UNITED STATES SECURITIES AND EXCHANGE COMMISSION
Washington, D.C. 20549
FORM 20-F
(Mark One)
| ¨ | REGISTRATION STATEMENT PURSUANT TO SECTION 12(b) OR (g) OF THE SECURITIES EXCHANGE ACT OF 1934 |
OR
| x | ANNUAL REPORT PURSUANT TO SECTION 13 OR 15(d) OF THE SECURITIES EXCHANGE ACT OF 1934 |
| | For the fiscal year ended March 31, 2012 |
OR
| ¨ | TRANSITION REPORT PURSUANT TO SECTION 13 OR 15(d) OF THE SECURITIES EXCHANGE ACT OF 1934 |
| | For the transition period from to |
OR
| ¨ | SHELL COMPANY REPORT PURSUANT TO SECTION 13 OR 15(d) OF THE SECURITIES EXCHANGE ACT OF 1934 |
| | Date of event requiring this shell company report |
Commission file number: 001-34919
Kabushiki Kaisha Mitsui Sumitomo Financial Group
(Exact name of registrant as specified in its charter)
SUMITOMO MITSUI FINANCIAL GROUP, INC.
(Translation of registrant’s name into English)
| | |
| Japan | | 1-2, Marunouchi 1-chome, Chiyoda-ku, Tokyo 100-0005, Japan |
| (Jurisdiction of incorporation or organization) | | (Address of principal executive offices) |
Haruyuki Nagata
1-2, Marunouchi 1-chome, Chiyoda-ku, Tokyo 100-0005, Japan
Telephone: +81-3-3282-8111 Facsimile: +81-3-4333-9954
(Name, telephone, e-mail and/or facsimile number and address of company contact person)
Securities registered or to be registered pursuant to Section 12(b) of the Act:
| | |
Title of Each Class | | Name of Each Exchange on which Registered |
Common stock, without par value | | The New York Stock Exchange* |
| * | Not for trading, but only in connection with the listing of the American Depositary Shares, each American Depositary Share representing 1/5 of one share of the registrant’s common stock. |
Securities registered or to be registered pursuant to Section 12(g) of the Act:
None
Securities for which there is a reporting obligation pursuant to Section 15(d) of the Act:
None
Indicate the number of outstanding shares of each of the issuer’s classes of capital or common stock as of the close of the period covered by the annual report.
At March 31, 2012, the following shares of capital stock were outstanding: 1,414,055,625 shares of common stock (including 62,939,559 shares of common stock held by the registrant and its consolidated subsidiaries and equity-method associates as treasury stock).
Indicate by check mark if the registrant is a well-known seasoned issuer, as defined in Rule 405 of the Securities Act. Yes x No ¨
If this report is an annual or transition report, indicate by check mark if the registrant is not required to file reports pursuant to Section 13 or 15(d) of the Securities Exchange Act of 1934. Yes ¨ No x
Indicate by check mark whether the registrant: (1) has filed all reports required to be filed by Section 13 or 15(d) of the Securities Exchange Act of 1934 during the preceding 12 months (or for such shorter period that the registrant was required to file such reports), and (2) has been subject to such filing requirements for the past 90 days. Yes x No ¨
Indicate by check mark whether the registrant has submitted electronically and posted on its corporate Web site, if any, every Interactive Data File required to be submitted and posted pursuant to Rule 405 of Regulation S-T during the preceding 12 months (or for such shorter period that the registrant was required to submit and post such files). Yes ¨ No ¨
Indicate by check mark whether the registrant is a large accelerated filer, an accelerated filer, or a non-accelerated filer. See definition of “accelerated filer and large accelerated filer” in Rule 12b-2 of the Exchange Act. (Check one):
| | | | |
| Large Accelerated Filer x | | Accelerated Filer ¨ | | Non-Accelerated Filer ¨ |
Indicate by check mark which basis of accounting the registrant has used to prepare the financial statements included in this filing.
| | | | |
U.S. GAAP ¨ | | International Financial Reporting Standards as issued by the International Accounting Standards Board x | | Other ¨ |
If “Other” has been checked in response to the previous question, indicate by check mark which financial statement item the registrant has elected to follow. Item 17 ¨ Item 18 ¨
If this is an annual report, indicate by check mark whether the registrant is a shell company (as defined in Rule 12b-2 of the Exchange Act). Yes ¨ No x
TABLE OF CONTENTS
i
ii
CERTAIN DEFINED TERMS, CONVENTIONS AND
PRESENTATION OF FINANCIAL INFORMATION
As used in this annual report, unless the context otherwise requires, “SMFG,” the “Company,” “we,” “us,” “our” and similar terms refer to Sumitomo Mitsui Financial Group, Inc. as well as to its subsidiaries, as the context requires. References to the “Group” are to us and our subsidiaries and affiliates taken as a whole. “SMBC” and the “Bank” refer to Sumitomo Mitsui Banking Corporation or to Sumitomo Mitsui Banking Corporation and its consolidated subsidiaries taken as a whole, depending on the context. The Bank is our main subsidiary.
In this annual report, all of our financial information is presented on a consolidated basis, unless we state otherwise. As used in this annual report, “IFRS” means International Financial Reporting Standards as issued by the International Accounting Standards Boards, the “IASB,” and “Japanese GAAP” means accounting principles generally accepted in Japan. Our consolidated financial information in this annual report has been prepared in accordance with IFRS, except for the risk-weighted capital ratios, the segment results of operation and some other specifically identified information, which are prepared in accordance with Japanese banking regulations or Japanese GAAP. Unless otherwise stated or the context otherwise requires, all financial information contained in this annual report is expressed in Japanese yen.
Our fiscal year ends on March 31.
Unless otherwise specified or required by the context: references to “days” are to calendar days; references to “years” are to calendar years and to “fiscal years” are to our fiscal years ending on March 31; references to “$,” “dollars” and “U.S. dollars” are to United States dollars; references to “euros” and “€” are to the currency of those member states of the European Union which are participating in the European Economic and Monetary Union pursuant to the Treaty on European Union; references to “£” and “British pounds sterling” are to the currency of the United Kingdom; and references to “yen” and “¥” are to Japanese yen. Unless otherwise specified, when converting currencies into yen, we use the median exchange rates for buying and selling spot dollars, or other currencies, by telegraphic transfer against yen as determined by the Bank on March 31, 2012.
Unless otherwise indicated, in this annual report, where information is presented in millions, billions or trillions of yen or thousands, millions or billions of dollars, amounts of less than one thousand, one million, one billion or one trillion, as the case may be, have been rounded. Accordingly, the total of figures presented in columns or otherwise may not equal the total of the individual items. All percentages have been rounded to the nearest percent, one-tenth of one percent or one-hundredth of one percent, as the case may be, except for capital ratios, which have been truncated.
We implemented a 100-for-1 stock split of shares of our common stock and adopted a unit share system effective on January 4, 2009, pursuant to which one hundred shares constitutes one unit of shares. The 100-for-1 stock split and the adoption of the unit share system do not apply to shares of our preferred stock. Numbers of shares of our common stock and per share information for our common stock, for example historical dividend information, in this annual report have been retroactively adjusted to reflect the 100-for-1 stock split effective on January 4, 2009.
1
CAUTIONARY STATEMENT REGARDING FORWARD-LOOKING STATEMENTS
This annual report contains statements that constitute “forward-looking statements” within the meaning of Section 21E of the U.S. Securities Exchange Act of 1934, as amended. When included in this annual report, the words “anticipate,” “believe,” “estimate,” “expect,” “intend,” “may,” “plan,” “probability,” “risk,” “project,” “should,” “seek,” “target,” “will” and similar expressions, among others, identify forward-looking statements. You can also identify forward-looking statements in the discussions of strategy, plans or intentions. Such statements, which include, but are not limited to, statements contained in “Item 3. Key Information—Risk Factors,” “Item 5. Operating and Financial Review and Prospects” and “Item 11. Quantitative and Qualitative Disclosures about Credit, Market and Other Risk,” reflect our current views with respect to future events and are inherently subject to risks, uncertainties and assumptions, including the risk factors described in this annual report. Should one or more of these risks or uncertainties materialize, or should underlying assumptions prove incorrect, actual results may vary materially from those described here as anticipated, believed, estimated, expected or intended.
The U.S. Private Securities Litigation Reform Act of 1995 provides a “safe harbor” for forward-looking information to encourage companies to provide prospective information about themselves. We rely on this safe harbor in making these forward-looking statements.
Forward-looking statements are not guarantees of future performance and involve risks and uncertainties, and actual results may differ from those in the forward-looking statements as a result of various factors, and the differences may be material. Potential risks and uncertainties include, without limitation, the following:
| | • | | deterioration of Japanese and global economic conditions and financial markets; |
| | • | | constraints on our operations due to capital adequacy requirements; |
| | • | | declines in the value of our securities portfolio; |
| | • | | changes in the level or volatility of market rates or prices; |
| | • | | incurrence of significant credit-related costs; |
| | • | | a significant downgrade of our or the Bank’s credit rating; |
| | • | | our ability to successfully implement our business strategy through our subsidiaries, affiliates and alliance partners; |
| | • | | exposure to new risks as we expand the scope of our business; |
| | • | | the industry specific risks of the consumer finance industry; |
| | • | | the recoverability of deferred tax assets; |
| | • | | litigation and regulatory proceedings; |
| | • | | insufficient liquidity; |
| | • | | problems of other financial institutions; and |
| | • | | adverse regulatory developments or changes in government policies. |
Given these and other risks and uncertainties, you should not place undue reliance on forward-looking statements, which speak only as of the date of the filing of this annual report. We expressly disclaim any obligation to update or to announce publicly any revision to any of the forward-looking statements contained in this annual report to reflect any changes in events, conditions, circumstances or other developments upon which any such statement is based. The information contained in this annual report identifies important factors in addition to those referred to above that could cause differences in our actual results.
2
PART I
| Item 1. | Identity of Directors, Senior Management and Advisers |
Not applicable.
| Item 2. | Offer Statistics and Expected Timetable |
Not applicable.
3.A. SELECTED FINANCIAL DATA
Selected Financial Data
The following selected financial data at and for each of the four fiscal years ended March 31, 2012, 2011, 2010 and 2009 have been derived from our consolidated financial statements. You should read this data together with “Item 5. Operating and Financial Review and Prospects” and our consolidated financial statements included elsewhere in this annual report.
| | | | | | | | | | | | | | | | |
| | | For the fiscal year ended and at March 31, | |
| | | 2012 | | | 2011 | | | 2010 | | | 2009 | |
| | | (In millions, except per share data) | |
Consolidated income statement data: | | | | |
Interest income | | ¥ | 1,710,331 | | | ¥ | 1,720,181 | | | ¥ | 1,766,047 | | | ¥ | 2,164,048 | |
Interest expense | | | 313,631 | | | | 311,056 | | | | 346,810 | | | | 676,293 | |
| | | | | | | | | | | | | | | | |
Net interest income | | | 1,396,700 | | | | 1,409,125 | | | | 1,419,237 | | | | 1,487,755 | |
| | | | | | | | | | | | | | | | |
Fee and commission income | | | 869,407 | | | | 806,704 | | | | 650,437 | | | | 570,603 | |
Fee and commission expense | | | 132,562 | | | | 132,560 | | | | 121,716 | | | | 116,240 | |
| | | | | | | | | | | | | | | | |
Net fee and commission income | | | 736,845 | | | | 674,144 | | | | 528,721 | | | | 454,363 | |
| | | | | | | | | | | | | | | | |
Net trading income | | | 182,296 | | | | 324,479 | | | | 330,130 | | | | 134,298 | |
Net income (loss) from financial assets at fair value through profit or loss | | | 33,734 | | | | 30,116 | | | | 75,579 | | | | (17,951 | ) |
Net investment income | | | 239,365 | | | | 235,911 | | | | 178,552 | | | | 159,511 | |
Other income | | | 245,563 | | | | 204,470 | | | | 232,334 | | | | 193,119 | |
| | | | | | | | | | | | | | | | |
Total operating income | | | 2,834,503 | | | | 2,878,245 | | | | 2,764,553 | | | | 2,411,095 | |
| | | | | | | | | | | | | | | | |
Impairment charges on financial assets | | | 284,310 | | | | 433,928 | | | | 258,641 | | | | 1,240,710 | |
| | | | | | | | | | | | | | | | |
Net operating income | | | 2,550,193 | | | | 2,444,317 | | | | 2,505,912 | | | | 1,170,385 | |
| | | | | | | | | | | | | | | | |
General and administrative expenses | | | 1,366,705 | | | | 1,293,546 | | | | 1,096,957 | | | | 992,487 | |
Other expenses | | | 239,292 | | | | 212,292 | | | | 236,760 | | | | 261,770 | |
| | | | | | | | | | | | | | | | |
Operating expenses | | | 1,605,997 | | | | 1,505,838 | | | | 1,333,717 | | | | 1,254,257 | |
| | | | | | | | | | | | | | | | |
Share of post-tax loss of associates and joint ventures | | | 25,004 | | | | 5,796 | | | | 37,461 | | | | 54,318 | |
| | | | | | | | | | | | | | | | |
Profit (loss) before tax | | | 919,192 | | | | 932,683 | | | | 1,134,734 | | | | (138,190 | ) |
| | | | | | | | | | | | | | | | |
Income tax expense (benefit) | | | 461,194 | | | | 361,165 | | | | 488,041 | | | | (56,166 | ) |
| | | | | | | | | | | | | | | | |
Net profit (loss) | | ¥ | 457,998 | | | ¥ | 571,518 | | | ¥ | 646,693 | | | ¥ | (82,024 | ) |
| | | | | | | | | | | | | | | | |
3
| | | | | | | | | | | | | | | | |
| | | For the fiscal year ended and at March 31, | |
| | | 2012 | | | 2011 | | | 2010 | | | 2009 | |
| | | (In millions, except per share data) | |
Profit (loss) attributable to: | | | | | | | | | | | | | | | | |
Shareholders of Sumitomo Mitsui Financial Group, Inc. | | ¥ | 345,430 | | | ¥ | 464,007 | | | ¥ | 528,692 | | | ¥ | (154,954 | ) |
Non-controlling interests | | | 112,568 | | | | 107,511 | | | | 118,001 | | | | 72,930 | |
Earnings per share: | | | | | | | | | | | | | | | | |
Basic | | ¥ | 249 | | | ¥ | 328 | | | ¥ | 512 | | | ¥ | (214 | ) |
Diluted | | | 248 | | | | 328 | | | | 482 | | | | (260 | ) |
Weighted average number of common shares in issue (in thousands of shares) | | | 1,387,405 | | | | 1,394,391 | | | | 1,017,066 | | | | 772,349 | |
Dividends per share in respect of each fiscal year: | | | | | | | | | | | | | | | | |
Common stock | | ¥ | 100 | | | ¥ | 105 | | | ¥ | 65 | | | ¥ | 140 | |
| | $ | 1.22 | | | $ | 1.26 | | | $ | 0.70 | | | $ | 1.43 | |
Preferred stock (Type 4)(1): | | | | | | | | | | | | | | | | |
First series | | ¥ | — | | | ¥ | — | | | ¥ | 135,000 | | | ¥ | 135,000 | |
| | $ | — | | | $ | — | | | $ | 1,451 | | | $ | 1,374 | |
Second series | | ¥ | — | | | ¥ | — | | | ¥ | 135,000 | | | ¥ | 135,000 | |
| | $ | — | | | $ | — | | | $ | 1,451 | | | $ | 1,374 | |
Third series | | ¥ | — | | | ¥ | — | | | ¥ | 135,000 | | | ¥ | 135,000 | |
| | $ | — | | | $ | — | | | $ | 1,451 | | | $ | 1,374 | |
Fourth series | | ¥ | — | | | ¥ | — | | | ¥ | 135,000 | | | ¥ | 135,000 | |
| | $ | — | | | $ | — | | | $ | 1,451 | | | $ | 1,374 | |
Ninth series | | ¥ | — | | | ¥ | — | | | ¥ | 135,000 | | | ¥ | 135,000 | |
| | $ | — | | | $ | — | | | $ | 1,451 | | | $ | 1,374 | |
Tenth series | | ¥ | — | | | ¥ | — | | | ¥ | 135,000 | | | ¥ | 135,000 | |
| | $ | — | | | $ | — | | | $ | 1,451 | | | $ | 1,374 | |
Eleventh series | | ¥ | — | | | ¥ | — | | | ¥ | 135,000 | | | ¥ | 135,000 | |
| | $ | — | | | $ | — | | | $ | 1,451 | | | $ | 1,374 | |
Twelfth series | | ¥ | — | | | ¥ | — | | | ¥ | 135,000 | | | ¥ | 135,000 | |
| | $ | — | | | $ | — | | | $ | 1,451 | | | $ | 1,374 | |
Preferred stock (Type 6)(2) | | ¥ | 44,250 | | | ¥ | 88,500 | | | ¥ | 88,500 | | | ¥ | 88,500 | |
| | $ | 539 | | | $ | 1,064 | | | $ | 951 | | | $ | 901 | |
Consolidated statement of financial position data: | | | | | | | | | | | | | | | | |
Total assets | | ¥ | 141,874,426 | | | ¥ | 136,470,927 | | | ¥ | 122,992,929 | | | ¥ | 119,334,876 | |
Loans and advances | | | 72,536,813 | | | | 71,020,329 | | | | 71,634,128 | | | | 74,669,294 | |
Total liabilities | | | 134,259,035 | | | | 128,919,722 | | | | 115,431,259 | | | | 114,418,861 | |
Deposits | | | 92,853,566 | | | | 90,469,098 | | | | 85,697,973 | | | | 83,231,234 | |
Borrowings | | | 10,412,858 | | | | 12,548,358 | | | | 7,321,484 | | | | 6,423,003 | |
Total equity | | | 7,615,391 | | | | 7,551,205 | | | | 7,561,670 | | | | 4,916,015 | |
Capital stock | | | 2,337,896 | | | | 2,337,896 | | | | 2,337,896 | | | | 1,370,777 | |
| (1) | All shares of the Type 4 preferred stock were converted to common stock by January 28, 2010, and no shares of Type 4 preferred stock were outstanding at March 31, 2012, 2011 and 2010. |
| (2) | On April 1, 2011, we acquired and cancelled all of the outstanding Type 6 preferred stock. |
4
Exchange Rates
We maintain our accounts in yen. The following table sets forth for the indicated periods the median exchange rates for buying and selling spot dollars by telegraphic transfer against yen as determined by the Bank, expressed in Japanese yen per $1.00.
| | | | | | | | | | | | | | | | |
| | | High | | | Low | | | Period end | | | Average(1) | |
| | | (Yen per dollar) | |
Fiscal year ended March 31, | | | | | | | | | | | | | | | | |
2008 | | ¥ | 123.95 | | | ¥ | 97.05 | | | ¥ | 100.19 | | | ¥ | 114.13 | |
2009 | | | 110.29 | | | | 87.47 | | | | 98.23 | | | | 100.68 | |
2010 | | | 100.76 | | | | 86.31 | | | | 93.05 | | | | 92.61 | |
2011 | | | 94.43 | | | | 79.31 | | | | 83.15 | | | | 85.22 | |
2012 | | | 85.47 | | | | 75.99 | | | | 82.13 | | | | 78.98 | |
Most recent six months: | | | | | | | | | | | | | | | | |
January | | | 77.80 | | | | 76.38 | | | | 76.38 | | | | 76.99 | |
February | | | 81.30 | | | | 76.13 | | | | 80.68 | | | | 78.41 | |
March | | | 83.97 | | | | 80.75 | | | | 82.13 | | | | 82.45 | |
April | | | 83.20 | | | | 80.56 | | | | 81.19 | | | | 81.56 | |
May | | | 80.40 | | | | 78.94 | | | | 78.94 | | | | 79.77 | |
June | | | 80.40 | | | | 78.17 | | | | 79.28 | | | | 79.30 | |
July (through July 10, 2012) | | | 79.99 | | | | 79.51 | | | | 79.53 | | | | 79.72 | |
| (1) | Average exchange rates have been calculated by using the average of the exchange rates on the last day of each month during a fiscal year, except for the monthly average rate, which represents the average of the exchange rates for each day of that month. |
The median exchange rate quotation by the Bank for buying and selling spot dollars by telegraphic transfer against yen on July 10, 2012 was ¥79.53 = $1.00.
These exchange rates are reference rates and are neither necessarily the rates used to calculate ratios nor the rates used to convert dollars to yen in the consolidated financial statements included elsewhere in this annual report.
3.B. CAPITALIZATION AND INDEBTEDNESS
Not applicable.
3.C. REASONS FOR THE OFFER AND USE OF PROCEEDS
Not applicable.
3.D. RISK FACTORS
Investing in our securities involves risks. You should carefully consider the risks described below as well as all the other information in this annual report, including, but not limited to, our consolidated financial statements and related notes included elsewhere in this annual report and “Item 11. Quantitative and Qualitative Disclosures about Credit, Market and Other Risk.” Our business, operating results and financial condition could be adversely affected by any factors, including, but not limited to, those discussed below. The trading prices of our securities could also decline due to any of these factors including, but not limited to, those discussed below. Moreover, this annual report contains forward-looking statements that involve risks and uncertainties. Our actual results could also differ from those anticipated in these forward-looking statements as a result of various factors, including, but not limited to, the risks faced by us described below and elsewhere in this annual report. See “Cautionary Statement Regarding Forward-Looking Statements.” Forward-looking statements in this section are made only as of the filing date of this annual report.
5
Risks Related to the Economic and Financial Environment
We may be adversely affected if Japanese and global economic conditions and financial markets deteriorate.
Our financial condition and results of operations are materially affected by general economic conditions and financial markets in Japan and foreign countries.
In the aftermath of the Great East Japan Earthquake, a magnitude 9.0 earthquake which occurred in March 2011, and collateral events, the Japanese economy contracted due to a combination of supply chain disruptions, electricity shortages and the consequential slowdown in exports. It gradually recovered as supply chains and lost output from the earthquake and collateral events were restored. In the second half of the fiscal year ended March 31, 2012 there were some visible signs of improvement in the unemployment rate, and private consumption remained firm. The rate of recovery of the Japanese economy slowed due to the persistent strength of the Japanese yen against other currencies and a weak recovery of the global economies.
In the second half of the fiscal year ended March 31, 2012, the U.S. economy began to recover. However, financial market anxiety owing to the European sovereign debt crisis continued and some European nations experienced recessionary conditions. The growth rate of China, India and other emerging economies in Asia began declining. Geopolitical instability in various parts of the world, including North Africa, the Middle East and Asia, could contribute to economic instability in those and other regions.
Future deterioration of general economic conditions in Japan or other countries, or financial market turmoil, could adversely affect our business, financial condition and operating results. Such adverse effects could include a worsening of our liquidity and capital conditions, an increase in our credit costs, and an increase in impairment of our investment securities.
Risks Related to Our Business
Failure to satisfy capital adequacy requirements could constrain our and the Bank’s operations.
We and the Bank are subject to capital adequacy requirements set by the Financial Services Agency of Japan (“FSA”). At March 31, 2012, our risk-weighted consolidated capital ratio was 16.93% compared to the minimum required risk-weighted capital ratio of 8.0%, and our Tier I risk-weighted capital ratio was 12.28% compared to the minimum required Tier I risk-weighted capital ratio of 4.0%. Our and the Bank’s capital ratios could decline as a result of decreases in Tier I and Tier II capital or increases in risk-weighted assets. The following circumstances, among others, could reduce our risk-weighted capital ratio and that of the Bank:
| | • | | increases in risk-weighted assets resulting from business growth, strategic investments, borrower downgrades or changes in parameters such as probability of default; |
| | • | | declines in the value of securities; and |
| | • | | an inability to refinance subordinated debt obligations. |
Furthermore, our Tier II capital cannot exceed our Tier I capital. If our Tier I capital is reduced, then amounts that may be credited as Tier II capital may be reduced as well because at least half of our capital must consist of Tier I capital. Failure by us or the Bank to maintain the minimum risk-weighted capital ratios may result in administrative actions or sanctions, which may indirectly affect our or the Bank’s ability to fulfill our and the Bank’s contractual obligations or may result in restrictions on our and the Bank’s businesses.
We and the Bank have adopted the advanced internal rating-based (“IRB”) approach for measuring exposure to credit risk and the advanced measurement approach (“AMA”) to measure exposure to operational risk. If the FSA revokes its approval of such implementation or otherwise changes its approach to measure capital adequacy ratios, our and the Bank’s ability to maintain capital at the required levels may be adversely affected.
6
FSA regulations limit the amount of deferred tax assets which may be included in our and the Bank’s regulatory capital. The amount of net deferred tax assets established pursuant to Japanese GAAP that major banks may include in regulatory capital for capital ratio purposes is limited to 20% of Tier I capital. Where net deferred tax assets of a bank exceed this 20% limit, Tier I capital must be adjusted by deducting the amount in excess of the limit. If the percentages of our capital that consist of net deferred tax assets increase, or if the limits are further decreased, these limits could adversely affect our capital ratios. Furthermore, under the new Basel III rules text published by the Basel Committee on Banking Supervision (“Basel Committee”) in December 2010, deferred tax assets that arise from timing differences will be recognized as part of the common equity component of Tier I, with recognition capped at 10% of the bank’s common equity component under certain conditions, while deferred tax assets that arise from net loss carry forwards will be deducted from the common equity component of Tier I. The FSA changed its capital adequacy guidelines to generally reflect the main measures of the minimum capital requirements of the Basel Committee that are scheduled to be phased in starting January 1, 2013, and the FSA’s changes will be generally applied from March 31, 2013.
On November 4, 2011, we and other organizations were identified by the Financial Stability Board (“FSB”) as Global Systemically Important Financial Institutions (“G-SIFIs”). The list of G-SIFIs will be updated each year in November and from 2016, requirements for additional loss absorption capacity above the Basel III minimum requirement will apply to those banks identified in November 2014 as G-SIFIs.
If our capital ratios fall below required levels, the FSA may require us to take a variety of corrective actions, including withdrawal from all international operations or suspension of all or part of our and the Bank’s operations. In addition, some of the Bank’s domestic and overseas subsidiaries are also subject to local capital ratio requirements. Failure of those subsidiaries to meet local requirements may result in administrative actions or sanctions imposed by local regulatory authorities.
Future declines of securities prices on Japanese stock markets or other global markets could cause us to experience impairment losses and unrealized losses on our equity securities portfolio, which could negatively affect our financial condition, operating results and regulatory capital position.
The reported value of our available-for-sale equity instruments accounted for 2.2% of our total assets at March 31, 2012, approximately 89.0% of which were Japanese equity securities. This value depends mainly on prices of the instruments in the stock market. A listed equity security is impaired primarily based on its market price. If we conclude that a particular security is impaired, we calculate the impairment loss based on the market price of that security at the end of the relevant period. Declines in the Japanese stock markets or other global markets could result in further losses from impairment of the securities in our equity securities portfolio or sales of these securities, adversely affecting our results of operations and financial condition.
Our regulatory capital position and that of the Bank depend in part on the fair value of our equity securities portfolio, since 45% of unrealized gains are counted as Tier II capital, while unrealized losses reduce net assets and Tier I capital. Substantial declines in the Japanese stock markets or other global markets would negatively affect our and the Bank’s capital positions, and limit the Bank’s ability to make distributions to us.
We may further reduce our holdings of equity securities in order to reduce financial risks. Any disposal by us of equity holdings in our customers’ shares could adversely affect our relationships with those customers.
Changes in the levels or volatility of market rates or prices could adversely affect our financial condition and results of operations.
We engage in trading and investing activities dealing with various kinds of financial instruments such as bonds, equities, currencies, derivatives and funds. Our financial condition and results of operations could be adversely affected by actual changes or volatility in interest rates, foreign exchange rates and market prices of other investment securities. For example, we have substantial investments in debt securities. In particular,
7
Japanese government bonds represent a significant part of our fixed income portfolio. At March 31, 2012, we had ¥23 trillion of Japanese government bonds classified as available-for-sale financial assets, which accounted for approximately 15.9% of our total assets. Increases in interest rates could substantially decrease the value of our fixed income portfolio, and any unexpected changes in yield curves could adversely affect the value of our bond and interest rate derivative positions, resulting in lower-than-expected revenues from trading and investment activities. Market volatility may also result in significant unrealized losses or impairment losses on such instruments. Furthermore, the downgrading of investment securities by credit rating agencies may also cause declines in the value of our securities portfolio.
Adverse economic conditions and deterioration of the financial conditions of our customers could increase our credit costs.
We have substantial exposure to corporate customers in the following sectors: manufacturing, real estate and goods rental and leasing, wholesale and retail, transportation, communications and public enterprises, and services, including electric utilities, and to individual customers mainly through housing loans. Our non-performing loans (“NPLs”) and our credit costs for corporate and individual customers may increase significantly if:
| | • | | domestic or global economic conditions worsen or do not improve; |
| | • | | our customers do not repay their loans, including due to deterioration of their financial conditions; and |
| | • | | the value of mortgaged property declines. |
Moreover, in relation to the Great East Japan Earthquake, we may be required to, or choose to, provide new or additional financing to customers who may incur unexpected liabilities, have difficulty in the future in continuing operations, encounter difficulties or need to devote significant resources to repair their infrastructures, as a result of the earthquake and collateral events. We may also be required to record increases in our allowance for loan losses as a result of the adverse impact on the financial condition of our obligors or recognize decreases in the value of mortgaged property in the affected regions and our equity securities portfolio. For certain borrowers, we may choose to engage in debt-for-equity swaps, or provide partial debt write-offs, additional financing or other forms of assistance as an alternative to exercising our full legal rights as a creditor if we believe that doing so may increase our ultimate recoverable amount of the loan. Moreover, changes in laws or government policies that have an adverse impact on the rights of creditors could also cause us to incur increased credit costs. It is unclear to what extent our current or any future loans to borrowers will benefit, directly or indirectly, from any government guarantees or other government support measures that have been or may be enacted as a result of the earthquake and collateral events.
In addition, our NPLs may increase and there may be additional credit costs if we fail to accurately estimate the incurred losses in our loan portfolio. These estimates require difficult, subjective and complex judgments such as credit evaluation of our borrowers, valuation of collateral and forecasts of economic conditions.
The ratio of impaired loans and advances to the total loans and advances, both net of allowance for loan losses, were 1.9%, 1.8% and 1.6% at March 31, 2012, 2011 and 2010, respectively. For further information, see “Item 5.A. Operating Results—Loans and Advances.”
A significant downgrade of our credit ratings could have a negative effect on us.
At the date of this annual report, SMFG has the issuer credit ratings of A/A-1 from Standard & Poor’s Ratings Japan K.K., (“S&P”), and the long-term foreign and local currency issuer default ratings (“IDRs”) of A- and the short-term foreign and local currency IDRs of F1 from Fitch Ratings Japan Limited (“Fitch”). There can be no assurance that these ratings will be maintained.
8
On August 24, 2011, Moody’s Japan K.K., (“Moody’s”) announced that it had downgraded by one notch the Government of Japan’s local and foreign currency bond ratings to Aa3. On the same date, Moody’s also downgraded by one notch the long term debt ratings of many Japanese banks, including the Bank’s long-term debt ratings, due to fiscal pressures on the Government of Japan that might constrain its ability to support Japan’s banking system. On November 29, 2011, S&P, in connection with the application of its new ratings criteria for banks, revised downward the rating or outlook of financial institutions globally, including a revision of SMFG’s and the Bank’s outlook from stable to negative. On May 22, 2012, Fitch announced that it had downgraded the Government of Japan’s long-term local and foreign currency IDRs to A+ with negative outlook. On July 20, 2012, Fitch downgraded by one notch the long-term foreign and local currency IDRs of the major Japanese banking groups and their subsidiaries, including SMFG and the Bank, in connection with the sovereign downgrade.
A material downgrade of our credit ratings may have various effects including, but not limited to, the following:
| | • | | we may have to accept less favorable terms in our transactions with counterparties, including capital raising activities, or may be unable to enter into certain transactions; |
| | • | | foreign regulatory bodies may impose restrictions on our overseas operations; |
| | • | | existing agreements or transactions may be cancelled; and |
| | • | | we may be required to provide additional collateral in connection with derivatives transactions. |
Any of these or other effects of a downgrade of our credit ratings could have a negative impact on the profitability of our treasury and other operations, and could adversely affect our regulatory capital position, financial condition and results of operations. For more information about our credit ratings, see “Item 5.B. Liquidity and Capital Resources.”
We face significant challenges in achieving the goals of our business strategy, and our business may not be successful.
In May 2011, we and the Bank launched a new medium-term management plan through March 2014. We believe that we have targeted appropriate business areas. However, our initiatives to offer new products and services and to increase sales of our existing products and services may not succeed, if current market conditions do not stabilize, market opportunities develop more slowly than expected, our initiatives have less potential than we envisioned originally or the profitability of these products and services is undermined by competitive pressures. Consequently, we may be unable to achieve or maintain profitability in our targeted business areas.
In order to implement our business strategy successfully, we need to hire and train qualified personnel continuously and in a proactive manner, as well as to attract and retain employees with professional experience and specialized product knowledge. However, we face competition from other commercial banks, investment banks, consumer finance companies and other financial services providers in hiring highly competent employees. There can be no assurance that we will succeed in attracting, integrating and retaining appropriately qualified personnel.
We are exposed to new risks as we expand our businesses, the range of our products and services, and geographic scope of our businesses overseas.
As part of our business strategies we have expanded and may continue to expand our businesses or our range of products and services beyond our core business, commercial banking. This could expose us to new risks, such as adverse regulatory changes, more competition or a decline in the operating environments that affect those businesses, products and services. Some of those risks could be types with which we have no or only limited experience. As a result, our risk management systems may prove to be insufficient and may not be effective in all cases or to the degree required.
9
In accordance with our strategy to further increase our presence in the international financial markets, we may continue to expand the scale of our overseas businesses, especially in emerging economies, notably Asian countries. The expansion of our overseas businesses may further increase our exposure to risks of adverse developments in foreign economies and markets, including interest rate and foreign exchange rate risk, regulatory risk and political risk. Our overseas expansion also exposes us to the compliance risks and the credit and market risks specific to the countries and regions in which we operate, including the risk of deteriorating conditions in the credit profile of overseas borrowers.
Failure of our business strategies through our subsidiaries, affiliates and other business alliance partners could negatively affect our financial condition and operating results, including impairment losses on goodwill or investments.
As part of our business strategies, we have made and may undertake acquisition of a subsidiary and investments in affiliates and other business alliance partners in the banking, securities, consumer finance, credit card, leasing and asset management businesses. It is uncertain whether we will receive the expected benefits from those business strategies, due to any adverse regulatory changes, worsening of economic conditions, competition or other factors that may negatively affect the related business activities. Furthermore, unanticipated costs and liabilities may be incurred in connection with those business strategies, including claims related to the businesses prior to our business alliances, and actions by regulatory authorities.
When we acquire a subsidiary, we may recognize some goodwill and intangible assets. Impairment losses on goodwill or intangible assets in connection with acquisitions must be recognized when the recoverable amount of goodwill or intangible assets of the business is lower than the carrying amount at the time of impairment testing, which is performed annually or whenever there is an indication that the goodwill or intangible assets may be impaired.
We account for some of our investments in affiliates under the equity method. Net losses by equity method investees may cause us to record our share of net losses of the affiliates. Furthermore, we may lose the capital which we have invested in business alliances or may incur impairment losses on securities acquired in such alliances. We may also be required under contractual or other arrangements to provide financial support, including credit support and equity investments, to business alliance partners in the future. We may also incur credit costs from our credit exposure to such partners.
We are exposed to the industry specific risks of the consumer finance industry.
Changes in the legal environment have severely adversely affected the business performance of consumer finance and credit card companies. We have exposures to those associated risks through our subsidiaries, including Cedyna Financial Corporation (“Cedyna”) and SMBC Consumer Finance Co., Ltd. (“SMBC Consumer Finance”), formerly known as Promise Co., Ltd. and which became our subsidiary on December 7, 2011.
Consumer finance and credit card companies had offered unsecured personal loans, which included so-called “gray zone” interest on loans in excess of the maximum rate prescribed by the Interest Rate Restriction Act (ranging from 15% to 20%) up to the 29.2% maximum rate permitted under the Act Regulating the Receipt of Contributions, Receipt of Deposits and Interest Rates (“Contributions Act”). However, as a result of court decisions unfavorable to those companies, claims for refunds of amounts paid in excess of the applicable maximum allowed rate by the Interest Rate Restriction Act have increased substantially. Although SMBC Consumer Finance, Cedyna and other subsidiaries have each recorded a provision for claims for refunds of gray zone interest on loans, we may be required to recognize additional losses if such provisions are determined to be insufficient.
Amendments to laws regulating moneylenders, which were promulgated in 2006 and which became fully effective in June 2010, increased the authority of government regulators, prohibited gray zone interest and
10
introduced an upper limit on aggregate credit extensions to an individual by moneylenders at one-third of the borrower’s annual income. After the promulgation of such amendments, SMBC Consumer Finance, Cedyna and other companies engaged in related business reduced their interest rates on loans in preparation for the prohibition of gray zone interest. As a consequence, margins earned by those companies, as well as the amounts of loans extended, have decreased.
An inability to generate sufficient future taxable profits or adverse changes to tax laws, regulatory requirements or accounting standards could have a negative impact on the recoverability of certain deferred tax assets.
We recognize deferred tax assets relating to tax losses carried forward and deductible temporary differences only to the extent that it is probable that future taxable profit will be available against which the tax losses carried forward and the temporary differences can be utilized. Net deferred tax assets amounted to ¥563 billion and ¥1,001 billion at March 31, 2012 and 2011, respectively. Net deferred tax assets are quantified on the basis of current tax rates and accounting standards and are subject to change as a result of changes to future tax rates or the rules for computing taxable profits and allowable losses. Failure to generate sufficient future taxable profits or changes in tax laws or accounting standards may reduce our estimated recoverable amount of net deferred tax assets. Such a reduction could have an adverse effect on our financial condition and results of operations.
Declines in actual returns on our plan assets or revised actuarial assumptions for retirement benefits may adversely affect our financial condition and results of operations.
The Bank and some of our subsidiaries have various defined benefit plans. We have experienced in the past, and may experience in the future, declines in actual returns on plan assets and changes in the discount rates and other actuarial assumptions. If actual returns on plan assets are lower than expected returns on plan assets or if we revise the discount rates and other assumptions, we may incur actuarial losses which may have an adverse effect on our financial condition and results of operations. Unrecognized actuarial losses may be recognized as losses in future periods. Because approximately half of our plan assets are composed of equity instruments, the plan assets are greatly affected by volatility in the prices of equity securities. Substantial declines in the prices for publicly traded Japanese stocks would negatively affect our plan assets and unrecognized losses arising from such declines may be recognized as losses in future periods. For further information, see Note 23 “Retirement Benefits” to our consolidated financial statements included elsewhere in this annual report.
Our business relies on our information technology systems, and their failure could harm our relationships with customers or adversely affect our provision of services to customers.
In all aspects of our business, we use information technology systems to deliver services to and execute transactions on behalf of our customers as well as for back-office operations. We therefore depend on the capacity and reliability of the electronic and information technology systems supporting our operations. We may encounter service disruptions in the future, owing to failures of these information technology systems. Our information technology systems are subject to damage or incapacitation as a result of quality problems, human errors, natural disasters, power losses, sabotage, computer viruses, acts of terrorism and similar events. While we have taken steps to protect information technology systems from those risks, including by establishing data recovery capability and functionality, these measures may not be sufficient. In addition, we may not be prepared to address all contingencies that could arise in the event of a major disruption of services. The failure to address such contingencies could harm our relationships with customers or adversely affect our provision of services to customers.
We handle personal information obtained from our individual and corporate customers in relation to our banking, securities, credit card, consumer finance and other businesses. The systems we have implemented to protect the confidentiality of personal information, including those designed to meet the strict requirements of the Act Concerning Protection of Personal Information, may not be effective in preventing disclosure of personal
11
information by unauthorized access from a third party. Leakage of personal information could expose us to demands for compensation or lawsuits for ensuing economic losses or emotional distress, administrative actions or sanctions, additional expenses associated with making necessary changes to our systems and reputational harm. As a result, our business, financial condition and results of operations could be materially and adversely affected.
Our risk management policies and procedures may not adequately address unidentified or unanticipated risks.
We are exposed to a variety of operational, legal and regulatory risks throughout our organization. Management of these risks requires, among other things, policies and procedures to properly record and verify large numbers of transactions and events. However, these policies and procedures may not be fully effective or sufficient. We have devoted significant resources to strengthening our risk management policies and procedures and expect to continue doing so in the future. Nevertheless, particularly in light of the continuing evolution of our operations and expansion into new areas, our policies and procedures designed to identify, monitor and manage risks may not be fully effective. Some of our methods of managing risks are based upon our use of observed historical market behavior and thus may not accurately predict future risks. Violations of laws including the Japanese antitrust and fair trade laws by us or by the Bank may result in administrative sanctions. Furthermore, investigations, administrative actions or litigation could commence in relation to violations, which may involve costs and may result in deterioration of our reputation.
Fraud or other misconduct by directors, officers and employees or third parties could subject us to losses and regulatory sanctions.
We are exposed to potential losses resulting from fraud, misconduct and other unlawful behavior by directors, officers and employees. Directors, officers and employees may bind us to transactions that exceed authorized limits or present unacceptable risks, hide from us and from our customers unauthorized activities, improperly use confidential information or otherwise abuse customer confidences. Third parties may engage in fraudulent activities, including fraudulent use of bank accounts or the use of false identities to open accounts for money laundering, tax evasion or other illegal purposes. Third parties could also use stolen or forged ATM cards or engage in credit card fraud, and we may be required to indemnify victims of such fraud for related losses. In the broad range of businesses in which we engage, fraud, misconduct and other unlawful behavior are difficult to prevent or detect. In addition, with or without actual fraud, misconduct and other unlawful behavior by directors, officers and employees, investigations, administrative actions or litigation could commence in relation to them. Furthermore, we may not be able to recover the losses caused by these activities, including possible deterioration of our reputation.
Transactions with counterparties in Iran and other countries designated by the U.S. Department of State as state sponsors of terrorism or that are subject to other U.S. economic sanctions may lead some potential customers and investors to avoid doing business with us or investing in our securities or may limit our business operations.
U.S. law generally prohibits or substantially restricts U.S. persons from doing business with countries designated by the U.S. Department of State as state sponsors of terrorism (“Designated Countries”), which currently are Cuba, Iran, Sudan and Syria. Under U.S. law, there are similar prohibitions or restrictions on countries that are the subject of other U.S. economic sanctions administered by the U.S. Department of the Treasury’s Office of Foreign Assets Control (“OFAC”) or other agencies (collectively with the Designated Countries, the “Restricted Countries”). We maintain a Group-wide policy designed to ensure compliance with applicable U.S. laws and regulations. This policy, which covers the Bank and our banking subsidiaries that provide financial services globally, prohibits the new extension of credit to Iranian entities. Our non-U.S. offices engage in transactions relating to the Restricted Countries on a limited basis and in compliance with applicable laws and regulations. These include remittance of Japanese yen with respect to our customers’ export or import
12
transactions, maintenance of correspondent banking accounts and inter-bank money market transactions with Iranian banks, including those which OFAC identifies as “Specially Designated Nationals.” In addition, we maintain a representative office in Iran that mainly performs an information-collecting function.
We do not believe that our operations relating to the Restricted Countries materially affect our business, financial condition or results of operations. A limited number of the Bank’s transactions with Cuba, Iran, Sudan and certain other countries that are the subject of U.S. economic sanctions were identified and voluntarily disclosed to OFAC. These transactions resulted from inadvertent operational errors or the lack of familiarity of some Bank personnel with the requirements of the relevant regulations in the past. Since the discovery of these potential violations we have further strengthened our Group-wide OFAC compliance program in an effort to prevent the recurrence of such potential violations. We settled some of the disclosed potential violations with OFAC while others remain unsettled. However, in light of the inadvertent nature of such potential violations and the degree to which our strengthened OFAC compliance program aims to mitigate the risk of potential violations, we do not believe that our settlement with OFAC or any possible penalties that OFAC may impose with respect to the other potential violations that remain unsettled will have a material impact on our reputation, financial condition or results of operations or on the prices of our securities.
We are aware of initiatives by U.S. governmental entities and U.S. institutional investors, such as pension funds, to adopt laws, regulations or policies prohibiting transactions with or investment in, or requiring divestment from, entities doing business with Iran and other Designated Countries. It is possible that such laws and initiatives may result in our inability to enter into transactions with those entities that are subject to such prohibitions or to retain or acquire such entities as customers or investors in our securities. In addition, depending on sociopolitical developments, our reputation may suffer due to our association with the Designated Countries. The above circumstances could have a significant adverse effect on our business or the prices of our securities.
In July 2010, the U.S. government enacted legislation designed to restrict economic and financial transactions with Iran, i.e., the Comprehensive Iran Sanctions, Accountability and Divestment Act of 2010 (“CISADA”), which may lead to the imposition of sanctions against non-U.S. financial institutions, such as us, if they are determined by the Secretary of the Treasury to have facilitated “significant transactions�� or provided “significant financial services” for certain Iran-linked financial institutions or the Iranian Revolutionary Guard Corps. In addition, the U.S. government broadened the range of sanctionable transactions to include conducting or facilitating “significant financial transactions” with the Central Bank of Iran or certain other Iranian financial institutions by adopting Section 1245 of the National Defense Authorization Act for Fiscal Year 2012 (the “NDAA”), as implemented by Executive Order 13599 of February 5, 2012 and by amending the Iranian Financial Sanctions Regulations on February 27, 2012. These or similar legislative or regulatory developments may further limit our business operations. Specifically, we could lose our ability to maintain correspondent or payable-through accounts with U.S. financial institutions in case we are determined to have engaged in activities targeted by CISADA or the NDAA.
The U.S. Secretary of State announced on March 20, 2012 that Japan is among a group of countries that has significantly reduced the volume of crude oil purchases from Iran, and that therefore the NDAA sanctions would not apply to Japanese financial institutions for a period of 180 days, which period is renewable based on ongoing reductions in crude oil purchases from Iran. There is no guarantee that the U.S. Secretary of State will renew this waiver with respect to Japanese financial institutions. This or similar legislative developments may further affect our business operations.
Our business could be adversely affected by litigation and regulatory proceedings globally.
We conduct business in many locations in and outside of Japan. We face the risk of litigation and regulatory proceedings in connection with our operations. For example, if we engage in activities targeted by CISADA or the NDAA, this could result in the imposition of sanctions by the U.S. government against us. Lawsuits and regulatory actions may result in sanctions of very large indeterminate amounts or limit our operations, and costs
13
to defend either could be substantial. Moreover, the Bank and one of its subsidiaries contribute to financial benchmarks such as the Tokyo Interbank Offered Rate and the London Interbank Offered Rate for certain specific currencies. These benchmarks are used in jurisdictions in which we operate and do not operate. We face or may face some investigations, litigation and regulatory proceedings, and an adverse regulatory decision, judgment or ruling, including in jurisdictions we do not operate in, could have a material adverse effect on our business, operating results and financial condition.
Risks Related to Our Industry
Our liquidity could be adversely affected by actual or perceived weaknesses in our businesses and by factors we cannot control, such as a general decline in the level of business activity in the financial services sector.
We need liquidity to pay our operating expenses, pay interest on and principal of debt and dividends on capital stock, maintain our lending activities and meet deposit withdrawals. Adverse market and economic conditions in the domestic and global economies may limit or adversely affect our access to liquidity required to operate our business. If our counterparties or the markets are reluctant to finance our operations due to factors including actual or perceived weaknesses in our businesses as a result of large losses, changes in our credit ratings, or a general decline in the level of business activity in the financial services sector, we may be unable to meet our payment obligations when they become due or only be able to meet them with funding obtained on unfavorable terms. Circumstances unrelated to our businesses and outside our control, such as, but not limited to, adverse economic conditions, disruptions in the financial markets or negative developments concerning other financial institutions perceived to be comparable to us, may also limit or adversely affect our ability to replace maturing liabilities in a timely manner. Without sufficient liquidity, we will be forced to curtail our operations, and our business and our operating results and financial condition could be adversely affected.
We may incur losses as a result of financial difficulties of counterparties and other financial institutions.
We regularly execute transactions with counterparties in the financial services industry. Many of these transactions expose us to credit risk in the event of deterioration of creditworthiness of a counterparty or client. With respect to secured transactions, our credit risk may be exacerbated when the collateral cannot be foreclosed on or is liquidated at prices not sufficient to recover the full amount of the loan or other exposures due to us. Losses from our investments in and loans to other financial institutions could materially and adversely affect our business, financial condition and results of operations. We may also be requested to participate in providing assistance to distressed financial institutions that are not our consolidated subsidiaries. In addition, if the funds collected by the Deposit Insurance Corporation of Japan (“DIC”) are insufficient to insure the deposits of failed Japanese banks, the insurance premiums that we pay to the DIC will likely be increased, which could adversely affect our business and operating results.
Adverse regulatory developments or changes in government policies could have a negative impact on our results of operations.
Our businesses are subject to extensive regulation and associated regulatory risks, including the effects of changes in the laws, regulations, policies, voluntary codes of practice and interpretations in Japan and the other jurisdictions in which we operate. Those changes and their effects on us are unpredictable and beyond our control.
Changes in the regulatory environment may adversely affect our financial condition and results of operations. In particular, the financial crisis has led to calls for significant financial reform measures, and various governments are at different stages of enacting legislation that will affect financial institutions.
In response to the financial and economic turmoil, regulatory authorities have been reviewing and revising capital adequacy guidelines, particularly in relation to quality of capital and accounting standards; such revisions
14
could adversely affect our capital ratios. In December 2010, the Basel Committee published the Basel III rules text, setting out certain changes to capital requirements which include raising the quality of banks’ capital bases, enhancing risk coverage, inhibiting leverage, reducing pro-cyclicality and introducing liquidity regulation. The changes that FSA made to its capital adequacy guidelines in response to Basel III will be generally applied from March 31, 2013.
The FSA’s Financial Inspection Manual for financial institutions and related guidelines are revised or amended from time to time. Our implementation of any such changes could result in an increase in our administrative expenses, which could have an adverse effect on the results of operations and financial condition of us and the Bank.
The FSA and regulatory authorities in the United States and other jurisdictions, along with the United Nations, have in recent years made sanctions as a means to promote the prevention of money laundering and terrorism financing a focus of governmental policy relating to financial institutions. Any regulatory action or change in regulatory focus, whether as a result of inspections or regulatory developments, may negatively affect our banking operations and may require expensive remediation.
The Dodd-Frank Wall Street Reform and Consumer Protection Act (“Dodd-Frank Act”), which was enacted in July 2010, provides a broad framework for significant regulatory changes across most areas of U.S. financial regulations. The Dodd-Frank Act addresses, among other issues, systemic risk oversight, bank capital standards, over-the-counter (“OTC”) derivatives, the ability of banking entities to engage in proprietary trading activities and invest in hedge funds and private equity funds (known as the “Volcker Rule”) and securitization. Implementation of the Dodd-Frank Act is taking place through detailed rulemaking over multiple years by various regulators. Although the final details, impact and timing of the rules remain uncertain, it could result in additional costs, or restrict or otherwise affect the way we conduct our business.
These and similar, or any other kind of significant regulatory developments could adversely affect our capital ratios and operating results. For further details, see “Item 4.B. Business Overview—Regulation.” Since those changes in regulation or fiscal or other policies and their effects are unpredictable and beyond our control, we may be unable to comply with those changes regardless of our efforts. Any such failures could result in administrative or judicial proceedings against us, including suspension of our business and financial penalties, which could materially adversely affect our business, reputation, operating results and financial condition.
We operate in the highly competitive financial services industry.
Deregulation, consolidation among financial institutions, diversification within the financial services industry and the expanded presence of foreign financial institutions and investors have made the Japanese financial services market highly competitive. Moreover, competition in overseas markets has intensified due to global consolidation, convergence and alliances among financial institutions. We compete with various types of financial services companies, including:
| | • | | banking groups, including Japan’s other major banking groups; |
| | • | | government-controlled and government-affiliated entities; |
| | • | | regional banking institutions; |
| | • | | major investment banks; and |
| | • | | non-bank financial institutions. |
Government actions, such as those taken to stabilize the market and to alter the regulatory framework, may affect our competitive position. In response to the recent financial crisis, the Government of Japan has taken and may adopt policies, including providing fiscal stimulus or extending credit support to other Japanese financial
15
institutions, which adversely affect our competitive position. For example, the National Diet of Japan (“Diet”) enacted a bill that allowed the Japan Post Bank Co., Ltd., one of the world’s largest deposit-taking financial institutions, to expand its business upon notification to and without future approval of the government. Increased competition in Japan may put downward pressure on prices for our financial services, cause us to lose market share or require us to incur additional expenses in order to remain competitive. Internationally, various forms of financial support provided by foreign governments to foreign banks and other financial institutions during the current financial crisis may reduce the cost of capital to those institutions and otherwise give them competitive advantages. There can be no assurance that we will be able to respond effectively to current or future competition.
Damage to our reputation may have an adverse effect on our business and operating results.
Maintaining our reputation is vital to our ability to attract and maintain customers, investors and employees. Our reputation could be damaged through a variety of circumstances, including, among others, fraud or other misconduct or unlawful behavior by directors, officers or employees, systems failures, compliance failures, investigations, adverse litigation judgments or regulatory decisions, or unfavorable outcomes of governmental inspections. Negative media coverage of Japan’s financial services industry or us, even if inaccurate or not applicable to us, may have a materially adverse effect on our brand image and may undermine depositor confidence, thereby affecting our businesses and results of operations. For example, actual or rumored investigations of us or our directors, officers or employees, or actual or rumored litigation or regulatory proceedings, or media coverage of the same, may have a material adverse effect on our reputation and could negatively affect the prices of our securities. Actions by the financial services industry generally or by certain members in the industry can also adversely affect customers’ confidence on the financial services industry. Such reputational harm could also lead to a decreased customer base, reduced revenues and higher operating costs.
Other Risks
Our failure to establish, maintain and apply adequate internal controls over financial reporting could negatively impact investor confidence in the reliability of our financial statements.
In order to operate as a global financial institution, it is essential for us to have effective internal controls, corporate compliance functions, and accounting systems to manage our assets and operations.
As a New York Stock Exchange-listed company and a registrant with the U.S. Securities and Exchange Commission (“SEC”) under section 404 of the U.S. Sarbanes-Oxley Act of 2002, our management is required to assess the effectiveness of our internal control over financial reporting and disclose whether such internal controls are effective. Our independent registered public accounting firm has to conduct an audit to evaluate and then render an opinion on the effectiveness of our internal control over financial reporting. The Financial Instruments and Exchange Act of Japan (“FIEA”) also requires us, as a company listed on a Japanese stock exchange, to file, together with our annual securities reports required by the FIEA, audited internal control reports assessing the effectiveness of our internal controls over financial reporting.
We have established internal controls over financial reporting, as well as rules for evaluating those controls, in order to provide reasonable assurance of the reliability of our financial reporting and the preparation of financial statements. However, these controls may not prevent or detect errors. Any evaluation of effectiveness to future periods is subject to the risks that controls may become inadequate because of changes in conditions, or that the degree of compliance with the policies or procedures may deteriorate. To the extent any issues are identified through the foregoing processes, there can be no assurance that we will be able to resolve them in a timely manner or at all. If this occurs, our reputation may be damaged, which could lead to a decline in investor confidence in us.
16
Our business operations are exposed to risks of natural disasters, terrorism, pandemics and other calamities.
Our business operations are subject to the risks of natural disasters, terrorism, pandemics, blackouts, geopolitical incidents and other calamities, any of which could impair our business operations. Despite our preparation of operation manuals and other backup measures and procedures, such calamities could cause us to suspend operations and could adversely affect our businesses, financial condition and results of operations. Massive natural disasters such as the Great East Japan Earthquake and any subsequent collateral events, may adversely affect economic conditions in general, the financial conditions of our corporate and individual customers and stock market prices, or cause other negative effects, any or all of which could materially and adversely affect our financial condition and results of operations owing to, for example, an associated increase in the amount of credit-related costs or an increase in losses related to our holdings of securities.
Sales of shares by us or the Bank may have an adverse effect on the market price of our shares and may dilute existing shareholders.
We may issue shares from the unissued portion of our authorized share capital and sell shares held as treasury stock, generally without a shareholder vote. In addition, the Bank may sell any of our shares that it holds. Sales of shares in the future may be at prices below prevailing market prices and may be dilutive.
It may not be possible for investors to effect service of process within the United States upon us or our directors, corporate auditors or senior management, or to enforce against us or those persons judgments obtained in U.S. courts predicated upon the civil liability provisions of the U.S. federal or state securities laws.
We are a joint stock corporation incorporated under the laws of Japan. Almost all of our directors, corporate auditors and senior management reside outside the United States. Many of our assets and the assets of these persons are located in Japan and elsewhere outside the United States. It may not be possible, therefore, for U.S. investors to effect service of process within the United States upon us or these persons or to enforce, against us or these persons, judgments obtained in U.S. courts predicated upon the civil liability provisions of the federal or state securities laws. We believe that there is doubt as to the enforceability in Japan, in original actions or in actions to enforce judgments of U.S. courts, of claims predicated solely upon the U.S. federal or state securities laws mainly because the Civil Execution Act of Japan requires Japanese courts to deny requests for the enforcement of judgments of foreign courts if foreign judgments fail to satisfy the requirements prescribed by the Civil Execution Act, including requirements that:
| | • | | the jurisdiction of the foreign court be recognized under laws, regulations, treaties or conventions; |
| | • | | proper service of process be made on relevant defendants, or relevant defendants be given appropriate protection if such service is not received; |
| | • | | the judgment and proceedings of the foreign court not be repugnant to public policy as applied in Japan; and |
| | • | | there exists reciprocity as to the recognition by a court of the relevant foreign jurisdiction of a final judgment of a Japanese court. |
Judgments obtained in U.S. courts, predicated upon the civil liability provisions of the U.S. federal or state securities laws, may not satisfy these requirements.
As a holder of our American Depositary Shares (“ADSs”), you have fewer rights than a shareholder of record in our shareholder register because you must act through the depositary to exercise these rights.
The rights of our shareholders under Japanese law to take actions such as voting their shares, receiving dividends and distributions, bringing derivative actions, examining our accounting books and records and
17
exercising appraisal rights are available only to our shareholders of record. Because the depositary, through its custodian, is the record holder of the shares underlying the ADSs, only the depositary can exercise shareholder rights relating to the deposited shares. ADS holders will not be able to directly bring a derivative action, examine our accounting books and records or exercise appraisal rights.
Pursuant to the deposit agreement among us, the depositary and the holders and beneficial owners of ADSs, the depositary will endeavor to exercise voting and other rights associated with shares underlying ADSs in accordance with instructions given by ADS holders, and the depositary will also pay to ADS holders dividends and distributions collected from us. However, the depositary is permitted under the deposit agreement to exercise reasonable discretion in carrying out those instructions or in making distributions, and is not liable for failure to carry out instructions or make distributions as long as it acts in good faith. Therefore, ADS holders may not be able to exercise voting or other rights associated with the shares underlying ADSs in the manner that they intend, or may lose some or all of the value of dividends or distributions collected from us. Moreover, the deposit agreement may be amended or terminated by us and the depositary without any reason, or consent from or notice to ADS holders. As a result, ADS holders may not be able to exercise rights in connection with the deposited shares exercised in the way they wish or at all.
ADS holders are dependent on the depositary for certain communications from us. We send to the depositary most of our communications to ADS holders in Japanese. ADS holders may not receive all of our communications in the same manner as or on an equal basis with shareholders of record in our shareholder register.
| Item 4. | Information on the Company |
4.A. HISTORY AND DEVELOPMENT OF THE COMPANY
Legal and Commercial Name
Our legal name is Sumitomo Mitsui Financial Group, Inc. Our commercial name is Sumitomo Mitsui Financial Group (“SMFG”).
Date of Incorporation
We were established in December 2002.
Domicile and Legal Form
We are a joint stock corporation incorporated with limited liability under the laws of Japan. Our address is: Sumitomo Mitsui Financial Group, Inc., 1-2, Marunouchi 1-chome, Chiyoda-ku, Tokyo 100-0005, Japan. Our telephone number is: +81-3-3282-8111.
History and Development
We were established in December 2002 as a holding company for the Group through a statutory share transfer (kabushiki-iten) of all of the outstanding equity securities of the former SMBC in exchange for our newly issued securities. Upon our formation and completion of the statutory share transfer, the former SMBC became our direct, wholly owned subsidiary. The Bank was established in March 2003 through the merger of the former SMBC with Wakashio Bank, which was established in 1996 as a subsidiary of Sakura Bank. The former SMBC was established in April 2001 through the merger of Sumitomo Bank and Sakura Bank, which was established through the merger of Taiyo Kobe Bank and Mitsui Bank in 1990. Mitsui and Sumitomo started their banking businesses in 1876 and 1895, respectively. The origins of both banking businesses can be traced back to the seventeenth century.
18
Information Concerning the Principal Capital Expenditures and Divestitures
In July 2009, the Bank invested ¥27 billion to acquire a 51% interest in ORIX Credit Corporation, a consumer finance provider, which became a consolidated subsidiary of the Bank with ORIX Corporation owning the remaining 49%.
In October 2009, we acquired for ¥565 billion all the operations of the former Nikko Cordial Securities Inc. and a part of the operations of the former Nikko Citigroup Ltd., which have since been combined to form SMBC Nikko Securities Inc.
In December 2009, we terminated a joint business with Daiwa Securities Group Inc. and sold to Daiwa Securities Group our 40% equity interest in the former Daiwa Securities SMBC Co., Ltd., now Daiwa Securities Co. Ltd.
In May 2010, our wholly owned subsidiary, SMFG Card & Credit, Inc., subscribed for a third-party allotment of newly-issued shares of Cedyna’s common stock for a total price of approximately ¥50 billion. As a result, Cedyna, previously our equity-method associate, became our consolidated subsidiary. In May 2011, SMFG Card & Credit completed a share exchange to acquire the remaining outstanding shares of Cedyna, and Cedyna became our wholly owned subsidiary.
In December 2011, the Bank made SMBC Consumer Finance, formerly known as Promise, its consolidated subsidiary with the completion of a tender offer for an aggregate ¥71 billion. Following the tender offer, in the same month, we subscribed for a third-party allotment of newly issued shares of SMBC Consumer Finance’s common stock for a total price of ¥120 billion. On April 1, 2012, SMBC Consumer Finance became our wholly owned subsidiary upon the completion of a share exchange of our common stock for SMBC Consumer Finance’s common stock, including the shares which the Bank owned.
On June 1, 2012, the Bank, Sumitomo Mitsui Finance and Leasing and Sumitomo Corporation, a non-affiliate, acquired the aircraft leasing business of The Royal Bank of Scotland Group plc, and commenced its operation as SMBC Aviation Capital. The final purchase price has not yet been finalized because it will be adjusted based on the assets and liabilities of the acquired business at May 31, 2012.
On June 29, 2012, the Bank transferred all of its shares of ORIX Credit to ORIX and, as a result, ORIX Credit is no longer our subsidiary.
Public Takeover Offers
Not applicable.
4.B. BUSINESS OVERVIEW
Overview
We are a holding company that directly owns 100% of the issued and outstanding shares of the Bank, one of the largest commercial banks in Japan. We are one of the three largest banking groups in Japan with an established presence across all of the consumer and corporate banking sectors. Our subsidiaries in our commercial banking business include, in addition to SMBC, Kansai Urban Banking Corporation, The Minato Bank, Sumitomo Mitsui Banking Corporation Europe Limited (“SMBC Europe”) and Sumitomo Mitsui Banking Corporation (China) Limited (“SMBC (China)”). Our subsidiaries also include SMBC Nikko Securities and SMBC Friend Securities Co., Ltd. in our securities business; Sumitomo Mitsui Finance and Leasing Company, Limited in our leasing business; and Sumitomo Mitsui Card Company, Limited and Cedyna in our credit card services business. See “Item 4.C. Organizational Structure.”
19
Management Philosophy
Our Group-wide management philosophy is as follows:
| | • | | to provide optimum added value to our customers and together with them achieve growth; |
| | • | | to create sustainable shareholder value through business growth; and |
| | • | | to provide a challenging and professionally rewarding work environment for our dedicated employees. |
In addition to our Group-wide management philosophy, we have also established a code of conduct. Our code of conduct is designed to be a guideline for the conduct of our directors, officers and other employees in the realization of our Group-wide management philosophy in all areas. Our code of conduct is as follows:
| | • | | to strive to increase shareholder value and simultaneously maintain healthy relationships with our customers, employees and other important stakeholders; |
| | • | | to give due consideration to people’s trust in our company, abide by laws and regulations, maintain a high ethical standard, and act fairly and sincerely; |
| | • | | to acquire and continuously enhance our knowledge, ability and intelligence, increase productivity in all areas of our business and provide superior financial services at competitive prices; |
| | • | | to establish a top-brand company on a global basis by understanding the needs of each customer and providing valuable services according to the changing needs of our customers; |
| | • | | to efficiently implement the goals of our business strategy in order to become a leader in selected markets by strategically allocating managerial resources; |
| | • | | to proactively promote innovation and creativity in all our business areas in order to stay ahead of competitors; |
| | • | | to build a strong organization based on market principles and rational thinking which reflect diverse values and delegate internal authority under a strict risk management system so as to enable rapid decisions and efficient business execution; and |
| | • | | to promote the growth of our business through the development of our employees by setting high targets and using objective evaluation and compensation systems which emphasize ability and achievement of good results. |
Environment
We recognize preservation of the environment as one of our most important management objectives and strive to achieve harmony with the natural environment in our corporate activities.
Basic Philosophy Regarding the Group’s Environmental Activities
Recognizing the importance of realizing a sustainable society as one of our most important tasks, we make continuous efforts to harmonize environmental preservation and corporate activities in order to support the economy and contribute to the general well-being of society as a whole.
We and our principal Group companies have obtained ISO 14001 certification, the international standard for environmental management systems. Every year we set environmental objectives which we systematically pursue through environmental activities based on a PDCA (Plan, Do, Check and Act) cycle. We officially signed the “Statement by Financial Institutions on the Environment and Sustainable Development” of the United Nations Environment Programme (“UNEP”) in 2002.
20
The Bank made its head office “carbon neutral” and requires land pledged as collateral to undergo soil contamination and asbestos risk assessment. In addition, we also apply the “Equator Principles,” a set of guidelines for financial institutions to assess and manage social and environmental impacts related to the financing of large-scale development projects, when we finance such projects.
Description of Operations and Principal Activities
Commercial Banking
We offer commercial banking services to a wide range of customers including individuals, mid-sized companies, small and medium-sized enterprises (“SMEs”), large corporations, governments and governmental entities mainly through the Bank. The Bank has solid franchises in both corporate and consumer banking in Japan. The Bank has long-standing and close business relationships with many companies listed on the First Section of the Tokyo Stock Exchange and long historical relationships with the so-called Sumitomo Group and Mitsui Group companies.
The Bank provides an extensive range of consumer and corporate banking services in Japan and wholesale banking services overseas. In Japan, the Bank accepts deposits from, makes loans to, extends guarantees to and provides other products and services to corporations, individuals, governments and governmental entities. The Bank offers financing solutions through loan syndication, structured finance and project finance to large corporate customers in the domestic and overseas markets, as well as a variety of financing options to domestic mid-sized companies, SMEs and individuals. The Bank also underwrites and deals in bonds issued by or guaranteed by the Government of Japan and local government authorities, and acts in various administrative and advisory capacities for select types of corporate and government bonds. Internationally, the Bank operates through a network of branches, representative offices, subsidiaries and affiliates to provide loan syndication, project finance and cash management services and participate in international securities markets.
The Bank conducts its primary banking business through its five business units: the Consumer Banking Unit, the Middle Market Banking Unit, the Corporate Banking Unit, the International Banking Unit and the Treasury Unit. The Bank’s Investment Banking Unit, Corporate Advisory Division, Private Advisory Division and Transaction Business Division operate across these business units. Further, the Bank has a Corporate Staff Unit, a Corporate Services Unit, a Compliance Unit, a Risk Management Unit and an Internal Audit Unit.
The Bank’s Consumer Banking Unit
The Bank’s Consumer Banking Unit provides financial services to consumers residing in Japan. It offers a wide array of financial services including, but not limited to, personal bank accounts, investment trusts, pension-type insurance products, life insurance products and housing loans.
The operations are mainly conducted through a large and well developed branch network. The Bank had a domestic network consisting of 437 branch offices at March 31, 2012, most of which were located in the Tokyo and Osaka regions. At March 31, 2012, 73 of these branches had “SMBC Consulting Plazas” that provide financial consulting services about asset management and housing loans during extended hours, including weekday evenings, weekends and national holidays, for the convenience of individual customers.
The Bank also operates an extensive network of ATMs in Japan. At March 31, 2012, the Bank offers its customers’ access to 43,824 ATMs, some of which are the Bank’s ATMs and the majority of which are ATMs made available through arrangements with other ATM providers such as convenience store chains.
The Consumer Banking Unit also offers internet banking services for consumers. At March 31, 2012, the Bank’s internet banking services had approximately 12 million registered users. The users are able to transfer funds, perform balance inquiries, make time deposits and foreign currency deposits and buy and sell investment trusts over the internet, as well as over the mobile phone or the traditional telephone.
21
This business unit offers deposit products, including ordinary deposits and time deposits, and the following products and services through various channels:
| | • | | Housing Loans. Housing loans, which are principally secured by collateral or supported by guarantees, are one of the primary products offered by this business unit. The Bank provides housing loans with a variety of terms and interest rates, including 10- to 35-year term, fixed-rate loans, to meet diversified customer needs. For instance, the Bank offers a housing loan combined with an insurance policy that covers the repayment of the outstanding loan balance in the event the borrower is diagnosed with certain serious diseases. |
| | • | | Investment Trust. The Bank, as a broker, provides a variety of investment trust products with varying risk-return profiles that are developed and managed by experienced asset management companies within Japan and overseas. |
| | • | | Insurance Products. The Bank, as an agent, offers pension-type insurance, whereby customers who make all premium payments are able to receive annuity payments when they reach a certain age. The Bank, as an agent, also sells a wide range of insurance products, including medical insurance, juvenile insurance, home fire insurance, single-premium whole life insurance, level-premium life insurance and annuities. |
| | • | | Securities Intermediary Services for Individuals. The Bank offers a variety of financial products, including foreign currency bonds and structured bonds, to its individual customers to complement its lineup of investment trusts together with its subsidiary SMBC Nikko Securities. |
| | • | | Consumer Finance Services. The Bank offers a variety of consumer loan products such as unsecured card loan products to its individual customers. |
The Bank also offers the wealth management services to its customers in collaboration with SMBC Nikko Securities and Barclays PLC. See “—Alliance with Barclays.”
The Bank’s Middle Market Banking Unit
The Bank’s Middle Market Banking Unit focuses on building a solution business and responding to various issues which mid-sized companies and SMEs face. This business unit, together with certain of our Group companies, offers its customers lending, cash management, settlement, leasing, factoring, management information systems consulting, collection and investment banking services, through 223 sales channels of the Bank at March 31, 2012. This business unit also provides the following products and services to mid-sized companies and SMEs:
| | • | | Loan products and services to promote socially responsible activities. The Bank provides a variety of loan products and services designed for corporate clients engaging in socially responsible activities. These activities include environmentally friendly activities, improvement of eating habits, development of agricultural and fishery industries, and development of risk management systems for emergency situations. The Bank evaluates their socially responsible activities and offers loans with certain conditions incorporating the results of its evaluation. Furthermore, in connection with these loans, the Bank provides advice in relation to the client’s socially responsible initiatives. |
| | • | | Services for Globalizing Corporations. In light of the recent overseas expansion trend among mid-sized companies and SMEs, the Bank focuses on offering products and services whereby the Bank assists those customers entering new markets, especially in China and other Asian countries, and accommodates an increase in their international trade operations. |
| | • | | Services to Promote B-to-B Transactions. The Bank, with its subsidiaries and affiliates, provides various internet settlement services to meet its customers’ needs. The Bank has promoted these services to stimulate greater demand for its solutions business for mid-sized companies and SMEs. Using these services, corporate customers are able to transfer money more easily and effectively, and also utilize foreign exchange services to transfer funds to and from their overseas counterparts in foreign currencies. |
22
The Bank’s Corporate Banking Unit
The Bank’s Corporate Banking Unit provides a wide range of financial products and services such as loans, deposits and settlement services, targeting large Japanese corporations and listed companies. This business unit also offers business solutions for the increasingly complex and diverse management issues which large Japanese corporations are currently facing, and supports their active business expansion plans.
This business unit, with the Bank’s Investment Banking Unit, provides products and services such as loan syndication, structured finance, commitment lines and non-recourse loans. As part of its solutions services, the Bank intends to promote opportunities for the capital markets to respond to its customers’ funding and corporate restructuring needs, particularly through SMBC Nikko Securities.
The Bank’s International Banking Unit
The Bank’s International Banking Unit mainly supports companies, financial institutions, sovereign/quasi-sovereign entities outside Japan, and multinational companies operating in Japan. This business unit provides a variety of tailored products and services to meet customer and market requirements, including loans, deposits, clearing services, trade finance, project finance, loan syndication and global cash management services.
At March 31, 2012, the Bank’s international network consisted of 15 branches, 10 sub-branches and 10 representative offices and together with the network of its subsidiaries such as SMBC Europe and SMBC (China), the Bank seeks to meet customers’ needs globally. After April 2011, the Bank newly established representative offices in:
| | • | | New Delhi, the Republic of India in April 2011; |
| | • | | Phnom Penh, the Kingdom of Cambodia in February 2012; |
| | • | | Istanbul, the Republic of Turkey in February 2012; and |
| | • | | Lima, the Republic of Peru in May 2012. |
Based on our strategy of expanding our businesses globally, the Bank has been promoting strategic alliances to enhance products and services with leading financial institutions such as Barclays, Vietnam Export Import Commercial Joint Stock Bank, The Bank of East Asia Limited, Kookmin Bank and Kotak Mahindra Bank Limited.
The Bank’s Treasury Unit
The Bank’s Treasury Unit operates in the domestic and international money, foreign exchange, securities and derivatives markets to serve customer needs and the Bank’s own asset and liability management requirements.
To further expand the Bank’s customer base, this business unit also seeks to provide specialized solutions and enhance customer service capabilities in market transactions through the following activities:
| | • | | providing a variety of products from traditional money and foreign-exchange transactions to derivative transactions; and |
| | • | | developing channels such as an internet banking site providing foreign exchange transactions to satisfy a variety of requirements and orders from customers. |
This business unit also provides underwriting services for the placement of commercial paper.
23
Others
The Bank also engages in the following business activities through its business units:
| | • | | Payment Services. The Bank handles money remittances for municipalities, public and private corporations and individuals in Japan and overseas. Domestic remittance services are significant in Japan, where checks are rarely used and money remittance is a major means of payment. The Bank also handles the collection for its customers of promissory notes, bills of exchange and checks. |
| | • | | Foreign Exchange. The Bank engages in a variety of foreign exchange transactions, including foreign currency exchange, overseas transfers and trade finance for export and import activities. |
In cooperation with the Bank’s business units and SMBC Nikko Securities, the Bank also engages in the following business activities:
| | • | | Investment Banking Unit. The Investment Banking Unit provides a broad range of sophisticated financial products and services, as follows: |
| | • | | Customized Financial Services and Financing Solutions. The Bank provides a wide range of innovative financial services and financing solutions to its corporate clients, including loan syndication, structured finance, project finance, acquisition financing such as LBO and MBO financing, non-recourse real estate finance, securitization, derivatives, and M&A advisory. |
| | • | | Securities Intermediary Services for Corporate Clients. The Bank provides corporate clients with securities intermediary services, and offers structured bonds, subordinated bonds and other products to corporate clients in cooperation with SMBC Nikko Securities. |
| | • | | Corporate Bond Trust Services. The Bank serves as a trustee or co-trustee of corporate mortgage bonds. The Bank also serves as a commissioned company for bondholders and as a fiscal and paying agent for unsecured bonds that are issued and publicly offered by domestic and foreign customers. In this role, the Bank also advises issuers about market conditions and provides administrative services on behalf of issuers. |
| | • | | Other Trust Services. The Bank offers other trust services to its customers, including monetary claims trusts for asset securitizations and trusts for structured finance. |
| | • | | Principal Investments.The Bank, directly or through private equity funds, invests in corporate customers seeking to restructure or reorganize themselves or expand their businesses. |
| | • | | Solutions Related to Growing Industrial Sectors. The Bank provides a wide range of solutions to corporate customers addressing businesses related to growing industrial sectors, such as environmental, natural resources, water and new energy industries. As for the environmental industry, we undertake the trading of emission credits. |
| | • | | Corporate Advisory Division. The Corporate Advisory Division complements our service lineup for both listed and non-listed companies, providing financial solutions for the increasingly sophisticated and diverse management issues faced by corporate clients. This division provides a centralized information platform that maintains the Bank’s accumulated information and knowledge concerning a wide range of industries. Leveraging this centralized information platform, this division provides the Bank’s customers with proposals for strategic initiatives to help enhance their corporate value. This division establishes a separate team for each project and works in cooperation with the Bank’s other departments and our Group companies, including SMBC Nikko Securities and Sumitomo Mitsui Finance and Leasing. This division aims to offer comprehensive solutions for M&A, strategic investment, business alliances and other management issues. |
| | • | | Private Advisory Division. The Private Advisory Division addresses areas where the needs of individuals and corporate clients overlap, including private banking, workplace banking and business succession consulting. |
24
| | • | | Transaction Business Division.The Transaction Business Division complements our transaction and financing services, including cash management, settlement, foreign exchange, supply chain finance, for our corporate clients. This division aims to offer a variety of products and services to capture customers’ cash flows and business flows. |
In addition to the Bank, our domestic banking subsidiaries include local financial institutions, such as Kansai Urban Banking Corporation and The Minato Bank, as well as The Japan Net Bank, Limited. Kansai Urban Banking Corporation and The Minato Bank, as regional financial institutions based in Kansai area, provide commercial banking services to corporations and individuals. The Japan Net Bank, as an internet bank, provides internet-based services such as deposits, loans and investment products.
Our foreign banking subsidiaries include SMBC Europe, SMBC (China), Manufacturers Bank, Sumitomo Mitsui Banking Corporation of Canada, Banco Sumitomo Mitsui Brasileiro S.A., ZAO Sumitomo Mitsui Rus Bank, PT Bank Sumitomo Mitsui Indonesia and Sumitomo Mitsui Banking Corporation Malaysia Berhad. At March 31, 2012, in China there are 15 offices which are composed of eight branches including the head office and four sub-branches of SMBC (China), and one branch and two representative offices of the Bank.
Securities
SMBC Friend Securities
SMBC Friend Securities, our wholly owned subsidiary, is a full-line securities company focusing on retail business. SMBC Friend Securities has a nationwide network that offers services tailored to the needs of its clients and offers online financial consulting services.
SMBC Nikko Securities
As one of the major Japanese securities companies, SMBC Nikko Securities offers a wide range of financial products and investment consultation and administrative services to its individual and corporate customers in Japan. For individual customers, SMBC Nikko Securities provides consulting services to meet diversified asset management needs at 109 branches nationwide, and a widely used online trading tool. For corporate customers, it also offers trading capabilities and financial products, debt and equity underwriting, and M&A advisory services, mainly in Japan.
In October 2009, SMBC Nikko Securities was formed as a wholly owned subsidiary of the Bank through the Bank’s acquisition of all the shares of Nikko Cordial Securities Inc., which engaged mainly in the retail business, and the domestic debt and equity underwriting and certain other businesses of Nikko Citigroup Ltd., which engaged mainly in the wholesale business.
SMBC Nikko Securities, together with its overseas subsidiaries, SMBC Nikko Securities (Hong Kong) Limited, SMBC Nikko Capital Markets Limited and SMBC Nikko Securities America, Inc., seeks to provide financial services such as brokerage services of Japanese stocks and M&A advisory services to clients on a global basis.
To strengthen our cross border M&A and other advisory services to Japanese companies, SMBC Nikko Securities, the Bank and Moelis & Company, a global investment bank headquartered in New York, established a business alliance in March 2011. In February 2012, we invested approximately $93 million in Moelis & Company to enhance the existing business alliance.
Business Alliance with Citigroup
In May 2009, we entered into a strategic business alliance with Citigroup Inc. centering on a variety of collaborative activities between SMBC Nikko Securities and Citigroup. As part of this alliance, Citigroup
25
provides us with access to its global corporate and investment banking networks, including sales and trading and M&A services. The long-standing relationship between Citigroup and the former Nikko Cordial Securities in the origination and distribution of financial products in Japan and globally is being upheld with SMBC Nikko Securities.
Termination of Our Alliance with Daiwa Securities Group
In December 2009, we terminated our Daiwa Securities SMBC joint business with Daiwa Securities Group Inc. We sold our 40% equity investment in the former Daiwa Securities SMBC to Daiwa Securities Group, which held the remaining 60%. Through the joint business, which lasted ten years, we engaged in the wholesale securities business and provided a variety of financial services to the Bank’s corporate customers. We currently offer many of these services through SMBC Nikko Securities. Upon the termination, we and Daiwa Securities Group agreed that Daiwa Securities SMBC Principal Investments Co. Ltd., which was a wholly owned subsidiary of Daiwa Securities SMBC, will continue as a joint venture between Daiwa Securities Group (which owns 60% of the shares) and the Bank (which owns the remaining 40%).
In July 2010, we also terminated our Daiwa SMBC Capital joint business with the Daiwa Securities Group and executed a company split to form SMBC Venture Capital Co., Ltd., which became our consolidated subsidiary, of which we own 40%.
Leasing
Sumitomo Mitsui Finance and Leasing
Sumitomo Mitsui Finance and Leasing, one of the major leasing companies in Japan, provides a variety of leasing services including equipment lease, operating lease, leveraged lease, and aircraft operating lease. In 2007, Sumitomo Mitsui Finance and Leasing was formed as a result of the merger of SMBC Leasing and Sumisho Lease. We have a 60% equity interest in Sumitomo Mitsui Finance and Leasing, while the remaining 40% is held by Sumitomo Corporation, a non-affiliate.
In November 2010, Sumitomo Mitsui Finance and Leasing established SFI Leasing Company, Limited, a joint business with Sony Corporation, in order to further develop our leasing and rental business.
On June 1, 2012, the Bank, Sumitomo Mitsui Finance and Leasing and Sumitomo Corporation acquired the aircraft leasing business of The Royal Bank of Scotland Group plc, and commenced its operation as SMBC Aviation Capital. Together with an existing aircraft leasing unit, we and Sumitomo Corporation intend to further expand and develop the aircraft leasing business in Asia and other emerging markets.
In addition to the above companies, our U.S. subsidiary SMBC Leasing and Finance, Inc. engages in the leasing business, and our associate Sumitomo Mitsui Auto Service Company, Limited engages in the auto leasing business.
Credit Card
Sumitomo Mitsui Card
Sumitomo Mitsui Card is a leading company in Japan’s credit card industry, having introduced the Visa brand into the Japanese market. Sumitomo Mitsui Card conducts a comprehensive credit card business with a strong brand, and offers a variety of settlement and finance services to meet diverse customer needs.
We, Sumitomo Mitsui Card, the Bank and NTT DoCoMo, Inc. formed a strategic business and capital alliance in credit payment service. We have 66% equity interest in Sumitomo Mitsui Card, while the remaining 34% is held by NTT DoCoMo. Pursuant to the alliance, Sumitomo Mitsui Card offers a credit payment service using NTT DoCoMo’s mobile phones equipped with contactless IC chips.
26
In addition, Sumitomo Mitsui Card issues a variety of affiliated credit cards in cooperation with partners including, but not limited to, railway companies, airline companies, department stores, and retailers, to satisfy both these partners’ and cardholders’ needs. Sumitomo Mitsui Card also provides services for customers such as travelers and retailers both in Japan and China, in alliance with China UnionPay Co., Ltd., a bankcard association established in the People’s Republic of China.
Cedyna
Cedyna conducts credit card, installment (such as shopping credit and automobile loan), and solution (such as collection outsourcing and factoring) businesses.
In April 2009, Central Finance and QUOQ merged into OMC Card, creating Cedyna. Cedyna became our subsidiary after SMFG Card & Credit subscribed to Cedyna’s third-party share allotment in May 2010. Subsequently, in May 2011, Cedyna became our wholly owned subsidiary when SMFG Card & Credit completed a share exchange to acquire the remaining outstanding shares of Cedyna.
On March 31, 2012, Cedyna made SMBC Finance Service Co., Ltd. a wholly owned subsidiary. SMBC Finance Service, which had been a subsidiary of the Bank before the reorganization, provides collection outsourcing services and has a strong customer base and internet settlement know-how. Cedyna will transfer its own solution business to SMBC Finance Service in order to strengthen its competitive edge by taking advantage of scale and promoting streamlining.
Others
In addition to the above companies, our subsidiary Sakura Card Co., Ltd. and our associate Pocket Card Co., Ltd. also engage in the credit card business.
Other Major Group Companies and Alliances
The Japan Research Institute
The Japan Research Institute, Limited is our wholly owned subsidiary that provides financial consultation services on management reform, IT, the planning and development of strategic information systems and outsourcing. It also conducts diverse activities including domestic and international economic research and analysis, policy recommendations and business incubation.
In 2009, The Japan Research Institute sold 50% of the shares in JSOL Corporation to NTT Data Corporation, which resulted in JSOL becoming our associate. Prior to the sale, JSOL had been a wholly owned subsidiary of The Japan Research Institute. JSOL offers information technology solutions to customers in the general industrial, financial and public sectors.
SMBC Consumer Finance
SMBC Consumer Finance, which changed its trade name from Promise on July 1, 2012, is a core entity in our consumer finance business. It provides consumer loans that consist mainly of unsecured loans to individuals, and conducts other business including loan guarantee business. SMBC Consumer Finance guarantees certain consumer loans made by the Bank.
We decided to make SMBC Consumer Finance our wholly owned subsidiary in order to reinforce its consumer finance business, to enhance our earnings generation capacity, and to better achieve the expansion of our consumer finance business centered on SMBC Consumer Finance. In December 2011, the Bank made SMBC Consumer Finance its consolidated subsidiary with the completion of a tender offer. Following the tender offer,
27
we subscribed for a third-party allotment of newly issued shares of SMBC Consumer Finance’s common stock. On April 1, 2012, SMBC Consumer Finance became our wholly owned subsidiary upon the completion of a share exchange of shares of our common stock for SMBC Consumer Finance’s common stock, including the shares which the Bank owned.
ORIX Credit
ORIX Credit offers a wide range of card loan products, focusing on a card loan with a low interest rate and large credit line, and has expanded its business operation by gaining as customers high-income individuals. In July 2009, the Bank acquired a 51% interest in ORIX Credit as part of a collaborative initiative with ORIX, and ORIX Credit became a consolidated subsidiary of the Bank. In March 2011, ORIX Credit entered into a business alliance agreement with SMBC Consumer Finance regarding loan guarantees.
On June 29, 2012, the Bank transferred all of its shares of ORIX Credit to ORIX and, as a result, ORIX Credit is no longer our subsidiary.
Alliance with Barclays
Following an agreement in 2008 between Barclays and the Bank to explore joint business development opportunities, the Bank acquired newly issued shares of Barclays common stock for approximately £500 million. In April 2010, Barclays, the Bank and SMBC Nikko Securities established a division in SMBC Nikko Securities to provide wealth management services to high-net-worth individuals in Japan. In May 2010, the Bank entered into a business alliance agreement with Absa Bank Limited, a group company of Barclays, regarding collaboration on services to Japanese companies in South Africa and other African countries. We have intensified our management-level communications with Barclays regarding, for example, the effects of strengthened regulation of the global banking industry. The Bank believes these initiatives will yield mutual benefits and will facilitate business expansion for us in targeted growth business areas, both foreign and domestic.
Credit Loss Protection Agreement with Goldman Sachs
To expand its overseas portfolio and revenue, the Bank entered into agreements with Goldman Sachs in 2003 to provide credit protection to Goldman Sachs’ extension of credit to their investment grade clients in exchange for receiving a proportion of the fees and interest income from the borrowers. In connection with the agreements, Goldman Sachs established certain wholly owned subsidiaries (the “William Street Entities”) that might make credit commitments and extensions. Goldman Sachs entered into credit loss protection arrangements with the Bank in order to hedge in part the credit risk to its investment in the William Street Entities. The Bank, through its Cayman Islands branch, would issue letters of credit in exchange for fees equal to a portion of the fees and interest to be paid by the borrowers to the William Street Entities. The first letter of credit (“FLC”), was issued in 2003 in a maximum available amount of $1 billion, and is available over a 20-year period, subject to early termination or extension. Also, from time to time over a 20-year period, subject to early termination or extension and other conditions, upon the request of Goldman Sachs, the Bank has issued letters of credit and may issue one or more additional letters of credit (each a second letter of credit (“SLC Series”) exposing the Bank to risk rated BBB/Baa2 or higher in an aggregate maximum available amount of $1.125 billion). Goldman Sachs may draw on the letters of credit in the event that Goldman Sachs realizes certain losses (“Specified Losses”), with respect to loan commitments or loans extended thereunder that Goldman Sachs has entered into with specified borrowers approved by the Bank and Goldman Sachs.
Under the FLC, Goldman Sachs is entitled to draw from time to time amounts equal to approximately 95% of Specified Losses, up to an aggregate stated amount of $1 billion. Under the SLC Series, Goldman Sachs is entitled, subject to certain conditions, to draw from time to time amounts equal to approximately 70% of Specified Losses above specified loss thresholds, up to an aggregate stated amount of $1.125 billion. Goldman Sachs has made a small number of draw downs under the FLC in accordance with its terms.
28
In connection with these credit arrangements, the Bank pays Goldman Sachs an administration fee based on the aggregate amount of commitments covered by the FLC.
The credit loss protection arrangements contain a number of provisions that give the Bank some control over the determination of borrowers to which it has potential exposure under the FLC and any SLC Series:
| | • | | Goldman Sachs may make credit commitments covered by the arrangements only to borrowers approved by the Bank. |
| | • | | Unless the Bank and Goldman Sachs agree otherwise, the borrowers covered by the FLC and any SLC Series that are rated by both of the two major rating agencies must be rated investment grade by at least one, and borrowers that are rated only by one of the two major rating agencies must be rated investment grade by that rating agency. If neither of the two major rating agencies rates a borrower, then further credit to the borrower shall no longer be covered by the FLC or any SLC Series, if the Bank and Goldman Sachs determine the borrower’s credit conditions are lower than investment grade. |
| | • | | If the ratings of an approved borrower fall below investment grade in the judgment of both major rating agencies (or, if a borrower is rated investment grade by only one agency, and that agency downgrades the borrower below investment grade), further credit to that borrower will no longer be covered by these arrangements, unless the Bank and Goldman Sachs otherwise agree. |
| | • | | On the fifth, tenth and fifteenth anniversaries of the transaction, the Bank has the right to cause Goldman Sachs to stop extending new credit to borrowers the Bank deems to have become “unbankable.” Unbankable borrowers are those who have investment grade ratings from the two major rating agencies but are deemed by the Bank to be below BB- and below Ba3 based on the Bank’s application of rating agency methodologies and criteria. If Goldman Sachs disagrees with the Bank, the matter is to be referred to arbitration, and a suspension is effective unless and until an arbitrator rules in favor of Goldman Sachs. |
The Bank, through a separate bankruptcy-remote Cayman Islands subsidiary, has collateralized the obligations on the FLC and a portion of the SLC Series by buying $1.330 billion of Goldman Sachs demand notes and pledging those demand notes to Goldman Sachs. If Goldman Sachs activates an SLC Series that is not collateralized, the Bank through its Cayman Islands subsidiary will be required to purchase and pledge additional Goldman Sachs demand notes with a principal amount equal to the stated amount of that SLC Series. Subject to certain conditions, the Bank has the right to substitute as collateral high quality liquid securities for the Goldman Sachs demand notes.
These arrangements are designed to collateralize the Bank’s obligations in the event the Bank’s Cayman Island branch fails to perform on the FLC or any SLC Series, including as a result of our insolvency or the insolvency of the Bank or the Bank’s Cayman Island branch.
If Goldman Sachs’ credit rating, as determined by either of the two major credit rating agencies, falls below investment grade, Goldman Sachs is obligated to provide collateral to the Bank to support Goldman Sachs’ obligations under the Goldman Sachs demand notes. After an initial 15-year period under the letters of credit, the Bank and Goldman Sachs will negotiate in good faith to extend the terms of the letter of credit arrangements for one additional five-year term. Before the expiration of the initial 20-year term, in certain circumstances, the letter of credit arrangements with the Bank may be terminated by the Bank or Goldman Sachs, in which event Goldman Sachs would be obligated to prepay any outstanding demand notes. In circumstances related primarily to the creditworthiness of the Bank or a breach of its representations or covenants, Goldman Sachs may draw on the letters of credit for early termination amounts of up to the remaining undrawn or available amount on the letters of credit. In connection with draws on the letters of credit of early termination amounts, Goldman Sachs would have to prepay any outstanding demand notes. Goldman Sachs also would be obligated to pay the Bank on the originally scheduled expiration date of the letter of credit arrangements an amount equal to the early termination amounts minus the losses that would have been reimbursed under the letters of credit had they not terminated early.
29
At the time the Bank entered into the above credit protection agreements, SMFG issued Type 4 preferred stock amounting to ¥150.3 billion to Goldman Sachs and SMFG and the Bank entered into a business cooperation agreement with Goldman Sachs. However all the Type 4 preferred stock has been converted to common stock and the business cooperation agreement has expired, except for certain rights which will expire in January 2014.
Management Policies
We aim to be a globally competitive and trusted financial services group by maximizing our strength of Spirit of Innovation, Speed and Solution & Execution. We launched a medium-term management plan in May 2011 for the three years from the fiscal year ended March 31, 2012 to the fiscal year ending March 31, 2014, with the two management objectives as follows:
| | • | | Aim for top quality in strategic business areas; and |
| | • | | Establish a solid financial base and corporate infrastructure to meet the challenges of financial regulations and the highly competitive environment. |
The following four financial objectives and targets were set with the aim of improving and seeking a balance between financial soundness, profitability and growth.
Financial Soundness.
| | • | | Achieve sufficient Core Tier I ratio as required for a global player; |
Profitability.
| | • | | Enhance risk-return profile by improving asset quality; |
| | • | | Aim for top-level cost efficiency among global players; and |
Growth.
| | • | | Expand international business especially in Asia by capturing business opportunities in growth markets. |
Our basic policy for the fiscal year ending March 31, 2013 is as follows: “Move forward steadily towards the targets of the medium-term management plan, capturing opportunities with proactive ideas and actions.” We also intend to continue to implement initiatives for the two strategies—(1) strengthening initiatives in strategic business areas and (2) establishing a solid financial base and corporate infrastructure—of the medium-term management plan.
(1) Strengthen initiatives in strategic business areas
Financial consulting for retail customers.We intend to continue to make efforts to improve our financial consulting capabilities for retail customers, whose needs are diversifying, through initiatives including an expansion of the product line-up in the securities intermediary business and a reinforcement of insurance business at the Bank. At the same time, we intend to strengthen our client base by promoting collaboration between the Bank’s Middle Market Banking Unit and Consumer Banking Unit, and cross-selling on a Group-wide basis. In addition, we plan to offer products and services addressing individuals’ important life events. We also plan to enhance transaction services and our consumer finance business for retail customers on a Group-wide basis by consolidating the management function of Group companies engaged in these businesses into Consumer Finance & Transaction Business Department.
30
Tailor-made solutions for corporate clients. We plan to strengthen responsiveness to customers by reorganizing our marketing framework and optimizing staff allocation. Specifically, we plan to reinforce our lending business and our solution providing capabilities in order to more effectively accommodate diversified and sophisticated financing needs of clients from the planning stage.
Commercial banking in emerging markets, especially Asia. We intend to accommodate Japanese clients’ needs, including supporting their international business development, more effectively and in a more integrated manner, and reinforce our growing businesses, including infrastructure finance and trade finance, by expanding our global network, promoting collaboration between domestic and overseas offices and between business units, and strengthening marketing functions associated with investment banking business in Asia. In addition, we plan to secure stable foreign currency funding sources to accommodate an increase of overseas assets.
Broker-dealer services and investment banking. We plan to reinforce SMBC Nikko Securities, the principal driver of our securities business, by further promoting collaboration with the Bank and enhancing wholesale securities business capabilities for cross-border M&A and other advisory services.
Non-asset business (payment and settlement services and asset management). We aim to accommodate the transaction services needs and accompanying financing needs of corporate clients the world over by flexibly and quickly offering products and services in a more integrated manner. To this end, we intend to leverage the functions of the newly established Transaction Business Planning Department, which devises long-term, integrated transaction services business strategies for our Group and manages settlement risk, and the Transaction Business Division, which promotes transaction services businesses for corporate clients. Regarding our asset management business, we aim to reinforce collaboration within our Group and with overseas asset management companies.
(2) Establish a solid financial base and corporate infrastructure
In order to strengthen our corporate infrastructure to support sustainable development of our international business, we plan to upgrade our risk management system, develop human resources with international business capabilities and promote national staff. We also aim to upgrade our Group-wide management capabilities by diversifying and enhancing our business portfolio through rebalancing while reinforcing strategic business areas, and pursuing operational efficiency through business process re-engineering. Regarding compliance, we intend to further reinforce our compliance system to address the changing regulatory environment and to more effectively meet local laws and regulations in view of the Group-wide development of our international business.
Through these initiatives, we aim to achieve steady results, and further increase the value for our clients and shareholders, financial markets, and society.
31
Revenues by Region
The following table sets forth the percentage of our total operating income under IFRS for the fiscal years ended March 31, 2012, 2011 and 2010, based on the total operating income of our offices in the indicated regions. For each of the periods presented, we earned most of our total operating income in Japan, where we compete with other major Japanese banking groups and financial service providers. We earn the remainder in the Americas, Europe and Middle East, and Asia and Oceania, where we mainly compete with global financial institutions.
| | | | | | | | | | | | |
| | | For the fiscal year ended March 31, | |
| | | 2012 | | | 2011 | | | 2010 | |
Region: | | | | | | | | | | | | |
Japan | | | 88 | % | | | 90 | % | | | 86 | % |
Foreign: | | | | | | | | | | | | |
Americas | | | 3 | % | | | 4 | % | | | 7 | % |
Europe and Middle East | | | 4 | % | | | 2 | % | | | 4 | % |
Asia and Oceania (excluding Japan) | | | 5 | % | | | 4 | % | | | 3 | % |
| | | | | | | | | | | | |
Total | | | 100 | % | | | 100 | % | | | 100 | % |
| | | | | | | | | | | | |
Seasonality
Our business is not materially affected by seasonality.
Sources and Availability of Raw Materials
We are not reliant on any particular source of raw materials.
Marketing Channels
Please see “Item 4.B. Business Overview—Description of Operations and Principal Activities” for a discussion of our marketing channels.
Regulation
Our businesses are subject to extensive regulation, including the effects of changes in the laws, regulations, policies, voluntary codes of practice and interpretations in Japan, and the other jurisdictions in which we operate. On the other hand, deregulation of banking activities in Japan, and more generally of the Japanese financial system, has proceeded. This deregulation is altering two structural features of Japan’s financial system: (1) the separation of banking and securities businesses and (2) distinctions among the permissible activities of Japan’s two principal types of private banking institutions: ordinary banks (futsu-ginko; including both city banks, of which the Bank is one, and regional banks) and trust banks. We also face competition from some government entities, including Japan Post Bank Co., Ltd., one of the world’s largest deposit-taking financial institutions. The Government of Japan has begun to privatize or eliminate several government institutions, in connection with which Japan Post Holdings Co., Ltd., in 2007 became a joint stock corporation, holding shares of four operating companies. Privatization of Japan Post’s banking and insurance subsidiaries, which was originally planned to be completed by 2017, was suspended in December 2009. In April 2012, a law was enacted to abolish the deadline of the privatization of Japan Post’s banking and insurance subsidiaries.
The former Securities and Exchange Act separated the commercial banking business from the securities business in Japan. However, the Act on Arrangement of Relevant Acts for the Financial System Reform and the subsequent amendment to the Banking Act now permit banks with the FSA approval to establish or otherwise own domestic and overseas subsidiaries to engage in securities businesses. Since 2004, banks have been
32
permitted to engage in securities intermediation, and more recent amendments have permitted banks to solicit customers for securities trades and act as intermediaries with respect to the resulting trades for securities companies.
Within the Japanese consumer banking sector, the deregulation of interest rates on yen deposits has enabled banks to offer customers an increasingly attractive and diversified range of new products. We face competition in this sector from the other city and regional banks as well as from Japan Post Bank. Japanese banks have been competing with one another by developing innovative proprietary computer technologies to allow them to deliver basic banking services in a more efficient manner and to create sophisticated new products in response to customer demand.
In addition, the deregulation described above has made the Japanese banking industry highly competitive. For example, the deregulation of the separation of banking and securities businesses enabled the integration and restructuring of Japanese financial institutions that resulted in larger and more integrated financial institutions.
In international markets, we face competition from other commercial banks and similar financial institutions, particularly major international banks and the leading domestic banks in those financial markets in which we conduct business.
Japan
Pursuant to the Banking Act, the FSA has the authority in Japan to supervise banks, bank holding companies and banks’ principal shareholders, meaning bank shareholders having 20% (or 15% in some cases) or more of the voting rights of a bank. The Bank of Japan (“BOJ”) also has supervisory authority over banks in Japan based primarily on its contractual agreements and transactions with Japanese banks. Only companies licensed by the Prime Minister are defined as banks under the Banking Act, and licenses may be granted only to a kabushiki kaisha, a joint stock corporation, with paid-up capital of ¥2 billion or more.
The Financial Services Agency
Scope of Supervision. The Prime Minister has supervisory authority over banks in Japan, which is generally delegated to the FSA, except for matters prescribed by cabinet order. The Minister for Financial Services has the power to direct the FSA. Under the Banking Act, the FSA has supervisory control over banks, bank holding companies and banks’ principal shareholders in Japan, except for matters to which the Prime Minister retains authority.
The FSA’s authority includes approving:
| | • | | applications for licenses to operate a bank or bank holding company and revoking those licenses; |
| | • | | becoming a principal shareholder; |
| | • | | changes of corporate name; |
| | • | | establishment or closure of overseas offices; |
| | • | | establishment or acquisition of certain subsidiaries and acquisition of more than 5% of the voting rights in Japanese companies other than subsidiaries; |
| | • | | mergers, corporate splits or business transfers; and |
| | • | | dissolutions or discontinuations of business by existing banks. |
33
The FSA may also instruct a Japanese bank to suspend its business or to remove directors if the bank violates laws, other regulations or their articles of incorporation or commits acts contrary to public policy. The FSA may also direct a Japanese bank in financial difficulties to hold certain property in Japan for the protection of depositors and to take other actions. Under the prompt corrective action (“PCA”) system, the FSA may take corrective actions in the case of capital deterioration of financial institutions. These actions include (1) requiring a financial institution to formulate and implement reform measures, (2) requiring it to reduce its assets or take other specific actions and (3) issuing an order suspending all or part of its business operations.
The Ministry of Finance and the FSA have introduced a number of regulatory measures into the banking sector in Japan to secure sound management of banks, as well as measures to increase the transparency of the regulatory process, including the following:
Bank Holding Company Regulations. A bank holding company is prohibited from carrying on any business other than management of its subsidiaries and other incidental businesses. A bank holding company may have any of the following as a subsidiary: a bank, a securities company, an insurance company or a foreign subsidiary that engages in the banking, securities or insurance business. In addition, a bank holding company may have as a subsidiary any company that engages in finance-related business, such as a credit card company, a leasing company or an investment advisory company. Certain companies that are designated by ministerial ordinance as those that cultivate new business fields may also become the subsidiary of a bank holding company.
Single Customer Credit Limit. The Banking Act restricts the aggregate amount of loans, guarantees and capital investments to any single customer in order to avoid excessive concentration of credit risks and promote fair and extensive use of bank credit. An ordinary bank’s aggregate exposure to any single customer is limited by the Banking Act and the related cabinet order. The limit is 40% (or 25% if the customer is a principal shareholder of the bank) of an ordinary bank’s total qualifying capital based on aggregate exposure to any single customer including certain of the customer’s affiliates, or 25% (or 15% if the customer is a principal shareholder of the bank) of the bank’s total qualifying capital based on aggregate exposures to any single customer not including the customer’s affiliates. The same restriction applies to a bank group (the bank, its subsidiaries and certain affiliates) on a consolidated basis maximum permitted aggregate exposure by a bank group to a single customer is 25% (or 15% if the customer is a principal shareholder of the bank), and to a customer including certain of the customer’s affiliates is 40% (or 25% if the customer is a principal shareholder of the bank), of the total qualifying capital of the group companies.
Disclosure. Under the Banking Act, banks and bank holding companies must disclose their non- and under-performing loans (consolidated and nonconsolidated) as risk-monitored loans. Risk-monitored loans are classified into four categories: (1) bankrupt loans, (2) non-accrual loans, (3) past due loans (three months or more) and (4) restructured loans. Banks and bank holding companies are required to submit annual reports to the FSA on their business including the amount of risk-monitored loans. Banks and bank holding companies must disclose their financial statements on an annual basis. The financial statements consist of the balance sheet and income statement, and explanatory documents regarding business and asset conditions, each prepared under the Banking Act both on a nonconsolidated and consolidated basis.
Independent of the Banking Act disclosure regulations, the Act Concerning Emergency Measures for the Revitalization of Financial Functions requires banks to disclose their loans and their other problem assets. Under this law, assets are classified into four categories: (1) bankrupt and quasi-bankrupt assets, (2) doubtful assets, (3) substandard assets and (4) normal assets. Generally, bankrupt and quasi-bankrupt assets correspond to the total of bankrupt loans and the lower tier of the non-accrual loans (the borrowers of which are effectively bankrupt) under the Banking Act disclosure. Doubtful assets generally correspond to the higher tier portion of the non-accrual loans (the borrowers of which are not, but have the potential to become, bankrupt). The substandard loans generally correspond to the total of the restructured loans and past due loans (three months or more). Bankrupt and quasi-bankrupt assets and doubtful assets also include non-loan assets, for example, securities lending, foreign exchange, accrued interest, advanced payments and customers’ liabilities for acceptances and guarantees.
34
Net Deferred Tax Assets. Under FSA guidelines, the amount of net deferred tax assets that can be recorded without diminishing the Tier I capital of major Japanese banks and their holding companies (including us and the Bank) is limited to 20% of the level of their Tier I capital.
Reserves for Loan Losses. Based on the Accounting Standards for Banks issued by the Japanese Bankers Association, the Bank, for statutory purposes, establishes three categories of reserves: a general reserve, a specific reserve and a reserve for specific overseas loan losses.
The general reserve is provided based on the historical loan-loss ratio for the total of certain outstanding loans of the Bank at each balance sheet date. For Japanese taxation purposes, the amount credited to the general reserve recognized as an expense is generally treated as a tax-deductible reserve, if it is not more than the amount based on the Bank’s average loan loss ratio for the previous three fiscal years. The specific reserve is established for specific loans, the repayment of which is considered materially doubtful, in the same amounts as the amount of the expected losses on these loans. The reserve for specific overseas loan losses is for possible losses on loans to certain countries classified as restructuring countries.
The self-assessment rule for the credit quality of the assets of financial institutions, including the Bank, as well as the PCA system, require the Bank to establish a reserve for its loan portfolio in an amount the Bank considers adequate at a balance sheet date.
The FSA has issued operating guidelines, called the Financial Inspection Manual, on inspection of financial institutions that include credit-risk management and the standards for write-offs and reserves. The Financial Inspection Manual itself does not have the force of law, but the FSA inspection of banks is based on the Financial Inspection Manual. As a result of an inspection, the FSA may exercise its authority over a bank under the Banking Act to suspend or terminate its banking business.
Inspection of Banks. The Banking Act authorizes the FSA to inspect banks and bank holding companies in Japan at any time and with any frequency. Such inspections are conducted by officials from the FSA’s Inspection Department. The FSA monitors the financial soundness of banks and the status and performance of their control systems for business activities by evaluating banks’ systems of self-assessment, auditing their accounts and reviewing their compliance with laws and regulations. Bank inspection is performed pursuant to the Financial Inspection Manual, which emphasizes the need for: bank self-assessment rather than assessment based on the advice of the government authority, and risk management by each bank instead of a mere assessment of its assets. In 2005, the FSA announced that it would change its approach in inspections and shift its emphasis from normalizing the NPLs problem to the protection of consumer interests and strengthening the Japanese financial system through private sector initiatives. Under this framework, which took effect in 2007, FSA inspections emphasize dialogue between inspectors and financial institutions and enhanced verification of risk management and compliance systems. The current framework also introduces a financial inspection ratings system, which provides inspection results in the form of graded evaluations intended to offer an incentive for management action as well as an indication of the FSA’s subsequent regulatory stance with respect to the financial institution in terms of, among other things, frequency and scope of inspections. The FSA has also issued non-binding guidelines to clarify its interpretation and enforcement policies of the Banking Act and related regulations.
The Ministry of Finance
The Ministry of Finance conducts examinations of banks in relation to foreign exchange transactions under the Foreign Exchange and Foreign Trade Act.
The Bank of Japan
The BOJ is the central bank of Japan and serves as the principal instrument for the execution of Japan’s monetary policy. The BOJ implements monetary policy mainly by adjusting its basic loan rate, open market
35
operations and imposing deposit reserve requirements. All banks in Japan maintain deposits with the BOJ and rely substantially upon obtaining borrowings from and rediscounting bills with the BOJ. Moreover, all banks in Japan maintain current accounts under agreements with the BOJ pursuant to which the BOJ can conclude a contract with the Bank concerning on-site examinations. BOJ supervision is intended to support the effective execution of monetary policy, while FSA supervision aims to maintain the sound operations of banks in Japan and promote the security of depositors. Through its examinations, the BOJ seeks to identify problems at an early stage and give corrective guidance where necessary.
Capital Adequacy Requirements
In 1988, the Basel Committee issued the Basel Capital Accord. The Basel Capital Accord, which was endorsed by the G-10 central bank governors, established a risk-weighted capital ratio as the principal measure of capital adequacy. The Basel Capital Accord sets minimum risk-weighted capital ratios for the purpose of maintaining sound management of banks which have international operations. The minimum risk-weighted capital ratio required is 8% on both a consolidated and nonconsolidated basis.
Banks and bank holding companies are required to measure and apply capital charges in respect of their market risks in addition to their credit risks. Market risk is defined as the risk of losses in on- and off-balance sheet positions arising from movements in market prices. The risks subject to this requirement are:
| | • | | those pertaining to interest rate-related instruments and equities in the trading book; and |
| | • | | foreign exchange risk and commodities risk throughout the bank. |
In 2004, the Basel Committee issued the amended Basel Capital Accord (“Basel II”), which includes detailed measurement of credit risk, the addition of operational risk, a supervisory review process and market discipline through disclosure. These amendments did not change the minimum risk-weighted capital ratio of 8% applicable to banks with international operations (including the Bank). These rules took effect in Japan in 2007, and since 2008 banks are able to apply the advanced IRB approach for credit risk and the AMA for operational risk.
In addition to new methods for risk-weighting and new requirements to measure and establish reserves for operational risk, the new FSA capital adequacy guidelines also required Japanese banks and bank holding companies to expand their disclosure regarding capital ratio data. Banks and bank holding companies must include detailed disclosure in their annual and semiannual Japanese language disclosure reports (disclosure shi). The required disclosure includes detailed information regarding risk-weighting calculations and operational risk measurement calculations underlying capital ratio data. Under the Banking Act and its related regulations, banks and bank holding companies are required to publish their annual disclosure reports within four months of the end of the fiscal year and to publish their semiannual disclosure reports within four months of the end of the interim period.
In July 2009, the Basel Committee approved a final package of measures to enhance certain elements of the Basel II framework which includes an increase of the risk weights of resecuritization instruments and revisions of certain trading book rules (referred to as “Basel 2.5”), and the FSA’s capital adequacy guidelines which reflect such framework have been applied in Japan from December 2011.
In September 2009, the Group of Central Bank Governors and Heads of Supervision reached an agreement on several key measures to strengthen regulation of the banking sector, and in December 2009 the Basel Committee published a consultative document entitled “Strengthening the resilience of the banking sector” containing proposals on these measures centering on several core areas. The Basel Committee’s proposals focused on raising the quality, consistency and transparency of the regulatory capital base through measures including a requirement that the predominant form of Tier I capital must be common shares and retained earnings; limitations on the use of hybrid instruments with an incentive to redeem; a requirement that regulatory
36
adjustments, including deductions of the amount of net deferred tax assets which rely on the future profitability of a bank, be applied to common equity generally; and a requirement for additional disclosure regarding regulatory capital levels.
The Basel Committee’s proposals also cover the following key areas:
| | • | | Strengthening the risk coverage of the capital framework; |
| | • | | Introducing a leverage ratio as a supplementary measure to the Basel II risk-based framework with a view to migrating to a minimum capital requirements treatment based on appropriate review and calibration; |
| | • | | Introducing measures to promote the build-up of capital buffers in good times that can be drawn upon in periods of stress; and |
| | • | | Introducing minimum liquidity standards for internationally active banks that include a 30-day liquidity coverage ratio requirement underpinned by a longer-term structural liquidity ratio. |
In July 2010, the Group of Central Bank Governors and Heads of Supervision reached a broad agreement on the overall design of the Basel Committee’s capital and liquidity reform package. In addition, in August 2010, the Basel Committee issued for consultation a proposal to enhance the loss absorbency function of regulatory capital. In September 2010, the Group of Central Bank Governors and Heads of Supervision announced a substantial strengthening of existing capital requirements. The framework of the proposed reform was endorsed by the G-20 leaders at their Seoul summit in November 2010. These capital reforms will increase the minimum common equity requirement from 2% to 4.5% and require banks to hold a capital conservation buffer of 2.5% to withstand future periods of stress, bringing the total common equity requirement to 7%. The Tier I capital requirement will also be increased from 4% to 6% (together with the above capital conservation buffer, to 8.5%). The total capital requirement will remain at the existing level of 8% but will be increased to 10.5% with the capital conservation buffer. In addition, a countercyclical buffer within a range of 0% to 2.5% of common equity or other fully loss-absorbing capital will be implemented according to national circumstances. The Group of Central Bank Governors and Heads of Supervision also agreed on transitional arrangements for implementing the new standards. Under the transitional arrangements, these new capital requirements will be phased in between January 1, 2013 and January 1, 2019. In December 2010, the Basel Committee published the new Basel III rules text. To reflect changes made by the Basel Committee, the FSA changed its capital adequacy guidelines and the changes will be generally applied from March 31, 2013, which generally reflects the main measures of the minimum capital requirements of the Basel Committee that are scheduled to be phased in starting January 1, 2013.
On November 4, 2011, the FSB released its list of 29 banks which are G-SIFIs, and this list included us. Because we have been identified as a G-SIFI, we are subject, among other things, to resolution-related requirements described in the FSB’s “Key Attributes of Effective Resolution Regimes for Financial Institutions.” In particular, the FSB has required the initial group of G-SIFIs, by the end of 2012, to have in place a recovery and resolution plan, including a group-level plan, containing various specified elements, to be subject to regular resolvability assessments. The FSB will revise and update its list of G-SIFIs on an annual basis and G-SIFIs included on the list in November 2014 will be subject to an additional loss absorbency requirement that will be phased in from January 2016 with full implementation by January 2019. If we are identified as a G-SIFI in November 2014, we will be required to maintain 1% to 2.5% additional loss absorption capacity above the Basel III common equity Tier I minimum requirement of 7%, depending upon our systemic importance as determined by the FSB. Furthermore, as a disincentive for banks facing the highest required level of common equity Tier I to “increase materially their global systemic importance in the future,” an additional 1% charge could be applied. Also beginning in November 2014, so long as we are identified as a G-SIFI, we will be subject to stronger supervisory mandates and higher supervisory expectations for risk management functions, data aggregation capabilities, risk governance and internal controls. The substance of this heightened supervision has not yet been fixed, but we anticipate that at a minimum any rules will contain more stringent reporting requirements and impose common frameworks for data aggregation and internal risk management processes on G-SIFIs.
37
Our securities subsidiaries in Japan are also subject to capital adequacy requirements under the FIEA. Under the requirements, securities firms must maintain a minimum capital adequacy ratio of 120% on a nonconsolidated basis and must file periodic reports with the Commissioner of the FSA or the Director-General of the appropriate Local Finance Bureau, and also publicly disclose their capital adequacy ratio on a quarterly basis. Failure to meet the capital adequacy requirements will trigger mandatory regulatory action. For example, a securities firm with a capital adequacy ratio of greater than 120%, but less than 140% will be required to file daily reports with the Commissioner of the FSA or the Director-General of the appropriate Local Finance Bureau. A securities firm with a capital adequacy ratio of less than 120% may be ordered to change its business conduct, place its property in trust or be subject to other supervisory orders, as the relevant authorities deem appropriate. A securities firm with a capital adequacy ratio of less than 100% may be subject to temporary suspension of all or part of its business operations or cancellation of its license to act as a securities broker and dealer.
The capital adequacy ratio for securities firms is defined as the ratio of adjusted capital to a quantified total of business risks, which include market risks, counterparty risks and operational risks (e.g., risks in carrying out daily business activities, such as administrative problems with securities transactions and clerical mistakes) quantified in the manner specified by a rule promulgated under the FIEA. Adjusted capital is defined as net worth less illiquid assets, as determined in accordance with Japanese GAAP. Net worth consists mainly of stated capital, additional paid-in capital, retained earnings, reserves for securities transactions, certain allowances for doubtful current accounts, net unrealized gains (losses) in the market value of investment securities, and subordinated debt. Illiquid assets generally include non-current market assets, certain deposits and advances, and prepaid expenses.
In May 2010, the FIEA was amended, introducing a minimum capital adequacy requirement on a consolidated basis applicable to securities firms whose total assets exceed ¥1,000 billion. These amendments became effective from April 1, 2011.
PCA and Self-Assessment
Under the PCA system, the FSA may take corrective actions depending upon the extent of capital deterioration of a financial institution. The PCA system also requires financial institutions to establish self-assessment programs. Financial institutions, including the Bank, are required to analyze their assets giving due consideration to accounting principles and other applicable rules and to classify their assets into categories taking into account the likelihood of repayment and the risk of impairment to the value of the assets. These classifications determine whether an addition to or reduction in reserves or write-offs is necessary.
Pursuant to the Japanese Institute of Certified Public Accountants (“JICPA”), guidelines, the outcome of each financial institution’s self-assessment leads to substantially all of a bank’s loans and other claims on customers being analyzed by classifying obligors into five categories: (1) normal borrowers; (2) borrowers requiring caution; (3) potentially bankrupt borrowers; (4) effectively bankrupt borrowers; and (5) bankrupt borrowers. The reserve for possible loan losses is then calculated based on the obligor categories. FSA guidelines require banks to classify their assets not only by the five categories of obligor but also by four categories of quality. The Bank has adopted its own internal guidelines for self-assessment which conform to guidelines currently in effect and comply with the PCA system requirements.
Under the PCA system, if the risk-weighted capital ratio of a bank or a bank holding company with international operations becomes less than 8% but not less than 4%, the FSA may require a bank or a bank holding company to submit and implement a capital reform plan.
If the risk-weighted capital ratio of a bank with international operations declines to less than 4% but not less than 2%, the FSA may order a bank to (1) submit and implement a plan for improving its capital; (2) prohibit or restrict the payment of dividends to shareholders or bonuses to officers; (3) reduce assets or restrict any increase
38
in assets; (4) prohibit or restrict the acceptance of deposits under terms less advantageous than ordinary terms; (5) reduce the business of some offices; (6) eliminate some offices other than the head office; (7) reduce or prevent the launching of non-banking businesses; or (8) take certain other actions.
If the risk-weighted capital ratio of a bank with international operations declines to less than 2% but not less than 0%, the FSA may order a bank to conduct any one of the following: (1) a capital increase; (2) a substantial reduction in its business; (3) a merger; or (4) abolishment of its banking business.
If the risk-weighted capital ratio of a bank with international operations declines below 0%, the FSA may order the bank to suspend all or part of its business.
If the risk-weighted capital ratio of a bank holding company that holds a bank with international operations declines to levels below 8%, the FSA may take actions similar to the actions the FSA may take with respect to a bank.
Prompt Warning System
The prompt warning system currently in effect allows the FSA to take precautionary measures to maintain and promote the sound operation of financial institutions before those financial institutions become subject to the PCA system. These measures include requiring a financial institution to reform: (1) profitability, if deemed necessary to improve profitability based upon a fundamental profit index; (2) credit risk management, if deemed necessary to reform management of credit risk based upon the degree of large credit concentration and other circumstances; (3) stability, if deemed necessary to reform management of market and other risks based upon, in particular, the effect of securities price fluctuations; and (4) cash flow management, if deemed necessary to reform management of liquidity risks based upon deposit trends and level of reserve for liquidity.
Deposit Insurance System
The Deposit Insurance Act was enacted to protect depositors when financial institutions fail to meet their obligations. The DIC implements the law and is supervised by the Prime Minister and the Minister of Finance. Subject to limited exceptions, the Prime Minister’s authority is delegated to the FSA Commissioner.
Since April 2010, the DIC receives annual insurance premiums from member financial institutions equivalent to 0.107% of deposits that bear no interest, are redeemable upon demand and are used by depositors primarily for payment and settlement purposes, and premiums equivalent to 0.082% of other deposits. Beginning from April 2012, if there is no member financial institutions fail during the fiscal year, a premium rate of 0.089% for deposits primarily for payment and settlement purposes, and a premium rate of 0.068% for other deposits, will be applied and the amount equivalent to 0.018% of deposits primarily for payment and settlement purposes, and 0.014% of other deposits, without interest, will be reimbursed to the member institutions. The same formula will apply for the fiscal years beginning from April 2013 and 2014.
Premiums held by the DIC may be either deposited at financial institutions or used to purchase marketable securities. The insurance money may be paid out to depositors in case of a suspension of repayments of deposits, banking license revocation, dissolution or bankruptcy of a bank. Payouts are generally limited to a maximum of ¥10 million of principal amount together with any interest accrued with respect to each depositor. Only non-interest-bearing deposits that are redeemable upon demand and used by depositors primarily for payment and settlement functions are protected in full.
City banks (including the Bank), regional banks (including member banks of the second association of regional banks), trust banks, credit associations, credit cooperatives, labor banks and Japan Post Bank participate in the deposit insurance system on a compulsory basis.
39
Resolutions of Failed Financial Institutions
The Deposit Insurance Act currently provides a permanent system for resolving failed financial institutions.
The basic method for resolving a failed financial institution under the Deposit Insurance Act is cessation of the business by paying insurance money to depositors up to the principal amount of ¥10 million plus accrued interest per depositor, or pay-off or transfer of the business to another financial institution, with financial assistance provided within the cost of pay-off. Under the Deposit Insurance Act, transfer of business is regarded as the primary method. In order to effect a prompt transfer of business, the following framework has been established:
| | • | | a Financial Reorganization Administrator is appointed by the FSA Commissioner and takes control of the management and assets of the failed financial institution. The administrator is expected to diligently search for a financial institution which will succeed to the business of the failed institution; |
| | • | | if no successor financial institution can be immediately found, a “bridge bank” will be established by the DIC for the purpose of temporarily maintaining the operations of the failed financial institution, and the bridge bank will seek to transfer the failed financial institution’s assets to another financial institution or dissolve the failed financial institution; and |
| | • | | in order to facilitate or encourage a financial institution to succeed to a failed business, financial aid may be provided by the DIC to any successor financial institution to enhance its capital after succession or to indemnify it for losses incurred as a result of the succession. |
Where it is anticipated that the failure of a financial institution may cause an extremely grave problem in maintaining the financial order in Japan or the region where the financial institution is operating, the following exceptional measures may be taken after consulting with the Conference for Financial Crisis Countermeasures:
| | • | | the DIC may subscribe for shares or other instruments issued by the relevant financial institution and require the institution to submit to the DIC a plan to reestablish sound management; |
| | • | | once the financial institution fails, financial aid exceeding the cost of pay-off may be available to the institution; and |
| | • | | if the failed institution is a bank and the problem cannot be avoided by other measures, then the DIC may acquire all of the shares of the bank. |
In order to fund the above-mentioned activities, the DIC may borrow from financial institutions or issue bonds which may be guaranteed by the government.
The Resolution and Collection Corporation
The Resolution and Collection Corporation ( “RCC”), a wholly owned subsidiary of the DIC, is permitted to purchase underperforming loan receivables from failed financial institutions. The DIC guarantees financing for the RCC’s business and compensates the RCC for losses that it incurs.
Special Measures Act Concerning Facilitation of Reorganization by Financial Institutions, Etc.
Under the Special Measures Act Concerning Facilitation of Reorganization by Financial Institutions, Etc.: (1) for one year after the merger or transfer of the entire business of a financial institution, the maximum amount to be covered by the deposit insurance will be ¥10 million multiplied by the number of parties to the merger or business transfer; and (2) the procedures are simplified to a certain extent in connection with the transfer of an entire business or a merger with another financial institution by a financial institution that is made in accordance with a management base-strengthening plan that has been approved by the government.
40
Capital Injection by the Government
In response to the 2008 financial turmoil, amendments to the Special Measures Act for Strengthening Financial Functions, the Special Measures Act Concerning Facilitation of Reorganization by Financial Institutions, and other related legislation were enacted by the Diet in 2008 in order to authorize capital contributions to financial institutions by the Government of Japan. The amendments include: (1) extension to March 31, 2012 of a deadline for financial institutions to apply to the government for capital contributions; (2) other revisions of the government requirements associated with capital contributions intended to facilitate the financing of SMEs; and (3) amendments which permit the government to make capital contributions to credit cooperatives, credit unions and other types of cooperative financial institutions. In June 2011, in response to the Great East Japan Earthquake, amendments to the Special Measures Act for Strengthening Financial Functions were enacted and extended the deadline described above to March 31, 2017. The amendments also include special exceptions for financial institutions affected by the Great East Japan Earthquake that need capital enhancement for the smooth extension of loans in their main business area, which are not applicable to any of the financial institutions within the Group.
Restriction on Aggregate Shareholdings by a Bank
The Act Concerning Restriction on Shareholdings by Banks requires Japanese banks and their qualified subsidiaries to limit the aggregate market value (excluding unrealized gains, if any) of their equity securities holdings to an amount equal to 100% of their consolidated Tier I capital, with adjustments, in order to reduce exposure to stock price fluctuations. Treasury shares, shares issued by subsidiaries, shares not listed on any stock exchange or not registered with any OTC market, shares held as trust assets, and shares acquired through debt-for-equity swaps in restructuring transactions are excluded from this limitation.
Banks’ Shareholdings Purchase Corporation
In March 2009, legislation that was enacted and became effective restarted share purchases by the Banks’ Shareholdings Purchase Corporation of listed shares from banks and certain other financial institutions under certain conditions. These shares purchases are intended to facilitate the disposition of shares of listed stocks held by banks while preventing adverse effects caused by sales of large amounts of shares in a short period of time.
Shareholding Restrictions Applicable to a Bank Holding Company and a Bank
The provision of the Act on Prohibition of Private Monopolization and Maintenance of Fair Trade which prohibits banks from holding more than 5% of the voting rights of non-financial companies in Japan does not apply to bank holding companies. However, the Banking Act generally prohibits a bank holding company and its subsidiaries, on an aggregated basis, from holding more than 15% of the voting rights of certain types of companies which are not permitted to become subsidiaries of bank holding companies. Also, the Banking Act generally prohibits a bank and its subsidiaries, on an aggregated basis, from holding more than 5% of the voting rights of certain types of companies which are not permitted to become subsidiaries of banks.
Examination and Reporting Applicable to Shareholders of a Bank
The FSA may request the submission of reports or other materials from a bank and/or its bank holding company, or inspect the bank and/or the bank holding company, if necessary, in order to secure the sound and appropriate operation of the business of a bank.
Under the Banking Act, a person who desires to hold 20% (in some exceptional cases, 15%) or more of the voting rights of a bank is required to obtain advance approval of the FSA Commissioner. In addition, the FSA may request the submission of reports or materials from, or may conduct an inspection of, any principal shareholder who holds 20% (in some exceptional cases, 15%) or more of the voting rights of a bank if the FSA deems the action necessary in order to secure the sound and appropriate operation of the business of the bank. Under limited circumstances, the FSA may order the principal shareholder to take such measures as the FSA deems necessary.
41
Furthermore, any person who becomes a holder of more than 5% of the voting rights of a bank holding company or a bank must report the ownership of the voting rights to the Director General of the relevant local finance bureau within five business days. This requirement is separate from the significant shareholdings report required under the FIEA. In addition, a similar report must be made in respect of any subsequent change of 1% or more in any previously reported holding or in respect of any change in material matters set out in reports previously filed, with some exceptions.
The Act Concerning Temporary Measures to Facilitate Financing for SMEs, etc.
The Act Concerning Temporary Measures to Facilitate Financing for SMEs, etc., became effective in December 2009 and requires financial institutions to, among other things, endeavor to reduce their customers’ burden of loan payments by employing such methods as term modification at the request of eligible borrowers, including SMEs and individual housing loan borrowers. The legislation also requires financial institutions to internally establish a system to implement the requirements of the legislation and periodically make disclosures regarding, and report to the relevant authority the status of, implementation. Following the enactment of the legislation, the FSA altered its approach toward inspections and shifted its emphasis to facilitation of finance while monitoring risks appropriately. These measures were originally scheduled to remain effective until March 2011, but the effective period was extended until March 2013.
Protection of Personal Information
The Act on Protection of Personal Information and related rules, regulations and guidelines impose requirements on businesses that use databases containing personal information, including appropriate custody of personal information and restrictions on information sharing with third parties.
Act on Sales, Etc. of Financial Products
Due to deregulatory measures in the banking and other financial services industries, more financial products, including highly structured and other complicated products, may now be marketed to a broad base of customers. The Act on Sales, Etc. of Financial Products was enacted to better protect customers from incurring unexpected losses as a result of purchasing these financial products. Under this law, sellers of financial products have a duty to their potential customers to explain important matters (i.e., the nature and magnitude of risk involved) regarding the financial products that they sell. If a seller fails to comply with the duty, the loss in value of the purchased investment product due to the failure to explain is refutably presumed to be the amount of the customer’s loss. An amendment to this law, together with other related laws including the FIEA, became effective in September 2007. The amended law enlarges the scope of the duty of financial services providers to inform customers of important matters related to the financial products that they offer.
Act Concerning Protection of Depositors and Relief for Victims of Certain Types of Fraud
The Act Concerning Protection of Depositors from Illegal Withdrawals Made by Forged or Stolen Cards requires financial institutions to establish internal systems to prevent illegal withdrawals of deposits made using forged or stolen bank cards. The law also requires financial institutions to compensate depositors for any amount illegally withdrawn using forged or stolen bankcards, subject to certain conditions.
The Act Concerning Payment of Dividends for Relief of Damages from Funds in Account used in connection with Crimes (Act No. 133 of 2007) requires that financial institutions take appropriate measures against various crimes including the closing of accounts used in connection with fraud and other crimes. The law also requires financial institutions to make, in accordance with specified procedures, payments from funds collected from the closed accounts to victims of certain crimes.
42
Act on Prevention of Transfer of Criminal Proceeds
Under the Act on Prevention of Transfer of Criminal Proceeds (Act No. 22 of 2007), which addresses money laundering and terrorism concerns, financial institutions and certain other entities, such as credit card companies, are required to perform customer identification, submit suspicious transaction reports and keep records of their transactions.
FIEA
The Financial Instruments and Exchange Act of Japan (“FIEA”) regulates the securities industry and most aspects of securities transactions in Japan, including public offerings, private placements and secondary trading of securities, ongoing disclosure by securities issuers, tender offers for securities, organization and operation of securities exchanges and self-regulatory organizations and registration of securities companies. The Prime Minister has the authority to regulate the securities industry and securities companies, which authority is delegated to the FSA Commissioner under the FIEA. The Securities and Exchange Surveillance Commission, an external agency of the FSA, is independent from the Agency’s other bureaus and is vested with authority to conduct day-to-day monitoring of the securities markets and to investigate irregular activities that hinder fair trading of securities, including inspection of securities companies as well as banks in connection with their securities business. Furthermore, the FSA Commissioner delegates certain authority to the Director General of the Local Finance Bureau to inspect local securities companies and their branches. A violation of applicable laws and regulations may result in various administrative sanctions, including revocation of registration or authorization, suspension of business or an order to discharge any Director or Executive Officer who has failed to comply with applicable laws and regulations. Securities companies are also subject to the rules and regulations of the Japanese stock exchanges and the Japan Securities Dealers Association, a self-regulatory organization of securities companies.
The FIEA replaced the Securities and Exchange Act in order to broaden and strengthen investor protection and to reduce trading costs through deregulation and the easing or elimination of certain regulatory restrictions. The regime under the FIEA includes, among other measures, (1) the development of comprehensive and cross-sectoral regulations covering a wide range of financial instruments; (2) the enhancement of corporate disclosure, requiring listed companies to file quarterly reports, audited internal control reports assessing the effectiveness of internal control structures for financial reporting, and confirmation of the content of annual reports; (3) the expansion of the duties of financial institutions to provide customers with detailed disclosure regarding the financial products that they offer and other measures to protect investors; and (4) the relaxation of regulations through flexible application depending on the type of investor (professional or general public).
Deregulation of the Securities Business by a Bank
Due to gradual deregulation, the Securities and Exchange Act allowed banks to underwrite and deal in Japanese government bonds, Japanese municipal bonds, Japanese government guaranteed bonds, commercial paper and certain bonds issued by special purpose companies; to sell beneficiary certificates of investment trusts and securities issued by an investment company; and to engage in listed or OTC securities derivatives transactions as well as in the securities intermediary business, each subject to registration with the FSA.
In addition, amendments to the FIEA and the Banking Act, that became effective on June 1, 2009, abolished restrictions on directors and officers holding concurrent offices in banks, securities companies and insurance companies, and introduced a system to manage conflicts of interest between banks, securities companies and insurance companies. The amendments provide for revised firewalls between banks, securities companies and insurance companies; and the development of a system to manage conflicts of interest between banks, securities companies and insurance companies. The amendment relating to firewalls abolished the ban on certain officers and employees from holding concurrent posts in banks, securities companies and insurance companies, and relaxed restrictions on the transfer of non-public customer information. On the other hand, the amendment relating to conflicts of interest requires those financial institutions, including banks, to implement proper information management procedures and to develop appropriate internal systems to prevent customer interests
43
from being unfairly harmed through trading by a financial institution or by other companies within its group. For example, a financial institution may be required to create information barriers between departments and monitor how it executes transactions with customers.
Deregulation of Insurance Products
Deregulation in the financial services industry has gradually permitted banks in Japan to offer a variety of insurance products including pension-type insurance. Currently, banks in Japan may offer a full range of insurance products as an agent.
Regulation of the Consumer Finance Business
In order to resolve the problems of heavily indebted borrowers and to effect proper regulation of the consumer finance business, in June 2010, maximum legal interest rates were reduced to levels prescribed by the Interest Rate Restriction Act, ranging from 15% to 20%, and gray zone interest, which is interest on loans in excess of rates prescribed by the Interest Rate Restriction Act up to the 29.2% maximum rate permitted under the Contributions Act, was abolished. Judicial decisions have strictly interpreted the conditions under which consumer finance companies may retain gray zone interest. As a result, claims for refunds of gray zone interest increased substantially. Amendments to the Money Lending Business Act provide an additional upper limit on aggregate borrowings by an individual from all moneylenders over which moneylenders may not extend further loans, as well as stricter regulation and supervision of moneylender activities.
Installment Sales Act
In order to ensure the fairness of transactions with respect to installment and other sales, prevent damage to consumers and manage credit card numbers, the Installment Sales Act imposes requirements on those who conduct installment sales businesses. In June 2008, revisions to the Installment Sales Act were enacted, most of which became effective in December 2009. The revisions impose more stringent and expanded requirements for credit card companies, including, among other things: (1) wider coverage of installment sales under the regulations; (2) measures to prevent inappropriate extensions of credit for certain credit transactions; (3) measures to prevent excessive lending for certain credit transactions that include requirements to investigate the payment ability of consumers by use of designated credit information organizations and prohibition of execution of credit agreements that exceed the payment ability of consumers; and (4) measures to protect certain information, such as credit numbers.
United States
As a result of its operations in the United States, the Bank and SMFG are subject to extensive federal and state banking and securities supervision and regulation. The Bank engages in U.S. banking activities directly through its branches in Los Angeles, San Francisco and New York and through its representative office in Houston. The Bank also controls a U.S. banking subsidiary, Manufacturers Bank, and a U.S. broker-dealer subsidiary, SMBC Nikko Securities America, Inc.
The Bank and SMFG are qualifying foreign banking organizations under the U.S. International Banking Act of 1978 as amended (“International Banking Act”), and as such are subject to regulation as bank holding companies under the U.S. Bank Holding Company Act of 1956, as amended (“Bank Holding Company Act”). Additionally, the Bank and SMFG are bank holding companies by virtue of their ownership of Manufacturers Bank. As a result, the Bank, SMFG and their U.S. operations are subject to regulation, supervision and examination by the Federal Reserve Board as Manufacturers Bank’s U.S. “umbrella supervisor.”
Manufacturers Bank is a California state-chartered bank, which is not a member of the Federal Reserve System. As a state non-member bank, the deposits of which are insured by the Federal Deposit Insurance Corporation (“FDIC”), Manufacturers Bank is subject to regulation, supervision and examination by the FDIC and the California Department of Financial Institutions.
44
The Bank’s New York branch is supervised by the Federal Reserve Bank of New York and the New York Department of Financial Services, but its deposits are not insured (or eligible to be insured) by the FDIC. The Bank’s Los Angeles and San Francisco branches are supervised by the Federal Reserve Bank of San Francisco and the California Department of Financial Institutions, but their deposits are not insured (or eligible to be insured) by the FDIC. The Bank’s representative office in Houston is subject to regulation and examination by the Texas Department of Financial Institutions and the Federal Reserve Bank of Dallas.
Restrictions on Activities
As described below, federal and state banking laws and regulations restrict the Bank’s and SMFG’s ability to engage, directly or indirectly through subsidiaries, in certain activities in the United States.
The Bank and SMFG are required to obtain the prior approval of the Federal Reserve Board before directly or indirectly acquiring the ownership or control of more than 5% of any class of voting shares of U.S. banks, certain other depository institutions and bank or depository institution holding companies. Under the Bank Holding Company Act and Federal Reserve Board regulations, the Bank is required to serve as a source of financial strength to Manufacturers Bank. In addition, the Bank’s U.S. banking operations (including Manufacturers Bank and the Bank’s U.S. branches) are also restricted from engaging in certain “tying” arrangements involving products and services. In addition, the activities of the non-bank subsidiaries of the Bank and SMFG are generally limited to those activities that the Federal Reserve Board has determined to be a proper incident to banking or managing and controlling banks, and the Bank Holding Company Act generally prohibits the Bank and SMFG from acquiring, directly or indirectly, the ownership or control of more than 5% of any class of voting shares of any company engaged in the United States in activities other than banking or activities deemed a proper incident to banking or managing and controlling banks. Federal Reserve Board approval is generally required for the Bank and SMFG to acquire more than 5% of any class of voting shares of a U.S. company engaged in permissible non-banking activities.
The Bank’s U.S. branches and Manufacturers Bank are subject to requirements and restrictions under federal and state law, including requirements to maintain reserves against deposits, restrictions on the types and amounts of loans that may be made and limitations on the types of investments that may be made and the types of services that may be offered. Various consumer laws and regulations also affect the operations of Manufacturers Bank, and to a limited extent, the Bank’s New York and California branches.
In addition, under U.S. federal banking laws, state-chartered banks (such as Manufacturers Bank) and state-licensed branches and agencies of foreign banks (such as the Bank’s New York branch) may not, as a general matter, engage as a principal in any type of activity not permissible for their federally chartered or licensed counterparts, unless (i) in the case of state-chartered banks, the FDIC determines that the additional activity would pose no significant risk to the FDIC’s Deposit Insurance Fund and is consistent with sound banking practices and (ii) in the case of state-licensed branches and agencies of foreign banks, the Federal Reserve Board determines that the additional activity is consistent with sound banking practices. United States federal banking laws also subject state branches and agencies of foreign banks to the same single-borrower lending limits that apply to federal branches or agencies, which are substantially similar to the lending limits applicable to national banks. For the Bank’s U.S. branches, these single-borrower lending limits are based on the worldwide capital of the entire foreign bank (i.e., the Bank in the case of the Bank’s New York branch).
Under the International Banking Act, the Federal Reserve Board may terminate the activities of any U.S. office of a foreign bank if it determines (i) that the foreign bank is not subject to comprehensive supervision on a consolidated basis in its home country (unless the home country is making demonstrable progress toward establishing such supervision), (ii) that there is reasonable cause to believe that such foreign bank or its affiliate has violated the law or engaged in an unsafe or unsound banking practice in the United States and, as a result of such violation or practice, the continued operation of the U.S. office would be inconsistent with the public interest or with the purposes of federal banking laws, or (iii) for a foreign bank that presents a risk to the stability
45
of the United States financial system, the home country of the foreign bank has not adopted, or made demonstrable progress toward adopting, an appropriate system of financial regulation to mitigate such risk.
There are various qualitative and quantitative restrictions on the extent to which SMFG and its non-bank subsidiaries can borrow or otherwise obtain credit from its U.S. bank subsidiary, Manufacturers Bank, or engage in certain other transactions involving that subsidiary. In general, these transactions must be on terms that would ordinarily be offered by Manufacturers Bank to unaffiliated entities, and credit transactions must be secured by designated amounts of specified collateral. In addition, certain transactions, such as certain purchases by Manufacturers Bank from the Bank or its non-bank subsidiaries, are subject to volume limitations. Effective in July 2012, the Dodd-Frank Act (discussed below) subjects credit exposure arising from derivative transactions, securities borrowing and lending transactions, and repurchase/reverse repurchase agreements to these collateral and volume transactions limitations.
Dodd-Frank Act
The Dodd-Frank Wall Street Reform and Consumer Protection Act (“Dodd-Frank Act”), which was enacted in July, 2010, provides a broad framework for significant regulatory changes across most areas of U.S. financial regulation. The Dodd-Frank Act addresses, among other issues, systemic risk oversight, bank capital standards, the liquidation of failing systemically significant U.S. financial institutions, OTC derivatives, the ability of banking entities to engage in proprietary trading activities and invest in hedge funds and private equity funds (known as the “Volcker Rule”) consumer and investor protection, and securitization.
Implementation of the Dodd-Frank Act is taking place through detailed rulemaking over multiple years by various regulators, including the Office of the Comptroller of the Currency, the Federal Reserve Board, the SEC, the FDIC, the Commodity Futures Trading Commission (“CFTC”), the newly created Financial Stability Oversight Council (“Council”) and the newly created Consumer Financial Protection Bureau. Although the final details, impact and timing of certain of the implementing rules remain uncertain, complying with the final rules could result in additional costs, or restrict or otherwise affect the way we conduct our business.
The Dodd-Frank Act provides regulators with tools to impose greater capital, leverage and liquidity requirements and other prudential standards, particularly for financial institutions that pose significant systemic risk and bank holding companies with greater than $50 billion in assets. In imposing such heightened prudential standards on non-U.S. banks such as us and the Bank, the Federal Reserve Board is directed to take into account the principle of national treatment and equality of competitive opportunity, and the extent to which the foreign bank holding company is subject to comparable home country standards.
The Dodd-Frank Act will also limit the ability of bank holding companies to sponsor or invest in private equity or hedge funds (including an aggregate investment limit of 3% of Tier I capital in funds that are sponsored by the bank holding company) and to engage in certain types of proprietary trading, although certain non-U.S. banking entities (such as the Bank and SMFG) will be able to engage in such activities solely outside the United States. The U.S. agencies responsible for implementing the Volcker Rule proposed implementing rules in October 2011 and January 2012 but have not yet adopted final rules. The Volcker Rule became effective on July 21, 2012, although banking entities will have at least two years from that date to conform activities, investments and relationships in accordance with the Volcker Rule and the rules that are to be adopted by the agencies.
Effective in July 2011, the Dodd-Frank Act removed a longstanding prohibition on the payment of interest on demand deposits by Manufacturers Bank and the Bank’s three branches in the United Sates. In addition, the Dodd-Frank Act will require Manufacturers Bank and the Bank’s U.S. branches to include in their lending limits the credit exposures arising from derivative transactions, and repurchase and reverse repurchase agreements with counterparties.
46
Furthermore, the Dodd-Frank Act provides for an extensive framework for the regulation of OTC derivatives, including mandatory clearing, exchange trading and transaction reporting of certain OTC derivatives. Entities that are swap dealers, security-based swap dealers, major swap participants or major security-based swap participants will be required to register with the SEC or the CFTC, or both, and comply with capital, margin, business conduct, recordkeeping and other requirements applicable to such entities. Under the so-called swap “push-out” provisions of the Dodd-Frank Act, the derivatives activities of U.S. banks and U.S. branch offices of foreign banks (such as the Bank’s New York branch) will be restricted, which may necessitate changes to how we conduct our derivatives activities.
Regulations that the FDIC or the Consumer Financial Protection Bureau may adopt could affect the nature of the activities that a bank, such as Manufacturers Bank, may conduct, and may impose restrictions and limitations on the conduct of such activities.
Furthermore, the Dodd-Frank Act requires the SEC to establish rules requiring issuers with listed securities, which may include foreign private issuers such as us, to establish a “clawback” policy to recoup previously awarded compensation in the event of an accounting restatement. The Dodd-Frank Act also grants the SEC discretionary rule-making authority to impose a new fiduciary standard on brokers, dealers and investment advisers, and expands the extraterritorial jurisdiction of U.S. courts over actions brought by the SEC or the United States with respect to violations of the antifraud provisions in the Securities Act of 1933, the Securities Exchange Act of 1934 and the Investment Advisers Act of 1940.
PATRIOT Act
The Bank Secrecy Act, as amended by the USA PATRIOT Act of 2001 (“PATRIOT Act”) contains measures to prevent and detect the financing of terrorism and international money laundering by imposing significant compliance and due diligence obligations, creating crimes, providing for penalties and expanding the extraterritorial jurisdiction of the United States. The Bank Secrecy Act, as amended, imposes anti-money laundering compliance obligations on U.S. financial institutions, including the U.S. offices of foreign banks. The passage of the PATRIOT Act and other events have resulted in heightened scrutiny of compliance with the Bank Secrecy Act and anti-money laundering rules by federal and state regulatory and law enforcement authorities.
CISADA
In July 2010, the U.S. government enacted legislation designed to restrict economic and financial transactions with Iran, i.e., Comprehensive Iran Sanctions, Accountability and Divestment Act of 2010 (“CISADA”), which may lead to the imposition of sanctions against non-U.S. financial institutions, such as us, if they are determined by the Secretary of the Treasury to have facilitated “significant transactions” or provided “significant financial services” for certain Iran-linked financial institutions or the Iranian Revolutionary Guard Corps.
NDAA
The U.S. government broadened the range of sanctionable transactions to include conducting or facilitating “significant financial transactions” with the Central Bank of Iran or certain other Iranian financial institutions by adopting the National Defense Authorization Act for Fiscal Year 2012 (the “NDAA”), as implemented by Executive Order 13599 of February 5, 2012 and by amending the Iranian Financial Sanctions Regulations on February 27, 2012. These or similar legislative or regulatory developments may further limit our business operations. Specifically, we could lose our ability to maintain correspondent or payable-through accounts with U.S. financial institutions if it were determined that we have engaged in activities targeted by CISADA or the NDAA.
The Secretary of State announced on March 20, 2012 that Japan is among a group of countries that has significantly reduced their volume of crude oil purchases from Iran, and that therefore the NDAA sanctions
47
would not apply to Japanese financial institutions for a period of 180 days, which period is renewable based on ongoing reductions in crude oil purchases from Iran. There is no guarantee that the Secretary of State will renew this waiver with respect to Japanese financial institutions.
FATCA
In March 2010, the Hiring Incentives to Restore Employment Act enacted certain provisions of the U.S. Internal Revenue Code commonly referred to as Foreign Account Tax Compliance Act (“FATCA”). The purpose of FATCA is to prevent U.S. persons from using offshore accounts to evade U.S. federal income tax. Under FATCA, a 30% withholding tax is imposed on “withholdable payments” (which generally include certain U.S.-source “fixed or determinable annual or periodical” payments and gross proceeds from the disposition of any property that can produce U.S.-source interest or dividends) and “passthru payments” (described below) made to a foreign financial institution (such as ourselves and certain of our banking subsidiaries) that is not a “participating foreign financial institution” (“PFFI”) described below. To avoid the 30% withholding tax on payments it receives, a foreign financial institution is generally required to become a PFFI which is a foreign financial institution that has entered into an agreement with the U.S. Treasury Department pursuant to which it agrees to perform specified due diligence, reporting and withholding functions (a “PFFI agreement”). Specifically, under its PFFI agreement, a PFFI will be required to obtain and report to the U.S. Internal Revenue Service certain information with respect to financial accounts held by U.S. persons or U.S.-owned foreign entities and to withhold 30% from certain payments (“passthru payments”) that it makes to “recalcitrant” accountholders or to non-participating foreign financial institutions. We are currently considering whether we and our subsidiaries will become PFFIs. Becoming a PFFI and complying with a PFFI agreement, would require the establishment of complex internal compliance systems at significant cost. On the other hand, failure to do so could result in the imposition of additional withholding tax on certain payments made to us or our banking subsidiaries.
Other
In the United States, the Bank’s U.S.-registered broker-dealer subsidiary, SMBC Nikko Securities America, is regulated by the SEC. Broker-dealers are subject to regulations that cover all aspects of the securities business, including:
| | • | | trade practices among broker-dealers; |
| | • | | use and safekeeping of customers’ funds and securities; |
| | • | | the financing of customers’ purchases; and |
| | • | | the conduct of directors, officers and employees. |
In addition, SMBC Nikko Securities America is a member of and regulated by the Financial Industry Regulatory Authority and is regulated by the individual state securities authorities in the states in which it operates. The U.S. government agencies and self-regulatory organizations, as well as state securities authorities in the United States having jurisdiction over the Bank’s U.S. broker-dealer affiliates, are empowered to conduct administrative proceedings that can result in censure, fine, the issuance of cease-and-desist orders or the suspension or expulsion of a broker-dealer or its directors, officers or employees.
Other Jurisdictions
Elsewhere in the world, our operations are subject to regulation and control by local central banks and monetary authorities.
48
4.C. ORGANIZATIONAL STRUCTURE
The following chart presents our corporate structure summary at March 31, 2012:
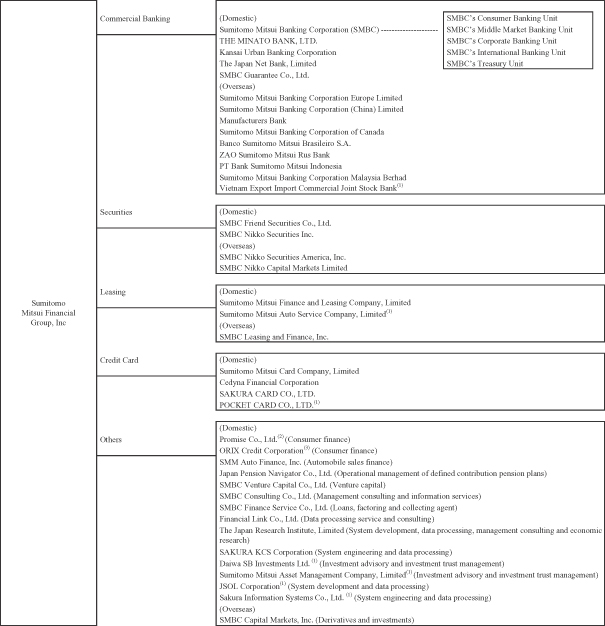
| (1) | These companies are our associates. |
| (2) | On April 1, 2012, we conducted a share exchange for the shares of common stock of Promise Co., Ltd. which we did not own, and Promise Co., Ltd. became our wholly owned subsidiary. On July 1, 2012, Promise Co., Ltd. changed its trade name to SMBC Consumer Finance Co., Ltd. |
| (3) | On June 29, 2012, the Bank transferred all of its shares of ORIX Credit Corporation to ORIX Corporation and, as a result, ORIX Credit Corporation is no longer our subsidiary. |
49
As the ultimate holding company of the Group, we are responsible for:
| | • | | group strategy and management; |
| | • | | group resource allocation; |
| | • | | group financial accounting; |
| | • | | HR management for group executives; |
| | • | | group risk management and compliance; |
| | • | | compensation schemes; and |
| | • | | efficiently harmonizing our operations on a Group-wide basis. |
50
Principal Subsidiaries
Our principal subsidiaries at March 31, 2012 are shown in the list below. We consolidate all entities over which we control, or have the power to govern the financial and operating policies so as to obtain benefits from their activities.
Principal domestic subsidiaries
| | | | | | | | | | |
Company Name | | Proportion of
Ownership
Interest | | | Proportion
of Voting Rights | | | Main Business |
| | | (%) | | | (%) | | | |
Sumitomo Mitsui Banking Corporation | | | 100.0 | | | | 100.0 | | | Commercial banking |
THE MINATO BANK, LTD. | | | 6.0 | | | | 46.4 | (1)(5) | | Commercial banking |
Kansai Urban Banking Corporation | | | 59.8 | | | | 60.2 | | | Commercial banking |
The Japan Net Bank, Limited | | | 41.1 | (2) | | | 61.4 | | | Internet banking |
SMBC Guarantee Co., Ltd. | | | 100.0 | | | | 100.0 | | | Credit guarantee |
SMBC Friend Securities Co., Ltd. | | | 100.0 | | | | 100.0 | | | Securities |
SMBC Nikko Securities Inc. | | | 100.0 | | | | 100.0 | | | Securities |
Sumitomo Mitsui Finance and Leasing Company, Limited | | | 60.0 | | | | 60.0 | | | Leasing |
Sumitomo Mitsui Card Company, Limited | | | 65.9 | | | | 65.9 | | | Credit card |
Cedyna Financial Corporation | | | 100.0 | | | | 100.0 | | | Credit card |
SAKURA CARD CO., LTD. | | | 95.7 | | | | 95.7 | | | Credit card |
Promise Co., Ltd.(3) | | | 97.7 | | | | 97.7 | | | Consumer finance |
ORIX Credit Corporation(4) | | | 50.9 | | | | 50.9 | | | Consumer finance |
SMM Auto Finance, Inc. | | | 56.0 | | | | 56.0 | | | Automobile sales finance |
Japan Pension Navigator Co., Ltd. | | | 69.7 | | | | 69.7 | | | Operational management of defined contribution pension plans |
SMBC Venture Capital Co., Ltd. | | | 40.0 | | | | 40.0 | (5) | | Venture capital |
SMBC Consulting Co., Ltd. | | | 100.0 | | | | 100.0 | | | Management consulting and information services |
SMBC Finance Service Co., Ltd. | | | 100.0 | | | | 100.0 | | | Loans, factoring and collecting agent |
Financial Link Co., Ltd. | | | 100.0 | | | | 100.0 | | | Data processing service and consulting |
The Japan Research Institute, Limited | | | 100.0 | | | | 100.0 | | | System development, data processing, management consulting and economic research |
SAKURA KCS Corporation | | | 50.2 | | | | 50.2 | | | System engineering and data processing |
| (1) | We have a 6.0% direct holding in THE MINATO BANK, LTD., and can control further 40.4% of the voting rights held by the Bank’s retirement benefit trust under contractual agreements between the Bank and the retirement benefit trust. |
| (2) | Our ownership interest in The Japan Net Bank, Limited is 41.1%, which is different from its proportion of voting rights, because The Japan Net Bank, Limited issued non-voting shares. |
| (3) | On April 1, 2012, we conducted a share exchange for the shares of common stock of Promise Co., Ltd. which we did not own, and Promise Co., Ltd. became our wholly owned subsidiary. On July 1, 2012, Promise Co., Ltd. changed its trade name to SMBC Consumer Finance Co., Ltd. |
| (4) | On June 29, 2012 the Bank transferred all of its shares of ORIX Credit Corporation to ORIX Corporation and, as a result, ORIX Credit Corporation is no longer our subsidiary. |
| (5) | These companies are accounted for as subsidiaries, despite our holdings of less than 50% of the voting rights, because we are able to govern the financial and operating policies of these companies under a statute or an agreement, or by delegating the majority of the members of the board of directors. |
51
Principal foreign subsidiaries
| | | | | | | | | | | | |
Company Name | | Country of
Incorporation | | Proportion
of Ownership
Interest | | | Proportion
of Voting
Rights | | | Main Business |
| | | | | (%) | | | (%) | | | |
Sumitomo Mitsui Banking Corporation Europe Limited | | U.K. | | | 100.0 | | | | 100.0 | | | Commercial banking |
Sumitomo Mitsui Banking Corporation (China) Limited | | China | | | 100.0 | | | | 100.0 | | | Commercial banking |
Manufacturers Bank | | U.S.A. | | | 100.0 | | | | 100.0 | | | Commercial banking |
Sumitomo Mitsui Banking Corporation of Canada | | Canada | | | 100.0 | | | | 100.0 | | | Commercial banking |
Banco Sumitomo Mitsui Brasileiro S.A. | | Brazil | | | 100.0 | | | | 100.0 | | | Commercial banking |
ZAO Sumitomo Mitsui Rus Bank | | Russia | | | 100.0 | | | | 100.0 | | | Commercial banking |
PT Bank Sumitomo Mitsui Indonesia | | Indonesia | | | 98.4 | | | | 98.4 | | | Commercial banking |
Sumitomo Mitsui Banking Corporation Malaysia Berhad | | Malaysia | | | 100.0 | | | | 100.0 | | | Commercial banking |
SMBC Nikko Securities America, Inc. | | U.S.A. | | | 100.0 | | | | 100.0 | | | Securities |
SMBC Nikko Capital Markets Limited | | U.K. | | | 100.0 | | | | 100.0 | | | Securities |
SMBC Leasing and Finance, Inc. | | U.S.A. | | | 100.0 | | | | 100.0 | | | Leasing |
SMBC Capital Markets, Inc. | | U.S.A. | | | 100.0 | | | | 100.0 | | | Derivatives and
investments |
4.D. PROPERTY, PLANT AND EQUIPMENT
We own or lease the land and buildings in which we conduct our business. Most of the property that we operate in Japan is owned by us to be used by our branches. In contrast, our international operations are conducted out of leased premises. Our head office building in Marunouchi is leased from a third party. Our largest property is the site of the Bank’s former Otemachi head office, with a net carrying value of ¥122 billion at March 31, 2012. The redevelopment of such property started in April 2011 and is expected to be completed in February 2015.
The following table shows the net carrying amount of our tangible fixed assets at March 31, 2012:
| | | | |
| | | At March 31, 2012 | |
| | | (In millions) | |
Land | | ¥ | 493,137 | |
Buildings | | | 287,913 | |
Leased assets | | | 9,180 | |
Others | | | 254,776 | |
| | | | |
Total | | ¥ | 1,045,006 | |
| | | | |
For more information, see Note 12 “Property, Plant and Equipment” and Note 38 “Assets Pledged and Received as Collateral” to our consolidated financial statements included elsewhere in this annual report.
The total area of land related to our material office and other properties at March 31, 2012 was approximately 753,000 square meters for owned land and approximately 17,000 square meters for leased land.
We are not aware of any material environmental issues that may affect the utilization of our assets.
| Item 4A. | Unresolved Staff Comments |
None.
52
| Item 5. | Operating and Financial Review and Prospects |
The discussion below should be read together with “Item 3.A. Selected Financial Data” and our consolidated financial statements and related notes included elsewhere in this annual report. Unless otherwise indicated, we present our information on a consolidated basis.
OVERVIEW
Operating Environment
In the first few months of the fiscal year ended March 31, 2012 the Japanese economy contracted due to a combination of supply chain disruptions, electricity shortages and the consequential slowdown in exports in the aftermath of the Great East Japan Earthquake and its collateral events. The Japanese economy then gradually recovered as the efforts to restore supply chains and make up for the lost output took hold. In the second half of the fiscal year, there were some visible signs of improvement in the unemployment rate despite monthly fluctuations, as the ratio of job offers to applicants continued to improve, although the employment situation in Japan still remains weak partly due to the effects of the earthquake. Private consumption also remained firm. Even though the rate of recovery of the Japanese economy slowed down due to the deceleration of the overseas economy coupled with the persistent strength of the Japanese yen against other currencies, the Japanese economy continued to recover.
In Japanese financial and capital markets, short-term interest rates have been stable at low levels, due to the BOJ’s ongoing provision of ample funds. Long-term interest rates have hovered at low levels and the long-term interest rate was around 1.0% at the end of the March 31, 2012 fiscal year.
The Nikkei 225 Index, which was ¥9,755.10 at March 31, 2011, decreased to the ¥8,100 level in November 2011. In March 2012, it moved above the ¥10,200 level in response to the strong U.S. stock market, mainly as a result of the improvement in the U.S. economic indicators, and depreciation of the yen. The Nikkei 225 Index was ¥10,083.56 at March 31, 2012.
The yen appreciated against both the U.S. dollar and the euro during the fiscal year ended March 31, 2012. It appreciated from the ¥83 level against the U.S. dollar at March 31, 2011 to an all-time peak of the ¥75 level in October 2011. It also appreciated from the ¥117 level against the euro at March 31, 2011 to the ¥97 level in January 2012. The yen then returned to the ¥82 level against the dollar and the ¥110 level against the euro at March 31, 2012, following enhanced monetary easing by the BOJ in February 2012.
Corporate bankruptcies in Japan, both in number and the amount of total liabilities are on a downward trend. According to Teikoku Databank, a Japanese research institution, there were approximately 12,900 corporate bankruptcies involving approximately ¥7.0 trillion in total liabilities for the fiscal year ended March 31, 2010, approximately 11,500 corporate bankruptcies involving approximately ¥4.6 trillion in total liabilities for the fiscal year ended March 31, 2011, and approximately 11,400 corporate bankruptcies involving approximately ¥3.9 trillion in total liabilities for the fiscal year ended March 31, 2012.
The global economy as a whole showed a weak recovery for the fiscal year ended March 31, 2012. International financial and capital markets continued to decline due to concerns about the European sovereign debt crisis and a tightening of fiscal or monetary policy by emerging economies.
The U.S. economy had been picking up because of a moderate increase in production and a recovery of consumption in the second half of the fiscal year ended March 31, 2012. Economic growth in Europe has slowed in some countries. Several European nations were experiencing recessionary conditions in the second half of the fiscal year ended March 31, 2012. Although the establishment of the European Financial Stability Facility and purchases of sovereign debt by the European Central Bank have led to some progress towards remedying the European sovereign debt crisis in Greece and other countries, uncertainty remains in some countries due to
53
concerns about fiscal stability. China, India and other emerging economies in Asia are expected to grow further. However their rates of growth have been declining since the second half of the fiscal year ended March 31, 2012. For further information on exposures to certain European countries, see “Item 5.A Operating Results—Exposures to Selected European Countries.”
In response to the Great East Japan Earthquake, the Government of Japan has engaged in revitalization efforts. The Basic Act on Reconstruction from the Great East Japan Earthquake, including the establishment of a reconstruction agency for planning and coordination of national policies and measures for reconstruction, entered into force in June 2011. On December 2, 2011, the Government of Japan enacted a third supplementary budget for the fiscal year ended March 31, 2012, mainly intended to promote recovery and reconstruction from the earthquake and nuclear damages, and which included special tax measures for funding the restoration from the earthquake. Although the budget includes special tax measures for funding the restoration from the earthquake, the statutory corporation tax rate will be reduced pursuant to an amendment to the Corporation Tax Act. For a more detailed description of changes in Japanese corporation tax rates, see “Item 5.A. Operating Results—Income Tax Expense.”
In addition to economic factors and conditions, we expect that our financial condition and operating results will be significantly affected by regulatory trends.
To address perceived weaknesses in financial regulation revealed by the global financial crisis, regulatory authorities in Japan and foreign countries have been and may continue taking significant steps to enhance regulation of the financial sector. The Basel Committee and other international bodies are leading efforts to formulate enhanced regulations, including in the areas of capital adequacy and liquidity. The Basel Committee published the Basel III rules text in December 2010, reflecting agreement on global regulatory standards on capital adequacy and liquidity of internationally active banks. To reflect changes made by the Basel Committee, the FSA changed its capital adequacy guidelines. The FSA’s changes will be generally applied from March 31, 2013, and will generally reflect the main measures of the minimum capital requirements of the Basel Committee that are scheduled to be phased in starting January 1, 2013. For a more detailed description of the capital adequacy rules based on Basel III, see “Item 4.B. Business Overview—Regulation.”
Japanese banks are facing increased scrutiny over their credit policies relating to SMEs and residential mortgage loans. The Act Concerning Temporary Measures to Facilitate Financing for SMEs, etc., which took effect on December 4, 2009, requires financial institutions to, among other things, make an effort to reduce their customers’ burden of loan repayments through methods such as term modification at the request of eligible borrowers, including SMEs and individual housing loan borrowers. The law was initially established as a short term measure to be effective until March 2011 but in March 2012 the application period was re-extended until March 2013. For a more detailed description of the Act Concerning Temporary Measures to Facilitate Financing for SMEs, etc., see “Item 4.B. Business Overview—Regulation.”
In the United States, the Dodd-Frank Act which was enacted in July 2010, provides a broad framework for significant regulatory changes across most areas of U.S. financial regulation. The Dodd-Frank Act addresses, among other issues, systemic risk oversight, bank capital standards, the liquidation of failing systemically significant U.S. financial institutions, OTC derivatives, the ability of banking entities to engage in proprietary trading activities and invest in hedge funds and private equity funds (known as the “Volcker Rule”), consumer and investor protection, hedge fund registration, securitization, investment advisors and the role of credit-rating agencies. For a more detailed description of the Dodd-Frank Act, see “Item 4.B. Business Overview—Regulation.”
For a more detailed description of regulations to which we are subject to, risks associated with regulatory development and our management policy under this environment, see “Item 3.D. Risk Factors—Risks Related to Our Business, and Risks Related to Our Industry,” “Item 4.B. Business Overview—Regulation,” and “Item 4.B. Business Overview—Management Policies.”
54
Factors Affecting Results of Operation
Income (Loss)
We have three principal sources of operating income: net interest income, net fee and commission income, and net trading/investment income. Income other than these three principal sources is included in “Other income.”
Net Interest Income. Net interest income, or the difference between interest income and interest expense, is determined by:
| | • | | the amount of interest-earning assets and interest-bearing liabilities; |
| | • | | the general level of interest rates; and |
| | • | | the proportion of interest-earning assets to interest-bearing liabilities. |
Our principal interest-earning assets are loans and advances, investment securities, and deposits with banks. Our principal interest-bearing liabilities are deposits, borrowings and debt securities in issue. The interest income and expense on trading assets and liabilities are not included in net interest income. Our net interest income is earned mainly by the Bank. The Bank controls its exposure to interest rate fluctuations through asset and liability management operations.
The Bank, like other banks in Japan, makes most domestic loans based on a short-term interest rate, the Tokyo Interbank Offered Rate (“TIBOR”), or a short-term prime rate, which are generally intended to reflect its cost of short-term yen funding. The Bank’s short-term prime rate is affected mainly by changes in the policy interest rates set by the BOJ, which is an uncollateralized overnight call rate.
Prime rates in Japan have been relatively stable since 2000. This is mainly because short-term interest rates, for example, the three-month TIBOR, have declined to nearly zero, and prime rates, which are adjusted according to changes in short-term interest rates, had little room for further decline. The BOJ lowered its target for the uncollateralized overnight call rate from 0.5% to 0.3% on October 31, 2008 and by an additional 0.2 percentage point to 0.1% on December 19, 2008 in order to address market conditions. Following these policy interest rate changes, we lowered our short-term prime rate by 0.2 percentage point from 1.675% to 1.475% on January 13, 2009 and our ordinary deposit rate by 0.02 percentage point from 0.04% to 0.02% on September 13, 2010. On October 5, 2010, the BOJ lowered its target for the uncollateralized overnight call rate to a range of 0% to 0.1% in order to enhance monetary easing, making clear that it is pursuing a virtual zero interest rate policy. Moreover, on February 14, 2012, the BOJ clarified its monetary policy stance and decided to further enhance monetary easing, with the aim of achieving the goal of 1% year-on-year rate of increase in the consumer price index.
The following table sets forth the Bank’s short-term prime rate, three-month TIBOR, ordinary deposit rate, long-term prime rate and ten-year swap rate, at the dates indicated:
| | | | | | | | | | | | |
| | | At March 31, | |
| | | 2012 | | | 2011 | | | 2010 | |
Short-term prime rate | | | 1.475 | % | | | 1.475 | % | | | 1.475 | % |
Three-month TIBOR | | | 0.336 | | | | 0.340 | | | | 0.438 | |
Ordinary deposit rate | | | 0.020 | | | | 0.020 | | | | 0.040 | |
Long-term prime rate | | | 1.350 | | | | 1.600 | | | | 1.600 | |
Ten-year swap rate | | | 1.035 | | | | 1.299 | | | | 1.453 | |
55
It is difficult to earn a wide interest spread when interest rates are at a low level, as they currently are in Japan. When interest rates rise from extremely low levels, interest spreads at commercial banks generally increase. However, interest spreads may temporarily decrease immediately after an increase in interest rates because it may take time for banks to increase lending rates correspondingly, in contrast to their funding rates. After an adjustment period, lending rates generally also increase and banks are able to secure a wider interest spread than in a low interest rate environment. Conversely, interest spreads may temporarily increase immediately after a decrease in interest rates because it may take time for banks to decrease lending rates correspondingly, in contrast to their funding rates. After an adjustment period, lending rates generally also decrease and banks generally are not able to maintain a wide interest spread. While various factors may affect the level of net interest income, generally the loan-to-deposit interest spread increases when short-term interest rates rise, particularly in the current low interest-rate environment.
Net Fee and Commission Income. We earn fees and commissions from a variety of services. The primary components of the Bank’s net fee and commission income are fees and commissions related to money remittances and transfers, investment trusts, loans (such as loan commitment fees and loan arrangement fees), securities transactions (such as bond trustee fees and bond recording agency fees) and guarantees and acceptances. Other fees and commissions include fees from investment banking and electronic banking.
In addition, we earn a significant amount of fees and commissions from our credit card business, conducted through Sumitomo Mitsui Card and Cedyna, and from our securities business, conducted through SMBC Nikko Securities and SMBC Friend Securities. The principal components of Sumitomo Mitsui Card’s and Cedyna’s fees and commissions are membership fees from retailers and annual cardholder membership fees, while those of SMBC Nikko Securities’ and SMBC Friend Securities’ fees and commissions are subscription and agent commissions from investment trusts and underwriting commissions.
The principal factors affecting fees and commissions are the demand for the services provided, the fees charged for those services and fees charged by competitors for similar services. The volume of services provided also affects profitability, as our fee businesses have significant economies of scale. In order to diversify sources of revenue and enhance return on assets, we are expanding our fees and commissions businesses, including sales of investment trusts and pension-type insurance, and investment banking businesses.
Net Trading/Investment Income. We undertake significant trading activities involving a variety of financial instruments, including derivatives. Our income from these activities is subject to volatility caused by, among other things, changes in interest rates, exchange rates, equity prices or other market variables. Any unexpected change in interest rates could affect the fair value of our interest rate derivative positions and our net income from trading activities. Net trading income consists of margins made on market-making and our customer business as well as changes in fair value of trading assets and liabilities and derivative financial instruments. It also includes net interest and dividend income on these instruments.
We have hybrid instruments classified as financial assets at fair value through profit or loss in our consolidated financial statements. Net income from financial assets at fair value through profit or loss includes gains and losses arising from sales and the change in the fair value of these instruments. It also includes interest and dividend income on these instruments.
We have substantial investments in debt securities as available-for-sale financial assets. In particular, Japanese government bonds represent a significant part of our bond portfolio. We also own debt securities denominated in foreign currencies, principally the U.S. dollar. We also have investments in equity securities as available-for-sale financial assets, which include our strategic investments in stocks issued by our customers. Net investment income includes the gains and losses arising from the sales or redemptions of available-for-sale financial assets and the dividend income earned from available-for-sale equity instruments. Increases in interest rates or declines in equity prices could substantially decrease the fair value of our available-for-sale financial assets.
56
Other Income. Other income consists primarily of income from operating leases conducted by Sumitomo Mitsui Finance and Leasing and income related to IT solution services.
Expenses
Impairment Charges on Financial Assets. Our impairment charges are recorded mainly due to impairment charges on loans and advances and on investment securities.
Impairment charges on loans and advances are affected by the economic environment. During periods of economic slowdown, corporate and individual borrowers are generally more likely to suffer credit rating downgrades, or become delinquent or default on their borrowings. The slowdown in the domestic or global economy may increase credit costs relating to a wide range of industries.
Declines in market prices for domestic and foreign investment securities may result in our recording impairment charges. We assess at the end of each reporting period whether there is any objective evidence that a financial asset or a group of financial assets is impaired. In the case of equity instruments classified as available-for-sale, a significant or prolonged decline in the fair value of the instrument below its cost is also considered to be such evidence in determining whether the assets are impaired. If any such evidence exists for available-for-sale financial assets, the cumulative loss, measured as the difference between the cost and the current fair value less any impairment charges on that financial asset previously recognized in profit or loss, is removed from equity and recognized in profit or loss.
General and Administrative Expenses. General and administrative expenses consist primarily of personnel expenses (salaries and related expenses), depreciation and amortization expenses, and other expenses (rent and lease expenses, premiums for deposit insurance, advertising and marketing expenses, and communication expenses).
Other Expenses. Other expenses consist primarily of cost of operating leases, costs related to IT services, losses on disposal of property, plant and equipment and other intangible assets and impairment losses of property, plant and equipment.
Unrealized Gains or Losses on Investment Securities Portfolio
Changes in the fair value of domestic and foreign investment securities result in an increase or a decrease in unrealized gains or losses on available-for-sale financial assets. Unrealized gains or losses arising from changes in the fair value of investment of these securities are recognized directly in equity, until they are derecognized or impaired.
Most of our domestic equity instruments consist of publicly traded Japanese stocks. The Nikkei 225 Index decreased by 12.0% from ¥11,089.94 at March 31, 2010, to ¥9,755.10 at March 31, 2011, but increased by 3.4% to ¥10,083.56 at March 31, 2012. At March 31, 2012, we had net unrealized gains on domestic equity securities of ¥916,457 million, an increase of ¥67,204 million from ¥849,253 million at March 31, 2011. For more information, see “Item 5.A. Operating Results—Financial Condition—Investment Securities.”
Strengthening of Equity Capital
In response to more stringent regulatory capital requirements, we have been taking a proactive approach to managing our risk-weighted capital ratio by focusing on increasing our qualifying capital, including through measures such as global common stock offerings, identifying risks and controlling risk-weighted assets. As a result of global offerings of common stock completed in July 2009 and February 2010, we increased our equity in our consolidated statement of financial position by ¥1,836 billion. In September and October 2009, we issued into the domestic market ¥388 billion of preferred securities via a consolidated subsidiary, the proceeds of which
57
were used to improve our capital. In February 2010, we completed cash tender offers whereby we repurchased the majority of the outstanding series of certain non-cumulative perpetual preferred securities and the Bank repurchased the majority of the outstanding series of our fixed to floating rate perpetual subordinated bonds. The successful tender offers reduced our interest and dividend payment obligations with respect to those securities, and together with associated gains, improved the quantity and quality of our capital. In addition, on April 1, 2011, we acquired and cancelled all shares of our Type 6 preferred stock for an aggregate amount of ¥210 billion.
Foreign Currency Fluctuations
The average exchange rate used to convert dollars to yen in the consolidated financial statements included elsewhere in this annual report for the fiscal year ended March 31, 2012 was ¥79.08 per $1.00, compared to the prior fiscal year’s average exchange rate of ¥85.74 per $1.00. The percentage of revenue we earned from our foreign operations for the fiscal years ended March 31, 2012 and 2011 was 12% and 10%, respectively. For more information, please see “Item 4.B. Business Overview—Revenues by Region.”
Critical Accounting Estimates and Judgments
Our financial position and operating results are influenced by estimates and judgments that management employs in the course of preparation of our consolidated financial statements. We identified the following areas of significant accounting policies to be particularly sensitive in terms of estimates and judgments made by management. Estimates and judgments are continually evaluated based on historical experience and other factors, including expectations of future events that are believed to be reasonable.
Allowance for Loan Losses
Allowance for loan losses represents management’s estimate of the losses incurred in the loan portfolios at the end of each reporting period. Management exercises judgments in making assumptions and estimations when calculating the allowance for loan losses on both individually and collectively assessed loans.
The allowance for loan losses for individually significant impaired loans is estimated by management based on the expected future cash flows taking into account factors such as historical loss information, the appropriateness of the borrower’s business plan or operational improvement plan, the status of progress of its plan, the overall support from financial institutions and realizable value of any collateral held. The allowance for loan losses is the difference between the carrying amount of a loan and the discounted present value of expected future cash flows that are estimated by management. The actual future cash flows may differ from the estimates by management and consequently may cause actual loan losses to differ from the reported allowance for loan losses.
The allowance for loan losses for the remaining loans is collectively calculated based on the historical loss experience for loans which have similar credit risk characteristics to those in the current loan portfolio using statistical methods. These statistical methods are subject to estimation uncertainty. In normal circumstances, the use of statistical methods evidenced by historical information provides the most objective methodology in assessing inherent losses on loans with similar credit risk characteristics. However, in certain circumstances, the use of historical loss experience alone may not be representative of current loss experiences and as a result it may provide less relevant information about the loss incurred in a given portfolio at the end of the reporting period, particularly in a situation where there have been changes in economic conditions. In these circumstances, we make a judgment to update the historical loss experience based on the most recent loss information, taking into account, among others, the effect of the current economic environment.
Additionally, we recognize an allowance for loan losses when it is probable that a loss has been incurred but not yet reported to us. To assess the losses on the loan portfolios where loss events have occurred but not yet been reported, management develops assumptions and methodologies.
58
Management estimates and judgments may change from time to time as the economic environment changes or new information becomes available. Changes in these estimates and judgments will result in a different allowance for loan losses and may have a direct impact on impairment charges. The impairment charges for loan losses totaled ¥144,022 million, ¥259,292 million and ¥215,886 million for the fiscal years ended March 31, 2012, 2011 and 2010, respectively.
Fair Value of Financial Instruments
Some of our financial instruments are measured at fair value with changes in fair value recognized in profit or loss, such as trading assets and liabilities, financial assets at fair value through profit or loss, and derivative financial instruments. Available-for-sale financial assets are also measured at fair value with changes in fair value reported in other comprehensive income.
The fair value of a financial instrument is the amount for which the instrument could be exchanged or settled between knowledgeable and willing parties in an arm’s length transaction. Our financial assets and liabilities measured at fair value are mostly valued based on observable market data that are readily available in active markets, or using valuation techniques that incorporate inputs, other than quoted market prices, that are observable either directly or indirectly in the market, including dealers’ quotes. We principally use valuation techniques that are commonly used by market participants to price the instruments. To the extent practical, the valuation models make maximum use of observable data. However, for certain financial assets and liabilities, the fair values are measured by using valuation techniques with significant unobservable inputs. In such cases, significant management estimates are made, resulting in a less objective measurement of fair value.
The risk management departments in each subsidiary regularly review significant valuation methodologies and recalibrate model parameters and inputs, both observable and unobservable, in an effort to ensure an appropriate estimation of fair value has been made. Where significant management judgments are required in valuation, we establish a valuation control framework to validate the valuation models and fair values calculated based on such valuation models. Under the framework, the accounting department is responsible for ensuring that the accounting policies and procedures to determine the fair values are in compliance with the relevant accounting standards.
If there are significant unobservable inputs used in the valuation technique at the trade date and financial assets and liabilities are not recognized at their respective transaction prices, any profit or loss on the trade date is deferred. Management judgment is required to determine whether significant unobservable inputs exist in the valuation technique.
The financial assets and liabilities carried at fair value were categorized under the three levels of fair value hierarchy as follows:
| | • | | Level 1. Quoted prices (unadjusted) in active markets for identical assets or liabilities; |
| | • | | Level 2. Inputs other than quoted prices included within Level 1 that are observable for the asset or liability, either directly (i.e., as prices) or indirectly (i.e., derived from prices); and |
| | • | | Level 3. Inputs for the asset or liability that are not based on observable market data (unobservable inputs). |
Management judgment is involved in determining the level of hierarchy to which each financial instrument should be categorized and in periodical assessments of market liquidity for inputs and price transparency.
In addition to the fair value hierarchy disclosure, we provide a sensitivity analysis of the impact on the Level 3 financial instruments of using reasonably possible alternatives for the unobservable parameters in Note 44 “Fair Value of Financial Assets and Liabilities” to our consolidated financial statements included elsewhere in this annual report. The determination of reasonably possible alternatives requires significant management judgment.
59
The financial assets measured at fair value categorized in Level 3 were ¥1,000,426 million and ¥1,040,285 million at March 31, 2012 and 2011, respectively. The financial liabilities measured at fair value categorized in Level 3 were ¥17,470 million and ¥7,351 million at March 31, 2012 and 2011 respectively.
Impairment of Available-for-sale Financial Assets
Available-for-sale financial assets are measured at fair value with changes in fair value reported in available-for-sale financial assets reserve as a separate component of equity until the financial assets are either derecognized or become impaired. If there is objective evidence of impairment as a result of loss events which have an impact on the estimated future cash flows of the financial assets that can be reliably estimated, the cumulative loss previously recognized in equity is removed and recognized in profit or loss as an impairment charge.
We exercise judgment in determining whether there is objective evidence of occurrence of loss events which result in a decrease in estimated future cash flows. The estimation of future cash flows also requires judgment. In the assessment of impairment of available-for-sale equity instruments, we also consider whether there has been a significant or prolonged decline in fair value below their cost. The determination of what is a significant or prolonged decline requires management judgment.
Impairment may occur when there is objective evidence of deterioration in the financial conditions of the investee, industry and sector performance, or changes in operating and financing cash flows. The determination of impairment in this respect also includes significant management judgment.
Management estimates and judgments may change from time to time upon future events that may or may not occur and changes in these estimates and judgments could adversely affect the carrying amounts of available-for-sale financial assets. Impairment charges on available-for-sale financial assets reclassified from equity to profit or loss totaled ¥140,288 million, ¥174,636 million and ¥42,755 million for the fiscal years ended March 31, 2012, 2011 and 2010, respectively.
Impairment of Goodwill
Goodwill is tested for impairment at least annually and whenever events or changes in circumstances indicate that it may be impaired. The first step of the impairment test is identifying the cash-generating units (“CGUs”), which represent the smallest identifiable groups of assets that generate cash inflows that are largely independent of the cash inflows from other assets or groups of assets. Goodwill is then allocated to the CGUs, considering how the goodwill is recognized and other relevant factors.
In the impairment test, the carrying amount of the CGU to which goodwill is allocated is compared against its recoverable amount, which is the higher of its fair value less costs to sell and its value in use. Such recoverable amounts are determined based on significant management judgments and assumptions.
We determine the recoverable amount using the estimated future cash flows, pre-tax discount rates, growth rates and other factors. The estimation of future cash flows inherently reflects management judgments, even though such forecasts are prepared taking into account actual past performance and external economic data. The pre-tax discount rates and growth rates may be significantly affected by market interest rates or other market conditions, which are beyond management’s control, and therefore significant management judgments are made to determine these assumptions.
These management judgments are made based on the facts and circumstances at the time of the impairment test, and may vary depending on the situation and time. Changes in management judgments may result in different impairment test results and different impairment losses recognized. For the fiscal years ended March 31, 2012, 2011 and 2010, impairment losses on goodwill were ¥1,884 million, nil and ¥3,918 million, respectively.
60
Provision for Interest Repayment
Provision for interest repayment represents management’s estimate of future claims for the refund of gray zone interest, taking into account historical experience such as the number of customer claims for a refund, the amount of repayments and the customers’ characteristics, and the length of the period the claims are expected to be received in the future.
Management estimates and judgments may change from time to time as the legal environment and market conditions change or new information becomes available. Changes in these estimates and judgments could affect the balance of provision for interest repayment. Provision for interest repayment is recorded in provisions as a liability, and it totaled ¥400,233 million and ¥72,219 million at March 31, 2012 and 2011, respectively. The increase in provision for interest repayment was due mainly to the inclusion of the provision from SMBC Consumer Finance, formerly known as Promise, which became our consolidated subsidiary in December 2011.
Retirement Benefits
We have defined benefit plans such as defined benefit pension plans and lump-sum severance indemnity plans. The present value of the defined benefit obligation is calculated based on actuarial valuations that are dependent upon a number of assumptions, including discount rates, mortality rates and future salary (benefit) increases. The discount rates are equivalent to market yields of AA credit-rated corporate bonds that have terms to maturity approximating those of the related obligations. Future mortality rates are based on the official mortality table generally used for actuarial assumptions in Japan. Other assumptions used for the calculation of the defined benefit obligation are based on historical records. The expected return on plan assets is developed separately for each plan, typically using a building block approach recognizing the plan’s specific asset allocation and the assumed return on assets for each asset category. Due to the long-term nature of these plans, such estimates are subject to significant uncertainty. While we believe that these assumptions are appropriate, any change in these assumptions will impact actuarial gains and losses, as well as the present value of the defined benefit obligations and the net retirement benefit expense for each period. Actuarial gains and losses in excess of the greater of 10% of the fair value of plan assets and 10% of the present value of the defined benefit obligation are recognized in profit or loss over the employees’ expected average remaining working lives. The amounts of cumulative unrecognized actuarial losses, net of gains, at March 31, 2012 and 2011 were ¥307,776 million and ¥210,534 million, respectively.
The difference between the fair value of the plan assets and the present value of the defined benefit obligation at the end of the reporting period, adjusted for any cumulative unrecognized actuarial gains and losses and past service costs for each plan, is recognized as liabilities and assets in the consolidated statement of financial position. When this calculation for each plan results in a benefit to us, the recognized asset is limited to the net total of any cumulative unrecognized actuarial losses and past service costs and the present value of any economic benefits available in the form of refunds from the plan or reductions in future contributions to the plan. An economic benefit is available to us, if it is realizable during the life of the plan or on settlement of the plan obligation. Our cumulative deficit at March 31, 2012 and 2011 was ¥184,675 million and ¥124,705 million, respectively, while the net total of assets and liabilities in the consolidated statement of financial position amounted to net assets of ¥122,799 million and ¥85,318 million at March 31, 2012 and 2011, respectively.
Deferred Tax Assets
We recognize deferred tax assets relating to tax losses carried forward and deductible temporary differences, only to the extent that it is probable that future taxable profit will be available against which the tax losses carried forward and the deductible temporary differences can be utilized. This assessment requires significant management judgments and assumptions. Future taxable profit is estimated based on, among other relevant factors, forecasted operating results, which are based on historical financial performance and the business plans that management believes to be prudent and feasible. While we carefully assess the realization of tax losses
61
carried forward and deductible temporary differences, the actual taxable profit in the future may be less than the forecast. The net deferred tax assets amounted to ¥562,890 million and ¥1,001,140 million at March 31, 2012 and 2011, respectively.
Special Purpose Entities
In the ordinary course of business, we are involved in a number of transactions using vehicles which may be deemed as special purpose entities (“SPEs”), in areas including the securitization of financial assets.
We consolidate SPEs, if our control is considered substantive with respect to the SPEs as required by IFRS. In assessing and determining whether we control SPEs, judgment is made to determine whether (a) the activities of the SPE are being conducted on our behalf according to our specific business needs so that we obtain benefits from the SPE’s operations, (b) we have the decision-making powers to obtain the majority of the benefits of the activities of the SPE or we have delegated these decision-making powers by setting up an autopilot mechanism, (c) we have rights to obtain the majority of the benefits of the SPE and therefore may be exposed to risks incident to the activities of the SPE, or (d) we retain the majority of the residual or ownership risks related to the SPE or its assets in order to obtain benefits from its activities. In many instances, the indicators of control of an SPE are clear, in which case less management judgment is required. In some cases, however, several different indicators of control that would support different conclusions may exist, in which case more management judgment is required to form an overall conclusion on control. For more information, see “Item 5.E. Off-balance Sheet Arrangements.”
New and Amended Standards and Recent Accounting Pronouncements
See “New and amended standards adopted by the SMFG Group” and “Recent Accounting Pronouncements” under Note 2 “Summary of Significant Accounting Policies” to our consolidated financial statements included elsewhere in this annual report.
5.A. OPERATING RESULTS
Under the economic and financial circumstances described in “Item 5. Overview—Operating Environment”, we made a profit through our commercial banking and other financial services businesses. Our total operating income decreased by ¥43,742 million from ¥2,878,245 million for the fiscal year ended March 31, 2011 to ¥2,834,503 million for the fiscal year ended March 31, 2012 primarily due to a decrease of net trading income. In spite of this, our net operating income increased by ¥105,876 million from ¥2,444,317 million for the fiscal year ended March 31, 2011 to ¥2,550,193 million for the fiscal year ended March 31, 2012, primarily due to a decrease in impairment charges on loans and advances. However, our net profit decreased by ¥113,520 million from ¥571,518 million for the fiscal year ended March 31, 2011 to ¥457,998 million for the fiscal year ended March 31, 2012, due to an increase in general and administrative expenses and income tax expense.
Our total assets increased by ¥5,403,499 million from ¥136,470,927 million at March 31, 2011 to ¥141,874,426 million at March 31, 2012, primarily due to an increase in investment securities and loans and advances.
Our total liabilities increased by ¥5,339,313 million from ¥128,919,722 million at March 31, 2011 to ¥134,259,035 million at March 31, 2012, primarily due to an increase in deposits and debt securities in issue, which was partially offset by a decrease in borrowings.
Our total equity increased by ¥64,186 million from ¥7,551,205 million at March 31, 2011 to ¥7,615,391 million at March 31, 2012, due primarily to an increase in retained earnings and other reserves, although capital surplus decreased and treasury stock increased.
62
Operating Results
The following table presents information as to our income, expenses and net profit for the fiscal years ended March 31, 2012, 2011 and 2010:
| | | | | | | | | | | | |
| | | For the fiscal year ended March 31, | |
| | | 2012 | | | 2011 | | | 2010 | |
| | | (In millions, except per share data) | |
Interest income | | ¥ | 1,710,331 | | | ¥ | 1,720,181 | | | ¥ | 1,766,047 | |
Interest expense | | | 313,631 | | | | 311,056 | | | | 346,810 | |
| | | | | | | | | | | | |
Net interest income | | | 1,396,700 | | | | 1,409,125 | | | | 1,419,237 | |
| | | | | | | | | | | | |
Fee and commission income | | | 869,407 | | | | 806,704 | | | | 650,437 | |
Fee and commission expense | | | 132,562 | | | | 132,560 | | | | 121,716 | |
| | | | | | | | | | | | |
Net fee and commission income | | | 736,845 | | | | 674,144 | | | | 528,721 | |
| | | | | | | | | | | | |
Net trading income | | | 182,296 | | | | 324,479 | | | | 330,130 | |
Net income from financial assets at fair value through profit or loss | | | 33,734 | | | | 30,116 | | | | 75,579 | |
Net investment income | | | 239,365 | | | | 235,911 | | | | 178,552 | |
Other income | | | 245,563 | | | | 204,470 | | | | 232,334 | |
| | | | | | | | | | | | |
Total operating income | | | 2,834,503 | | | | 2,878,245 | | | | 2,764,553 | |
| | | | | | | | | | | | |
Impairment charges on financial assets | | | 284,310 | | | | 433,928 | | | | 258,641 | |
| | | | | | | | | | | | |
Net operating income | | | 2,550,193 | | | | 2,444,317 | | | | 2,505,912 | |
| | | | | | | | | | | | |
General and administrative expenses | | | 1,366,705 | | | | 1,293,546 | | | | 1,096,957 | |
Other expenses | | | 239,292 | | | | 212,292 | | | | 236,760 | |
| | | | | | | | | | | | |
Operating expenses | | | 1,605,997 | | | | 1,505,838 | | | | 1,333,717 | |
| | | | | | | | | | | | |
Share of post-tax loss of associates and joint ventures | | | 25,004 | | | | 5,796 | | | | 37,461 | |
| | | | | | | | | | | | |
Profit before tax | | | 919,192 | | | | 932,683 | | | | 1,134,734 | |
| | | | | | | | | | | | |
Income tax expense | | | 461,194 | | | | 361,165 | | | | 488,041 | |
| | | | | | | | | | | | |
Net profit | | ¥ | 457,998 | | | ¥ | 571,518 | | | ¥ | 646,693 | |
| | | | | | | | | | | | |
Profit attributable to: | | | | | | | | | | | | |
Shareholders of Sumitomo Mitsui Financial Group, Inc. | | ¥ | 345,430 | | | ¥ | 464,007 | | | ¥ | 528,692 | |
Non-controlling interests | | | 112,568 | | | | 107,511 | | | | 118,001 | |
Earnings per share: | | | | | | | | | | | | |
Basic | | ¥ | 248.98 | | | ¥ | 328.32 | | | ¥ | 511.51 | |
Diluted | | | 248.29 | | | | 328.31 | | | | 481.59 | |
Fiscal Year Ended March 31, 2012 Compared to Fiscal Year Ended March 31, 2011
Total operating income decreased by ¥43,742 million, or 2%, from ¥2,878,245 million for the fiscal year ended March 31, 2011 to ¥2,834,503 million for the fiscal year ended March 31, 2012, primarily due to a decrease in net trading income of ¥142,183 million, which was partially offset by an increase in net fee and commission income.
Net operating income increased by ¥105,876 million from ¥2,444,317 million for the fiscal year ended March 31, 2011 to ¥2,550,193 million for the fiscal year ended March 31, 2012. The primary reason of this increase was a decrease in impairment charges on loans and advances.
Net profit decreased from ¥571,518 million for the fiscal year ended March 31, 2011 to ¥457,998 million for the fiscal year ended March 31, 2012 as a result of an increase in both general and administrative expenses
63
and income tax expense resulting from a reduction of net deferred tax assets which resulted mainly from changes in Japanese corporation tax rates which will be applied after the fiscal years beginning April 1, 2012. For a more detailed description of changes in Japanese corporation tax rates, see “Item5.A. Operating Results—Income Tax Expense.”
Fiscal Year Ended March 31, 2011 Compared to Fiscal Year Ended March 31, 2010
Total operating income increased by ¥113,692 million, or 4%, from ¥2,764,553 million for the fiscal year ended March 31, 2010 to ¥2,878,245 million for the fiscal year ended March 31, 2011. The primary reason for this increase was an increase in net fee and commission income of ¥145,423 million due mainly to the effect of the inclusion of full year impact of SMBC Nikko Securities, which became a subsidiary in October 2009, and the acquisition of Cedyna in May 2010. In addition, net investment income increased by ¥57,359 million due primarily to an increase in gains on sales of bonds by quickly responding to fluctuations in the market interest rates at the Bank. These were partially offset by decreases in net interest income, which was driven by a decline in market interest rates, and net income from financial assets at fair value through profit or loss due primarily to a decrease in gains on debt instruments.
Net operating income decreased by ¥61,595 million from ¥2,505,912 million for the fiscal year ended March 31, 2010 to ¥2,444,317 million for the fiscal year ended March 31, 2011. The primary reason of this decrease was an increase in impairment charges on available-for-sale financial assets.
Net profit decreased from a net profit of ¥646,693 million for the fiscal year ended March 31, 2010 to a net profit of ¥571,518 million for the fiscal year ended March 31, 2011 as a result of a decrease in net operating income described above and an increase in general and administrative expenses due to the inclusion of full year impact of SMBC Nikko Securities in October 2009 and the acquisition of Cedyna in May 2010.
64
Net Interest Income
The following tables show the average balances of our statements of financial position items and related interest income and expense, and average rates for the fiscal years ended March 31, 2012, 2011 and 2010:
| | | | | | | | | | | | | | | | | | | | | | | | | | | | | | | | | | | | |
| | | For the fiscal year ended March 31, | |
| | | 2012 | | | 2011 | | | 2010 | |
| | | Average
balance(3) | | | Interest
income | | | Average
rate | | | Average
balance(3) | | | Interest
income | | | Average
rate | | | Average
balance(3) | | | Interest
income | | | Average
rate | |
| | | (In millions, except percentages) | |
Interest-earning assets: | | | | | | | | | | | | | | | | | | | | | | | | | | | | | | | | | | | | |
Interest-earning deposits with other banks: | | | | | | | | | | | | | | | | | | | | | | | | | | | | | | | | | | | | |
Domestic offices | | ¥ | 292,043 | | | ¥ | 1,602 | | | | 0.55 | % | | ¥ | 298,557 | | | ¥ | 1,144 | | | | 0.38 | % | | ¥ | 222,757 | | | ¥ | 1,005 | | | | 0.45 | % |
Foreign offices | | | 3,626,677 | | | | 26,557 | | | | 0.73 | % | | | 2,224,887 | | | | 17,324 | | | | 0.78 | % | | | 2,054,195 | | | | 13,591 | | | | 0.66 | % |
| | | | | | | | | | | | | | | | | | | | | | | | | | | | | | | | | | | | |
Total | | | 3,918,720 | | | | 28,159 | | | | 0.72 | % | | | 2,523,444 | | | | 18,468 | | | | 0.73 | % | | | 2,276,952 | | | | 14,596 | | | | 0.64 | % |
| | | | | | | | | | | | | | | | | | | | | | | | | | | | | | | | | | | | |
Call loans and bills bought: | | | | | | | | | | | | | | | | | | | | | | | | | | | | | | | | | | | | |
Domestic offices | | | 346,962 | | | | 2,081 | | | | 0.60 | % | | | 361,438 | | | | 2,252 | | | | 0.62 | % | | | 347,177 | | | | 2,500 | | | | 0.72 | % |
Foreign offices | | | 832,860 | | | | 12,269 | | | | 1.47 | % | | | 802,633 | | | | 7,022 | | | | 0.87 | % | | | 819,819 | | | | 4,952 | | | | 0.60 | % |
| | | | | | | | | | | | | | | | | | | | | | | | | | | | | | | | | | | | |
Total | | | 1,179,822 | | | | 14,350 | | | | 1.22 | % | | | 1,164,071 | | | | 9,274 | | | | 0.80 | % | | | 1,166,996 | | | | 7,452 | | | | 0.64 | % |
| | | | | | | | | | | | | | | | | | | | | | | | | | | | | | | | | | | | |
Reverse repurchase agreements and cash collateral on securities borrowed: | | | | | | | | | | | | | | | | | | | | | | | | | | | | | | | | | | | | |
Domestic offices | | | 4,123,424 | | | | 9,072 | | | | 0.22 | % | | | 4,467,165 | | | | 11,271 | | | | 0.25 | % | | | 2,509,461 | | | | 8,634 | | | | 0.34 | % |
Foreign offices | | | 200,641 | | | | 6,047 | | | | 3.01 | % | | | 76,189 | | | | 2,375 | | | | 3.12 | % | | | 24,899 | | | | 802 | | | | 3.22 | % |
| | | | | | | | | | | | | | | | | | | | | | | | | | | | | | | | | | | | |
Total | | | 4,324,065 | | | | 15,119 | | | | 0.35 | % | | | 4,543,354 | | | | 13,646 | | | | 0.30 | % | | | 2,534,360 | | | | 9,436 | | | | 0.37 | % |
| | | | | | | | | | | | | | | | | | | | | | | | | | | | | | | | | | | | |
Held-to-maturity investments(1): | | | | | | | | | | | | | | | | | | | | | | | | | | | | | | | | | | | | |
Domestic offices | | | 4,818,061 | | | | 37,895 | | | | 0.79 | % | | | 3,709,853 | | | | 32,629 | | | | 0.88 | % | | | 2,830,378 | | | | 28,784 | | | | 1.02 | % |
| | | | | | | | | | | | | | | | | | | | | | | | | | | | | | | | | | | | |
Available-for-sale financial assets(1): | | | | | | | | | | | | | | | | | | | | | | | | | | | | | | | | | | | | |
Domestic offices | | | 23,307,399 | | | | 83,223 | | | | 0.36 | % | | | 19,297,268 | | | | 103,026 | | | | 0.53 | % | | | 13,561,413 | | | | 104,254 | | | | 0.77 | % |
Foreign offices | | | 1,001,531 | | | | 16,835 | | | | 1.68 | % | | | 1,229,769 | | | | 19,076 | | | | 1.55 | % | | | 1,120,526 | | | | 17,819 | | | | 1.59 | % |
| | | | | | | | | | | | | | | | | | | | | | | | | | | | | | | | | | | | |
Total | | | 24,308,930 | | | | 100,058 | | | | 0.41 | % | | | 20,527,037 | | | | 122,102 | | | | 0.59 | % | | | 14,681,939 | | | | 122,073 | | | | 0.83 | % |
| | | | | | | | | | | | | | | | | | | | | | | | | | | | | | | | | | | | |
Loans and advances(2): | | | | | | | | | | | | | | | | | | | | | | | | | | | | | | | | | | | | |
Domestic offices | | | 62,286,915 | | | | 1,224,234 | | | | 1.97 | % | | | 63,761,723 | | | | 1,282,041 | | | | 2.01 | % | | | 64,768,749 | | | | 1,317,068 | | | | 2.03 | % |
Foreign offices | | | 11,618,471 | | | | 290,516 | | | | 2.50 | % | | | 9,702,902 | | | | 242,021 | | | | 2.49 | % | | | 10,451,249 | | | | 266,638 | | | | 2.55 | % |
| | | | | | | | | | | | | | | | | | | | | | | | | | | | | | | | | | | | |
Total | | | 73,905,386 | | | | 1,514,750 | | | | 2.05 | % | | | 73,464,625 | | | | 1,524,062 | | | | 2.07 | % | | | 75,219,998 | | | | 1,583,706 | | | | 2.11 | % |
| | | | | | | | | | | | | | | | | | | | | | | | | | | | | | | | | | | | |
Total interest-earning assets: | | | | | | | | | | | | | | | | | | | | | | | | | | | | | | | | | | | | |
Domestic offices | | | 95,174,804 | | | | 1,358,107 | | | | 1.43 | % | | | 91,896,004 | | | | 1,432,363 | | | | 1.56 | % | | | 84,239,935 | | | | 1,462,245 | | | | 1.74 | % |
Foreign offices | | | 17,280,180 | | | | 352,224 | | | | 2.04 | % | | | 14,036,380 | | | | 287,818 | | | | 2.05 | % | | | 14,470,688 | | | | 303,802 | | | | 2.10 | % |
| | | | | | | | | | | | | | | | | | | | | | | | | | | | | | | | | | | | |
Total | | ¥ | 112,454,984 | | | | 1,710,331 | | | | 1.52 | % | | ¥ | 105,932,384 | | | | 1,720,181 | | | | 1.62 | % | | ¥ | 98,710,623 | | | | 1,766,047 | | | | 1.79 | % |
| | | | | | | | | | | | | | | | | | | | | | | | | | | | | | | | | | | | |
65
| | | | | | | | | | | | | | | | | | | | | | | | | | | | | | | | | | | | |
| | | For the fiscal year ended March 31, | |
| | | 2012 | | | 2011 | | | 2010 | |
| | | Average
balance(3) | | | Interest
expense | | | Average
rate | | | Average
balance(3) | | | Interest
expense | | | Average
rate | | | Average
balance(3) | | | Interest
expense | | | Average
rate | |
| | | (In millions, except percentages) | |
Interest-bearing liabilities: | | | | | | | | | | | | | | | | | | | | | | | | | | | | | | | | | | | | |
Deposits: | | | | | | | | | | | | | | | | | | | | | | | | | | | | | | | | | | | | |
Domestic offices | | ¥ | 69,331,354 | | | ¥ | 61,690 | | | | 0.09 | % | | ¥ | 67,912,936 | | | ¥ | 78,529 | | | | 0.12 | % | | ¥ | 65,150,510 | | | ¥ | 119,055 | | | | 0.18 | % |
Foreign offices | | | 9,819,810 | | | | 67,773 | | | | 0.69 | % | | | 8,351,047 | | | | 55,955 | | | | 0.67 | % | | | 8,916,248 | | | | 54,319 | | | | 0.61 | % |
| | | | | | | | | | | | | | | | | | | | | | | | | | | | | | | | | | | | |
Total | | | 79,151,164 | | | | 129,463 | | | | 0.16 | % | | | 76,263,983 | | | | 134,484 | | | | 0.18 | % | | | 74,066,758 | | | | 173,374 | | | | 0.23 | % |
| | | | | | | | | | | | | | | | | | | | | | | | | | | | | | | | | | | | |
Call money and bills sold: | | | | | | | | | | | | | | | | | | | | | | | | | | | | | | | | | | | | |
Domestic offices | | | 1,434,363 | | | | 1,564 | | | | 0.11 | % | | | 1,613,628 | | | | 2,166 | | | | 0.13 | % | | | 1,857,443 | | | | 2,855 | | | | 0.15 | % |
Foreign offices | | | 379,093 | | | | 1,999 | | | | 0.53 | % | | | 334,514 | | | | 1,672 | | | | 0.50 | % | | | 1,207,668 | | | | 3,392 | | | | 0.28 | % |
| | | | | | | | | | | | | | | | | | | | | | | | | | | | | | | | | | | | |
Total | | | 1,813,456 | | | | 3,563 | | | | 0.20 | % | | | 1,948,142 | | | | 3,838 | | | | 0.20 | % | | | 3,065,111 | | | | 6,247 | | | | 0.20 | % |
| | | | | | | | | | | | | | | | | | | | | | | | | | | | | | | | | | | | |
Repurchase agreements and cash collateral on securities lent: | | | | | | | | | | | | | | | | | | | | | | | | | | | | | | | | | | | | |
Domestic offices | | | 4,908,276 | | | | 7,901 | | | | 0.16 | % | | | 5,074,570 | | | | 9,421 | | | | 0.19 | % | | | 3,472,016 | | | | 6,843 | | | | 0.20 | % |
Foreign offices | | | 649,143 | | | | 2,665 | | | | 0.41 | % | | | 602,510 | | | | 2,183 | | | | 0.36 | % | | | 365,884 | | | | 703 | | | | 0.19 | % |
| | | | | | | | | | | | | | | | | | | | | | | | | | | | | | | | | | | | |
Total | | | 5,557,419 | | | | 10,566 | | | | 0.19 | % | | | 5,677,080 | | | | 11,604 | | | | 0.20 | % | | | 3,837,900 | | | | 7,546 | | | | 0.20 | % |
| | | | | | | | | | | | | | | | | | | | | | | | | | | | | | | | | | | | |
Borrowings: | | | | | | | | | | | | | | | | | | | | | | | | | | | | | | | | | | | | |
Domestic offices | | | 10,904,124 | | | | 66,414 | | | | 0.61 | % | | | 8,600,247 | | | | 70,713 | | | | 0.82 | % | | | 6,066,674 | | | | 60,837 | | | | 1.00 | % |
Foreign offices | | | 347,165 | | | | 17,076 | | | | 4.92 | % | | | 451,803 | | | | 14,762 | | | | 3.27 | % | | | 471,182 | | | | 18,467 | | | | 3.92 | % |
| | | | | | | | | | | | | | | | | | | | | | | | | | | | | | | | | | | | |
Total | | | 11,251,289 | | | | 83,490 | | | | 0.74 | % | | | 9,052,050 | | | | 85,475 | | | | 0.94 | % | | | 6,537,856 | | | | 79,304 | | | | 1.21 | % |
| | | | | | | | | | | | | | | | | | | | | | | | | | | | | | | | | | | | |
Debt securities in issue: | | | | | | | | | | | | | | | | | | | | | | | | | | | | | | | | | | | | |
Domestic offices | | | 5,336,930 | | | | 77,083 | | | | 1.44 | % | | | 4,873,726 | | | | 65,834 | | | | 1.35 | % | | | 4,783,157 | | | | 67,785 | | | | 1.42 | % |
Foreign offices | | | 820,798 | | | | 8,712 | | | | 1.06 | % | | | 595,205 | | | | 9,110 | | | | 1.53 | % | | | 431,283 | | | | 10,543 | | | | 2.44 | % |
| | | | | | | | | | | | | | | | | | | | | | | | | | | | | | | | | | | | |
Total | | | 6,157,728 | | | | 85,795 | | | | 1.39 | % | | | 5,468,931 | | | | 74,944 | | | | 1.37 | % | | | 5,214,440 | | | | 78,328 | | | | 1.50 | % |
| | | | | | | | | | | | | | | | | | | | | | | | | | | | | | | | | | | | |
Other interest-bearing liabilities: | | | | | | | | | | | | | | | | | | | | | | | | | | | | | | | | | | | | |
Domestic offices | | | 73,821 | | | | 672 | | | | 0.91 | % | | | 72,261 | | | | 635 | | | | 0.88 | % | | | 83,198 | | | | 1,977 | | | | 2.38 | % |
Foreign offices | | | 3,508 | | | | 82 | | | | 2.34 | % | | | 4,147 | | | | 76 | | | | 1.83 | % | | | 4,518 | | | | 34 | | | | 0.75 | % |
| | | | | | | | | | | | | | | | | | | | | | | | | | | | | | | | | | | | |
Total | | | 77,329 | | | | 754 | | | | 0.98 | % | | | 76,408 | | | | 711 | | | | 0.93 | % | | | 87,716 | | | | 2,011 | | | | 2.29 | % |
| | | | | | | | | | | | | | | | | | | | | | | | | | | | | | | | | | | | |
Total interest-bearing liabilities: | | | | | | | | | | | | | | | | | | | | | | | | | | | | | | | | | | | | |
Domestic offices | | | 91,988,868 | | | | 215,324 | | | | 0.23 | % | | | 88,147,368 | | | | 227,298 | | | | 0.26 | % | | | 81,412,998 | | | | 259,352 | | | | 0.32 | % |
Foreign offices | | | 12,019,517 | | | | 98,307 | | | | 0.82 | % | | | 10,339,226 | | | | 83,758 | | | | 0.81 | % | | | 11,396,783 | | | | 87,458 | | | | 0.77 | % |
| | | | | | | | | | | | | | | | | | | | | | | | | | | | | | | | | | | | |
Total | | ¥ | 104,008,385 | | | | 313,631 | | | | 0.30 | % | | ¥ | 98,486,594 | | | | 311,056 | | | | 0.32 | % | | ¥ | 92,809,781 | | | | 346,810 | | | | 0.37 | % |
| | | | | | | | | | | | | | | | | | | | | | | | | | | | | | | | | | | | |
Net interest income and interest rate spread | | | | | | ¥ | 1,396,700 | | | | 1.22 | % | | | | | | ¥ | 1,409,125 | | | | 1.30 | % | | | | | | ¥ | 1,419,237 | | | | 1.42 | % |
| | | | | | | | | | | | | | | | | | | | | | | | | | | | | | | | | | | | |
| (1) | Taxable investment securities and non-taxable investment securities are not disclosed separately because the aggregate effect of these average balances and interest income would not be material. In addition, the yields on tax-exempt obligations have not been calculated on a tax equivalent basis because the effect of such calculation would not be material. |
| (2) | Loans and advances include impaired loans and advances. The amortized portion of net loan origination fees is included in interest income on loans and advances. |
| (3) | Average balances are generally based on a daily average. Weekly, month-end or quarter-end averages are used for certain average balances where it is not practical to obtain applicable daily averages. The allocations of amounts between domestic and foreign are based on the location of the office. |
66
The following tables show changes in our net interest income based on changes in volume and changes in rate for the fiscal year ended March 31, 2012 compared to the fiscal year ended March 31, 2011, and those for the fiscal year ended March 31, 2011 compared to the fiscal year ended March 31, 2010:
| | | | | | | | | | | | | | | | | | | | | | | | |
| | | Fiscal year ended March 31, 2012
compared to
fiscal year ended March 31, 2011
Increase / (decrease) | | | Fiscal year ended March 31, 2011
compared to
fiscal year ended March 31, 2010
Increase / (decrease) | |
| | | Volume | | | Rate | | | Net change | | | Volume | | | Rate | | | Net change | |
| | | (In millions) | |
Interest income: | | | | | | | | | | | | | | | | | | | | | | | | |
Interest-earning deposits with other banks: | | | | | | | | | | | | | | | | | | | | | | | | |
Domestic offices | | ¥ | (25 | ) | | ¥ | 483 | | | ¥ | 458 | | | ¥ | 305 | | | ¥ | (166 | ) | | ¥ | 139 | |
Foreign offices | | | 10,298 | | | | (1,065 | ) | | | 9,233 | | | | 1,193 | | | | 2,540 | | | | 3,733 | |
| | | | | | | | | | | | | | | | | | | | | | | | |
Total | | | 10,273 | | | | (582 | ) | | | 9,691 | | | | 1,498 | | | | 2,374 | | | | 3,872 | |
| | | | | | | | | | | | | | | | | | | | | | | | |
Call loans and bills bought: | | | | | | | | | | | | | | | | | | | | | | | | |
Domestic offices | | | (88 | ) | | | (83 | ) | | | (171 | ) | | | 99 | | | | (347 | ) | | | (248 | ) |
Foreign offices | | | 272 | | | | 4,975 | | | | 5,247 | | | | (106 | ) | | | 2,176 | | | | 2,070 | |
| | | | | | | | | | | | | | | | | | | | | | | | |
Total | | | 184 | | | | 4,892 | | | | 5,076 | | | | (7 | ) | | | 1,829 | | | | 1,822 | |
| | | | | | | | | | | | | | | | | | | | | | | | |
Reverse repurchase agreements and cash collateral on securities borrowed: | | | | | | | | | | | | | | | | | | | | | | | | |
Domestic offices | | | (819 | ) | | | (1,380 | ) | | | (2,199 | ) | | | 5,372 | | | | (2,735 | ) | | | 2,637 | |
Foreign offices | | | 3,749 | | | | (77 | ) | | | 3,672 | | | | 1,601 | | | | (28 | ) | | | 1,573 | |
| | | | | | | | | | | | | | | | | | | | | | | | |
Total | | | 2,930 | | | | (1,457 | ) | | | 1,473 | | | | 6,973 | | | | (2,763 | ) | | | 4,210 | |
| | | | | | | | | | | | | | | | | | | | | | | | |
Held-to-maturity investments: | | | | | | | | | | | | | | | | | | | | | | | | |
Domestic offices | | | 9,009 | | | | (3,743 | ) | | | 5,266 | | | | 8,104 | | | | (4,259 | ) | | | 3,845 | |
| | | | | | | | | | | | | | | | | | | | | | | | |
Available-for-sale financial assets: | | | | | | | | | | | | | | | | | | | | | | | | |
Domestic offices | | | 18,573 | | | | (38,376 | ) | | | (19,803 | ) | | | 36,198 | | | | (37,426 | ) | | | (1,228 | ) |
Foreign offices | | | (3,742 | ) | | | 1,501 | | | | (2,241 | ) | | | 1,702 | | | | (445 | ) | | | 1,257 | |
| | | | | | | | | | | | | | | | | | | | | | | | |
Total | | | 14,831 | | | | (36,875 | ) | | | (22,044 | ) | | | 37,900 | | | | (37,871 | ) | | | 29 | |
| | | | | | | | | | | | | | | | | | | | | | | | |
Loans and advances: | | | | | | | | | | | | | | | | | | | | | | | | |
Domestic offices | | | (29,327 | ) | | | (28,480 | ) | | | (57,807 | ) | | | (20,342 | ) | | | (14,685 | ) | | | (35,027 | ) |
Foreign offices | | | 47,885 | | | | 610 | | | | 48,495 | | | | (18,749 | ) | | | (5,868 | ) | | | (24,617 | ) |
| | | | | | | | | | | | | | | | | | | | | | | | |
Total | | | 18,558 | | | | (27,870 | ) | | | (9,312 | ) | | | (39,091 | ) | | | (20,553 | ) | | | (59,644 | ) |
| | | | | | | | | | | | | | | | | | | | | | | | |
Total interest income: | | | | | | | | | | | | | | | | | | | | | | | | |
Domestic offices | | | (2,677 | ) | | | (71,579 | ) | | | (74,256 | ) | | | 29,736 | | | | (59,618 | ) | | | (29,882 | ) |
Foreign offices | | | 58,462 | | | | 5,944 | | | | 64,406 | | | | (14,359 | ) | | | (1,625 | ) | �� | | (15,984 | ) |
| | | | | | | | | | | | | | | | | | | | | | | | |
Total | | ¥ | 55,785 | | | ¥ | (65,635 | ) | | ¥ | (9,850 | ) | | ¥ | 15,377 | | | ¥ | (61,243 | ) | | ¥ | (45,866 | ) |
| | | | | | | | | | | | | | | | | | | | | | | | |
67
| | | | | | | | | | | | | | | | | | | | | | | | |
| | | Fiscal year ended March 31, 2012
compared to
fiscal year ended March 31, 2011
Increase / (decrease) | | | Fiscal year ended March 31, 2011
compared to
fiscal year ended March 31, 2010
Increase / (decrease) | |
| | | Volume | | | Rate | | | Net change | | | Volume | | | Rate | | | Net change | |
| | | (In millions) | |
Interest expense: | | | | | | | | | | | | | | | | | | | | | | | | |
Deposits: | | | | | | | | | | | | | | | | | | | | | | | | |
Domestic offices | | ¥ | 1,669 | | | ¥ | (18,508 | ) | | ¥ | (16,839 | ) | | ¥ | 4,858 | | | ¥ | (45,384 | ) | | ¥ | (40,526 | ) |
Foreign offices | | | 10,092 | | | | 1,726 | | | | 11,818 | | | | (3,577 | ) | | | 5,213 | | | | 1,636 | |
| | | | | | | | | | | | | | | | | | | | | | | | |
Total | | | 11,761 | | | | (16,782 | ) | | | (5,021 | ) | | | 1,281 | | | | (40,171 | ) | | | (38,890 | ) |
| | | | | | | | | | | | | | | | | | | | | | | | |
Call money and bills sold: | | | | | | | | | | | | | | | | | | | | | | | | |
Domestic offices | | | (218 | ) | | | (384 | ) | | | (602 | ) | | | (348 | ) | | | (341 | ) | | | (689 | ) |
Foreign offices | | | 232 | | | | 95 | | | | 327 | | | | (3,373 | ) | | | 1,653 | | | | (1,720 | ) |
| | | | | | | | | | | | | | | | | | | | | | | | |
Total | | | 14 | | | | (289 | ) | | | (275 | ) | | | (3,721 | ) | | | 1,312 | | | | (2,409 | ) |
| | | | | | | | | | | | | | | | | | | | | | | | |
Repurchase agreements and cash collateral on securities lent: | | | | | | | | | | | | | | | | | | | | | | | | |
Domestic offices | | | (307 | ) | | | (1,213 | ) | | | (1,520 | ) | | | 3,053 | | | | (475 | ) | | | 2,578 | |
Foreign offices | | | 176 | | | | 306 | | | | 482 | | | | 624 | | | | 856 | | | | 1,480 | |
| | | | | | | | | | | | | | | | | | | | | | | | |
Total | | | (131 | ) | | | (907 | ) | | | (1,038 | ) | | | 3,677 | | | | 381 | | | | 4,058 | |
| | | | | | | | | | | | | | | | | | | | | | | | |
Borrowings: | | | | | | | | | | | | | | | | | | | | | | | | |
Domestic offices | | | 16,418 | | | | (20,717 | ) | | | (4,299 | ) | | | 22,183 | | | | (12,307 | ) | | | 9,876 | |
Foreign offices | | | (3,965 | ) | | | 6,279 | | | | 2,314 | | | | (734 | ) | | | (2,971 | ) | | | (3,705 | ) |
| | | | | | | | | | | | | | | | | | | | | | | | |
Total | | | 12,453 | | | | (14,438 | ) | | | (1,985 | ) | | | 21,449 | | | | (15,278 | ) | | | 6,171 | |
| | | | | | | | | | | | | | | | | | | | | | | | |
Debt securities in issue: | | | | | | | | | | | | | | | | | | | | | | | | |
Domestic offices | | | 6,498 | | | | 4,751 | | | | 11,249 | | | | 1,266 | | | | (3,217 | ) | | | (1,951 | ) |
Foreign offices | | | 2,866 | | | | (3,264 | ) | | | (398 | ) | | | 3,252 | | | | (4,685 | ) | | | (1,433 | ) |
| | | | | | | | | | | | | | | | | | | | | | | | |
Total | | | 9,364 | | | | 1,487 | | | | 10,851 | | | | 4,518 | | | | (7,902 | ) | | | (3,384 | ) |
| | | | | | | | | | | | | | | | | | | | | | | | |
Other interest-bearing liabilities: | | | | | | | | | | | | | | | | | | | | | | | | |
Domestic offices | | | 14 | | | | 23 | | | | 37 | | | | (232 | ) | | | (1,110 | ) | | | (1,342 | ) |
Foreign offices | | | (13 | ) | | | 19 | | | | 6 | | | | (3 | ) | | | 45 | | | | 42 | |
| | | | | | | | | | | | | | | | | | | | | | | | |
Total | | | 1 | | | | 42 | | | | 43 | | | | (235 | ) | | | (1,065 | ) | | | (1,300 | ) |
| | | | | | | | | | | | | | | | | | | | | | | | |
Total interest expense: | | | | | | | | | | | | | | | | | | | | | | | | |
Domestic offices | | | 24,074 | | | | (36,048 | ) | | | (11,974 | ) | | | 30,780 | | | | (62,834 | ) | | | (32,054 | ) |
Foreign offices | | | 9,388 | | | | 5,161 | | | | 14,549 | | | | (3,811 | ) | | | 111 | | | | (3,700 | ) |
| | | | | | | | | | | | | | | | | | | | | | | | |
Total | | | 33,462 | | | | (30,887 | ) | | | 2,575 | | | | 26,969 | | | | (62,723 | ) | | | (35,754 | ) |
| | | | | | | | | | | | | | | | | | | | | | | | |
Net interest income: | | | | | | | | | | | | | | | | | | | | | | | | |
Domestic offices | | | (26,751 | ) | | | (35,531 | ) | | | (62,282 | ) | | | (1,044 | ) | | | 3,216 | | | | 2,172 | |
Foreign offices | | | 49,074 | | | | 783 | | | | 49,857 | | | | (10,548 | ) | | | (1,736 | ) | | | (12,284 | ) |
| | | | | | | | | | | | | | | | | | | | | | | | |
Total | | ¥ | 22,323 | | | ¥ | (34,748 | ) | | ¥ | (12,425 | ) | | ¥ | (11,592 | ) | | ¥ | 1,480 | | | ¥ | (10,112 | ) |
| | | | | | | | | | | | | | | | | | | | | | | | |
Fiscal Year Ended March 31, 2012 Compared to Fiscal Year Ended March 31, 2011
Interest Income
Our interest income decreased by ¥9,850 million, or 1%, from ¥1,720,181 million for the fiscal year ended March 31, 2011 to ¥1,710,331 million for the fiscal year ended March 31, 2012. This decrease reflected decreases in interest income from investment securities, including available-for-sale financial assets and held-to-maturity investments, and loans and advances. Interest income from investment securities decreased by
68
¥16,778 million, or 11%, from ¥154,731 million for the fiscal year ended March 31, 2011 to ¥137,953 million for the fiscal year ended March 31, 2012, due to a decline in average rates. Interest income on loans and advances decreased by ¥9,312 million, or 1%, from ¥1,524,062 million for the fiscal year ended March 31, 2011 to ¥1,514,750 million for the fiscal year ended March 31, 2012, mainly due to a decrease in both average balance and rates at our domestic offices, reflecting weak financing needs of domestic companies and the sluggish housing market.
Interest Expense
Our interest expense increased by ¥2,575 million, or 1%, from ¥311,056 million for the fiscal year ended March 31, 2011 to ¥313,631 million for the fiscal year ended March 31, 2012, due primarily to an increase in interest expense on debt securities in issue, which was partially offset by a decrease in interest expense on deposits. Interest expense on debt securities in issue increased by ¥10,851 million, or 14%, from ¥74,944 million for the fiscal year ended March 31, 2011 to ¥85,795 million for the fiscal year ended March 31, 2012, due primarily to an increase of senior bonds issued for foreign currency funding. Our interest expense on deposits decreased by ¥5,021 million, or 4%, from ¥134,484 million for the fiscal year ended March 31, 2011 to ¥129,463 million for the fiscal year ended March 31, 2012, due primarily to a decline in domestic interest rates.
Net Interest Income
Our net interest income decreased by ¥12,425 million, or 1%, from ¥1,409,125 million for the fiscal year ended March 31, 2011 to ¥1,396,700 million for the fiscal year ended March 31, 2012. The decrease in our net interest income was due primarily to a decrease in interest income on loans and advances and investment securities, and an increase in interest expense on debt securities in issues.
On an average rate basis, from the fiscal year ended March 31, 2011 to March 31, 2012, loans and advances at domestic offices decreased by 0.04 percentage point from 2.01% to 1.97% and loans and advances at foreign offices increased by 0.01 percentage point from 2.49% to 2.50%, resulting in the total for loans and advances decreasing by 0.02 percentage point from 2.07% to 2.05%. On an average rate basis, deposits at domestic offices decreased by 0.03 percentage point from 0.12% to 0.09%, while deposits at foreign offices increased by 0.02 percentage point from 0.67% to 0.69%, resulting in the total for deposits decreasing by 0.02 percentage point from 0.18% to 0.16%.
Fiscal Year Ended March 31, 2011 Compared to Fiscal Year Ended March 31, 2010
Interest Income
Our interest income decreased by ¥45,866 million, or 3%, from ¥1,766,047 million for the fiscal year ended March 31, 2010 to ¥1,720,181 million for the fiscal year ended March 31, 2011. This decrease principally reflected decreases in interest on loans and advances. Our interest on loans and advances decreased by ¥59,644 million, or 4%, from ¥1,583,706 million for the fiscal year ended March 31, 2010 to ¥1,524,062 million for the fiscal year ended March 31, 2011, due to a decrease in the balance of loans and advances as well as a decline in market interest rates. Interest from investment securities increased by ¥3,874 million, or 3%, from ¥150,857 million for the fiscal year ended March 31, 2010 to ¥154,731 million for the fiscal year ended March 31, 2011. The increase in interest from investment securities was due primarily to an increase in investment in bonds as a result of limited demand for funding in Japan.
Interest Expense
Our interest expense decreased by ¥35,754 million, or 10%, from ¥346,810 million for the fiscal year ended March 31, 2010 to ¥311,056 million for the fiscal year ended March 31, 2011, due primarily to a decrease in interest expense on deposits. Our interest expense on deposits decreased by ¥38,890 million, or 22%, from
69
¥173,374 million for the fiscal year ended March 31, 2010 to ¥134,484 million for the fiscal year ended March 31, 2011, due primarily to a decline of interest rates in Japan.
Net Interest Income
Our net interest income decreased by ¥10,112 million, or 1%, from ¥1,419,237 million for the fiscal year ended March 31, 2010 to ¥1,409,125 million for the fiscal year ended March 31, 2011. The decrease in our net interest income was due primarily to a decrease in interest income on loans and advances, of which ¥39,091 million is attributable to the decrease in volume and ¥20,553 million is attributable to the decline in market interest rates, which was offset by an increase of interest income on investment securities and a decrease in interest expense on deposits.
On an average rate basis, from the fiscal year ended March 31, 2010 to March 31, 2011, loans and advances at domestic offices decreased by 0.02 percentage point from 2.03% to 2.01% and loans and advances at foreign offices decreased by 0.06 percentage point from 2.55% to 2.49%, resulting in the total for loans and advances decreasing by 0.04 percentage point from 2.11% to 2.07%. On an average rate basis, deposits at domestic offices decreased by 0.06 percentage point from 0.18% to 0.12%, while deposits at foreign offices increased by 0.06 percentage point from 0.61% to 0.67%, resulting in the total for deposits decreasing by 0.05 percentage point from 0.23% to 0.18%.
Net Fee and Commission Income
The following table sets forth the breakdown of our net fee and commission income for the periods shown:
| | | | | | | | | | | | |
| | | For the fiscal year ended March 31, | |
| | | 2012 | | | 2011 | | | 2010 | |
| | | (In millions) | |
Fee and commission income from: | | | | | | | | | | | | |
Loans | | ¥ | 83,919 | | | ¥ | 75,860 | | | ¥ | 81,174 | |
Credit card business | | | 210,449 | | | | 181,160 | | | | 143,987 | |
Guarantees | | | 41,059 | | | | 28,779 | | | | 11,823 | |
Securities-related business | | | 80,965 | | | | 61,467 | | | | 43,164 | |
Deposits | | | 16,802 | | | | 16,256 | | | | 15,819 | |
Remittances and transfers | | | 125,796 | | | | 126,916 | | | | 124,917 | |
Safe deposits | | | 6,324 | | | | 6,508 | | | | 6,685 | |
Trust fees | | | 1,373 | | | | 2,328 | | | | 1,779 | |
Investment trusts | | | 142,941 | | | | 163,708 | | | | 96,258 | |
Agency | | | 18,897 | | | | 18,056 | | | | 14,763 | |
Others | | | 140,882 | | | | 125,666 | | | | 110,068 | |
| | | | | | | | | | | | |
Total fee and commission income | | | 869,407 | | | | 806,704 | | | | 650,437 | |
| | | | | | | | | | | | |
Fee and commission expense from: | | | | | | | | | | | | |
Remittances and transfers | | | 33,114 | | | | 34,062 | | | | 31,086 | |
Guarantees | | | 18,487 | | | | 21,645 | | | | 16,268 | |
Others | | | 80,961 | | | | 76,853 | | | | 74,362 | |
| | | | | | | | | | | | |
Total fee and commission expense | | | 132,562 | | | | 132,560 | | | | 121,716 | |
| | | | | | | | | | | | |
Net fee and commission income | | ¥ | 736,845 | | | ¥ | 674,144 | | | ¥ | 528,721 | |
| | | | | | | | | | | | |
70
Fiscal Year Ended March 31, 2012 Compared to Fiscal Year Ended March 31, 2011
Fee and commission income increased by ¥62,703 million, or 8%, from ¥806,704 million for the fiscal year ended March 31, 2011 to ¥869,407 million for the fiscal year ended March 31, 2012. Primary sources of fee and commission income are fees obtained through our credit card business, investment trust sales commissions, remittance and transfer fees, fees obtained through securities-related business, and commissions in relation to loan transactions. The fees related to credit card business increased, due to the inclusion of the full year impact of Cedyna. Those fees related to guarantees also increased due mainly to the inclusion of guarantee fees at SMBC Consumer Finance, which became our consolidated subsidiary in December 2011. The increase was partially offset by a decrease in the commissions from investment trust sales mainly due to the contraction of the Japanese economy coupled with the aftermath of the Great East Japan Earthquake, the appreciation of the yen, sinking global stock markets, and the steady low-interest rate.
Fee and commission expense was ¥132,562 million for the fiscal year ended March 31, 2012, increased slightly from ¥132,560 million for the fiscal year ended March 31, 2011.
As a result, net fee and commission income increased by ¥62,701 million, or 9%, from ¥674,144 million for the fiscal year ended March 31, 2011 to ¥736,845 million for the fiscal year ended March 31, 2012.
Fiscal Year Ended March 31, 2011 Compared to Fiscal Year Ended March 31, 2010
Fee and commission income increased by ¥156,267 million, or 24%, from ¥650,437 million for the fiscal year ended March 31, 2010 to ¥806,704 million for the fiscal year ended March 31, 2011. The commissions from investment trusts sales markedly increased due to increased sales of investment trusts to individual retail customers at the Bank and the inclusion of the full year impact of SMBC Nikko Securities, which also contributed to the fee increases for securities-related businesses. The fees related to credit card and guarantees also increased, due to the acquisition of Cedyna in May 2010.
Fee and commission expense was ¥132,560 million for the fiscal year ended March 31, 2011, increased slightly from ¥121,716 million for the fiscal year ended March 31, 2010.
As a result, net fee and commission income increased by ¥145,423 million, or 28%, from ¥528,721 million for the fiscal year ended March 31, 2010 to ¥674,144 million for the fiscal year ended March 31, 2011.
71
Net Income from Trading, Financial Assets at Fair Value Through Profit or Loss and Investment Securities
The following table sets forth our net income from trading and financial assets at fair value through profit or loss and investment securities for the periods shown:
| | | | | | | | | | | | |
| | | For the fiscal year ended March 31, | |
| | | 2012 | | | 2011 | | | 2010 | |
| | | (In millions) | |
Net trading income: | | | | | | | | | | | | |
Interest rate | | ¥ | 131,736 | | | ¥ | 205,102 | | | ¥ | 106,562 | |
Foreign exchange | | | 37,951 | | | | 104,037 | | | | 104,929 | |
Equity | | | 14,790 | | | | 17,243 | | | | 36,969 | |
Credit | | | (1,907 | ) | | | (2,543 | ) | | | 53,203 | |
Others(1) | | | (274 | ) | | | 640 | | | | 28,467 | |
| | | | | | | | | | | | |
Total net trading income | | ¥ | 182,296 | | | ¥ | 324,479 | | | ¥ | 330,130 | |
| | | | | | | | | | | | |
Net income from financial assets at fair value through profit or loss: | | | | | | | | | | | | |
Net income from debt instruments | | ¥ | 34,334 | | | ¥ | 29,150 | | | ¥ | 65,403 | |
Net income (loss) from equity instruments | | | (600 | ) | | | 966 | | | | 10,176 | |
| | | | | | | | | | | | |
Total net income from financial assets at fair value through profit or loss | | ¥ | 33,734 | | | ¥ | 30,116 | | | ¥ | 75,579 | |
| | | | | | | | | | | | |
Net investment income: | | | | | | | | | | | | |
Net gain from disposal of debt instruments | | ¥ | 149,484 | | | ¥ | 141,982 | | | ¥ | 61,541 | |
Net gain from disposal of equity instruments | | | 11,657 | | | | 20,779 | | | | 58,627 | |
Dividend income | | | 78,224 | | | | 73,150 | | | | 58,384 | |
| | | | | | | | | | | | |
Total net investment income | | ¥ | 239,365 | | | ¥ | 235,911 | | | ¥ | 178,552 | |
| | | | | | | | | | | | |
| (1) | Others for the fiscal year ended March 31, 2010 includes the change in fair value of the derivative embedded in the Type 4 preferred stock. |
Fiscal Year Ended March 31, 2012 Compared to Fiscal Year Ended March 31, 2011
Net trading income decreased by ¥142,183 million from ¥324,479 million for the fiscal year ended March 31, 2011 to ¥182,296 million for the fiscal year ended March 31, 2012 due primarily to a decrease in net trading income from interest rate transactions and foreign exchange transactions.
Net income from financial assets at fair value through profit or loss increased by ¥3,618 million from ¥30,116 million for the fiscal year ended March 31, 2011 to ¥33,734 million for the fiscal year ended March 31, 2012 due primarily to an increase in the fair value of debt instruments.
Net investment income slightly increased by ¥3,454 million from ¥235,911 million for the fiscal year ended March 31, 2011 to ¥239,365 million for the fiscal year ended March 31, 2012.
The total of net trading income, net income from financial assets at fair value through profit or loss and net investment income decreased by ¥135,111 million from ¥590,506 million for the fiscal year ended March 31, 2011 to ¥455,395 million for the fiscal year ended March 31, 2012. The decrease in net trading income was partly offset by an increase in net income from financial assets at fair value through profit or loss.
72
Fiscal Year Ended March 31, 2011 Compared to Fiscal Year Ended March 31, 2010
Net trading income was ¥324,479 million for the fiscal year ended March 31, 2011. The trading income related to interest rate transactions increased whereas net trading income from equity, credit and others decreased, which resulted in a slight decrease of ¥5,651 million from ¥330,130 million for the fiscal year ended March 31, 2010.
Net income from financial assets at fair value through profit or loss decreased by ¥45,463 million from ¥75,579 million for the fiscal year ended March 31, 2010 to ¥30,116 million for the fiscal year ended March 31, 2011 due primarily to a decrease in fair value gains on debt instruments.
Net investment income increased by ¥57,359 million from ¥178,552 million for the fiscal year ended March 31, 2010 to ¥235,911 million for the fiscal year ended March 31, 2011. This is primarily due to an increase in gains on sales of bonds by quickly responding to fluctuations in the market interest rates at the Bank.
The total of net trading income, net income from financial assets at fair value through profit or loss and net investment income increase slightly by ¥6,245 million from ¥584,261 million for the fiscal year ended March 31, 2010 to ¥590,506 million for the fiscal year ended March 31, 2011. The increase in net investment income was partly offset by a decrease in net trading income and net income from financial assets at fair value through profit or loss.
Other Income
The following table sets forth our other income for the periods shown:
| | | | | | | | | | | | |
| | | For the fiscal year ended March 31, | |
| | | 2012 | | | 2011 | | | 2010 | |
| | | (In millions) | |
Income from operating leases | | ¥ | 72,483 | | | ¥ | 63,199 | | | ¥ | 56,121 | |
Gains on disposal of assets leased | | | 24,977 | | | | 6,774 | | | | 10,344 | |
Income related to IT solution services | | | 39,648 | | | | 43,775 | | | | 44,319 | |
Gains on disposal of property, plant and equipment and other intangible assets | | | 2,741 | | | | 885 | | | | 17,179 | |
Reversal of impairment losses of investments in associates and joint ventures | | | 19,333 | | | | 13,533 | | | | 19,832 | |
Gains on step acquisition of subsidiaries | | | 27,491 | | | | 15,623 | | | | — | |
Others | | | 58,890 | | | | 60,681 | | | | 84,539 | |
| | | | | | | | | | | | |
Total other income | | ¥ | 245,563 | | | ¥ | 204,470 | | | ¥ | 232,334 | |
| | | | | | | | | | | | |
Fiscal Year Ended March 31, 2012 Compared to Fiscal Year Ended March 31, 2011
Other income increased by ¥41,093 million, or 20%, from ¥204,470 million for the fiscal year ended March 31, 2011 to ¥245,563 million for the fiscal year ended March 31, 2012. The increase in other income was due primarily to an increase in income from operating leases and gains on disposal of assets leased. Gains on step acquisition of subsidiaries for the fiscal year ended March 31, 2012 included gains related to the acquisition of SMBC Consumer Finance, which had been our associate and became our consolidated subsidiary in December 2011.
Fiscal Year Ended March 31, 2011 Compared to Fiscal Year Ended March 31, 2010
Other income decreased by ¥27,864 million, or 12%, from ¥232,334 million for the fiscal year ended March 31, 2010 to ¥204,470 million for the fiscal year ended March 31, 2011. The decrease in other income was
73
due primarily to a decrease in gains on disposal of property, plant and equipment and other intangible assets from the prior fiscal year when our subsidiaries sold fixed assets and reversal of impairment losses of investments in associates. The decrease was partially offset by gains on the step acquisition of Cedyna and other subsidiaries, and an increase in income from operating leases.
Impairment Charges on Financial Assets
The following table sets forth our impairment charges for the periods shown:
| | | | | | | | | | | | |
| | | For the fiscal year ended March 31, | |
| | | 2012 | | | 2011 | | | 2010 | |
| | | (In millions) | |
Loans and advances | | ¥ | 144,022 | | | ¥ | 259,292 | | | ¥ | 215,886 | |
Available-for-sale financial assets | | | 140,288 | | | | 174,636 | | | | 42,755 | |
| | | | | | | | | | | | |
Total impairment charges on financial assets | | ¥ | 284,310 | | | ¥ | 433,928 | | | ¥ | 258,641 | |
| | | | | | | | | | | | |
Fiscal Year Ended March 31, 2012 Compared to Fiscal Year Ended March 31, 2011
Our impairment charges on financial assets consist of losses relating to loans and advances, and investment securities.
In the first few months of the fiscal year ended March 31, 2012, the Japanese economy contracted in the aftermath of the Great East Japan Earthquake. The Japanese economy then gradually began to and continued to recover. In the second half of the fiscal year, there were some visible signs of improvement in the unemployment rate, and private consumption remained firm, in spite of deceleration of certain overseas economies coupled with the persistent strength of the Japanese yen against other currencies. The Nikkei 225 Index, which was ¥9,755.10 at March 31, 2011, recovered to ¥10,083.56 at March 31, 2012 in response to the strong U.S. stock market.
Impairment charges on loans and advances decreased by ¥115,270 million from ¥259,292 million for the fiscal year ended March 31, 2011 to ¥144,022 million for the fiscal year ended March 31, 2012. The decrease in impairment charges on loans and advances reflected not only the economic condition mentioned above but also our consistent implementation of consultative actions tailored to our borrowers’ businesses and financial condition. For detailed information on provision for loan losses, see “—Financial Condition—Allowance for Loan Losses.”
Impairment charges on available-for-sale financial assets decreased from ¥174,636 million for the fiscal year ended March 31, 2011 to ¥140,288 million for the fiscal year ended March 31, 2012. Most of the impairment charges on available-for-sale financial assets for the fiscal year ended March 31, 2012 were from publicly traded Japanese stocks.
In determining the amount of impairment charges, we consider whether there is objective evidence of impairment as a result of loss events, such as any significant financial difficulty of the issuer. Our assessments of issuers are focused by industry and geographical area taking into consideration the adverse impact of any specific issues including significant changes in the technological, market, economic or legal environment of the issuer indicating that the cost of our investment may not be recovered. Additionally, in the case of available-for-sale equity instruments, we consider a significant or prolonged decline in the fair value of the equity instruments below their cost.
For detailed information on our available-for-sale financial assets, which include a diversified portfolio of domestic equity securities, see “—Financial Condition—Investment Securities.”
74
Fiscal Year Ended March 31, 2011 Compared to Fiscal Year Ended March 31, 2010
Impairment charges for loans and advances increased by ¥43,406 million from ¥215,886 million for the fiscal year ended March 31, 2010 to ¥259,292 million for the fiscal year ended March 31, 2011. This increase was due primarily to the fact that although the global economy as a whole continued to recover during the fiscal year ended March 31, 2011, the Great East Japan Earthquake affected the credit quality of our loan portfolio. For detailed information on provision for loan losses, see “—Financial Condition—Allowance for Loan Losses.”
Impairment charges on available-for-sale financial assets increased from ¥42,755 million for the fiscal year ended March 31, 2010 to ¥174,636 million for the fiscal year ended March 31, 2011. The majority of the impairment charges for the fiscal year ended March 31, 2011 was from equity instruments and amounted to ¥165,764 million. The increase in impairment charges on available-for-sale equity instruments included the effect of the Great East Japan Earthquake.
General and Administrative Expenses
The following table sets forth a breakdown of our general and administrative expenses for the periods shown:
| | | | | | | | | | | | |
| | | For the fiscal year ended March 31, | |
| | | 2012 | | | 2011 | | | 2010 | |
| | | (In millions) | |
Personnel expenses | | ¥ | 612,512 | | | ¥ | 577,970 | | | ¥ | 511,075 | |
Depreciation and amortization | | | 121,611 | | | | 112,618 | | | | 107,054 | |
Rent and lease expenses | | | 105,196 | | | | 92,160 | | | | 77,715 | |
Building and maintenance expenses | | | 8,283 | | | | 10,186 | | | | 9,176 | |
Supplies expenses | | | 14,192 | | | | 15,135 | | | | 14,797 | |
Communication expenses | | | 34,170 | | | | 33,538 | | | | 23,939 | |
Publicity and advertising expenses | | | 41,957 | | | | 40,213 | | | | 35,315 | |
Taxes and dues | | | 56,582 | | | | 56,648 | | | | 51,020 | |
Outsourcing expenses | | | 85,196 | | | | 79,525 | | | | 68,715 | |
Premiums for deposit insurance | | | 59,600 | | | | 57,637 | | | | 53,799 | |
Office equipment expenses | | | 32,201 | | | | 29,234 | | | | 22,537 | |
Others | | | 195,205 | | | | 188,682 | | | | 121,815 | |
| | | | | | | | | | | | |
Total general and administrative expenses | | ¥ | 1,366,705 | | | ¥ | 1,293,546 | | | ¥ | 1,096,957 | |
| | | | | | | | | | | | |
Fiscal Year Ended March 31, 2012 Compared to Fiscal Year Ended March 31, 2011
General and administrative expenses increased by ¥73,159 million, or 6%, from ¥1,293,546 million for the fiscal year ended March 31, 2011 to ¥1,366,705 million for the fiscal year ended March 31, 2012, due mainly to the expansion of business including overseas operations, the depreciation of past information technology investments and facility investments, the inclusion of the full year impact of Cedyna’s general and administrative expenses and the inclusion of general and administrative expenses of SMBC Consumer Finance, which became our consolidated subsidiary in December 2011.
Fiscal Year Ended March 31, 2011 Compared to Fiscal Year Ended March 31, 2010
General and administrative expenses increased by ¥196,589 million, or 18%, from ¥1,096,957 million for the fiscal year ended March 31, 2010 to ¥1,293,546 million for the fiscal year ended March 31, 2011, due mainly to the inclusion of the full year impact of SMBC Nikko Securities, which became a subsidiary in October 2009, the acquisition of Cedyna in May 2010, and an increase in rent and lease expenses.
75
Other Expenses
The following table sets forth our other expenses for the periods shown:
| | | | | | | | | | | | |
| | | For the fiscal year ended March 31, | |
| | | 2012 | | | 2011 | | | 2010 | |
| | | (In millions) | |
Cost of operating leases | | ¥ | 46,278 | | | ¥ | 36,652 | | | ¥ | 30,487 | |
Losses on disposal of assets leased | | | 20,678 | | | | 2,599 | | | | 6,948 | |
Cost related to IT solution services | | | 98,914 | | | | 95,625 | | | | 95,342 | |
Losses on disposal of property, plant and equipment and other intangible assets | | | 6,541 | | | | 5,813 | | | | 4,497 | |
Impairment losses of property, plant and equipment | | | 3,757 | | | | 5,360 | | | | 9,899 | |
Impairment losses of intangible assets | | | 1,989 | | | | 59 | | | | 6,184 | |
Losses on sale of investments in subsidiaries and associates | | | 439 | | | | 138 | | | | 9,412 | |
Impairment losses of investments in associates and joint ventures | | | 656 | | | | 16,837 | | | | 18,134 | |
Others | | | 60,040 | | | | 49,209 | | | | 55,857 | |
| | | | | | | | | | | | |
Total other expenses | | ¥ | 239,292 | | | ¥ | 212,292 | | | ¥ | 236,760 | |
| | | | | | | | | | | | |
Fiscal Year Ended March 31, 2012 Compared to Fiscal Year Ended March 31, 2011
Other expenses increased by ¥27,000 million, or 13%, from ¥212,292 million for the fiscal year ended March 31, 2011 to ¥239,292 million for the fiscal year ended March 31, 2012, due primarily to an increase in cost of operating leases and losses on disposal of assets, partially offset by a decrease in impairment losses of investments in associates and joint ventures.
Fiscal Year Ended March 31, 2011 Compared to Fiscal Year Ended March 31, 2010
Other expenses decreased by ¥24,468 million, or 10%, from ¥236,760 million for the fiscal year ended March 31, 2010 to ¥212,292 million for the fiscal year ended March 31, 2011, due primarily to a decrease in losses on sale of investments in subsidiaries and associates, a decrease in impairment losses of property, plant and equipment of subsidiaries, and a decrease in impairment losses of intangible assets.
Share of Post-tax Loss of Associates and Joint Ventures
Fiscal Year Ended March 31, 2012 Compared to Fiscal Year Ended March 31, 2011
Share of post-tax loss of associates and joint ventures was ¥25,004 million for the fiscal year ended March 31, 2012, an increase of ¥19,208 million, from ¥5,796 million for the fiscal year ended March 31, 2011 due mainly to net loss of our consumer finance associate resulting from its increase in its provisions for interest repayment.
Fiscal Year Ended March 31, 2011 Compared to Fiscal Year Ended March 31, 2010
Share of post-tax loss of associates and joint ventures was ¥5,796 million for the fiscal year ended March 31, 2011, a decrease of ¥31,665 million, from ¥37,461 million for the fiscal year ended March 31, 2010 due mainly to not recognizing our shares of the profit or loss of some associates which changed from being our equity-method associates to our subsidiaries for the fiscal year ended March 31, 2011.
76
Income Tax Expense
Fiscal Year Ended March 31, 2012 Compared to Fiscal Year Ended March 31, 2011
Income tax expense increased by ¥100,029 million from ¥361,165 million for the fiscal year ended March 31, 2011 to ¥461,194 million for the fiscal year ended March 31, 2012. The increase of income tax expense is due mainly to an increase in deferred tax expense associated with a decrease of net deferred tax assets which resulted from changes in Japanese corporation tax rates.
On December 2, 2011, the Government of Japan promulgated (i) an amendment to the Corporation Tax Act and (ii) the Act on Special Measures Concerning Securing Necessary Financial Resources for Funding the Restoration from the Great East Japan Earthquake. Those laws will (i) reduce the Japanese national corporation tax rate by 4.5 percentage points from fiscal years beginning on or after April 1, 2012 but (ii) impose a 10% corporation surtax, i.e., an additional tax to be paid calculated as 10% of the corporation tax payable after the 4.5-percentage-point rate reduction, during the three fiscal years beginning on or after April 1, 2012 through to March 31, 2015. As a result, the effective statutory tax rate (including local taxes) of SMFG (currently 40.7%) would be reduced by approximately 2.7 percentage points during the three fiscal years beginning April 1, 2012 and by approximately 5.1 percentage points for the fiscal years beginning April 1, 2015.
We measured deferred tax assets and deferred tax liabilities at the tax rates that are expected to apply to the period when the assets are realized or the liabilities are settled, based on the tax rates that have been enacted or are substantively enacted at March 31, 2012. Accordingly, the tax rate reduction increased deferred tax expense for the fiscal year ended March 31, 2012.
Fiscal Year Ended March 31, 2011 Compared to Fiscal Year Ended March 31, 2010
Income tax expense decreased by ¥126,876 million from an expense of ¥488,041 million for the fiscal year ended March 31, 2010 to an expense of ¥361,165 million for the fiscal year ended March 31, 2011 due mainly to a decrease of profit before tax.
Business Segment Analysis
Our business segment information is based on the internal reporting system utilized by our management to assess the performance of our business segments under Japanese GAAP. We have four main business segments: Commercial Banking, Securities, Leasing and Credit Card, with the remaining operations recorded in Others. The commercial banking segment includes the Bank, which accounts for a major portion of our total assets and revenue, other domestic banking subsidiaries, such as Kansai Urban Banking Corporation, The Minato Bank and The Japan Net Bank, as well as foreign banking subsidiaries, such as SMBC Europe, SMBC (China) and Manufacturers Bank. We have SMBC Nikko Securities and SMBC Friend Securities in the securities segment, Sumitomo Mitsui Finance and Leasing in the leasing segment and Sumitomo Mitsui Card and Cedyna in the credit card segment. Since the Bank has a significant impact on our overall performance, its performance is reported to management in more detail by dividing the Bank’s performance into five business units by customer market: the Consumer Banking Unit, the Middle Market Banking Unit, the Corporate Banking Unit, the International Banking Unit and the Treasury Unit. In addition to the five business units, the Bank also has several cross-sectional units and departments. The revenues and expenses of these units and departments are in principal allocated to each business unit. Organizational charts of SMFG and the Bank are provided in “Item 4.C. Organizational Structure.” Since figures reported to management are prepared under Japanese GAAP, the segment information does not agree to figures in the consolidated financial statements under IFRS. This difference is addressed in “Segment Analysis—Reconciliation of Segmental Results of Operation to Consolidated Income Statement” of Note 4 to our consolidated financial statements included elsewhere in this annual report.
77
Segmental Results of Operations
For the fiscal year ended March 31, 2012:
| | | | | | | | | | | | | | | | | | | | | | | | | | | | | | | | |
| | | Commercial Banking | |
| | SMBC | | | Total(3) | |
| | | Consumer
Banking
Unit | | | Middle
Market
Banking
Unit | | | Corporate
Banking
Unit | | | International
Banking
Unit | | | Treasury
Unit | | | Others | | | SMBC Total | | | | |
| | | (In billions) | |
Gross profit | | ¥ | 383.7 | | | ¥ | 422.9 | | | ¥ | 212.6 | | | ¥ | 197.4 | | | ¥ | 319.3 | | | ¥ | (3.4 | ) | | ¥ | 1,532.5 | | | ¥ | 1,763.9 | |
Net interest income | | | 326.9 | | | | 256.8 | | | | 136.6 | | | | 111.6 | | | | 123.1 | | | | 1.9 | | | | 956.9 | | | | 1,113.5 | |
Net non-interest income | | | 56.8 | | | | 166.1 | | | | 76.0 | | | | 85.8 | | | | 196.2 | | | | (5.3 | ) | | | 575.6 | | | | 650.4 | |
General and administrative expenses | | | (289.5 | ) | | | (222.8 | ) | | | (38.2 | ) | | | (64.9 | ) | | | (19.2 | ) | | | (84.9 | ) | | | (719.5 | ) | | | (851.3 | ) |
Other profit (loss)(1) | | | — | | | | — | | | | — | | | | — | | | | — | | | | — | | | | — | | | | (20.5 | ) |
| | | | | | | | | | | | | | | | | | | | | | | | | | | | | | | | |
Consolidated net business profit(2)(5) | | ¥ | 94.2 | | | ¥ | 200.1 | | | ¥ | 174.4 | | | ¥ | 132.5 | | | ¥ | 300.1 | | | ¥ | (88.3 | ) | | ¥ | 813.0 | | | ¥ | 892.1 | |
| | | | | | | | | | | | | | | | | | | | | | | | | | | | | | | | |
| | | | | | | | | | | | | | | | | | | | | | | | | | | | | | | | | | | | | | | | |
| | | Securities | | | Leasing | | | Credit Card | | | Others | | | Total | |
| | | SMBC
Nikko
Securities | | | SMBC
Friend
Securities | | | Total(3) | | | Sumitomo
Mitsui
Finance &
Leasing | | | Total(3) | | | Sumitomo
Mitsui
Card | | | Cedyna | | | Total(3) | | | | | | | |
| | | (In billions) | |
Gross profit | | ¥ | 221.3 | | | ¥ | 47.4 | | | ¥ | 277.9 | | | ¥ | 88.5 | | | ¥ | 93.8 | | | ¥ | 179.3 | | | ¥ | 160.1 | | | ¥ | 345.9 | | | ¥ | 128.6 | | | ¥ | 2,610.1 | |
Net interest income | | | (2.5 | ) | | | 0.5 | | | | (0.7 | ) | | | 55.8 | | | | 54.8 | | | | 18.5 | | | | 36.4 | | | | 56.8 | | | | 125.1 | | | | 1,349.5 | |
Net non-interest income | | | 223.8 | | | | 46.9 | | | | 278.6 | | | | 32.7 | | | | 39.0 | | | | 160.8 | | | | 123.7 | | | | 289.1 | | | | 3.5 | | | | 1,260.6 | |
General and administrative expenses | | | (180.1 | ) | | | (39.1 | ) | | | (224.5 | ) | | | (28.1 | ) | | | (39.6 | ) | | | (126.6 | ) | | | (120.6 | ) | | | (252.2 | ) | | | (7.0 | ) | | | (1,374.6 | ) |
Other profit (loss)(1) | | | (1.2 | ) | | | — | | | | (2.6 | ) | | | (1.0 | ) | | | 8.2 | | | | (9.6 | ) | | | (67.2 | ) | | | (73.9 | ) | | | (132.8 | ) | | | (221.6 | ) |
| | | | | | | | | | | | | | | | | | | | | | | | | | | | | | | | | | | | | | | | |
Consolidated net business profit(2)(5) | | ¥ | 40.0 | | | ¥ | 8.3 | | | ¥ | 50.8 | | | ¥ | 59.4 | | | ¥ | 62.4 | | | ¥ | 43.1 | | | ¥ | (27.7 | ) | | ¥ | 19.8 | | | ¥ | (11.2 | ) | | ¥ | 1,013.9 | |
| | | | | | | | | | | | | | | | | | | | | | | | | | | | | | | | | | | | | | | | |
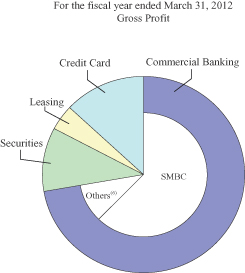
78
For the fiscal year ended March 31, 2011:
| | | | | | | | | | | | | | | | | | | | | | | | | | | | | | | | |
| | | Commercial Banking | |
| | SMBC | | | Total(3) | |
| | | Consumer
Banking
Unit | | | Middle
Market
Banking
Unit | | | Corporate
Banking
Unit | | | International
Banking
Unit | | | Treasury
Unit | | | Others | | | SMBC Total | | | | |
| | | (In billions) | |
Gross profit | | ¥ | 387.8 | | | ¥ | 443.9 | | | ¥ | 201.3 | | | ¥ | 186.5 | | | ¥ | 330.7 | | | ¥ | (18.4 | ) | | ¥ | 1,531.8 | | | ¥ | 1,773.5 | |
Net interest income | | | 337.5 | | | | 272.9 | | | | 131.4 | | | | 107.7 | | | | 136.3 | | | | (18.0 | ) | | | 967.8 | | | | 1,117.6 | |
Net non-interest income | | | 50.3 | | | | 171.0 | | | | 69.9 | | | | 78.8 | | | | 194.4 | | | | (0.4 | ) | | | 564.0 | | | | 655.9 | |
General and administrative expenses | | | (290.3 | ) | | | (221.7 | ) | | | (36.0 | ) | | | (57.9 | ) | | | (17.9 | ) | | | (75.4 | ) | | | (699.2 | ) | | | (834.2 | ) |
Other profit (loss)(1) | | | — | | | | — | | | | — | | | | — | | | | — | | | | — | | | | — | | | | (34.4 | ) |
| | | | | | | | | | | | | | | | | | | | | | | | | | | | | | | | |
Consolidated net business profit(2)(5) | | ¥ | 97.5 | | | ¥ | 222.2 | | | ¥ | 165.3 | | | ¥ | 128.6 | | | ¥ | 312.8 | | | ¥ | (93.8 | ) | | ¥ | 832.6 | | | ¥ | 904.9 | |
| | | | | | | | | | | | | | | | | | | | | | | | | | | | | | | | |
| | | | | | | | | | | | | | | | | | | | | | | | | | | | | | | | | | | | | | | | |
| | | Securities | | | Leasing | | | Credit Card | | | Others | | | Total | |
| | SMBC
Nikko
Securities | | | SMBC
Friend
Securities | | | Total(3) | | | Sumitomo
Mitsui
Finance &
Leasing | | | Total(3) | | | Sumitomo
Mitsui
Card | | | Cedyna(4) | | | Total(3) | | | | | | | |
| | | (In billions) | |
Gross profit | | ¥ | 205.2 | | | ¥ | 53.0 | | | ¥ | 261.6 | | | ¥ | 95.2 | | | ¥ | 99.4 | | | ¥ | 182.3 | | | ¥ | 134.4 | | | ¥ | 322.5 | | | ¥ | 75.6 | | | ¥ | 2,532.6 | |
Net interest income | | | (2.7 | ) | | | 0.6 | | | | (1.3 | ) | | | 60.0 | | | | 56.7 | | | | 22.9 | | | | 36.8 | | | | 62.3 | | | | 100.3 | | | | 1,335.6 | |
Net non-interest income | | | 207.9 | | | | 52.4 | | | | 262.9 | | | | 35.2 | | | | 42.7 | | | | 159.4 | | | | 97.6 | | | | 260.2 | | | | (24.7 | ) | | | 1,197.0 | |
General and administrative expenses | | | (166.7 | ) | | | (42.7 | ) | | | (212.4 | ) | | | (28.1 | ) | | | (38.0 | ) | | | (129.8 | ) | | | (97.5 | ) | | | (229.4 | ) | | | 12.9 | | | | (1,301.1 | ) |
Other profit (loss)(1) | | | — | | | | — | | | | (5.6 | ) | | | (16.9 | ) | | | (3.8 | ) | | | (19.9 | ) | | | (37.5 | ) | | | (57.4 | ) | | | (128.3 | ) | | | (229.5 | ) |
| | | | | | | | | | | | | | | | | | | | | | | | | | | | | | | | | | | | | | | | |
Consolidated net business profit(2)(5) | | ¥ | 38.5 | | | ¥ | 10.3 | | | ¥ | 43.6 | | | ¥ | 50.2 | | | ¥ | 57.6 | | | ¥ | 32.6 | | | ¥ | (0.6 | ) | | ¥ | 35.7 | | | ¥ | (39.8 | ) | | ¥ | 1,002.0 | |
| | | | | | | | | | | | | | | | | | | | | | | | | | | | | | | | | | | | | | | | |
79
For the fiscal year ended March 31, 2010:
| | | | | | | | | | | | | | | | | | | | | | | | | | | | | | | | |
| | | Commercial Banking | |
| | | SMBC | | | Total(3) | |
| | | Consumer
Banking
Unit | | | Middle
Market
Banking
Unit | | | Corporate
Banking
Unit | | | International
Banking
Unit | | | Treasury
Unit | | | Others | | | SMBC Total | | | | |
| | | (In billions) | |
Gross profit | | ¥ | 391.7 | | | ¥ | 472.9 | | | ¥ | 197.3 | | | ¥ | 169.1 | | | ¥ | 272.8 | | | ¥ | (48.5 | ) | | ¥ | 1,455.3 | | | ¥ | 1,669.3 | |
Net interest income | | | 357.2 | | | | 298.2 | | | | 125.9 | | | | 110.1 | | | | 187.5 | | | | (32.5 | ) | | | 1,046.4 | | | | 1,181.9 | |
Net non-interest income | | | 34.5 | | | | 174.7 | | | | 71.4 | | | | 59.0 | | | | 85.3 | | | | (16.0 | ) | | | 408.9 | | | | 487.4 | |
General and administrative expenses | | | (288.7 | ) | | | (218.7 | ) | | | (33.3 | ) | | | (54.5 | ) | | | (16.3 | ) | | | (74.3 | ) | | | (685.8 | ) | | | (803.3 | ) |
Other profit (loss)(1) | | | — | | | | — | | | | — | | | | — | | | | — | | | | — | | | | — | | | | (132.8 | ) |
| | | | | | | | | | | | | | | | | | | | | | | | | | | | | | | | |
Consolidated net business profit(2)(5) | | ¥ | 103.0 | | | ¥ | 254.2 | | | ¥ | 164.0 | | | ¥ | 114.6 | | | ¥ | 256.5 | | | ¥ | (122.8 | ) | | ¥ | 769.5 | | | ¥ | 733.2 | |
| | | | | | | | | | | | | | | | | | | | | | | | | | | | | | | | |
| | | | | | | | | | | | | | | | | | | | | | | | | | | | | | | | | | | | | | | | |
| | | Securities | | | Leasing | | | Credit Card | | | Others | | | Total | |
| | | SMBC
Nikko
Securities(4) | | | SMBC
Friend
Securities | | | Total(3) | | | Sumitomo
Mitsui
Finance &
Leasing | | | Total(3) | | | Sumitomo
Mitsui
Card | | | Cedyna | | | Total(3) | | | | | | | |
| | | (In billions) | |
Gross profit | | ¥ | 100.5 | | | ¥ | 67.2 | | | ¥ | 161.4 | | | ¥ | 97.2 | | | ¥ | 109.5 | | | ¥ | 183.6 | | | ¥ | — | | | ¥ | 183.4 | | | ¥ | 19.2 | | | ¥ | 2,142.8 | |
Net interest income | | | (1.4 | ) | | | 0.6 | | | | (0.2 | ) | | | 59.8 | | | | 64.5 | | | | 27.5 | | | | — | | | | 29.3 | | | | 9.9 | | | | 1,285.4 | |
Net non-interest income | | | 101.9 | | | | 66.6 | | | | 161.6 | | | | 37.4 | | | | 45.0 | | | | 156.1 | | | | — | | | | 154.1 | | | | 9.3 | | | | 857.4 | |
General and administrative expenses | | | (77.0 | ) | | | (44.4 | ) | | | (124.3 | ) | | | (28.5 | ) | | | (40.9 | ) | | | (135.8 | ) | | | — | | | | (137.9 | ) | | | 6.5 | | | | (1,099.9 | ) |
Other profit (loss)(1) | | | — | | | | — | | | | 13.7 | | | | (24.8 | ) | | | (27.5 | ) | | | (23.5 | ) | | | — | | | | (40.4 | ) | | | (23.6 | ) | | | (210.6 | ) |
| | | | | | | | | | | | | | | | | | | | | | | | | | | | | | | | | | | | | | | | |
Consolidated net business profit(2)(5) | | ¥ | 23.5 | | | ¥ | 22.8 | | | ¥ | 50.8 | | | ¥ | 43.9 | | | ¥ | 41.1 | | | ¥ | 24.3 | | | ¥ | — | | | ¥ | 5.1 | | | ¥ | 2.1 | | | ¥ | 832.3 | |
| | | | | | | | | | | | | | | | | | | | | | | | | | | | | | | | | | | | | | | | |
| (1) | Other profit (loss) in “Total” of each segment includes non-operating profits and losses of subsidiaries other than SMBC and ordinary profit of equity-method associates taking into account the ownership ratio. |
| (2) | The Group’s consolidated net business profit = SMBC’s business profit on a nonconsolidated basis, excluding the effect of the reversal of reserve for possible loan losses + ordinary profit of other consolidated subsidiaries (with adjustment for extraordinary items) + (ordinary profit of equity-method associates * ownership ratio) - internal transactions (such as dividends) under Japanese GAAP. |
| | Consolidated net business profit of SMBC Nikko Securities, SMBC Friend Securities, Sumitomo Mitsui Finance and Leasing, Sumitomo Mitsui Card, and Cedyna is operating profit (loss) of each company. |
| (3) | Total under each business segment includes the aggregation of the results from the operating units that were not separately identified. (e.g., the difference between “Total” in Commercial Banking and “SMBC Total” consists of SMFG’s banking subsidiaries except SMBC, such as SMBC Europe, SMBC (China), Kansai Urban Banking Corporation and The Minato Bank.) |
| (4) | The results of SMBC Nikko Securities for the fiscal year ended March 31, 2010 only include six months of SMBC Nikko Securities’ results. The results of Cedyna for the fiscal year ended March 31, 2011 include our ownership ratio of the first quarter of Cedyna’s results and the full results of Cedyna for subsequent quarters. |
| (5) | The Group’s total credit cost (reversal) for the fiscal years ended March 31, 2012, 2011 and 2010 was ¥116.8 billion, ¥217.3 billion and ¥473.0 billion, respectively, of which ¥78.1 billion, ¥144.6 billion and ¥395.1 billion was for Commercial Banking, ¥1.2 billion, ¥(0.02) billion and ¥0.03 billion were for Securities, ¥(3.6) billion, ¥8.0 billion and ¥27.4 billion were for Leasing, and ¥36.8 billion, ¥46.6 billion and ¥26.1 billion were for Credit Card. Total credit cost consists of credit cost and gains on recoveries of written-off claims. Credit cost of SMBC and gains on recoveries of written-off claims were not included in consolidated net business profit, but in “Loans and advances” in the reconciliation table in the section “Reconciliation of Segmental Results of Operations to Consolidated Income Statements.” |
| (6) | Others in Commercial Banking consists of SMFG’s banking subsidiaries except SMBC, such as SMBC Europe, SMBC (China), Kansai Urban Banking Corporation and The Minato Bank. |
80
Commercial Banking
Fiscal Year Ended March 31, 2012 Compared to Fiscal Year Ended March 31, 2011
Our consolidated net business profit from our Commercial Banking segment decreased by ¥13 billion from ¥905 billion for the fiscal year ended March 31, 2011 to ¥892 billion for the fiscal year ended March 31, 2012 due to a decrease in both net interest income and net non-interest income, and an increase in general and administrative expenses.
The Bank’s Consumer Banking Unit
Both gross profit and consolidated net business profit from the Bank’s Consumer Banking Unit slightly decreased from ¥388 billion and ¥98 billion for the fiscal year ended March 31, 2011 to ¥384 billion and ¥94 billion for the fiscal year ended March 31, 2012, respectively, due primarily to a decrease in net interest income, despite an increase in fees and commissions, in particular related to life insurance products.
The Bank’s Middle Market Banking Unit
Both gross profit and consolidated net business profit from the Bank’s Middle Market Banking Unit decreased from ¥444 billion and ¥222 billion for the fiscal year ended March 31, 2011 to ¥423 billion and ¥200 billion for the fiscal year ended March 31, 2012, respectively. The decrease was primarily due to a decrease in loan balances as a result of a limited demand for funding in Japan.
The Bank’s Corporate Banking Unit
Both gross profit and consolidated net business profit from the Bank’s Corporate Banking Unit increased from ¥201 billion and ¥165 billion for the fiscal year ended March 31, 2011 to ¥213 billion and ¥174 billion for the fiscal year ended March 31, 2012, respectively, due to an increase in fees and commissions, particularly related to loan syndication.
The Bank’s International Banking Unit
Gross profit from the Bank’s International Banking Unit increased by ¥10 billion from ¥187 billion for the fiscal year ended March 31, 2011 to ¥197 billion for the fiscal year ended March 31, 2012 due primarily to an increase in net non-interest income. Consolidated net business profit from the Bank’s International Banking Unit increased modestly by ¥4 billion from ¥129 billion for the fiscal year ended March 31, 2011 to ¥133 billion for the fiscal year ended March 31, 2012, due to an increase in general and administrative expenses related to the expansion of overseas operations.
The Bank’s Treasury Unit
Gross profit from the Bank’s Treasury Unit decreased by ¥12 billion from ¥331 billion for the fiscal year ended March 31, 2011 due to a decrease in net interest income but reached ¥319 billion due mainly to the sales of bonds through our timely responses to the declining interest rates both in domestic and overseas markets. Consolidated net business profit from the Bank’s Treasury Unit decreased by ¥13 billion from ¥313 billion for the fiscal year ended March 31, 2011 to ¥300 billion for the fiscal year ended March 31, 2012.
The Bank’s Others
The Bank’s Others represents the difference between the aggregate of the Bank’s five business units and the Bank as a whole. The Bank’s Others includes the profit and loss amounts related to the Corporate Staff Unit, Corporate Services Unit, Compliance Unit, Risk Management Unit and Internal Audit Unit, which do not belong to any of the five business units. Those amounts mainly consist of administrative costs related to the headquarters operations and profit or loss on the activities related to capital management.
81
Fiscal Year Ended March 31, 2011 Compared to Fiscal Year Ended March 31, 2010
Our consolidated business profit from our Commercial Banking segment increased by ¥172 billion from ¥733 billion for the fiscal year ended March 31, 2010 to ¥905 billion for the fiscal year ended March 31, 2011. This was primarily due to an increase in net non-interest income mainly from sales of bonds by the Treasury Unit of the Bank as well as an increase in both net interest income and net non-interest income in the Bank’s subsidiaries such as Kansai Urban Banking Corporation and The Minato Bank despite decreases in net interest income and net non-interest income in the Bank’s Middle Market Banking Unit. Because the Bank has a significant impact on our performance, its performance is reported to management in more detail. The performance of each of the Bank’s five business units is broken down further into customer market segments for management review. In addition to its five business units, the Bank also has several cross-sectional units and departments. The revenues and expenses of these units and departments are in principal allocated to each business unit.
The Bank’s Consumer Banking Unit
Gross profit from the Bank’s Consumer Banking Unit decreased slightly from ¥392 billion for the fiscal year ended March 31, 2010 to ¥388 billion for the fiscal year ended March 31, 2011, consolidated net business profit from the Bank’s Consumer Banking Unit decreased slightly from ¥103 billion for the fiscal year ended March 31, 2010 to ¥98 billion for the fiscal year ended March 31, 2011, due primarily to a decrease in net interest income despite an increase in fees and commissions related to investment trusts.
The Bank’s Middle Market Banking Unit
Gross profit from the Bank’s Middle Market Banking Unit decreased by ¥29 billion from ¥473 billion for the fiscal year ended March 31, 2010 to ¥444 billion for the fiscal year ended March 31, 2011 primarily due to a decrease in loan balance and a decline in the average loan-to-deposit interest spread. The decrease in gross profit was the primary reason for the decrease in consolidated net business profit from the Bank’s Middle Market Banking Unit, which decreased by ¥32 billion from ¥254 billion for the fiscal year ended March 31, 2010 to ¥222 billion for the fiscal year ended March 31, 2011.
The Bank’s Corporate Banking Unit
Consolidated net business profit from the Bank’s Corporate Banking Unit showed limited change from ¥164 billion for the fiscal year ended March 31, 2010 to ¥165 billion for the fiscal year ended March 31, 2011. Gross profit increased by ¥4 billion from ¥197 billion for the fiscal years ended March 31, 2010 to ¥201 billion for the fiscal year ended March 31, 2011. Interest income from loans and advances increased due primarily to an improvement in the average loan-to-deposit interest spread despite a decrease in loan balance.
The Bank’s International Banking Unit
Consolidated net business profit from the Bank’s International Banking Unit was ¥129 billion for the fiscal year ended March 31, 2011, a ¥14 billion change from ¥115 billion for the fiscal year ended March 31, 2010, and gross profit from the Bank’s International Banking Unit increased by ¥18 billion from ¥169 billion for the fiscal year ended March 31, 2010 to ¥187 billion for the fiscal year ended March 31, 2011 due primarily to an increase in net non-interest income.
The Bank’s Treasury Unit
Gross profit from the Bank’s Treasury Unit increased by ¥58 billion from ¥273 billion for the fiscal year ended March 31, 2010 to ¥331 billion for the fiscal year ended March 31, 2011 due mainly to an increase in net non-interest income mainly from sales of bonds made in response to fluctuations in market interest rates.
Net business profit from the Bank’s Treasury Unit increased by ¥56 billion from ¥257 billion for the fiscal year ended March 31, 2010 to ¥313 billion for the fiscal year ended March 31, 2011 due primarily to the increase in net non-interest income described above.
82
The Bank’s Others
The Bank’s Others represents the difference between the aggregate of the Bank’s five business units and the Bank as a whole. It mainly consists of administrative costs related to the headquarters operations and profit or loss on the activities related to capital management. Amounts recorded in Bank’s Others are those related to the Corporate Staff Units including the Compliance Unit, the Office of Corporate Auditors and the Corporate Planning Department, which do not belong to any of the five business units.
Securities
Fiscal Year Ended March 31, 2012 Compared to Fiscal Year Ended March 31, 2011
Consolidated net business profit in our Securities segment increased from ¥44 billion for the fiscal year ended March 31, 2011 to ¥51 billion for the fiscal year ended March 31, 2012 due to an increase in the net non-interest income of SMBC Nikko Securities and overseas subsidiaries, despite a decrease in fees and commissions for securities transactions at SMBC Friend Securities and an increase in general and administrative expenses of SMBC Nikko Securities.
Fiscal Year Ended March 31, 2011 Compared to Fiscal Year Ended March 31, 2010
Consolidated net business profit in our Securities segment showed limited change from ¥51 billion for the fiscal year ended March 31, 2010 to ¥44 billion for the fiscal year ended March 31, 2011 due to an increase in business profit of SMBC Nikko Securities, despite a decrease in fees and commissions for both domestic and foreign securities transaction of SMBC Friend Securities. Gross profit and General and administrative expenses of SMBC Nikko Securities almost doubled for the fiscal year ended March 31, 2011 since its figures for the previous fiscal year include only the second half of that fiscal year due to the date of acquisition.
Leasing
Fiscal Year Ended March 31, 2012 Compared to Fiscal Year Ended March 31, 2011
Consolidated net business profit in our Leasing segment increased by ¥4 billion from ¥58 billion for the fiscal year ended March 31, 2011, to ¥62 billion for the fiscal year ended March 31, 2012 due mainly to a decrease in credit costs incurred in Sumitomo Mitsui Finance and Leasing.
Fiscal Year Ended March 31, 2011 Compared to Fiscal Year Ended March 31, 2010
Consolidated net business profit in our Leasing segment increased by ¥17 billion from ¥41 billion for the fiscal year ended March 31, 2010, to ¥58 billion for the fiscal year ended March 31, 2011 due mainly to a decrease in the credit costs of Sumitomo Mitsui Finance and Leasing.
Credit Card
Fiscal Year Ended March 31, 2012 Compared to Fiscal Year Ended March 31, 2011
Consolidated net business profit in our Credit Card segment decreased by ¥16 billion from ¥36 billion for the fiscal year ended March 31, 2011 to ¥20 billion for the fiscal year ended March 31, 2012 due mainly to a decrease in business profit of Cedyna partially offset by an increase in business profit of Sumitomo Mitsui Card Company.
Fiscal Year Ended March 31, 2011 Compared to Fiscal Year Ended March 31, 2010
Consolidated net business profit in our Credit Card segment increased by ¥31 billion from ¥5 billion for the fiscal year ended March 31, 2010 to ¥36 billion for the fiscal year ended March 31, 2011 due mainly to an increase in business profit of Sumitomo Mitsui Card Company and a recovery in the business profit of Cedyna.
83
SMFG’s Others
SMFG’s Others represents the difference between the aggregate of the Commercial Banking, Securities, Leasing and Credit Card segments, and the Group as a whole. It mainly consists of the profit or loss from SMFG on a stand-alone basis, other subsidiaries and equity-method associates, which are not identified as reportable segments, including The Japan Research Institute, ORIX Credit, SMBC Consumer Finance. It also includes internal transactions between our Group companies which were eliminated in our consolidated financial statements.
Financial Condition
Assets
Our total assets increased by ¥5,403,499 million from ¥136,470,927 million at March 31, 2011 to ¥141,874,426 million at March 31, 2012, due primarily to an increase in investment securities and loans and advances.
Our assets at March 31, 2012 and 2011 were as follows:
| | | | | | | | |
| | | At March 31, | |
| | | 2012 | | | 2011 | |
| | | (In millions) | |
Assets: | | | | | | | | |
Cash and deposits with banks | | ¥ | 8,050,562 | | | ¥ | 9,436,358 | |
Call loans and bills bought | | | 1,297,082 | | | | 862,667 | |
Reverse repurchase agreements and cash collateral on securities borrowed | | | 4,937,025 | | | | 5,051,053 | |
Trading assets | | | 4,461,258 | | | | 3,315,153 | |
Derivative financial instruments | | | 5,901,526 | | | | 4,975,973 | |
Financial assets at fair value through profit or loss | | | 2,150,409 | | | | 2,132,348 | |
Investment securities | | | 37,324,100 | | | | 34,662,106 | |
Loans and advances | | | 72,536,813 | | | | 71,020,329 | |
Investments in associates and joint ventures | | | 206,660 | | | | 201,135 | |
Property, plant and equipment | | | 1,045,006 | | | | 1,039,483 | |
Intangible assets | | | 899,167 | | | | 769,677 | |
Other assets | | | 2,367,300 | | | | 1,924,070 | |
Current tax assets | | | 65,298 | | | | 53,708 | |
Deferred tax assets | | | 632,220 | | | | 1,026,867 | |
| | | | | | | | |
Total assets | | ¥ | 141,874,426 | | | ¥ | 136,470,927 | |
| | | | | | | | |
Loans and Advances
Our main operating activity is in the lending business. We make loans and extend other types of credit principally to corporate and individual customers in Japan and to corporate and sovereign customers in foreign countries.
At March 31, 2012, our loans and advances were ¥72,536,813 million, or 51% of total assets, representing an increase of ¥1,516,484 million, or 2%, from ¥71,020,329 million at March 31, 2011. The increase in loans and advances was due mainly to an increase in loans and advances to our foreign customers, in spite of a decrease in those to our domestic customers.
The increase in loans and advances to our foreign customers was due mainly to the strong financing needs in the United States and Asian countries. Contributing to the increase were not only a move to deleverage by European banks due to the strengthening of capital requirements for European banks as a result of the European
84
sovereign-debt crisis and the European bank downgrades but also an increased awareness of the presence of Japanese banks overseas. The decrease in loans and advances to our domestic customers was primarily due to weak financing needs of domestic mid-sized companies and SMEs, and a fall in new demand for refinancing housing loans and the sluggish domestic housing market. This decrease was partially offset by the inclusion of loans and advances to domestic individual customers from SMBC Consumer Finance, which became our consolidated subsidiary in December 2011.
Domestic
Through the Bank and other banking and nonbank subsidiaries, we make loans to a broad range of industrial, commercial and individual customers in Japan. The following table shows our outstanding loans and advances to our domestic customers whose domiciles are in Japan, classified by industry, classified by industry, before deducting the allowance for loan losses, and adjusting unearned income, unamortized premiums-net and deferred loan fees-net at the dates indicated:
| | | | | | | | |
| | | At March 31, | |
| | | 2012 | | | 2011 | |
| | | (In millions) | |
Domestic: | | | | | | | | |
Manufacturing | | ¥ | 8,462,004 | | | ¥ | 8,344,261 | |
Agriculture, forestry, fisheries and mining | | | 152,128 | | | | 162,727 | |
Construction | | | 1,284,882 | | | | 1,327,475 | |
Transportation, communications and public enterprises | | | 4,414,102 | | | | 4,036,780 | |
Wholesale and retail | | | 5,480,393 | | | | 5,616,084 | |
Finance and insurance | | | 2,170,776 | | | | 2,568,670 | |
Real estate and goods rental and leasing | | | 7,982,741 | | | | 8,281,048 | |
Services | | | 4,076,818 | | | | 4,316,724 | |
Municipalities | | | 1,234,355 | | | | 1,440,167 | |
Lease financing | | | 2,056,972 | | | | 2,205,451 | |
Consumer(1) | | | 19,185,574 | | | | 18,552,987 | |
Others | | | 4,155,960 | | | | 4,378,791 | |
| | | | | | | | |
Total domestic | | ¥ | 60,656,705 | | | ¥ | 61,231,165 | |
| | | | | | | | |
| (1) | The balance in Consumer consists mainly of housing loans. The housing loan balances amounted to ¥14,574,702 million and ¥14,577,945 million at March 31, 2012 and 2011, respectively. |
Foreign
The following table shows the outstanding loans and advances to our foreign customers whose domicile is not in Japan, classified by industry, before deducting the allowance for loan losses, and adjusting unearned income, unamortized premiums-net and deferred loan fees-net at the dates indicated:
| | | | | | | | |
| | | At March 31, | |
| | | 2012 | | | 2011 | |
| | | (In millions) | |
Foreign: | | | | | | | | |
Public sector | | ¥ | 130,426 | | | ¥ | 83,109 | |
Financial institutions | | | 2,012,751 | | | | 1,794,794 | |
Commerce and industry | | | 10,364,685 | | | | 8,949,629 | |
Lease financing | | | 191,966 | | | | 172,361 | |
Others | | | 706,175 | | | | 528,847 | |
| | | | | | | | |
Total foreign | | ¥ | 13,406,003 | | | ¥ | 11,528,740 | |
| | | | | | | | |
85
Allowance for Loan Losses
For the fiscal year ended March 31, 2012, the allowance for loan losses decreased by ¥205,969 million, or 13%, from ¥1,587,133 million at March 31, 2011 to ¥1,381,164 million at March 31, 2012. We recorded a provision for loan losses of ¥144,022 million for the fiscal year ended March 31, 2012, which is a decrease from ¥259,292 million for the fiscal year ended March 31, 2011.
In the first few months of the fiscal year ended March 31, 2012, the Japanese economy contracted in the aftermath of the Great East Japan Earthquake. The Japanese economy then gradually began to and continued to recover. In the second half of the fiscal year, there were some visible signs of improvement in the unemployment rate and private consumption remained firm, in spite of the deceleration of certain overseas economies coupled with the persistent strength of the Japanese yen against other currencies.
We implemented consultative actions tailored to our borrowers’ businesses and financial condition, by supporting the development of operational improvement plans for borrowers, and continued to manage centrally and globally our credit monitoring procedures on a cross-region basis, in order to reduce our credit risk exposure and hence the amount of provision required. As part of day-to-day risk management, we regularly assess our customers to review the obligor grades (our internal credit rating) assigned to them based on the latest available financial information. We also review the obligor grades of our customers upon the occurrence of events or a change in their financial condition that are indicative of a change in the borrower’s repayment ability.
We calculate the allowance for loan losses using the latest assignment of obligor grades and supplementary data such as the borrowers’ operating cash flows, realizable value of collateral and recent economic conditions. The recovery of the Japanese economy and our consultative actions tailored to our borrowers’ businesses and financial condition had a positive impact on their financial position, which may upgrade our customers’ obligor grades or avoid their obligor grades’ being downgraded.
Consequently the provision for loan losses decreased by ¥115,270 million from ¥259,292 million for the fiscal year ended March 31, 2011 to ¥144,022 million for the fiscal year ended March 31, 2012.
Charge-offs increased by ¥155,464 million from the previous fiscal year to ¥355,225 million for the fiscal year ended March 31, 2012. The overall charge-offs of domestic loans and advances increased by ¥130,890 million compared to the previous fiscal year to ¥306,607 million for the fiscal year ended March 31, 2012 and especially the charge-offs related to wholesale, retail and consumer industries increased. Charge-offs of foreign loans and advances increased by ¥24,574 million compared to the previous fiscal year to ¥48,618 million for the fiscal year ended March 31, 2012.
For the fiscal year ended March 31, 2012, charge-offs that were recognized mainly through the sales of loans exceeded the provision for loan losses that increased the balance of the allowance for loan losses. Accordingly, the overall allowance for loan losses decreased by ¥205,969 million at March 31, 2012 compared to March 31, 2011.
For the fiscal year ended March 31, 2011, the allowance for loan losses increased by ¥53,578 million, or 3%, from ¥1,533,555 million at March 31, 2010 to ¥1,587,133 million at March 31, 2011. We recorded a provision for loan losses of ¥259,292 million for the fiscal year ended March 31, 2011, which is an increase from ¥215,886 million for the fiscal year ended March 31, 2010.
During the fiscal year ended March 31, 2011, the global economy as a whole continued to recover, as continuous solid growth in emerging countries compensated for the lack of momentum in industrialized countries. The U.S. economy was stabilized by fiscal and monetary policies, while the European economies experienced varying growth against the backdrop of fiscal crises in certain European countries. The Japanese economy was recovering gradually due to consumption stimulus packages instituted by the government as well as increasing exports to Asia until the Great East Japan Earthquake, which was followed by a large tsunami, occurred in March 2011. The earthquake not only devastated the Tohoku region (northeastern Japan) but also affected the Kanto region, resulting in stagnation in economic activity across a wide range of regions.
86
After the Great East Japan Earthquake in March 2011, we conducted an assessment of our borrowers and a review of the obligor grades. This assessment and review indicated that, loans to our customers whose obligor grades were downgraded and decreases in the value of mortgaged property, both of which represent a direct impact of the earthquake on the credit quality of our loan portfolio, were limited. However, as the economic condition at the end of the fiscal year ended March 31, 2011 was adversely affected by the occurrence of the earthquake, we reflected the effect of this in the allowance for loan losses primarily as incurred but not yet identified (“IBNI”) losses. Accordingly, the provision for loan losses for the fiscal year ended March 31, 2011 increased by ¥43,406 million compared to the fiscal year ended March 31, 2010.
Charge-offs decreased by ¥184,754 million from the previous fiscal year to ¥199,761 million for the fiscal year ended March 31, 2011. The overall charge-offs of domestic loans and advances decreased by ¥185,178 million compared to the previous fiscal year to ¥175,717 million for the fiscal year ended March 31, 2011 and especially the charge-offs related to customers from the services, wholesale and retail industries decreased. Charge-offs of foreign loans and advances increased by ¥424 million compared to the previous fiscal year to ¥24,044 million for the fiscal year ended March 31, 2011.
For the fiscal year ended March 31, 2011, the provision for loan losses increased compared to the previous fiscal year. Although recognizing charge-offs through the sales of loans and others decreased the allowance for loan losses, the decrease from charge-offs for the fiscal year ended March 31, 2011 was not enough to offset the additional allowance for loan losses recognized due to some deterioration in the credit quality of the portfolio. Accordingly, the overall allowance for loan losses increased by ¥53,578 million at March 31, 2011 compared to March 31, 2010.
The following table shows the analysis of our allowance for loan losses for each of the periods indicated:
| | | | | | | | | | | | |
| | | For the fiscal year ended March 31, | |
| | | 2012 | | | 2011 | | | 2010 | |
| | | (In millions) | |
Allowance for loan losses at beginning of period | | ¥ | 1,587,133 | | | ¥ | 1,533,555 | | | ¥ | 1,599,630 | |
Provision for loan losses | | | 144,022 | | | | 259,292 | | | | 215,886 | |
Charge-offs: | | | | | | | | | | | | |
Domestic | | | 306,607 | | | | 175,717 | | | | 360,895 | |
Foreign | | | 48,618 | | | | 24,044 | | | | 23,620 | |
| | | | | | | | | | | | |
Total | | | 355,225 | | | | 199,761 | | | | 384,515 | |
| | | | | | | | | | | | |
Recoveries: | | | | | | | | | | | | |
Domestic | | | 4,595 | | | | 2,624 | | | | 953 | |
Foreign | | | 207 | | | | 190 | | | | 16 | |
| | | | | | | | | | | | |
Total | | | 4,802 | | | | 2,814 | | | | 969 | |
| | | | | | | | | | | | |
Net charge-offs | | | 350,423 | | | | 196,947 | | | | 383,546 | |
Others(1) | | | 432 | | | | (8,767 | ) | | | 101,585 | |
| | | | | | | | | | | | |
Allowance for loan losses at end of period | | ¥ | 1,381,164 | | | ¥ | 1,587,133 | | | ¥ | 1,533,555 | |
| | | | | | | | | | | | |
| (1) | Others were primarily from foreign exchange translations for the fiscal year ended March 31, 2011, whereas the amount for the fiscal year ended March 31, 2010 mainly included an increase in the allowance for loan losses of ¥102,687 million from the acquisition of subsidiaries. |
87
Impaired Loans and Advances
A portion of the total domestic and foreign loans and advances consists of impaired loans and advances, which are comprised of “potentially bankrupt, effectively bankrupt and bankrupt (loans and advances),” “past due three months or more (loans),” “restructured (loans)” and “other impaired (loans and advances).” The loans and advances for which management has serious doubts about the ability of the borrowers to comply in the near future with the repayment terms are wholly included in impaired loans and advances.
“Potentially bankrupt, effectively bankrupt and bankrupt (loans and advances)” comprise loans and advances to borrowers that are perceived to have a high risk of falling into bankruptcy, may not have been legally or formally declared bankrupt but are essentially bankrupt, or have been legally or formally declared bankrupt.
Loans classified as “past due three months or more (loans)” represent those loans that are three months or more past due as to principal or interest, other than those loans to borrowers who are potentially bankrupt, effectively bankrupt and bankrupt.
The category “restructured (loans)” comprises loans not included above for which the terms of the loans have been modified to grant concessions because of problems with the borrower.
“Other impaired (loans and advances)” represent impaired loans and advances, which are not included in “potentially bankrupt, effectively bankrupt and bankrupt (loans and advances),” “past due three months or more (loans),” or “restructured (loans),” but for which information about credit problems cause management to classify them as impaired loans and advances.
88
The following table shows the distribution of impaired loans and advances by “potentially bankrupt, effectively bankrupt and bankrupt (loans and advances),” “past due three months or more (loans),” “restructured (loans)” and “other impaired (loans and advances)” at March 31, 2012 and 2011 by domicile and type of industry of the borrowers.
| | | | | | | | |
| | | At March 31, | |
| | | 2012 | | | 2011 | |
| | | (In millions) | |
Potentially bankrupt, effectively bankrupt and bankrupt (loans and advances): | | | | | | | | |
Domestic: | | | | | | | | |
Manufacturing | | ¥ | 187,982 | | | ¥ | 211,597 | |
Agriculture, forestry, fisheries and mining | | | 5,295 | | | | 6,635 | |
Construction | | | 118,413 | | | | 120,696 | |
Transportation, communications and public enterprises | | | 68,768 | | | | 59,775 | |
Wholesale and retail | | | 225,399 | | | | 243,346 | |
Finance and insurance | | | 13,350 | | | | 11,496 | |
Real estate and goods rental and leasing | | | 499,485 | | | | 534,596 | |
Services | | | 213,142 | | | | 249,093 | |
Lease financing | | | 10,742 | | | | 27,716 | |
Consumer | | | 312,181 | | | | 297,732 | |
Others | | | 67,174 | | | | 55,909 | |
| | | | | | | | |
Total domestic | | | 1,721,931 | | | | 1,818,591 | |
| | | | | | | | |
Foreign: | | | | | | | | |
Public sector | | | 14 | | | | 14 | |
Financial institutions | | | 19,383 | | | | 42,350 | |
Commerce and industry | | | 162,509 | | | | 128,534 | |
Lease financing | | | 4,140 | | | | 5,037 | |
Others | | | 3,019 | | | | 3,831 | |
| | | | | | | | |
Total foreign | | | 189,065 | | | | 179,766 | |
| | | | | | | | |
Total | | | 1,910,996 | | | | 1,998,357 | |
| | | | | | | | |
Past due three months or more (loans): | | | | | | | | |
Domestic | | | 32,069 | | | | 40,699 | |
Foreign | | | 1,130 | | | | 1,336 | |
| | | | | | | | |
Total | | | 33,199 | | | | 42,035 | |
| | | | | | | | |
Restructured (loans): | | | | | | | | |
Domestic | | | 390,060 | | | | 296,751 | |
Foreign | | | 24,644 | | | | 59,296 | |
| | | | | | | | |
Total | | | 414,704 | | | | 356,047 | |
| | | | | | | | |
Other impaired (loans and advances): | | | | | | | | |
Domestic | | | 255,615 | | | | 252,457 | |
Foreign | | | 2,588 | | | | 527 | |
| | | | | | | | |
Total | | | 258,203 | | | | 252,984 | |
| | | | | | | | |
Gross impaired loans and advances | | | 2,617,102 | | | | 2,649,423 | |
| | | | | | | | |
Less: Allowance for loan losses | | | (1,234,299 | ) | | | (1,395,659 | ) |
| | | | | | | | |
Net impaired loans and advances | | ¥ | 1,382,803 | | | ¥ | 1,253,764 | |
| | | | | | | | |
In addition to the discussion in this section, see Note 45 “Financial Risk Management—Credit Risk” to our consolidated financial statements included elsewhere in this annual report.
89
Investment Securities
Our investment securities, including available-for-sale financial assets and held-to-maturity investments, totaled ¥37,324,100 million at March 31, 2012, an increase of ¥2,661,994 million, or 8%, from ¥34,662,106 million at March 31, 2011. The increase of our investment securities was due mainly to an increase in our holdings of Japanese government bonds.
Our bond portfolio is principally held for asset and liability management purposes. Our bond portfolio mostly consisted of fixed-rate Japanese government bonds, Japanese municipal bonds and high-quality corporate bonds denominated in yen.
Our held-to-maturity investments amounted to ¥5,277,268 million at March 31, 2012, an increase of ¥1,095,428 million, or 26%, from ¥4,181,840 million at March 31, 2011, mainly due to an increase in Japanese government bonds, which are the principal components of our held-to-maturity investments portfolio.
As to our domestic available-for-sale financial assets, we had ¥23,327,116 million of domestic debt instruments at March 31, 2012, an increase of ¥2,112,198 million from ¥21,214,918 million at March 31, 2011. The increase was also due mainly to an increase in investments in Japanese government bonds, especially with a maturity of less than five years. The reason behind the increase included prolonged limited demand of domestic mid-sized companies and SMEs for funding, in spite of an increase in domestic deposits. Japanese government bonds with a maturity of less than a year and Japanese government bonds with a maturity of less than five years accounted for 32% and 98%, respectively, of our total Japanese government bonds. We managed the average duration of our Japanese government bonds to be less than two years.
As for our foreign available-for-sale financial assets, we had ¥5,530,814 million of debt instruments at March 31, 2012, including ¥4,942,944 million of foreign government bonds consisting mainly of U.S. government bonds. Of our foreign government bonds, 96% had a maturity of less than five years.
We had ¥2,837,017 million of domestic equity instruments and ¥351,885 million of foreign equity instruments at March 31, 2012. Our domestic equity instruments, which consisted principally of publicly traded Japanese stocks and included common and preferred stocks issued by our customers, decreased by ¥48,380 million, or 2%, from ¥2,885,397 million at March 31, 2011. Net unrealized gains on our domestic equity instruments increased by ¥67,204 million from ¥849,253 million at March 31, 2011 to ¥916,457 million at March 31, 2012. The increase is partly due to the rise in the market prices of these stocks in an overall environment where, as described in “Overview—Operating Environment,” the Nikkei 225 Index rose from ¥9,755.10 at March 31, 2011 to ¥10,083.56 at March 31, 2012. Net unrealized gains on our foreign equity instruments increased by ¥11,424 million from ¥77,138 million at March 31, 2011 to ¥88,562 million at March 31, 2012.
We recognize the risks associated with our equity portfolio, owing to its volatility as well as its relatively poor dividend yields. Accordingly, we have been actively looking to minimize the negative effect of holding a large equity portfolio through economic hedging and derivative transactions while maintaining existing client relationships. We also have been reducing our equity portfolio to comply with the Act Concerning Restriction on Shareholdings by Banks, which requires Japanese banks and their qualified subsidiaries to limit the aggregate market value (excluding unrealized gains, if any) of their equity securities holdings to an amount equal to 100% of their consolidated Tier I capital. At March 31, 2012, our consolidated Tier I capital calculated under Japanese GAAP was ¥6,272,260 million.
There are no transactions pursuant to our repurchase agreements, securities lending transactions or other transactions involving the transfer of financial assets with an obligation to repurchase such transferred assets that are treated as sales for accounting purposes in our consolidated financial statements.
90
The following tables show the amortized cost, gross unrealized gains and losses and estimated fair value of our investment securities, which are classified as held-to-maturity investments and available-for-sale financial assets at March 31, 2012, 2011 and 2010.
| | | | | | | | | | | | | | | | |
| | | At March 31, 2012 | |
| | | Amortized
cost | | | Gross unrealized
gains | | | Gross unrealized
losses | | | Estimated
fair value | |
| | | (In millions) | |
Held-to-maturity investments: | | | | | | | | | | | | | | | | |
Domestic: | | | | | | | | | | | | | | | | |
Japanese government bonds | | ¥ | 4,857,096 | | | ¥ | 62,369 | | | ¥ | 91 | | | ¥ | 4,919,374 | |
Japanese municipal bonds | | | 177,732 | | | | 2,814 | | | | 3 | | | | 180,543 | |
Japanese corporate bonds | | | 242,440 | | | | 4,507 | | | | 10 | | | | 246,937 | |
| | | | | | | | | | | | | | | | |
Total domestic | | | 5,277,268 | | | | 69,690 | | | | 104 | | | | 5,346,854 | |
| | | | | | | | | | | | | | | | |
Foreign | | | — | | | | — | | | | — | | | | — | |
| | | | | | | | | | | | | | | | |
Total | | ¥ | 5,277,268 | | | ¥ | 69,690 | | | ¥ | 104 | | | ¥ | 5,346,854 | |
| | | | | | | | | | | | | | | | |
Available-for-sale financial assets: | | | | | | | | | | | | | | | | |
Domestic: | | | | | | | | | | | | | | | | |
Japanese government bonds | | ¥ | 22,502,697 | | | ¥ | 28,365 | | | ¥ | 769 | | | ¥ | 22,530,293 | |
Japanese municipal bonds | | | 295,664 | | | | 2,167 | | | | 16 | | | | 297,815 | |
Japanese corporate bonds | | | 380,595 | | | | 2,323 | | | | 955 | | | | 381,963 | |
Other debt instruments | | | 117,045 | | | | — | | | | — | | | | 117,045 | |
Equity instruments | | | 1,920,560 | | | | 926,259 | | | | 9,802 | | | | 2,837,017 | |
| | | | | | | | | | | | | | | | |
Total domestic | | | 25,216,561 | | | | 959,114 | | | | 11,542 | | | | 26,164,133 | |
| | | | | | | | | | | | | | | | |
Foreign: | | | | | | | | | | | | | | | | |
U.S. Treasury and other U.S. government agencies bonds | | | 4,410,599 | | | | 4,458 | | | | 10,288 | | | | 4,404,769 | |
Other governments and official institutions bonds | | | 538,661 | | | | 331 | | | | 817 | | | | 538,175 | |
Mortgage-backed securities | | | 324,391 | | | | 6,710 | | | | 30 | | | | 331,071 | |
Other debt instruments | | | 256,878 | | | | 2,397 | | | | 2,476 | | | | 256,799 | |
Equity instruments | | | 263,323 | | | | 88,739 | | | | 177 | | | | 351,885 | |
| | | | | | | | | | | | | | | | |
Total foreign | | | 5,793,852 | | | | 102,635 | | | | 13,788 | | | | 5,882,699 | |
| | | | | | | | | | | | | | | | |
Total | | ¥ | 31,010,413 | | | ¥ | 1,061,749 | | | ¥ | 25,330 | | | ¥ | 32,046,832 | |
| | | | | | | | | | | | | | | | |
91
| | | | | | | | | | | | | | | | |
| | | At March 31, 2011 | |
| | | Amortized
cost | | | Gross unrealized
gains | | | Gross unrealized
losses | | | Estimated
fair value | |
| | | (In millions) | |
Held-to-maturity investments: | | | | | | | | | | | | | | | | |
Domestic: | | | | | | | | | | | | | | | | |
Japanese government bonds | | ¥ | 3,763,715 | | | ¥ | 53,247 | | | ¥ | 1,464 | | | ¥ | 3,815,498 | |
Japanese municipal bonds | | | 171,516 | | | | 2,723 | | | | 39 | | | | 174,200 | |
Japanese corporate bonds | | | 246,609 | | | | 5,853 | | | | 29 | | | | 252,433 | |
| | | | | | | | | | | | | | | | |
Total domestic | | | 4,181,840 | | | | 61,823 | | | | 1,532 | | | | 4,242,131 | |
| | | | | | | | | | | | | | | | |
Foreign | | | — | | | | — | | | | — | | | | — | |
| | | | | | | | | | | | | | | | |
Total | | ¥ | 4,181,840 | | | ¥ | 61,823 | | | ¥ | 1,532 | | | ¥ | 4,242,131 | |
| | | | | | | | | | | | | | | | |
Available-for-sale financial assets: | | | | | | | | | | | | | | | | |
Domestic: | | | | | | | | | | | | | | | | |
Japanese government bonds | | ¥ | 20,247,115 | | | ¥ | 4,824 | | | ¥ | 28,461 | | | ¥ | 20,223,478 | |
Japanese municipal bonds | | | 373,041 | | | | 1,350 | | | | 1,640 | | | | 372,751 | |
Japanese corporate bonds | | | 412,501 | | | | 2,440 | | | | 1,474 | | | | 413,467 | |
Other debt instruments | | | 202,768 | | | | 2,454 | | | | — | | | | 205,222 | |
Equity instruments | | | 2,036,144 | | | | 868,936 | | | | 19,683 | | | | 2,885,397 | |
| | | | | | | | | | | | | | | | |
Total domestic | | | 23,271,569 | | | | 880,004 | | | | 51,258 | | | | 24,100,315 | |
| | | | | | | | | | | | | | | | |
Foreign: | | | | | | | | | | | | | | | | |
U.S. Treasury and other U.S. government agencies bonds | | | 4,354,133 | | | | 3,006 | | | | 73,879 | | | | 4,283,260 | |
Other governments and official institutions bonds | | | 1,288,687 | | | | 421 | | | | 23,186 | | | | 1,265,922 | |
Mortgage-backed securities | | | 210,930 | | | | 866 | | | | 5,952 | | | | 205,844 | |
Other debt instruments | | | 292,702 | | | | 2,179 | | | | 1,308 | | | | 293,573 | |
Equity instruments | | | 254,214 | | | | 77,177 | | | | 39 | | | | 331,352 | |
| | | | | | | | | | | | | | | | |
Total foreign | | | 6,400,666 | | | | 83,649 | | | | 104,364 | | | | 6,379,951 | |
| | | | | | | | | | | | | | | | |
Total | | ¥ | 29,672,235 | | | ¥ | 963,653 | | | ¥ | 155,622 | | | ¥ | 30,480,266 | |
| | | | | | | | | | | | | | | | |
92
| | | | | | | | | | | | | | | | |
| | | At March 31, 2010 | |
| | | Amortized
cost | | | Gross unrealized
gains | | | Gross unrealized
losses | | | Estimated
fair value | |
| | | (In millions) | |
Held-to-maturity investments: | | | | | | | | | | | | | | | | |
Domestic: | | | | | | | | | | | | | | | | |
Japanese government bonds | | ¥ | 2,871,212 | | | ¥ | 49,223 | | | ¥ | 627 | | | ¥ | 2,919,808 | |
Japanese municipal bonds | | | 154,281 | | | | 3,080 | | | | 3 | | | | 157,358 | |
Japanese corporate bonds | | | 246,519 | | | | 7,044 | | | | 106 | | | | 253,457 | |
| | | | | | | | | | | | | | | | |
Total domestic | | | 3,272,012 | | | | 59,347 | | | | 736 | | | | 3,330,623 | |
| | | | | | | | | | | | | | | | |
Foreign | | | — | | | | — | | | | — | | | | — | |
| | | | | | | | | | | | | | | | |
Total | | ¥ | 3,272,012 | | | ¥ | 59,347 | | | ¥ | 736 | | | ¥ | 3,330,623 | |
| | | | | | | | | | | | | | | | |
Available-for-sale financial assets: | | | | | | | | | | | | | | | | |
Domestic: | | | | | | | | | | | | | | | | |
Japanese government bonds | | ¥ | 11,901,492 | | | ¥ | 27,597 | | | ¥ | 3,602 | | | ¥ | 11,925,487 | |
Japanese municipal bonds | | | 266,387 | | | | 2,065 | | | | 161 | | | | 268,291 | |
Japanese corporate bonds | | | 435,063 | | | | 3,752 | | | | 151 | | | | 438,664 | |
Other debt instruments | | | 205,108 | | | | 12,531 | | | | — | | | | 217,639 | |
Equity instruments | | | 2,147,999 | | | | 1,029,956 | | | | 9,635 | | | | 3,168,320 | |
| | | | | | | | | | | | | | | | |
Total domestic | | | 14,956,049 | | | | 1,075,901 | | | | 13,549 | | | | 16,018,401 | |
| | | | | | | | | | | | | | | | |
Foreign: | | | | | | | | | | | | | | | | |
U.S. Treasury and other U.S. government agencies bonds | | | 2,071,258 | | | | 1,540 | | | | 23,252 | | | | 2,049,546 | |
Other governments and official institutions bonds | | | 1,283,130 | | | | 2,624 | | | | 2,163 | | | | 1,283,591 | |
Mortgage-backed securities | | | 4,595 | | | | 46 | | | | 4 | | | | 4,637 | |
Other debt instruments | | | 223,396 | | | | 2,408 | | | | 949 | | | | 224,855 | |
Equity instruments | | | 196,383 | | | | 103,138 | | | | 375 | | | | 299,146 | |
| | | | | | | | | | | | | | | | |
Total foreign | | | 3,778,762 | | | | 109,756 | | | | 26,743 | | | | 3,861,775 | |
| | | | | | | | | | | | | | | | |
Total | | ¥ | 18,734,811 | | | ¥ | 1,185,657 | | | ¥ | 40,292 | | | ¥ | 19,880,176 | |
| | | | | | | | | | | | | | | | |
93
The following tables show the estimated fair value and gross unrealized losses of our investment securities, aggregated by the length of time that the individual securities have been in a continuous unrealized loss position at March 31, 2012, 2011 and 2010. Note that none of the available-for-sale equity instruments included in the table have been in a continuous unrealized loss position for more than twelve months, since under our accounting policy, a significant or prolonged decline in the fair value of an equity instrument below its cost is considered to be an objective evidence of impairment.
| | | | | | | | | | | | | | | | | | | | | | | | |
| | | At March 31, 2012 | |
| | | Less than twelve months | | | Twelve months or more | | | Total | |
| | | Estimated
fair value | | | Gross unrealized
losses | | | Estimated
fair value | | | Gross unrealized
losses | | | Estimated
fair value | | | Gross unrealized
losses | |
| | | (In millions) | |
Held-to-maturity investments: | | | | | | | | | | | | | | | | | | | | | | | | |
Domestic: | | | | | | | | | | | | | | | | | | | | | | | | |
Japanese government bonds | | ¥ | 69,930 | | | ¥ | 91 | | | ¥ | — | | | ¥ | — | | | ¥ | 69,930 | | | ¥ | 91 | |
Japanese municipal bonds | | | 2,299 | | | | 3 | | | | — | | | | — | | | | 2,299 | | | | 3 | |
Japanese corporate bonds | | | — | | | | — | | | | 2,507 | | | | 10 | | | | 2,507 | | | | 10 | |
| | | | | | | | | | | | | | | | | | | | | | | | |
Total domestic | | | 72,229 | | | | 94 | | | | 2,507 | | | | 10 | | | | 74,736 | | | | 104 | |
| | | | | | | | | | | | | | | | | | | | | | | | |
Foreign | | | — | | | | — | | | | — | | | | — | | | | — | | | | — | |
| | | | | | | | | | | | | | | | | | | | | | | | |
Total | | ¥ | 72,229 | | | ¥ | 94 | | | ¥ | 2,507 | | | ¥ | 10 | | | ¥ | 74,736 | | | ¥ | 104 | |
| | | | | | | | | | | | | | | | | | | | | | | | |
Available-for-sale financial assets: | | | | | | | | | | | | | | | | | | | | | | | | |
Domestic: | | | | | | | | | | | | | | | | | | | | | | | | |
Japanese government bonds | | ¥ | 2,794,099 | | | ¥ | 767 | | | ¥ | 47,014 | | | ¥ | 2 | | | ¥ | 2,841,113 | | | ¥ | 769 | |
Japanese municipal bonds | | | 7,589 | | | | 16 | | | | 113 | | | | — | | | | 7,702 | | | | 16 | |
Japanese corporate bonds | | | 53,860 | | | | 92 | | | | 24,402 | | | | 863 | | | | 78,262 | | | | 955 | |
Other debt instruments | | | — | | | | — | | | | — | | | | — | | | | — | | | | — | |
Equity instruments | | | 77,543 | | | | 9,802 | | | | — | | | | — | | | | 77,543 | | | | 9,802 | |
| | | | | | | | | | | | | | | | | | | | | | | | |
Total domestic | | | 2,933,091 | | | | 10,677 | | | | 71,529 | | | | 865 | | | | 3,004,620 | | | | 11,542 | |
| | | | | | | | | | | | | | | | | | | | | | | | |
Foreign: | | | | | | | | | | | | | | | | | | | | | | | | |
U.S. Treasury and other U.S. government agencies bonds | | | 2,093,570 | | | | 10,288 | | | | — | | | | — | | | | 2,093,570 | | | | 10,288 | |
Other governments and official institutions bonds | | | 338,227 | | | | 794 | | | | 38,942 | | | | 23 | | | | 377,169 | | | | 817 | |
Mortgage-backed securities | | | 91 | | | | 8 | | | | 8,164 | | | | 22 | | | | 8,255 | | | | 30 | |
Other debt instruments | | | 75,205 | | | | 362 | | | | 49,585 | | | | 2,114 | | | | 124,790 | | | | 2,476 | |
Equity instruments | | | 8,076 | | | | 177 | | | | — | | | | — | | | | 8,076 | | | | 177 | |
| | | | | | | | | | | | | | | | | | | | | | | | |
Total foreign | | | 2,515,169 | | | | 11,629 | | | | 96,691 | | | | 2,159 | | | | 2,611,860 | | | | 13,788 | |
| | | | | | | | | | | | | | | | | | | | | | | | |
Total | | ¥ | 5,448,260 | | | ¥ | 22,306 | | | ¥ | 168,220 | | | ¥ | 3,024 | | | ¥ | 5,616,480 | | | ¥ | 25,330 | |
| | | | | | | | | | | | | | | | | | | | | | | | |
94
| | | | | | | | | | | | | | | | | | | | | | | | |
| | | At March 31, 2011 | |
| | | Less than twelve months | | | Twelve months or more | | | Total | |
| | | Estimated
fair value | | | Gross unrealized
losses | | | Estimated
fair value | | | Gross unrealized
losses | | | Estimated
fair value | | | Gross unrealized
losses | |
| | | (In millions) | |
Held-to-maturity investments: | | | | | | | | | | | | | | | | | | | | | | | | |
Domestic: | | | | | | | | | | | | | | | | | | | | | | | | |
Japanese government bonds | | ¥ | 378,410 | | | ¥ | 1,464 | | | ¥ | — | | | ¥ | — | | | ¥ | 378,410 | | | ¥ | 1,464 | |
Japanese municipal bonds | | | 11,860 | | | | 39 | | | | — | | | | — | | | | 11,860 | | | | 39 | |
Japanese corporate bonds | | | 2,679 | | | | 12 | | | | 2,482 | | | | 17 | | | | 5,161 | | | | 29 | |
| | | | | | | | | | | | | | | | | | | | | | | | |
Total domestic | | | 392,949 | | | | 1,515 | | | | 2,482 | | | | 17 | | | | 395,431 | | | | 1,532 | |
| | | | | | | | | | | | | | | | | | | | | | | | |
Foreign | | | — | | | | — | | | | — | | | | — | | | | — | | | | — | |
| | | | | | | | | | | | | | | | | | | | | | | | |
Total | | ¥ | 392,949 | | | ¥ | 1,515 | | | ¥ | 2,482 | | | ¥ | 17 | | | ¥ | 395,431 | | | ¥ | 1,532 | |
| | | | | | | | | | | | | | | | | | | | | | | | |
Available-for-sale financial assets: | | | | | | | | | | | | | | | | | | | | | | | | |
Domestic: | | | | | | | | | | | | | | | | | | | | | | | | |
Japanese government bonds | | ¥ | 13,496,173 | | | ¥ | 28,461 | | | ¥ | — | | | ¥ | — | | | ¥ | 13,496,173 | | | ¥ | 28,461 | |
Japanese municipal bonds | | | 176,313 | | | | 1,640 | | | | 80 | | | | — | | | | 176,393 | | | | 1,640 | |
Japanese corporate bonds | | | 134,558 | | | | 1,469 | | | | 1,328 | | | | 5 | | | | 135,886 | | | | 1,474 | |
Other debt instruments | | | — | | | | — | | | | — | | | | — | | | | — | | | | — | |
Equity instruments | | | 221,122 | | | | 19,683 | | | | — | | | | — | | | | 221,122 | | | | 19,683 | |
| | | | | | | | | | | | | | | | | | | | | | | | |
Total domestic | | | 14,028,166 | | | | 51,253 | | | | 1,408 | | | | 5 | | | | 14,029,574 | | | | 51,258 | |
| | | | | | | | | | | | | | | | | | | | | | | | |
Foreign: | | | | | | | | | | | | | | | | | | | | | | | | |
U.S. Treasury and other U.S. government agencies bonds | | | 2,785,682 | | | | 71,332 | | | | 40,601 | | | | 2,547 | | | | 2,826,283 | | | | 73,879 | |
Other governments and official institutions bonds | | | 956,761 | | | | 23,158 | | | | 12,819 | | | | 28 | | | | 969,580 | | | | 23,186 | |
Mortgage-backed securities | | | 139,860 | | | | 5,951 | | | | 340 | | | | 1 | | | | 140,200 | | | | 5,952 | |
Other debt instruments | | | 114,576 | | | | 1,179 | | | | 17,578 | | | | 129 | | | | 132,154 | | | | 1,308 | |
Equity instruments | | | 1,010 | | | | 39 | | | | — | | | | — | | | | 1,010 | | | | 39 | |
| | | | | | | | | | | | | | | | | | | | | | | | |
Total foreign | | | 3,997,889 | | | | 101,659 | | | | 71,338 | | | | 2,705 | | | | 4,069,227 | | | | 104,364 | |
| | | | | | | | | | | | | | | | | | | | | | | | |
Total | | ¥ | 18,026,055 | | | ¥ | 152,912 | | | ¥ | 72,746 | | | ¥ | 2,710 | | | ¥ | 18,098,801 | | | ¥ | 155,622 | |
| | | | | | | | | | | | | | | | | | | | | | | | |
95
| | | | | | | | | | | | | | | | | | | | | | | | |
| | | At March 31, 2010 | |
| | | Less than twelve months | | | Twelve months or more | | | Total | |
| | | Estimated
fair value | | | Gross unrealized
losses | | | Estimated
fair value | | | Gross unrealized
losses | | | Estimated
fair value | | | Gross unrealized
losses | |
| | | (In millions) | |
Held-to-maturity investments: | | | | | | | | | | | | | | | | | | | | | | | | |
Domestic: | | | | | | | | | | | | | | | | | | | | | | | | |
Japanese government bonds | | ¥ | 319,472 | | | ¥ | 627 | | | ¥ | — | | | ¥ | — | | | ¥ | 319,472 | | | ¥ | 627 | |
Japanese municipal bonds | | | 2,698 | | | | 3 | | | | — | | | | — | | | | 2,698 | | | | 3 | |
Japanese corporate bonds | | | 1,842 | | | | 68 | | | | 2,957 | | | | 38 | | | | 4,799 | | | | 106 | |
| | | | | | | | | | | | | | | | | | | | | | | | |
Total domestic | | | 324,012 | | | | 698 | | | | 2,957 | | | | 38 | | | | 326,969 | | | | 736 | |
| | | | | | | | | | | | | | | | | | | | | | | | |
Foreign | | | — | | | | — | | | | — | | | | — | | | | — | | | | — | |
| | | | | | | | | | | | | | | | | | | | | | | | |
Total | | ¥ | 324,012 | | | ¥ | 698 | | | ¥ | 2,957 | | | ¥ | 38 | | | ¥ | 326,969 | | | ¥ | 736 | |
| | | | | | | | | | | | | | | | | | | | | | | | |
Available-for-sale financial assets: | | | | | | | | | | | | | | | | | | | | | | | | |
Domestic: | | | | | | | | | | | | | | | | | | | | | | | | |
Japanese government bonds | | ¥ | 4,586,496 | | | ¥ | 3,164 | | | ¥ | 23,260 | | | ¥ | 438 | | | ¥ | 4,609,756 | | | ¥ | 3,602 | |
Japanese municipal bonds | | | 88,816 | | | | 156 | | | | 2,705 | | | | 5 | | | | 91,521 | | | | 161 | |
Japanese corporate bonds | | | 45,034 | | | | 147 | | | | 12,785 | | | | 4 | | | | 57,819 | | | | 151 | |
Other debt instruments | | | — | | | | — | | | | — | | | | — | | | | — | | | | — | |
Equity instruments | | | 106,743 | | | | 9,635 | | | | — | | | | — | | | | 106,743 | | | | 9,635 | |
| | | | | | | | | | | | | | | | | | | | | | | | |
Total domestic | | | 4,827,089 | | | | 13,102 | | | | 38,750 | | | | 447 | | | | 4,865,839 | | | | 13,549 | |
| | | | | | | | | | | | | | | | | | | | | | | | |
Foreign: | | | | | | | | | | | | | | | | | | | | | | | | |
U.S. Treasury and other U.S. government agencies bonds | | | 890,407 | | | | 9,903 | | | | 485,296 | | | | 13,349 | | | | 1,375,703 | | | | 23,252 | |
Other governments and official institutions bonds | | | 238,518 | | | | 237 | | | | 71,439 | | | | 1,926 | | | | 309,957 | | | | 2,163 | |
Mortgage-backed securities | | | — | | | | — | | | | 2,303 | | | | 4 | | | | 2,303 | | | | 4 | |
Other debt instruments | | | 87,727 | | | | 482 | | | | 18,568 | | | | 467 | | | | 106,295 | | | | 949 | |
Equity instruments | | | 5,259 | | | | 375 | | | | — | | | | — | | | | 5,259 | | | | 375 | |
| | | | | | | | | | | | | | | | | | | | | | | | |
Total foreign | | | 1,221,911 | | | | 10,997 | | | | 577,606 | | | | 15,746 | | | | 1,799,517 | | | | 26,743 | |
| | | | | | | | | | | | | | | | | | | | | | | | |
Total | | ¥ | 6,049,000 | | | ¥ | 24,099 | | | ¥ | 616,356 | | | ¥ | 16,193 | | | ¥ | 6,665,356 | | | ¥ | 40,292 | |
| | | | | | | | | | | | | | | | | | | | | | | | |
96
Trading Assets
The following table shows our trading assets at March 31, 2012 and 2011. Our trading assets were ¥4,461,258 million at March 31, 2012, an increase of ¥1,146,105 million from ¥3,315,153 million at March 31, 2011, primarily due to an increase in our holdings of Japanese government bonds.
Trading assets at March 31, 2012 and 2011 consisted of the following:
| | | | | | | | |
| | | At March 31, | |
| | | 2012 | | | 2011 | |
| | | (In millions) | |
Debt instruments | | ¥ | 4,132,979 | | | ¥ | 3,105,897 | |
Equity instruments | | | 328,279 | | | | 209,256 | |
| | | | | | | | |
Total trading assets | | ¥ | 4,461,258 | | | ¥ | 3,315,153 | |
| | | | | | | | |
Financial Assets at Fair Value Through Profit or Loss
The following table shows the fair value of our financial assets at fair value through profit or loss at March 31, 2012 and 2011. The fair value was ¥2,150,409 million at March 31, 2012, an increase from ¥2,132,348 million at March 31, 2011, primarily due to an increase in fair value of debt instruments.
| | | | | | | | |
| | | At March 31, | |
| | | 2012 | | | 2011 | |
| | | (In millions) | |
Debt instruments | | ¥ | 2,019,559 | | | ¥ | 1,995,810 | |
Equity instruments | | | 130,850 | | | | 136,538 | |
| | | | | | | | |
Total financial assets at fair value through profit or loss | | ¥ | 2,150,409 | | | ¥ | 2,132,348 | |
| | | | | | | | |
Exposures to Selected European Countries
At March 31, 2012, we had ¥464.9 billion of exposures to Greece, Italy, Ireland, Portugal and Spain, as indicated in the table below. Our exposures to those countries consisted mainly of loans, trade finances, guarantee and unused commitments to large corporations, and project finance transactions. All figures in this subsection are based on the data collected for our internal risk management.
| | | | | | | | | | | | | | | | |
| | | At March 31, 2012 | |
| | | Sovereign | | | Financial
institutions | | | Non-financial
corporations | | | Total | |
| | | (In billions) | |
Greece | | ¥ | — | | | ¥ | — | | | ¥ | 5.4 | | | ¥ | 5.4 | |
Italy | | | 0.1 | | | | 0.3 | | | | 240.7 | | | | 241.1 | |
Ireland | | | — | | | | 0.1 | | | | 35.9 | | | | 36.0 | |
Portugal | | | — | | | | 2.2 | | | | 1.9 | | | | 4.1 | |
Spain | | | 3.0 | | | | 9.1 | | | | 166.2 | | | | 178.3 | |
| | | | | | | | | | | | | | | | |
Total | | ¥ | 3.1 | | | ¥ | 11.7 | | | ¥ | 450.1 | | | ¥ | 464.9 | |
| | | | | | | | | | | | | | | | |
Securitized Products and Leveraged Loans
At March 31, 2012, we held ¥0.1 billion of subprime securitized products and ¥69.5 billion in other securitized products such as residential mortgage-backed securities (“RMBS”), commercial mortgage-backed securities (“CMBS”), and collateralized loan obligations (“CLO”). We have not incurred any losses on these
97
securitized products for the fiscal year ended March 31, 2012. At March 31, 2012, we had ¥419.8 billion in leveraged loans and ¥99.8 billion undrawn commitments for them as shown in the table below. The leveraged loans and undrawn commitments are reported in loans and advances and loan commitments, in the consolidated financial statements, respectively. All figures in this subsection are approximate amounts based on a managerial accounting basis.
| | | | | | | | | | | | | | | | |
| | | At March 31, | |
| | | 2012 | | | 2011 | |
| | | Loans | | | Undrawn
commitments | | | Loans | | | Undrawn
commitments | |
| | | (In billions) | |
Europe | | ¥ | 151.2 | | | ¥ | 20.7 | | | ¥ | 196.9 | | | ¥ | 23.4 | |
Japan | | | 131.0 | | | | 22.3 | | | | 183.5 | | | | 15.5 | |
United States | | | 75.6 | | | | 51.1 | | | | 77.2 | | | | 66.1 | |
Asia (excluding Japan) | | | 62.0 | | | | 5.7 | | | | 65.4 | | | | 7.7 | |
| | | | | | | | | | | | | | | | |
Total | | ¥ | 419.8 | | | ¥ | 99.8 | | | ¥ | 523.0 | | | ¥ | 112.7 | |
| | | | | | | | | | | | | | | | |
Liabilities
Our total liabilities increased by ¥5,339,313 million from ¥128,919,722 million at March 31, 2011 to ¥134,259,035 million at March 31, 2012, due primarily to an increase of deposits and debt securities in issue, partially offset by a decrease in borrowings.
The following table shows our liabilities at March 31, 2012 and 2011:
| | | | | | | | |
| | | At March 31, | |
| | | 2012 | | | 2011 | |
| | | (In millions) | |
Liabilities: | | | | | | | | |
Deposits | | ¥ | 92,853,566 | | | ¥ | 90,469,098 | |
Call money and bills sold | | | 2,144,600 | | | | 2,629,407 | |
Repurchase agreements and cash collateral on securities lent | | | 7,487,633 | | | | 6,439,598 | |
Trading liabilities | | | 2,173,567 | | | | 1,623,918 | |
Derivative financial instruments | | | 5,850,813 | | | | 4,725,261 | |
Borrowings | | | 10,412,858 | | | | 12,548,358 | |
Debt securities in issue | | | 7,377,742 | | | | 5,890,388 | |
Provisions | | | 425,350 | | | | 96,353 | |
Other liabilities | | | 5,401,790 | | | | 4,422,166 | |
Current tax liabilities | | | 61,786 | | | | 49,448 | |
Deferred tax liabilities | | | 69,330 | | | | 25,727 | |
| | | | | | | | |
Total liabilities | | ¥ | 134,259,035 | | | ¥ | 128,919,722 | |
| | | | | | | | |
Deposits
We offer a wide range of standard banking accounts through the offices of banking subsidiaries in Japan, including non-interest-bearing demand deposits, interest-bearing demand deposits, deposits at notice, time deposits and negotiable certificates of deposit. Domestic deposits, approximately 90% of total deposits, are our principal source of funds for our domestic operations. The domestic offices’ deposits of banking subsidiaries are principally from individuals and private corporations, with the balance from governmental bodies (including municipal authorities) and financial institutions.
The Bank’s foreign offices accept deposits mainly in U.S. dollars, but also in yen and other currencies, and are active participants in the Euro-currency market as well as the United States domestic money market. Foreign
98
deposits consist of stable types of deposits, such as deposits at notice, time deposits, and negotiable certificates of deposit, which the New York branch of the Bank and SMBC Europe issue in U.S. dollars and in other currencies. These deposits typically pay interest rates determined with reference to market rates of major money-center banks for deposits in London.
Our deposit balances at March 31, 2012 were ¥92,853,566 million, an increase of ¥2,384,468 million, or 3%, from ¥90,469,098 million at March 31, 2011, partially reflecting our efforts to expand and diversify our foreign currency funding sources.
The following table shows a breakdown of our domestic and foreign offices’ deposits at the dates indicated:
| | | | | | | | |
| | | At March 31, | |
| | | 2012 | | | 2011 | |
| | | (In millions) | |
Domestic offices: | | | | | | | | |
Non-interest-bearing demand deposits | | ¥ | 13,424,217 | | | ¥ | 12,550,557 | |
Interest-bearing demand deposits | | | 34,344,937 | | | | 32,756,899 | |
Deposits at notice | | | 855,577 | | | | 1,131,082 | |
Time deposits | | | 25,118,371 | | | | 25,348,713 | |
Negotiable certificates of deposit | | | 5,327,488 | | | | 5,997,958 | |
Others | | | 3,786,138 | | | | 3,950,740 | |
| | | | | | | | |
Total domestic offices | | | 82,856,728 | | | | 81,735,949 | |
| | | | | | | | |
Foreign offices: | | | | | | | | |
Non-interest-bearing demand deposits | | | 410,624 | | | | 337,090 | |
Interest-bearing demand deposits | | | 804,527 | | | | 680,292 | |
Deposits at notice | | | 3,642,208 | | | | 3,800,310 | |
Time deposits | | | 1,745,146 | | | | 1,533,773 | |
Negotiable certificates of deposit | | | 3,266,150 | | | | 2,368,365 | |
Others | | | 128,183 | | | | 13,319 | |
| | | | | | | | |
Total foreign offices | | | 9,996,838 | | | | 8,733,149 | |
| | | | | | | | |
Total deposits | | ¥ | 92,853,566 | | | ¥ | 90,469,098 | |
| | | | | | | | |
Borrowings
Borrowings include short-term borrowings, unsubordinated and subordinated long-term borrowings, liabilities associated with securitization of our own assets and lease obligations. At March 31, 2012, our borrowings were ¥10,412,858 million, a decrease of ¥2,135,500 million, or 17%, from ¥12,548,358 million at March 31, 2011, primarily due to a decrease in our short-term borrowings which increased at March 31, 2011 in connection with the effects of additional monetary easing by the BOJ owing to conditions resulting from the Great East Japan Earthquake.
At March 31, 2012, short-term borrowings accounted for 61% of our total borrowings, and our long-term borrowings accounted for 25% of our total borrowings. Most of our long-term borrowings were yen-denominated unsubordinated debt.
99
The following table shows the balances with respect to our borrowings at March 31, 2012 and 2011:
| | | | | | | | |
| | | At March 31, | |
| | | 2012 | | | 2011 | |
| | | (In millions) | |
Short-term borrowings | | ¥ | 6,392,554 | | | ¥ | 8,486,842 | |
Long-term borrowings: | | | | | | | | |
Unsubordinated | | | 2,253,600 | | | | 2,072,319 | |
Subordinated | | | 374,250 | | | | 371,233 | |
Liabilities associated with securitization transaction | | | 1,338,163 | | | | 1,552,987 | |
Lease obligations | | | 54,291 | | | | 64,977 | |
| | | | | | | | |
Total borrowings | | ¥ | 10,412,858 | | | ¥ | 12,548,358 | |
| | | | | | | | |
For more information, see Note 18 “Borrowings” to our consolidated financial statements included elsewhere in this annual report, which sets forth summaries of short- and long-term borrowings with their contractual interest rates and currencies.
Debt Securities in Issue
Debt securities in issue at March 31, 2012 were ¥7,377,742 million, an increase from ¥5,890,388 million at March 31, 2011 due primarily to an increase of commercial paper and senior bonds, which partly reflects our efforts to expand and diversify our foreign currency funding sources.
| | | | | | | | |
| | | At March 31, | |
| | | 2012 | | | 2011 | |
| | | (In millions) | |
Commercial paper | | ¥ | 2,743,664 | | | ¥ | 2,019,334 | |
Bonds | | | 2,224,116 | | | | 1,706,989 | |
Subordinated bonds | | | 2,398,100 | | | | 2,156,065 | |
Other | | | 11,862 | | | | 8,000 | |
| | | | | | | | |
Total debt securities in issue | | ¥ | 7,377,742 | | | ¥ | 5,890,388 | |
| | | | | | | | |
For additional information, see Note 19 “Debt Securities in Issue” to our consolidated financial statements included elsewhere in this annual report, which sets forth summaries of debt securities in issue with their contractual interest rates and currencies.
In the normal course of business, we enter into contractual obligations that require future cash payments. “Item 5.F. Tabular Disclosure of Contractual Obligations” sets forth a summary of our contractual cash obligations at March 31, 2012.
100
Total Equity
Our total equity increased by ¥64,186 million from ¥7,551,205 million at March 31, 2011 to ¥7,615,391 million at March 31, 2012, due primarily to an increase in retained earnings and other reserves, although capital surplus decreased and treasury stock increased. The increase in retained earnings mainly reflected our net profit. The decrease in capital surplus was due to our acquisition and cancellation of Type 6 preferred stock. For more information, see Note 24 “Shareholders’ Equity” and Note 25 “Non-controlling Interests” to our consolidated financial statements included elsewhere in this annual report.
| | | | | | | | |
| | | At March 31, | |
| | | 2012 | | | 2011 | |
| | | (In millions) | |
Capital stock | | ¥ | 2,337,896 | | | ¥ | 2,337,896 | |
Capital surplus | | | 862,933 | | | | 1,081,556 | |
Retained earnings | | | 2,162,696 | | | | 1,974,069 | |
Other reserves | | | 437,177 | | | | 280,783 | |
Treasury stock | | | (236,037 | ) | | | (171,761 | ) |
| | | | | | | | |
Equity attributable to shareholders of Sumitomo Mitsui Financial Group, Inc. | | | 5,564,665 | | | | 5,502,543 | |
Non-controlling interests | | | 2,050,726 | | | | 2,048,662 | |
| | | | | | | | |
Total equity | | ¥ | 7,615,391 | | | ¥ | 7,551,205 | |
| | | | | | | | |
Reconciliation with Japanese GAAP
Our consolidated financial statements are prepared in accordance with IFRS as summarized in Note 2 “Summary of Significant Accounting Policies” to our consolidated financial statements included elsewhere in this annual report. These policies differ in some respects from Japanese GAAP. Under Japanese banking regulations, we report our annual financial results prepared under Japanese GAAP. To show the major reconciling items between our IFRS and Japanese GAAP consolidated financial statements, we have provided below, with respect to our most recent fiscal year, a reconciliation of consolidated net profit and total equity under IFRS with those amounts under Japanese GAAP.
| | | | | | | | |
| | | At and for the fiscal year ended
March 31, 2012 | |
| | | Total equity | | | Net profit | |
| | | (In millions) | |
IFRS | | ¥ | 7,615,391 | | | ¥ | 457,998 | |
Differences arising from different accounting for: | | | | | | | | |
1. Scope of consolidation | | | 80,406 | | | | 1,094 | |
2. Derivative financial instruments | | | 130,263 | | | | 56,463 | |
3. Investment securities | | | (130,799 | ) | | | 43,226 | |
4. Loans and advances | | | (138,103 | ) | | | 5,110 | |
5. Investments in associates and joint ventures | | | 27,548 | | | | (23,375 | ) |
6. Property, plant and equipment | | | (5,083 | ) | | | (6,130 | ) |
7. Lease accounting | | | (15,538 | ) | | | 5,333 | |
8. Defined benefit plans | | | 30,967 | | | | (34,284 | ) |
9. Deferred tax assets | | | (321,155 | ) | | | 166,904 | |
10. Foreign currency translation | | | — | | | | (646 | ) |
Others | | | (87,455 | ) | | | (13,016 | ) |
Tax effect of the above | | | 68,534 | | | | (17,050 | ) |
| | | | | | | | |
Japanese GAAP | | ¥ | 7,254,976 | | | ¥ | 641,627 | |
| | | | | | | | |
101
The explanations below summarize certain differences between IFRS and Japanese GAAP that may be significant. The paragraphs below refer to the corresponding items as set forth in the table above.
Under Japanese GAAP, we consolidate an entity when we effectively control the decision making body of the entity’s financial and operating policies. Control is generally presumed to exist when we own more than half of the voting power, or own from 40% to 50% of the voting power and certain facts exist indicating control. Certain SPEs established for securitization are presumed not to be controlled. Under IFRS, we consolidate an entity when we control the entity. Control is generally presumed to exist when we have the power to govern the financial and operating policies by owning more than half of the voting power, or by legal or contractual arrangements. Currently exercisable potential voting rights are considered in assessing the control. An SPE is consolidated when the substance of the relationship between the SPE and us indicate that the SPE is controlled by us. This results in a difference in the scope of consolidation between Japanese GAAP and IFRS. Most significantly certain SPEs, such as securitization vehicles (usually, trusts under the Trust Act of Japan) and investment funds, are not consolidated under Japanese GAAP but consolidated under IFRS. Accordingly, both the cumulative gains on transfers of financial assets to these securitization vehicles and amortization of our retained subordinate interest under Japanese GAAP were not recognized under IFRS due to consolidation of such vehicles.
| | 2. | Derivative financial instruments |
Under Japanese GAAP, an embedded derivative shall be separately accounted for when the host contract may suffer losses arising from the embedded derivative. Also, an entity may separately account for an embedded derivative if the entity manages it separately, even though the criteria for separation are not fully met. Under IFRS, an embedded derivative shall be separated from the host contract and accounted for as a derivative if, and only if its economic characteristics and risks are not closely related to those of the host contract. Accordingly, certain embedded derivatives that are separately accounted for under Japanese GAAP but do not meet the criteria for separation under IFRS are adjusted such that they are combined with the host contract, and vice versa. In addition, the separation of the embedded derivatives from the host contract is adjusted so as not to result in any gain or loss at initial recognition under IFRS.
We apply hedge accounting under Japanese GAAP. However, IFRS imposes onerous documentation and effectiveness testing requirements on entities wishing to apply hedge accounting. The result of these requirements is that it is more difficult to achieve hedge accounting under IFRS than under Japanese GAAP, and the effects of hedge accounting under Japanese GAAP have therefore been reversed under IFRS.
Japanese GAAP and IFRS require OTC derivatives to be measured at fair value. In principle, there is no significant difference in the definitions of fair value, but in practice there is diversity in the application of valuation techniques used for fair value under Japanese GAAP and IFRS. Therefore to meet the requirements of fair value under IFRS, adjustments have been made to the fair values under Japanese GAAP to reflect the spread between bid and ask prices, as well as credit risk adjustments for OTC derivatives. Certain guarantees under Japanese GAAP do not meet the definition of a financial guarantee under IFRS but meet that of a derivative. These guarantees are measured at fair value and the change in fair value is recognized in the consolidated income statement under IFRS.
Under Japanese GAAP, certain financial assets classified as available-for-sale, such as unlisted stocks, are measured at cost. However, under IFRS available-for-sale financial assets (and financial assets at fair value through profit or loss) should be measured at fair value. The fair value of financial instruments where there is no quoted price in an active market is determined by using valuation techniques. In addition, the fair values of
102
financial instruments under Japanese GAAP have been adjusted in order to meet the requirements of fair value under IFRS. For example, the last 1-month average of the closing transaction prices can be used for the fair value measurement of available-for-sale financial assets (listed stocks) under Japanese GAAP, whereas closing spot prices are used under IFRS. Additionally under IFRS, we classify certain hybrid instruments as financial assets at fair value through profit or loss as we are unable to measure the embedded derivative separately from its host contract although it is required to separate the embedded derivative from the host contract. Accordingly, the change in fair value of such hybrid instruments is recognized in profit or loss.
Under Japanese GAAP, we recognize impairment of available-for-sale equity instruments if the decline in fair value below the cost, less previously recognized impairment loss, is in general 50% or more. Under IFRS, we assess whether there is objective evidence that available-for-sale equity instruments are impaired, including a significant or prolonged decline in the fair value below cost and other qualitative impairment indicators.
Under Japanese GAAP, the reserve for possible loan losses for specifically identified significant loans is calculated by the discounted cash flow (“DCF”) method, which is based on the present value of reasonably estimated cash flows discounted at the original contractual interest rate of the loan. The reserve for possible loan losses for the remaining loans is collectively calculated using the historical loss experience, or individually calculated based on the estimated uncollectible amount considering the historical loss experience and the recoveries from collateral, guarantees and any other collectible cash flows. The historical loss experience for 1 year or 3 years, according to the obligor grade, is calculated basically based on the averaged historical results of at least the past three years. Under IFRS, the allowance for loan losses for individually significant impaired loans is calculated by the DCF method based on the best estimate of cash flows discounted at the original effective interest rate which differs from the calculation of the DCF method under Japanese GAAP. The scope of the loans that are subject to the DCF method under IFRS is wider than that under Japanese GAAP. The allowance for loan losses for the remaining loans is collectively calculated by homogeneous group using statistical methods based on the historical loss experience and incorporating the effect of the time value of money. A qualitative analysis based on related economic factors is then performed to reflect the current conditions at the end of the reporting period. The allowance for the non-impaired loan losses is calculated as the IBNI losses for the period between the impairment occurring and the loss being identified, which are different from the expected losses under Japanese GAAP.
Under Japanese GAAP, loan origination fees and costs are generally recognized in the consolidated income statement as incurred. Under IFRS, loan origination fees and costs that are incremental and directly attributable to the origination of a loan are deferred and thus, included in the calculation of the effective interest rate.
Under Japanese GAAP, loan commitments are not recognized in the consolidated statement of financial position. Provision for the credit risk on these commitments is included as part of the reserve for possible loan losses. Under IFRS, loan commitments are not recognized in the consolidated statement of financial position and a provision for the expected losses to us in relation to the loan commitments is measured based on IAS 37 “Provisions, Contingent Liabilities and Contingent Assets.” Under Japanese GAAP, all guarantee contracts are accounted for by accruing both asset and liability accounts at the nominal guarantee amount. A provision for the credit risk of the guarantee is calculated using the same method as the reserve for possible loan losses and is included as part of it. Under IFRS, a financial guarantee contract is specifically defined in IAS 39 “Financial Instruments: Recognition and Measurement” as a contract that requires the issuer to make specified payments to reimburse the holder for a loss it incurs because a specified debtor fails to make payment when due in accordance with the original or modified terms of the debt instruments. Financial guarantees are initially recognized at fair value and subsequently measured at the higher of the amount determined in accordance with IAS 37 or the amount initially recognized (i.e., fair value) less, when appropriate, cumulative amortization recognized in accordance with IAS 18 “Revenue.”
103
| | 5. | Investments in associates and joint ventures |
Under Japanese GAAP, although goodwill related to investments in associates and joint ventures is included in the carrying amount of the investments, we are required to recognize and measure impairment losses only on goodwill separately from the investments if impairment indicators for the goodwill are identified. Under IFRS, for investments in associates and joint ventures, if we identify objective evidence of impairment, the entire carrying amount of the investment is tested for impairment since goodwill is not separately recognized on the initial acquisition of the investment. Additionally, the net profit of associates is adjusted for differences between Japanese GAAP and IFRS in accordance with our accounting policy prior to applying the equity method under IFRS.
| | 6. | Property, plant and equipment |
For certain assets that are depreciated using the declining balance method under Japanese GAAP, we apply the straight-line method of depreciation to those assets under IFRS as we consider that the straight-line method most closely reflects the expected pattern of consumption of the future economic benefits embodied in those assets. Additionally under IFRS, residual values of assets are reviewed at least at the end of each reporting period. After reviews of all categories of property, plant and equipment, the residual values of assets are considered to be zero under IFRS, whereas residual values are assigned to certain assets under Japanese GAAP.
We account for finance lease transactions without a transfer of ownership commencing before April 1, 2008 as operating leases under Japanese GAAP. However, such accounting treatment is not allowed under IFRS. Thus, we made certain adjustments for those transactions in order to comply with the accounting treatment under IFRS. From the fiscal year beginning after April 1, 2008, a new Japanese GAAP standard for lease accounting became effective, which removed the differences for finance leases (with or without a transfer of ownership) between Japanese GAAP and IFRS. Therefore, no adjustment is needed for finance lease transactions entered into after April 1, 2008.
Under Japanese GAAP, the present value of the defined benefit obligation is discounted by the rates based on the market yields of long-term Japanese government bonds. Additionally, the discount rates for the previous reporting period can be used for the current reporting period, if the change in the present value of the defined benefit obligation caused by a change in the discount rates from the previous reporting period to the current reporting period is less than 10%. Under IFRS, the discount rates are determined by market yields on high quality corporate bonds at the end of each reporting period.
Under Japanese GAAP, the expected rates of return on plan assets for the previous reporting period can be used for the current reporting period, unless the impact of the profit or loss for the current reporting period is considered to be significant. Under IFRS, the expected return on plan assets is required to be estimated at the beginning of each reporting period based on market expectations for returns over the entire life of the related obligation.
Under Japanese GAAP, the actuarial gains and losses are amortized using the straight-line method. Under IFRS, we recognize actuarial gains and losses in excess of the greater of 10% of the fair value of plan assets and 10% of the present value of the defined benefit obligation over the employees’ expected average remaining working lives, in accordance with the corridor approach.
Under Japanese GAAP, past service costs are amortized using the straight-line method. Under IFRS, past service costs are recognized immediately in the consolidated income statement, unless the changes to the plan are conditional on the employees remaining in service for a specified period of time.
104
Under Japanese GAAP, pursuant to the practical guidelines issued by the JICPA, we recognize deferred tax assets to the extent that the realization of the tax benefit is highly probable based on the schedule within the certain period (5 years for the Bank). Under IFRS, deferred tax assets are recognized to the extent that it is probable that future taxable profit will be available against which the temporary differences can be utilized without limiting the period over which the temporary difference can be utilized. For example, deferred tax assets for deductible temporary differences relating to impairment of loans and advances and investment securities which cannot be utilized within the specified period are not recognized under Japanese GAAP, whereas they can be recognized under IFRS to the extent that it is probable that future taxable profit will be available.
| | 10. | Foreign currency translation |
Under Japanese GAAP, the income statement items of foreign operations are translated into Japanese yen, our presentation currency, using the (spot) closing rate, whereas under IFRS they are translated into the presentation currency using the exchange rate at the dates of the transactions or, if the exchange rates do not fluctuate significantly, at average exchange rates. In addition, under Japanese GAAP, certain foreign operations’ monetary items denominated in foreign currencies are translated into Japanese yen using the exchange rate at the end of the reporting date. However, under IFRS the monetary items for which settlement is neither planned nor likely to occur in the foreseeable future are translated using the exchange rates at the dates of initial transactions.
5.B. LIQUIDITY AND CAPITAL RESOURCES
We consistently endeavor to enhance the management of our liquidity profile and strengthen our capital base to meet our customers’ loan requirements and deposit withdrawals and respond to unforeseen situations such as adverse movements in stock, foreign currency, interest rate and other markets, or changes in general domestic or international conditions.
Liquidity
We derive funding for our operations both from domestic and international sources. Our domestic funding is derived primarily from deposits placed with the Bank by its corporate and individual customers, and also from call money (inter-bank), bills sold (inter-bank promissory notes), repurchase agreements, borrowings, and negotiable certificates of deposit issued by the Bank to domestic and international customers. Our international sources of funds are principally from deposits from corporate customers and inter-bank market, negotiable certificates of deposit, commercial papers, and also from reverse repurchase agreements and cash collateral on securities borrowed. We closely monitor maturity gaps and foreign exchange exposure in order to manage our liquidity profile.
As shown in the following table, total deposits increased by ¥2,384,468 million, or 3%, from ¥90,469,098 million at March 31, 2011 to ¥92,853,566 million at March 31, 2012. The balance of deposits at March 31, 2012 exceeded the balance of loans and advances at the same time by ¥20,316,753 million due primarily to stable deposit base in Japan. Our loan-to-deposit ratio (total loans and advances divided by total deposits) in the same period was 78%, which contributed greatly to the reduction of our liquidity risk. Our balances of large-denomination domestic yen time deposits are stable due to the historically high rollover rate of our corporate customers and individual depositors.
| | | | | | | | |
| | | At March 31, | |
| | | 2012 | | | 2011 | |
| | | (In millions) | |
Loans and advances | | ¥ | 72,536,813 | | | ¥ | 71,020,329 | |
Deposits | | | 92,853,566 | | | | 90,469,098 | |
105
We have invested the excess balance of deposits against loans and advances primarily in marketable securities and other highly liquid assets, such as Japanese government bonds. The Bank’s Treasury Unit actively monitors the movement of interest rates and maturity profile of its bond portfolio as part of the Bank’s overall risk management. The bonds can be used to enhance liquidity. When needed, they can be used as collateral for call money or other money market funding or short-term borrowings from the BOJ.
Secondary sources of liquidity included short-term debts, such as call money, bills sold, and commercial paper issued at an inter-bank or other wholesale markets. We also issue long-term debts, including both senior and subordinated debts, as additional sources of liquidity. With short- and long-term debts, we can diversify our funding sources and effectively manage our funding costs and enhance our capital adequacy ratios when appropriate.
We source our funding in foreign currencies primarily from financial institutions, general corporations and institutional investors, through short- and long-term financing. Even if we encounter declines in our credit quality or that of Japan in the future, we expect to be able to purchase foreign currencies in sufficient amounts using the yen funds raised through our domestic customer base. As further measures to support our foreign currency liquidity, we hold foreign debt securities, maintain credit lines and swap facilities denominated in foreign currencies and pledge collateral to the U.S. Federal Reserve Bank to support future credit extensions.
We maintain management and control systems to support our ability to access liquidity on a stable and cost-effective basis.
We believe we are able to access such sources of liquidity on a stable and flexible basis by keeping credit ratings at a high level. The following table shows credit ratings assigned to SMFG by S&P and Fitch at July 20, 2012:
| | | | | | | | | | |
At July 20, 2012 |
S&P | | Fitch |
Long-term | | Outlook | | Short-term | | Long-term | | Outlook | | Short-term |
A | | N | | A-1 | | A- | | S | | F1 |
The following table shows credit ratings assigned to the Bank by S&P and Fitch at July 20, 2012:
| | | | | | | | | | |
At July 20, 2012 |
S&P | | Fitch |
Long-term | | Outlook | | Short-term | | Long-term | | Outlook | | Short-term |
A+ | | N | | A-1 | | A- | | S | | F1 |
We are assigned credit ratings by major domestic and international credit rating agencies. Credit ratings do not constitute recommendations to purchase, sell or hold a security, and rating agencies may review or indicate an intention to review ratings at any time. While the methodology and system of rating vary among rating agencies, credit ratings are generally based on information provided by us or independent sources, and can be influenced by credit ratings of Japanese government bonds and broader views of the Japanese financial system. Any downgrade in or withdrawal of these credit ratings, or any adverse change in these ratings relative to other financial institutions, could increase our borrowing costs, reduce our access to the capital markets and otherwise negatively affect our ability to raise funds, which in turn could have a negative impact on our liquidity position.
Capital Management
With regard to capital management, we rigidly abide by the capital adequacy guidelines set by the FSA. Japan’s capital adequacy guidelines are based on the Basel Capital Accord, which was proposed by the Basel Committee for uniform application to all banks which have international operations in industrialized countries.
106
Japan’s capital adequacy guidelines are different from those of central banks or supervisors of other countries due to reflection of FSA’s design to suit the Japanese banking environment. The FSA capital adequacy guidelines mandate that Japanese banks and bank holding companies that have international operations maintain a minimum capital ratio of 8%.
Each of our figures for the Basel Capital Accord is calculated based on the financial statements prepared under Japanese GAAP.
The FSA capital adequacy guidelines permit Japanese banks to choose from the standardized approach (“SA”), the foundation IRB approach and the advanced IRB approach as to credit-risk, and the basic indicator approach (“BIA”), the standardized approach (“TSA”) and the AMA as to operational risk. To be eligible to adopt the foundation IRB approach or the advanced IRB approach as to credit risk, and the TSA or the AMA as to operational risk, a Japanese bank must establish an advanced risk management systems and must receive prior approval from the FSA.
We and the Bank had initially adopted the foundation IRB approach for measuring exposure to credit risk effective from March 31, 2007, but we have adopted the advanced IRB approach since March 31, 2009. We and the Bank had initially adopted the BIA for measuring exposure to operational risk, but we have adopted the AMA since March 31, 2008.
In addition to the above mentioned framework, the FSA changed its regulations to increase the risk weights of resecuritization instruments and to revise certain trading book rules. These changes, commonly referred to as “Basel 2.5”, were implemented from December 2011. Our figures presented for March 31, 2012 are based on the revised Basel 2.5 capital requirements and our figures presented for March 31, 2011 are pursuant to the prior capital framework (referred to as “Basel II”).
107
The table below presents our total qualifying capital, risk-weighted assets and risk-weighted capital ratios at March 31, 2012 and 2011:
| | | | | | | | |
| | | At March 31, | |
| | | 2012 | | | 2011 | |
| | | (In millions, except percentages) | |
Tier I capital: | | | | | | | | |
Capital stock | | ¥ | 2,337,895 | | | ¥ | 2,337,895 | |
Capital surplus | | | 759,800 | | | | 978,851 | |
Retained earnings | | | 2,152,654 | | | | 1,776,433 | |
Treasury stock | | | (236,037 | ) | | | (171,760 | ) |
Minority interests | | | 2,030,638 | | | | 2,029,481 | |
Cash dividends to be paid | | | (68,230 | ) | | | (73,612 | ) |
Unrealized losses on other securities | | | — | | | | — | |
Foreign currency translation adjustments | | | (141,382 | ) | | | (122,889 | ) |
Stock acquisition rights | | | 692 | | | | 262 | |
Goodwill and others | | | (496,434 | ) | | | (394,343 | ) |
Gains on securitization transactions | | | (38,284 | ) | | | (36,324 | ) |
Amount equivalent to 50% of expected losses in excess of qualifying reserves | | | (29,052 | ) | | | — | |
Deductions of deferred tax assets(1) | | | — | | | | — | |
| | | | | | | | |
Total Tier I capital | | | 6,272,260 | | | | 6,323,995 | |
| | | | | | | | |
Tier II capital: | | | | | | | | |
Unrealized gains on other securities after 55% discount | | | 214,611 | | | | 169,267 | |
Land revaluation excess after 55% discount | | | 35,755 | | | | 35,739 | |
General reserve for possible loan losses | | | 66,695 | | | | 100,023 | |
Excess amount of provisions | | | — | | | | 21,742 | |
Subordinated debt | | | 2,454,062 | | | | 2,210,184 | |
| | | | | | | | |
Total Tier II capital | | | 2,771,125 | | | | 2,536,958 | |
| | | | | | | | |
Deductions | | | (399,634 | ) | | | (428,082 | ) |
| | | | | | | | |
Total qualifying capital | | ¥ | 8,643,751 | | | ¥ | 8,432,871 | |
| | | | | | | | |
Risk-weighted assets: | | | | | | | | |
On-balance sheet items | | | 38,150,731 | | | | 38,985,243 | |
Off-balance sheet items | | | 7,825,808 | | | | 7,433,319 | |
Market risk items | | | 1,174,187 | | | | 584,020 | |
Operational risk | | | 3,892,505 | | | | 3,691,113 | |
| | | | | | | | |
Total risk-weighted assets | | ¥ | 51,043,232 | | | ¥ | 50,693,696 | |
| | | | | | | | |
Tier I risk-weighted capital ratio | | | 12.28 | % | | | 12.47 | % |
Total risk-weighted capital ratio | | | 16.93 | % | | | 16.63 | % |
| (1) | The amount of net deferred tax assets was ¥350,182 million and ¥624,219 million at March 31, 2012 and 2011, respectively. Also, the upper limit of the inclusion of deferred tax assets into Tier I Capital was ¥1,254,452 million and ¥1,264,799 million at March 31, 2012 and 2011, respectively. |
| (2) | Amounts less than ¥1 million are omitted in the table. As a result, the totals in Japanese yen shown in the above table do not necessarily agree with the sum of the individual amounts. |
The principal components of Tier I capital include capital stock, minority interests in consolidated subsidiaries and retained earnings under Japanese GAAP.
Minority interests in consolidated subsidiaries consist primarily of preferred securities issued to third-party investors by offshore funding vehicles. The proceeds from these issuances contribute to Tier I capital. As the
108
amount of these transactions that may be counted as Tier I capital is constrained by the amount of other Tier I capital and the outstanding amount of other similar transactions at the time of issuance, our ability to raise additional regulatory capital in this manner could be constrained in the future. At March 31, 2012, the minority interests in consolidated subsidiaries within our Tier I capital attributable to these preferred securities was ¥1,589 billion. These preferred securities are redeemable at the option of the issuer on, and on specified dates after, the initial optional redemption date, subject to the prior approval of the FSA. The following table shows the issue date, the aggregate issue amounts and the initial optional redemption dates for the preferred securities included within our Tier I capital at March 31, 2012:
| | | | | | | | | | | | |
| | | Issue date | | Aggregate issue
amount | | | Redemption
at the option
of Issuer(1) | | | Type |
| | | (In billions of yen or millions of dollars or pounds) |
Issued by SMFG’s subsidiaries: | | | | | | | | | | | | |
SMFG Preferred Capital USD 1 Limited(2) | | Dec. 2006 | | $ | 1,650.0 | | | | Jan. 2017 | | | Step-up |
SMFG Preferred Capital GBP 1 Limited(2) | | Dec. 2006 | | £ | 500.0 | | | | Jan. 2017 | | | Step-up |
SMFG Preferred Capital JPY 1 Limited | | Feb. 2008 | | ¥ | 135.0 | | | | Jan. 2018 | | | Non step-up |
SMFG Preferred Capital USD 2 Limited | | May 2008 | | $ | 1,800.0 | | | | Jul. 2013 | | | Non step-up |
SMFG Preferred Capital USD 3 Limited | | Jul. 2008 | | $ | 1,350.0 | | | | Jul. 2018 | | | Step-up |
SMFG Preferred Capital GBP 2 Limited | | Jul. 2008 | | £ | 250.0 | | | | Jan. 2029 | | | Step-up |
SMFG Preferred Capital JPY 2 Limited | | Dec. 2008 – Jan. 2009 | | ¥ | 698.9 | | | | Jan. 2014 | | | Step-up / Non step-up |
Series A | | Dec. 2008 | | ¥ | 113.0 | | | | Jan. 2019 | | | Step-up |
Series B | | Dec. 2008 | | ¥ | 140.0 | | | | Jul. 2019 | | | Non Step-up |
Series C | | Dec. 2008 | | ¥ | 140.0 | | | | Jan. 2016 | | | Non step-up |
Series D | | Dec. 2008 | | ¥ | 145.2 | | | | Jan. 2014 | | | Non step-up |
Series E | | Jan. 2009 | | ¥ | 33.0 | | | | Jul. 2019 | | | Non step-up |
Series F | | Jan. 2009 | | ¥ | 2.0 | | | | Jan. 2016 | | | Non step-up |
Series G | | Jan. 2009 | | ¥ | 125.7 | | | | Jan. 2014 | | | Non step-up |
SMFG Preferred Capital JPY 3 Limited | | Sep. – Oct. 2009 | | ¥ | 388.0 | | | | Jan. 2015 | | | Step-up / Non step-up |
Series A | | Sep. 2009 | | ¥ | 99.0 | | | | Jan. 2020 | | | Step-up |
Series B | | Sep. 2009 | | ¥ | 164.5 | | | | Jan. 2020 | | | Non step-up |
Series C | | Sep. 2009 | | ¥ | 79.5 | | | | Jan. 2015 | | | Non step-up |
Series D | | Oct. 2009 | | ¥ | 45.0 | | | | Jan. 2015 | | | Non step-up |
Issued by a subsidiary of Kansai Urban Banking Corporation: | | | | | | | | | | | | |
KUBC Preferred Capital Cayman Limited(3) | | Jan. 2007 | | ¥ | 12.5 | | | | Jul. 2012 | | | Step-up |
| (1) | Subject to the prior approval of the FSA. Preferred securities are redeemable at any dividend payment date on and after a specific month and the month shown in this column is such a specific month of each preferred security. |
| (2) | On February 9, 2010, SMFG Preferred Capital USD 1 Limited and SMFG Preferred Capital GBP 1 Limited completed tender offers for their respective preferred securities. Following the completion of the tender offers, SMFG Preferred Capital USD 1 Limited had $649.1 million preferred securities outstanding and SMFG Preferred Capital GBP 1 Limited had £73.6 million preferred securities outstanding at March 31, 2012. |
| (3) | On May 14, 2012, we announced that the preferred securities issued by KUBC Preferred Capital Cayman Limited would be redeemed in full amount on July 25, 2012. |
109
The principal components of Tier II capital include subordinated debt securities, consisting of both perpetual subordinated debt and dated subordinated debt securities, together with unrealized gains on other securities. Tier II capital is subject to the limitation that it cannot exceed the amount of Tier I capital in connection with the calculation of capital ratios.
At March 31, 2012, our total Tier I capital was ¥6,272 billion, total Tier II capital was ¥2,771 billion and total qualifying capital was ¥8,644 billion. Our total risk-weighted assets at March 31, 2012 were ¥51,043 billion.
Our consolidated Tier I risk-weighted capital ratio was 12.28% at March 31, 2012, compared to 12.47% at March 31, 2011. Our consolidated total risk-weighted capital ratio was 16.93% at March 31, 2012, compared to 16.63% at March 31, 2011.
Our capital position and the Bank’s capital position depend in part on the fair market value of our investment securities portfolio, since 45% of unrealized gains are counted as Tier II capital, while unrealized losses reduce net assets and Tier I capital. At March 31, 2012, our other securities (including money held in trust) with a readily ascertainable market value included unrealized gains, of which ¥215 billion appeared in our net assets. Prices for the common stocks of publicly traded Japanese companies have been volatile in recent periods. Substantial declines in the Japanese stock markets may aggravate the negative effect on our capital position and on the capital position of the Bank. However, in November 2008, the FSA introduced revised capital adequacy guidelines under which a bank (including a bank holding company) with international operations may, through the fiscal year ended March 31, 2012, omit from its Tier I capital unrealized losses and from its Tier II capital unrealized gains on yen-denominated Japanese government bonds and certain other securities. We chose not to apply these new relaxed requirements.
Under guidelines issued by the JICPA, a company will lose its ability to recognize deferred tax assets if, in principle, it has substantial amounts of negative annual taxable income for each of three consecutive years or more and is expected to have significant negative taxable income in the following fiscal year.
Because the Bank has a taxable reserve for loan losses and other items, its taxable income can differ significantly from income calculated under Japanese GAAP. Our capital ratio would be negatively affected if we were unable to recognize our deferred tax assets.
The calculation of net deferred tax assets of certain companies under Japanese GAAP is based on taxable income projections for five years, multiplied by the applicable effective tax rates. These projections are based on a reasonable tax planning strategy as authorized by our management. These calculations require us to make estimates and certain assumptions. The results of these calculations may also differ from corresponding calculations made under U.S. or European regulations.
Set forth below is a table of risk-weighted capital ratios of the Bank at the dates shown, on a consolidated and nonconsolidated basis.
| | | | | | | | |
| | | At March 31, | |
| | | 2012 | | | 2011 | |
The Bank’s Consolidated capital ratios: | | | | | | | | |
Tier I risk-weighted capital ratio | | | 14.31 | % | | | 14.25 | % |
Total risk-weighted capital ratio | | | 19.63 | % | | | 19.16 | % |
The Bank’s Nonconsolidated capital ratios: | | | | | | | | |
Tier I risk-weighted capital ratio | | | 16.19 | % | | | 16.31 | % |
Total risk-weighted capital ratio | | | 21.91 | % | | | 21.45 | % |
Our securities subsidiaries in Japan, SMBC Nikko Securities and SMBC Friend Securities, are also subject to capital adequacy requirements under the FIEA described in “Item 4. Regulation—Capital Adequacy.” At
110
March 31, 2012, the capital adequacy ratio is 504.1% for SMBC Nikko Securities and 1,153.0% for SMBC Friend Securities, and sufficiently above 140%, below which level they would be required to file daily reports with the Commissioner of the FSA.
5.C. RESEARCH, DEVELOPMENT, PATENTS AND LICENSES
We did not conduct any significant research and development activities for the fiscal year ended March 31, 2012. However, there are certain research and development activities conducted by subsidiaries in charge of systems development and information processing for our information system infrastructure.
5.D. TREND INFORMATION
Our trend information is contained elsewhere in this annual report, including but not limited to “Item 4.B. Business Overview,” and “—A. Operating Results,” and “—B. Liquidity and Capital Resources” in this Item.
5.E. OFF-BALANCE SHEET ARRANGEMENTS
Loan Commitments and Financial Guarantees and Other Credit-Related Contingent Liabilities
To meet our customers’ financing needs, we engage in various types of off-balance sheet arrangements in the ordinary course of business. Our arrangements include loan commitments, financial guarantees and other credit related contingent liabilities. Loan commitment contracts on overdrafts and loans are agreements to lend to customers, up to a prescribed amount, as long as there is no violation of any condition established in the contracts. Financial guarantees are contracts that require the issuer to make specified payments to reimburse the holder for a loss it incurs because a specified debtor fails to make payments when due, in accordance with the terms of the debt instrument. Other credit related contingent liabilities include performance bonds, which are contracts that provide compensation if another party fails to perform the contractual obligation.
The table below shows the nominal amounts of undrawn loan commitments, and financial guarantees and other credit related contingent liabilities at March 31, 2012 and 2011:
| | | | | | | | |
| | | At March 31, | |
| | | 2012 | | | 2011 | |
| | | (In millions) | |
Loan commitments | | ¥ | 44,064,283 | | | ¥ | 42,743,780 | |
Financial guarantees and other credit-related contingent liabilities | | | 5,320,993 | | | | 4,810,931 | |
| | | | | | | | |
Total | | ¥ | 49,385,276 | | | ¥ | 47,554,711 | |
| | | | | | | | |
The nominal amounts of these off-balance sheet instruments generally represent the maximum potential amounts of future payments without consideration of possible recoveries under recourse provisions or from collateral held. For example, since many of these loan commitments are expected to expire without being drawn upon, the total amount of unused commitments does not necessarily represent actual future cash flow requirements. Many of these loan commitments include clauses under which we can reject an application from customers or reduce the contract amounts in the event that economic conditions change, we need to secure claims, or other events occur. In addition, we may request the customers to pledge collateral such as premises and securities at the time of the contracts, and take necessary measures such as monitoring customers’ financial positions, revising contracts when need arises and securing claims after the contracts are made. We regularly review the credit quality of the customer based on our risk management system as set forth in “Item 11. Quantitative and Qualitative Disclosures about Credit, Market and Other Risk” and Note 45 “Financial Risk Management” to our consolidated financial statements included elsewhere in this annual report.
111
Some of the Group’s off-balance sheet arrangements are related to activities of SPEs. Such arrangements include the following types of SPEs.
Special Purpose Entities
During the normal course of business, we become a party to numerous transactions involving entities commonly referred to as SPEs. These SPEs are primarily used to provide us and our clients with efficient access to funds or investment opportunities, through methods known as structured financing or collective investment schemes. In structured financing, SPEs generally purchase a pool of financial assets including, among others, trade accounts receivable, corporate and retail loans and lease receivables. SPEs fund the purchase by issuing various financial instruments including, among others, commercial paper, asset-backed notes, loans and trust beneficial interests. In some cases subordination is established among the instruments issued by an SPE to turn a single pool of homogeneous assets into multiple instruments with different risk characteristics so that the investment risk and return profile meets the investors’ needs. Certain of these transactions utilize derivative financial instruments to synthetically create an asset whose risk and return is referenced to a targeted asset. In collective investment schemes, an SPE is established as a financing vehicle to raise funds from investors by issuing instruments primarily in the form of trust beneficiary interests, unit trusts, limited partnership interests or shares of investment companies. We may hold a trust beneficiary interest, unit trust, general partner interest, limited partner interest, debt financing or a combination of them.
We have participation in SPEs that are established by us as well as those established by third parties. We consolidate certain SPEs based on the nature of our involvement, while others remain outside of our consolidation group. Consolidation of an SPE is assessed based on whether our relationship with an SPE indicates substantial control by us. The potential indicators of control are set out below:
| | • | | the activities of the SPE are being conducted on our behalf according to our specific business needs so that we obtain benefits from the SPE’s operation; |
| | • | | we have the decision-making powers to obtain the majority of the benefits of the activities of the SPE or, by setting up a “autopilot” mechanism, we have delegated its decision making powers; |
| | • | | we have rights to obtain the majority of the benefits of the SPE and therefore may be exposed to risks incidental to the activities of the SPE; or |
| | • | | we retain the majority of the residual or ownership risks related to the SPE or its assets in order to obtain benefits from its activities. |
The consolidation assessment is performed when we have initial involvement with an SPE. Consolidation is reassessed whenever circumstances change and indicate that there has been a change in a control relationship between an SPE and parties involved.
To the extent SPEs are consolidated by us, the assets and liabilities held by SPEs are included in our consolidated statement of financial position. Parties involved in an SPE generally have recourse only to the assets held by an SPE, except where we provide a guarantee, which may take a form of committed liquidity support. Our involvement with nonconsolidated SPEs includes loans and advances and investments in securities, which are included in our consolidated statement of financial position, and off-balance sheet arrangements, including commitments and guarantees. In such cases, we only have recourse against the assets held by nonconsolidated SPEs except where other parties provide some sort of guarantee to the instruments.
Multi-seller Conduits (Consolidated)
We manage and administer several multi-seller conduits. The conduits purchase financial assets, primarily trade accounts receivables, lease receivables and corporate loans by issuing short-term instruments such as commercial paper and providing asset-backed loans. The short-term instruments issued by the conduits are
112
primarily held by third-party investors whereas we provide most of the asset-backed loans to the conduits. Except for certain limited cases, we provide liquidity and credit support to the conduits, which allows the conduits to draw funds from us whenever a cash shortage arises. We consolidate the above mentioned conduits, to which we provide loans or liquidity and credit support, since we retain the significant risk of the conduits.
At March 31, 2012 and 2011, the consolidated conduits had total assets of ¥2,692,579 million and ¥2,565,677 million, respectively. The minimum credit rating for these assets is BBB-. The weighted average life of the assets held in the conduits is 5.6 months. The weighted average life of the commercial paper issued by these conduits is 1.2 months. The total notional amount of the liquidity and credit support at March 31, 2012 and 2011 was ¥722,608 million and ¥536,506 million, respectively. All of the liquidity and credit support was undrawn at March 31, 2012 and 2011.
In order to manage risk, we have established internal credit assessment policies and procedures in relation to the asset-backed financing programs described above and which require, where necessary, certain credit enhancement from the originators (clients) of the assets to contain the risk to the level deemed appropriate. The notional amount of the liquidity and credit support represents the theoretical maximum amount of loss we could incur and does not reflect the likelihood of such loss ever materializing. We believe that our risk through the liquidity and credit support has been appropriately managed and monitored, and does not represent significant risk to our business.
The following tables summarize selected information related to consolidated multi-seller conduits categorized by the statement of financial position items at March 31, 2012 and 2011:
| | | | | | | | | | | | |
| | | At March 31, 2012 | |
| | | Conduits-
domestic | | | Conduits-
overseas
(North
America) | | | Total | |
| | | (In millions) | |
Loans and advances: | | | | | | | | | | | | |
Corporations | | ¥ | 2,416,679 | | | ¥ | 141,597 | | | ¥ | 2,558,276 | |
Financial institutions | | | — | | | | 9,034 | | | | 9,034 | |
Consumer | | | — | | | | 80,242 | | | | 80,242 | |
| | | | | | | | | | | | |
Total loans and advances | | | 2,416,679 | | | | 230,873 | | | | 2,647,552 | |
| | | | | | | | | | | | |
Other assets | | | 44,358 | | | | 669 | | | | 45,027 | |
| | | | | | | | | | | | |
Total assets | | ¥ | 2,461,037 | | | ¥ | 231,542 | | | ¥ | 2,692,579 | |
| | | | | | | | | | | | |
| | | | | | | | | | | | |
| | | At March 31, 2011 | |
| | | Conduits-
domestic | | | Conduits-
overseas
(North
America) | | | Total | |
| | | (In millions) | |
Loans and advances: | | | | | | | | | | | | |
Corporations | | ¥ | 2,327,240 | | | ¥ | 128,731 | | | ¥ | 2,455,971 | |
Financial institutions | | | — | | | | 12,473 | | | | 12,473 | |
Consumer | | | — | | | | 53,477 | | | | 53,477 | |
| | | | | | | | | | | | |
Total loans and advances | | | 2,327,240 | | | | 194,681 | | | | 2,521,921 | |
| | | | | | | | | | | | |
Other assets | | | 39,028 | | | | 4,728 | | | | 43,756 | |
| | | | | | | | | | | | |
Total assets | | ¥ | 2,366,268 | | | ¥ | 199,409 | | | ¥ | 2,565,677 | |
| | | | | | | | | | | | |
113
The following tables summarize selected information related to consolidated multi-seller conduits categorized by the funding structure at March 31, 2012 and 2011:
| | | | | | | | | | | | |
| | | At March 31, 2012 | |
| | | Conduits-
domestic | | | Conduits-
overseas
(North
America) | | | Total | |
| | | (In millions) | |
Commercial paper | | ¥ | 369,984 | | | ¥ | 231,042 | | | ¥ | 601,026 | |
Term loans (provided by SMFG) | | | 1,753,585 | | | | — | | | | 1,753,585 | |
Others | | | 314,554 | | | | — | | | | 314,554 | |
| | | | | | | | | | | | |
Total | | ¥ | 2,438,123 | | | ¥ | 231,042 | | | ¥ | 2,669,165 | |
| | | | | | | | | | | | |
| | | | | | | | | | | | |
| | | At March 31, 2011 | |
| | | Conduits-
domestic | | | Conduits-
overseas
(North
America) | | | Total | |
| | | (In millions) | |
Commercial paper | | ¥ | 300,120 | | | ¥ | 198,897 | | | ¥ | 499,017 | |
Term loans (provided by SMFG) | | | 1,765,774 | | | | — | | | | 1,765,774 | |
Others | | | 296,928 | | | | — | | | | 296,928 | |
| | | | | | | | | | | | |
Total | | ¥ | 2,362,822 | | | ¥ | 198,897 | | | ¥ | 2,561,719 | |
| | | | | | | | | | | | |
Securitizations of Our Loan Portfolio (Consolidated)
We use SPEs to securitize our loans and advances that we have originated, mainly in order to diversify our sources of funding for asset origination and to improve capital efficiency. These loans and advances, such as residential mortgages are transferred by us to the SPEs for cash, and the SPEs issue debt securities to investors. Retained interests in the financial assets are mainly in the form of subordinated tranches as well as some senior tranches. We consolidate such SPEs where we take all or a majority of the residual risks and rewards by retaining the subordinated tranches. Credit enhancements to the underlying assets provided by us may be used to obtain investment grade ratings on the senior debt issued by the SPEs.
The following table shows the carrying amount of assets in consolidated SPEs at March 31, 2012 and 2011:
| | | | | | | | |
| | | At March 31, | |
| | | 2012 | | | 2011 | |
| | | (In millions) | |
Residential mortgage | | ¥ | 1,405,304 | | | ¥ | 1,506,644 | |
Corporate loans | | | 79,476 | | | | 113,936 | |
Credit card receivables | | | 154,663 | | | | 327,316 | |
Lease receivables | | | 57,009 | | | | 45,046 | |
Consumer loans | | | 157,768 | | | | — | |
| | | | | | | | |
Total | | ¥ | 1,854,220 | | | ¥ | 1,992,942 | |
| | | | | | | | |
Real Estate Investment Vehicles (Nonconsolidated)
We are involved with investment vehicles that typically take the form of a limited partnership or SPE that are used to raise funds in connection with real estate development or acquisition of existing real estate properties. We provide the vehicles with debt financing, partnership or equity interests (which are subordinate to debt financing), or both. The funds raised by the vehicles usually have recourse only to the assets held by them, except in certain cases where the providers of funds have recourse to the original owners of the assets or real estate developers through guarantees. None of our investments in these vehicles is significant in relation to the total
114
funds raised by them, and consequently they are not considered to be our subsidiaries as we do not control them in substance. At March 31, 2012 and 2011, our investments in these vehicles amounted to ¥73,188 million and ¥71,077 million, respectively. With respect to the vehicles that have been established to acquire existing real estate properties, we have entered into commitments to provide funds up to specified amounts. Such commitments amounted to ¥78,998 million and ¥71,658 million at March 31, 2012 and 2011, respectively. Of these amounts, ¥5,809 million and ¥581 million remained undrawn at March 31, 2012 and 2011, respectively.
Private-equity Investment Funds (Nonconsolidated)
We have investments in private-equity investment funds that primarily invest in unlisted companies, engaging in various businesses across different industries. In addition to that, we have some investments in mezzanine funds, infrastructure funds, and distressed debt funds. We only hold limited partner interests in these funds. These funds are not considered to be our subsidiaries since general partners control them.
At March 31, 2012 and 2011, the capital call commitments to these limited partnership funds entered into by us amounted to ¥309,567 million and ¥338,402 million, of which ¥105,136 million and ¥111,883 million remained undrawn, respectively. While the commitments are irrevocable, we believe that we do not have significant risk to meet the capital call commitments and the risks associated with the investments have been adequately controlled and managed.
5.F. TABULAR DISCLOSURE OF CONTRACTUAL OBLIGATIONS
In the normal course of business, we enter into contractual obligations that require future cash payments. The following table sets forth a summary of our contractual cash obligations at March 31, 2012:
| | | | | | | | | | | | | | | | | | | | |
| | | At March 31, 2012 | |
| | | Due in
one year or less | | | Due from
one year to
three years | | | Due from
three years to
five years | | | Due after
five years | | | Total(1) | |
| | | (In millions) | |
Time deposits | | ¥ | 22,210,565 | | | ¥ | 3,389,349 | | | ¥ | 654,552 | | | ¥ | 611,953 | | | ¥ | 26,866,419 | |
Negotiable certificate of deposits | | | 8,535,576 | | | | 55,412 | | | | 2,650 | | | | — | | | | 8,593,638 | |
Borrowings | | | 7,153,720 | | | | 1,115,906 | | | | 564,724 | | | | 1,523,013 | | | | 10,357,363 | |
Debt securities in issue | | | 3,230,077 | | | | 901,001 | | | | 1,094,686 | | | | 2,173,461 | | | | 7,399,225 | |
Capital (finance) lease obligation | | | 19,225 | | | | 22,696 | | | | 9,295 | | | | 5,608 | | | | 56,824 | |
Operating lease obligation | | | 42,247 | | | | 66,387 | | | | 48,611 | | | | 179,414 | | | | 336,659 | |
Purchase obligation(2) | | | 26,792 | | | | 56,338 | | | | 8,869 | | | | 478 | | | | 92,477 | |
| | | | | | | | | | | | | | | | | | | | |
Total | | ¥ | 41,218,202 | | | ¥ | 5,607,089 | | | ¥ | 2,383,387 | | | ¥ | 4,493,927 | | | ¥ | 53,702,605 | |
| | | | | | | | | | | | | | | | | | | | |
| (1) | The amount of interest on debt instruments is not included in the maturity table above due to its insignificance. |
| (2) | Purchase obligation in above table includes the contractual commitments to purchase goods or services of construction and information technology that are binding on us for the payment of more than ¥100 million. |
5.G. SAFE HARBOR
See the discussion under “Cautionary Statement Regarding Forward-Looking Statements.”
115
| Item 6. | Directors, Senior Management and Employees |
6.A. DIRECTORS AND SENIOR MANAGEMENT
Directors, Senior Management and Corporate Auditors
Under our corporate governance system, our board of directors is responsible for supervising the business operations of the Group as a whole, and has established four board committees to enhance the effectiveness of governance by our board of directors in exercising its management responsibilities. Those committees are:
| | • | | the risk management committee; |
| | • | | the auditing committee; |
| | • | | the compensation committee; and |
| | • | | the nominating committee. |
For more information, see “Item 6.C. Board Practices.”
Our board of directors is comprised of twelve directors, three of whom are outside directors as defined under the Companies Act, and our board of corporate auditors is comprised of six corporate auditors, three of whom are outside corporate auditors as defined under the Companies Act.
116
At June 29, 2012, the following persons held the indicated positions with us:
| | | | | | | | |
Name (Date of birth) | | Current positions and
principal outside positions | | Business experience | | Expiration of
current term
as director or
corporate auditor |
Masayuki Oku
(December 2, 1944) | | Chairman of the Board and Director of the Company | | April 1968 | | Joined Sumitomo Bank | | At the close of the annual general meeting of shareholders to be held for the fiscal year ended March 31, 2013. |
| | | June 1994 | | Director of Sumitomo Bank | |
| | | November 1998 | | Managing Director of Sumitomo Bank | |
| | | June 1999 | | Managing Director and Managing Executive Officer of Sumitomo Bank | |
| | | January 2001 | | Senior Managing Director and Senior Managing Executive Officer of Sumitomo Bank | |
| | | April 2001 | | Senior Managing Director and Senior Managing Executive Officer of the Bank | |
| | | December 2002 | | Resigned as Director of the Bank | |
| | | December 2002 | | Senior Managing Director of the Company | |
| | | | June 2003 | | Retired as Director of the Company | |
| | | | | | Deputy President and Executive Officer of the Bank | |
| | | | June 2005 | | Chairman of the Board and Director of the Company (to present) | |
| | | | | | President and Chief Executive Officer of the Bank | |
| | | | April 2011 | | Resigned as Director of the Bank | |
| | | | |
Koichi Miyata
(November 16, 1953) | | President and Representative Director of the Company Director of the Bank | | April 1976 | | Joined Mitsui Bank | | At the close of the annual general meeting of shareholders to be held for the fiscal year ended March 31, 2014. |
| | | June 2003 | | Executive Officer of the Bank | |
| | | October 2006 | | Managing Executive Officer of the Bank | |
| | | April 2009 | | Director and Senior Managing Executive Officer of the Bank | |
| | | April 2010 | | Senior Managing Executive Officer of the Company | |
| | | June 2010 | | Director of the Company | |
| | | April 2011 | | Director and President of the Company (to present) | |
| | | | | Director of the Bank (to present) | |
| | | | |
Takeshi Kunibe
(March 8, 1954) | | Director of the Company | | April 1976 | | Joined Sumitomo Bank | | At the close of the annual general meeting of shareholders to be held for the fiscal year ended March 31, 2013. |
| | President and Chief Executive Officer of the Bank | | June 2003 | | Executive Officer of the Bank | |
| | | October 2006 | | Managing Executive Officer of the Bank | |
| | | April 2007 | | Managing Executive Officer of the Company | |
| | | June 2007 | | Director of the Company (to present) | |
| | | April 2009 | | Director and Senior Managing Executive Officer of the Bank | |
| | | April 2011 | | President and Chief Executive Officer of the Bank (to present) | |
117
| | | | | | | | |
Name (Date of birth) | | Current positions and
principal outside positions | | Business experience | | Expiration of
current term
as director or
corporate auditor |
Tetsuya Kubo
(September 24, 1953) | | Representative Director of the Company Officer in Charge of Public Relations Department, Corporate Planning Department, Financial Accounting Department, and Subsidiaries & Affiliates Department Director and Deputy President of the Bank | | April 1976 | | Joined Sumitomo Bank | | At the close of the annual general meeting of shareholders to be held for the fiscal year ended March 31, 2013. |
| | | June 2003 | | Executive Officer of the Bank | |
| | | July 2006 | | Managing Executive Officer of the Bank | |
| | | April 2008 | | Managing Executive Officer of the Company | |
| | | April 2009 | | Senior Managing Executive Officer of the Company | |
| | | | | Director and Senior Managing Executive Officer of the Bank | |
| | | April 2011 | | Deputy President of the Company Director and Deputy President of the Bank (to present) | |
| | | June 2011 | | Director of the Company (to present) | |
| | | | |
Satoru Nakanishi
(August 31, 1953) | | Representative Director of the Company Officer in charge of Consumer Business Planning Department and Consumer Finance & Transaction Business Department Director and Deputy President of the Bank | | April 1976 | | Joined Mitsui Bank | | At the close of the annual general meeting of shareholders to be held for the fiscal year ended March 31, 2013. |
| | | April 2004 | | Executive Officer of the Bank | |
| | | April 2006 | | Managing Executive Officer of the Bank | |
| | | April 2009 | | Senior Managing Executive Officer of the Company Director and Senior Managing Executive Officer of the Bank | |
| | | June 2009 | | Director of the Company (to present) | |
| | | April 2011 | | Director and Deputy President of the Bank (to present) | |
| | | | |
Koichi Danno
(July 27, 1954) | | Director of the Company Officer in charge of Corporate Risk Management Department Director and Senior Managing Executive Officer of the Bank | | April 1978 | | Joined Mitsui Bank | | At the close of the annual general meeting of shareholders to be held for the fiscal year ended March 31, 2013. |
| | | April 2004 | | Executive Officer of the Bank | |
| | | April 2008 | | Managing Executive Officer of the Bank | |
| | | April 2011 | | Senior Managing Executive Officer of the Company | |
| | | | | Director and Senior Managing Executive Officer of the Bank (to present) | |
| | | June 2011 | | Director of the Company (to present) | |
118
| | | | | | | | |
Name (Date of birth) | | Current positions and
principal outside positions | | Business experience | | Expiration of
current term
as director or
corporate auditor |
Yujiro Ito
(August 3, 1955) | | Director of the Company Officer in charge of General Affairs Department and Human Resources Department Director and Senior Managing Executive Officer of the Bank | | April 1979 | | Joined Sumitomo Bank | | At the close of the annual general meeting of shareholders to be held for the fiscal year ended March 31, 2013. |
| | | June 2003 | | General Manager of General Affairs Department of the Company | |
| | | June 2005 | | Executive Officer of the Bank | |
| | | April 2009 | | Managing Executive Officer of the Bank | |
| | | April 2011 | | Managing Executive Officer of the Company | |
| | | | | Director and Managing Executive Officer of the Bank | |
| | | June 2011 | | Director of the Company (to present) | |
| | | | |
| | | | April 2012 | | Director and Senior Managing Executive Officer of the Bank (to present) | | |
| | | | |
Masahiro Fuchizaki
(April 8, 1956) | | Director of the Company Officer in charge of IT Planning Department Director and Senior Managing Executive Officer of the Bank | | April 1979 | | Joined Sumitomo Bank | | At the close of the annual general meeting of shareholders to be held for the fiscal year ended March 31, 2013. |
| | | June 2005 | | Deputy General Manager of General Affairs Department of the Company | |
| | | April 2007 | | Executive Officer of the Bank | |
| | | April 2009 | | Retired as Executive Officer of the Bank | |
| | | May 2009 | | Advisor of JSOL Corporation | |
| | | | |
| | | | June 2009 | | Director and Senior Managing Executive Director of JSOL Corporation | | |
| | | | |
| | | | March 2010 | | Resigned as Director of JSOL Corporation | | |
| | | | |
| | | | April 2010 | | Managing Executive officer of the Bank | | |
| | | | |
| | | | April 2011 | | Managing Executive officer of the Company | | |
| | | | |
| | | | June 2011 | | Director of the Company (to present) | | |
| | | | |
| | | | April 2012 | | Director and Senior Managing Executive officer of the Bank (to present) | | |
| | | | |
Nobuaki Kurumatani
(December 23, 1957) | | Director of the Company Officer in charge of Audit Department Managing Executive Officer of the Bank | | April 1980 | | Joined Mitsui Bank | | At the close of the annual general meeting of shareholders to be held for the fiscal year ended March 31, 2014. |
| | | April 2007 | | General Manager of Corporate Planning Department of the Company | |
| | | | | Executive Officer of the Bank | |
| | | January 2010 | | Managing Executive Officer of the Bank, commissioned as General Manager of Corporate Planning Department | |
| | | April 2010 | | Managing Executive Officer of the Bank (to present) | |
| | | April 2012 | | Managing Executive officer of the Company | |
| | | June 2012 | | Director of the Company (to present) | |
119
| | | | | | | | |
Name (Date of birth) | | Current positions and
principal outside positions | | Business experience | | Expiration of
current term
as director or
corporate auditor |
Shigeru Iwamoto(1)
(March 31, 1941) | | Director of the Company Director of the Bank | | December 1965 | | Joined Syuji Ozawa Certified Public Accountant Office | | At the close of the annual general meeting of shareholders to be held for the fiscal year ended March 31, 2013. |
| | | October 1971 | | Joined Asahi Accounting Company (currently, KPMG AZSA LLC) | |
| | | | March 1976 | | Registered as a certified public accountant (to present) | |
| | | | |
| | | | July 1992 | | Representative Partner of ASAHI SHINWA & Co. (currently, KPMG AZSA LLC) | | |
| | | | |
| | | | October 1993 | | Representative Partner of Asahi & Co. (currently, KPMG AZSA LLC) | | |
| | | | |
| | | | May 1999 | | President of Asahi & Co. | | |
| | | | |
| | | | January 2004 | | President of KPMG AZSA (currently, KPMG AZSA LLC) | | |
| | | | |
| | | | May 2004 | | Chairman of KPMG AZSA | | |
| | | | |
| | | | June 2005 | | Retired from KPMG AZSA | | |
| | | | |
| | | | June 2009 | | Director of the Company (to present) | | |
| | | | |
| | | | | | Director of the Bank (to present) | | |
| | | | |
Yoshinori Yokoyama(1)
(September 16, 1942) | | Director of the Company Director of the Bank | | April 1966 | | Joined Mayekawa Associates, Architects & Engineers | | At the close of the annual general meeting of shareholders to be held for the fiscal year ended March 31, 2014. |
| | | | September 1973 | | Joined Davis Brody & Associates | |
| | | | September 1975 | | Joined McKinsey & Company, Inc. | |
| | | | July 1987 | | Director (Senior Partner) of McKinsey & Company, Inc. | |
| | | | |
| | | | June 2002 | | Retired from McKinsey & Company, Inc. | | |
| | | | |
| | | | June 2002 | | Director of ORIX Corporation | | |
| | | | |
| | | | April 2003 | | Corporate Auditor of Industrial Revitalization Corporation of Japan | | |
| | | | |
| | | | June 2006 | | Director of the Company (to present) | | |
| | | | |
| | | | | | Director of the Bank (to present) | | |
| | | | |
Kuniaki Nomura(1)
(June 13, 1945) | | Director of the Company Director of the Bank | | April 1970 | | Registered as an attorney at law (to present) Attorney at law at Yanagida Law Office (currently, Yanagida & Partners) | | At the close of the annual general meeting of shareholders to be held for the fiscal year ended March 31, 2013. |
| | | | |
| | | June 2009 | | Director of the Company (to present) | |
| | | | | Director of the Bank (to present) | |
| | | | | Attorney at law at Nomura Law Office (to present) | | |
120
| | | | | | | | |
Name (Date of birth) | | Current positions and
principal outside positions | | Business experience | | Expiration of
current term
as director or
corporate auditor |
Jun Mizoguchi
(March 19, 1954) | | Corporate Auditor of the Company Corporate Auditor of the Bank | | April 1976 | | Joined Sumitomo Bank | | At the close of the annual general meeting of shareholders to be held for the fiscal year ended March 31, 2015. |
| | | April 2004 | | Executive Officer of the Bank | |
| | | April 2007 | | Managing Executive Officer of the Bank | |
| | | | April 2010 | | Senior Managing Executive Officer of the Bank | |
| | | | |
| | | | June 2011 | | Corporate Auditor of the Company (to present) | | |
| | | | |
| | | | | | Corporate Auditor of the Bank (to present) | | |
| | | | |
Yoji Yamaguchi
(June 14, 1955) | | Corporate Auditor of the Company | | April 1978 | | Joined Mitsui Bank | | At the close of the annual general meeting of shareholders to be held for the fiscal year ended March 31, 2016. |
| | | | April 2006 | | Deputy General Manager of General Affairs Department of the Company | |
| | | | | | General Manager of Administrative Department of the Bank | |
| | | | |
| | | | April 2008 | | Senior Manager of Head Office of the Bank | | |
| | | | |
| | | | June 2008 | | Corporate Auditor of the Company (to present) | | |
| | | | |
Shin Kawaguchi
(August 26, 1956) | | Corporate Auditor of the Company | | April 1980 | | Joined Sumitomo Bank | | At the close of the annual general meeting of shareholders to be held for the fiscal year ended March 31, 2015. |
| | | | April 2007 | | General Manager of Tobu Ikebukuro Block Consumer Business Office of the Bank | |
| | | | April 2009 | | Deputy General Manager of Corporate Planning Department of the Company | |
| | | | |
| | | | | | General Manager of Quality Management Department of the Bank | | |
| | | April 2010 | | Senior General Manager of Quality Management Department of the Bank | |
| | | | |
| | | | April 2011 | | Senior Manager of Head Office of the Bank | | |
| | | | |
| | | | June 2011 | | Corporate Auditor of the Company (to present) | | |
121
| | | | | | | | |
Name (Date of birth) | | Current positions and
principal outside positions | | Business experience | | Expiration of
current term
as director or
corporate auditor |
Ikuo Uno(2)
(January 4, 1935) | | Corporate Auditor of the Company Corporate Auditor of the Bank Executive Advisor to the Board of Nippon Life Insurance Company | | March 1959 | | Joined Nippon Life Insurance Company | | At the close of the annual general meeting of shareholders to be held for the fiscal year ended March 31, 2013 |
| | | April 1997 | | President of Nippon Life Insurance Company | |
| | | April 2005 | | Chairman of the Board and Representative Director of Nippon Life Insurance Company | |
| | | | June 2005 | | Corporate Auditor of the Company (to present) | |
| | | | |
| | | | June 2006 | | Corporate Auditor of the Bank (to present) | | |
| | | | |
| | | | April 2011 | | Director and Executive Advisor to the Board of Nippon Life Insurance Company | | |
| | | | July 2011 | | Executive Advisor to the Board of Nippon Life Insurance Company (to present) | |
| | | | |
Satoshi Itoh(2)
(July 25, 1942) | | Corporate Auditor of the Company | | January 1967 | | Joined Tokyo Office of Arthur Andersen & Co. | | At the close of the annual general meeting of shareholders to be held for the fiscal year ended March 31, 2013. |
| | Corporate Auditor of the Bank | | December 1970 | | Registered as a certified public accountant (to present) | |
| | | | September 1978 | | Partner of Arthur Andersen & Co. | |
| | | | October 1993 | | Representative Partner of Asahi & Co. (currently, KPMG AZSA LLC) | |
| | | | |
| | | | August 2001 | | Retired from Arthur Andersen & Co. | | |
| | | | Retired from Asahi & Co. | |
| | | | |
| | | | April 2002 | | Special Professor at Chuo University Graduate School of International Accounting | | |
| | | | |
| | | | March 2007 | | Retired as Special Professor from Chuo University Graduate School of International Accounting | | |
| | | | |
| | | | June 2009 | | Corporate Auditor of the Company (to present) | | |
| | | | |
| | | | | | Corporate Auditor of the Bank (to present) | | |
122
| | | | | | | | |
Name (Date of birth) | | Current positions and
principal outside positions | | Business experience | | Expiration of
current term
as director or
corporate auditor |
Rokuro Tsuruta(2)
(June 16, 1943) | | Corporate Auditor of the Company Corporate Auditor of the Bank | | April 1970 | | Appointed as a Prosecutor at Tokyo District Public Prosecutors Office | | At the close of the annual general meeting of shareholders to be held for the fiscal year ended March 31, 2016. |
| | | April 2005 | | Superintending Prosecutor of Nagoya High Public Prosecutors Office | |
| | | June 2006 | | Retired from his position as Prosecutor | |
| | | July 2006 | | Registered as an attorney at law (to present) | |
| | | October 2006 | | Professor at Chiba University Law School | | |
| | | | |
| | | | September 2008 | | Retired from his position as Professor at Chiba University Law School | | |
| | | | |
| | | | April 2009 | | Professor at Surugadai University Law School | | |
| | | | |
| | | | March 2012 | | Retired from his position as Professor at Surugadai University Law School | | |
| | | | |
| | | | June 2012 | | Corporate Auditor of the Company (to present) | | |
| | | | |
| | | | | | Corporate Auditor of the Bank (to present) | | |
| (1) | Messrs. Iwamoto, Yokoyama and Nomura satisfy the requirements for an “outside director” under the Companies Act. |
| (2) | Messrs. Uno, Itoh and Tsuruta satisfy the requirements for an “outside corporate auditor” under the Companies Act. |
For more information, please see “Item 6.C. Board Practices.”
Familial Relationships
There are no familial relationships between any of the directors and corporate auditors listed above.
Arrangements and Understandings
There is no arrangement or understanding with any major shareholder, customer, supplier or other party, pursuant to which any of the directors and corporate auditors listed above were selected as a director or member of corporate auditors.
123
6.B. COMPENSATION
The aggregate amounts of compensation paid by us and the Bank during the fiscal year ended March 31, 2012 to our directors and to our corporate auditors were ¥829 million and ¥193 million, respectively.
The following table sets forth the details of individual compensation, disclosed pursuant to the provision of the FIEA and related ordinance, by SMFG and its subsidiaries in amounts equal to or exceeding ¥100 million during the fiscal year ended March 31, 2012:
| | | | | | | | | | | | | | | | | | | | |
| | | | | | | | | Compensation | |
Director | | Aggregate
amount | | | Paid by | | | Annual
salary | | | Stock
option | | | Bonus | |
| | | (In millions)(1) | |
Masayuki Oku | | ¥ | 116 | | | | SMFG | | | ¥ | 86 | | | ¥ | 8 | | | ¥ | 20 | |
| | | | | | | SMBC | | | | — | | | | 1 | | | | — | |
Koichi Miyata | | ¥ | 123 | | | | SMFG | | | ¥ | 65 | | | ¥ | 6 | | | ¥ | 23 | |
| | | | | | | SMBC | | | | 21 | | | | 1 | | | | 5 | |
Takeshi Kunibe | | ¥ | 123 | | | | SMFG | | | ¥ | 21 | | | ¥ | 1 | | | ¥ | 4 | |
| | | | | | | SMBC | | | | 65 | | | | 6 | | | | 23 | |
| (1) | Amounts less than one million yen have been truncated. |
Compensation for our directors, including bonuses and incentive stock options, must be approved at our general meeting of shareholders, unless otherwise provided in our articles of incorporation. The shareholders’ approval may specify the upper limit of the aggregate amount of compensation or calculation methods, but if compensation includes benefits in kind, the shareholders’ approval must include the description of such benefits. Similarly, compensation to our corporate auditors must be approved by our shareholders at our general meeting of shareholders unless otherwise specified in our articles of incorporation. Our articles of incorporation currently do not have such provisions with respect to compensation for directors and corporate auditors.
Compensation for an individual director and corporate auditor is determined by our board of directors and by consultation among our corporate auditors, respectively, in accordance with our internal rules and our standard practice of approval at our general meeting of shareholders. To ensure objectivity in the process of determining such compensation, bonus and stock options to our board of directors and the board of directors of the Bank, we have formed a compensation committee in which an outside director serves as the chairman of the committee.
In the fiscal year ended March 31, 2003, we granted stock options for certain directors and employees. In addition, in June 2010, a shareholders resolution was passed at the general meeting of shareholders to introduce a stock option compensation program to certain directors and corporate auditors in connection with the abolition of their retirement benefit program. Following such resolution, we granted stock options for certain directors, corporate auditors and executive officers of the Company and the Bank on August 13, 2010. Because the resolution also abolished the retirement benefit program for our corporate directors and auditors, no amounts were set aside for the payment of any retirement benefits for them during the fiscal year ended March 31, 2012. For additional information, see “Item 6.E. Share Ownership” or Note 40 “Share Based Payment” to our consolidated financial statements included elsewhere in this annual report.
6.C. BOARD PRACTICES
General
The Companies Act permits two types of governance systems for large public companies. The first system is for companies with committees (i.e., audit, nomination and compensation committees), and the other is for companies with a board of corporate auditors. We employ the board of corporate auditors governance system. Pursuant to Article 4 of our articles of incorporation, we maintain a corporate governance system consisting of a general meeting of shareholders, individual directors, a board of directors, individual corporate auditors, a board of corporate auditors and an accounting auditor as its primary components.
124
Our articles of incorporation provide for a board of directors of not less than three. We currently have twelve directors. Our board of directors has ultimate responsibility for the administration of our affairs.
By resolution, our board of directors elects representative directors from the directors who may represent us severally. Our board of directors may elect directors with titles (yakutsuki-torishimariyaku), executive officers with titles (yakutsuki-shikkoyakuin), and elect and/or remove executive officers and other important employees by resolution. In addition, our board of directors may assign or change the designation of the duties of the directors and executive officers by resolution.
Our president executes business affairs in accordance with resolutions made by the board of directors. Our deputy presidents, senior managing directors and managing directors assist the president in the management of our day-to-day operations. Our chairman serves as the chairman of and presides over our board of directors. This is done in order to separate the role of our president, whose responsibility is to exercise overall supervision of our business activities and other group companies, from the role of our chairman.
The Companies Act requires a resolution of the board of directors for a company to execute important business strategies, including the acquisition and disposal of material assets, borrowing substantial amounts of money, the establishment of, changes in or abolition of branch offices or other material corporate organizations, issuance of bonds, establishment of internal control systems and exemption of directors and corporate auditors from liability to the Company in accordance with applicable laws and regulations.
Under the Companies Act, a company with a board of corporate auditors is not obligated to have any outside directors or to have any audit, nomination or compensation committees. However, we have three outside directors as part of our efforts to enhance corporate governance. In addition, we have voluntarily established our auditing, risk management, compensation and nominating committees to enhance effectiveness of our board of directors. To ensure the compliance of our execution of our business operations with legal regulations and generally accepted practices, the outside directors have been selected from among experts (including certified public accountants, lawyers and persons with consulting experience).
“Outside director” means a director of any corporation who is neither an executive director nor an executive officer, nor an employee, including a manager, of such corporation or any of its subsidiaries, and who has never served in the past as an executive director, executive officer, or as an employee, including a manager, of such corporation or any of its subsidiaries.
Under the Companies Act, a corporation with a board of corporate auditors shall have three or more corporate auditors, and half or more of them shall be outside corporate auditors. The board of corporate auditors shall appoint full-time corporate auditors from among the corporate auditors. Outside corporate auditor means an auditor of any corporation who has never served in the past as a director, accounting advisor (kaikei-sanyo) or executive officer, or as an employee, including a manager, of such corporation or any of its subsidiaries.
We have six corporate auditors and three of them are outside corporate auditors. The auditors monitor the execution of business operations of us and our subsidiaries by attending meetings of the board of directors and listening to reports on operations from the directors and others. They also examine documents relating to important decisions and receive reports from the internal audit departments, representatives of our subsidiaries and our accounting auditor.
Our corporate auditors (who are not required to be and most of whom are not certified public accountants) have a statutory duty to examine the financial statements and business reports submitted by the board of directors to the general meeting of shareholders. They also have the duty to supervise the administration of our affairs by the directors in accordance with the auditing policy and rules prescribed by resolutions of the board of corporate auditors.
125
All directors and corporate auditors are elected by our shareholders at a general meeting of shareholders. The term of office of a director shall expire upon conclusion of the annual general meeting of shareholders to be held for the last fiscal year ending within two years after the election of the director. The term of office of a corporate auditor shall expire upon conclusion of the annual general meeting of shareholders to be held for the last fiscal year ending within four years after the election of the corporate auditor. Directors and corporate auditors may serve any number of consecutive terms.
As mentioned above, the committees of our board of directors were created to enhance effectiveness of governance by our board of directors to oversee our operations.
The auditing committee is responsible for matters relating to internal audits on a Group-wide basis, under delegated authority from the board of directors. Such matters include internal auditing policies and control systems for the Group, the Company and the Bank, and other important auditing issues of the Group. The committee regularly reports to the board of directors.
The chairman of the auditing committee is Shigeru Iwamoto, who is an outside director. Other outside directors on the auditing committee are Yoshinori Yokoyama and Kuniaki Nomura. Other directors on the auditing committee are Masayuki Oku, chairman of our board of directors, Koichi Miyata, our president, Takeshi Kunibe, a director and Nobuaki Kurumatani, a director and the officer in charge of the audit department.
The compensation committee is responsible for matters relating to the compensation of the directors and executive officers of both the Company and the Bank, under delegated authority from the board of directors. Such matters include the determination of bonuses and stock option awards. The aim of the compensation committee is for the process of determining compensation to be transparent and objective and for the compensation to be appropriate. The committee reports to the board of directors.
The chairman of the compensation committee is Kuniaki Nomura, who is an outside director. Other outside directors on the compensation committee are Shigeru Iwamoto and Yoshinori Yokoyama. Other directors on the compensation committee are Masayuki Oku, chairman of our board of directors, Koichi Miyata, our president, and Takeshi Kunibe, a director.
In addition, the risk management committee supervises and reports to our board of directors on material Group-wide risk management and compliance issues. The nominating committee supervises and reports to our board of directors on the selection of directors of both the Company and the Bank, issues related to selection of candidates for directorships, the appointment of managing directors and the appointment of representative directors and other material director personnel issues.
These committees are each composed of six to nine members including the chairman of the board, the president, and three outside directors. Outside directors are appointed to all these committees to facilitate corporate governance from an objective perspective. As noted above, because the need for objectivity is particularly acute in the case of the auditing committee and the compensation committee, the chairmanship of these committees is assigned to outside directors.
At the operational level, we have created the Management Committee to act as the top decision-making body with respect to business administration and management supervision of the entire Group. The committee, composed of directors designated by our president, considers important matters relating to the execution of business in accordance with the basic policies set by the board of directors and based on discussions held by the committee members.
For the purpose of protecting the interests of shareholders in general, certain securities exchanges, including the Tokyo Stock Exchange, introduced a new rule regarding independent directors/corporate auditors, which requires a listed company to have, from amongst the outside directors or outside corporate auditors, at least one
126
independent director/corporate auditor who does not have conflicting interests with shareholders as specified under the rule. All companies on these securities exchanges are required to report the name of such independent director/corporate auditor, which is disclosed to the public. The rule became effective on the day immediately after the general shareholders meeting for the fiscal year ended after March 1, 2010. We designated all three outside directors and outside corporate auditors as independent directors and independent corporate auditors, respectively.
Exemption from Liability
Under the Companies Act and our articles of incorporation, we may exempt our outside directors and outside corporate auditors from liabilities to us arising in connection with their failure to execute their duties, within the limits stipulated by applicable laws and regulations. We have entered into a liability limitation agreement with each outside director and outside corporate auditor which limits the maximum amount of their liability to the Company arising in connection with a failure to execute their duties to the greater of either ¥10 million or the minimum liability amount prescribed in applicable laws.
Corporate Governance Practices
Companies listed on the New York Stock Exchange (“NYSE”), must comply with certain corporate governance standards provided under Section 303A of the NYSE Listed Company Manual. However, NYSE-listed companies that are foreign private issuers, including us, are permitted to follow home country practices in lieu of certain provisions of Section 303A if such foreign private issuers meet certain criteria. See “Item 16.G. Corporate Governance” for a summary of significant ways in which our corporate governance practices differ from those followed by NYSE-listed U.S. companies.
Independent Registered Public Accounting Firm
We are required to appoint an independent registered public accounting firm, whose appointment is approved at a general meeting of shareholders. The independent registered public accounting firm has the statutory duty to examine the financial statements prepared in accordance with the Companies Act and approved by the board of directors, and report its opinion thereon to the designated corporate auditors and to the designated directors for notification to the shareholders. Examination by independent registered public accounting firm of our financial statements is also required for the purpose of the securities report filed through the Kanto Local Finance Bureau to the Prime Minister for public inspection in accordance with the FIEA. Our independent registered public accounting firm for these purposes is KPMG AZSA LLC.
Benefits upon Termination of Employment
Neither we nor our subsidiaries maintain any directors’ service contracts providing for benefits upon termination of employment.
6.D. EMPLOYEES
At March 31, 2012, 2011 and 2010, on a consolidated basis, we had approximately 64,200, 61,600 and 57,900 employees, respectively, including locally hired staff in our foreign offices but excluding temporary employees. We also had an average of approximately 18,200 temporary employees during the fiscal year ended March 31, 2012.
127
The following tables show our full-time employees at March 31, 2012 on a consolidated basis under Japanese GAAP broken down based on business segment and geographical location:
| | | | |
| | | Percentage of full-
time employees at
March 31, 2012 | |
Business segment: | | | | |
Commercial Banking(1) | | | 47 | % |
Securities | | | 14 | |
Leasing | | | 4 | |
Credit Card | | | 8 | |
Others | | | 27 | |
| | | | |
Total | | | 100 | % |
| | | | |
| (1) | The number of employees of the Bank represents 36% of the number of our employees on a consolidated basis. Further, the number of employees in the Bank’s Consumer Banking Unit, Middle Market Banking Unit, Corporate Banking Unit, International Banking Unit, Treasury Unit and Others represent 13%, 8%, 1%, 4%, 1% and 9% of the number of our employees on a consolidated basis, respectively. |
| | | | |
| ` | | Percentage of full-
time employees at
March 31, 2012 | |
Location: | | | | |
Japan | | | 91 | % |
Americas | | | 2 | |
Europe and Middle East | | | 2 | |
Asia and Oceania | | | 5 | |
| | | | |
Total | | | 100 | % |
| | | | |
Most of the employees of the Bank are members of the Sumitomo Mitsui Banking Corporation Workers’ Union, which negotiates with the Bank concerning remuneration and working conditions. The union is affiliated with the Federation of City Bank Workers’ Unions. The Bank considers its labor relations to be excellent.
We consider our level of remuneration, fringe benefits (including an employee share ownership program), working conditions and other allowances, which include lump-sum payments and annuities to employees upon retirement, to be generally competitive with those offered by other large enterprises in Japan.
128
6.E. SHARE OWNERSHIP
Shareholdings by Directors, Senior Management and Corporate Auditors
The following table shows the number of shares of our common stock owned by our directors and corporate auditors at June 29, 2012:
| | | | |
| | | Number of shares owned | |
Directors and corporate auditors: | | | | |
Masayuki Oku | | | 10,500 | |
Koichi Miyata | | | 7,100 | |
Takeshi Kunibe | | | 6,888 | |
Tetsuya Kubo | | | 5,831 | |
Satoru Nakanishi | | | 6,500 | |
Koichi Danno | | | 5,100 | |
Yujiro Ito | | | 4,422 | |
Masahiro Fuchizaki | | | 3,800 | |
Nobuaki Kurumatani | | | 6,100 | |
Shigeru Iwamoto | | | 6,000 | |
Yoshinori Yokoyama | | | — | |
Kuniaki Nomura | | | — | |
Jun Mizoguchi | | | 5,100 | |
Yoji Yamaguchi | | | 2,700 | |
Shin Kawaguchi | | | 900 | |
Ikuo Uno | | | — | |
Satoshi Itoh | | | — | |
Rokuro Tsuruta | | | — | |
None of our directors or corporate auditors is the owner of more than one percent of our common stock, and no director or corporate auditor has voting rights with respect to our common stock that are different from any other holder of our common stock.
Stock Option Plans and Other Remuneration for Directors and Senior Management
Before our establishment in December 2002, the Bank granted common stock options to certain directors and employees of the Bank. When we were established, we took over the obligations related to the stock options from the Bank (“Pre-2002 stock option”).
In June 2010, a resolution was passed at the general meeting of shareholders to introduce a stock option compensation program for directors, corporate auditors and executive officers of the Company and the Bank (“SMFG Stock Acquisition Rights”). This serves to incentivize grantees to further contribute to the equity appreciation and improved corporate performance through a sharing of the benefits and risks of share price performance of our shares. These changes reflected a review of our compensation system and the elimination of retirement benefits for directors, corporate auditors and executive officers.
129
The following table provides an overview of the significant terms and conditions of our stock option plans:
| | | | | | | | | | | | |
| | | Date of
resolution | | | Number of grantees | | Shares granted | | Exercise period | | Exercise price |
Pre-2002 stock option | | | June 27, 2002 | | | 677 directors and employees of the Company and the Bank | | 162,000 shares of common stock(1) of the Company | | June 28, 2004 to June 27, 2012 | | ¥6,649 per share subject to adjustment(1)(2) |
| | | | | |
SMFG Stock Acquisition Rights (1st series) | | | July 28, 2010 | | | 82 directors, corporate auditors and executive officers of the Company and the Bank | | 102,600 shares of common stock of the Company | | August 13, 2010 to August 12, 2040 | | ¥1 per share granted upon exercise of each stock acquisition right, multiplied by the number of shares granted |
| | | | | |
SMFG Stock Acquisition Rights (2nd series) | | | July 29, 2011 | | | 85 directors, corporate auditors and executive officers of the Company and the Bank | | 268,200 shares of common stock of the Company | | August 16, 2011 to August 15, 2041 | | ¥1 per share granted upon exercise of each stock acquisition right, multiplied by the number of shares granted |
| (1) | We implemented a 100-for-1 stock split of shares of our common stock and adopted a unit share system effective on January 4, 2009. The numbers described above were adjusted to reflect such stock split. At the end of March 31, 2009 and 2010, 108,100 shares of stock options were outstanding and exercisable up to June 2012. |
We have employee stock ownership associations in Japan for our, the Bank’s and other subsidiaries’ employees. Members of the employee stock ownership associations set aside certain amounts from their monthly salary to purchase our common stock through the relevant employee stock ownership association. The administrator of each association makes open-market purchases of our common stock for the account of the association on a monthly basis. We, the Bank and other subsidiaries contribute matching funds equivalent to 5% of the amount purchased by the relevant association. At March 31, 2012, none of the employee stock ownership associations held more than 1% of our common stock.
130
| Item 7. | Major Shareholders and Related Party Transactions |
7.A. MAJOR SHAREHOLDERS
Major Shareholders
Our major shareholders, appearing on our register of common shareholders at March 31, 2012, were as follows:
| | | | | | | | |
| | | Number of
shares held | | | Percentage
of shares
issued(1) | |
Name: | | | | | | | | |
Japan Trustee Services Bank, Ltd. (Trust Account) | | | 90,536,318 | | | | 6.40 | % |
The Master Trust Bank of Japan, Ltd. (Trust Account) | | | 73,312,500 | | | | 5.18 | % |
SSBT OD05 OMNIBUS ACCOUNT TREATY CLIENTS | | | 39,033,944 | | | | 2.76 | % |
Japan Trustee Services Bank, Ltd. (Trust Account 9) | | | 29,113,800 | | | | 2.05 | % |
STATE STREET BANK AND TRUST COMPANY 505225 | | | 19,858,287 | | | | 1.40 | % |
MELLON BANK, N.A. AS AGENT FOR ITS CLIENT
Mellon Omnibus US Pension | | | 17,891,918 | | | | 1.26 | % |
THE BANK OF NEW YORK, TREATY JASDEC ACCOUNT | | | 15,999,996 | | | | 1.13 | % |
Nippon Life Insurance Company | | | 15,466,682 | | | | 1.09 | % |
NATSCUMCO | | | 14,319,917 | | | | 1.01 | % |
Sumitomo Mitsui Banking Corporation(2) | | | 13,340,000 | | | | 0.94 | % |
| (1) | Percentages are calculated based on the total number of shares of common stock then issued, including our treasury stock, and have been rounded down to the nearest second decimal point. |
| (2) | Pursuant to Article 67 of the Enforcement Ordinance of the Company Act, our subsidiary Sumitomo Mitsui Banking Corporation is not entitled to exercise the voting rights of our common shares it holds. |
Our major shareholders do not have different voting rights.
Shareholders in the United States
Because some of our common stock was held by brokers or other nominees, the number of shares held by and the number of beneficiary holders with addresses in the United States is not fully ascertainable. At March 31, 2012, there were 204 record holders of our common stock with addresses in the United States, whose shareholdings represented approximately 14% of our outstanding common stock on that date.
Control of the Company
To our knowledge, we are not directly or indirectly owned or controlled by any another corporation(s), by any foreign government or by any other natural or legal person(s), severally or jointly.
Arrangements for Change in Control of the Company
We know of no arrangements the operation of which may at a later time result in a change of control.
7.B. RELATED PARTY TRANSACTIONS
We and our banking subsidiaries had, and expect to have in the future, banking transactions and other transactions in the ordinary course of business with our related parties. For the fiscal year ended March 31, 2012, such transactions included, but were not limited to, loans, deposits and guarantees. Furthermore, such transactions were immaterial and were made at prevailing market rates, terms and conditions, and did not involve more than the normal risk of collectibility or present other unfavorable features.
131
During the fiscal year ended March 31, 2012, none of our directors or corporate auditors or the Bank’s directors, and none of the close members of their respective families, had any transactions that were material or any transactions that were unusual in their nature or conditions, involving goods, services or tangible or intangible assets, to which we were a party, and no such transactions were proposed at March 31, 2012. During the fiscal year ended March 31, 2012, we made no loans to our directors or corporate auditors or the Bank’s directors other than those that were made in the ordinary course of business, on substantially the same terms, including interest rates and collateral, as those prevailing at the time for comparable transactions with other persons, and did not involve more than the normal risk of collectibility or present other unfavorable features.
7.C. INTERESTS OF EXPERTS AND COUNSEL
Not applicable.
| Item 8. | Financial Information |
8.A. CONSOLIDATED STATEMENTS AND OTHER FINANCIAL INFORMATION
Financial Statements
All relevant financial statements are attached hereto. See “Item 18. Financial Statements.” See “Item 5. Operating and Financial Review and Prospects—Reconciliation with Japanese GAAP” for a reconciliation of consolidated net profit and total equity for the fiscal year ended March 31, 2012 under IFRS, with those amounts under Japanese GAAP.
Export Sales
Not applicable.
Legal Proceedings
We are party to routine litigation incidental to our business, none of which is currently expected to have a material adverse effect on our financial condition or results of operations. However, there can be no assurance that an adverse decision in one or more of these lawsuits will not have a material adverse effect.
Dividend Policy and Dividends
The declaration, payment and determination of any year-end dividend are subject to the approval of shareholders of our common stock at our general meeting of shareholders and to statutory restrictions. The declaration, payment and determination of the amount of any interim dividend require a resolution of our board of directors and are subject to statutory restrictions. Dividend payments are made to shareholders or pledgees of record at the record dates for each payment. March 31 is the record date for year-end dividends and September 30 is the record date for interim dividends. The payment of year-end and interim dividends on common stock is subject to prior payment of dividends on our preferred stock, if any.
We have a basic policy of steadily increasing returns to shareholders through the sustainable growth of our enterprise value, while enhancing our capital to maintain financial soundness in consideration of our public nature as a bank holding company. We continuously aim to increase returns to shareholders while taking into account new capital requirements and the competitive environment, by maintaining a payout ratio of over 20% on a consolidated net income basis under Japanese GAAP.
132
The following table shows historical aggregate dividend payments per share of our common stock for each of the fiscal years from the fiscal year ended March 31, 2010 through the fiscal year ended March 31, 2012:
| | | | | | | | |
| | | Dividend per share | |
| | | Paid(1) | | | Declared(2) | |
Fiscal year ended March 31, | | | | | | | | |
2010 | | ¥ | 100 | | | ¥ | 65 | |
2011 | | | 100 | | | | 105 | |
2012 | | | 100 | | | | 100 | |
| (1) | Dividend per share based on dividends in respect of each fiscal year including dividends proposed after current fiscal year-end but not recognized in the financial statements and excluding dividends in respect of the previous fiscal year declared in current fiscal year. |
| (2) | Dividend per share based on dividends declared and recognized in the financial statements during each fiscal year. |
8.B. SIGNIFICANT CHANGES
Except as otherwise described in this annual report, no significant change in our financial position has occurred since the date of the financial statements included elsewhere in this annual report.
| Item 9. | The Offer and Listing |
9.A. LISTING AND DETAILS
Offering Details
Not applicable.
Price History of the Shares
Market Price Information for Our American Depositary Shares
The following table sets forth, for the periods indicated, the high and low trading prices, and average daily trading volume for our ADSs on the NYSE since their listing on November 1, 2010:
| | | | | | | | | | | | |
| | | Price per
ADS | | | Average daily
trading volume | |
| | | High | | | Low | | |
| | | (In dollars) | | | (Number of
shares) | |
Fiscal year ended March 31, except quarter and month data: | | | | | | | | | | | | |
2011 (from November 1, 2010): | | | | | | | | | | | | |
Third quarter | | | 7.21 | | | | 5.75 | | | | 430,456 | |
Fourth quarter | | | 7.77 | | | | 6.01 | | | | 615,815 | |
Full year | | | 7.77 | | | | 5.75 | | | | 539,906 | |
2012: | | | | | | | | | | | | |
First quarter | | | 6.46 | | | | 5.55 | | | | 473,475 | |
Second quarter | | | 6.47 | | | | 5.12 | | | | 370,978 | |
Third quarter | | | 6.05 | | | | 5.13 | | | | 423,717 | |
Fourth quarter | | | 7.06 | | | | 5.59 | | | | 463,419 | |
Full year | | | 7.06 | | | | 5.12 | | | | 432,531 | |
Most recent six months: | | | | | | | | | | | | |
January | | | 6.40 | | | | 5.59 | | | | 482,436 | |
February | | | 7.00 | | | | 6.44 | | | | 560,619 | |
March | | | 7.06 | | | | 6.51 | | | | 357,768 | |
April | | | 6.79 | | | | 6.32 | | | | 857,331 | |
May | | | 6.37 | | | | 5.77 | | | | 479,788 | |
June | | | 6.67 | | | | 5.65 | | | | 383,962 | |
July (through July 10, 2012) | | | 6.81 | | | | 6.52 | | | | 289,911 | |
133
Market Price Information for Our Shares
See “Item 9.C. The Offer and Listing—Markets” for information on the stock exchanges on which our common stock is listed.
The following table sets forth, for the periods indicated, the high and low trading prices, and average daily trading volume for our common stock since the fiscal year ended March 31, 2007 on the Tokyo Stock Exchange.
| | | | | | | | | | | | |
| | | Price per Share | | | Average daily
trading volume | |
| | | High | | | Low | | |
| | | (In yen) | | | (Number of
shares) | |
Fiscal year ended March 31, except quarter and month data: | | | | | | | | | | | | |
2007 | | ¥ | 13,900 | | | ¥ | 10,100 | | | | 3,211,378 | |
2008 | | | 12,100 | | | | 6,330 | | | | 4,948,529 | |
2009 | | | 9,640 | | | | 2,585 | | | | 8,135,967 | |
2010 | | | 4,520 | | | | 2,591 | | | | 13,310,559 | |
2011: | | | | | | | | | | | | |
First quarter | | | 3,355 | | | | 2,500 | | | | 11,866,548 | |
Second quarter | | | 2,743 | | | | 2,424 | | | | 10,119,651 | |
Third quarter | | | 2,949 | | | | 2,325 | | | | 12,651,643 | |
Fourth quarter | | | 3,225 | | | | 2,235 | | | | 13,539,852 | |
Full year | | | 3,355 | | | | 2,235 | | | | 12,022,607 | |
2012: | | | | | | | | | | | | |
First quarter | | | 2,652 | | | | 2,251 | | | | 9,946,057 | |
Second quarter | | | 2,621 | | | | 2,055 | | | | 8,221,132 | |
Third quarter | | | 2,312 | | | | 2,003 | | | | 7,332,161 | |
Fourth quarter | | | 2,933 | | | | 2,161 | | | | 7,862,634 | |
Full year | | | 2,933 | | | | 2,003 | | | | 8,339,526 | |
Most recent six months: | | | | | | | | | | | | |
January | | | 2,451 | | | | 2,161 | | | | 7,074,821 | |
February | | | 2,806 | | | | 2,409 | | | | 8,782,352 | |
March | | | 2,933 | | | | 2,632 | | | | 7,655,700 | |
April | | | 2,788 | | | | 2,565 | | | | 6,351,805 | |
May | | | 2,558 | | | | 2,262 | | | | 5,686,095 | |
June | | | 2,632 | | | | 2,231 | | | | 5,946,100 | |
July (through July 10, 2012) | | | 2,679 | | | | 2,575 | | | | 5,294,271 | |
9.B. PLAN OF DISTRIBUTION
Not applicable.
9.C. MARKETS
The primary trading market for our common stock is the Tokyo Stock Exchange (First Section). Our common stock is also listed on the Osaka Securities Exchange (First Section) and the Nagoya Stock Exchange (First Section). Our common stock is not listed on any stock exchange outside of Japan.
Our ADSs have been listed on the NYSE since November 1, 2010 and are quoted under the ticker symbol “SMFG.”
9.D. SELLING SHAREHOLDERS
Not applicable.
134
9.E. DILUTION
Not applicable.
9.F. EXPENSES OF THE ISSUE
Not applicable.
| Item 10. | Additional Information |
10.A. SHARE CAPITAL
Not applicable.
10.B. MEMORANDUM AND ARTICLES OF INCORPORATION
Set out below is information concerning our share capital, including a summary of provisions of our articles of incorporation and share handling regulations and of the Companies Act relating to joint stock corporations (kabushiki-kaisha) and related legislation, each as currently in effect.
Register and Entry, Objects and Purposes of the Company
The Company is a joint stock corporation (kabushiki-kaisha) incorporated in Japan under the Companies Act (kaishaho) of Japan. It is registered in the commercial register (shogyo-tokibo) maintained by the Chiyoda Branch Office of the Tokyo Bureau of Legal Affairs.
Article 2 of our articles of incorporation provide that our purpose is to engage in the following business activities:
| | • | | management of banks and other corporations which are permitted to become, or to be established as, subsidiaries under the Banking Act; and |
| | • | | any business incidental to the business mentioned in the foregoing item. |
Provisions Relating to Directors
With respect to directors, the Companies Act and our articles of incorporation, bylaws and associated internal rules issued pursuant to the articles provide in summary as follows:
| | • | | a director is not entitled to vote on a proposal or arrangement or contract in which the director has a special interest; |
| | • | | the aggregate remuneration for directors are determined at a general meeting of shareholders and, within the upper limit approved at the general meeting of shareholders, our board of directors will determine the amount of compensation for each director; our board of directors may, by its resolution, leave such decision to the discretion of our representative director; |
| | • | | the board of directors has authority to approve transactions between the directors and us; |
| | • | | there are no provisions requiring the mandatory retirement of directors at a specified age; and |
| | • | | share ownership is not required in order to be eligible to serve as a director. |
Rights, Preferences and Restrictions of the Shares
A joint stock corporation is a legal entity incorporated under the Companies Act. The rights of shareholders of a joint stock corporation are represented by shares of stock in the corporation, and shareholders’ liability is limited to the amount of the subscription for the shares.
135
We may issue shares within our authorized but unissued share capital following a resolution by our board of directors. An increase in our authorized share capital requires an amendment of our articles of incorporation, which generally requires approval of our common and preferred shareholders, if any.
Common Stock
General
On January 5, 2009, a central clearing system of shares of Japanese listed companies was enacted under the Act Concerning Book-Entry Transfer of Corporate Bonds, Shares and Other Securities (“Book-Entry Transfer Act”) and the shares of all Japanese companies listed on any Japanese stock exchange, including our shares, became subject to this system, and all share certificates of companies then listed in Japan became null and void on the effective date of the Book-Entry Transfer Act.
Under the clearing system, a person must have an account at an account managing institution or at Japan Securities Depository Center, Inc. (“JASDEC”) in order to purchase, hold, sell or otherwise dispose of listed shares. Account managing institutions include financial instruments traders (i.e., securities companies), banks, trust companies and certain other financial institutions which meet the requirements prescribed by the Book-Entry Transfer Act, and only those financial institutions that meet further stringent requirements of the Book-Entry Transfer Act can open accounts directly at JASDEC. Under the Book-Entry Transfer Act, any transfer of shares is effected through book entry, and title to the shares passes to the transferee at the time when the transferred number of the shares is recorded in the transferee’s account at an account managing institution. The holder of an account at an account managing institution is presumed to be the legal owner of the shares held in such account.
Under the Companies Act and the Book-Entry Transfer Act, in order to assert shareholders’ rights against us, a shareholder’s name and address must be registered in our register of shareholders, except in limited circumstances. Under the clearing system, such registration is made upon our receipt of the necessary information from JASDEC. Nonresident shareholders are required to appoint a standing proxy in Japan or provide a mailing address in Japan. Each nonresident shareholder must give notice of a standing proxy or a mailing address to the relevant account managing institution. That notice will be forwarded to us through JASDEC. Japanese securities companies and commercial banks customarily act as standing proxies and provide related services for standard fees. Notices from us to nonresident shareholders are delivered to standing proxies or their mailing addresses in Japan.
Our transfer agent is Sumitomo Mitsui Trust Bank, Limited, formerly known as The Sumitomo Trust and Banking Company, Limited.
Distributions of Surplus
As a holding company, we expect that most of our cash flow will come from dividends that the Bank pays us. Under some circumstances, various statutory or contractual provisions may restrict the dividends the Bank can pay us. For example, if the Bank does not have sufficient distributable amounts, it will be unable to pay dividends and we, in turn, may be unable to pay dividends on shares of our common stock. Therefore, our ability to pay dividends mainly depends on the financial performance of our principal operating subsidiary, the Bank.
Under the Companies Act, distribution of cash or other assets by a joint stock corporation to its shareholders, including dividends, takes the form of distributions of surplus (as described in “—Restriction on Distributions of Surplus”). We are permitted to make distributions of surplus to our shareholders any number of times per fiscal year, subject to limitations described in “—Restriction on Distributions of Surplus.” Distributions of surplus are required in principle to be authorized by a resolution of a general meeting of shareholders. Distributions of surplus are, however, permitted pursuant to a resolution of the board of directors if:
| | (1) | our articles of incorporation so provide (our current articles of incorporation do not have a provision to that effect); |
136
| | (2) | the normal term of office of our directors is no longer than one year (our current articles of incorporation provide that the normal term of office of our directors expires upon the close of the general meeting of shareholders to be held for the last fiscal year ending within two years after the election); and |
| | (3) | our nonconsolidated annual financial statements and certain documents for the latest fiscal year fairly present our assets and profit or loss, as required by an ordinance of the Ministry of Justice. |
In an exception to the above rule, even if the requirements described in (1) through (3) are not met, we are permitted to make distributions of surplus in cash to our shareholders by resolutions of the board of directors once per fiscal year if our articles of incorporation so provide. Our current articles of incorporation provide for distributions of surplus as interim dividends, the record date for which is September 30 of each year.
Distributions of surplus may be made in cash or in kind in proportion to the number of shares of common stock held by each shareholder. A resolution of a general meeting of shareholders or by the board of directors authorizing a distribution of surplus must specify the kind and aggregate book value of assets to be distributed, the manner of allocation of the assets to shareholders, and the effective date of the distribution. If a distribution of surplus is to be made in kind, we may, pursuant to a resolution of a general meeting of shareholders or by the board of directors, grant the right to our shareholders to require us to make the distribution in cash instead of in kind. If that right is not granted to shareholders, then the relevant distribution of surplus must be approved by a special resolution of a general meeting of shareholders.
Under our articles of incorporation, the record dates for annual dividends and interim dividends are March 31 and September 30, respectively, in each year. In Japan, both “ex-dividend date” (the date from which purchasers at shares through Japanese stock exchanges will not be entitled to the dividends to be paid to registered shareholders as any record date) and the record date for dividends precede the date of determination of the amount of the dividend to be paid. The ex-dividend date of the shares of common stock is generally the third business day prior to the record date. Under our articles of incorporation, we are not obligated to pay any distributions of surplus to be made in cash which have not been received after five years from the commencement date of those distributions.
Restriction on Distributions of Surplus
Payment of dividends on shares of common stock is also subject to the prior payment of dividends on shares of preferred stock, if any. In the event we pay an interim dividend on shares of our common stock, the interim dividend payment is also subject to the prior payment of interim dividends on the shares of preferred stock, if any.
When we make a distribution of surplus, we must set aside in our capital reserve or retained earnings reserve an amount equal to one-tenth of the amount of surplus so distributed as required by an ordinance of the Ministry of Justice.
The amount of surplus at any given time must be calculated in accordance with the following formula:
A + B + C + D – (E + F + G)
In the above formula:
| | | | | | |
“A” | | | = | | | the total amount of other capital surplus and other retained earnings, each being the amount that appears on our nonconsolidated balance sheet as of the end of the last fiscal year; |
| | |
“B” | | | = | | | if we have disposed of treasury stock after the end of the last fiscal year, the amount of the consideration for that treasury stock received by us less the book value thereof; |
137
| | | | | | |
| | |
“C” | | | = | | | if we have reduced our stated capital after the end of the last fiscal year, the amount of that reduction less the portion thereof that has been transferred to capital reserve or retained earnings reserve, if any: |
| | |
“D” | | | = | | | if we have reduced our capital reserve or retained earnings reserve after the end of the last fiscal year, the amount of that reduction less the portion thereof that has been transferred to stated capital, if any: |
| | |
“E” | | | = | | | if we have cancelled treasury stock after the end of the last fiscal year, the book value of that treasury stock; |
| | |
“F” | | | = | | | if we have distributed surplus to our shareholders after the end of the last fiscal year, the total book value of the surplus so distributed; and |
| | |
“G” | | | = | | | other amounts set forth in an ordinance of the Ministry of Justice, including: |
| | • | | if we have reduced surplus and increased our stated capital, capital reserve or retained earnings reserve after the end of the last fiscal year, the amount of that reduction; and |
| | • | | if we have distributed surplus to shareholders after the end of the last fiscal year, the amount set aside in our capital reserve or retained earnings reserve, if any, as required by ordinances of the Ministry of Justice. |
The aggregate book value of surplus distributed by us may not exceed a prescribed distributable amount as calculated on the effective date of the distribution. Our prescribed distributable amount at any given time shall be the amount of surplus less the aggregate of (a) the book value of our treasury stock, (b) the amount of consideration for any treasury stock we disposed of after the end of the last fiscal year, (c) the sum of net unrealized losses on other securities and unrealized losses on land valuation, and (d) other amounts set forth in an ordinance of the Ministry of Justice, including (if the sum of one-half of our goodwill and deferred assets exceeds the total of the stated capital, capital reserve and retained earnings reserve, each being the amount in our nonconsolidated balance sheet at the end of the last fiscal year) all or a certain part of the exceeding amount as calculated in accordance with the ordinances of the Ministry of Justice. If we have prepared interim financial statements in accordance with the ordinances of the Ministry of Justice as described below, and if the interim financial statements have been approved by the board of directors or (if so required) by a general meeting of shareholders, then the prescribed distributable amount must be adjusted to take into account the amount of profit or loss, and the amount of consideration for any of our treasury stock disposed of by us, during the period for which the interim financial statements have been prepared. We will be permitted to prepare nonconsolidated interim financial statements consisting of a balance sheet at any date subsequent to the end of the last fiscal year and an income statement for the period from the first day of the current fiscal year to the date of the balance sheet. Interim financial statements so prepared by us must be audited by our corporate auditors and/or accounting auditors, as required by an ordinance of the Ministry of Justice.
Voting Rights
Holders of shares of common stock have one voting right for each unit of shares held by them. Except as otherwise provided by law or by our articles of incorporation, a resolution can be adopted at a general shareholders’ meeting by the holder of a majority of the total number of the voting rights represented at the meeting. In our articles of incorporation the quorum to elect directors and corporate auditors is one-third of the total number of voting rights. Our shareholders are not entitled to cumulative voting in the election of directors. Our shareholders may cast their votes by mail or via the internet. Our shareholders may also exercise their voting rights through proxies, provided that the proxies are also holders of shares with voting rights.
The Companies Act provides that certain important matters shall be approved by a special resolution of a general shareholders’ meeting. Under our articles of incorporation, the quorum for a special resolution is
138
one-third of the total number of voting rights and the approval of at least two-thirds of the voting rights represented at the meeting is required for adopting a special resolution. Important matters include:
| | • | | amending the articles of incorporation (except for amendments that may be authorized by the board of directors under the Companies Act); |
| | • | | reducing stated capital which meets certain requirements, with some exceptions; |
| | • | | removing a corporate auditor; |
| | • | | dissolving, merging or consolidating requiring shareholders’ approval; |
| | • | | establishing a parent and a wholly owned subsidiary relationship by way of a share transfer (kabushiki-iten) or share exchange (kabushiki-kokan) requiring shareholders’ approval; |
| | • | | transferring the whole or a substantial part of our business; |
| | • | | taking over the whole business of another company requiring shareholders’ approval; |
| | • | | corporate split requiring shareholders’ approval; |
| | • | | consolidating shares of common stock; |
| | • | | acquiring shares of common stock from a specific shareholder other than one of our subsidiaries; |
| | • | | issuing or transferring new shares or existing shares held by us as treasury stock to persons other than the shareholders at a specially favorable price; |
| | • | | issuing stock acquisition rights (including those incorporated in bonds with stock acquisition rights) to persons other than the shareholders under specially favorable conditions; |
| | • | | exempting some liability of a director or corporate auditor; and |
| | • | | distributing surplus in-kind if shareholders are not granted the right to require us to make a distribution in cash instead of in-kind. |
Capital and Reserves
When we issue new shares, the amount of the cash or assets paid or contributed by subscribers for new shares (with some exceptions) is required to be accounted for as stated capital, although we may account for an amount not exceeding one-half of the cash or assets as capital reserve by resolutions of the board of directors.
We may reduce our capital reserve or retained earnings reserve generally by resolution of a general meeting of shareholders. We may account for the whole or any part of the reduction as stated capital if we so decide by the same resolution. On the other hand, we may reduce our stated capital generally by special resolution of a general meeting of shareholders and may account for the whole or any part of the reduction as capital reserve if we so decide by the same resolution. We may reduce our surplus and increase either (1) stated capital or (2) capital reserve and/or retained earnings reserve by the same amount, in either case by resolution of a general meeting of shareholders.
Stock Splits
We may at any time split our outstanding shares of common stock into a greater number of shares of common stock by resolution of the board of directors. When a stock split is to be made, so long as our only class of outstanding stock is the common stock, we may increase the number of authorized shares in the same ratio as that of the stock split by amending our articles of incorporation. We may effect such an amendment by resolution of the board of directors without shareholder approval.
We must give public notice of a stock split, specifying the record date therefor, not less than two weeks prior to the record date.
139
The board of directors, in May 2008, adopted a resolution on a stock split. The record date for the stock split was one day prior to the effective date of the stock split. Our shareholders approved amendments to the articles of incorporation to abolish the fractional share system and to adopt a unit share system, under which 100 shares of common stock constitute one unit, at our shareholders’ meeting held in June 2008. These amendments to our articles of incorporation became effective in January 2009.
Unit Share System
We have a unit share system, under which 100 shares of our common stock constitute one unit. Under the unit share system, shareholders have one voting right for each unit of shares held by them at a general meeting of shareholders, and shares constituting a fractional unit carry no voting rights. Under our articles of incorporation, the holders of shares constituting a fractional unit do not have shareholder rights except for those specified in the Companies Act or an ordinance of the Ministry of Justice, which include the rights (1) to receive dividends, (2) to receive cash or other assets in case of consolidation or split of shares, share exchange or share transfer, or merger, or (3) to be allotted rights to subscribe for free new shares and stock acquisition rights when those rights are granted to shareholders. We may cease to use the unit share system by amendment to the articles of incorporation without shareholders’ approval even though amendments to the articles of incorporation generally require a special resolution of the general meeting of shareholders.
A holder of shares of our common stock constituting less than one unit may at any time request us to purchase those shares. In addition, a holder of shares of our common stock constituting less than one unit may at any time request us to sell to it the number of shares necessary to raise its share ownership to a whole unit. Under the clearing system operated by JASDEC, such request must be made through the financial institution where the shareholder has opened its account.
The price at which shares of our common stock constituting less than one unit will be purchased or sold by us pursuant to such request will be equal to either (a) the closing price of shares of our common stock reported by the Tokyo Stock Exchange on the day when such request is received by our transfer agent, or (b) if no sale takes place on the Tokyo Stock Exchange on that day, the price at which sale of such shares is executed on the Tokyo Stock Exchange immediately thereafter. Pursuant to our share handling regulations, an amount equal to the applicable brokerage commission will be deducted from the price so determined.
Under the new clearing system, shares constituting less than one unit are transferable. Under the rules of the Japanese stock exchanges, however, shares constituting less than one unit do not comprise a trading unit, except in limited circumstances, and accordingly, may not be sold on the Japanese stock exchanges.
Liquidation Rights
In the event of our liquidation, the assets remaining after payment of all debts, liquidation expenses, taxes and required distribution payments to preferred shareholders, if any, will be distributed among shareholders of common stock in proportion to the respective number of shares which they hold. For liquidation preference for residual assets to the holders of preferred stock, see “—Preferred Stock—Liquidation Rights.”
Redemption Provisions and Sinking Fund Provisions
Our common stock has no redemption provisions or sinking fund provisions.
Liability to Further Calls or Assessments
Our shares of common stock outstanding, including shares represented by the ADSs, are fully paid and nonassessable.
140
Legal Restrictions on Acquisitions of Shares
The Financial Instruments and Exchange Act of Japan (“FIEA”) and its related regulations require any person who has become solely or jointly a beneficial holder of more than 5% of the total issued shares of capital stock of a company listed on any Japanese stock exchange, to file with the director of an appropriate local finance bureau of the Ministry of Finance within five business days a report concerning the shareholdings. With some exceptions, a similar report must also be filed in respect of any subsequent change of 1% or more in those holdings or any change in material matters set out in reports previously filed. For this purpose, shares issuable to a holder upon conversion of convertible securities or exercise of share subscription warrants or stock acquisition rights are taken into account in determining both the number of shares held by such holder and the issuer’s total issued share capital. Copies of each report must also be furnished to the company and to all the Japanese stock exchanges on which the shares are listed.
Under the Banking Act, a person who desires to hold 20% (in some exceptional cases, 15%) or more of the voting rights of a bank is required to obtain advance approval of the FSA Commissioner. In addition, any person who becomes a holder of more than 5% of the voting rights of a bank holding company or a bank must report the ownership of the voting rights to the Director of an appropriate local finance bureau within five business days. This requirement is separate from the significant shareholdings report required under the FIEA. See “Item 4.B. Business Overview—Regulation—Japan—Examination and Reporting Applicable to Shareholders of a Bank.”
Subscription Rights
Holders of shares of our common stock have no preemptive rights. Authorized but unissued shares of common stock may be issued at the times, and upon the terms the board of directors determines, subject to the limitations as to the issuance of new shares of common stock at a specially favorable price mentioned in “—Voting Rights” above. The board of directors may, however, determine that the holders of shares of common stock be given subscription rights to new shares of common stock, in which case they must be given on uniform terms to all holders of shares of common stock at a record date of which not less than two weeks’ prior public notice must be given. Each of the shareholders to whom subscription rights is given must also be given at least two weeks’ prior notice of the date on which the rights expire.
Stock Acquisition Rights
We may issue stock acquisition rights (shinkabu-yoyakuken). Holders of stock acquisition rights are entitled to acquire shares from us upon payment of the applicable exercise price and subject to other terms and conditions thereof. We may also issue bonds with stock acquisition rights (shinkabu-yoyakuken-tsuki-shasai). The issuance of stock acquisition rights and bonds with stock acquisition rights may be authorized by the board of directors unless it is made under specially favorable conditions, as described in “—Voting Rights.”
Record Date
March 31 is the record date for the payment of year-end dividends and the determination of shareholders entitled to vote at the annual general meeting of shareholders. September 30 is the record date for payment of interim dividends. In addition, by a resolution of the board of directors and after giving at least two weeks’ prior public notice, we may at any time set a record date in order to determine the shareholders who are entitled to certain rights pertaining to the common stock.
Under the Book-Entry Transfer Act, we are required to give notice of each record date to JASDEC at least two weeks prior to such record date. JASDEC is required to give us notice of the names and addresses of our shareholders, the numbers of shares held by them, and other relevant information at a record date promptly after we set it.
141
Our Acquisition of Our Own Shares of Common Stock
We may acquire shares of our common stock (1) by way of purchase on any Japanese stock exchange on which shares of our common stock are listed, or by way of tender offer (in either case, pursuant to an ordinary resolution of a general meeting of shareholders or a resolution of the board of directors), (2) from a specific shareholder other than any of our subsidiaries (pursuant to a special resolution of a general meeting of shareholders), or (3) from any of our subsidiaries (pursuant to a resolution of the board of directors). In the case of (2) above, any other shareholder may make a request to a director, at least five days prior to the relevant shareholders’ meeting, to include the shareholder as a seller in the proposed purchase. However, that right is not available if the purchase price or any other consideration to be received by the relevant specific shareholder does not exceed the then market price of the shares to be purchased from the shareholder.
The total amount of the purchase price of shares of common stock may not exceed the prescribed distributable amount, as described in “—Common Stock—Restriction on Distributions of Surplus.”
We may hold the shares of common stock acquired, and may generally dispose of or cancel those shares by resolution of the board of directors.
Disposal of Shares of Our Common Stock Held by Shareholders Whose Location Is Unknown
We are not required to send notices to a shareholder if notices have failed to arrive for five consecutive years or more at his or her address in our register of shareholders unless we are notified of a new address. If the shareholder also fails to receive distributions of surplus on the shares for five or more consecutive years at his or her address in our register of shareholders or otherwise as specified, then we may in general dispose of those shares at their then-market price and hold or deposit the proceeds of that disposition on behalf of that shareholder.
Preferred Stock
The following is a summary of information concerning provisions of our articles of incorporation.
General
At the date of this annual report, under our articles of incorporation, we are authorized to issue 167,000 shares of Type 5 preferred stock, 70,001 shares of Type 6 preferred stock, 167,000 shares of Type 7 preferred stock, 115,000 shares of Type 8 preferred stock and 115,000 shares of Type 9 preferred stock.
In February 2003, we issued 50,100 shares of Type 4 preferred stock for an aggregate price of ¥150.3 billion. The Type 4 preferred stock was issued at a price of ¥3,000,000 per share, ¥1,500,000 of which was accounted for as stated capital. On April 30, 2008, Goldman Sachs exercised the acquisition rights granted to 16,700 shares of the Type 4 preferred stock and on January 28, 2010, Goldman Sachs exercised the acquisition rights granted to 33,400 shares of Type 4 preferred stock.
In March 2005, we issued 70,001 shares of our 1st series Type 6 preferred stock for an aggregate issue price of ¥210 billion. The Type 6 preferred stock was allocated using a third-party allocation of shares at a price of ¥3,000,000 per share, ¥1,500,000 of which was accounted for as stated capital. Sumitomo Life Insurance Company acquired 23,334 shares, Nippon Life Insurance Company acquired 20,000 shares, Mitsui Life Insurance Company, Limited acquired 16,667 shares and Mitsui Sumitomo Insurance Company, Limited acquired 10,000 shares. On April 1, 2011, we acquired and cancelled all of the outstanding 1st series Type 6 preferred stock.
At the date of this annual report, we have no preferred stock outstanding. The following is a summary of the relevant provisions of our articles of incorporation regarding preferred stock.
142
Preferred Dividends
Our articles of incorporation provide that, if we pay dividends, we must pay cash dividends to holders of shares of our preferred stock in preference to the holders of our common stock. If preferred interim dividends stipulated in our articles of incorporation were paid during the relevant fiscal year, the amount of the preferred interim dividends shall be subtracted from the amount of annual preferred dividends.
Our failure to declare annual preferred dividends in full in respect of any fiscal year on a series of preferred stock gives the holders of that preferred stock certain voting rights.
Liquidation Rights
In the event of our voluntary or involuntary liquidation, holders of our preferred stock will be entitled, equally in rank as among themselves and in preference over shares of our common stock, to receive out of our residual assets upon liquidation a distribution of ¥3,000,000 per share.
Preferred stockholders are not entitled to any further dividends or other participation or distribution of our residual assets upon our liquidation.
Voting Rights
Our articles of incorporation provide that holders of preferred stock are only entitled to receive notice of, and to vote at, a general meeting of shareholders
| | • | | from the commencement of our annual general meeting of shareholders if an agenda for approval to declare a preferred dividend is not submitted to the meeting; or |
| | • | | from the close of our annual general meeting of shareholders if a proposed resolution to declare a preferred dividend is not approved at the meeting. |
In both cases, these rights of our preferred stockholders lapse when a resolution of a meeting of shareholders declaring a preferred dividend is approved.
The Companies Act provides that a separate resolution of a meeting of the holders of the preferred stock is required in order to approve certain matters which would prejudice their interests, including
| | • | | amendments to the articles of incorporation to add new classes of shares to be issued, alter the terms of the shares or increase the number of shares or authorized number of any class of shares, with certain exceptions; |
| | • | | consolidations or splits of shares; |
| | • | | dividends of shares or stock acquisition rights to shareholders without any consideration; |
| | • | | grants of preemptive rights for new shares or stock acquisition rights; |
| | • | | amalgamations or mergers; |
| | • | | certain corporate splits; |
| | • | | other matters set forth in the articles of incorporation. |
Except for the amendments described above, the articles of incorporation may expressly permit certain of the above matters to be approved without a separate resolution. Our articles of incorporation do not include that express permission.
143
Ranking
If issued, the outstanding shares of our preferred stock would rankpari passu with each other as to participation in our profits or assets, including dividends and distributions of residual assets upon our liquidation.
Unless holders of our preferred stock give approval, we may not create or issue any other shares ranking in priority in terms of the right to receive distributions of surplus or the right to receive distributions of residual assets or otherwise in priority to the preferred stock already issued. However, without obtaining the consent of holders of the preferred stock, we may issue other preferred stock rankingpari passu with the preferred stock already issued as to the order of participation in our profits or assets, carrying rights to preferred dividends, or terms of conversion that our board of directors may determine, subject to limitations set forth in our articles of incorporation and the Companies Act.
Purchase or Redemption of Preferred Stock
Subject to the requirements provided in the Companies Act, we may purchase out of our prescribed distributable amounts any shares of the preferred stock then outstanding at any time and cancel that preferred stock.
Mandatory Redemption Provisions and Sinking Fund Provisions
Our articles of incorporation do not provide any mandatory redemption provisions and sinking fund provisions.
Stock Splits
Our articles of incorporation provide that no stock split shall be made to the preferred stock unless otherwise provided for in any law or regulation.
Subscription Rights
Our articles of incorporation provide that we shall not grant holders of preferred stock any right to subscribe for new shares or stock acquisition rights.
Conditions to Change Shareholders’ Rights
Our articles of incorporation do not specify what actions or quorums are required to change the rights of holders of our stock.
General Meeting of Shareholders
Our annual general meeting of shareholders is held within three months after the end of each fiscal year. In addition, we may hold an extraordinary general meeting of shareholders whenever necessary. Notice of a shareholders’ meeting stating the place, the time and the purpose thereof, and certain matters set forth in the Companies Act and in ordinances of the Ministry of Justice, must be given to each holder of shares of common stock with voting rights (or to the standing proxy or mailing address in Japan of a nonresident shareholder) at least two weeks prior to the date set for the meeting. The record date for an annual general meeting of shareholders is March 31 of each year.
Any shareholder or group of shareholders holding at least three percent of the total outstanding voting rights, for a continuous period of six months or longer, may require the convocation of a general meeting of shareholders for a particular purpose. Unless such a general meeting of shareholders is convened promptly, or a convocation notice of a meeting which is to be held not later than eight weeks from the day of such demand is dispatched, the requiring shareholders may, upon obtaining court approval, convene such shareholders’ meeting.
144
Any shareholder holding at least 300 voting rights or one percent of our total number of voting rights for six months or longer may propose a matter to be considered at a general meeting of shareholders by submitting a written request to a director at least eight weeks prior to the date of the meeting. Any of the minimum percentages, time periods and number of voting rights necessary for exercising the minority shareholder rights described above may be decreased or shortened if our articles of incorporation so provide. Our articles of incorporation currently do not include any of those provisions.
To attend a shareholders’ meeting in person or by proxy, shareholders must provide proof of identity upon request. Shareholders may appoint a proxy by a written power of attorney for the meeting. Such proxy must be one of our shareholders with voting rights.
Limitations on the Rights to Hold Our Common Stock by Foreign Investors
There are no specific limitations imposed by the laws of Japan, our articles of incorporation, or our other constituent documents, on the rights of nonresidents or foreign shareholders to hold or exercise voting rights on our shares of common stock or preferred stock. For additional information, See “Common Stock—Voting Rights.”
Anti-Change in Control Provisions
There is no provision in our articles of incorporation that would have the effect of delaying, deferring or preventing a change in control of us, and that would operate only with respect to a merger, consolidation, acquisition or corporate restructuring involving us.
Provisions Governing Changes in the Company’s Capital
We have no conditions more stringent than are required by law imposed by our articles of incorporation governing changes in capital.
10.C. MATERIAL CONTRACTS
All contracts that we are currently a party to, or were a party to during our two most recently completed fiscal years up to the date of this annual report, were entered into in the ordinary course of business or were otherwise immaterial.
10.D. EXCHANGE CONTROLS
Japanese Foreign Exchange Regulations
The Foreign Exchange and Foreign Trade Act of Japan, and the cabinet orders and ministerial ordinances, collectively known as the Foreign Exchange Act, set forth, among other things, the regulations relating to the receipt by nonresidents of Japan of payment with respect to our shares, and the acquisition and holding of our shares by nonresidents of Japan and foreign investors, both as defined below.
Nonresidents of Japan are individuals who are not residents in Japan and corporations whose principal offices are located outside Japan. Generally, branches and offices of nonresident corporations located in Japan are regarded as residents of Japan while the branches and offices of Japanese corporations located outside Japan are regarded as nonresidents of Japan.
“Foreign investors” are defined as:
| | • | | individuals not residing in Japan; |
| | • | | corporations which are organized under the laws of foreign countries or whose principal offices are located outside Japan; |
145
| | • | | corporations of which 50% or more of the voting rights are held, directly or indirectly, by individuals not residing in Japan and/or corporations which are organized under the laws of foreign countries or whose principal offices are located outside Japan; and |
| | • | | corporations, a majority of officers (or a majority of officers having the power of representation) of which are individuals not residing in Japan. |
Acquisition of Shares
In general, a nonresident who acquires our shares from a resident of Japan is not subject to any prior filing requirement, although the Foreign Exchange Act authorizes the Minister of Finance of Japan and the Ministers responsible for the business to require a prior submission for any such acquisition in certain limited circumstances.
If a foreign investor acquires shares of our common stock, and, together with parties who have a special relationship with such foreign investor, holds 10% or more of the issued shares of our common stock as a result of the acquisition, the foreign investor must file a report of the acquisition with the Minister of Finance and any other competent minister by the fifteenth day of the month immediately following the month to which the date of such acquisition belongs.
Except for the general limitation under Japanese antitrust and antimonopoly regulations against shareholdings in the capital stock of a Japanese corporation, which lead or may lead to a restraint of trade or monopoly, and general limitations under the Companies Act or our articles of incorporation on the rights of shareholders applicable, regardless of residence or nationality, there is no limitation under Japanese law and regulations applicable to us, or under our articles of incorporation on the rights of nonresident or foreign shareholders to hold or exercise voting rights on our shares.
Dividends and Proceeds of Sale
Under the Foreign Exchange Act, dividends paid on, and the proceeds of sales in Japan of, shares held by nonresidents of Japan, may, in general, be converted into any foreign currency and repatriated abroad. The acquisition of our shares by nonresidents by way of a stock split is not, in general, subject to any notification or reporting requirements.
10.E. TAXATION
Japanese Taxation
The following is a summary of the principal Japanese national tax consequences to owners of shares of our common stock or ADSs representing shares of our common stock who are nonresidents of Japan or non-Japanese corporations without a permanent establishment in Japan (“Nonresident Shareholders”). The statements regarding Japanese tax laws set forth below are based on the laws and treaties currently in force and as interpreted by the Japanese tax authorities at the date of this annual report and are subject to changes in the applicable Japanese law or tax treaties, conventions or agreements, or in the interpretation thereof, occurring after that date. This summary does not include all possible tax considerations which may apply to a particular investor and potential investors are advised to satisfy themselves as to the overall tax consequences of the acquisition, ownership and disposition of shares of our common stock or ADSs, including specifically the tax consequences under Japanese law, the laws of the jurisdiction of which they are resident, and any tax treaty, convention or agreement between Japan and their country of residence, by consulting their own tax advisors.
For the purpose of Japanese taxation, a Nonresident Shareholder of ADSs will generally be treated as the owner of the shares underlying the ADSs, which may be evidenced by one or more ADRs.
146
Generally, a Nonresident Shareholder of shares of our common stock or ADSs will be subject to Japanese income tax collected by way of withholding on dividends we pay. Stock splits are, in general, not subject to Japanese income tax or corporation tax.
In the absence of any applicable tax treaty, convention or agreement reducing the maximum rate of Japanese withholding tax or allowing exemption from Japanese withholding tax, the rate of Japanese withholding tax applicable to dividends paid by a Japanese corporation to Nonresident Shareholders is generally 20% (20.42%, on or after January 1, 2013). However, with respect to dividends paid on listed shares issued by a Japanese corporation (including shares of our common stock or ADSs) to Nonresident Shareholders, except for any individual shareholder who owns 3% or more of the total number of shares issued by the relevant Japanese corporation, the aforementioned 20% (20.42%, on or after January 1, 2013) withholding tax rate is reduced to (1) 7% for dividends due and payable on or before December 31, 2012, (2) 7.147% for dividends due and payable on or after January 1, 2013 but on or before December 31, 2013, and (3) 15.315% for dividends due and payable on or after January 1, 2014. Due to the imposition of a special additional withholding tax (2.1% of the original withholding tax amount) to secure funds for reconstruction from the Great East Japan Earthquake, the original withholding tax rate of 7%, 15% and 20%, as applicable, will be effectively increased, respectively, to 7.147%, 15.315% and 20.42%, during the period beginning on January 1, 2013 and ending on December 31, 2037.
At the date of this annual report, Japan has income tax treaties in force, whereby the above-mentioned withholding tax rate is reduced, generally, to 15% for portfolio investors, with, among others, Belgium, Canada, Denmark, Finland, Germany, Ireland, Italy, Luxembourg, New Zealand, Norway, Singapore, Spain and Sweden, while the income tax treaties with Australia, France, Hong Kong, the Netherlands, Switzerland, the United Kingdom and the United States generally reduce the withholding tax rate to 10% for portfolio investors. In addition, under the income tax treaty between Japan and the United States, dividends paid to pension funds which are qualified U.S. residents eligible to enjoy treaty benefits are exempt from Japanese income taxation by way of withholding or otherwise unless the dividends are derived from the carrying on of a business, directly or indirectly, by those pension funds. Under the income tax treaties with the Netherlands, Switzerland and the United Kingdom, similar treatment will be applied to dividends. Under Japanese tax law, any reduced maximum rate applicable under a tax treaty will be available when the maximum rate is below the rate otherwise applicable under Japanese tax law referred to in the preceding paragraph with respect to the dividends to be paid by us on shares of common stock or ADSs. A Nonresident Shareholder of shares of our common stock who is entitled, under any tax treaty, to a reduced rate of Japanese withholding tax, or exemption therefrom, as the case may be, is required to submit an Application Form for Income Tax Convention Regarding Relief from Japanese Income Tax on Dividends (together with any other required forms and documents) in advance, through the withholding agent, to the relevant tax authority before payment of dividends. A standing proxy for a Nonresident Shareholder may provide the application services. See “Item 10.B Memorandum and Articles of Incorporation—Common Stock—General.” With respect to ADSs, this reduced rate or exemption will be applicable to Nonresident Shareholders of ADSs if the Depositary or its agent submits two Application Forms (one before payment of dividends and the other within eight months after the record date concerning such payment of dividends), together with certain other documents. To claim this reduced rate or exemption, Nonresident Shareholders of ADSs will be required to file a proof of taxpayer status, residence and beneficial ownership, as applicable, and to provide other information or documents as may be required by the Depositary. A Nonresident Shareholder who is entitled, under any applicable tax treaty, to a reduced rate of Japanese withholding tax below the rate otherwise applicable under Japanese tax law mentioned above, or exemption therefrom, as the case may be, but fails to submit the required application in advance may nevertheless be entitled to claim a refund from the relevant Japanese tax authority of withholding taxes withheld in excess of the rate under an applicable tax treaty (if the Nonresident Shareholder is entitled to a reduced treaty rate under the applicable tax treaty) or the full amount of tax withheld (if the Nonresident Shareholder is entitled to an exemption under the applicable tax treaty), as the case may be, by complying with certain subsequent filing procedures. We do not assume any responsibility to ensure withholding at the reduced treaty rate, or exemption therefrom, for shareholders who would be so eligible under an applicable tax treaty but where the required procedures as stated above are not followed.
147
Gains derived from the sale outside Japan of shares of our common stock or ADSs by a Nonresident Shareholder who is a portfolio investor are, in general, not subject to Japanese income tax or corporation tax.
Any deposits or withdrawals of shares of our common stock by a Nonresident Shareholder in exchange for ADSs are, in general, not subject to Japanese income or corporation tax.
Japanese inheritance and gift taxes at progressive rates may be payable by an individual who has acquired shares of our common stock or ADSs from another individual as a legatee, heir or donee, even if the individual is not a Japanese resident.
Potential investors should consult with their own tax advisors regarding the Japanese tax consequences of the ownership and disposition of shares of common stock or ADSs in light of their particular situations.
United States Federal Income Taxation
The following is a discussion of the material U.S. federal income tax consequences to the U.S. Holders described below of owning and disposing of shares or ADSs, but it does not purport to be a comprehensive description of all the tax considerations that may be relevant to a particular person’s decision to hold the shares or ADSs. This discussion does not address U.S. state, local or non-U.S. tax consequences. As used herein, a U.S. Holder is a beneficial owner of shares or ADSs that is, for U.S. federal income tax purposes: (1) a citizen or resident of the United States; (2) a corporation, or other entity taxable as a corporation, created or organized in or under the laws of the United States or any political subdivision thereof; or (3) an estate or trust the income of which is subject to U.S. federal income taxation regardless of its source.
The discussion applies only to U.S. Holders who hold the shares or ADSs as capital assets for U.S. federal income tax purposes, and it does not address all of the tax consequences which may be applicable to special classes of holders, such as:
| | • | | certain financial institutions; |
| | • | | dealers and certain traders in securities; |
| | • | | persons holding shares or ADSs as part of a hedge, straddle, conversion or other integrated transaction; |
| | • | | persons whose functional currency for U.S. federal income tax purposes is not the U.S. dollar; |
| | • | | regulated investment companies; |
| | • | | real estate investment trusts; |
| | • | | partnerships or other entities classified as partnerships for U.S. federal income tax purposes; |
| | • | | persons liable for the alternative minimum tax; |
| | • | | tax-exempt entities, including “individual retirement accounts” or “Roth IRAs”; |
| | • | | persons who acquired our shares or ADSs pursuant to the exercise of an employee stock option or otherwise as compensation; |
| | • | | persons holding shares or ADSs that own or are deemed to own 10% or more of our voting stock; or |
| | • | | persons holding shares or ADSs in connection with a trade or business conducted outside the United States. |
If a partnership holds shares or ADSs, the tax treatment of a partner will generally depend upon the status of the partner and the activities of the partnership. Partnerships holding shares or ADSs, and partners in such partnerships, should consult their own tax advisors.
148
This discussion is based on the Internal Revenue Code of 1986, as amended, administrative pronouncements, judicial decisions and final, temporary and proposed United States Treasury regulations, as well as the double taxation treaty between Japan and the United States (the “Treaty”) all as of the date hereof. These laws are subject to change, possibly on a retroactive basis. It is also based in part on representations by the Depositary and assumes that each obligation under the Deposit Agreement and any related agreement or undertaking will be performed in accordance with its terms.
In general, a U.S. Holder who owns ADSs will be treated as the owner of the underlying shares represented by those ADSs for U.S. federal income tax purposes. Accordingly, no gain or loss will be recognized if a U.S. Holder exchanges ADSs for the underlying shares represented by those ADSs.
The U.S. Treasury has expressed concern that parties to whom ADSs are released before shares are delivered to the depositary (“prerelease”), or intermediaries in the chain of ownership between holders and the issuer of the security underlying the ADSs, may be taking actions that are inconsistent with the claiming of foreign tax credits by holders of ADSs. These actions would also be inconsistent with the claiming of the reduced rate of tax, described below, applicable to dividends received by certain noncorporate holders. Accordingly, the creditability of Japanese taxes, and the availability of the reduced tax rate for dividends received by certain noncorporate U.S. Holders, each described below, could be affected by actions taken by such parties or intermediaries.
U.S. Holders should consult their own tax advisors concerning the U.S. federal, state, local and non-U.S. tax consequences of owning and disposing of shares or ADSs in their particular circumstances.
This discussion assumes that we are not, and will not become, a passive foreign investment company, as described below.
Taxation of Distributions
Distributions received by a U.S. Holder on shares or ADSs, including the amount of any Japanese taxes withheld, other than certain pro rata distributions of shares, will constitute foreign-source dividend income to the extent paid out of our current or accumulated earnings and profits (as determined under U.S. federal income tax principles). Because we do not maintain calculations of our earnings and profits under U.S. federal income tax principles, we expect that distributions generally will be reported to a U.S. Holder as dividends. The amount of the dividends a U.S. Holder will be required to include in income will equal the U.S. dollar value of the yen dividend, calculated by reference to the exchange rate in effect on the date the payment is received by the holder, or in the case of ADSs, by the Depositary, regardless of whether the payment is converted into U.S. dollars on the date of receipt. If the dividend is converted into U.S. dollars on the date of receipt, the U.S. Holder generally should not be required to recognize foreign currency gain or loss in respect of the dividend payment. A U.S. Holder may have foreign currency gain or loss if the dividend is converted into U.S. dollars after the date of receipt. Any foreign currency gain or loss realized by a U.S. Holder on a sale or other disposition of yen will be U.S.-source ordinary income or loss. Corporate U.S. Holders will not be entitled to claim a dividends-received deduction with respect to our dividends. Subject to applicable limitations, and the discussion above regarding concerns expressed by the U.S. Treasury, dividends received from us by certain noncorporate U.S. Holders in their taxable years beginning before January 1, 2013 may be taxable at favorable rates, up to a maximum rate of 15%. Noncorporate U.S. Holders should consult their own tax advisors to determine whether they are subject to any special rules that limit their ability to be taxed at these favorable rates.
Subject to applicable restrictions and limitations that vary depending upon the U.S. Holder’s circumstances, Japanese taxes withheld from dividends on shares or ADSs (at a rate not exceeding the rate provided by the Treaty, in the case of a U.S. Holder who is eligible for the Treaty’s benefits) will be creditable against the holder’s U.S. federal income tax liability. Instead of claiming a credit, a U.S. Holder may elect to deduct such Japanese taxes in computing its taxable income, subject to generally applicable limitations. The limitation on
149
foreign taxes eligible for credit is calculated separately with respect to two categories of income, passive income and general income. The rules governing foreign tax credits are complex. U.S. Holders should consult their own tax advisors regarding the availability of foreign tax credits and deductions in their particular circumstances.
Sale and Other Disposition of the Shares or ADSs
A U.S. Holder will generally recognize capital gain or loss on the sale or other disposition of shares or ADSs, which will be long-term capital gain or loss if the holder has held the shares or ADSs for more than one year. The amount of the U.S. Holder’s gain or loss will equal the difference between the amount realized on the sale or other disposition and the holder’s tax basis in the shares or ADSs, each as determined in U.S. dollars. The deductibility of capital losses is subject to limitations. Any gain or loss will generally be U.S.-source gain or loss for foreign tax credit purposes.
Passive Foreign Investment Company Rules
Based upon certain proposed Treasury regulations that are not yet in effect, but are generally proposed to become effective for taxable years beginning after December 31, 1994, we believe that we were not a passive foreign investment company (a “PFIC”) for U.S. federal income tax purposes for our taxable year ended March 31, 2012. However, since PFIC status depends upon the composition of our income and assets and the market value of our assets from time to time, there can be no assurance that we will not be a PFIC for any taxable year. If we were a PFIC for any taxable year during which a U.S. Holder held shares, certain adverse U.S. federal income tax consequences could apply to the U.S. Holder.
Information Reporting and Backup Withholding
Payments of dividends and sales proceeds that are made within the United States or through certain U.S.-related financial intermediaries may be subject to information reporting and to backup withholding unless the U.S. Holder is an exempt recipient or, in the case of backup withholding, the U.S. Holder provides a correct taxpayer identification number and certifies that no loss of exemption from backup withholding has occurred. The amount of any backup withholding from a payment to a U.S. Holder will be allowed as a credit against the U.S. Holder’s U.S. federal income tax liability and may entitle the U.S. Holder to a refund, provided that the required information is timely furnished to the Internal Revenue Service.
10.F. DIVIDENDS AND PAYING AGENTS
Not applicable.
10.G. STATEMENT BY EXPERTS
Not applicable.
10.H. DOCUMENTS ON DISPLAY
We are subject to the reporting requirements of the Securities Exchange Act of 1934. In accordance with these requirements, we file annual reports on Form 20-F and furnish periodic reports on Form 6-K with the SEC.
These materials, including this annual report and the exhibits thereto, may be inspected and copied at the Commission’s Public Reference Room at Room 1580, 100 F Street, N.E., Washington, D.C. 20549. The public may obtain information on the operation of the Commission’s Public Reference Room by calling the Commission in the United States at 1-800-SEC-0330. The Commission also maintains a website at http://www.sec.gov that contains reports and proxy information regarding issuers that file electronically with the Commission. Some of the information may also be found on our website at http://www.smfg.co.jp.
150
10.I. SUBSIDIARY INFORMATION
Not applicable.
| Item 11. | Quantitative and Qualitative Disclosures about Credit, Market and Other Risk |
Quantitative and Qualitative Information about Risk Management
Basic Approach
As risks in the financial services industry increase in diversity and complexity, risk management (identifying, measuring, and controlling risk) has never been more important in the management of a financial institution. We have established a basic approach to be employed in risk management and include these in the manual entitled Regulations on Risk Management. The basic approach is to do the following:
| | • | | set forth Group-wide basic policies for risk management after specifying the categories of risk to which these policies apply; |
| | • | | provide all necessary guidance to the Group companies to enable them to follow the Group-wide basic policies for risk management set forth by us and set up their own appropriate risk management systems; and |
| | • | | monitor the risk management procedures implemented by all Group companies to ensure that their practices meet the relevant standards. |
Types of Risk to Be Managed
We classify risk into the following categories:
Credit Risk. Credit risk is the possibility of a loss arising from a credit event, such as deterioration in the financial condition of a borrower, that causes an asset (including off-balance sheet transactions) to lose value or become worthless.
Market Risk. Market risk is the possibility that fluctuations in interest rates, foreign exchange rates or stock prices will change the market value of financial products, leading to a loss.
Liquidity Risk. Liquidity risk is the risk that there may be difficulties in raising funds needed for settlements, as a result of the mismatching of uses of funds and sources of funds or unexpected outflows of funds, which may make it necessary to raise funds at higher rates than normal.
Operational Risk (including Processing Risk and System Risk). Operational risk is the possibility of losses arising from inadequate or failed internal processes, people, and systems or from external events.
Processing Risk. Processing risk is the possibility of losses arising from negligent processing by employees, accidents or unauthorized activities.
System Risk.System risk is the possibility of losses arising from failure, malfunction, or unauthorized use of computer systems.
Risk Management System
The Group-wide basic policies for risk management are determined by the Management Committee, which consists of designated board members, and they are authorized by the board of directors. The policies include:
| | • | | managing risk on a Group-wide basis; |
| | • | | managing risk using quantification methods; |
151
| | • | | ensuring consistency with business strategies; |
| | • | | setting up a system of checks and balances; |
| | • | | establishing contingency plans for emergencies and serious situations; and |
| | • | | verifying preparedness to handle reasonably conceivable risk situations. |
The policies also include fundamental principles for each risk category, which each Group company has to follow when establishing its own risk management system. The Corporate Risk Management Department, in cooperation with the Corporate Planning Department, performs risk management according to the above policies. In addition, the Internal Audit Department is responsible for the independent review of risk management within the Group.
Risk management systems are in place at individual Group companies and they have been established in accordance with the Group-wide basic policies for risk management and implementation guidance provided by us. Based on these policies and guidance, each Group company implements guidelines and establishes processes for risk management. On an ongoing basis, these processes and risks are monitored by us.
For example, at the Bank, specific departments have been appointed to oversee the handling of the four risk categories listed above, in addition to the risks associated with settlement. Each risk category is managed taking into account the particular characteristics of that category. In addition, the Risk Management Unit has been established—independent of the business units—and the risk management system has been strengthened by consolidating the functions for managing risks—credit, market, liquidity and operational—into the Risk Management Unit and enhancing our across-the-board risk monitoring ability. One board member is assigned to oversee the Risk Management Unit comprising the Corporate Risk Management Department and the Credit & Investment Planning Department. The Corporate Risk Management Department—the unit’s planning department—seeks to manage all categories of risk in cooperation with the Corporate Planning Department. Moreover the Internal Audit Unit—independent of all business units—conducts periodic audits to ensure that the management system is functioning properly.
The decision-making process for addressing the risks at the operating level is also strengthened by the Credit Risk Management Committee and the Market Risk Management Committee, which are subcommittees of the Management Committee of the Bank.
Integrated Risk Management
(1) Risk Capital-Based Management
In order to maintain a balance between risk and return, we employ a risk capital-based management method. We measure “risk capital” based on value at risk (“VaR”), and other specific measures such as uniform basic measures of credit, market and operational risks, taking into account the special characteristics of each type of risk and the business activities of each Group company.
We then allocate risk capital to each unit to keep the total exposure to various risks within the scope of our resources, i.e., capital. The allocation to each unit is determined by the Management Committee and authorized by the Board of Directors. In this framework, risk capital includes credit concentration risk and interest rate risk in the banking book, which are taken into account under the second pillar of Basel II. In addition, we conduct risk capital-based management activities on a consolidated basis, including each Group company.
Liquidity risk is managed within the context of cash-flow plans and funding gap. Other risk categories are managed with procedures closely attuned to the nature of the risk, as described in the following paragraphs.
Disclosures of the objectives, policies and processes to manage each risk and the methods used to measure each risk have been included in “Credit Risk,” “Market Risk and Liquidity Risk,” and “Operational Risk, Processing Risk and System Risk.”
152
(2) Stress Tests
In the current volatile business environment, stress tests are essential to analyze and estimate the effects of stress events brought about by the economic recession and market turbulence. When we establish the management plan, we implement stress tests based on multiple assumptions to analyze and estimate such effects on our financial condition.
Implementation of Basel II
Basel II is an international agreement on minimum capital requirement for internationally active banks, and it has been applied since March 31, 2007 in Japan.
The Basel II framework establishes multiple approaches of calculating the capital requirements; we have adopted the advanced IRB approach for credit risk since March 31, 2009, and AMA for operational risk since March 31, 2008 and we calculate our capital requirement properly.
On July 13, 2009, the Basel Committee approved a final package of measures to enhance certain elements of the Basel II framework, which has been implemented in Japan from the end of 2011.
Details of relevant initiatives are provided below, and detailed information on our capital ratio is provided in the discussion on Capital Ratio Information appearing in “Item 4.B. Business Overview—Regulation—Capital Adequacy” and “Item 5.B. Liquidity and Capital Resources—Capital Management.”
Credit Risk
Credit risk is the possibility of a loss arising from a credit event, such as the deterioration in the financial condition of a borrower that causes an asset (including off-balance sheet transactions) to decline in value or become worthless. Overseas credits also include an element of country risk, which is closely related to credit risk. This is the risk of loss caused by changes in political or economic conditions. Credit exposures arise principally in lending activities such as loans and advances, acquiring investment securities, derivative transactions, and off-balance sheet transactions such as loan commitments.
Credit Risk Management System
Credit risk is the most significant risk to which we are exposed. The purpose of credit risk management is to keep the credit risk exposure to a permissible level relative to capital, to maintain the quality of assets, and to ensure returns commensurate with risk.
On the basis of Group-wide basic policies for risk management, our Group companies follow the fundamental principles established by us to assess and manage credit risk. Each of our Group companies manages credit risk according to the nature of its business, and assesses and manages credit risks of individual loans and credit portfolios quantitatively, using consistent standards.
At the Bank, our significant banking subsidiary, the Credit & Investment Planning Department within the Risk Management Unit is responsible for the comprehensive management of credit risk. This department drafts and administers credit policies, the internal rating system, credit authority guidelines, and credit application guidelines, and manages NPLs, including impaired loans, and other aspects of credit portfolio management. The department also cooperates with the Corporate Risk Management Department in quantifying credit risk (risk capital and risk-weighted assets) and controls the Bank’s entire credit risk. Further, the Credit Portfolio Management Department within the Credit & Investment Planning Department strives to stabilize the credit portfolio and manage the risk through credit derivatives, loan asset sales and other instruments.
The Corporate Research Department within the Corporate Services Unit performs research on industries and investigates the business situations of borrower enterprises to detect early signs of problems or growth potential.
153
The Credit Administration Department is responsible for handling NPLs of borrowers classified as potentially bankrupt or lower, and draws up plans for their workouts, including write-offs, and corporate rehabilitation. The department closely liaises with SMBC Servicer Co., Ltd., our Group company, which engages in related services to efficiently reduce the amount of NPLs by such means as the sale of loans.
The credit departments within each business unit conduct credit risk management for loans handled by their units and manage their units’ portfolios. The credit limits they use are based on the baseline amounts that the Credit & Investment Planning Department establishes for each grading category, with particular attention paid to evaluating and managing customers or loans perceived to have particularly high credit risk.
The Internal Audit Unit, operating independently of the business units, audits asset quality, accuracy of grading and state of credit risk management, and reports the results directly to the board of directors and the Management Committee.
The Bank has established the Credit Risk Committee to undertake control of credit risk and to ensure loan operations.
Credit Risk Management Methods
To effectively manage the risk involved in individual loans as well as its credit portfolio as a whole, the Bank first acknowledges that every loan entails credit risk, assesses the credit risk posed by each borrower and loan using an internal rating system, and quantifies that risk for control purposes.
Credit Risk Evaluation
The Credit & Investment Planning Department manages an internal rating system for each asset control category set according to portfolio characteristics. For example, credits to commercial and industrial (“C&I”) companies, individuals for business purposes (domestic only), sovereigns, public sector entities, and financial institutions are assigned an “obligor grade,” which indicates the borrower’s creditworthiness, and/or “facility grade,” which indicates the collectibility of assets taking into account the transaction conditions such as guarantee/collateral, and tenor. The business units determine an obligor grade by first assigning a financial grade using a financial strength grading model and data obtained from the obligor’s financial statements, including net worth and cash flows. The financial grade is then adjusted taking into account the actual state of the obligor’s financial position and qualitative factors to derive the obligor grade. The qualitative factors mainly include the expected future cash flows taking into account factors such as historical loss information, the appropriateness of the borrower’s business plan or operational improvement plan, the status of progress of its plan, and the overall support from financial institutions. In the event that the borrower is domiciled overseas, internal ratings for credit are made after taking into consideration the country rank, which represents an assessment of the credit quality of each country based on its political and economic situation, as well as its current account balance and external debt. Obligor grades and facility grades are reviewed once a year and as otherwise necessary, such as when there are changes in the credit situation. Our subsidiaries carry out credit risk evaluations in line with the Bank.
There are also grading systems for loans to individuals such as housing loans, loans to small businesses, and structured finance including project finance, where the repayment source is limited to the cash flows generated by a particular business or asset. For example, the obligor grade of housing loans is determined taking into account various relevant factors such as proportion of the repayment to revenue, proportion of down payment to the value and past due information.
The Credit & Investment Planning Department centrally manages the internal rating systems, and designs, operates, supervises and validates the grading models. It validates the grading models (including statistical validation) of main assets following the procedure manual once a year to ensure their effectiveness and suitability.
154
Quantification of Credit Risk
Credit risk quantification refers to the process of estimating the degree of credit risk of a portfolio or individual loan taking into account not just the obligor’s probability of default (“PD”), but also the concentration of risk in a specific customer or industry and the loss impact of fluctuations in the value of collateral, such as real estate and securities.
Specifically, the PD by grade, loss given default (“LGD”) credit quality correlation among obligors, and other parameter values are estimated using the historical data of obligors and facilities stored in a database to calculate the credit risk. Then, based on these parameters, the Bank runs a simulation of simultaneous default using the Monte Carlo Simulation to calculate the Bank’s maximum loss exposure to the estimated amount of the maximum losses that may be incurred. Based on these quantitative results, the Bank allocates risk capital.
Risk quantification is also executed for purposes such as to determine the portfolio’s risk concentration, or to simulate economic movements (stress tests), and the results are used for making optimal decisions across the whole range of business operations, including formulating business plans and providing a standard against which individual credit applications are assessed.
Credit Assessment
At the Bank, the credit assessment of corporate loans involves a variety of financial analyses, including cash flows, to predict an enterprise’s capability of loan repayment and its growth prospects. These quantitative measures, when combined with qualitative analyses of industrial trends, the enterprise’s research and development capabilities, the competitiveness of its products or services, and its management caliber, result in a comprehensive credit assessment. The loan application is analyzed in terms of the intended utilization of the funds and the repayment schedule. In the assessment of housing loans for individuals, the Bank employs a credit assessment model based on credit data amassed and analyzed by the Bank over many years, taking into account various relevant factors including proportion of the repayment to revenue, proportion of down payment to the value and past due information.
Credit Monitoring
At the Bank, in addition to analyzing loans at the application stage, the Credit Monitoring System is utilized to reassess obligor grades, and review credit policies for each obligor so that problems can be detected at an early stage, and quick and effective action can be taken. The system includes periodic monitoring carried out each time the financial results of the obligor enterprise are obtained, as well as continuous monitoring performed each time credit conditions change.
Credit Portfolio Management
Risk-Taking Within the Scope of Capital
To keep the credit risk exposure to a permissible level relative to capital, the Bank’s Corporate Risk Management Department sets credit risk limits for internal control purposes. Under these limits, separate guidelines are issued for each business unit, such as for real estate finance, fund investment, and investment in securitization products. The Corporate Risk Management Department conducts monthly monitoring to make sure that these guidelines are being followed.
Controlling Concentration Risk
As the concentration of credit risk in an industry or a corporate group has the potential to substantially impair capital, the Bank’s Credit & Investment Planning Department sets guidelines for maximum loan amounts to prevent the excessive concentration of loans in an industry and to control large exposures to an individual company or a corporate group. Further, to manage country risk, the Credit Management Department of the International Banking Unit has credit limit guidelines based on each country’s creditworthiness.
155
Toward Active Portfolio Management
The Bank’s Credit Portfolio Management Department makes use of credit derivatives, loan asset sales, and other instruments to proactively and flexibly manage its portfolio to stabilize credit risk.
Market Risk and Liquidity Risk
Market risk is the possibility that fluctuations in interest rates, foreign exchange rates, stock prices or other market prices will change the market value of financial products, leading to a loss. The purpose of market risk management is to keep the market risk exposure to a permissible level relative to capital.
Liquidity risk is the risk that there may be difficulties in raising funds needed for settlements, as a result of the mismatching of uses of funds and sources of funds or unexpected outflows of funds, which may make it necessary to raise funds at higher rates than normal. The purpose of liquidity risk management is to ensure that we are in a position to address its liquidity obligations through monitoring the liquidity gap between assets and liabilities, and maintaining highly liquid supplementary funding resources.
On the basis of the Group-wide basic policies for risk management, we have a quantitative management process to control market and liquidity risks on a Group-wide basis by setting allowable risk limits by company. We annually review and identify which companies primarily carry the market and liquidity risks within the Group. We set permissible levels and upper limits of risk for each identified company in consideration of those companies’ business plans. We ensure that each identified company establishes a risk management system that is appropriate to the risks it faces, and has built in transparent risk management processes, clearly separating front-office, middle-office and back-office operations, and establishing a control system of mutual checks and balances.
Framework for Market and Liquidity Risk Management
The board of directors authorizes important matters relating to the management of market and liquidity risks, such as the basic policies and risk limits, which are decided by the Management Committee.
Additionally, at the Bank, the Corporate Risk Management Department manages market and liquidity risks in an integrated manner. The Corporate Risk Management Department is the planning department of the Risk Management Unit, which is independent of the business units that directly handle market transactions, and not only monitors the current risk situations but also reports regularly to the Management Committee and the board of directors. Furthermore, the Bank’s Asset Liability Management (“ALM”) Committee meets on a monthly basis to examine reports on the state of observance of the Bank’s limits on market and liquidity risks and to review and discuss the Bank’s ALM operations.
To prevent unforeseen processing errors as well as fraudulent transactions, it is important to establish a system of checks on the business units (front office). At the Bank, both the processing departments (back office) and the administrative departments (middle office) conduct the checks. In addition, the Internal Audit Unit of the Bank periodically performs internal audits to verify that the risk management framework is functioning properly.
Market Risk Management Methods
Market Risk Management Process
We manage market risk from trading activities and non-trading activities, including strategic equity investment and other transactions within the risk capital limit, which is determined taking into account our shareholders’ equity and other principal indicators of our financial position. We also establish an upper limit on VaR and losses within the risk capital limits.
156
Our market risk can be divided into various factors: foreign exchange rates, interest rates, equity prices and option risks. We manage each of these risks employing the VaR method as well as supplemental indicators suitable for managing each risk, such as the basis point value (“BPV”).
VaR is the largest predicted loss that is possible given a fixed confidence interval. For example our VaR indicates the largest loss that is possible for a holding period of one day and a confidence interval of 99.0%. BPV is the amount of change in assessed value as a result of a one-basis-point (0.01%) movement in interest rates.
Market Risk Measurement Techniques—Value at Risk
The principal Group companies’ internal VaR model makes use of historical data to prepare scenarios for market fluctuations and, by conducting simulations of gains and losses, the model estimates the maximum losses that may occur. The VaR calculation method we employ for both trading and non-trading activities is based mainly on the following (after April 2011, VaR for strategic equity investment in non-trading activities is measured based on a one-year holding period and an observation period of ten years in order to appropriately calculate long-term profit and loss scenarios):
| | • | | the historical simulation method; |
| | • | | a one-sided confidence interval of 99.0%; |
| | • | | a one-day holding period (a one-year holding period for strategic equity investment portfolio); and |
| | • | | an observation period of four years (ten years for strategic equity investment portfolio). |
The relationship between the VaR calculated with the model and the actual profit and loss data is back-tested periodically. The back-testing results for the Group’s trading accounts during the fiscal year ended March 31, 2012 are shown below. A data point below the diagonal line indicates a loss in excess of the predicted VaR for that day; however, there were no significant excess losses as with the previous year. This demonstrates that the Group’s VaR model, with a one-sided confidence interval of 99.0%, is sufficiently reliable.
Back-Testing Results (Trading Book—SMFG consolidated)
Marginal Profit or Loss (in ¥100 million)
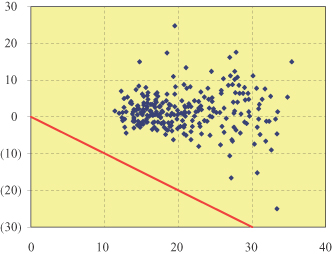
VaR (in ¥100 million)
157
Trading Activities
Most of our trading activity is undertaken to accommodate the needs of commercial banking customers for interest rate and foreign exchange transactions. However, some interest rate and foreign exchange rate positions are taken using derivatives and other on-balance sheet instruments with the objective of earning a profit from favorable movements in market rates. The overall objective of managing market risk is to avoid unexpected losses due to changes in market prices.
Non-trading Activities
The market risk for non-trading activity arises principally from the interest rate risk of our ALM operations, or banking, including loans, debt investment securities, deposits, and long- and short-term borrowings, and from the equity risk of our strategic investments. ALM operations are regularly reviewed and discussed by the ALM Committee so as not to be heavily exposed to market fluctuations. Strategic equity investment is a portfolio that consists principally of publicly traded Japanese equities. This portfolio, like that of other financial institutions in Japan, has historically included shares of our customers.
VaR summary for the Fiscal Years Ended March 31, 2012 and 2011
The following tables show our VaR by risk category and these figures are prepared based on the internal reporting provided to management.
Our material market risk exposure categories consist of interest rate risk, foreign exchange risk, equities and commodities risk and others. The section headed “VaR for Trading Activity” shows our VaR for instruments entered into for trading purposes and the VaR model for the trading book includes principal consolidated subsidiaries. The section headed “VaR for Non-Trading Activity” shows our VaR for instruments entered into for purposes other than trading purposes. “Strategic Equity Investment” in the “VaR for Non-Trading Activity” section is a portfolio that consists principally of publicly traded Japanese equities. This portfolio, like that of other financial institutions in Japan, has historically included shares of our customers.
158
VaR for Trading Activity
The aggregate VaR for our total trading activities at March 31, 2012 was ¥10.0 billion. VaR increased at March 31, 2012 compared with March 31, 2011 in the category of equities risk, primarily reflecting an increased position in equities.
| | | | | | | | | | | | | | | | | | | | |
| | | Interest rate
risk | | | Foreign
exchange risk | | | Equities and
commodities
risk | | | Others | | | Total(1) | |
| | | (In billions) | |
| For the fiscal year ended March 31, 2012: | | | | | | | | | | | | | | | | | | | | |
SMBC Consolidated | | | | | | | | | | | | | | | | | | | | |
Maximum | | ¥ | 7.6 | | | ¥ | 2.6 | | | ¥ | 4.4 | | | ¥ | 0.3 | | | ¥ | 11.8 | |
Minimum | | | 3.4 | | | | 0.4 | | | | 0.6 | | | | 0.2 | | | | 5.4 | |
Daily average | | | 5.3 | | | | 1.2 | | | | 2.2 | | | | 0.2 | | | | 8.2 | |
At March 31, 2012 | | | 4.9 | | | | 0.6 | | | | 4.0 | | | | 0.2 | | | | 9.3 | |
| | | | | |
SMFG Consolidated | | | | | | | | | | | | | | | | | | | | |
Maximum | | | 8.1 | | | | 2.6 | | | | 4.8 | | | | 0.3 | | | | 12.6 | |
Minimum | | | 3.8 | | | | 0.5 | | | | 0.8 | | | | 0.2 | | | | 5.9 | |
Daily average | | | 5.8 | | | | 1.2 | | | | 2.5 | | | | 0.2 | | | | 8.9 | |
At March 31, 2012 | | | 5.4 | | | | 0.6 | | | | 4.1 | | | | 0.2 | | | | 10.0 | |
| (1) | Total for “Maximum,” “Minimum,” and “Daily average” represent the maximum, minimum and daily average of the total of the trading book. For certain subsidiaries, we employ the standardized method and/or the historical simulation method for the VaR calculation method. |
| | | | | | | | | | | | | | | | | | | | |
| | | Interest rate
risk | | | Foreign
exchange risk | | | Equities and
commodities
risk | | | Others | | | Total(1) | |
| | | (In billions) | |
| For the fiscal year ended March 31, 2011: | | | | | | | | | | | | | | | | | | | | |
SMBC Consolidated | | | | | | | | | | | | | | | | | | | | |
Maximum | | ¥ | 6.8 | | | ¥ | 1.8 | | | ¥ | 2.2 | | | ¥ | 0.5 | | | ¥ | 8.7 | |
Minimum | | | 3.7 | | | | 0.4 | | | | 0.5 | | | | 0.2 | | | | 5.4 | |
Daily average | | | 5.2 | | | | 0.8 | | | | 1.4 | | | | 0.2 | | | | 7.2 | |
At March 31, 2011 | | | 4.5 | | | | 0.7 | | | | 1.4 | | | | 0.2 | | | | 6.5 | |
| | | | | |
SMFG Consolidated | | | | | | | | | | | | | | | | | | | | |
Maximum | | | 7.1 | | | | 2.4 | | | | 2.5 | | | | 0.5 | | | | 9.3 | |
Minimum | | | 3.9 | | | | 0.5 | | | | 0.7 | | | | 0.2 | | | | 5.8 | |
Daily average | | | 5.6 | | | | 1.0 | | | | 1.6 | | | | 0.2 | | | | 7.9 | |
At March 31, 2011 | | | 4.7 | | | | 0.8 | | | | 1.5 | | | | 0.2 | | | | 6.8 | |
| (1) | Total for “Maximum,” “Minimum,” and “Daily average” represent the maximum, minimum and daily average of the total of the trading book. For certain subsidiaries, we employ the standardized method and/or the historical simulation method for the VaR calculation method. |
159
VaR for Non-trading Activity
• Banking
The aggregate VaR for our total banking activities at March 31, 2012 was ¥32.1 billion. Most of this was composed of interest rate risk exposure based on the operations for the purpose of asset and liability management of the Bank. VaR decreased at March 31, 2012 compared with March 31, 2011 in the category of interest rate risk, primarily reflecting smaller market fluctuations caused by the recent lower level of interest rates.
| | | | | | | | | | | | | | | | | | | | |
| | | Interest rate
risk | | | Foreign
exchange risk | | | Equities and
commodities
risk | | | Others | | | Total(1) | |
| | | (In billions) | |
| For the fiscal year ended March 31, 2012: | | | | | | | | | | | | | | | | | | | | |
SMBC Consolidated | | | | | | | | | | | | | | | | | | | | |
Maximum | | ¥ | 49.3 | | | ¥ | 0.0 | | | ¥ | 14.0 | | | ¥ | 0.0 | | | ¥ | 52.2 | |
Minimum | | | 27.9 | | | | 0.0 | | | | 7.8 | | | | 0.0 | | | | 31.0 | |
Daily average | | | 34.7 | | | | 0.0 | | | | 10.1 | | | | 0.0 | | | | 38.0 | |
At March 31, 2012 | | | 28.7 | | | | 0.0 | | | | 10.2 | | | | 0.0 | | | | 31.3 | |
| | | | | |
SMFG Consolidated | | | | | | | | | | | | | | | | | | | | |
Maximum | | | 50.6 | | | | 0.0 | | | | 14.0 | | | | 0.0 | | | | 53.6 | |
Minimum | | | 28.6 | | | | 0.0 | | | | 7.8 | | | | 0.0 | | | | 31.8 | |
Daily average | | | 35.7 | | | | 0.0 | | | | 10.1 | | | | 0.0 | | | | 38.9 | |
At March 31, 2012 | | | 29.4 | | | | 0.0 | | | | 10.2 | | | | 0.0 | | | | 32.1 | |
| (1) | Total for “Maximum,” “Minimum,” and “Daily average” represent the maximum, minimum and daily average of the total of the banking book. |
| | | | | | | | | | | | | | | | | | | | |
| | | Interest rate
risk | | | Foreign
exchange risk | | | Equities and
commodities
risk | | | Others | | | Total(1) | |
| | | (In billions) | |
| For the fiscal year ended March 31, 2011: | | | | | | | | | | | | | | | | | | | | |
SMBC Consolidated | | | | | | | | | | | | | | | | | | | | |
Maximum | | ¥ | 46.3 | | | ¥ | 0.1 | | | ¥ | 12.1 | | | ¥ | 0.0 | | | ¥ | 49.6 | |
Minimum | | | 25.0 | | | | 0.0 | | | | 6.1 | | | | 0.0 | | | | 28.8 | |
Daily average | | | 35.9 | | | | 0.0 | | | | 8.2 | | | | 0.0 | | | | 39.4 | |
At March 31, 2011 | | | 44.2 | | | | 0.0 | | | | 8.6 | | | | 0.0 | | | | 47.4 | |
| | | | | |
SMFG Consolidated | | | | | | | | | | | | | | | | | | | | |
Maximum | | | 47.6 | | | | 0.1 | | | | 12.1 | | | | 0.0 | | | | 50.9 | |
Minimum | | | 25.9 | | | | 0.0 | | | | 6.1 | | | | 0.0 | | | | 29.7 | |
Daily average | | | 37.0 | | | | 0.0 | | | | 8.2 | | | | 0.0 | | | | 40.5 | |
At March 31, 2011 | | | 45.5 | | | | 0.0 | | | | 8.6 | | | | 0.0 | | | | 48.6 | |
| (1) | Total for “Maximum,” “Minimum,” and “Daily average” represent the maximum, minimum and daily average of the total of the banking book. |
160
• Strategic Equity Investment
The aggregate VaR for our strategic equity investment at March 31, 2012 was ¥897.9 billion, a decrease from ¥930.3 billion at March 31, 2011, due primarily to a decline in the fair value of the strategic equity investment portfolio.
| | | | |
| | | Equities risk | |
| | | (In billions) | |
| For the fiscal year ended March 31, 2012: | | | | |
SMBC Consolidated | | | | |
Maximum | | ¥ | 918.2 | |
Minimum | | | 696.0 | |
Daily average | | | 814.2 | |
At March 31, 2012 | | | 873.0 | |
| |
SMFG Consolidated | | | | |
Maximum | | | 939.2 | |
Minimum | | | 712.5 | |
Daily average | | | 834.4 | |
At March 31, 2012 | | | 897.9 | |
| Note: | After April 2011, VaR for strategic equity investment is measured based on a one-year holding period and an observation period of ten years in order to appropriately calculate long-term profit and loss scenarios. For comparison purpose, the aggregate VaR at March 31, 2011 is recalculated based on the VaR calculation method adopted at March 31, 2012. The recalculated aggregate VaR for the strategic equity investment at March 31, 2011 was ¥910.0 billion and ¥930.3 billion for SMBC Consolidated and SMFG Consolidated, respectively. |
| | | | |
| | | Equities risk | |
| | | (In billions) | |
| For the fiscal year ended March 31, 2011: | | | | |
SMBC Consolidated | | | | |
Maximum | | ¥ | 127.4 | |
Minimum | | | 98.4 | |
Daily average | | | 111.4 | |
At March 31, 2011 | | | 111.8 | |
| |
SMFG Consolidated | | | | |
Maximum | | | 129.7 | |
Minimum | | | 100.3 | |
Daily average | | | 113.8 | |
At March 31, 2011 | | | 114.1 | |
| Note: | For the fiscal year ended March 31, 2011, VaR for strategic equity investment is measured based on a one-day holding period and an observation period of four years. |
161
Stress Tests
The market occasionally undergoes extreme fluctuations that exceed projections. Therefore, to manage market risk, it is important to run simulations of situations that may occur only once in many years, or so-called stress tests. To prepare for unexpected market swings, the Bank performs stress tests on a monthly basis based on various scenarios including historical simulations which reflect past market fluctuations.
The limitations of the VaR methodology include the following:
| | • | | The use of historical data as a proxy for estimating future events may underestimate the probability of extreme market movements. Past market movement is not necessarily a good indicator of future events; |
| | • | | The use of a holding period assumes that all positions can be liquidated or hedged in that period of time. This assumption does not fully capture the market risk arising during periods of illiquidity, when liquidation or hedging in that period of time may not be possible; |
| | • | | The use of a confidence level neither takes account of, nor makes any statement about, any losses that might occur beyond this level of confidence; and |
| | • | | VaR does not capture all of the complex effects of the risk factors on the value of positions and portfolios and could underestimate potential losses. |
Additional Information for Certain Risks
Interest Rate Risk
To supplement the above limitations of VaR methodologies, the Group adopts various indices to measure and monitor the sensitivity of interest rates, including delta, gamma and vega risks. The Group considers BPV as one of the most significant indices to manage interest rate risk. BPV is the amount of change in the value to the banking and trading book as a result of a one-basis-point (0.01%) movement in interest rates. The principal Group companies use BPV to monitor interest rate risk, not only on a net basis, but also by term to prevent the concentration of interest rate risk in a specific period. The table “Basel II (Pillar 2)—Outlier Ratio” presented below is one of the sensitivity analyses for interest rate risk concerning the banking book using the BPV approach. In addition, as previously addressed, the Group enhances the risk management method of VaR and BPV by using them in combination with back-testing and stress tests.
Interest rate risk substantially changes depending on the method used for recognizing the expected maturity dates of demand deposits that can be withdrawn at any time or the method used for estimating the timing of cancellation prior to maturity of time deposits and consumer housing loans. At the Bank, the maturity of demand deposits that are expected to be left with the bank for a prolonged period is regarded to be at the longest five years (2.5 years on average) and the cancellation prior to maturity of time deposits and consumer housing loans is estimated based on historical data.
Basel II (Pillar 2)—Outlier Ratio
A decline in economic value of the Bank on a consolidated basis as a result of a certain interest rate shock is measured as shown in the table based on the Outlier Framework of Basel II. At March 31, 2012, the outlier ratio was less than 2.6% at the Bank (Consolidated), substantially below the 20% criterion. In the event the economic value of a bank declines by more than 20% of the sum of Tier I and Tier II capital, or the outlier ratio, as a result of interest rate shocks, that bank would fall into the category of “outlier bank,” as stipulated under the Second Pillar of Basel II.
162
Decline in Economic Value Based on Outlier Framework
| | | | | | | | |
| | | At March 31, | |
| | | 2012 | | | 2011 | |
| | | (In billions, except percentages) | |
SMBC Consolidated | | | | | | | | |
Total | | ¥ | 240.2 | | | ¥ | 696.5 | |
Impact of yen interest rates | | | 144.3 | | | | 530.5 | |
Impact of U.S. dollar interest rates | | | 87.3 | | | | 141.9 | |
Impact of euro interest rates | | | 1.3 | | | | 16.0 | |
Percentage of Tier I + Tier II | | | 2.6 | % | | | 7.8 | % |
| Note: | Decline in economic value is the decline of the present value of a banking portfolio after interest rate shocks (1st and 99th percentile of observed interest rate changes using a one-year holding period and five years of observables). |
Foreign Exchange Risk
The principal Group companies set risk limits for each currency to manage the concentration of the foreign currency position. The foreign exchange risk is immaterial as shown above in “VaR by risk category.”
Strategic Equity Investment Risk
We establish limits on allowable risk for strategic equity investments, and monitor the observance of those limits to keep stock price fluctuation risk within acceptable parameters. We have been reducing its strategic equity investments, and the balance is within a permitted level which is less than 100% of our consolidated Tier I Capital. See “Item 4.B. Business Overview—Regulation—Japan—Restriction on Aggregate Shareholdings by a Bank.”
Liquidity Risk Management Methods
To manage liquidity risk, we identify Group companies which have significant liquidity risk. Each identified Group company establishes a fundamental risk management framework, which includes, but is not limited to, establishing risk limits, such as funding gap limits, and contingency plans for liquidity management.
At the Bank, liquidity risk is regarded as one of the major risks. The Bank’s liquidity risk management is based on a framework consisting of setting funding gap limits, maintaining highly liquid supplementary funding sources, and establishing contingency plans.
In order not to be overly dependent on short-term market-based funding to cover cash outflows, the Bank sets funding gap limits. The funding gap limits are set Bank-wide and for each location, taking into account the cash flow plans, external environment, funding status, characteristics of local currency and other factors. Additionally, a risk limit is set by currency as needed to achieve more rigorous management.
To minimize the impact of a crisis on its funding, the Bank manages highly liquid supplementary funding sources, whereby it maintains high quality liquid assets, such as government bonds and has emergency borrowing facilities.
For emergency situations, there are contingency plans in place for addressing the funding liquidity risk which include an action plan with measures for reducing the funding gap limits.
Operational Risk, Processing Risk and System Risk
Operational risk is the possibility of losses arising from inadequate or failed internal processes, people and systems or from external events. We have prepared operational risk management regulations to define the basic rules to be observed across our Group. Under these regulations, we are working to raise the level of sophistication of our management of operational risk across the group by providing an effective framework for the identification, assessment, control and monitoring of significant risk factors and by establishing a system for executing contingency and business continuity plans.
163
Processing risk is the possibility of losses arising from negligent processing by employees, accidents, or unauthorized activities. We recognize that all operations entail processing risk. We are, therefore, working to raise the level of sophistication of our management of processing risk across the whole Group by ensuring that each branch conducts its own regular investigations of processing risk; minimizing losses in the event of processing errors or negligence by drafting exhaustive contingency plans; and carrying out thorough quantification of the risk under management.
System risk is the possibility of a loss arising from the failure, malfunction or unauthorized use of computer systems. We recognize that reliable computer systems are essential for the effective implementation of management strategy. We strive to minimize system risk by adopting and implementing risk management regulations and specific management standards, including a security policy. We also have contingency plans with the goal of minimizing losses in the event of a system failure. To prevent computer system breakdowns, we have also implemented numerous measures, including the duplication of various systems and infrastructures, maintaining its computer system to facilitate steady, uninterrupted operation, and establishing a disaster-prevention system consisting of computer centers in eastern and western Japan.
Other Risk
Settlement risk is the possibility of losses arising from a transaction that cannot be settled as planned. Because this risk comprises elements of several types of risks, including credit, liquidity, processing, and system risk, it requires interdisciplinary management.
| Item 12. | Description of Securities other than Equity Securities |
12.A. DEBT SECURITIES
Not applicable.
12.B. WARRANTS AND RIGHTS
Not applicable.
12.C. OTHER SECURITIES
Not applicable.
12.D. AMERICAN DEPOSITARY SHARES
Under the terms of the deposit agreement, an ADSs holder may have to pay the following service fees to the depositary:
| | |
Service | | Fees |
Issuance of ADSs | | Up to U.S. 5¢ per ADS issued |
| |
Cancellation of ADSs | | Up to U.S. 5¢ per ADS canceled |
| |
Distribution of cash dividends or other cash distributions | | Up to U.S. 5¢ per ADS held |
| |
| Distribution of ADSs pursuant to stock dividends, free stock distributions or exercises of rights | | Up to U.S. 5¢ per ADS held |
| |
| Distribution of securities other than ADSs or rights to purchase additional ADSs | | Up to U.S. 5¢ per ADS held |
| |
Depositary services | | Up to U.S. 5¢ per ADS held on the applicable record date(s) established by the depositary |
164
An ADS holder will also be responsible for paying certain fees and expenses incurred by the depositary and certain taxes and governmental charges such as:
| | • | | taxes (including applicable interest and penalties) and other governmental charges; |
| | • | | the registration fees applicable to transfers of shares or other deposited securities to or from the name of the custodian, the depositary or any nominees upon the making of deposits or withdrawals, respectively; |
| | • | | the cable, telex and facsimile transmission and delivery expenses expressly provided in the deposit agreement to be at the expense of the person depositing or withdrawing shares or holders and beneficial owners of ADSs; |
| | • | | the expenses and charges incurred by the depositary in the conversion of foreign currency; |
| | • | | the fees and expenses incurred by the depositary in connection with compliance with exchange control regulations and other regulatory requirements applicable to shares, deposited securities, ADSs and ADRs; and |
| | • | | the fees and expenses incurred by the depositary, the custodian or any nominee in connection with the servicing or delivery of deposited securities. |
Depositary fees payable upon the issuance and cancellation of ADSs are typically paid to the depositary by the brokers (on behalf of their clients) receiving the newly issued ADSs from the depositary and by the brokers (on behalf of their clients) delivering the ADSs to the depositary for cancellation. The brokers in turn charge these transaction fees to their clients.
Citibank, N.A., as depositary, has agreed to reimburse us annually for expenses related to the administration and maintenance of the depositary receipt facility, subject to certain criteria. For the fiscal year ended March 31, 2012, the depositary reimbursed us $100,000 as a portion of our ADS advertising expenses.
165
PART II
| Item 13. | Defaults, Dividend Arrearages and Delinquencies |
None.
| Item 14. | Material Modifications to the Rights of Security Holders and Use of Proceeds |
None.
| Item 15. | Controls and Procedures |
Disclosure Controls and Procedures
We carried out an evaluation under the supervision and with the participation of our management, including Koichi Miyata, our President and Representative Director, and Tetsuya Kubo, our Representative Director, of the effectiveness of the design and operation of our disclosure controls and procedures (as defined in Rule 13a-15(e) under the Securities Exchange Act of 1934) at March 31, 2012. There are inherent limitations to the effectiveness of any system of disclosure controls and procedures, including the possibility of human error and the circumvention or overriding of the controls and procedures. Accordingly, even effective disclosure controls and procedures can only provide reasonable, not absolute, assurance of achieving their control objectives. Also, projections of any evaluation of effectiveness to future periods are subject to the risk that controls may become inadequate because of changes in conditions, or that the degree of compliance with the policies or procedures may deteriorate. Based upon the evaluation referred to above, Mr. Miyata and Mr. Kubo concluded that the design and operation of our disclosure controls and procedures at March 31, 2012 were effective to provide reasonable assurance that information required to be disclosed in the reports that we file or submit under the Securities Exchange Act of 1934 is recorded, processed, summarized and reported within the time periods specified in the SEC’s rules and forms.
Management’s Annual Report on Internal Control Over Financial Reporting
Our management is responsible for establishing and maintaining adequate internal control over financial reporting, as defined in Rule 13a-15(f) under the Securities Exchange Act of 1934. Our internal control over financial reporting is a process designed to provide reasonable assurance regarding the reliability of financial reporting and the preparation of financial statements for external purposes in accordance with IFRS. Our internal control over financial reporting includes those policies and procedures that:
| | (i) | pertain to the maintenance of records that, in reasonable detail, accurately and fairly reflect the transactions and dispositions of our assets; |
| | (ii) | provide reasonable assurance that transactions are recorded as necessary to permit preparation of financial statements in accordance with IFRS, and that our receipts and expenditures are being made only in accordance with authorizations of our management and directors; and |
| | (iii) | provide reasonable assurance regarding prevention or timely detection of unauthorized acquisition, use or disposition of our assets that could have a material effect on the financial statements. |
Because of its inherent limitations, internal control over financial reporting may not prevent or detect misstatements. Also, projections of any evaluation of effectiveness to future periods are subject to the risk that controls may become inadequate because of changes in conditions, or that the degree of compliance with the policies or procedures may deteriorate.
Our management evaluated the effectiveness of our internal control over financial reporting at March 31, 2012 based on the criteria established in “Internal Control—Integrated Framework” issued by the Committee of Sponsoring Organizations of the Treadway Commission. Based on the evaluation, management has concluded that we maintained effective internal control over financial reporting at March 31, 2012.
166
The effectiveness of our internal control over financial reporting at March 31, 2012 has been audited by KPMG AZSA LLC, our independent registered public accounting firm, as stated in their report appearing on page F-4.
Changes in Internal Control Over Financial Reporting
There have been no changes in our internal control over financial reporting that occurred during the period covered by this annual report that have materially affected, or are reasonably likely to materially affect, our internal control over financial reporting.
| Item 16A. | Audit Committee Financial Expert |
We have determined at a meeting of our board of corporate auditors in July 2009 that Mr. Satoshi Itoh is an “audit committee financial expert” as defined in Item 16A. of Form 20-F and is “independent” as defined in the listing standards of the NYSE. Mr. Itoh, an outside corporate auditor under the Companies Act, has spent most of his career auditing Japanese corporations as a certified public accountant and was a special professor at Chuo University Graduate School of International Accounting from April 2002 to March 2007.
We have adopted a code of ethics, which is comprised of internal rules included in our business ethics and compliance manual, each of which applies to all our directors, officers and other employees.
Our business ethics are commonly applicable principles of Corporate Social Responsibility (“CSR”) in which observance of the compliance system is regarded as very important. Our compliance manual sets forth the necessity of adherence to our management philosophy and code of conduct by our directors, officers and other employees, and the roles and responsibilities of our employees, compliance officers, Compliance Division and others in the event of a breach of the compliance rules.
This manual was created to identify, and to promote compliance by our directors, officers and other employees with relevant laws and regulations in conjunction with our management philosophy and code of conduct and compliance rules. This manual also sets forth the procedures regarding the handling of conflicts of interest for our directors and the promotion of conduct that meets our management philosophy and code of conduct and compliance rules for employees. For a detailed discussion of our management philosophy and code of conduct, see “Item 4.B. Business Overview—Management Philosophy.”
A copy of the sections of our business ethics and compliance manual equivalent to the “code of ethics” (as defined in paragraph (b) of Item 16B. of Form 20-F) is attached as Exhibit 11 to this annual report.
There were no material changes to the code of ethics during the fiscal year ended March 31, 2012. No waivers of the business ethics and compliance manual have been granted to any of our directors, officers or other employees, during the fiscal year ended March 31, 2012.
167
| Item 16C. | Principal Accountant Fees and Services |
Fees for Services Provided by KPMG AZSA LLC and its Affiliates
The aggregate fees billed by KPMG AZSA LLC (“KPMG”), our independent registered public accounting firm, and its affiliates, for the fiscal years ended March 31, 2012 and 2011 are presented in the following table:
| | | | | | | | |
| | | For the fiscal year ended March 31, | |
| | | 2012 | | | 2011 | |
| | | (In millions) | |
Audit fees(1) | | ¥ | 3,678 | | | ¥ | 3,606 | |
Audit-related fees(2) | | | 110 | | | | 129 | |
Tax fees(3) | | | 102 | | | | 106 | |
All other fees(4) | | | 31 | | | | 9 | |
| | | | | | | | |
Total | | ¥ | 3,921 | | | ¥ | 3,850 | |
| | | | | | | | |
| (1) | Audit fees primarily include fees for the audit of our and our subsidiaries’ annual financial statements and fees for the services that are normally provided in connection with our statutory and regulatory filings. |
| (2) | Audit-related fees primarily include fees for attestation and related services that are not reported under audit fees. |
| (3) | Tax fees primarily include fees for tax compliance, assistance with preparation of tax return filings and tax advisory services. |
| (4) | All other fees primarily include fees for advisory services for existing model assessment. |
Pre-Approval Policies and Procedures
Pursuant to Rule 2-01(c)(7) of Regulation S-X, our board of corporate auditors pre-approves all engagements with KPMG and its affiliates. Under the policies and procedures established by our board of corporate auditors, SMFG and its subsidiaries must apply to our board of corporate auditors for pre-approval on either a periodic basis twice a year for services expected to be performed in the coming months or case-by-case basis before entering into the engagement with KPMG and its affiliates to perform audit and permitted non-audit services.
Pre-approval is granted by our board of corporate auditors prior to entering into the engagement. Additionally, if necessary, full-time corporate auditors may consider any case-by-case application for pre-approval on behalf of our board of corporate auditors prior to the next scheduled board meeting. Such pre-approvals made by full-time corporate auditors are reported to our board of corporate auditors at the next scheduled board meeting.
Fees approved pursuant to the procedures described in paragraph 2-01(c)(7)(i)(C) of Regulation S-X, which provides for an exception to the general requirement for pre-approval in certain circumstances, were approximately 0.4% of the total fees for the fiscal year ended March 31, 2011, and none for the fiscal year ended March 31, 2012.
| Item 16D. | Exemptions from the Listing Standards for the Audit Committee |
We do not have an audit committee defined under the Securities Exchange Act of 1934. We are relying on the general exemption contained in Rule 10A-3(c)(3) under the Securities Exchange Act of 1934, which provides an exemption from the NYSE’s listing standards relating to audit committees for foreign companies that have a board of corporate auditors that meets the requirements set forth in Rule 10A-3(c)(3). Our reliance on Rule 10A-3(c)(3) does not, in our opinion, materially adversely affect the ability of our board of corporate auditors to act independently and to satisfy the other requirements of Rule 10A-3.
168
| Item 16E. | Purchases of Equity Securities by the Issuer and Affiliated Purchasers |
The following table sets forth purchases of our common stock by us and our affiliated purchasers during the fiscal year ended March 31, 2012:
| | | | | | | | | | | | | | | | |
| | | Total number of
shares purchased | | | Average price
paid per share | | | Total number of
shares purchased
as part of
publicly
announced plans
or programs | | | Maximum
number of shares
that may yet be
purchased under
the plans
or programs | |
April 1 to April 30, 2011 | | | 1,030 | | | ¥ | 2,538 | | | | — | | | | — | |
May 1 to May 31, 2011 | | | 372,303 | | | | 2,876 | | | | — | | | | — | |
June 1 to June 30, 2011 | | | 1,680 | | | | 2,326 | | | | — | | | | — | |
July 1 to July 31, 2011 | | | 3,021 | | | | 2,492 | | | | — | | | | — | |
August 1 to August 31, 2011 | | | 2,053 | | | | 2,344 | | | | | | | | | |
September 1 to September 30, 2011 | | | 1,505 | | | | 2,154 | | | | — | | | | — | |
October 1 to October 31, 2011 | | | 1,824 | | | | 2,127 | | | | — | | | | — | |
November 1 to November 30, 2011 | | | 1,173 | | | | 2,122 | | | | — | | | | — | |
December 1 to December 31, 2011 | | | 17,101,980 | | | | 2,197 | | | | 17,099,700 | | | | 5,900,300 | |
January 1 to January 31, 2012 | | | 5,620,329 | | | | 2,215 | | | | 5,618,400 | | | | 23,224,900 | |
February 1 to February 29, 2012 | | | 11,861,187 | | | | 2,585 | | | | 11,858,500 | | | | 11,084,500 | |
March 1 to March 31, 2012 | | | 11,087,523 | | | | 2,781 | | | | 11,084,500 | | | | — | |
| | | | | | | | | | | | | | | | |
Total | | | 46,055,608 | | | ¥ | 2,445 | | | | 45,661,100 | | | | — | |
| | | | | | | | | | | | | | | | |
| (1) | A total of 394,508 shares were purchased other than through a publicly announced plan or program during the fiscal year ended March 31, 2012, due to purchases of our shares by certain subsidiaries in connection with the share exchange to make Cedyna our wholly owned consolidated subsidiary, or our purchases of shares constituting less than one unit from registered holders of such shares at the current market prices of those shares. |
| (2) | On November 14, 2011, our board of directors resolved to repurchase some shares of our common stock to be delivered to the shareholders of SMBC Consumer Finance, formerly known as Promise, as consideration in the share exchange that made SMBC Consumer Finance our wholly owned subsidiary. Concurrently, we also announced that we would acquire up to 23,000,000 shares of our stock to be delivered or the number of our shares obtainable with a maximum aggregate purchase price of ¥50,000,000,000, through market purchases based on the discretionary dealing contract regarding repurchase of shares from December 2, 2011 to January 20, 2012. |
| | Pursuant to this resolution, we acquired 22,718,100 shares of our common stock for an aggregate purchase price of ¥49,999,892,841 and concluded such acquisitions on January 16, 2012 because the aggregate purchase price reached nearly ¥50,000,000,000. |
| (3) | On January 30, 2012, our board of directors resolved to repurchase the remaining shares of our common stock to be delivered to the shareholders of Promise in connection with the share exchange mentioned in note (2). We thus concurrently announced that we would acquire up to 22,943,000 shares of our stock to be delivered or the number of our shares obtainable with a maximum aggregate purchase price of ¥80,000,000,000, through market purchases based on the discretionary dealing contract regarding repurchase of shares from January 31, 2012 to March 23, 2012. |
| | Pursuant to this resolution, on March 23, 2012 we concluded our acquisition of an additional 22,943,100 shares of our common stock for an aggregate purchase price of ¥61,457,908,844. |
| Item 16F. | Change in Registrant’s Certifying Accountant |
None.
| Item 16G. | Corporate Governance |
Companies listed on the NYSE must comply with certain corporate governance standards provided under Section 303A of the NYSE Listed Company Manual. However, NYSE-listed companies that are foreign private issuers, including us, are permitted to follow home country practices in lieu of certain provisions of Section 303A if such foreign private issuers meet certain criteria. We rely on the exemption for home country practices concerning the listing of our ADSs on the NYSE.
169
Foreign private issuers listed on the NYSE are required to provide to their U.S. investors a brief, general summary of the significant differences of corporate governance practices that differ from U.S. companies under NYSE listing standards. The following is a summary of the significant ways in which our corporate governance practices differ from NYSE standards followed by U.S. companies:
| | • | | U.S. companies listed on the NYSE are required to have an audit committee composed entirely of independent directors. Under the Companies Act of Japan, we are required to have a corporate governance system based on either (i) a board of corporate auditors or (ii) committees. We adopt a corporate governance system based on a board of corporate auditors. The basic function of the board of corporate auditors is similar to that of independent directors, including those who are members of the audit committee, of a NYSE-listed U.S. company, i.e., to monitor the performance of the directors and review and express opinions on the method of auditing by the independent registered public accounting firm and on such accounting firm’s audit reports for the protection of the company’s shareholders. Under the Companies Act, we are required to have at least half of our corporate auditors be outside corporate auditors who meet the independence requirements under the Companies Act. Currently, three of our six corporate auditors are outside corporate auditors that meet such independence requirements. In addition, none of the corporate auditors may at the same time be directors, managers or employees of the company or any of its subsidiaries, or accounting participants or executive officers of such subsidiaries. While the Companies Act does not require corporate auditors to have expertise in accounting or other special knowledge and experience, one of our corporate auditors is a certified public accountant in Japan. We rely on an exemption from the audit committee requirements imposed by Rule 10A-3 of the Securities Exchange Act of 1934, which is available to foreign private issuers with a board of auditors (or similar body) meeting specified criteria. With respect to our board of corporate auditors, the criteria that we meet include the following: |
| | • | | responsible, to the extent permitted by law, for the appointment, retention and supervision of the work of an independent registered public accounting firm engaged for the purpose of preparing or issuing an audit report or performing other audit, review or attestation services for us; |
| | • | | subject to procedures for the receipt, retention and treatment of complaints and the confidential, anonymous submission of concerns by employees regarding the status of our internal control system on accounting and financial reporting and internal and external audits; |
| | • | | each corporate auditor has the authority to engage independent counsel and other advisers if such engagement is necessary to carry out his or her duties; and |
| | • | | each corporate auditor has the ability to require us to pay any and all expenses necessary for carrying out his or her duties. |
Under the Companies Act, companies that adopt a corporate governance system based on a board of corporate auditors, such as us, are not required to maintain directors that are outside directors who meet the independence requirements under the Companies Act. However, three of our twelve directors are outside directors who meet such requirements.
| | • | | A NYSE-listed U.S. company is required to have a nominating/corporate governance committee and a compensation committee, all of which must be composed entirely of independent directors. While we, a company which has corporate auditors, are not required to establish a nominating committee or a compensation committee under the Companies Act, we voluntarily established similar committees, each with six members, three of which are outside directors, to advise the board of directors on these matters in order to ensure transparency and impartiality in matters of personnel decisions affecting the board of directors and directors’ compensation. |
| | • | | A NYSE-listed U.S. company must hold regularly scheduled executive sessions where participants are limited to non-management directors. Under the Companies Act, Japanese corporations are not obliged to hold executive sessions where participants are limited to non-management directors. |
170
| | • | | The Companies Act requires that the aggregate amount of remuneration to be paid to all directors and the aggregate amount of remuneration to be paid to all corporate auditors to be determined by a resolution of a general meeting of shareholders, unless their remuneration is provided for in the articles of incorporation. Based on the above resolution, the distribution of remuneration among directors is broadly delegated to our board of directors, which takes into consideration the advisory opinion by the compensation committee, and the distribution of remuneration among corporate auditors is determined by consultation among our corporate auditors. |
| | • | | A NYSE-listed U.S. company must adopt a code of business conduct and ethics and must post the code on its website. While we are not required to adopt such code under Japanese law or the rules of stock exchanges in Japan on which we are listed, we maintain our code of conduct as our standard for corporate conduct to be observed by our directors, officers and employees. |
| | • | | A NYSE-listed U.S. company must generally obtain shareholder approval with respect to any equity compensation plan, subject to limited exemptions. Under the Companies Act of Japan, the adoption of an equity compensation plan including stock option-based plans for directors and corporate auditors requires shareholder approval. In order to issue stock options, a public company such as us must obtain the approval of its board of directors, unless stock options are granted on preferential terms to the recipient, in which case it must obtain shareholder approval by a “special resolution” of a general meeting of shareholders. Under our articles of incorporation, the quorum for such a special resolution of our shareholders is at least one-third of the total number of voting rights of all of shareholders, and approval by at least two-thirds of the number of voting rights represented at the meeting is required. |
We obtained shareholder approval at our June 2010 general meeting of shareholders to introduce stock compensation-type stock options to our directors and corporate auditors. Under the terms resolved at the meeting we may issue stock options to our directors and corporate auditors as part of their remuneration upon the approval of our board of directors unless stock options are issued on preferential terms to the recipient. For additional information, see “Item 6.E. Share Ownership.”
| Item 16H. | Mine Safety Disclosure |
Not applicable.
171
PART III
| Item 17. | Financial Statements |
We have responded to Item 18 in lieu of this item.
| Item 18. | Financial Statements |
The information required by this item is set forth in our consolidated financial statements starting on page F-1 of this annual report.
We have filed the following documents as exhibits to this document:
| | |
| |
| Exhibit 1.1 | | Articles of Incorporation of Sumitomo Mitsui Financial Group, Inc., incorporated by reference from our registration statement on Form 20-F (Commission file number 001-34919) filed on October 20, 2010 |
| |
| Exhibit 1.2 | | Regulations of Board of Directors of Sumitomo Mitsui Financial Group, Inc., incorporated by reference from our registration statement on Form 20-F (Commission file number 001-34919) filed on October 20, 2010 |
| |
| Exhibit 1.3 | | Share Handling Regulations of Sumitomo Mitsui Financial Group, Inc., as amended on April 1, 2012 |
| |
| Exhibit 2.1 | | Form of Deposit Agreement among the registrant, Citibank, N.A., as Depositary, and all owners and holders from time to time of American Depositary Shares issued thereunder, incorporated by reference from our registration statement on Form 20-F (Commission file number 001-34919) filed on October 20, 2010 |
| |
| Exhibit 8 | | List of subsidiaries of Sumitomo Mitsui Financial Group, Inc., at March 31, 2012 |
| |
| Exhibit 11 | | Code of Ethics of Sumitomo Mitsui Financial Group, Inc., incorporated by reference from our annual report on Form 20-F (File No. 001-34919) filed on July 29, 2011 |
| |
| Exhibit 12.1 | | CEO Certification Required by Rule 13a-14(a) (17 CFR 240.13a-14(a)) |
| |
| Exhibit 12.2 | | CFO Certification Required by Rule 13a-14(a) (17 CFR 240.13a-14(a)) |
| |
| Exhibit 13.1 | | Certification Required by Rule 13a-14(b) (17 CFR 240.13a-14(b)) and Section 1350 of Chapter 63 of Title 18 of the United States Code (18 U.S.C. 1350) |
| |
| Exhibit 13.2 | | Certification Required by Rule 13a-14(b) (17 CFR 240.13a-14(b)) and Section 1350 of Chapter 63 of Title 18 of the United States Code (18 U.S.C. 1350) |
We have not included as exhibits certain instruments with respect to our long-term debt. The total amount of our long-term debt securities or that of our subsidiaries, authorized under any instrument does not exceed 10% of our total assets. We hereby agree to furnish to the SEC, upon its request, a copy of any instrument defining the rights of holders of our long-term debt or that of our subsidiaries for which consolidated or unconsolidated financial statements are required to be filed.
172
SIGNATURES
The registrant hereby certifies that it meets all of the requirements for filing on Form 20-F and that it has duly caused and authorized the undersigned to sign this annual report on its behalf.
| | | | |
| Sumitomo Mitsui Financial Group, Inc. |
| |
| By: | | /s/ Koichi Miyata |
| | Name: | | Koichi Miyata |
| | Title: | | President and Representative Director |
Date: July 23, 2012
173
SELECTED STATISTICAL DATA
| I. | Distribution of Assets, Liabilities and Equity; Interest Rates and Interest Differential |
Average Statements of Financial Positions, Interest and Average Rates
The following table shows the average balances of the SMFG Group’s statement of financial positions items and related interest and average interest rates for the fiscal years ended March 31, 2012, 2011 and 2010. Average balances are generally based on a daily average. Weekly, month-end or quarter-end averages are used for certain average balances where it is not practical to obtain the applicable daily averages. The average balances determined by such methods are considered to be representative of the SMFG Group’s operations. The allocation of amounts between domestic and foreign is based on the location of the office.
| | | | | | | | | | | | | | | | | | | | | | | | | | | | | | | | | | | | |
| | | For the fiscal year ended March 31, | |
| | | 2012 | | | 2011 | | | 2010 | |
| | | Average
balance | | | Interest
income | | | Average
rate | | | Average
balance | | | Interest
income | | | Average
rate | | | Average
balance | | | Interest
income | | | Average
rate | |
| | | (In millions, except percentages) | |
Interest-earning assets: | | | | | | | | | | | | | | | | | | | | | | | | | | | | | | | | | | | | |
Interest-earning deposits with other banks: | | | | | | | | | | | | | | | | | | | | | | | | | | | | | | | | | | | | |
Domestic offices | | ¥ | 292,043 | | | ¥ | 1,602 | | | | 0.55 | % | | ¥ | 298,557 | | | ¥ | 1,144 | | | | 0.38 | % | | ¥ | 222,757 | | | ¥ | 1,005 | | | | 0.45 | % |
Foreign offices | | | 3,626,677 | | | | 26,557 | | | | 0.73 | % | | | 2,224,887 | | | | 17,324 | | | | 0.78 | % | | | 2,054,195 | | | | 13,591 | | | | 0.66 | % |
| | | | | | | | | | | | | | | | | | | | | | | | | | | | | | | | | | | | |
Total | | | 3,918,720 | | | | 28,159 | | | | 0.72 | % | | | 2,523,444 | | | | 18,468 | | | | 0.73 | % | | | 2,276,952 | | | | 14,596 | | | | 0.64 | % |
| | | | | | | | | | | | | | | | | | | | | | | | | | | | | | | | | | | | |
Call loans and bills bought: | | | | | | | | | | | | | | | | | | | | | | | | | | | | | | | | | | | | |
Domestic offices | | | 346,962 | | | | 2,081 | | | | 0.60 | % | | | 361,438 | | | | 2,252 | | | | 0.62 | % | | | 347,177 | | | | 2,500 | | | | 0.72 | % |
Foreign offices | | | 832,860 | | | | 12,269 | | | | 1.47 | % | | | 802,633 | | | | 7,022 | | | | 0.87 | % | | | 819,819 | | | | 4,952 | | | | 0.60 | % |
| | | | | | | | | | | | | | | | | | | | | | | | | | | | | | | | | | | | |
Total | | | 1,179,822 | | | | 14,350 | | | | 1.22 | % | | | 1,164,071 | | | | 9,274 | | | | 0.80 | % | | | 1,166,996 | | | | 7,452 | | | | 0.64 | % |
| | | | | | | | | | | | | | | | | | | | | | | | | | | | | | | | | | | | |
Reverse repurchase agreements and cash collateral on securities borrowed: | | | | | | | | | | | | | | | | | | | | | | | | | | | | | | | | | | | | |
Domestic offices | | | 4,123,424 | | | | 9,072 | | | | 0.22 | % | | | 4,467,165 | | | | 11,271 | | | | 0.25 | % | | | 2,509,461 | | | | 8,634 | | | | 0.34 | % |
Foreign offices | | | 200,641 | | | | 6,047 | | | | 3.01 | % | | | 76,189 | | | | 2,375 | | | | 3.12 | % | | | 24,899 | | | | 802 | | | | 3.22 | % |
| | | | | | | | | | | | | | | | | | | | | | | | | | | | | | | | | | | | |
Total | | | 4,324,065 | | | | 15,119 | | | | 0.35 | % | | | 4,543,354 | | | | 13,646 | | | | 0.30 | % | | | 2,534,360 | | | | 9,436 | | | | 0.37 | % |
| | | | | | | | | | | | | | | | | | | | | | | | | | | | | | | | | | | | |
Trading assets(1): | | | | | | | | | | | | | | | | | | | | | | | | | | | | | | | | | | | | |
Domestic offices | | | 4,342,210 | | | | 29,747 | | | | 0.69 | % | | | 4,218,883 | | | | 35,268 | | | | 0.84 | % | | | 1,954,014 | | | | 7,270 | | | | 0.37 | % |
Foreign offices | | | 75,359 | | | | 1,680 | | | | 2.23 | % | | | 114,134 | | | | 2,262 | | | | 1.98 | % | | | 103,244 | | | | 1,780 | | | | 1.72 | % |
| | | | | | | | | | | | | | | | | | | | | | | | | | | | | | | | | | | | |
Total | | | 4,417,569 | | | | 31,427 | | | | 0.71 | % | | | 4,333,017 | | | | 37,530 | | | | 0.87 | % | | | 2,057,258 | | | | 9,050 | | | | 0.44 | % |
| | | | | | | | | | | | | | | | | | | | | | | | | | | | | | | | | | | | |
Financial assets at fair value through profit or loss(2): | | | | | | | | | | | | | | | | | | | | | | | | | | | | | | | | | | | | |
Domestic offices | | | 2,010,408 | | | | 4,165 | | | | 0.21 | % | | | 1,984,458 | | | | 5,798 | | | | 0.29 | % | | | 1,990,261 | | | | 11,664 | | | | 0.59 | % |
| | | | | | | | | | | | | | | | | | | | | | | | | | | | | | | | | | | | |
Held-to-maturity investments(3): | | | | | | | | | | | | | | | | | | | | | | | | | | | | | | | | | | | | |
Domestic offices | | | 4,818,061 | | | | 37,895 | | | | 0.79 | % | | | 3,709,853 | | | | 32,629 | | | | 0.88 | % | | | 2,830,378 | | | | 28,784 | | | | 1.02 | % |
| | | | | | | | | | | | | | | | | | | | | | | | | | | | | | | | | | | | |
Available-for-sale financial assets(3): | | | | | | | | | | | | | | | | | | | | | | | | | | | | | | | | | | | | |
Domestic offices | | | 23,307,399 | | | | 83,223 | | | | 0.36 | % | | | 19,297,268 | | | | 103,026 | | | | 0.53 | % | | | 13,561,413 | | | | 104,254 | | | | 0.77 | % |
Foreign offices | | | 1,001,531 | | | | 16,835 | | | | 1.68 | % | | | 1,229,769 | | | | 19,076 | | | | 1.55 | % | | | 1,120,526 | | | | 17,819 | | | | 1.59 | % |
| | | | | | | | | | | | | | | | | | | | | | | | | | | | | | | | | | | | |
Total | | | 24,308,930 | | | | 100,058 | | | | 0.41 | % | | | 20,527,037 | | | | 122,102 | | | | 0.59 | % | | | 14,681,939 | | | | 122,073 | | | | 0.83 | % |
| | | | | | | | | | | | | | | | | | | | | | | | | | | | | | | | | | | | |
Loans and advances(4): | | | | | | | | | | | | | | | | | | | | | | | | | | | | | | | | | | | | |
Domestic offices | | | 62,286,915 | | | | 1,224,234 | | | | 1.97 | % | | | 63,761,723 | | | | 1,282,041 | | | | 2.01 | % | | | 64,768,749 | | | | 1,317,068 | | | | 2.03 | % |
Foreign offices | | | 11,618,471 | | | | 290,516 | | | | 2.50 | % | | | 9,702,902 | | | | 242,021 | | | | 2.49 | % | | | 10,451,249 | | | | 266,638 | | | | 2.55 | % |
| | | | | | | | | | | | | | | | | | | | | | | | | | | | | | | | | | | | |
Total | | | 73,905,386 | | | | 1,514,750 | | | | 2.05 | % | | | 73,464,625 | | | | 1,524,062 | | | | 2.07 | % | | | 75,219,998 | | | | 1,583,706 | | | | 2.11 | % |
| | | | | | | | | | | | | | | | | | | | | | | | | | | | | | | | | | | | |
Total interest-earning assets: | | | | | | | | | | | | | | | | | | | | | | | | | | | | | | | | | | | | |
Domestic offices | | | 101,527,422 | | | | 1,392,019 | | | | 1.37 | % | | | 98,099,345 | | | | 1,473,429 | | | | 1.50 | % | | | 88,184,210 | | | | 1,481,179 | | | | 1.68 | % |
Foreign offices | | | 17,355,539 | | | | 353,904 | | | | 2.04 | % | | | 14,150,514 | | | | 290,080 | | | | 2.05 | % | | | 14,573,932 | | | | 305,582 | | | | 2.10 | % |
| | | | | | | | | | | | | | | | | | | | | | | | | | | | | | | | | | | | |
Total | | | 118,882,961 | | | | 1,745,923 | | | | 1.47 | % | | | 112,249,859 | | | | 1,763,509 | | | | 1.57 | % | | | 102,758,142 | | | | 1,786,761 | | | | 1.74 | % |
| | | | | | | | | | | | | | | | | | | | | | | | | | | | | | | | | | | | |
Non-interest-earning assets: | | | | | | | | | | | | | | | | | | | | | | | | | | | | | | | | | | | | |
Cash and due from banks | | | 3,139,966 | | | | | | | | | | | | 2,416,670 | | | | | | | | | | | | 2,228,009 | | | | | | | | | |
Other non-interest-earning assets | | | 14,500,755 | | | | | | | | | | | | 14,975,785 | | | | | | | | | | | | 20,334,857 | | | | | | | | | |
Allowance for loan losses | | | (1,476,293 | ) | | | | | | | | | | | (1,548,825 | ) | | | | | | | | | | | (1,635,248 | ) | | | | | | | | |
| | | | | | | | | | | | | | | | | | | | | | | | | | | | | | | | | | | | |
Total non-interest-earning assets | | | 16,164,428 | | | | | | | | | | | | 15,843,630 | | | | | | | | | | | | 20,927,618 | | | | | | | | | |
| | | | | | | | | | | | | | | | | | | | | | | | | | | | | | | | | | | | |
Total assets | | ¥ | 135,047,389 | | | | | | | | | | | ¥ | 128,093,489 | | | | | | | | | | | ¥ | 123,685,760 | | | | | | | | | |
| | | | | | | | | | | | | | | | | | | | | | | | | | | | | | | | | | | | |
Total assets attributable to foreign offices | | | 15.1 | % | | | | | | | | | | | 13.0 | % | | | | | | | | | | | 14.2 | % | | | | | | | | |
A-1
| | | | | | | | | | | | | | | | | | | | | | | | | | | | | | | | | | | | |
| | | For the fiscal year ended March 31, | |
| | | 2012 | | | 2011 | | | 2010 | |
| | | Average
balance | | | Interest
expense | | | Average
rate | | | Average
balance | | | Interest
expense | | | Average
rate | | | Average
balance | | | Interest
expense | | | Average
rate | |
| | | (In millions, except percentages) | |
Interest-bearing liabilities: | | | | | | | | | | | | | | | | | | | | | | | | | | | | | | | | | | | | |
Deposits: | | | | | | | | | | | | | | | | | | | | | | | | | | | | | | | | | | | | |
Domestic offices | | ¥ | 69,331,354 | | | ¥ | 61,690 | | | | 0.09 | % | | ¥ | 67,912,936 | | | ¥ | 78,529 | | | | 0.12 | % | | ¥ | 65,150,510 | | | ¥ | 119,055 | | | | 0.18 | % |
Foreign offices | | | 9,819,810 | | | | 67,773 | | | | 0.69 | % | | | 8,351,047 | | | | 55,955 | | | | 0.67 | % | | | 8,916,248 | | | | 54,319 | | | | 0.61 | % |
| | | | | | | | | | | | | | | | | | | | | | | | | | | | | | | | | | | | |
Total | | | 79,151,164 | | | | 129,463 | | | | 0.16 | % | | | 76,263,983 | | | | 134,484 | | | | 0.18 | % | | | 74,066,758 | | | | 173,374 | | | | 0.23 | % |
| | | | | | | | | | | | | | | | | | | | | | | | | | | | | | | | | | | | |
Call money and bills sold: | | | | | | | | | | | | | | | | | | | | | | | | | | | | | | | | | | | | |
Domestic offices | | | 1,434,363 | | | | 1,564 | | | | 0.11 | % | | | 1,613,628 | | | | 2,166 | | | | 0.13 | % | | | 1,857,443 | | | | 2,855 | | | | 0.15 | % |
Foreign offices | | | 379,093 | | | | 1,999 | | | | 0.53 | % | | | 334,514 | | | | 1,672 | | | | 0.50 | % | | | 1,207,668 | | | | 3,392 | | | | 0.28 | % |
| | | | | | | | | | | | | | | | | | | | | | | | | | | | | | | | | | | | |
Total | | | 1,813,456 | | | | 3,563 | | | | 0.20 | % | | | 1,948,142 | | | | 3,838 | | | | 0.20 | % | | | 3,065,111 | | | | 6,247 | | | | 0.20 | % |
| | | | | | | | | | | | | | | | | | | | | | | | | | | | | | | | | | | | |
Repurchase agreements and cash collateral on securities lent: | | | | | | | | | | | | | | | | | | | | | | | | | | | | | | | | | | | | |
Domestic offices | | | 4,908,276 | | | | 7,901 | | | | 0.16 | % | | | 5,074,570 | | | | 9,421 | | | | 0.19 | % | | | 3,472,016 | | | | 6,843 | | | | 0.20 | % |
Foreign offices | | | 649,143 | | | | 2,665 | | | | 0.41 | % | | | 602,510 | | | | 2,183 | | | | 0.36 | % | | | 365,884 | | | | 703 | | | | 0.19 | % |
| | | | | | | | | | | | | | | | | | | | | | | | | | | | | | | | | | | | |
Total | | | 5,557,419 | | | | 10,566 | | | | 0.19 | % | | | 5,677,080 | | | | 11,604 | | | | 0.20 | % | | | 3,837,900 | | | | 7,546 | | | | 0.20 | % |
| | | | | | | | | | | | | | | | | | | | | | | | | | | | | | | | | | | | |
Trading liabilities(1): | | | | | | | | | | | | | | | | | | | | | | | | | | | | | | | | | | | | |
Domestic offices | | | 1,887,066 | | | | 20,382 | | | | 1.08 | % | | | 1,909,663 | | | | 22,653 | | | | 1.19 | % | | | 546,183 | | | | 3,095 | | | | 0.57 | % |
Foreign offices | | | 4,728 | | | | 85 | | | | 1.80 | % | | | 3,801 | | | | 76 | | | | 2.00 | % | | | 470 | | | | 12 | | | | 2.55 | % |
| | | | | | | | | | | | | | | | | | | | | | | | | | | | | | | | | | | | |
Total | | | 1,891,794 | | | | 20,467 | | | | 1.08 | % | | | 1,913,464 | | | | 22,729 | | | | 1.19 | % | | | 546,653 | | | | 3,107 | | | | 0.57 | % |
| | | | | | | | | | | | | | | | | | | | | | | | | | | | | | | | | | | | |
Borrowings: | | | | | | | | | | | | | | | | | | | | | | | | | | | | | | | | | | | | |
Domestic offices | | | 10,904,124 | | | | 66,414 | | | | 0.61 | % | | | 8,600,247 | | | | 70,713 | | | | 0.82 | % | | | 6,066,674 | | | | 60,837 | | | | 1.00 | % |
Foreign offices | | | 347,165 | | | | 17,076 | | | | 4.92 | % | | | 451,803 | | | | 14,762 | | | | 3.27 | % | | | 471,182 | | | | 18,467 | | | | 3.92 | % |
| | | | | | | | | | | | | | | | | | | | | | | | | | | | | | | | | | | | |
Total | | | 11,251,289 | | | | 83,490 | | | | 0.74 | % | | | 9,052,050 | | | | 85,475 | | | | 0.94 | % | | | 6,537,856 | | | | 79,304 | | | | 1.21 | % |
| | | | | | | | | | | | | | | | | | | | | | | | | | | | | | | | | | | | |
Debt securities in issue: | | | | | | | | | | | | | | | | | | | | | | | | | | | | | | | | | | | | |
Domestic offices | | | 5,336,930 | | | | 77,083 | | | | 1.44 | % | | | 4,873,726 | | | | 65,834 | | | | 1.35 | % | | | 4,783,157 | | | | 67,785 | | | | 1.42 | % |
Foreign offices | | | 820,798 | | | | 8,712 | | | | 1.06 | % | | | 595,205 | | | | 9,110 | | | | 1.53 | % | | | 431,283 | | | | 10,543 | | | | 2.44 | % |
| | | | | | | | | | | | | | | | | | | | | | | | | | | | | | | | | | | | |
Total | | | 6,157,728 | | | | 85,795 | | | | 1.39 | % | | | 5,468,931 | | | | 74,944 | | | | 1.37 | % | | | 5,214,440 | | | | 78,328 | | | | 1.50 | % |
| | | | | | | | | | | | | | | | | | | | | | | | | | | | | | | | | | | | |
Other interest-bearing liabilities: | | | | | | | | | | | | | | | | | | | | | | | | | | | | | | | | | | | | |
Domestic offices | | | 73,821 | | | | 672 | | | | 0.91 | % | | | 72,261 | | | | 635 | | | | 0.88 | % | | | 83,198 | | | | 1,977 | | | | 2.38 | % |
Foreign offices | | | 3,508 | | | | 82 | | | | 2.34 | % | | | 4,147 | | | | 76 | | | | 1.83 | % | | | 4,518 | | | | 34 | | | | 0.75 | % |
| | | | | | | | | | | | | | | | | | | | | | | | | | | | | | | | | | | | |
Total | | | 77,329 | | | | 754 | | | | 0.98 | % | | | 76,408 | | | | 711 | | | | 0.93 | % | | | 87,716 | | | | 2,011 | | | | 2.29 | % |
| | | | | | | | | | | | | | | | | | | | | | | | | | | | | | | | | | | | |
Total interest-bearing liabilities: | | | | | | | | | | | | | | | | | | | | | | | | | | | | | | | | | | | | |
Domestic offices | | | 93,875,934 | | | | 235,706 | | | | 0.25 | % | | | 90,057,031 | | | | 249,951 | | | | 0.28 | % | | | 81,959,181 | | | | 262,447 | | | | 0.32 | % |
Foreign offices | | | 12,024,245 | | | | 98,392 | | | | 0.82 | % | | | 10,343,027 | | | | 83,834 | | | | 0.81 | % | | | 11,397,253 | | | | 87,470 | | | | 0.77 | % |
| | | | | | | | | | | | | | | | | | | | | | | | | | | | | | | | | | | | |
Total | | | 105,900,179 | | | | 334,098 | | | | 0.32 | % | | | 100,400,058 | | | | 333,785 | | | | 0.33 | % | | | 93,356,434 | | | | 349,917 | | | | 0.37 | % |
| | | | | | | | | | | | | | | | | | | | | | | | | | | | | | | | | | | | |
Non-interest-bearing liabilities | | | 21,882,381 | | | | | | | | | | | | 20,092,929 | | | | | | | | | | | | 24,775,374 | | | | | | | | | |
Total equity | | | 7,264,829 | | | | | | | | | | | | 7,600,502 | | | | | | | | | | | | 5,553,952 | | | | | | | | | |
| | | | | | | | | | | | | | | | | | | | | | | | | | | | | | | | | | | | |
Total equity and liabilities | | ¥ | 135,047,389 | | | | | | | | | | | ¥ | 128,093,489 | | | | | | | | | | | ¥ | 123,685,760 | | | | | | | | | |
| | | | | | | | | | | | | | | | | | | | | | | | | | | | | | | | | | | | |
Total liabilities attributable to foreign offices | | | 11.8 | % | | | | | | | | | | | 10.8 | % | | | | | | | | | | | 12.1 | % | | | | | | | | |
Net interest income and interest rate spread | | | | | | ¥ | 1,411,825 | | | | 1.15 | % | | | | | | ¥ | 1,429,724 | | | | 1.24 | % | | | | | | ¥ | 1,436,844 | | | | 1.37 | % |
| | | | | | | | | | | | | | | | | | | | | | | | | | | | | | | | | | | | |
Net interest income as a percentage of total interest-earning assets | | | | | | | | | | | 1.19 | % | | | | | | | | | | | 1.27 | % | | | | | | | | | | | 1.40 | % |
| | | | | | | | | | | | | | | | | | | | | | | | | | | | | | | | | | | | |
| (1) | The net amount of interest income on trading assets and interest expense on trading liabilities is reported as net trading income in our consolidated income statement. |
| (2) | Interest income on financial assets at fair value through profit or loss is reported in net income from financial assets at fair value through profit or loss in our consolidated income statement. |
| (3) | Taxable investment securities and non-taxable investment securities are not disclosed separately because the aggregate effect of these average balances and interest income would not be material. In addition, the yields on tax-exempt obligations have not been calculated on a tax equivalent basis because the effect of such calculation would not be material. |
| (4) | Loans and advances include impaired loans and advances. The amortized portion of net loan origination fees is included in interest income on loans and advances. |
A-2
Analysis of Net Interest Income
The following table shows the changes to the SMFG Group’s net interest income attributable to changes in the volume and changes in the rates for the fiscal year ended March 31, 2012 compared to the fiscal year ended March 31, 2011 and for the fiscal year ended March 31, 2011 compared to the fiscal year ended March 31, 2010.
Changes attributable to the combined impact of changes in the rates and the volume have been allocated proportionately to the changes in the volume and changes in the rates.
| | | | | | | | | | | | | | | | | | | | | | | | |
| | | Fiscal year ended March 31, 2012
compared to
fiscal year ended March 31, 2011
Increase / (decrease) | | | Fiscal year ended March 31, 2011
compared to
fiscal year ended March 31, 2010
Increase / (decrease) | |
| | | Volume | | | Rate | | | Net change | | | Volume | | | Rate | | | Net change | |
| | | (In millions) | |
Interest income: | | | | | | | | | | | | | | | | | | | | | | | | |
Interest-earning deposits with other banks: | | | | | | | | | | | | | | | | | | | | | | | | |
Domestic offices | | ¥ | (25 | ) | | ¥ | 483 | | | ¥ | 458 | | | ¥ | 305 | | | ¥ | (166 | ) | | ¥ | 139 | |
Foreign offices | | | 10,298 | | | | (1,065 | ) | | | 9,233 | | | | 1,193 | | | | 2,540 | | | | 3,733 | |
| | | | | | | | | | | | | | | | | | | | | | | | |
Total | | | 10,273 | | | | (582 | ) | | | 9,691 | | | | 1,498 | | | | 2,374 | | | | 3,872 | |
| | | | | | | | | | | | | | | | | | | | | | | | |
Call loans and bills bought: | | | | | | | | | | | | | | | | | | | | | | | | |
Domestic offices | | | (88 | ) | | | (83 | ) | | | (171 | ) | | | 99 | | | | (347 | ) | | | (248 | ) |
Foreign offices | | | 272 | | | | 4,975 | | | | 5,247 | | | | (106 | ) | | | 2,176 | | | | 2,070 | |
| | | | | | | | | | | | | | | | | | | | | | | | |
Total | | | 184 | | | | 4,892 | | | | 5,076 | | | | (7 | ) | | | 1,829 | | | | 1,822 | |
| | | | | | | | | | | | | | | | | | | | | | | | |
Reverse repurchase agreements and cash collateral on securities borrowed: | | | | | | | | | | | | | | | | | | | | | | | | |
Domestic offices | | | (819 | ) | | | (1,380 | ) | | | (2,199 | ) | | | 5,372 | | | | (2,735 | ) | | | 2,637 | |
Foreign offices | | | 3,749 | | | | (77 | ) | | | 3,672 | | | | 1,601 | | | | (28 | ) | | | 1,573 | |
| | | | | | | | | | | | | | | | | | | | | | | | |
Total | | | 2,930 | | | | (1,457 | ) | | | 1,473 | | | | 6,973 | | | | (2,763 | ) | | | 4,210 | |
| | | | | | | | | | | | | | | | | | | | | | | | |
Trading assets: | | | | | | | | | | | | | | | | | | | | | | | | |
Domestic offices | | | 1,010 | | | | (6,531 | ) | | | (5,521 | ) | | | 13,509 | | | | 14,489 | | | | 27,998 | |
Foreign offices | | | (838 | ) | | | 256 | | | | (582 | ) | | | 199 | | | | 283 | | | | 482 | |
| | | | | | | | | | | | | | | | | | | | | | | | |
Total | | | 172 | | | | (6,275 | ) | | | (6,103 | ) | | | 13,708 | | | | 14,772 | | | | 28,480 | |
| | | | | | | | | | | | | | | | | | | | | | | | |
Financial assets at fair value through profit or loss: | | | | | | | | | | | | | | | | | | | | | | | | |
Domestic offices | | | 74 | | | | (1,707 | ) | | | (1,633 | ) | | | (34 | ) | | | (5,832 | ) | | | (5,866 | ) |
| | | | | | | | | | | | | | | | | | | | | | | | |
Held-to-maturity investments: | | | | | | | | | | | | | | | | | | | | | | | | |
Domestic offices | | | 9,009 | | | | (3,743 | ) | | | 5,266 | | | | 8,104 | | | | (4,259 | ) | | | 3,845 | |
| | | | | | | | | | | | | | | | | | | | | | | | |
Available-for-sale financial assets: | | | | | | | | | | | | | | | | | | | | | | | | |
Domestic offices | | | 18,573 | | | | (38,376 | ) | | | (19,803 | ) | | | 36,198 | | | | (37,426 | ) | | | (1,228 | ) |
Foreign offices | | | (3,742 | ) | | | 1,501 | | | | (2,241 | ) | | | 1,702 | | | | (445 | ) | | | 1,257 | |
| | | | | | | | | | | | | | | | | | | | | | | | |
Total | | | 14,831 | | | | (36,875 | ) | | | (22,044 | ) | | | 37,900 | | | | (37,871 | ) | | | 29 | |
| | | | | | | | | | | | | | | | | | | | | | | | |
Loans and advances: | | | | | | | | | | | | | | | | | | | | | | | | |
Domestic offices | | | (29,327 | ) | | | (28,480 | ) | | | (57,807 | ) | | | (20,342 | ) | | | (14,685 | ) | | | (35,027 | ) |
Foreign offices | | | 47,885 | | | | 610 | | | | 48,495 | | | | (18,749 | ) | | | (5,868 | ) | | | (24,617 | ) |
| | | | | | | | | | | | | | | | | | | | | | | | |
Total | | | 18,558 | | | | (27,870 | ) | | | (9,312 | ) | | | (39,091 | ) | | | (20,553 | ) | | | (59,644 | ) |
| | | | | | | | | | | | | | | | | | | | | | | | |
Total interest income: | | | | | | | | | | | | | | | | | | | | | | | | |
Domestic offices | | | (1,593 | ) | | | (79,817 | ) | | | (81,410 | ) | | | 43,211 | | | | (50,961 | ) | | | (7,750 | ) |
Foreign offices | | | 57,624 | | | | 6,200 | | | | 63,824 | | | | (14,160 | ) | | | (1,342 | ) | | | (15,502 | ) |
| | | | | | | | | | | | | | | | | | | | | | | | |
Total | | ¥ | 56,031 | | | ¥ | (73,617 | ) | | ¥ | (17,586 | ) | | ¥ | 29,051 | | | ¥ | (52,303 | ) | | ¥ | (23,252 | ) |
| | | | | | | | | | | | | | | | | | | | | | | | |
A-3
| | | | | | | | | | | | | | | | | | | | | | | | |
| | | Fiscal year ended March 31, 2012
compared to
fiscal year ended March 31, 2011
Increase / (decrease) | | | Fiscal year ended March 31, 2011
compared to
fiscal year ended March 31, 2010
Increase / (decrease) | |
| | | Volume | | | Rate | | | Net change | | | Volume | | | Rate | | | Net change | |
| | | (In millions) | |
Interest expense: | | | | | | | | | | | | | | | | | | | | | | | | |
Deposits: | | | | | | | | | | | | | | | | | | | | | | | | |
Domestic offices | | ¥ | 1,669 | | | ¥ | (18,508 | ) | | ¥ | (16,839 | ) | | ¥ | 4,858 | | | ¥ | (45,384 | ) | | ¥ | (40,526 | ) |
Foreign offices | | | 10,092 | | | | 1,726 | | | | 11,818 | | | | (3,577 | ) | | | 5,213 | | | | 1,636 | |
| | | | | | | | | | | | | | | | | | | | | | | | |
Total | | | 11,761 | | | | (16,782 | ) | | | (5,021 | ) | | | 1,281 | | | | (40,171 | ) | | | (38,890 | ) |
| | | | | | | | | | | | | | | | | | | | | | | | |
Call money and bills sold: | | | | | | | | | | | | | | | | | | | | | | | | |
Domestic offices | | | (218 | ) | | | (384 | ) | | | (602 | ) | | | (348 | ) | | | (341 | ) | | | (689 | ) |
Foreign offices | | | 232 | | | | 95 | | | | 327 | | | | (3,373 | ) | | | 1,653 | | | | (1,720 | ) |
| | | | | | | | | | | | | | | | | | | | | | | | |
Total | | | 14 | | | | (289 | ) | | | (275 | ) | | | (3,721 | ) | | | 1,312 | | | | (2,409 | ) |
| | | | | | | | | | | | | | | | | | | | | | | | |
Repurchase agreements and cash collateral on securities lent: | | | | | | | | | | | | | | | | | | | | | | | | |
Domestic offices | | | (307 | ) | | | (1,213 | ) | | | (1,520 | ) | | | 3,053 | | | | (475 | ) | | | 2,578 | |
Foreign offices | | | 176 | | | | 306 | | | | 482 | | | | 624 | | | | 856 | | | | 1,480 | |
| | | | | | | | | | | | | | | | | | | | | | | | |
Total | | | (131 | ) | | | (907 | ) | | | (1,038 | ) | | | 3,677 | | | | 381 | | | | 4,058 | |
| | | | | | | | | | | | | | | | | | | | | | | | |
Trading liabilities: | | | | | | | | | | | | | | | | | | | | | | | | |
Domestic offices | | | (266 | ) | | | (2,005 | ) | | | (2,271 | ) | | | 13,626 | | | | 5,932 | | | | 19,558 | |
Foreign offices | | | 17 | | | | (8 | ) | | | 9 | | | | 67 | | | | (3 | ) | | | 64 | |
| | | | | | | | | | | | | | | | | | | | | | | | |
Total | | | (249 | ) | | | (2,013 | ) | | | (2,262 | ) | | | 13,693 | | | | 5,929 | | | | 19,622 | |
| | | | | | | | | | | | | | | | | | | | | | | | |
Borrowings: | | | | | | | | | | | | | | | | | | | | | | | | |
Domestic offices | | | 16,418 | | | | (20,717 | ) | | | (4,299 | ) | | | 22,183 | | | | (12,307 | ) | | | 9,876 | |
Foreign offices | | | (3,965 | ) | | | 6,279 | | | | 2,314 | | | | (734 | ) | | | (2,971 | ) | | | (3,705 | ) |
| | | | | | | | | | | | | | | | | | | | | | | | |
Total | | | 12,453 | | | | (14,438 | ) | | | (1,985 | ) | | | 21,449 | | | | (15,278 | ) | | | 6,171 | |
| | | | | | | | | | | | | | | | | | | | | | | | |
Debt securities in issue: | | | | | | | | | | | | | | | | | | | | | | | | |
Domestic offices | | | 6,498 | | | | 4,751 | | | | 11,249 | | | | 1,266 | | | | (3,217 | ) | | | (1,951 | ) |
Foreign offices | | | 2,866 | | | | (3,264 | ) | | | (398 | ) | | | 3,252 | | | | (4,685 | ) | | | (1,433 | ) |
| | | | | | | | | | | | | | | | | | | | | | | | |
Total | | | 9,364 | | | | 1,487 | | | | 10,851 | | | | 4,518 | | | | (7,902 | ) | | | (3,384 | ) |
| | | | | | | | | | | | | | | | | | | | | | | | |
Other interest-bearing liabilities: | | | | | | | | | | | | | | | | | | | | | | | | |
Domestic offices | | | 14 | | | | 23 | | | | 37 | | | | (232 | ) | | | (1,110 | ) | | | (1,342 | ) |
Foreign offices | | | (13 | ) | | | 19 | | | | 6 | | | | (3 | ) | | | 45 | | | | 42 | |
| | | | | | | | | | | | | | | | | | | | | | | | |
Total | | | 1 | | | | 42 | | | | 43 | | | | (235 | ) | | | (1,065 | ) | | | (1,300 | ) |
| | | | | | | | | | | | | | | | | | | | | | | | |
Total interest expense: | | | | | | | | | | | | | | | | | | | | | | | | |
Domestic offices | | | 23,808 | | | | (38,053 | ) | | | (14,245 | ) | | | 44,406 | | | | (56,902 | ) | | | (12,496 | ) |
Foreign offices | | | 9,405 | | | | 5,153 | | | | 14,558 | | | | (3,744 | ) | | | 108 | | | | (3,636 | ) |
| | | | | | | | | | | | | | | | | | | | | | | | |
Total | | | 33,213 | | | | (32,900 | ) | | | 313 | | | | 40,662 | | | | (56,794 | ) | | | (16,132 | ) |
| | | | | | | | | | | | | | | | | | | | | | | | |
Net interest income: | | | | | | | | | | | | | | | | | | | | | | | | |
Domestic offices | | | (25,401 | ) | | | (41,764 | ) | | | (67,165 | ) | | | (1,195 | ) | | | 5,941 | | | | 4,746 | |
Foreign offices | | | 48,219 | | | | 1,047 | | | | 49,266 | | | | (10,416 | ) | | | (1,450 | ) | | | (11,866 | ) |
| | | | | | | | | | | | | | | | | | | | | | | | |
Total | | ¥ | 22,818 | | | ¥ | (40,717 | ) | | ¥ | (17,899 | ) | | ¥ | (11,611 | ) | | ¥ | 4,491 | | | ¥ | (7,120 | ) |
| | | | | | | | | | | | | | | | | | | | | | | | |
A-4
The information as to the value of held-to-maturity investments and available-for-sale financial assets at March 31, 2012, 2011 and 2010 is presented on Item 5.A. Operating Results—Investment Securities.
The following table shows the book values, maturities and weighted average yields of held-to-maturity investments and available-for-sale financial assets, excluding equity instruments, at March 31, 2012. Weighted average yields are calculated based on amortized cost. Yields on tax-exempt obligations have not been calculated on a tax equivalent basis because the effect of such a calculation would not be material.
| | | | | | | | | | | | | | | | | | | | | | | | | | | | | | | | | | | | | | | | |
| | | Not later than
one year | | | Later than one year
and not later than
five years | | | Later than five years
and not later than
ten years | | | Later than
ten years | | | Total | |
| | | Amount | | | Yield | | | Amount | | | Yield | | | Amount | | | Yield | | | Amount | | | Yield | | | Amount | | | Yield | |
| | | (In millions, except percentages) | |
Held-to-maturity investments: | | | | | | | | | | | | | | | | | | | | | | | | | | | | | | | | | | | | | | | | |
Domestic: | | | | | | | | | | | | | | | | | | | | | | | | | | | | | | | | | | | | | | | | |
Japanese government bonds | | ¥ | 209,708 | | | | 1.11 | % | | ¥ | 4,476,091 | | | | 0.67 | % | | ¥ | 171,297 | | | | 1.35 | % | | ¥ | — | | | | — | | | ¥ | 4,857,096 | | | | 0.71 | % |
Japanese municipal bonds | | | 16,794 | | | | 0.84 | % | | | 160,938 | | | | 1.00 | % | | | — | | | | — | | | | — | | | | — | | | | 177,732 | | | | 0.99 | % |
Japanese corporate bonds | | | 82,217 | | | | 1.22 | % | | | 148,705 | | | | 1.30 | % | | | 11,518 | | | | 1.50 | % | | | — | | | | — | | | | 242,440 | | | | 1.28 | % |
Other debt instruments | | | — | | | | — | | | | — | | | | — | | | | — | | | | — | | | | — | | | | — | | | | — | | | | — | |
| | | | | | | | | | | | | | | | | | | | | | | | | | | | | | | | | | | | | | | | |
Total domestic | | | 308,719 | | | | 1.13 | % | | | 4,785,734 | | | | 0.70 | % | | | 182,815 | | | | 1.36 | % | | | — | | | | — | | | | 5,277,268 | | | | 0.74 | % |
| | | | | | | | | | | | | | | | | | | | | | | | | | | | | | | | | | | | | | | | |
Foreign: | | | | | | | | | | | | | | | | | | | | | | | | | | | | | | | | | | | | | | | | |
U.S. Treasury government and other U.S. government agencies bonds | | | — | | | | — | | | | — | | | | — | | | | — | | | | — | | | | — | | | | — | | | | — | | | | — | |
Other governments and official institutions bonds | | | — | | | | — | | | | — | | | | — | | | | — | | | | — | | | | — | | | | — | | | | — | | | | — | |
Other debt instruments | | | — | | | | — | | | | — | | | | — | | | | — | | | | — | | | | — | | | | — | | | | — | | | | — | |
| | | | | | | | | | | | | | | | | | | | | | | | | | | | | | | | | | | | | | | | |
Total foreign | | | — | | | | — | | | | — | | | | — | | | | — | | | | — | | | | — | | | | — | | | | — | | | | — | |
| | | | | | | | | | | | | | | | | | | | | | | | | | | | | | | | | | | | | | | | |
Total | | ¥ | 308,719 | | | | 1.13 | % | | ¥ | 4,785,734 | | | | 0.70 | % | | ¥ | 182,815 | | | | 1.36 | % | | ¥ | — | | | | — | | | ¥ | 5,277,268 | | | | 0.74 | % |
| | | | | | | | | | | | | | | | | | | | | | | | | | | | | | | | | | | | | | | | |
Available-for-sale financial assets: | | | | | | | | | | | | | | | | | | | | | | | | | | | | | | | | | | | | | | | | |
Domestic: | | | | | | | | | | | | | | | | | | | | | | | | | | | | | | | | | | | | | | | | |
Japanese government bonds | | ¥ | 7,132,934 | | | | 0.13 | % | | ¥ | 14,873,380 | | | | 0.24 | % | | ¥ | 523,979 | | | | 0.71 | % | | ¥ | — | | | | — | | | ¥ | 22,530,293 | | | | 0.22 | % |
Japanese municipal bonds | | | 41,296 | | | | 0.96 | % | | | 241,785 | | | | 0.58 | % | | | 14,687 | | | | 0.69 | % | | | 47 | | | | 1.96 | % | | | 297,815 | | | | 0.64 | % |
Japanese corporate bonds | | | 63,888 | | | | 0.82 | % | | | 280,815 | | | | 0.67 | % | | | 37,260 | | | | 2.45 | % | | | — | | | | — | | | | 381,963 | | | | 0.86 | % |
Other debt instruments | | | 117,045 | | | | 0.00 | % | | | — | | | | — | | | | — | | | | — | | | | — | | | | — | | | | 117,045 | | | | 0.00 | % |
| | | | | | | | | | | | | | | | | | | | | | | | | | | | | | | | | | | | | | | | |
Total domestic | | | 7,355,163 | | | | 0.14 | % | | | 15,395,980 | | | | 0.25 | % | | | 575,926 | | | | 0.83 | % | | | 47 | | | | 1.96 | % | | | 23,327,116 | | | | 0.23 | % |
| | | | | | | | | | | | | | | | | | | | | | | | | | | | | | | | | | | | | | | | |
Foreign: | | | | | | | | | | | | | | | | | | | | | | | | | | | | | | | | | | | | | | | | |
U.S. Treasury and other U.S. government agencies bonds | | | 30,318 | | | | 0.00 | % | | | 4,188,659 | | | | 0.60 | % | | | 185,792 | | | | 1.94 | % | | | — | | | | — | | | | 4,404,769 | | | | 0.65 | % |
Other governments and official institutions bonds | | | 359,283 | | | | 1.73 | % | | | 178,508 | | | | 3.13 | % | | | 384 | | | | 3.22 | % | | | — | | | | — | | | | 538,175 | | | | 2.19 | % |
Mortgage-backed securities | | | — | | | | — | | | | 192 | | | | 0.00 | % | | | — | | | | — | | | | 330,879 | | | | 3.32 | % | | | 331,071 | | | | 3.31 | % |
Other debt instruments | | | 67,948 | | | | 1.11 | % | | | 180,128 | | | | 2.32 | % | | | 8,723 | | | | 4.30 | % | | | — | | | | — | | | | 256,799 | | | | 2.06 | % |
| | | | | | | | | | | | | | | | | | | | | | | | | | | | | | | | | | | | | | | | |
Total foreign | | | 457,549 | | | | 1.52 | % | | | 4,547,487 | | | | 0.77 | % | | | 194,899 | | | | 2.04 | % | | | 330,879 | | | | 3.32 | % | | | 5,530,814 | | | | 1.03 | % |
| | | | | | | | | | | | | | | | | | | | | | | | | | | | | | | | | | | | | | | | |
Total | | ¥ | 7,812,712 | | | | 0.22 | % | | ¥ | 19,943,467 | | | | 0.37 | % | | ¥ | 770,825 | | | | 1.14 | % | | ¥ | 330,926 | | | | 3.32 | % | | ¥ | 28,857,930 | | | | 0.38 | % |
| | | | | | | | | | | | | | | | | | | | | | | | | | | | | | | | | | | | | | | | |
Excluding U.S. Treasury and other U.S. government agencies bonds and Japanese government bonds, there are no investments in any individual issuers held in the SMFG Group’s investment portfolio which exceeded 10% of shareholders’ equity in the consolidated statement of financial position at March 31, 2012.
A-5
The following table shows our outstanding loans and advances by the domicile and industry type of the borrowers at March 31, 2012, 2011, 2010, 2009 and 2008. The classification of loans and advances by industry is based on the industry segment loan classification as defined by the Bank of Japan for regulatory reporting purposes.
| | | | | | | | | | | | | | | | | | | | |
| | | At March 31, | |
| | | 2012 | | | 2011 | | | 2010 | | | 2009 | | | 2008 | |
| | | (In millions) | |
Domestic: | | | | | | | | | | | | | | | | | | | | |
Manufacturing | | ¥ | 8,462,004 | | | ¥ | 8,344,261 | | | ¥ | 8,428,854 | | | ¥ | 8,836,291 | | | ¥ | 7,555,462 | |
Agriculture, forestry, fisheries and mining | | | 152,128 | | | | 162,727 | | | | 162,879 | | | | 163,647 | | | | 259,803 | |
Construction | | | 1,284,882 | | | | 1,327,475 | | | | 1,492,690 | | | | 1,716,567 | | | | 1,815,201 | |
Transportation, communications and public enterprises | | | 4,414,102 | | | | 4,036,780 | | | | 3,519,279 | | | | 3,606,748 | | | | 3,244,752 | |
Wholesale and retail | | | 5,480,393 | | | | 5,616,084 | | | | 5,552,637 | | | | 6,201,520 | | | | 6,350,694 | |
Finance and insurance | | | 2,170,776 | | | | 2,568,670 | | | | 3,431,882 | | | | 3,613,653 | | | | 3,582,845 | |
Real estate and goods rental and leasing | | | 7,982,741 | | | | 8,281,048 | | | | 8,751,450 | | | | 9,264,523 | | | | 9,393,149 | |
Services | | | 4,076,818 | | | | 4,316,724 | | | | 4,644,737 | | | | 4,947,995 | | | | 5,141,719 | |
Municipalities | | | 1,234,355 | | | | 1,440,167 | | | | 1,346,611 | | | | 1,274,196 | | | | 1,086,548 | |
Lease financing | | | 2,056,972 | | | | 2,205,451 | | | | 2,320,651 | | | | 2,562,727 | | | | 2,658,423 | |
Consumer(1) | | | 19,185,574 | | | | 18,552,987 | | | | 17,544,284 | | | | 16,377,870 | | | | 15,733,316 | |
Others | | | 4,155,960 | | | | 4,378,791 | | | | 5,137,721 | | | | 5,446,206 | | | | 5,077,704 | |
| | | | | | | | | | | | | | | | | | | | |
Total domestic | | | 60,656,705 | | | | 61,231,165 | | | | 62,333,675 | | | | 64,011,943 | | | | 61,899,616 | |
| | | | | | | | | | | | | | | | | | | | |
Foreign: | | | | | | | | | | | | | | | | | | | | |
Public sector | | | 130,426 | | | | 83,109 | | | | 147,115 | | | | 82,598 | | | | 115,942 | |
Financial institutions | | | 2,012,751 | | | | 1,794,794 | | | | 2,031,812 | | | | 1,812,218 | | | | 1,897,715 | |
Commerce and industry | | | 10,364,685 | | | | 8,949,629 | | | | 8,161,198 | | | | 9,282,120 | | | | 8,283,544 | |
Lease financing | | | 191,966 | | | | 172,361 | | | | 205,547 | | | | 239,728 | | | | 227,508 | |
Others | | | 706,175 | | | | 528,847 | | | | 442,225 | | | | 1,017,223 | | | | 830,568 | |
| | | | | | | | | | | | | | | | | | | | |
Total foreign | | | 13,406,003 | | | | 11,528,740 | | | | 10,987,897 | | | | 12,433,887 | | | | 11,355,277 | |
| | | | | | | | | | | | | | | | | | | | |
Gross loans and advances | | | 74,062,708 | | | | 72,759,905 | | | | 73,321,572 | | | | 76,445,830 | | | | 73,254,893 | |
Adjust: Unearned income, unamortized premiums-net and deferred loan fees-net | | | (144,731 | ) | | | (152,443 | ) | | | (153,889 | ) | | | (176,906 | ) | | | (176,387 | ) |
Less: Allowance for loan losses | | | (1,381,164 | ) | | | (1,587,133 | ) | | | (1,533,555 | ) | | | (1,599,630 | ) | | | (1,094,226 | ) |
| | | | | | | | | | | | | | | | | | | | |
Net loans and advances | | ¥ | 72,536,813 | | | ¥ | 71,020,329 | | | ¥ | 71,634,128 | | | ¥ | 74,669,294 | | | ¥ | 71,984,280 | |
| | | | | | | | | | | | | | | | | | | | |
| (1) | The balance in Consumer mainly consists of housing loans. The housing loan balances amounted to ¥14,574,702 million, ¥14,577,945 million, ¥14,436,921 million, ¥13,577,902 million and ¥13,067,503 million at March 31, 2012, 2011, 2010, 2009 and 2008, respectively. |
A-6
Maturities and Sensitivities of Loans and Advances to Changes in Interest Rates
The following table shows the maturities of loans and advances by the domicile and industry type of the borrower at March 31, 2012.
| | | | | | | | | | | | | | | | |
| | | Maturity | |
| | | Not later than one
year | | | Later than one
year and not later
than five years | | | Later than five
years | | | Total | |
| | | (In millions) | |
Domestic: | | | | | | | | | | | | | | | | |
Manufacturing | | ¥ | 5,043,885 | | | ¥ | 2,732,427 | | | ¥ | 685,692 | | | �� | 8,462,004 | |
Agriculture, forestry, fisheries and mining | | | 88,073 | | | | 30,401 | | | | 33,654 | | | | 152,128 | |
Construction | | | 740,152 | | | | 389,024 | | | | 155,706 | | | | 1,284,882 | |
Transportation, communications and public enterprises | | | 1,375,711 | | | | 2,024,705 | | | | 1,013,686 | | | | 4,414,102 | |
Wholesale and retail | | | 3,381,405 | | | | 1,619,893 | | | | 479,095 | | | | 5,480,393 | |
Finance and insurance | | | 1,402,920 | | | | 597,053 | | | | 170,803 | | | | 2,170,776 | |
Real estate and goods rental and leasing | | | 2,364,743 | | | | 3,924,607 | | | | 1,693,391 | | | | 7,982,741 | |
Services | | | 1,461,652 | | | | 1,598,479 | | | | 1,016,687 | | | | 4,076,818 | |
Municipalities | | | 194,868 | | | | 566,970 | | | | 472,517 | | | | 1,234,355 | |
Lease financing | | | 704,220 | | | | 1,191,262 | | | | 161,490 | | | | 2,056,972 | |
Consumer | | | 3,309,881 | | | | 4,087,433 | | | | 11,788,260 | | | | 19,185,574 | |
Others | | | 938,112 | | | | 1,005,596 | | | | 2,212,252 | | | | 4,155,960 | |
| | | | | | | | | | | | | | | | |
Total domestic | | | 21,005,622 | | | | 19,767,850 | | | | 19,883,233 | | | | 60,656,705 | |
| | | | | | | | | | | | | | | | |
Foreign: | | | | | | | | | | | | | | | | |
Public sector | | | 14,980 | | | | 41,315 | | | | 74,131 | | | | 130,426 | |
Financial institutions | | | 918,048 | | | | 780,674 | | | | 314,029 | | | | 2,012,751 | |
Commerce and industry | | | 3,409,756 | | | | 4,676,659 | | | | 2,278,270 | | | | 10,364,685 | |
Lease financing | | | 21,306 | | | | 87,971 | | | | 82,689 | | | | 191,966 | |
Others | | | 277,491 | | | | 334,184 | | | | 94,500 | | | | 706,175 | |
| | | | | | | | | | | | | | | | |
Total foreign | | | 4,641,581 | | | | 5,920,803 | | | | 2,843,619 | | | | 13,406,003 | |
| | | | | | | | | | | | | | | | |
Total | | ¥ | 25,647,203 | | | ¥ | 25,688,653 | | | ¥ | 22,726,852 | | | ¥ | 74,062,708 | |
| | | | | | | | | | | | | | | | |
The above loans and advances due after one year which had predetermined interest rates and floating or adjustable interest rates at March 31, 2012 are shown below:
| | | | | | | | | | | | |
| | | Domestic | | | Foreign | | | Total | |
| | | (In millions) | |
Predetermined rate | | ¥ | 11,948,165 | | | ¥ | 862,880 | | | ¥ | 12,811,045 | |
Floating or adjustable rate | | | 27,702,918 | | | | 7,901,542 | | | | 35,604,460 | |
| | | | | | | | | | | | |
Total | | ¥ | 39,651,083 | | | ¥ | 8,764,422 | | | ¥ | 48,415,505 | |
| | | | | | | | | | | | |
Impaired Loans and Advances
The SMFG Group’s credit risk elements analyzed by categories for loans and advances differ from those required by the U.S. Securities and Exchange Commission. The SMFG Group’s impaired loans and advances are comprised of “potentially bankrupt, effectively bankrupt and bankrupt (loans and advances),” “past due three months or more (loans),” “restructured (loans)” and “other impaired (loans and advances).” “Potentially bankrupt, effectively bankrupt and bankrupt (loans and advances)” comprises of loans and advances to the borrowers that are perceived to have a high risk of falling into bankruptcy, may not have been legally or formally
A-7
declared bankrupt but are essentially bankrupt, or have been legally or formally declared bankrupt. Loans classified as “past due three months or more (loans)” represent those loans that are three months or more past due as to principal or interest, other than those loans to borrowers who are potentially bankrupt, effectively bankrupt and bankrupt. The category “restructured (loans)” comprises of loans not included above for which the terms of the loans have been modified to grant concessions because of problems with the borrower. “Other impaired (loans and advances)” represent impaired loans and advances, which are not included in “potentially bankrupt, effectively bankrupt and bankrupt (loans and advances),” “past due three months or more (loans),” or “restructured (loans),” but for which information about credit problems cause management to classify them as impaired loans and advances. All loans and advances for which management has serious doubts about the ability of the borrowers to comply in the near future with the repayment terms are included in impaired loans and advances.
An allowance is recorded if there is objective evidence of impairment and the carrying value of the loans and advances exceeds the present value of their estimated future cash flows discounted at the original effective interest rate. Cash receipts on impaired loans and advances are recorded as a credit to the balance of loans and advances on the statement of financial position. To the extent that cash receipts are different from expectations built into the calculation of the recoverable amount of the loans and advances, the amount of allowance for loan losses is revised. In accordance with IFRS, the accrual of interest as per the contractual terms is discontinued when loans and advances are determined to be impaired. Interest income recognized in the consolidated income statement on impaired loans and advances represents the accretion of the net present value of the written down amount due to the passage of time based on the original effective interest rate of the loans and advances.
A-8
The following table shows the distribution of impaired loans and advances by “potentially bankrupt, effectively bankrupt and bankrupt (loans and advances),” “past due three months or more (loans),” “restructured (loans),” and “other impaired (loans and advances)” at March 31, 2012, 2011, 2010, 2009 and 2008 by the domicile and industry type of the borrowers.
| | | | | | | | | | | | | | | | | | | | |
| | | At March 31, | |
| | | 2012 | | | 2011 | | | 2010 | | | 2009 | | | 2008 | |
| | | (In millions) | |
Potentially bankrupt, effectively bankrupt and bankrupt (loans and advances): | | | | | | | | | | | | | | | | | | | | |
Domestic: | | | | | | | | | | | | | | | | | | | | |
Manufacturing | | ¥ | 187,982 | | | ¥ | 211,597 | | | ¥ | 180,642 | | | ¥ | 164,736 | | | ¥ | 92,741 | |
Agriculture, forestry, fisheries and mining | | | 5,295 | | | | 6,635 | | | | 7,014 | | | | 4,842 | | | | 1,424 | |
Construction | | | 118,413 | | | | 120,696 | | | | 125,674 | | | | 141,581 | | | | 88,436 | |
Transportation, communications and public enterprises | | | 68,768 | | | | 59,775 | | | | 78,726 | | | | 64,451 | | | | 62,950 | |
Wholesale and retail | | | 225,399 | | | | 243,346 | | | | 233,124 | | | | 217,549 | | | | 181,170 | |
Finance and insurance | | | 13,350 | | | | 11,496 | | | | 30,287 | | | | 53,776 | | | | 21,823 | |
Real estate and goods rental and leasing | | | 499,485 | | | | 534,596 | | | | 622,944 | | | | 566,916 | | | | 188,899 | |
Services | | | 213,142 | | | | 249,093 | | | | 260,917 | | | | 227,103 | | | | 200,822 | |
Lease financing | | | 10,742 | | | | 27,716 | | | | 52,648 | | | | 45,379 | | | | 31,753 | |
Consumer | | | 312,181 | | | | 297,732 | | | | 242,106 | | | | 214,620 | | | | 193,801 | |
Others | | | 67,174 | | | | 55,909 | | | | 62,351 | | | | 61,663 | | | | 49,464 | |
| | | | | | | | | | | | | | | | | | | | |
Total domestic | | | 1,721,931 | | | | 1,818,591 | | | | 1,896,433 | | | | 1,762,616 | | | | 1,113,283 | |
| | | | | | | | | | | | | | | | | | | | |
Foreign: | | | | | | | | | | | | | | | | | | | | |
Public sector | | | 14 | | | | 14 | | | | 4,564 | | | | 13 | | | | 13 | |
Financial institutions | | | 19,383 | | | | 42,350 | | | | 36,381 | | | | 64,827 | | | | 34,291 | |
Commerce and industry | | | 162,509 | | | | 128,534 | | | | 135,958 | | | | 165,772 | | | | 26,065 | |
Lease financing | | | 4,140 | | | | 5,037 | | | | 33 | | | | 3,151 | | | | 6,693 | |
Others | | | 3,019 | | | | 3,831 | | | | 15,901 | | | | 6,617 | | | | 5,564 | |
| | | | | | | | | | | | | | | | | | | | |
Total foreign | | | 189,065 | | | | 179,766 | | | | 192,837 | | | | 240,380 | | | | 72,626 | |
| | | | | | | | | | | | | | | | | | | | |
Total | | | 1,910,996 | | | | 1,998,357 | | | | 2,089,270 | | | | 2,002,996 | | | | 1,185,909 | |
| | | | | | | | | | | | | | | | | | | | |
Past due three months or more (loans): | | | | | | | | | | | | | | | | | | | | |
Domestic | | | 32,069 | | | | 40,699 | | | | 28,434 | | | | 31,012 | | | | 36,646 | |
Foreign | | | 1,130 | | | | 1,336 | | | | 635 | | | | 11,045 | | | | 1,139 | |
| | | | | | | | | | | | | | | | | | | | |
Total | | | 33,199 | | | | 42,035 | | | | 29,069 | | | | 42,057 | | | | 37,785 | |
| | | | | | | | | | | | | | | | | | | | |
Restructured (loans): | | | | | | | | | | | | | | | | | | | | |
Domestic | | | 390,060 | | | | 296,751 | | | | 127,392 | | | | 160,658 | | | | 259,525 | |
Foreign | | | 24,644 | | | | 59,296 | | | | 37,007 | | | | 7,940 | | | | 32,923 | |
| | | | | | | | | | | | | | | | | | | | |
Total | | | 414,704 | | | | 356,047 | | | | 164,399 | | | | 168,598 | | | | 292,448 | |
| | | | | | | | | | | | | | | | | | | | |
Other impaired (loans and advances): | | | | | | | | | | | | | | | | | | | | |
Domestic | | | 255,615 | | | | 252,457 | | | | 158,653 | | | | 121,971 | | | | 181,835 | |
Foreign | | | 2,588 | | | | 527 | | | | 1,760 | | | | 6,069 | | | | 5,667 | |
| | | | | | | | | | | | | | | | | | | | |
Total | | | 258,203 | | | | 252,984 | | | | 160,413 | | | | 128,040 | | | | 187,502 | |
| | | | | | | | | | | | | | | | | | | | |
Gross impaired loans and advances | | | 2,617,102 | | | | 2,649,423 | | | | 2,443,151 | | | | 2,341,691 | | | | 1,703,644 | |
| | | | | | | | | | | | | | | | | | | | |
Less: Allowance for loan losses | | | (1,234,299 | ) | | | (1,395,659 | ) | | | (1,282,610 | ) | | | (1,204,091 | ) | | | (936,510 | ) |
| | | | | | | | | | | | | | | | | | | | |
Net impaired loans and advances | | ¥ | 1,382,803 | | | ¥ | 1,253,764 | | | ¥ | 1,160,541 | | | ¥ | 1,137,600 | | | ¥ | 767,134 | |
| | | | | | | | | | | | | | | | | | | | |
A-9
Interest Foregone on Impaired Loans and Advances
Interest income which would have been accrued at the original terms on domestic impaired loans and advances during the fiscal year ended March 31, 2012 was ¥49 billion, of which ¥24 billion was included in profit or loss for the fiscal year then ended. Interest income which would have been accrued at the original terms on foreign impaired loans and advances during the fiscal year ended March 31, 2012 was ¥6 billion, of which ¥5 billion was included in profit or loss for the fiscal year then ended.
Cross-border Outstanding
Cross-border outstandings are defined as loans, acceptances, interest-earning deposits with other banks, other interest-earning investments and any other monetary assets denominated in Japanese yen or other non-local currencies. Local currency outstandings are netted out from cross-border outstandings. This cross-border disclosure is based on the reports to the Bank of Japan required under Japanese foreign exchange-related laws. There were no cross-border outstandings to borrowers in any foreign country which in total exceeded 0.75% of consolidated total assets at March 31, 2012, 2011 and 2010.
Loan Concentrations
At March 31, 2012, there were no concentrations of loans and advances to a single industry group of borrowers, as defined by the Bank of Japan industry segment loan and advance classifications, which exceeded 10% of the SMFG Group’s consolidated total loans and advances, except for loans and advances in a category disclosed in the table of outstanding loans and advances above.
A-10
| IV. | Summary of Loan Loss Experience |
The following table shows an analysis of our loan loss experience by the borrowers’ domicile and industry type for the fiscal years ended March 31, 2012, 2011, 2010 and 2009.
| | | | | | | | | | | | | | | | |
| | | For the fiscal year ended March 31, | |
| | | 2012 | | | 2011 | | | 2010 | | | 2009 | |
| | | (In millions, except percentages) | |
Allowance for loan losses at beginning of period | | ¥ | 1,587,133 | | | ¥ | 1,533,555 | | | ¥ | 1,599,630 | | | ¥ | 1,094,226 | |
Provision for loan losses | | | 144,022 | | | | 259,292 | | | | 215,886 | | | | 849,495 | |
Charge-offs: | | | | | | | | | | | | | | | | |
Domestic: | | | | | | | | | | | | | | | | |
Manufacturing | | | 46,229 | | | | 27,355 | | | | 43,059 | | | | 26,405 | |
Agriculture, forestry, fisheries and mining | | | 173 | | | | 372 | | | | 713 | | | | 648 | |
Construction | | | 14,204 | | | | 12,190 | | | | 31,779 | | | | 40,185 | |
Transportation, communications and public enterprises | | | 11,296 | | | | 26,126 | | | | 24,999 | | | | 28,004 | |
Wholesale and retail | | | 64,492 | | | | 29,602 | | | | 73,299 | | | | 71,934 | |
Finance and insurance | | | 679 | | | | 172 | | | | 701 | | | | 8,717 | |
Real estate and goods rental and leasing | | | 61,683 | | | | 33,371 | | | | 53,930 | | | | 30,989 | |
Services | | | 35,498 | | | | 13,078 | | | | 66,826 | | | | 47,742 | |
Lease financing | | | 3,319 | | | | 1,364 | | | | 1,400 | | | | 3,664 | |
Consumer | | | 64,329 | | | | 29,481 | | | | 57,436 | | | | 47,255 | |
Others | | | 4,705 | | | | 2,606 | | | | 6,753 | | | | 598 | |
| | | | | | | | | | | | | | | | |
Total domestic | | | 306,607 | | | | 175,717 | | | | 360,895 | | | | 306,141 | |
| | | | | | | | | | | | | | | | |
Foreign: | | | | | | | | | | | | | | | | |
Public sector | | | — | | | | 600 | | | | — | | | | — | |
Financial institutions | | | 14,784 | | | | 9,332 | | | | 504 | | | | 13,667 | |
Commerce and industry | | | 33,173 | | | | 13,087 | | | | 23,095 | | | | 15,982 | |
Lease financing | | | 38 | | | | 15 | | | | 19 | | | | 50 | |
Others | | | 623 | | | | 1,010 | | | | 2 | | | | 1,034 | |
| | | | | | | | | | | | | | | | |
Total foreign | | | 48,618 | | | | 24,044 | | | | 23,620 | | | | 30,733 | |
| | | | | | | | | | | | | | | | |
Total | | | 355,225 | | | | 199,761 | | | | 384,515 | | | | 336,874 | |
| | | | | | | | | | | | | | | | |
Recoveries: | | | | | | | | | | | | | | | | |
Domestic: | | | | | | | | | | | | | | | | |
Manufacturing | | | 252 | | | | 195 | | | | 31 | | | | 6 | |
Agriculture, forestry, fisheries and mining | | | — | | | | 3 | | | | — | | | | — | |
Construction | | | 64 | | | | 64 | | | | 11 | | | | 4 | |
Transportation, communications and public enterprises | | | 52 | | | | 241 | | | | 7 | | | | 8 | |
Wholesale and retail | | | 328 | | | | 266 | | | | 27 | | | | 3 | |
Finance and insurance | | | 3 | | | | 1 | | | | — | | | | — | |
Real estate and goods rental and leasing | | | 283 | | | | 97 | | | | 11 | | | | 1 | |
Services | | | 142 | | | | 65 | | | | 26 | | | | 7 | |
Consumer | | | 3,453 | | | | 1,648 | | | | 836 | | | | 820 | |
Others | | | 18 | | | | 44 | | | | 4 | | | | 233 | |
| | | | | | | | | | | | | | | | |
Total domestic | | | 4,595 | | | | 2,624 | | | | 953 | | | | 1,082 | |
| | | | | | | | | | | | | | | | |
Foreign: | | | | | | | | | | | | | | | | |
Public sector | | | — | | | | 6 | | | | — | | | | — | |
Financial institutions | | | 3 | | | | — | | | | — | | | | 1 | |
Commerce and industry | | | 187 | | | | 117 | | | | 6 | | | | 5 | |
Others | | | 17 | | | | 67 | | | | 10 | | | | 9 | |
| | | | | | | | | | | | | | | | |
Total foreign | | | 207 | | | | 190 | | | | 16 | | | | 15 | |
| | | | | | | | | | | | | | | | |
Total | | | 4,802 | | | | 2,814 | | | | 969 | | | | 1,097 | |
| | | | | | | | | | | | | | | | |
Net charge-offs | | | 350,423 | | | | 196,947 | | | | 383,546 | | | | 335,777 | |
Others(1) | | | 432 | | | | (8,767 | ) | | | 101,585 | | | | (8,314 | ) |
| | | | | | | | | | | | | | | | |
Allowance for loan losses at end of period | | ¥ | 1,381,164 | | | ¥ | 1,587,133 | | | ¥ | 1,533,555 | | | ¥ | 1,599,630 | |
| | | | | | | | | | | | | | | | |
Allowance for loan losses applicable to foreign activities: | | | | | | | | | | | | | | | | |
Balance at beginning of period | | ¥ | 108,612 | | | ¥ | 121,797 | | | ¥ | 192,325 | | | ¥ | 92,248 | |
| | | | | | | | | | | | | | | | |
Balance at end of period | | ¥ | 87,344 | | | ¥ | 108,612 | | | ¥ | 121,797 | | | ¥ | 192,325 | |
| | | | | | | | | | | | | | | | |
Provision (credit) for loan losses | | ¥ | 30,675 | | | ¥ | 19,501 | | | ¥ | (42,830 | ) | | ¥ | 137,898 | |
| | | | | | | | | | | | | | | | |
Ratio of net charge-offs to average loans outstanding during the period | | | 0.47 | % | | | 0.27 | % | | | 0.51 | % | | | 0.45 | % |
| (1) | Others are primarily from foreign exchange translations for the fiscal years ended March 31, 2011 and 2009, whereas the amount for the fiscal year ended March 31, 2010 mainly includes an increase in the allowance for loan losses of ¥102,687 million from the acquisition of subsidiaries. |
A-11
Loan loss experience for the fiscal year ended March 31, 2008 is not available under IFRS. The trend observed by the SMFG Group showed a significant increase in the balance of provision for loan losses for the fiscal year ended March 31, 2009 compared to the fiscal year ended March 31, 2008. This increase was primarily due to a deterioration of the SMFG Group’s credit portfolio resulting from the rapid global economic downturn.
The following table shows an allocation of the allowance for loan losses by the borrower’s domicile and industry type at March 31, 2012, 2011, 2010, 2009 and 2008.
| | | | | | | | | | | | | | | | | | | | | | | | | | | | | | | | | | | | | | | | |
| | | At March 31, | |
| | | 2012 | | | 2011 | | | 2010 | | | 2009 | | | 2008 | |
| | | Amount | | | % of
loans in
each
category
to total
loans | | | Amount | | | % of
loans in
each
category
to total
loans | | | Amount | | | % of
loans in
each
category
to total
loans | | | Amount | | | % of
loans in
each
category
to total
loans | | | Amount | | | % of
loans in
each
category
to total
loans | |
| | | (In millions, except percentages) | |
Domestic: | | | | | | | | | | | | | | | | | | | | | | | | | | | | | | | | | | | | |
Manufacturing | | ¥ | 126,773 | | | | 11.43 | % | | ¥ | 178,030 | | | | 11.47 | % | | ¥ | 163,598 | | | | 11.50 | % | | ¥ | 155,886 | | | | 11.56 | % | | ¥ | 93,400 | | | | 10.31 | % |
Agriculture, forestry, fisheries and mining | | | 4,374 | | | | 0.21 | % | | | 4,499 | | | | 0.22 | % | | | 4,453 | | | | 0.22 | % | | | 2,621 | | | | 0.21 | % | | | 1,856 | | | | 0.35 | % |
Construction | | | 69,605 | | | | 1.73 | % | | | 87,514 | | | | 1.82 | % | | | 87,178 | | | | 2.04 | % | | | 104,320 | | | | 2.25 | % | | | 86,874 | | | | 2.48 | % |
Transportation, communications and public enterprises | | | 47,723 | | | | 5.96 | % | | | 52,832 | | | | 5.55 | % | | | 82,113 | | | | 4.80 | % | | | 88,272 | | | | 4.72 | % | | | 54,836 | | | | 4.43 | % |
Wholesale and retail | | | 159,740 | | | | 7.40 | % | | | 197,995 | | | | 7.72 | % | | | 179,494 | | | | 7.58 | % | | | 203,240 | | | | 8.11 | % | | | 160,265 | | | | 8.67 | % |
Finance and insurance | | | 14,045 | | | | 2.93 | % | | | 15,418 | | | | 3.53 | % | | | 18,231 | | | | 4.68 | % | | | 36,596 | | | | 4.73 | % | | | 21,444 | | | | 4.89 | % |
Real estate and goods rental and leasing | | | 338,162 | | | | 10.78 | % | | | 385,889 | | | | 11.38 | % | | | 386,706 | | | | 11.94 | % | | | 301,135 | | | | 12.12 | % | | | 144,984 | | | | 12.82 | % |
Services | | | 144,984 | | | | 5.50 | % | | | 176,388 | | | | 5.93 | % | | | 172,037 | | | | 6.33 | % | | | 197,215 | | | | 6.47 | % | | | 166,214 | | | | 7.02 | % |
Municipalities | | | 2 | | | | 1.67 | % | | | 3 | | | | 1.98 | % | | | 182 | | | | 1.84 | % | | | 252 | | | | 1.67 | % | | | 141 | | | | 1.48 | % |
Lease financing | | | 11,942 | | | | 2.78 | % | | | 25,071 | | | | 3.03 | % | | | 49,596 | | | | 3.17 | % | | | 47,938 | | | | 3.35 | % | | | 30,239 | | | | 3.63 | % |
Consumer | | | 315,211 | | | | 25.90 | % | | | 290,468 | | | | 25.50 | % | | | 214,224 | | | | 23.93 | % | | | 196,729 | | | | 21.42 | % | | | 172,242 | | | | 21.48 | % |
Others | | | 61,259 | | | | 5.61 | % | | | 64,414 | | | | 6.02 | % | | | 53,946 | | | | 6.98 | % | | | 73,101 | | | | 7.13 | % | | | 69,483 | | | | 6.94 | % |
| | | | | | | | | | | | | | | | | | | | | | | | | | | | | | | | | | | | | | | | |
Total domestic | | | 1,293,820 | | | | 81.90 | % | | | 1,478,521 | | | | 84.15 | % | | | 1,411,758 | | | | 85.01 | % | | | 1,407,305 | | | | 83.74 | % | | | 1,001,978 | | | | 84.50 | % |
| | | | | | | | | | | | | | | | | | | | | | | | | | | | | | | | | | | | | | | | |
Foreign: | | | | | | | | | | | | | | | | | | | | | | | | | | | | | | | | | | | | | | | | |
Public sector | | | 568 | | | | 0.18 | % | | | 135 | | | | 0.11 | % | | | 84 | | | | 0.20 | % | | | 103 | | | | 0.11 | % | | | 225 | | | | 0.16 | % |
Financial institutions | | | 15,217 | | | | 2.72 | % | | | 34,926 | | | | 2.47 | % | | | 45,805 | | | | 2.77 | % | | | 45,375 | | | | 2.37 | % | | | 38,307 | | | | 2.59 | % |
Commerce and industry | | | 64,014 | | | | 13.99 | % | | | 67,805 | | | | 12.30 | % | | | 69,043 | | | | 11.13 | % | | | 139,572 | | | | 12.14 | % | | | 46,640 | | | | 11.31 | % |
Lease financing | | | 4,324 | | | | 0.26 | % | | | 2,905 | | | | 0.24 | % | | | 3,098 | | | | 0.28 | % | | | 3,321 | | | | 0.31 | % | | | 2,328 | | | | 0.31 | % |
Others | | | 3,221 | | | | 0.95 | % | | | 2,841 | | | | 0.73 | % | | | 3,767 | | | | 0.61 | % | | | 3,954 | | | | 1.33 | % | | | 4,748 | | | | 1.13 | % |
| | | | | | | | | | | | | | | | | | | | | | | | | | | | | | | | | | | | | | | | |
Total foreign | | | 87,344 | | | | 18.10 | % | | | 108,612 | | | | 15.85 | % | | | 121,797 | | | | 14.99 | % | | | 192,325 | | | | 16.26 | % | | | 92,248 | | | | 15.50 | % |
| | | | | | | | | | | | | | | | | | | | | | | | | | | | | | | | | | | | | | | | |
Total | | ¥ | 1,381,164 | | | | 100.00 | % | | ¥ | 1,587,133 | | | | 100.00 | % | | ¥ | 1,533,555 | | | | 100.00 | % | | ¥ | 1,599,630 | | | | 100.00 | % | | ¥ | 1,094,226 | | | | 100.00 | % |
| | | | | | | | | | | | | | | | | | | | | | | | | | | | | | | | | | | | | | | | |
A-12
The following table shows the average amount of, and the average rate paid on, the following deposit categories for the fiscal years ended March 31, 2012, 2011 and 2010.
| | | | | | | | | | | | | | | | | | | | | | | | |
| | | For the fiscal year ended March 31, | |
| | | 2012 | | | 2011 | | | 2010 | |
| | | Average
amount | | | Average
rate | | | Average
amount | | | Average
rate | | | Average
amount | | | Average
rate | |
| | | (In millions, except percentages) | |
Domestic offices: | | | | | | | | | | | | | | | | | | | | | | | | |
Non-interest-bearing demand deposits | | ¥ | 11,676,103 | | | | — | | | ¥ | 10,193,114 | | | | — | | | ¥ | 10,282,862 | | | | — | |
Interest-bearing demand deposits | | | 32,822,329 | | | | 0.02 | % | | | 31,264,556 | | | | 0.03 | % | | | 29,884,845 | | | | 0.04 | % |
Deposits at notice | | | 925,210 | | | | 0.02 | % | | | 963,722 | | | | 0.01 | % | | | 916,101 | | | | 0.05 | % |
Time deposits | | | 25,499,940 | | | | 0.14 | % | | | 25,373,367 | | | | 0.20 | % | | | 24,105,635 | | | | 0.33 | % |
Negotiable certificates of deposit | | | 6,552,965 | | | | 0.15 | % | | | 7,144,913 | | | | 0.17 | % | | | 6,939,708 | | | | 0.26 | % |
Others | | | 3,530,910 | | | | 0.27 | % | | | 3,166,378 | | | | 0.20 | % | | | 3,304,221 | | | | 0.23 | % |
| | | | | | | | | | | | | | | | | | | | | | | | |
Total domestic offices | | | 81,007,457 | | | | | | | | 78,106,050 | | | | | | | | 75,433,372 | | | | | |
| | | | | | | | | | | | | | | | | | | | | | | | |
Foreign offices: | | | | | | | | | | | | | | | | | | | | | | | | |
Non-interest-bearing deposits | | | 429,486 | | | | — | | | | 311,132 | | | | — | | | | 256,091 | | | | — | |
Interest-bearing deposits | | | 6,849,041 | | | | 0.67 | % | | | 6,334,358 | | | | 0.59 | % | | | 7,104,994 | | | | 0.55 | % |
Negotiable certificates of deposit | | | 2,970,769 | | | | 0.73 | % | | | 2,016,689 | | | | 0.93 | % | | | 1,811,254 | | | | 0.85 | % |
| | | | | | | | | | | | | | | | | | | | | | | | |
Total foreign offices | | | 10,249,296 | | | | | | | | 8,662,179 | | | | | | | | 9,172,339 | | | | | |
| | | | | | | | | | | | | | | | | | | | | | | | |
Total | | ¥ | 91,256,753 | | | | | | | ¥ | 86,768,229 | | | | | | | ¥ | 84,605,711 | | | | | |
| | | | | | | | | | | | | | | | | | | | | | | | |
Deposits at notice represent interest-bearing demand deposits which require the depositor to give two or more days notice in advance of withdrawal.
The total amount of deposits by foreign depositors included in domestic offices for the fiscal years ended March 31, 2012, 2011 and 2010 were ¥914,298 million, ¥914,460 million and ¥1,008,387 million, respectively.
At March 31, 2012, the balances and remaining maturities of time deposits and negotiable certificates of deposit issued by domestic offices in amounts of ¥10 million (approximately $121,758 at the median exchange rate for buying and selling spot dollars for yen by telegraphic transfer as determined by the Bank at the end of the current fiscal year) or more and total foreign deposits issued in amounts of $100,000 or more are shown in the following table.
| | | | | | | | | | | | |
| | | Time deposits | | | Negotiable
certificates of
deposit | | | Total | |
| | | (In millions) | |
Domestic offices: | | | | | | | | | | | | |
Not later than three months | | ¥ | 3,154,544 | | | ¥ | 3,991,104 | | | ¥ | 7,145,648 | |
Later than three months and not later than six months | | | 2,225,045 | | | | 793,833 | | | | 3,018,878 | |
Later than six months and not later than one year | | | 5,412,583 | | | | 498,652 | | | | 5,911,235 | |
Later than one year | | | 2,168,571 | | | | 43,900 | | | | 2,212,471 | |
| | | | | | | | | | | | |
Total | | ¥ | 12,960,743 | | | ¥ | 5,327,489 | | | ¥ | 18,288,232 | |
| | | | | | | | | | | | |
Foreign offices | | ¥ | 1,732,684 | | | ¥ | 3,266,121 | | | ¥ | 4,998,805 | |
| | | | | | | | | | | | |
A-13
| VI. | Return on Equity and Assets |
The following table shows the ratio of return on equity and assets for the fiscal years ended March 31, 2012, 2011 and 2010.
| | | | | | | | | | | | |
| | | For the fiscal year ended March 31, | |
| | | 2012 | | | 2011 | | | 2010 | |
Return on average total assets | | | 0.3 | % | | | 0.4 | % | | | 0.4 | % |
Return on average shareholders’ equity | | | 6.6 | % | | | 8.4 | % | | | 15.1 | % |
Dividends payout ratio(1): | | | | | | | | | | | | |
Basic | | | 40.2 | % | | | 32.0 | % | | | 12.7 | % |
Diluted | | | 40.3 | % | | | 32.0 | % | | | 13.5 | % |
Average shareholders’ equity to average total assets | | | 3.9 | % | | | 4.3 | % | | | 2.8 | % |
| (1) | Dividends declared per common share as a percentage of net profit per share. |
| VII. | Short-Term Borrowings |
The following table shows certain additional information with respect to our short-term borrowings for the fiscal years ended March 31, 2012, 2011 and 2010.
| | | | | | | | | | | | |
| | | For the fiscal year ended March 31, | |
| | | 2012 | | | 2011 | | | 2010 | |
| | | (In millions, except percentages) | |
Call money, and payables under repurchase agreements and securities lending transactions: | | | | | | | | | | | | |
Average balance outstanding during the period | | ¥ | 7,370,875 | | | ¥ | 7,625,222 | | | ¥ | 6,903,011 | |
Maximum balance outstanding at any month-end during the period | | | 9,632,233 | | | | 9,212,189 | | | | 8,479,285 | |
Balance at end of period | | | 9,632,233 | | | | 9,069,005 | | | | 7,557,007 | |
Weighted average interest rate during the period | | | 0.19 | % | | | 0.20 | % | | | 0.20 | % |
Weighted average interest rate on balance at end of period | | | 0.19 | % | | | 0.21 | % | | | 0.15 | % |
Commercial paper: | | | | | | | | | | | | |
Average balance outstanding during the period | | | 2,044,158 | | | | 1,934,738 | | | | 1,651,374 | |
Maximum balance outstanding at any month-end during the period | | | 2,743,664 | | | | 2,046,794 | | | | 1,927,229 | |
Balance at end of period | | | 2,743,664 | | | | 2,019,334 | | | | 1,885,640 | |
Weighted average interest rate during the period | | | 0.23 | % | | | 0.23 | % | | | 0.31 | % |
Weighted average interest rate on balance at end of period | | | 0.29 | % | | | 0.20 | % | | | 0.19 | % |
Short-term borrowings: | | | | | | | | | | | | |
Average balance outstanding during the period | | | 7,347,792 | | | | 5,245,423 | | | | 2,918,335 | |
Maximum balance outstanding at any month-end during the period | | | 8,037,680 | | | | 8,486,842 | | | | 3,759,006 | |
Balance at end of period | | | 6,392,554 | | | | 8,486,842 | | | | 3,759,006 | |
Weighted average interest rate during the period | | | 0.24 | % | | | 0.27 | % | | | 0.41 | % |
Weighted average interest rate on balance at end of period | | | 0.27 | % | | | 0.22 | % | | | 0.31 | % |
A-14
INDEX TO CONSOLIDATED FINANCIAL STATEMENTS
The following consolidated financial statements listed below and the reports thereon by its independent registered public accounting firm are filed as part of this annual report:
| | | | |
| | | Page | |
Reports of Independent Registered Public Accounting Firm | | | F-3 | |
Consolidated Financial Statements | | | | |
Consolidated Statement of Financial Position at March 31, 2012 and 2011 | | | F-5 | |
Consolidated Income Statement for the Fiscal Years Ended March 31, 2012, 2011 and 2010 | | | F-6 | |
Consolidated Statement of Comprehensive Income for the Fiscal Years Ended March 31, 2012, 2011 and 2010 | | | F-7 | |
Consolidated Statement of Changes in Equity for the Fiscal Years Ended March 31, 2012, 2011 and 2010 | | | F-8 | |
Consolidated Statement of Cash Flows for the Fiscal Years Ended March 31, 2012, 2011 and 2010 | | | F-9 | |
Notes to Consolidated Financial Statements | | | F-10 | |
1 General Information | | | F-10 | |
2 Summary of Significant Accounting Policies | | | F-10 | |
3 Critical Accounting Estimates and Judgments | | | F-29 | |
4 Segment Analysis | | | F-32 | |
5 Cash and Deposits with Banks | | | F-40 | |
6 Trading Assets | | | F-40 | |
7 Derivative Financial Instruments | | | F-40 | |
8 Financial Assets at Fair Value Through Profit or Loss | | | F-43 | |
9 Investment Securities | | | F-44 | |
10 Loans and Advances | | | F-45 | |
11 Investments in Associates and Joint Ventures | | | F-47 | |
12 Property, Plant and Equipment | | | F-49 | |
13 Leases | | | F-50 | |
14 Intangible Assets | | | F-52 | |
15 Other Assets | | | F-56 | |
16 Deposits | | | F-56 | |
17 Trading Liabilities | | | F-56 | |
18 Borrowings | | | F-57 | |
19 Debt Securities in Issue | | | F-58 | |
20 Provisions | | | F-59 | |
21 Other Liabilities | | | F-60 | |
22 Deferred Income Tax | | | F-60 | |
23 Retirement Benefits | | | F-63 | |
24 Shareholders’ Equity | | | F-67 | |
25 Non-Controlling Interests | | | F-71 | |
26 Net Interest Income | | | F-73 | |
27 Net Fee and Commission Income | | | F-74 | |
28 Net Trading Income | | | F-74 | |
29 Net Income from Financial Assets at Fair Value Through Profit or Loss | | | F-75 | |
30 Net Investment Income | | | F-75 | |
31 Other Income | | | F-75 | |
32 Impairment Charges on Financial Assets | | | F-76 | |
33 General and Administrative Expenses | | | F-76 | |
34 Other Expenses | | | F-76 | |
35 Income Tax Expense | | | F-77 | |
F-1
F-2
Report of Independent Registered Public Accounting Firm
The Board of Directors and Shareholders
Sumitomo Mitsui Financial Group, Inc.:
We have audited the accompanying consolidated statement of financial position of Sumitomo Mitsui Financial Group, Inc. and subsidiaries (the “SMFG Group”) as of March 31, 2012 and 2011, and the related consolidated income statement and consolidated statements of comprehensive income, changes in equity and cash flows for each of the years in the three-year period ended March 31, 2012. These consolidated financial statements are the responsibility of the Company’s management. Our responsibility is to express an opinion on these consolidated financial statements based on our audits.
We conducted our audits in accordance with the standards of the Public Company Accounting Oversight Board (United States). Those standards require that we plan and perform the audit to obtain reasonable assurance about whether the financial statements are free of material misstatement. An audit includes examining, on a test basis, evidence supporting the amounts and disclosures in the financial statements. An audit also includes assessing the accounting principles used and significant estimates made by management, as well as evaluating the overall financial statement presentation. We believe that our audits provide a reasonable basis for our opinion.
In our opinion, the consolidated financial statements referred to above present fairly, in all material respects, the financial position of the SMFG Group as of March 31, 2012 and 2011, and the results of their operations and their cash flows for each of the years in the three-year period ended March 31, 2012, in conformity with International Financial Reporting Standards as issued by the International Accounting Standards Board.
We also have audited, in accordance with the standards of the Public Company Accounting Oversight Board (United States), Sumitomo Mitsui Financial Group, Inc.’s internal control over financial reporting as of March 31, 2012, based on criteria established in Internal Control—Integrated Framework issued by the Committee of Sponsoring Organizations of the Treadway Commission (COSO), and our report dated July 23, 2012 expressed an unqualified opinion on the effectiveness of the Company’s internal control over financial reporting.
/s/ KPMG AZSA LLC
Tokyo, Japan
July 23, 2012
F-3
Report of Independent Registered Public Accounting Firm
The Board of Directors and Shareholders
Sumitomo Mitsui Financial Group, Inc.:
We have audited Sumitomo Mitsui Financial Group, Inc.’s internal control over financial reporting as of March 31, 2012, based on criteria established in Internal Control—Integrated Framework issued by the Committee of Sponsoring Organizations of the Treadway Commission (COSO). The Company’s management is responsible for maintaining effective internal control over financial reporting and for its assessment of the effectiveness of internal control over financial reporting, included in the accompanying Management’s Annual Report on Internal Control over Financial Reporting, included in Item 15 “Controls and Procedures” of the accompanying Form 20-F. Our responsibility is to express an opinion on Sumitomo Mitsui Financial Group Inc.’s internal control over financial reporting based on our audit.
We conducted our audit in accordance with the standards of the Public Company Accounting Oversight Board (United States). Those standards require that we plan and perform the audit to obtain reasonable assurance about whether effective internal control over financial reporting was maintained in all material respects. Our audit included obtaining an understanding of internal control over financial reporting, assessing the risk that a material weakness exists, and testing and evaluating the design and operating effectiveness of internal control based on the assessed risk. Our audit also included performing such other procedures as we considered necessary in the circumstances. We believe that our audit provides a reasonable basis for our opinion.
A company’s internal control over financial reporting is a process designed to provide reasonable assurance regarding the reliability of financial reporting and the preparation of financial statements for external purposes in accordance with generally accepted accounting principles. A company’s internal control over financial reporting includes those policies and procedures that (1) pertain to the maintenance of records that, in reasonable detail, accurately and fairly reflect the transactions and dispositions of the assets of the company; (2) provide reasonable assurance that transactions are recorded as necessary to permit preparation of financial statements in accordance with generally accepted accounting principles, and that receipts and expenditures of the company are being made only in accordance with authorizations of management and directors of the company; and (3) provide reasonable assurance regarding prevention or timely detection of unauthorized acquisition, use, or disposition of the company’s assets that could have a material effect on the financial statements.
Because of its inherent limitations, internal control over financial reporting may not prevent or detect misstatements. Also, projections of any evaluation of effectiveness to future periods are subject to the risk that controls may become inadequate because of changes in conditions, or that the degree of compliance with the policies or procedures may deteriorate.
In our opinion, Sumitomo Mitsui Financial Group, Inc. maintained, in all material respects, effective internal control over financial reporting as of March 31, 2012, based on criteria established in Internal Control—Integrated Framework issued by the Committee of Sponsoring Organizations of the Treadway Commission.
We also have audited, in accordance with the standards of the Public Company Accounting Oversight Board (United States), the consolidated statement of financial position of Sumitomo Mitsui Financial Group, Inc. and subsidiaries as of March 31, 2012 and 2011, and the related consolidated income statement and consolidated statements of comprehensive income, changes in equity and cash flows for each of the years in the three-year period ended March 31, 2012, and our report dated July 23, 2012 expressed an unqualified opinion on those consolidated financial statements.
/s/ KPMG AZSA LLC
Tokyo, Japan
July 23, 2012
F-4
CONSOLIDATED FINANCIAL STATEMENTS
Consolidated Statement of Financial Position
| | | | | | | | | | |
| | | | | At March 31, | |
| | | Note | | 2012 | | | 2011 | |
| | | | | (In millions) | |
Assets: | | | | | | | | | | |
Cash and deposits with banks | | 5 | | ¥ | 8,050,562 | | | ¥ | 9,436,358 | |
Call loans and bills bought | | | | | 1,297,082 | | | | 862,667 | |
Reverse repurchase agreements and cash collateral on securities borrowed | | | | | 4,937,025 | | | | 5,051,053 | |
Trading assets | | 6 | | | 4,461,258 | | | | 3,315,153 | |
Derivative financial instruments | | 7 | | | 5,901,526 | | | | 4,975,973 | |
Financial assets at fair value through profit or loss | | 8 | | | 2,150,409 | | | | 2,132,348 | |
Investment securities | | 9 | | | 37,324,100 | | | | 34,662,106 | |
Loans and advances | | 10 | | | 72,536,813 | | | | 71,020,329 | |
Investments in associates and joint ventures | | 11 | | | 206,660 | | | | 201,135 | |
Property, plant and equipment | | 12 | | | 1,045,006 | | | | 1,039,483 | |
Intangible assets | | 14 | | | 899,167 | | | | 769,677 | |
Other assets | | 15 | | | 2,367,300 | | | | 1,924,070 | |
Current tax assets | | | | | 65,298 | | | | 53,708 | |
Deferred tax assets | | 22 | | | 632,220 | | | | 1,026,867 | |
| | | | | | | | | | |
Total assets | | | | ¥ | 141,874,426 | | | ¥ | 136,470,927 | |
| | | | | | | | | | |
Liabilities: | | | | | | | | | | |
Deposits | | 16 | | ¥ | 92,853,566 | | | ¥ | 90,469,098 | |
Call money and bills sold | | | | | 2,144,600 | | | | 2,629,407 | |
Repurchase agreements and cash collateral on securities lent | | | | | 7,487,633 | | | | 6,439,598 | |
Trading liabilities | | 17 | | | 2,173,567 | | | | 1,623,918 | |
Derivative financial instruments | | 7 | | | 5,850,813 | | | | 4,725,261 | |
Borrowings | | 18 | | | 10,412,858 | | | | 12,548,358 | |
Debt securities in issue | | 19 | | | 7,377,742 | | | | 5,890,388 | |
Provisions | | 20 | | | 425,350 | | | | 96,353 | |
Other liabilities | | 21 | | | 5,401,790 | | | | 4,422,166 | |
Current tax liabilities | | | | | 61,786 | | | | 49,448 | |
Deferred tax liabilities | | 22 | | | 69,330 | | | | 25,727 | |
| | | | | | | | | | |
Total liabilities | | | | | 134,259,035 | | | | 128,919,722 | |
| | | | | | | | | | |
Equity: | | | | | | | | | | |
Capital stock | | 24 | | | 2,337,896 | | | | 2,337,896 | |
Capital surplus | | 24 | | | 862,933 | | | | 1,081,556 | |
Retained earnings | | 24 | | | 2,162,696 | | | | 1,974,069 | |
Other reserves | | 24 | | | 437,177 | | | | 280,783 | |
Treasury stock | | 24 | | | (236,037 | ) | | | (171,761 | ) |
| | | | | | | | | | |
Equity attributable to shareholders of Sumitomo Mitsui Financial Group, Inc. | | | | | 5,564,665 | | | | 5,502,543 | |
Non-controlling interests | | 25 | | | 2,050,726 | | | | 2,048,662 | |
| | | | | | | | | | |
Total equity | | | | | 7,615,391 | | | | 7,551,205 | |
| | | | | | | | | | |
Total equity and liabilities | | | | ¥ | 141,874,426 | | | ¥ | 136,470,927 | |
| | | | | | | | | | |
The accompanying notes are an integral part of the Consolidated Financial Statements.
F-5
Consolidated Income Statement
| | | | | | | | | | | | | | |
| | | | | For the fiscal year ended March 31, | |
| | | Note | | 2012 | | | 2011 | | | 2010 | |
| | | | | (In millions, except per share data) | |
Interest income | | | | ¥ | 1,710,331 | | | ¥ | 1,720,181 | | | ¥ | 1,766,047 | |
Interest expense | | | | | 313,631 | | | | 311,056 | | | | 346,810 | |
| | | | | | | | | | | | | | |
Net interest income | | 26 | | | 1,396,700 | | | | 1,409,125 | | | | 1,419,237 | |
| | | | | | | | | | | | | | |
| | | | |
Fee and commission income | | | | | 869,407 | | | | 806,704 | | | | 650,437 | |
Fee and commission expense | | | | | 132,562 | | | | 132,560 | | | | 121,716 | |
| | | | | | | | | | | | | | |
Net fee and commission income | | 27 | | | 736,845 | | | | 674,144 | | | | 528,721 | |
| | | | | | | | | | | | | | |
| | | | |
Net trading income | | 28 | | | 182,296 | | | | 324,479 | | | | 330,130 | |
Net income from financial assets at fair value through
profit or loss | | 29 | | | 33,734 | | | | 30,116 | | | | 75,579 | |
Net investment income | | 30 | | | 239,365 | | | | 235,911 | | | | 178,552 | |
Other income | | 31 | | | 245,563 | | | | 204,470 | | | | 232,334 | |
| | | | | | | | | | | | | | |
Total operating income | | | | | 2,834,503 | | | | 2,878,245 | | | | 2,764,553 | |
| | | | | | | | | | | | | | |
| | | | |
Impairment charges on financial assets | | 32 | | | 284,310 | | | | 433,928 | | | | 258,641 | |
| | | | | | | | | | | | | | |
Net operating income | | | | | 2,550,193 | | | | 2,444,317 | | | | 2,505,912 | |
| | | | | | | | | | | | | | |
| | | | |
General and administrative expenses | | 33 | | | 1,366,705 | | | | 1,293,546 | | | | 1,096,957 | |
Other expenses | | 34 | | | 239,292 | | | | 212,292 | | | | 236,760 | |
| | | | | | | | | | | | | | |
Operating expenses | | | | | 1,605,997 | | | | 1,505,838 | | | | 1,333,717 | |
| | | | | | | | | | | | | | |
| | | | |
Share of post-tax loss of associates and joint ventures | | | | | 25,004 | | | | 5,796 | | | | 37,461 | |
| | | | | | | | | | | | | | |
Profit before tax | | | | | 919,192 | | | | 932,683 | | | | 1,134,734 | |
| | | | | | | | | | | | | | |
| | | | |
Income tax expense | | 35 | | | 461,194 | | | | 361,165 | | | | 488,041 | |
| | | | | | | | | | | | | | |
Net profit | | | | ¥ | 457,998 | | | ¥ | 571,518 | | | ¥ | 646,693 | |
| | | | | | | | | | | | | | |
Profit attributable to: | | | | | | | | | | | | | | |
Shareholders of Sumitomo Mitsui Financial Group, Inc. | | | | ¥ | 345,430 | | | ¥ | 464,007 | | | ¥ | 528,692 | |
Non-controlling interests | | | | | 112,568 | | | | 107,511 | | | | 118,001 | |
| | | | |
Earnings per share: | | | | | | | | | | | | | | |
Basic | | 36 | | ¥ | 248.98 | | | ¥ | 328.32 | | | ¥ | 511.51 | |
Diluted | | 36 | | | 248.29 | | | | 328.31 | | | | 481.59 | |
The accompanying notes are an integral part of the Consolidated Financial Statements.
F-6
Consolidated Statement of Comprehensive Income
| | | | | | | | | | | | |
| | | For the fiscal year ended March 31, | |
| | | 2012 | | | 2011 | | | 2010 | |
| | | (In millions) | |
Net profit | | ¥ | 457,998 | | | ¥ | 571,518 | | | ¥ | 646,693 | |
| | | |
Other comprehensive income: | | | | | | | | | | | | |
Available-for-sale financial assets: | | | | | | | | | | | | |
Gains (losses) arising during the period, before tax | | | 253,865 | | | | (349,080 | ) | | | 616,762 | |
Reclassification adjustments for (gains) losses included in net profit, before tax | | | (21,563 | ) | | | 10,957 | | | | (77,339 | ) |
| | | |
Exchange differences on translating the foreign operations: | | | | | | | | | | | | |
Losses arising during the period, before tax | | | (34,781 | ) | | | (121,593 | ) | | | (15,009 | ) |
Reclassification adjustments for (gains) losses included in net profit, before tax | | | 7,350 | | | | (505 | ) | | | 2 | |
| | | |
Share of other comprehensive income (loss) of associates and joint ventures | | | (2,832 | ) | | | (4,225 | ) | | | 9,960 | |
Income tax relating to components of other comprehensive income | | | (43,809 | ) | | | 146,520 | | | | (219,887 | ) |
| | | | | | | | | | | | |
Other comprehensive income (loss), net of tax | | | 158,230 | | | | (317,926 | ) | | | 314,489 | |
| | | | | | | | | | | | |
Total comprehensive income | | ¥ | 616,228 | | | ¥ | 253,592 | | | ¥ | 961,182 | |
| | | | | | | | | | | | |
Total comprehensive income attributable to: | | | | | | | | | | | | |
Shareholders of Sumitomo Mitsui Financial Group, Inc. | | ¥ | 501,316 | | | ¥ | 189,372 | | | ¥ | 855,665 | |
Non-controlling interests | | | 114,912 | | | | 64,220 | | | | 105,517 | |
The accompanying notes are an integral part of the Consolidated Financial Statements.
F-7
Consolidated Statement of Changes in Equity
| | | | | | | | | | | | | | | | | | | | | | | | | | | | | | | | | | | | |
| | | Capital
stock | | | Capital
surplus | | | Retained
earnings | | | Available-
for-sale
financial
assets | | | Exchange
differences
on translating
the foreign
operations | | | Treasury
stock | | | Shareholders’
equity | | | Non-controlling
interests | | | Total equity | |
| | | (In millions) | |
Balance at April 1, 2009 | | ¥ | 1,370,777 | | | ¥ | 114,594 | | | ¥ | 1,204,952 | | | ¥ | 349,213 | | | ¥ | (120,897 | ) | | ¥ | (124,024 | ) | | ¥ | 2,794,615 | | | ¥ | 2,121,400 | | | ¥ | 4,916,015 | |
| | | | | | | | | | | | | | | | | | | | | | | | | | | | | | | | | | | | |
| | | | | | | | | |
Comprehensive income: | | | | | | | | | | | | | | | | | | | | | | | | | | | | | | | | | | | | |
Net profit | | | — | | | | — | | | | 528,692 | | | | — | | | | — | | | | — | | | | 528,692 | | | | 118,001 | | | | 646,693 | |
Other comprehensive income (loss) | | | — | | | | — | | | | — | | | | 314,694 | | | | 12,279 | | | | — | | | | 326,973 | | | | (12,484 | ) | | | 314,489 | |
| | | | | | | | | | | | | | | | | | | | | | | | | | | | | | | | | | | | |
Total comprehensive income | | | — | | | | — | | | | 528,692 | | | | 314,694 | | | | 12,279 | | | | — | | | | 855,665 | | | | 105,517 | | | | 961,182 | |
| | | | | | | | | | | | | | | | | | | | | | | | | | | | | | | | | | | | |
Issuance of common stock | | | 917,019 | | | | 918,644 | | | | — | | | | — | | | | — | | | | — | | | | 1,835,663 | | | | — | | | | 1,835,663 | |
Conversion of Type 4 preferred stock | | | 50,100 | | | | 50,100 | | | | — | | | | — | | | | — | | | | — | | | | 100,200 | | | | — | | | | 100,200 | |
Issuance of preferred securities | | | — | | | | — | | | | — | | | | — | | | | — | | | | — | | | | — | | | | 388,000 | | | | 388,000 | |
Redemption of preferred securities | | | — | | | | — | | | | — | | | | — | | | | — | | | | — | | | | — | | | | (496,231 | ) | | | (496,231 | ) |
Acquisition of subsidiaries | | | — | | | | — | | | | — | | | | — | | | | — | | | | — | | | | — | | | | 23,025 | | | | 23,025 | |
Transaction with non-controlling interest shareholders | | | — | | | | — | | | | — | | | | — | | | | — | | | | — | | | | — | | | | 4,868 | | | | 4,868 | |
Dividends to shareholders | | | — | | | | — | | | | (71,175 | ) | | | — | | | | — | | | | — | | | | (71,175 | ) | | | (99,082 | ) | | | (170,257 | ) |
Purchase of treasury stock | | | — | | | | — | | | | — | | | | — | | | | — | | | | (189 | ) | | | (189 | ) | | | — | | | | (189 | ) |
Sale of treasury stock | | | — | | | | — | | | | — | | | | — | | | | — | | | | 151 | | | | 151 | | | | — | | | | 151 | |
Loss on sale of treasury stock | | | — | | | | (108 | ) | | | — | | | | — | | | | — | | | | — | | | | (108 | ) | | | — | | | | (108 | ) |
Others | | | — | | | | (1,798 | ) | | | 1,149 | | | | — | | | | — | | | | — | | | | (649 | ) | | | — | | | | (649 | ) |
| | | | | | | | | | | | | | | | | | | | | | | | | | | | | | | | | | | | |
Balance at March 31, 2010 | | | 2,337,896 | | | | 1,081,432 | | | | 1,663,618 | | | | 663,907 | | | | (108,618 | ) | | | (124,062 | ) | | | 5,514,173 | | | | 2,047,497 | | | | 7,561,670 | |
| | | | | | | | | | | | | | | | | | | | | | | | | | | | | | | | | | | | |
Comprehensive income: | | | | | | | | | | | | | | | | | | | | | | | | | | | | | | | | | | | | |
Net profit | | | — | | | | — | | | | 464,007 | | | | — | | | | — | | | | — | | | | 464,007 | | | | 107,511 | | | | 571,518 | |
Other comprehensive loss | | | — | | | | — | | | | — | | | | (198,830 | ) | | | (75,805 | ) | | | — | | | | (274,635 | ) | | | (43,291 | ) | | | (317,926 | ) |
| | | | | | | | | | | | | | | | | | | | | | | | | | | | | | | | | | | | |
Total comprehensive income (loss) | | | — | | | | — | | | | 464,007 | | | | (198,830 | ) | | | (75,805 | ) | | | — | | | | 189,372 | | | | 64,220 | | | | 253,592 | |
| | | | | | | | | | | | | | | | | | | | | | | | | | | | | | | | | | | | |
Acquisition of subsidiaries | | | — | | | | — | | | | — | | | | — | | | | — | | | | — | | | | — | | | | 38,020 | | | | 38,020 | |
Transaction with non-controlling interest shareholders | | | — | | | | — | | | | (678 | ) | | | 108 | | | | 21 | | | | — | | | | (549 | ) | | | (2,554 | ) | | | (3,103 | ) |
Dividends to shareholders | | | — | | | | — | | | | (152,878 | ) | | | — | | | | — | | | | — | | | | (152,878 | ) | | | (98,521 | ) | | | (251,399 | ) |
Purchase of treasury stock | | | — | | | | — | | | | — | | | | — | | | | — | | | | (47,759 | ) | | | (47,759 | ) | | | — | | | | (47,759 | ) |
Sale of treasury stock | | | — | | | | — | | | | — | | | | — | | | | — | | | | 60 | | | | 60 | | | | — | | | | 60 | |
Loss on sale of treasury stock | | | — | | | | (46 | ) | | | — | | | | — | | | | — | | | | — | | | | (46 | ) | | | — | | | | (46 | ) |
Others | | | — | | | | 170 | | | | — | | | | — | | | | — | | | | — | | | | 170 | | | | — | | | | 170 | |
| | | | | | | | | | | | | | | | | | | | | | | | | | | | | | | | | | | | |
Balance at March 31, 2011 | | | 2,337,896 | | | | 1,081,556 | | | | 1,974,069 | | | | 465,185 | | | | (184,402 | ) | | | (171,761 | ) | | | 5,502,543 | | | | 2,048,662 | | | | 7,551,205 | |
| | | | | | | | | | | | | | | | | | | | | | | | | | | | | | | | | | | | |
Comprehensive income: | | | | | | | | | | | | | | | | | | | | | | | | | | | | | | | | | | | | |
Net profit | | | — | | | | — | | | | 345,430 | | | | — | | | | — | | | | — | | | | 345,430 | | | | 112,568 | | | | 457,998 | |
Other comprehensive income (loss) | | | — | | | | — | | | | — | | | | 184,238 | | | | (28,352 | ) | | | — | | | | 155,886 | | | | 2,344 | | | | 158,230 | |
| | | | | | | | | | | | | | | | | | | | | | | | | | | | | | | | | | | | |
Total comprehensive income (loss) | | | — | | | | — | | | | 345,430 | | | | 184,238 | | | | (28,352 | ) | | | — | | | | 501,316 | | | | 114,912 | | | | 616,228 | |
| | | | | | | | | | | | | | | | | | | | | | | | | | | | | | | | | | | | |
Acquisition of subsidiaries | | | — | | | | — | | | | — | | | | — | | | | — | | | | — | | | | — | | | | 2,443 | | | | 2,443 | |
Transaction with non-controlling interest shareholders | | | — | | | | (8,368 | ) | | | (14,792 | ) | | | 508 | | | | — | | | | 44,127 | | | | 21,475 | | | | (23,270 | ) | | | (1,795 | ) |
Dividends to shareholders | | | — | | | | — | | | | (142,011 | ) | | | — | | | | — | | | | — | | | | (142,011 | ) | | | (92,021 | ) | | | (234,032 | ) |
Purchase of treasury stock | | | — | | | | — | | | | — | | | | — | | | | — | | | | (111,518 | ) | | | (111,518 | ) | | | — | | | | (111,518 | ) |
Sale of treasury stock | | | — | | | | — | | | | — | | | | — | | | | — | | | | 3,115 | | | | 3,115 | | | | — | | | | 3,115 | |
Loss on sale of treasury stock | | | — | | | | (679 | ) | | | — | | | | — | | | | — | | | | — | | | | (679 | ) | | | — | | | | (679 | ) |
Purchase of Type 6 preferred stock | | | — | | | | — | | | | — | | | | — | | | | — | | | | (210,003 | ) | | | (210,003 | ) | | | — | | | | (210,003 | ) |
Cancellation of Type 6 preferred stock | | | — | | | | (210,003 | ) | | | — | | | | — | | | | — | | | | 210,003 | | | | — | | | | — | | | | — | |
Others | | | — | | | | 427 | | | | — | | | | — | | | | — | | | | — | | | | 427 | | | | — | | | | 427 | |
| | | | | | | | | | | | | | | | | | | | | | | | | | | | | | | | | | | | |
Balance at March 31, 2012 | | ¥ | 2,337,896 | | | ¥ | 862,933 | | | ¥ | 2,162,696 | | | ¥ | 649,931 | | | ¥ | (212,754 | ) | | ¥ | (236,037 | ) | | ¥ | 5,564,665 | | | ¥ | 2,050,726 | | | ¥ | 7,615,391 | |
| | | | | | | | | | | | | | | | | | | | | | | | | | | | | | | | | | | | |
The accompanying notes are an integral part of the Consolidated Financial Statements.
F-8
Consolidated Statement of Cash Flows
| | | | | | | | | | | | |
| | | For the fiscal year ended March 31, | |
| | | 2012 | | | 2011 | | | 2010 | |
| | | (In millions) | |
Operating Activities: | | | | | | | | | | | | |
Profit before tax | | ¥ | 919,192 | | | ¥ | 932,683 | | | ¥ | 1,134,734 | |
Adjustments for: | | | | | | | | | | | | |
Gains on financial assets at fair value through profit or loss and investment securities | | | (55,639 | ) | | | (17,439 | ) | | | (152,924 | ) |
Foreign exchange losses | | | 79,258 | | | | 420,015 | | | | 135,453 | |
Provision for loan losses | | | 144,022 | | | | 259,292 | | | | 215,886 | |
Depreciation and amortization | | | 172,953 | | | | 163,400 | | | | 140,716 | |
Share of post-tax loss of associates and joint ventures | | | 25,004 | | | | 5,796 | | | | 37,461 | |
Net changes in assets and liabilities: | | | | | | | | | | | | |
Net increase of term deposits with original maturities over three months | | | (133,235 | ) | | | (343,404 | ) | | | (91,035 | ) |
Net (increase) decrease of call loans and bills bought | | | (446,175 | ) | | | 202,797 | | | | (137,593 | ) |
Net (increase) decrease of reverse repurchase agreements and cash collateral on securities borrowed | | | 110,676 | | | | 640,766 | | | | (3,291,814 | ) |
Net (increase) decrease of loans and advances | | | (1,138,608 | ) | | | 1,380,486 | | | | 4,021,020 | |
Net change of trading assets and liabilities and derivative financial instruments | | | (427,125 | ) | | | 43,119 | | | | (37,284 | ) |
Net increase of deposits | | | 2,540,054 | | | | 5,129,774 | | | | 1,355,456 | |
Net increase (decrease) of call money and bills sold | | | (478,629 | ) | | | 544,332 | | | | (1,062,075 | ) |
Net increase (decrease) of repurchase agreements and cash collateral on securities lent | | | 1,049,082 | | | | 1,009,568 | | | | (3,072,237 | ) |
Net increase (decrease) of other unsubordinated borrowings and debt securities in issue | | | (1,112,860 | ) | | | 4,867,822 | | | | 409,356 | |
Income taxes paid—net | | | (100,884 | ) | | | (125,618 | ) | | | (109,520 | ) |
Other operating activities—net | | | 173,925 | | | | (204,794 | ) | | | 62,212 | |
| | | | | | | | | | | | |
Net cash and cash equivalents provided by (used in) operating activities | | | 1,321,011 | | | | 14,908,595 | | | | (442,188 | ) |
| | | | | | | | | | | | |
Investing Activities: | | | | | | | | | | | | |
Purchases of financial assets at fair value through profit or loss and available-for-sale financial assets | | | (48,064,086 | ) | | | (65,533,905 | ) | | | (43,936,025 | ) |
Proceeds from sale of financial assets at fair value through profit or loss and available-for-sale financial assets | | | 31,909,764 | | | | 36,486,703 | | | | 32,271,697 | |
Proceeds from maturities of financial assets at fair value through profit or loss and available-for-sale financial assets | | | 15,010,487 | | | | 18,795,275 | | | | 13,252,829 | |
Purchases of held-to-maturity investments | | | (1,267,389 | ) | | | (983,404 | ) | | | (1,374,337 | ) |
Proceeds from maturities of held-to-maturity investments | | | 170,911 | | | | 72,313 | | | | 173,409 | |
Acquisitions of the subsidiaries, net of cash and cash equivalents acquired | | | (47,108 | ) | | | 82,773 | | | | (223,938 | ) |
Investments in associates and joint ventures | | | (580 | ) | | | (10,724 | ) | | | (60,787 | ) |
Proceeds from sale of investments in associates and joint ventures | | | 16,912 | | | | 309 | | | | 152,312 | |
Purchases of property, plant and equipment and investment properties | | | (129,993 | ) | | | (178,406 | ) | | | (173,408 | ) |
Purchases of intangible assets | | | (101,341 | ) | | | (101,646 | ) | | | (82,227 | ) |
Proceeds from sale of property, plant and equipment, investment properties and intangible assets | | | 30,337 | | | | 7,598 | | | | 38,841 | |
Other investing activities—net | | | 25 | | | | 243 | | | | 6,835 | |
| | | | | | | | | | | | |
Net cash and cash equivalents provided by (used in) investing activities | | | (2,472,061 | ) | | | (11,362,871 | ) | | | 45,201 | |
| | | | | | | | | | | | |
Financing Activities: | | | | | | | | | | | | |
Proceeds from issuance of subordinated borrowings | | | 106,000 | | | | 80,000 | | | | 8,000 | |
Redemption of subordinated borrowings | | | (103,000 | ) | | | (87,500 | ) | | | (78,000 | ) |
Proceeds from issuance of subordinated bonds | | | 552,726 | | | | 252,218 | | | | 607,212 | |
Redemption of subordinated bonds | | | (306,398 | ) | | | (314,900 | ) | | | (649,875 | ) |
Proceeds from issuance of preferred securities | | | — | | | | — | | | | 384,970 | |
Redemption of preferred securities | | | — | | | | — | | | | (496,231 | ) |
Purchase of Type 6 preferred stock | | | (210,003 | ) | | | — | | | | — | |
Proceeds from issuance of common stock | | | — | | | | — | | | | 1,824,896 | |
Dividends paid to shareholders of Sumitomo Mitsui Financial Group, Inc. | | | (141,922 | ) | | | (152,612 | ) | | | (71,063 | ) |
Dividends paid to non-controlling interest shareholders | | | (91,983 | ) | | | (98,431 | ) | | | (99,171 | ) |
Purchase of treasury stock and proceed from sale of treasury stock—net | | | (109,128 | ) | | | (47,745 | ) | | | (146 | ) |
Transactions with non-controlling interest shareholders—net | | | (1,493 | ) | | | 2,668 | | | | 2 | |
| | | | | | | | | | | | |
Net cash and cash equivalents provided by (used in) financing activities | | | (305,201 | ) | | | (366,302 | ) | | | 1,430,594 | |
| | | | | | | | | | | | |
Effect of exchange rate changes on cash and cash equivalents | | | (61,678 | ) | | | (217,386 | ) | | | (55,223 | ) |
| | | | | | | | | | | | |
Net increase (decrease) of cash and cash equivalents | | | (1,517,929 | ) | | | 2,962,036 | | | | 978,384 | |
Cash and cash equivalents at beginning of period | | | 8,573,599 | | | | 5,611,563 | | | | 4,633,179 | |
| | | | | | | | | | | | |
Cash and cash equivalents at end of period | | ¥ | 7,055,670 | | | ¥ | 8,573,599 | | | ¥ | 5,611,563 | |
| | | | | | | | | | | | |
Net cash and cash equivalents provided by (used in) operating activities includes: | | | | | | | | | | | | |
Interests and dividends received | | ¥ | 1,787,503 | | | ¥ | 1,757,233 | | | ¥ | 1,838,253 | |
Interests paid | | | 315,311 | | | | 322,298 | | | | 370,902 | |
| | | |
Significant non-cash investing and financing activities: | | | | | | | | | | | | |
The SMFG Group made Cedyna Financial Corporation a wholly-owned subsidiary of the SMFG Group by share exchange transaction during the fiscal year ended March 31, 2012. The details of the transaction are described in Note 25 “Non-controlling interests.” The SMFG Group acquired Nikko Cordial Securities Inc. and THE BIWAKO BANK, LIMITED during the fiscal year ended March 31, 2010. The details of these transactions are described in Note 48 “Acquisitions.” Capital stock and capital surplus were increased by conversion of Type 4 preferred stock during the fiscal year ended March 31, 2010. The details of this transaction are described in Note 24 “Shareholders’ Equity.” | |
The accompanying notes are an integral part of the Consolidated Financial Statements.
F-9
Notes to Consolidated Financial Statements
Sumitomo Mitsui Financial Group, Inc. (“SMFG”) was established on December 2, 2002, as a holding company for Sumitomo Mitsui Banking Corporation (“SMBC”) and its subsidiaries through a statutory share transfer (kabushiki-iten) of all of the outstanding equity securities of SMBC in exchange for SMFG’s newly issued securities. SMFG is a joint stock corporation with limited liability (Kabushiki Kaisha) incorporated under the Companies Act of Japan (“Companies Act”). Upon the formation of SMFG and the completion of the statutory share transfer, SMBC became a direct, wholly-owned subsidiary of SMFG. SMFG has a primary listing on the Tokyo Stock Exchange (First Section), with further listings on the Osaka Securities Exchange (First Section) and the Nagoya Stock Exchange (First Section). SMFG’s American Depositary Shares are listed on the New York Stock Exchange.
SMFG and its subsidiaries (the “SMFG Group”) offer a diverse range of financial services, including commercial banking, securities, leasing, credit card and other services.
The accompanying consolidated financial statements have been authorized for issue by the Management Committee on July 23, 2012.
| 2 | SUMMARY OF SIGNIFICANT ACCOUNTING POLICIES |
The principal accounting policies applied in the preparation of the consolidated financial statements are set out below. These policies have been consistently applied to all the fiscal years presented, unless otherwise stated.
Basis of Preparation
Compliance with International Financial Reporting Standards
The consolidated financial statements of the SMFG Group have been prepared in accordance with International Financial Reporting Standards (“IFRS”) as issued by the International Accounting Standards Board (“IASB”).
Basis of measurement
The consolidated financial statements have been prepared under the historical cost basis except for the following:
| | • | | trading assets and liabilities are measured at fair value; |
| | • | | derivative financial instruments are measured at fair value; |
| | • | | financial assets at fair value through profit or loss are measured at fair value; |
| | • | | available-for-sale financial assets are measured at fair value; and |
| | • | | the liabilities and the assets recognized in the consolidated statement of financial position in respect of defined benefit plans are the present value of the defined benefit obligation less the fair value of plan assets, together with adjustments for unrecognized actuarial gains or losses and past service costs. |
Functional and presentation currency
The consolidated financial statements are presented in Japanese yen, which is also SMFG’s functional currency. All financial information presented in Japanese yen has been rounded to the nearest million Japanese yen, except as otherwise indicated.
F-10
Critical accounting estimates and judgments
The preparation of financial statements in accordance with IFRS requires the use of certain critical accounting estimates. It also requires management to exercise judgment in the process of applying the accounting policies. Actual results may differ from these estimates. The notes to the consolidated financial statements set out areas involving a higher degree of judgment or complexity, or areas where assumptions are significant to the consolidated financial statements, such as allowance for loan losses (Notes 10, 32), fair value of financial instruments (Note 44), impairment of available-for-sale financial assets (Notes 9, 32), impairment of goodwill (Note 14), provision for interest repayment (Note 20), retirement benefits (Note 23), deferred tax assets (Note 22), and special purpose entities.
Refer to Note 3 “Critical Accounting Estimates and Judgments” for further information.
New and amended standards adopted by the SMFG Group
During the fiscal year ended March 31, 2012, a number of interpretations and amendments to standards have become effective; however, they have not resulted in any material changes to the SMFG Group’s accounting policies.
Consolidation
Subsidiaries
Subsidiaries are all entities controlled by the SMFG Group including special purpose entities (“SPEs”). The SMFG Group considers that it controls an entity if it has the power to govern the financial and operating policies of the entity, in general by having a shareholding of more than 50% of the voting rights. The existence and effect of potential voting rights that are currently exercisable or convertible are considered when assessing whether the SMFG Group controls another entity. Subsidiaries are fully consolidated from the date on which the SMFG Group obtains control. They are de-consolidated from the date on which the SMFG Group loses control.
The SMFG Group has become a party to a number of SPEs for the purpose of, but not limited to, structured financing transactions, investment vehicles, securitization of financial assets and leasing transactions. The following circumstances may indicate a relationship in which, in substance, the SMFG Group controls and consequently consolidates the SPE:
| | • | | the activities of the SPE are being conducted on behalf of the SMFG Group according to its specific business needs so that the SMFG Group obtains benefits from the SPE’s operation; |
| | • | | the SMFG Group has the decision-making powers to obtain the majority of the benefits of the activities of the SPE or, by setting up an “autopilot” mechanism, the SMFG Group has delegated its decision-making powers; |
| | • | | the SMFG Group has rights to obtain the majority of the benefits of the SPE and therefore may be exposed to risks incident to the activities of the SPE; or |
| | • | | the SMFG Group retains the majority of the residual or ownership risks related to the SPE or its assets in order to obtain benefits from its activities. |
Consolidation is reassessed whenever circumstances change and indicate that there has been a change in the control relationship between the SMFG Group and the SPE.
The acquisition method is used to account for the business combinations including the acquisition of subsidiaries by the SMFG Group. The consideration transferred in a business combination is measured at fair value, which is calculated as the sum of the acquisition-date fair values of the assets transferred, the liabilities incurred and the equity interests issued. Identifiable assets acquired and liabilities assumed in a business
F-11
combination are measured initially at their fair values at the acquisition date. The SMFG Group’s previously held equity interest in the acquiree is remeasured to fair value at the acquisition date and a gain or loss is recognized in profit or loss. For each business combination, the SMFG Group measures any non-controlling interest in the acquiree either at fair value or at the non-controlling interest’s proportionate share of the acquiree’s identifiable net assets. The excess of the aggregate of the consideration transferred, the amount of any non-controlling interest and the acquisition-date fair value of the SMFG Group’s previously held equity interest in the acquiree over the net of the acquisition-date amounts of the identifiable assets acquired and the liabilities assumed is recorded as goodwill in the consolidated statement of financial position. If the aggregate of the consideration transferred, the amount of any non-controlling interest and the acquisition-date fair value of the SMFG Group’s previously held equity interest in the acquiree is less than the net of the acquisition-date amounts of the identifiable assets acquired and the liabilities assumed, the difference is recognized immediately in the consolidated income statement.
Inter-company transactions, balances and unrealized gains on transactions between the SMFG Group companies are eliminated on consolidation. Unrealized losses are also eliminated unless the transaction provides evidence of impairment of the asset transferred. The accounting policies of subsidiaries have been adjusted where necessary to ensure consistency with the accounting policies adopted by the SMFG Group.
Non-controlling interests
Changes in the SMFG Group’s ownership interest in a subsidiary that do not result in a loss of control are accounted for as equity transactions.
Interests in the equity of subsidiaries not attributable to the SMFG Group are reported in the consolidated statement of financial position as a separate component of equity as non-controlling interests. Profits or losses attributable to non-controlling interests are separately reported in the consolidated income statement.
Associates and joint ventures
An associate is an entity over which the SMFG Group has significant influence, but does not control the financial and operating policy decisions of the entity. Significant influence is generally presumed to exist when the SMFG Group holds 20% or more, but less than 50%, of the voting rights.
Entities which are subject to joint control by more than one party including the SMFG Group may be determined to be a joint venture.
The SMFG Group accounts for investments in associates and joint ventures using the equity method from the date on which they become associates or joint ventures. The SMFG Group discontinues the use of the equity method from the date on which the SMFG Group ceases to have significant influence or joint control over the investees.
Under the equity method, the SMFG Group’s investments in associates and joint ventures are initially recognized at cost. The carrying amount of the investments are subsequently increased or decreased to recognize the SMFG Group’s share of the post-acquisition profit or loss of the associate or joint venture and other movements included directly in the equity of the associate or joint venture. The SMFG Group’s share of the results of associates and joint ventures is based on the financial statements of its associates, adjusted to conform with the accounting policies of the SMFG Group. Profits on transactions between the SMFG Group and its associates and joint ventures are eliminated to the extent of the SMFG Group’s interest in the associates or joint ventures. Losses are also eliminated to the extent of the SMFG Group’s interest in the associates or joint ventures unless the transaction provides evidence of impairment in the asset transferred.
The carrying amounts of the investments in associates and joint ventures include goodwill (net of any accumulated impairment loss) arising on the acquisition of the interests in the entities. Because goodwill arising
F-12
on the acquisition of the interest in an associate or joint venture is not separately recognized, it is not tested for impairment separately. Instead, the entire carrying amount of the investment in an associate or joint venture is tested for impairment as a single asset by comparing its recoverable amount, which is the higher of value in use and fair value less costs to sell, with its carrying amount, whenever there is any objective evidence that the investment is impaired. An impairment loss recognized in prior periods for the investment is reversed only if there has been a change in the estimates used to determine the recoverable amount of the investment since the last impairment loss was recognized. If this is the case, the carrying amount of the investment is increased to its recoverable amount. That increase is a reversal of an impairment loss.
When the SMFG Group’s share of losses in an associate or joint venture exceeds the SMFG Group’s carrying amount of the investment, the SMFG Group does not recognize further losses, unless it has a binding obligation or has made payments on behalf of the entity.
Segment Reporting
The SMFG Group determines its operating segments based on the management approach, which requires operating segments to be identified on the basis of internal reports about components of the entity that are regularly reviewed by management, in order to allocate resources to a segment and to assess its performance.
Foreign Currency Translation
Items included in the financial statements of each of the SMFG Group companies are measured using the currency of the primary economic environment in which the company operates (“the functional currency”). The consolidated financial statements are presented in Japanese yen, which is also SMFG’s functional currency.
Transactions and balances
Foreign currency transactions that are denominated or settled in a foreign currency are translated into the functional currency using the exchange rates prevailing at the dates of the transactions. Monetary items denominated in foreign currencies are translated using the exchange rate at the end of the reporting period. Foreign exchange gains and losses resulting from the retranslation and settlement of monetary items are recognized in the consolidated income statement. Non-monetary items that are measured at fair value in a foreign currency are translated into the functional currency using the exchange rate at the date the fair value is determined. Translation differences on non-monetary items, such as equity instruments classified as available-for-sale financial assets, are not included in the consolidated income statement but are recognized directly in equity. Non-monetary items that are measured at historical cost in a foreign currency are translated into the functional currency using the exchange rate at the date of the initial transaction.
Foreign operations
The assets and liabilities of foreign operations are translated into the presentation currency of the SMFG Group using the exchange rate at the reporting date, and their income statements are translated using the exchange rates at the dates of the transactions or average exchange rates where these approximate to actual rates.
The exchange differences arising on the translation of a foreign operation are included in other comprehensive income within equity and subsequently included in profit or loss on full or partial disposal of the operation.
Financial Assets
At initial recognition, the financial assets of the SMFG Group are classified into one of the following categories: trading assets, derivative financial instruments, financial assets at fair value through profit or loss, loans and receivables, held-to-maturity investments and available-for-sale financial assets.
F-13
Regular way purchases and sales of trading assets, derivative financial instruments, financial assets at fair value through profit or loss, held-to-maturity investments and available-for-sale financial assets are recognized on the trade date—the date on which the SMFG Group commits to purchase or sell the assets.
Financial assets are derecognized when the rights to receive cash flows from the financial assets have expired or where the SMFG Group has transferred substantially all the risks and rewards of ownership at a consolidated level. The SMFG Group consolidates all subsidiaries in accordance with IAS 27 “Consolidated and Separate Financial Statements” and SIC-12 “Consolidation—Special Purpose Entities” before determining derecognition of financial assets under IAS 39 “Financial Instruments: Recognition and Measurement.”
Trading assets
Financial assets are classified as held for trading and included in “Trading assets” in the consolidated statement of financial position, if they are acquired or incurred principally for the purpose of selling or repurchasing in the near term or if they are part of a portfolio of identified financial instruments that are managed together and for which there is evidence of a recent actual pattern of short-term profit-taking. Trading assets are initially recognized at fair value with transaction costs being recognized in the consolidated income statement, and subsequently measured at fair value. Gains and losses arising from changes in the fair values of trading assets are included in “Net trading income” in the consolidated income statement.
Derivative financial instruments
Derivatives are also classified as held for trading and included in “Derivative financial instruments” in the consolidated statement of financial position. The SMFG Group does not apply hedge accounting under IFRS. All derivatives are carried as assets when the fair value is positive and as liabilities when the fair value is negative. Derivatives are initially recognized at fair value with transaction costs being recognized in the consolidated income statement, and subsequently measured at fair value. Gains and losses arising from changes in the fair values of derivatives are included in “Net trading income” in the consolidated income statement.
The derivative component of a hybrid instrument containing both a derivative and non-derivative component (“host contract”) is referred to as an embedded derivative. Certain embedded derivatives are accounted for as separate derivatives, when their economic characteristics and risks are not closely related to those of the host contract and the hybrid instrument is not carried at fair value through profit or loss. These embedded derivatives are measured at fair value and are presented in the consolidated statement of financial position together with the host contract.
Financial assets at fair value through profit or loss
Financial assets, other than those held for trading, are classified as financial assets at fair value through profit or loss and are included in “Financial assets at fair value through profit or loss” in the consolidated statement of financial position, if they meet one of the following criteria, and are so designated by management:
| | • | | the designation eliminates or significantly reduces a measurement or recognition inconsistency; |
| | • | | a group of financial assets is managed and its performance is evaluated on a fair value basis in accordance with a documented risk management or investment strategy; or |
| | • | | the instrument contains one or more embedded derivatives unless (a) the embedded derivative does not significantly modify the cash flows that otherwise would be required by the contract or (b) it is clear with little or no analysis that separation is prohibited. |
In addition, the SMFG Group classifies the entire hybrid instrument at fair value through profit or loss when the SMFG Group is required to separate an embedded derivative from its host contract, but is unable to measure the embedded derivative separately either at acquisition or at the end of a subsequent reporting period. Financial
F-14
assets at fair value through profit or loss are initially recognized at fair value with transaction costs being recognized in the consolidated income statement, and subsequently measured at fair value. Gains and losses arising from changes in the fair value of such financial assets are included in “Net income from financial assets at fair value through profit or loss” in the consolidated income statement.
Loans and receivables
Loans and receivables are non-derivative financial assets with fixed or determinable payments that are not quoted in an active market, other than:
| | • | | those that the SMFG Group intends to sell immediately or in the near term, which are classified as held for trading, and those that the SMFG Group upon initial recognition designates as at fair value through profit or loss; |
| | • | | those that the SMFG Group upon initial recognition classifies as available-for-sale; or |
| | • | | those for which the SMFG Group may not recover substantially all of its initial investment, other than because of credit deterioration. |
The financial assets classified as loans and receivables are mainly included in “Loans and advances” in the consolidated statement of financial position. Loans and receivables are initially recognized at fair value plus directly attributable transaction costs, and are subsequently measured at amortized cost using the effective interest method.
When the SMFG Group is the lessor in a lease agreement that transfers substantially all of the risks and rewards incidental to ownership of the asset to the lessee, the arrangement is classified as a finance lease and a receivable equal to the net investment in the lease is recognized and presented within “Loans and advances” in the consolidated statement of financial position.
Held-to-maturity investments
Held-to-maturity investments are non-derivative financial assets quoted in an active market with fixed or determinable payments and fixed maturities that the SMFG Group has the positive intention and ability to hold to maturity. If the SMFG Group were to sell other than an insignificant amount of held-to-maturity investments, the remaining investments in this category would be reclassified as available-for-sale financial assets. Held-to-maturity investments are initially recognized at fair value plus directly attributable transaction costs, and are subsequently measured at amortized cost using the effective interest method.
Available-for-sale financial assets
Available-for-sale financial assets are non-derivative financial assets that are classified as available-for-sale at initial recognition or are not classified into any of the other categories described above. Available-for-sale financial assets are initially recognized at fair value plus directly attributable transaction costs, and are subsequently measured at fair value.
Gains and losses arising from changes in the fair value of available-for-sale financial assets are recognized in other comprehensive income, until they are derecognized or impaired. At that time, the cumulative gain or loss previously recognized in other comprehensive income is recognized in the consolidated income statement. However, interest income calculated using the effective interest method and foreign currency gains and losses on monetary assets classified as available-for-sale are recognized in the consolidated income statement. Dividends on available-for-sale equity instruments are recognized in the consolidated income statement when the entity’s right to receive payment is established.
F-15
Financial Liabilities
Financial liabilities, except for held for trading and derivatives, are initially recognized at fair value net of transaction costs incurred, including premiums, discounts and issuance costs, and subsequently measured at amortized cost based on the effective interest method. Financial liabilities carried at amortized cost are mainly “Deposits,” “Borrowings,” and “Debt securities in issue” included in the consolidated statement of financial position.
Financial liabilities held for trading and derivatives are initially measured at fair value with transaction costs being recognized in the consolidated income statement, and subsequently measured at fair value. Financial liabilities held for trading and derivatives are mainly included in “Trading liabilities” and “Derivative financial instruments,” respectively, in the consolidated statement of financial position.
Financial liabilities are derecognized when they have been redeemed or otherwise extinguished.
Hedge Accounting
The SMFG Group does not apply hedge accounting under IAS 39.
Offsetting Financial Instruments
Financial assets and liabilities are offset and the net amount is reported in the consolidated statement of financial position, only if the SMFG Group currently has a legally enforceable right to offset the recognized amounts and intends to settle on a net basis or to realize the asset and settle the liability simultaneously. In all other situations, they are presented on a gross basis.
Fair Value Measurement
Fair value is the amount for which an asset could be exchanged, or a liability settled, between knowledgeable, willing parties in an arm’s-length transaction. The fair values of quoted financial instruments in active markets are based on current bid or asking prices. A financial instrument is regarded as quoted in an active market if quoted prices are readily and regularly available from an exchange, dealer, broker, industry group or pricing service and those prices represent actual and regularly occurring market transactions on an arm’s-length basis. If there is no active market for a financial instrument, the SMFG Group establishes the fair value using valuation techniques. These include the use of recent arm’s-length transactions, discounted cash flow analyses, option pricing models and other valuation techniques commonly used by market participants. Details of fair value measurement are described in Note 44 “Fair Value of Financial Assets and Liabilities.”
Recognition of Deferred Day One Profit and Loss
The best evidence of fair value at initial recognition is the transaction price (i.e., the fair value of the consideration given or received), unless the fair value of that instrument is evidenced by comparison with other observable current market transactions in the same instrument (i.e., without modification or repackaging) or based on a valuation technique which includes variables such as data from observable markets.
The SMFG Group has certain financial instruments, such as derivatives and hybrid financial instruments, where fair value is determined using valuation techniques for which not all inputs are market observable. Such a financial instrument is initially recognized at the transaction price, although the value obtained from the relevant valuation technique may be different. The difference between the transaction price and the fair value based on the valuation technique, commonly referred to as “day one profit and loss,” is not recognized immediately in the consolidated income statement but is deferred.
F-16
The timing of recognition of the deferred day one profit and loss is determined on an instrument by instrument basis. It is either amortized over the life of the transaction, deferred until the instrument’s fair value can be determined using market observable inputs, or realized through settlement. The financial instrument is subsequently measured at fair value, the value obtained from the valuation technique, and adjusted for the change in deferred day one profit and loss. Subsequent changes in fair value are recognized immediately in the consolidated income statement.
Repurchase and Reverse Repurchase Agreements, and Securities Borrowing and Lending Agreements
In the ordinary course of business, the SMFG Group lends or sells securities under agreements to repurchase them at a predetermined price (“repos”). Since the majority of the risks and rewards are retained by the SMFG Group, the securities remain on the consolidated statement of financial position and a liability is recorded in respect of the consideration received. On the other hand, the SMFG Group borrows or purchases securities under agreements to resell them at a predetermined price (“reverse repos”). Since the SMFG Group does not retain the risks and rewards of ownership, these transactions are treated as collateralized loans and the securities are not included in the consolidated statement of financial position.
The difference between the sale and purchase price is accrued over the life of the transactions. Securities lent to counterparties remain on the consolidated statement of financial position. Securities borrowed are not recognized in the consolidated statement of financial position, unless these are sold to third parties, at which point the obligation to repurchase the securities is recorded as a trading liability at fair value and any subsequent gain or loss is included in “Net trading income” in the consolidated income statement.
For the fiscal years ended March 31, 2012, 2011 and 2010, there were no transactions pursuant to repurchase agreements, securities lending transactions or other transactions involving the transfer of financial assets with an obligation to repurchase such transferred assets that were treated as sales and hence derecognized for accounting purposes.
Impairment of Financial Assets
Loans and advances and held-to-maturity investments
At the end of each reporting period, the SMFG Group assesses whether there is any objective evidence that a financial asset or a group of financial assets is impaired.
A financial asset or a group of financial assets is impaired and impairment losses are incurred only if there is objective evidence of impairment as a result of one or more events that occurred after the initial recognition of the asset (a “loss event”) and that loss event (or events) has an impact on the estimated future cash flows of the financial asset or group of financial assets that can be reliably estimated.
The criteria that the SMFG Group uses to determine that there is objective evidence of an impairment loss include:
| | • | | significant financial difficulty of an issuer or an obligor; |
| | • | | a default or delinquency in interest or principal payments; |
| | • | | restructuring of a financial asset by the SMFG Group due to the borrower’s financial difficulties on terms that the SMFG Group would not otherwise consider; |
| | • | | indications that a borrower or issuer will enter bankruptcy; |
| | • | | disappearance of an active market for a security because of the borrower’s financial difficulties; and |
| | • | | other observable data relating to a group of assets, such as adverse changes in the payment status of borrowers or issuers in the group, or national or local economic conditions that correlate with defaults in the group. |
F-17
The SMFG Group first assesses whether objective evidence of impairment exists individually for financial assets that are individually significant, and individually or collectively for financial assets that are not individually significant. If the SMFG Group determines that no objective evidence of impairment exists for an individually assessed financial asset, whether significant or not, it includes the asset in a group of financial assets with similar credit risk characteristics and collectively assesses them for impairment. Assets that are individually assessed for impairment and for which an impairment loss is or continues to be recognized are not included in the collective assessment of impairment.
The allowance for individually significant impaired financial assets is measured by the discounted cash flow (“DCF”) method, which is used to calculate the difference between the asset’s carrying amount and the present value of estimated future cash flows (excluding future credit losses that have not been incurred) discounted at the financial asset’s original effective interest rate. If financial assets have a variable interest rate, the discount rate for measuring any impairment loss is the effective interest rate determined under the contract, for the current period. The estimated future cash flows are individually calculated taking into account factors including historical loss information, the appropriateness of the borrower’s business plan or operational improvement plan, the status of progress of its plan, the overall support from financial institutions, and the realizable value of any collateral held.
The collective allowance for financial assets is classified into two types: (1) the allowance for impaired financial assets that are not individually significant, and (2) the allowance for non-impaired financial assets, which reflects incurred but not yet identified (“IBNI”) losses for the period between the impairment occurring and the loss being identified. The collective allowance is estimated by applying historical loss experience to groups of homogenous loans. The historical loss experience data includes the number of borrowers for whom objective evidence of impairment has been identified for the most recent rolling one-year period, and the amount ultimately recovered from impaired financial assets. The SMFG Group has collected and accumulated historical data on amounts ultimately recovered from impaired financial assets. The homogeneous groups are determined on the basis of similar credit risk characteristics. For every group, the SMFG Group’s grading processes are established considering asset type, industry, geographical location, collateral type, past-due status and other relevant characteristics (see Note 45 “Financial Risk Management”). These characteristics are relevant to the estimation of future cash flows for groups of such assets as being indicative of the debtors’ ability to pay all amounts due according to the contractual terms of the assets being evaluated. Historical loss experience is adjusted on the basis of current observable data, including bankruptcy trends after the occurrence of significant events which had a negative effect on the global economy and the economies in which a large portion of the SMFG Group’s assets are located, to reflect the effects of current conditions that did not affect the period on which the historical loss experience is based and to remove the effects of conditions in the historical period that do not currently exist.
The carrying amount of the asset is reduced by the impairment loss either directly or through the use of an allowance account. Changes in the carrying amount of the allowance account are recognized in the consolidated income statement. If, in a subsequent period, the amount of the impairment loss decreases and the decrease can be related objectively to an event occurring after the impairment was recognized (such as an improvement in the debtor’s credit rating), the previously recognized impairment loss is reversed by adjusting the allowance account. The amount of the reversal is recognized in “Impairment charges on financial assets” in the consolidated income statement.
If a financial asset is determined to be uncollectible, it is written off against the related allowance account. Uncollectible financial assets are normally written off when there is no expectation of further recovery after any collateral is foreclosed and the amount of the loss has been determined. Those assets primarily include loans for borrowers that have been legally or formally declared bankrupt and borrowers that may not have been legally or formally declared bankrupt but are essentially bankrupt.
Loans and advances that would otherwise be past due or impaired, but whose terms have been renegotiated without providing any financial concessions, are not classified as impaired loans and advances as the terms of the
F-18
renegotiated loans and advances do not result in a decrease in the net present value of the loan discounted at its original effective interest rate. The collective allowance is estimated for these loans and advances by including them in homogenous groups on the basis of applying the SMFG Group’s grading process, taking into account the renegotiation and their consequent higher risk status. These loans and advances are continually assessed for impairment until maturity or derecognition.
In addition, provisions for loan commitments are calculated where it is probable that the SMFG Group will incur a loss and recognized in other provisions (see Note 20 “Provisions”).
Available-for-sale financial assets
At the end of each reporting period, the SMFG Group assesses whether there is objective evidence that a financial asset or a group of financial assets is impaired. In the case of equity instruments classified as available-for-sale, a significant or prolonged decline in the fair value of the instruments below cost is also considered in determining whether the assets are impaired. In the case of debt instruments classified as available-for-sale, impairment is assessed based on the same criteria as for loans and advances and held-to-maturity investments. If any objective evidence of impairment exists for available-for-sale financial assets, the cumulative loss—measured as the difference between the cost and the current fair value, less any impairment loss on that financial asset previously recognized in profit or loss—is removed from equity and recognized in the consolidated income statement.
Impairment losses recognized in the consolidated income statement on equity instruments classified as available-for-sale are not reversed through the consolidated income statement. For debt instruments classified as available-for-sale, if the fair value recovers in a subsequent period and it can be objectively associated with an event occurring after the impairment loss was recognized in the consolidated income statement, the impairment loss is reversed through the consolidated income statement.
Property, Plant and Equipment
All property, plant and equipment are stated at cost less accumulated depreciation and accumulated impairment losses, if any. Additions and subsequent expenditures are capitalized only to the extent that they enhance the future economic benefits expected to be derived from the assets. Repairs and maintenance costs are expensed as incurred.
Land is not depreciated. Depreciation of other assets is calculated using the straight-line method to allocate their cost to their residual values over their estimated useful lives, as follows:
| | • | | Leased assets: the shorter of the lease term and the estimated useful life, which is principally 5–20 years; and |
| | • | | Others (principally equipment and furniture): 2–20 years. |
The residual values and useful lives are reviewed and adjusted, if appropriate, at the end of each reporting period. Gains and losses on disposal are determined by comparing the proceeds with the carrying amount. These are included in “Other income” and “Other expenses” in the consolidated income statement.
Intangible Assets
Goodwill
Goodwill represents the excess of the aggregate of the consideration transferred, the amount of any non-controlling interest and the acquisition-date fair value of the SMFG Group’s previously held equity interest
F-19
in the acquiree over the net of the acquisition-date amounts of the identifiable assets acquired and the liabilities assumed, and is initially recognized at the date of acquisition. Goodwill is allocated to cash-generating units for the purpose of impairment testing. A cash-generating unit is the smallest identifiable group of assets that generates cash inflows that are largely independent of cash inflows from other assets or groups of assets. Impairment testing is performed at least annually and whenever there is an indication that the cash-generating unit may be impaired. When the SMFG Group disposes of all or part of a cash-generating unit to which goodwill is allocated, the goodwill associated with the cash-generating unit is included in the carrying amount of the cash-generating unit when determining the gain or loss on disposal.
Software
Purchased software is carried at cost less accumulated amortization and accumulated impairment losses, if any.
Expenditure on internally generated software is recognized as an asset if the SMFG Group can demonstrate its intention and ability to complete the development and use the software in a manner that will generate future economic benefits and it can reliably measure the costs to complete the development. Internally generated software is carried at capitalized cost less accumulated amortization and accumulated impairment losses, if any. Costs associated with maintaining software are expensed as incurred.
Software is amortized using the straight-line method over the estimated useful life, which is generally five years.
Contractual customer relationships and trademarks
Contractual customer relationships and trademarks acquired in a business combination are recognized at fair value at the acquisition date. Contractual customer relationships and trademarks are carried at cost less accumulated amortization or impairment losses, if any. Contractual customer relationships and trademarks are amortized using the straight-line method over their estimated useful lives of 10 to 20 years.
Other intangible assets
Other intangible assets primarily consist of leasehold rights. They are recognized only when the SMFG Group legally obtains the rights and can reliably measure the fair value. Leasehold rights have an indefinite useful life and they are not amortized but are tested for impairment annually.
Impairment of Non-Financial Assets
Non-financial assets are reviewed for impairment at the end of each reporting period and whenever events or changes in circumstances indicate that the carrying amount may not be recoverable. If any such indication exists, the asset’s recoverable amount is estimated. An impairment loss is recognized in the consolidated income statement if the asset’s carrying amount is greater than its estimated recoverable amount. The recoverable amount is estimated as the higher of the asset’s fair value less costs to sell and value in use. Value in use is the present value of the future cash flows expected to be derived from the asset. In addition, irrespective of whether there is any indication of impairment, intangible assets that have an indefinite useful life are tested for impairment annually.
For the purposes of conducting impairment reviews, assets are grouped into cash-generating units to which the assets belong. Non-financial assets other than impaired goodwill are reviewed for possible reversal of the impairment loss at the end of each reporting period. An impairment loss is reversed only to the extent that the asset’s carrying amount does not exceed the carrying amount that would have been determined, net of depreciation or amortization, if no impairment loss had been recognized.
F-20
Leases
As lessee
A lease agreement in which the lessor retains a significant portion of the risks and rewards of ownership of assets is classified as an operating lease. The leases entered into by the SMFG Group as a lessee are primarily operating leases. Operating lease payments, net of lease incentives received from the lessor, are recognized in the consolidated income statement on a straight-line basis over the lease term.
A lease agreement in which the lessor transfers to the lessee substantially all the risks and rewards of ownership of assets, with or without ultimate legal title, is classified as a finance lease. For finance leases, the SMFG Group initially recognizes the leased asset at the lower of the fair value of the asset or the present value of the minimum lease payments. Subsequent to initial recognition, assets are accounted for in accordance with the accounting policy applicable to those assets. The corresponding liability to the lessor is recognized as a lease obligation within “Borrowings” in the consolidated statement of financial position. Interest expense is recognized over the term of the lease based on the interest rate implicit in the lease so as to give a constant rate of interest on the remaining balance of the liability.
As lessor
When the SMFG Group acts as a lessor in an operating lease, the leased assets are included in “Property, plant and equipment” in the consolidated statement of financial position and are depreciated over their expected useful lives on a basis consistent with similar assets in property, plant and equipment. Income from operating leases (net of any incentives given to the lessee) is recognized on a straight-line basis over the lease term. Initial direct costs incurred in negotiating and arranging an operating lease are added to the carrying amount of the leased assets and recognized as an expense on a straight-line basis over the lease term.
When the SMFG Group is a lessor in a finance lease, the leased assets are derecognized and the present value of the future lease payments is recognized as a lease receivable within “Loans and advances” in the consolidated statement of financial position. The difference between the gross receivables, i.e., undiscounted future cash flows, and the present value of the receivables is recognized as unearned finance income. Finance income is recognized over the lease term based on a pattern reflecting a constant periodic rate of return on the net investment in the finance lease.
Sale and leaseback
For sale and leaseback transactions leading to an operating lease, and the transaction took place at fair value, any profit or loss is recognized immediately. If the sale price is at or below fair value, any profit and loss is recognized immediately. However, if the loss is compensated for by future rentals at a below market price, the loss is deferred and amortized over the period that the asset is expected to be used. If the sale price is above fair value, any profit is deferred and amortized over the useful life of the asset. If the fair value of the asset is less than the carrying value of the asset at the date of transaction, that difference is recognized immediately as a loss on the sale.
Cash and Cash Equivalents
For the purposes of the consolidated statement of cash flows, cash and cash equivalents include cash on hand, demand deposits, and other short-term highly liquid financial assets with original maturities of three months or less, which are subject to insignificant risk of changes in their fair value.
Provisions
A provision is recognized if, as a result of a past event, the SMFG Group has a present legal or constructive obligation that can be estimated reliably and it is probable that an outflow of economic benefits will be required
F-21
to settle the obligation. Provisions are determined by discounting the expected future cash flows at a pre-tax rate that reflects current market assessments of the time value of money and, where appropriate, the risks specific to the liability.
Financial Guarantee Contracts
Financial guarantee contracts are contracts that require the issuer to make specified payments to reimburse the holder for a loss it incurs because a specified debtor fails to make payments when due in accordance with the terms of a debt instrument. Such financial guarantees are given to banks, financial institutions and other bodies on behalf of customers to secure loans, overdrafts and other banking facilities. Financial guarantees are initially recognized at fair value on the date the guarantee is given.
Subsequent to initial recognition, the SMFG Group’s liabilities under such guarantees are measured at the higher of the initial measurement, less amortization calculated to recognize in the consolidated income statement the fee income earned over the guarantee period, and the best estimate of the expenditure required to settle any financial obligation arising at the end of the reporting period. These estimates are determined based on experience of similar transactions and history of past losses, supplemented by the judgment of management.
Any increase in the liability relating to financial guarantee contracts is included in “Other expenses” in the consolidated income statement.
Employee Benefits
The SMFG Group operates various retirement benefit plans and other employee benefit plans.
Retirement benefits
The SMFG Group has defined benefit plans, such as defined benefit pension plans and lump-sum severance indemnity plans, and defined contribution plans.
The liabilities and the assets recognized in the consolidated statement of financial position in respect of defined benefit plans are the present value of the defined benefit obligation less the fair value of plan assets, together with adjustments for unrecognized actuarial gains or losses and past service costs.
The present value of the defined benefit obligation is calculated annually by qualified actuaries. The SMFG Group attributes the retirement benefits to periods of service on a straight-line basis because an employee’s service in later years will lead to a materially higher level of benefit than in earlier years. The present value of the defined benefit obligation is determined by discounting the estimated future cash outflows using market yields of AA credit-rated corporate bonds that have terms to maturity approximating those of the related obligations. In cases where there is no deep market in corporate bonds with a sufficiently long maturity to match the estimated maturity of the benefit payments, the SMFG Group uses current market rates of the appropriate term to discount shorter term payments and estimates the discount rates for longer maturities by extrapolating current market rates along the yield curve.
Actuarial gains and losses arising from experience adjustments and changes in actuarial assumptions in excess of the greater of 10% of the fair value of plan assets and 10% of the present value of the defined benefit obligation are recognized in the consolidated income statement over the employees’ expected average remaining working lives, in accordance with the corridor approach.
Past service costs are recognized immediately in the consolidated income statement, unless the changes to the plan are conditional on the employee’s remaining in service for a specified period of time (“vesting period”). If the changes to the plan are conditional on the employee’s remaining in service for a vesting period, the past service costs are amortized on a straight-line basis over the vesting period.
F-22
When the calculations above result in a benefit to the SMFG Group, the recognized asset is limited to the net total of any cumulative unrecognized actuarial losses and past service costs and the present value of any economic benefits available in the form of any refunds from the plan or reductions in future contributions to the plan. An economic benefit is available to the SMFG Group if it is realizable during the life of the plan or on settlement of the plan obligations.
| | (b) | Defined contribution plans |
Contributions to defined contribution plans are recognized as an expense in the consolidated income statement when they are due.
Other long-term employee benefits
The SMFG Group’s net obligation with respect to long-term employee benefits other than retirement benefits is the amount of future benefit that employees have earned in return for their service in the current and prior periods; that benefit is discounted to determine its present value and the fair value of any related assets is deducted. The discount rates are market yields of AA credit-rated corporate bonds that have terms to maturity approximating those of the related obligations. The calculation of obligations is performed using the projected unit credit method. Any actuarial gains or losses and past service costs are recognized in the consolidated income statement in the period in which they arise.
Short-term employee benefits
Short-term employee benefits, such as salaries, paid absences and other benefits are accounted for on an accrual basis over the period in which employees have provided services. Bonuses are recognized to the extent that the SMFG Group has a present obligation to its employees that can be measured reliably.
Income Tax
Income tax expense comprises current and deferred taxes. Income tax expense is recognized in the consolidated income statement except for that related to items recognized directly in equity. In such case, the income tax expense is recognized in equity.
Current tax is the expected tax payable or receivable on the taxable profit or loss for the fiscal year.
Deferred taxes are provided in full, using the balance sheet liability method, on temporary differences arising between the tax bases of assets and liabilities and their carrying amounts in the consolidated financial statements. Deferred taxes are determined using tax rates (and laws) that have been enacted or substantially enacted by the end of the reporting period and are expected to apply when the related deferred tax assets are realized or the deferred tax liabilities are settled.
Deferred tax assets principally arise from tax losses carried forward, impairment of investment securities and loans, and the allowance for loan losses.
Deferred taxes are not recognized for the following temporary differences: (a) the initial recognition of goodwill; (b) the initial recognition of assets or liabilities in a transaction that is not a business combination and that affects neither accounting nor taxable profit or loss; and (c) the temporary differences associated with investments in subsidiaries, associates, and joint ventures, when the parent investor is able to control the timing of the reversal of the temporary difference and it is probable that the temporary difference will not reverse in the foreseeable future.
Deferred tax assets relating to tax losses carried forward and deductible temporary differences are recognized where it is probable that future taxable profit will be available against which the tax losses carried forward and the deductible temporary differences can be utilized.
F-23
Debt and equity securities in issue
On initial recognition, financial instruments issued by the SMFG Group are classified in accordance with the substance of the contractual agreement as financial liabilities where the contractual arrangement results in the SMFG Group having a present obligation to either deliver cash or another financial asset to the holder, or to satisfy the obligation other than by delivering a fixed number of equity shares in exchange for a fixed amount of cash or another financial asset. The instruments or their components are classified as equity where they do not meet the definition of a liability and show evidence of a residual interest in the entity’s assets after deducting all of its liabilities. Compound financial instruments that contain both liability and equity elements are accounted for separately with the equity component being assigned the residual amount after deducting from the entire value of the compound financial instrument the fair value of the liability component which has been determined separately.
Shareholders’ Equity
Stock issuance costs
Incremental costs directly attributable to the issuance of new shares or options including those issued as a result of a business combination transaction are deducted from the proceeds and shown in equity, net of tax.
Dividends on common stock and preferred stock
Dividends on common stock and preferred stock are recognized in equity in the period in which they are approved by the shareholders. Dividends for the fiscal year that are declared after the reporting period are described in Note 41 “Dividends Per Share.”
Treasury stock
Where SMFG or the SMFG Group companies purchase SMFG’s common or preferred stock, the consideration paid is deducted from equity as treasury stock until they are cancelled or sold. No gain or loss is recognized on the purchase, sale, or cancellation of SMFG’s own equity instruments and the consideration paid or received is recognized in equity.
Interest Income and Expense
Interest income and expense for all financial instruments, except for those classified as held for trading and financial assets at fair value through profit or loss, are recognized in “Interest income” and “Interest expense” in the consolidated income statement using the effective interest method.
The effective interest method is a method of calculating the amortized cost of a financial asset or a financial liability and of allocating the interest income or interest expense over the relevant period.
The effective interest rate is the rate that discounts the estimated future cash payments or receipts through the expected life of the financial instrument or, when appropriate, a shorter period to the net carrying amount of the financial asset or financial liability. When calculating the effective interest rate, the SMFG Group estimates cash flows, considering the contractual terms of the financial instrument but not including future credit losses. The calculation includes fees and points paid or received between parties to the contract that are an integral part of the effective interest rate of the financial instrument, transaction costs and other premiums or discounts.
Once a financial asset or a group of similar financial assets has been written down as a result of an impairment loss, interest income is thereafter recognized using the rate of interest used to discount the future cash flows for the purpose of measuring the impairment loss. For financial assets measured at amortized cost, the interest rate is the original effective interest rate.
F-24
Fee and Commission Income
Fee and commission income includes fee and commission income arising from a diverse range of services that the SMFG Group provides to its customers. Fee and commission income can be divided into two categories: fee and commission income from providing transaction services, and fee and commission income earned from services that are provided over a certain period of time. Fee and commission income earned from providing transaction services is recognized when the service has been completed or the event has occurred. This fee and commission income includes fees on funds transfer and collection services, service charges from deposit accounts, fees and commissions on the securities business, underwriting fees, brokerage fees, and fee and commission income from other services. Fee and commission income earned from services over a period of time is recognized over that service period. This fee and commission income includes fees on credit-related businesses, investment fund businesses, and fee and commission income from other services. Loan commitment fees, together with the related direct cost, for loans that are likely to be drawn down are deferred and recognized as an adjustment to the effective interest rate on the loan. Loan commitment fees are recognized over the term of the commitment period when it is unlikely that a loan will be drawn down.
Net Trading Income
Net trading income consists of margins made on market-making and customer business, as well as changes in fair value of trading assets and liabilities and derivative financial instruments, caused by movements in interest rates, exchange rates, equity prices and other market variables. It also includes net interest and dividend income on trading assets and liabilities.
Net Income from Financial Assets at Fair Value through Profit or Loss
Net income from financial assets at fair value through profit or loss includes all gains and losses arising from changes in the fair value of these financial assets and sales of such assets, and interest and dividend income on these financial assets.
Net Investment Income
Net investment income includes gains and losses on the disposal of available-for-sale financial assets, and dividends from available-for-sale equity instruments.
Earnings Per Share
The SMFG Group presents basic and diluted earnings per share (“EPS”) data for its common stock. Basic EPS is calculated by dividing the profit or loss attributable to common shareholders of the SMFG Group by the weighted average number of common stock outstanding during the period. Diluted EPS is determined by adjusting the profit or loss attributable to common shareholders and the weighted average number of common stock outstanding for the effects of all dilutive potential common stock including share options and other convertible instruments.
Recent Accounting Pronouncements
The SMFG Group is currently assessing the impact of the following standards, amendments to standards, and interpretations that are not yet effective and have not been early adopted:
Disclosures—Transfers of Financial Assets (Amendments to IFRS 7)
In October 2010, the IASB issued amendments to IFRS 7 “Financial Instruments: Disclosures” to require additional disclosures of risk exposures arising from transferred financial assets. The current IFRS 7 requires certain disclosures related to transfers of financial assets that do not qualify for derecognition in their entirety.
F-25
The amendments not only enhance disclosures for those transfers, but also add a new set of disclosures for transfers of financial assets where derecognition is achieved in their entirety. The amendments are effective for annual periods beginning on or after July 1, 2011. The SMFG Group will adopt the amendments from its fiscal year beginning on April 1, 2012.
Deferred Tax: Recovery of Underlying Assets (Amendments to IAS 12)
In December 2010, the IASB issued amendments to IAS 12 “Income Taxes” to provide a practical approach for measuring deferred tax liabilities and deferred tax assets when investment property is measured using the fair value model. The measurement of deferred tax liabilities and deferred tax assets depends on whether an entity expects to recover the carrying amount by using it or by selling it. However, it is often difficult and subjective to determine the expected manner of recovery when the investment property is measured using the fair value model. To provide a practical approach in such cases, the amendments introduce a presumption that an investment property is recovered entirely through sale. The amendments are effective for annual periods beginning on or after January 1, 2012 and are not expected to have a material impact on the SMFG Group’s consolidated financial statements.
Presentation of Items of Other Comprehensive Income (Amendments to IAS 1)
In June 2011, the IASB issued amendments to IAS 1 “Presentation of Financial Statements” to require entities to separate items presented in other comprehensive income into two groups, based on whether or not they may be reclassified to profit or loss in the future. Items that will not be reclassified will be presented separately from items that may be reclassified in the future. The amendments also reaffirm existing requirements that items in other comprehensive income and profit or loss should be presented as either a single statement or two consecutive statements. The amendments are effective for annual periods beginning on or after July 1, 2012 and are not expected to have a material impact on the SMFG Group’s consolidated financial statements.
IFRS 10 “Consolidated Financial Statements”
In May 2011, the IASB issued IFRS 10 “Consolidated Financial Statements,” which replaces the consolidation requirements of IAS 27 and SIC-12. IFRS 10 contains a single consolidation model that identifies control as the basis for consolidation for all types of entities. Under IFRS 10, control is based on whether an investor has (a) power over the investee; (b) exposure, or rights, to variable returns from its involvement with the investee; and (c) the ability to use its power over the investee to affect the amount of the investor’s returns. IFRS 10 sets out requirements for assessing control, including cases involving potential voting rights, agency relationships, control of specified assets and circumstances in which voting rights are not the dominant factor in determining control. In June 2012, the IASB issuedConsolidated Financial Statements, Joint Arrangements and Disclosure of Interests in Other Entities: Transition Guidance (Amendments to IFRS 10, IFRS 11 and IFRS 12) (“Transition Guidance”). Transition Guidance clarifies the transition guidance in IFRS 10 and provides additional transition relief which limits the requirement to present adjusted comparative information to only the annual period immediately preceding the first annual period for which IFRS 10 is applied. The standard is effective for annual periods beginning on or after January 1, 2013. The SMFG Group is currently evaluating the potential impact that the adoption of the standard will have on its consolidated financial statements.
IFRS 11 “Joint Arrangements”
In May 2011, the IASB issued IFRS 11 “Joint Arrangements,” which replaces IAS 31 “Interests in Joint Ventures” and SIC-13 “Jointly Controlled Entities—Non-Monetary Contributions by Venturers.” IFRS 11 improves the accounting for joint arrangements by introducing a principle-based approach that requires a party to a joint arrangement to recognize its rights and obligations arising from the arrangement. Under IFRS 11, joint arrangements are classified either as joint operations or joint ventures. A joint operation is a joint arrangement whereby the parties that have joint control have rights to the assets and obligations for the liabilities. A joint
F-26
venture is a joint arrangement whereby the parties that have joint control have rights to the net assets. IFRS 11 also eliminates proportionate consolidation as a method to account for joint ventures. In June 2012, the IASB issued Transition Guidance to provide transition relief in IFRS 11 which limits the requirement to present adjusted comparative information to only the annual period immediately preceding the first annual period for which IFRS 11 is applied. The standard is effective for annual periods beginning on or after January 1, 2013. The SMFG Group is currently evaluating the potential impact that the adoption of the standard will have on its consolidated financial statements.
IFRS 12 “Disclosure of Interests in Other Entities”
In May 2011, the IASB issued IFRS 12 “Disclosure of Interests in Other Entities,” which provides a new and comprehensive standard on disclosure requirements for all forms of interests in other entities, including subsidiaries, joint arrangements, associates and unconsolidated structured entities. IFRS 12 sets out the required disclosures for entities reporting under IFRS 10 and IFRS 11, and replaces the disclosure requirements in IAS 28 “Investments in Associates.” It expands the disclosure requirements for subsidiaries with non-controlling interests, joint arrangements and associates that are individually material. It also requires an entity to disclose the nature of, and changes in, the risk associated with its interests in both its consolidated and unconsolidated structured entities. In June 2012, the IASB issued Transition Guidance to provide transition relief in IFRS 12 which limits the requirement to present adjusted comparative information to only the annual period immediately preceding the first annual period for which IFRS 12 is applied. Transition Guidance further removes the requirement to present comparative information for the disclosures relating to unconsolidated structured entities for any period before the first annual period for which IFRS 12 is applied. The standard is effective for annual periods beginning on or after January 1, 2013. The SMFG Group is currently evaluating the potential impact that the adoption of the standard will have on disclosures in its consolidated financial statements.
IAS 27 “Separate Financial Statements”
In May 2011, the IASB issued amended and retitled IAS 27 “Separate Financial Statements,” which supersedes the previous version of IAS 27. The requirements relating to separate financial statements are unchanged and are included in the amended IAS 27. The other portions of the previous version of IAS 27 are replaced by IFRS 10. The amended standard is effective for annual periods beginning on or after January 1, 2013 and is not expected to have a material impact on the SMFG Group’s consolidated financial statements.
IAS 28 “Investments in Associates and Joint Ventures”
In May 2011, the IASB issued amended and retitled IAS 28 “Investments in Associates and Joint Ventures,” which supersedes the previous version of IAS 28 and conforms changes based on the issuance of IFRS 10, IFRS 11 and IFRS 12. The amended standard is effective for annual periods beginning on or after January 1, 2013 and is not expected to have a material impact on the SMFG Group’s consolidated financial statements.
IFRS 13 “Fair Value Measurement”
In May 2011, the IASB issued IFRS 13 “Fair Value Measurement,” which defines fair value, sets out in a single IFRS a framework for measuring fair value and requires disclosures about fair value measurements. IFRS 13 applies when other IFRSs require or permit fair value measurements. It does not introduce any new requirements to measure an asset or a liability at fair value, change what is measured at fair value in IFRSs or address how to present changes in fair value. IFRS 13 provides clear and consistent guidance for measuring fair value and addressing valuation uncertainty in markets that are no longer active. It also increases the transparency of fair value measurements by requiring detailed disclosures about fair values derived by using models. The standard is effective for annual periods beginning on or after January 1, 2013. The SMFG Group is currently evaluating the potential impact that the adoption of the standard will have on its consolidated financial statements.
F-27
IAS 19 “Employee Benefits”
In June 2011, the IASB issued amendments to IAS 19 “Employee Benefits” to require entities to recognize all changes in the net defined benefit liability (asset) in the period in which those changes occur. The requirements include immediate recognition of defined benefit cost, disaggregation of defined benefit cost into components and recognition of remeasurements in other comprehensive income. The amended standard also requires additional disclosures about the risks arising from defined benefit plans. The amended standard is effective for annual periods beginning on or after January 1, 2013. The SMFG Group is currently evaluating the potential impact that the adoption of the amended standard will have on its consolidated financial statements.
IFRIC Interpretation 20 “Stripping Costs in the Production Phase of a Surface Mine”
In October 2011, the IASB issued IFRIC Interpretation 20 “Stripping Costs in the Production Phase of a Surface Mine,” which provides guidance on the accounting for stripping costs in the production phase of a surface mine. This interpretation clarifies when production stripping costs should lead to the recognition of an asset and how that asset should be measured, both initially and in subsequent periods. The interpretation is effective for annual periods beginning on or after January 1, 2013 and is not expected to have a material impact on the SMFG Group’s consolidated financial statements.
Disclosures—Offsetting Financial Assets and Financial Liabilities (Amendments to IFRS 7)
In December 2011, the IASB issued amendments to IFRS 7 to require additional disclosures for all recognized financial instruments that are set off in the statement of financial position and those recognized financial instruments that are subject to an enforceable master netting arrangement or similar agreement, irrespective of whether they are set off in accordance with IAS 32 “Financial Instruments: Presentation.” The amendments are effective for annual periods beginning on or after January 1, 2013. The SMFG Group is currently evaluating the potential impact that the adoption of the amendments will have on disclosures in its consolidated financial statements.
Annual Improvements to IFRSs 2009-2011 Cycle
In May 2012, the IASB issued Annual Improvements to IFRSs 2009-2011 Cycle, a collection of amendments to standards, as part of its annual improvements process under which the IASB makes necessary, but non-urgent, amendments to standards. Five standards are primarily affected by the amendments, with consequential amendments to other standards. The amendments are effective for annual periods beginning on or after January 1, 2013 and are not expected to have a material impact on the SMFG Group’s consolidated financial statements.
Offsetting Financial Assets and Financial Liabilities (Amendments to IAS 32)
In December 2011, the IASB issued amendments to IAS 32 to clarify the requirements for offsetting financial assets and financial liabilities. The amendments clarify the meaning of an entity’s current legally enforceable right of set-off; that is, the right of set-off must not be contingent on a future event and must be legally enforceable for the entity and all counterparties in the normal course of business, in the event of default and in the event of insolvency or bankruptcy. The amendments also clarify that some gross settlement systems may be considered equivalent to net settlement. The amendments are effective for annual periods beginning on or after January 1, 2014. The SMFG Group is currently evaluating the potential impact that the adoption of the amendments will have on its consolidated financial statements.
IFRS 9 “Financial Instruments”
In November 2009 and October 2010, the IASB issued IFRS 9 “Financial Instruments,” which introduces new requirements for classifying and measuring financial assets and liabilities. The standard requires all financial
F-28
assets to be classified as fair value or amortized cost. A financial asset is measured at amortized cost if the asset is held within a business model whose objective is to hold the asset in order to collect contractual cash flows, and the asset’s contractual terms give rise on specified dates to cash flows that are solely payments of principal and interest on the principal amount outstanding. All other financial assets are measured at fair value. For an investment in an equity instrument which is not held for trading, the standard permits an irrevocable election, on initial recognition, on an instrument-by-instrument basis, to present all fair value changes from the investment in other comprehensive income. The standard also requires that derivatives embedded in contracts with a host that is a financial asset within the scope of the standard are not separated; instead, the hybrid financial instrument is assessed in its entirety as to whether it should be measured at fair value or amortized cost. The standard maintains most of the requirements in IAS 39 regarding the classification and measurement of financial liabilities. However, with the new requirements, if an entity chooses to measure a financial liability at fair value, the amount of change in its fair value that is attributable to changes in the credit risk of that liability will be presented in other comprehensive income, rather than in profit or loss. The standard was initially issued with a mandatory effective date of January 1, 2013. However, in December 2011, the IASB issuedMandatory Effective Date and Transition Disclosures (Amendments to IFRS 9 and IFRS 7), which defers the mandatory effective date to annual periods beginning on or after January 1, 2015. The amendments also provide the relief from restating prior periods by amending IFRS 7 to require additional disclosures on transition from IAS 39 to IFRS 9. The SMFG Group is currently evaluating the potential impact that the adoption of the standard will have on its consolidated financial statements.
| 3 | CRITICAL ACCOUNTING ESTIMATES AND JUDGMENTS |
The consolidated financial statements are influenced by estimates and management judgment, which necessarily have to be made in the course of preparation of the consolidated financial statements. Estimates and judgments are based on historical experience and other factors, including expectations of future events that are believed to be reasonable under the circumstances, and which are continually evaluated.
Key Sources of Estimation Uncertainty
Allowance for loan losses
Allowance for loan losses represents management’s estimate of the losses incurred in the loan portfolios at the end of each reporting period. Management exercises judgment in making assumptions and estimations when calculating the allowance for loan losses on both individually and collectively assessed loans.
The allowance for loan losses for individually significant impaired loans is estimated by management based on the expected future cash flows, taking into account factors such as historical loss information, the appropriateness of the borrower’s business plan or operational improvement plan, the status of progress of its plan, the overall support from financial institutions, and the realizable value of any collateral held. The allowance for loan losses for the remaining loans is collectively estimated by grouping financial assets into portfolios on the basis of similar credit risk characteristics and using the historical loss experience for these portfolios adjusted for the effect of the current economic environment. To assess the losses on the loan portfolios where loss events have occurred but not yet been identified, management develops assumptions and methodologies to estimate the loss identification period.
Management estimates and judgments may change from time to time as the economic environment changes or new information becomes available. Changes in these estimates and judgments will result in a different allowance for loan losses and may have a direct impact on impairment charges. The impairment charges for loan losses totaled ¥144,022 million, ¥259,292 million and ¥215,886 million for the fiscal years ended March 31, 2012, 2011 and 2010, respectively. For additional information, refer to Note 10 “Loans and Advances” and Note 32 “Impairment Charges on Financial Assets.”
F-29
Fair value of financial instruments
The fair values of financial instruments where no active market exists or where quoted prices are not otherwise available are determined by using valuation techniques. In these cases, inputs to valuation techniques are based on observable data with respect to similar financial instruments or by using models. Where observable inputs are not available, the fair value is estimated based on appropriate assumptions that a market participant would take into account. Where valuation techniques (for example, models) are used to determine fair values, they are validated and periodically reviewed. All models are certified before they are used, and calibrated to ensure that outputs reflect actual data and comparative market prices. To the extent practical, models use only observable data; however, areas such as credit risk (both own and counterparty), volatilities and correlations require management to make estimates. Changes in assumptions about these factors could affect the fair values of these financial instruments. More details about the SMFG Group’s valuation techniques, and the sensitivity analyses of fair values for financial instruments with significant unobservable inputs to reasonably possible alternative assumptions are given in Note 44 “Fair Value of Financial Assets and Liabilities.”
Impairment of available-for-sale financial assets
Available-for-sale financial assets are impaired if there is objective evidence of impairment as a result of loss events. The SMFG Group exercises judgment in determining whether there is objective evidence of occurrence of loss events, which result in a decrease in estimated future cash flows of the financial assets. The estimation of future cash flows also requires judgment. In the assessment of impairment of available-for-sale equity instruments, the SMFG Group also considers whether there has been a significant or prolonged decline in fair value below their cost. The determination of what is a significant or prolonged decline requires management judgment.
Impairment may occur when there is objective evidence of deterioration in the financial conditions of the investee, industry and sector performance, or changes in operating and financing cash flows. The determination of impairment in this respect also includes significant management judgment.
Management estimates and judgments may change from time to time based upon future events that may or may not occur and changes in these estimates and judgments could adversely affect the carrying amounts of available-for-sale financial assets. Impairment charges on available-for-sale financial assets totaled ¥140,288 million, ¥174,636 million and ¥42,755 million for the fiscal years ended March 31, 2012, 2011 and 2010, respectively. For additional information, refer to Note 9 “Investment Securities” and Note 32 “Impairment Charges on Financial Assets.”
Impairment of goodwill
Goodwill is tested for impairment on an annual basis or more frequently if events or changes in circumstances indicate that it may not be recoverable. If any such indication exists, then its recoverable amount is estimated. The process to determine the recoverable amount is inherently uncertain because such recoverable amount is determined based on a number of management estimates and judgments. The SMFG Group determines the recoverable amount using the estimated future cash flows, pre-tax discount rates, growth rates, and other factors. The estimation of future cash flows inherently reflects management judgments, even though such forecasts are prepared taking into account actual performance and external economic data. The pre-tax discount rates and growth rates may be significantly affected by market interest rates or other market conditions, which are beyond management’s control, and therefore significant management judgments are made to determine these assumptions. These management judgments are made based on the facts and circumstances at the time of the impairment test, and may vary depending on the situation and the time. Changes in management judgments may result in different impairment test results and different impairment amounts recognized. For the fiscal years ended March 31, 2012, 2011 and 2010, impairment losses on goodwill were ¥1,884 million, nil and ¥3,918 million, respectively. For additional information, refer to Note 14 “Intangible Assets.”
F-30
Provision for Interest Repayment
Provision for interest repayment represents management’s estimate of future claims for the refund of so-called “gray zone interest” (interest on loans in excess of the maximum rate prescribed by the Interest Rate Restriction Act (ranging from 15% to 20%) up to the 29.2% maximum rate permitted under the Act Regulating the Receipt of Contributions, Receipt of Deposits and Interest Rates), taking into account historical experience such as the number of customer claims for a refund, the amount of repayments and the customers’ characteristics, and the length of the period the claims are expected to be received in the future.
Management estimates and judgments may change from time to time as the legal environment and market conditions change or new information becomes available. Changes in these estimates and judgments could affect the balance of provision for interest repayment. Provision for interest repayment is recorded in provisions as a liability, and it totaled ¥400,233 million and ¥72,219 million at March 31, 2012 and 2011, respectively. For additional information, refer to Note 20 “Provisions.”
Retirement benefits
The SMFG Group has defined benefit plans such as defined benefit pension plans and lump-sum severance indemnity plans. The present value of the defined benefit obligation is calculated based on actuarial valuations that are dependent upon a number of assumptions, including discount rates, mortality rates and future salary (benefit) increases. The discount rates are equivalent to market yields of AA credit-rated corporate bonds that have terms to maturity approximating those of the related obligations. Future mortality rates are based on the official mortality table generally used for actuarial assumptions in Japan. Other assumptions used for the calculation of the defined benefit obligation are based on historical records. The expected return on plan assets is developed separately for each plan, typically using a building block approach recognizing the plan’s specific asset allocation and the assumed return on assets for each asset category. Due to the long-term nature of these plans, such estimates are subject to significant uncertainty. Any change in these assumptions will impact actuarial gains and losses, as well as the present value of the defined benefit obligations and the net retirement benefit expense for each period. Actuarial gains and losses in excess of the greater of 10% of the fair value of plan assets and 10% of the present value of the defined benefit obligation are recognized in the consolidated income statement over the employees’ expected average remaining working lives. The amounts of cumulative unrecognized actuarial losses, net of gains, at March 31, 2012 and 2011 were ¥307,776 million and ¥210,534 million, respectively. For additional information, refer to Note 23 “Retirement Benefits.”
Deferred tax assets
Deferred tax assets relating to tax losses carried forward and deductible temporary differences are recognized, only to the extent that it is probable that future taxable profit will be available against which the tax losses carried forward and the deductible temporary differences can be utilized. This assessment requires significant management estimates and judgments. Future taxable profit is estimated based on, among other relevant factors, forecasted operating results, which are based on historical financial performance and the business plans that management believes to be prudent and feasible. While the SMFG Group carefully assesses the realization of tax losses carried forward and deductible temporary differences, the actual taxable profit in the future may be less than the forecast. The net deferred tax assets amounted to ¥562,890 million and ¥1,001,140 million at March 31, 2012 and 2011, respectively. For additional information, refer to Note 22 “Deferred Income Tax.”
Critical Accounting Judgments
Special purpose entities
The SMFG Group is involved in transactions using special purpose vehicles, which may be deemed as SPEs under IFRS in areas including the securitization of financial assets.
F-31
The SMFG Group consolidates SPEs, if the SMFG Group controls the SPEs in terms of potential indicators of control under IFRS. As it can sometimes be difficult to determine whether the SMFG Group controls an SPE, management makes judgments about its exposure to the risks and rewards, as well as about its ability to make operational decisions for the SPE in question.
Business Segments
The SMFG Group’s business segment information is prepared based on the internal reporting system utilized by management to assess the performance of its business segments. For the fiscal year ended March 31, 2012, there were no material changes in the organizational structure that affected the composition of the business segments. The SMFG Group has four main business segments: Commercial Banking, Securities, Leasing and Credit Card, with the remaining operations recorded in Others. The business segment information covers SMBC, which accounts for the major portion of the SMFG Group’s total assets and revenue, in Commercial Banking, SMBC Nikko Securities Inc. (“SMBC Nikko Securities”) and SMBC Friend Securities Co., Ltd. (“SMBC Friend Securities”) in Securities, Sumitomo Mitsui Finance and Leasing Company, Limited (“SMFL”) in Leasing, and Sumitomo Mitsui Card Company, Limited (“Sumitomo Mitsui Card”) and Cedyna Financial Corporation (“Cedyna”) in Credit Card.
Commercial Banking
SMBC consists of the majority of the Commercial Banking segment, and the remainder includes, but is not limited to, domestic banking subsidiaries, such as Kansai Urban Banking Corporation (“KUBC”) and THE MINATO BANK, LTD. and The Japan Net Bank, Limited, as well as foreign banking subsidiaries, such as Sumitomo Mitsui Banking Corporation Europe Limited (“SMBC Europe”), Manufacturers Bank and Sumitomo Mitsui Banking Corporation (China) Limited (“SMBC (China)”). Since SMBC has a significant impact on the overall performance of the SMFG Group, its performance is reported to management in more detail by dividing it into five business units by customer market: the Consumer Banking Unit, the Middle Market Banking Unit, the Corporate Banking Unit, the International Banking Unit and the Treasury Unit. The revenues and expenses of the Investment Banking Unit, which develops and provides investment banking products and services, are in principle allocated to each business unit.
SMBC’s Consumer Banking Unit
SMBC’s Consumer Banking Unit provides financial services to individual consumers residing in Japan. This business unit offers a wide array of financial services including, but not limited to, personal bank accounts, investment trusts, pension-type insurance products, life insurance products and housing loans.
SMBC’s Middle Market Banking Unit
SMBC’s Middle Market Banking Unit provides financial services targeting mid-sized companies and small- and medium-sized enterprises. This business unit, through its sales channels and certain of other SMFG Group companies, offers its customers lending, cash management, settlement, leasing, factoring, management information systems consulting, collection and investment banking services.
SMBC’s Corporate Banking Unit
SMBC’s Corporate Banking Unit provides a wide range of financial products and services such as loans, deposits and settlement services, targeting large Japanese corporations and listed companies. This business unit also provides products and services such as loan syndication, structured finance, commitment lines and nonrecourse loans with SMBC’s Investment Banking Unit.
F-32
SMBC’s International Banking Unit
SMBC’s International Banking Unit mainly supports companies, financial institutions, sovereign/quasi-sovereign entities outside Japan, and multinational companies operating in Japan. This business unit has branches in the Americas, Europe and Middle East, and Asia and Oceania regions, forming a global network. This business unit provides a variety of tailored products and services including loans, deposits, clearing services, trade finance, project finance, loan syndication and global cash management services.
SMBC’s Treasury Unit
SMBC’s Treasury Unit operates in the domestic and international money, foreign exchange, securities and derivatives markets to serve customer needs and SMBC’s own asset and liability management requirements. To further expand SMBC’s customer base, this business unit also seeks to provide specialized solutions and enhance customer service capabilities in market transactions through providing a variety of products from traditional money and foreign-exchange transactions to derivative transactions.
SMBC’s Others
SMBC’s Others represents the difference between the aggregate of SMBC’s five business units and SMBC as a whole. It mainly consists of administrative expenses related to the headquarters operations and profit or loss on the activities related to capital management. Amounts recorded in SMBC’s Others include those related to the Corporate Staff Unit, the Corporate Services Unit, the Compliance Unit, the Risk Management Unit and the Internal Audit Unit, which do not belong to any of the five business units.
In addition, the revenues and expenses of the Investment Banking Unit, which develops and provides investment banking products and services, are in principle allocated to each business unit.
Securities
Securities mainly consists of SMBC Nikko Securities and SMBC Friend Securities. SMBC Nikko Securities, which the SMFG Group acquired on October 1, 2009, is one of the major Japanese securities brokers and offers a wide range of financial products, investment consultation and administration services to its individual and corporate customers in Japan. For individual customers, SMBC Nikko Securities provides consulting services to meet diversified asset management needs, and an online trading tool. For corporate customers, it offers trading capabilities and financial products, debt and equity underwriting, and M&A advisory services, mainly in Japan. SMBC Friend Securities is a full-line securities company focusing on retail business in Japan.
Leasing
Leasing mainly consists of SMFL, SMBC Leasing and Finance, Inc., a U.S. subsidiary, and Sumitomo Mitsui Auto Service, an associate of the SMFG Group. SMFL is one of the major leasing companies in Japan and provides a variety of leasing services, including equipment lease, operating lease, leveraged lease and aircraft operating lease. In 2007, SMFL was formed as a result of the merger of SMBC Leasing and Sumisho Lease, aiming at combining the know-how obtained from the expertise of the SMFG Group in providing financial solutions, and the expertise of Sumitomo Corporation, a non-affiliate, in commercial products and business distribution.
Credit Card
Credit Card mainly consists of Sumitomo Mitsui Card and Cedyna. Sumitomo Mitsui Card is a leading company in the domestic credit card industry, having introduced the Visa brand into the Japanese market. Sumitomo Mitsui Card conducts a comprehensive credit card business and offers a variety of settlement and
F-33
financing services. Cedyna conducts credit card, installment (such as shopping credit and automobile loan), and solution (such as collection and factoring) businesses. Cedyna was established as an associate of the SMFG Group on April 1, 2009 by a merger between Central Finance Co., Limited, QUOQ Inc. and OMC Card, Inc. On May 31, 2010, the SMFG Group acquired the majority stake in Cedyna and subsequently made it a wholly-owned subsidiary by a share exchange with an effective date of May 1, 2011.
SMFG’s Others
SMFG’s Others represents the difference between the aggregate of Commercial Banking, Securities, Leasing and Credit Card segments, and the SMFG Group as a whole. It mainly consists of profit or loss from SMFG on a stand-alone basis, other subsidiaries and equity-method associates, including The Japan Research Institute, Limited, ORIX Credit Corporation, and Promise Co., Ltd. (“Promise”), now known as SMBC Consumer Finance Co., Ltd. It also includes internal transactions between the SMFG Group companies, which are eliminated in the consolidated financial statements.
Measurement of Segment Profit or Loss
The business segment information is prepared under the management approach. Consolidated net business profit is used as a profit indicator of banks in Japan. Consolidated net business profit is calculated by deducting general and administrative expenses (i.e., the total of personnel expense, non-personnel expense and tax, excluding nonrecurring factors) from gross profits (i.e., the total of net interest income, trust fees, net fee and commission income, net trading income and net other operating income). While the SMFG Group’s disclosure complies with the requirements on segment information in accordance with IFRS, the figures reported to management and disclosed herein are prepared under accounting principles generally accepted in Japan (“Japanese GAAP”). Consequently, the business segment information does not agree with the figures in the consolidated financial statements under IFRS. These differences are addressed in the “Reconciliation of Segmental Results of Operation to Consolidated Income Statement.”
Information regarding the total assets of each segment is not used by management in deciding how to allocate resources and assess performance. Accordingly, total assets are not included in the business segment information.
F-34
Segmental Results of Operation
For the fiscal year ended March 31, 2012:
| | | | | | | | | | | | | | | | | | | | | | | | | | | | | | | | |
| | | Commercial Banking | |
| | SMBC | | | Total(3) | |
| | | Consumer
Banking
Unit | | | Middle
Market
Banking
Unit | | | Corporate
Banking
Unit | | | International
Banking
Unit | | | Treasury
Unit | | | Others | | | SMBC Total | | | | |
| | | (In billions) | |
Gross profit | | ¥ | 383.7 | | | ¥ | 422.9 | | | ¥ | 212.6 | | | ¥ | 197.4 | | | ¥ | 319.3 | | | ¥ | (3.4 | ) | | ¥ | 1,532.5 | | | ¥ | 1,763.9 | |
Net interest income | | | 326.9 | | | | 256.8 | | | | 136.6 | | | | 111.6 | | | | 123.1 | | | | 1.9 | | | | 956.9 | | | | 1,113.5 | |
Net non-interest income | | | 56.8 | | | | 166.1 | | | | 76.0 | | | | 85.8 | | | | 196.2 | | | | (5.3 | ) | | | 575.6 | | | | 650.4 | |
General and administrative expenses | | | (289.5 | ) | | | (222.8 | ) | | | (38.2 | ) | | | (64.9 | ) | | | (19.2 | ) | | | (84.9 | ) | | | (719.5 | ) | | | (851.3 | ) |
Other profit (loss)(1) | | | — | | | | — | | | | — | | | | — | | | | — | | | | — | | | | — | | | | (20.5 | ) |
| | | | | | | | | | | | | | | | | | | | | | | | | | | | | | | | |
Consolidated net business profit(2)(5) | | ¥ | 94.2 | | | ¥ | 200.1 | | | ¥ | 174.4 | | | ¥ | 132.5 | | | ¥ | 300.1 | | | ¥ | (88.3 | ) | | ¥ | 813.0 | | | ¥ | 892.1 | |
| | | | | | | | | | | | | | | | | | | | | | | | | | | | | | | | |
| | | | | | | | | | | | | | | | | | | | | | | | | | | | | | | | | | | | | | | | |
| | | Securities | | | Leasing | | | Credit Card | | | Others | | | Total | |
| | | SMBC
Nikko
Securities | | | SMBC
Friend
Securities | | | Total(3) | | | Sumitomo
Mitsui
Finance &
Leasing | | | Total(3) | | | Sumitomo
Mitsui
Card | | | Cedyna | | | Total(3) | | | | | | | |
| | | (In billions) | |
Gross profit | | ¥ | 221.3 | | | ¥ | 47.4 | | | ¥ | 277.9 | | | ¥ | 88.5 | | | ¥ | 93.8 | | | ¥ | 179.3 | | | ¥ | 160.1 | | | ¥ | 345.9 | | | ¥ | 128.6 | | | ¥ | 2,610.1 | |
Net interest income | | | (2.5 | ) | | | 0.5 | | | | (0.7 | ) | | | 55.8 | | | | 54.8 | | | | 18.5 | | | | 36.4 | | | | 56.8 | | | | 125.1 | | | | 1,349.5 | |
Net non-interest income | | | 223.8 | | | | 46.9 | | | | 278.6 | | | | 32.7 | | | | 39.0 | | | | 160.8 | | | | 123.7 | | | | 289.1 | | | | 3.5 | | | | 1,260.6 | |
General and administrative expenses | | | (180.1 | ) | | | (39.1 | ) | | | (224.5 | ) | | | (28.1 | ) | | | (39.6 | ) | | | (126.6 | ) | | | (120.6 | ) | | | (252.2 | ) | | | (7.0 | ) | | | (1,374.6 | ) |
Other profit (loss)(1) | | | (1.2 | ) | | | — | | | | (2.6 | ) | | | (1.0 | ) | | | 8.2 | | | | (9.6 | ) | | | (67.2 | ) | | | (73.9 | ) | | | (132.8 | ) | | | (221.6 | ) |
| | | | | | | | | | | | | | | | | | | | | | | | | | | | | | | | | | | | | | | | |
Consolidated net business profit(2)(5) | | ¥ | 40.0 | | | ¥ | 8.3 | | | ¥ | 50.8 | | | ¥ | 59.4 | | | ¥ | 62.4 | | | ¥ | 43.1 | | | ¥ | (27.7 | ) | | ¥ | 19.8 | | | ¥ | (11.2 | ) | | ¥ | 1,013.9 | |
| | | | | | | | | | | | | | | | | | | | | | | | | | | | | | | | | | | | | | | | |
F-35
For the fiscal year ended March 31, 2011:
| | | | | | | | | | | | | | | | | | | | | | | | | | | | | | | | |
| | | Commercial Banking | |
| | SMBC | | | Total(3) | |
| | | Consumer
Banking
Unit | | | Middle
Market
Banking
Unit | | | Corporate
Banking
Unit | | | International
Banking
Unit | | | Treasury
Unit | | | Others | | | SMBC Total | | | | |
| | | (In billions) | |
Gross profit | | ¥ | 387.8 | | | ¥ | 443.9 | | | ¥ | 201.3 | | | ¥ | 186.5 | | | ¥ | 330.7 | | | ¥ | (18.4 | ) | | ¥ | 1,531.8 | | | ¥ | 1,773.5 | |
Net interest income | | | 337.5 | | | | 272.9 | | | | 131.4 | | | | 107.7 | | | | 136.3 | | | | (18.0 | ) | | | 967.8 | | | | 1,117.6 | |
Net non-interest income | | | 50.3 | | | | 171.0 | | | | 69.9 | | | | 78.8 | | | | 194.4 | | | | (0.4 | ) | | | 564.0 | | | | 655.9 | |
General and administrative expenses | | | (290.3 | ) | | | (221.7 | ) | | | (36.0 | ) | | | (57.9 | ) | | | (17.9 | ) | | | (75.4 | ) | | | (699.2 | ) | | | (834.2 | ) |
Other profit (loss)(1) | | | — | | | | — | | | | — | | | | — | | | | — | | | | — | | | | — | | | | (34.4 | ) |
| | | | | | | | | | | | | | | | | | | | | | | | | | | | | | | | |
Consolidated net business profit(2)(5) | | ¥ | 97.5 | | | ¥ | 222.2 | | | ¥ | 165.3 | | | ¥ | 128.6 | | | ¥ | 312.8 | | | ¥ | (93.8 | ) | | ¥ | 832.6 | | | ¥ | 904.9 | |
| | | | | | | | | | | | | | | | | | | | | | | | | | | | | | | | |
| | | | | | | | | | | | | | | | | | | | | | | | | | | | | | | | | | | | | | | | |
| | | Securities | | | Leasing | | | Credit Card | | | Others | | | Total | |
| | | SMBC
Nikko
Securities | | | SMBC
Friend
Securities | | | Total(3) | | | Sumitomo
Mitsui
Finance &
Leasing | | | Total(3) | | | Sumitomo
Mitsui
Card | | | Cedyna(4) | | | Total(3) | | | | | | | |
| | | (In billions) | |
Gross profit | | ¥ | 205.2 | | | ¥ | 53.0 | | | ¥ | 261.6 | | | ¥ | 95.2 | | | ¥ | 99.4 | | | ¥ | 182.3 | | | ¥ | 134.4 | | | ¥ | 322.5 | | | ¥ | 75.6 | | | ¥ | 2,532.6 | |
Net interest income | | | (2.7 | ) | | | 0.6 | | | | (1.3 | ) | | | 60.0 | | | | 56.7 | | | | 22.9 | | | | 36.8 | | | | 62.3 | | | | 100.3 | | | | 1,335.6 | |
Net non-interest income | | | 207.9 | | | | 52.4 | | | | 262.9 | | | | 35.2 | | | | 42.7 | | | | 159.4 | | | | 97.6 | | | | 260.2 | | | | (24.7 | ) | | | 1,197.0 | |
General and administrative expenses | | | (166.7 | ) | | | (42.7 | ) | | | (212.4 | ) | | | (28.1 | ) | | | (38.0 | ) | | | (129.8 | ) | | | (97.5 | ) | | | (229.4 | ) | | | 12.9 | | | | (1,301.1 | ) |
Other profit (loss)(1) | | | — | | | | — | | | | (5.6 | ) | | | (16.9 | ) | | | (3.8 | ) | | | (19.9 | ) | | | (37.5 | ) | | | (57.4 | ) | | | (128.3 | ) | | | (229.5 | ) |
| | | | | | | | | | | | | | | | | | | | | | | | | | | | | | | | | | | | | | | | |
Consolidated net business profit(2)(5) | | ¥ | 38.5 | | | ¥ | 10.3 | | | ¥ | 43.6 | | | ¥ | 50.2 | | | ¥ | 57.6 | | | ¥ | 32.6 | | | ¥ | (0.6 | ) | | ¥ | 35.7 | | | ¥ | (39.8 | ) | | ¥ | 1,002.0 | |
| | | | | | | | | | | | | | | | | | | | | | | | | | | | | | | | | | | | | | | | |
F-36
For the fiscal year ended March 31, 2010:
| | | | | | | | | | | | | | | | | | | | | | | | | | | | | | | | |
| | | Commercial Banking | |
| | SMBC | | | Total(3) | |
| | | Consumer
Banking
Unit | | | Middle
Market
Banking
Unit | | | Corporate
Banking
Unit | | | International
Banking
Unit | | | Treasury
Unit | | | Others | | | SMBC
Total | | | | |
| | | (In billions) | |
Gross profit | | ¥ | 391.7 | | | ¥ | 472.9 | | | ¥ | 197.3 | | | ¥ | 169.1 | | | ¥ | 272.8 | | | ¥ | (48.5 | ) | | ¥ | 1,455.3 | | | ¥ | 1,669.3 | |
Net interest income | | | 357.2 | | | | 298.2 | | | | 125.9 | | | | 110.1 | | | | 187.5 | | | | (32.5 | ) | | | 1,046.4 | | | | 1,181.9 | |
Net non-interest income | | | 34.5 | | | | 174.7 | | | | 71.4 | | | | 59.0 | | | | 85.3 | | | | (16.0 | ) | | | 408.9 | | | | 487.4 | |
General and administrative expenses | | | (288.7 | ) | | | (218.7 | ) | | | (33.3 | ) | | | (54.5 | ) | | | (16.3 | ) | | | (74.3 | ) | | | (685.8 | ) | | | (803.3 | ) |
Other profit (loss)(1) | | | — | | | | — | | | | — | | | | — | | | | — | | | | — | | | | — | | | | (132.8 | ) |
| | | | | | | | | | | | | | | | | | | | | | | | | | | | | | | | |
Consolidated net business profit(2)(5) | | ¥ | 103.0 | | | ¥ | 254.2 | | | ¥ | 164.0 | | | ¥ | 114.6 | | | ¥ | 256.5 | | | ¥ | (122.8 | ) | | ¥ | 769.5 | | | ¥ | 733.2 | |
| | | | | | | | | | | | | | | | | | | | | | | | | | | | | | | | |
| | | | | | | | | | | | | | | | | | | | | | | | | | | | | | | | | | | | | | | | |
| | | Securities | | | Leasing | | | Credit Card | | | Others | | | Total | |
| | | SMBC
Nikko
Securities(4) | | | SMBC
Friend
Securities | | | Total(3) | | | Sumitomo
Mitsui
Finance &
Leasing | | | Total(3) | | | Sumitomo
Mitsui
Card | | | Cedyna | | | Total(3) | | | | | | | |
| | | (In billions) | |
Gross profit | | ¥ | 100.5 | | | ¥ | 67.2 | | | ¥ | 161.4 | | | ¥ | 97.2 | | | ¥ | 109.5 | | | ¥ | 183.6 | | | ¥ | — | | | ¥ | 183.4 | | | ¥ | 19.2 | | | ¥ | 2,142.8 | |
Net interest income | | | (1.4 | ) | | | 0.6 | | | | (0.2 | ) | | | 59.8 | | | | 64.5 | | | | 27.5 | | | | — | | | | 29.3 | | | | 9.9 | | | | 1,285.4 | |
Net non-interest income | | | 101.9 | | | | 66.6 | | | | 161.6 | | | | 37.4 | | | | 45.0 | | | | 156.1 | | | | — | | | | 154.1 | | | | 9.3 | | | | 857.4 | |
General and administrative expenses | | | (77.0 | ) | | | (44.4 | ) | | | (124.3 | ) | | | (28.5 | ) | | | (40.9 | ) | | | (135.8 | ) | | | — | | | | (137.9 | ) | | | 6.5 | | | | (1,099.9 | ) |
Other profit (loss)(1) | | | — | | | | — | | | | 13.7 | | | | (24.8 | ) | | | (27.5 | ) | | | (23.5 | ) | | | — | | | | (40.4 | ) | | | (23.6 | ) | | | (210.6 | ) |
| | | | | | | | | | | | | | | | | | | | | | | | | | | | | | | | | | | | | | | | |
Consolidated net business profit(2)(5) | | ¥ | 23.5 | | | ¥ | 22.8 | | | ¥ | 50.8 | | | ¥ | 43.9 | | | ¥ | 41.1 | | | ¥ | 24.3 | | | ¥ | — | | | ¥ | 5.1 | | | ¥ | 2.1 | | | ¥ | 832.3 | |
| | | | | | | | | | | | | | | | | | | | | | | | | | | | | | | | | | | | | | | | |
| (1) | Other profit (loss) in “Total” of each segment includes non-operating profits and losses of subsidiaries other than SMBC and ordinary profit of equity-method associates taking into account the ownership ratio. |
| (2) | The Group’s consolidated net business profit = SMBC’s business profit on a nonconsolidated basis, excluding the effect of the reversal of reserve for possible loan losses + ordinary profit of other consolidated subsidiaries (with adjustment for extraordinary items) + (ordinary profit of equity-method associates * ownership ratio)—internal transactions (such as dividends) under Japanese GAAP. |
| | Consolidated net business profit of SMBC Nikko Securities, SMBC Friend Securities, SMFL, Sumitomo Mitsui Card and Cedyna is the operating profit (loss) of each company. |
| (3) | Total under each business segment includes the aggregation of the results from the operating units that were not separately identified (e.g., the difference between “Total” in Commercial Banking and “SMBC Total” consists of SMFG’s banking subsidiaries except SMBC, such as SMBC Europe, SMBC (China), KUBC and THE MINATO BANK, LTD.). |
| (4) | The results of SMBC Nikko Securities for the fiscal year ended March 31, 2010 only include six months of SMBC Nikko Securities’ results. The results of Cedyna for the fiscal year ended March 31, 2011 include the SMFG Group’s ownership ratio of the first quarter of Cedyna’s results and the full results of Cedyna for subsequent quarters. |
| (5) | The Group’s total credit cost (reversal) for the fiscal years ended March 31, 2012, 2011 and 2010 was ¥116.8 billion, ¥217.3 billion and ¥473.0 billion, respectively, of which ¥78.1 billion, ¥144.6 billion and ¥395.1 billion was for Commercial Banking, ¥1.2 billion, ¥(0.02) billion and ¥0.03 billion was for Securities, ¥(3.6) billion, ¥8.0 billion and ¥27.4 billion was for Leasing, and ¥36.8 billion, ¥46.6 billion and ¥26.1 billion was for Credit Card. Total credit cost consists of credit cost and gains on recoveries of written-off claims. Credit cost of SMBC and gains on recoveries of written-off claims were not included in consolidated net business profit, but in “Loans and advances” in the reconciliation table in the section “Reconciliation of Segmental Results of Operation to Consolidated Income Statement.” |
F-37
Reconciliation of Segmental Results of Operation to Consolidated Income Statement
The figures provided in the tables above are calculated by aggregating the figures used for management reporting under Japanese GAAP for each segment. The total amount of consolidated net business profits that is calculated by each business segment based on the internal managerial data is reconciled to profit before tax reported in the consolidated financial statements under IFRS as shown in the following table:
| | | | | | | | | | | | |
| | | Reconciliation between
Consolidated net business profit and Profit before tax | |
For the fiscal year ended March 31, 2012: | | Differences between
Management
reporting and
Japanese GAAP | | | Differences
between IFRS and
Japanese GAAP | | | Total | |
| | | (In billions) | |
Consolidated net business profit | | ¥ | 1,013.9 | | | | | | | ¥ | 1,013.9 | |
| | | | | | | | | | | | |
Scope of consolidation | | | 86.1 | | | ¥ | (1.1 | ) | | | 85.0 | |
Derivative financial instruments | | | — | | | | (56.5 | ) | | | (56.5 | ) |
Investment securities | | | (15.2 | ) | | | (43.2 | ) | | | (58.4 | ) |
Loans and advances | | | (56.7 | ) | | | (5.1 | ) | | | (61.8 | ) |
Investments in associates and joint ventures | | | (6.5 | ) | | | 23.4 | | | | 16.9 | |
Property, plant and equipment | | | (7.6 | ) | | | 6.1 | | | | (1.5 | ) |
Defined benefit plans | | | (32.2 | ) | | | 34.3 | | | | 2.1 | |
Foreign currency translation | | | — | | | | 0.6 | | | | 0.6 | |
Lease accounting | | | — | | | | (5.3 | ) | | | (5.3 | ) |
Others | | | (28.8 | ) | | | 13.0 | | | | (15.8 | ) |
| | | | | | | | | | | | |
Profit before tax under Japanese GAAP | | ¥ | 953.0 | | | | | | | | | |
| | | | | | | | | | | | |
Total differences between IFRS and Japanese GAAP | | | ¥ | (33.8 | ) | | | | |
| | | | | | | | | | | | |
Profit before tax under IFRS | | | ¥ | 919.2 | |
| | | | | | | | | | | | |
| |
| | | Reconciliation between
Consolidated net business profit and Profit before tax | |
For the fiscal year ended March 31, 2011: | | Differences between
Management
reporting and
Japanese GAAP | | | Differences
between IFRS and
Japanese GAAP | | | Total | |
| | | (In billions) | |
Consolidated net business profit | | ¥ | 1,002.0 | | | | | | | ¥ | 1,002.0 | |
| | | | | | | | | | | | |
Scope of consolidation | | | 85.1 | | | ¥ | 30.2 | | | | 115.3 | |
Derivative financial instruments | | | — | | | | 97.3 | | | | 97.3 | |
Investment securities | | | (87.3 | ) | | | (19.2 | ) | | | (106.5 | ) |
Loans and advances | | | (97.0 | ) | | | (62.8 | ) | | | (159.8 | ) |
Investments in associates and joint ventures | | | (12.9 | ) | | | (0.4 | ) | | | (13.3 | ) |
Property, plant and equipment | | | (10.4 | ) | | | 3.0 | | | | (7.4 | ) |
Defined benefit plans | | | (38.6 | ) | | | 48.6 | | | | 10.0 | |
Foreign currency translation | | | — | | | | 9.9 | | | | 9.9 | |
Lease accounting | | | — | | | | (9.2 | ) | | | (9.2 | ) |
Others | | | (13.6 | ) | | | 8.0 | | | | (5.6 | ) |
| | | | | | | | | | | | |
Profit before tax under Japanese GAAP | | ¥ | 827.3 | | | | | | | | | |
| | | | | | | | | | | | |
Total differences between IFRS and Japanese GAAP | | | ¥ | 105.4 | | | | | |
| | | | | | | | | | | | |
Profit before tax under IFRS | | | ¥ | 932.7 | |
| | | | | | | | | | | | |
F-38
| | | | | | | | | | | | |
| | | Reconciliation between
Consolidated net business profit and Profit before tax | |
For the fiscal year ended March 31, 2010: | | Differences between
Management
reporting and
Japanese GAAP | | | Differences
between IFRS and
Japanese GAAP | | | Total | |
| | | (In billions) | |
Consolidated net business profit | | ¥ | 832.3 | | | | | | | ¥ | 832.3 | |
| | | | | | | | | | | | |
Scope of consolidation | | | 91.7 | | | ¥ | 48.2 | | | | 139.9 | |
Derivative financial instruments | | | — | | | | 82.2 | | | | 82.2 | |
Investment securities | | | 3.8 | | | | 100.8 | | | | 104.6 | |
Loans and advances | | | (257.9 | ) | | | 232.8 | | | | (25.1 | ) |
Investments in associates and joint ventures | | | (27.5 | ) | | | 19.6 | | | | (7.9 | ) |
Property, plant and equipment | | | (1.7 | ) | | | 6.5 | | | | 4.8 | |
Defined benefit plans | | | (48.0 | ) | | | 45.5 | | | | (2.5 | ) |
Classification of equity and liability | | | — | | | | 20.2 | | | | 20.2 | |
Foreign currency translation | | | — | | | | (1.5 | ) | | | (1.5 | ) |
Lease accounting | | | — | | | | (8.8 | ) | | | (8.8 | ) |
Others | | | (34.6 | ) | | | 31.1 | | | | (3.5 | ) |
| | | | | | | | | | | | |
Profit before tax under Japanese GAAP | | ¥ | 558.1 | | | | | | | | | |
| | | | | | | | | | | | |
Total differences between IFRS and Japanese GAAP | | | ¥ | 576.6 | | | | | |
| | | | | | | | | | | | |
Profit before tax under IFRS | | | ¥ | 1,134.7 | |
| | | | | | | | | | | | |
Information about Geographical Areas
The following table shows the total operating income in accordance with IFRS by the main geographical areas. The SMFG Group’s services are provided to domestic and foreign clients on a worldwide basis. These include transactions where SMBC’s branches in Japan may deal with customers located in foreign countries and where SMBC’s overseas branches may provide services to Japanese companies.
To identify income attributed to each geographical area for the purposes of this disclosure, they are aggregated based on the geographical location of the booking entity, with the assumption that transactions booked in booking entities are deemed to have occurred in their respective geographical areas.
| | | | | | | | | | | | |
| | | For the fiscal year ended March 31, | |
| | | 2012 | | | 2011 | | | 2010 | |
| | | (In millions) | |
Domestic(2): | | | | | | | | | | | | |
Japan | | ¥ | 2,501,305 | | | ¥ | 2,584,873 | | | ¥ | 2,372,369 | |
| | | | | | | | | | | | |
Total domestic | | | 2,501,305 | | | | 2,584,873 | | | | 2,372,369 | |
| | | | | | | | | | | | |
Foreign(2)(3): | | | | | | | | | | | | |
Americas | | | 91,472 | | | | 110,339 | | | | 194,470 | |
Europe and Middle East | | | 94,698 | | | | 70,791 | | | | 101,749 | |
Asia and Oceania | | | 147,028 | | | | 112,242 | | | | 95,965 | |
| | | | | | | | | | | | |
Total foreign | | | 333,198 | | | | 293,372 | | | | 392,184 | |
| | | | | | | | | | | | |
Total operating income(1) | | ¥ | 2,834,503 | | | ¥ | 2,878,245 | | | ¥ | 2,764,553 | |
| | | | | | | | | | | | |
| (1) | Total operating income comprises net interest income, net fee and commission income, net trading income, net income from financial assets at fair value through profit or loss, net investment income and other income. |
| (2) | The geographical segmentation is determined based on the degrees of the following factors: geographic proximity, similarity of economic activities and relationship of business activities among regions. |
| (3) | Americas includes the United States, Brazil, Canada and others; Europe and Middle East include the United Kingdom, Germany, France and others; Asia and Oceania include China, Singapore, Australia and others except Japan. |
F-39
| 5 | CASH AND DEPOSITS WITH BANKS |
Cash and deposits with banks at March 31, 2012 and 2011 consisted of the following:
| | | | | | | | |
| | | At March 31, | |
| | | 2012 | | | 2011 | |
| | | (In millions) | |
Cash | | ¥ | 989,279 | | | ¥ | 1,285,847 | |
Deposits with banks | | | 7,061,283 | | | | 8,150,511 | |
| | | | | | | | |
Total cash and deposits with banks | | ¥ | 8,050,562 | | | ¥ | 9,436,358 | |
| | | | | | | | |
The reconciliation of cash and cash equivalents used for the purposes of the consolidated statement of cash flows at March 31, 2012, 2011 and 2010 is shown as follows:
| | | | | | | | | | | | |
| | | At March 31, | |
| | | 2012 | | | 2011 | | | 2010 | |
| | | (In millions) | |
Cash and deposits with banks | | ¥ | 8,050,562 | | | ¥ | 9,436,358 | | | ¥ | 6,239,398 | |
Less: term deposits with original maturities over three months | | | (727,139 | ) | | | (680,935 | ) | | | (436,334 | ) |
Less: cash segregated as deposits and others | | | (267,753 | ) | | | (181,824 | ) | | | (191,501 | ) |
| | | | | | | | | | | | |
Cash and cash equivalents | | ¥ | 7,055,670 | | | ¥ | 8,573,599 | | | ¥ | 5,611,563 | |
| | | | | | | | | | | | |
Private depository institutions in Japan are required to maintain certain minimum reserve funds with the Bank of Japan, based on average deposit balances and certain other factors. There are similar reserve deposit requirements for the SMFG Group’s foreign offices engaged in banking businesses in foreign countries. At March 31, 2012, 2011 and 2010, the reserve funds, which were included in cash and cash equivalents, amounted to ¥3,960,209 million, ¥3,829,002 million and ¥2,032,456 million, respectively.
Trading assets at March 31, 2012 and 2011 consisted of the following:
| | | | | | | | |
| | | At March 31, | |
| | | 2012 | | | 2011 | |
| | | (In millions) | |
Debt instruments | | ¥ | 4,132,979 | | | ¥ | 3,105,897 | |
Equity instruments | | | 328,279 | | | | 209,256 | |
| | | | | | | | |
Total trading assets | | ¥ | 4,461,258 | | | ¥ | 3,315,153 | |
| | | | | | | | |
Trading debt instruments mainly consist of Japanese government bonds, Japanese municipal bonds and commercial papers. Trading equity instruments mainly consist of investment funds and Japanese listed stocks.
| 7 | DERIVATIVE FINANCIAL INSTRUMENTS |
Derivative financial instruments include futures, forwards, swaps, options and other types of derivative contracts, which are transactions listed on exchanges or over-the-counter (“OTC”) transactions. In the normal course of business, the SMFG Group enters into a variety of derivatives for trading and risk management purposes. The SMFG Group uses derivatives for trading activities, which include facilitating customer transactions, market-making and arbitrage activities. The SMFG Group also uses derivatives to reduce its exposures to market and credit risks as part of its asset and liability management, but does not apply hedge accounting.
F-40
Derivatives are financial instruments that derive their value from the price of underlying items such as interest rates, foreign exchange rates, equities, bonds, commodities, credit spreads and other indices. The SMFG Group’s derivative financial instruments mainly consist of interest rate derivatives and currency derivatives. Interest rate derivatives include interest rate futures, interest rate swaps and interest rate swaptions. Currency derivatives include currency swaps, foreign exchange forward transactions and currency options.
The tables below represent the derivative financial instruments by type and purpose of derivative at March 31, 2012 and 2011.
| | | | | | | | | | | | | | | | | | | | | | | | |
| | | At March 31, 2012 | |
| | | Trading | | | Risk Management(1) | |
| | | Notional
amounts | | | Assets | | | Liabilities | | | Notional
amounts | | | Assets | | | Liabilities | |
| | | (In millions) | |
Interest rate derivatives | | ¥ | 451,332,001 | | | ¥ | 4,009,540 | | | ¥ | 4,040,326 | | | ¥ | 44,595,733 | | | ¥ | 451,528 | | | ¥ | 427,772 | |
Futures | | | 32,034,925 | | | | 30,100 | | | | 29,755 | | | | 8,045,954 | | | | 65 | | | | 308 | |
Listed Options | | | 339,147 | | | | 60 | | | | 73 | | | | — | | | | — | | | | — | |
Forwards | | | 8,824,022 | | | | 1,463 | | | | 1,628 | | | | — | | | | — | | | | — | |
Swaps | | | 368,792,521 | | | | 3,899,877 | | | | 3,900,163 | | | | 36,205,248 | | | | 448,516 | | | | 427,198 | |
OTC Options | | | 41,341,386 | | | | 78,040 | | | | 108,707 | | | | 344,531 | | | | 2,947 | | | | 266 | |
Currency derivatives | | | 64,352,811 | | | | 964,172 | | | | 1,167,005 | | | | 3,637,149 | | | | 337,040 | | | | 81,703 | |
Futures | | | 1,414,647 | | | | — | | | | — | | | | — | | | | — | | | | — | |
Listed Options | | | — | | | | — | | | | — | | | | — | | | | — | | | | — | |
Forwards | | | 36,202,320 | | | | 570,465 | | | | 496,637 | | | | 244,547 | | | | 755 | | | | 543 | |
Swaps | | | 19,733,333 | | | | 56,151 | | | | 425,896 | | | | 3,392,602 | | | | 336,285 | | | | 81,160 | |
OTC Options | | | 7,002,511 | | | | 337,556 | | | | 244,472 | | | | — | | | | — | | | | — | |
Equity derivatives | | | 800,990 | | | | 52,093 | | | | 57,086 | | | | 13,057 | | | | 30 | | | | 366 | |
Futures | | | 382,950 | | | | 1,504 | | | | 6,830 | | | | — | | | | — | | | | — | |
Listed Options | | | 630 | | | | 2 | | | | 1 | | | | — | | | | — | | | | — | |
Forwards | | | 32,228 | | | | 823 | | | | 305 | | | | — | | | | — | | | | — | |
Swaps | | | 10,035 | | | | 23 | | | | 185 | | | | 13,057 | | | | 30 | | | | 366 | |
OTC Options | | | 375,147 | | | | 49,741 | | | | 49,765 | | | | — | | | | — | | | | — | |
Commodity derivatives | | | 284,731 | | | | 68,062 | | | | 40,141 | | | | — | | | | — | | | | — | |
Futures | | | 11,737 | | | | 136 | | | | 146 | | | | — | | | | — | | | | — | |
Listed Options | | | — | | | | — | | | | — | | | | — | | | | — | | | | — | |
Forwards | | | — | | | | — | | | | — | | | | — | | | | — | | | | — | |
Swaps | | | 255,285 | | | | 67,379 | | | | 39,279 | | | | — | | | | — | | | | — | |
OTC Options | | | 17,709 | | | | 547 | | | | 716 | | | | — | | | | — | | | | — | |
Credit derivatives | | | 1,675,561 | | | | 19,061 | | | | 36,414 | | | | — | | | | — | | | | — | |
| | | | | | | | | | | | | | | | | | | | | | | | |
Total derivative financial instruments | | ¥ | 518,446,094 | | | ¥ | 5,112,928 | | | ¥ | 5,340,972 | | | ¥ | 48,245,939 | | | ¥ | 788,598 | | | ¥ | 509,841 | |
| | | | | | | | | | | | | | | | | | | | | | | | |
| (1) | Derivative financial instruments categorized as “Risk Management” are used for economic hedging, such as managing the exposure to changes in fair value of the loan portfolio, and are identified as hedges under Japanese GAAP, but the SMFG Group does not apply hedge accounting under IFRS. |
F-41
| | | | | | | | | | | | | | | | | | | | | | | | |
| | | At March 31, 2011 | |
| | | Trading | | | Risk Management(1) | |
| | | Notional
amounts | | | Assets | | | Liabilities | | | Notional
amounts | | | Assets | | | Liabilities | |
| | | (In millions) | |
Interest rate derivatives | | ¥ | 495,845,898 | | | ¥ | 2,968,609 | | | ¥ | 2,959,420 | | | ¥ | 48,188,973 | | | ¥ | 365,694 | | | ¥ | 349,570 | |
Futures | | | 72,265,454 | | | | 21,292 | | | | 23,412 | | | | 10,942,193 | | | | 535 | | | | 1,181 | |
Listed Options | | | 525,276 | | | | 43 | | | | 60 | | | | — | | | | — | | | | — | |
Forwards | | | 19,541,028 | | | | 5,881 | | | | 5,843 | | | | — | | | | — | | | | — | |
Swaps | | | 356,353,932 | | | | 2,847,841 | | | | 2,802,926 | | | | 36,772,822 | | | | 363,507 | | | | 347,805 | |
OTC Options | | | 47,160,208 | | | | 93,552 | | | | 127,179 | | | | 473,958 | | | | 1,652 | | | | 584 | |
Currency derivatives | | | 78,968,925 | | | | 1,113,735 | | | | 1,258,206 | | | | 2,797,985 | | | | 362,640 | | | | 28,376 | |
Futures | | | 8,980 | | | | 1 | | | | — | | | | — | | | | — | | | | — | |
Listed Options | | | — | | | | — | | | | — | | | | — | | | | — | | | | — | |
Forwards | | | 50,715,913 | | | | 561,155 | | | | 462,277 | | | | 9,616 | | | | — | | | | 173 | |
Swaps | | | 20,596,772 | | | | 99,389 | | | | 473,836 | | | | 2,788,369 | | | | 362,640 | | | | 28,203 | |
OTC Options | | | 7,647,260 | | | | 453,190 | | | | 322,093 | | | | — | | | | — | | | | — | |
Equity derivatives | | | 577,385 | | | | 46,910 | | | | 45,496 | | | | 21,521 | | | | 455 | | | | 1,083 | |
Futures | | | 177,990 | | | | 5,583 | | | | 3,584 | | | | — | | | | — | | | | — | |
Listed Options | | | 10,657 | | | | 116 | | | | 203 | | | | — | | | | — | | | | — | |
Forwards | | | — | | | | — | | | | — | | | | — | | | | — | | | | — | |
Swaps | | | — | | | | — | | | | — | | | | 21,521 | | | | 455 | | | | 1,083 | |
OTC Options | | | 388,738 | | | | 41,211 | | | | 41,709 | | | | — | | | | — | | | | — | |
Commodity derivatives | | | 377,569 | | | | 102,587 | | | | 61,839 | | | | — | | | | — | | | | — | |
Futures | | | 10,140 | | | | 113 | | | | 117 | | | | — | | | | — | | | | — | |
Listed Options | | | — | | | | — | | | | — | | | | — | | | | — | | | | — | |
Forwards | | | — | | | | — | | | | — | | | | — | | | | — | | | | — | |
Swaps | | | 340,733 | | | | 100,954 | | | | 60,451 | | | | — | | | | — | | | | — | |
OTC Options | | | 26,696 | | | | 1,520 | | | | 1,271 | | | | — | | | | — | | | | — | |
Credit derivatives | | | 2,296,589 | | | | 15,343 | | | | 21,271 | | | | — | | | | — | | | | — | |
| | | | | | | | | | | | | | | | | | | | | | | | |
Total derivative financial instruments | | ¥ | 578,066,366 | | | ¥ | 4,247,184 | | | ¥ | 4,346,232 | | | ¥ | 51,008,479 | | | ¥ | 728,789 | | | ¥ | 379,029 | |
| | | | | | | | | | | | | | | | | | | | | | | | |
| (1) | Derivative financial instruments categorized as “Risk Management” are used for economic hedging, such as managing the exposure to changes in fair value of the loan portfolio, and are identified as hedges under Japanese GAAP, but the SMFG Group does not apply hedge accounting under IFRS. |
F-42
Credit derivatives
The SMFG Group enters into credit derivatives to manage the risk of its commercial banking credit portfolio containing loans by hedging, as well as diversifying the credit exposure in the portfolio, and to undertake credit loss protection transactions based on the needs from customers as financial intermediation. The tables below provide information regarding the notional amounts and the fair value of credit derivatives by purpose.
| | | | | | | | | | | | | | | | | | | | | | | | |
| | | At March 31, 2012 | |
| | | Protection purchased | | | Protection sold | |
| | | Notional
amounts | | | Assets | | | Liabilities | | | Notional
amounts | | | Assets | | | Liabilities | |
| | | (In millions) | |
Managing the SMFG Group’s credit risk portfolio | | ¥ | 243,077 | | | ¥ | 462 | | | ¥ | 316 | | | ¥ | 423,232 | | | ¥ | 975 | | | ¥ | 16,837 | |
Trading purposes | | | 6,250 | | | | — | | | | 98 | | | | 156 | | | | — | | | | 7 | |
Facilitating client transactions | | | 480,948 | | | | 17,474 | | | | 100 | | | | 521,898 | | | | 150 | | | | 19,056 | |
| | | | | | | | | | | | | | | | | | | | | | | | |
Total | | ¥ | 730,275 | | | ¥ | 17,936 | | | ¥ | 514 | | | ¥ | 945,286 | | | ¥ | 1,125 | | | ¥ | 35,900 | |
| | | | | | | | | | | | | | | | | | | | | | | | |
| | | | | | | | | | | | | | | | | | | | | | | | |
| | | At March 31, 2011 | |
| | | Protection purchased | | | Protection sold | |
| | | Notional
amounts | | | Assets | | | Liabilities | | | Notional
amounts | | | Assets | | | Liabilities | |
| | | (In millions) | |
Managing the SMFG Group’s credit risk portfolio | | ¥ | 503,677 | | | ¥ | 569 | | | ¥ | 319 | | | ¥ | 576,875 | | | ¥ | 1,100 | | | ¥ | 7,379 | |
Trading purposes | | | 29,764 | | | | 169 | | | | 29 | | | | 35,061 | | | | 37 | | | | 204 | |
Facilitating client transactions | | | 575,606 | | | | 13,261 | | | | 173 | | | | 575,606 | | | | 207 | | | | 13,167 | |
| | | | | | | | | | | | | | | | | | | | | | | | |
Total | | ¥ | 1,109,047 | | | ¥ | 13,999 | | | ¥ | 521 | | | ¥ | 1,187,542 | | | ¥ | 1,344 | | | ¥ | 20,750 | |
| | | | | | | | | | | | | | | | | | | | | | | | |
The following table summarizes the notional amounts of the SMFG Group’s credit derivative portfolio by type of counterparty at March 31, 2012 and 2011.
| | | | | | | | | | | | | | | | |
| | | At March 31, | |
| | | 2012 | | | 2011 | |
| | | Notional amounts | | | Notional amounts | |
Type of counterparty: | | Protection
purchased | | | Protection
sold | | | Protection
purchased | | | Protection
sold | |
| | | (In millions) | |
Banks and broker-dealers | | ¥ | 494,176 | | | ¥ | 945,286 | | | ¥ | 787,784 | | | ¥ | 1,187,542 | |
Insurance and other financial guaranty firms | | | 236,099 | | | | — | | | | 321,263 | | | | — | |
| | | | | | | | | | | | | | | | |
Total | | ¥ | 730,275 | | | ¥ | 945,286 | | | ¥ | 1,109,047 | | | ¥ | 1,187,542 | |
| | | | | | | | | | | | | | | | |
| 8 | FINANCIAL ASSETS AT FAIR VALUE THROUGH PROFIT OR LOSS |
Financial assets at fair value through profit or loss at March 31, 2012 and 2011 consisted of the following:
| | | | | | | | |
| | | At March 31, | |
| | | 2012 | | | 2011 | |
| | | (In millions) | |
Debt instruments | | ¥ | 2,019,559 | | | ¥ | 1,995,810 | |
Equity instruments | | | 130,850 | | | | 136,538 | |
| | | | | | | | |
Total financial assets at fair value through profit or loss | | ¥ | 2,150,409 | | | ¥ | 2,132,348 | |
| | | | | | | | |
F-43
The SMFG Group classifies the entire hybrid instrument at fair value through profit or loss when the SMFG Group is required to separate an embedded derivative from its host contract, but is unable to measure the embedded derivative separately either at acquisition or at the end of a subsequent reporting period.
The SMFG Group also classifies certain financial assets held by a venture capital investment subsidiary as financial assets at fair value through profit or loss. These financial assets are managed and their performance is evaluated on a fair value basis in accordance with a documented risk management or investment strategy.
Investment securities at March 31, 2012 and 2011 consisted of the following:
| | | | | | | | |
| | | At March 31, | |
| | | 2012 | | | 2011 | |
| | | (In millions) | |
Held-to-maturity investments: | | | | | | | | |
Domestic: | | | | | | | | |
Japanese government bonds | | ¥ | 4,857,096 | | | ¥ | 3,763,715 | |
Japanese municipal bonds | | | 177,732 | | | | 171,516 | |
Japanese corporate bonds | | | 242,440 | | | | 246,609 | |
| | | | | | | | |
Total domestic | | | 5,277,268 | | | | 4,181,840 | |
| | | | | | | | |
Total held-to-maturity investments | | ¥ | 5,277,268 | | | ¥ | 4,181,840 | |
| | | | | | | | |
Available-for-sale financial assets: | | | | | | | | |
Domestic: | | | | | | | | |
Japanese government bonds | | ¥ | 22,530,293 | | | ¥ | 20,223,478 | |
Japanese municipal bonds | | | 297,815 | | | | 372,751 | |
Japanese corporate bonds | | | 381,963 | | | | 413,467 | |
Other debt instruments | | | 117,045 | | | | 205,222 | |
Equity instruments | | | 2,837,017 | | | | 2,885,397 | |
| | | | | | | | |
Total domestic | | | 26,164,133 | | | | 24,100,315 | |
| | | | | | | | |
Foreign: | | | | | | | | |
U.S. Treasury and other U.S. government agencies bonds | | | 4,404,769 | | | | 4,283,260 | |
Other governments and official institutions bonds | | | 538,175 | | | | 1,265,922 | |
Mortgage-backed securities | | | 331,071 | | | | 205,844 | |
Other debt instruments | | | 256,799 | | | | 293,573 | |
Equity instruments | | | 351,885 | | | | 331,352 | |
| | | | | | | | |
Total foreign | | | 5,882,699 | | | | 6,379,951 | |
| | | | | | | | |
Total available-for-sale financial assets | | ¥ | 32,046,832 | | | ¥ | 30,480,266 | |
| | | | | | | | |
Total investment securities | | ¥ | 37,324,100 | | | ¥ | 34,662,106 | |
| | | | | | | | |
Financial Stabilization Funds
The Financial Stabilization Funds (“Funds”) were established in 1996 by the Government of Japan in connection with the restructuring program for the loans of certain failed housing-loan companies. The Government of Japan requested Japanese domestic financial institutions to contribute to the Funds, including commercial banks, insurance companies, securities companies, as well as the Bank of Japan. The contributions to the Funds are non-interest earning and expected to mature 15 years from the contribution date.
The Funds invest principally in Japanese government bonds. The investment returns of the Funds are used to make up for the losses incurred from the restructuring program. On maturity of the Funds, if there are accumulated losses incurred through the collection of the loans made to the housing-loan companies (so-called “stage two losses”), the Government of Japan indicated that it would bear half of such losses.
F-44
The SMFG Group contributed ¥218,426 million to the Funds when they were established. Since the contributions to the Funds are non-interest earning, they were discounted to their present value at the time of the contribution and the discount is accrued until the expected maturity date using the effective interest method. The contributions to the Funds are included in other debt instruments in available-for-sale financial assets and are measured at fair value. The fair values of the Funds at the end of each reporting period are calculated by the DCF method using Japanese government bond yields. In March 2011, the Government of Japan approved the outline of final treatment for this program, where the Japanese domestic financial institutions, including the SMFG Group, would share the stage two losses evenly with the government and, as a consequence, would not recover a portion of the contributions to the Funds. Accordingly, at March 31, 2011, the SMFG Group calculated the fair value of the Funds and recognized an impairment loss based on the above development. The Funds have been closed progressively in accordance with the above-mentioned outline. The SMFG Group received ¥88,476 million as part of the closure in September 2011 and ¥117,045 million as final distributions of the Funds by June 2012. The SMFG Group did not recognize any additional impairment loss for the fiscal year ended March 31, 2012. The fair values of the Funds were ¥117,045 million and ¥205,222 million at March 31, 2012 and 2011, respectively.
The following are the principal components of loans and advances at March 31, 2012 and 2011 by industry classification.
| | | | | | | | |
| | | At March 31, | |
| | | 2012 | | | 2011 | |
| | | (In millions) | |
Domestic: | | | | | | | | |
Manufacturing | | ¥ | 8,462,004 | | | ¥ | 8,344,261 | |
Agriculture, forestry, fisheries and mining | | | 152,128 | | | | 162,727 | |
Construction | | | 1,284,882 | | | | 1,327,475 | |
Transportation, communications and public enterprises | | | 4,414,102 | | | | 4,036,780 | |
Wholesale and retail | | | 5,480,393 | | | | 5,616,084 | |
Finance and insurance | | | 2,170,776 | | | | 2,568,670 | |
Real estate and goods rental and leasing | | | 7,982,741 | | | | 8,281,048 | |
Services | | | 4,076,818 | | | | 4,316,724 | |
Municipalities | | | 1,234,355 | | | | 1,440,167 | |
Lease financing | | | 2,056,972 | | | | 2,205,451 | |
Consumer(1) | | | 19,185,574 | | | | 18,552,987 | |
Others | | | 4,155,960 | | | | 4,378,791 | |
| | | | | | | | |
Total domestic | | | 60,656,705 | | | | 61,231,165 | |
| | | | | | | | |
Foreign: | | | | | | | | |
Public sector | | | 130,426 | | | | 83,109 | |
Financial institutions | | | 2,012,751 | | | | 1,794,794 | |
Commerce and industry | | | 10,364,685 | | | | 8,949,629 | |
Lease financing | | | 191,966 | | | | 172,361 | |
Others | | | 706,175 | | | | 528,847 | |
| | | | | | | | |
Total foreign | | | 13,406,003 | | | | 11,528,740 | |
| | | | | | | | |
| | |
Gross loans and advances | | | 74,062,708 | | | | 72,759,905 | |
Adjust: Unearned income, unamortized premiums—net and deferred loan fees—net | | | (144,731 | ) | | | (152,443 | ) |
Less: Allowance for loan losses | | | (1,381,164 | ) | | | (1,587,133 | ) |
| | | | | | | | |
Net loans and advances | | ¥ | 72,536,813 | | | ¥ | 71,020,329 | |
| | | | | | | | |
| (1) | The balance in Consumer mainly consists of housing loans. The housing loan balances amounted to ¥14,574,702 million and ¥14,577,945 million at March 31, 2012 and 2011, respectively. |
F-45
Reconciliation of allowance for loan losses is as follows:
| | | | | | | | | | | | |
| | | For the fiscal year ended March 31, | |
| | | 2012 | | | 2011 | | | 2010 | |
| | | (In millions, except percentages) | |
Allowance for loan losses at beginning of period | | ¥ | 1,587,133 | | | ¥ | 1,533,555 | | | ¥ | 1,599,630 | |
Provision for loan losses | | | 144,022 | | | | 259,292 | | | | 215,886 | |
Charge-offs: | | | | | | | | | | | | |
Domestic | | | 306,607 | | | | 175,717 | | | | 360,895 | |
Foreign | | | 48,618 | | | | 24,044 | | | | 23,620 | |
| | | | | | | | | | | | |
Total | | | 355,225 | | | | 199,761 | | | | 384,515 | |
| | | | | | | | | | | | |
Recoveries: | | | | | | | | | | | | |
Domestic | | | 4,595 | | | | 2,624 | | | | 953 | |
Foreign | | | 207 | | | | 190 | | | | 16 | |
| | | | | | | | | | | | |
Total | | | 4,802 | | | | 2,814 | | | | 969 | |
| | | | | | | | | | | | |
Net charge-offs | | | 350,423 | | | | 196,947 | | | | 383,546 | |
Others(1) | | | 432 | | | | (8,767 | ) | | | 101,585 | |
| | | | | | | | | | | | |
Allowance for loan losses at end of period | | ¥ | 1,381,164 | | | ¥ | 1,587,133 | | | ¥ | 1,533,555 | |
| | | | | | | | | | | | |
Allowance for loan losses applicable to foreign activities: | | | | | | | | | | | | |
Balance at beginning of period | | ¥ | 108,612 | | | ¥ | 121,797 | | | ¥ | 192,325 | |
| | | | | | | | | | | | |
Balance at end of period | | ¥ | 87,344 | | | ¥ | 108,612 | | | ¥ | 121,797 | |
| | | | | | | | | | | | |
Provision (credit) for loan losses | | ¥ | 30,675 | | | ¥ | 19,501 | | | ¥ | (42,830 | ) |
| | | | | | | | | | | | |
Ratio of net charge-offs to average loans outstanding during the period | | | 0.47 | % | | | 0.27 | % | | | 0.51 | % |
| (1) | Others are primarily from foreign exchange translations for the fiscal year ended March 31, 2011, whereas the amount for the fiscal year ended March 31, 2010 mainly includes an increase in the allowance for loan losses of ¥102,687 million from the acquisition of subsidiaries. |
F-46
| 11 | INVESTMENTS IN ASSOCIATES AND JOINT VENTURES |
The following table presents the SMFG Group’s principal associates and joint ventures at March 31, 2012. Investments in associates and joint ventures of the SMFG Group are accounted for using the equity method unless they are held for sale.
| | | | | | | | | | | | |
Company Name | | Country of
Incorporation | | Proportion
of Ownership
Interest | | | Proportion
of Voting
Rights | | | Main Business |
| | | | | (%) | | | (%) | | | |
Principal Associates | | | | | | | | | | | | |
Vietnam Export Import Commercial Joint Stock Bank | | Vietnam | | | 15.0 | | | | 15.0 | | | Commercial banking |
Sumitomo Mitsui Auto Service Company, Limited | �� | Japan | | | 33.9 | | | | 33.9 | | | Leasing |
NEC Capital Solutions Limited | | Japan | | | 25.0 | | | | 25.0 | | | Leasing |
POCKET CARD CO., LTD. | | Japan | | | 35.5 | | | | 35.5 | | | Credit card |
Daiwa SB Investments Ltd. | | Japan | | | 43.9 | | | | 43.9 | | | Investment advisory and investment trust management |
Sumitomo Mitsui Asset Management Company, Limited | | Japan | | | 27.5 | | | | 27.5 | | | Investment advisory and investment trust management |
JSOL Corporation | | Japan | | | 50.0 | | | | 50.0 | | | System development and data processing |
Sakura Information Systems Co., Ltd. | | Japan | | | 49.0 | | | | 49.0 | | | System engineering and data processing |
Principal Joint Venture | | | | | | | | | | | | |
Daiwa Securities SMBC Principal Investments Co., Ltd. | | Japan | |
| 40.0
|
| |
| 40.0
|
| | Investments, fund management |
The SMFG Group accounts for certain investees, including Vietnam Export Import Commercial Joint Stock Bank, as associates regardless of its below 20% holdings of the voting rights to these investees, since the SMFG Group has the ability to exercise significant influence over these investees through participation in the policy making process at the meeting of the board of directors, the provision of essential technical information, or other relevant agreements or relationships.
On the other hand, the SMFG Group accounts for certain investees as available-for-sale financial assets regardless of its 20% or more holdings of the voting rights to these investees because the SMFG Group has contracts or arrangements with other investors by which the SMFG Group loses the power to exert significant influence over such investees.
F-47
The changes in the SMFG Group’s share of net assets of associates and joint ventures for the fiscal years ended March 31, 2012 and 2011 were as follows:
| | | | | | | | |
| | | At and for the fiscal year ended
March 31, | |
| | | 2012 | | | 2011 | |
| | | (In millions) | |
At beginning of period | | ¥ | 201,135 | | | ¥ | 289,141 | |
Share of post-tax loss of associates and joint ventures | | | (25,004 | ) | | | (5,796 | ) |
Dividends paid | | | (3,743 | ) | | | (2,287 | ) |
Changes in scope of consolidation | | | 21,455 | | | | (67,537 | ) |
New investments | | | 580 | | | | 10,724 | |
Disposals | | | (2,829 | ) | | | (335 | ) |
Impairment losses(1) | | | (656 | ) | | | (16,837 | ) |
Reversal of impairment losses(2) | | | 19,333 | | | | 13,533 | |
Exchange differences and other adjustments | | | (3,611 | ) | | | (19,471 | ) |
| | | | | | | | |
At end of period | | ¥ | 206,660 | | | ¥ | 201,135 | |
| | | | | | | | |
| (1) | Impairment losses are included in “Other expenses” in the consolidated income statement. |
| (2) | Reversal of impairment losses is included in “Other income” in the consolidated income statement. |
Summarized financial information of the SMFG Group’s associates and joint ventures at and for the fiscal years ended March 31, 2012 and 2011 was as follows:
| | | | | | | | |
| | | At and for the fiscal year ended
March 31, | |
| | | 2012 | | | 2011 | |
| | | (In millions) | |
Total assets | | ¥ | 2,726,397 | | | ¥ | 3,647,923 | |
Total liabilities | | | 2,221,169 | | | | 3,015,336 | |
Revenues | | | 932,912 | | | | 1,050,230 | |
Expenses | | | 1,055,524 | | | | 1,083,956 | |
Net loss | | | 122,612 | | | | 33,726 | |
The above amounts represent the aggregate of total assets, total liabilities, revenues, expenses and net loss of each associate and joint venture. They are principally based on the financial statements of the associates and joint ventures at March 31, 2012 and 2011. For the fiscal year ended March 31, 2010, revenues, expenses and net loss of the SMFG Group’s associates and joint ventures were ¥1,643,425 million, ¥1,658,503 million and ¥15,078 million, respectively.
The fair value of investments in associates for which there were published price quotations at March 31, 2012 and 2011 was as follows:
| | | | | | | | |
| | | At March 31, | |
| | | 2012 | | | 2011 | |
| | | (In millions) | |
Promise(1) | | ¥ | — | | | ¥ | 16,281 | |
Vietnam Export Import Commercial Joint Stock Bank. | | | 12,825 | | | | 9,251 | |
POCKET CARD CO., LTD | | | 9,754 | | | | 7,336 | |
NEC Capital Solutions Limited | | | 7,390 | | | | 7,352 | |
| (1) | The SMFG Group purchased the shares of Promise common stock through tender offer and made it a consolidated subsidiary on December 7, 2011. For further detail, refer to Note 48 “Acquisitions.” |
F-48
There are no significant restrictions on the ability of associates or joint ventures to transfer funds to the SMFG Group in the form of cash dividends, repayment of loans and advances.
| 12 | PROPERTY, PLANT AND EQUIPMENT |
The table below shows the changes in property, plant and equipment for the fiscal years ended March 31, 2012 and 2011.
| | | | | | | | | | | | | | | | | | | | |
| | | Land | | | Buildings | | | Leased
assets | | | Others | | | Total | |
| | | (In millions) | |
Cost | | ¥ | 505,046 | | | ¥ | 589,708 | | | ¥ | 13,575 | | | ¥ | 570,982 | | | ¥ | 1,679,311 | |
Accumulated depreciation and impairment losses | | | (7,837 | ) | | | (337,587 | ) | | | (4,029 | ) | | | (336,687 | ) | | | (686,140 | ) |
| | | | | | | | | | | | | | | | | | | | |
Net carrying amount at April 1, 2010 | | | 497,209 | | | | 252,121 | | | | 9,546 | | | | 234,295 | | | | 993,171 | |
| | | | | | | | | | | | | | | | | | | | |
Additions | | | 10,011 | | | | 23,289 | | | | 4,692 | | | | 129,265 | | | | 167,257 | |
Acquisition of subsidiaries | | | 461 | | | | 1,910 | | | | 728 | | | | 1,966 | | | | 5,065 | |
Disposals | | | (2,673 | ) | | | (2,389 | ) | | | (401 | ) | | | (5,365 | ) | | | (10,828 | ) |
Depreciation | | | — | | | | (18,830 | ) | | | (3,473 | ) | | | (54,309 | ) | | | (76,612 | ) |
Impairment losses | | | (2,231 | ) | | | (3,113 | ) | | | — | | | | (16 | ) | | | (5,360 | ) |
Exchange differences | | | (559 | ) | | | (457 | ) | | | (5 | ) | | | (2,605 | ) | | | (3,626 | ) |
Other changes | | | (699 | ) | | | 21,283 | | | | (41 | ) | | | (50,127 | ) | | | (29,584 | ) |
| | | | | | | | | | | | | | | | | | | | |
Net carrying amount | | | 501,519 | | | | 273,814 | | | | 11,046 | | | | 253,104 | | | | 1,039,483 | |
| | | | | | | | | | | | | | | | | | | | |
Cost | | | 510,874 | | | | 614,043 | | | | 19,781 | | | | 618,674 | | | | 1,763,372 | |
Accumulated depreciation and impairment losses | | | (9,355 | ) | | | (340,229 | ) | | | (8,735 | ) | | | (365,570 | ) | | | (723,889 | ) |
| | | | | | | | | | | | | | | | | | | | |
Net carrying amount at March 31, 2011 | | | 501,519 | | | | 273,814 | | | | 11,046 | | | | 253,104 | | | | 1,039,483 | |
| | | | | | | | | | | | | | | | | | | | |
Additions | | | 1,473 | | | | 27,659 | | | | 1,149 | | | | 89,955 | | | | 120,236 | |
Acquisition of subsidiaries | | | 3,360 | | | | 2,339 | | | | 197 | | | | 3,308 | | | | 9,204 | |
Disposals | | | (3,612 | ) | | | (3,707 | ) | | | (293 | ) | | | (15,768 | ) | | | (23,380 | ) |
Depreciation | | | — | | | | (18,784 | ) | | | (2,831 | ) | | | (56,152 | ) | | | (77,767 | ) |
Impairment losses | | | (751 | ) | | | (2,927 | ) | | | (76 | ) | | | (3 | ) | | | (3,757 | ) |
Exchange differences | | | (277 | ) | | | (104 | ) | | | 2 | | | | (890 | ) | | | (1,269 | ) |
Other changes | | | (8,575 | ) | | | 9,623 | | | | (14 | ) | | | (18,778 | ) | | | (17,744 | ) |
| | | | | | | | | | | | | | | | | | | | |
Net carrying amount | | | 493,137 | | | | 287,913 | | | | 9,180 | | | | 254,776 | | | | 1,045,006 | |
| | | | | | | | | | | | | | | | | | | | |
Cost | | | 501,364 | | | | 621,188 | | | | 19,240 | | | | 649,876 | | | | 1,791,668 | |
Accumulated depreciation and impairment losses | | | (8,227 | ) | | | (333,275 | ) | | | (10,060 | ) | | | (395,100 | ) | | | (746,662 | ) |
| | | | | | | | | | | | | | | | | | | | |
Net carrying amount at March 31, 2012 | | ¥ | 493,137 | | | ¥ | 287,913 | | | ¥ | 9,180 | | | ¥ | 254,776 | | | ¥ | 1,045,006 | |
| | | | | | | | | | | | | | | | | | | | |
The impairment losses on property, plant and equipment are included in “Other expenses” in the consolidated income statement.
Others include equipment and furniture, which had net carrying amounts of ¥242,190 million and ¥248,639 million at March 31, 2012 and 2011, respectively.
The SMFG Group had ¥44,058 million and ¥8,786 million of contractual commitments to acquire property, plant and equipment at March 31, 2012 and 2011, respectively.
F-49
The carrying amount of items of property, plant and equipment on which there was a restriction on sale was ¥10,126 million and ¥12,005 million at March 31, 2012 and 2011, respectively.
The carrying amount of items of property, plant and equipment pledged as security for liabilities was ¥14,336 million and ¥15,019 million at March 31, 2012 and 2011, respectively.
As Lessee
The SMFG Group leases land and buildings, office equipment, and other tangible and intangible assets from third parties under finance leases or operating leases.
The carrying amount of assets held under finance leases
The carrying amount of assets held under finance leases at March 31, 2012 and 2011 consisted of the following:
| | | | | | | | |
| | | At March 31, | |
| | | 2012 | | | 2011 | |
| | | (In millions) | |
Tangible assets: | | | | | | | | |
Land and buildings | | ¥ | 4,266 | | | ¥ | 4,610 | |
Other tangible assets(1) | | | 4,914 | | | | 6,436 | |
| | | | | | | | |
Total(2) | | | 9,180 | | | | 11,046 | |
| | | | | | | | |
Software | | | 200 | | | | 361 | |
| | | | | | | | |
Total(3) | | ¥ | 9,380 | | | ¥ | 11,407 | |
| | | | | | | | |
| (1) | Other tangible assets include mainly equipment, machinery and vehicles. |
| (2) | Cross-reference to Leased assets in Note 12 “Property, Plant and Equipment.” |
| (3) | The SMFG Group has sublet leased assets classified as finance leases (the carrying amount of those assets is not included in table above). Future minimum sublease payments related to sublet leased assets are included in finance lease commitments. |
Finance lease commitments
The total of future minimum lease payments and their present value under finance leases at March 31, 2012 and 2011 were as follows:
| | | | | | | | |
| | | At March 31, | |
| | | 2012 | | | 2011 | |
| | | (In millions) | |
Not later than one year | | ¥ | 19,225 | | | ¥ | 23,238 | |
Later than one year and not later than five years | | | 31,991 | | | | 38,594 | |
Later than five years | | | 5,608 | | | | 6,215 | |
| | | | | | | | |
Total | | | 56,824 | | | | 68,047 | |
Less: Future interest charges | | | (2,533 | ) | | | (3,070 | ) |
| | | | | | | | |
Present value of finance lease commitments(1) | | ¥ | 54,291 | | | ¥ | 64,977 | |
| | | | | | | | |
| (1) | Present value of finance lease commitments is included in “Borrowings” in the consolidated statement of financial position. See Note 18 “Borrowings.” |
At March 31, 2012 and 2011, the total amounts of future minimum sublease payments to be received under non-cancellable subleases were ¥45,552 million and ¥56,829 million, respectively.
F-50
Operating lease commitments
The total amounts of future minimum lease payments under non-cancellable operating leases at March 31, 2012 and 2011 were as follows:
| | | | | | | | |
| | | At March 31, | |
| | | 2012 | | | 2011 | |
| | | (In millions) | |
Not later than one year | | ¥ | 42,247 | | | ¥ | 34,805 | |
Later than one year and not later than five years | | | 114,998 | | | | 91,538 | |
Later than five years | | | 179,414 | | | | 175,511 | |
| | | | | | | | |
Total future minimum lease payments under non-cancellable operating leases | | ¥ | 336,659 | | | ¥ | 301,854 | |
| | | | | | | | |
For the fiscal years ended March 31, 2012, 2011 and 2010, ¥38,106 million, ¥30,360 million and ¥18,455 million were recognized as expenses in respect of lease and sublease agreements, of which ¥38,047 million, ¥30,303 million and ¥18,398 million related to minimum lease payments, and ¥59 million, ¥57 million and ¥57 million related to sublease payments, respectively. Lease expenses recognized in respect of lease and sublease agreements are included in “General and administrative expenses” in the consolidated income statement.
As Lessor
The SMFG Group leases assets to third parties under finance leases or operating leases, including machinery, equipment, aircraft, vessel and property.
Finance lease receivable
The gross investment in the lease, unearned finance income, present value of the minimum lease payments receivable and unguaranteed residual values under finance leases at March 31, 2012 and 2011 were as follows:
| | | | | | | | | | | | | | | | |
| | | At March 31, 2012 | |
| | | Gross investment
in the lease | | | Unearned
finance
income | | | Present value of
the minimum
lease payments
receivable(1) | | | Unguaranteed
residual values(1) | |
| | | (In millions) | |
Not later than one year | | ¥ | 777,722 | | | ¥ | 68,133 | | | ¥ | 709,589 | | | ¥ | 15,937 | |
Later than one year and not later than five years | | | 1,260,688 | | | | 97,041 | | | | 1,163,647 | | | | 115,586 | |
Later than five years | | | 251,528 | | | | 34,591 | | | | 216,937 | | | | 27,242 | |
| | | | | | | | | | | | | | | | |
Total | | ¥ | 2,289,938 | | | ¥ | 199,765 | | | ¥ | 2,090,173 | | | ¥ | 158,765 | |
| | | | | | | | | | | | | | | | |
| | | | | | | | | | | | | | | | |
| | | At March 31, 2011 | |
| | | Gross investment
in the lease | | | Unearned
finance
income | | | Present value of
the minimum
lease payments
receivable(1) | | | Unguaranteed
residual values(1) | |
| | | (In millions) | |
Not later than one year | | ¥ | 820,899 | | | ¥ | 72,426 | | | ¥ | 748,473 | | | ¥ | 21,293 | |
Later than one year and not later than five years | | | 1,344,722 | | | | 107,421 | | | | 1,237,301 | | | | 114,948 | |
Later than five years | | | 260,862 | | | | 36,895 | | | | 223,967 | | | | 31,830 | |
| | | | | | | | | | | | | | | | |
Total | | ¥ | 2,426,483 | | | ¥ | 216,742 | | | ¥ | 2,209,741 | | | ¥ | 168,071 | |
| | | | | | | | | | | | | | | | |
| (1) | Present value of the minimum lease payments receivable and unguaranteed residual values are included in “Loans and advances” in the consolidated statement of financial position. |
F-51
Accumulated allowance for uncollectible minimum lease payments receivable was ¥16,266 million and ¥27,976 million at March 31, 2012 and 2011, respectively.
Operating lease receivable
The total amount of the future minimum lease payments receivable under non-cancellable operating leases at March 31, 2012 and 2011 was as follows:
| | | | | | | | |
| | | At March 31, | |
| | | 2012 | | | 2011 | |
| | | (In millions) | |
Not later than one year | | ¥ | 35,329 | | | ¥ | 36,995 | |
Later than one year and not later than five years | | | 100,369 | | | | 101,846 | |
Later than five years | | | 58,446 | | | | 54,704 | |
| | | | | | | | |
Total | | ¥ | 194,144 | | | ¥ | 193,545 | |
| | | | | | | | |
Goodwill
The table below shows the changes in goodwill by business segment for the fiscal years ended March 31, 2012 and 2011.
| | | | | | | | | | | | | | | | | | | | | | | | |
| | | Commercial
Banking | | | Securities | | | Leasing | | | Credit
Card | | | Others | | | Total | |
| | | (In millions) | |
Gross amount of goodwill | | ¥ | 11,197 | | | ¥ | 256,936 | | | ¥ | 102,710 | | | ¥ | 260 | | | ¥ | 5,458 | | | ¥ | 376,561 | |
Accumulated impairment losses | | | — | | | | (10,067 | ) | | | — | | | | — | | | | (3,992 | ) | | | (14,059 | ) |
| | | | | | | | | | | | | | | | | | | | | | | | |
Net carrying amount at April 1, 2010 | | | 11,197 | | | | 246,869 | | | | 102,710 | | | | 260 | | | | 1,466 | | | | 362,502 | |
| | | | | | | | | | | | | | | | | | | | | | | | |
Acquisitions | | | — | | | | — | | | | — | | | | 5,000 | | | | 1,884 | | | | 6,884 | |
Impairment losses | | | — | | | | — | | | | — | | | | — | | | | — | | | | — | |
| | | | | | | | | | | | | | | | | | | | | | | | |
Net carrying amount | | | 11,197 | | | | 246,869 | | | | 102,710 | | | | 5,260 | | | | 3,350 | | | | 369,386 | |
Gross amount of goodwill | | | 11,197 | | | | 256,936 | | | | 102,710 | | | | 5,260 | | | | 7,342 | | | | 383,445 | |
Accumulated impairment losses | | | — | | | | (10,067 | ) | | | — | | | | — | | | | (3,992 | ) | | | (14,059 | ) |
| | | | | | | | | | | | | | | | | | | | | | | | |
Net carrying amount at March 31, 2011 | | | 11,197 | | | | 246,869 | | | | 102,710 | | | | 5,260 | | | | 3,350 | | | | 369,386 | |
| | | | | | | | | | | | | | | | | | | | | | | | |
Acquisitions | | | — | | | | — | | | | — | | | | — | | | | 56,692 | | | | 56,692 | |
Impairment losses | | | — | | | | — | | | | — | | | | — | | | | (1,884 | ) | | | (1,884 | ) |
| | | | | | | | | | | | | | | | | | | | | | | | |
Net carrying amount | | | 11,197 | | | | 246,869 | | | | 102,710 | | | | 5,260 | | | | 58,158 | | | | 424,194 | |
Gross amount of goodwill | | | 11,197 | | | | 256,936 | | | | 102,710 | | | | 5,260 | | | | 64,034 | | | | 440,137 | |
Accumulated impairment losses | | | — | | | | (10,067 | ) | | | — | | | | — | | | | (5,876 | ) | | | (15,943 | ) |
| | | | | | | | | | | | | | | | | | | | | | | | |
Net carrying amount at March 31, 2012 | | ¥ | 11,197 | | | ¥ | 246,869 | | | ¥ | 102,710 | | | ¥ | 5,260 | | | ¥ | 58,158 | | | ¥ | 424,194 | |
| | | | | | | | | | | | | | | | | | | | | | | | |
The impairment losses on goodwill are included in “Other expenses” in the consolidated income statement.
Changes in goodwill during the fiscal year ended March 31, 2012
During the fiscal year ended March 31, 2012, the SMFG Group recognized goodwill of ¥56,692 million in Others resulting from the acquisition of Promise, now known as SMBC Consumer Finance.
F-52
Changes in goodwill during the fiscal year ended March 31, 2011
During the fiscal year ended March 31, 2011, the SMFG Group recognized goodwill of ¥6,884 million, ¥5,000 million of which was for Credit Card resulting from the acquisition of Cedyna Financial Corporation.
Impairment testing of goodwill
| | (a) | Allocating goodwill to cash-generating units |
For the purpose of impairment testing, goodwill is allocated to cash-generating units or group of cash-generating units, which represent the lowest level within the entity at which goodwill is monitored for internal purposes.
At March 31, 2012, the SMFG Group allocated goodwill to KUBC within Commercial Banking amounting to ¥11,197 million, to SMBC Friend Securities and SMBC Nikko Securities within Securities amounting to ¥74,616 million and ¥172,253 million, respectively, to SMFL within Leasing amounting to ¥102,710 million, and to Promise within Others amounting to ¥56,692 million.
At March 31, 2011, the SMFG Group allocated goodwill to KUBC within Commercial Banking amounting to ¥11,197 million, to SMBC Friend Securities and SMBC Nikko Securities within Securities amounting to ¥74,616 million and ¥172,253 million, respectively, and to SMFL within Leasing amounting to ¥102,710 million.
The aggregate amounts of other goodwill were ¥6,726 million and ¥8,610 million at March 31, 2012 and 2011, respectively, and they were not considered individually significant.
| | (b) | Timing of impairment tests |
The SMFG Group performs impairment tests at least annually and whenever there is an indication that the cash-generating unit may be impaired.
| | (c) | Recoverable amount of cash-generating units |
To determine whether an impairment loss shall be recognized, the carrying amount of a cash-generating unit is compared to its recoverable amount. The recoverable amount of a cash-generating unit is the higher of its fair value less costs to sell and its value in use.
Fair value less costs to sell: The fair value less costs to sell is determined using an observable market price for the cash-generating unit in the active market at the date of the impairment test. The SMFG Group determined the recoverable amount of KUBC for the fiscal year ended March 31, 2011 based on the fair value less costs to sell.
Value in use: The value in use is determined based on discounted future cash flows, which are based on the financial plans which have been approved by management and which are valid when the impairment test is performed. The financial plans are prepared taking into account the current economic and regulatory environment, direction of the regulation and business forecasts of the individual cash-generating units. The SMFG Group determined the recoverable amounts of the primary cash-generating units based on the value in use other than the recoverable amount of KUBC for the fiscal year ended March 31, 2011.
The financial plans, which are used to estimate the cash flow projections of the cash-generating units, cover three to five years. The cash flow projections beyond the period covered by the financial plans are extrapolated by applying the appropriate growth rates in perpetuity.
F-53
| | (d) | Key assumptions used in impairment testing |
The key assumptions used for the value in use calculations for the fiscal years ended March 31, 2012 and 2011 were as follows:
| | | | | | | | | | | | | | | | | | | | | | | | | | | | | | | | | | | | |
| | | For the fiscal year ended March 31, | |
| | | 2012 | | | 2011 | |
| | | KUBC | | | SMBC Friend
Securities | | | SMBC Nikko
Securities | | | SMFL | | | Cedyna | | | Promise | | | SMBC Friend
Securities | | | SMBC Nikko
Securities | | | SMFL | |
Pre-tax discount rate | | | 6.78% | | | | 8.01% | | | | 11.14% | | | | 9.50% | | | | 10.50% | | | | 11.81% | | | | 11.94% | | | | 15.77% | | | | 12.65% | |
Growth rate | | | 1.00% | | | | 1.00% | | | | 1.00% | | | | 1.00% | | | | 1.00% | | | | 1.00% | | | | 1.00% | | | | 1.00% | | | | 1.00% | |
Management considers that the pre-tax discount rates and the growth rates are the most sensitive key assumptions to determine the value in use of the cash-generating units.
Pre-tax discount rate: The pre-tax discount rates used to estimate the discounted cash flow of the primary cash-generating units are determined based on the Capital Asset Pricing Model (“CAPM”). The risk-free interest rate, the market risk premium and the beta factor that are used in the CAPM are determined based on market data and other external sources of information. The beta factor is determined based on a respective group of peer companies of the cash-generating units.
Growth rate: The growth rates used to estimate the cash flow projections beyond the period covered by the financial plans, which shall cover a maximum period of five years, are determined based on the expected long-term inflation rate and long-term average growth rates for the industries. The growth rate does not exceed the long-term growth rate for the industry in which the cash-generating unit operates.
Management believes that there were no reasonably possible changes in any of the key assumptions that would lead to the recoverable amounts of the cash-generating units being below these carrying amounts for the fiscal years ended March 31, 2012 and 2011.
F-54
Other intangible assets
The table below shows the changes in other intangible assets for the fiscal years ended March 31, 2012 and 2011.
| | | | | | | | | | | | | | | | | | | | | | | | |
| | | Internally
generated
software | | | Purchased
software | | | Contractual
customer
relationships | | | Trademarks | | | Other
intangibles | | | Total | |
| | | (In millions) | |
Cost | | ¥ | 280,176 | | | ¥ | 128,642 | | | ¥ | 86,066 | | | ¥ | 37,055 | | | ¥ | 16,278 | | | ¥ | 548,217 | |
Accumulated amortization and impairment losses | | | (154,263 | ) | | | (38,992 | ) | | | (2,869 | ) | | | (1,853 | ) | | | (2,507 | ) | | | (200,484 | ) |
| | | | | | | | | | | | | | | | | | | | | | | | |
Net carrying amount at April 1, 2010 | | | 125,913 | | | | 89,650 | | | | 83,197 | | | | 35,202 | | | | 13,771 | | | | 347,733 | |
| | | | | | | | | | | | | | | | | | | | | | | | |
Additions | | | 52,058 | | | | 40,026 | | | | — | | | | — | | | | 9,596 | | | | 101,680 | |
Acquisition of subsidiaries | | | — | | | | 25,886 | | | | 10,264 | | | | 253 | | | | 632 | | | | 37,035 | |
Disposals | | | (192 | ) | | | (1,582 | ) | | | — | | | | — | | | | (20 | ) | | | (1,794 | ) |
Amortization | | | (46,021 | ) | | | (27,206 | ) | | | (6,180 | ) | | | (3,724 | ) | | | (719 | ) | | | (83,850 | ) |
Impairment losses | | | (2 | ) | | | (35 | ) | | | — | | | | — | | | | (22 | ) | | | (59 | ) |
Exchange differences | | | (62 | ) | | | (333 | ) | | | — | | | | — | | | | — | | | | (395 | ) |
Other changes | | | 1,676 | | | | 2,293 | | | | — | | | | — | | | | (4,028 | ) | | | (59 | ) |
| | | | | | | | | | | | | | | | | | | | | | | | |
Net carrying amount | | | 133,370 | | | | 128,699 | | | | 87,281 | | | | 31,731 | | | | 19,210 | | | | 400,291 | |
| | | | | | | | | | | | | | | | | | | | | | | | |
Cost | | | 349,843 | | | | 185,232 | | | | 96,330 | | | | 37,308 | | | | 22,382 | | | | 691,095 | |
Accumulated amortization and impairment losses | | | (216,473 | ) | | | (56,533 | ) | | | (9,049 | ) | | | (5,577 | ) | | | (3,172 | ) | | | (290,804 | ) |
| | | | | | | | | | | | | | | | | | | | | | | | |
Net carrying amount at March 31, 2011 | | | 133,370 | | | | 128,699 | | | | 87,281 | | | | 31,731 | | | | 19,210 | | | | 400,291 | |
| | | | | | | | | | | | | | | | | | | | | | | | |
Additions | | | 64,474 | | | | 32,311 | | | | — | | | | — | | | | 4,596 | | | | 101,381 | |
Acquisition of subsidiaries | | | 2,548 | | | | 1,302 | | | | 58,832 | | | | 3,848 | | | | 23 | | | | 66,553 | |
Disposals | | | (419 | ) | | | (401 | ) | | | — | | | | — | | | | (268 | ) | | | (1,088 | ) |
Amortization | | | (47,485 | ) | | | (33,252 | ) | | | (7,246 | ) | | | (3,827 | ) | | | (613 | ) | | | (92,423 | ) |
Impairment losses | | | — | | | | (5 | ) | | | — | | | | — | | | | (100 | ) | | | (105 | ) |
Exchange differences | | | (10 | ) | | | (36 | ) | | | — | | | | — | | | | 1 | | | | (45 | ) |
Other changes | | | 2,316 | | | | (614 | ) | | | — | | | | — | | | | (1,293 | ) | | | 409 | |
| | | | | | | | | | | | | | | | | | | | | | | | |
Net carrying amount | | | 154,794 | | | | 128,004 | | | | 138,867 | | | | 31,752 | | | | 21,556 | | | | 474,973 | |
| | | | | | | | | | | | | | | | | | | | | | | | |
Cost | | | 430,080 | | | | 195,202 | | | | 155,162 | | | | 41,156 | | | | 24,589 | | | | 846,189 | |
Accumulated amortization and impairment losses | | | (275,286 | ) | | | (67,198 | ) | | | (16,295 | ) | | | (9,404 | ) | | | (3,033 | ) | | | (371,216 | ) |
| | | | | | | | | | | | | | | | | | | | | | | | |
Net carrying amount at March 31, 2012 | | ¥ | 154,794 | | | ¥ | 128,004 | | | ¥ | 138,867 | | | ¥ | 31,752 | | | ¥ | 21,556 | | | ¥ | 474,973 | |
| | | | | | | | | | | | | | | | | | | | | | | | |
The impairment losses on intangible assets are included in “Other expenses” and the amortization expenses of intangible assets are included in “General and administrative expenses” in the consolidated income statement.
The SMFG Group had ¥503 million and ¥1,926 million of contractual commitments to acquire intangible assets at March 31, 2012 and 2011, respectively.
The amounts of research and development expenditure recognized as expenses for the fiscal years ended March 31, 2012, 2011 and 2010 were ¥291 million, ¥521 million and ¥267 million, respectively, and they were included in “General and administrative expenses” in the consolidated income statement.
Other intangibles at March 31, 2012 and 2011 include leasehold rights, amounting to ¥7,616 million and ¥7,700 million, respectively, which are rights to use land for the purpose of owning the buildings. Since the
F-55
SMFG Group has a long history of renewal, these contracts are not expected to be terminated in the foreseeable future. Leasehold rights are expected to generate cash flows for an indefinite period of time. They are not amortized but are tested for impairment annually, irrespective of whether there is any indication of impairment.
Other assets at March 31, 2012 and 2011 consisted of the following:
| | | | | | | | |
| | | At March 31, | |
| | | 2012 | | | 2011 | |
| | | (In millions) | |
Prepaid expenses | | ¥ | 40,650 | | | ¥ | 40,213 | |
Accrued income | | | 329,956 | | | | 266,072 | |
Receivables from unsettled regular way trades | | | 1,034,097 | | | | 873,461 | |
Retirement benefit assets | | | 180,911 | | | | 142,211 | |
Security deposits | | | 120,637 | | | | 117,627 | |
Investment properties(1) | | | 149,772 | | | | 138,099 | |
Others | | | 511,277 | | | | 346,387 | |
| | | | | | | | |
Total other assets | | ¥ | 2,367,300 | | | ¥ | 1,924,070 | |
| | | | | | | | |
| (1) | Investment properties are carried at cost less accumulated depreciation and accumulated impairment losses. The fair values of investment properties were ¥143,722 million and ¥136,689 million at March 31, 2012 and 2011, respectively. The fair values were mainly determined based on market values provided by independent valuation appraisers having the appropriate recognized professional qualifications and recent experience in the locations and categories of properties being valued. Rental income from investment properties was ¥11,392 million, ¥10,871 million and ¥9,758 million for the fiscal years ended March 31, 2012, 2011 and 2010, respectively. |
Deposits at March 31, 2012 and 2011 consisted of the following:
| | | | | | | | |
| | | At March 31, | |
| | | 2012 | | | 2011 | |
| | | (In millions) | |
Non-interest-bearing demand deposits | | ¥ | 13,834,841 | | | ¥ | 12,887,647 | |
Interest-bearing deposits: | | | | | | | | |
Demand deposits | | | 35,149,464 | | | | 33,437,191 | |
Deposits at notice | | | 4,497,785 | | | | 4,931,392 | |
Time deposits | | | 26,863,517 | | | | 26,882,486 | |
Negotiable certificates of deposit | | | 8,593,638 | | | | 8,366,323 | |
Others(1) | | | 3,914,321 | | | | 3,964,059 | |
| | | | | | | | |
Total deposits | | ¥ | 92,853,566 | | | ¥ | 90,469,098 | |
| | | | | | | | |
| (1) | Others include, among other items, foreign currency deposits in domestic offices and Japanese yen accounts held by foreign depositors in domestic offices. |
Trading liabilities at March 31, 2012 and 2011 consisted of the following:
| | | | | | | | |
| | | At March 31, | |
| | | 2012 | | | 2011 | |
| | | (In millions) | |
Debt instruments “short position” | | ¥ | 2,171,010 | | | ¥ | 1,622,849 | |
Equity instruments “short position” | | | 2,557 | | | | 1,069 | |
| | | | | | | | |
Total trading liabilities | | ¥ | 2,173,567 | | | ¥ | 1,623,918 | |
| | | | | | | | |
F-56
Trading liabilities include the instruments classified as held for trading. Trading debt instruments mainly consist of Japanese government bonds. Trading equity instruments mainly consist of Japanese listed stocks.
Short-term borrowings and long-term borrowings (with original maturities of more than one year) at March 31, 2012 and 2011 consisted of the following:
| | | | | | | | | | | | |
| | | | | | At March 31, | |
| | | Interest rate | | | 2012 | | | 2011 | |
| | | | | | (In millions) | |
SMBC: | | | | | | | | | | | | |
Short-term borrowings | | | 0.10%-3.54% | | | ¥ | 3,151,463 | | | ¥ | 4,084,858 | |
Long-term borrowings: | | | | | | | | | | | | |
Unsubordinated | | | | | | | | | | | | |
Floating rate borrowing, payable in Japanese yen,
due 2011-2030 | | | 0.05%-0.36% | | | | 77,332 | | | | 53,145 | |
Floating rate borrowing, payable in United States dollars,
due 2014-2022 | | | 0.62%-1.12% | | | | 322,270 | | | | 266,080 | |
Other fixed or floating rate borrowing,
due 2011-2026 | | | 0.10%-6.10% | | | | 85,421 | | | | 10,048 | |
Subordinated | | | | | | | | | | | | |
Fixed rate borrowing, payable in Japanese yen,
due 2011-2027 | | | 1.44%-4.50% | | | | 358,000 | | | | 341,000 | |
Floating rate borrowing, payable in Japanese yen,
due 2012 | | | 1.64%-1.73% | | | | 5,000 | | | | 5,000 | |
| | | | | | | | | | | | |
Total SMBC | | | | | | | 3,999,486 | | | | 4,760,131 | |
| | | | | | | | | | | | |
Other subsidiaries: | | | | | | | | | | | | |
Short-term borrowings | | | 0.05%-6.87% | | | | 3,241,091 | | | | 4,401,984 | |
Long-term borrowings: | | | | | | | | | | | | |
Unsubordinated | | | | | | | | | | | | |
Fixed rate borrowing, payable in Japanese yen,
due 2011-2031 | | | 0.10%-5.65% | | | | 613,543 | | | | 734,717 | |
Fixed rate borrowing, payable in United States dollars,
due 2011-2018 | | | 1.07%-5.68% | | | | 81,909 | | | | 90,110 | |
Fixed rate borrowing, payable in Thai baht,
due 2011-2014 | | | 2.85%-6.30% | | | | 12,197 | | | | 12,673 | |
Fixed rate borrowing, payable in Chinese yuan,
due 2011-2013 | | | 4.86%-6.10% | | | | 27,168 | | | | 23,712 | |
Floating rate borrowing, payable in Japanese yen,
due 2011-2031 | | | 0.29%-3.44% | | | | 892,996 | | | | 822,031 | |
Floating rate borrowing, payable in United States dollars,
due 2011-2017 | | | 0.54%-1.51% | | | | 44,084 | | | | 29,565 | |
Floating rate borrowing, payable in Chinese yuan,
due 2011-2014 | | | 4.86%-7.32% | | | | 42,342 | | | | 25,646 | |
Floating rate borrowing, payable in Euros,
due 2015 | | | 1.00% | | | | 50,411 | | | | — | |
Other fixed or floating rate borrowing,
due 2011-2016 | | | 0.48%-8.95% | | | | 3,927 | | | | 4,592 | |
Subordinated | | | | | | | | | | | | |
Floating rate borrowing, payable in Japanese yen,
due 2015-2022 | | | 2.15%-3.29% | | | | 11,250 | | | | 25,233 | |
| | | | | | | | | | | | |
Total other subsidiaries | | | | | | | 5,020,918 | | | | 6,170,263 | |
| | | | | | | | | | | | |
Liabilities associated with securitization transactions: | | | | | | | | | | | | |
Fixed rate borrowing, payable in Japanese yen,
due 2011-2046 | | | 0.47%-3.13% | | | | 1,233,810 | | | | 1,390,107 | |
Floating rate borrowing, payable in Japanese yen,
due 2011-2039 | | | 0.43%-2.50% | | | | 104,353 | | | | 162,880 | |
| | | | | | | | | | | | |
Total liabilities associated with securitization transactions | | | | | | | 1,338,163 | | | | 1,552,987 | |
| | | | | | | | | | | | |
Lease obligations | | | — | | | | 54,291 | | | | 64,977 | |
| | | | | | | | | | | | |
Total borrowings | | | | | | ¥ | 10,412,858 | | | ¥ | 12,548,358 | |
| | | | | | | | | | | | |
F-57
The interest rates shown in the above table are the contractual rates in effect at March 31, 2012 and 2011, and thus do not represent the actual effective interest rates. Maturity information for certain subordinated borrowings is based on the date of callable option.
| 19 | DEBT SECURITIES IN ISSUE |
Debt securities in issue at March 31, 2012 and 2011 consisted of the following:
| | | | | | | | | | |
| | | | | At March 31, | |
| | | Interest rate | | 2012 | | | 2011 | |
| | | | | (In millions) | |
SMBC: | | | | | | | | | | |
Commercial paper | | 0.08%-1.02% | | ¥ | 1,213,249 | | | ¥ | 378,120 | |
Bonds: | | | | | | | | | | |
Bonds, payable in Japanese yen | | 0.00%-4.67% | | | 1,253,026 | | | | 1,257,486 | |
Bonds, payable in United States dollars | | 1.51%-3.95% | | | 572,761 | | | | 289,857 | |
Bonds, payable in Australian dollars | | 4.28%-5.76% | | | 82,642 | | | | 46,123 | |
Subordinated bonds: | | | | | | | | | | |
Subordinated bonds, payable in Japanese yen | | 0.44%-2.97% | | | 1,930,059 | | | | 1,813,353 | |
Subordinated bonds, payable in United States dollars | | 4.85%-8.00% | | | 208,595 | | | | 91,320 | |
Subordinated bonds, payable in Euros | | 4.00%-4.38% | | | 117,246 | | | | 125,593 | |
| | | | | | | | | | |
Total SMBC | | | | | 5,377,578 | | | | 4,001,852 | |
| | | | | | | | | | |
Other subsidiaries: | | | | | | | | | | |
Commercial paper | | 0.11%-0.45% | | | 1,530,415 | | | | 1,641,214 | |
Bonds: | | | | | | | | | | |
Bonds, payable in Japanese yen | | 0.30%-8.15% | | | 267,529 | | | | 113,523 | |
Bonds, payable in United States dollars | | 5.95% | | | 41,638 | | | | — | |
Bonds, payable in Chinese yuan | | 2.50%-3.00% | | | 6,520 | | | | — | |
Subordinated bonds: | | | | | | | | | | |
Subordinated bonds, payable in Japanese yen | | 1.80%-4.50% | | | 142,200 | | | | 125,799 | |
Other: | | | | | | | | | | |
Liabilities to third parties under investment contracts | | — | | | 11,862 | | | | 8,000 | |
| | | �� | | | | | | | |
Total other subsidiaries | | | | | 2,000,164 | | | | 1,888,536 | |
| | | | | | | | | | |
Total debt securities in issue | | | | ¥ | 7,377,742 | | | ¥ | 5,890,388 | |
| | | | | | | | | | |
Interest rates represent the contractual interest rates that were applied at March 31, 2012 and 2011, and thus do not represent the actual effective interest rates.
Certain bonds are redeemable prior to maturity at the option of the SMFG Group.
F-58
The following table presents movements by class of provisions for the fiscal years ended March 31, 2012 and 2011.
| | | | | | | | | | | | |
| | | Provision for
interest repayment | | | Other
provisions | | | Total | |
| | | (In millions) | |
Balance at April 1, 2010 | | ¥ | 9,816 | | | ¥ | 22,420 | | | ¥ | 32,236 | |
| | | | | | | | | | | | |
Additional provisions | | | 27,790 | | | | 5,475 | | | | 33,265 | |
Amounts used | | | (32,313 | ) | | | (4,399 | ) | | | (36,712 | ) |
Unused amounts reversed | | | (75 | ) | | | (24 | ) | | | (99 | ) |
Amortization of discount and effect of change in discount rate | | | (777 | ) | | | 171 | | | | (606 | ) |
Acquisition of subsidiaries | | | 67,562 | | | | 432 | | | | 67,994 | |
Others | | | 216 | | | | 59 | | | | 275 | |
| | | | | | | | | | | | |
Balance at March 31, 2011 | | | 72,219 | | | | 24,134 | | | | 96,353 | |
| | | | | | | | | | | | |
Additional provisions | | | 27,473 | | | | 9,659 | | | | 37,132 | |
Amounts used | | | (66,121 | ) | | | (6,712 | ) | | | (72,833 | ) |
Unused amounts reversed | | | (293 | ) | | | (2,076 | ) | | | (2,369 | ) |
Amortization of discount and effect of change in discount rate | | | (266 | ) | | | 190 | | | | (76 | ) |
Acquisition of subsidiaries | | | 367,221 | | | | — | | | | 367,221 | |
Others | | | — | | | | (78 | ) | | | (78 | ) |
| | | | | | | | | | | | |
Balance at March 31, 2012 | | ¥ | 400,233 | | | ¥ | 25,117 | | | ¥ | 425,350 | |
| | | | | | | | | | | | |
Provision for Interest Repayment
Japan has two laws restricting interest rates on loans. The Interest Rate Restriction Act sets the maximum interest rates on loans ranging from 15% to 20%. The Act Regulating the Receipt of Contributions, Receipt of Deposits and Interest Rates capped the interest rate on loans at 29.2% up to June 2010. Interest rates on loans greater than the range of 15-20% but below the maximum allowable of 29.2% were called “gray zone interest,” and many consumer finance companies were charging interest in this zone.
In January 2006, judicial decisions strictly interpreted the conditions under which consumer finance companies may retain gray zone interest. As a result, claims for refunds of gray zone interest have increased, and consumer finance companies have recorded a provision for claims for refunds of gray zone interest.
In December 2006, the Government of Japan made amendments to laws regulating money lenders to implement regulatory reforms affecting the consumer finance industry. As a result, in June 2010, the maximum legal interest rates on loans were reduced to the range of 15-20%, and gray zone interest was abolished.
The provision for interest repayment is calculated by estimating the future claims for the refund of gray zone interest, taking into account historical experience such as the number of customer claims for a refund, the amount of repayments and the customers’ characteristics, and the length of the period the claims are expected to be received in the future. The timing of the settlement of these claims is uncertain.
In December 2011, Promise, which is a consumer finance company in Japan and is now known as SMBC Consumer Finance, became a consolidated subsidiary of the SMFG Group. As a result, at March 31, 2012, the balance of the provision for interest repayment increased significantly. The amount at the acquisition date, arising from the consolidation, was included in Acquisition of subsidiaries in the table above for the fiscal year ended March 31, 2012.
F-59
Other Provisions
Other provisions include asset retirement obligations and provisions for reimbursement of deposits, loan commitments, product warranties and litigation claims. Most of these provisions occurred in the normal course of business and none of them were individually significant at March 31, 2012 and 2011.
Other liabilities at March 31, 2012 and 2011 consisted of the following:
| | | | | | | | |
| | | At March 31, | |
| | | 2012 | | | 2011 | |
| | | (In millions) | |
Accrued expenses | | ¥ | 199,252 | | | ¥ | 188,683 | |
Unearned income | | | 169,130 | | | | 172,763 | |
Financial guarantees and other credit-related contingent liabilities | | | 117,900 | | | | 74,728 | |
Due to trust account | | | 443,724 | | | | 216,172 | |
Payables from unsettled regular way trades | | | 2,620,192 | | | | 2,189,746 | |
Payables related to credit card services | | | 406,480 | | | | 333,395 | |
Obligations from factoring transactions | | | 220,861 | | | | 182,189 | |
Retirement benefit liabilities | | | 58,112 | | | | 56,893 | |
Guarantee deposits received | | | 141,961 | | | | 139,358 | |
Others | | | 1,024,178 | | | | 868,239 | |
| | | | | | | | |
Total other liabilities | | ¥ | 5,401,790 | | | ¥ | 4,422,166 | |
| | | | | | | | |
The changes of net deferred tax assets and liabilities for the fiscal years ended March 31, 2012 and 2011 were as follows:
| | | | | | | | |
| | | For the fiscal year ended
March 31, | |
| | | 2012 | | | 2011 | |
| | | (In millions) | |
At beginning of period | | ¥ | 1,001,140 | | | ¥ | 1,097,351 | |
Deferred tax expense | | | (358,937 | ) | | | (263,174 | ) |
Deferred tax relating to other comprehensive income: | | | | | | | | |
Available-for-sale financial assets reserve | | | (41,194 | ) | | | 137,137 | |
Exchange differences on translating the foreign operations reserve | | | (2,615 | ) | | | 9,383 | |
Acquisitions of subsidiaries | | | (35,913 | ) | | | 20,130 | |
Exchange differences and others | | | 409 | | | | 313 | |
| | | | | | | | |
At end of period | | ¥ | 562,890 | | | ¥ | 1,001,140 | |
| | | | | | | | |
F-60
The deferred tax assets and liabilities at March 31, 2012 and 2011 were attributable to the following items:
| | | | | | | | |
| | | At March 31, | |
| | | 2012 | | | 2011 | |
| | | (In millions) | |
Deferred tax assets: | | | | | | | | |
Loans and advances | | ¥ | 439,131 | | | ¥ | 515,490 | |
Investment securities | | | 77,025 | | | | 223,286 | |
Derivative financial instruments | | | 68,285 | | | | 57,659 | |
Tax losses carried forward | | | 46,550 | | | | 187,910 | |
Retirement benefits | | | 38,369 | | | | 63,706 | |
Other deductible temporary differences | | | 123,538 | | | | 143,326 | |
| | | | | | | | |
Total deferred tax assets | | | 792,898 | | | | 1,191,377 | |
| | | | | | | | |
Deferred tax liabilities: | | | | | | | | |
Goodwill and intangible assets | | | 63,132 | | | | 31,157 | |
Deposits | | | 49,468 | | | | 56,408 | |
Investment securities | | | 26,036 | | | | 19,786 | |
Lease transactions | | | 25,332 | | | | 31,919 | |
Other taxable temporary differences | | | 66,040 | | | | 50,967 | |
| | | | | | | | |
Total deferred tax liabilities | | | 230,008 | | | | 190,237 | |
| | | | | | | | |
Total deferred tax assets—net(1) | | ¥ | 562,890 | | | ¥ | 1,001,140 | |
| | | | | | | | |
| (1) | Deferred tax assets and deferred tax liabilities were offset in the consolidated statement of financial position if the entity has a legally enforceable right to set off current tax assets against current tax liabilities, and the deferred tax assets and the deferred tax liabilities relate to income taxes levied by the same taxation authority on the same taxable entity. |
On December 2, 2011, the Government of Japan promulgated (i) an amendment to the Corporation Tax Act and (ii) the Act on Special Measures Concerning Securing Necessary Financial Resources for Funding the Restoration from the Great East Japan Earthquake. Those laws will (i) reduce the Japanese national corporation tax rate by 4.5 percentage points from fiscal years beginning April 1, 2012 but (ii) impose a 10% corporation surtax, i.e., an additional tax to be paid calculated as 10% of the corporation tax payable after the 4.5-percentage-point rate reduction, during the three fiscal years beginning April 1, 2012 through March 31, 2015. As a result, the effective statutory tax rate (including local taxes) of SMFG (currently 40.7%) would be reduced by approximately 2.7 percentage points during the three fiscal years beginning April 1, 2012 and by approximately 5.1 percentage points for the fiscal years beginning April 1, 2015.
The SMFG Group measured deferred tax assets and deferred tax liabilities at the tax rates that are expected to apply to the period when the assets are realized or the liabilities are settled, based on the tax rates that have been enacted or are substantively enacted at March 31, 2012. Accordingly, the tax rate reduction in Japan increased deferred tax expense by ¥104 billion for the fiscal year ended March 31, 2012.
The net deferred tax assets of the SMFG Group consist mainly of the net deferred tax assets of SMBC. At March 31, 2012 and 2011, SMBC recognized ¥462 billion and ¥820 billion of net deferred tax assets, including deferred tax assets recognized for the tax losses carried forward of ¥25 billion and ¥150 billion, respectively. Other major items, such as the deferred tax assets for loans and advances, derivative financial instruments or investment securities were generally related to the accumulated losses from the fair value change or the impairment of these assets which would be deductible for tax purposes in future periods. SMBC considers that it will be able to use most of the tax losses carried forward before expiration and other deductible temporary differences based mainly on taxable income expected to be generated in the future under business plans which management believes to be prudent and feasible. In SMFG’s other subsidiaries, deferred tax assets relating to tax losses carried forward and deductible temporary differences are recognized only to the extent that it is probable
F-61
that future taxable profit will be available against which the tax losses carried forward and the deductible temporary differences can be utilized. No deferred tax assets were recognized in SMFG, SMBC and certain SMFG subsidiaries for the tax losses carried forward projected to expire, or for the deductible temporary differences estimated not to be realized due to the uncertainty of sufficient future taxable profit.
The following table shows the amounts of deductible temporary differences and tax losses carried forward by expiration date at March 31, 2012 and 2011 for which no deferred tax assets were recognized.
| | | | | | | | |
| | | At March 31, | |
| | | 2012 | | | 2011 | |
| | | (In millions) | |
Deductible temporary differences | | ¥ | 561,054 | | | ¥ | 236,327 | |
Tax losses carried forward which will expire in 1 year | | | 269,336 | (1) | | | 360 | |
2 years | | | 4,860 | | | | 228,854 | (1) |
3 years | | | 83,113 | | | | 5,198 | |
4 years | | | 41 | | | | 4,509 | |
5 years | | | 1,703 | | | | 25,303 | |
6 years | | | 140,023 | | | | 68,904 | |
7 years | | | 234,127 | | | | 80,496 | |
8 years | | | 163,366 | | | | — | |
9 years and thereafter | | | 282,233 | | | | 307 | |
| | | | | | | | |
Total deductible temporary differences and tax losses carried forward | | ¥ | 1,739,856 | (2) | | ¥ | 650,258 | |
| | | | | | | | |
| (1) | The amount of unrecognized deferred tax assets for ¥269 billion and ¥229 billion of tax losses carried forward at March 31, 2012 and 2011 would be ¥17 billion and ¥11 billion, respectively, if recognized. The majority of these unrecognized deferred tax assets were for tax losses of enterprise taxes in Japan. Most of the other unrecognized deferred tax assets for temporary differences and tax losses carried forward at March 31, 2012 would be calculated using an applicable tax rate of 38.0% or 35.6%, if recognized. |
| (2) | The unrecognized deferred tax assets at March 31, 2012 increased mainly due to the acquisition of Promise on December 7, 2011. The amounts of deductible temporary differences and tax losses carried forward of Promise are included in the total amount at March 31, 2012. |
In addition to the above table, the SMFG Group does not recognize deferred tax assets for deductible temporary differences related to investments in subsidiaries, associates and joint ventures where SMFG has no intention to reverse these differences in the foreseeable future. The amount of those deductible temporary differences was approximately ¥3,474 billion and ¥3,883 billion at March 31, 2012 and 2011, respectively. Most of the temporary differences were associated with investments in SMBC, which resulted from a statutory share transfer made at the establishment of SMFG in December 2002.
At March 31, 2012 and 2011, the amount of taxable temporary differences associated with investments in subsidiaries, associates and joint ventures for which deferred tax liabilities had not been recognized was approximately ¥369 billion and ¥353 billion, respectively. SMFG can control the timing of reversal of the temporary differences and it is probable that they will not be reversed in the foreseeable future.
F-62
Deferred tax expense for the fiscal years ended March 31, 2012 and 2011 was attributable to the following temporary differences and tax losses carried forward:
| | | | | | | | |
| | | For the fiscal year ended
March 31, | |
| | | 2012 | | | 2011 | |
| | | (In millions) | |
Tax losses carried forward | | ¥ | (140,982 | ) | | ¥ | (248,985 | ) |
Loans and advances | | | (111,162 | ) | | | 45,525 | |
Investment securities | | | (108,754 | ) | | | 22,901 | |
Retirement benefits | | | (25,552 | ) | | | (24,083 | ) |
Derivative financial instruments | | | 10,792 | | | | (19,720 | ) |
Goodwill and intangible assets | | | (9,316 | ) | | | (17,308 | ) |
Deposits | | | 6,940 | | | | (18,798 | ) |
Lease transactions | | | 5,575 | | | | 5,485 | |
Other temporary differences—net | | | 13,522 | | | | (8,191 | ) |
| | | | | | | | |
Total deferred tax expense | | ¥ | (358,937 | ) | | ¥ | (263,174 | ) |
| | | | | | | | |
Defined Benefit Plans
SMBC and some of SMFG’s other subsidiaries have various defined benefit plans such as defined benefit pension plans and lump-sum severance indemnity plans, which define the amount of benefits that an employee will receive on or after retirement, usually based on one or more factors, such as age, years of service, compensation, classes and earned points based on service.
SMBC’s defined benefit plans account for the vast majority of the defined benefit obligations and plan assets in the SMFG Group. SMBC has a Corporate Defined Benefit Pension Plan and a lump-sum severance indemnity plan. SMBC has set up retirement benefit trusts in relation to both of these plans as described below.
Defined benefit pension plans
SMBC’s Corporate Defined Benefit Pension Plan is a funded defined benefit pension plan, which is defined and regulated by the Corporate Defined Benefit Pension Plan Law, one of the Japanese pension laws. The pension plan is funded through SMBC’s contribution to a “Pension Fund,” a special entity established in accordance with the pension laws. The Pension Fund administers and manages the plan assets. Other defined benefit pension plans in the SMFG Group are typically established and managed in the same way.
Lump-sum severance indemnity plans
SMBC and some of SMFG’s other subsidiaries have lump-sum severance indemnity plans under which their employees are provided with lump-sum cash payments upon leaving the company. While funding of these plans is not required under Japanese pension laws, some of these plans are funded with assets held by retirement benefit trusts as described below.
Retirement benefit trusts
SMBC and some of SMFG’s other subsidiaries in Japan established some retirement benefit trusts and contributed some of their marketable securities to these trusts in order to isolate these assets for retirement benefits by entering into contracts with trust banks. Retirement benefit trusts are voluntary funds that are used either to contribute assets to the Pension Funds or to directly settle retirement benefits. Among the SMFG Group, retirement benefit trusts are set up for the defined benefit pension plans which have the Pension Funds as described above, as well as for the lump-sum severance indemnity plans.
F-63
The assets retained in the retirement benefit trusts, as well as the assets retained in the Pension Funds, are held by an entity or a fund that is legally separated from the SMFG Group and exists solely to pay or fund retirement benefits. They are available to be used only to pay or fund retirement benefits, are not available to the SMFG Group’s own creditors even in bankruptcy and cannot be returned to the SMFG Group, unless either the remaining assets are sufficient to meet all the related obligations or the entities (funds) reimburse to the SMFG Group the retirement benefits which are already paid by the SMFG Group. Therefore, these assets are accounted for as plan assets.
The following tables provide detailed information for the defined benefit plans.
The amounts of the retirement benefit liabilities and the retirement benefit assets recognized in the consolidated statement of financial position at March 31, 2012 and 2011 were determined as follows:
| | | | | | | | |
| | | At March 31, | |
| | | 2012 | | | 2011 | |
| | | (In millions) | |
Present value of unfunded obligations | | ¥ | (39,690 | ) | | ¥ | (37,364 | ) |
Present value of funded obligations | | | (1,044,139 | ) | | | (967,496 | ) |
Fair value of plan assets | | | 899,154 | | | | 880,155 | |
| | | | | | | | |
Net deficit | | | (184,675 | ) | | | (124,705 | ) |
| | | | | | | | |
Unrecognized actuarial losses | | | 307,776 | | | | 210,534 | |
Unrecognized past service cost | | | (302 | ) | | | (511 | ) |
| | | | | | | | |
Net retirement benefit assets | | ¥ | 122,799 | | | ¥ | 85,318 | |
| | | | | | | | |
Of which retirement benefit liabilities included in “Other liabilities” | | ¥ | (58,112 | ) | | ¥ | (56,893 | ) |
Of which retirement benefit assets included in “Other assets” | | ¥ | 180,911 | | | ¥ | 142,211 | |
The movements in the defined benefit obligations for the fiscal years ended March 31, 2012 and 2011 were as follows:
| | | | | | | | |
| | | For the fiscal year ended
March 31, | |
| | | 2012 | | | 2011 | |
| | | (In millions) | |
At beginning of period | | ¥ | 1,004,860 | | | ¥ | 997,287 | |
Current service cost | | | 25,660 | | | | 25,647 | |
Interest cost | | | 23,127 | | | | 21,239 | |
Actuarial losses (gains) | | | 76,039 | | | | (1,995 | ) |
Benefits paid | | | (38,829 | ) | | | (36,763 | ) |
Lump-sum payments | | | (17,998 | ) | | | (16,211 | ) |
Past service cost | | | (1,265 | ) | | | 1,459 | |
Acquisition and disposal of subsidiaries | | | 15,008 | | | | 20,960 | |
Settlements | | | (2,174 | ) | | | (6,533 | ) |
Others | | | (599 | ) | | | (230 | ) |
| | | | | | | | |
At end of period | | ¥ | 1,083,829 | | | ¥ | 1,004,860 | |
| | | | | | | | |
F-64
The movements in the fair value of plan assets for the fiscal years ended March 31, 2012 and 2011 were as follows:
| | | | | | | | |
| | | For the fiscal year ended
March 31, | |
| | | 2012 | | | 2011 | |
| | | (In millions) | |
At beginning of period | | ¥ | 880,155 | | | ¥ | 888,577 | |
Expected return on plan assets | | | 36,521 | | | | 41,225 | |
Actuarial losses | | | (30,604 | ) | | | (75,329 | ) |
Contributions by employer | | | 43,887 | | | | 45,646 | |
Benefits paid | | | (38,829 | ) | | | (36,763 | ) |
Acquisition and disposal of subsidiaries | | | 7,996 | | | | 16,830 | |
Others | | | 28 | | | | (31 | ) |
| | | | | | | | |
At end of period | | ¥ | 899,154 | | | ¥ | 880,155 | |
| | | | | | | | |
The amounts recognized in “General and administrative expenses” in the consolidated income statement for the fiscal years ended March 31, 2012, 2011 and 2010 were as follows:
| | | | | | | | | | | | |
| | | For the fiscal year ended March 31, | |
| | | 2012 | | | 2011 | | | 2010 | |
| | | (In millions) | |
Current service cost | | ¥ | 25,660 | | | ¥ | 25,647 | | | ¥ | 23,803 | |
Interest cost | | | 23,127 | | | | 21,239 | | | | 20,508 | |
Expected return on plan assets | | | (36,521 | ) | | | (41,225 | ) | | | (31,366 | ) |
Amortization of actuarial losses | | | 9,662 | | | | 5,100 | | | | 12,417 | |
Amortization of past service cost | | | (1,474 | ) | | | 756 | | | | (83 | ) |
Losses (gains) on settlements | | | (297 | ) | | | 283 | | | | — | |
| | | | | | | | | | | | |
Total | | ¥ | 20,157 | | | ¥ | 11,800 | | | ¥ | 25,279 | |
| | | | | | | | | | | | |
The plan assets at March 31, 2012 and 2011 were composed as follows:
| | | | | | | | |
| | | At March 31, | |
| | | 2012 | | | 2011 | |
| | | (% of total fair value of plan assets) | |
Plan assets retained in the Pension Funds | | | | | | | | |
Equity instruments | | | 27.0 | % | | | 27.6 | % |
Debt instruments | | | 25.2 | % | | | 24.6 | % |
General account of life insurance companies | | | 5.6 | % | | | 4.8 | % |
Other short-term assets | | | 9.7 | % | | | 9.0 | % |
Plan assets retained in the retirement benefit trusts | | | | | | | | |
Japanese equity instruments | | | 26.0 | % | | | 27.9 | % |
Other short-term assets | | | 6.5 | % | | | 6.1 | % |
| | | | | | | | |
Total | | | 100.0 | % | | | 100.0 | % |
| | | | | | | | |
The plan assets in the Pension Funds included the common stocks issued by the SMFG Group at March 31, 2012 and 2011. The amounts of these stocks were not significant.
The assets in retirement benefit trusts were primarily composed of Japanese equity instruments. The SMFG Group retained the voting rights of some of these equity instruments with fair values of ¥215,288 million and ¥220,775 million (23.9% and 25.1% of the total fair values of plan assets) at March 31, 2012 and 2011,
F-65
respectively. The assets in retirement benefit trusts included common stocks issued by a subsidiary (THE MINATO BANK, LTD.) with a fair value of ¥25,487 million and ¥24,660 million (2.8% and 2.8% of the total fair values of plan assets) at March 31, 2012 and 2011, respectively. The SMFG Group retained the voting rights of these stocks (40.4% of the voting rights of THE MINATO BANK, LTD., for all periods presented). Refer to Note 47 “Principal Subsidiaries” for further information.
The principal actuarial assumptions used at March 31, 2012, 2011 and 2010 were as follows:
| | | | | | | | | | | | |
| | | At March 31, | |
| | | 2012 | | | 2011 | | | 2010 | |
Discount rates | | | 1.8 | % | | | 2.3 | % | | | 2.1 | % |
Expected rates of return on plan assets | | | 4.1 | % | | | 4.5 | % | | | 4.2 | % |
Expected rates of salary (benefit) increases | | | 6.1 | % | | | 5.9 | % | | | 6.0 | % |
The expected rates of returns on plan assets are weighted on the basis of the fair value of the plan assets. All other assumptions are weighted on the basis of the defined benefit obligations.
The expected return on plan assets is developed separately for each plan, typically using a building block approach recognizing the plan’s specific asset allocation and the assumed return on assets for each asset category.
The assumptions for future mortality are based on the official mortality table generally used for actuarial assumptions in Japan. Under the mortality table used at March 31, 2012, 2011 and 2010, the average remaining life expectancy of an individual retiring at age 60 was 22 years, 22 years and 21 years for males, respectively, and 28 years, 28 years and 27 years for females, respectively.
The actual returns on plan assets for the fiscal years ended March 31, 2012, 2011 and 2010 was a positive return of ¥5,917 million, a negative return of ¥34,104 million, and a positive return of ¥127,128 million, respectively.
The experience adjustments on the defined benefit obligations and plan assets at March 31, 2012, 2011, 2010 and 2009 were as follows:
| | | | | | | | | | | | | | | | |
| | | At March 31, | |
| | | 2012 | | | 2011 | | | 2010 | | | 2009 | |
| | | (In millions) | |
Present value of defined benefit obligations | | ¥ | (1,083,829 | ) | | ¥ | (1,004,860 | ) | | ¥ | (997,287 | ) | | ¥ | (974,398 | ) |
Fair value of plan assets | | | 899,154 | | | | 880,155 | | | | 888,577 | | | | 737,978 | |
| | | | | | | | | | | | | | | | |
Net deficit | | ¥ | (184,675 | ) | | ¥ | (124,705 | ) | | ¥ | (108,710 | ) | | ¥ | (236,420 | ) |
| | | | | | | | | | | | | | | | |
| | | | |
Experience losses on defined benefit obligations | | ¥ | (2,993 | ) | | ¥ | (4,242 | ) | | ¥ | (8,524 | ) | | ¥ | (3,125 | ) |
Experience losses on plan assets | | | (30,604 | ) | | | (75,329 | ) | | | (95,762 | ) | | | (265,098 | ) |
Expected contribution
Expected contributions to the defined benefit plans for the fiscal year ending March 31, 2013 are ¥45,097 million.
Defined Contribution Plans
Some of SMFG’s subsidiaries provide defined contribution plans. The amounts recognized as expenses for the defined contribution plans were ¥4,416 million, ¥3,751 million and ¥2,958 million for the fiscal years ended March 31, 2012, 2011 and 2010, respectively, which were included in “General and administrative expenses” in the consolidated income statement.
Employees’ Pension Insurance Plan
In Japan, the national government operates the Employees’ Pension Insurance Plan which covers most of the private entities’ employees. The amounts of contributions charged to expense for the Employees’ Pension
F-66
Insurance Plan were ¥29,991 million, ¥27,898 million and ¥21,124 million for the fiscal years ended March 31, 2012, 2011 and 2010, respectively, which were included in “General and administrative expenses” in the consolidated income statement.
Common Stock
The changes in the number of issued shares of common stock and common stock held by SMFG or its consolidated subsidiaries and associates during the fiscal years ended March 31, 2012, 2011 and 2010 were as follows:
| | | | | | | | | | | | | | | | | | | | | | | | |
| | | For the fiscal year ended March 31, | |
| | | 2012 | | | 2011 | | | 2010 | |
| | | Outstanding | | | In treasury | | | Outstanding | | | In treasury | | | Outstanding | | | In treasury | |
At beginning of period | | | 1,414,055,625 | | | | 32,581,914 | | | | 1,414,055,625 | | | | 17,070,340 | | | | 789,080,477 | | | | 20,049,818 | |
Issuance of common stock | | | — | | | | — | | | | — | | | | — | | | | 588,631,300 | | | | — | |
Conversion of Type 4 preferred stock | | | — | | | | — | | | | — | | | | — | | | | 36,343,848 | | | | — | |
Net change | | | — | | | | 30,357,645 | (1) | | | — | | | | 15,511,574 | (2) | | | — | | | | (2,979,478 | ) |
| | | | | | | | | | | | | | | | | | | | | | | | |
At end of period | | | 1,414,055,625 | | | | 62,939,559 | | | | 1,414,055,625 | | | | 32,581,914 | | | | 1,414,055,625 | | | | 17,070,340 | |
| | | | | | | | | | | | | | | | | | | | | | | | |
| (1) | Includes an increase of 45,686,368 shares acquired mainly as consideration for the share exchange to make Promise a wholly-owned subsidiary of SMFG, and a decrease of 15,328,723 shares mainly delivered to shareholders of Cedyna by SMFG Card & Credit, a wholly-owned subsidiary of SMFG, as consideration for the share exchange executed on May 1, 2011. |
| (2) | Includes 15,479,400 shares acquired by SMFG Card & Credit in connection with making Cedyna a wholly-owned subsidiary of SMFG Card & Credit through a share exchange. |
The total number of authorized shares of common stock was 3,000 million at March 31, 2012 and 2011 with no stated value. All issued shares are fully paid. The details of the stock options outstanding to subscribe for shares of SMFG common stock are described in Note 40 “Share-Based Payment.”
Preferred Stock
Preferred stock at March 31, 2012 and 2011 consisted of the following:
| | | | | | | | | | | | | | | | |
| | | | | | Number of shares | | | | |
| | | Aggregate
amount | | | Authorized | | | Issued | | | Liquidation value
per share | |
| | | (In millions) | | | | | | | | | (In yen) | |
At March 31, 2012: | | | | | | | | | | | | | | | | |
Type 5 preferred stock | | ¥ | — | | | | 167,000 | | | | — | | | ¥ | — | |
Type 6 preferred stock(1) | | | — | | | | 70,001 | | | | — | | | | — | |
Type 7 preferred stock | | | — | | | | 167,000 | | | | — | | | | — | |
Type 8 preferred stock | | | — | | | | 115,000 | | | | — | | | | — | |
Type 9 preferred stock | | | — | | | | 115,000 | | | | — | | | | — | |
| | | | |
At March 31, 2011: | | | | | | | | | | | | | | | | |
Type 5 preferred stock | | ¥ | — | | | | 167,000 | | | | — | | | ¥ | — | |
Type 6 preferred stock(1) | | | 210,003 | | | | 70,001 | | | | 70,001 | | | | 3,000,000 | |
Type 7 preferred stock | | | — | | | | 167,000 | | | | — | | | | — | |
Type 8 preferred stock | | | — | | | | 115,000 | | | | — | | | | — | |
Type 9 preferred stock | | | — | | | | 115,000 | | | | — | | | | — | |
| (1) | SMFG acquired and cancelled all of the Type 6 preferred stocks on April 1, 2011. |
F-67
The movement of preferred stock for the fiscal years ended March 31, 2012, 2011 and 2010 was as follows:
| | | | | | | | | | | | | | | | |
| | | Type 4 preferred stock | | | Type 6 preferred stock | |
| | | Aggregate
amount | | | Number of shares | | | Aggregate
amount | | | Number of shares | |
| | | (In millions) | | | | | | (In millions) | | | | |
Balance at April 1, 2009 | | ¥ | 100,200 | | | | 33,400 | | | ¥ | 210,003 | | | | 70,001 | |
Conversion to common stock | | | (100,200 | ) | | | (33,400 | ) | | | — | | | | — | |
| | | | | | | | | | | | | | | | |
Balance at March 31, 2010 | | | — | | | | — | | | | 210,003 | | | | 70,001 | |
| | | | | | | | | | | | | | | | |
Balance at March 31, 2011 | | | — | | | | — | | | | 210,003 | | | | 70,001 | |
| | | | | | | | | | | | | | | | |
Acquisition and cancellation | | | — | | | | — | | | | (210,003 | ) | | | (70,001 | ) |
| | | | | | | | | | | | | | | | |
Balance at March 31, 2012 | | ¥ | — | | | | — | | | ¥ | — | | | | — | |
| | | | | | | | | | | | | | | | |
All the preferred stocks have no stated value. The numbers in “Aggregate amount” in the table above represent the initial proceeds upon issuance.
Type 4 preferred stock
On January 15, 2003, SMFG’s Board of Directors resolved to issue an aggregate amount of ¥150.3 billion of Type 4 preferred stock. The face value of each Type 4 preferred stock was ¥3 million. On the same day, SMFG and Goldman Sachs Group, Inc. (“GS”) entered into a preferred stock subscription agreement through which GS subscribed for all of the issued Type 4 preferred stock. The Type 4 preferred stock was issued on February 8, 2003.
On April 30, 2008, GS exercised its conversion rights with respect to 16,700 Type 4 preferred stock at a conversion price of ¥3,188. Pursuant to the conversion, SMFG issued 15,715,100 shares of its common stock. GS exercised its conversion rights with respect to the remaining Type 4 preferred stock on January 28, 2010, at a conversion price of ¥2,757. Pursuant to the conversion, SMFG issued 36,343,848 shares of its common stock. None of the Type 4 preferred stock was outstanding at March 31, 2012, 2011, and 2010.
The Type 4 preferred stock had noncumulative and nonparticipating dividend rights. When SMFG paid annual dividends or interim dividends to its common stockholders, SMFG was required to pay to the holders of the Type 4 preferred stock an annual dividend per share of ¥135,000 or an interim dividend per share of ¥67,500 in preference to the common stockholders (any such interim dividend on the Type 4 preferred stock reduced the following annual dividend by the same amount). The holders of the Type 4 preferred stock were not entitled to any other dividends. The holders of the Type 4 preferred stock were not entitled to vote at the general shareholders’ meeting unless a proposal to pay dividends to the holders of the Type 4 preferred stock was not submitted to a stockholder vote or was rejected by a stockholder vote.
In the event of SMFG’s voluntary or involuntary liquidation, the holders of the Type 4 preferred stock would have been entitled to receive out of SMFG’s residual assets a distribution of ¥3 million per share. The holders of the Type 4 preferred stock would have ranked equally with the holders of SMFG’s other preferred stocks and in preference to the common stockholders. The holders of the Type 4 preferred stock were not entitled to any further distribution upon SMFG’s liquidation.
The Type 4 preferred stock was convertible to common stock at any time from February 7, 2005 up to February 7, 2028. The conversion price was set initially at ¥3,310, the market price at which the Type 4 preferred stock was issued. The conversion price was subject to a downward reset at the time of conversion, if the market price of the common stock was less than the conversion price, as measured by a 30-day moving average. The downward reset was subject to a floor price, which was initially ¥1,092. If any Type 4 preferred stock had remained outstanding on February 7, 2028, it would have been mandatorily converted into common stock on the following day.
F-68
The instrument was accounted for in accordance with the substance of the transaction. As such, as required by IAS 32, the Type 4 preferred stock was treated as a compound financial instrument containing a liability component that represented the obligation on SMFG to deliver a variable number of common stock on conversion and an equity component representing the discretionary dividends. The liability component was required to be accounted for under IAS 39, and comprised of an embedded derivative representing the right to exercise the conversion before the maturity and the cap and floor on the number of common stocks to be delivered upon the conversion, and a financial liability representing the obligation to deliver ¥3 million worth of common stocks at maturity. At the contract date, SMFG recognized ¥16.0 billion of financial liability and ¥130.8 billion of embedded derivative, both of which were measured at fair value, and ¥3.5 billion of equity as the residual. The financial liability was subsequently carried at amortized cost and “Interest expense” was recognized in the consolidated income statement using the effective interest rate. The embedded derivative was subsequently carried at fair value and the change in the fair value was recognized in “Net trading income” in the consolidated income statement. At the conversion into common stock, the amount equivalent to the fair value of the common stocks delivered was credited to equity and the difference compared to the carrying amount of the financial liability, and the embedded derivative was recognized as a profit or loss. Dividends on the Type 4 preferred stock were recognized in equity in the period in which they were approved by the shareholders.
Type 6 preferred stock
On March 10, 2005, SMFG’s Board of Directors resolved at the meeting to issue an aggregate amount of ¥210 billion of Type 6 preferred stock by means of a third-party allocation. On March 29, 2005, SMFG issued Type 6 preferred stock totaling 70,001 stocks to qualified institutional investors as defined in the Financial Instruments and Exchange Act of Japan (Sumitomo Life Insurance Company, Nippon Life Insurance Company and Mitsui Life Insurance Company).
The Type 6 preferred stock had noncumulative and nonparticipating dividend rights. When SMFG paid annual dividends or interim dividends to its common stockholders, SMFG was required to pay to the holders of the Type 6 preferred stock an annual dividend of ¥88,500 or an interim dividend of ¥44,250 in preference to the common stockholders (Any such interim dividend on the Type 6 preferred stock reduced the following annual dividend by the same amount). The holders of the Type 6 preferred stock were not entitled to any other dividends. The holders of the Type 6 preferred stock were not entitled to vote at the general shareholders’ meeting unless a proposal to pay dividends to the holders of the Type 6 preferred stock was not submitted to a stockholder vote or was rejected by a stockholder vote.
In the event of SMFG’s voluntary or involuntary liquidation, the holders of the Type 6 preferred stock would have been entitled to receive out of SMFG’s residual assets a distribution of ¥3 million per share. The holders of the Type 6 preferred stock would have ranked equally with the holders of SMFG’s other preferred stocks and in preference to common stockholders in this right. The holders of the Type 6 preferred stock were not entitled to any further distribution upon SMFG’s liquidation. The Type 6 preferred stock was not convertible to common stock.
On February 28, 2011, SMFG’s Board of Directors resolved at a meeting to acquire and cancel all of the issued Type 6 preferred stock (70,001 shares). Subsequent to the resolution, SMFG acquired and cancelled those preferred stocks on April 1, 2011.
Under IFRS, in accordance with the substance of the contractual arrangement, the Type 6 preferred stock was treated as equity in its entirety because there was no legally binding obligation to pay dividends or principal.
Capital stock, Capital surplus and Treasury stock
“Capital stock” represents share capital under the Companies Act adjusted by the amount corresponding to the preferred stock which is accounted for as a liability under IFRS. Purchases of treasury stock are recognized at
F-69
cost in “Treasury stock.” Any additional paid-in capital, net gains or losses on the sale of treasury stock, and other changes in equity resulting from transactions with shareholders except for dividends are included in “Capital surplus.”
Restriction on the Payment of Dividends
The amount of the capital surplus and retained earnings of SMFG that can be paid out as dividends is subject to restrictions under the Companies Act. These amounts are calculated based on SMFG’s nonconsolidated statement of financial position prepared in accordance with Japanese GAAP. Therefore, the adjustments made to prepare the IFRS consolidated financial statements have no impact on the calculation. The total amount that SMFG can pay out as a dividend was ¥630 billion at March 31, 2012.
Other than the restriction by the Companies Act, SMFG is required to maintain a risk-weighted capital ratio above 8% (at least half of which must consist of core capital (“Tier I”), or a risk-weighted core capital ratio of 4%) as per the Banking Act of Japan (“Banking Act”). Therefore, SMFG would not be able to pay a dividend if the ratio were to fall below the minimum amount as a result of the payment of the dividends.
Since SMFG is a holding company, its earnings rely mostly on dividend income from SMBC, and SMFG’s other subsidiaries and associates. SMBC is subject to some restrictions on its dividend payment by the Companies Act and the Banking Act, similar to those applied to SMFG.
Other Reserves
Available-for-sale financial assets reserve
The available-for-sale financial assets reserve includes the accumulated gains and losses of available-for-sale financial assets excluding the amount reclassified to profit or loss when the assets are derecognized or impaired.
The movements of the available-for-sale financial assets reserve for the fiscal years ended March 31, 2012, 2011 and 2010 were as follows:
| | | | | | | | | | | | |
| | | For the fiscal year ended March 31, | |
| | | 2012 | | | 2011 | | | 2010 | |
| | | (In millions) | |
At beginning of period | | ¥ | 465,185 | | | ¥ | 663,907 | | | ¥ | 349,213 | |
| | | |
Gains (losses) arising during the period, before tax | | | 253,865 | | | | (349,080 | ) | | | 616,762 | |
Income tax (expenses) benefits for changes arising during the period | | | (50,061 | ) | | | 142,268 | | | | (251,308 | ) |
| | | |
Reclassification adjustments for (gains) losses included in net profit, before tax | | | (21,563 | ) | | | 10,957 | | | | (77,339 | ) |
Income tax expenses (benefits) for reclassification adjustments | | | 8,867 | | | | (5,131 | ) | | | 31,362 | |
| | | |
Amount attributable to non-controlling interests | | | (6,167 | ) | | | 2,543 | | | | (9,012 | ) |
Share of other comprehensive income (loss) of associates and joint ventures | | | (195 | ) | | | (279 | ) | | | 4,229 | |
| | | | | | | | | | | | |
At end of period | | ¥ | 649,931 | | | ¥ | 465,185 | | | ¥ | 663,907 | |
| | | | | | | | | | | | |
F-70
Exchange differences on translating the foreign operations reserve
Exchange differences on translating the foreign operations reserve include foreign exchange differences arising from the translation of the net assets of foreign operations from their functional currencies to the SMFG Group’s presentation currency, Japanese yen.
The movements of exchange differences on translating the foreign operations reserve for the fiscal years ended March 31, 2012, 2011 and 2010 were as follows:
| | | | | | | | | | | | |
| | | For the fiscal year ended March 31, | |
| | | 2012 | | | 2011 | | | 2010 | |
| | | (In millions) | |
At beginning of period | | ¥ | (184,402 | ) | | ¥ | (108,618 | ) | | ¥ | (120,897 | ) |
| | | |
Losses arising during the period, before tax | | | (34,781 | ) | | | (121,593 | ) | | | (15,009 | ) |
Income tax (expenses) benefits for losses arising during the period | | | (503 | ) | | | 9,383 | | | | 59 | |
| | | |
Reclassification adjustments for (gains) losses included in net
profit, before tax | | | 7,350 | | | | (505 | ) | | | 2 | |
Income tax benefits for reclassification adjustments | | | (2,112 | ) | | | — | | | | — | |
| | | |
Amount attributable to non-controlling interests | | | 4,331 | | | | 40,877 | | | | 21,496 | |
Share of other comprehensive income (loss) of associates and joint ventures | | | (2,637 | ) | | | (3,946 | ) | | | 5,731 | |
| | | | | | | | | | | | |
At end of period | | ¥ | (212,754 | ) | | ¥ | (184,402 | ) | | ¥ | (108,618 | ) |
| | | | | | | | | | | | |
| 25 | NON-CONTROLLING INTERESTS |
Non-controlling interests at March 31, 2012 and 2011 consisted of the following:
| | | | | | | | |
| | | At March 31, | |
| | | 2012 | | | 2011 | |
| | | (In millions) | |
Preferred securities issued by subsidiaries | | ¥ | 1,588,893 | | | ¥ | 1,593,619 | |
Others(1) | | | 461,833 | | | | 455,043 | |
| | | | | | | | |
Total non-controlling interests | | ¥ | 2,050,726 | | | ¥ | 2,048,662 | |
| | | | | | | | |
| (1) | For the fiscal year ended March 31, 2012, the SMFG Group recognized the decrease of equity by ¥15 billion from the transactions with non-controlling interests that do not result in a loss of control. Most of the decrease was recognized by the share exchange transaction made in May 2011 to make Cedyna a wholly-owned subsidiary. By this exchange, ¥36 billion of treasury stocks were exchanged with non-controlling interests of Cedyna. |
F-71
Preferred securities issued by subsidiaries consisted of the following:
| | | | | | | | |
| | | At March 31, | |
| | | 2012 | | | 2011 | |
| | | (In millions) | |
Issued by SMFG’s subsidiaries, other than SMBC: | | | | | | | | |
SMFG Preferred Capital USD 1 Limited
(non-cumulative step-up perpetual preferred securities) | | ¥ | 53,314 | | | ¥ | 53,976 | |
SMFG Preferred Capital GBP 1 Limited
(non-cumulative step-up perpetual preferred securities) | | | 9,657 | | | | 9,850 | |
SMFG Preferred Capital JPY 1 Limited
(non-cumulative perpetual preferred securities) | | | 135,000 | | | | 135,000 | |
SMFG Preferred Capital USD 2 Limited
(non-cumulative perpetual preferred securities) | | | 147,834 | | | | 149,670 | |
SMFG Preferred Capital USD 3 Limited
(non-cumulative step-up perpetual preferred securities) | | | 110,876 | | | | 112,253 | |
SMFG Preferred Capital GBP 2 Limited
(non-cumulative step-up perpetual preferred securities) | | | 32,812 | | | | 33,470 | |
SMFG Preferred Capital JPY 2 Limited | | | | | | | | |
Series A (non-cumulative step-up perpetual preferred securities) | | | 113,000 | | | | 113,000 | |
Series B (non-cumulative perpetual preferred securities) | | | 140,000 | | | | 140,000 | |
Series C (non-cumulative perpetual preferred securities) | | | 140,000 | | | | 140,000 | |
Series D (non-cumulative perpetual preferred securities) | | | 145,200 | | | | 145,200 | |
Series E (non-cumulative perpetual preferred securities) | | | 33,000 | | | | 33,000 | |
Series F (non-cumulative perpetual preferred securities) | | | 2,000 | | | | 2,000 | |
Series G (non-cumulative perpetual preferred securities) | | | 125,700 | | | | 125,700 | |
SMFG Preferred Capital JPY 3 Limited | | | | | | | | |
Series A (non-cumulative step-up perpetual preferred securities) | | | 99,000 | | | | 99,000 | |
Series B (non-cumulative perpetual preferred securities) | | | 164,500 | | | | 164,500 | |
Series C (non-cumulative perpetual preferred securities) | | | 79,500 | | | | 79,500 | |
Series D (non-cumulative perpetual preferred securities) | | | 45,000 | | | | 45,000 | |
Issued by a subsidiary of Kansai Urban Banking Corporation: | | | | | | | | |
KUBC Preferred Capital Cayman Limited
(non-cumulative step-up perpetual preferred securities)(1) | | | 12,500 | | | | 12,500 | |
| | | | | | | | |
Preferred securities issued by subsidiaries | | ¥ | 1,588,893 | | | ¥ | 1,593,619 | |
| | | | | | | | |
| (1) | On May 14, 2012, KUBC announced that the preferred securities issued by KUBC Preferred Capital Cayman Limited would be redeemed in full amount on July 25, 2012. |
F-72
Net interest income for the fiscal years ended March 31, 2012, 2011 and 2010 consisted of the following:
| | | | | | | | | | | | |
| | | For the fiscal year ended March 31, | |
| | | 2012 | | | 2011 | | | 2010 | |
| | | (In millions) | |
Interest income from: | | | | | | | | | | | | |
Deposits with banks | | ¥ | 28,159 | | | ¥ | 18,468 | | | ¥ | 14,596 | |
Call loans and bills bought | | | 14,350 | | | | 9,274 | | | | 7,452 | |
Reverse repurchase agreements and cash collateral on securities borrowed | | | 15,119 | | | | 13,646 | | | | 9,436 | |
Investment securities | | | 137,953 | | | | 154,731 | | | | 150,857 | |
Loans and advances | | | 1,514,750 | | | | 1,524,062 | | | | 1,583,706 | |
| | | | | | | | | | | | |
Total interest income | | | 1,710,331 | | | | 1,720,181 | | | | 1,766,047 | |
| | | | | | | | | | | | |
Interest expense from: | | | | | | | | | | | | |
Deposits | | | 129,463 | | | | 134,484 | | | | 173,374 | |
Call money and bills sold | | | 3,563 | | | | 3,838 | | | | 6,247 | |
Repurchase agreements and cash collateral on securities lent | | | 10,566 | | | | 11,604 | | | | 7,546 | |
Borrowings | | | 83,490 | | | | 85,475 | | | | 79,304 | |
Debt securities in issue | | | 85,795 | | | | 74,944 | | | | 78,328 | |
Others | | | 754 | | | | 711 | | | | 2,011 | |
| | | | | | | | | | | | |
Total interest expense | | | 313,631 | | | | 311,056 | | | | 346,810 | |
| | | | | | | | | | | | |
Net interest income | | ¥ | 1,396,700 | | | ¥ | 1,409,125 | | | ¥ | 1,419,237 | |
| | | | | | | | | | | | |
Interest income recorded on impaired financial assets was ¥28,971 million, ¥33,176 million and ¥29,442 million for the fiscal years ended March 31, 2012, 2011 and 2010, respectively.
F-73
| 27 | NET FEE AND COMMISSION INCOME |
Net fee and commission income for the fiscal years ended March 31, 2012, 2011 and 2010 consisted of the following:
| | | | | | | | | | | | |
| | | For the fiscal year ended March 31, | |
| | | 2012 | | | 2011 | | | 2010 | |
| | | (In millions) | |
Fee and commission income from: | | | | | | | | | | | | |
Loans | | ¥ | 83,919 | | | ¥ | 75,860 | | | ¥ | 81,174 | |
Credit card business | | | 210,449 | | | | 181,160 | | | | 143,987 | |
Guarantees | | | 41,059 | | | | 28,779 | | | | 11,823 | |
Securities-related business | | | 80,965 | | | | 61,467 | | | | 43,164 | |
Deposits | | | 16,802 | | | | 16,256 | | | | 15,819 | |
Remittances and transfers | | | 125,796 | | | | 126,916 | | | | 124,917 | |
Safe deposits | | | 6,324 | | | | 6,508 | | | | 6,685 | |
Trust fees | | | 1,373 | | | | 2,328 | | | | 1,779 | |
Investment trusts | | | 142,941 | | | | 163,708 | | | | 96,258 | |
Agency | | | 18,897 | | | | 18,056 | | | | 14,763 | |
Others | | | 140,882 | | | | 125,666 | | | | 110,068 | |
| | | | | | | | | | | | |
Total fee and commission income | | | 869,407 | | | | 806,704 | | | | 650,437 | |
| | | | | | | | | | | | |
Fee and commission expense from: | | | | | | | | | | | | |
Remittances and transfers | | | 33,114 | | | | 34,062 | | | | 31,086 | |
Guarantees | | | 18,487 | | | | 21,645 | | | | 16,268 | |
Others | | | 80,961 | | | | 76,853 | | | | 74,362 | |
| | | | | | | | | | | | |
Total fee and commission expense | | | 132,562 | | | | 132,560 | | | | 121,716 | |
| | | | | | | | | | | | |
Net fee and commission income | | ¥ | 736,845 | | | ¥ | 674,144 | | | ¥ | 528,721 | |
| | | | | | | | | | | | |
Net trading income for the fiscal years ended March 31, 2012, 2011 and 2010 consisted of the following:
| | | | | | | | | | | | |
| | | For the fiscal year ended March 31, | |
| | | 2012 | | | 2011 | | | 2010 | |
| | | (In millions) | |
Interest rate | | ¥ | 131,736 | | | ¥ | 205,102 | | | ¥ | 106,562 | |
Foreign exchange | | | 37,951 | | | | 104,037 | | | | 104,929 | |
Equity | | | 14,790 | | | | 17,243 | | | | 36,969 | |
Credit | | | (1,907 | ) | | | (2,543 | ) | | | 53,203 | |
Others(1) | | | (274 | ) | | | 640 | | | | 28,467 | |
| | | | | | | | | | | | |
Total net trading income | | ¥ | 182,296 | | | ¥ | 324,479 | | | ¥ | 330,130 | |
| | | | | | | | | | | | |
| (1) | Others for the fiscal year ended March 31, 2010 include the change in fair value of the derivative embedded in the Type 4 preferred stock. |
Net trading income includes income and losses from trading assets and liabilities, and derivative financial instruments.
F-74
| 29 | NET INCOME FROM FINANCIAL ASSETS AT FAIR VALUE THROUGH PROFIT OR LOSS |
Net income from financial assets at fair value through profit or loss for the fiscal years ended March 31, 2012, 2011 and 2010 consisted of the following:
| | | | | | | | | | | | |
| | | For the fiscal year ended March 31, | |
| | | 2012 | | | 2011 | | | 2010 | |
| | | (In millions) | |
Net income from debt instruments | | ¥ | 34,334 | | | ¥ | 29,150 | | | ¥ | 65,403 | |
Net income (loss) from equity instruments | | | (600 | ) | | | 966 | | | | 10,176 | |
| | | | | | | | | | | | |
Total net income from financial assets at fair value through profit or loss | | ¥ | 33,734 | | | ¥ | 30,116 | | | ¥ | 75,579 | |
| | | | | | | | | | | | |
Net investment income for the fiscal years ended March 31, 2012, 2011 and 2010 consisted of the following:
| | | | | | | | | | | | |
| | | For the fiscal year ended March 31, | |
| | | 2012 | | | 2011 | | | 2010 | |
| | | (In millions) | |
Net gain from disposal of debt instruments | | ¥ | 149,484 | | | ¥ | 141,982 | | | ¥ | 61,541 | |
Net gain from disposal of equity instruments | | | 11,657 | | | | 20,779 | | | | 58,627 | |
Dividend income | | | 78,224 | | | | 73,150 | | | | 58,384 | |
| | | | | | | | | | | | |
Total net investment income | | ¥ | 239,365 | | | ¥ | 235,911 | | | ¥ | 178,552 | |
| | | | | | | | | | | | |
Other income for the fiscal years ended March 31, 2012, 2011 and 2010 consisted of the following:
| | | | | | | | | | | | |
| | | For the fiscal year ended March 31, | |
| | | 2012 | | | 2011 | | | 2010 | |
| | | (In millions) | |
Income from operating leases | | ¥ | 72,483 | | | ¥ | 63,199 | | | ¥ | 56,121 | |
Gains on disposal of assets leased | | | 24,977 | | | | 6,774 | | | | 10,344 | |
Income related to IT solution services | | | 39,648 | | | | 43,775 | | | | 44,319 | |
Gains on disposal of property, plant and equipment and other intangible assets | | | 2,741 | | | | 885 | | | | 17,179 | |
Reversal of impairment losses of investments in associates and joint ventures | | | 19,333 | | | | 13,533 | | | | 19,832 | |
Gains on step acquisition of subsidiaries | | | 27,491 | | | | 15,623 | | | | — | |
Others | | | 58,890 | | | | 60,681 | | | | 84,539 | |
| | | | | | | | | | | | |
Total other income | | ¥ | 245,563 | | | ¥ | 204,470 | | | ¥ | 232,334 | |
| | | | | | | | | | | | |
F-75
| 32 | IMPAIRMENT CHARGES ON FINANCIAL ASSETS |
Impairment charges on financial assets for the fiscal years ended March 31, 2012, 2011 and 2010 consisted of the following:
| | | | | | | | | | | | |
| | | For the fiscal year ended March 31, | |
| | | 2012 | | | 2011 | | | 2010 | |
| | | (In millions) | |
Loans and advances(1) | | ¥ | 144,022 | | | ¥ | 259,292 | | | ¥ | 215,886 | |
Available-for-sale financial assets | | | 140,288 | | | | 174,636 | | | | 42,755 | |
| | | | | | | | | | | | |
Total impairment charges on financial assets | | ¥ | 284,310 | | | ¥ | 433,928 | | | ¥ | 258,641 | |
| | | | | | | | | | | | |
| (1) | Cross-reference to provision for loan losses in Note 10 “Loans and Advances.” |
| 33 | GENERAL AND ADMINISTRATIVE EXPENSES |
General and administrative expenses for the fiscal years ended March 31, 2012, 2011 and 2010 consisted of the following:
| | | | | | | | | | | | |
| | | For the fiscal year ended March 31, | |
| | | 2012 | | | 2011 | | | 2010 | |
| | | (In millions) | |
Personnel expenses | | ¥ | 612,512 | | | ¥ | 577,970 | | | ¥ | 511,075 | |
Depreciation and amortization | | | 121,611 | | | | 112,618 | | | | 107,054 | |
Rent and lease expenses | | | 105,196 | | | | 92,160 | | | | 77,715 | |
Building and maintenance expenses | | | 8,283 | | | | 10,186 | | | | 9,176 | |
Supplies expenses | | | 14,192 | | | | 15,135 | | | | 14,797 | |
Communication expenses | | | 34,170 | | | | 33,538 | | | | 23,939 | |
Publicity and advertising expenses | | | 41,957 | | | | 40,213 | | | | 35,315 | |
Taxes and dues | | | 56,582 | | | | 56,648 | | | | 51,020 | |
Outsourcing expenses | | | 85,196 | | | | 79,525 | | | | 68,715 | |
Premiums for deposit insurance | | | 59,600 | | | | 57,637 | | | | 53,799 | |
Office equipment expenses | | | 32,201 | | | | 29,234 | | | | 22,537 | |
Others | | | 195,205 | | | | 188,682 | | | | 121,815 | |
| | | | | | | | | | | | |
Total general and administrative expenses | | ¥ | 1,366,705 | | | ¥ | 1,293,546 | | | ¥ | 1,096,957 | |
| | | | | | | | | | | | |
Other expenses for the fiscal years ended March 31, 2012, 2011 and 2010 consisted of the following:
| | | | | | | | | | | | |
| | | For the fiscal year ended March 31, | |
| | | 2012 | | | 2011 | | | 2010 | |
| | | (In millions) | |
Cost of operating leases | | ¥ | 46,278 | | | ¥ | 36,652 | | | ¥ | 30,487 | |
Losses on disposal of assets leased | | | 20,678 | | | | 2,599 | | | | 6,948 | |
Cost related to IT solution services | | | 98,914 | | | | 95,625 | | | | 95,342 | |
Losses on disposal of property, plant and equipment and other intangible assets | | | 6,541 | | | | 5,813 | | | | 4,497 | |
Impairment losses of property, plant and equipment | | | 3,757 | | | | 5,360 | | | | 9,899 | |
Impairment losses of intangible assets | | | 1,989 | | | | 59 | | | | 6,184 | |
Losses on sale of investments in subsidiaries and associates | | | 439 | | | | 138 | | | | 9,412 | |
Impairment losses of investments in associates and joint ventures | | | 656 | | | | 16,837 | | | | 18,134 | |
Others | | | 60,040 | | | | 49,209 | | | | 55,857 | |
| | | | | | | | | | | | |
Total other expenses | | ¥ | 239,292 | | | ¥ | 212,292 | | | ¥ | 236,760 | |
| | | | | | | | | | | | |
F-76
The detail of income tax expense for the fiscal years ended March 31, 2012, 2011 and 2010 was as follows:
| | | | | | | | | | | | |
| | | For the fiscal year ended March 31, | |
| | | 2012 | | | 2011 | | | 2010 | |
| | | (In millions) | |
Current tax: | | | | | | | | | | | | |
Charge for period | | ¥ | 102,257 | | | ¥ | 97,991 | | | ¥ | 102,050 | |
Deferred tax: | | | | | | | | | | | | |
Origination and reversal of temporary differences | | | 243,205 | | | | 262,877 | | | | 345,809 | |
Changes in Japanese corporation tax rates(1) | | | 103,944 | | | | — | | | | — | |
Change in the write-down of deferred tax assets on the current fiscal year income tax expense | | | 11,788 | | | | 297 | | | | 40,182 | |
| | | | | | | | | | | | |
Total deferred tax expense | | | 358,937 | | | | 263,174 | | | | 385,991 | |
| | | | | | | | | | | | |
Total income tax expense | | ¥ | 461,194 | | | ¥ | 361,165 | | | ¥ | 488,041 | |
| | | | | | | | | | | | |
| (1) | See Note 22 “Deferred Income Tax” for further information on changes in Japanese corporation tax rates. |
The following table shows the reconciliations of the effective income tax rates for the fiscal years ended March 31, 2012, 2011 and 2010.
| | | | | | | | | | | | |
| | | For the fiscal year ended March 31, | |
| | | 2012 | | | 2011 | | | 2010 | |
| | | (In millions, except percentages) | |
Profit before tax | | ¥ | 919,192 | | | ¥ | 932,683 | | | ¥ | 1,134,734 | |
Income tax expense | | | 461,194 | | | | 361,165 | | | | 488,041 | |
Effective income tax rate | | | 50.2 | % | | | 38.7 | % | | | 43.0 | % |
| | | |
Statutory tax rate in Japan(1) | | | 40.7 | % | | | 40.7 | % | | | 40.7 | % |
Changes in Japanese corporation tax rates | | | 11.3 | % | | | — | | | | — | |
Effect of the change in the write-down of deferred tax assets on the current fiscal year income tax expense | | | 1.3 | % | | | 0.1 | % | | | 3.5 | % |
Nontaxable dividends received | | | (1.2 | %) | | | (1.0 | %) | | | (0.1 | %) |
Tax impact of share of post-tax losses in associates and joint ventures | | | 1.1 | % | | | 0.2 | % | | | 1.1 | % |
Gains on step acquisition of subsidiaries which were not taxable | | | (1.1 | %) | | | (0.7 | %) | | | — | |
Tax impact of impairment losses and reversal of impairment losses for investments in associates and joint ventures—net | | | (0.8 | %) | | | 0.1 | % | | | (0.1 | %) |
Income from derivative and liability component of Type 4 preferred stock which was not taxable | | | — | | | | — | | | | (0.7 | %) |
Others—net | | | (1.1 | %) | | | (0.7 | %) | | | (1.4 | %) |
| | | | | | | | | | | | |
Effective income tax rate | | | 50.2 | % | | | 38.7 | % | | | 43.0 | % |
| | | | | | | | | | | | |
| (1) | The statutory tax rate in Japan is the aggregate of the effective corporate tax rate of 27.9%, the effective inhabitant tax rate of 5.8% and the effective enterprise tax rate of 7.0%, which is payable by corporate entities on taxable profits under the tax laws in Japan. It will change from the fiscal year beginning April 1, 2012 reflecting the changes in Japanese corporation tax rates as mentioned in Note 22 “Deferred Income Tax.” |
F-77
The following tables show the income and share data used in the basic and diluted earnings per share calculations for the fiscal years ended March 31, 2012, 2011 and 2010.
| | | | | | | | | | | | |
| | | For the fiscal year ended March 31, | |
| | | 2012 | | | 2011 | | | 2010 | |
| | | (In millions, except number of shares and
per share data) | |
Basic: | | | | | | | | | | | | |
Profit attributable to shareholders of SMFG | | ¥ | 345,430 | | | ¥ | 464,007 | | | ¥ | 528,692 | |
Dividend payable on preferred stock classified as equity | | | — | | | | (6,195 | ) | | | (8,450 | ) |
| | | | | | | | | | | | |
Profit attributable to the common shareholders of SMFG | | ¥ | 345,430 | | | ¥ | 457,812 | | | ¥ | 520,242 | |
| | | | | | | | | | | | |
Weighted average number of common stock in issue (in thousands of shares) | | | 1,387,405 | | | | 1,394,391 | | | | 1,017,066 | |
| | | | | | | | | | | | |
Basic earnings per share | | ¥ | 248.98 | | | ¥ | 328.32 | | | ¥ | 511.51 | |
| | | | | | | | | | | | |
| | | For the fiscal year ended March 31, | |
| | | 2012 | | | 2011 | | | 2010 | |
| | | (In millions, except number of shares and
per share data) | |
Diluted: | | | | | | | | | | | | |
Profit attributable to the common shareholders of SMFG | | ¥ | 345,430 | | | ¥ | 457,812 | | | ¥ | 520,242 | |
Dividend payable on preferred stock classified as equity | | | — | | | | — | | | | 2,255 | |
Dilutive impact of convertible instruments issued by subsidiary | | | (896 | ) | | | — | | | | — | |
Net profit on the liability component of Type 4 preferred stock | | | — | | | | — | | | | (20,165 | ) |
| | | | | | | | | | | | |
Net profit used to determine diluted earnings per share | | ¥ | 344,534 | | | ¥ | 457,812 | | | ¥ | 502,332 | |
| | | | | | | | | | | | |
Weighted average number of common stock in issue (in thousands of shares) | | | 1,387,405 | | | | 1,394,391 | | | | 1,017,066 | |
Adjustments for stock options (in thousands of shares) | | | 244 | | | | 68 | | | | — | |
Adjustments for preferred stock (in thousands of shares) | | | — | | | | — | | | | 26,005 | |
| | | | | | | | | | | | |
Weighted average number of common stock for diluted earnings per share (in thousands of shares) | | | 1,387,649 | | | | 1,394,459 | | | | 1,043,071 | |
| | | | | | | | | | | | |
Diluted earnings per share | | ¥ | 248.29 | | | ¥ | 328.31 | | | ¥ | 481.59 | |
Stock options granted to certain directors and employees of SMBC before the establishment of SMFG have an effect on the potential common stock. Those stock options were antidilutive and not included in the calculation of diluted earnings per share for the fiscal years ended March 31, 2012, 2011 and 2010. The details of stock options are described in Note 40 “Share-Based Payment.”
| 37 | TRANSFERS OF FINANCIAL ASSETS WHICH DO NOT QUALIFY FOR DERECOGNITION |
Full derecognition occurs when the SMFG Group transfers its contractual rights to receive cash flows from financial assets or retains the contractual rights to receive the cash flows, but assumes a contractual obligation to pay the cash flows to another party, and transfers substantially all the risks and rewards of ownership, including credit risk, prepayment risk and interest rate risk.
F-78
The following table shows the carrying amount of financial assets which were transferred, but did not qualify for derecognition and their associated financial liabilities.
| | | | | | | | | | | | | | | | |
| | | At March 31, | |
| | | 2012 | | | 2011 | |
| | | Carrying amount
of assets | | | Associated
liabilities | | | Carrying amount
of assets | | | Associated
liabilities | |
| | | (In millions) | |
Nature of transaction: | | | | | | | | | | | | | | | | |
Repurchase agreements and securities lending transactions | | ¥ | 6,861,236 | | | ¥ | 6,856,937 | | | ¥ | 5,823,127 | | | ¥ | 5,804,901 | |
Loans and advances | | | 63,609 | | | | 43,477 | | | | 93,189 | | | | 63,812 | |
| | | | | | | | | | | | | | | | |
Total | | ¥ | 6,924,845 | | | ¥ | 6,900,414 | | | ¥ | 5,916,316 | | | ¥ | 5,868,713 | |
| | | | | | | | | | | | | | | | |
| 38 | ASSETS PLEDGED AND RECEIVED AS COLLATERAL |
Assets Pledged
The carrying amounts of assets pledged as collateral at March 31, 2012 and 2011 were as follows:
| | | | | | | | |
| | | At March 31, | |
| | | 2012 | | | 2011 | |
| | | (In millions) | |
Cash and deposits with banks | | ¥ | 318,376 | | | ¥ | 35,847 | |
Call loans and bills bought | | | 490,255 | | | | 327,259 | |
Trading assets | | | 3,805,912 | | | | 2,745,308 | |
Financial assets at fair value through profit or loss | | | 1,386,242 | | | | 1,320,927 | |
Held-to-maturity investments | | | 5,163,048 | | | | 4,061,049 | |
Available-for-sale financial assets | | | 24,998,239 | | | | 23,858,052 | |
Loans and advances | | | 2,700,373 | | | | 2,277,458 | |
Property, plant and equipment | | | 14,336 | | | | 15,019 | |
Other assets | | | 329,394 | | | | 222,217 | |
| | | | | | | | |
Total | | ¥ | 39,206,175 | | | ¥ | 34,863,136 | |
| | | | | | | | |
The SMFG Group pledges assets as collateral to secure payables under repurchase agreements, securities lending transactions and securitizations, borrowings or for cash settlements, variation margins on futures markets and certain other purposes. These transactions are conducted under terms that are usual and customary to standard contracts.
Unsecured loaned securities for which the borrowers have the right to sell or repledge were ¥7,216,071 million and ¥6,158,772 million at March 31, 2012 and 2011, respectively.
For the reserve funds with the Bank of Japan and other reserve deposits for foreign offices maintained by the SMFG Group, refer to Note 5 “Cash and Deposits with Banks.”
Assets Received as Collateral
Under certain transactions, including reverse repurchase agreements, securities borrowing, and discounting of bills, the SMFG Group is permitted to resell or repledge the collateral held in the absence of default by the owner of the collateral. These transactions are conducted under terms that are usual and customary for standard contracts. The fair values of securities and bills accepted as collateral were ¥5,947,179 million and ¥5,992,194 million at March 31, 2012 and 2011, respectively. As to the securities received in the reverse repurchase
F-79
agreements and securities borrowing transactions, the SMFG Group has the obligation to return equivalent securities upon completion of the transactions. The fair value of securities sold or repledged to others was ¥4,200,677 million and ¥4,608,606 million at March 31, 2012 and 2011, respectively.
| 39 | DEFERRED DAY ONE PROFIT AND LOSS |
The aggregate deferred day one profit and loss yet to be recognized in profit or loss at the beginning and end of the fiscal years ended March 31, 2012 and 2011, and reconciliation of the changes in the balances were as follows:
| | | | | | | | |
| | | For the fiscal year ended March 31, | |
| | | 2012 | | | 2011 | |
| | | (In millions) | |
Balance at beginning of period | | ¥ | 4,051 | | | ¥ | 6,546 | |
Released to profit or loss | | | (2,261 | ) | | | (2,495 | ) |
| | | | | | | | |
Balance at end of period | | ¥ | 1,790 | | | ¥ | 4,051 | |
| | | | | | | | |
The SMFG Group has entered into transactions where the fair value is determined using valuation techniques for which not all inputs are observable in the market. The difference between the transaction price and the fair value that would be determined at initial recognition using a valuation technique is referred to as “day one profit and loss,” which is not recognized immediately in the consolidated income statement. The table above shows the “day one profit and loss” balances, all of which are derived from financial assets at fair value through profit or loss. The release to profit or loss is due to the amortization of the deferred day one profit and loss over the life of the instruments. See Note 44 “Fair Value of Financial Assets and Liabilities” for additional information.
Before the establishment of SMFG in December 2002, SMBC granted common stock options to certain directors and employees of SMBC. When SMFG was established, SMFG took over the obligations related to the stock options from SMBC (“Pre-2002 stock option”). SMFG elected not to apply IFRS 2 “Shared-based Payments” to those stock options because they were granted and vested prior to the date of transition to IFRS, April 1, 2008.
In June 2010, a resolution was passed at the general meeting of shareholders to introduce the compensation-type stock options to directors, corporate auditors, and executive officers of SMFG and SMBC (“SMFG Stock Acquisition Rights”). This serves as an incentive for them to further contribute to the equity appreciation and achieve better corporate performance through sharing the benefits and risks of the share price performance with the shareholders. These changes reflected a review of the compensation system where the retirement benefit for directors, corporate auditors and executive officers was abolished. The following table provides an overview of the significant terms and conditions of these stock option plans.
| | | | | | | | |
| | | Title of grantees | | Exercise period | | Requisite service
period | | Method of settlement |
Pre-2002 stock option | | Directors and employees of SMFG and SMBC | | June 28, 2004
to June 27, 2012 | | Not applicable | | Common stock of
SMFG |
SMFG Stock Acquisition Rights | | Directors, corporate auditors and executive officers of SMFG and SMBC | | Not exceeding 30
years from the date
of allocation of stock
acquisition rights(1) | | One year from the
date of the ordinary
general meeting of
shareholders of
SMFG to the closing
of the next ordinary
general meeting of
shareholders of
SMFG | | Common stock of
SMFG |
| (1) | A stock acquisition rights holder can exercise the rights from the day they are relieved of their positions either as a director, a corporate auditor or an executive officer (“Start of Exercise Date”) to 20 years from the Start of Exercise Date. |
F-80
The number and the weighted average exercise prices of stock options for the fiscal years ended on March 31, 2012 and 2011 were as follows:
| | | | | | | | | | | | | | | | |
| | | For the fiscal year ended March 31, | |
| | | 2012 | | | 2011 | |
| | | Number of
options(1) | | | Weighted
average
exercise price | | | Number of
options(1) | | | Weighted
average
exercise price | |
Outstanding at beginning of period | | | 210,700 | | | ¥ | 3,412 | | | | 108,100 | | | ¥ | 6,649 | |
Granted | | | 268,200 | | | | 1 | | | | 102,600 | | | | 1 | |
Exercised | | | (500 | ) | | | 1 | | | | — | | | | — | |
Forfeited | | | (3,900 | ) | | | 1 | | | | — | | | | — | |
| | | | | | | | | | | | | | | | |
Outstanding at end of period | | | 474,500 | | | ¥ | 1,516 | | | | 210,700 | | | ¥ | 3,412 | |
| | | | | | | | | | | | | | | | |
Exercisable at end of period | | | 139,800 | | | ¥ | 5,142 | | | | 108,100 | | | ¥ | 6,649 | |
| (1) | Number of options is the number of SMFG’s common stock granted by the exercise of stock options. |
The weighted average stock price at the date of exercise was ¥2,336 for the fiscal year ended March 31, 2012.
Summarized information about stock options outstanding at March 31, 2012 and 2011 was as follows:
| | | | | | | | | | | | | | | | | | | | |
| | | | | | At March 31, | |
| | | | | | 2012 | | | 2011 | |
| | | Exercise
price | | | Number of
options | | | Remaining
contractual lives
in years | | | Number of
options | | | Remaining
contractual lives
in years | |
Pre-2002 stock option | | ¥ | 6,649 | | | | 108,100 | | | | 0.3 | | | | 108,100 | | | | 1.3 | |
SMFG Stock Acquisition Rights | | ¥ | 1 | | | | 366,400 | | | | 29.1 | | | | 102,600 | | | | 29.4 | |
F-81
The amounts of stock options recognized as expenses were measured based on the fair value of stock options granted, which were ¥431 million and ¥180 million for the fiscal years ended March 31, 2012 and 2011, respectively, and included in “General and administrative expenses” in the consolidated income statement. The fair value at the measurement date and the assumptions used to estimate the fair value of SMFG Stock Acquisition Rights granted for the fiscal years ended March 31, 2012 and 2011 were as follows:
| | | | |
| | | For the fiscal year ended March 31, |
| | | 2012 | | 2011 |
Fair value at measurement date | | ¥1,872 | | ¥2,215 |
Valuation technique | | Black-Scholes option-pricing model | | Black-Scholes option-pricing model |
Stock price | | ¥2,239 | | ¥2,587 |
Exercise price | | ¥1 | | ¥1 |
Expected volatility | | 51.64%(1) | | 51.44%(2) |
Expected remaining life(3) | | 4 years | | 4 years |
Expected dividends | | ¥ 100 per share(4) | | ¥ 100 per share(5) |
Risk free interest rate(6) | | 0.30% | | 0.23% |
| (1) | Calculated based on the actual stock prices during the 4 years from August 17, 2007 to August 16, 2011. |
| (2) | Calculated based on the actual stock prices during the 4 years from August 14, 2006 to August 13, 2010. |
| (3) | The average expected remaining life could not be estimated rationally due to insufficient amount of data. Therefore, it was estimated based on average remaining service life of directors of SMFG and its consolidated subsidiaries. |
| (4) | Expected dividends are based on the actual dividends on common stock for the fiscal year ended March 31, 2012. |
| (5) | Expected dividends are based on the actual dividends on common stock for the fiscal year ended March 31, 2011. |
| (6) | Japanese government bond yield corresponding to the average expected remaining life. |
The dividends recognized by the SMFG Group for the fiscal years ended March 31, 2012, 2011 and 2010 were as follows:
| | | | | | | | |
| | | Dividends per share | | | Aggregate amount | |
| | | (In yen) | | | (In millions) | |
For the fiscal year ended March 31, 2012: | | | | | | | | |
Common stock | | ¥ | 100 | | | ¥ | 138,913 | |
1st series Type 6 preferred stock | | | 44,250 | | | | 3,098 | |
| | |
For the fiscal year ended March 31, 2011: | | | | | | | | |
Common stock | | ¥ | 105 | | | ¥ | 146,683 | |
1st series Type 6 preferred stock | | | 88,500 | | | | 6,195 | |
| | |
For the fiscal year ended March 31, 2010: | | | | | | | | |
Common stock | | ¥ | 65 | | | ¥ | 60,471 | |
1st to 12th series Type 4 preferred stock | | | 135,000 | | | | 4,509 | |
1st series Type 6 preferred stock | | | 88,500 | | | | 6,195 | |
On June 28, 2012, the general meeting of shareholders approved a dividend of ¥50 per share of common stock totaling ¥67,556 million in respect of the fiscal year ended March 31, 2012. The consolidated financial statements for the fiscal year ended March 31, 2012 do not include this dividend payable.
F-82
| 42 | CONTINGENCY AND CAPITAL COMMITMENTS |
Legal Proceedings
The SMFG Group is engaged in various legal proceedings in Japan and a number of overseas jurisdictions, involving claims by and against it, which arise in the normal course of business. The SMFG Group does not expect that the outcome of these proceedings will have a significant adverse effect on the consolidated financial statements of the SMFG Group. The SMFG Group has recorded adequate provisions in “Other provisions” in Note 20 “Provisions” with respect to litigation arising out of normal business operations. The SMFG Group has not disclosed any contingent liability associated with these legal actions because it can not reliably be estimated.
Capital Commitments
At March 31, 2012 and 2011, the SMFG Group had ¥503 million and ¥1,926 million, respectively, of contractual commitments to acquire intangible assets, such as software. In addition, the SMFG Group had ¥44,058 million and ¥8,786 million of contractual commitments to acquire property, plant and equipment at March 31, 2012 and 2011, respectively. The SMFG Group’s management is confident that future net revenues and funding will be sufficient to cover these commitments.
Loan Commitments
Loan commitment contracts on overdrafts and loans are agreements to lend to customers, up to a prescribed amount, as long as there is no violation of any condition established in the contracts. Since many of these loan commitments are expected to expire without being drawn down, the total amount of unused commitments does not necessarily represent an actual future cash flow requirement. Many of these loan commitments include clauses under which the SMFG Group can reject an application from customers or reduce the contract amounts in the event that economic conditions change, the SMFG Group needs to secure claims, or other events occur.
Financial Guarantees and Other Credit-Related Contingent Liabilities
Financial guarantees are contracts that require the issuer to make specified payments to reimburse the holder for a loss it incurs because a specified debtor fails to make payments when due, in accordance with the terms of the debt instrument. Other credit-related contingent liabilities include performance bonds, which are contracts that provide compensation if another party fails to perform the contractual obligation.
The table below shows the nominal amounts of undrawn loan commitments, financial guarantees and other credit-related contingent liabilities at March 31, 2012 and 2011.
| | | | | | | | |
| | | At March 31, | |
| | | 2012 | | | 2011 | |
| | | (In millions) | |
Loan commitments | | ¥ | 44,064,283 | | | ¥ | 42,743,780 | |
Financial guarantees and other credit-related contingent liabilities | | | 5,320,993 | | | | 4,810,931 | |
| | | | | | | | |
Total | | ¥ | 49,385,276 | | | ¥ | 47,554,711 | |
| | | | | | | | |
F-83
| 43 | ANALYSIS OF FINANCIAL ASSETS AND LIABILITIES BY MEASUREMENT BASIS |
After initial recognition, financial assets and liabilities are measured either at fair value or amortized cost, within the measurement categories as defined in IAS 39. The summary of significant accounting policies in Note 2 describes how these categories of financial assets and liabilities are measured, and how income and expenses are recognized either in profit or loss, or in other comprehensive income. The following table presents the carrying amounts of the financial assets and liabilities, by category and by line item, of the consolidated statement of financial position.
| | | | | | | | | | | | | | | | | | | | | | | | |
| | | At March 31, 2012 | |
| | | Financial
assets and
liabilities at
fair value
through profit
or loss | | | Held-to-maturity
investments | | | Loans and
receivables | | | Available-for-sale
financial assets | | | Financial
liabilities
measured at
amortized cost | | | Total | |
| | | (In millions) | |
Financial assets: | | | | | | | | | | | | | | | | | | | | | | | | |
Cash and deposits with banks | | ¥ | — | | | ¥ | — | | | ¥ | 8,050,562 | | | ¥ | — | | | ¥ | — | | | ¥ | 8,050,562 | |
Call loans and bills bought | | | — | | | | — | | | | 1,297,082 | | | | — | | | | — | | | | 1,297,082 | |
Reverse repurchase agreements and cash collateral on securities borrowed | | | — | | | | — | | | | 4,937,025 | | | | — | | | | — | | | | 4,937,025 | |
Trading assets | | | 4,461,258 | | | | — | | | | — | | | | — | | | | — | | | | 4,461,258 | |
Derivative financial instruments | | | 5,901,526 | | | | — | | | | — | | | | — | | | | — | | | | 5,901,526 | |
Financial assets at fair value through profit or loss | | | 2,150,409 | | | | — | | | | — | | | | — | | | | — | | | | 2,150,409 | |
Investment securities | | | — | | | | 5,277,268 | | | | — | | | | 32,046,832 | | | | — | | | | 37,324,100 | |
Loans and advances(1) | | | 14,273 | | | | — | | | | 72,522,540 | | | | — | | | | — | | | | 72,536,813 | |
Other financial assets(2) | | | — | | | | — | | | | 1,899,432 | | | | — | | | | — | | | | 1,899,432 | |
| | | | | | | | | | | | | | | | | | | | | | | | |
Total | | ¥ | 12,527,466 | | | ¥ | 5,277,268 | | | ¥ | 88,706,641 | | | ¥ | 32,046,832 | | | ¥ | — | | | ¥ | 138,558,207 | |
| | | | | | | | | | | | | | | | | | | | | | | | |
Financial liabilities: | | | | | | | | | | | | | | | | | | | | | | | | |
Deposits(1) | | ¥ | (2,901 | ) | | ¥ | — | | | ¥ | — | | | ¥ | — | | | ¥ | 92,856,467 | | | ¥ | 92,853,566 | |
Call money and bills sold | | | — | | | | — | | | | — | | | | — | | | | 2,144,600 | | | | 2,144,600 | |
Repurchase agreements and cash collateral on securities lent | | | — | | | | — | | | | — | | | | — | | | | 7,487,633 | | | | 7,487,633 | |
Trading liabilities | | | 2,173,567 | | | | — | | | | — | | | | — | | | | — | | | | 2,173,567 | |
Derivative financial instruments | | | 5,850,813 | | | | — | | | | — | | | | — | | | | — | | | | 5,850,813 | |
Borrowings(1) | | | 1,204 | | | | — | | | | — | | | | — | | | | 10,411,654 | | | | 10,412,858 | |
Debt securities in issue(1) | | | 5,497 | | | | — | | | | — | | | | — | | | | 7,372,245 | | | | 7,377,742 | |
Other financial liabilities(2) | | | — | | | | — | | | | — | | | | — | | | | 4,953,425 | | | | 4,953,425 | |
| | | | | | | | | | | | | | | | | | | | | | | | |
Total | | ¥ | 8,028,180 | | | ¥ | — | | | ¥ | — | | | ¥ | — | | | ¥ | 125,226,024 | | | ¥ | 133,254,204 | |
| | | | | | | | | | | | | | | | | | | | | | | | |
F-84
| | | | | | | | | | | | | | | | | | | | | | | | |
| | | At March 31, 2011 | |
| | | Financial
assets and
liabilities at
fair value
through profit
or loss | | | Held-to-maturity
investments | | | Loans and
receivables | | | Available-for-sale
financial assets | | | Financial
liabilities
measured at
amortized cost | | | Total | |
| | | (In millions) | |
Financial assets: | | | | | | | | | | | | | | | | | | | | | | | | |
Cash and deposits with banks | | ¥ | — | | | ¥ | — | | | ¥ | 9,436,358 | | | ¥ | — | | | ¥ | — | | | ¥ | 9,436,358 | |
Call loans and bills bought | | | — | | | | — | | | | 862,667 | | | | — | | | | — | | | | 862,667 | |
Reverse repurchase agreements and cash collateral on securities borrowed | | | — | | | | — | | | | 5,051,053 | | | | — | | | | — | | | | 5,051,053 | |
Trading assets | | | 3,315,153 | | | | — | | | | — | | | | — | | | | — | | | | 3,315,153 | |
Derivative financial instruments | | | 4,975,973 | | | | — | | | | — | | | | — | | | | — | | | | 4,975,973 | |
Financial assets at fair value through profit or loss | | | 2,132,348 | | | | — | | | | — | | | | — | | | | — | | | | 2,132,348 | |
Investment securities | | | — | | | | 4,181,840 | | | | — | | | | 30,480,266 | | | | — | | | | 34,662,106 | |
Loans and advances(1) | | | 13,833 | | | | — | | | | 71,006,496 | | | | — | | | | — | | | | 71,020,329 | |
Other financial assets(2) | | | — | | | | — | | | | 1,496,409 | | | | — | | | | — | | | | 1,496,409 | |
| | | | | | | | | | | | | | | | | | | | | | | | |
Total | | ¥ | 10,437,307 | | | ¥ | 4,181,840 | | | ¥ | 87,852,983 | | | ¥ | 30,480,266 | | | ¥ | — | | | ¥ | 132,952,396 | |
| | | | | | | | | | | | | | | | | | | | | | | | |
Financial liabilities: | | | | | | | | | | | | | | | | | | | | | | | | |
Deposits(1) | | ¥ | (8,992 | ) | | ¥ | — | | | ¥ | — | | | ¥ | — | | | ¥ | 90,478,090 | | | ¥ | 90,469,098 | |
Call money and bills sold | | | — | | | | — | | | | — | | | | — | | | | 2,629,407 | | | | 2,629,407 | |
Repurchase agreements and cash collateral on securities lent | | | — | | | | — | | | | — | | | | — | | | | 6,439,598 | | | | 6,439,598 | |
Trading liabilities | | | 1,623,918 | | | | — | | | | — | | | | — | | | | — | | | | 1,623,918 | |
Derivative financial instruments | | | 4,725,261 | | | | — | | | | — | | | | — | | | | — | | | | 4,725,261 | |
Borrowings(1) | | | 907 | | | | — | | | | — | | | | — | | | | 12,547,451 | | | | 12,548,358 | |
Debt securities in issue(1) | | | 3,830 | | | | — | | | | — | | | | — | | | | 5,886,558 | | | | 5,890,388 | |
Other financial liabilities(2) | | | — | | | | — | | | | — | | | | — | | | | 4,063,020 | | | | 4,063,020 | |
| | | | | | | | | | | | | | | | | | | | | | | | |
Total | | ¥ | 6,344,924 | | | ¥ | — | | | ¥ | — | | | ¥ | — | | | ¥ | 122,044,124 | | | ¥ | 128,389,048 | |
| | | | | | | | | | | | | | | | | | | | | | | | |
| (1) | Embedded derivatives, which are separately accounted for, but presented together with the host contract in the consolidated statement of financial position, are disclosed in this table within the category of “Financial assets and liabilities at fair value through profit or loss.” Although the separated embedded derivatives may have a positive or a negative fair value, they have been presented in this table as assets or liabilities to be consistent with the line of the host contract. |
| (2) | Other financial assets and liabilities comprise of those included in other assets and liabilities, which meet the definition of a financial asset and liability. |
| 44 | FAIR VALUE OF FINANCIAL ASSETS AND LIABILITIES |
Fair value is the amount for which an asset could be exchanged, or a liability settled, between knowledgeable, willing parties in an arm’s-length transaction. The fair values stated below represent the best estimates based on a range of methods and assumptions. In determining the fair value of financial assets and liabilities, the SMFG Group gives the highest priority to a quoted market price in an active market. If such prices are not available, it establishes fair value using valuation techniques. The valuation techniques, if used, make maximum use of observable inputs, and rely as little as possible on unobservable inputs.
F-85
The table below presents the carrying amounts of financial assets and liabilities presented on the SMFG Group’s consolidated statements of financial position at March 31, 2012 and 2011, together with the associated fair value.
| | | | | | | | | | | | | | | | | | | | |
| | | | | | At March 31, | |
| | | | | | 2012 | | | 2011 | |
| | | Notes | | | Carrying
amount | | | Fair value | | | Carrying
amount | | | Fair value | |
| | | | | | (In millions) | |
Financial assets: | | | | | | | | | | | | | | | | | | | | |
Cash and deposits with banks: | | | | | | | | | | | | | | | | | | | | |
Cash and non-interest-earning deposits | | | a | | | ¥ | 4,597,372 | | | ¥ | 4,597,370 | | | ¥ | 5,658,273 | | | ¥ | 5,658,273 | |
Interest-earning deposits with banks | | | a | | | | 3,453,190 | | | | 3,452,202 | | | | 3,778,085 | | | | 3,777,707 | |
Call loans and bills bought: | | | | | | | | | | | | | | | | | | | | |
Call loans | | | a | | | | 1,254,014 | | | | 1,253,852 | | | | 825,923 | | | | 825,791 | |
Bills bought | | | a | | | | 43,068 | | | | 43,026 | | | | 36,744 | | | | 36,721 | |
Reverse repurchase agreements and cash collateral on securities borrowed | | | a | | | | 4,937,025 | | | | 4,937,747 | | | | 5,051,053 | | | | 5,051,093 | |
Trading assets | | | b | | | | 4,461,258 | | | | 4,461,258 | | | | 3,315,153 | | | | 3,315,153 | |
Derivative financial instruments | | | b | | | | 5,901,526 | | | | 5,901,526 | | | | 4,975,973 | | | | 4,975,973 | |
Financial assets at fair value through profit or loss | | | b | | | | 2,150,409 | | | | 2,150,409 | | | | 2,132,348 | | | | 2,132,348 | |
Investment securities: | | | | | | | | | | | | | | | | | | | | |
Held-to-maturity investments | | | c | | | | 5,277,268 | | | | 5,346,854 | | | | 4,181,840 | | | | 4,242,131 | |
Available-for-sale financial assets | | | b | | | | 32,046,832 | | | | 32,046,832 | | | | 30,480,266 | | | | 30,480,266 | |
Loans and advances | | | a | | | | 72,536,813 | | | | 74,048,420 | | | | 71,020,329 | | | | 72,480,758 | |
Other financial assets | | | a | | | | 1,899,432 | | | | 1,893,938 | | | | 1,496,409 | | | | 1,486,953 | |
Financial liabilities: | | | | | | | | | | | | | | | | | | | | |
Deposits: | | | | | | | | | | | | | | | | | | | | |
Non-interest-bearing deposits, demand deposits and deposits at notice | | | d | | | ¥ | 53,482,090 | | | ¥ | 53,482,035 | | | ¥ | 51,256,230 | | | ¥ | 51,256,191 | |
Other deposits | | | d | | | | 39,371,476 | | | | 39,378,994 | | | | 39,212,868 | | | | 39,228,549 | |
Call money and bills sold: | | | | | | | | | | | | | | | | | | | | |
Call money | | | d | | | | 2,144,600 | | | | 2,144,599 | | | | 2,629,407 | | | | 2,629,407 | |
Bills sold | | | | | | | — | | | | — | | | | — | | | | — | |
Repurchase agreements and cash collateral on securities lent | | | d | | | | 7,487,633 | | | | 7,487,633 | | | | 6,439,598 | | | | 6,439,598 | |
Trading liabilities | | | b | | | | 2,173,567 | | | | 2,173,567 | | | | 1,623,918 | | | | 1,623,918 | |
Derivative financial instruments | | | b | | | | 5,850,813 | | | | 5,850,813 | | | | 4,725,261 | | | | 4,725,261 | |
Borrowings | | | d | | | | 10,412,858 | | | | 10,524,586 | | | | 12,548,358 | | | | 12,652,650 | |
Debt securities in issue | | | d | | | | 7,377,742 | | | | 7,514,031 | | | | 5,890,388 | | | | 5,983,912 | |
Other financial liabilities | | | d | | | | 4,953,425 | | | | 4,951,566 | | | | 4,063,020 | | | | 4,060,891 | |
Notes:
| | | | | | |
| a. | | (i) | | The carrying amounts of deposits with banks without maturity and loans with no specified repayment dates represent a reasonable estimate of fair value as these financial instruments are short-term in nature. |
| | |
| | (ii) | | Financial assets with a remaining maturity of six months or less: The carrying amounts represent a reasonable estimate of fair value. |
| | |
| | (iii) | | Financial assets with a remaining maturity of more than six months: Except for impaired loans and advances, the fair values are mostly determined using discounted cash flow models taking into account factors such as counterparties’ credit ratings, pledged collateral, market interest rates, and an overhead ratio. The fair values of impaired loans and advances are generally determined by discounting the estimated future cash flows over the time period they are expected to be recovered, and may be based on the appraisal value of underlying collateral as appropriate. |
| |
| | Note that some of the financial assets in this category include embedded derivatives, which are separately accounted for, but presented together with the host contract. |
F-86
| | | | | | | | |
| | |
| b. | | | | The carrying amounts of financial instruments which are classified as trading assets and trading liabilities, derivative financial instruments, financial assets at fair value through profit or loss, and available-for-sale financial assets are measured at fair value. Further description and analysis of these fair values, including the detailed valuation techniques, are set out below. |
| | |
| c. | | | | The fair values for held-to-maturity investments are determined using quoted prices in active markets. |
| | |
| d. | | (i) | | The carrying amounts of demand deposits and deposits without maturity represent reasonable estimates of fair value as these financial instruments are short-term in nature. |
| | |
| | (ii) | | Financial liabilities with a remaining maturity of six months or less: The carrying amounts represent a reasonable estimate of fair value. |
| | |
| | (iii) | | Financial liabilities with a remaining maturity of more than six months: The fair values are, in principle, based on the present values of future cash flows calculated using the refinancing rate applied to the same type of instruments for similar remaining maturities. The fair values of debt securities in issue are based on the present values of future cash flows calculated using the rate derived from yields of bonds issued by SMBC and publicly offered subordinated bonds published by securities firms. |
| |
| | Note that some of the financial liabilities in this category include embedded derivatives, which are separately accounted for, but presented together with the host contract. |
Valuation Control
The SMFG Group undertakes a valuation process based on its valuation control framework, which governs internal control standards, methodologies, and procedures to ensure that the fair values are determined or validated independently of the front office.
The SMFG Group uses valuation techniques commonly used by market participants to price the financial instruments and that have been demonstrated to provide reliable estimates of prices obtained in actual market transactions. The valuation techniques include the discounted cash flow method, option pricing models and reference to the current fair value of another instrument that is substantially the same. Key adjustments, such as bid-ask spread, liquidity risk and credit risk adjustments are also taken into account to derive fair values.
Where valuation techniques are used to determine fair values, they are validated and reviewed. In principal banking subsidiaries, their risk management departments review significant valuation methodologies at least once a year, and recalibrate model parameters and inputs to ensure the appropriate estimation of fair value. These departments are independent from the business units and have a specific group who reviews these techniques. In addition, their accounting departments are responsible for ensuring that the accounting policies and procedures to determine the fair values are in compliance with relevant accounting standards.
Fair Value Hierarchy
The financial assets and liabilities carried at fair value were categorized under the three levels of the fair value hierarchy as follows:
| | • | | quoted prices (unadjusted) in active markets for identical assets or liabilities (Level 1); |
| | • | | inputs other than quoted prices included within Level 1 that are observable for the asset or liability, either directly (i.e., as prices) or indirectly (i.e., derived from prices) (Level 2); and |
| | • | | inputs for the asset or liability that are not based on observable market data (unobservable inputs) (Level 3). |
F-87
The following table presents the carrying amounts of the financial instruments held at fair value across the three levels of the fair value hierarchy at March 31, 2012 and 2011.
| | | | | | | | | | | | | | | | |
| | | At March 31, 2012 | |
| | | Quoted market
price in an active
market (Level 1) | | | Valuation
techniques—
observable inputs
(Level 2) | | | Valuation
techniques—significant
unobservable
inputs (Level 3) | | | Total | |
| | | (In millions) | |
Assets: | | | | |
Trading assets | | ¥ | 3,667,000 | | | ¥ | 740,748 | | | ¥ | 53,510 | | | ¥ | 4,461,258 | |
Derivative financial instruments | | | 32,297 | | | | 5,869,008 | | | | 221 | | | | 5,901,526 | |
Financial assets at fair value through profit or loss | | | 1,556 | | | | 1,887,882 | | | | 260,971 | | | | 2,150,409 | |
Available-for-sale financial assets | | | 29,725,227 | | | | 1,635,881 | | | | 685,724 | | | | 32,046,832 | |
Others(1) | | | — | | | | 14,273 | | | | — | | | | 14,273 | |
| | | | |
Liabilities: | | | | | | | | | | | | | | | | |
Trading liabilities | | ¥ | 2,156,266 | | | ¥ | 17,301 | | | ¥ | — | | | ¥ | 2,173,567 | |
Derivative financial instruments | | | 37,233 | | | | 5,796,110 | | | | 17,470 | | | | 5,850,813 | |
Others(1) | | | — | | | | 3,800 | | | | — | | | | 3,800 | |
| |
| | | At March 31, 2011 | |
| | | Quoted market
price in an active
market (Level 1) | | | Valuation
techniques—
observable inputs
(Level 2) | | | Valuation
techniques—significant
unobservable inputs
(Level 3) | | | Total | |
| | | (In millions) | |
Assets: | | | | |
Trading assets | | ¥ | 2,372,361 | | | ¥ | 854,576 | | | ¥ | 88,216 | | | ¥ | 3,315,153 | |
Derivative financial instruments | | | 29,296 | | | | 4,946,607 | | | | 70 | | | | 4,975,973 | |
Financial assets at fair value through profit or loss | | | 849 | | | | 1,858,710 | | | | 272,789 | | | | 2,132,348 | |
Available-for-sale financial assets | | | 28,158,217 | | | | 1,642,839 | | | | 679,210 | | | | 30,480,266 | |
Others(1) | | | — | | | | 13,833 | | | | — | | | | 13,833 | |
| | | | |
Liabilities: | | | | | | | | | | | | | | | | |
Trading liabilities | | ¥ | 1,611,475 | | | ¥ | 12,443 | | | ¥ | — | | | ¥ | 1,623,918 | |
Derivative financial instruments | | | 29,542 | | | | 4,688,368 | | | | 7,351 | | | | 4,725,261 | |
Others(1) | | | — | | | | (4,255 | ) | | | — | | | | (4,255 | ) |
| (1) | Embedded derivatives, which are separately accounted for, but presented together with the host contract in the consolidated statement of financial position, are disclosed in this table within Others. Although the separated embedded derivatives may have a positive or a negative fair value, they have been presented in this table as assets or liabilities to be consistent with the host contract. |
F-88
There were no significant transfers between Level 1 and Level 2 for the fiscal years ended March 31, 2012 and 2011.
The following table presents a reconciliation from the beginning to the ending balances for those assets and liabilities that are measured in the consolidated statement of financial position at fair value based on a valuation technique for which one or more significant inputs are not based on observable market data (Level 3) for the fiscal years ended March 31, 2012 and 2011.
| | | | | | | | | | | | | | | | | | | | |
| | | Trading assets | | | Derivative
financial
instruments | | | Financial
assets at fair
value through
profit or loss | | | Available-for-
sale financial
assets | | | Total | |
| | | (In millions) | |
At April 1, 2010 | | ¥ | 77,553 | | | ¥ | (7,387 | ) | | ¥ | 260,339 | | | ¥ | 699,933 | | | ¥ | 1,030,438 | |
| | | | | | | | | | | | | | | | | | | | |
Total gains (losses) | | | (4,031 | ) | | | 7,966 | | | | (5,630 | ) | | | (14,940 | ) | | | (16,635 | ) |
In profit or loss | | | 955 | | | | 7,130 | | | | (5,630 | ) | | | (13,121 | ) | | | (10,666 | ) |
In other comprehensive income | | | (4,986 | ) | | | 836 | | | | — | | | | (1,819 | ) | | | (5,969 | ) |
| | | | | |
Purchases | | | 17,997 | | | | 25 | | | | 24,973 | | | | 74,163 | | | | 117,158 | |
Sales | | | (894 | ) | | | — | | | | (5,939 | ) | | | (32,435 | ) | | | (39,268 | ) |
Settlements | | | (857 | ) | | | (7,885 | ) | | | (324 | ) | | | (47,082 | ) | | | (56,148 | ) |
| | | | | |
Transfers out of Level 3 | | | (1,552 | ) | | | — | | | | (630 | ) | | | (429 | ) | | | (2,611 | ) |
| | | | | | | | | | | | | | | | | | | | |
At March 31, 2011 | | | 88,216 | | | | (7,281 | ) | | | 272,789 | | | | 679,210 | | | | 1,032,934 | |
| | | | | | | | | | | | | | | | | | | | |
Total gains (losses) | | | (2,025 | ) | | | (1,988 | ) | | | (3,034 | ) | | | 10,860 | | | | 3,813 | |
In profit or loss | | | 9,411 | | | | (1,731 | ) | | | (3,034 | ) | | | (10,661 | ) | | | (6,015 | ) |
In other comprehensive income | | | (11,436 | ) | | | (257 | ) | | | — | | | | 21,521 | | | | 9,828 | |
| | | | | |
Purchases | | | 3,677 | | | | 37 | | | | 2,375 | | | | 71,730 | | | | 77,819 | |
Sales | | | (36,358 | ) | | | — | | | | (6,363 | ) | | | (46,891 | ) | | | (89,612 | ) |
Settlements | | | — | | | | (8,074 | ) | | | (1,789 | ) | | | (29,227 | ) | | | (39,090 | ) |
| | | | | |
Transfers into Level 3 | | | — | | | | — | | | | 55 | | | | 536 | | | | 591 | |
Transfers out of Level 3 | | | — | | | | 57 | | | | (3,062 | ) | | | (494 | ) | | | (3,499 | ) |
| | | | | | | | | | | | | | | | | | | | |
At March 31, 2012 | | ¥ | 53,510 | | | ¥ | (17,249 | ) | | ¥ | 260,971 | | | ¥ | 685,724 | | | ¥ | 982,956 | |
| | | | | | | | | | | | | | | | | | | | |
The following table shows total gains or losses included in profit or loss for the Level 3 assets and liabilities held at March 31, 2012 and 2011.
| | | | | | | | | | | | | | | | | | | | |
| | | Trading assets | | | Derivative
financial
instruments | | | Financial
assets at fair
value through
profit or loss | | | Available-for-
sale financial
assets | | | Total | |
| | | (In millions) | |
Total gains (losses) included in profit or loss for assets and liabilities held at March 31, 2012 | | ¥ | (3,679 | ) | | ¥ | (1,660 | ) | | ¥ | (2,871 | ) | | ¥ | (3,144 | ) | | ¥ | (11,354 | ) |
Total gains (losses) included in profit or loss for assets and liabilities held at March 31, 2011 | | ¥ | 2,127 | | | ¥ | 7,130 | | | ¥ | (6,119 | ) | | ¥ | (14,478 | ) | | ¥ | (11,340 | ) |
F-89
Gains or losses included in profit or loss are presented in net trading income, net income from financial assets at fair value through profit or loss, net investment income, and impairment charges on financial assets.
| | | | | | | | | | | | | | | | | | | | |
| | | Net trading
income | | | Net income
from financial
assets at fair
value through
profit
or loss | | | Net investment
income | | | Impairment
charges on
financial assets | | | Total | |
| | | (In millions) | |
For the fiscal year ended March 31, 2012: | | | | |
Total gains (losses) included in profit or loss | | ¥ | 7,680 | | | ¥ | (3,034 | ) | | ¥ | 8,381 | | | ¥ | (19,042 | ) | | ¥ | (6,015 | ) |
| | | | | |
Total gains (losses) included in profit or loss for assets and liabilities held at March 31, 2012 | | | (5,339 | ) | | | (2,871 | ) | | | 15,825 | | | | (18,969 | ) | | | (11,354 | ) |
| | | | | |
For the fiscal year ended March 31, 2011: | | | | | | | | | | | | | | | | | | | | |
Total gains (losses) included in profit or loss | | ¥ | 8,085 | | | ¥ | (5,630 | ) | | ¥ | 6,033 | | | ¥ | (19,154 | ) | | ¥ | (10,666 | ) |
| | | | | |
Total gains (losses) included in profit or loss for assets and liabilities held at March 31, 2011 | | | 9,257 | | | | (6,119 | ) | | | 3,913 | | | | (18,391 | ) | | | (11,340 | ) |
Valuation Techniques
Financial instruments which are classified as trading assets and liabilities, derivative financial instruments, financial assets at fair value through profit or loss, and available-for-sale financial assets are measured at fair value in the consolidated statement of financial position. These instruments are measured at fair value using a quoted market price, if they are traded in an active market, or, for others, using the fair value measurement techniques as discussed below.
Trading assets and trading liabilities
Debt and equity instruments traded in an active market are measured at fair value using a quoted market price in such a market and they are classified as Level 1. If a quoted market price is not available, they are measured by using a price quoted by a third party, such as a pricing service or broker, or by reference to the current fair value of another instrument that is substantially the same, based on inputs such as prices obtained from brokers, observable interest rates and spreads. These financial instruments are classified as Level 2.
Certain investment funds classified as held for trading are measured at fair value determined based on the unit price, calculated by fund administrators. The unit price is determined based on net asset value, market approach or income approach, which may use significant unobservable inputs. In such a case, the funds are classified as Level 3.
Commercial paper is measured at fair value using the DCF method, where primary inputs are observable interest rates and credit spreads, inferred from the prevailing market rates. Therefore, commercial paper is classified as Level 2.
Derivative financial instruments
Listed derivatives (including interest rate, bonds, stocks and commodities) are measured at fair value using the settlement price announced by the major exchange on which transactions are traded because the settlement price in the exchange reflects the most current transaction price, and is readily and regularly available from the exchange. Listed derivatives are classified as Level 1.
F-90
OTC derivatives (non-exchange-traded derivatives) are measured at fair value using valuation techniques such as the present value of estimated future cash flows and option pricing models, generally based on observable interest rates, foreign exchange, commodities, stock prices and other factors as inputs. The valuation models for some complex transactions, such as the yield curve spread options, use inputs which are not directly observable in the market, such as historical correlation coefficients. However, as the impact of these unobservable inputs is insignificant to the fair value, the SMFG Group classifies most of those transactions as Level 2.
The credit loss protection scheme which the SMFG Group offers to Goldman Sachs (“GS”) is considered to be a credit derivative, where the underlying reference entities are the American and European corporate entities covered in the commitment line portfolio of the GS group. The fair value for this derivative is determined using an ordinary collateralized debt obligation (“CDO”) pricing model, commonly used in the financial markets. The SMFG Group takes some portions of the positions in subordinated and mezzanine tranches, which covers the first and second credit losses from the portfolio. The major inputs for this derivative are credit default swap (“CDS”) spread rates, correlation ratios of CDS indices for similar portfolios, and the expected additional commitment withdrawal ratio. Although CDS spread rates and correlation ratios are observable in an active market or available from brokers, this whole scheme is classified as Level 3 as the expected additional withdrawal ratio, which is considered to be a significant input, is not usually observable in the market and is estimated based on historical data.
In addition, the fair value of OTC derivatives incorporates both counterparty credit risk in relation to OTC derivative assets and own credit risk in relation to OTC derivative liabilities. The SMFG Group calculates the credit risk adjustment by applying the probability of default that reflects the counterparty’s or its own credit risk to the OTC derivative exposure and multiplying the result by the loss expected in the event of default. For the probability of default, the SMFG Group uses observable market data, where possible. The OTC derivative exposure used is determined taking into consideration the effect of master netting agreements and collateral.
Financial assets at fair value through profit or loss
The majority of debt instruments classified in this category are measured at fair value, using a valuation technique based on the observable prices in the market and they are classified as Level 2.
Some equity and debt instruments in this category are hybrid instruments which have both equity and debt features. These include preferred stocks and bonds with equity risk, such as convertible bonds, which are measured at fair value using various valuation models, such as the Monte Carlo Simulation and the binomial lattice model, if they are indexed to the market prices in a stock exchange. Those valuation models use the historical volatility of the listed stocks as an input, which are not observable in the market, resulting in these instruments being classified as Level 3. Other types of preferred stocks and other non-hybrid equity instruments are evaluated using fair value techniques for unlisted stocks, which are normally used for private equity investments. The SMFG Group calculates the fair values of these financial instruments based on the income approach or market approach using market multiples that are not usually observable in the market, and they are classified as Level 3.
Available-for-sale financial assets
Debt instruments are measured at fair value using a quoted market price and classified as Level 1 if they are traded in an active market. Debt instruments are classified as Level 2 if they are measured at fair value using a price quoted by a third party, such as a pricing service or broker, or by reference to the current fair value of another bond that is substantially the same based on inputs such as prices obtained from brokers, observable interest rates and spreads.
F-91
The Financial Stabilization Funds are measured at fair value using the DCF method based on actual prices for government bonds of similar maturities, which are observable in an active market. These funds are classified as Level 2. See Note 9 “Investment Securities” for further information on the Financial Stabilization Funds.
The fair value of some securitized products is calculated based on broker quotes. Since they are calculated using valuation techniques with inputs such as unobservable interest rates, foreign exchange and prices of credit products, these securitized products are classified as Level 3.
Listed stocks are measured at fair value based on the market price at a stock exchange and classified as Level 1.
Unlisted common and preferred stocks in this category are measured at fair value using valuation techniques, similar to those described in “Financial assets at fair value through profit or loss” above.
Publicly offered investment trusts and funds are measured at fair value using a unit price or the market price on which such instruments are listed, and they are classified as Level 1. Instruments whose prices are not available in the market, such as privately offered investment trusts, are measured at fair value based on the unit price, which is usually regarded as an exit price, obtained from the fund administrator or investment management firm. In such a case, these investment trusts and funds are classified as Level 2. Other investment funds, such as private equity and real estate investment funds, are generally measured at fair value based on net asset value, which may include significant unobservable input. In such a case, the funds are classified as Level 3.
Sensitivity Analysis
The fair value of certain financial instruments are measured using valuation techniques based on inputs such as prices and rates that are not observable in the market. The following table presents the impact of the valuation sensitivity, if these inputs fluctuate to the extent deemed reasonable and the volatility of such inputs has a significant impact on the fair value.
| | | | | | | | | | | | | | | | | | | | |
| | | At March 31, 2012 | |
| | | Total fair value
measured using
valuation
techniques | | | Effect recorded
in profit or loss | | | Effect recorded
directly in equity | |
| | | | Favorable
changes | | | Unfavorable
changes | | | Favorable
changes | | | Unfavorable
changes | |
| | | (In millions) | |
Trading assets | | ¥ | 53,510 | | | ¥ | 1,119 | | | ¥ | (1,119 | ) | | ¥ | — | | | ¥ | — | |
Derivative financial instruments—assets | | | 221 | | | | 453 | | | | (146 | ) | | | — | | | | — | |
Derivative financial instruments—liabilities | | | (17,470 | ) | | | 8,149 | | | | (6,436 | ) | | | — | | | | — | |
Financial assets at fair value through profit or loss | | | 260,971 | | | | 4,065 | | | | (2,639 | ) | | | — | | | | — | |
Available-for-sale financial assets | | | 685,724 | | | | — | | | | — | | | | 16,749 | | | | (16,043 | ) |
| |
| | | At March 31, 2011 | |
| | | Total fair value
measured using
valuation
techniques | | | Effect recorded
in profit or loss | | | Effect recorded
directly in equity | |
| | | | Favorable
changes | | | Unfavorable
changes | | | Favorable
changes | | | Unfavorable
changes | |
| | | (In millions) | |
Trading assets | | ¥ | 88,216 | | | ¥ | 1,354 | | | ¥ | (1,354 | ) | | ¥ | — | | | ¥ | — | |
Derivative financial instruments—assets | | | 70 | | | | 183 | | | | (52 | ) | | | — | | | | — | |
Derivative financial instruments—liabilities | | | (7,351 | ) | | | 5,611 | | | | (5,635 | ) | | | — | | | | — | |
Financial assets at fair value through profit or loss | | | 272,789 | | | | 6,394 | | | | (5,688 | ) | | | — | | | | — | |
Available-for-sale financial assets | | | 679,210 | | | | — | | | | — | | | | 14,872 | | | | (14,531 | ) |
F-92
Trading assets
The investment funds based on net asset value, market approach or income approach are managed by value at risk (“VaR”) based on historical gain or loss data. Hence, the impact of the valuation sensitivity is estimated using a one-day VaR of the portfolio.
Derivative financial instruments
With respect to the credit loss protection scheme offered to GS, the expected additional withdrawal ratio is considered to be a significant unobservable input for its fair value measurement because the anticipated losses will vary significantly depending on the expected additional withdrawal ratio of unfunded commitment lines in the reference portfolio (mainly revolving credit facilities for CP backup). The expected additional withdrawal ratio is estimated based on historical data of actual funded amounts at default for similar portfolios. The table above presents the estimates of the impact of changing the expected additional withdrawal ratio from an optimistic (favorable) scenario to a pessimistic (unfavorable) scenario.
Financial assets at fair value through profit or loss / Available-for-sale financial assets
With respect to preferred stocks convertible into listed stocks and bonds with equity risk, valuation techniques such as Monte Carlo Simulation or the binomial lattice model are used to measure the fair value of the conversion options. Historical volatilities of the related listed stocks are used as input for the valuation because current implied volatility is generally not observable in the market. The impact resulting from using a reasonable range for the volatility is statistically estimated where it would be significant. With respect to unlisted stocks which are measured at fair value based on a market approach, the impact of changing the market multiples within a reasonable range (±10%) is estimated in the table above.
| 45 | FINANCIAL RISK MANAGEMENT |
The SMFG Group classifies risks into the following categories: credit risk, market risk, liquidity risk and operational risk (including processing risk and system risk). This note presents information about the SMFG Group’s exposure to credit risk, market risk, and liquidity risk, and its policies and processes for measuring and managing these risks.
Risk Management System
The SMFG Group has established a basic approach for risk management. This basic approach includes establishing Group-wide basic policies for risk management, providing all necessary implementation guidance to the SMFG Group companies and monitoring the risk management procedures implemented by all Group companies to ensure their practices meet the relevant standards.
The Group-wide basic policies for risk management are determined by the Management Committee, which consists of designated Board Members, and such policies are authorized by the Board of Directors. The policies include:
| | • | | managing risk on a Group-wide basis; |
| | • | | managing risk using quantification methods; |
| | • | | ensuring consistency with business strategies; |
| | • | | setting up a system of checks and balances; |
| | • | | establishing contingency plans for emergencies and serious situations; and |
| | • | | verifying preparedness to handle reasonably conceivable risk situations. |
F-93
The policies also include fundamental principles for each risk category, which each SMFG Group company has to follow when establishing its own risk management system. The Corporate Risk Management Department, in cooperation with the Corporate Planning Department, performs risk management according to the above policies. In addition, the Internal Audit Department is responsible for the independent review of risk management within the SMFG Group.
Risk management systems are in place at the individual SMFG Group companies, and have been established in accordance with the Group-wide basic policies for risk management and implementation guidance provided by SMFG. Based on these policies and guidance, each SMFG Group company implements guidelines and establishes processes for risk management. On an ongoing basis, these processes and risks are monitored by SMFG.
For example, at SMBC, specific departments have been appointed to oversee the handling of the four risk categories listed above, in addition to the risks associated with settlement. Each risk category is managed taking into account, the particular characteristics of that category. In addition, the Risk Management Unit has been established—independent of the business units—and the risk management system has been strengthened by consolidating the functions for managing risks—credit, market, liquidity and operational—into the Risk Management Unit and enhancing SMBC’s across-the-board risk monitoring ability. One board member is assigned to oversee the Risk Management Unit comprising the Corporate Risk Management Department and Credit & Investment Planning Department. The Corporate Risk Management Department—the unit’s planning department—seeks to manage all categories of risk in cooperation with the Corporate Planning Department. Moreover, the Internal Audit Unit—independent of all business units—conducts periodic audits to ensure that the management system is functioning properly.
The decision-making process for addressing the risks at the operating level is also strengthened by the Credit Risk Management Committee and the Market Risk Management Committee, which are subcommittees of the Management Committee of SMBC.
The diagram below represents the risk management system of the SMFG Group and SMBC.
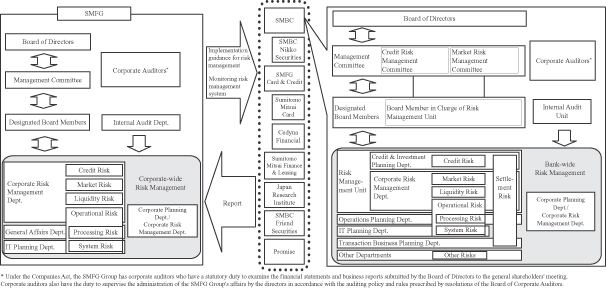
F-94
Risk Capital-Based Management
In order to maintain a balance between risk and return, the SMFG Group employs a risk capital-based management method. The SMFG Group measures “risk capital” based on VaR and other specific measures such as uniform basic measures of credit, market and operational risks, taking into account the special characteristics of each type of risk, and the business activities of each SMFG Group company.
The SMFG Group then allocates risk capital to each unit to keep the total exposure to various risks within the scope of the SMFG Group’s resources, i.e., capital. The allocation to each unit is determined by the Management Committee and authorized by the Board of Directors. In this framework, risk capital includes credit concentration risk and interest rate risk in the banking book, which are taken into account under the second pillar of Basel II. In addition, the SMFG Group conducts risk capital management activities on a consolidated basis, including each SMFG Group company.
Credit Risk
Credit risk is the possibility of a loss arising from a credit event, such as the deterioration in the financial condition of a borrower that causes an asset (including off-balance sheet transactions) to decline in value or become worthless. Overseas credits also include an element of country risk, which is closely related to credit risk. This is the risk of loss caused by changes in political or economic conditions. Credit exposures arise principally in lending activities such as loans and advances, acquiring investment securities, derivative transactions, and off-balance sheet transactions such as loan commitments.
Credit risk management system
Credit risk is the most significant risk to which the SMFG Group is exposed. The purpose of credit risk management is to keep the credit risk exposure to a permissible level relative to capital, to maintain the quality of assets and to ensure returns commensurate with risk.
On the basis of Group-wide basic policies for risk management, the SMFG Group companies follow the fundamental principles established by the SMFG Group to assess and manage credit risk. Each SMFG Group company manages credit risk according to the nature of its business, and assesses and manages the credit risks of individual loans and credit portfolios quantitatively, using consistent standards.
F-95
The following chart shows the credit risk management system of SMBC, the SMFG Group’s significant banking subsidiary.
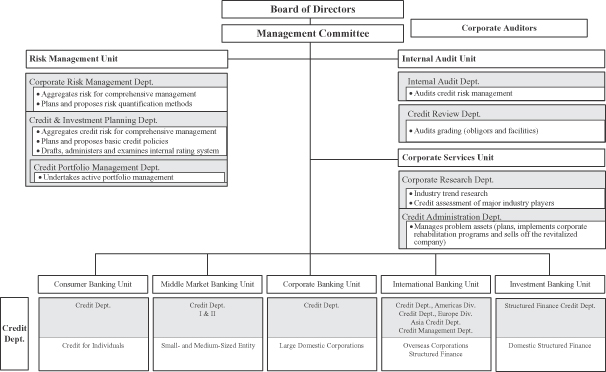
At SMBC, the Credit & Investment Planning Department within the Risk Management Unit is responsible for the comprehensive management of credit risk. This department drafts and administers credit policies, the internal rating system, credit authority guidelines and credit application guidelines, and manages non-performing loans (“NPLs”), including impaired loans, and other aspects of credit portfolio management. The department also cooperates with the Corporate Risk Management Department in quantifying credit risk (risk capital and risk-weighted assets) and controls SMBC’s entire credit risk. Further, the Credit Portfolio Management Department within the Credit & Investment Planning Department strives to stabilize the credit portfolio and manage the risk through credit derivatives, loan asset sales and other instruments.
The Corporate Research Department within the Corporate Services Unit performs research on industries and investigates the business situations of borrower enterprises to detect early signs of problems or growth potential. The Credit Administration Department is responsible for handling NPLs of borrowers classified as potentially bankrupt or lower, and draws up plans for their workouts, including write-offs, and corporate rehabilitation. The department closely liaises with SMBC Servicer Co., Ltd., a SMFG Group company, which engages in related services to efficiently reduce the amount of NPLs by such means as the sale of loans.
The credit departments within each business unit conduct credit risk management for loans handled by their units and manage their units’ portfolios. The credit limits they use are based on the baseline amounts that the Credit & Investment Planning Department establishes for each grading category, with particular attention paid to evaluating and managing customers or loans perceived to have particularly high credit risk.
The Internal Audit Unit, operating independently of the business units, audits asset quality, accuracy of grading and state of credit risk management, and reports the results directly to the board of directors and the Management Committee.
F-96
SMBC has established the Credit Risk Committee to undertake control of credit risk and to ensure loan operations.
Credit risk management methods
To effectively manage the risk involved in individual loans as well as the credit portfolio as a whole, SMBC first acknowledges that every loan entails credit risk, assesses the credit risk posed by each borrower and loan using an internal rating system, and quantifies that risk for control purposes.
| | (a) | Credit risk evaluation |
The Credit & Investment Planning Department manages an internal rating system for each asset control category set according to portfolio characteristics. For example, credits to commercial and industrial (“C&I”) companies, individuals for business purposes (domestic only), sovereigns, public sector entities, and financial institutions are assigned an “obligor grade,” which indicates the borrower’s creditworthiness, and/or “facility grade,” which indicates the collectibility of assets taking into account the transaction conditions such as guarantee/collateral, and tenor. The business units determine an obligor grade by first assigning a financial grade using a financial strength grading model and data obtained from the obligor’s financial statements, including net worth and cash flows. The financial grade is then adjusted taking into account the actual state of the obligor’s financial position and qualitative factors to derive the obligor grade. The qualitative factors mainly include the expected future cash flows taking into account factors such as historical loss information, the appropriateness of the borrower’s business plan or operational improvement plan, the status of progress of its plan, and the overall support from financial institutions. In the event that the borrower is domiciled overseas, internal ratings for credit are made after taking into consideration the country rank, which represents an assessment of the credit quality of each country based on its political and economic situation, as well as its current account balance and external debt. Obligor grades and facility grades are reviewed once a year and as otherwise necessary, such as when there are changes in the credit situation. The SMFG Group’s subsidiaries carry out credit risk evaluations in line with SMBC.
F-97
The table below shows the corporate obligor grading system of SMBC.
| | | | | | |
Obligor Grade | | Definition | | Borrower Category |
| Domestic (C&I), etc. | | Overseas (C&I), etc. | | |
J1 | | G1 | | Very high certainty of debt repayment | | Normal
Borrowers |
J2 | | G2 | | High certainty of debt repayment | |
J3 | | G3 | | Satisfactory certainty of debt repayment | |
J4 | | G4 | | Debt repayment is likely, but this could change in cases of significant changes in economic trends or business environment | |
J5 | | G5 | | No problem with debt repayment over the short term, but not satisfactory over the mid to long term, and the situation could change in cases of significant changes in economic trends or business environment | |
J6 | | G6 | | Currently no problem with debt repayment, but there are unstable business and financial factors that could lead to debt repayment problems | |
J7 | | G7 | | Close monitoring is required due to problems in meeting loan terms and conditions, sluggish/unstable business, or financial problems | | Borrowers
Requiring Caution |
J7R | | G7R | | Obligors with loans that are more than three months past due or with restructured loans within the “Borrowers Requiring Caution” category | | Substandard
Borrowers |
J8 | | G8 | | Currently not bankrupt, but experiencing business difficulties, making insufficient progress in restructuring and highly likely to go bankrupt | | Potentially
Bankrupt
Borrowers |
J9 | | G9 | | Though not yet legally or formally bankrupt, has serious business difficulties and rehabilitation is unlikely; thus, effectively bankrupt | | Effectively
Bankrupt
Borrowers |
J10 | | G10 | | Legally or formally bankrupt | | Bankrupt
Borrowers |
There are also grading systems for loans to individuals such as housing loans, loans to small businesses, and structured finance including project finance, where the repayment source is limited to the cash flows generated by a particular business or asset. For example, the obligor grade of housing loans is determined taking into account various relevant factors such as proportion of the repayment to revenue, proportion of down payment to the value and past due information.
The Credit & Investment Planning Department centrally manages the internal rating systems, and designs, operates, supervises and validates the grading models. It validates the grading models (including statistical validation) of main assets following the procedure manual once a year to ensure their effectiveness and suitability.
| | (b) | Quantification of credit risk |
Credit risk quantification refers to the process of estimating the degree of credit risk of a portfolio or individual loan taking into account not just the obligor’s probability of default (“PD”), but also the concentration of risk in a specific customer or industry, and the loss impact of fluctuations in the value of collateral, such as real estate and securities.
F-98
Specifically, the PD by grade, loss given default (“LGD”), credit quality correlation among obligors, and other parameter values are estimated using the historical data of obligors and facilities stored in a database to calculate the credit risk. Then, based on these parameters, SMBC runs a simulation of simultaneous default using the Monte Carlo Simulation to calculate SMBC’s maximum loss exposure to the estimated amount of the maximum losses that may be incurred. Based on these quantitative results, SMBC allocates risk capital.
Risk quantification is also executed for purposes such as to determine the portfolio’s risk concentration or to simulate economic movements (stress tests), and the results are used for making optimal decisions across the whole range of business operations, including formulating business plans and providing a standard against which individual credit applications are assessed.
Credit assessment
At SMBC, the credit assessment of corporate loans involves a variety of financial analyses, including cash flows, to predict an enterprise’s capability of loan repayment and its growth prospects. These quantitative measures, when combined with qualitative analyses of industrial trends, the enterprise’s research and development capabilities, the competitiveness of its products or services, and its management caliber, result in a comprehensive credit assessment. The loan application is analyzed in terms of the intended utilization of the funds and the repayment schedule. In the assessment of housing loans for individuals, SMBC employs a credit assessment model based on credit data amassed and analyzed by SMBC over many years, taking into account various relevant factors including proportion of the repayment to revenue, proportion of down payment to the value and past-due information.
Credit monitoring
At SMBC, in addition to analyzing loans at the application stage, the Credit Monitoring System is utilized to reassess obligor grades, and review credit policies for each obligor so that problems can be detected at an early stage, and quick and effective action can be taken. The system includes periodic monitoring carried out each time the financial results of the obligor enterprise are obtained, as well as continuous monitoring performed each time credit conditions change.
Credit portfolio management
| | (a) | Risk-taking within the scope of capital |
To keep the credit risk exposure to a permissible level relative to capital, SMBC’s Corporate Risk Management Department sets credit risk limits for internal control purposes. Under these limits, separate guidelines are issued for each business unit, such as for real estate finance, fund investment, and investment in securitization products. The Corporate Risk Management Department conducts monthly monitoring to make sure that these guidelines are being followed.
| | (b) | Controlling concentration risk |
As the concentration of credit risk in an industry or a corporate group has the potential to substantially impair capital, SMBC’s Credit & Investment Planning Department sets guidelines for maximum loan amounts to prevent the excessive concentration of loans in an industry and to control large exposures to an individual company or a corporate group. Further, to manage country risk, the Credit Management Department of the International Banking Unit has credit limit guidelines based on each country’s creditworthiness.
| | (c) | Toward active portfolio management |
SMBC’s Credit Portfolio Management Department makes use of credit derivatives, loan asset sales, and other instruments to proactively and flexibly manage its portfolio to stabilize credit risk.
F-99
Maximum exposure to credit risk before collateral held or other credit enhancements
The following table shows the maximum exposure to credit risk before taking into account any collateral held or other credit enhancements at March 31, 2012 and 2011.
| | | | | | | | |
| | | At March 31, | |
| | | 2012 | | | 2011 | |
| | | (In millions) | |
Credit risk exposures relating to assets on the consolidated statement of financial position: | | | | | | | | |
Deposits with banks | | ¥ | 7,061,283 | | | ¥ | 8,150,511 | |
Call loans and bills bought | | | 1,297,082 | | | | 862,667 | |
Reverse repurchase agreements and cash collateral on securities borrowed | | | 4,937,025 | | | | 5,051,053 | |
Trading assets | | | 4,132,979 | | | | 3,105,897 | |
Derivative financial instruments | | | 5,901,526 | | | | 4,975,973 | |
Financial assets at fair value through profit or loss | | | 2,019,559 | | | | 1,995,810 | |
Investment securities: | | | | | | | | |
Held-to-maturity investments | | | 5,277,268 | | | | 4,181,840 | |
Available-for-sale financial assets | | | 28,857,930 | | | | 27,263,517 | |
Loans and advances | | | 72,536,813 | | | | 71,020,329 | |
Other financial assets | | | 1,899,432 | | | | 1,496,409 | |
Credit risk exposures relating to off-balance sheet items(1): | | | | | | | | |
Loan commitments | | | 44,064,283 | | | | 42,743,780 | |
Financial guarantees and other credit-related contingent liabilities | | | 5,320,993 | | | | 4,810,931 | |
| | | | | | | | |
Total | | ¥ | 183,306,173 | | | ¥ | 175,658,717 | |
| | | | | | | | |
| (1) | The off-balance sheet items represent the nominal amounts of undrawn loan commitments, financial guarantees and other credit-related contingent liabilities. |
Based on the table above, excluding loan commitments (refer to Note 42 “Contingency and Capital Commitments”), the majority of the total exposure to credit risk is derived from “Loans and advances” and “Available-for-sale financial assets.”
Collateral and other credit enhancements
The SMFG Group considers the acquisition of collateral and guarantees as a secondary repayment source to further enhance loan recovery and minimize credit risk. Based on an analysis of the repayment ability of a borrower by understanding its real business conditions and future potential to generate cash flows, the SMFG Group requires sufficient collateral in the form of an asset or third-party obligation. This serves to mitigate the inherent credit risk in the exposure, by either improving recoveries in the event of a default or transferring the borrower’s obligation to guarantors. Collateral received is mainly segregated into (1) financial collateral such as cash, deposits and securities, (2) real estate collateral such as land and buildings, and (3) guarantees received from sovereigns, municipal corporations, credit guarantee corporations and other public entities, financial institutions, and other companies.
The SMFG Group’s credit risk management is mainly based on an analysis of the repayment ability from the cash flows of the borrower’s business performance, and the collateral and other credit enhancements are considered as secondary repayment sources in the SMFG Group’s business practice. At the time of the primary lending decision, the SMFG Group evaluates the collateral on an individual borrower basis to consider its financial effect for mitigating credit risk. The frequency of subsequent collateral reviews is dependent on the borrower’s creditworthiness. Once there is a significant change in the borrower’s repayment ability due to a
F-100
deterioration in its credit condition or a cash flow becomes past due, the SMFG Group may utilize the collateral and other credit enhancements as a source of repayment. In such circumstances the revaluation of the collateral and other credit enhancements will be performed regularly.
The following table shows the financial effect of collateral and other credit enhancements on loans and advances for borrowers requiring caution and impaired loans and advances at March 31, 2012 and 2011. The maximum collateral amounts included in the disclosure are limited to the carrying value of loans and advances where the credit exposure is over-collateralized.
| | | | | | | | |
| | | At March 31, | |
| | | 2012 | | | 2011 | |
| | | (In millions) | |
Loans and advances for borrowers requiring caution and impaired loans and advances | | ¥ | 6,236,852 | | | ¥ | 6,677,506 | |
Financial effect of collateral and other credit enhancements | | | 2,940,240 | | | | 3,156,375 | |
Concentration of risks of loans and advances with credit risk exposure
An analysis of concentrations of credit risk from loans and advances by geographical sector and industry sector at March 31, 2012 and 2011 is shown below. The concentration by geographical sector is measured based on the domicile of the borrower.
| | | | | | | | |
| | | At March 31, | |
| | | 2012 | | | 2011 | |
| | | (In millions) | |
Domestic | | ¥ | 60,656,705 | | | ¥ | 61,231,165 | |
Foreign: | | | | | | | | |
Americas | | | 4,916,882 | | | | 4,239,800 | |
Europe | | | 2,752,961 | | | | 2,376,786 | |
Asia | | | 4,341,841 | | | | 3,629,841 | |
Others | | | 1,394,319 | | | | 1,282,313 | |
| | | | | | | | |
Total foreign | | | 13,406,003 | | | | 11,528,740 | |
| | | | | | | | |
Gross loans and advances | | | 74,062,708 | | | | 72,759,905 | |
Adjust: Unearned income, unamortized premiums-net and deferred loan fees—net | | | (144,731 | ) | | | (152,443 | ) |
Less: Allowance for loan losses | | | (1,381,164 | ) | | | (1,587,133 | ) |
| | | | | | | | |
Net loans and advances | | ¥ | 72,536,813 | | | ¥ | 71,020,329 | |
| | | | | | | | |
F-101
| | | | | | | | |
| | | At March 31, | |
| | | 2012 | | | 2011 | |
| | | (In millions) | |
Domestic: | | | | | | | | |
Manufacturing | | ¥ | 8,462,004 | | | ¥ | 8,344,261 | |
Agriculture, forestry, fisheries and mining | | | 152,128 | | | | 162,727 | |
Construction | | | 1,284,882 | | | | 1,327,475 | |
Transportation, communications and public enterprises | | | 4,414,102 | | | | 4,036,780 | |
Wholesale and retail | | | 5,480,393 | | | | 5,616,084 | |
Finance and insurance | | | 2,170,776 | | | | 2,568,670 | |
Real estate and goods rental and leasing | | | 7,982,741 | | | | 8,281,048 | |
Services | | | 4,076,818 | | | | 4,316,724 | |
Municipalities | | | 1,234,355 | | | | 1,440,167 | |
Lease financing | | | 2,056,972 | | | | 2,205,451 | |
Consumer(1) | | | 19,185,574 | | | | 18,552,987 | |
Others | | | 4,155,960 | | | | 4,378,791 | |
| | | | | | | | |
Total domestic | | | 60,656,705 | | | | 61,231,165 | |
| | | | | | | | |
Foreign: | | | | | | | | |
Public sector | | | 130,426 | | | | 83,109 | |
Financial institutions | | | 2,012,751 | | | | 1,794,794 | |
Commerce and industry | | | 10,364,685 | | | | 8,949,629 | |
Lease financing | | | 191,966 | | | | 172,361 | |
Others | | | 706,175 | | | | 528,847 | |
| | | | | | | | |
Total foreign | | | 13,406,003 | | | | 11,528,740 | |
| | | | | | | | |
Gross loans and advances | | | 74,062,708 | | | | 72,759,905 | |
Adjust: Unearned income, unamortized premiums—net and deferred loan fees—net | | | (144,731 | ) | | | (152,443 | ) |
Less: Allowance for loan losses | | | (1,381,164 | ) | | | (1,587,133 | ) |
| | | | | | | | |
Net loans and advances | | ¥ | 72,536,813 | | | ¥ | 71,020,329 | |
| | | | | | | | |
| (1) | The balance in Consumer mainly consists of housing loans. The housing loan balances amounted to ¥14,574,702 million and ¥14,577,945 million at March 31, 2012 and 2011, respectively. |
F-102
The following tables show a disaggregation of the structured finance loans and advances balances, where the repayment source is limited to the cash flows generated by a particular business or asset, and the balances of secured or unsecured consumer loans at March 31, 2012 and 2011. These loans and advances are included in the preceding table.
Structured finance:
| | | | | | | | |
| | | At March 31, | |
| | | 2012 | | | 2011 | |
| | | (In millions) | |
Real estate finance | | ¥ | 1,951,764 | | | ¥ | 1,889,243 | |
Project finance | | | 1,413,819 | | | | 1,198,998 | |
Other structured finance | | | 287,325 | | | | 300,765 | |
| | | | | | | | |
Total structured finance | | ¥ | 3,652,908 | | | ¥ | 3,389,006 | |
| | | | | | | | |
Consumer:
| | | | | | | | |
| | | At March 31, | |
| | | 2012 | | | 2011 | |
| | | (In millions) | |
Secured loans(1) | | ¥ | 15,614,747 | | | ¥ | 15,688,645 | |
Unsecured loans | | | 3,570,827 | | | | 2,864,342 | |
| | | | | | | | |
Total consumer | | ¥ | 19,185,574 | | | ¥ | 18,552,987 | |
| | | | | | | | |
| (1) | The secured loans and advances mainly represent housing loans. The housing loan balances amounted to ¥14,574,702 million and ¥14,577,945 million at March 31, 2012 and 2011, respectively. |
Loans and advances by credit quality category
Loans and advances are summarized as follows:
| | | | | | | | |
| | | At March 31, | |
| | | 2012 | | | 2011 | |
| | | (In millions) | |
Neither past due nor impaired | | ¥ | 71,300,909 | | | ¥ | 69,953,012 | |
Past due but not impaired | | | 144,697 | | | | 157,470 | |
Impaired(1) | | | 2,617,102 | | | | 2,649,423 | |
| | | | | | | | |
Gross loans and advances | | | 74,062,708 | | | | 72,759,905 | |
Adjust: Unearned income, unamortized premiums—net and deferred loan fees—net | | | (144,731 | ) | | | (152,443 | ) |
Less: Allowance for loan losses | | | (1,381,164 | ) | | | (1,587,133 | ) |
| | | | | | | | |
Net loans and advances | | ¥ | 72,536,813 | | | ¥ | 71,020,329 | |
| | | | | | | | |
| (1) | Loans and advances to borrowers who are classified in the borrower categories of substandard borrowers, potentially bankrupt borrowers, effectively bankrupt borrowers, and bankrupt borrowers described in the obligor grading system represent impaired loans and advances. |
F-103
| | (a) | Loans and advances neither past due nor impaired |
The following table shows the credit quality of the portfolio of loans and advances that were neither past due nor impaired, by geography and by industry based on the corporate obligor grading system of SMBC at March 31, 2012 and 2011. Since the internal rating system of SMBC’s consumer portfolio differs from the corporate obligor grading system, the balances of loans and advances to consumers are included in the grade category of “Other.” Additionally, as the SMFG Group’s subsidiaries are adopting various internal rating systems which differ from SMBC, the grade category of “Other” also includes some balances of loans and advances held by those subsidiaries.
| | | | | | | | | | | | | | | | | | | | | | | | | | | | |
| | | At March 31, 2012 | |
| | | Normal | | | Requiring Caution | | | | |
| | | J 1-3 | | | J 4-6 | | | Japanese
government
and local
municipal
corporations | | | Other | | | J 7 | | | Other | | | Total | |
| | | (In millions) | |
Domestic: | | | | |
Manufacturing | | ¥ | 3,633,947 | | | ¥ | 2,528,721 | | | ¥ | — | | | ¥ | 1,560,885 | | | ¥ | 373,887 | | | ¥ | 139,926 | | | ¥ | 8,237,366 | |
Agriculture, forestry, fisheries and mining | | | 53,379 | | | | 49,215 | | | | 1,264 | | | | 4,739 | | | | 36,536 | | | | 1,066 | | | | 146,199 | |
Construction | | | 255,292 | | | | 304,934 | | | | — | | | | 456,733 | | | | 67,980 | | | | 61,044 | | | | 1,145,983 | |
Transportation, communications and public enterprises | | | 1,717,770 | | | | 1,822,101 | | | | 139,964 | | | | 468,346 | | | | 64,043 | | | | 74,573 | | | | 4,286,797 | |
Wholesale and retail | | | 1,489,228 | | | | 2,272,331 | | | | — | | | | 1,070,530 | | | | 241,107 | | | | 118,503 | | | | 5,191,699 | |
Finance and insurance | | | 687,049 | | | | 246,590 | | | | 41,246 | | | | 927,613 | | | | 237,173 | | | | 17,712 | | | | 2,157,383 | |
Real estate and goods rental and leasing | | | 2,500,185 | | | | 3,044,877 | | | | 44,103 | | | | 1,274,938 | | | | 306,003 | | | | 186,968 | | | | 7,357,074 | |
Services | | | 666,718 | | | | 1,842,202 | | | | 127,449 | | | | 780,149 | | | | 242,666 | | | | 133,797 | | | | 3,792,981 | |
Municipalities | | | — | | | | — | | | | 1,129,149 | | | | 87,956 | | | | 333 | | | | 14,525 | | | | 1,231,963 | |
Lease financing | | | — | | | | — | | | | — | | | | 2,000,114 | | | | — | | | | 34,920 | | | | 2,035,034 | |
Consumer(1) | | | — | | | | 524 | | | | — | | | | 18,079,072 | | | | 6,183 | | | | 401,578 | | | | 18,487,357 | |
Others | | | 11,390 | | | | 2,409,118 | | | | 696,950 | | | | 491,122 | | | | 433,440 | | | | 9,123 | | | | 4,051,143 | |
| | | | | | | | | | | | | | | | | | | | | | | | | | | | |
Total domestic | | | 11,014,958 | | | | 14,520,613 | | | | 2,180,125 | | | | 27,202,197 | | | | 2,009,351 | | | | 1,193,735 | | | | 58,120,979 | |
| | | | | | | | | | | | | | | | | | | | | | | | | | | | |
| | | | | | | |
| | | G 1-3 | | | G 4-6 | | | — | | | Other | | | G 7 | | | Other | | | Total | |
Foreign: | | | | |
Public sector | | | 97,932 | | | | — | | | | — | | | | 31,332 | | | | — | | | | 1,114 | | | | 130,378 | |
Financial institutions | | | 1,174,915 | | | | 26,339 | | | | — | | | | 750,712 | | | | 2,080 | | | | 22,277 | | | | 1,976,323 | |
Commerce and industry | | | 6,679,852 | | | | 1,450,041 | | | | — | | | | 1,707,819 | | | | 251,377 | | | | 94,802 | | | | 10,183,891 | |
Lease financing | | | — | | | | — | | | | — | | | | 174,347 | | | | — | | | | 13,348 | | | | 187,695 | |
Others | | | 484,756 | | | | 63,988 | | | | — | | | | 143,118 | | | | 1,043 | | | | 8,738 | | | | 701,643 | |
| | | | | | | | | | | | | | | | | | | | | | | | | | | | |
Total foreign | | | 8,437,455 | | | | 1,540,368 | | | | — | | | | 2,807,328 | | | | 254,500 | | | | 140,279 | | | | 13,179,930 | |
| | | | | | | | | | | | | | | | | | | | | | | | | | | | |
Total | | ¥ | 19,452,413 | | | ¥ | 16,060,981 | | | ¥ | 2,180,125 | | | ¥ | 30,009,525 | | | ¥ | 2,263,851 | | | ¥ | 1,334,014 | | | ¥ | 71,300,909 | |
| | | | | | | | | | | | | | | | | | | | | | | | | | | | |
| (1) | The balance in the grade category of “Other” in Consumer includes housing loans, which amounted to ¥14,151,064 million and ¥119,513 million for the borrower category of Normal and Requiring Caution, respectively. |
F-104
| | | | | | | | | | | | | | | | | | | | | | | | | | | | |
| | | At March 31, 2011 | |
| | | Normal | | | Requiring Caution | | | | |
| | | J 1-3 | | | J 4-6 | | | Japanese
government
and local
municipal
corporations | | | Other | | | J 7 | | | Other | | | Total | |
| | | (In millions) | |
Domestic: | | | | |
Manufacturing | | ¥ | 3,585,500 | | | ¥ | 2,572,464 | | | ¥ | — | | | ¥ | 1,524,614 | | | ¥ | 310,039 | | | ¥ | 103,460 | | | ¥ | 8,096,077 | |
Agriculture, forestry, fisheries and mining | | | 62,391 | | | | 48,871 | | | | — | | | | 5,109 | | | | 38,422 | | | | 1,057 | | | | 155,850 | |
Construction | | | 252,967 | | | | 340,533 | | | | — | | | | 465,126 | | | | 65,211 | | | | 61,822 | | | | 1,185,659 | |
Transportation, communications and public enterprises | | | 2,129,093 | | | | 1,057,435 | | | | 124,553 | | | | 445,636 | | | | 85,032 | | | | 72,758 | | | | 3,914,507 | |
Wholesale and retail | | | 1,393,748 | | | | 2,388,124 | | | | — | | | | 1,121,092 | | | | 293,428 | | | | 121,274 | | | | 5,317,666 | |
Finance and insurance | | | 758,896 | | | | 310,133 | | | | 147,780 | | | | 1,009,277 | | | | 294,477 | | | | 36,040 | | | | 2,556,603 | |
Real estate and goods rental and leasing | | | 2,313,815 | | | | 3,243,563 | | | | 28,941 | | | | 1,440,271 | | | | 383,897 | | | | 189,218 | | | | 7,599,705 | |
Services | | | 673,268 | | | | 1,950,621 | | | | 115,694 | | | | 805,748 | | | | 299,378 | | | | 133,215 | | | | 3,977,924 | |
Municipalities | | | — | | | | — | | | | 1,314,980 | | | | 106,765 | | | | — | | | | 18,422 | | | | 1,440,167 | |
Lease financing | | | — | | | | — | | | | — | | | | 2,113,074 | | | | — | | | | 60,875 | | | | 2,173,949 | |
Consumer(1) | | | — | | | | 791 | | | | — | | | | 17,442,297 | | | | 6,024 | | | | 518,239 | | | | 17,967,351 | |
Others | | | 10,935 | | | | 2,625,390 | | | | 696,926 | | | | 528,345 | | | | 413,242 | | | | 9,625 | | | | 4,284,463 | |
| | | | | | | | | | | | | | | | | | | | | | | | | | | | |
Total domestic | | | 11,180,613 | | | | 14,537,925 | | | | 2,428,874 | | | | 27,007,354 | | | | 2,189,150 | | | | 1,326,005 | | | | 58,669,921 | |
| | | | | | | | | | | | | | | | | | | | | | | | | | | | |
| | | | | | | |
| | | G 1-3 | | | G 4-6 | | | — | | | Other | | | G 7 | | | Other | | | Total | |
Foreign: | | | | |
Public sector | | | 54,952 | | | | — | | | | — | | | | 27,499 | | | | — | | | | 610 | | | | 83,061 | |
Financial institutions | | | 1,088,262 | | | | 49,189 | | | | — | | | | 569,627 | | | | 8,363 | | | | 19,698 | | | | 1,735,139 | |
Commerce and industry | | | 5,420,227 | | | | 1,396,580 | | | | — | | | | 1,587,509 | | | | 274,206 | | | | 94,226 | | | | 8,772,748 | |
Lease financing | | | — | | | | — | | | | — | | | | 153,473 | | | | — | | | | 13,851 | | | | 167,324 | |
Others | | | 363,621 | | | | 42,041 | | | | — | | | | 97,851 | | | | 14,408 | | | | 6,898 | | | | 524,819 | |
| | | | | | | | | | | | | | | | | | | | | | | | | | | | |
Total foreign | | | 6,927,062 | | | | 1,487,810 | | | | — | | | | 2,435,959 | | | | 296,977 | | | | 135,283 | | | | 11,283,091 | |
| | | | | | | | | | | | | | | | | | | | | | | | | | | | |
Total | | ¥ | 18,107,675 | | | ¥ | 16,025,735 | | | ¥ | 2,428,874 | | | ¥ | 29,443,313 | | | ¥ | 2,486,127 | | | ¥ | 1,461,288 | | | ¥ | 69,953,012 | |
| | | | | | | | | | | | | | | | | | | | | | | | | | | | |
| (1) | The balance in the grade category of “Other” in Consumer includes housing loans, which amounted to ¥14,169,190 million and ¥126,251 million for the borrower category of Normal and Requiring Caution, respectively. |
F-105
| | (b) | Loans and advances past due but not impaired |
The SMFG Group assesses the credit quality of loans and advances taking into account past due information on a borrower basis, and does not comprehensively collate the data related to the age analysis of loans and advances that were past due but not impaired on an individual basis. The aggregate balances of loans and advances of borrowers with one or more facilities, where any of the facilities is past due for less than three months but not impaired as at March 31, 2012 and 2011 were ¥194,248 million and ¥226,544 million, respectively. Those aggregate balances therefore include individual loans and advances which are not past due. Thus, in the table below, the SMFG Group provides the amount of loans and advances where the final payment at contractual maturity is past due, by geography and by industry, at March 31, 2012 and 2011. For reference, since all the loans and advances that are past due over three months are treated as impaired, those loans and advances are not included in the table below.
| | | | | | | | | | | | | | | | |
| | | At March 31, 2012 | |
| | | Past due up to
1 month | | | Past due 1 – 2
months | | | Past due 2 – 3
months | | | Total | |
| | | (In millions) | |
Domestic: | | | | |
Manufacturing | | ¥ | 1,656 | | | ¥ | 987 | | | ¥ | 113 | | | ¥ | 2,756 | |
Agriculture, forestry, fisheries and mining | | | — | | | | 11 | | | | — | | | | 11 | |
Construction | | | 850 | | | | 286 | | | | 307 | | | | 1,443 | |
Transportation, communications and public enterprises | | | 639 | | | | 258 | | | | 23 | | | | 920 | |
Wholesale and retail | | | 5,338 | | | | 596 | | | | 687 | | | | 6,621 | |
Finance and insurance | | | 36 | | | | — | | | | — | | | | 36 | |
Real estate and goods rental and leasing | | | 644 | | | | 185 | | | | 838 | | | | 1,667 | |
Services | | | 1,767 | | | | 264 | | | | 331 | | | | 2,362 | |
Municipalities | | | 2,392 | | | | — | | | | — | | | | 2,392 | |
Lease financing | | | 59 | | | | 10,200 | | | | — | | | | 10,259 | |
Consumer | | | 74,462 | | | | 16,886 | | | | 15,022 | | | | 106,370 | |
Others | | | 89 | | | | 1,120 | | | | 5 | | | | 1,214 | |
| | | | | | | | | | | | | | | | |
Total domestic | | | 87,932 | | | | 30,793 | | | | 17,326 | | | | 136,051 | |
| | | | | | | | | | | | | | | | |
Foreign: | | | | | | | | | | | | | | | | |
Public sector | | | — | | | | — | | | | 34 | | | | 34 | |
Financial institutions | | | 396 | | | | 17 | | | | — | | | | 413 | |
Commerce and industry | | | 3,853 | | | | 1,334 | | | | 1,498 | | | | 6,685 | |
Others | | | 1,099 | | | | 296 | | | | 119 | | | | 1,514 | |
| | | | | | | | | | | | | | | | |
Total foreign | | | 5,348 | | | | 1,647 | | | | 1,651 | | | | 8,646 | |
| | | | | | | | | | | | | | | | |
Total | | ¥ | 93,280 | | | ¥ | 32,440 | | | ¥ | 18,977 | | | ¥ | 144,697 | |
| | | | | | | | | | | | | | | | |
F-106
| | | | | | | | | | | | | | | | |
| | | At March 31, 2011 | |
| | | Past due up to
1 month | | | Past due 1 – 2
months | | | Past due 2 – 3
months | | | Total | |
| | | (In millions) | |
Domestic: | | | | |
Manufacturing | | ¥ | 7,982 | | | ¥ | 362 | | | ¥ | 171 | | | ¥ | 8,515 | |
Agriculture, forestry, fisheries and mining | | | 40 | | | | 2 | | | | — | | | | 42 | |
Construction | | | 3,232 | | | | 523 | | | | 138 | | | | 3,893 | |
Transportation, communications and public enterprises | | | 943 | | | | 145 | | | | 61 | | | | 1,149 | |
Wholesale and retail | | | 10,009 | | | | 678 | | | | 730 | | | | 11,417 | |
Finance and insurance | | | 161 | | | | 390 | | | | — | | | | 551 | |
Real estate and goods rental and leasing | | | 12,668 | | | | 454 | | | | 318 | | | | 13,440 | |
Services | | | 7,735 | | | | 978 | | | | 581 | | | | 9,294 | |
Municipalities | | | — | | | | — | | | | — | | | | — | |
Lease financing | | | 14 | | | | 302 | | | | 103 | | | | 419 | |
Consumer | | | 76,261 | | | | 17,747 | | | | 9,398 | | | | 103,406 | |
Others | | | 297 | | | | 271 | | | | 52 | | | | 620 | |
| | | | | | | | | | | | | | | | |
Total domestic | | | 119,342 | | | | 21,852 | | | | 11,552 | | | | 152,746 | |
| | | | | | | | | | | | | | | | |
Foreign: | | | | | | | | | | | | | | | | |
Public sector | | | — | | | | — | | | | 34 | | | | 34 | |
Financial institutions | | | 417 | | | | 11 | | | | — | | | | 428 | |
Commerce and industry | | | 3,757 | | | | 100 | | | | 338 | | | | 4,195 | |
Others | | | 51 | | | | 16 | | | | — | | | | 67 | |
| | | | | | | | | | | | | | | | |
Total foreign | | | 4,225 | | | | 127 | | | | 372 | | | | 4,724 | |
| | | | | | | | | | | | | | | | |
Total | | ¥ | 123,567 | | | ¥ | 21,979 | | | ¥ | 11,924 | | | ¥ | 157,470 | |
| | | | | | | | | | | | | | | | |
F-107
| (c) | Impaired loans and advances |
The following table shows the impaired loans and advances, by geography and by industry, at March 31, 2012 and 2011.
| | | | | | | | |
| | | At March 31, | |
| | | 2012 | | | 2011 | |
| | | (In millions) | |
Domestic: | | | | | | | | |
Manufacturing | | ¥ | 221,882 | | | ¥ | 239,669 | |
Agriculture, forestry, fisheries and mining | | | 5,918 | | | | 6,835 | |
Construction | | | 137,456 | | | | 137,923 | |
Transportation, communications and public enterprises | | | 126,385 | | | | 121,124 | |
Wholesale and retail | | | 282,073 | | | | 287,001 | |
Finance and insurance | | | 13,357 | | | | 11,516 | |
Real estate and goods rental and leasing | | | 624,000 | | | | 667,903 | |
Services | | | 281,475 | | | | 329,506 | |
Lease financing | | | 11,679 | | | | 31,083 | |
Consumer | | | 591,847 | | | | 482,230 | |
Others | | | 103,603 | | | | 93,708 | |
| | | | | | | | |
Total domestic | | | 2,399,675 | | | | 2,408,498 | |
| | | | | | | | |
Foreign: | | | | | | | | |
Public sector | | | 14 | | | | 14 | |
Financial institutions | | | 36,015 | | | | 59,227 | |
Commerce and industry | | | 174,109 | | | | 172,686 | |
Lease financing | | | 4,271 | | | | 5,037 | |
Others | | | 3,018 | | | | 3,961 | |
| | | | | | | | |
Total foreign | | | 217,427 | | | | 240,925 | |
| | | | | | | | |
Total impaired loans and advances before allowance for loan losses | | | 2,617,102 | | | | 2,649,423 | |
| | | | | | | | |
Less: Allowance for loan losses | | | (1,234,299 | ) | | | (1,395,659 | ) |
| | | | | | | | |
Net impaired loans and advances | | ¥ | 1,382,803 | | | ¥ | 1,253,764 | |
| | | | | | | | |
Renegotiated loans and advances
The following table shows loans and advances at March 31, 2012 and 2011 that would otherwise be past due or impaired, but whose terms have been renegotiated without providing any financial concessions. These loans and advances are mainly classified as requiring caution in the table of “(a) Loans and advances neither past due nor impaired” in the section “Loans and advances by credit quality category.”
The SMFG Group continually assesses the creditworthiness of a borrower for whom terms of the loans and advances have been renegotiated, taking into account the actual state of the borrower’s financial position and qualitative factors. Further details are described in “(a) Credit risk evaluation” in the section “Credit risk management methods.”
| | | | | | | | |
| | | At March 31, | |
| | | 2012 | | | 2011 | |
| | | (In millions) | |
Renegotiated loans and advances | | ¥ | 1,185,123 | | | ¥ | 1,307,189 | |
Trading assets and investment securities
The following table shows an analysis of trading assets, financial assets at fair value through profit or loss, held-to-maturity investments and available-for-sale financial assets based on the external rating system at
F-108
March 31, 2012 and 2011, excluding equity instruments. The decrease in AAA-rated securities at March 31, 2012 mainly reflects the downgrading of Japanese government bonds during the current fiscal year. Collateral is generally not obtained directly from the issuers.
| | | | | | | | | | | | | | | | | | | | |
| | | At March 31, 2012 | |
| | | Trading
assets | | | Financial assets at
fair value through
profit or loss | | | Held-to-maturity
investments | | | Available-for-sale
financial assets | | | Total | |
| | | (In millions) | |
AAA | | ¥ | 100,032 | | | ¥ | — | | | ¥ | — | | | ¥ | 4,926,867 | | | ¥ | 5,026,899 | |
AA- to AA+ | | | 3,686,800 | | | | 1,886,820 | | | | 5,260,240 | | | | 23,342,718 | | | | 34,176,578 | |
A- to A+ | | | 317,132 | | | | 84,727 | | | | 17,028 | | | | 316,938 | | | | 735,825 | |
Lower than A- | | | 23,112 | | | | — | | | | — | | | | 126,445 | | | | 149,557 | |
Unrated | | | 5,903 | | | | 48,012 | | | | — | | | | 144,962 | | | | 198,877 | |
| | | | | | | | | | | | | | | | | | | | |
Total | | ¥ | 4,132,979 | | | ¥ | 2,019,559 | | | ¥ | 5,277,268 | | | ¥ | 28,857,930 | | | ¥ | 40,287,736 | |
| | | | | | | | | | | | | | | | | | | | |
Impaired available-for-sale financial assets with a carrying amount of ¥117,238 million at March 31, 2012 are included in the table above. This amount includes ¥117,045 million of the Financial Stabilization Funds. See Note 9 “Investment Securities” for additional information concerning the Financial Stabilization Funds.
| | | | | | | | | | | | | | | | | | | | |
| | | At March 31, 2011 | |
| | | Trading
assets | | | Financial assets at
fair value through
profit or loss | | | Held-to-maturity
investments | | | Available-for-sale
financial assets | | | Total | |
| | | (In millions) | |
AAA | | ¥ | 2,313,388 | | | ¥ | 1,857,367 | | | ¥ | 3,980,582 | | | ¥ | 25,848,467 | | | ¥ | 33,999,804 | |
AA- to AA+ | | | 399,758 | | | | — | | | | 181,224 | | | | 753,428 | | | | 1,334,410 | |
A- to A+ | | | 339,952 | | | | 84,155 | | | | 19,034 | | | | 192,296 | | | | 635,437 | |
Lower than A- | | | 47,943 | | | | — | | | | 1,000 | | | | 200,995 | | | | 249,938 | |
Unrated | | | 4,856 | | | | 54,288 | | | | — | | | | 268,331 | | | | 327,475 | |
| | | | | | | | | | | | | | | | | | | | |
Total | | ¥ | 3,105,897 | | | ¥ | 1,995,810 | | | ¥ | 4,181,840 | | | ¥ | 27,263,517 | | | ¥ | 36,547,064 | |
| | | | | | | | | | | | | | | | | | | | |
Impaired available-for-sale financial assets with a carrying amount of ¥117,231 million at March 31, 2011 are included in the table above. This amount includes ¥116,875 million of a part of the Financial Stabilization Funds. See Note 9 “Investment Securities” for additional information concerning the Financial Stabilization Funds.
Credit risk from derivative financial instruments
The SMFG Group maintains control limits on net open derivative positions (i.e., the difference between purchase and sale contracts), by both amount and term. At any one time, the amount subject to credit risk is limited to the fair value of derivative financial instruments that are favorable to the SMFG Group (i.e., assets where their fair value is positive).
The SMFG Group’s credit risk from derivatives is mitigated where possible through netting agreements whereby derivative assets and liabilities with the same counterparty can be offset. Netting agreements, such as the International Swaps and Derivatives Association’s (“ISDA”) master agreement, allow the netting of obligations arising under all of the derivative transactions that the agreement covers upon the counterparty’s default, regardless of maturity and currency, resulting in a single net claim against the counterparty. The SMFG Group’s credit risk is also mitigated by collateral arrangements through the credit support annex, resulting in collateral delivered or received regularly based on the replacement costs of derivatives.
F-109
Market Risk and Liquidity Risk
Market risk is the possibility that fluctuations in interest rates, foreign exchange rates, stock prices or other market prices will change the market value of financial products, leading to a loss. The purpose of market risk management is to keep the market risk exposure to a permissible level relative to capital.
Liquidity risk is the risk that there may be difficulties in raising funds needed for settlements as a result of the mismatching of uses of funds, and sources of funds or unexpected outflows of funds, which may make it necessary to raise funds at higher rates than normal. The purpose of liquidity risk management is to ensure that the SMFG Group is in a position to address its liquidity obligations through monitoring the liquidity gap between assets and liabilities, and maintaining highly liquid supplementary funding resources.
On the basis of the Group-wide basic policies for risk management, the SMFG Group has a quantitative management process to control market and liquidity risks on a Group-wide basis by setting allowable risk limits by company. The SMFG Group annually reviews and identifies which companies primarily carry the market and liquidity risks within the Group. The SMFG Group sets permissible levels and upper limits of risk for each identified company in consideration of those companies’ business plans. The SMFG Group ensures that each identified company establishes a risk management system that is appropriate to the risks it faces, and has built-in transparent risk management processes, clearly separating front-office, middle-office and back-office operations, and establishing a control system of mutual checks and balances.
Framework for market and liquidity risk management
The Board of Directors authorizes important matters relating to the management of market and liquidity risks, such as the basic policies and risk limits, which are decided by the Management Committee.
Additionally, at SMBC, the Corporate Risk Management Department manages market and liquidity risks in an integrated manner. The Corporate Risk Management Department is the planning department of the Risk Management Unit, which is independent of the business units that directly handle market transactions, and not only monitors the current risk situations, but also reports regularly to the Management Committee and the Board of Directors. Furthermore, SMBC’s Asset Liability Management (“ALM”) Committee meets on a monthly basis to examine reports on the state of observance of SMBC’s limits on market and liquidity risks, and to review and discuss SMBC’s ALM operations.
To prevent unforeseen processing errors as well as fraudulent transactions, it is important to establish a system of checks on the business units (front office). At SMBC, both the processing departments (back office) and the administrative departments (middle office) conduct the checks. In addition, the Internal Audit Unit of SMBC periodically performs internal audits to verify that the risk management framework is functioning properly.
F-110
The following chart shows the market and liquidity risk management system of SMBC.
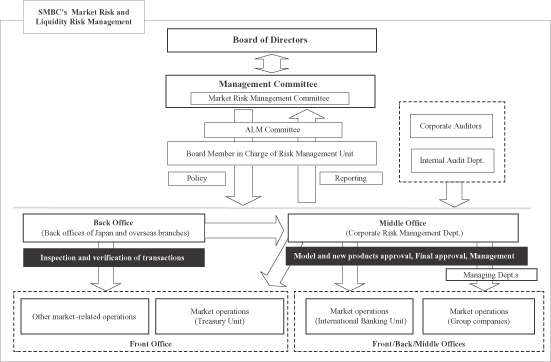
Market and liquidity risk management methods
Market risk management process
The SMFG Group manages market risk from trading activities and non-trading activities, including strategic equity investment and other transactions within the risk capital limit which is determined taking into account SMFG’s shareholders’ equity and other principal indicators of the financial position. The SMFG Group also establishes an upper limit on VaR and losses within the risk capital limits.
The SMFG Group’s market risk can be divided into various factors: interest rates, foreign exchange rates, equity prices and option risks. The SMFG Group manages each of these risks by employing the VaR method as well as supplemental indicators suitable for managing each risk, such as the basis point value (“BPV”).
VaR is the largest predicted loss that is possible given a fixed confidence interval. For example, the SMFG Group’s VaR indicates the largest loss that is possible for a holding period of one day and a confidence interval of 99.0%. BPV is the amount of change in assessed value as a result of a one-basis-point (0.01%) movement in interest rates.
The principal Group companies’ internal VaR model makes use of historical data to prepare scenarios for market fluctuations and, by conducting simulations of gains and losses, the model estimates the maximum losses that may occur.
F-111
The VaR calculation method the SMFG Group employs for both trading and non-trading activities is based mainly on the following, and after April 2011, VaR for strategic equity investment in non-trading activities is measured based on a one-year holding period and an observation period of ten years in order to appropriately calculate long-term profit and loss scenarios.
| | • | | the historical simulation method; |
| | • | | a one-sided confidence interval of 99.0%; |
| | • | | a one-day holding period (a one-year holding period for strategic equity investment portfolio); and |
| | • | | an observation period of four years (ten years for strategic equity investment portfolio). |
The relationship between the VaR calculated with the model and the actual profit and loss data is back-tested periodically. There were no significant excess losses in the back-testing results including the trading accounts. The back-testing results are reviewed by management, which also monitors the ongoing suitability of the VaR model.
VaR summary
The following tables show the SMFG Group’s VaR by risk category and these figures are prepared based on the internal reporting provided to management. The SMFG Group’s material market risk exposure categories consist of interest rate risk, foreign exchange risk, equities and commodities risk, and others. The section headed “VaR for Trading Activity” shows VaR for instruments entered into for trading purposes and the VaR model for the trading book includes principal consolidated subsidiaries. The section headed “VaR for Non-Trading Activity” shows VaR for instruments entered into for purposes other than trading purposes. “Strategic Equity Investment” in the “VaR for Non-Trading Activity” section is a portfolio that consists principally of publicly traded Japanese equities. This portfolio, like that of other financial institutions in Japan, has historically included shares of the SMFG Group’s customers.
F-112
VaR for Trading Activity
The aggregate VaR for the SMFG Group’s total trading activities at March 31, 2012 was ¥10.0 billion. VaR increased at March 31, 2012 compared with March 31, 2011 in the category of equities risk primarily reflecting an increased position in equities.
| | | | | | | | | | | | | | | | | | | | |
| | | Interest rate
risk | | | Foreign
exchange risk | | | Equities and
commodities
risk | | | Others | | | Total(1) | |
| | | (In billions) | |
| For the fiscal year ended March 31, 2012: | | | | | | | | | | | | | | | | | | | | |
SMBC Consolidated | | | | | | | | | | | | | | | | | | | | |
Maximum | | ¥ | 7.6 | | | ¥ | 2.6 | | | ¥ | 4.4 | | | ¥ | 0.3 | | | ¥ | 11.8 | |
Minimum | | | 3.4 | | | | 0.4 | | | | 0.6 | | | | 0.2 | | | | 5.4 | |
Daily average | | | 5.3 | | | | 1.2 | | | | 2.2 | | | | 0.2 | | | | 8.2 | |
At March 31, 2012 | | | 4.9 | | | | 0.6 | | | | 4.0 | | | | 0.2 | | | | 9.3 | |
| | | | | |
SMFG Consolidated | | | | | | | | | | | | | | | | | | | | |
Maximum | | ¥ | 8.1 | | | ¥ | 2.6 | | | ¥ | 4.8 | | | ¥ | 0.3 | | | ¥ | 12.6 | |
Minimum | | | 3.8 | | | | 0.5 | | | | 0.8 | | | | 0.2 | | | | 5.9 | |
Daily average | | | 5.8 | | | | 1.2 | | | | 2.5 | | | | 0.2 | | | | 8.9 | |
At March 31, 2012 | | | 5.4 | | | | 0.6 | | | | 4.1 | | | | 0.2 | | | | 10.0 | |
| (1) | Total for “Maximum,” “Minimum,” and “Daily average” represent the maximum, minimum and daily average of the total of the trading book. For certain subsidiaries, the SMFG Group employs the standardized method and/or the historical simulation method for the VaR calculation method. |
| | | | | | | | | | | | | | | | | | | | |
| | | Interest rate
risk | | | Foreign
exchange risk | | | Equities and
commodities
risk | | | Others | | | Total(1) | |
| | | (In billions) | |
| For the fiscal year ended March 31, 2011: | | | | | | | | | | | | | | | | | | | | |
SMBC Consolidated | | | | | | | | | | | | | | | | | | | | |
Maximum | | ¥ | 6.8 | | | ¥ | 1.8 | | | ¥ | 2.2 | | | ¥ | 0.5 | | | ¥ | 8.7 | |
Minimum | | | 3.7 | | | | 0.4 | | | | 0.5 | | | | 0.2 | | | | 5.4 | |
Daily average | | | 5.2 | | | | 0.8 | | | | 1.4 | | | | 0.2 | | | | 7.2 | |
At March 31, 2011 | | | 4.5 | | | | 0.7 | | | | 1.4 | | | | 0.2 | | | | 6.5 | |
| | | | | |
SMFG Consolidated | | | | | | | | | | | | | | | | | | | | |
Maximum | | ¥ | 7.1 | | | ¥ | 2.4 | | | ¥ | 2.5 | | | ¥ | 0.5 | | | ¥ | 9.3 | |
Minimum | | | 3.9 | | | | 0.5 | | | | 0.7 | | | | 0.2 | | | | 5.8 | |
Daily average | | | 5.6 | | | | 1.0 | | | | 1.6 | | | | 0.2 | | | | 7.9 | |
At March 31, 2011 | | | 4.7 | | | | 0.8 | | | | 1.5 | | | | 0.2 | | | | 6.8 | |
| (1) | Total for “Maximum,” “Minimum,” and “Daily average” represent the maximum, minimum and daily average of the total of the trading book. For certain subsidiaries, the SMFG Group employs the standardized method and/or the historical simulation method for the VaR calculation method. |
F-113
VaR for Non-Trading Activity
The aggregate VaR for the SMFG Group’s total banking activities at March 31, 2012 was ¥32.1 billion. Most of this was composed of interest rate risk exposure based on the operations for the purpose of asset and liability management of SMBC. VaR decreased at March 31, 2012 compared with March 31, 2011 in the category of interest rate risk primarily reflecting smaller market fluctuations caused by the recent lower level of interest rates.
| | | | | | | | | | | | | | | | | | | | |
| | | Interest rate
risk | | | Foreign
exchange risk | | | Equities and
commodities
risk | | | Others | | | Total(1) | |
| | | (In billions) | |
| For the fiscal year ended March 31, 2012: | | | | | | | | | | | | | | | | | | | | |
SMBC Consolidated | | | | | | | | | | | | | | | | | | | | |
Maximum | | ¥ | 49.3 | | | ¥ | 0.0 | | | ¥ | 14.0 | | | ¥ | 0.0 | | | ¥ | 52.2 | |
Minimum | | | 27.9 | | | | 0.0 | | | | 7.8 | | | | 0.0 | | | | 31.0 | |
Daily average | | | 34.7 | | | | 0.0 | | | | 10.1 | | | | 0.0 | | | | 38.0 | |
At March 31, 2012 | | | 28.7 | | | | 0.0 | | | | 10.2 | | | | 0.0 | | | | 31.3 | |
| | | | | |
SMFG Consolidated | | | | | | | | | | | | | | | | | | | | |
Maximum | | ¥ | 50.6 | | | ¥ | 0.0 | | | ¥ | 14.0 | | | ¥ | 0.0 | | | ¥ | 53.6 | |
Minimum | | | 28.6 | | | | 0.0 | | | | 7.8 | | | | 0.0 | | | | 31.8 | |
Daily average | | | 35.7 | | | | 0.0 | | | | 10.1 | | | | 0.0 | | | | 38.9 | |
At March 31, 2012 | | | 29.4 | | | | 0.0 | | | | 10.2 | | | | 0.0 | | | | 32.1 | |
| (1) | Total for “Maximum,” “Minimum,” and “Daily average” represent the maximum, minimum and daily average of the total of the banking book. |
| | | | | | | | | | | | | | | | | | | | |
| | | Interest rate
risk | | | Foreign
exchange risk | | | Equities and
commodities
risk | | | Others | | | Total(1) | |
| | | (In billions) | |
| For the fiscal year ended March 31, 2011: | | | | | | | | | | | | | | | | | | | | |
SMBC Consolidated | | | | | | | | | | | | | | | | | | | | |
Maximum | | ¥ | 46.3 | | | ¥ | 0.1 | | | ¥ | 12.1 | | | ¥ | 0.0 | | | ¥ | 49.6 | |
Minimum | | | 25.0 | | | | 0.0 | | | | 6.1 | | | | 0.0 | | | | 28.8 | |
Daily average | | | 35.9 | | | | 0.0 | | | | 8.2 | | | | 0.0 | | | | 39.4 | |
At March 31, 2011 | | | 44.2 | | | | 0.0 | | | | 8.6 | | | | 0.0 | | | | 47.4 | |
| | | | | |
SMFG Consolidated | | | | | | | | | | | | | | | | | | | | |
Maximum | | ¥ | 47.6 | | | ¥ | 0.1 | | | ¥ | 12.1 | | | ¥ | 0.0 | | | ¥ | 50.9 | |
Minimum | | | 25.9 | | | | 0.0 | | | | 6.1 | | | | 0.0 | | | | 29.7 | |
Daily average | | | 37.0 | | | | 0.0 | | | | 8.2 | | | | 0.0 | | | | 40.5 | |
At March 31, 2011 | | | 45.5 | | | | 0.0 | | | | 8.6 | | | | 0.0 | | | | 48.6 | |
| (1) | Total for “Maximum,” “Minimum,” and “Daily average” represent the maximum, minimum and daily average of the total of the banking book. |
F-114
| | • | | Strategic Equity Investment |
The aggregate VaR for the SMFG Group’s strategic equity investment at March 31, 2012 was ¥897.9 billion, a decrease from ¥930.3 billion at March 31, 2011 due primarily to a decline in the fair value of the strategic equity investment portfolio.
| | | | |
| | | Equities risk | |
| | | (In billions) | |
For the fiscal year ended March 31, 2012: | | | | |
SMBC Consolidated | | | | |
Maximum | | ¥ | 918.2 | |
Minimum | | | 696.0 | |
Daily average | | | 814.2 | |
At March 31, 2012 | | | 873.0 | |
| |
SMFG Consolidated | | | | |
Maximum | | ¥ | 939.2 | |
Minimum | | | 712.5 | |
Daily average | | | 834.4 | |
At March 31, 2012 | | | 897.9 | |
| Note: | After April 2011, VaR for strategic equity investment is measured based on a one-year holding period and an observation period of ten years in order to appropriately calculate long-term profit and loss scenarios. For comparison purpose, the aggregate VaR at March 31, 2011 is recalculated based on the VaR calculation method adopted at March 31, 2012. The recalculated aggregate VaR for the strategic equity investment at March 31, 2011 was ¥910.0 billion and ¥930.3 billion for SMBC Consolidated and SMFG Consolidated, respectively. |
| | | | |
| | | Equities risk | |
| | | (In billions) | |
| For the fiscal year ended March 31, 2011: | | | | |
SMBC Consolidated | | | | |
Maximum | | ¥ | 127.4 | |
Minimum | | | 98.4 | |
Daily average | | | 111.4 | |
At March 31, 2011 | | | 111.8 | |
| |
SMFG Consolidated | | | | |
Maximum | | ¥ | 129.7 | |
Minimum | | | 100.3 | |
Daily average | | | 113.8 | |
At March 31, 2011 | | | 114.1 | |
| Note: | For the fiscal year ended March 31, 2011, VaR for strategic equity investment is measured based on a one-day holding period and an observation period of four years. |
F-115
The market occasionally undergoes extreme fluctuations that exceed projections. Therefore, to manage market risk, it is important to run simulations of situations that may occur only once in many years, or so-called stress tests. To prepare for unexpected market swings, SMBC performs stress tests on a monthly basis based on various scenarios.
The limitations of the VaR methodology include the following:
| | • | | The use of historical data as a proxy for estimating future events may underestimate the probability of extreme market movements. Past market movement is not necessarily a good indicator of future events; |
| | • | | The use of a holding period assumes that all positions can be liquidated or hedged in that period of time. This assumption does not fully capture the market risk arising during periods of illiquidity, when liquidation or hedging in that period of time may not be possible; |
| | • | | The use of a confidence level neither takes account of, nor makes any statement about, any losses that might occur beyond this level of confidence; and |
| | • | | VaR does not capture all of the complex effects of the risk factors on the value of positions and portfolios and could underestimate potential losses. |
| | (c) | Additional information for the certain risks |
To supplement the above limitations of VaR methodologies, the SMFG Group adopts various indices to measure and monitor the sensitivity of interest rates, including delta, gamma and vega risks. The SMFG Group considers BPV as one of the most significant indices to manage interest rate risk. BPV is the amount of change in the value to the banking and trading book as a result of a one basis point (0.01%) movement in interest rates. The principal SMFG Group companies use BPV to monitor interest rate risk, not only on a net basis, but also by term to prevent the concentration of interest rate risk in a specific period. The table “Basel II (Pillar 2)—Outlier Ratio” presented below is one of the sensitivity analyses for interest rate risk concerning the banking book using the BPV approach. In addition, as previously addressed, the SMFG Group enhances the risk management methods of VaR and BPV by using them in combination with back-testing and stress tests.
Interest rate risk substantially changes depending on the method used for recognizing the expected maturity dates of demand deposits that can be withdrawn at any time, or the method used for estimating the timing of cancellation prior to maturity of time deposits and consumer housing loans. At SMBC, the maturity of demand deposits that are expected to be left with the bank for a prolonged period is regarded to be, at the longest, five years (2.5 years on average), and the cancellation prior to maturity of time deposits and consumer housing loans is estimated based on historical data.
Basel II (Pillar 2)—Outlier Ratio
A decline in economic value of SMBC on a consolidated basis as a result of a certain interest rate shock is measured as shown in the table below based on the Outlier Framework of Basel II. At March 31, 2012, the outlier ratio was less than 2.6% at SMBC (Consolidated), substantially below the 20% criterion. (In the event the economic value of a bank declines by more than 20% of the sum of Tier I and Tier II capital, or the outlier ratio, as a result of interest rate shocks, that bank would fall into the category of “outlier bank,” as stipulated under the Second Pillar of Basel II.)
F-116
Decline in economic value based on outlier framework:
| | | | | | | | |
| | | At March 31, | |
| | | 2012 | | | 2011 | |
| | | (In billions, except for percentages) | |
SMBC Consolidated | | | | | | | | |
Total | | ¥ | 240.2 | | | ¥ | 696.5 | |
Impact of Japanese yen interest rates | | | 144.3 | | | | 530.5 | |
Impact of U.S. dollar interest rates | | | 87.3 | | | | 141.9 | |
Impact of Euro interest rates | | | 1.3 | | | | 16.0 | |
Percentage of Tier I + Tier II | | | 2.6 | % | | | 7.8 | % |
Note: “Decline in economic value” is the decline of the present value of the banking portfolio after interest rate shocks (1st and 99th percentile of observed interest rate changes using a 1-year holding period and five years of observables).
| | (ii) | Foreign exchange risk |
The principal Group companies set risk limits for each currency to manage the concentration of the foreign currency position. The foreign exchange risk is immaterial as shown above in “VaR by risk category.”
| | (iii) | Strategic equity investment risk |
The SMFG Group establishes limits on allowable risk for strategic equity investments and monitors the observance of those limits to keep stock price fluctuation risk within acceptable parameters. SMBC has been reducing its strategic equity investments and the balance is within a permitted level which is less than 100% of the SMFG Group’s Tier I Capital.
Liquidity risk management process
To manage liquidity risk, the SMFG Group identifies group companies which have significant liquidity risk. Each identified group company establishes a fundamental risk management framework, which includes, but is not limited to, establishing risk limits, such as funding gap limits and contingency plans for liquidity management.
At SMBC, liquidity risk is regarded as one of the major risks. SMBC’s liquidity risk management is based on a framework consisting of setting funding gap limits, maintaining highly liquid supplementary funding sources and establishing contingency plans.
In order not to be overly dependent on short-term market-based funding to cover cash outflows, SMBC sets funding gap limits. The funding gap limits are set SMBC-wide and for each location, taking into account the cash flow plans, external environment, funding status, characteristics of local currency and other factors. Additionally, a risk limit is set by currency as needed to achieve more rigorous management.
To minimize the impact of a crisis on its funding, SMBC manages highly liquid supplementary funding sources, whereby it maintains high-quality liquid assets and has emergency borrowing facilities. High-quality liquid assets include Japanese government bonds, and U.S. Treasury and other U.S. government agencies bonds, which are included in “Investment securities” in the consolidated statement of financial position. For more information, see Note 9 “Investment Securities.”
For emergency situations, there are contingency plans in place for addressing the funding liquidity risk that include an action plan with measures for reducing the funding gap limits.
F-117
Maturity analysis of financial liabilities at March 31, 2012 and 2011
The following table shows a maturity analysis of the contractual undiscounted cash flows for financial liabilities at March 31, 2012 and 2011. The amount of interest on debt instruments is not included in the maturity table below due to its insignificance.
| | | | | | | | | | | | | | | | | | | | | | | | | | | | |
| | | At March 31, 2012 | |
| | | On
demand | | | Not later than
three months | | | Later than
three months
and not later
than one year | | | Later than
one year and
not later than
three years | | | Later than
three years
and not later
than five years | | | Later
than
five years | | | Total | |
| | | (In millions) | |
Non-derivative financial instruments: | | | | | | | | | | | | | | | | | | | | | | | | | | | | |
Deposits | | ¥ | 51,847,506 | | | ¥ | 21,088,198 | | | ¥ | 15,177,683 | | | ¥ | 3,453,331 | | | ¥ | 659,905 | | | ¥ | 629,844 | | | ¥ | 92,856,467 | |
Call money and bills sold | | | — | | | | 2,139,388 | | | | 5,212 | | | | — | | | | — | | | | — | | | | 2,144,600 | |
Repurchase agreements and cash collateral on securities lent | | | 1,253 | | | | 7,486,380 | | | | — | | | | — | | | | — | | | | — | | | | 7,487,633 | |
Trading liabilities | | | 2,173,567 | | | | — | | | | — | | | | — | | | | — | | | | — | | | | 2,173,567 | |
Borrowings | | | 59,464 | | | | 5,021,610 | | | | 2,072,646 | | | | 1,115,906 | | | | 564,724 | | | | 1,523,013 | | | | 10,357,363 | |
Debt securities in issue | | | — | | | | 2,640,819 | | | | 589,258 | | | | 901,001 | | | | 1,094,686 | | | | 2,173,461 | | | | 7,399,225 | |
Lease payable | | | — | | | | 5,658 | | | | 13,567 | | | | 22,696 | | | | 9,295 | | | | 5,608 | | | | 56,824 | |
Other financial liabilities | | | 1,113,301 | | | | 3,735,311 | | | | 18,907 | | | | 22,751 | | | | 16,410 | | | | 46,745 | | | | 4,953,425 | |
Off balance sheet items: | | | | | | | | | | | | | | | | | | | | | | | | | | | | |
Loan commitments | | | 44,064,283 | | | | — | | | | — | | | | — | | | | — | | | | — | | | | 44,064,283 | |
Financial guarantee contracts | | | 5,320,993 | | | | — | | | | — | | | | — | | | | — | | | | — | | | | 5,320,993 | |
| | | | | | | | | | | | | | | | | | | | | | | | | | | | |
Total non-derivative financial instruments | | ¥ | 104,580,367 | | | ¥ | 42,117,364 | | | ¥ | 17,877,273 | | | ¥ | 5,515,685 | | | ¥ | 2,345,020 | | | ¥ | 4,378,671 | | | ¥ | 176,814,380 | |
| | | | | | | | | | | | | | | | | | | | | | | | | | | | |
Derivative financial instruments | | ¥ | 5,850,813 | | | ¥ | — | | | ¥ | — | | | ¥ | — | | | ¥ | — | | | ¥ | — | | | ¥ | 5,850,813 | |
| | | | | | | | | | | | | | | | | | | | | | | | | | | | |
| |
| | | At March 31, 2011 | |
| | | On
demand | | | Not later than
three months | | | Later than
three months
and not later
than one year | | | Later than
one year and
not later than
three years | | | Later than
three years
and not later
than five years | | | Later
than
five years | | | Total | |
| | | (In millions) | |
Non-derivative financial instruments: | | | | | | | | | | | | | | | | | | | | | | | | | | | | |
Deposits | | ¥ | 50,117,768 | | | ¥ | 21,263,712 | | | ¥ | 13,740,997 | | | ¥ | 4,055,561 | | | ¥ | 722,662 | | | ¥ | 577,390 | | | ¥ | 90,478,090 | |
Call money and bills sold | | | 8,190 | | | | 2,621,091 | | | | 126 | | | | — | | | | — | | | | — | | | | 2,629,407 | |
Repurchase agreements and cash collateral on securities lent | | | 1,159 | | | | 6,438,439 | | | | — | | | | — | | | | — | | | | — | | | | 6,439,598 | |
Trading liabilities | | | 1,623,918 | | | | — | | | | — | | | | — | | | | — | | | | — | | | | 1,623,918 | |
Borrowings | | | 53,001 | | | | 3,673,282 | | | | 5,444,773 | | | | 1,081,747 | | | | 712,355 | | | | 1,517,316 | | | | 12,482,474 | |
Debt securities in issue | | | — | | | | 2,036,252 | | | | 271,899 | | | | 780,611 | | | | 879,728 | | | | 1,926,619 | | | | 5,895,109 | |
Lease payable | | | — | | | | 6,366 | | | | 16,872 | | | | 27,354 | | | | 11,240 | | | | 6,215 | | | | 68,047 | |
Other financial liabilities | | | 754,156 | | | | 3,199,918 | | | | 24,965 | | | | 22,688 | | | | 11,993 | | | | 49,300 | | | | 4,063,020 | |
Off balance sheet items: | | | | | | | | | | | | | | | | | | | | | | | | | | | | |
Loan commitments | | | 42,743,780 | | | | — | | | | — | | | | — | | | | — | | | | — | | | | 42,743,780 | |
Financial guarantee contracts | | | 4,810,931 | | | | — | | | | — | | | | — | | | | — | | | | — | | | | 4,810,931 | |
| | | | | | | | | | | | | | | | | | | | | | | | | | | | |
Total non-derivative financial instruments | | ¥ | 100,112,903 | | | ¥ | 39,239,060 | | | ¥ | 19,499,632 | | | ¥ | 5,967,961 | | | ¥ | 2,337,978 | | | ¥ | 4,076,840 | | | ¥ | 171,234,374 | |
| | | | | | | | | | | | | | | | | | | | | | | | | | | | |
Derivative financial instruments | | ¥ | 4,725,261 | | | ¥ | — | | | ¥ | — | | | ¥ | — | | | ¥ | — | | | ¥ | — | | | ¥ | 4,725,261 | |
| | | | | | | | | | | | | | | | | | | | | | | | | | | | |
| 1. | Embedded derivatives which are separately accounted for, but presented together with the host contract in the consolidated statement of financial position are not included in the contractual table above as they relate to the interest cash flow of the host contract, which are also not included in the table above. |
| 2. | Derivative financial instruments are recorded at fair value and included in the column “On demand.” These instruments are not used for hedging under IAS 39 and the fair value represents the cash flow on demand. |
F-118
Balance of loans and advances, and deposits at March 31, 2012 and 2011
The following table presents the balance of loans and advances, and deposits at March 31, 2012 and 2011. The balance of deposits, which was mainly composed of individual customer deposits at March 31, 2012 and 2011, exceeded the balance of loans and advances at the same time due to the stable deposit base in Japan.
| | | | | | | | |
| | | At March 31, | |
| | | 2012 | | | 2011 | |
| | | (In millions) | |
Loans and advances | | ¥ | 72,536,813 | | | ¥ | 71,020,329 | |
Deposits | | | 92,853,566 | | | | 90,469,098 | |
The following table presents a breakdown of deposits by domestic and foreign offices. Domestic inter-bank money was classified as “Call money and bills sold” and not included in “Deposits” in the consolidated statement of financial position. Over half of domestic deposits was composed of individual customer deposits.
| | | | | | | | |
| | | At March 31, | |
| | | 2012 | | | 2011 | |
| | | (In millions) | |
Domestic offices: | | | | | | | | |
Non-interest-bearing demand deposits | | ¥ | 13,424,217 | | | ¥ | 12,550,557 | |
Interest-bearing demand deposits | | | 34,344,937 | | | | 32,756,899 | |
Deposits at notice | | | 855,577 | | | | 1,131,082 | |
Time deposits | | | 25,118,371 | | | | 25,348,713 | |
Negotiable certificates of deposit | | | 5,327,488 | | | | 5,997,958 | |
Others | | | 3,786,138 | | | | 3,950,740 | |
| | | | | | | | |
Total domestic offices | | | 82,856,728 | | | | 81,735,949 | |
| | | | | | | | |
Foreign offices: | | | | | | | | |
Non-interest-bearing demand deposits | | | 410,624 | | | | 337,090 | |
Interest-bearing demand deposits | | | 804,527 | | | | 680,292 | |
Deposits at notice | | | 3,642,208 | | | | 3,800,310 | |
Time deposits | | | 1,745,146 | | | | 1,533,773 | |
Negotiable certificates of deposit | | | 3,266,150 | | | | 2,368,365 | |
Others | | | 128,183 | | | | 13,319 | |
| | | | | | | | |
Total foreign offices | | | 9,996,838 | | | | 8,733,149 | |
| | | | | | | | |
Total deposits | | ¥ | 92,853,566 | | | ¥ | 90,469,098 | |
| | | | | | | | |
Capital Management
The SMFG Group manages its capital by taking into consideration regulatory compliance and business development.
The SMFG Group’s capital management objectives are to maintain sufficient capital resources to meet the capital adequacy requirements and to maintain a strong capital base to support the development of its business.
External regulatory capital requirement
With regard to capital management, the SMFG Group, SMFG and its principal banking subsidiaries in Japan rigidly abide by the capital adequacy guidelines set by the Financial Services Agency of Japan (“FSA”). Japan’s capital adequacy guidelines are based on the Basel Capital Accord, which was proposed by the Basel Committee for uniform application to all banks which have international operations in industrialized countries. Japan’s
F-119
capital adequacy guidelines are different from those of central banks or supervisions of other countries because the FSA designed them to suit the Japanese banking environment. The capital adequacy guidelines mandate that Japanese banks and bank holding companies and banks that have international operations maintain a minimum capital ratio of 8%. The SMFG Group’s banking subsidiaries outside of Japan are also subject to the local capital ratio requirements.
The SMFG Group’s capital is classified into three tiers, referred to as core capital (Tier I), supplementary capital (Tier II) and junior supplementary capital (Tier III) as follows:
Tier I: Core capital generally consists of stockholders’ equity including retained earnings less any recorded goodwill.
Tier II: Supplementary capital generally consists of (1) the general reserve for possible loan losses (subject to a limit of 1.25% of total risk-weighted assets and off-balance sheet exposures), (2) 45% of (a) the unrealized gains on investments in “investment securities” (i.e., investment securities that are not those held for trading purposes, held-to-maturity bonds or shares in subsidiaries, or certain associates), (b) the unrealized appreciation on land, (3) the balance of subordinated perpetual debt and (4) the balance of subordinated term debt with an original maturity of over five years and limited life preferred equity (up to a maximum of 50% of core capital).
Tier III: Junior supplementary capital consists of the balance of subordinated term debt with an original maturity of at least two years. Junior supplementary capital may be counted, subject to certain conditions, according to the amount of market risk or the amount of core capital.
Supplementary capital may be counted up to the amount equivalent to core capital (less junior supplementary capital in case market risk is counted in the capital ratio calculation).
The capital adequacy guidelines permit Japanese banks to choose from the standardized approach, the foundation Internal Ratings-Based (“IRB”) approach and the advanced IRB approach as to credit-risk, and the basic indicator approach, the standardized approach (“TSA”) and the Advanced Measurement Approach (“AMA”) as to operational risk. To be eligible to adopt the foundation IRB approach or the advanced IRB approach as to credit risk, and TSA or AMA as to operational risk, a Japanese bank must have established advanced risk management systems and must receive advance approval from the FSA.
Adopting these approved approaches, the SMFG Group sets a target minimum standard risk-weighted capital ratio of 8.0% (at least half of which must consist of core capital (Tier I), or a risk-weighted core capital ratio of 4.0%) on the SMFG Group’s consolidated basis, and both SMBC consolidated and nonconsolidated basis, and has complied with all externally imposed capital requirements throughout the period.
Failure of a Japanese bank, bank holding company or other financial institution to maintain the required risk-weighted capital ratios, may result in administrative actions or sanctions imposed by the FSA.
F-120
Regulatory capital
The table below presents the SMFG Group’s total qualifying capital, risk-weighted assets and risk-weighted capital ratios at March 31, 2012 and 2011. Credit risk exposures from balance sheet and off-balance sheet assets under Japanese GAAP are measured based on credit risk quantification parameters, such as PD and LGD. Risk-based capital in the consolidated financial statements prepared under Japanese GAAP is classified into core capital (Tier I capital), supplementary capital (Tier II capital) and junior supplementary capital (Tier III capital).
| | | | | | | | |
| | | At March 31, | |
| | | 2012 | | | 2011 | |
| | | (In millions, except percentages) | |
Tier I capital: | | | | | | | | |
Capital stock | | ¥ | 2,337,895 | | | ¥ | 2,337,895 | |
Capital surplus | | | 759,800 | | | | 978,851 | |
Retained earnings | | | 2,152,654 | | | | 1,776,433 | |
Treasury stock | | | (236,037 | ) | | | (171,760 | ) |
Minority interests | | | 2,030,638 | | | | 2,029,481 | |
Cash dividends to be paid | | | (68,230 | ) | | | (73,612 | ) |
Unrealized losses on other securities | | | — | | | | — | |
Foreign currency translation adjustments | | | (141,382 | ) | | | (122,889 | ) |
Stock acquisition rights | | | 692 | | | | 262 | |
Goodwill and others | | | (496,434 | ) | | | (394,343 | ) |
Gains on securitization transactions | | | (38,284 | ) | | | (36,324 | ) |
Amount equivalent to 50% of expected losses in excess of qualifying reserves | | | (29,052 | ) | | | — | |
Deductions of deferred tax assets(1) | | | — | | | | — | |
| | | | | | | | |
Total Tier I capital | | | 6,272,260 | | | | 6,323,995 | |
| | | | | | | | |
Tier II capital: | | | | | | | | |
Unrealized gains on other securities after 55% discount | | | 214,611 | | | | 169,267 | |
Land revaluation excess after 55% discount | | | 35,755 | | | | 35,739 | |
General reserve for possible loan losses | | | 66,695 | | | | 100,023 | |
Excess amount of provisions | | | — | | | | 21,742 | |
Subordinated debt | | | 2,454,062 | | | | 2,210,184 | |
| | | | | | | | |
Total Tier II capital | | | 2,771,125 | | | | 2,536,958 | |
| | | | | | | | |
Deductions | | | (399,634 | ) | | | (428,082 | ) |
| | | | | | | | |
Total qualifying capital | | ¥ | 8,643,751 | | | ¥ | 8,432,871 | |
| | | | | | | | |
Risk-weighted assets: | | | | | | | | |
On-balance sheet items | | | 38,150,731 | | | | 38,985,243 | |
Off-balance sheet items | | | 7,825,808 | | | | 7,433,319 | |
Market risk items | | | 1,174,187 | | | | 584,020 | |
Operational risk | | | 3,892,505 | | | | 3,691,113 | |
| | | | | | | | |
Total risk-weighted assets | | ¥ | 51,043,232 | | | ¥ | 50,693,696 | |
| | | | | | | | |
Tier I risk-weighted capital ratio | | | 12.28 | % | | | 12.47 | % |
Total risk-weighted capital ratio | | | 16.93 | % | | | 16.63 | % |
| (1) | The amount of net deferred tax assets was ¥350,182 million and ¥624,219 million at March 31, 2012 and 2011, respectively. Also, the upper limit of the inclusion of deferred tax assets into Tier I capital was ¥1,254,452 million and ¥1,264,799 million at March 31, 2012 and 2011, respectively. |
| (2) | Amounts less than ¥1 million have been omitted in the table of Regulatory Capital. As a result, the totals in Japanese yen shown in the above table do not necessarily agree with the sum of the individual amounts. |
F-121
The SMFG Group’s consolidated capital ratio at March 31, 2012 was 16.93%, 0.30 percentage points higher than 16.63% at March 31, 2011. Total capital, which is the numerator in the capital ratio calculation equation, amounted to ¥8,644 billion at March 31, 2012, which was ¥211 billion higher than ¥8,433 billion at March 31, 2011. This was due primarily to the result of recording of net income for the fiscal year.
Risk-weighted assets, the denominator in the equation, amounted to ¥51,043 billion, which was ¥349 billion higher than ¥50,694 billion at March 31, 2011, due mainly to the increase of market risk items.
| 46 | RELATED-PARTY TRANSACTIONS |
Transactions with Related Parties
The SMFG Group considers that its related parties include subsidiaries, associates, joint ventures, key management personnel and close family members of key management personnel. Any transactions between the SMFG Group and its subsidiaries meet the definition of related-party transactions. However, because these transactions are eliminated on consolidation, they are not disclosed as related-party transactions. Transactions between the SMFG Group and its associates and joint ventures qualify as related-party transactions, and all of these transactions are conducted on substantially the same terms as third-party transactions.
The transaction amounts included in the accounts, in aggregate, by category of related party were as follows:
Transactions with associates and joint ventures
| | | | | | | | |
| | | At March 31, | |
| | | 2012 | | | 2011 | |
| | | (In millions) | |
Assets: | | | | | | | | |
Loans and advances | | ¥ | 218,809 | | | ¥ | 534,057 | |
Others | | | 2,235 | | | | 1,377 | |
| | |
Liabilities: | | | | | | | | |
Deposits | | ¥ | 147,902 | | | ¥ | 251,302 | |
Others | | | 7,764 | | | | 24,994 | |
| | | | | | | | | | | | |
| | | For the fiscal year ended March 31, | |
| | | 2012 | | | 2011 | | | 2010 | |
| | | (In millions) | |
Income statement: | | | | | | | | | | | | |
Income (interest income, and fee and commission income) | | ¥ | 27,179 | | | ¥ | 33,715 | | | ¥ | 59,810 | |
Expense (interest expense and other expenses) | | | 33,981 | | | | 37,125 | | | | 45,778 | |
Loan commitments to associates and joint ventures at March 31, 2012 and 2011 were ¥189,888 million and ¥166,777 million, respectively.
Financial guarantees received from associates and joint ventures at March 31, 2012 and 2011 were nil and ¥18,834 million, respectively.
F-122
Transactions with key management personnel and their close family members
Key management personnel are those persons having authority and responsibility for planning, directing and controlling the activities of the SMFG Group, directly or indirectly. The SMFG Group considers the members of the Board of Directors of SMFG and SMBC to constitute key management personnel for the purpose of this disclosure required under IAS 24 “Related Party Disclosures.”
| | | | | | | | |
| | | At March 31, | |
| | | 2012 | | | 2011 | |
| | | (In millions) | |
Assets: | | | | | | | | |
Loans and advances | | ¥ | 2 | | | ¥ | 2 | |
| | |
Liabilities: | | | | | | | | |
Deposits | | ¥ | 1,130 | | | ¥ | 994 | |
Others | | | 125 | | | | 62 | |
Compensation of Key Management Personnel
The following table presents the compensation expenses of key management personnel.
| | | | | | | | | | | | |
| | | For the fiscal year ended March 31, | |
| | | 2012 | | | 2011 | | | 2010 | |
| | | (In millions) | |
Short-term employee benefits | | ¥ | 1,141 | | | ¥ | 1,039 | | | ¥ | 607 | |
Retirement benefits | | | — | | | | 94 | | | | 312 | |
Share-based compensation | | | 182 | | | | 135 | | | | 22 | |
SMFG and SMBC introduced a stock option compensation plan for their directors, corporate auditors and executive officers in connection with the abolition of their retirement benefit plan based on the shareholders’ approval at the general meeting of shareholders held in June 2010. The details of the stock option compensation plan are described in Note 40 “Share-Based Payment.”
There were no other long-term benefits and termination benefits for the fiscal years ended March 31, 2012, 2011 and 2010.
F-123
Principal Subsidiaries
The SMFG Group’s principal subsidiaries at March 31, 2012 are shown in the list below. The SMFG Group consolidates all entities over which the SMFG Group controls, or has the power to govern the financial and operating policies so as to obtain benefits from their activities.
Principal domestic subsidiaries
| | | | | | | | | | |
Company Name | | Proportion
of Ownership
Interest | | | Proportion
of Voting Rights | | | Main Business |
| | | (%) | | | (%) | | | |
Sumitomo Mitsui Banking Corporation | | | 100.0 | | | | 100.0 | | | Commercial banking |
THE MINATO BANK, LTD. | | | 6.0 | | | | 46.4 | (1) | | Commercial banking |
Kansai Urban Banking Corporation | | | 59.8 | | | | 60.2 | | | Commercial banking |
The Japan Net Bank, Limited | | | 41.1 | (2) | | | 61.4 | | | Internet banking |
SMBC Guarantee Co., Ltd. | | | 100.0 | | | | 100.0 | | | Credit guarantee |
SMBC Friend Securities Co., Ltd. | | | 100.0 | | | | 100.0 | | | Securities |
SMBC Nikko Securities Inc. | | | 100.0 | | | | 100.0 | | | Securities |
Sumitomo Mitsui Finance and Leasing Company, Limited | | | 60.0 | | | | 60.0 | | | Leasing |
Sumitomo Mitsui Card Company, Limited | | | 65.9 | | | | 65.9 | | | Credit card |
Cedyna Financial Corporation | | | 100.0 | | | | 100.0 | | | Credit card |
SAKURA CARD CO., LTD. | | | 95.7 | | | | 95.7 | | | Credit card |
Promise Co., Ltd.(3) | | | 97.7 | | | | 97.7 | | | Consumer finance |
ORIX Credit Corporation(4) | | | 50.9 | | | | 50.9 | | | Consumer finance |
SMM Auto Finance, Inc. | | | 56.0 | | | | 56.0 | | | Automobile sales finance |
Japan Pension Navigator Co., Ltd. | | | 69.7 | | | | 69.7 | | | Operational management of defined contribution pension plans |
SMBC Venture Capital Co., Ltd. | | | 40.0 | | | | 40.0 | | | Venture capital |
SMBC Consulting Co., Ltd. | | | 100.0 | | | | 100.0 | | | Management consulting and information services |
SMBC Finance Service Co., Ltd. | | | 100.0 | | | | 100.0 | | | Loans, factoring and collecting agent |
Financial Link Co., Ltd. | | | 100.0 | | | �� | 100.0 | | | Data processing service and consulting |
The Japan Research Institute, Limited | | | 100.0 | | | | 100.0 | | | System development, data processing, management consulting and economic research |
SAKURA KCS Corporation | | | 50.2 | | | | 50.2 | | | System engineering and data processing |
| (1) | The SMFG Group has a 6.0% direct holding in THE MINATO BANK, LTD., and can control further 40.4% of the voting rights held by SMBC’s retirement benefit trust under contractual agreements between SMBC and the retirement benefit trust. |
| (2) | The SMFG Group’s ownership interest in The Japan Net Bank, Limited is 41.1%, which is different from its proportion of voting rights, because The Japan Net Bank, Limited issued non-voting shares. |
| (3) | On April 1, 2012, the SMFG Group conducted a share exchange for the shares of common stock of Promise Co., Ltd. which SMFG did not own, and Promise Co., Ltd. became a wholly-owned subsidiary of the SMFG Group. On July 1, 2012, Promise Co., Ltd. changed its trade name to SMBC Consumer Finance Co., Ltd. |
| (4) | On June 29, 2012, SMBC transferred all of its shares of ORIX Credit Corporation to ORIX Corporation and, as a result, ORIX Credit Corporation is no longer the SMFG Group’s subsidiary. |
F-124
Principal foreign subsidiaries
| | | | | | | | | | | | |
Company Name | | Country of
Incorporation | | Proportion
of Ownership
Interest | | | Proportion
of Voting
Rights | | | Main Business |
| | | | | (%) | | | (%) | | | |
Sumitomo Mitsui Banking Corporation Europe Limited | | U.K. | | | 100.0 | | | | 100.0 | | | Commercial banking |
Sumitomo Mitsui Banking Corporation (China) Limited | | China | | | 100.0 | | | | 100.0 | | | Commercial banking |
Manufacturers Bank | | U.S.A. | | | 100.0 | | | | 100.0 | | | Commercial banking |
Sumitomo Mitsui Banking Corporation of Canada | | Canada | | | 100.0 | | | | 100.0 | | | Commercial banking |
Banco Sumitomo Mitsui Brasileiro S.A. | | Brazil | | | 100.0 | | | | 100.0 | | | Commercial banking |
ZAO Sumitomo Mitsui Rus Bank | | Russia | | | 100.0 | | | | 100.0 | | | Commercial banking |
PT Bank Sumitomo Mitsui Indonesia | | Indonesia | | | 98.4 | | | | 98.4 | | | Commercial banking |
Sumitomo Mitsui Banking Corporation Malaysia Berhad | | Malaysia | | | 100.0 | | | | 100.0 | | | Commercial banking |
SMBC Nikko Securities America, Inc. | | U.S.A. | | | 100.0 | | | | 100.0 | | | Securities |
SMBC Nikko Capital Markets Limited | | U.K. | | | 100.0 | | | | 100.0 | | | Securities |
SMBC Leasing and Finance, Inc. | | U.S.A. | | | 100.0 | | | | 100.0 | | | Leasing |
SMBC Capital Markets, Inc. | | U.S.A. | | | 100.0 | | | | 100.0 | | | Derivatives and investments |
THE MINATO BANK, LTD. and SMBC Venture Capital Co., Ltd. are accounted for as subsidiaries, despite the SMFG Group’s holdings of less than 50% of the voting rights, because the SMFG Group is able to govern the financial and operating policies of these companies under a statute or an agreement, or by delegating the majority of the members of the board of directors.
The SMFG Group does not control some entities despite the fact that the SMFG Group holds more than 50% of their share capital, because the SMFG Group has entered into agreements with other investors to share or give those investors the power to govern the entities’ financial and operating policies over these investees.
Some of the SMFG Group’s subsidiaries may be subject to restrictions on the ability to transfer funds to SMFG in the form of cash dividends or to repay loans or advances, which include capital adequacy requirements imposed by the governments and central banks, and the Companies Act restrictions relating to dividends.
Fiscal Year Ended March 31, 2012
Promise Co., Ltd (currently SMBC Consumer Finance Co., Ltd.)
On December 7, 2011, the SMFG Group purchased 91,020,096 shares of Promise common stock through a tender offer and made Promise a consolidated subsidiary of the SMFG Group. Promise conducts a consumer loan business that consists mainly of unsecured loans to individuals. By making Promise a consolidated subsidiary, the SMFG Group sought to reinforce its consumer finance business, to enhance its earnings generation capacity, and to effectively achieve the expansion of its consumer finance business centered on Promise. Before the tender offer, the SMFG Group held 22.0% of the voting rights of Promise and accounted for Promise as an associate. As a result of the tender offer, the SMFG Group’s proportion of voting rights of Promise increased to 93.8%, and the SMFG Group obtained control of Promise.
F-125
The fair values of Promise’s assets and liabilities at the date of acquisition and the consideration paid were as follows:
| | | | |
| | | At December 7, 2011 | |
| | | (In millions) | |
Assets:(1) | | | | |
Loans and advances | | ¥ | 799,902 | |
All other assets | | | 241,348 | |
| | | | |
Total assets | | ¥ | 1,041,250 | |
| | | | |
Liabilities(1) | | ¥ | 1,002,804 | |
| | | | |
Net assets | | ¥ | 38,446 | |
Non-controlling interests measured at their proportionate share of the identifiable net assets | | | (2,443 | ) |
| | | | |
Net assets acquired | | | 36,003 | |
Goodwill | | | 56,692 | |
| | | | |
Consideration | | ¥ | 92,695 | |
| | | | |
Consideration: | | | | |
Cash | | ¥ | 70,996 | |
Fair value of the equity interest in Promise held before the acquisition | | | 21,699 | |
| | | | |
Total | | ¥ | 92,695 | |
| | | | |
Acquisition related costs recognized as an expense in “General and administrative expenses” in the consolidated income statement | | ¥ | 344 | |
| | | | |
| (1) | The fair value of Promise’s assets and liabilities at the date of acquisition included the outstanding balance arising from the transactions made between the SMFG Group and Promise before the acquisition, which included deposit amounting to ¥30 billion accepted from and loans amounting to ¥267 billion made to Promise. |
The fair value of the financial assets acquired included ¥807,811 million of loans and receivables to customers. The gross contractual amounts receivable were ¥830,356 million, of which ¥73,539 million were expected to be uncollectible.
The goodwill was attributable to the profitability of the acquired business and the synergies expected to arise after the acquisition. None of the goodwill recognized was expected to be deductible for income tax purposes.
As a result of remeasuring the previously held interest to fair value, the SMFG Group recognized a gain of ¥25,827 million, which was included in “Other income” in the consolidated income statement.
Promise’s net profit from the acquisition date to March 31, 2012 was ¥11,675 million.
Pro forma financial information
It was estimated that the SMFG Group would have reported a total operating income of ¥2,932,742 million and a net profit of ¥299,923 million for the fiscal year ended March 31, 2012, if the acquisition of Promise had occurred on April 1, 2011.
F-126
Cash and cash equivalents acquired by obtaining control of subsidiaries
The total amount of cash consideration paid and cash acquired by obtaining control of subsidiaries during the fiscal year ended March 31, 2012 were as follows:
| | | | |
| | | For the fiscal year
ended March 31,
2012 | |
| | | (In millions) | |
Cash consideration paid | | ¥ | (70,996 | ) |
Cash and cash equivalents acquired as a result of the acquisitions | | | 23,888 | |
| | | | |
Cash consideration paid, net of cash and cash equivalents acquired by obtaining control of the subsidiaries | | ¥ | (47,108 | ) |
| | | | |
The amounts of assets and liabilities other than cash or cash equivalents in these subsidiaries were ¥1,017,362 million and ¥1,002,804 million respectively.
Fiscal Year Ended March 31, 2011
Cedyna Financial Corporation
On May 31, 2010, the SMFG Group subscribed for all the new stock issued by Cedyna Financial Corporation (“Cedyna”) by way of a third-party allotment and made Cedyna a consolidated subsidiary of the SMFG Group. Cedyna conducts credit card business, shopping credit business and certain other businesses. By making Cedyna a consolidated subsidiary, the SMFG Group sought to further accelerate and make a stable promotion of its credit card business strategy. Before the subscription, the SMFG Group held a 48.0% interest in Cedyna and accounted for it as an associate. As a result of this transaction, the SMFG Group’s interest in Cedyna increased to 68.8% and the SMFG Group obtained control of Cedyna.
The fair values of Cedyna’s assets and liabilities at the date of acquisition and the consideration paid were as follows:
| | | | |
| | | At May 31,
2010 | |
| | | (In millions) | |
Assets: | | | | |
Loans and advances | | ¥ | 1,351,126 | |
All other assets | | | 356,618 | |
| | | | |
Total assets | | ¥ | 1,707,744 | |
| | | | |
| | | | |
Liabilities | | ¥ | 1,590,043 | |
| | | | |
| | | | |
Net assets | | ¥ | 117,701 | |
Non-controlling interests measured at their proportionate share of the identifiable net assets | | | (36,799 | ) |
| | | | |
Net assets acquired | | | 80,902 | |
Goodwill | | | 5,000 | |
| | | | |
Consideration | | ¥ | 85,902 | |
| | | | |
Consideration: | | | | |
Cash | | ¥ | 50,000 | |
Fair value of the equity interest in Cedyna held before the acquisition | | | 35,902 | |
| | | | |
Total | | ¥ | 85,902 | |
| | | | |
Acquisition related costs recognized as an expense in “General and administrative expenses” in the consolidated income statement | | ¥ | 203 | |
| | | | |
F-127
The fair value of the financial assets acquired included ¥1,358,546 million of loans and receivables. The gross contractual amounts receivable were ¥1,445,213 million, of which ¥99,477 million were expected to be uncollectible.
The goodwill was attributable to the synergies expected to be achieved by collaboration between Cedyna and SMBC mainly in Cedyna’s shopping credit business, and solutions business, and collaboration between Cedyna and SMCC in their credit card businesses. None of the goodwill recognized was expected to be deductible for income tax purposes.
As a result of remeasuring the previously held interest to fair value, the SMFG Group recognized a gain of ¥14,480 million, which was included in “Other income” in the consolidated income statement.
Cedyna’s net loss from the acquisition date to March 31, 2011 was ¥37,340 million.
Pro forma financial information
It was estimated that the SMFG Group would have reported a total operating income of ¥2,943,845 million and a net profit of ¥570,741 million for the fiscal year ended March 31, 2011, if the acquisition of Cedyna had occurred on April 1, 2010.
Cash and cash equivalents acquired by obtaining control of the subsidiaries
The total amount of cash consideration paid and cash acquired by obtaining control of Cedyna and other immaterial subsidiaries during the fiscal year ended March 31, 2011 were as follows:
| | | | |
| | | For the fiscal year
ended March 31,
2011 | |
| | | (In millions) | |
Cash consideration paid | | ¥ | (62,899 | ) |
Cash and cash equivalents acquired as a result of the acquisitions | | | 145,672 | |
| | | | |
Cash and cash equivalents acquired by obtaining control of the subsidiaries, net of cash consideration paid | | ¥ | 82,773 | |
| | | | |
The amount of assets and liabilities other than cash or cash equivalents in these subsidiaries including Cedyna were ¥1,685,881 million and ¥1,666,916 million respectively.
Fiscal Year Ended March 31, 2010
The SMFG Group finalized several acquisitions that were accounted for as business combinations during the fiscal year ended March 31, 2010. Of these transactions, the acquisitions of Nikko Cordial Securities Inc. (“Nikko Cordial Securities”) and THE BIWAKO BANK, LIMITED (“Biwako Bank”) were individually significant and are, therefore, presented separately. The other business combinations, which were not individually significant, are presented in the aggregate.
Nikko Cordial Securities Inc. (currently SMBC Nikko Securities Inc.)
On October 1, 2009, the SMFG Group acquired 100.0% of the voting rights of Nikko Cordial Securities, which comprises the retail securities business of the former Nikko Cordial Securities, the domestic debt and equity underwriting businesses of the former Nikko Citigroup, and certain other related businesses. Nikko Cordial Securities changed its trade name to SMBC Nikko Securities Inc. on April 1, 2011.
F-128
The fair values of Nikko Cordial Securities’ assets and liabilities at the date of acquisition and the consideration paid were as follows:
| | | | | | | | | | | | |
| | | At October 1, 2009 | |
| | | Carrying
amounts before
the acquisition | | | Adjustments to
fair value | | | Fair value | |
| | | (In millions) | |
Assets: | | | | | | | | | | | | |
Trading assets | | ¥ | 644,252 | | | ¥ | — | | | ¥ | 644,252 | |
Intangible assets | | | 38,759 | | | | 116,040 | | | | 154,799 | |
All other assets | | | 1,390,097 | | | | 1,623 | | | | 1,391,720 | |
| | | | | | | | | | | | |
Total assets | | ¥ | 2,073,108 | | | ¥ | 117,663 | | | ¥ | 2,190,771 | |
| | | | | | | | | | | | |
| | | |
Liabilities: | | | | | | | | | | | | |
Borrowing | | ¥ | 333,091 | | | ¥ | — | | | ¥ | 333,091 | |
All other liabilities | | | 1,450,678 | | | | 2,631 | | | | 1,453,309 | |
| | | | | | | | | | | | |
Total liabilities | | ¥ | 1,783,769 | | | ¥ | 2,631 | | | ¥ | 1,786,400 | |
| | | | | | | | | | | | |
Net assets | | | | | | | | | | ¥ | 404,371 | |
Non-controlling interests | | | | | | | | | | | (711 | ) |
| | | | | | | | | | | | |
Net assets acquired | | | | | | | | | | | 403,660 | |
Goodwill | | | | | | | | | | | 164,440 | |
| | | | | | | | | | | | |
Consideration | | | | | | | | | | ¥ | 568,100 | |
| | | | | | | | | | | | |
Consideration: | | | | | | | | | | | | |
Cash | | | | | | | | | | ¥ | 565,155 | |
Costs directly attributable to the acquisition | | | | | | | | | | | 2,945 | |
| | | | | | | | | | | | |
Total | | | | | | | | | | ¥ | 568,100 | |
| | | | | | | | | | | | |
The goodwill was attributable to the profitability of the acquired business and the synergies expected to arise after the acquisition.
Nikko Cordial Securities’ net profit from the acquisition date to March 31, 2010 was ¥9,152 million.
THE BIWAKO BANK, LIMITED
On March 1, 2010, Kansai Urban Banking Corporation (“KUBC”), a subsidiary of the SMFG Group, merged with Biwako Bank. Biwako Bank operated a retail banking business in the Kansai area. As a result of this merger, the SMFG Group held 56.4% of the voting rights or a 56.1% interest in KUBC, which was the merged company.
F-129
The fair values of Biwako Bank’s assets and liabilities at the date of acquisition and the consideration paid were as follows:
| | | | | | | | | | | | |
| | | At March 1, 2010 | |
| | | Carrying
amounts before
the acquisition | | | Adjustments to
fair value | | | Fair value | |
| | | (In millions) | |
Assets: | | | | | | | | | | | | |
Loans and advances | | ¥ | 805,980 | | | ¥ | 5,022 | | | ¥ | 811,002 | |
Intangible assets | | | 1,128 | | | | 3,848 | | | | 4,976 | |
All other assets | | | 296,473 | | | | (6,438 | ) | | | 290,035 | |
| | | | | | | | | | | | |
Total assets | | ¥ | 1,103,581 | | | ¥ | 2,432 | | | ¥ | 1,106,013 | |
| | | | | | | | | | | | |
| | | |
Liabilities: | | | | | | | | | | | | |
Deposits | | ¥ | 1,030,994 | | | ¥ | 2,263 | | | ¥ | 1,033,257 | |
All other liabilities | | | 73,500 | | | | 1,858 | | | | 75,358 | |
| | | | | | | | | | | | |
Total liabilities | | ¥ | 1,104,494 | | | ¥ | 4,121 | | | ¥ | 1,108,615 | |
| | | | | | | | | | | | |
Net assets | | | | | | | | | | ¥ | (2,602 | ) |
Non-controlling interests | | | | | | | | | | | (208 | ) |
| | | | | | | | | | | | |
Net assets acquired | | | | | | | | | | | (2,810 | ) |
Goodwill | | | | | | | | | | | 10,787 | |
| | | | | | | | | | | | |
Consideration | | | | | | | | | | ¥ | 7,977 | |
| | | | | | | | | | | | |
Consideration: | | | | | | | | | | | | |
Fair value of consideration transferred | | | | | | | | | | ¥ | 5,610 | |
Equity interest held before the acquisition | | | | | | | | | | | 2,030 | |
Costs directly attributable to the acquisition | | | | | | | | | | | 337 | |
| | | | | | | | | | | | |
Total | | | | | | | | | | ¥ | 7,977 | |
| | | | | | | | | | | | |
The fair value of consideration transferred represents the fair value of the reduction of the SMFG Group’s interest in KUBC. The SMFG Group’s interest in KUBC reduced from 63.8% to 56.1% as a result of a stock issuance by KUBC to the shareholders of Biwako Bank at the business combination. This reduction in interest was measured based on the listed stock price of KUBC at the time of the acquisition.
The goodwill was attributable to the synergies expected to arise after the acquisition and the profitability by becoming a regional bank with a broader operational base in the Kansai area.
It is impracticable to disclose the profit or loss of the acquired Biwako Bank from the acquisition date to March 31, 2010. The acquired business has been integrated into the corresponding existing KUBC’s business lines and there is no reliable basis for allocating post-acquisition results between KUBC and Biwako Bank.
Other business combinations
The aggregate amounts of total assets and liabilities acquired through other business combinations, which were not individually significant, were ¥449,343 million and ¥403,001 million, respectively. Goodwill of ¥3,918 million was recognized. The SMFG Group acquired between 50.9% and 95.0% of interests in the acquirees. The total consideration transferred, including equity interest held before the acquisitions and costs directly attributed to the acquisitions, was ¥28,086 million.
F-130
Pro forma financial information
It was estimated that the SMFG Group would have reported a total operating income of ¥2,880,766 million and a net profit of ¥660,437 million for the fiscal year ended March 31, 2010, if the acquisition had occurred on April 1, 2009.
Cash consideration paid
The total amount of cash consideration paid and cash acquired by obtaining control of Nikko Cordial Securities, Biwako Bank and other immaterial subsidiaries during the fiscal year ended March 31, 2010 was as follows:
| | | | |
| | | For the fiscal year
ended March 31,
2010 | |
| | | (In millions) | |
Cash consideration paid | | ¥ | (595,728 | ) |
Cash and cash equivalents acquired as a result of the acquisitions | | | 371,790 | |
| | | | |
Cash consideration paid, net of cash and cash equivalents acquired by obtaining control of the subsidiaries | | ¥ | (223,938 | ) |
| | | | |
The amounts of assets and liabilities other than cash or cash equivalents in these subsidiaries, including Nikko Cordial Securities and Biwako Bank, were ¥3,374,337 million and ¥3,298,016 million, respectively.
After the Fiscal Year Ended March 31, 2012
SMBC Aviation Capital
On June 1, 2012, the SMFG Group acquired an aircraft leasing business of The Royal Bank of Scotland Group plc, and commenced its operation as SMBC Aviation Capital, in order to further expand and develop the business in Asia and other emerging markets together with the existing aircraft leasing unit. Companies engaged in the acquired aircraft leasing business are SMBC Aviation Capital Limited (former RBS Aerospace Limited), SMBC Aviation Capital (UK) Limited (former RBS Aerospace (UK) Limited), and SMBC Aviation Capital (Australia) Pty Limited (former RBS Australia Leasing Pty Limited), and the SMFG Group obtained 90% of the voting rights of these companies.
Further information could not be disclosed as the initial accounting for the business combination is yet to be finalized due to proximity of the acquisition date to the date of authorization for issue of the consolidated financial statements.
F-131
| 49 | CURRENT AND NON-CURRENT DISTINCTION |
The following tables present an analysis of financial assets and liabilities, excluding cash and deposits with banks, trading assets and liabilities, and derivative financial instruments, by amounts recovered or settled, not more than twelve months or more than twelve months, at March 31, 2012 and 2011.
| | | | | | | | | | | | |
| | | At March 31, 2012 | |
| | | Amounts recovered or settled | | | | |
| | | Not more than
twelve months | | | More than twelve
months | | | Total | |
| | | (In millions) | |
Assets: | | | | | | | | | | | | |
Call loans and bills bought | | ¥ | 1,269,932 | | | ¥ | 27,150 | | | ¥ | 1,297,082 | |
Reverse repurchase agreements and cash collateral on securities borrowed | | | 4,937,025 | | | | — | | | | 4,937,025 | |
Financial assets at fair value through profit or loss | | | — | | | | 2,150,409 | | | | 2,150,409 | |
Investment securities: | | | | | | | | | | | | |
Held-to-maturity investments | | | 308,719 | | | | 4,968,549 | | | | 5,277,268 | |
Available-for-sale financial assets | | | 7,812,712 | | | | 24,234,120 | | | | 32,046,832 | |
Loans and advances | | | 25,083,461 | | | | 47,453,352 | | | | 72,536,813 | |
Other financial assets | | | 1,773,895 | | | | 125,537 | | | | 1,899,432 | |
| | | |
Liabilities: | | | | | | | | | | | | |
Deposits | | ¥ | 88,113,456 | | | ¥ | 4,740,110 | | | ¥ | 92,853,566 | |
Call money and bills sold | | | 2,144,600 | | | | — | | | | 2,144,600 | |
Repurchase agreements and cash collateral on securities lent | | | 7,487,633 | | | | — | | | | 7,487,633 | |
Borrowings | | | 7,172,200 | | | | 3,240,658 | | | | 10,412,858 | |
Debt securities in issue | | | 3,211,321 | | | | 4,166,421 | | | | 7,377,742 | |
Other financial liabilities | | | 4,867,519 | | | | 85,906 | | | | 4,953,425 | |
| | | | | | | | | | | | |
| | | At March 31, 2011 | |
| | | Amounts recovered or settled | | | | |
| | | Not more than
twelve months | | | More than twelve
months | | | Total | |
| | | (In millions) | |
Assets: | | | | | | | | | | | | |
Call loans and bills bought | | ¥ | 853,669 | | | ¥ | 8,998 | | | ¥ | 862,667 | |
Reverse repurchase agreements and cash collateral on securities borrowed | | | 5,051,053 | | | | — | | | | 5,051,053 | |
Financial assets at fair value through profit or loss | | | 4 | | | | 2,132,344 | | | | 2,132,348 | |
Investment securities: | | | | | | | | | | | | |
Held-to-maturity investments | | | 165,254 | | | | 4,016,586 | | | | 4,181,840 | |
Available-for-sale financial assets | | | 13,018,155 | | | | 17,462,111 | | | | 30,480,266 | |
Loans and advances | | | 25,092,282 | | | | 45,928,047 | | | | 71,020,329 | |
Other financial assets | | | 1,373,634 | | | | 122,775 | | | | 1,496,409 | |
| | | |
Liabilities: | | | | | | | | | | | | |
Deposits | | ¥ | 85,122,536 | | | ¥ | 5,346,562 | | | ¥ | 90,469,098 | |
Call money and bills sold | | | 2,629,407 | | | | — | | | | 2,629,407 | |
Repurchase agreements and cash collateral on securities lent | | | 6,439,598 | | | | — | | | | 6,439,598 | |
Borrowings | | | 9,193,156 | | | | 3,355,202 | | | | 12,548,358 | |
Debt securities in issue | | | 2,308,077 | | | | 3,582,311 | | | | 5,890,388 | |
Other financial liabilities | | | 3,979,039 | | | | 83,981 | | | | 4,063,020 | |
F-132
| 50 | CONDENSED FINANCIAL INFORMATION OF REGISTRANT (SMFG) |
Condensed Statement of Financial Position
| | | | | | | | |
| | | At March 31, | |
| | | 2012 | | | 2011 | |
| | | (In millions) | |
Assets: | | | | | | | | |
Deposits with SMBC | | ¥ | 67,323 | | | ¥ | 54,154 | |
Investments in SMBC | | | 5,175,789 | | | | 5,385,792 | |
Investments in other subsidiaries and associates | | | 856,646 | | | | 734,765 | |
Other assets | | | 1,281 | | | | 871 | |
Current tax assets | | | 33,266 | | | | 41,382 | |
| | | | | | | | |
Total assets | | ¥ | 6,134,305 | | | ¥ | 6,216,964 | |
| | | | | | | | |
Liabilities and equity: | | | | | | | | |
Short-term borrowings from SMBC | | ¥ | 1,228,030 | | | ¥ | 997,030 | |
Debt securities due to a subsidiary | | | 392,900 | | | | 392,900 | |
Other liabilities | | | 4,902 | | | | 4,812 | |
| | | | | | | | |
Total liabilities | | | 1,625,832 | | | | 1,394,742 | |
| | | | | | | | |
Shareholders’ equity | | | 4,508,473 | | | | 4,822,222 | |
| | | | | | | | |
Total liabilities and shareholders’ equity | | ¥ | 6,134,305 | | | ¥ | 6,216,964 | |
| | | | | | | | |
Condensed Income Statement
| | | | | | | | | | | | |
| | | For the fiscal year ended March 31, | |
| | | 2012 | | | 2011 | | | 2010 | |
| | | (In millions) | |
Income: | | | | | | | | | | | | |
Dividends from SMBC | | ¥ | 158,645 | | | ¥ | 191,174 | | | ¥ | 113,315 | |
Dividends from other subsidiaries and associates | | | 7,627 | | | | 15,692 | | | | 5,504 | |
Fees and commission income from subsidiaries | | | 15,100 | | | | 15,352 | | | | 14,561 | |
Derivative income(1) | | | — | | | | — | | | | 23,626 | |
Income from disposal of an associate | | | — | | | | — | | | | 7,670 | |
Other income | | | 1,645 | | | | 5,522 | | | | 3,343 | |
| | | | | | | | | | | | |
Total income | | | 183,017 | | | | 227,740 | | | | 168,019 | |
| | | | | | | | | | | | |
Expense: | | | | | | | | | | | | |
Interest expense to SMBC | | | 6,485 | | | | 6,291 | | | | 9,116 | |
Interest expense due to a subsidiary | | | 16,468 | | | | 16,468 | | | | 8,288 | |
Other interest expense | | | — | | | | — | | | | 1,429 | |
Operating and other expense | | | 8,607 | | | | 8,026 | | | | 11,671 | |
| | | | | | | | | | | | |
Total expense | | | 31,560 | | | | 30,785 | | | | 30,504 | |
| | | | | | | | | | | | |
Profit before tax | | | 151,457 | | | | 196,955 | | | | 137,515 | |
Income tax expense | | | 3 | | | | 3 | | | | 10,703 | |
| | | | | | | | | | | | |
Net profit | | ¥ | 151,454 | | | ¥ | 196,952 | | | ¥ | 126,812 | |
| | | | | | | | | | | | |
| (1) | Derivative income represents income from the derivative embedded in Type 4 preferred stock. The detail of the instruments is described in Note 24 “Shareholders’ Equity.” |
F-133
Condensed Statement of Cash Flows
| | | | | | | | | | | | |
| | | For the fiscal year ended March 31, | |
| | | 2012 | | | 2011 | | | 2010 | |
| | | (In millions) | |
Operating Activities: | | | | | | | | | | | | |
Profit before tax | | ¥ | 151,457 | | | ¥ | 196,955 | | | ¥ | 137,515 | |
Adjustments for: | | | | | | | | | | | | |
Derivative income | | | — | | | | — | | | | (23,626 | ) |
Income from disposal of an associate | | | — | | | | — | | | | (7,670 | ) |
Income taxes refund (paid)—net | | | 8,104 | | | | (17,299 | ) | | | (2,618 | ) |
Other operating activities-net | | | (1,494 | ) | | | (7,160 | ) | | | 5,037 | |
| | | | | | | | | | | | |
Net cash and cash equivalents provided by operating activities | | | 158,067 | | | | 172,496 | | | | 108,638 | |
| | | | | | | | | | | | |
Investing Activities: | | | | | | | | | | | | |
Investment in SMBC | | | — | | | | — | | | | (2,212,020 | ) |
Proceeds from sale of investment in SMBC | | | 210,003 | | | | — | | | | — | |
Investments in and establishment of subsidiaries and associates | | | (120,346 | ) | | | (99,519 | ) | | | (4,900 | ) |
Proceeds from disposal of investment in associates | | | — | | | | — | | | | 180,595 | |
Other investing activities—net | | | (13 | ) | | | (3 | ) | | | — | |
| | | | | | | | | | | | |
Net cash and cash equivalents provided by (used in) investing activities | | | 89,644 | | | | (99,522 | ) | | | (2,036,325 | ) |
| | | | | | | | | | | | |
Financing Activities: | | | | | | | | | | | | |
Proceeds from issuance of debt securities | | | — | | | | — | | | | 392,900 | |
Net increase (decrease) of short-term borrowings | | | 231,000 | | | | 49,000 | | | | (130,000 | ) |
Purchase of Type 6 Preferred stock | | | (210,003 | ) | | | — | | | | — | |
Proceeds from issuance of common stock | | | — | | | | — | | | | 1,824,896 | |
Dividends paid | | | (144,038 | ) | | | (154,013 | ) | | | (71,930 | ) |
Purchases of treasury stock and proceeds from sale of treasury stock—net | | | (111,501 | ) | | | (91 | ) | | | (146 | ) |
Other financing activities—net | | | — | | | | — | | | | (3,030 | ) |
| | | | | | | | | | | | |
Net cash and cash equivalents provided by (used in) financing activities | | | (234,542 | ) | | | (105,104 | ) | | | 2,012,690 | |
| | | | | | | | | | | | |
Net increase (decrease) of cash and cash equivalents | | | 13,169 | | | | (32,130 | ) | | | 85,003 | |
Cash and cash equivalents at beginning of period | | | 54,154 | | | | 86,284 | | | | 1,281 | |
| | | | | | | | | | | | |
Cash and cash equivalents at end of period | | ¥ | 67,323 | | | ¥ | 54,154 | | | ¥ | 86,284 | |
| | | | | | | | | | | | |
Investments in subsidiaries and associates
Investments in subsidiaries and associates are stated at cost. SMFG recognizes dividend income from subsidiaries and associates when its right to receive payment is established.
Investments in other subsidiaries and associates include equity investments in SMFG Card & Credit, Inc., SMFL, SMBC Friend Securities, Promise and others at March 31, 2012, and SMFG Card & Credit, Inc., SMFL, SMBC Friend Securities and others at March 31, 2011. These companies are incorporated in Japan, and the proportion of ownership interest of SMFG in these companies other than Promise was the same as described in Note 11 “Investments in Associates and Joint Ventures,” and Note 47 “Principal Subsidiaries.” The proportion of ownership interest of SMFG in Promise was 64.1% at March 31, 2012.
In January 2011, SMBC Friend Securities, which is a direct subsidiary of SMFG, transferred its collaborative business with SMBC to SMBC Nikko Securities, a subsidiary of SMBC. As a result of this
F-134
transaction, SMFG recognized a decrease in the carrying amount of investment in SMBC Friend Securities and, concurrently, an increase in the carrying amount of investment in SMBC with the same amount. No profit or loss was recognized for this transaction.
Long-term obligations
SMFG issued perpetual subordinated bonds of ¥393 billion outstanding to its subsidiary, SMFG Preferred Capital JPY 3 Limited, at March 31, 2012. The interest rates of these bonds are fixed until January 2015 or January 2020, which range from 3.9% to 4.5% per annum, and will be floating thereafter. SMFG Preferred Capital JPY 3 Limited issued preferred securities to purchase these bonds.
Guarantees
SMFG provided guarantee of ¥41 billion and ¥39 billion at March 31, 2012 and 2011, respectively, to the Deposit Protection Fund of the Association of German Banks with regard to the deposits of the SMBC Dusseldorf branch.
F-135
EXHIBIT INDEX
| | |
Exhibit number | | Description of Exhibit |
| Exhibit 1.1 | | Articles of Incorporation of Sumitomo Mitsui Financial Group, Inc., as amended on June 29, 2010 (English translation)* |
| |
| Exhibit 1.2 | | Regulations of Board of Directors of Sumitomo Mitsui Financial Group, Inc., as amended on June 29, 2010 (English translation)* |
| |
| Exhibit 1.3 | | Share Handling Regulations of Sumitomo Mitsui Financial Group, Inc., as amended on April 1, 2012 (English translation) |
| |
| Exhibit 2.1 | | Form of Deposit Agreement among the registrant, Citibank, N.A., as Depositary, and all owners and holders from time to time of American Depositary Shares issued thereunder* |
| |
| Exhibit 8 | | List of subsidiaries of Sumitomo Mitsui Financial Group, Inc., at March 31, 2012 |
| |
| Exhibit 11 | | Code of Ethics of Sumitomo Mitsui Financial Group, Inc.** |
| |
| Exhibit 12.1 | | CEO Certification Required by Rule 13a-14(a) (17 CFR 240.13a-14(a)) |
| |
| Exhibit 12.2 | | CFO Certification Required by Rule 13a-14(a) (17 CFR 240.13a-14(a)) |
| |
| Exhibit 13.1 | | Certification Required by Rule 13a-14(b) (17 CFR 240.13a-14(b)) and Section 1350 of Chapter 63 of Title 18 of the United States Code (18 U.S.C. 1350) |
| |
| Exhibit 13.2 | | Certification Required by Rule 13a-14(b) (17 CFR 240.13a-14(b)) and Section 1350 of Chapter 63 of Title 18 of the United States Code (18 U.S.C. 1350) |
| * | Incorporated by reference to our registration statement on Form 20-F (File No. 001-34919) filed on October 20, 2010. |
| ** | Incorporated by reference to our annual report on Form 20-F (File No. 001-34919) filed on July 29, 2011. |