Exhibit 99.2
A Specialty Pharmaceutical Company NASDAQ: ANIP GENERIC AND BRANDED PRESCRIPTION DRUG PRODUCTS Corporate Presentation March 2016
Forward - Looking Statements To the extent any statements made in this presentation deal with information that is not historical, these are forward - looking statements within the meaning of the Private Securities Litigation Reform Act of 1995. Such statements include, but are not limited to, statements about price increases, the Company’s future operations, products financial position, operating results and prospects , the Company’s pipeline or potential markets therefore, and other statements that are not historical in nature, particularly those that utilize terminology such as “anticipates,” “will,” “expects,” “plans,” “potential,” “future,” “believes,” “intends,” “continue,” other words of similar meaning, derivations of such words and the use of future dates. Uncertainties and risks may cause the Company’s actual results to be materially different than those expressed in or implied by such forward - looking statements. Uncertainties and risks include, but are not limited to, the risk that the Company may face with respect to importing raw materials; increased competition; acquisitions; delays or failure in obtaining product approval from the U.S. Food and Drug Administration; general business and economic conditions; market trends; products development; regulatory and other approvals and marketing. More detailed information on these and additional factors that could affect the Company’s actual results are described in the Company’s filings with the Securities and Exchange Commission, including its most recent annual report on Form 10 - K and quarterly reports on Form 10 - Q, as well as its proxy statement. All forward - looking statements in this presentation speak only as of the date of this presentation and are based on the Company’s current beliefs, assumptions, and expectations. The Company undertakes no obligation to update or revise any forward - looking statement, whether as a result of new information, future events or otherwise. 2
3 ANI Mission Statement ANI Pharmaceuticals is an integrated specialty pharmaceutical company developing, manufacturing and marketing branded and generic prescription pharmaceuticals. We focus on niche and high barrier to entry opportunities including controlled substances, anti - cancer (oncolytics), hormones and steroids, and complex formulations.
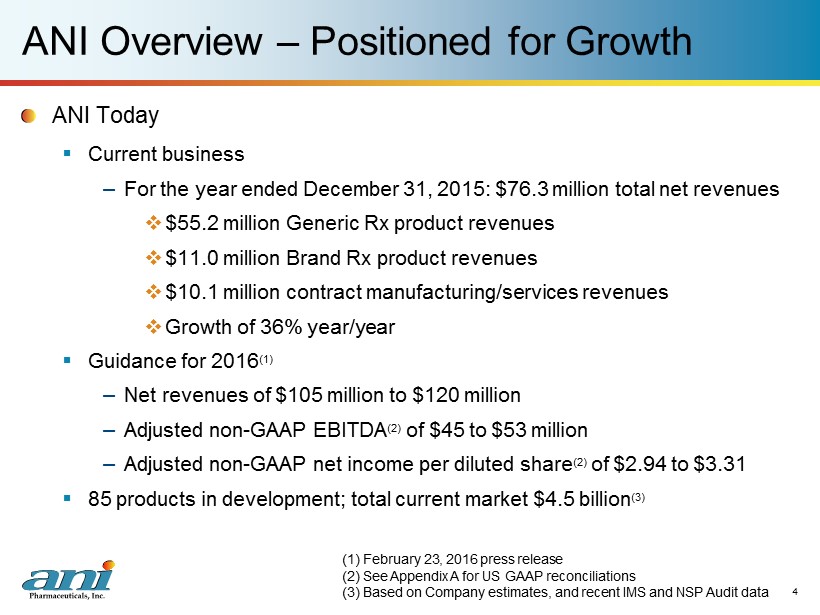
ANI Overview – Positioned for Growth ANI Today ▪ Current business – For the year ended December 31, 2015: $76.3 million total net revenues □ $55.2 million Generic Rx product revenues □ $11.0 million Brand Rx product revenues □ $10.1 million c ontract manufacturing/services revenues □ Growth of 36% year/year ▪ Guidance for 2016 (1) – Net revenues of $105 million to $120 million – Adjusted non - GAAP EBITDA (2) of $45 to $53 million – Adjusted non - GAAP net income per diluted share (2) of $2.94 to $3.31 ▪ 85 products in development; total current market $4.5 billion (3) (1) February 23, 2016 press release (2) See Appendix A for US GAAP reconciliations (3) Based on Company estimates, and recent IMS and NSP Audit data 4
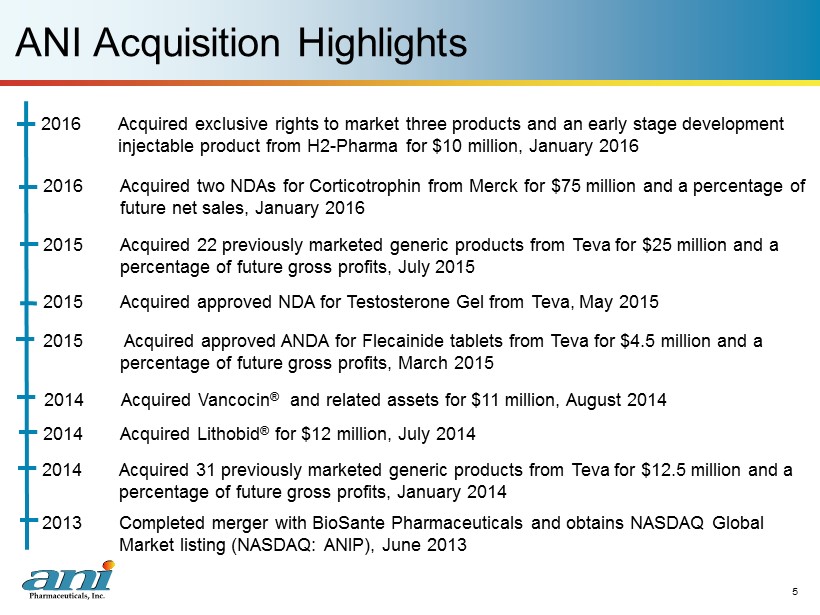
5 ANI Acquisition Highlights 2013 Completed merger with BioSante Pharmaceuticals and obtains NASDAQ Global Market listing (NASDAQ: ANIP), June 2013 2014 Acquired 31 previously marketed generic products from Teva for $12.5 million and a percentage of future gross profits, January 2014 2014 Acquired Lithobid ® for $12 million, July 2014 2015 Acquired approved NDA for Testosterone Gel from Teva , May 2015 2014 Acquired Vancocin ® and related assets for $11 million, August 2014 2015 Acquired approved ANDA for Flecainide tablets from Teva for $4.5 million and a percentage of future gross profits, March 2015 2016 Acquired exclusive rights to market three products and an early stage development injectable product from H2 - Pharma for $10 million, January 2016 2016 Acquired two NDAs for Corticotrophin from Merck for $75 million and a percentage of future net sales, January 2016 2015 Acquired 22 previously marketed generic products from Teva for $25 million and a percentage of future gross profits, July 2015

6 Sales and Marketing Overview
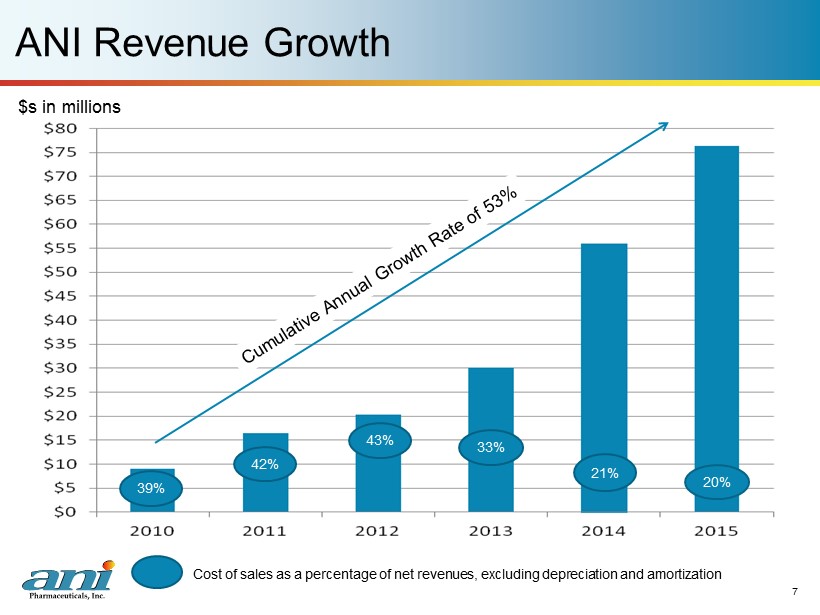
ANI Revenue Growth 7 $s in millions 39% C ost of sales as a percentage of net revenues, excluding depreciation and amortization 42% 43% 33% 21% 20%
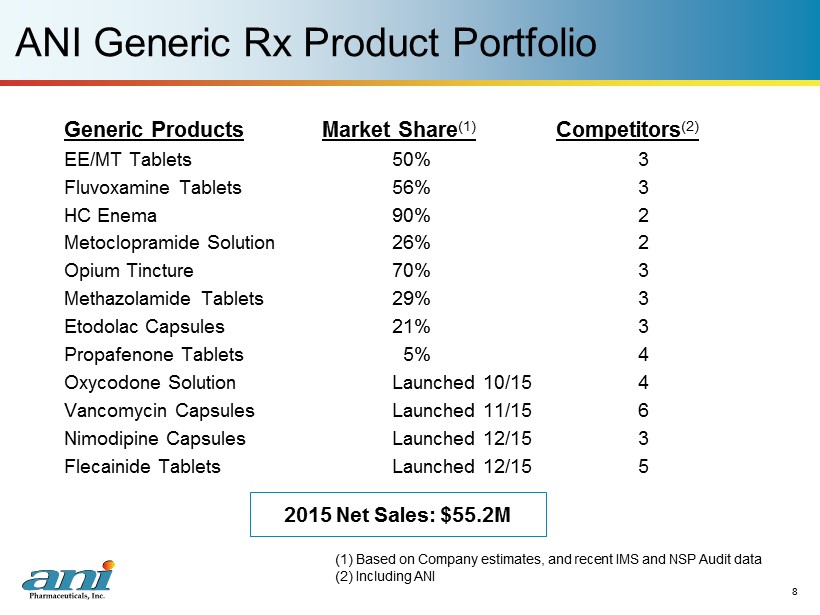
ANI Generic Rx Product Portfolio Generic Products Market Share (1) Competitors (2) EE/MT Tablets 50% 3 Fluvoxamine Tablets 56% 3 HC Enema 90% 2 Metoclopramide Solution 26% 2 Opium Tincture 70% 3 Methazolamide Tablets 29% 3 Etodolac Capsules 21% 3 Propafenone Tablets 5% 4 Oxycodone Solution Launched 10/15 4 Vancomycin Capsules Launched 11/15 6 Nimodipine Capsules Launched 12/15 3 Flecainide Tablets Launched 12/15 5 8 (1) Based on Company estimates, and recent IMS and NSP Audit data (2) Including ANI 2015 Net Sales: $55.2M
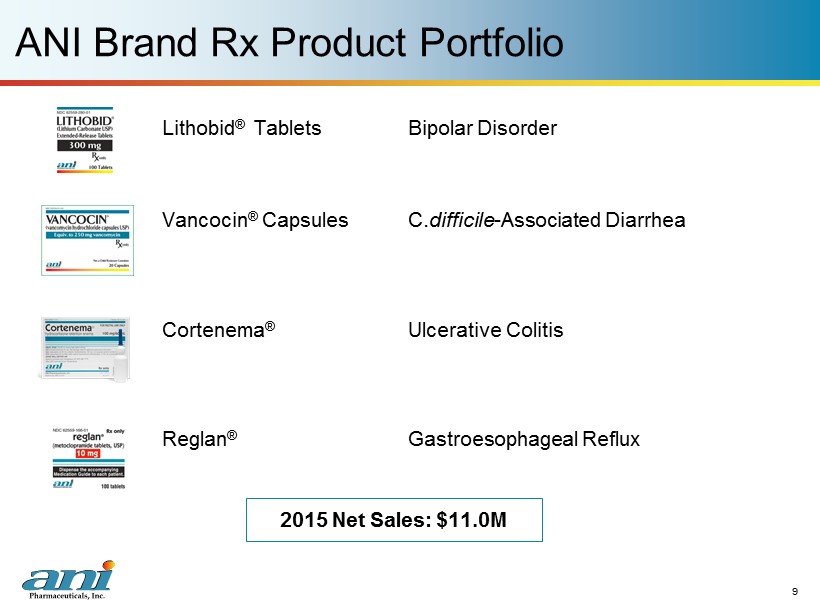
ANI Brand Rx Product Portfolio 9 Lithobid ® Tablets Bipolar Disorder Vancocin ® Capsules C. difficile - Associated Diarrhea Cortenema ® U lcerative Colitis Reglan ® Gastroesophageal Reflux 2015 Net Sales: $11.0M

ANI Contract Manufacturing and Other 10 Current Business ▪ Four customers – Seven products and seventeen SKUs – Contract manufacturing and contract packaging 2015 Net Sales: $10.1M

11 Business Development / Product Development Overview
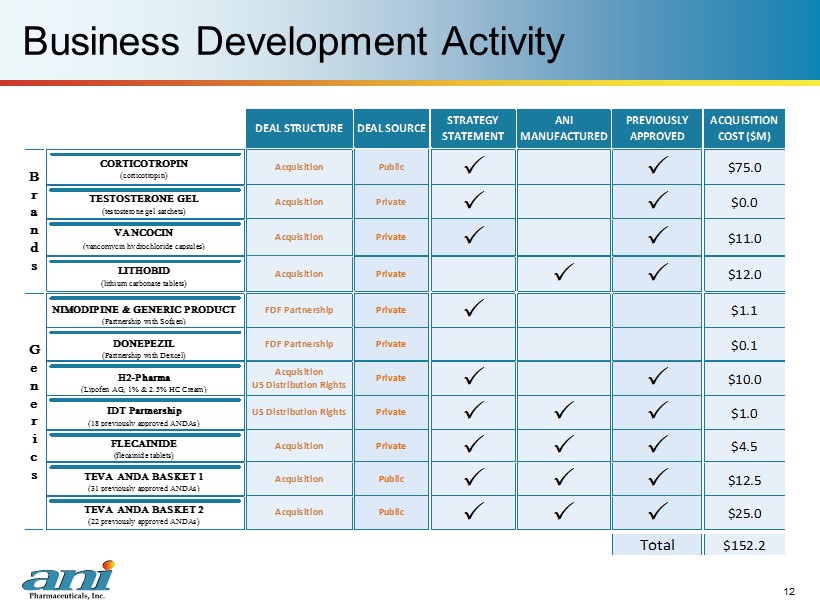
Business Development Activity 12 $1.1 $0.1 G e n e r i c s DONEPEZIL (Partnership with Dexcel) FDF Partnership Private P TEVA ANDA BASKET 2 (22 previously approved ANDAs) TEVA ANDA BASKET 1 (31 previously approved ANDAs) Total $152.2 FDF Partnership Private Acquisition Public P P P $25.0 P $12.5 Acquisition Public P P Acquisition Private P P P $4.5 US Distribution Rights Private P P FLECAINIDE (flecainide tablets) P Acquisition US Distribution Rights Private P P $1.0 IDT Partnership (18 previously approved ANDAs) P P $12.0 NIMODIPINE & GENERIC PRODUCT (Partnership with Sofgen) VANCOCIN (vancomycin hydrochloride capsules) LITHOBID (lithium carbonate tablets) Acquisition Private Acquisition Private P P $11.0 P $0.0 Acquisition Private P $10.0 H2-Pharma (Lipofen AG, 1% & 2.5% HC Cream) $75.0 TESTOSTERONE GEL (testosterone gel satchets) ACQUISITION COST ($M) B r a n d s Acquisition Public P P CORTICOTROPIN DEAL STRUCTURE DEAL SOURCE STRATEGY STATEMENT ANI MANUFACTURED PREVIOUSLY APPROVED (corticotropin)
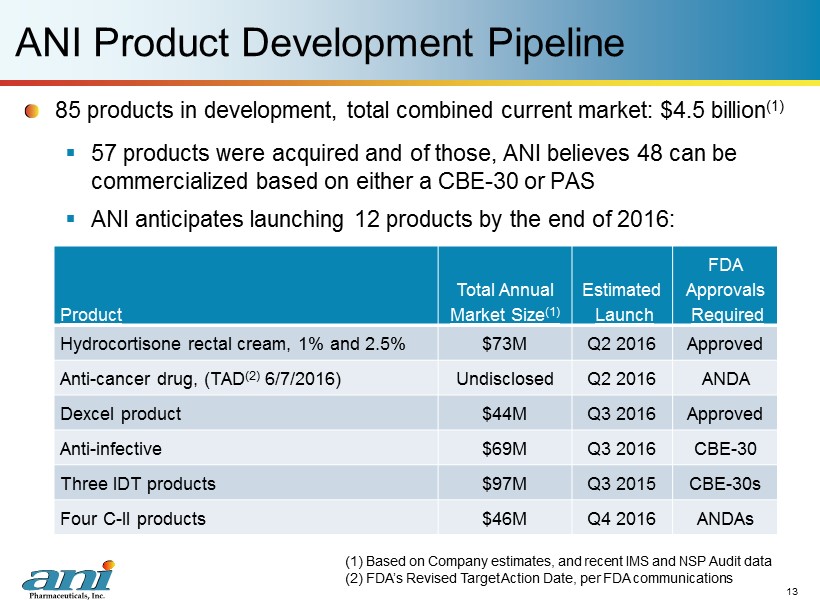
13 ANI Product Development Pipeline 85 p roducts in development, total combined current market: $4.5 billion (1) ▪ 57 products were acquired and of those, ANI believes 48 can be commercialized based on either a CBE - 30 or PAS ▪ ANI anticipates launching 12 products by the end of 2016: (1) Based on Company estimates, and recent IMS and NSP Audit data (2) FDA’s Revised Target Action Date, per FDA communications Product Total Annual Market Size (1) Estimated Launch FDA Approvals Required Hydrocortisone rectal cream, 1% and 2.5% $73M Q2 2016 Approved Anti - cancer drug, ( TAD (2) 6/7/2016 ) Undisclosed Q2 2016 ANDA Dexcel product $ 44M Q3 2016 Approved Anti - infective $69M Q3 2016 CBE - 30 Three IDT products $97M Q3 2015 CBE - 30s Four C - II products $46M Q4 2016 ANDAs
14 Manufacturing Overview

15 ANI Manufacturing – Main Street Facility Location: Baudette , Minnesota ▪ 52,000 square feet of manufacturing , packaging, and warehouse facilities ▪ Rx solutions , suspensions , topicals , tablets , and capsules ▪ DEA - licensed for Schedule II controlled substances ▪ 17,000 square feet of laboratory space for product development and analytical testing
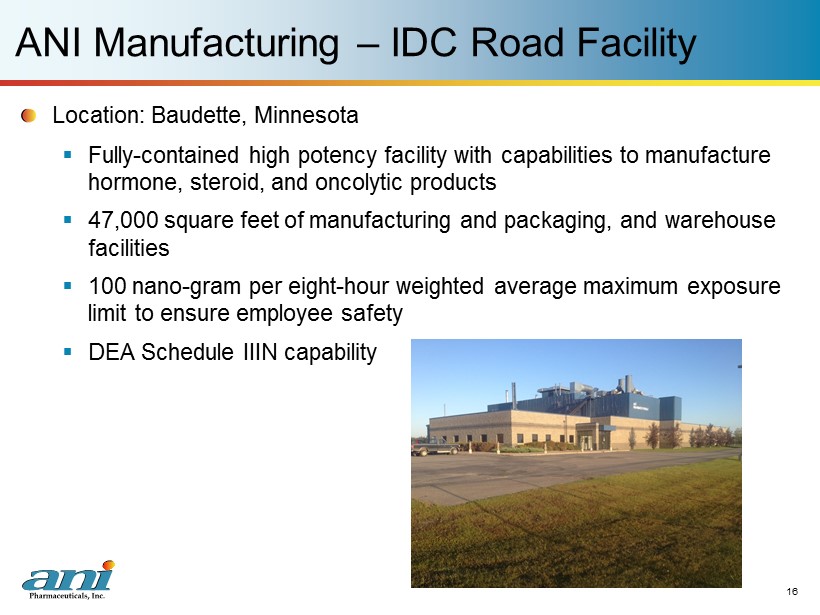
16 ANI Manufacturing – IDC Road Facility Location: Baudette, Minnesota ▪ Fully - contained h igh potency facility with capabilities to manufacture h ormone , steroid , and oncolytic products ▪ 47,000 square feet of manufacturing and packaging, and warehouse facilities ▪ 100 nano - gram per eight - hour weighted average maximum exposure limit to ensure employee safety ▪ DEA Schedule IIIN capability

ANI Summary ANI is an integrated specialty generic pharmaceutical firm with: ▪ Profitable base business generating organic growth – 2016 Annual guidance (1) □ Net revenues of $105 million to $120 million □ Adjusted non - GAAP EBITDA of $45 million to $53 million □ Adjusted non - GAAP Net Income Per Diluted Share of $2.94 to $3.31 ▪ Well capitalized balance sheet with $75 million in cash ▪ Experienced management team ANI is focused on: ▪ Partnerships/strategic alliances ▪ Accretive acquisitions ▪ Internal product development 17 (1) February 23, 2016 press release

18 Appendix A

U.S. GAAP Reconciliations 19 2015 2014 2015 2014 Operating Income $6,268 $10,772 $32,700 $20,006 Add back Depreciation and amortization 2,111 1,282 6,900 3,878 Add back Stock-based compensation 1,139 704 3,856 3,423 Adjusted non-GAAP EBITDA $9,518 $12,758 $43,456 $27,307 ANI Pharmaceuticals, Inc. and Subsidiaries Adjusted non-GAAP EBITDA Calculation and US GAAP to Non-GAAP Reconciliation (unaudited, in thousands) Three months ended December 31, Year ended December 31,
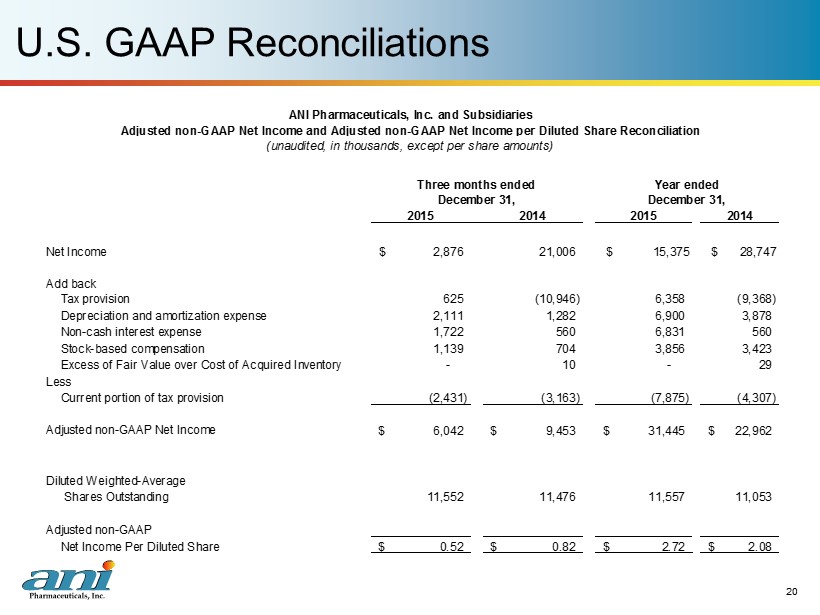
U.S. GAAP Reconciliations 20 2015 2014 2015 2014 Net Income 2,876$ 21,006 $ 15,375 $ 28,747 Add back Tax provision 625 (10,946) 6,358 (9,368) Depreciation and amortization expense 2,111 1,282 6,900 3,878 Non-cash interest expense 1,722 560 6,831 560 Stock-based compensation 1,139 704 3,856 3,423 Excess of Fair Value over Cost of Acquired Inventory - 10 - 29 Less Current portion of tax provision (2,431) (3,163) (7,875) (4,307) Adjusted non-GAAP Net Income 6,042$ 9,453$ 31,445$ 22,962$ Diluted Weighted-Average Shares Outstanding 11,552 11,476 11,557 11,053 Adjusted non-GAAP Net Income Per Diluted Share 0.52$ 0.82$ 2.72$ 2.08$ Year ended December 31, ANI Pharmaceuticals, Inc. and Subsidiaries Adjusted non-GAAP Net Income and Adjusted non-GAAP Net Income per Diluted Share Reconciliation (unaudited, in thousands, except per share amounts) Three months ended December 31,