UNITED STATES
SECURITIES AND EXCHANGE COMMISSION
Washington, D.C. 20549
FORM 10-K
x ANNUAL REPORT PURSUANT TO SECTION 13 OR 15(d) OF THE SECURITIES EXCHANGE ACT OF 1934
FOR THE FISCAL YEAR ENDED DECEMBER 31, 2014
— OR —
o TRANSITION REPORT PURSUANT TO SECTION 13 OR 15(d) OF THE SECURITIES EXCHANGE ACT OF 1934
Commission File Number 1-12833
Energy Future Holdings Corp.
(Exact name of registrant as specified in its charter)
|
| | |
| Texas | | 46-2488810 |
| (State or other jurisdiction of incorporation or organization) | | (I.R.S. Employer Identification No.) |
| | | |
| 1601 Bryan Street, Dallas, TX 75201-3411 | | (214) 812-4600 |
| (Address of principal executive offices) (Zip Code) | | (Registrant's telephone number, including area code) |
__________________________________________________________________________
Securities registered pursuant to Section 12(b) of the Act: None
Securities registered pursuant to Section 12(g) of the Act: None
__________________________________________________________________________
Indicate by check mark if the registrant is a well-known seasoned issuer, as defined in Rule 405 of the Securities Act. Yes ¨ No x
Indicate by check mark if the registrant is not required to file reports pursuant to Section 13 or Section 15(d) of the Act. Yes ¨ No x
Indicate by check mark whether the registrant (1) has filed all reports required to be filed by Section 13 or 15(d) of the Securities Exchange Act of 1934 during the preceding 12 months (or for such shorter period that the registrant was required to file such reports) and (2) has been subject to such filing requirements for the past 90 days. Yes x No o
Indicate by check mark whether the registrant has submitted electronically and posted on its corporate Web site, if any, every Interactive Data File required to be submitted and posted pursuant to Rule 405 of Regulation S-T (§232.405 of this chapter) during the preceding 12 months (or for such shorter period that the registrant was required to submit and post such files). Yes x No o
Indicate by check mark if disclosure of delinquent filers pursuant to Item 405 of Regulation S-K (229.405 of this chapter) is not contained herein, and will not be contained, to the best of registrant's knowledge, in definitive proxy or information statements incorporated by reference in Part III of this Form 10-K or any amendment to this Form 10-K. x
Indicate by check mark whether the registrant is a large accelerated filer, an accelerated filer, a non-accelerated filer, or a smaller reporting company. See definitions of "large accelerated filer," "accelerated filer" and "smaller reporting company" in Rule 12b-2 of the Exchange Act.
Large accelerated filer o Accelerated filer o Non-Accelerated filer x (Do not check if a smaller reporting company)
Smaller reporting company o
Indicate by check mark if the registrant is a shell company (as defined in Rule 12b-2 of the Exchange Act). Yes o No x
At March 31, 2015, there were 1,669,861,379 shares of common stock, without par value, outstanding of Energy Future Holdings Corp. (substantially all of which were owned by Texas Energy Future Holdings Limited Partnership, Energy Future Holdings Corp.’s parent holding company, and none of which is publicly traded).
________________________________________________________________________________
DOCUMENTS INCORPORATED BY REFERENCE
None
TABLE OF CONTENTS
|
| | |
| | | PAGE |
| | |
| | | |
| Items 1. and 2. | | |
| Item 1A. | | |
| Item 1B. | | |
| Item 3. | | |
| Item 4. | | |
| | | |
| Item 5. | | |
| Item 6. | | |
| Item 7. | | |
| Item 7A. | | |
| Item 8. | | |
| Item 9. | | |
| Item 9A. | | |
| Item 9B. | | |
| | | |
| Item 10. | | |
| Item 11. | | |
| Item 12. | | |
| Item 13. | | |
| Item 14. | | |
| | | |
| Item 15. | | |
Energy Future Holdings Corp.'s (EFH Corp.) annual reports on Form 10-K, quarterly reports on Form 10-Q, current reports on Form 8-K and any amendments to those reports are made available to the public, free of charge, on the EFH Corp. website at http://www.energyfutureholdings.com, as soon as reasonably practicable after they have been filed with or furnished to the Securities and Exchange Commission. The information on EFH Corp.'s website shall not be deemed a part of, or incorporated by reference into, this annual report on Form 10-K. The representations and warranties contained in any agreement that we have filed as an exhibit to this annual report on Form 10-K or that we have or may publicly file in the future may contain representations and warranties made by and to the parties thereto at specific dates. Such representations and warranties may be subject to exceptions and qualifications contained in separate disclosure schedules, may represent the parties' risk allocation in the particular transaction, or may be qualified by materiality standards that differ from what may be viewed as material for securities law purposes.
This annual report on Form 10-K and other Securities and Exchange Commission filings of EFH Corp. and its subsidiaries occasionally make references to EFH Corp. (or "we," "our," "us" or "the company"), EFCH, EFIH, TCEH, TXU Energy, Luminant, Oncor Holdings or Oncor when describing actions, rights or obligations of their respective subsidiaries. These references reflect the fact that the subsidiaries are consolidated with, or otherwise reflected in, their respective parent company's financial statements for financial reporting purposes. However, these references should not be interpreted to imply that the parent company is actually undertaking the action or has the rights or obligations of the relevant subsidiary company or vice versa.
GLOSSARY
When the following terms and abbreviations appear in the text of this report, they have the meanings indicated below.
|
| | |
| ancillary services | | Refers to services necessary to support the transmission of energy and maintain reliable operations for the entire transmission system. These services include monitoring and providing for various types of reserve generation to ensure adequate electricity supply and system reliability. |
| | | |
| Bankruptcy Filing | | Voluntary petitions for relief under Chapter 11 of the US Bankruptcy Code (Bankruptcy Code) in the US Bankruptcy Court for the District of Delaware (Bankruptcy Court) filed on April 29, 2014 by the Debtors |
| | | |
| CAIR | | Clean Air Interstate Rule |
| | | |
| CFTC | | US Commodity Futures Trading Commission |
| | | |
CO2 | | carbon dioxide |
| | | |
| CPNPC | | Refers to Comanche Peak Nuclear Power Company LLC, which was formed for the purpose of developing two new nuclear generation units and obtaining a combined operating license from the NRC for the units. |
| | | |
| Competitive Electric segment | | the EFH Corp. business segment that consists principally of TCEH |
| | | |
| Consolidated EBITDA | | Consolidated EBITDA means TCEH EBITDA adjusted to exclude noncash items, unusual items and other adjustments allowable under the agreement governing the TCEH DIP Facility. See the definition of EBITDA below. Consolidated EBITDA and EBITDA are not recognized terms under US GAAP and, thus, are non-GAAP financial measures. We are providing Consolidated EBITDA in this Form 10-K (see reconciliation in Exhibit 99(b)) solely because of the important role that Consolidated EBITDA plays in respect of covenants contained in the agreement governing the TCEH DIP Facility. We do not intend for Consolidated EBITDA (or EBITDA) to be an alternative to net income as a measure of operating performance or an alternative to cash flows from operating activities as a measure of liquidity or an alternative to any other measure of financial performance presented in accordance with US GAAP. Additionally, we do not intend for Consolidated EBITDA (or EBITDA) to be used as a measure of free cash flow available for management's discretionary use, as the measure excludes certain cash requirements such as adequate assurance payments, interest payments, tax payments and other debt service requirements. Because not all companies use identical calculations, our presentation of Consolidated EBITDA (and EBITDA) may not be comparable to similarly titled measures of other companies. |
| | | |
| CREZ | | Competitive Renewable Energy Zone |
| | | |
| CSAPR | | the final Cross-State Air Pollution Rule issued by the EPA in July 2011 |
| | | |
| DIP Facilities | | Refers, collectively, to TCEH's debtor-in-possession financing and EFIH's debtor-in-possession financing. See Note 11 to the Financial Statements. |
| | | |
| Debtors | | EFH Corp. and the substantial majority of its direct and indirect subsidiaries, including EFIH, EFCH and TCEH but excluding the Oncor Ring-Fenced Entities |
| | | |
| D.C. Circuit Court | | US Court of Appeals for the District of Columbia Circuit |
| | | |
| DOE | | US Department of Energy |
| | | |
| EBITDA | | earnings (net income) before interest expense, income taxes, depreciation and amortization |
| | | |
| EFCH | | Energy Future Competitive Holdings Company LLC, a direct, wholly owned subsidiary of EFH Corp. and the direct parent of TCEH, and/or its subsidiaries, depending on context |
| | | |
| EFH Corp. | | Energy Future Holdings Corp., a holding company, and/or its subsidiaries, depending on context, whose major subsidiaries include TCEH and Oncor |
| | | |
| EFIH | | Energy Future Intermediate Holding Company LLC, a direct, wholly owned subsidiary of EFH Corp. and the direct parent of Oncor Holdings |
| | | |
| EFIH Debtors | | EFIH and EFIH Finance |
| | | |
| EFIH Finance | | EFIH Finance Inc., a direct, wholly owned subsidiary of EFIH, formed for the sole purpose of serving as co-issuer with EFIH of certain debt securities |
| | | |
|
| | |
| EFIH First Lien Notes | | Refers, collectively, to EFIH's and EFIH Finance's $503 million principal amount of 6.875% Senior Secured First Lien Notes and $3.482 billion principal amount of 10.000% Senior Secured First Lien Notes. |
| | | |
| EFIH Second Lien Notes | | Refers, collectively, to EFIH's and EFIH Finance's $406 million principal amount of 11% Senior Secured Second Lien Notes and $1.75 billion principal amount of 11.75% Senior Secured Second Lien Notes. |
| | | |
| EFIH PIK Notes | | EFIH's $1.566 billion principal amount of 11.25%/12.25% Senior Toggle Notes. |
| | | |
| EPA | | US Environmental Protection Agency |
| | | |
| ERCOT | | Electric Reliability Council of Texas, Inc., the independent system operator and the regional coordinator of various electricity systems within Texas |
| | | |
| ERISA | | Employee Retirement Income Security Act of 1974, as amended |
| | | |
| Federal and State Income Tax Allocation Agreements | | EFH Corp. and certain of its subsidiaries (including EFCH, EFIH and TCEH, but not including Oncor Holdings and Oncor) are parties to a Federal and State Income Tax Allocation Agreement, executed on May 15, 2012 but effective as of January 1, 2010. EFH Corp., Oncor Holdings, Oncor, Oncor's third-party minority investor, and Oncor Management Investment LLC are parties to a separate Federal and State Income Tax Allocation Agreement dated November 5, 2008. See Note 6 to the Financial Statements and Management's Discussion and Analysis, under Financial Condition. |
| | | |
| FERC | | US Federal Energy Regulatory Commission |
| | | |
| Fifth Circuit Court | | US Court of Appeals for the Fifth Circuit |
| | | |
| GAAP | | generally accepted accounting principles |
| | | |
| GHG | | greenhouse gas |
| | | |
| GWh | | gigawatt-hours |
| | | |
| ICE | | the IntercontinentalExchange, an electronic commodity derivative exchange |
| | | |
| IRS | | US Internal Revenue Service |
| | | |
| kWh | | kilowatt-hours |
| | | |
| LIBOR | | London Interbank Offered Rate, an interest rate at which banks can borrow funds, in marketable size, from other banks in the London interbank market |
| | | |
| Luminant | | subsidiaries of TCEH engaged in competitive market activities consisting of electricity generation and wholesale energy sales and purchases as well as commodity risk management and trading activities, all largely in Texas |
| | | |
| market heat rate | | Heat rate is a measure of the efficiency of converting a fuel source to electricity. Market heat rate is the implied relationship between wholesale electricity prices and natural gas prices and is calculated by dividing the wholesale market price of electricity, which is based on the price offer of the marginal supplier in ERCOT (generally natural gas plants), by the market price of natural gas. Forward wholesale electricity market price quotes in ERCOT are generally limited to two or three years; accordingly, forward market heat rates are generally limited to the same time period. Forecasted market heat rates for time periods for which market price quotes are not available are based on fundamental economic factors and forecasts, including electricity supply, demand growth, capital costs associated with new construction of generation supply, transmission development and other factors. |
| | | |
| MATS | | the Mercury and Air Toxics Standard established by the EPA |
| | | |
| Merger | | the transaction referred to in the Agreement and Plan of Merger, dated February 25, 2007, under which Texas Holdings agreed to acquire EFH Corp., which was completed on October 10, 2007 |
| | | |
| MMBtu | | million British thermal units |
| | | |
| Moody's | | Moody's Investors Services, Inc. |
| | | |
| MSHA | | US Mine Safety and Health Administration |
| | | |
| MW | | megawatts |
|
| | |
| | | |
| MWh | | megawatt-hours |
| | | |
| NERC | | North American Electric Reliability Corporation |
| | | |
NOX | | nitrogen oxide |
| | | |
| NRC | | US Nuclear Regulatory Commission |
| | | |
| NYMEX | | the New York Mercantile Exchange, a commodity derivatives exchange |
| | | |
| Oncor | | Oncor Electric Delivery Company LLC, a direct, majority-owned subsidiary of Oncor Holdings and an indirect subsidiary of EFH Corp., and/or its consolidated bankruptcy-remote financing subsidiary, Oncor Electric Delivery Transition Bond Company LLC, depending on context, that is engaged in regulated electricity transmission and distribution activities |
| | | |
| Oncor Holdings | | Oncor Electric Delivery Holdings Company LLC, a direct, wholly owned subsidiary of EFIH and the direct majority owner of Oncor, and/or its subsidiaries, depending on context |
| | | |
| Oncor Ring-Fenced Entities | | Oncor Holdings and its direct and indirect subsidiaries, including Oncor |
| | | |
| Oncor Tax Sharing Agreement | | Federal and State Income Tax Allocation Agreement among EFH Corp., Oncor Holdings, Oncor and Texas Transmission |
| | | |
| OPEB | | postretirement employee benefits other than pensions |
| | | |
| Petition Date | | April 29, 2014, the date the Debtors made the Bankruptcy Filing |
| | | |
| PUCT | | Public Utility Commission of Texas |
| | | |
| PURA | | Texas Public Utility Regulatory Act |
| | | |
| purchase accounting | | The purchase method of accounting for a business combination as prescribed by US GAAP, whereby the cost or "purchase price" of a business combination, including the amount paid for the equity and direct transaction costs are allocated to identifiable assets and liabilities (including intangible assets) based upon their fair values. The excess of the purchase price over the fair values of assets and liabilities is recorded as goodwill. |
| | | |
| Regulated Delivery segment | | the EFH Corp. business segment that consists primarily of our investment in Oncor |
| | | |
| REP | | retail electric provider |
| | | |
| RSA | | Restructuring Support and Lock-Up Agreement |
| | | |
| RCT | | Railroad Commission of Texas, which among other things, has oversight of lignite mining activity in Texas |
| | | |
| S&P | | Standard & Poor's Ratings (a credit rating agency) |
| | | |
| SEC | | US Securities and Exchange Commission |
| | | |
| Securities Act | | Securities Act of 1933, as amended |
| | | |
| SG&A | | selling, general and administrative |
| | | |
SO2 | | sulfur dioxide |
| | | |
| Sponsor Group | | Refers, collectively, to certain investment funds affiliated with Kohlberg Kravis Roberts & Co. L.P., TPG Global, LLC (together with its affiliates, TPG) and GS Capital Partners, an affiliate of Goldman, Sachs & Co., that have an ownership interest in Texas Holdings. |
| | | |
| TCEH | | Texas Competitive Electric Holdings Company LLC, a direct, wholly owned subsidiary of EFCH and an indirect subsidiary of EFH Corp., and/or its subsidiaries, depending on context, that are engaged in electricity generation and wholesale and retail energy market activities, and whose major subsidiaries include Luminant and TXU Energy |
| | | |
| TCEH Debtors | | EFCH, TCEH and the subsidiaries of TCEH that are Debtors in the Chapter 11 Cases |
| | | |
| TCEH Demand Notes | | Refers to certain loans from TCEH to EFH Corp. in the form of demand notes to finance EFH Corp. debt principal and interest payments and, until April 2011, other general corporate purposes of EFH Corp. that were guaranteed on a senior unsecured basis by EFCH and EFIH and were settled by EFH Corp. in January 2013. |
| | | |
|
| | |
| TCEH DIP Facility | | TCEH's $3.375 billion debtor-in-possession financing facility approved by the Bankruptcy Court in June 2014 (see Note 11 to the Financial Statements)
|
| | | |
| TCEH Finance | | TCEH Finance, Inc., a direct, wholly owned subsidiary of TCEH, formed for the sole purpose of serving as co-issuer with TCEH of certain debt securities |
| | | |
| TCEH Senior Notes | | Refers, collectively, to TCEH's and TCEH Finance's 10.25% Senior Notes and 10.25% Senior Notes, Series B (collectively, TCEH 10.25% Notes) and TCEH's and TCEH Finance's 10.50%/11.25% Senior Toggle Notes (TCEH Toggle Notes) with a total principal amount of $4.874 billion. |
| | | |
| TCEH Senior Secured Facilities | | Refers, collectively, to the TCEH First Lien Term Loan Facilities, TCEH First Lien Revolving Credit Facility and TCEH First Lien Letter of Credit Facility with a total principal amount of $22.616 billion. |
| | | |
| TCEH Senior Secured Notes | | TCEH's and TCEH Finance's $1.750 billion principal amount of 11.5% First Lien Senior Secured Notes |
| | | |
| TCEH Senior Secured Second Lien Notes | | Refers, collectively, to TCEH's and TCEH Finance's 15% Senior Secured Second Lien Notes and TCEH's and TCEH Finance's 15% Senior Secured Second Lien Notes, Series B with a total principal amount of $1.571 billion. |
| | | |
| TCEQ | | Texas Commission on Environmental Quality |
| | | |
| Texas Holdings | | Texas Energy Future Holdings Limited Partnership, a limited partnership controlled by the Sponsor Group, that owns substantially all of the common stock of EFH Corp. |
| | | |
| Texas Holdings Group | | Texas Holdings and its direct and indirect subsidiaries other than the Oncor Ring-Fenced Entities |
| | | |
| Texas Transmission | | Texas Transmission Investment LLC, a limited liability company that owns a 19.75% equity interest in Oncor and is not affiliated with EFH Corp., any of EFH Corp.'s subsidiaries or any member of the Sponsor Group |
| | | |
| TRE | | Texas Reliability Entity, Inc., an independent organization that develops reliability standards for the ERCOT region and monitors and enforces compliance with NERC standards and monitors compliance with ERCOT protocols |
| | | |
| TXU Energy | | TXU Energy Retail Company LLC, a direct, wholly owned subsidiary of TCEH that is a REP in competitive areas of ERCOT and is engaged in the retail sale of electricity to residential and business customers |
| | | |
| US | | United States of America |
| | | |
| VIE | | variable interest entity |
PART I.
Items 1. and 2. BUSINESS AND PROPERTIES
References in this report to "we," "our," "us" and "the company" are to EFH Corp. and/or its subsidiaries, as apparent in the context. See Glossary for descriptions of major subsidiaries and other defined terms.
EFH Corp. Business and Strategy
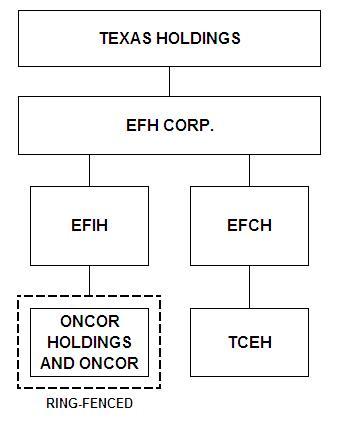
We are a Dallas, Texas-based energy company with a portfolio of competitive and regulated energy businesses in Texas. EFH Corp. is a holding company conducting its operations principally through its TCEH and Oncor subsidiaries. Collectively with its operating subsidiaries, EFH Corp. is the largest generator, retailer and distributor of electricity in Texas. Immediately below is an organization chart of the key subsidiaries discussed in this report.
Texas Holdings, which is controlled by the Sponsor Group, owns substantially all of the common stock of EFH Corp.
EFCH and EFIH are wholly owned by EFH Corp. TCEH is wholly owned by EFCH. EFIH indirectly holds an approximate 80% equity interest in Oncor.
EFCH's principal asset is its investment in TCEH. EFCH is a guarantor of a significant portion of TCEH's debt and $60 million principal amount of EFH Corp.'s debt.
TCEH, through its subsidiaries, is engaged in competitive electricity market activities largely in Texas, including electricity generation, wholesale energy sales and purchases, commodity risk management and trading activities, and retail electricity operations.
TCEH owns 13,772 MW of electricity generation capacity in Texas, which consists of lignite/coal, nuclear and natural gas fueled generation facilities and accounts for approximately 15% of the generation in ERCOT. These amounts do not include four natural gas fueled generation units representing 1,655 MW of capacity that Luminant plans to retire in June 2015. TCEH is also one of the largest purchasers of wind-generated electricity in Texas and the US. TCEH provides competitive electricity and related services to 1.7 million retail electricity customers in Texas.
EFIH's principal asset consists of its investment in Oncor Holdings, the principal asset of which is an 80% equity interest in Oncor. EFIH is also a guarantor of $60 million principal amount of EFH Corp.'s debt.
Oncor is engaged in regulated electricity transmission and distribution operations in Texas that are primarily regulated by the PUCT and, in certain instances, the FERC. Oncor provides transmission and distribution services to REPs, which sell electricity to residential and business consumers, as well as transmission services to electricity distribution companies, cooperatives and municipalities. Oncor operates the largest transmission and distribution system in Texas, delivering electricity to more than 3.3 million homes and businesses and operating more than 121,000 miles of transmission and distribution lines. A significant portion of Oncor's revenues represent fees for services provided to TCEH's retail electricity operations. Revenues from services provided to TCEH represented 25% and 27% of Oncor's total reported consolidated revenues for the years ended December 31, 2014 and 2013, respectively.
EFH Corp. and Oncor have implemented certain structural and operational ring-fencing measures based on commitments made by Texas Holdings and Oncor to the PUCT to further enhance the credit quality of Oncor Holdings and Oncor. These measures serve to mitigate Oncor's and Oncor Holdings' credit exposure to the Texas Holdings Group with the intent to minimize the risk that a court would order any of the assets and liabilities of the Oncor Ring-Fenced Entities to be substantively consolidated with the assets and liabilities of any member of the Texas Holdings Group in the event any such member were to become a debtor in a bankruptcy case. Accordingly, EFH Corp. and EFIH do not control and do not consolidate Oncor Holdings and Oncor for financial reporting purposes. See Notes 1 and 3 to the Financial Statements for a description of the material features of these ring-fencing measures.
At December 31, 2014, we had approximately 8,920 full-time employees (including approximately 3,410 at Oncor). Approximately 2,580 employees are under collective bargaining agreements (including approximately 640 at Oncor).
Chapter 11 Cases
On April 29, 2014 (the Petition Date), EFH Corp. and the substantial majority of its direct and indirect subsidiaries, including EFIH, EFCH and TCEH but excluding the Oncor Ring-Fenced Entities (the Debtors), filed voluntary petitions for relief (the Bankruptcy Filing) under Chapter 11 of the United States Bankruptcy Code (the Bankruptcy Code) in the United States Bankruptcy Court for the District of Delaware (the Bankruptcy Court). During the pendency of the Bankruptcy Filing (the Chapter 11 Cases), the Debtors will operate their businesses as debtors-in-possession under the jurisdiction of the Bankruptcy Court and in accordance with the applicable provisions of the Bankruptcy Code. We intend to conduct our business operations in the normal course and maintain our focus on achieving excellence in customer service and meeting the needs of electricity consumers in Texas.
Consistent with the ring-fencing measures discussed above, the assets and liabilities of the Oncor Ring-Fenced Entities have not been, and are not expected to be, substantively consolidated with the assets and liabilities of the Debtors in the Chapter 11 Cases.
For additional discussion of the Chapter 11 Cases and the effects on us, see Note 2 to the Financial Statements and Item 1A, Risk Factors – Risks Related to Chapter 11 Cases. See Note 11 to the Financial Statements for discussion of the DIP Facilities.
EFH Corp.'s Market
We operate primarily within the ERCOT electricity market. This market represents approximately 90% of the electricity consumption in Texas. ERCOT is the regional reliability coordinating organization for member electricity systems in Texas and the Independent System Operator of the interconnected transmission grid for those systems. ERCOT's membership consists of approximately 300 corporate and associate members, including electric cooperatives, municipal power agencies, independent generators, independent power marketers, investor-owned utilities, REPs and consumers.
The ERCOT market operates under reliability standards set by the NERC. The PUCT has primary jurisdiction over the ERCOT market to ensure adequacy and reliability of power supply across Texas' main interconnected transmission grid. ERCOT is responsible for scheduling power on the grid and maintaining reliable operations of the electricity supply system. Its responsibilities include centralized dispatch of the power pool and ensuring that electricity production and delivery are accurately accounted for among the generation resources and wholesale buyers and sellers. ERCOT also serves as agent for procuring ancillary services for those members who elect not to provide their own ancillary services.
Oncor, along with other owners of transmission and distribution facilities in Texas, assists ERCOT in its operations. Oncor has planning, design, construction, operation and maintenance responsibility for the portion of the transmission grid and for the load-serving substations it owns, primarily within its certificated distribution service area. Oncor participates with ERCOT and other ERCOT utilities in obtaining regulatory approvals and planning, designing, constructing and upgrading transmission lines in order to remove existing constraints and interconnect generation on the ERCOT transmission grid. The transmission line projects are necessary to meet reliability needs, support energy production and increase bulk power transfer capability.
Installed generation capacity in the ERCOT market for the year 2014 totaled approximately 90,600 MW, including approximately 2,500 MW of mothballed (idled) capacity and approximately 11,500 MW of wind and other resources that may not be available coincident with system need. Texas has more installed wind generation capacity than any other state in the US. In 2014, ERCOT's hourly demand peaked at 66,454 MW as compared to peak hourly demand of 67,245 MW in 2013. Of ERCOT's total installed capacity, approximately 59% is natural gas fueled generation, approximately 27% is lignite/coal and nuclear fueled generation and approximately 14% is wind and other renewable resources.
The ERCOT market has limited interconnections to other markets in the US and Mexico, which currently limits potential imports into, and exports out of, the ERCOT market to 1,100 MW of generation capacity (or approximately 2% of peak demand). In addition, wholesale transactions within the ERCOT market are generally not subject to regulation by the FERC.
Natural gas fueled generation is the predominant electricity capacity resource (approximately 59%) in the ERCOT market and accounted for approximately 41% of the electricity produced in the ERCOT market in 2014. Because of the significant amount of natural gas fueled capacity and the ability of such facilities to more readily increase or decrease production when compared to nuclear and lignite/coal fueled generation, marginal demand for electricity in ERCOT is usually met by natural gas fueled facilities. As a result, wholesale electricity prices in ERCOT have generally moved with natural gas prices.
EFH Corp.'s Strategies
Each of our businesses focuses its operations on key safety, reliability, economic and environmental drivers for that business, as described below:
| |
| • | TCEH focuses on optimizing and developing its generation fleet to safely provide reliable electricity supply in a cost-effective manner and in consideration of environmental impacts, hedging its commodity price and volume exposure and providing high quality service and innovative energy products to retail and wholesale customers. |
| |
| • | Oncor focuses on delivering electricity in a safe and reliable manner, minimizing service interruptions and investing in its transmission and distribution infrastructure to maintain its system, serving its growing customer base with a modernized grid and supporting energy production. |
Other elements of our strategies include:
| |
| • | Increase value from existing business lines. We strive for top-tier performance across our operations in terms of safety, reliability, cost and customer service. In establishing strategic objectives, we incorporate the following core operating principles: |
| |
| • | Safety: Placing the safety of communities, customers and employees first; |
| |
| • | Environmental Stewardship: Continuing to make strategic and operational improvements that lead to cleaner air, land and water; |
| |
| • | Customer Focus: Delivering products and superior service to help customers more effectively manage their use of electricity; |
| |
| • | Community Focus: Being an integral part of the communities in which we live, work and serve; |
| |
| • | Operational Excellence: Incorporating continuous improvement and financial discipline in all aspects of the business to achieve top-tier results that maximize our value, including operating world-class facilities that produce and deliver safe and dependable electricity at affordable prices, and |
| |
| • | Performance-Driven Culture: Fostering a strong values- and performance-based culture designed to attract, develop and retain best-in-class talent. |
| |
| • | Drive and support growth of the ERCOT market. We expect to pursue growth opportunities across our existing business lines, including: |
| |
| • | Pursuing generation development opportunities to help meet ERCOT's growing electricity needs over the longer term from a diverse range of energy sources such as natural gas, nuclear and renewable energy. |
| |
| • | Profitably increasing the number of retail customers served throughout the competitive ERCOT market areas by delivering superior value through high quality customer service and innovative energy products, including leading energy efficiency initiatives and service offerings. |
| |
| • | Investing in transmission and distribution and constructing transmission and distribution facilities to meet the needs of the growing Texas market. |
| |
| • | Manage exposure to wholesale electricity price volatility. We actively manage our exposure to wholesale electricity prices in ERCOT through contracts for physical delivery of electricity, exchange traded and over-the-counter financial contracts, ERCOT day-ahead market transactions and bilateral contracts with other wholesale market participants, including other generators and end-use customers. These hedging activities include shorter-term agreements, longer-term electricity sales contracts and forward sales of natural gas. The historical correlation between natural gas prices and wholesale electricity prices in the ERCOT market has provided us an opportunity to manage our exposure to variability of wholesale electricity prices through natural gas hedging activities. See Item 7, Management's Discussion and Analysis of Financial Condition and Results of Operations – Significant Activities and Events and Items Influencing Future Performance – Natural Gas Hedging Program and Termination of Positions. |
| |
| • | Pursue new environmental initiatives. We are committed to continue to operate in compliance with all environmental laws, rules and regulations and to reduce our impact on the environment. EFH Corp.'s Sustainable Energy Advisory Board advises us in our pursuit of technology development opportunities that reduce our impact on the environment while balancing the need to help address the energy requirements of Texas. The Sustainable Energy Advisory Board is comprised of individuals who represent the following interests, among others: environmental conservation, labor unions, customers, economic development in Texas and technology/reliability standards. See Environmental Regulations and Related Considerations below for discussion of actions we are taking to reduce emissions from our generation facilities and our investments in energy efficiency and related initiatives. |
Seasonality
Our revenues and results of operations are subject to seasonality, weather conditions and other electricity usage drivers, with revenues being highest in the summer.
Operating Segments
We have aligned and report our business activities as two operating segments: the Competitive Electric segment, consisting largely of TCEH and its subsidiaries, and the Regulated Delivery segment, consisting largely of our investment in Oncor. See Note 20 to the Financial Statements for additional financial information for the segments.
Competitive Electric Segment
Key activities, including risk management related to commodity price and availability, as well as electricity sourcing for our retail and wholesale customers, are performed on an integrated basis. This integration strategy, the execution of which is discussed below in describing the activities of our wholesale operations, is a key consideration in our operating segment determination. For purposes of market identity and operational accountability, our operations are grouped and identified as Luminant, which is engaged in electricity generation and wholesale markets activities, and TXU Energy, which is engaged in retail electricity activities. These activities are conducted through separate legal entities.
Luminant — Luminant's existing fleet consists of 36 electricity generation units in Texas, all of which are owned, with total installed nameplate generating capacity as shown in the table below:
|
| | | | | | | | |
| Fuel Type | Installed Nameplate Capacity (MW) | | Number of
Plant Sites | | Number of
Units |
| Nuclear | 2,300 |
| | 1 |
| | 2 |
|
| Lignite/coal | 8,017 |
| | 5 |
| | 12 |
|
| Natural gas (a) | 3,455 |
| | 7 |
| | 22 |
|
| Total | 13,772 |
| | 13 |
| | 36 |
|
___________
| |
| (a) | Excludes four units at two plant sites representing 1,655 MW of capacity that Luminant plans to retire in June 2015. |
The generation units are located primarily on owned land. Nuclear and lignite/coal fueled units are generally scheduled to run at capacity except for periods of scheduled maintenance activities; however, we reduce production from certain lignite/coal fueled generation units, referred to as economic backdown, during periods when wholesale electricity prices are less than the unit's variable production costs. In addition, we have implemented seasonal suspensions of operations of certain lignite/coal fueled generation units because of the low wholesale electricity price environment. The natural gas fueled generation units supplement the nuclear and lignite/coal fueled generation capacity in meeting consumption in peak demand periods as production from certain of these units, particularly combustion-turbine units, can be more readily ramped up or down as demand warrants.
Nuclear Generation Operations — Luminant operates two nuclear generation units at the Comanche Peak plant site, each of which is designed for a capacity of 1,150 MW. Comanche Peak Unit 1 and Unit 2 went into commercial operation in 1990 and 1993, respectively, and are generally operated at full capacity. Refueling (nuclear fuel assembly replacement) outages for each unit are scheduled to occur every eighteen months during the spring or fall off-peak demand periods. Every three years, the refueling cycle results in the refueling of both units during the same year, which occurred in 2014. While one unit is undergoing a refueling outage, the remaining unit is intended to operate at full capacity. During a refueling outage, other maintenance, modification and testing activities are completed that cannot be accomplished when the unit is in operation. Over the last three years the refueling outage period per unit has ranged from 22 to 54 days. The Comanche Peak facility operated at a capacity factor of 92.5%, 101.7% and 98.5% in 2014, 2013 and 2012, respectively.
Luminant has contracts in place for the majority of its nuclear fuel requirements for 2015. Luminant has contracts in place for more than 50% of its nuclear fuel conversion services requirements through 2019. In addition, Luminant has contracts in place for all of its nuclear fuel fabrication services through 2018, as well as all of its nuclear fuel enrichment services through 2019. Luminant does not anticipate any significant difficulties in acquiring uranium and contracting for associated conversion, enrichment and fabrication services in the foreseeable future.
The nuclear industry has developed ways to store used nuclear fuel on site at nuclear generation facilities, primarily through the use of dry cask storage, since there are no facilities for reprocessing or disposal of used nuclear fuel currently in operation in the US. Luminant stores its used nuclear fuel on-site in storage pools or dry cask storage facilities and believes its on-site used nuclear fuel storage capability is sufficient for the foreseeable future.
The Comanche Peak nuclear generation units have an estimated useful life of 60 years from the date of commercial operation. Therefore, assuming that Luminant receives 20-year license extensions, similar to what has been granted by the NRC to several other commercial generation reactors over the past several years, decommissioning activities would be scheduled to begin in 2050 for Comanche Peak Unit 1 and 2053 for Unit 2 and common facilities. Decommissioning costs will be paid from a decommissioning trust that, pursuant to Texas law, is intended to be fully funded from Oncor's customers through an ongoing delivery surcharge. (See Note 21 to the Financial Statements for discussion of the decommissioning trust fund.) Under applicable law, the Bankruptcy Filing is not expected to have any effect on the collection of such surcharge or the ongoing viability of the decommissioning trust.
Nuclear insurance provisions are discussed in Note 13 to the Financial Statements.
Nuclear Generation Development — In 2008, we filed a combined operating license application with the NRC for two new nuclear generation units, each with approximately 1,700 MW (gross capacity), at our existing Comanche Peak nuclear plant site. In connection with the filing of the application, in 2009, subsidiaries of TCEH and Mitsubishi Heavy Industries Ltd. (MHI) formed a joint venture, Comanche Peak Nuclear Power Company LLC (CPNPC), to further the development of the two new nuclear generation units using MHI's US-Advanced Pressurized Water Reactor (US-APWR) technology. In the fourth quarter 2014, MHI withdrew from the joint venture, and the TCEH subsidiary now owns 100% of CPNPC.
In the fourth quarter 2013, MHI notified us and the NRC of its plans to refocus MHI's US resources on the restart of 24 nuclear reactors in Japan and thus reduce its support of review activities related to the NRC's Design Certification of MHI's US-APWR technology. As a result, Luminant notified the NRC of its intent to suspend all reviews associated with the combined operating license application by March 31, 2014. Luminant does not intend to withdraw the license application at this time. MHI expressed to the NRC its continuing commitment to obtaining an NRC design certification for its technology. Luminant has filed a loan guarantee application with the DOE for financing the proposed units prior to commencement of construction and expects to continue to update the application in accordance with the loan solicitation guidelines. See Note 8 to the Financial Statements for discussion of impairment of the joint venture's assets in 2013.
Lignite/Coal Fueled Generation Operations — Luminant's lignite/coal fueled generation fleet capacity totals 8,017 MW and consists of the Big Brown (2 units), Monticello (3 units), Martin Lake (3 units), Oak Grove (2 units) and Sandow (2 units) plant sites. Maintenance outages at these units are scheduled during the spring or fall off-peak demand periods. Over the last three years, the total annual scheduled and unscheduled outages per unit averaged 40 days in duration. Luminant's lignite/coal fueled generation fleet operated at a capacity factor of 69.6% in 2014, 74.1% in 2013 and 70.0% in 2012. This performance reflects increased economic backdown of the units and the seasonal suspension of certain units as discussed above.
Luminant meets all of its fuel requirements at its Oak Grove and Sandow generation facilities with lignite that it mines. Luminant meets its fuel requirements for its Big Brown, Monticello and Martin Lake generation units by blending lignite it mines with coal purchased from multiple suppliers under contracts of various lengths and transported from the Powder River Basin to Luminant's generation plants by railcar. In 2014, approximately 56% of the fuel used at the Big Brown, Monticello and Martin Lake generation facilities and 73% of the fuel used at all of Luminant’s lignite/coal fueled generation facilities was supplied from surface minable lignite reserves dedicated to our generation plants, which are located adjacent to the reserves.
As a result of projected mining development costs, current economic forecasts and regulatory uncertainty, in 2014, Luminant decided to transition the fuel plans at its Big Brown and Monticello generation facilities to be fully fueled with coal from the Powder River Basin. As a result, it plans to discontinue lignite mining operations at these sites once mining and reclamation of current mine sites is complete. Lignite mining and the majority of reclamation activities at these facilities is expected to be completed by the end of 2020 unless economic forecasts and increased regulatory certainty justify additional mine development. See Note 8 to the Financial Statements for discussion of the impairment of certain generation facilities and related mining facilities and the write off of certain mine development costs.
Luminant is the ninth-largest coal miner in the US and the largest lignite coal miner in Texas. Luminant owns or has under lease an estimated 730 million tons of lignite reserves dedicated to our generation plants, including an undivided interest in approximately 170 million tons of lignite reserves that provide fuel for the Sandow facility. Luminant also owns or has under lease approximately 85 million tons of reserves not currently dedicated to specific generation plants. In 2014, Luminant recovered approximately 30 million tons of lignite to fuel its generation plants. Luminant utilizes owned and/or leased equipment to remove the overburden and recover the lignite. Based on its current planned usage, Luminant believes that it has sufficient lignite reserves for the foreseeable future and has contracted all of its anticipated Powder River Basin coal requirements and related transportation through 2015.
Luminant's lignite mining operations include extensive reclamation activities that return the land to productive uses such as wildlife habitats, commercial timberland and pasture land. In 2014, Luminant reclaimed more than 1,500 acres of land. In addition, Luminant planted 1.5 million trees in 2014, the majority of which were part of the reclamation effort.
See Environmental Regulations and Related Considerations – Sulfur Dioxide, Nitrogen Oxide and Mercury Air Emissions for discussion of potential effects of recent EPA rules on future operations of our generation units.
Natural Gas Fueled Generation Operations — Luminant owns a fleet of 22 natural gas fueled generation units, of which 7 are steam generation units totaling 2,480 MW of capacity and 15 are combustion turbine generation units totaling 975 MW of capacity. These amounts do not include four steam generation units representing 1,655 MW of capacity that Luminant plans to retire in June 2015. The natural gas fueled units predominantly serve as peaking units that can be ramped up or down to balance electricity supply and demand.
Natural Gas Fueled Generation Development — In 2013 and 2014, the TCEQ granted air permits to Luminant to build two natural gas combustion turbine generation units totaling 420 MW to 460 MW at each of Luminant's existing Decordova, Tradinghouse and Lake Creek generation facilities. In 2014 and 2015, Luminant filed air permit applications with the TCEQ to build two natural gas combustion turbine generation units totaling 420 MW to 460 MW at each of its existing Valley and Permian Basin generation facilities. In 2014, Luminant filed air permit applications with the TCEQ to build a combined cycle natural gas generation unit totaling 730 MW to 810 MW at each of its existing Eagle Mountain and DeCordova generation facilities. In 2015, Luminant filed an air permit application with the TCEQ to build two combined cycle natural gas generation units totaling 1460 MW to 1620 MW at its Tradinghouse generation facility. The proposed combined cycle natural gas generation units would be an alternative to the natural gas combustion turbine generation units at DeCordova and Tradinghouse. We believe current market conditions do not provide adequate economic returns for the development or construction of these facilities; however, we believe additional generation resources will be needed in the future to support electricity demand growth and reliability in the ERCOT market.
Wholesale Operations — Luminant's wholesale operations play a pivotal role in our Competitive Electric segment by optimally dispatching the generation fleet, procuring fuels for the generation fleet, sourcing all of TXU Energy's electricity requirements and managing commodity risk for the retail and wholesale electricity sales operations.
Our electricity price exposure is managed across the complementary generation, wholesale and retail operations on an integrated basis. Under this approach, Luminant's wholesale operations manage the risks of imbalances between generation supply and sales load, as well as exposures to natural gas price movements and market heat rate changes (variations in the relationships between natural gas prices and wholesale electricity prices), through wholesale market activities that include physical purchases and sales and transacting in financial instruments.
Luminant's wholesale operations provide TXU Energy and other retail and wholesale customers with electricity-related services to meet their demands and the operating requirements of ERCOT. In consideration of electricity generation resource availability and consumer demand levels that can be highly variable, as well as opportunities to meet longer-term objectives of larger wholesale market participants, Luminant buys and sells electricity in short-term transactions and executes longer-term forward electricity purchase and sales agreements. Luminant is also one of the largest purchasers of wind-generated electricity in Texas and the US with approximately 650 MW of existing wind power under contract.
Fuel price exposure, primarily relating to Powder River Basin coal, natural gas, uranium and fuel oil, as well as fuel transportation costs, is managed primarily through short- and long-term contracts for physical delivery of fuel as well as financial contracts.
In its hedging activities, Luminant enters into contracts for the physical delivery of electricity and fuel commodities, exchange traded and over-the-counter financial contracts and bilateral contracts with other wholesale market participants, including generators and end-use customers. A significant element of these activities involves natural gas hedging, described above under EFH Corp.'s Strategies, designed to reduce exposure to changes in future electricity prices due to changes in the price of natural gas, principally utilizing natural gas-related financial instruments.
The wholesale operations also dispatch Luminant's available generation capacity. These dispatching activities include economic backdown of lignite/coal fueled units and ramping up and down of natural gas fueled units as market conditions warrant. Luminant's dispatching activities are performed on a centrally managed real-time basis optimizing operational activities across the fleet and interfacing with various wholesale market channels. In addition, the wholesale operations manage the fuel procurement requirements for Luminant's fossil fuel and nuclear generation facilities.
Luminant's wholesale operations include electricity and natural gas trading and third-party energy management activities. Natural gas transactions include direct purchases from natural gas producers, transportation agreements, storage leases and commercial retail sales. Luminant currently manages approximately 10.5 billion cubic feet of natural gas storage capacity.
Luminant's wholesale operations manage exposure to wholesale commodity and credit-related risk within established transactional risk management policies, limits and controls. These policies, limits and controls have been structured so that they are practical in application and consistent with stated business objectives. Risk management processes include capturing transaction data, monitoring transaction types and notional limits, reviewing and managing credit risk, performing and validating valuations and reporting exposures on a daily basis using risk management information systems designed to support a large transactional portfolio. Risk management also includes a disciplinary program to address any violations of the policies and periodic reviews of these policies to ensure they are responsive to changing market and business conditions.
TXU Energy — TXU Energy serves 1.7 million residential and commercial retail electricity customers in Texas. Approximately 67% of our reported retail revenues in 2014 represented sales to residential customers. Texas is one of the fastest growing states in the nation with a diverse economy and, as a result, has attracted a number of competitors into the retail electricity market; consequently, competition is robust. TXU Energy, as an active participant in this competitive market, provides retail electric service to all areas of the ERCOT market now open to competition, including the Dallas/Fort Worth area, Houston, Corpus Christi, and certain other parts of south Texas, and holds an approximately 25% and 19% share of the residential and business customers in ERCOT, respectively. TXU Energy competitively markets its services to add new customers and retain its existing customer base, as well as opportunistically acquire customers from other REPs. There are more than 100 REPs certified to compete within the ERCOT region. Based upon data published by the PUCT, at June 30, 2014, approximately 63% of residential customers and 70% of small commercial customers in competitive areas of ERCOT are served by REPs not affiliated with the pre-competition utility. TXU Energy is a REP affiliated with a pre-competition utility, considering EFH Corp.'s history prior to the deregulation of the Texas market.
TXU Energy's strategy focuses on providing its customers with high quality customer service and creating new products and services to meet customer needs; accordingly, customer care enhancements are implemented on an ongoing basis to continually improve customer satisfaction. TXU Energy offers a wide range of residential products to meet varying customer needs and has invested more than $100 million in energy efficiency initiatives since the Merger as part of a program to offer customers a broad set of innovative energy products and services.
Regulation — Luminant is an exempt wholesale generator under the Energy Policy Act of 2005 and is subject to the jurisdiction of the NRC with respect to its nuclear generation plant. NRC regulations govern the granting of licenses for the construction and operation of nuclear fueled generation facilities and subject such facilities to continuing review and regulation. In addition, Luminant is subject to the jurisdiction of the RCT's oversight of its lignite mining and reclamation operations.
Luminant is also subject to the jurisdiction of the PUCT's oversight of the competitive ERCOT wholesale electricity market. PUCT rules establish a framework for and robust oversight of wholesale electricity pricing and market behavior. Luminant is also subject to the requirements of the ERCOT Nodal Protocols as well as reliability standards adopted and enforced by the TRE and the NERC, including NERC critical infrastructure protection (CIP) standards. Luminant is also subject to the authority of the CFTC as it continues to implement rules and provide oversight vested in the agency by the Wall Street Reform and Consumer Protection Act of 2010, particularly Title VII, which deals with over-the-counter derivative markets.
TXU Energy is a licensed REP under the Texas Electric Choice Act and is subject to the jurisdiction of the PUCT with respect to provision of electricity service in ERCOT. PUCT rules govern the granting of licenses for REPs, including oversight but not setting of retail prices. TXU Energy is also subject to the requirements of the ERCOT Nodal Protocols.
Regulated Delivery Segment
The Regulated Delivery segment consists largely of our investment in Oncor. Oncor is a regulated electricity transmission and distribution company that provides the service of delivering electricity safely, reliably and economically to end-use consumers through its electrical systems, as well as providing transmission grid connections to merchant generation facilities and interconnections to other transmission grids in Texas. Oncor's service territory comprises 91 counties and more than 400 incorporated municipalities, including Dallas/Fort Worth and surrounding suburbs, as well as Waco, Wichita Falls, Odessa, Midland, Tyler and Killeen. Oncor's transmission and distribution assets are located principally in the north-central, eastern and western parts of Texas. Most of Oncor's power lines have been constructed over lands of others pursuant to easements or along public highways, streets and rights-of-way as permitted by law. Oncor's transmission and distribution rates are regulated by the PUCT.
Oncor is not a seller of electricity, nor does it purchase electricity for resale. It provides transmission services to electricity distribution companies, cooperatives and municipalities. It provides distribution services to REPs, including subsidiaries of TCEH, which sell electricity to residential, business and other consumers. Oncor is also subject to the requirements of the ERCOT Nodal Protocols as well as reliability standards adopted and enforced by the TRE and the NERC, including NERC CIP standards.
Performance — Oncor achieved or exceeded market performance protocols in 12 out of 14 PUCT market metrics in 2014. These metrics measure the success of transmission and distribution companies in facilitating customer transactions in the competitive Texas electricity market.
Investing in Infrastructure and Technology — In 2014, Oncor invested approximately $1.1 billion in its network to construct, rebuild and upgrade transmission lines and associated facilities, to extend the distribution infrastructure and to pursue certain initiatives in infrastructure maintenance and information technology.
Oncor's technology upgrade initiatives include development of a modernized grid through advanced digital communication, data management, real-time monitoring and outage detection capabilities to take advantage of Oncor's deployment of advanced digital metering equipment. This modernized grid is producing electricity service reliability improvements and providing for additional products and services from REPs that enable businesses and consumers to better manage their electricity usage and costs.
Electricity Transmission — Oncor's electricity transmission business is responsible for the safe and reliable operations of its transmission network and substations. These responsibilities consist of the construction and maintenance of transmission facilities and substations and the monitoring, controlling and dispatching of high-voltage electricity over Oncor's transmission facilities in coordination with ERCOT.
Oncor is a member of ERCOT, and its transmission business actively assists the operations of ERCOT and market participants. Through its transmission business, Oncor participates with ERCOT and other member utilities to plan, design, construct and operate new transmission lines, with regulatory approval, necessary to maintain reliability, interconnect to merchant generation facilities, increase bulk power transfer capability and minimize limitations and constraints on the ERCOT transmission grid.
Transmission revenues are provided under tariffs approved by either the PUCT or, to a small degree related to an interconnection to other markets, the FERC. Network transmission revenues compensate Oncor for delivery of electricity over transmission facilities operating at 60 kilovolt (kV) and above. Other services offered by Oncor through its transmission business include system impact studies, facilities studies, transformation service and maintenance of transformer equipment, substations and transmission lines owned by other parties.
PURA allows Oncor to update its transmission rates periodically to reflect changes in invested capital. This capital tracker provision encourages investment in the transmission system to help ensure reliability and efficiency by allowing for timely recovery of and return on new transmission investments.
At December 31, 2014, Oncor's transmission facilities included 6,447 circuit miles of 345kV transmission lines and 9,634 circuit miles of 138kV and 69kV transmission lines. Sixty-seven generation facilities totaling 36,410 MW were directly connected to Oncor's transmission system at December 31, 2014, and 292 transmission stations and 715 distribution substations were served from Oncor's transmission system.
At December 31, 2014, Oncor's transmission facilities had the following connections to other transmission grids in Texas:
|
| | | | | | | | |
| | Number of Interconnected Lines |
| Grid Connections | 345kV | | 138kV | | 69kV |
| Brazos Electric Power Cooperative, Inc. | 8 |
| | 113 |
| | 23 |
|
| Rayburn Country Electric Cooperative, Inc. | — |
| | 39 |
| | 6 |
|
| Lower Colorado River Authority | 10 |
| | 23 |
| | 2 |
|
| Texas New Mexico Power | 4 |
| | 10 |
| | 12 |
|
| Tex-La Electric Cooperative of Texas, Inc. | — |
| | 12 |
| | 1 |
|
| American Electric Power Company, Inc. (a) | 5 |
| | 7 |
| | 11 |
|
| Texas Municipal Power Agency | 7 |
| | 6 |
| | — |
|
| Lone Star Transmission | 12 |
| | — |
| | — |
|
| Centerpoint Energy Inc. | 8 |
| | — |
| | — |
|
| Sharyland Utilities, L.P. | — |
| | 8 |
| | — |
|
| Electric Transmission Texas, LLC | 6 |
| | 1 |
| | — |
|
| Other small systems operating wholly within Texas | 6 |
| | 7 |
| | 3 |
|
___________
| |
| (a) | One of the 345kV lines is an asynchronous high-voltage direct current connection with the Southwest Power Pool. |
Electricity Distribution — Oncor's electricity distribution business is responsible for the overall safe and efficient operation of distribution facilities, including electricity delivery, power quality and system reliability. These responsibilities consist of the ownership, management, construction, maintenance and operation of the distribution system within Oncor's certificated service area. Oncor's distribution system receives electricity from the transmission system through substations and distributes electricity to end-users and wholesale customers through 3,207 distribution feeders.
The Oncor distribution system included over 3.3 million points of delivery at December 31, 2014. Over the past five years, the number of distribution system points of delivery served by Oncor, excluding lighting sites, grew an average of 1.28% per year. Oncor added approximately 49,100 points of delivery in 2014.
The Oncor distribution system consists of 56,907 miles of overhead primary conductors, 21,541 miles of overhead secondary and street light conductors, 16,517 miles of underground primary conductors and 10,203 miles of underground secondary and street light conductors. The majority of the distribution system operates at 25kV and 12.5kV.
Oncor's distribution revenues from residential and small business users are based on actual monthly consumption (kWh), and, depending on size and annual load factor, revenues from large commercial and industrial users are based either on actual monthly demand (kilowatts) or the greater of actual monthly demand (kilowatts) or 80% of peak monthly demand during the prior eleven months.
The PUCT allows Oncor to file, under certain circumstances, up to four rate adjustments between rate reviews to recover distribution-related investments on an interim basis.
Customers — Oncor's transmission customers consist of municipalities, electric cooperatives and other distribution companies. Oncor's distribution customers consist of approximately 80 REPs, including TCEH's retail sales operations and certain electric cooperatives in Oncor's certificated service area. Revenues from services provided to TCEH represented 25% of Oncor's total reported consolidated revenues for 2014. Revenues from REP subsidiaries of one nonaffiliated entity, NRG Energy, Inc., collectively represented 16% of Oncor's total reported consolidated revenues for 2014. No other customer represented more than 10% of Oncor's total operating revenues. The consumers of the electricity delivered by Oncor are free to choose their electricity supplier from REPs who compete for their business.
Regulation and Rates — As its operations are wholly within Texas, Oncor is not a public utility as defined in the Federal Power Act and, as a result, it is not subject to general regulation under that Act. However, Oncor is subject to reliability standards adopted and enforced by the TRE and the NERC, including NERC CIP standards, under the Federal Power Act.
The PUCT has original jurisdiction over transmission and distribution rates and services in unincorporated areas and in those municipalities that have ceded original jurisdiction to the PUCT and has exclusive appellate jurisdiction to review the rate and service orders and ordinances of municipalities. Generally, PURA prohibits the collection of any rates or charges by a public utility (as defined by PURA) that does not have the prior approval of the appropriate regulatory authority (i.e., the PUCT or the municipality with original jurisdiction).
At the state level, PURA requires owners or operators of transmission facilities to provide open-access wholesale transmission services to third parties at rates and terms that are nondiscriminatory and comparable to the rates and terms of the utility's own use of its system. The PUCT has adopted rules implementing the state open-access requirements for all utilities that are subject to the PUCT's jurisdiction over transmission services, including Oncor.
Securitization Bonds — Oncor's operations include its wholly owned, bankruptcy-remote financing subsidiary, Oncor Electric Delivery Transition Bond Company LLC. This financing subsidiary was organized for the limited purpose of issuing certain securitization (transition) bonds in 2003 and 2004. Oncor Electric Delivery Transition Bond Company LLC issued $1.3 billion principal amount of transition bonds to recover generation-related regulatory asset stranded costs and other qualified costs under an order issued by the PUCT in 2002. At December 31, 2014, aggregate principal amounts of transition bonds outstanding, which mature in 2015 and 2016, totaled $180 million. See Note 19 to the Financial Statements for discussion of agreements between TCEH and Oncor regarding payment of interest and incremental taxes related to these bonds that were settled in 2012.
Environmental Regulations and Related Considerations
Global Climate Change
Background — There is a debate nationally and internationally about global climate change and how greenhouse gas (GHG) emissions, such as CO2, might contribute to global climate change. GHG emissions from the combustion of fossil fuels, primarily by our lignite/coal fueled generation plants, represent the substantial majority of our total GHG emissions. CO2, methane and nitrous oxide are emitted in this combustion process, with CO2 representing the largest portion of these GHG emissions. We estimate that our generation facilities produced 57 million short tons of CO2 in 2014. Other aspects of our operations result in emissions of GHGs including, among other things, slight methane emissions from coal production and storage at our mines and generation facilities, sulfur hexafluoride releases from transmission and distribution equipment, incidental refrigerant emissions from our chilling and cooling equipment, products of fossil fuel combustion from our motor vehicles and mining equipment and emissions related to electricity usage at our facilities and headquarters. Our financial condition, liquidity or results of operations could be materially affected by the enactment of statutes or regulations that mandate a reduction in GHG emissions or that impose financial penalties, costs or taxes on those that produce GHG emissions. See Item 1A, Risk Factors for additional discussion of risks posed to us regarding global climate change regulation.
Recent Global Climate Change Legislation — Federal Level — Over the past several years, the EPA has taken a number of actions regarding GHG emissions. In December 2009, the EPA issued a finding that GHG emissions endanger human health and the environment and that emissions from motor vehicles contribute to that endangerment. The EPA's finding required it to begin regulating GHG emissions from motor vehicles, and the EPA ultimately extended regulation of GHG emissions to stationary sources under existing provisions of the federal Clean Air Act (CAA). In March 2010, the EPA determined that the CAA's Prevention of Significant Deterioration (PSD) program permit requirements would apply to newly identified pollutants such as GHGs when a nation-wide rule requiring the control of a pollutant takes effect. Under this determination, PSD permitting requirements became applicable to GHG emissions from planned stationary sources or planned modifications to stationary sources that had not been issued a PSD permit by January 2, 2011 - the first date that new motor vehicles were required to meet the new GHG standards. In June 2010, the EPA finalized its so-called "tailoring rule" that established new thresholds of GHG emissions for the applicability of permits under the CAA for stationary sources, including our electricity generation facilities. The EPA's tailoring rule defined a threshold of GHG emissions for determining applicability of the CAA's PSD and Title V permitting programs at levels greater than the emission thresholds contained in the CAA. In June 2014, the US Supreme Court ruled that the EPA's regulation of GHG emissions from motor vehicles did not mandate that the EPA implement permit requirements for stationary source GHGs, but upheld the EPA's permitting program in situations where the source is already required to permit emissions that have historically been covered under the CAA. The case was remanded to the D.C. Circuit Court for further proceedings consistent with the US Supreme Court's decision.
The EPA has proposed three rules to address greenhouse gas (GHG) emissions from new, modified and reconstructed, and existing electricity generation plants. In January 2014, the EPA proposed standards to regulate CO2 emissions from new electricity generation plants. Luminant filed comments on the proposed standards for new sources in May 2014. In June 2014, the EPA proposed two additional rules: 1) guidelines for states to develop standards that address CO2 emissions from existing electricity generation plants, and 2) proposed standards for modified and reconstructed electricity generation plants. The proposed guidelines for existing plants would establish state-specific emission rate goals to reduce nationwide CO2 emissions related to electricity generation by approximately 17% from 2012 emission levels by 2030. For Texas, the EPA would establish an interim emission rate goal for the electricity generation sector of 853 pounds CO2/MWh averaged between 2020-2029 and a final emission rate goal of 791 pounds CO2/MWh by 2030. The 2030 goal represents an approximate 40% reduction in the CO2 emission rate for Texas electricity generation using EPA's 2012 baseline and calculation methodology. The EPA developed this emission rate goal based on the application of a six percent efficiency improvement in converting fuel to electricity, an increase in the dispatch of natural gas combined cycle units, an increase in renewable electricity generation in the state and assumptions about improvement in demand side management of electricity use. In September 2014, the comment deadline on the proposed guidelines for existing electricity generation plants was extended 45 days to December 1, 2014. Luminant filed comments on the proposed guidelines for modified and reconstructed sources in October 2014. The EPA is expected to finalize the guidelines by summer 2015. Under the proposed guidelines, states will be required to submit to the EPA their program plans by June 2016, but may request an extension if certain commitments are met. While we cannot predict the outcome of this rulemaking on our results of operations, liquidity or financial condition, the impacts could be material.
A number of members of the US Congress from both parties have introduced legislation to either block or delay EPA regulation of GHGs under the CAA, and legislative activity in this area in the future is possible.
State and Regional Level — There are currently no Texas state regulations in effect concerning GHGs, except for permitting in situations where the source is already required to permit emissions that have been traditionally covered by the CAA, and there are no regional initiatives concerning GHGs in which the State of Texas is a participant.
EFH Corp.'s Voluntary Energy Efficiency, Renewable Energy, and Global Climate Change Efforts — We are actively engaged in, considering, or expect to be actively engaged in, business activities that could result in reduced GHG emissions including:
| |
| • | Investing in Energy Efficiency and Related Initiatives by Our Competitive Businesses — Since the Merger, our competitive businesses have invested more than $100 million in energy efficiency and related initiatives, including software- and hardware-based services deployed behind the meter. These programs leverage advanced meter interval data and in-home devices to provide usage and other information to customers. Examples of these initiatives include: the TXU Energy MyEnergy DashboardSM, a set of online tools that show residential customers how and when they use electricity; the Online Energy Store providing customers cost-effective energy-saving products; the iThermostat, a web-enabled programmable thermostat; TXU Energy Right Time Pricing ProductsSM, including time-based electricity rates; the provision of GreenBack rebates to business customers for purchasing new energy efficient equipment for their facilities; the TXU Energy Electricity Usage Report, a weekly email that contains charts and graphs that give customers insight to better control their electricity usage and bills; and home warranty service plans that cover repair or replacement for various appliances such as heating and cooling systems in homes. |
| |
| • | Investing in Energy Efficiency Initiatives by Oncor — Oncor's technology upgrade initiatives include development of a modernized grid through advanced digital communication, data management, real-time monitoring and outage detection capabilities to take advantage of Oncor's deployment of advanced digital metering equipment. Advanced meters facilitate automated demand side management, which allows consumers to monitor the amount of electricity they are consuming and adjust their electricity consumption habits. |
| |
| • | Participating in the CREZ Program — Oncor has largely completed construction of CREZ transmission facilities (at a cost of approximately $2.0 billion) that are designed to connect existing and future renewable energy facilities to the electricity transmission system in ERCOT (see Item 7, Management's Discussion and Analysis of Financial Condition and Results of Operations – Significant Activities and Events and Items Influencing Future Performance – Oncor Matters with the PUCT). |
| |
| • | Purchasing Electricity from Renewable Sources — We expect to remain a leader in the ERCOT market in providing electricity from renewable sources by purchasing wind power. Our total wind power portfolio is currently approximately 650 MW. We also purchase additional renewable energy credits (RECs) to support sales of renewable power to our customers. |
| |
| • | Promoting the Use of Solar Power — TXU Energy provides qualified customers, through its TXU Energy SolarLeaseSM program, the ability to finance the addition of solar panels to their homes. TXU Energy also purchases surplus renewable distributed generation from qualified customers. In addition, TXU Energy's Solar Academy works with Texas school districts to teach and demonstrate the benefits of solar power. |
| |
| • | Investing in Technology — We continue to evaluate the development and commercialization of cleaner power facility technologies, including technologies that support sequestration and/or reduction of CO2; incremental renewable sources of electricity, including wind and solar power; energy storage, including advanced battery and compressed air storage, as well as related technologies that seek to lower emissions intensity. Additionally, we continue to explore and participate in opportunities to accelerate the adoption of electric cars and plug-in hybrid electric vehicles that have the potential to reduce overall GHG emissions and are furthering the advance of such vehicles by supporting, and helping develop infrastructure for, networks of charging stations for electric vehicles. |
| |
| • | Offsetting GHG Emissions by Planting Trees — We are engaged in a number of tree planting programs that offset GHG emissions, resulting in the planting of over 1.5 million trees in 2014. The majority of these trees were planted as part of our mining reclamation efforts but also include TXU Energy's Urban Tree Farm program, which has planted more than 194,000 trees since its inception in 2002. |
Sulfur Dioxide, Nitrogen Oxide and Mercury Air Emissions
Air Transport Regulations: Clean Air Interstate Rule (CAIR) and Cross-State Air Pollution Rule (CSAPR) — In 2005, the EPA issued CAIR, which was intended to implement the provisions of the Clean Air Act requiring states to reduce emissions of sulfur dioxide (SO2) and nitrogen oxide (NOX) that significantly contribute to other states failing to attain or maintain compliance with the EPA's National Ambient Air Quality Standards (NAAQS) for fine particulate matter and/or ozone. In 2008, the D.C. Circuit Court invalidated CAIR, but allowed the rule to continue until the EPA issued a final replacement rule.
In July 2011, the EPA issued the CSAPR, which was intended to replace CAIR. In February 2012, the EPA released a final rule (Final Revisions) and a proposed rule revising certain aspects of the CSAPR, including increases in the emissions budgets for Texas and our generation assets as compared to the July 2011 version of the rule. In June 2012, the EPA finalized the proposed rule (Second Revised Rule). As compared to the proposed revisions to the CSAPR issued by the EPA in October 2011, the Final Revisions and the Second Revised Rule finalize emissions budgets for our generation assets that are approximately 6% lower for SO2, 3% higher for annual NOx and 2% higher for seasonal NOx.
The CSAPR became effective January 1, 2015, but is still subject to further legal challenge before the D.C. Circuit Court on remand from the US Supreme Court. Oral argument took place in February 2015. While we cannot predict the outcome of future proceedings related to the CSAPR, based upon our current operating plans, including Mercury and Air Toxics Standard (MATS) compliance efforts, we do not believe that the CSAPR will have any material impact on our business, results of operations, liquidity or financial condition.
Mercury and Air Toxics Standard (MATS) — In December 2011, the EPA finalized the MATS rule, which regulates the emissions of mercury, nonmercury metals, hazardous organic compounds and acid gases. Any additional control equipment retrofits on our lignite/coal fueled generation units required to comply with the MATS rule as finalized would need to be installed within three to four years from the April 2012 effective date of the rule.
In November 2012, the EPA proposed revised standards for new coal fired generation units and other minor changes to the MATS rule, including changes to the work practice standards affecting all units. In March 2013, the EPA finalized the revised standards for new coal fired units and certain other minor changes but did not address the work practice standards. In June 2013, the EPA solicited comments on certain proposed changes to these work practice standards. In November 2014, the EPA published the final rule implementing work practice standards changes. In February 2015, the EPA finalized proposed corrections to the MATS rule. The TCEQ has granted one-year MATS compliance extensions for our Big Brown, Martin Lake, Monticello and Sandow 4 generation facilities.
In July 2014, certain parties filed petitions for certiorari with the US Supreme Court. In November 2014, the US Supreme Court granted review of the MATS case on the question of whether the EPA unreasonably refused to consider costs in determining whether it is appropriate to regulate hazardous air pollutants emitted by electric utilities. Oral argument is expected to take place in late March 2015. While we cannot predict the outcome of this proceeding, we do not expect any material impact on our results of operations, liquidity or financial condition as a result of the outcome of this proceeding.
Regional Haze — The Regional Haze Program of the CAA establishes "as a national goal the prevention of any future, and the remedying of any existing, impairment of visibility in mandatory Class I federal areas, like national parks, which impairment results from man-made pollution." There are two components to the Regional Haze Program. First, states must take measures to show reasonable progress towards a goal of natural visibility by 2064. Second, electricity generation units built between 1962 and 1977 are subject to best available retrofit technology (BART) standards designed to improve visibility. BART reductions of SO2 and NOX are required either on a unit-by-unit basis or are deemed satisfied by state participation in an EPA-approved regional trading program such as the CAIR or the CSAPR. In February 2009, the TCEQ submitted a State Implementation Plan (SIP) concerning regional haze (Regional Haze SIP) to the EPA. In December 2011, the EPA proposed a limited disapproval of the Regional Haze SIP due to its reliance on the CAIR and a Federal Implementation Plan (FIP) for Texas providing that the inclusion in the CSAPR programs meets the BART program's regional haze requirements for SO2 and NOX reductions. In August 2012, we filed a petition for review in the US Court of Appeals for the Fifth Circuit (Fifth Circuit Court) challenging the EPA's limited disapproval of the Regional Haze SIP on the grounds that the CAIR continued in effect pending the D.C. Circuit Court's decision in the CSAPR litigation. In September 2012, we filed a petition to intervene in a case filed by industry groups and other states and private parties in the D.C. Circuit Court challenging the EPA's limited disapproval and issuance of FIP regarding the regional haze BART program. The Fifth Circuit Court case has since been transferred to the D.C. Circuit Court and consolidated with other pending BART program regional haze appeals. The consolidated cases now in the D.C. Circuit Court are currently stayed. Following the US Supreme Court's ruling in the CSAPR described in Note 13 to the Financial Statements, the case remains stayed in the D.C. Circuit Court. In December 2014, the EPA filed an unopposed motion to continue to hold the case in abeyance pending a decision in the CSAPR litigation that is pending in the D.C. Circuit Court on remand from the US Supreme Court.
In response to a lawsuit by environmental groups, the D.C. Circuit Court issued a consent decree in March 2012 that required the EPA to propose a decision on the Regional Haze SIP by May 2012 and finalize that decision by November 2012. The consent decree requires a FIP for any provisions that the EPA disapproves. The D.C. Circuit amended the consent decree and extended the dates for the EPA to propose and finalize a decision on the Regional Haze SIP to November 2014 and September 2015, respectively.
In June 2014, the EPA issued requests for information under Section 114 of the CAA to Luminant and other generators. In November 2014, the EPA released a proposed action approving in part and disapproving in part Texas' SIP for Regional Haze and proposing a FIP for Regional Haze. In the proposed action, the EPA asserts that the Texas SIP does not show reasonable progress in improving visibility for two areas in Texas and fails to make emission reductions needed to achieve reasonable progress in improving visibility in the Wichita Mountains of Oklahoma. Consistent with how the EPA has applied Regional Haze rules to other states, the EPA's final rule confirms that Texas's compliance with the CSAPR will satisfy its obligations under the BART portion of the Regional Haze Program. However, the EPA's proposed FIP for Texas goes beyond the requirements of the CSAPR and sets emission limits on a unit-by-unit basis for 15 electricity generation units in Texas. The EPA's proposed emission limits assume additional control equipment for specific coal fueled generation units across Texas, including new flue gas desulfurization systems (scrubbers) at seven generation units and upgrades to existing scrubbers at seven generation units. Specifically for Luminant, the EPA's emission limitations are based on new scrubbers at Big Brown Units 1 and 2 and Monticello Units 1 and 2 and scrubber upgrades at Martin Lake Units 1, 2 and 3, Monticello Unit 3 and Sandow Unit 4. Luminant is currently evaluating the requirements and potential financial and operational impacts of the proposed rule, but new scrubbers at the Big Brown and Monticello units necessary to achieve the emission limits required by the proposed FIP (if those limits are even possible to attain) would likely challenge the long-term viability of those units. Comments on the EPA's proposal are due in April 2015, and the rule is expected to be finalized in September 2015. While Luminant continues to evaluate this proposal, we believe this proposed rule aggressively interprets the Regional Haze requirements. As proposed, the scrubber upgrades would be required three years after the rule is finalized, and the new scrubbers would be required five years after the rule is finalized. Assuming the proposed rule is finalized in September 2015, compliance would be required beginning in September 2018 and September 2020, respectively. While we cannot predict the outcome of the final rule, the result may have a material impact on our results of operations, liquidity or financial condition.
State Implementation Plan (SIP) Emissions Rules — The CAA requires each state to monitor air quality for compliance with federal health standards. The EPA is required to periodically review, and if appropriate, revise all national ambient air quality standards. The standards for ozone are not being achieved in several areas of Texas. The TCEQ adopted SIP rules in May 2007 to deal with eight-hour ozone standards, which required NOX emission reductions from certain of our peaking natural gas fueled units in the Dallas-Fort Worth area. In May 2012, the EPA designated nonattainment areas; however, because SIP rules to address attainment of the 2008 standards will not be required until June 2015, we cannot yet predict the impact of this action on our generation facilities. In December 2014, the EPA proposed to make the eight-hour ozone standards more stringent. In 2010 the EPA added a new one-hour nitrogen dioxide (NO2) and one-hour SO2 National Ambient Air Quality Standard (NAAQS) that may require actions within Texas to reduce emissions. The TCEQ will be required to revise its monitoring network and submit an implementation plan with compliance required no earlier than January 2021. Based on current monitoring, Texas has recommended to the EPA that no area in Texas is in nonattainment with a 2010 one-hour SO2 standard. The EPA designated 29 areas in 16 states as nonattainment but did not finalize designations for other areas of the country, including Texas. In April 2014, the EPA issued a proposed rule establishing data requirements and deadlines associated with a timeline to expand existing monitoring networks and require modeling to determine attainment status for the other areas. Areas where modeling will be used will be designated in 2017 with attainment demonstrations due in 2019, while areas with expanded or new monitors will be designated in 2020 with SIP revisions due in 2022. In March 2015, the US District Court of Northern California granted the EPA and the Sierra Club's motion to enter into a proposed consent decree with the Sierra Club that would require designations within 16 months of finalization for counties with sources that emit 16,000 tons or more of SO2. In September 2013, four states, including Texas, filed suit to compel the EPA to make SO2 designations. The Sierra Club and the Natural Resources Defense Council also recently filed a lawsuit seeking to force the EPA to issue designations using air modeling. The Sierra Club has provided modeling that implicates Luminant's coal plants in NAAQS exceedances. We are not a party to this litigation, but we are continuing to monitor the case. The EPA has also initiated efforts to expand near-road monitoring for fine particulates and NOX, which will increase the risk that an area could be labeled as nonattainment as a result of the proximity of the monitors to mobile sources. We cannot predict the impact of the new standards on our business, results of operations or financial condition until the TCEQ adopts (if required) an implementation plan with respect to the standards.
In September 2010, the EPA disapproved a portion of the SIP pursuant to which the TCEQ implements its program to achieve the requirements of the CAA. The EPA disapproved the Texas standard permit for pollution control projects (PCP). We hold several permits issued pursuant to the TCEQ standard permit conditions for PCP. We challenged the EPA's disapproval by filing a lawsuit in the Fifth Circuit Court arguing that the TCEQ's adoption of the standard permit conditions for pollution control projects was consistent with the CAA. In May 2014, the EPA issued the final approval of Texas' PCP standard permit.
In February 2013, in response to a petition for rulemaking filed by the Sierra Club, the EPA proposed a rule requiring certain states to replace SIP exemptions for excess emissions during malfunctions with an affirmative defense. Texas was not included in that original proposal since it already had an EPA-approved affirmative defense provision in its SIP. In 2014, as a result of a D.C. Circuit Court decision striking down an affirmative defense in another EPA rule, the EPA revised its 2013 proposal to extend the EPA's proposed findings of inadequacy to states that have affirmative defense provisions, including Texas. The EPA's revised proposal would require Texas to remove or replace its EPA-approved affirmative defense provisions for excess emissions during startup, shutdown and maintenance events. We filed comments on the EPA proposal in November 2014, and the EPA is expected to finalize the proposal in May 2015. We cannot predict the timing or outcome of future proceedings related to this rulemaking, including the requirements of any ultimately implemented rule, any compliance timeframe, or the operational, financial or liquidity effects, if any, of this rulemaking.
In June 2014, the Sierra Club filed a petition in the D.C. Circuit Court seeking review of several EPA regulations containing affirmative defenses for malfunctions, including MATS. Luminant filed a motion to intervene in this case. In July 2014, the D.C. Circuit Court ordered the case stayed pending the EPA's consideration of a petition for administrative reconsideration of the regulations at issue and has since asked the parties for periodic status reports. In November 2014, the EPA proposed revisions to the MATS rule, including removing the affirmative defenses for malfunctions and comments are due on the proposed revisions by April 3, 2015. Except as set forth above, we cannot predict the timing or outcome of future proceedings related to this petition, the petition for administrative reconsideration that is pending before the EPA or the operational, financial or liquidity effects of these proceedings, if any.
Acid Rain Program — The EPA has promulgated Acid Rain Program rules that require fossil fueled generation plants to have sufficient SO2 emission allowances and meet certain NOX emission standards. We believe our generation plants meet these SO2 allowance requirements and NOX emission rates.
Installation of Substantial Emissions Control Equipment — Each of our lignite/coal fueled generation facilities is currently equipped with substantial emissions control equipment. All of our lignite/coal fueled generation facilities are equipped with activated carbon injection systems to reduce mercury emissions. Flue gas desulfurization systems designed primarily to reduce SO2 emissions are installed at Oak Grove Units 1 and 2, Sandow Units 4 and 5, Martin Lake Units 1, 2, and 3, and Monticello Unit 3. Selective catalytic reduction systems designed to reduce NOX emissions are installed at Oak Grove Units 1 and 2 and Sandow Unit 4. Selective non-catalytic reduction systems designed to reduce NOX emissions are installed at Sandow Unit 5, Monticello Units 1, 2, and 3, and Big Brown Units 1 and 2. Fabric filter systems designed primarily to reduce particulate matter emissions are installed at Oak Grove Units 1 and 2, Sandow Unit 5, Monticello Units 1 and 2, and Big Brown Units 1 and 2. Electrostatic precipitator systems designed primarily to reduce particulate matter emissions are installed at Sandow Unit 4, Martin Lake Units 1, 2, and 3, Monticello Units 1, 2, and 3, and Big Brown Units 1 and 2. Sandow Unit 5 uses a fluidized bed combustion process that facilitates control of NOX and SO2. Flue gas desulfurization systems, fabric filter systems, and electrostatic precipitator systems also assist in reducing mercury and other emissions.
We believe that we hold all required emissions permits for facilities in operation. If the TCEQ adopts implementation plans that require us to install additional emissions controls, or if the EPA adopts more stringent requirements through any of the number of potential rulemaking activities in which it is or may be engaged, we could incur material capital expenditures, higher operating costs and potential production curtailments, resulting in material effects on our results of operations, liquidity and financial condition.
Water
The TCEQ and the EPA have jurisdiction over water discharges (including storm water) from facilities in Texas. We believe our facilities are presently in material compliance with applicable state and federal requirements relating to discharge of pollutants into water. We believe we hold all required waste water discharge permits from the TCEQ for facilities in operation and have applied for or obtained necessary permits for facilities under construction. We also believe we can satisfy the requirements necessary to obtain any required permits or renewals.
Diversion, impoundment and withdrawal of water for cooling and other purposes are subject to the jurisdiction of the TCEQ and the EPA. We believe we possess all necessary permits from the TCEQ for these activities at our current facilities. Clean Water Act Section 316(b) regulations pertaining to existing water intake structures at large generation facilities were published by the EPA in 2004. As prescribed in the regulations, we began implementing a monitoring program to determine the future actions that might need to be taken to comply with these regulations. In May 2014, the EPA finalized the Section 316(b) regulations. Although the rule does not mandate a certain control technology, it does require site-specific assessments of technology feasibility on a case-by-case basis at the state level. Compliance with this rule requires assessments and reports six months following implementation of the rule, but allows up to eight full years following promulgation for full compliance. Compliance with the rule is not anticipated to have a material effect on our results of operations, liquidity or financial condition.
Radioactive Waste
Under the federal Low-Level Radioactive Waste Policy Act of 1980, as amended, the State of Texas is required to provide, either on its own or jointly with other states in a compact, for the disposal of all low-level radioactive waste generated within the state. The State of Texas has agreed to a compact for a disposal facility that would be located in Texas. That compact was ratified by Congress and signed by the President in 1998, and the State of Texas has enacted legislation allowing a private entity to be licensed to accept low-level radioactive waste for disposal. The first disposal facility in Texas for such purposes began operations in 2012, and we began shipping some forms of waste material to the facility in 2013. We also ship other low-level waste material to a disposal facility outside of Texas. Should existing off-site disposal become unavailable, the low-level waste material can be stored on-site. (See discussion of this and storage of used nuclear fuel under Luminant – Nuclear Generation Operations above.)
Solid Waste, Including Coal Combustion Residuals from Lignite/Coal Fueled Generation
Treatment, storage and disposal of solid waste and hazardous waste are regulated at the state level under the Texas Solid Waste Disposal Act and at the federal level under the Resource Conservation and Recovery Act of 1976, as amended, and the Toxic Substances Control Act. The EPA has issued regulations under the Resource Conservation and Recovery Act of 1976 and the Toxic Substances Control Act, and the TCEQ has issued regulations under the Texas Solid Waste Disposal Act applicable to our facilities. We believe we are in material compliance with all applicable solid waste rules and regulations. In addition, we have registered solid waste disposal sites and have obtained or applied for permits required by such regulations.
In December 2014, the EPA signed the final Disposal of Coal Combustion Residuals from Electric Utilities rule. While we continue to review the rule, our initial estimates are that it will result in approximately $100 million of capital expenditures from 2015 through 2020 for our lignite/coal fueled generation facilities.
The EPA issued a notice in December 2009 that it had identified several industries, including the electric power industry, which should be subject to financial responsibility requirements under the Comprehensive Environmental Response, Compensation and Liability Act (CERCLA) consistent with the risk associated with their production, transportation, treatment, storage or disposal of hazardous substances. The EPA indicated in its notice that it would develop regulations that define the scope of those financial responsibility requirements. We do not know the scope of these requirements, nor are we able to estimate the potential cost, which could be material, of complying with any such new requirements.
Environmental Capital Expenditures
Capital expenditures for our environmental projects totaled $76 million in 2014 and are expected to total approximately $100 million in 2015 for environmental control equipment to comply with regulatory requirements. From 2010 through 2014, our environmental capital expenditures totaled approximately $700 million, and additional such expenditures are expected to total approximately $500 million from 2015 through 2020 to comply with the MATS rule and the Disposal of Coal Combustion Residuals from Electric Utilities rule as well as other final and pending EPA regulations, including maintenance of existing equipment, but excluding costs related to the proposed Regional Haze rules. The total expenditure for environmental capital will ultimately depend on the evolution of pending or future regulatory requirements. Our current plan includes the ongoing use of lignite coal as part of the fuel mix at certain of our lignite/coal facilities, in varying proportions that reflect the economically available fuel supply as well as the configuration of environmental control equipment for each unit.
Item 1A. RISK FACTORS
Important factors, in addition to others specifically addressed in Item 7, Management's Discussion and Analysis of Financial Condition and Results of Operations, that could have a material impact on our operations, liquidity, financial results and financial condition, or could cause our actual results or outcomes to differ materially from any projected outcome contained in any forward-looking statement in this report, are described below. There may be further risks and uncertainties that are not currently known or that are not currently believed to be material that may adversely affect our business, results of operations, liquidity and/or financial condition in the future.
Our major risks fall primarily into the following categories:
| |
| • | Risks Related to the Chapter 11 Cases. The Chapter 11 Cases subject us to material expense and a variety of material risks, including: a decrease in the number of counterparties that are willing to engage in commodity related hedging transactions with us and a significant increase in the amount of collateral required to engage in any such transactions; a loss of, or a disruption in, the materials or services received from, suppliers, contractors or service providers; a loss of wholesale and retail electric customers and a tarnishing of the TXU Energy brand; difficulties in the retention of employees; management distraction; limitations on our ability to operate our business and to adjust to changing market and industry conditions during the pendency of the Chapter 11 Cases; and litigation and/or claims asserted by creditors or other stakeholders in the Chapter 11 Cases. |
In addition, our capital structure will likely be significantly altered under any Chapter 11 plan confirmed by the Bankruptcy Court, and there can be no assurances regarding the amount of any distribution holders of claims against, or equity interests in, the Debtors ultimately will receive with respect to their claims or equity interests. For example, in connection with the Chapter 11 Cases, certain of our creditors may seek, and receive, Bankruptcy Court approval to sell or otherwise transfer certain of our subsidiaries (or their assets) in order to satisfy liabilities owed to such creditors. Any such transfer could result in significant tax liabilities for EFH Corp. and its subsidiaries (excluding the Oncor Ring-Fenced Entities), which could reduce the recovery of creditors.
| |
| • | Risks Related to Our Structure. EFH Corp.'s cash flows and ability to meet its obligations are largely dependent upon the earnings of its subsidiaries and the payment of such earnings to EFH Corp. in the form of dividends, distributions, loans or otherwise, and repayment of loans or advances from EFH Corp. These subsidiaries are separate and distinct legal entities and have no obligation (other than any existing contractual obligations, which could be suspended or altered in the Chapter 11 Cases) to provide EFH Corp. with funds for its payment obligations. A subsidiary's ability to pay dividends or make loans is limited by the Chapter 11 Cases, covenants in its existing and future debt agreements and/or applicable law. The distributions that may be paid by Oncor are limited due to certain structural and operational ring-fencing measures. Further, distributions declared by Oncor are made by Oncor's independent board of directors subject to the terms of its organizational documents and applicable law. |
| |
| • | Market, Financial and Economic Risks. Changes in technology or increased electricity conservation efforts may reduce the value of our assets. In addition, wholesale electricity prices in the ERCOT market have generally moved with the price of natural gas. Accordingly, our earnings, cash flows and the value of our lignite/coal and nuclear fueled generation assets are dependent in significant part upon the price of natural gas. In recent years natural gas supply has outpaced demand, thereby depressing natural gas prices. In addition, wholesale electricity prices have generally moved with ERCOT market heat rates, which could fall if demand for electricity were to decrease or if more efficient generation facilities are built in ERCOT. Accordingly, our earnings, cash flows and the value of our lignite/coal and nuclear fueled generation assets are also dependent in significant part upon market heat rates. Our assets or positions cannot be fully hedged against changes in commodity prices and market heat rates, and hedging transactions may not work as planned or hedge counterparties may default on their obligations. |
| |
| • | Regulatory and Legislative Risks. Our regulatory and legislative risks include changes in laws and regulations that govern our operations. In particular, new requirements for control of certain emissions from sources including electricity generation facilities may result in our incurrence of significant additional costs or significant changes to our existing operating practices. In addition, the rates of Oncor's electricity delivery business are subject to regulatory review, and may be reduced below current levels, which could adversely impact Oncor's results of operations, liquidity and financial condition. |
| |
| • | Operational Risks. Our operational risks include the risks inherent in running electricity generation facilities, retail electricity operations and electricity transmission and distribution systems. Failure of our equipment and facilities, information technology failure, fuel or water supply interruptions and adverse weather conditions, among other things, can adversely affect our business. In addition, our retail business is subject to intense competition. |
Risks Related to Chapter 11 Cases
We have filed voluntary petitions for relief under the Bankruptcy Code and are subject to the risks and uncertainties associated with bankruptcy cases.
We have filed voluntary petitions for relief under Chapter 11 of the Bankruptcy Code. For the duration of the Chapter 11 Cases, our business and operations will be subject to various risks, including but not limited to the following:
| |
| • | Our ability to develop, file and complete a Chapter 11 plan of reorganization, particularly during the exclusivity period (i.e. in general, the period in which we have the exclusive right to file a Chapter 11 plan of reorganization); |
| |
| • | Our ability to obtain Bankruptcy Court, creditor and regulatory approval of a Chapter 11 plan of reorganization in a timely manner; |
| |
| • | Our ability to obtain Bankruptcy Court approval with respect to motions in the Chapter 11 Cases and the outcomes of Bankruptcy Court rulings and of the Chapter 11 Cases in general; |
| |
| • | Risks associated with third party motions in the Chapter 11 Cases, which may interfere with our business operations or our ability to propose and/or complete a Chapter 11 plan of reorganization; |
| |
| • | Increased costs related to the Chapter 11 Cases and related litigation; |
| |
| • | Our ability to maintain or obtain sufficient financing sources for our operations during the pendency of the Chapter 11 Cases or to obtain sufficient exit financing to fund a Chapter 11 plan of reorganization; |
| |
| • | A significant increase in the amount of collateral required to engage in commodity related hedging transactions; |
| |
| • | A loss of, or a disruption in the materials or services received from, suppliers, contractors or service providers with whom we have commercial relationships; |
| |
| • | A material decrease in the number of TXU Energy's electricity customers and a material tarnishing of its brand; |
| |
| • | Risk that parties in interest in the Chapter 11 Cases may seek to cause the PUCT to review our REP certifications; |
| |
| • | Risks related to our mining reclamation bonding obligations; |
| |
| • | Potential incremental increase in risks related to distributions from Oncor to EFH Corp. or EFIH; |
| |
| • | Potential increased difficulty in retaining and motivating our key employees through the process of reorganization, and potential increased difficulty in attracting new employees; |
| |
| • | Significant time and effort required to be spent by our senior management in dealing with the bankruptcy and restructuring activities rather than focusing exclusively on business operations; |
| |
| • | The outcome of current or potential litigation regarding whether certain holders are entitled to make-whole or redemption premiums and/or post-petition interest in connection with the treatment of their claims in bankruptcy, and |
| |
| • | The outcome of current or potential litigation regarding intercompany claims and/or derivative claims. |
We are also subject to risks and uncertainties with respect to the actions and decisions of creditors and other third parties who have interests in our Chapter 11 Cases that may be inconsistent with our plans. These risks and uncertainties could affect our business and operations in various ways and may significantly increase the duration of the Chapter 11 Cases. Because of the risks and uncertainties associated with Chapter 11 Cases, we cannot predict or quantify the ultimate impact that events occurring during the Chapter 11 Cases may have on our business, cash flows, liquidity, financial condition and results of operations, nor can we predict the ultimate impact that events occurring during the Chapter 11 Cases may have on our corporate or capital structure. For example, in connection with the Chapter 11 Cases, certain of our creditors may seek, and receive, Bankruptcy Court approval to sell or otherwise transfer certain of our subsidiaries (or their assets) in order to satisfy liabilities owed to such creditors. Any such transfer could result in significant tax liabilities for EFH Corp. and its subsidiaries (excluding the Oncor Ring-Fenced Entities), which could reduce the recovery of creditors.
The duration of the Chapter 11 Cases is difficult to estimate and could be lengthy. Due to the termination of the Restructuring Support and Lock-Up Agreement (RSA), we are likely subject to more lengthy, costly and contentious Chapter 11 Cases. If the Debtors are unable to file and solicit votes for a Chapter 11 plan of reorganization prior to the expiration of the exclusivity period granted by the Bankruptcy Court, then third parties can file a plan, which would likely further exacerbate the length, cost and contentiousness of the Chapter 11 Cases. Moreover, the duration of the Chapter 11 Cases is subject to the receipt of Bankruptcy Court approval for a Chapter 11 plan of reorganization and regulatory approvals, the timing of which is unpredictable.
The duration of the Chapter 11 Cases is difficult to estimate and could be lengthy. As a result of the termination of the RSA, we are likely subject to more lengthy, costly and contentious Chapter 11 Cases, which will likely have a more pronounced adverse effect on our business than the pre-arranged plan contemplated by the RSA. The Chapter 11 Cases will likely involve contested issues with multiple stakeholders.
The uncertainty surrounding a prolonged restructuring could also have other adverse effects on us. For example, it could also adversely affect:
| |
| • | our ability to refinance our DIP Facilities and raise additional capital; |
| |
| • | how our business is viewed by regulators, investors, lenders, credit ratings agencies and other stakeholders, and |
If we are unable to file a Chapter 11 plan of reorganization, or solicit the appropriate votes for such plan, in each case, prior to the expiration of the exclusivity period granted by the Bankruptcy Court (currently June 23, 2015 for filing a Chapter 11 plan of reorganization and August 23, 2015 for soliciting the appropriate votes for such plan), third parties could file their own plan or plans of reorganization. Any such third party plan or plans will likely exacerbate the length, cost and contentiousness of the Chapter 11 Cases.
We will be required to seek approvals of the Bankruptcy Court and certain federal and state regulators in connection with certain actions in the Chapter 11 Cases, and certain parties may intervene and protest approval, absent the imposition of conditions to resolve their concerns. The approvals by governmental entities may be denied, conditioned or delayed.
Operating under Chapter 11 may restrict our ability to pursue our strategic and operational initiatives. Moreover, we are subject to various covenants and events of default under our DIP Facilities.
Under Chapter 11, transactions outside the ordinary course of business are subject to the prior approval of the Bankruptcy Court, which may limit our ability to respond in a timely manner to certain events or take advantage of certain opportunities or to adapt to changing market or industry conditions. The TCEH Debtors and the EFIH Debtors are subject to various covenants and events of default under their respective DIP Facilities. In general, certain of these covenants limit the Debtors' ability, subject to certain exceptions, to take certain actions such as selling assets, granting liens, incurring indebtedness and making investments. If the TCEH Debtors and EFIH Debtors fail to comply with these covenants or an event of default occurs under the DIP Facilities, our liquidity, financial condition or operations may be materially impacted.
We may experience increased levels of employee attrition as a result of the Chapter 11 Cases.
As a result of the Chapter 11 Cases, we may experience increased levels of employee attrition, and our employees likely will face considerable distraction and uncertainty. A loss of key personnel or material erosion of employee morale could adversely affect our business and results of operations. Our ability to engage, motivate and retain key employees or take other measures intended to motivate and incent key employees to remain with us through the pendency of the Chapter 11 Cases is limited by restrictions on implementation of incentive programs under the Bankruptcy Code. The loss of services of members of our senior management team could impair our ability to execute our strategy and implement operational initiatives, which would be likely to have a material adverse effect on our financial condition, liquidity and results of operations.
As a result of the Chapter 11 Cases, our historical financial information may not be indicative of our future financial performance.
Our capital structure will likely be significantly altered under any Chapter 11 plan confirmed by the Bankruptcy Court. Under fresh-start accounting rules that may apply to us upon the effective date of a Chapter 11 plan, our assets and liabilities would be adjusted to fair value, which could have a significant impact on our financial statements. Accordingly, if fresh-start accounting rules apply, our financial condition and results of operations following our emergence from Chapter 11 would not be comparable to the financial condition and results of operations reflected in our historical financial statements. In connection with the Chapter 11 Cases and the development of a Chapter 11 plan, it is also possible that additional restructuring and related charges may be identified and recorded in future periods. Such charges could be material to our consolidated financial position, liquidity and results of operations.
There is no assurance regarding the outcome of any litigation regarding whether note holders are entitled to make-whole or redemption premiums and/or post-petition interest in connection with the treatment of their claims in bankruptcy.
The EFIH Debtors are engaged in litigation regarding whether holders of its outstanding notes are entitled to receive a make-whole or redemption premium in connection with the repayment of such notes, including pursuant to a Chapter 11 plan of reorganization. As of December 31, 2014, the total aggregate amount of make-whole or redemption premiums that would be owed if such alleged claims were allowed claims would be approximately $1.123 billion (of which $432 million relates to the EFIH First Lien Notes, $591 million relates to the EFIH Second Lien Notes and $100 million relates to the EFIH PIK Notes). In these matters, the EFIH Debtors have requested, or expect to request, orders from the Bankruptcy Court disallowing such make-whole or redemption claims. See Note 13 to the Financial Statements for a more detailed discussion regarding these claims.
EFH Corp. is also likely to become engaged in litigation or similar adversarial proceedings regarding whether holders of its outstanding notes are entitled to receive a make-whole or redemption premium in connection with the repayment of such notes, including pursuant to a Chapter 11 plan of reorganization. As of December 31, 2014, the total aggregate amount of make-whole or redemption premiums that would be owed if such alleged claims were allowed would be approximately $231 million.
Moreover, creditors may make additional claims in the Chapter 11 Cases in connection with the repayments or settlements of their pre-petition debt such as indemnification claims or for the payment of fees and expenses incurred in connection with litigating such claims.
In addition, creditors may assert claims for post-petition interest, including default interest, on their outstanding notes in connection with the repayment of such notes, including pursuant to a Chapter 11 plan of reorganization. Such amounts would be material, particularly if such post-petition interest were required to be paid at the contract rate as opposed to the federal judgment rate.
We cannot predict whether any such litigation would be filed or, if filed, the outcome of any such litigation or the Bankruptcy Court's determination regarding the validity or the amounts payable in respect of any such claim.
The DIP Facilities may be insufficient to fund our cash requirements through our emergence from bankruptcy. In addition, our independent auditor's report on our financial statements raises substantial doubt about our ability to continue as a going concern given the Chapter 11 Cases.
For the duration of the Chapter 11 Cases, we will be subject to various risks, including but not limited to (i) the inability to maintain or obtain sufficient financing sources for operations or to fund any reorganization plan and meet future obligations, and (ii) increased legal and other professional costs associated with the Chapter 11 Cases and our reorganization.
We believe that the DIP Facilities, plus cash from operations (in the case of TCEH) and distributions received from Oncor Holdings (in the case of EFIH and EFH Corp.), will be sufficient to fund the Debtors' anticipated cash requirements through the pendency of the Chapter 11 Cases. However, if a Chapter 11 plan of reorganization is not completed during the term of the DIP Facilities, we may not be able to obtain sufficient additional financing on acceptable terms or at all.
In its report on our financial statements included in this Annual Report on Form 10-K, our independent public accounting firm states that the uncertainties inherent in the bankruptcy process raise substantial doubt about our ability to continue as a going concern.
We may not be able to obtain exit financing to repay the DIP Facilities or, if we are able to obtain such exit financing, the agreements governing such exit financing may significantly restrict our financing and operations flexibility after emerging from bankruptcy.
It is expected that the TCEH First Lien DIP Facility and EFIH First Lien DIP Facility will be repaid using, in whole or in part, the proceeds from borrowings under exit financings. Our ability to obtain such exit financings will depend on, among other things, the timing and outcome of various ongoing matters in the Chapter 11 Cases, our business, operations and financial condition, and market conditions. We have not yet received any commitment with respect to any exit facilities, and there can be no assurance that we will be able to obtain such exit facilities on reasonable economic terms, or at all. If we cannot secure exit financing, we may not be able to emerge from bankruptcy and may not be able to repay the EFIH First Lien DIP Facility or TCEH First Lien DIP Facility at their respective maturities. Any exit financing that we are able to secure may include a number of significant restrictive covenants which could impair our financing and operational flexibility and make it difficult for us to react to market conditions and satisfy our ongoing capital needs and unanticipated cash requirements. In addition, such exit facilities may require us to periodically meet various financial ratios and tests. These financial covenants and tests could limit our ability to react to market conditions or satisfy extraordinary capital needs and could otherwise restrict our financing and operations.
TCEH may not be able to fully and efficiently use its cash in the event TCEH's existing cash collateral order expires without TCEH being able to agree with the TCEH first lien lenders to an extension or a new cash collateral order that is approved by the Bankruptcy Court.
TCEH's existing cash collateral order expires in October 2015. TCEH may not be able to fully and efficiently use its cash in the event TCEH's existing cash collateral order expires without TCEH being able to agree with the TCEH first lien lenders to an extension or a new cash collateral order that is approved by the Bankruptcy Court. TCEH's business and operations are cash intensive and any restriction on its ability to use its cash could have a material and adverse impact on its business and operations, results of operations, liquidity and financial condition. Moreover, the expiration of the cash collateral order would cause an event of default under the TCEH DIP Facility, which could have a material and adverse impact on its business and operations, results of operations, liquidity and financial condition.
As a result of the Chapter 11 Cases, net operating losses and other tax attributes are not expected to be available upon emergence from the Chapter 11 Cases.
Certain tax attributes, such as net operating loss carry-forwards and certain tax credits, are expected to be utilized in connection with the Chapter 11 Cases. Under the Internal Revenue Code, tax attributes are reduced to the extent discharge of indebtedness income is excluded from gross income arising from a Chapter 11 case. If any attributes are still available after the application of Section 108, such attributes may be limited or lost in the event EFH Corp. or any of its subsidiaries experience an ownership change as defined under the Internal Revenue Code. In addition, tax attributes may be utilized in a transaction such as a sale or transfer of assets that could result in a significant tax liability for EFH Corp. and its subsidiaries. As a result of the foregoing rules, any pre-emergence net operating losses and certain tax credits are not expected to be available to EFH Corp. and its subsidiaries to reduce taxable income for tax periods beginning after emergence from Chapter 11.
While the Bankruptcy Court approved the Debtors' bidding procedures for the solicitation of bids from third parties to purchase EFH Corp.'s indirect economic ownership interest in Oncor, there can be no assurance that the Debtors will receive a bid the Debtors deem acceptable, that the Bankruptcy Court will approve any such bid or that any such transaction will ultimately close.
In January 2015, the Bankruptcy Court approved the Debtors' bidding procedures motion that sets forth the process by which the Debtors are authorized to solicit proposals (i.e. bids) from third parties to acquire (in any form and employing any structure, whether taxable (in whole or in part) or tax-free) EFH Corp.'s indirect economic ownership in Oncor in accordance with the Bankruptcy Code. We cannot predict the outcome of this process, including whether we will receive any acceptable bid, whether the Bankruptcy Court will approve any such bid or whether any such transaction will (or when it will) ultimately close because any such transaction would be the subject of customary closing conditions, including receipt of all applicable regulatory approvals.
Risks Related to Our Structure
EFH Corp. is a holding company and its obligations are structurally subordinated to existing and future liabilities and preferred stock of its subsidiaries.
EFH Corp.'s cash flows and ability to meet its obligations are largely dependent upon the earnings of its subsidiaries and the payment of such earnings to EFH Corp. in the form of dividends, distributions, loans or otherwise, and repayment of loans or advances from EFH Corp. These subsidiaries are separate and distinct legal entities and have no obligation (other than any existing contractual obligations, which may be suspended or altered in the Chapter 11 Cases) to provide EFH Corp. with funds for its payment obligations. Any decision by a subsidiary to provide EFH Corp. with funds for its payment obligations, whether by dividends, distributions, loans or otherwise, will depend on, among other things, the subsidiary's results of operations, financial condition, cash requirements, contractual restrictions and other factors. In addition, a subsidiary's ability to pay dividends may be limited by covenants in its existing and future debt agreements, applicable law and the Chapter 11 Cases. Further, the distributions that may be paid by Oncor are limited as discussed below.
Because EFH Corp. is a holding company, its obligations to its creditors are structurally subordinated to all existing and future liabilities and existing and future preferred stock of its subsidiaries that do not guarantee such obligations. Therefore, with respect to subsidiaries that do not guarantee EFH Corp.'s obligations, EFH Corp.'s rights and the rights of its creditors to participate in the assets of any subsidiary in the event that such a subsidiary is liquidated or reorganized are subject to the prior claims of such subsidiary's creditors and holders of such subsidiary's preferred stock. To the extent that EFH Corp. may be a creditor with recognized claims against any such subsidiary, EFH Corp.'s claims would still be subject to the prior claims of such subsidiary's creditors to the extent that they are secured or senior to those held by EFH Corp. Subject to restrictions contained in their financing arrangements and limitations imposed by the Bankruptcy Code, EFH Corp.'s subsidiaries may incur additional debt and other liabilities.
EFH Corp. and EFIH have a very limited ability to control activities at Oncor due to structural and operational ring-fencing measures.
EFH Corp. and EFIH depend upon Oncor for a significant amount of their cash flows and rely on such cash flows in order to satisfy their obligations. However, EFH Corp. and EFIH have a very limited ability to control the activities of Oncor. As part of the ring-fencing measures implemented by EFH Corp. and Oncor, including certain measures required by the PUCT's Order on Rehearing in Docket No. 34077, a majority of the members of Oncor's board of directors are required to meet the New York Stock Exchange requirements for independence in all material respects, and the unanimous, or majority, consent of such directors is required for Oncor to take certain actions. In addition, any new independent directors are required to be appointed by the nominating committee of Oncor Holdings' board of directors, a majority of whose members are independent directors. No member of EFH Corp.'s or EFIH's management is a member of Oncor's board of directors. Under Oncor Holdings' and Oncor's organizational documents, EFH Corp. has limited indirect consent rights with respect to the activities of Oncor, including (i) new issuances of equity securities by Oncor, (ii) material transactions with third parties involving Oncor outside of the ordinary course of business, (iii) actions that cause Oncor's assets to be subject to an increased level of jurisdiction of the FERC, (iv) any changes to the state of formation of Oncor, (v) material changes to accounting methods not required by US GAAP, and (vi) actions that fail to enforce certain tax sharing obligations between Oncor and EFH Corp. In addition, Oncor's organizational agreements contain restrictions on Oncor's ability to make distributions to its members, including indirectly to EFH Corp. or EFIH.
Additionally, the restrictive measures required by the PUCT's Order on Rehearing in Docket No. 34077, include, among other things:
| |
| • | Oncor not being restricted from incurring its own debt; |
| |
| • | Oncor not guaranteeing or pledging any of its assets to secure the debt of any member of the Texas Holdings Group, and |
| |
| • | restrictions on distributions by Oncor, and the right of the independent members of Oncor's board of directors and the largest non-majority member of Oncor to block the payment of distributions to Oncor Holdings (i.e., such distributions not being available to EFH Corp. under certain circumstances). |
Oncor may or may not make any distributions to EFH Corp. or EFIH.
EFH Corp. and Oncor have implemented certain structural and operational ring-fencing measures, including certain measures required by the PUCT's Order on Rehearing in Docket No. 34077, that were based on principles articulated by rating agencies and commitments made by Texas Holdings and Oncor to the PUCT and the FERC to further enhance Oncor's credit quality. These measures were put in place to mitigate Oncor's credit exposure to the Texas Holdings Group and to reduce the risk that the assets and liabilities of Oncor would be substantively consolidated with the assets and liabilities of the Texas Holdings Group in a bankruptcy of one or more of those entities.
As part of the ring-fencing measures, a majority of the members of the board of directors of Oncor are required to be, and are, independent from EFH Corp. and EFIH. Any new independent directors of Oncor are required to be appointed by the nominating committee of Oncor Holdings, which is required to be, and is, comprised of a majority of directors that are independent from EFH Corp. and EFIH. The organizational documents of Oncor give these independent directors, acting by majority vote, and, during certain periods, any director designated by Texas Transmission, the express right to prevent distributions from Oncor if they determine that it is in the best interests of Oncor to retain such amounts to meet expected future requirements. The Chapter 11 Cases could result in Oncor limiting or suspending such dividends to EFIH during the pendency of such filing. Accordingly, there can be no assurance that Oncor will make any distributions to EFH Corp. or EFIH.
In addition, Oncor's organizational documents prohibit Oncor from making any distribution to its owners, including EFH Corp. and EFIH, so long as and to the extent that such distribution would cause Oncor's regulatory capital structure to exceed the debt-to-equity ratio established from time to time by the PUCT for ratemaking purposes, which is currently set at 60% debt to 40% equity. Under the terms of a Federal and State Income Tax Allocation Agreement, Oncor makes tax payments to EFH Corp. (bypassing EFIH) based on its share of an amount calculated to approximate the amount of taxes Oncor would have paid to the IRS if it was a stand-alone taxpayer.
Moreover, Oncor has incurred debt in connection with CREZ and may incur additional debt in connection with other investments in infrastructure or technology. Accordingly, while Oncor is required to maintain a specified debt-to-equity ratio, there can be no assurance that Oncor's equity balance will be sufficient to maintain the required debt-to-equity ratio established from time to time by the PUCT for ratemaking purposes, thereby restricting Oncor from making any distributions to EFH Corp. or EFIH.
Oncor's ring-fencing measures may not work as planned and the Bankruptcy Court may nevertheless subject Oncor to the claims of Texas Holdings Group entity creditors.
In 2007, EFH Corp. and Oncor implemented certain structural and operational ring-fencing measures, including certain measures required by the PUCT's Order on Rehearing in Docket No. 34077, that were based on principles articulated by rating agencies and commitments made by Texas Holdings and Oncor to the PUCT and the FERC to further enhance Oncor's credit quality. These measures were put in place to mitigate Oncor's credit exposure to the Texas Holdings Group and to minimize the risk that a court would order any of Oncor Holdings', Oncor's or Oncor's subsidiary's (collectively, the Oncor Ring-Fenced Entities) assets and liabilities to be substantively consolidated with those of any member of the Texas Holdings Group in the event that a member of the Texas Holdings Group were to become a debtor in a bankruptcy case. Substantive consolidation is an equitable remedy in bankruptcy that results in the pooling of the assets and liabilities of the debtor and one or more of its affiliates solely for purposes of the bankruptcy case, including for purposes of distributions to creditors and voting on and treatment under a reorganization plan. Bankruptcy courts have broad equitable powers, and as a result, outcomes in bankruptcy proceedings are inherently difficult to predict. To the extent the Bankruptcy Court were to determine that substantive consolidation was appropriate under the facts and circumstances, then the assets and liabilities of any Oncor Ring-Fenced Entity that were subject to the substantive consolidation order would be available to help satisfy the debt or contractual obligations of the Texas Holdings Group entity that was a debtor in bankruptcy and subject to the same substantive consolidation order. However, even if any Oncor Ring-Fenced Entity were included in such a substantive consolidation order, the secured creditors of Oncor would retain their liens and priority with respect to Oncor's assets.
There can be no assurance that the Bankruptcy Court will not order an Oncor Ring-Fenced Entity's assets and liabilities to be substantively consolidated with those of the Debtors or that the Chapter 11 Cases will not result in a disruption of services Oncor receives from, or jointly with, our affiliates. See Note 1 to the Financial Statements for additional information on ring-fencing measures.
In addition, Oncor's access to capital markets and cost of debt could be directly affected by its credit ratings. Any adverse action with respect to Oncor's credit ratings would generally cause borrowing costs to increase and the potential pool of investors and funding sources to decrease. Oncor's credit ratings are currently substantially higher than those of the Texas Holdings Group. If credit rating agencies were to change their views of Oncor's independence from any member of the Texas Holdings Group, Oncor's credit ratings would likely decline. Despite the ring-fencing measures, rating agencies have in the past, and could in the future, take an adverse action with respect to Oncor's credit ratings in response to debt restructuring or other activities by EFH Corp. or any of its subsidiaries, including the Chapter 11 Cases. In the event any such adverse action takes place and causes Oncor's borrowing costs to increase, it may not be able to recover these increased costs if they exceed Oncor's PUCT-approved cost of debt determined in its most recent rate case or subsequent rate cases.
Market, Financial and Economic Risks
Changes in technology or increased electricity conservation efforts may reduce the value of our generation facilities and/or Oncor's electricity delivery facilities and may otherwise significantly impact our businesses.
Technological advances have improved, and are likely to continue to improve, existing and alternative technologies to produce or store electricity, including gas turbines, fuel cells, microturbines, photovoltaic (solar) cells, batteries and concentrated solar thermal devices. Such technological advances have reduced, and are expected to continue to reduce, the costs of electricity production or storage from these technologies to a level that will enable these technologies to compete effectively with traditional generation facilities. Consequently, the profitability and market value of our generation assets could be significantly reduced as a result of these advances. In addition, changes in technology have altered, and are expected to continue to alter, the channels through which retail customers buy electricity (i.e., self-generation facilities). To the extent self-generation facilities become a more cost-effective option for ERCOT customers, our revenues, liquidity and results of operations could be materially reduced.
Technological advances in demand-side management and increased conservation efforts have resulted, and are expected to continue to result, in a decrease in electricity demand. A significant decrease in electricity demand in ERCOT as a result of such efforts would significantly reduce the value of our generation assets and electricity delivery facilities. Certain regulatory and legislative bodies have introduced or are considering requirements and/or incentives to reduce energy consumption. Effective energy conservation by our customers could result in reduced energy demand or significantly slow the growth in demand. Such reduction in demand could materially reduce our revenues, liquidity and results of operations. Furthermore, we may incur increased capital expenditures if we are required to increase investment in conservation measures.
TCEH's revenues and results of operations generally are negatively impacted by decreases in market prices for electricity, natural gas prices and/or market heat rates.
TCEH is not guaranteed any rate of return on capital investments in its businesses. We market electricity, including electricity from our own generation facilities and generation contracted from third parties, as part of our wholesale operations. TCEH's results of operations depend in large part upon wholesale market prices for electricity, natural gas, uranium, coal, fuel oil and transportation in its regional market and other competitive markets and upon prevailing retail electricity rates, which may be impacted by, among other things, actions of regulatory authorities. Market prices may fluctuate substantially over relatively short periods of time. Demand for electricity can fluctuate dramatically, creating periods of substantial under- or over-supply. During periods of over-supply, prices might be depressed. Also, at times, there may be political pressure, or pressure from regulatory authorities with jurisdiction over wholesale and retail energy commodity and transportation rates, to impose price limitations, bidding rules and other mechanisms to address volatility and other issues in these markets.
Some of the fuel for our generation facilities is purchased under short-term contracts. Prices of fuel (including diesel, natural gas, coal and nuclear fuel) may also be volatile, and the price we can obtain for electricity sales may not change at the same rate as changes in fuel costs. In addition, we purchase and sell natural gas and other energy related commodities, and volatility in these markets may affect costs incurred in meeting obligations.
Volatility in market prices for fuel and electricity may result from the following:
| |
| • | volatility in natural gas prices; |
| |
| • | volatility in ERCOT market heat rates; |
| |
| • | volatility in coal and rail transportation prices; |
| |
| • | severe or unexpected weather conditions, including drought and limitations on access to water; |
| |
| • | changes in electricity and fuel usage; |
| |
| • | illiquidity in the wholesale electricity or other commodity markets; |
| |
| • | transmission or transportation constraints, inoperability or inefficiencies; |
| |
| • | availability of competitively-priced alternative energy sources or storage; |
| |
| • | changes in market structure; |
| |
| • | changes in supply and demand for energy commodities, including nuclear fuel and related enrichment and conversion services; |
| |
| • | changes in the manner in which we operate our facilities, including curtailed operation due to market pricing, environmental, safety or other factors; |
| |
| • | changes in generation efficiency; |
| |
| • | outages or otherwise reduced output from our generation facilities or those of our competitors; |
| |
| • | changes in the credit risk or payment practices of market participants; |
| |
| • | changes in production and storage levels of natural gas, lignite, coal, crude oil, diesel and other refined products; |
| |
| • | natural disasters, wars, sabotage, terrorist acts, embargoes and other catastrophic events, and |
| |
| • | federal, state and local energy, environmental and other regulation and legislation. |
All of our generation facilities are located in the ERCOT market, a market with limited interconnections to other markets. Wholesale electricity prices in the ERCOT market have generally moved with the price of natural gas because marginal electricity demand is generally supplied by natural gas fueled generation facilities. Accordingly, our earnings, cash flows and the value of our nuclear and lignite/coal fueled generation assets, which provided a substantial portion of our supply volumes in 2014, are dependent in significant part upon the price of natural gas. Natural gas prices have generally trended downward since mid-2008 (from $11.12 per MMBtu in mid-2008 for calendar year 2014 to $4.42 per MMBtu for the average settled price for the year ended December 31, 2014). The economy, weather, demand, production and storage all affect natural gas prices. In recent years natural gas supply has outpaced demand as a result of development and expansion of hydraulic fracturing in natural gas extraction. Many industry experts expect this supply/demand imbalance to continue for a number of years, thereby depressing natural gas prices for a long-term period.
Wholesale electricity prices also move with ERCOT market heat rates, which could fall if demand for electricity were to decrease or if more efficient generation facilities are built in ERCOT. Accordingly, our earnings, cash flows and the value of our nuclear and lignite/coal fueled generation assets are also dependent in significant part upon market heat rates. As a result, our nuclear and lignite/coal fueled generation assets could significantly decrease in profitability and value if ERCOT market heat rates decline.
Our assets or positions cannot be fully hedged against changes in commodity prices and market heat rates, and hedging transactions may not work as planned or hedge counterparties may default on their obligations.
We cannot fully hedge the risk associated with changes in commodity prices, most notably electricity and natural gas prices, because of the expected useful life of our generation assets and the size of our position relative to market liquidity. To the extent we have unhedged positions, fluctuating commodity prices and/or market heat rates can materially impact our results of operations, liquidity and financial position, either favorably or unfavorably. At December 31, 2014, we had no significant natural gas hedges beyond 2015.
To manage our financial exposure related to commodity price fluctuations, we routinely enter into contracts to hedge portions of purchase and sale commitments, fuel requirements and inventories of natural gas, lignite, coal, crude oil, diesel fuel, uranium and refined products, and other commodities, within established risk management guidelines. As part of this strategy, we routinely utilize fixed-price forward physical purchase and sale contracts, futures, financial swaps and option contracts traded in over-the-counter markets or on exchanges. Although we devote a considerable amount of time and effort to the establishment of risk management procedures, as well as the ongoing review of the implementation of these procedures, the procedures in place may not always function as planned and cannot eliminate all the risks associated with these activities. For example, we hedge the expected needs of our wholesale and retail customers, but unexpected changes due to weather, natural disasters, consumer behavior, market constraints or other factors could cause us to purchase electricity to meet unexpected demand in periods of high wholesale market prices or resell excess electricity into the wholesale market in periods of low prices. As a result of these and other factors, we cannot precisely predict the impact that risk management decisions may have on our businesses, results of operations, liquidity or financial position.
With the tightening of credit markets that began in 2008 and the expansion of regulatory oversight through various financial reforms, there has been some decline in the number of market participants in the wholesale energy commodities markets, resulting in less liquidity, particularly in the ERCOT electricity market. Participation by financial institutions and other intermediaries (including investment banks) has particularly declined. Extended declines in market liquidity could materially affect our ability to hedge our financial exposure to desired levels. In addition, our financial condition and the Chapter 11 Cases have significantly limited the number of counterparties that will enter into commodity hedging transactions with us on attractive terms.
To the extent we engage in hedging and risk management activities, we are exposed to the risk that counterparties that owe us money, energy or other commodities as a result of these activities will not perform their obligations. Should the counterparties to these arrangements fail to perform, we could be forced to enter into alternative hedging arrangements or honor the underlying commitment at then-current market prices. In such event, we could incur losses or forgo expected gains in addition to amounts, if any, already paid to the counterparties. ERCOT market participants are also exposed to risks that another ERCOT market participant may default on its obligations to pay ERCOT for electricity taken, in which case such costs, to the extent not offset by posted security and other protections available to ERCOT, may be allocated to various non-defaulting ERCOT market participants, including us.
Our liquidity needs could be difficult to satisfy, particularly during times of uncertainty in the financial markets and/or during times when there are significant changes in commodity prices. The inability to access liquidity, particularly on favorable terms, could materially affect our results of operations, liquidity and financial condition. We cannot be certain that the DIP Facilities will ultimately be adequate to cover all of our liquidity needs for the entirety of the Chapter 11 Cases
Our businesses are capital intensive. In general, we rely on access to financial markets and credit facilities as a significant source of liquidity for our capital requirements and other obligations not satisfied by cash-on-hand or operating cash flows. The inability to raise capital or access credit facilities, particularly on favorable terms, could adversely impact our liquidity and our ability to meet our obligations or sustain and grow our businesses and could increase capital costs. Our access to the financial markets and credit facilities could be adversely impacted by various factors, such as:
| |
| • | changes in financial markets that reduce available liquidity or the ability to obtain or renew credit facilities on acceptable terms; |
| |
| • | economic weakness in the ERCOT or general US market; |
| |
| • | changes in interest rates; |
| |
| • | a deterioration, or perceived deterioration, of EFH Corp.'s (and/or its subsidiaries') creditworthiness or enterprise value; |
| |
| • | a reduction in EFH Corp.'s or its applicable subsidiaries' credit ratings; |
| |
| • | a deterioration of the creditworthiness or bankruptcy of one or more lenders or counterparties under our credit facilities that affects the ability of such lender(s) to make loans to us; |
| |
| • | volatility in commodity prices that increases credit requirements; |
| |
| • | a material breakdown in our risk management procedures, and |
| |
| • | the occurrence of changes in our businesses that restrict our ability to access credit facilities. |
In the event that the governmental agencies that regulate the activities of our businesses determine that the creditworthiness of any such business is inadequate to support our activities, such agencies could require us to provide additional cash or letter of credit collateral in substantial amounts to qualify to do business.
Further, a lack of available liquidity could adversely impact the evaluation of our creditworthiness by counterparties and rating agencies. In particular, such concerns by existing and potential counterparties could significantly limit TCEH's wholesale markets activities, including any future hedging activities.
Although the Bankruptcy Court approved the TCEH and EFIH DIP Facilities in June 2014 to, among other things, provide liquidity and fund operational and restructuring-related expenses during the Chapter 11 Cases, we cannot be sure that the DIP Facilities will ultimately be adequate to cover all of our liquidity needs for the entirety of the Chapter 11 Cases. Additionally, the TCEH Debtors and EFIH Debtors, respectively, are subject to various covenants and events of default under their respective DIP Facilities. If we fail to comply with these covenants or an event of default occurs under the DIP Facilities, our liquidity, financial condition or operations may be materially impacted.
The costs of providing postretirement benefits and related funding requirements are subject to changes in value of fund assets, benefit costs, demographics and actuarial assumptions and may have a material effect on our results of operations, liquidity and financial condition.
Oncor provides, and to a limited extent, we provide pension benefits based on either a traditional defined benefit formula or a cash balance formula, and we also provide certain health care and life insurance benefits to eligible employees and their eligible dependents upon the retirement of such employees. Our costs of providing such benefits and related funding requirements are dependent upon numerous factors, assumptions and estimates and are subject to changes in these factors, assumptions and estimates, including the market value of the assets funding the pension and OPEB plans. Fluctuations in financial market returns as well as changes in general interest rates may result in increased or decreased benefit costs in future periods.
The values of the investments that fund the pension and OPEB plans are subject to changes in financial market conditions. Significant decreases in the values of these investments could increase the expenses of the pension plans and the costs of the OPEB plans and related funding requirements in the future. Our costs of providing such benefits and related funding requirements are also subject to changing employee demographics (including but not limited to age, compensation levels and years of accredited service), the level of contributions made to retiree plans, expected and actual earnings on plan assets and the discount rates used in determining the projected benefit obligation. Changes made to the provisions of the plans may also impact current and future benefit costs. Fluctuations in financial market returns as well as changes in general interest rates may result in increased or decreased benefit costs in future periods. See Note 17 to the Financial Statements for further discussion of our pension and OPEB plans, including certain pension plan amendments approved by EFH Corp. in August 2012.
Regulatory and Legislative Risks
Our businesses are subject to ongoing complex governmental regulations and legislation that have impacted, and may in the future impact, our businesses and/or results of operations, liquidity and financial condition.
Our businesses operate in changing market environments influenced by various state and federal legislative and regulatory initiatives regarding the restructuring of the energy industry, including competition in the generation and sale of electricity. We will need to continually adapt to these changes.
Our businesses are subject to changes in state and federal laws (including PURA, the Federal Power Act, the Atomic Energy Act, the Public Utility Regulatory Policies Act of 1978, the Clean Air Act, the Energy Policy Act of 2005 and the Dodd-Frank Wall Street Reform and Consumer Protection Act), changing governmental policy and regulatory actions (including those of the PUCT, the NERC, the TRE, the RCT, the TCEQ, the FERC, the MSHA, the EPA, the NRC and the CFTC) and the rules, guidelines and protocols of ERCOT with respect to matters including, but not limited to, market structure and design, operation of nuclear generation facilities, construction and operation of other generation facilities, construction and operation of transmission facilities, development, operation and reclamation of lignite mines, acquisition, disposal, depreciation and amortization of regulated assets and facilities, recovery of costs and investments, decommissioning costs, return on invested capital for regulated businesses, market behavior rules, present or prospective wholesale and retail competition and environmental matters. TCEH, along with other market participants, is subject to electricity pricing constraints and market behavior and other competition-related rules and regulations under PURA that are administered by the PUCT and ERCOT. Changes in, revisions to, or reinterpretations of existing laws and regulations may have a material effect on our businesses.
The Texas Legislature meets every two years. The current regular legislative session began in January 2015; however, at any time the governor of Texas may convene a special session of the legislature. During any regular or special session, bills may be introduced that, if adopted, could materially affect our businesses, including our results of operations, liquidity or financial condition.
Our cost of compliance with existing and new environmental laws could materially affect our results of operations, liquidity and financial condition.
We are subject to extensive environmental regulation by governmental authorities, including the EPA and the TCEQ. In operating our facilities, we are required to comply with numerous environmental laws and regulations and to obtain numerous governmental permits. We may incur significant additional costs beyond those currently contemplated to comply with these requirements. If we fail to comply with these requirements, we could be subject to civil or criminal liabilities and fines. Existing environmental regulations could be revised or reinterpreted, new laws and regulations could be adopted or become applicable to us or our facilities, and future changes in environmental laws and regulations could occur, including potential regulatory and enforcement developments related to air emissions, all of which could result in significant additional costs beyond those currently contemplated to comply with existing requirements (see Note 13 to the Financial Statements).
The EPA has recently completed several regulatory actions establishing new requirements for control of certain emissions from sources including electricity generation facilities. It is also currently considering several other regulatory actions, as well as contemplating future additional regulatory actions, in each case that may affect our generation facilities or our ability to cost-effectively develop new generation facilities. There is no assurance that the currently-installed emissions control equipment at our lignite/coal fueled generation facilities will satisfy the requirements under any future EPA or TCEQ regulations. Some of the recent regulatory actions and proposed actions, such as the EPA's Regional Haze FIP, CSAPR and MATS, could require us to install significant additional control equipment, resulting in material costs of compliance for our generation units, including capital expenditures, higher operating and fuel costs and potential production curtailments if the rules take effect. These costs could result in material effects on our results of operations, liquidity and financial condition.
We may not be able to obtain or maintain all required environmental regulatory approvals. If there is a delay in obtaining any required environmental regulatory approvals, if we fail to obtain, maintain or comply with any such approval or if an approval is retroactively disallowed, the operation of our generation facilities could be stopped, curtailed or modified or become subject to additional costs.
In addition, we may be responsible for any on-site liabilities associated with the environmental condition of facilities that we have acquired, leased or developed, regardless of when the liabilities arose and whether they are known or unknown. In connection with certain acquisitions and sales of assets, we may obtain, or be required to provide, indemnification against certain environmental liabilities. Another party could, depending on the circumstances, assert an environmental claim against us or fail to meet its indemnification obligations to us.
Our results of operations, liquidity and financial condition may be materially affected if new federal and/or state legislation or regulations are adopted to address global climate change, or if we are subject to lawsuits for alleged damage to persons or property resulting from greenhouse gas emissions.
There is a concern nationally and internationally about global climate change and how greenhouse gas (GHG) emissions, such as carbon dioxide (CO2), contribute to global climate change. Over the last few years, proposals have been debated in the US Congress or discussed by the Obama Administration that were intended to address climate change using different approaches, including a cap on carbon emissions with emitters allowed to trade unused emission allowances (cap-and-trade), a tax on carbon or GHG emissions, incentives for the development of low-carbon technology and federal renewable portfolio standards. In addition, a number of federal court cases have been filed in recent years asserting damage claims related to GHG emissions, and the results in those proceedings could establish adverse precedent that might apply to companies (including us) that produce GHG emissions. For more detailed discussion of recent global climate change legislation see Items 1 and 2, Business and Properties – Environmental Regulations and Related Considerations – Global Climate Change. Our results of operations, liquidity and financial condition may be materially affected if new federal and/or state legislation or regulations are adopted to address global climate change, or if we are subject to lawsuits for alleged damage to persons or property resulting from greenhouse gas emissions.
Luminant's mining permits are subject to RCT review.
The RCT reviews on an ongoing basis whether Luminant is compliant with RCT rules and regulations and whether it has met all of the requirements of its mining permits. Any revocation of a mining permit would mean that Luminant would no longer be allowed to mine lignite at the applicable mine to serve its generation facilities. Such event would have a material effect on our results of operations, liquidity and financial condition.
In June 2014, the RCT agreed to accept a collateral bond from TCEH of up to $1.1 billion, as a substitute for its self-bond, to secure mining land reclamation obligations. The collateral bond was a $1.1 billion carve-out from the super-priority liens under the TCEH DIP Facility that enables the RCT to be paid before the TCEH DIP Facility lenders in the event such collateral bond was called. There can be no assurance that the RCT will continue to accept this form of collateral bond throughout the pendency of the Chapter 11 Cases. If we were required to secure our mining reclamation with cash or a letter of credit, our liquidity and financial condition would be materially and adversely impacted.
Litigation, legal proceedings, regulatory investigations or other administrative proceedings could expose us to significant liabilities and reputation damage, and have a material effect on our results of operations, and the litigation environment in which we operate poses a significant risk to our businesses.
We are involved in the ordinary course of business in a number of lawsuits involving employment, commercial, and environmental issues, and other claims for injuries and damages, among other matters. We evaluate litigation claims and legal proceedings to assess the likelihood of unfavorable outcomes and to estimate, if possible, the amount of potential losses. Based on these evaluations and estimates, we establish reserves and disclose the relevant litigation claims or legal proceedings, as appropriate. These evaluations and estimates are based on the information available to management at the time and involve a significant amount of judgment. Actual outcomes or losses may differ materially from current evaluations and estimates. The settlement or resolution of such claims or proceedings may have a material effect on our results of operations. We use appropriate means to contest litigation threatened or filed against us, but the litigation environment poses a significant business risk.
We are involved in the ordinary course of business in permit applications and renewals, and we are exposed to the risk that certain of our operating permit applications may not be granted or that certain of our operating permits may not be renewed on satisfactory terms. Failure to obtain and maintain the necessary permits to conduct our businesses could have a material effect on our results of operations, liquidity and financial condition.
We are also involved in the ordinary course of business in regulatory investigations and other administrative proceedings, and we are exposed to the risk that we may become the subject of additional regulatory investigations or administrative proceedings. See Note 13 to the Financial Statements, Litigation Related to EPA Reviews. While we cannot predict the outcome of any regulatory investigation or administrative proceeding, any such regulatory investigation or administrative proceeding could result in us incurring material penalties and/or other costs and have a material effect on our results of operations, liquidity and financial condition.
Our collateral requirements for hedging arrangements could be materially impacted if the remaining rules implementing the Financial Reform Act broaden the scope of the Act's provisions regarding the regulation of over-the-counter financial derivatives, making certain provisions applicable to end-users like us.
In July 2010, the US Congress enacted financial reform legislation known as the Dodd-Frank Wall Street Reform and Consumer Protection Act (the Financial Reform Act). While the legislation is broad and detailed, a few key rulemaking decisions remain to be made by federal governmental agencies to fully implement the Financial Reform Act.
Title VII of the Financial Reform Act provides for the regulation of the over-the-counter (OTC) derivatives (Swaps) market. The Financial Reform Act generally requires OTC derivatives (including the types of asset-backed OTC derivatives that we historically used to hedge risks associated with commodity and interest rate exposure) to be cleared by a derivatives clearing organization. However, under the end-user clearing exemption, entities are exempt from these clearing requirements if they (i) are not "Swap Dealers" or "Major Swap Participants" and (ii) use Swaps to hedge or mitigate commercial risk. Existing swaps are grandfathered from the clearing requirements.
In May 2012, the CFTC published its final rule defining the terms Swap Dealer and Major Swap Participant. Additionally, in July 2012, the CFTC approved the final rules defining the term Swap and the end-user clearing exemption. The definition of the term Swap and the Swap Dealer/Major Swap Participant rule became effective in October 2012. Based on our assessments, we are not a Swap Dealer or Major Swap Participant. However, we are required to continually assess our activity to determine if we will be required to register as a Swap Dealer or Major Swap Participant. The reporting requirements under the Financial Reform Act for entities that are not Swap Dealers or Major Swap Participants became effective in August 2013, and we are in compliance with these rules.
In January 2015, President Obama signed into law an amendment to the Commodity Exchange Act with respect to margin requirements for swaps. Specifically, the amended language would prevent regulators from imposing margin requirements on end-user swaps qualifying for the end-user exception. We are currently reviewing the amendment to determine the implications on our business. In addition, in December 2013, the CFTC published its new proposed Position Limit Rule (PLR). The PLR provides for specific position limits related to futures and Swap contracts that we utilize in our hedging activities. The proposed PLR will require that we comply with the portion of the PLR applicable to these contracts, which will result in increased monitoring and reporting requirements and can also impact the types of contracts that we utilize as hedging instruments in our operations.
The rates of Oncor's electricity delivery business are subject to regulatory review, and may be reduced below current levels, which could adversely impact Oncor's results of operations, liquidity and financial condition.
The rates charged by Oncor are regulated by the PUCT and certain cities and are subject to cost-of-service regulation and annual earnings oversight. This regulatory treatment does not provide any assurance as to achievement of earnings levels. Oncor's rates are regulated based on an analysis of Oncor's costs and capital structure, as reviewed and approved in a regulatory proceeding. While rate regulation is premised on the full recovery of prudently incurred costs and a reasonable rate of return on invested capital, there can be no assurance that the PUCT will judge all of Oncor's costs to have been prudently incurred, that the PUCT will not reduce the amount of invested capital included in the capital structure that Oncor's rates are based upon, or that the regulatory process in which rates are determined will always result in rates that will produce full recovery of Oncor's costs, including regulatory assets reported on Oncor's balance sheet, and the return on invested capital allowed by the PUCT. See Item 7, Management's Discussion and Analysis of Financial Condition and Results of Operations – Significant Activities and Events and Items Influencing Future Performance – Oncor Matters with the PUCT for discussion of recent and pending rate-related filings with the PUCT.
The REP certification of our retail operation is subject to PUCT review.
The PUCT may at any time initiate an investigation into whether our retail operation complies with certain PUCT rules and whether we have met all of the requirements for REP certification, including financial requirements. In addition, as a result of the Chapter 11 Cases, the PUCT may initiate additional reviews of our retail operation, including with respect to its creditworthiness. Any removal or revocation of a REP certification would mean that we would no longer be allowed to provide electricity service to retail customers. Such decertification could have a material effect on our results of operations, liquidity and financial condition.
Operational Risks
We may suffer material losses, costs and liabilities due to ownership and operation of the Comanche Peak nuclear generation facility.
The ownership and operation of a nuclear generation facility involves certain risks. These risks include:
| |
| • | unscheduled outages or unexpected costs due to equipment, mechanical, structural, cyber security or other problems; |
| |
| • | inadequacy or lapses in maintenance protocols; |
| |
| • | the impairment of reactor operation and safety systems due to human error or force majeure; |
| |
| • | the costs of storage, handling and disposal of nuclear materials, including availability of storage space; |
| |
| • | the costs of procuring nuclear fuel; |
| |
| • | terrorist or cyber security attacks and the cost to protect against any such attack; |
| |
| • | the impact of a natural disaster; |
| |
| • | limitations on the amounts and types of insurance coverage commercially available, and |
| |
| • | uncertainties with respect to the technological and financial aspects of decommissioning nuclear facilities at the end of their useful lives. |
The prolonged unavailability of Comanche Peak could materially affect our financial condition and results of operations. The following are among the more significant of these risks:
| |
| • | Operational Risk — Operations at any nuclear generation facility could degrade to the point where the facility would have to be shut down. If such degradations were to occur, the process of identifying and correcting the causes of the operational downgrade to return the facility to operation could require significant time and expense, resulting in both lost revenue and increased fuel and purchased power expense to meet supply commitments. Furthermore, a shut-down or failure at any other nuclear generation facility could cause regulators to require a shut-down or reduced availability at Comanche Peak. |
| |
| • | Regulatory Risk — The NRC may modify, suspend or revoke licenses and impose civil penalties for failure to comply with the Atomic Energy Act, the regulations under it or the terms of the licenses of nuclear generation facilities. Unless extended, the NRC operating licenses for Comanche Peak Unit 1 and Unit 2 will expire in 2030 and 2033, respectively. In addition, as a result of the Bankruptcy Filing, the NRC may initiate additional reviews of our operations at Comanche Peak, including with respect to its ability to fund its operations in compliance with its operating license. Changes in regulations by the NRC, including potential regulation as a result of the NRC's ongoing analysis and response to the effects of the natural disaster on nuclear generation facilities in Japan in 2010, could require a substantial increase in capital expenditures or result in increased operating or decommissioning costs. |
| |
| • | Nuclear Accident Risk — Although the safety record of Comanche Peak and other nuclear generation facilities generally has been very good, accidents and other unforeseen problems have occurred both in the US and elsewhere. The consequences of an accident can be severe and include loss of life, injury, lasting negative health impact and property damage. Any accident, or perceived accident, could result in significant liabilities and damage our reputation. Any such resulting liability from a nuclear accident could exceed our resources, including insurance coverage, and could ultimately result in the suspension or termination of electricity generation from Comanche Peak. |
The operation and maintenance of electricity generation and delivery facilities involves significant risks that could adversely affect our results of operations, liquidity and financial condition.
The operation and maintenance of electricity generation and delivery facilities involves many risks, including, as applicable, start-up risks, breakdown or failure of facilities, operator error, lack of sufficient capital to maintain the facilities, the dependence on a specific fuel source or the impact of unusual or adverse weather conditions or other natural events, or terrorist attacks, as well as the risk of performance below expected levels of output, efficiency or reliability, the occurrence of any of which could result in lost revenues and/or increased expenses. A significant number of our facilities were constructed many years ago. In particular, older generating equipment and transmission and distribution equipment, even if maintained in accordance with good engineering practices, may require significant capital expenditures to keep operating at peak efficiency or reliability. The risk of increased maintenance and capital expenditures arises from (i) increased starting and stopping of generation equipment due to the volatility of the competitive generation market and the prospect of continuing low wholesale electricity prices that may not justify sustained or year-round operation of all our generation facilities, (ii) any unexpected failure to generate electricity, including failure caused by equipment breakdown or forced outage, (iii) damage to facilities due to storms, natural disasters, wars, terrorist or cyber security acts and other catastrophic events and (iv) the passage of time and normal wear and tear. Further, our ability to successfully and timely complete capital improvements to existing facilities or other capital projects is contingent upon many variables and subject to substantial risks. Should any such efforts be unsuccessful, we could be subject to additional costs and/or losses and write downs of our investment in the project or improvement.
We cannot be certain of the level of capital expenditures that will be required due to changing environmental and safety laws and regulations (including changes in the interpretation or enforcement thereof), needed facility repairs and unexpected events (such as natural disasters or terrorist or cyber security attacks). The unexpected requirement of large capital expenditures could materially affect our results of operations, liquidity and financial condition.
If we make any major modifications to our electricity generation facilities, we may be required to install the best available control technology or to achieve the lowest achievable emission rates as such terms are defined under the new source review provisions of the Clean Air Act. Any such modifications would likely result in us incurring substantial additional capital expenditures.
Insurance, warranties or performance guarantees may not cover all or any of the lost revenues or increased expenses that could result from the risks discussed above, including the cost of replacement electricity. Likewise, the ability to obtain insurance, and the cost of and coverage provided by such insurance, could be affected by events outside our control.
Our employees, contractors, customers and the general public may be exposed to a risk of injury due to the nature of our operations.
Employees and contractors throughout our organization work in, and customers and the general public may be exposed to, potentially dangerous environments near our operations. As a result, employees, contractors, customers and the general public are at risk for serious injury, including loss of life. Significant risks include nuclear accidents, dam failure, gas explosions, mine area collapses, pole strikes and electric contact cases.
Our results of operations, liquidity and financial condition may be materially affected by the effects of extreme weather conditions.
Our results of operations, liquidity and financial condition may be materially affected by weather conditions and may fluctuate substantially on a seasonal basis as the weather changes. In addition, we could be subject to the effects of extreme weather. Extreme weather conditions could stress our transmission and distribution system or our generation facilities resulting in outages, increased maintenance and capital expenditures. Extreme weather events, including sustained cold or hot temperatures, hurricanes, storms or other natural disasters, could be destructive and result in casualty losses that are not ultimately offset by insurance proceeds or in increased capital expenditures or costs, including supply chain costs.
Moreover, an extreme weather event could cause disruption in service to customers due to downed wires and poles or damage to other operating equipment, which could result in us foregoing sales of electricity and lost revenue. Similarly, an extreme weather event might affect the availability of generation and transmission capacity, limiting our ability to source or deliver electricity where it is needed or limit our ability to source fuel for our plants (including due to damage to rail or natural gas pipeline infrastructure). Additionally, extreme weather may result in unexpected increases in customer load, requiring our retail operation to procure additional electricity supplies at wholesale prices in excess of customer sales prices for electricity. These conditions, which cannot be reliably predicted, could have an adverse consequence by requiring us to seek additional sources of electricity when wholesale market prices are high or to sell excess electricity when market prices are low.
Our results of operations, liquidity and financial condition may be materially affected by insufficient water supplies.
Supplies of water are important for our generation facilities. Water in Texas is limited and various parties have made conflicting claims regarding the right to access and use such limited supplies of water. In addition, Texas has experienced sustained drought conditions that could affect the water supply for certain of our generation facilities if adequate rain does not fall in the watershed that supplies the affected areas. If we are unable to access sufficient supplies of water, it could restrict, prevent or increase the cost of operations at certain of our generation facilities.
Attacks on our infrastructure that breach cyber/data security measures could expose us to significant liabilities and reputation damage and disrupt business operations, which could have a material effect on our results of operations, liquidity and financial condition.
Much of our information technology infrastructure is connected (directly or indirectly) to the Internet. There have been numerous attacks on government and industry information technology systems through the Internet that have resulted in material operational, reputation and/or financial costs. While we have controls in place designed to protect our infrastructure and have not had any significant breaches, a breach of cyber/data security measures that impairs our information technology infrastructure could disrupt normal business operations and affect our ability to control our generation and transmission and distribution assets, access retail customer information and limit communication with third parties. Any loss of confidential or proprietary data through a breach could adversely affect our reputation, expose the company to material legal/regulatory claims, impair our ability to execute on business strategies and/or materially affect our results of operations, liquidity and financial condition.
As part of the continuing development of new and modified reliability standards, the FERC has approved changes to its Critical Infrastructure Protection reliability standards and has established standards for assets identified as "critical cyber assets." Under the Energy Policy Act of 2005, the FERC can impose penalties (up to $1 million per day, per violation) for failure to comply with mandatory electric reliability standards, including standards to protect the power system against potential disruptions from cyber and physical security breaches.
Our retail operation (TXU Energy) may lose a significant number of customers due to competitive marketing activity by other retail electric providers.
Our retail operation faces competition for customers. Competitors may offer lower prices and other incentives, or attempt to use the Chapter 11 Cases against us, which, despite the business' long-standing relationship with customers, may attract customers away from us. We operate in a very competitive retail market, as is reflected in a 21% decline in customers (based on meters) served over the last five years.
In some retail electricity markets, our principal competitor may be the incumbent REP. The incumbent REP has the advantage of long-standing relationships with its customers, including well-known brand recognition.
In addition to competition from the incumbent REP, we may face competition from a number of other energy service providers, other energy industry participants, or nationally branded providers of consumer products and services who may develop businesses that will compete with us. Some of these competitors or potential competitors may be larger or better capitalized than we are. If there is inadequate potential margin in these retail electricity markets, it may not be profitable for us to compete in these markets.
Our retail operations are subject to the risk that sensitive customer data may be compromised, which could result in an adverse impact to our reputation and/or the results of the retail operations.
Our retail business requires access to sensitive customer data in the ordinary course of business. Examples of sensitive customer data are names, addresses, account information, historical electricity usage, expected patterns of use, payment history, credit bureau data, credit and debit card account numbers, driver license numbers, social security numbers and bank account information. Our retail business may need to provide sensitive customer data to vendors and service providers who require access to this information in order to provide services, such as call center operations, to the retail business. If a significant breach occurred, the reputation of our retail business may be adversely affected, customer confidence may be diminished, or our retail business may be subject to legal claims, any of which may contribute to the loss of customers and have a negative impact on the business and its results of operations, liquidity and financial condition.
Our retail operations rely on the infrastructure of local utilities or independent transmission system operators to provide electricity to, and to obtain information about, its customers. Any infrastructure failure could negatively impact customer satisfaction and could have a material negative impact on the business and results of operations.
Our retail operations depend on transmission and distribution facilities owned and operated by unaffiliated utilities, as well as Oncor's facilities, to deliver the electricity it sells to its customers. If transmission capacity is inadequate, our ability to sell and deliver electricity may be hindered, and we may have to forgo sales or buy more expensive wholesale electricity than is available in the capacity-constrained area. For example, during some periods, transmission access is constrained in some areas of the Dallas-Fort Worth metroplex, where we have a significant number of customers. The cost to provide service to these customers may exceed the cost to provide service to other customers, resulting in lower profits. In addition, any infrastructure failure that interrupts or impairs delivery of electricity to our customers could negatively impact customer satisfaction with our service.
Our retail operations offer bundled services to customers, with some bundled services offered at fixed prices and for fixed terms. If our costs for these bundled services exceed the prices paid by our customers, our results of operations could be materially affected.
Our retail operations offer customers a bundle of services that include, at a minimum, electricity plus transmission, distribution and related services. The prices we charge for the bundle of services or for the various components of the bundle, any of which may be fixed by contract with the customer for a period of time, could fall below our underlying cost to provide the components of such services.
Our revenues and results of operations may be adversely impacted by decreases in wholesale market prices of electricity due to the development of wind generation sources.
A significant amount of investment in wind generation in the ERCOT market over the past few years has increased overall wind power generation capacity. Generally, the increased capacity has led to lower wholesale electricity prices (driven by lower market heat rates) in the regions at or near wind power development. As a result, the profitability of our generation facilities and electricity purchase contracts, including certain wind generation power purchase contracts, has been impacted and could be further impacted by the effects of the wind power development, and the value could significantly decrease if wind power generation has a material sustained effect on market heat rates.
Our results of operations and financial condition could be negatively impacted by any development or event beyond our control that causes economic weakness in the ERCOT market.
We derive substantially all of our revenues from operations in the ERCOT market, which covers approximately 75% of the geographical area in the State of Texas. As a result, regardless of the state of the economy in areas outside the ERCOT market, economic weakness in the ERCOT market could lead to reduced demand for electricity in the ERCOT market. Such a reduction could have a material negative impact on our results of operations, liquidity and financial condition.
The loss of the services of our key management and personnel could adversely affect our ability to operate our businesses.
Our future success will depend on our ability to continue to attract and retain highly qualified personnel. We compete for such personnel with many other companies, in and outside our industry, government entities and other organizations. We may not be successful in retaining current personnel or in hiring or retaining qualified personnel in the future. Our failure to attract new personnel or retain existing personnel could have a material effect on our businesses.
We have disclosed a material weakness in our internal control over financial reporting relating to our accounting for deferred income taxes, which could adversely affect our ability to report our financial condition, results of operations or cash flows accurately and on a timely basis.
In connection with our assessment of internal control over financial reporting under Section 404 of the Sarbanes-Oxley Act of 2002, we identified a material weakness in our internal control over financial reporting relating to our accounting for deferred income taxes. For a discussion of our internal control over financial reporting and a description of the identified material weakness, see Management's Annual Report on Internal Control over Financial Reporting under Item 9A, Controls and Procedures.
A material weakness is a deficiency, or a combination of deficiencies, in internal control over financial reporting, such that there is a reasonable possibility that a material misstatement of our annual or interim financial statements will not be prevented or detected on a timely basis. Management's procedures and testing identified control deficiencies related to incomplete underlying data and insufficient documentation in the reconciliation process related to deferred income tax accounting that led management to conclude that control deficiencies existed at December 31, 2014. As a result of these deficiencies, until they are substantially remediated, it is reasonably possible that internal controls over financial reporting may not prevent or detect errors in the financial statements from occurring that could be material, either individually or in the aggregate.
While actions have been taken to improve our internal controls in response to the identified material weakness related to certain aspects of accounting for deferred income taxes, additional work continues to address and remediate the identified material weakness. Until these actions are fully implemented and tested, a material weakness in our internal control over financial reporting will continue to exist. As a result, our ability to timely or accurately report our future financial condition, results of operations or cash flows may be adversely affected.
| |
| Item 1B. | UNRESOLVED STAFF COMMENTS |
None.
See Note 13 to the Financial Statements for discussion of litigation, including matters related to our generation facilities, make-whole claims and EPA reviews. Also see Items 1 and 2, Business and Properties – Environmental Regulations and Related Considerations – Sulfur Dioxide, Nitrogen Oxide and Mercury Air Emissions for discussion of litigation regarding the CSAPR and the Texas State Implementation Plan as well as certain other environmental regulations.
| |
| Item 4. | MINE SAFETY DISCLOSURES |
We currently own and operate 12 surface lignite coal mines in Texas to provide fuel for our electricity generation facilities. These mining operations are regulated by the US Mine Safety and Health Administration (MSHA) under the Federal Mine Safety and Health Act of 1977, as amended (the Mine Act), as well as other federal and state regulatory agencies such as the RCT and Office of Surface Mining. The MSHA inspects US mines, including ours, on a regular basis, and if it believes a violation of the Mine Act or any health or safety standard or other regulation has occurred, it may issue a citation or order, generally accompanied by a proposed fine or assessment. Such citations and orders can be contested and appealed, which often results in a reduction of the severity and amount of fines and assessments and sometimes results in dismissal. Disclosure of MSHA citations, orders and proposed assessments are provided in Exhibit 95(a) to this annual report on Form 10-K.
PART II.
| |
| Item 5. | MARKET FOR REGISTRANT'S COMMON EQUITY, RELATED STOCKHOLDER MATTERS AND ISSUER PURCHASES OF EQUITY SECURITIES |
EFH Corp.'s common stock is privately held and has no established public trading market.
See Note 14 to the Financial Statements for discussion of the restrictions on EFH Corp.'s ability to pay dividends.
The number of holders of EFH Corp.'s common stock at March 31, 2015 totaled 61.
| |
| Item 6. | SELECTED FINANCIAL DATA |
EFH CORP. AND SUBSIDIARIES, A DEBTOR-IN-POSSESSION
SELECTED CONSOLIDATED FINANCIAL DATA
(millions of dollars, except ratios)
|
| | | | | | | | | | | | | | | | | | | |
| | Year Ended December 31, |
| | 2014 | | 2013 | | 2012 | | 2011 | | 2010 |
| Operating revenues | $ | 5,978 |
| | $ | 5,899 |
| | $ | 5,636 |
| | $ | 7,040 |
| | $ | 8,235 |
|
| Impairment of goodwill | $ | (1,600 | ) | | $ | (1,000 | ) | | $ | (1,200 | ) | | $ | — |
| | $ | (4,100 | ) |
| Impairment of long-lived assets | $ | (4,670 | ) | | $ | (140 | ) | | $ | — |
| | $ | — |
| | $ | — |
|
| Net loss | $ | (6,406 | ) | | $ | (2,325 | ) | | $ | (3,360 | ) | | $ | (1,913 | ) | | $ | (2,812 | ) |
| Net loss attributable to noncontrolling interests | $ | — |
| | $ | 107 |
| | $ | — |
| | $ | — |
| | $ | — |
|
| Net loss attributable to EFH Corp. | $ | (6,406 | ) | | $ | (2,218 | ) | | $ | (3,360 | ) | | $ | (1,913 | ) | | $ | (2,812 | ) |
| Ratio of earnings to fixed charges (a) | — |
| | — |
| | — |
| | — |
| | — |
|
| Cash provided by (used in) operating activities | $ | 404 |
| | $ | (503 | ) | | $ | (818 | ) | | $ | 841 |
| | $ | 1,106 |
|
| Cash provided by (used in) financing activities | $ | 2,257 |
| | $ | (196 | ) | | $ | 3,373 |
| | $ | (1,014 | ) | | $ | (264 | ) |
| Cash provided by (used in) investing activities | $ | (450 | ) | | $ | 3 |
| | $ | (1,468 | ) | | $ | (535 | ) | | $ | (468 | ) |
| Capital expenditures, including nuclear fuel | $ | (463 | ) | | $ | (617 | ) | | $ | (877 | ) | | $ | (684 | ) | | $ | (944 | ) |
| | | | | | | | | | |
| | At December 31, |
| | 2014 | | 2013 | | 2012 | | 2011 | | 2010 |
| Total assets | $ | 29,248 |
| | $ | 36,446 |
| | $ | 40,970 |
| | $ | 44,077 |
| | $ | 46,388 |
|
| Property, plant & equipment — net | $ | 12,397 |
| | $ | 17,791 |
| | $ | 18,705 |
| | $ | 19,427 |
| | $ | 20,366 |
|
| Goodwill and intangible assets | $ | 3,667 |
| | $ | 5,631 |
| | $ | 6,707 |
| | $ | 7,997 |
| | $ | 8,552 |
|
| Investment in unconsolidated subsidiary (Note 3 to the Financial Statements) | $ | 6,058 |
| | $ | 5,959 |
| | $ | 5,850 |
| | $ | 5,720 |
| | $ | 5,544 |
|
| Capitalization | | | | | | | | | |
| Borrowings under debtor-in-possession credit facilities | $ | 6,825 |
| | $ | — |
| | $ | — |
| | $ | — |
| | $ | — |
|
| Debt (b) | 128 |
| | 34,150 |
| | 37,815 |
| | 35,360 |
| | 34,226 |
|
| Pre-petition notes, loans and other debt reported as liabilities subject to compromise (c) | 35,857 |
| | — |
| | — |
| | — |
| | — |
|
| EFH Corp. common stock equity | (19,723 | ) | | (13,256 | ) | | (11,025 | ) | | (7,852 | ) | | (5,990 | ) |
| Noncontrolling interests in subsidiaries | — |
| | 1 |
| | 102 |
| | 95 |
| | 79 |
|
| Total capitalization | $ | 23,087 |
| | $ | 20,895 |
| | $ | 26,892 |
| | $ | 27,603 |
| | $ | 28,315 |
|
| Capitalization ratios | | | | | | | | | |
| Borrowings under debtor-in-possession credit facilities | 29.6 | % | | — | % | | — | % | | — | % | | — | % |
| Debt (b) | 0.5 | % | | 163.4 | % | | 140.6 | % | | 128.1 | % | | 120.9 | % |
| Pre-petition notes, loans and other debt reported as liabilities subject to compromise (c) | 155.3 | % | | — | % | | — | % | | — | % | | — | % |
| EFH Corp. common stock equity | (85.4 | )% | | (63.4 | )% | | (41.0 | )% | | (28.4 | )% | | (21.2 | )% |
| Noncontrolling interests in subsidiaries | — | % | | — | % | | 0.4 | % | | 0.3 | % | | 0.3 | % |
| Total | 100.0 | % | | 100.0 | % | | 100.0 | % | | 100.0 | % | | 100.0 | % |
| Borrowings under credit and other facilities | $ | — |
| | $ | 2,054 |
| | $ | 2,136 |
| | $ | 774 |
| | $ | 1,221 |
|
___________
| |
| (a) | Fixed charges exceeded earnings (see Exhibit 12(a)) by $9.172 billion, $3.718 billion, $4.715 billion, $3.217 billion and $2.531 billion for the years ended December 31, 2014, 2013, 2012, 2011 and 2010, respectively. |
| |
| (b) | For all periods presented, excludes amounts with contractual maturity dates in the following twelve months. |
| |
| (c) | Includes both unsecured and under secured obligations incurred prior to the Petition Date, but excludes pre-petition obligations that are fully secured and other obligations that are allowed to be paid as ordered by the Bankruptcy Court and $733 million of deferred debt issuance and extension costs. |
Note: See Note 1 to the Financial Statements Basis of Presentation, Including Application of Bankruptcy Accounting. Financial Statements for 2010 reflect the prospective adoption of amended guidance regarding consolidation accounting standards related to variable interest entities that resulted in the deconsolidation of Oncor Holdings as discussed in Note 3 to the Financial Statements. In addition, Financial Statements for 2010 reflect amended guidance regarding transfers of financial assets that resulted in the accounts receivable securitization program no longer being accounted for as a sale of accounts receivable and the funding under the program being reported as borrowings under credit and other facilities. Results for 2014 were significantly impacted by impairment of long-lived assets and intangible assets (see Notes 4 and 8). Results for 2014, 2013, 2012 and 2010 were significantly impacted by goodwill impairment charges as discussed in Note 4 to the Financial Statements. Results for 2011 were significantly impacted by an impairment charge related to emissions allowance intangible assets as discussed in Note 4 to the Financial Statements.
Quarterly Information (Unaudited)
Results of operations by quarter are summarized below. In our opinion, all adjustments (consisting of normal recurring accruals) necessary for a fair statement of such amounts have been made. Quarterly results are not necessarily indicative of a full year's operations because of seasonal and other factors. All amounts are in millions of dollars and may not add to full year amounts due to rounding.
|
| | | | | | | | | | | | | | | |
| | First Quarter | | Second Quarter | | Third Quarter | | Fourth Quarter (a) |
| 2014: | | | | | | | |
| Operating revenues | $ | 1,517 |
| | $ | 1,406 |
| | $ | 1,807 |
| | $ | 1,248 |
|
| Net income (loss) | (609 | ) | | (774 | ) | | 49 |
| | (5,072 | ) |
| Net loss attributable to noncontrolling interests | — |
| | — |
| | — |
| | — |
|
| Net income (loss) attributable to EFH Corp, | $ | (609 | ) | | $ | (774 | ) | | $ | 49 |
| | $ | (5,072 | ) |
|
| | | | | | | | | | | | | | | |
| | First Quarter | | Second Quarter | | Third Quarter | | Fourth Quarter (a)(b) |
| 2013: | | | | | | | |
| Operating revenues | $ | 1,260 |
| | $ | 1,419 |
| | $ | 1,893 |
| | $ | 1,327 |
|
| Net income (loss) | (569 | ) | | (71 | ) | | 5 |
| | (1,690 | ) |
| Net loss attributable to noncontrolling interests | — |
| | — |
| | — |
| | 107 |
|
| Net income (loss) attributable to EFH Corp, | $ | (569 | ) | | $ | (71 | ) | | $ | 5 |
| | $ | (1,583 | ) |
___________
| |
| (a) | Net loss reflects goodwill and other intangible asset impairment charges of $1.863 billion and $1.0 billion in 2014 and 2013, respectively (see Note 4 to the Financial Statements). Additionally, net loss reflects impairment of long-lived assets of $4.670 billion in 2014 (see Note 8 to the Financial Statements). |
| |
| (b) | Net loss reflects a $140 million impairment charge related to assets of the nuclear generation development joint venture in 2013 (see Note 8 to the Financial Statements). |
| |
| Item 7. | MANAGEMENT'S DISCUSSION AND ANALYSIS OF FINANCIAL CONDITION AND RESULTS OF OPERATIONS |
The following discussion and analysis of our financial condition and results of operations for the years ended December 31, 2014, 2013 and 2012 should be read in conjunction with Selected Consolidated Financial Data and our audited consolidated financial statements and the notes to those statements. Comparisons of year-over-year results are impacted by the effects of the Bankruptcy Filing and the application of Financial Accounting Standards Board Accounting Standards Codification (ASC) 852, Reorganizations.
All dollar amounts in the tables in the following discussion and analysis are stated in millions of US dollars unless otherwise indicated.
Business
EFH Corp., a Texas corporation, is a Dallas-based holding company that conducts its operations principally through its TCEH and Oncor subsidiaries. EFH Corp. is a subsidiary of Texas Holdings, which is controlled by the Sponsor Group. TCEH is a holding company for subsidiaries engaged in competitive electricity market activities largely in Texas, including electricity generation, wholesale energy sales and purchases, commodity risk management and trading activities, and retail electricity operations. TCEH is a wholly owned subsidiary of EFCH, which is a holding company and a wholly owned subsidiary of EFH Corp. Oncor is engaged in regulated electricity transmission and distribution operations in Texas. Oncor provides distribution services to REPs, including subsidiaries of TCEH, which sell electricity to residential, business and other consumers. Oncor Holdings, a holding company that holds an approximately 80% equity interest in Oncor, is a wholly owned subsidiary of EFIH, which is a holding company and a wholly owned subsidiary of EFH Corp.
Various ring-fencing measures have been taken to enhance the credit quality of Oncor. See Notes 1 and 3 to the Financial Statements for a discussion of the reporting of our investment in Oncor (and Oncor Holdings) as an equity method investment and a description of the ring-fencing measures implemented with respect to Oncor. These measures were put in place to mitigate Oncor's exposure to the Texas Holdings Group with the intent to minimize the risk that a court would order any of the assets and liabilities of the Oncor Ring-Fenced Entities to be substantively consolidated with those of any member of the Texas Holdings Group in the event any such member were to become a debtor in a bankruptcy case. Consistent with these ring-fencing measures, the assets and liabilities of the Oncor Ring-Fenced Entities have not been, and are not expected to be, substantively consolidated with the assets and liabilities of the Debtors in the Chapter 11 Cases.
Operating Segments
Our operations are aligned into two reportable business segments: Competitive Electric and Regulated Delivery. The Competitive Electric segment consists largely of TCEH. The Regulated Delivery segment consists largely of our investment in Oncor.
See Note 20 to the Financial Statements for further information regarding reportable business segments.
Significant Activities and Events and Items Influencing Future Performance
Filing under Chapter 11 of the United States Bankruptcy Code — On April 29, 2014 (the Petition Date), EFH Corp. and the substantial majority of its direct and indirect subsidiaries, including EFIH, EFCH and TCEH but excluding the Oncor Ring-Fenced Entities, filed voluntary petitions for relief under Chapter 11 of the United States Bankruptcy Code in the United States Bankruptcy Court for the District of Delaware. During the pendency of the Bankruptcy Filing, the Debtors will operate their businesses as "debtors-in-possession" under the jurisdiction of the Bankruptcy Court and in accordance with the applicable provisions of the Bankruptcy Code.
For additional discussion of the Bankruptcy Filing and its effects, see Note 2 to the Financial Statements and Item 1A, Risk Factors – Risks Related to the Chapter 11 Cases. See Note 11 to the Financial Statements for discussion of the DIP Facilities.
Proposed Sale of EFH Corp.'s Indirect Economic Ownership Interest in Oncor — In January 2015, the Bankruptcy Court approved the Debtors' bidding procedures motion that sets forth the process by which the Debtors are authorized to solicit proposals (i.e., bids) from third parties to acquire (in any form and employing any structure, whether taxable (in whole or in part) or tax-free) EFH Corp.'s indirect economic ownership interest in Oncor in accordance with the Bankruptcy Code. These bidding procedures contemplate that the Debtors select a stalking horse bid after a two-stage closed bidding process, and, after approval by the Bankruptcy Court of such stalking horse bid, the Debtors conduct a round of open bidding culminating in an auction intended to obtain a higher or otherwise best bid for a transaction. Initial bids were received in early March 2015, and each of the Debtors is currently assessing those submissions. For additional discussion see Note 2 to the Financial Statements and Item 1A, Risk Factors – Risks Related to the Chapter 11 Cases.
Repayment of EFIH Second Lien Notes — In March 2015, with the approval of the Bankruptcy Court, EFIH used some of its cash to repay (Repayment) $735 million, including interest at contractual rates, in amounts outstanding under EFIH's pre-petition 11.00% Second Lien Notes due 2021 (11.00% Notes) and 11.75% Second Lien Notes due 2022 (11.75% Notes) and $15 million in certain fees and expenses of the trustee for such notes. The Repayment required the requisite consent of the lenders under its DIP Facility. EFIH received such consent from approximately 97% of the lenders under EFIH's DIP Facility and paid an aggregate consent fee equal to approximately $13 million. As a result of the Repayment, as of the date hereof, the principal amount outstanding on the 11.00% Notes and 11.75% are $322 million and $1.388 billion, respectively.
EFIH First Lien Notes Settlement — See Note 11 to the Financial Statements for discussion of the incurrence of the EFIH DIP Facility and the use of certain proceeds to settle the EFIH First Lien Notes.
Income Tax Matters — See Note 5 to the Financial Statements for discussion of the agreement we reached with the IRS in March 2013 that resolved disputed adjustments from the IRS audit for the years 2003 through 2006 and the approval we received from the Joint Committee on Taxation of the IRS appeals settlement in May 2013 that resolved all issues from the IRS audit for the years 1997 through 2002. The resolution of audits for these periods resulted in an income tax benefit of $305 million recorded in the year ended December 31, 2013.
We expect to generate additional net operating loss (NOL) carryforwards during our Chapter 11 Cases, and expect to have total NOL carryforwards of approximately $4.9 billion when we emerge from bankruptcy (estimated based on a December 31, 2015 emergence date). The total amount of such NOL carryforwards will depend on the length of time we remain in bankruptcy and on the resolution of certain disputed issues in our Chapter 11 Cases. In addition, we expect that TCEH and its subsidiaries will have approximately $6.7 billion of tax basis in their assets as of December 31, 2015.
Natural Gas Hedging Program and Termination of Positions — Prior to the Petition Date, TCEH entered into long-term market transactions involving natural gas-related financial instruments designed to mitigate the effect of natural gas price changes on future electricity revenues. These instruments were deemed to be "forward contracts" under the Bankruptcy Code. The Bankruptcy Filing constituted an event of default under the natural gas hedging agreements, and in accordance with the contractual terms, counterparties terminated these hedging positions, which are secured by a first-lien interest in the same assets of TCEH on a pari passu basis with the TCEH Senior Secured Facilities and the TCEH Senior Secured Notes. These positions represented the substantial majority of the positions in the program. See discussion below regarding termination of interest rate swaps with the same counterparties and related contractual netting arrangements.
The natural gas positions have resulted in realized and unrealized net gains (losses), reported in net gain (loss) from commodity hedging and trading activities, as provided in the table below. Realized net gain presented below for the year ended December 31, 2014 represents amounts settled in cash and therefore does not include $117 million of realized net gains that are included (as an offset) in the net settlement liability arising from the terminations of interest rate swap and natural gas hedging positions as discussed below. (Corresponding amount is excluded from unrealized net loss.)
|
| | | | | | | | | | | |
| | Year Ended December 31, |
| | 2014 | | 2013 | | 2012 |
| Realized net gains | $ | 345 |
| | $ | 998 |
| | $ | 1,833 |
|
| Unrealized net losses including reversals of previously recorded amounts related to positions settled | (433 | ) | | (1,033 | ) | | (1,540 | ) |
| Total | $ | (88 | ) | | $ | (35 | ) | | $ | 293 |
|
See Results of Operations for discussion of the results of all hedging and trading activity, including the results of the natural gas hedging program.
TCEH Interest Rate Swaps and Terminations of Positions — Prior to the Petition Date, TCEH employed interest rate swaps to hedge exposure to its variable rate debt. TCEH also entered into interest rate basis swap transactions that further reduced the fixed borrowing costs achieved through the interest rate swaps. These instruments were deemed to be "forward contracts" under the Bankruptcy Code. The Bankruptcy Filing constituted an event of default under the interest rate swap agreements, and in accordance with the contractual terms, the counterparties terminated all the TCEH agreements shortly after the Bankruptcy Filing. All of the TCEH interest rate swaps are secured by a first-lien interest in the same assets of TCEH on a pari passu basis with the TCEH Senior Secured Facilities and the TCEH Senior Secured Notes.
The interest rate swaps have resulted in realized and unrealized net gains (losses), reported in interest expense and related charges, as presented in the table below. Realized net loss presented below for the year ended December 31, 2014 represents amounts settled in cash and therefore does not include $1.225 billion of realized net losses that are included in the net liability arising from the terminations and $127 million in realized losses on matured positions that have not been settled as discussed immediately below. (Corresponding amounts are excluded from unrealized net gain.)
|
| | | | | | | | | | | |
| | Year Ended December 31, |
| | 2014 | | 2013 | | 2012 |
| Realized net loss | $ | (66 | ) | | $ | (620 | ) | | $ | (670 | ) |
| Unrealized net gain including reversals related to realized net loss amounts | 65 |
| | 1,053 |
| | 166 |
|
| Total | $ | (1 | ) | | $ | 433 |
| | $ | (504 | ) |
First-Lien Security for Natural Gas Hedging Positions and Interest Rate Swaps — Entities with a first-lien security interest included counterparties to both our natural gas hedging positions and interest rate swaps, which had entered into master agreements that provided for netting and setoff of amounts related to these positions, as well as counterparties to only our interest rate swaps. The net liability recorded upon termination of the interest rate swaps and natural gas hedges totaled $1.108 billion, which represents the $1.225 billion realized loss related to the terminated interest rate swaps net of the $117 million realized gain related to the terminated natural gas hedging positions. In addition, net accounts payable amounts related to matured interest rate swaps, which totaled $127 million at December 31, 2014, are secured by the first-lien interest. The total net liability of $1.235 billion is subject to the terms of settlement of TCEH's first-lien claims ultimately approved by the Bankruptcy Court, and is reported in the consolidated balance sheets as a liability subject to compromise. Further, as noted in Note 9 to the Financial Statements, the net liability is subject to adequate protection payments during the pendency of the Chapter 11 Cases.
Overall Hedged Generation Position — Taking together forward wholesale and retail electricity sales with all hedging positions, at December 31, 2014, we had effectively hedged an estimated 79% of the price exposure, on a natural gas equivalent basis, related to our expected generation output for 2015 (assuming an 8.5 market heat rate). The majority of our third-party hedges are financial natural gas positions. At December 31, 2014, we had no significant natural gas hedges beyond 2015.
Seasonal Suspension of Certain Generation Operations — In 2013, ERCOT approved our notice of intent to seasonally suspend operations for approximately eight months beginning each October at two of the three generation units at our Monticello generation facility and one of the three generation units at our Martin Lake generation facility. We decided to take this action due to low wholesale electricity prices and other market conditions impacting these facilities. While the units are under seasonal suspension, they generally only run in the summer months, but after notification to ERCOT, we can run them in other months, as we did in early 2014 in response to higher than anticipated wholesale electricity prices. We will continue to monitor wholesale electricity prices and market conditions in determining whether to continue seasonal operations and/or return the units to service prior to peak demand months.
Pension and OPEB Plan Actions — In August 2012, EFH Corp. approved certain amendments to its pension plan (see Note 17 to the Financial Statements). These actions were completed in the fourth quarter 2012, and the amendments resulted in:
| |
| • | splitting off assets and liabilities under the plan associated with employees of Oncor and all retirees and terminated vested participants of EFH Corp. and its subsidiaries (including discontinued businesses) to a new plan sponsored and administered by Oncor (the Oncor Plan) and |
| |
| • | the termination of, distributions of benefits under, and settlement of all of EFH Corp.'s liabilities associated with active employees of EFH Corp.'s competitive businesses other than collective bargaining unit employees. |
EFH Corp.'s competitive operations recorded charges totaling $285 million in the fourth quarter 2012, including $193 million related to the competitive business obligations (including discontinued businesses) that were assumed under the Oncor Plan and $92 million related to the settlement of the terminated liabilities. These amounts represent the previously unrecognized actuarial losses reported in accumulated other comprehensive income (loss).
Settlement of the liabilities and the full funding of the EFH Corp. competitive operations portion of liabilities (including discontinued businesses) under the Oncor Plan resulted in an aggregate pension plan cash contribution by EFH Corp.'s competitive operations of $259 million in the fourth quarter of 2012.
In accordance with an agreement between Oncor and EFH Corp., Oncor ceased participation in EFH Corp.'s OPEB Plan effective July 1, 2014 and established its own OPEB plan for Oncor's eligible existing and future retirees and their dependents, as well as split service participants as discussed in Note 19 to the Financial Statements. The separation resulted in the transfer of a significant portion of the liability associated with our plan to the new Oncor plan, which resulted in a reduction of our OPEB liability of approximately $758 million and a corresponding reduction of an equal amount in the receivable from unconsolidated subsidiary.
Impairment of Goodwill — In 2014, 2013 and 2012, we recorded $1.6 billion, $1.0 billion and $1.2 billion, respectively, in noncash goodwill impairment charges (which were not deductible for income tax purposes) related to the Competitive Electric segment. The write-offs reflected the effect of lower wholesale electricity prices in ERCOT, driven by the sustained decline in natural gas prices as discussed in Key Risks and Challenges – Natural Gas Price and Market Heat Rate Exposure below. Recorded goodwill related to the Competitive Electric segment totaled $2.352 billion at December 31, 2014. See Note 4 to the Financial Statements for a description of the methods and key inputs and assumptions used by management to determine implied fair value of goodwill, the degree of uncertainty associated with those key inputs and assumptions, and the changes in circumstances that reasonably could be expected to affect the key inputs and assumptions.
The noncash impairment charges did not cause EFH Corp. or its subsidiaries to be in default under any of their respective debt covenants or have a material impact on liquidity.
See Note 4 to the Financial Statements and Application of Critical Accounting Policies below for more information on goodwill impairment testing and charges.
Impairment of Long-Lived Assets — EFH Corp. records impairment losses on long-lived assets used in our operations when events and circumstances indicate the long-lived assets might be impaired and the undiscounted cash flows generated by those assets are less than the carrying amounts of the assets. During 2014, the decrease in forecasted wholesale electricity prices in ERCOT, potential effects from environmental regulations and changes to our operating plans led to recording $4.670 billion in noncash impairment charges substantially all related to our Martin Lake, Monticello and Sandow 5 generation facilities (see Note 8 to the Financial Statements). Additional material impairments related to these or other of our generation facilities may occur in the future if forward wholesale electricity prices in ERCOT continue to decline or if additional environmental regulations increase the cost of producing electricity at our generation facilities.
Global Climate Change and Other Environmental Matters — See Items 1 and 2, Business and Properties – Environmental Regulations and Related Considerations for discussion of global climate change, recent and anticipated EPA actions and various other environmental matters and their effects on the company.
Recent PUCT/ERCOT Actions — ERCOT publishes a Capacity, Demand and Reserves report (CDR Report) twice each year that projects the reserve margin in ERCOT over a ten year horizon. In its December 2014 CDR Report, ERCOT projected that reserve margins in the ERCOT market would not fall below the current target reserve margin of 13.75% until 2019. The CDR Report projects reserve margins of 18.1% in 2017, 16.5% in 2018, 13.6% in 2019 and 12.4% in 2020. The December 2014 CDR Report continues to employ ERCOT's revised load forecast methodology that indicates a slower pace of peak demand growth as compared to the methodology ERCOT used prior to 2014. In addition, ERCOT uses new peak summer capacity factors for wind resources in the December 2014 CDR Report. The effective load carrying capacity of non-coastal wind increased from 8.7% to 12%, and coastal wind increased from 8.7% to 56%.
A number of changes to the ERCOT market rules have been implemented for the stated purpose of sending appropriate price signals to encourage development of generation resources in ERCOT. These changes include an increased system-wide offer cap that applies to wholesale electricity offers in ERCOT (from its previous level of $3,000 per MWh to $4,500 per MWh effective August 2012, $5,000 per MWh effective June 2013, $7,000 per MWh effective June 2014 and $9,000 per MWh beginning in the summer of 2015). In September 2013, the PUCT directed ERCOT to develop the processes necessary to implement a new pricing mechanism, the operating reserve demand curve (also known as ORDC and Hogan Solution B+), which would provide for a price adder to real-time wholesale electricity prices as reserves decline, subject to a $9,000 per MWh energy price cap. The market rules implementing the operating reserve demand curve were approved by the ERCOT Board in November 2013 and were implemented effective June 2014. We cannot predict the frequency of market conditions in the ERCOT market that could result in these price adders, but these would likely be due to extreme weather and/or reduced generation availability, among other factors.
Settlement of Make-Whole Agreements with Oncor — See Note 19 to the Financial Statements for discussion of the settlement in 2012 of our interest and tax-related reimbursement agreements with Oncor associated with Oncor's bankruptcy-remote financing subsidiary's securitization bonds.
Oncor's Investment in Transmission and Distribution Infrastructure — Oncor expects its capital expenditures on transmission and distribution infrastructure to total approximately $1.1 billion in 2015. Oncor's management currently expects to recommend to its board of directors capital expenditures of approximately $1.4 billion in 2016 and approximately $1.5 billion in each of the years 2017 through 2020.
Oncor Matters with the PUCT — Application for Reconciliation of Advanced Meter Surcharge (PUCT Docket No. 41814) — In September 2013, Oncor filed an application with the PUCT for reconciliation of all costs incurred and investments made from January 1, 2011 through December 31, 2012, in the deployment of Oncor's advanced metering system (AMS) pursuant to the AMS Deployment Plan approved in Docket No. 35718. During the 2011 to 2012 period, Oncor incurred approximately $300 million of capital expenditures and $34 million of operating and maintenance expense, and billed customers approximately $174 million through the AMS surcharge. Oncor was not seeking a change in the AMS surcharge in this proceeding. In November 2013, Oncor filed an amended request and the PUCT Staff filed its recommendation concluding that all costs presented in the amended application, with the exception of less than $1,000 of expenses, are appropriate for recovery. In December 2013, the PUCT issued its final order in the proceeding agreeing with the PUCT Staff's recommendation, finding that costs expended and investments made in the deployment of Oncor's AMS through December 31, 2012 were properly allocated, reasonable and necessary.
Competitive Renewable Energy Zones (CREZs) (PUCT Docket Nos. 35665 and 37902) — In 2009, the PUCT awarded Oncor CREZ construction projects. These projects involve the construction of transmission lines and stations to support the transmission of electricity from renewable energy sources, principally wind generation facilities, in the western part of Texas to population centers in the eastern part of Texas, as well as building additional facilities to provide further voltage support to the transmission grid as a result of CREZ. At December 31, 2014, Oncor's cumulative CREZ-related capital expenditures totaled $2.011 billion, including $140 million in 2014.
2008 Rate Review Filing (PUCT Docket No. 35717) — In August 2009, the PUCT issued a final order with respect to Oncor's June 2008 rate review filing with the PUCT and 204 cities based on a test year ended December 31, 2007, and new rates were implemented in September 2009. Oncor and four other parties appealed various portions of the rate review final order to a state district court. In January 2011, the district court signed its judgment reversing the PUCT with respect to two issues: the PUCT's disallowance of certain franchise fees and the PUCT's decision that PURA no longer requires imposition of a rate discount for state colleges and universities. Oncor filed an appeal with the Texas Third Court of Appeals (Austin Court of Appeals) in February 2011 with respect to the issues it appealed to the district court and did not prevail upon, as well as the district court's decision to reverse the PUCT with respect to discounts for state colleges and universities. In August 2014, the Austin Court of Appeals reversed the district court and affirmed the PUCT with respect to the PUCT's disallowance of certain franchise fees and the PUCT's decision that PURA no longer requires imposition of a rate discount for state colleges and universities. The Austin Court of Appeals also reversed the PUCT and district court's rejection of a proposed consolidated tax savings adjustment arising out of EFH Corp.'s ability to offset Oncor's taxable income against losses from other investments and remanded the issue to the PUCT to determine the amount of the consolidated tax savings adjustment. In late August 2014, Oncor filed a motion on rehearing with the Austin Court of Appeals with respect to certain appeal issues on which Oncor was not successful, including the consolidated tax savings adjustment. In December 2014, the Austin Court of Appeals issued its Opinion on Rehearing, clarifying that it was rendering judgment on the rate discount for state colleges and universities issue (affirming that PURA no longer requires imposition of the rate discount) rather than remanding it to the PUCT, and dismissing the motions for rehearing regarding the franchise fee issue and the consolidated tax savings adjustment. Oncor filed a petition for review with the Texas Supreme Court in February 2015. If Oncor's appeals efforts are unsuccessful and the proposed consolidated tax savings adjustment is implemented, Oncor estimates that on remand the impact on earnings of the consolidated tax savings adjustment's value could range from zero, as originally determined by the PUCT in Docket No. 35717, to a $130 million loss (after-tax). Oncor does not believe that any of the other issues ruled upon by the Austin Court of Appeals would result in a material impact to its results of operations or financial condition.
Transmission Cost Recovery and Rates (PUCT Docket Nos. 43858, 42558, 42059 and 41543) — In order to reflect increases or decreases in its wholesale transmission costs, including fees it pays to other transmission service providers, PUCT rules allow Oncor to update the transmission cost recovery factor (TCRF) component of its retail delivery rates charged to REPs on March 1 and September 1 each year. In December 2014, Oncor filed an application to update the TCRF, which became effective March 1, 2015. This application was designed to reduce Oncor's billings for the period from March 2015 through August 2015 by $27 million. In May 2014, Oncor filed an application to update the TCRF, which became effective September 1, 2014. This application was designed to increase Oncor's billings for the period from September 2014 through February 2015 by $71 million. In December 2013, Oncor filed an application to update the TCRF, which became effective March 1, 2014. This application was designed to increase Oncor's billings for the period from March 2014 through August 2014 by $44 million. In June 2013, Oncor filed an application to update the TCRF, which became effective September 1, 2013. This application was designed to increase Oncor's billings for the period from September 2013 through February 2014 by $88 million.
Transmission Interim Rate Update Applications (PUCT Docket Nos. 44363, 42706, 42267, 41706 and 41166) — In order to reflect changes in its invested transmission capital, PUCT rules allow Oncor to update its transmission cost of service (TCOS) rates by filing up to two interim TCOS rate adjustments in a calendar year. TCOS revenues are collected from load serving entities benefiting from Oncor's transmission system. REPs serving customers in Oncor's service territory are billed through the TCRF mechanism discussed above while other load serving entities are billed directly. In January 2015, Oncor filed an application for an interim update of its TCOS rate. The new rate was approved by the PUCT and became effective in March 2015. Oncor's annualized revenues increased by an estimated $35 million with approximately $23 million of this increase recoverable through transmission costs charged to wholesale customers and $12 million recoverable from REPs through the TCRF component of Oncor's delivery rates.
In July 2014, Oncor filed an application for an interim update of its TCOS rate. The new rate was approved by the PUCT and became effective in September 2014. Oncor's annualized revenues increased by an estimated $12 million with approximately $8 million of this increase recoverable through transmission costs charged to wholesale customers and $4 million recoverable from REPs through the TCRF component of Oncor's delivery rates. In February 2014, Oncor filed an application for an interim update of its TCOS rate. The new rate was approved by the PUCT and became effective in April 2014. Oncor's annualized revenues increased by an estimated $74 million with approximately $47 million of this increase recoverable through transmission costs charged to wholesale customers and $27 million recoverable from REPs through the TCRF component of Oncor's delivery rates.
In July 2013, Oncor filed an application for an interim update of its TCOS rate. The new rate was approved by the PUCT and became effective in September 2013. Oncor's annualized revenues increased by an estimated $71 million with approximately $45 million of this increase recoverable through transmission costs charged to wholesale customers and $26 million recoverable from REPs through the TCRF component of Oncor's delivery rates. In January 2013, Oncor filed an application for an interim update of its TCOS rate. The new rate was approved by the PUCT and became effective in March 2013. Oncor's annualized revenues increased by an estimated $27 million with approximately $17 million of this increase recoverable through transmission costs charged to wholesale customers and $10 million recoverable from REPs through the TCRF component of Oncor's delivery rates.
Application for 2015 Energy Efficiency Cost Recovery Factor Surcharge (PUCT Docket No. 42559) — In May 2014, Oncor filed an application with the PUCT to request approval of the energy efficiency cost recovery factor (EECRF) for 2015. PUCT rules require Oncor to make an annual EECRF filing by the first business day in June in each year for implementation on March 1 of the next calendar year. The requested 2015 EECRF was $68 million as compared to $73 million established for 2014, and would result in a monthly charge for residential customers of $1.03 as compared to the 2014 residential charge of $1.01 per month. In October 2014, the PUCT issued a final order approving the 2015 EECRF, which is designed to recover $50 million of Oncor's costs for the 2015 program year, a $23 million performance bonus based on Oncor's 2013 results and a $5 million decrease for over-recovery of 2013 costs.
Summary — We cannot predict future regulatory or legislative actions or any changes in economic and securities market conditions. Such actions or changes could significantly affect our results of operations, liquidity or financial condition.
KEY RISKS AND CHALLENGES
Following is a discussion of key risks and challenges facing management and the initiatives currently underway to manage such challenges. These matters involve risks that could have a material effect on our results of operations, liquidity or financial condition. Also see Item 1A, Risk Factors.
Chapter 11 Cases
As discussed above, we filed voluntary petitions for relief under Chapter 11 of the Bankruptcy Code. For the duration of the Chapter 11 Cases, our business and operations will be subject to various risks, including but not limited to the following:
| |
| • | a loss of, or a disruption in receipts of, materials or services provided by vendors with whom we have commercial relationships; |
| |
| • | a decrease in the number of counterparties that are willing to engage in commodity related hedging transactions with us and an increase in the amount of collateral required to engage in any such transactions; |
| |
| • | increased levels of employee distraction, uncertainty and potential attrition; |
| |
| • | the inability to maintain or obtain sufficient debtor-in-possession financing sources for operations or to fund any reorganization plan and meet future obligations; |
| |
| • | a decrease in the number of our retail electricity customers and potential tarnishing of the TXU Energy brand, and |
| |
| • | increased legal and other professional costs associated with the Chapter 11 Cases and our reorganization. |
The duration of the Chapter 11 Cases is difficult to estimate and ultimately could be lengthy. If we are unable to file a Chapter 11 plan of reorganization, or solicit the appropriate votes for such plan, in each case, prior to the expiration of the exclusivity period granted by the Bankruptcy Court (currently June 23, 2015 for filing a Chapter 11 plan of reorganization and August 23, 2015 for soliciting the appropriate votes for such plan), third parties could file their own plan or plans of reorganization. Any such third party plan or plans will likely exacerbate the duration, cost and contentiousness of the Chapter 11 Cases. We will also be required to seek approvals of certain federal and state regulators in connection with the Chapter 11 Cases, which approvals may be denied, conditioned or delayed, and certain parties may intervene and protest approval. An extended duration of the Chapter 11 Cases due to these factors could exacerbate the risks identified above and the contentiousness of the Chapter 11 Cases.
While we are operating under Chapter 11, transactions outside of the ordinary course of business will be subject to the prior approval of the Bankruptcy Court, which may limit our ability to respond in a timely manner to certain events or take advantage of certain opportunities. Additionally, the terms of the DIP Facilities and the Chapter 11 plan of reorganization ultimately proposed by the Debtors or any other reorganization plan will limit our ability to undertake certain business initiatives.
To mitigate the risks discussed above, we requested and ultimately received a number of first day motions from the Bankruptcy Court that are intended to allow us to conduct our business operations in the normal course and maintain our focus on achieving excellence in customer service and meeting the needs of electricity consumers in Texas. In addition, TCEH procured the TCEH DIP Facility. Moreover, we continue to keep on-going communications with our customers, suppliers, employees and other stakeholders emphasizing that the Bankruptcy Filing resulted from an overleveraged balance sheet and a sustained decline in wholesale electricity prices, not the result of a failure of our operating business model or issues with the performance of our generation assets or other operations.
We have also engaged outside counsel and other advisors who are experts in bankruptcy matters to assist our management and other employees with legal and administrative matters related to the Chapter 11 Cases to minimize disruption to and distraction from our business operations and to help ensure that we have sufficient liquidity through the duration of the Chapter 11 Cases.
Natural Gas Price and Market Heat Rate Exposure
Wholesale electricity prices in the ERCOT market have historically moved with the price of natural gas because marginal demand for electricity supply is generally met by natural gas fueled generation facilities. The price of natural gas has fluctuated due to changes in industrial demand, supply availability and other economic and market factors, and such prices have historically been volatile. As shown in the table below, forward natural gas prices have generally declined over the last several years driven by development and expansion of hydraulic fracturing in natural gas extraction. (Amounts are prices per MMBtu.)
|
| | | | | | | | | | | | | | | | | | | | | | | | | | | | | | | |
| | Settled Prices (b) | | Forward Market Prices (a) | | |
| Date | | 2011 | | 2012 | | 2013 | | 2014 | | 2015 | | 2016 | | 2017 |
| December 31, 2009 | $ | 3.99 |
| | $ | 6.34 |
| | $ | 6.53 |
| | | | | | | | | | |
| December 31, 2010 | $ | 4.39 |
| | $ | 4.55 |
| | $ | 5.08 |
| | $ | 5.33 |
| | | | | | | | |
| December 31, 2011 | $ | 4.04 |
| | | | $ | 3.24 |
| | $ | 3.94 |
| | $ | 4.34 |
| | | | | | |
| December 31, 2012 | $ | 2.79 |
| | | | | | $ | 3.54 |
| | $ | 4.03 |
| | $ | 4.23 |
| | | | |
| December 31, 2013 | $ | 3.60 |
| | | | | | | | $ | 4.19 |
| | $ | 4.14 |
| | $ | 4.13 |
| | |
| December 31, 2014 | $ | 4.42 |
| | | | | | | | | | $ | 3.03 |
| | $ | 3.46 |
| | $ | 3.76 |
|
___________
| |
| (a) | Represents the annual average of NYMEX Henry Hub monthly forward prices at the date presented. Three years of forward prices are presented as such period is generally deemed to be the liquid period. |
| |
| (b) | Represents the average of NYMEX Henry Hub monthly settled prices of financial contracts for the year ending on the date presented. |
In contrast to our natural gas fueled generation facilities, changes in natural gas prices have no significant effect on the cost of generating electricity from our nuclear and lignite/coal fueled facilities, which represent the substantial majority of our generation capacity. All other factors being equal, these nuclear and lignite/coal fueled generation assets increase or decrease in value as natural gas prices and market heat rates rise or fall, respectively, because of the effect on wholesale electricity prices in ERCOT.
The wholesale market price of electricity divided by the market price of natural gas represents the market heat rate. Market heat rate can be affected by a number of factors including generation availability and the efficiency of the marginal supplier (generally natural gas fueled generation facilities) in generating electricity. While market heat rates have generally increased over the past several years as natural gas prices have declined, wholesale electricity prices have declined due to the greater effect of falling natural gas prices.
Our market heat rate exposure is impacted by changes in the availability, such as additions and retirements of generation facilities, and mix of generation assets in ERCOT. For example, increasing wind generation capacity generally depresses market heat rates. Our heat rate exposure is impacted by potential economic backdown of our generation assets. We expect that decreases in market heat rates would decrease the value of our generation assets because lower market heat rates generally result in lower wholesale electricity prices, and vice versa.
With the exposure to variability of natural gas prices and market heat rates in ERCOT, retail sales price management and hedging activities are critical to the profitability of the business and maintaining consistent cash flow levels.
Our approach to managing electricity price risk focuses on the following:
| |
| • | employing disciplined, liquidity-efficient hedging and risk management strategies through physical and financial energy-related (electricity and natural gas) contracts intended to partially hedge gross margins; |
| |
| • | continuing focus on cost management to better withstand gross margin volatility; |
| |
| • | following a retail pricing strategy that appropriately reflects the magnitude and costs of commodity price, liquidity risk and retail load variability, and |
| |
| • | improving retail customer service to attract and retain high-value customers. |
As discussed above in Significant Activities and Events and Items Influencing Future Performance – Natural Gas Hedging Program and Termination of Positions, we have engaged in natural gas hedging activities to mitigate the risk of lower wholesale electricity prices due to declines in natural gas prices. While current and forward natural gas prices are currently depressed, we continue to seek opportunities to manage our wholesale power price exposure through hedging activities, including forward wholesale and retail electricity sales. At December 31, 2014, we had no significant natural gas hedges beyond 2015.
We mitigate market heat rate risk through retail and wholesale electricity sales contracts and shorter-term heat rate hedging transactions. We evaluate opportunities to mitigate market heat rate risk over extended periods through longer-term electricity sales contracts where practical considering pricing, credit, liquidity and related factors.
The following sensitivity table provides estimates of the potential impact (in $ millions) of movements in natural gas prices and market heat rates on realized pretax earnings for the periods presented. The estimates related to price sensitivity are based on our unhedged position and forward prices at December 31, 2014, which for natural gas reflects estimates of electricity generation less amounts under existing wholesale and retail sales contracts and amounts related to hedging positions. On a rolling basis, generally twelve-months, the substantial majority of retail sales under month-to-month arrangements are deemed to be under contract.
|
| | | |
| | Balance 2015 | | 2016 |
| $1.00/MMBtu change in natural gas price (a)(b) | $ ~84 | | $ ~400 |
| 0.1/MMBtu/MWh change in market heat rate (c) | $ ~6 | | $ ~20 |
___________
| |
| (a) | Balance of 2015 is from February 1, 2015 through December 31, 2015. |
| |
| (b) | Assumes conversion of electricity positions based on an approximate 8.5 market heat rate with natural gas generally being on the margin 70% to 90% of the time in the ERCOT market (i.e., when coal is forecast to be on the margin, no natural gas position is assumed to be generated). Excludes the impact of economic backdown. |
| |
| (c) | Based on Houston Ship Channel natural gas prices at December 31, 2014. |
On an ongoing basis, we will continue monitoring our overall commodity risks and seek to balance our portfolio based on our desired level of exposure to natural gas prices and market heat rates and potential changes to our operational forecasts of overall generation and consumption in our businesses (which is also subject to volatility resulting from customer churn, weather, economic and other factors). Portfolio balancing may include the execution of incremental transactions, including heat rate hedges, the unwinding of existing transactions and the substitution of natural gas hedges with commitments for the sale of electricity at fixed prices. As a result, commodity price exposures and their effect on earnings could materially change from time to time.
New and Changing Environmental Regulations
We are subject to various environmental laws and regulations related to SO2, NOX and mercury as well as other emissions that impact air and water quality. We believe we are in compliance with all current laws and regulations, but regulatory authorities have recently adopted or proposed new rules, such as the EPA's CSAPR, Regional Haze Program, MATS and GHG rules, which could require material capital expenditures and/or changes to our operating plans if the rules take effect, and authorities continue to evaluate existing requirements and consider proposals for further rule changes. If we make any major modifications to our electricity generation facilities, we may be required to install the best available control technology or to achieve the lowest achievable emission rates as such terms are defined under the new source review provisions of the Clean Air Act. Any such modifications would likely result in substantial additional capital expenditures. (See Note 13 to the Financial Statements for discussion of litigation related to our generation facilities and Environmental Contingencies and Items 1 and 2, Business and Properties – Environmental Regulations and Related Considerations.)
We also continue to closely monitor any potential legislative, regulatory and judicial changes pertaining to global climate change. In view of the fact that a substantial portion of our generation portfolio consists of lignite/coal fueled generation facilities, our results of operations, liquidity or financial condition could be materially affected by the enactment of any legislation, regulation or judicial action that mandates a reduction in GHG emissions or that imposes financial penalties, costs or taxes on entities that produce GHG emissions, or that establishes federal renewable energy portfolio standards. For example, federal, state or regional legislation or regulation addressing global climate change could result in us either incurring material costs to reduce our GHG emissions or to procure emission allowances or credits to comply with a mandatory cap-and-trade emissions reduction program. See further discussion under Items 1 and 2, Business and Properties – Environmental Regulations and Related Considerations.
Competitive Retail Markets and Customer Retention
Competitive retail activity in ERCOT has resulted in retail customer churn. Our total retail customer counts declined 1% in 2014, 3% in 2013 and 4% in 2012. Based upon 2014 results discussed below in Results of Operations – Competitive Electric Segment, a 1% decline in residential customers would result in a decline in annual revenues of approximately $30 million. In responding to the competitive landscape in the ERCOT marketplace, we have reduced overall customer losses by focusing on the following key initiatives:
| |
| • | Maintaining competitive pricing initiatives on residential service plans; |
| |
| • | Actively competing for new customers in areas in ERCOT open to competition, including those outside our traditional service territory, while continuing to strive to enhance the experience of our existing customers. The customer retention strategy remains focused on continuing to implement initiatives to deliver world-class customer service and improve the overall customer experience; |
| |
| • | Establishing TXU Energy as the most innovative retailer in the ERCOT market by continuing to develop tailored product offerings to meet customer needs. Since the Merger, TXU Energy has invested more than $100 million in retail initiatives aimed at helping consumers conserve energy and demand-side management initiatives that are intended to moderate consumption and reduce peak demand for electricity, and |
| |
| • | Focusing business market initiatives largely on programs targeted to retain the existing highest-value customers and to recapture customers who have switched REPs. Initiatives include maintaining and continuously refining a disciplined contracting and pricing approach and economic segmentation of the business market to enhance targeted sales and marketing efforts and to more effectively deploy the direct-sales force. Tactical programs put into place include improved customer service, aided by an enhanced customer management system, new product price/service offerings and a multichannel approach for the small business market. |
Exposures Related to Nuclear Asset Outages
Our nuclear assets are comprised of two generation units at the Comanche Peak plant site, each with an installed nameplate capacity of 1,150 MW. These units represent approximately 17% of our total generation capacity. The nuclear generation units represent our lowest marginal cost source of electricity. Assuming both nuclear generation units experienced an outage, the unfavorable impact to pretax earnings is estimated (based upon forward electricity market prices for 2015 at December 31, 2014) to be approximately $1.3 million per day before consideration of any costs to repair the cause of an outage or any insurance proceeds. Also see discussion of nuclear facilities insurance in Note 13 to the Financial Statements.
The inherent complexities and related regulations associated with operating nuclear generation facilities result in environmental, regulatory and financial risks. The operation of nuclear generation facilities is subject to continuing review and regulation by the NRC, including potential regulation as a result of the NRC's ongoing analysis and response to the effects of the natural disaster on nuclear generation facilities in Japan in 2010, covering, among other things, operations, maintenance, emergency planning, security, and environmental and safety protection. The NRC may implement changes in regulations that result in increased capital or operating costs, and it may require extended outages, modify, suspend or revoke operating licenses and impose fines for failure to comply with its existing regulations and the provisions of the Atomic Energy Act. In addition, an unplanned outage at another nuclear generation facility could result in the NRC taking action to shut down the Comanche Peak units as a precautionary measure.
We participate in industry groups and with regulators to remain current on the latest developments in nuclear safety, operation and maintenance and on emerging threats and mitigating techniques. These groups include, but are not limited to, the NRC and the Institute of Nuclear Power Operations (INPO). We also apply the knowledge gained by continuing to invest in technology, processes and services to improve our operations and detect, mitigate and protect our nuclear generation assets. The Comanche Peak plant has not experienced an extended unplanned outage, and management continues to focus on the safe, reliable and efficient operations at the plant.
Oncor's Capital Availability and Cost
Our investment in Oncor, which represents approximately 80% of its membership interests, is a significant value driver of our overall business. Oncor's access to capital markets and cost of debt could be directly affected by its credit ratings. Any adverse action with respect to Oncor's credit ratings could generally cause borrowing costs to increase and the potential pool of investors and funding sources to decrease and could result in reduced distributions from Oncor. Oncor's credit ratings are currently substantially higher than those of the Texas Holdings Group. If credit rating agencies were to change their views of Oncor's independence from any member of the Texas Holdings Group, Oncor's credit ratings would likely decline. We believe these risks are substantially mitigated by the significant ring-fencing measures implemented by EFH Corp. and Oncor as described in Note 1 to the Financial Statements.
Cyber Security and Infrastructure Protection Risk
A breach of cyber/data security measures that impairs our information technology infrastructure could disrupt normal business operations and affect our ability to control our generation and transmission assets, access retail customer information and limit communication with third parties. Any loss of confidential or proprietary data through a breach could materially affect our reputation, expose the company to legal claims or impair our ability to execute on business strategies.
We participate in industry groups and with regulators to remain current on emerging threats and mitigating techniques. These groups include, but are not limited to, the US Cyber Emergency Response Team, the National Electric Sector Cyber Security Organization, the NRC and NERC.
While the company has not experienced a cyber event causing any material operational, reputational or financial impact, we recognize the growing threat within our industry and are proactively making strategic investments in our perimeter and internal defenses, cyber security operations center and regulatory compliance activities. We also apply the knowledge gained through industry and government organizations to continuously improve our technology, processes and services to detect, mitigate and protect our cyber assets.
APPLICATION OF CRITICAL ACCOUNTING POLICIES
Our significant accounting policies are discussed in Note 1 to the Financial Statements. We follow accounting principles generally accepted in the US. Application of these accounting policies in the preparation of our consolidated financial statements requires management to make estimates and assumptions about future events that affect the reporting of assets and liabilities at the balance sheet dates and revenues and expenses during the periods covered. The following is a summary of certain critical accounting policies that are impacted by judgments and uncertainties and under which different amounts might be reported using different assumptions or estimation methodologies.
Impairment of Goodwill and Other Long-Lived Assets
We evaluate long-lived assets (including intangible assets with finite lives) for impairment, in accordance with accounting standards related to impairment or disposal of long-lived assets, whenever events or changes in circumstances indicate that their carrying amount may not be recoverable. One of those indications is a current expectation that "more likely than not" a long-lived asset will be sold or otherwise disposed of significantly before the end of its previously estimated useful life. For our nuclear and lignite/coal fueled generation assets, another possible indication would be an expectation of continuing long-term declines in natural gas prices and/or market heat rates. We evaluate investments in unconsolidated subsidiaries for impairment when factors indicate that a decrease in the value of the investment has occurred that is not temporary. Indications of a loss in value might include a series of operating losses of the investee or that the fair value of the investment is less than its carrying amount. The determination of the existence of these and other indications of impairment involves judgments that are subjective in nature and may require the use of estimates in forecasting future results and cash flows related to an asset, group of assets or investment in unconsolidated subsidiary. Further, the unique nature of our property, plant and equipment, which includes a fleet of generation assets with a diverse fuel mix and individual generation units that have varying production or output rates, requires the use of significant judgments in determining the existence of impairment indications and the grouping of assets for impairment testing. We generally utilize an income approach measurement to derive fair values for our long-lived generation assets. The income approach involves estimates of future performance that reflect assumptions regarding, among other things, forward natural gas and electricity prices, market heat rates, the effects of environmental rules, generation plant performance, forecasted capital expenditures and forecasted fuel prices. Any significant change to one or more of these factors can have a material impact on the fair value measurement of our long-lived assets. As a result of the decrease in forecasted wholesale electricity prices, potential effects from environmental regulations and changes to our operating plans in 2014, we evaluated the recoverability of our generation assets. In 2013, we evaluated the recoverability of the assets of our joint venture to develop additional nuclear generation units. See Note 8 to the Financial Statements for a discussion of the impairment of certain of those assets. Additional material impairments related to these or other of our generation facilities may occur in the future if forward wholesale electricity prices in ERCOT continue to decline or if additional environmental regulations increase the cost of producing electricity at our generation facilities.
Goodwill and intangible assets with indefinite useful lives are required to be tested for impairment at least annually (we have selected December 1) or whenever events or changes in circumstances indicate an impairment may exist, such as the indicators used to evaluate impairments to long-lived assets discussed above. As required by accounting guidance related to goodwill, we have allocated goodwill to our reporting units, which are our two segments: Competitive Electric and Regulated Delivery, and goodwill impairment testing is performed at the reporting unit level. Under this goodwill impairment analysis, if at the assessment date, a reporting unit's carrying value exceeds its estimated fair value (enterprise value), the estimated enterprise value of the reporting unit is compared to the estimated fair values of the reporting unit's assets (including identifiable intangible assets) and liabilities at the assessment date, and the resultant implied goodwill amount is then compared to the recorded goodwill amount. Any excess of the recorded goodwill amount over the implied goodwill amount is written off as an impairment charge.
The determination of enterprise value involves a number of assumptions and estimates. We use a combination of fair value measurements to estimate enterprise values of our reporting units: internal discounted cash flow analyses (income approach), and comparable publicly traded company values (market approach). The income approach involves estimates of future performance that reflect assumptions regarding, among other things, forward natural gas and electricity prices, market heat rates, the effects of environmental rules, generation plant performance, forecasted capital expenditures and retail sales volume trends, as well as determination of a terminal value. Another key variable in the income approach is the discount rate, or weighted average cost of capital, applied to the forecasted cash flows. The determination of the discount rate takes into consideration the capital structure, debt ratings and current debt yields of comparable public companies as well as an estimate of return on equity that reflects historical market returns and current market volatility for the industry. Enterprise value estimates based on comparable company values involve using trading multiples of EBITDA of those selected public companies to derive appropriate multiples to apply to the EBITDA of the reporting units. Critical judgments include the selection of comparable companies and the weighting of the value metrics in developing the best estimate of enterprise value.
See Note 4 to the Financial Statements for additional discussion of goodwill impairment charges.
Derivative Instruments and Mark-to-Market Accounting
We enter into contracts for the purchase and sale of energy-related commodities, and also enter into other derivative instruments such as options, swaps, futures and forwards primarily to manage commodity price and interest rate risks. Under accounting standards related to derivative instruments and hedging activities, these instruments are subject to mark-to-market accounting, and the determination of market values for these instruments is based on numerous assumptions and estimation techniques.
Mark-to-market accounting recognizes changes in the fair value of derivative instruments in the financial statements as market prices change. Such changes in fair value are accounted for as unrealized mark-to-market gains and losses in net income with an offset to derivative assets and liabilities. The availability of quoted market prices in energy markets is dependent on the type of commodity (e.g., natural gas, electricity, etc.), time period specified and delivery point. In computing fair value for derivatives, each forward pricing curve is separated into liquid and illiquid periods. The liquid period varies by delivery point and commodity. Generally, the liquid period is supported by exchange markets, broker quotes and frequent trading activity. For illiquid periods, fair value is estimated based on forward price curves developed using modeling techniques that take into account available market information and other inputs that might not be readily observable in the market. We estimate fair value as described in Note 15 to the Financial Statements and discussed under Fair Value Measurements below.
Accounting standards related to derivative instruments and hedging activities allow for normal purchase or sale elections and hedge accounting designations, which generally eliminate or defer the requirement for mark-to-market recognition in net income and thus reduce the volatility of net income that can result from fluctuations in fair values. Normal purchases and sales are contracts that provide for physical delivery of quantities expected to be used or sold over a reasonable period in the normal course of business and are not subject to mark-to-market accounting if the election as normal is made. Hedge accounting designations are made with the intent to match the accounting recognition of the contract's financial performance to that of the transaction the contract is intended to hedge. The intent of our hedging activity is generally to enter into positions that reduce our exposure to future variable cash flows, and such hedges are referred to as cash flow hedges.
Under hedge accounting, changes in fair value of instruments designated as cash flow hedges are recorded in other comprehensive income with an offset to derivative assets and liabilities to the extent the change in value is effective; that is, it mirrors the offsetting change in fair value of the forecasted hedged transaction. Changes in value that represent ineffectiveness of the hedge are recognized in net income immediately, and the effective portion of changes in fair value initially recorded in other comprehensive income are reclassified to net income in the period that the hedged transactions are recognized in net income. Although at December 31, 2014 and 2013 we did not have any derivatives designated as cash flow hedges, we continually assess potential hedge elections and could, as we have in the past, designate positions such as natural gas hedges and interest rate swaps as cash flow hedges in the future. See further discussion of natural gas hedging activities and interest rate swap transactions under Significant Activities and Events and Items Influencing Future Performance.
The following tables provide the effects on both the statements of consolidated income (loss) and comprehensive income (loss) of accounting for those derivative instruments (both commodity-related and interest rate swaps) that we have determined to be subject to fair value measurement under accounting standards related to derivative instruments.
|
| | | | | | | | | | | |
| | Year Ended December 31, |
| | 2014 | | 2013 | | 2012 |
| Amounts recognized in net income (loss) (after-tax): | | | | | |
| Unrealized net gains on positions marked-to-market in net income | $ | 858 |
| | $ | 653 |
| | $ | 292 |
|
| Unrealized net losses representing reversals of previously recognized fair values of positions settled/terminated in the period | (249 | ) | | (668 | ) | | (1,162 | ) |
| Reclassifications of net losses on cash flow hedge positions from other comprehensive income | (1 | ) | | (6 | ) | | (7 | ) |
| Total net gain (loss) recognized | $ | 608 |
| | $ | (21 | ) | | $ | (877 | ) |
| Amounts recognized in other comprehensive income (loss) (after-tax): | | | | | |
| Reclassifications of net losses on cash flow hedge positions to net income | $ | 1 |
| | $ | 6 |
| | $ | 7 |
|
The effect of mark-to-market and hedge accounting for derivatives on the consolidated balance sheets is as follows:
|
| | | | | | | |
| | December 31, |
| | 2014 | | 2013 |
| Commodity contract assets | $ | 497 |
| | $ | 788 |
|
| Commodity contract liabilities | $ | 317 |
| | $ | 263 |
|
| Interest rate swap assets | $ | — |
| | $ | 67 |
|
| Interest rate swap liabilities | $ | — |
| | $ | 1,092 |
|
| Net accumulated other comprehensive loss included in shareholders' equity (amounts after tax) | $ | 36 |
| | $ | 37 |
|
We report derivative assets and liabilities in the consolidated balance sheets without taking into consideration netting arrangements we have with counterparties. Margin deposits that contractually offset these assets and liabilities are reported separately in the consolidated balance sheets.
See Note 16 to the Financial Statements for further discussion regarding derivative instruments, including the termination of interest rate swaps and certain natural gas hedging agreements shortly after the Bankruptcy Filing.
Fair Value Measurements
For certain accounting measurements that require fair value we determine value under the fair value hierarchy established in accounting standards. We utilize several valuation techniques to measure the fair value, relying primarily on the market approach of using prices and other market information for identical and/or comparable assets and liabilities for those items that are measured on a recurring basis.
Under the fair value hierarchy, Level 1 and Level 2 valuations generally apply to our commodity-related contracts for natural gas, electricity and fuel, including coal and uranium, derivative instruments entered into for hedging purposes, securities associated with the nuclear decommissioning trust and interest rate swaps intended to fix interest payments on our debt. Level 1 valuations use quoted prices in active markets for identical assets or liabilities that are accessible at the measurement date. Level 2 valuations are based on evaluated prices that reflect observable market information, such as actual trade information of similar securities, adjusted for observable differences.
Our Level 3 valuations generally apply to interest rate swaps intended to fix interest payments on TCEH's debt, congestion revenue rights, certain coal contracts, options to purchase or sell electricity, and electricity purchase and sales agreements for which the valuations include unobservable inputs, including the hourly shaping of the price curve. Level 3 valuations use largely unobservable inputs, with little or no supporting market activity, and assets and liabilities are classified as Level 3 if such inputs are significant to the fair value determination. Valuation risk is mitigated through the performance of stress testing of the significant inputs to understand the impact that varying assumptions may have on the valuation and other review processes performed to ensure appropriate valuation.
As part of our valuation of assets subject to fair value measurement, counterparty credit risk is taken into consideration by measuring the extent of netting arrangements in place with the counterparty along with credit enhancements and the estimated credit ratings, default rate factors and debt trading values of the counterparty. Our valuation of liabilities subject to fair value accounting takes into consideration the market's view of our credit risk along with the existence of netting arrangements in place with the counterparty and credit enhancements posted by us. We consider the credit risk adjustment to be a Level 3 input since judgment is used to assign credit ratings, recovery rate factors and default rate factors. The risk adjustment for our credit is what drove our interest rate swap valuations to be Level 3 in 2013.
Valuations of Level 3 assets and liabilities are sensitive to the assumptions used for the significant inputs. Where market data is available, the inputs used for valuation reflect that information as of our valuation date. In periods of extreme volatility, lessened liquidity or in illiquid markets, there may be more variability in market pricing or a lack of market data to use in the valuation process. An illiquid market is one in which little or no observable activity has occurred or one that lacks willing buyers.
Valuations of several of our Level 3 assets and liabilities are sensitive to changes in discount rates, option-pricing model inputs such as volatility factors and credit risk adjustments. At both December 31, 2014 and 2013, a 10% change in electricity price (per MWh) assumptions across unobservable inputs would cause an approximate $3 million change in net Level 3 assets and liabilities. At December 31, 2014 and 2013, a 10% change in coal price assumptions across unobservable inputs would cause an approximate $7 million and $4 million change in net Level 3 assets and liabilities, respectively.
See Note 15 to the Financial Statements for additional information about fair value measurements, including information on unobservable inputs and related valuation sensitivities and a table presenting the changes in Level 3 assets and liabilities for the years ended December 31, 2014, 2013 and 2012.
Variable Interest Entities
A variable interest entity (VIE) is an entity with which we have a relationship or arrangement that indicates some level of control over the entity or results in economic risks to us. Determining whether or not to consolidate a VIE requires interpretation of accounting rules and their application to existing business relationships and underlying agreements. Amended accounting rules related to VIEs became effective January 1, 2010 and resulted in the deconsolidation of Oncor Holdings, which holds an approximate 80% interest in Oncor. In determining the appropriateness of consolidation of a VIE, we evaluate its purpose, governance structure, decision making processes and risks that are passed on to its interest holders. We also examine the nature of any related party relationships among the interest holders of the VIE and the rights granted to the interest holders of the VIE to determine whether we have the right or obligation to absorb profit and loss from the VIE and the power to direct the significant activities of the VIE. See Note 3 to the Financial Statements for our analysis of the Oncor relationship and information regarding our consolidated variable interest entities.
Revenue Recognition
Our revenue includes an estimate for unbilled revenue that represents estimated daily kWh consumption after the meter read date to the end of the period multiplied by the applicable billing rates. Estimated daily kWh usage is derived using metered consumption as well as historical kWh usage information adjusted for weather and other measurable factors affecting consumption. Calculations of unbilled revenues during certain interim periods are generally subject to more estimation variability because of seasonal changes in demand. Accrued unbilled revenues totaled $239 million, $272 million and $260 million at December 31, 2014, 2013 and 2012, respectively.
Accounting for Income Taxes
EFH Corp. files a US federal income tax return that includes the results of EFCH, EFIH, Oncor Holdings and TCEH. Oncor is a partnership for US federal income tax purposes and is not a corporate member of the EFH Corp. consolidated group.
EFH Corp., Oncor Holdings, Oncor and Oncor's third-party minority investor are parties to a Federal and State Income Tax Allocation Agreement, which governs the computation of federal income tax liability among such parties, and similarly provides, among other things, that each of Oncor Holdings and Oncor will pay EFH Corp. its share of an amount calculated to approximate the amount of tax liability such entity would have owed if it filed a separate corporate tax return.
Our income tax expense and related consolidated balance sheet amounts involve significant management estimates and judgments. Amounts of deferred income tax assets and liabilities, as well as current and noncurrent accruals, involve estimates and judgments of the timing and probability of recognition of income and deductions by taxing authorities. In assessing the likelihood of realization of deferred tax assets, management considers estimates of the amount and character of future taxable income. Actual income taxes could vary from estimated amounts due to the future impacts of various items, including changes in income tax laws, our forecasted financial condition and results of operations in future periods, as well as final review of filed tax returns by taxing authorities. Our income tax returns are regularly subject to examination by applicable tax authorities. In management's opinion, the liability recorded pursuant to income tax accounting guidance related to uncertain tax positions reflects future taxes that may be owed as a result of any examination.
We recorded income tax benefits totaling $35 million and $305 million in the years ended December 31, 2014 and 2013, respectively, related to resolution of IRS audit matters. See Note 5 to the Financial Statements regarding uncertain tax positions.
See Notes 1, 5 and 6 to the Financial Statements for discussion of income tax matters.
Accounting in Reorganization
Consolidated financial statements for periods following the Petition Date have been prepared in accordance with ASC 852, Reorganizations, which contemplates the realization of assets and the satisfaction of liabilities on a going concern basis. However, as a result of the Chapter 11 Cases, such realization of assets and satisfaction of liabilities are subject to a number of uncertainties. ASC 852 requires the following:
| |
| • | Reclassification of unsecured or under-secured pre-petition debt, including unamortized deferred financing costs and discounts/premiums associated with debt, and other liabilities to a separate line item in the consolidated balance sheets, called "Liabilities subject to compromise;" |
| |
| • | Nonaccrual of interest expense for financial reporting purposes, to the extent not paid during bankruptcy; |
| |
| • | Reporting in a new line in the statements of consolidated income (loss) of incremental items of income or loss related to bankruptcy, such as professional fees, as well as adjustments of liabilities to allowed claim amounts and ultimately settlement amounts as a separate line item in the statements of consolidated income (loss); |
| |
| • | Evaluation of actual or potential bankruptcy claims, which are not already reflected as a liability on the consolidated balance sheets, under ASC 450, Contingencies. If valid unrecorded claims meeting the ASC 450 criteria are presented to us in future periods, we will accrue for these amounts at the expected amount of the allowed claim, and |
| |
| • | Upon emergence from Chapter 11 reorganization, fresh-start accounting under GAAP may be required. Under fresh-start accounting, the reorganization value of the entity would be allocated to the entity's individual assets and liabilities on a fair value basis in conformity with the procedures specified by ASC 805, Business Combinations. |
RESULTS OF OPERATIONS
Consolidated Financial Results — Year Ended December 31, 2014 Compared to Year Ended December 31, 2013
See Competitive Electric Segment – Financial Results below for a discussion of variances in: operating revenues; fuel, purchased power costs and delivery fees; net gain (loss) from commodity hedging and trading activities; operating costs; depreciation and amortization; SG&A expenses and franchise and revenue-based taxes.
In 2014 and 2013, noncash impairments of goodwill totaling $1.6 billion and $1.0 billion, respectively, were recorded in the Competitive Electric segment as discussed in Note 4 to the Financial Statements.
In 2014 and 2013, noncash impairments of certain long-lived assets totaling $4.670 billion and $140 million, respectively, were recorded in the Competitive Electric segment as discussed in Note 8 to the Financial Statements.
See Note 7 to the Financial Statements for details of other income and deductions.
Results include fees for legal and other professional services associated with our debt restructuring activities prior to the Petition Date, which totaled $49 million in 2014 and $105 million in 2013 and are reported in SG&A expenses. Of the 2014 amount, $28 million is included in the Competitive Electric segment results and $21 million is included in Corporate and Other activities. Legal and other professional services costs incurred with the Chapter 11 Cases since the Petition Date are now being reported in reorganization items as discussed below. Of the 2013 amount, $63 million is included in the Competitive Electric segment results and $42 million is included in Corporate and Other activities.
Interest expense and related charges decreased $503 million to $2.201 billion in 2014. The decrease reflected:
| |
| • | $2.329 billion in lower interest expense on pre-petition debt due to the discontinuance of interest upon the Bankruptcy Filing and the termination of the interest rate swap agreements shortly after the Bankruptcy Filing, and |
| |
| • | $141 million in lower amortization of pre-petition debt issuance, amendment and extension costs and discounts due to reclassification of such amounts to liabilities subject to compromise, |
partially offset by
| |
| • | $992 million in lower mark-to-market net gains on interest rate swaps due to the termination of the agreements; |
| |
| • | $827 million in expense related to adequate protection payments approved by the Bankruptcy Court for the benefit of TCEH secured creditors; and |
| |
| • | $162 million in interest expense on debtor-in-possession financing. |
See Note 9 to the Financial Statements for details of interest expense and related charges.
Reorganization items totaled $815 million in 2014 and included a noncash charge of $278 million related to a liability adjustment arising from termination of interest rate swap agreements (see Note 16 to the Financial Statements), $187 million in fees associated with completion of the TCEH and EFIH DIP facilities (see Note 11 to the Financial Statements), a $108 million net loss on exchange and settlement of the EFIH First Lien Notes, $127 million in legal advisory and representation services fees, $95 million in other professional consulting and advisory services fees and $20 million primarily related to contract claim adjustments. See Note 10 to the Financial Statements for additional discussion.
Income tax benefit totaled $2.619 billion and $1.271 billion in 2014 and 2013, respectively. Excluding the $39 million income tax benefit recorded in the third quarter of 2014 related to an adjustment of reserves for uncertain tax positions for the 2007 tax year, the $305 million income tax benefit recorded in 2013 related to resolution of IRS audit matters, the 2013 impairment of the assets of the nuclear generation development joint venture and the nondeductible goodwill impairment charges in both years, the effective tax benefit rate was 33.2% and 34.2% in 2014 and 2013, respectively. The change in the effective income tax rate is driven primarily by higher nondeductible legal and other professional services costs related to the Chapter 11 Cases in 2014. See Note 5 to the Financial Statements for discussion of uncertain tax positions. See Note 8 to the Financial Statements for discussion of the impairment of the joint venture's assets. See Note 4 to the Financial Statements for discussion of goodwill impairments. See Note 6 to the Financial Statements for reconciliation of these comparable effective rates to the US federal statutory rate.
Equity in earnings of our Oncor Holdings unconsolidated subsidiary (net of tax) increased $14 million to $349 million in 2014. The increase in equity earnings of Oncor reflected increased revenue from higher transmission rates and lower interest expense. These favorable effects were partially offset by higher income taxes reflecting the $11 million favorable tax effect in 2013 due to resolution of certain income tax positions and an increase in non-deductible amortization of regulatory assets, higher depreciation, higher operation and maintenance expense and higher property taxes. See Note 3 to the Financial Statements.
Net loss for EFH Corp. increased $4.188 billion to $6.406 billion in 2014.
| |
| • | Net loss for the Competitive Electric segment increased $3.951 billion to $6.260 billion. |
| |
| • | Earnings from the Regulated Delivery segment increased $14 million to $349 million as discussed above. |
| |
| • | After-tax net expenses from Corporate and Other activities totaled $495 million and $244 million in 2014 and 2013, respectively. The change reflects a $226 million income tax benefit in 2013 related to the Corporate and Other portion of the $305 million income tax benefit related to resolution of IRS audit matters referred to above and charges of $190 million ($295 million pre-tax) for the Corporate and Other portion of reorganization items discussed above, partially offset by $155 million ($240 million pre-tax) in lower interest expense, $24 million in income tax benefit recorded in 2014 related to an adjustment of reserves for uncertain tax positions discussed above and $14 million ($21 million pretax) in lower legal and professional fees for the Corporate and Other portion of our debt restructuring activities. |
Net loss attributable to noncontrolling interests of $107 million in 2013 represents the noncontrolling interest share of the impairment of the assets of the nuclear generation development joint venture.
Consolidated Financial Results – Year Ended December 31, 2013 Compared to Year Ended December 31, 2012
See Competitive Electric Segment – Financial Results below for a discussion of variances in: operating revenues; fuel, purchased power costs and delivery fees; net gain (loss) from commodity hedging and trading activities; operating costs; depreciation and amortization; SG&A expenses and franchise and revenue-based taxes.
In 2013 and 2012, impairments of goodwill of $1.0 billion and $1.2 billion, respectively, were recorded in the Competitive Electric segment as discussed in Note 4 to the Financial Statements.
See Note 7 to the Financial Statements for details of other income and deductions.
Results include fees for legal and other professional services associated with our debt restructuring activities, which totaled $105 million in 2013 and $11 million in 2012 and are reported in SG&A expenses. Of the 2013 amount, $63 million is included in the Competitive Electric segment results and $42 million is included in Corporate and Other activities. The 2012 amount of $11 million is included in the Competitive Electric segment results.
Interest expense and related charges decreased $804 million, or 23%, to $2.704 billion in 2013. The decrease was driven by $886 million in higher unrealized mark-to-market net gains on interest rate swaps in 2013, which reflected the nonperformance risk adjustment related to interest rate swaps as discussed in Note 15 to the Financial Statements. This change was partially offset by $74 million in higher interest expense driven by higher average borrowings. See Note 9 to the Financial Statements for details of interest expense and related charges.
Income tax benefit totaled $1.271 billion and $1.232 billion in 2013 and 2012, respectively. Excluding the $305 million income tax benefit recorded in 2013 related to resolution of IRS audit matters, the 2013 impairment of the assets of the nuclear generation development joint venture and the nondeductible goodwill impairment charges in both years, the effective tax rate was 34.2% and 33.6% in 2013 and 2012, respectively. The increase in the effective tax benefit rate was driven by lower accrued interest on uncertain tax positions. See Note 5 to the Financial Statements for discussion of uncertain tax positions. See Note 8 to the Financial Statements for discussion of the impairment of the joint venture's assets. See Note 4 to the Financial Statements for discussion of goodwill impairments. See Note 6 to the Financial Statements for reconciliation of these comparable effective rates to the US federal statutory rate.
Equity in earnings of our Oncor Holdings unconsolidated subsidiary (net of tax) increased $65 million to $335 million in 2013. The increase in equity earnings of Oncor reflected an $11 million favorable tax effect in 2013 due to resolution of certain income tax positions at Oncor and a $31 million unfavorable impact in 2012 from the settlement of a management incentive pay plan. The settlement resulted in a $57 million pretax charge reported by Oncor. Excluding these items, the increase in Oncor's earnings reflected higher revenues from higher transmission rates, the effect of colder fall/winter weather and growth in points of delivery, partially offset by higher operation and maintenance expenses and higher depreciation. See Note 3 to the Financial Statements.
Net loss for EFH Corp. decreased $1.142 billion to $2.218 billion in 2013.
| |
| • | Net loss for the Competitive Electric segment decreased $754 million to $2.309 billion. |
| |
| • | Earnings from the Regulated Delivery segment increased $65 million to $335 million as discussed above. |
| |
| • | After-tax net expenses from Corporate and Other activities totaled $244 million and $567 million in 2013 and 2012, respectively. The change reflects a $226 million income tax benefit in 2013 related to the Corporate and Other portion of the $305 million income tax benefit related to resolution of IRS audit matters referred to above. The change also reflects a $93 million pension charge in 2012, or $144 million pretax, which represented the Corporate and Other portion of the $285 million total pretax charge ($141 million balance reported in the Competitive Electric segment) (see Note 17 to the Financial Statements). These factors were partially offset by $27 million, or $42 million pre-tax, in legal and other professional fees incurred in 2013 related to our debt restructuring activities. The amounts in 2013 and 2012 include recurring interest expense on outstanding debt, as well as corporate general and administrative expenses. |
Net loss attributable to noncontrolling interests of $107 million in 2013 represents the noncontrolling interest share of the impairment of the assets of the nuclear generation development joint venture.
Non-GAAP Earnings Measures
In communications with investors, we use a non-GAAP earnings measure that reflects adjustments to earnings reported in accordance with US GAAP in order to review and analyze underlying operating performance. These adjustments, which are generally noncash, consist of unrealized mark-to-market gains and losses, impairment charges, debt extinguishment gains and other charges, and credits or gains that are unusual or nonrecurring. All such items and related amounts are disclosed in our annual report on Form 10-K and quarterly reports on Form 10-Q. Our communications with investors also reference "Consolidated EBITDA," which is a non-GAAP measure used in calculation of ratios under certain debt securities covenants.
Competitive Electric Segment
Financial Results
|
| | | | | | | | | | | |
| | Year Ended December 31, |
| | 2014 | | 2013 | | 2012 |
| Operating revenues | $ | 5,978 |
| | $ | 5,899 |
| | $ | 5,636 |
|
| Fuel, purchased power costs and delivery fees | (2,842 | ) | | (2,848 | ) | | (2,816 | ) |
| Net gain (loss) from commodity hedging and trading activities | 11 |
| | (54 | ) | | 389 |
|
| Operating costs | (914 | ) | | (881 | ) | | (888 | ) |
| Depreciation and amortization | (1,270 | ) | | (1,333 | ) | | (1,344 | ) |
| Selling, general and administrative expenses | (630 | ) | | (681 | ) | | (659 | ) |
| Franchise and revenue-based taxes | (78 | ) | | (75 | ) | | (80 | ) |
| Impairment of goodwill | (1,600 | ) | | (1,000 | ) | | (1,200 | ) |
| Impairment of long-lived assets | (4,670 | ) | | (140 | ) | | — |
|
| Other income | 16 |
| | 9 |
| | 14 |
|
| Other deductions | (281 | ) | | (50 | ) | | (223 | ) |
| Interest income | — |
| | 6 |
| | 46 |
|
| Interest expense and related charges | (1,799 | ) | | (2,062 | ) | | (2,892 | ) |
| Reorganization items | (520 | ) | | — |
| | — |
|
| Loss before income taxes | (8,599 | ) | | (3,210 | ) | | (4,017 | ) |
| Income tax benefit | 2,339 |
| | 794 |
| | 954 |
|
| Net loss | (6,260 | ) | | (2,416 | ) | | (3,063 | ) |
| Net loss attributable to noncontrolling interests | — |
| | 107 |
| | — |
|
| Net loss attributable to the Competitive Electric segment | $ | (6,260 | ) | | $ | (2,309 | ) | | $ | (3,063 | ) |
Competitive Electric Segment
Sales Volume and Customer Count Data
|
| | | | | | | | | | | | | | |
| | Year Ended December 31, | | 2014 | | 2013 |
| | 2014 | | 2013 | | 2012 | | % Change | | % Change |
| Sales volumes: | | | | | | | | | |
| Retail electricity sales volumes – (GWh): | | | | | | | | | |
| Residential | 21,910 |
| | 22,791 |
| | 23,283 |
| | (3.9 | ) | | (2.1 | ) |
| Small business (a) | 5,888 |
| | 5,387 |
| | 5,914 |
| | 9.3 |
| | (8.9 | ) |
| Large business and other customers | 10,713 |
| | 9,816 |
| | 10,373 |
| | 9.1 |
| | (5.4 | ) |
| Total retail electricity | 38,511 |
| | 37,994 |
| | 39,570 |
| | 1.4 |
| | (4.0 | ) |
| Wholesale electricity sales volumes (b) | 32,965 |
| | 38,320 |
| | 34,524 |
| | (14.0 | ) | | 11.0 |
|
| Total sales volumes | 71,476 |
| | 76,314 |
| | 74,094 |
| | (6.3 | ) | | 3.0 |
|
| | | | | | | | | | |
| Average volume (kWh) per residential customer (c) | 14,530 |
| | 14,815 |
| | 14,617 |
| | (1.9 | ) | | 1.4 |
|
| | | | | | | | | | |
| Weather (North Texas average) – percent of normal (d): | | | | | | | | | |
| Cooling degree days | 101.4 | % | | 103.0 | % | | 114.7 | % | | (1.6 | ) | | (10.2 | ) |
| Heating degree days | 117.8 | % | | 117.8 | % | | 82.0 | % | | — |
| | 43.7 |
|
| | | | | | | | | | |
| Customer counts: | | | | | | | | | |
| Retail electricity customers (end of period, in thousands) (e): | | | | | | | | | |
| Residential | 1,499 |
| | 1,516 |
| | 1,560 |
| | (1.1 | ) | | (2.8 | ) |
| Small business (a) | 176 |
| | 176 |
| | 176 |
| | — |
| | — |
|
| Large business and other customers | 22 |
| | 17 |
| | 17 |
| | 29.4 |
| | — |
|
| Total retail electricity customers | 1,697 |
| | 1,709 |
| | 1,753 |
| | (0.7 | ) | | (2.5 | ) |
___________
| |
| (a) | Customers with demand of less than 1 MW annually. |
| |
| (b) | Includes net amounts related to sales and purchases of balancing energy in the ERCOT real-time market. |
| |
| (c) | Calculated using average number of customers for the period. |
| |
| (d) | Weather data is obtained from Weatherbank, Inc., an independent company that collects and archives weather data from reporting stations of the National Oceanic and Atmospheric Administration (a federal agency under the US Department of Commerce). Normal is defined as the average over the 10-year period from 2000 to 2010. |
| |
| (e) | Based on number of meters. Typically, large business and other customers have more than one meter; therefore, number of meters does not reflect the number of individual customers. |
Competitive Electric Segment
Revenue and Commodity Hedging and Trading Activities
|
| | | | | | | | | | | | | | | | | |
| | Year Ended December 31, | | 2014 | | 2013 |
| | 2014 | | 2013 | | 2012 | | % Change | | % Change |
| Operating revenues: | | | | | | | | | |
| Retail electricity revenues: | | | | | | | | | |
| Residential | $ | 2,970 |
| | $ | 2,984 |
| | $ | 2,918 |
| | (0.5 | ) | | 2.3 |
|
| Small business (a) | 701 |
| | 680 |
| | 738 |
| | 3.1 |
| | (7.9 | ) |
| Large business and other customers | 742 |
| | 675 |
| | 717 |
| | 9.9 |
| | (5.9 | ) |
| Total retail electricity revenues | 4,413 |
| | 4,339 |
| | 4,373 |
| | 1.7 |
| | (0.8 | ) |
| Wholesale electricity revenues (b)(c) | 1,267 |
| | 1,282 |
| | 1,005 |
| | (1.2 | ) | | 27.6 |
|
| Amortization of intangibles (d) | 23 |
| | 22 |
| | 21 |
| | 4.5 |
| | 4.8 |
|
| Other operating revenues | 275 |
| | 256 |
| | 237 |
| | 7.4 |
| | 8.0 |
|
| Total operating revenues | $ | 5,978 |
| | $ | 5,899 |
| | $ | 5,636 |
| | 1.3 |
| | 4.7 |
|
| | | | | | | | | | |
| Net gain (loss) from commodity hedging and trading activities: | | | | | | | | | |
| Realized net gains | $ | 387 |
| | $ | 1,057 |
| | $ | 1,953 |
| |
|
| |
|
|
| Unrealized net losses | (376 | ) | | (1,111 | ) | | (1,564 | ) | |
|
| | |
| Total | $ | 11 |
| | $ | (54 | ) | | $ | 389 |
| |
|
| |
|
|
___________
| |
| (a) | Customers with demand of less than 1 MW annually. |
| |
| (b) | Upon settlement of physical derivative commodity contracts that we mark-to-market in net income, such as certain electricity sales and purchase agreements and coal purchase contracts, wholesale electricity revenues and fuel and purchased power costs are reported at approximated market prices, as required by accounting rules, rather than contract price. As a result, these line item amounts include a noncash component that we deem "unrealized." (The offsetting differences between contract and market prices are reported in net gain (loss) from commodity hedging and trading activities.) These amounts are as follows: |
|
| | | | | | | | | | | |
| | Year Ended December 31, |
| | 2014 | | 2013 | | 2012 |
| Reported in revenues | $ | (1 | ) | | $ | (2 | ) | | $ | (1 | ) |
| Reported in fuel and purchased power costs | 7 |
| | 22 |
| | 39 |
|
| Net gain | $ | 6 |
| | $ | 20 |
| | $ | 38 |
|
| |
| (c) | Includes net amounts related to sales and purchases of balancing energy in the ERCOT real-time market. |
| |
| (d) | Represents amortization of the intangible net asset value of retail and wholesale electricity sales agreements resulting from purchase accounting. |
Competitive Electric Segment
Production, Purchased Power and Delivery Cost Data
|
| | | | | | | | | | | | | | | | | |
| | Year Ended December 31, | | 2014 | | 2013 |
| | 2014 | | 2013 | | 2012 | | % Change | | % Change |
| Fuel, purchased power costs and delivery fees ($ millions): | | | | | | | | | |
| Fuel for nuclear facilities | $ | 147 |
| | $ | 173 |
| | $ | 175 |
| | (15.0 | ) | | (1.1 | ) |
| Fuel for lignite/coal facilities | 784 |
| | 869 |
| | 816 |
| | (9.8 | ) | | 6.5 |
|
| Total nuclear and lignite/coal facilities | 931 |
| | 1,042 |
| | 991 |
| | (10.7 | ) | | 5.1 |
|
| Fuel for natural gas facilities and purchased power costs (a) | 316 |
| | 292 |
| | 323 |
| | 8.2 |
| | (9.6 | ) |
| Amortization of intangibles (b) | 40 |
| | 37 |
| | 48 |
| | 8.1 |
| | (22.9 | ) |
| Other costs | 227 |
| | 196 |
| | 194 |
| | 15.8 |
| | 1.0 |
|
| Fuel and purchased power costs | 1,514 |
| | 1,567 |
| | 1,556 |
| | (3.4 | ) | | 0.7 |
|
| Delivery fees (c) | 1,328 |
| | 1,281 |
| | 1,260 |
| | 3.7 |
| | 1.7 |
|
| Total | $ | 2,842 |
| | $ | 2,848 |
| | $ | 2,816 |
| | (0.2 | ) | | 1.1 |
|
| Fuel and purchased power costs (which excludes generation facilities operating costs) per MWh: | | | | | | | | | |
| Nuclear facilities | $ | 7.90 |
| | $ | 8.45 |
| | $ | 8.78 |
| | (6.5 | ) | | (3.8 | ) |
| Lignite/coal facilities (d) | $ | 19.79 |
| | $ | 19.93 |
| | $ | 20.54 |
| | (0.7 | ) | | (3.0 | ) |
| Natural gas facilities and purchased power (e) | $ | 49.48 |
| | $ | 46.62 |
| | $ | 45.06 |
| | 6.1 |
| | 3.5 |
|
| Delivery fees per MWh | $ | 34.36 |
| | $ | 33.57 |
| | $ | 31.75 |
| | 2.4 |
| | 5.7 |
|
| Production and purchased power volumes (GWh): | | | | | | | | | |
| Nuclear facilities | 18,636 |
| | 20,487 |
| | 19,897 |
| | (9.0 | ) | | 3.0 |
|
| Lignite/coal facilities (f) | 48,878 |
| | 52,023 |
| | 49,298 |
| | (6.0 | ) | | 5.5 |
|
| Total nuclear and lignite/coal facilities | 67,514 |
| | 72,510 |
| | 69,195 |
| | (6.9 | ) | | 4.8 |
|
| Natural gas facilities | 816 |
| | 899 |
| | 1,295 |
| | (9.2 | ) | | (30.6 | ) |
| Purchased power (g) | 3,146 |
| | 2,905 |
| | 3,604 |
| | 8.3 |
| | (19.4 | ) |
| Total energy supply volumes | 71,476 |
| | 76,314 |
| | 74,094 |
| | (6.3 | ) | | 3.0 |
|
| Capacity factors: | | | | | | | | | |
| Nuclear facilities | 92.5 | % | | 101.7 | % | | 98.5 | % | | (9.0 | ) | | 3.2 |
|
| Lignite/coal facilities (f) | 69.6 | % | | 74.1 | % | | 70.0 | % | | (6.1 | ) | | 5.9 |
|
| Total | 74.7 | % | | 80.2 | % | | 76.4 | % | | (6.9 | ) | | 5.0 |
|
___________
| |
| (a) | See note (b) to the Revenue and Commodity Hedging and Trading Activities table on previous page. |
| |
| (b) | Represents amortization of the intangible net asset values of emission credits, coal purchase contracts, nuclear fuel contracts and power purchase agreements and the stepped up value of nuclear fuel resulting from purchase accounting. |
| |
| (c) | Includes delivery fee charges from Oncor. |
| |
| (d) | Includes depreciation and amortization of lignite mining assets, which is reported in the depreciation and amortization expense line item, but is part of overall fuel costs and excludes unrealized amounts as discussed in footnote (b) to the Revenue and Commodity Hedging and Trading Activities table on previous page. |
| |
| (e) | Excludes volumes related to line loss and power imbalances and unrealized amounts referenced in footnote (d) immediately above. |
| |
| (f) | Includes the estimated effects of economic backdown (including seasonal operations) of lignite/coal fueled units totaling 15,770 GWh, 12,460 GWh and 10,410 GWh in 2014, 2013 and 2012, respectively. |
| |
| (g) | Includes amounts related to line loss and power imbalances. |
Competitive Electric Segment – Financial Results – Year Ended December 31, 2014 Compared to Year Ended December 31, 2013
Operating revenues increased $79 million, or 1%, to $5.978 billion in 2014.
Retail electricity revenues increased $74 million, or 2%, to $4.413 billion in 2014 reflecting a $59 million increase in sales volumes and $15 million in higher average prices. Retail sales volumes increased 1% reflecting higher sales growth in small and large business largely offset by a decline in residential volumes. The decrease in residential volumes reflects milder weather and a 1% decline in customer counts.
Wholesale electricity revenues decreased $15 million, or 1%, to $1.267 billion in 2014 reflecting a $179 million decrease due to lower sales volumes, largely offset by a $164 million increase due to higher average prices. A 14% decrease in wholesale sales volumes reflected lower generation volumes. Higher average prices were driven by an overall 16% increase in natural gas prices in 2014, predominately in the first half of the year.
A 6% decrease in lignite/coal fueled generation volumes reflected increased economic-driven production backdown during certain periods of lower wholesale electricity prices and rail congestion in the second quarter of 2014 that reduced deliveries of purchased coal. A 9% decrease in nuclear fueled generation volumes reflected two refueling outages in 2014 compared to one in 2013 and unplanned outage time experienced during the fall 2014 refueling outage.
Fuel, purchased power costs and delivery fees decreased $6 million to $2.842 billion in 2014. Lignite/coal fuel costs decreased $85 million reflecting lower generation volumes and higher lignite in the fuel blend, partially offset by higher western coal prices. Nuclear fuel costs decreased $26 million reflecting lower generation volumes and the discontinuance of DOE billing for spent fuel handling costs beginning in May 2014. Delivery fees increased $47 million primarily reflecting higher delivery rates. ERCOT ancillary fees were $26 million higher in 2014 due to higher prices that resulted from colder weather in early 2014 and decreasing supply being offered into the ancillary services market as the year progressed. Fuel for natural gas facilities and purchased power costs increased $24 million reflecting the effect of colder weather on natural gas prices and purchased power costs in the first quarter 2014.
Following is an analysis of amounts reported as net gain (loss) from commodity hedging and trading activities, which totaled $11 million in net gains and $54 million in net losses for the years ended December 31, 2014 and 2013, respectively, and includes the natural gas hedging positions discussed above under Significant Activities and Events and Items Influencing Future Performance – Natural Gas Hedging Program and Termination of Positions, as well as other hedging positions.
|
| | | | | | | | | | | |
| | Year Ended December 31, 2014 |
| | Net Realized Gains (Losses) | | Net Unrealized Gains (Losses) | | Total |
| Hedging positions | $ | 397 |
| | $ | (393 | ) | | $ | 4 |
|
| Trading positions | (10 | ) | | 17 |
| | 7 |
|
| Total | $ | 387 |
| | $ | (376 | ) | | $ | 11 |
|
|
| | | | | | | | | | | |
| | Year Ended December 31, 2013 |
| | Net Realized Gains | | Net Unrealized Losses | | Total |
| Hedging positions | $ | 1,055 |
| | $ | (1,090 | ) | | $ | (35 | ) |
| Trading positions | 2 |
| | (21 | ) | | (19 | ) |
| Total | $ | 1,057 |
| | $ | (1,111 | ) | | $ | (54 | ) |
Net realized gains on hedging and trading positions decreased by $670 million reflecting lower hedging gains from the natural gas hedging program in 2014 due to lower hedge prices.
The favorable change in net unrealized losses on hedging and trading positions of $735 million also reflected the lower gains in the natural gas hedging program. As realized gains were recognized, unrealized losses were recognized for the reversal of previously recognized unrealized gains.
Operating costs increased $33 million, or 4%, to $914 million in 2014. The increase was due to $57 million in higher nuclear maintenance costs primarily reflecting refueling outages for both generation units in 2014 as compared to only one unit in 2013 and maintenance costs incurred during the unplanned outage time experienced during the fall refueling outage, partially offset by lower maintenance and other costs of $14 million at lignite/coal fueled generation units and $5 million at natural gas fueled plants.
Depreciation and amortization expenses decreased $63 million, or 5%, to $1.270 billion reflecting reduced depreciation expense resulting from the effect of noncash impairments of certain long-lived assets and useful lives of certain lignite/coal generation equipment being longer than originally estimated.
SG&A expenses decreased $51 million, or 7%, to $630 million in 2014 reflecting $41 million in lower legal and other professional services costs associated with our debt restructuring activities prior to the Petition Date and $29 million in lower allocated Sponsor Group management fees, partially offset by $14 million in higher employee compensation and benefit costs. Legal and other professional services costs associated with the Chapter 11 Cases since the Petition Date are reported in reorganization items as discussed below.
In 2014 and 2013, noncash impairments of goodwill totaling $1.6 billion and $1.0 billion, respectively, were recorded as discussed in Note 4 to the Financial Statements.
In 2014 and 2013, noncash impairments of certain long-lived assets totaling $4.670 billion and $140 million, respectively, were recorded as discussed in Note 8 to the Financial Statements.
Other income totaled $16 million in 2014 and $9 million in 2013. See Note 7 to the Financial Statements.
Other deductions totaled $281 million in 2014 and $50 million in 2013. Other deductions in 2014 include a $183 million impairment of intangible assets related to favorable purchase contracts and $80 million related to environmental credits. Other deductions in 2013 include a $27 million impairment charge to write down equipment remaining from cancelled generation projects and $10 million in other asset impairments. See Notes 4 and 7 to the Financial Statements.
Interest expense and related charges decreased $263 million, or 13%, to $1.799 billion in 2014. The decrease reflected:
| |
| • | $1.931 billion in lower interest expense on pre-petition debt due to the discontinuance of interest upon the Bankruptcy Filing and the termination of the interest rate swap agreements shortly after the Bankruptcy Filing, and |
| |
| • | $178 million in lower amortization of pre-petition debt issuances, amendment and extension costs and discounts due to reclassification of such amounts to liabilities subject to compromise, |
partially offset by
| |
| • | $987 million in lower mark-to-market net gains on interest rate swaps due to the termination of the agreements; |
| |
| • | $828 million in expense related to adequate protection payments approved by the Bankruptcy Court for the benefit of secured creditors; and |
| |
| • | $37 million in interest expense on debtor-in-possession financing. |
Reorganization items totaled $520 million in 2014 and included a noncash charge of $277 million related to adjustment of a liability arising from termination of interest rate swap agreements and natural gas hedging positions (see Note 16 to the Financial Statements), $92 million in fees associated with completion of the TCEH DIP Facility (see Note 11 to the Financial Statements), $67 million in professional consulting and advisory services fees, $65 million in legal advisory and representation services fees and $19 million primarily related to contract claim adjustments. See Note 10 to the Financial Statements for additional discussion.
Income tax benefit totaled $2.339 billion and $794 million on pretax losses in 2014 and 2013, respectively. Excluding the $15 million income tax benefit recorded in the third quarter of 2014 related to an adjustment of reserves for uncertain tax positions for the 2007 tax year, the $79 million in total income tax benefit recorded in 2013 related to resolution of IRS audit matters, the 2013 impairment of the assets of the nuclear generation development joint venture and the nondeductible goodwill impairment charges in both years, the effective tax rates were 33.2% and 34.0% in 2014 and 2013, respectively. The change in the effective tax rate is driven primarily by higher nondeductible legal and other professional services costs related to the Chapter 11 Cases in 2014. See Note 5 to the Financial Statements for discussion of uncertain tax positions. See Note 8 to the Financial Statements for discussion of the impairment of the joint venture's assets. See Note 4 to the Financial Statements for discussion of goodwill impairments. See Note 6 to the Financial Statements for reconciliation of these comparable effective rates to the US federal statutory rate.
Net loss for the Competitive Electric segment increased $3.951 billion to $6.260 billion in 2014. The increase primarily reflected the noncash impairments of certain long-lived assets, the noncash impairment of goodwill and reorganization items, partially offset by the decrease in interest expense and related charges.
Net loss attributable to noncontrolling interests of $107 million in 2013 represents the noncontrolling interest share of the impairment of the assets of the nuclear generation development joint venture.
Competitive Electric Segment – Financial Results – Year Ended December 31, 2013 Compared to Year Ended December 31, 2012
Operating revenues increased $263 million, or 5%, to $5.899 billion in 2013.
Retail electricity revenues decreased $34 million, or 1%, to $4.339 billion reflecting a $174 million decline in sales volumes partially offset by $140 million in higher average prices. Sales volumes fell 4% reflecting declines in both business and residential markets. Business market volumes declined 7% reflecting changes in customer mix and competitive intensity. Residential volumes declined 2% reflecting a 3% decrease in customer counts, partially offset by higher average usage driven by the effect of colder weather in the fourth quarter 2013. Overall average retail pricing increased 3% driven by residential markets and due in part to higher delivery fees incurred and passed on to customers.
Wholesale electricity revenues increased $277 million, or 28%, to $1.282 billion in 2013 reflecting a $166 million increase due to higher average prices and a $111 million increase in sales volumes. Higher average prices reflected an increase in natural gas prices. Wholesale sales volumes increased 11% reflecting higher generation volumes and lower volumes sold in our retail operations.
Lignite/coal fueled generation volumes increased 6% and nuclear fueled volumes increased 3% reflecting fewer unplanned and planned outage days.
Fuel, purchased power costs and delivery fees increased $32 million, or 1%, to $2.848 billion in 2013. Lignite/coal fuel costs increased $53 million driven by higher generation volumes, higher lignite mining costs and lower lignite in the fuel blend, partially offset by lower western coal prices. Delivery fees increased $21 million reflecting higher rates, partially offset by lower retail volumes. Natural gas fuel costs decreased $32 million primarily reflecting decreases in natural gas fueled generation volumes. Amortization of the nuclear fuel intangible asset arising from purchase accounting at the Merger date decreased $8 million.
Following is an analysis of amounts reported as net gain (loss) from commodity hedging and trading activities, which totaled $54 million in net losses and $389 million in net gains for the years ended December 31, 2013 and 2012, respectively, and includes the natural gas hedging positions discussed above under Significant Activities and Events and Items Influencing Future Performance – Natural Gas Hedging Program and Termination of Positions, as well as other hedging positions.
|
| | | | | | | | | | | |
| | Year Ended December 31, 2013 |
| | Net Realized Gains | | Net Unrealized Losses | | Total |
| Hedging positions | $ | 1,055 |
| | $ | (1,090 | ) | | $ | (35 | ) |
| Trading positions | 2 |
| | (21 | ) | | (19 | ) |
| Total | $ | 1,057 |
| | $ | (1,111 | ) | | $ | (54 | ) |
|
| | | | | | | | | | | |
| | Year Ended December 31, 2012 |
| | Net Realized Gains | | Net Unrealized Losses | | Total |
| Hedging positions | $ | 1,885 |
| | $ | (1,542 | ) | | $ | 343 |
|
| Trading positions | 68 |
| | (22 | ) | | 46 |
|
| Total | $ | 1,953 |
| | $ | (1,564 | ) | | $ | 389 |
|
Net realized gains on hedging and trading positions decreased by $896 million reflecting lower hedging gains from the natural gas hedging program in 2013.
The favorable change in net unrealized losses on hedging and trading positions of $453 million also reflected the lower gains in the natural gas hedging program. As realized gains were recognized, unrealized losses were recognized for the reversal of previously recognized unrealized gains.
Operating costs decreased $7 million, or 1%, to $881 million in 2013. The decrease reflected $8 million in lower lease expense due to purchase of the interest in a trust holding certain combustion turbines and $8 million in lower information technology project costs, partially offset by $7 million in higher nuclear generation costs driven by the scope of planned outage maintenance projects and $4 million in higher maintenance costs associated with lignite/coal fueled generation unit outages.
SG&A expenses increased $22 million, or 3%, to $681 million in 2013. The increase reflected $63 million in legal and consulting costs in 2013 associated with our debt restructuring initiatives, compared to $11 million in 2012. This increase is partially offset by $29 million in lower employee-related costs driven by lower incentive compensation expenses.
In 2013 and 2012, impairments of goodwill of $1.0 billion and $1.2 billion, respectively, were recorded as discussed in Note 4 to the Financial Statements.
In 2013, noncash impairments of certain long-lived assets totaling $140 million were recorded as discussed in Note 8 to the Financial Statements.
Other income totaled $9 million in 2013 and $14 million in 2012. See Note 7 to the Financial Statements.
Other deductions totaled $50 million in 2013 and $223 million in 2012. Other deductions in 2013 include a $27 million impairment charge to write down equipment remaining from cancelled generation projects and $10 million in other asset impairments. Other deductions in 2012 included a $141 million charge related to pension plan actions discussed in Note 17 to the Financial Statements, which represents the Competitive Electric Segment portion of the $285 million total charge (balance reported in Corporate and Other), a $35 million impairment charge to write down equipment remaining from cancelled generation projects and a $24 million impairment of mineral interest assets as a result of lower natural gas drilling activity and prices. See Note 7 to the Financial Statements.
Interest income decreased $40 million to $6 million in 2013. The decrease was driven by EFH Corp.'s settlement of the TCEH Demand Notes. See Note 19 to the Financial Statements.
Interest expense and related charges decreased $830 million, or 29%, to $2.062 billion in 2013. The decrease was driven by $887 million in higher unrealized mark-to-market net gains on interest rate swaps. See Note 15 to the Financial Statements regarding nonperformance risk adjustment related to interest rate swaps. This change was partially offset by $83 million in higher amortization of debt issuance costs and discounts reflecting the January 2013 amendment and extension of the TCEH Revolving Credit Facility.
Income tax benefit totaled $794 million and $954 million on pretax losses in 2013 and 2012, respectively. Excluding the $79 million in total income tax benefit recorded in 2013 related to resolution of IRS audit matters, the 2013 impairment of the assets of the nuclear generation development joint venture and the nondeductible goodwill impairment charges in both years, the effective tax rates were 34.0% and 33.9% in 2013 and 2012, respectively. See Note 5 to the Financial Statements for discussion of uncertain tax positions. See Note 8 to the Financial Statements for discussion of the impairment of the joint venture's assets. See Note 4 to the Financial Statements for discussion of goodwill impairments. See Note 6 to the Financial Statements for reconciliation of these comparable effective rates to the US federal statutory rate.
Net loss for the Competitive Electric segment decreased $754 million to $2.309 billion in 2013. The net losses in 2013 and 2012 reflected goodwill impairment charges of $1.0 billion and $1.2 billion, respectively. Other factors contributing to the change included $887 million in higher unrealized mark-to-market net gains on interest rate swaps, $231 million in higher revenues net of fuel, purchased power and delivery fees, a $141 million pension charge in 2012 and a $79 million income tax benefit in 2013 due to resolution of IRS audit matters. These items were partially offset by $54 million in net losses from commodity hedging and trading activities in 2013 compared to $389 million in net gains in 2012, as well as the $140 million impairment of the assets of the nuclear generation development joint venture.
Net loss attributable to noncontrolling interests of $107 million in 2013 represents the noncontrolling interest share of the impairment of the assets of the nuclear generation development joint venture.
Competitive Electric Segment – Energy-Related Commodity Contracts and Mark-to-Market Activities
The table below summarizes the changes in commodity contract assets and liabilities for the years ended December 31, 2014, 2013 and 2012. The net change in these assets and liabilities, excluding "other activity" as described below, reflects $368 million, $1.093 billion and $1.521 billion in unrealized net losses in 2014, 2013 and 2012, respectively, arising from mark-to-market accounting for positions in the commodity contract portfolio. The reduction in the net asset value of the portfolio primarily reflects the termination of positions in the natural gas hedging program as a result of the Bankruptcy Filing. The portfolio consists primarily of economic hedges but also includes proprietary trading positions.
|
| | | | | | | | | | | |
| | Year Ended December 31, |
| | 2014 | | 2013 | | 2012 |
| Commodity contract net asset at beginning of period | $ | 525 |
| | $ | 1,664 |
| | $ | 3,190 |
|
| Settlements/termination of positions (a) | (385 | ) | | (1,039 | ) | | (1,800 | ) |
| Changes in fair value of positions in the portfolio (b) | 17 |
| | (54 | ) | | 279 |
|
| Other activity (c) | 23 |
| | (46 | ) | | (5 | ) |
| Commodity contract net asset at end of period | $ | 180 |
| | $ | 525 |
| | $ | 1,664 |
|
____________
| |
| (a) | Represents reversals of previously recognized unrealized gains and losses upon settlement/termination (offsets realized gains and losses recognized in the settlement period). Excludes changes in fair value in the month the position settled as well as amounts related to positions entered into and settled in the same month. See discussion above under Significant Activities and Events and Items Influencing Future Performance – Natural Gas Hedging Program and Termination of Positions. |
| |
| (b) | Represents unrealized net gains (losses) recognized, reflecting the effect of changes in fair value. Excludes changes in fair value in the month the position settled as well as amounts related to positions entered into and settled in the same month. |
| |
| (c) | These amounts do not represent unrealized gains or losses. Includes initial values of positions involving the receipt or payment of cash or other consideration, generally related to options purchased/sold. |
Substantially all of the $180 million commodity contract net asset value at December 31, 2014 will mature in less than one year with the remainder maturing between one and three years. A substantial majority of the commodity contract net asset value is based on actively quoted prices or prices provided by external sources, with $35 million resulting from valuations based on models.
FINANCIAL CONDITION
Operating Cash Flows
Year Ended December 31, 2014 Compared to Year Ended December 31, 2013 — Cash provided by operating activities totaled $404 million in 2014 compared to cash used in operating activities of $503 million in 2013. The change of $907 million was primarily driven by lower cash interest payments due to the discontinuation of interest paid on pre-petition debt (see Note 9 to the Financial Statements) partially offset by lower cash received from commodity hedging and trading activities reflecting lower gains on the natural gas hedging program and a decrease in cash used for margin deposits.
Year Ended December 31, 2013 Compared to Year Ended December 31, 2012 — Cash used in operating activities totaled $503 million and $818 million in 2013 and 2012, respectively. The improvement of $315 million was more than accounted for by favorable changes in accounts payable, prepaid expenses and accrued liability accounts due primarily to timing of payments. Other key favorable factors included the effect of the $259 million pension plan cash contribution in 2012, an approximately $200 million effect of increased wholesale electricity revenues driven by higher average prices, $163 million in higher net distributions (including income tax payments) received from Oncor Holdings and $156 million in favorable changes in margin deposits. Key unfavorable factors included a decrease of $896 million in net realized gains from commodity hedging and trading activities and an increase of $248 million in interest payments.
Depreciation and amortization expense reported in the statements of consolidated cash flows exceeded the amount reported in the statements of consolidated income (loss) by $170 million, $166 million and $179 million for the years ended December 31, 2014, 2013 and 2012, respectively. The difference represented amortization of nuclear fuel, which is reported as fuel costs in the statements of consolidated income (loss) consistent with industry practice, and amortization of intangible net assets arising from purchase accounting that is reported in various other statements of consolidated income (loss) line items including operating revenues and fuel and purchased power costs and delivery fees.
Financing Cash Flows
Year Ended December 31, 2014 Compared to Year Ended December 31, 2013 — Cash provided by financing activities totaled $2.257 billion in 2014 compared to cash used in financing activities of $196 million in 2013. The change of $2.453 billion reflected:
| |
| • | $1.425 billion in borrowings from the TCEH DIP Facility, and |
| |
| • | $3.564 billion in borrowings from the EFIH DIP Facility, |
partially offset by
| |
| • | $2.438 billion in repayments of EFIH First Lien Notes; |
| |
| • | $187 million in payments for fees associated with completion of the TCEH and EFIH DIP Facilities, and |
| |
| • | $82 million of net borrowings under an accounts receivable securitization program in 2013. |
Year Ended December 31, 2013 Compared to Year Ended December 31, 2012 — Cash used in financing activities totaled $196 million in 2013 and cash provided by financing activities totaled $3.373 billion in 2012. Activity in 2013 reflected scheduled repayments of debt and an $82 million repayment resulting from the termination of the accounts receivable securitization program (see Note 21 to the Financial Statements). Activity in 2012, including the issuance of $2.253 billion of EFIH senior notes, is discussed immediately below.
See Notes 11 and 12 to the Financial Statements for further detail of debtor-in-possession borrowing facilities and pre-petition debt.
Investing Cash Flows
Year Ended December 31, 2014 Compared to Year Ended December 31, 2013 — Cash used in investing activities totaled $450 million in 2014 compared to cash provided by investing activities of $3 million in 2013. The change of $453 million was largely driven by a net use of restricted cash of $636 million, partially offset by a reduction in capital expenditures (including nuclear fuel purchases) of $154 million. Cash provided by restricted cash activity in 2014 reflected a $391 million source of cash from an escrow account when certain letters of credit were drawn (see Note 12 to the Financial Statements), partially offset by a $350 million use of restricted cash supporting new letters of credit issued under the TCEH DIP Facility. Cash provided by restricted cash activity in 2013 reflected a $680 million cash source released from a collateral account to repay the balance of the TCEH Demand Notes (see Note 19 to the Financial Statements). The decrease in capital expenditures (including nuclear fuel purchases) of $154 million, to $463 million, was due to scope and timing of capital projects, including certain cancelled or deferred mining and generation projects, timing and costs of nuclear fuel purchases and pre-petition payments that were stayed due to the Bankruptcy Filing. Investing cash flows were also favorably affected by $40 million in cash used in 2013 to acquire the owner participant interest in a trust established to lease six natural gas-fired combustion turbines to TCEH.
Capital expenditures, including nuclear fuel, in 2014 totaled $463 million and consisted of:
| |
| • | $248 million for major maintenance, primarily in existing generation operations; |
| |
| • | $76 million for environmental expenditures related to generation units; |
| |
| • | $77 million for nuclear fuel purchases, and |
| |
| • | $62 million for information technology, nuclear generation development and other corporate investments. |
Cash capital expenditures in 2014 are net of $11 million of reimbursements from the DOE related to dry cask storage. We expect to be reimbursed for our allowable costs of constructing dry cask storage for spent nuclear fuel through 2016 in accordance with a settlement agreement with the DOE.
Year Ended December 31, 2013 Compared to Year Ended December 31, 2012 — Cash provided by investing activities totaled $3 million in 2013 and cash used in investing activities totaled $1.468 billion in 2012. The change was driven by restricted cash movements, as $680 million was deposited in a collateral account in 2012 for the purpose of EFH Corp. repaying the balance of the TCEH Demand Notes (see Note 19 to the Financial Statements), and the funds were released from the collateral account in 2013 to make the repayment. Capital expenditures (excluding nuclear fuel purchases) decreased $163 million to $501 million in 2013 reflecting decreases in generation environmental-related spending and other capital projects, partially offset by increased spending on lignite mine development. Nuclear fuel purchases decreased $97 million to $116 million due to timing of purchases for refueling cycles. Investing activities in 2013 also included $40 million used to acquire the owner participant interest in a trust established to lease six natural gas combustion turbines to TCEH. See Note 12 to the Financial Statements and discussion below under Debt Activity regarding the debt obligation of the trust.
Capital expenditures, including nuclear fuel, in 2013 totaled $617 million and consisted of:
| |
| • | $366 million for major maintenance, primarily in existing generation operations; |
| |
| • | $93 million for environmental expenditures related to generation units; |
| |
| • | $116 million for nuclear fuel purchases, and |
| |
| • | $42 million for information technology, nuclear generation development and other corporate investments. |
Cash capital expenditures in 2013 are net of $12 million of reimbursements from the DOE related to dry cask storage.
Debt Activity — Debt activities during the year ended December 31, 2014 are as follows (all amounts presented are principal, and settlements include amounts related to capital leases and exclude amounts related to debt discount, financing and reacquisition expenses):
|
| | | | | | | |
| | Borrowings | | Settlements |
| TCEH (a) | $ | 1,425 |
| | $ | (223 | ) |
| EFCH | — |
| | (12 | ) |
| EFIH (b) | 5,400 |
| | (3,985 | ) |
| EFH Corp. (c) | — |
| | (6 | ) |
| Total | $ | 6,825 |
| | $ | (4,226 | ) |
___________
| |
| (a) | Settlements include $204 million of pollution control revenue bonds tendered, $11 million of payments of principal at scheduled maturity dates and $8 million of payments of capital lease liabilities. |
| |
| (b) | Settlements include $2.312 billion cash and $1.673 billion of noncash exchanges (see Note 11 to the Financial Statements). |
| |
| (c) | Settlements are noncash. |
See Notes 11 and 12 to the Financial Statements for further detail of debtor-in-possession borrowing facilities and pre-petition debt, including discussion related to the settlement of the EFIH First-Lien Notes.
Available Liquidity — The following table summarizes changes in available liquidity for the year ended December 31, 2014.
|
| | | | | | | | | | | |
| | Available Liquidity |
| | December 31, 2014 | | December 31, 2013 | | Change |
| Cash and cash equivalents – EFH Corp. and other | $ | 428 |
| | $ | 229 |
| | $ | 199 |
|
| Cash and cash equivalents – EFIH | 1,157 |
| | 242 |
| | 915 |
|
| Cash and cash equivalents – TCEH (a) | 1,843 |
| | 746 |
| | 1,097 |
|
| Total cash and cash equivalents | 3,428 |
| | 1,217 |
| | 2,211 |
|
| TCEH DIP Revolving Credit Facility (b) | 1,950 |
| | — |
| | 1,950 |
|
| TCEH Letter of Credit Facility | — |
| | 195 |
| | (195 | ) |
| Total liquidity (b) | $ | 5,378 |
| | $ | 1,412 |
| | $ | 3,966 |
|
___________
| |
| (a) | Cash and cash equivalents in 2014 and 2013 exclude $901 million and $945 million, respectively, of restricted cash held for letter of credit support. The 2014 restricted cash balance includes $551 million under the TCEH Letter of Credit Facility and $350 million under the TCEH DIP Facility. |
| |
| (b) | Pursuant to an order of the Bankruptcy Court, the TCEH Debtors may not have more than $1.650 billion of cash borrowings outstanding under the TCEH DIP Revolving Credit Facility without written consent of the TCEH committee of unsecured creditors and the ad hoc group of TCEH unsecured noteholders or further order of the Bankruptcy Court. |
The increase in available liquidity of $3.966 billion in the year ended December 31, 2014 was driven by cash and available capacity under the $3.375 billion TCEH DIP Facility and the cash borrowings under the EFIH DIP Facility of $1.038 billion, net of fees related to both facilities of $187 million (see Note 10 to the Financial Statements), and $404 million in cash provided by operating activities, partially offset by $463 million in capital expenditures, including nuclear fuel purchases. See discussion of cash flows above.
In March 2015, with the approval of the Bankruptcy Court, EFIH used some of its cash to repay (Repayment) $735 million, including interest at contractual rates, in amounts outstanding under EFIH's pre-petition 11.00% Second Lien Notes due 2021 (11.00% Notes) and 11.75% Second Lien Notes due 2022 (11.75% Notes) and $15 million in certain fees and expenses of the trustee for such notes. The Repayment required the requisite consent of the lenders under its DIP Facility. EFIH received such consent from approximately 97% of the lenders under EFIH's DIP Facility and paid an aggregate consent fee equal to approximately $13 million. As a result of the Repayment, as of the date hereof, the principal amount outstanding on the 11.00% Notes and 11.75% are $322 million and $1.388 billion, respectively.
Subject to certain exceptions under the Bankruptcy Code, the Bankruptcy Filing automatically enjoined, or stayed, the continuation of most pending judicial or administrative proceedings and the filing of other actions against the Debtors or their property to recover on, collect or secure a claim arising prior to the date of the Bankruptcy Filing (including with respect to our pre-petition debt instruments).
The Bankruptcy Court approved final orders in June 2014 authorizing the TCEH DIP Facility and the EFIH DIP Facility (see Note 11 to the Financial Statements). The TCEH DIP Facility provides for $3.375 billion in senior secured, super-priority financing. The EFIH First Lien DIP Facility provides for $5.4 billion in senior secured, super-priority financing.
We have incurred and expect to continue to incur significant costs associated with the Chapter 11 Cases and our reorganization, but we cannot accurately predict the effect the Chapter 11 Cases will have on our operations, liquidity, financial position and results of operations. Based upon our current internal financial forecasts, we believe that we will have sufficient amounts available under the DIP Facilities, plus cash generated from operations, to fund our anticipated cash requirements through at least the maturity dates of the DIP Facilities.
Debt Capacity — The TCEH DIP Facility permits, subject to certain terms, conditions and limitations, TCEH to request additional term loans or increases in the amount of the revolving credit commitment, not to exceed $750 million. The EFIH DIP Facility permits, subject to certain terms, conditions and limitations, EFIH to incur incremental junior lien subordinated debt in an aggregate amount not to exceed $3 billion.
Capital Expenditures — Capital expenditures and nuclear fuel purchases for 2015 are expected to total approximately $650 million and include:
| |
| • | $400 million for investments in TCEH generation facilities, including approximately: |
| |
| • | $300 million for major maintenance and |
| |
| • | $100 million for environmental expenditures related to the MATS and other regulations; |
| |
| • | $175 million for nuclear fuel purchases and |
| |
| • | $75 million for information technology and other corporate investments. |
Distributions of Earnings from Oncor Holdings and Related Considerations — Oncor Holdings' distributions of earnings to us totaled $202 million, $213 million and $147 million for the years ended December 31, 2014, 2013 and 2012, respectively. On February 26, 2015, we received a distribution totaling $74 million from Oncor Holdings. See Note 3 to the Financial Statements for discussion of limitations on amounts Oncor can distribute to its members.
As a result of the Bankruptcy Filing, Oncor had credit risk exposure to trade accounts receivable from TCEH, which related to delivery services provided by Oncor to TCEH's retail electricity operations. At the Petition Date, these accounts receivable totaled $109 million. In June 2014, the Bankruptcy Court authorized TCEH to pay all pre-petition delivery charges due Oncor, and such amounts were paid in full.
EFH Corp., Oncor Holdings, Oncor and Oncor's minority investor are parties to a Federal and State Income Tax Allocation Agreement. Additional income tax amounts receivable or payable may arise in the normal course under that agreement.
Pension and OPEB Plan Funding — See Note 17 to the Financial Statements.
Liquidity Effects of Commodity Hedging and Trading Activities — We have entered into commodity hedging and trading transactions that require us to post collateral if the forward price of the underlying commodity moves such that the hedging or trading instrument we hold has declined in value. TCEH uses cash, letters of credit and other forms of credit support to satisfy such collateral posting obligations. See Note 11 to the Financial Statements for discussion of the TCEH DIP Facility.
Exchange cleared transactions typically require initial margin (i.e., the upfront cash and/or letter of credit posted to take into account the size and maturity of the positions and credit quality) in addition to variation margin (i.e., the daily cash margin posted to take into account changes in the value of the underlying commodity). The amount of initial margin required is generally defined by exchange rules. Clearing agents, however, typically have the right to request additional initial margin based on various factors including market depth, volatility and credit quality, which may be in the form of cash, letters of credit, a guaranty or other forms as negotiated with the clearing agent. Cash collateral received from counterparties is either used for working capital and other corporate purposes, including reducing borrowings under credit facilities, or is required to be deposited in a separate account and restricted from being used for working capital and other corporate purposes. At December 31, 2014, all cash collateral held was unrestricted. With respect to over-the-counter transactions, counterparties generally have the right to substitute letters of credit for such cash collateral. In such event, the cash collateral previously posted would be returned to such counterparties, which would reduce liquidity in the event the cash was not restricted.
At December 31, 2014, TCEH received or posted cash and letters of credit for commodity hedging and trading activities as follows:
| |
| • | $9 million in cash has been posted with counterparties as compared to $93 million posted at December 31, 2013; |
| |
| • | $26 million in cash has been received from counterparties as compared to $302 million received at December 31, 2013. This decrease was driven by termination of positions in the natural gas hedging program as discussed in Note 16 to the Financial Statements; |
| |
| • | $329 million in letters of credit have been posted with counterparties, as compared to $317 million posted at December 31, 2013, and |
| |
| • | $3 million in letters of credit have been received from counterparties, as compared to $3 million received at December 31, 2013. |
Because certain agreements related to these activities are deemed to be "forward contracts" under the Bankruptcy Code, they are not subject to the automatic stay, and counterparties may elect to terminate the agreements. If the agreements are terminated, such cash and letter of credit postings may be used in the ultimate settlement of the positions. See Note 16 to the Financial Statements for discussion of agreements terminated subsequent to the Bankruptcy Filing.
Income Tax Matters — EFH Corp. files a US federal income tax return that includes the results of EFCH, EFIH, Oncor Holdings and TCEH. EFH Corp. (parent entity) is a corporate member of the EFH Corp. consolidated group, while each of EFIH, Oncor Holdings, EFCH and TCEH is classified as a disregarded entity for US federal income tax purposes. Oncor is a partnership for US federal income tax purposes and is not a corporate member of the EFH Corp. consolidated group. Pursuant to applicable US Treasury regulations and published guidance of the IRS, corporations that are members of a consolidated group have joint and several liability for the taxes of such group.
EFH Corp. and certain of its subsidiaries (including EFCH, EFIH, and TCEH, but not including Oncor Holdings and Oncor) are parties to a Federal and State Income Tax Allocation Agreement, which provides, among other things, that any corporate member or disregarded entity in the EFH Corp. group is required to make payments to EFH Corp. in an amount calculated to approximate the amount of tax liability such entity would have owed if it filed a separate corporate tax return. EFH Corp., Oncor Holdings, Oncor and Oncor's third-party minority investor are parties to a separate Federal and State Income Tax Allocation Agreement, which governs the computation of federal income tax liability among such parties, and similarly provides, among other things, that each of Oncor Holdings and Oncor will pay EFH Corp. its share of an amount calculated to approximate the amount of tax liability such entity would have owed if it filed a separate corporate tax return. The material weakness in our internal controls over financial reporting related to accounting for deferred income taxes, as described in Item 9A, Controls and Procedures, did not cause any change in our historic tax sharing practices or the interpretation of any tax sharing agreements within the different members of our company.
Income Tax Payments — In the next twelve months, income tax payments related to the Texas margin tax are expected to total approximately $50 million, and no payments or refunds of federal income taxes are expected. Income tax payments totaled $55 million, $65 million and $71 million for the years ended December 31, 2014, 2013 and 2012, respectively. In April 2014, EFH Corp. paid the IRS for interest in the amount of $3 million, thus settling all contested issues related to the 1997 through 2002 open tax years.
We cannot reasonably estimate the ultimate amounts and timing of tax payments associated with uncertain tax positions, but expect that no material federal income tax payments related to such positions will be made in the next twelve months (see Note 5 to the Financial Statements).
Capitalization — At December 31, 2014, our capitalization ratios consisted of 185.4% borrowings under debtor-in-possession credit facilities, debt and pre-petition notes, loans and other debt reported as liabilities subject to compromise, less amounts due currently, and (85.4)% common stock equity. Total borrowings under debtor-in-possession credit facilities, debt and pre-petition notes, loans and other debt reported as liabilities subject to compromise to capitalization was 185.3% at December 31, 2014. At December 31, 2013, our capitalization ratios consisted of 163.4% debt, less amounts with contractual maturity dates in the next twelve months, and (63.4)% common stock equity. Total debt to capitalization was 149.1% at December 31, 2013.
Financial Covenants — The Bankruptcy Filing constituted an event of default and automatic acceleration under the agreements governing the pre-petition debt of EFH Corp. and its subsidiaries, including EFIH, EFCH and TCEH but excluding the Oncor Ring-Fenced Entities. The creditors are, however, stayed from taking any action against the Debtors as a result of such defaults and accelerations under the Bankruptcy Code.
The agreement governing the TCEH DIP Facility includes a covenant that requires the Consolidated Superpriority Secured Net Debt to Consolidated EBITDA ratio not exceed 3.50 to 1.00, beginning with the test period ending June 30, 2014. The ratio was 1.05 to 1.00 at December 31, 2014 and TCEH is in compliance with this covenant. Consolidated Superpriority Secured Net Debt consists of outstanding term loans and revolving credit exposure under the TCEH DIP Facility less unrestricted cash. TCEH's Consolidated EBITDA (as used in the covenant contained in the agreement governing the TCEH DIP Facility) for the year ended December 31, 2014 totaled $1.871 billion. See Exhibit 99(b) for a reconciliation of TCEH's net income (loss) to Consolidated EBITDA. The EFIH DIP Facility also includes a minimum liquidity covenant pursuant to which EFIH cannot allow unrestricted cash (as defined in the EFIH DIP Facility) to be less than $150 million. EFIH is in compliance with this covenant.
See Note 11 to the Financial Statements for discussion of other covenants related to the DIP Facilities.
Collateral Support Obligations — The RCT has rules in place to assure that parties can meet their mining reclamation obligations, including through self-bonding when appropriate. In June 2014, the RCT agreed to accept a collateral bond from TCEH of up to $1.1 billion as a substitute for its self-bond. The collateral bond is a $1.1 billion carve out from the super-priority liens under the TCEH DIP Facility that will enable the RCT to be paid before the TCEH DIP Facility lenders in the event of a liquidation of TCEH's assets. Collateral support relates to land mined or being mined and not yet reclaimed as well as land for which permits have been obtained but mining activities have not yet begun and land already reclaimed but not released from regulatory obligations by the RCT, and includes cost contingency amounts. Our most recent estimate of future costs to complete reclamation of land that we have mined as well as land we are currently mining totals approximately $350 million on an undiscounted basis, including required premiums and inflation.
Certain transmission and distribution utilities in Texas are required to assure adequate creditworthiness of any REP to support the REP's obligation to collect securitization bond-related (transition) charges on behalf of the utility. Under these requirements, as a result of TCEH's below investment grade credit rating, TCEH is required to post collateral support in an amount equal to estimated transition charges over specified time periods. The amount of collateral support required to be posted, as well as the time period of transition charges covered, varies by utility. At December 31, 2014, TCEH has posted collateral support in the form of letters of credit to the applicable utilities in an aggregate amount equal to $23 million, with $9 million of this amount posted for the benefit of Oncor.
The PUCT has rules in place to assure adequate creditworthiness of each REP, including the ability to return customer deposits, if necessary. Under these rules, at December 31, 2014, TCEH posted letters of credit in the amount of $62 million, which are subject to adjustments.
ERCOT has rules in place to assure adequate creditworthiness of parties that participate in the day-ahead, real-time and congestion revenue rights markets operated by ERCOT. Under these rules, TCEH has posted collateral support, predominantly in the form of letters of credit, totaling $105 million at December 31, 2014 (which is subject to daily adjustments based on settlement activity with ERCOT).
Oncor and Texas Holdings agreed to the terms of a stipulation with major interested parties to resolve all outstanding issues in the PUCT review related to the Merger. As part of this stipulation, TCEH would be required to post a letter of credit in an amount equal to $170 million to secure its payment obligations to Oncor in the event, which has not occurred, two or more rating agencies downgrade Oncor's credit ratings below investment grade.
Material Cross Default/Acceleration Provisions — Certain of our financing arrangements contain provisions that result in an event of default if there were a failure under other financing arrangements to meet payment terms or to observe other covenants that could or does result in an acceleration of payments due. Such provisions are referred to as "cross default" or "cross acceleration" provisions. The Bankruptcy Filing triggered defaults on our pre-petition debt obligations, but pursuant to the Bankruptcy Code, the creditors are stayed from taking any actions against the Debtors as a result of such defaults.
Under the terms of a TCEH rail car lease, which has $36 million in remaining lease payments at December 31, 2014 and terminates in 2017, if TCEH fails to perform under agreements causing its indebtedness in an aggregate principal amount of $100 million or more to become accelerated, the lessor could, among other remedies, terminate the lease and effectively accelerate the payment of any remaining lease payments due under the lease. Under the Bankruptcy Code, the lessors are stayed from taking any action against the Debtors as a result of the default.
Under the terms of another TCEH rail car lease, which has $38 million in remaining lease payments at December 31, 2014 and terminates in 2029, if payment obligations of TCEH in excess of $200 million in the aggregate to third-party creditors under lease agreements, deferred purchase agreements or loan or credit agreements are accelerated prior to their original stated maturity, the lessor could, among other remedies, terminate the lease and effectively accelerate the payment of any remaining lease payments due under the lease. Under the Bankruptcy Code, the lessors are stayed from taking any action against the Debtors as a result of the default.
Contractual Obligations and Commitments — The following table summarizes the amounts and related maturities of our contractual cash obligations at December 31, 2014 (see Notes 11 and 13 to the Financial Statements for additional disclosures regarding these debt and noncancellable purchase obligations). Pre-petition liabilities subject to compromise (i.e., obligations incurred or accrued prior to the Bankruptcy Filing) are being administered by the Bankruptcy Court and are excluded from the table below due to the uncertainty related to when those obligations will mature.
|
| | | | | | | | | | | | | | | | | | | |
| Contractual Cash Obligations: | Less Than One Year | | One to Three Years | | Three to Five Years | | More Than Five Years | | Total |
| Debt – principal, including capital leases (a) | $ | 39 |
| | $ | 6,909 |
| | $ | 21 |
| | $ | 21 |
| | $ | 6,990 |
|
| Debt – interest (b) | 293 |
| | 137 |
| | 4 |
| | 2 |
| | 436 |
|
| Operating leases | 24 |
| | 60 |
| | 52 |
| | 116 |
| | 252 |
|
| Obligations under commodity purchase and services agreements (c) | 740 |
| | 540 |
| | 292 |
| | 504 |
| | 2,076 |
|
| Total contractual cash obligations | $ | 1,096 |
| | $ | 7,646 |
| | $ | 369 |
| | $ | 643 |
| | $ | 9,754 |
|
___________
| |
| (a) | Includes $6.825 billion of borrowings under the TCEH and EFIH DIP Facilities and $165 million principal amount of long-term debt, including capital leases. Excludes unamortized premiums and discounts and fair value premiums and discounts related to purchase accounting. |
| |
| (b) | Contractual and adequate protection interest payments are excluded. |
| |
| (c) | Includes capacity payments, nuclear fuel and natural gas take-or-pay contracts, coal contracts, business services and nuclear related outsourcing and other purchase commitments. Amounts presented for variable priced contracts reflect the year-end 2014 price for all periods except where contractual price adjustment or index-based prices are specified. |
The following are not included in the table above:
| |
| • | liabilities subject to compromise (see Note 12 to the Financial Statements); |
| |
| • | arrangements between affiliated entities and intercompany debt (see Note 19 to the Financial Statements); |
| |
| • | individual contracts that have an annual cash requirement of less than $1 million (however, multiple contracts with one counterparty that are more than $1 million on an aggregated basis have been included); |
| |
| • | contracts that are cancellable without payment of a substantial cancellation penalty; |
| |
| • | employment contracts with management, and |
| |
| • | liabilities related to uncertain tax positions totaling $65 million (as well as accrued interest totaling $9 million) discussed in Note 5 to the Financial Statements as the ultimate timing of payment, if any, is not known. |
Guarantees — See Note 13 to the Financial Statements for discussion of guarantees.
OFF–BALANCE SHEET ARRANGEMENTS
See Notes 3 and 13 to the Financial Statements regarding VIEs and guarantees, respectively.
COMMITMENTS AND CONTINGENCIES
See Note 13 to the Financial Statements for discussion of commitments and contingencies.
CHANGES IN ACCOUNTING STANDARDS
See Note 1 to the Financial Statements for discussion of changes in accounting standards.
| |
| Item 7A. | QUANTITATIVE AND QUALITATIVE DISCLOSURES ABOUT MARKET RISK |
All dollar amounts in the tables in the following discussion and analysis are stated in millions of US dollars unless otherwise indicated.
Market risk is the risk that in the ordinary course of business we may experience a loss in value as a result of changes in market conditions that affect economic factors such as commodity prices, interest rates and counterparty credit. Our exposure to market risk is affected by a number of factors, including the size, duration and composition of our energy and financial portfolio, as well as the volatility and liquidity of markets. Instruments used to manage this exposure include interest rate swaps to hedge debt costs, as well as exchange-traded, over-the-counter contracts and other contractual arrangements to hedge commodity prices.
Risk Oversight
We manage the commodity price, counterparty credit and commodity-related operational risk related to the competitive energy business within limitations established by senior management and in accordance with overall risk management policies. Interest rate risk is managed centrally by the corporate treasury function. Market risks are monitored by risk management groups that operate independently of the wholesale commercial operations, utilizing defined practices and analytical methodologies. These techniques measure the risk of change in value of the portfolio of contracts and the hypothetical effect on this value from changes in market conditions and include, but are not limited to, position review, Value at Risk (VaR) methodologies and stress test scenarios. Key risk control activities include, but are not limited to, transaction review and approval (including credit review), operational and market risk measurement, transaction authority oversight, validation of transaction capture, market price validation and reporting, and portfolio valuation and reporting, including mark-to-market valuation, VaR and other risk measurement metrics.
We have a corporate risk management organization that is headed by the Chief Financial Officer, who also functions as the Chief Risk Officer. The Chief Risk Officer, through his designees, enforces applicable risk limits, including the respective policies and procedures to ensure compliance with such limits, and evaluates the risks inherent in our businesses.
Commodity Price Risk
The competitive business is subject to the inherent risks of market fluctuations in the price of electricity, natural gas and other energy-related products it markets or purchases. We actively manage the portfolio of generation assets, fuel supply and retail sales load to mitigate the near-term impacts of these risks on results of operations. Similar to other participants in the market, we cannot fully manage the long-term value impact of structural declines or increases in natural gas and power prices.
In managing energy price risk, we enter into a variety of market transactions including, but not limited to, short- and long-term contracts for physical delivery, exchange-traded and over-the-counter financial contracts and bilateral contracts with customers. Activities include hedging, the structuring of long-term contractual arrangements and proprietary trading. We continuously monitor the valuation of identified risks and adjust positions based on current market conditions. We strive to use consistent assumptions regarding forward market price curves in evaluating and recording the effects of commodity price risk.
VaR Methodology — A VaR methodology is used to measure the amount of market risk that exists within the portfolio under a variety of market conditions. The resultant VaR produces an estimate of a portfolio's potential for loss given a specified confidence level and considers, among other things, market movements utilizing standard statistical techniques given historical and projected market prices and volatilities.
A Monte Carlo simulation methodology is used to calculate VaR and is considered by management to be the most effective way to estimate changes in a portfolio's value based on assumed market conditions for liquid markets. The use of this method requires a number of key assumptions, such as use of (i) an assumed confidence level; (ii) an assumed holding period (i.e., the time necessary for management action, such as to liquidate positions); and (iii) historical estimates of volatility and correlation data. The tables below detail certain VaR measures related to various portfolios of contracts; however, we have excluded a table for proprietary trading activity due to the de minimis size of that activity.
VaR for Energy-Related Contracts Subject to Mark-to-Market (MtM) Accounting — This measurement estimates the potential loss in fair value, due to changes in market conditions, of all contracts marked-to-market in net income (principally hedges not accounted for as cash flow hedges and trading positions), based on a 95% confidence level and an assumed holding period of five to 60 days.
|
| | | | | | | |
| | Year Ended December 31, |
| | 2014 | | 2013 |
| Month-end average MtM VaR: | $ | 50 |
| | $ | 69 |
|
| Month-end high MtM VaR: | $ | 129 |
| | $ | 97 |
|
| Month-end low MtM VaR: | $ | 22 |
| | $ | 43 |
|
Earnings at Risk (EaR) — This measurement estimates the potential reduction of pretax earnings for the periods presented, due to changes in market conditions, of all energy-related contracts marked-to-market in net income and contracts not marked-to-market in net income that are expected to be settled within the fiscal year (physical purchases and sales of commodities), based on a 95% confidence level and an assumed holding period of five to 60 days.
|
| | | | | | | |
| | Year Ended December 31, |
| | 2014 | | 2013 |
| Month-end average EaR: | $ | 27 |
| | $ | 36 |
|
| Month-end high EaR: | $ | 60 |
| | $ | 71 |
|
| Month-end low EaR: | $ | 4 |
| | $ | 23 |
|
The increase in the month end high MtM VaR risk measure during 2014 reflected increases in natural gas prices and higher market volatility.
Interest Rate Risk
The following table provides information concerning our financial instruments at December 31, 2014 and 2013 that are sensitive to changes in interest rates, which consist of debtor-in-possession financing and pre-petition obligations that are fully secured and other obligations that are allowed to be paid as ordered by the Bankruptcy Court. Other pre-petition obligations (i.e., obligations incurred or accrued prior to the Bankruptcy Filing) are being administered by the Bankruptcy Court and are excluded from the table below due to the uncertainty related to when those obligations will mature. See Notes 11 and 12 to the Financial Statements for further discussion of these financial instruments.
|
| | | | | | | | | | | | | | | |
| | 2014 Total Carrying Amount | | 2014 Total Fair Value | | 2013 Total Carrying Amount | | 2013 Total Fair Value |
| Debt amounts (a): | | | | | | | |
| Fixed rate debt amount | $ | 121 |
| | $ | 119 |
| | $ | 17,566 |
| | $ | 10,273 |
|
| Average interest rate | 8.35 | % | | | | 10.87 | % | | |
| Variable rate debt amount | $ | 6,825 |
| | $ | 6,830 |
| | $ | 20,768 |
| | $ | 14,380 |
|
| Average interest rate (b) | 4.15 | % | | | | 4.50 | % | | |
| Total debt | $ | 6,946 |
| | $ | 6,949 |
| | $ | 38,334 |
| | $ | 24,653 |
|
| Debt swapped to fixed (c): | | | | | | | |
| Amount | $ | — |
| | | | $ | 30,790 |
| | |
| Average pay rate | | | | | 8.24 | % | | |
| Average receive rate | | | | | 4.78 | % | | |
| Variable basis swaps (c): | | | | | | | |
| Amount | $ | — |
| | | | $ | 1,050 |
| | |
| Average pay rate | | | | | 0.24 | % | | |
| Average receive rate | | | | | 0.17 | % | | |
___________
| |
| (a) | Borrowings under the TCEH Revolving Credit Facilities, capital leases and the effects of unamortized premiums and discounts are excluded from the table. |
| |
| (b) | The weighted average interest rate presented is based on the rate in effect at December 31, 2014. |
| |
| (c) | In order to hedge our variable rate debt exposure, we entered into interest rate swaps under which we received amounts based on variable interest rates and paid amounts based on fixed interest rates. In addition, we entered into certain interest rate basis swaps to further reduce borrowing costs. The average pay rate and average receive rate for variable rate instruments was based on rates in effect at December 31, 2013. |
Credit Risk
Credit risk relates to the risk of loss associated with nonperformance by counterparties. We maintain credit risk policies with regard to our counterparties to minimize overall credit risk. These policies prescribe practices for evaluating a potential counterparty's financial condition, credit rating and other quantitative and qualitative credit criteria and authorize specific risk mitigation tools including, but not limited to, use of standardized master agreements that allow for netting of positive and negative exposures associated with a single counterparty. We have processes for monitoring and managing credit exposure of our businesses including methodologies to analyze counterparties' financial strength, measurement of current and potential future exposures and contract language that provides rights for netting and setoff. Credit enhancements such as parental guarantees, letters of credit, surety bonds, margin deposits and customer deposits are also utilized. Additionally, individual counterparties and credit portfolios are managed to assess overall credit exposure.
Credit Exposure — Our gross exposure to credit risk associated with trade accounts receivable (retail and wholesale) and net asset positions (before credit collateral) arising from commodity contracts and hedging and trading activities totaled $740 million at December 31, 2014. The components of this exposure are discussed in more detail below.
Assets subject to credit risk at December 31, 2014 include $469 million in retail trade accounts receivable before taking into account cash deposits held as collateral for these receivables totaling $54 million. The risk of material loss (after consideration of bad debt allowances) from nonperformance by these customers is unlikely based upon historical experience. Allowances for uncollectible accounts receivable are established for the potential loss from nonpayment by these customers based on historical experience, market or operational conditions and changes in the financial condition of large business customers.
The remaining credit exposure arises from wholesale trade receivables and amounts associated with derivative instruments related to hedging and trading activities. Counterparties to these transactions include energy companies, financial institutions, electric utilities, independent power producers, oil and gas producers, local distribution companies and energy trading and marketing companies. At December 31, 2014, the exposure to credit risk from these counterparties totaled $271 million consisting of accounts receivable of $76 million and net asset positions related to commodity contracts of $195 million, after taking into account the netting provisions of the master agreements described above but before taking into account $26 million in credit collateral (cash, letters of credit and other credit support). The net exposure (after credit collateral) of $245 million increased $42 million in the year ended December 31, 2014.
Of this $245 million net exposure, essentially all is with investment grade customers and counterparties, as determined by our internal credit evaluation process which includes publicly available information including major rating agencies' published ratings as well as internal credit methodologies and credit scoring models. Those customers and counterparties without an S&P rating of at least BBB- or similar rating from another major rating agency are rated using internal credit methodologies and credit scoring models to estimate an S&P equivalent rating. The company routinely monitors and manages credit exposure to these customers and counterparties based on, but not limited to, the assigned credit rating, margining and collateral management.
The following table presents the distribution of credit exposure at December 31, 2014. This credit exposure largely represents wholesale trade accounts receivable and net asset positions related to commodity contracts and hedging and trading activities (a substantial majority of which mature in 2015) recognized as derivative assets in the consolidated balance sheets, after taking into consideration netting provisions within each contract, setoff provisions in the event of default and any master netting contracts with counterparties. Credit collateral includes cash and letters of credit, but excludes other credit enhancements such as liens on assets. See Note 16 to the Financial Statements for further discussion of portions of this exposure related to activities marked-to-market in the financial statements.
|
| | | | | | | | | | | |
| | | | | | |
| | Exposure Before Credit Collateral | | Credit Collateral | | Net Exposure |
| Investment grade | $ | 245 |
| | $ | 23 |
| | $ | 222 |
|
| Below investment grade | 26 |
| | 3 |
| | 23 |
|
| Totals | $ | 271 |
| | $ | 26 |
| | $ | 245 |
|
| Investment grade | 90.4 | % | | | | 90.6 | % |
| Below investment grade | 9.6 | % | | | | 9.4 | % |
In addition to the exposures in the table above, contracts classified as normal purchase or sale and non-derivative contractual commitments are not marked-to-market in the financial statements. Such contractual commitments may contain pricing that is favorable considering current market conditions and therefore represent economic risk if the counterparties do not perform. Nonperformance could have a material impact on future results of operations, liquidity and financial condition.
Significant (10% or greater) concentration of credit exposure exists with four counterparties, which represented 23%, 22%, 17% and 12% of the $245 million net exposure. We view exposure to these counterparties to be within an acceptable level of risk tolerance due to the counterparties' credit ratings, each of which is rated as investment grade, the counterparties market role and deemed creditworthiness and the importance of our business relationship with the counterparties. An event of default by one or more counterparties could subsequently result in termination-related settlement payments that reduce available liquidity if amounts such as margin deposits are owed to the counterparties or delays in receipts of expected settlements owed to us. While the potential concentration of risk with these counterparties is viewed to be within an acceptable risk tolerance, the exposure to hedge counterparties is managed through the various ongoing risk management measures described above.
The termination of natural gas hedging agreements by counterparties shortly after the Bankruptcy Filing (as discussed in Note 16 to the Financial Statements) did not significantly affect the net credit risk exposure presented in the table above.
FORWARD-LOOKING STATEMENTS
This report and other presentations made by us contain "forward-looking statements." All statements, other than statements of historical facts, that are included in this report, or made in presentations, in response to questions or otherwise, that address activities, events or developments that may occur in the future, including such matters as activities related to our bankruptcy, financial or operational projections, capital allocation, future capital expenditures, business strategy, competitive strengths, goals, future acquisitions or dispositions, development or operation of power generation assets, market and industry developments and the growth of our businesses and operations (often, but not always, through the use of words or phrases such as "intends," "plans," "will likely," "unlikely," "expected," "anticipated," "estimated," "should," "projection," "target," "goal," "objective" and "outlook"), are forward-looking statements. Although we believe that in making any such forward-looking statement our expectations are based on reasonable assumptions, any such forward-looking statement involves uncertainties and is qualified in its entirety by reference to the discussion of risk factors under Item 1A, Risk Factors and the discussion under Item 7, Management's Discussion and Analysis of Financial Condition and Results of Operations in this report and the following important factors, among others, that could cause our actual results to differ materially from those projected in such forward-looking statements:
| |
| • | our ability to develop, file and complete a Chapter 11 plan of reorganization that receives the necessary votes from the required creditors and stakeholders and the approval from the Bankruptcy Court, particularly prior to the expiration of the exclusivity period granted by the Bankruptcy Court; |
| |
| • | the outcome of the court-supervised bid process with respect to the restructuring of EFH Corp. and EFIH; |
| |
| • | our ability to obtain Bankruptcy Court approval with respect to our motions in the Chapter 11 Cases, including such approvals not being overturned on appeal or being stayed for any extended period of time; |
| |
| • | the terms and conditions of any Chapter 11 plan of reorganization that is ultimately approved by the Bankruptcy Court; |
| |
| • | the extent to which the Chapter 11 Cases cause customers, suppliers and others with whom we have commercial relationships to lose confidence in us, which may make it more difficult for us to obtain and maintain such commercial relationships on competitive terms; |
| |
| • | difficulties we may face in retaining and motivating our key employees through the bankruptcy process, and difficulties we may face in attracting new employees; |
| |
| • | the significant time and effort required to be spent by our senior management in dealing with the bankruptcy and restructuring activities rather than focusing exclusively on business operations; |
| |
| • | our ability to remain in compliance with the requirements of the DIP Facilities; |
| |
| • | our ability to maintain or obtain sufficient financing sources for our operations during the pendency of the Chapter 11 Cases and our ability to obtain sufficient exit financing to fund any Chapter 11 plan of reorganization; |
| |
| • | limitations on our ability to utilize previously incurred federal net operating losses or alternative minimum tax credits; |
| |
| • | the actions and decisions of creditors, regulators and other third parties that have an interest in the Chapter 11 Cases or reorganization that may be inconsistent with, or interfere with, our business and/or plans; |
| |
| • | the duration of the Chapter 11 Cases; |
| |
| • | the actions and decisions of regulatory authorities relative to any Chapter 11 plan of reorganization; |
| |
| • | restrictions on our operations due to the terms of our debt agreements, including the DIP Facilities, and restrictions imposed by the Bankruptcy Court; |
| |
| • | our ability to obtain any required regulatory consent necessary to implement any Chapter 11 plan of reorganization; |
| |
| • | the outcome of current or potential litigation regarding whether holders are entitled to make-whole or redemption premiums and/or post-petition interest in connection with the treatment of their claims in bankruptcy; |
| |
| • | the outcome of current or potential litigation regarding intercompany claims and/or derivative claims; |
| |
| • | prevailing governmental policies and regulatory actions, including those of the Texas Legislature, the Governor of Texas, the US Congress, the FERC, the NERC, the TRE, the PUCT, the RCT, the NRC, the EPA, the TCEQ, the US Mine Safety and Health Administration and the CFTC, with respect to, among other things: |
| |
| ◦ | allowed rates of return; |
| |
| ◦ | permitted capital structure; |
| |
| ◦ | industry, market and rate structure; |
| |
| ◦ | purchased power and recovery of investments; |
| |
| ◦ | operations of nuclear generation facilities; |
| |
| ◦ | operations of fossil fueled generation facilities; |
| |
| ◦ | self-bonding requirements; |
| |
| ◦ | acquisition and disposal of assets and facilities; |
| |
| ◦ | development, construction and operation of facilities; |
| |
| ◦ | present or prospective wholesale and retail competition; |
| |
| ◦ | changes in tax laws and policies; |
| |
| ◦ | changes in and compliance with environmental and safety laws and policies, including the CSAPR, MATS, and greenhouse gas and other climate change initiatives, and |
| |
| ◦ | clearing over-the-counter derivatives through exchanges and posting of cash collateral therewith; |
| |
| • | legal and administrative proceedings and settlements, including the legal proceedings arising out of the bankruptcy; |
| |
| • | general industry trends; |
| |
| • | economic conditions, including the impact of an economic downturn; |
| |
| • | our ability to collect trade receivables from counterparties; |
| |
| • | our ability to attract and retain profitable customers; |
| |
| • | our ability to profitably serve our customers; |
| |
| • | restrictions on competitive retail pricing; |
| |
| • | changes in wholesale electricity prices or energy commodity prices, including the price of natural gas; |
| |
| • | changes in prices of transportation of natural gas, coal, fuel oil and other refined products; |
| |
| • | changes in the ability of vendors to provide or deliver commodities as needed; |
| |
| • | changes in market heat rates in the ERCOT electricity market; |
| |
| • | our ability to effectively hedge against unfavorable commodity prices, including the price of natural gas, market heat rates and interest rates; |
| |
| • | weather conditions, including drought and limitations on access to water, and other natural phenomena, and acts of sabotage, wars or terrorist or cyber security threats or activities; |
| |
| • | population growth or decline, or changes in market supply or demand and demographic patterns, particularly in ERCOT; |
| |
| • | changes in business strategy, development plans or vendor relationships; |
| |
| • | access to adequate transmission facilities to meet changing demands; |
| |
| • | changes in interest rates, commodity prices, rates of inflation or foreign exchange rates; |
| |
| • | changes in operating expenses, liquidity needs and capital expenditures; |
| |
| • | commercial bank market and capital market conditions and the potential impact of disruptions in US and international credit markets; |
| |
| • | access to capital, the cost of such capital, and the results of financing and refinancing efforts, including availability of funds in capital markets; |
| |
| • | our ability to generate sufficient cash flow to make interest or adequate protection payments, or refinance, our debt instruments, including the DIP Facilities; |
| |
| • | competition for new energy development and other business opportunities; |
| |
| • | inability of various counterparties to meet their obligations with respect to our financial instruments; |
| |
| • | changes in technology (including large scale electricity storage) used by and services offered by us; |
| |
| • | changes in electricity transmission that allow additional electricity generation to compete with our generation assets; |
| |
| • | significant changes in our relationship with our employees, including the availability of qualified personnel, and the potential adverse effects if labor disputes or grievances were to occur; |
| |
| • | changes in assumptions used to estimate costs of providing employee benefits, including medical and dental benefits, pension and OPEB, and future funding requirements related thereto, including joint and several liability exposure under ERISA; |
| |
| • | changes in assumptions used to estimate future executive compensation payments; |
| |
| • | hazards customary to the industry and the possibility that we may not have adequate insurance to cover losses resulting from such hazards; |
| |
| • | significant changes in critical accounting policies, and |
| |
| • | actions by credit rating agencies. |
Any forward-looking statement speaks only at the date on which it is made, and except as may be required by law, we undertake no obligation to update any forward-looking statement to reflect events or circumstances after the date on which it is made or to reflect the occurrence of unanticipated events or circumstances. New factors emerge from time to time, and it is not possible for us to predict all of them; nor can we assess the impact of each such factor or the extent to which any factor, or combination of factors, may cause results to differ materially from those contained in any forward-looking statement. As such, you should not unduly rely on such forward-looking statements.
INDUSTRY AND MARKET INFORMATION
The industry and market data and other statistical information used throughout this report are based on independent industry publications, government publications, reports by market research firms or other published independent sources, including certain data published by ERCOT, the PUCT and NYMEX. We did not commission any of these publications or reports. Some data is also based on good faith estimates, which are derived from our review of internal surveys, as well as the independent sources listed above. Independent industry publications and surveys generally state that they have obtained information from sources believed to be reliable, but do not guarantee the accuracy and completeness of such information. While we believe that each of these studies and publications is reliable, we have not independently verified such data and make no representation as to the accuracy of such information. Forecasts are particularly likely to be inaccurate, especially over long periods of time, and we do not know what assumptions regarding general economic growth are used in preparing the forecasts included in this report. Similarly, while we believe that such internal and external research is reliable, it has not been verified by any independent sources, and we make no assurances that the predictions contained therein are accurate.
| |
| Item 8. | FINANCIAL STATEMENTS AND SUPPLEMENTARY DATA |
REPORT OF INDEPENDENT REGISTERED PUBLIC ACCOUNTING FIRM
To the Board of Directors and Shareholders of Energy Future Holdings Corp. (Debtor-in-Possession)
Dallas, Texas
We have audited the accompanying consolidated balance sheets of Energy Future Holdings Corp. and subsidiaries (Debtor-in-Possession) ("EFH Corp.") as of December 31, 2014 and 2013, and the related statements of consolidated income (loss), comprehensive income (loss), cash flows and equity for each of the three years in the period ended December 31, 2014. Our audits also included the financial statement schedule listed in the Index at Item 15(a). These financial statements and financial statement schedule are the responsibility of EFH Corp.'s management. Our responsibility is to express an opinion on these financial statements and financial statement schedule based on our audits.
We conducted our audits in accordance with the standards of the Public Company Accounting Oversight Board (United States). Those standards require that we plan and perform the audit to obtain reasonable assurance about whether the financial statements are free of material misstatement. An audit includes examining, on a test basis, evidence supporting the amounts and disclosures in the financial statements. An audit also includes assessing the accounting principles used and significant estimates made by management, as well as evaluating the overall financial statement presentation. We believe that our audits provide a reasonable basis for our opinion.
In our opinion, such consolidated financial statements present fairly, in all material respects, the financial position of Energy Future Holdings Corp. and subsidiaries (Debtor-in-Possession) as of December 31, 2014 and 2013, and the results of their operations and their cash flows for each of the three years in the period ended December 31, 2014, in conformity with accounting principles generally accepted in the United States of America. Also, in our opinion, such financial statement schedule, when considered in relation to the basic consolidated financial statements taken as a whole, presents fairly, in all material respects, the information set forth therein.
As discussed in Note 2 to the consolidated financial statements, on April 29, 2014, Energy Future Holdings Corp. and the substantial majority of its direct and indirect subsidiaries, excluding Oncor Electric Delivery Holdings Company LLC and its subsidiaries, filed voluntary petitions for relief under Chapter 11 of the United States Bankruptcy Code. The accompanying consolidated financial statements do not purport to reflect or provide for the consequences of the bankruptcy proceedings. In particular, such financial statements do not purport to show (1) as to assets, their realizable value on a liquidation basis or their availability to satisfy liabilities; (2) as to prepetition liabilities, the amounts that may be allowed for claims or contingencies, or the status and priority thereof; (3) as to shareholder accounts, the effect of any changes that may be made in the capitalization of EFH Corp.; or (4) as to operations, the effect of any changes that may be made in its business.
The accompanying consolidated financial statements for the years ended December 31, 2014 and 2013 have been prepared assuming that EFH Corp. will continue as a going concern. As discussed in Note 2 to the consolidated financial statements, EFH Corp.’s ability to continue as a going concern is contingent upon its ability to comply with the financial and other covenants contained in the DIP Facilities described in Note 11, its ability to obtain new debtor in possession financing in the event the DIP Facilities were to expire during the pendency of the Chapter 11 Cases, its ability to complete a Chapter 11 plan of reorganization in a timely manner, including obtaining creditor and Bankruptcy Court approval of such plan as well as applicable regulatory approvals required for such plan, and its ability to obtain any exit financing needed to implement such plan, among other factors. These circumstances and uncertainties inherent in the bankruptcy proceedings raise substantial doubt about EFH Corp.’s ability to continue as a going concern. Management’s plans concerning these matters are also discussed in Note 2 to the consolidated financial statements. The consolidated financial statements do not include adjustments that might result from the outcome of these uncertainties.
We have also audited, in accordance with the standards of the Public Company Accounting Oversight Board (United States), EFH Corp.'s internal control over financial reporting as of December 31, 2014, based on the criteria established in Internal Control - Integrated Framework (2013) issued by the Committee of Sponsoring Organizations of the Treadway Commission and our report dated March 31, 2015 expressed an adverse opinion on EFH Corp.'s internal control over financial reporting because of a material weakness.
/s/ Deloitte & Touche LLP
Dallas, Texas
March 31, 2015
ENERGY FUTURE HOLDINGS CORP. AND SUBSIDIARIES, A DEBTOR-IN-POSSESSION
STATEMENTS OF CONSOLIDATED INCOME (LOSS)
|
| | | | | | | | | | | |
| | Year Ended December 31, |
| | 2014 | | 2013 | | 2012 |
| | (millions of dollars) |
| Operating revenues | $ | 5,978 |
| | $ | 5,899 |
| | $ | 5,636 |
|
| Fuel, purchased power costs and delivery fees | (2,842 | ) | | (2,848 | ) | | (2,816 | ) |
| Net gain (loss) from commodity hedging and trading activities | 11 |
| | (54 | ) | | 389 |
|
| Operating costs | (914 | ) | | (881 | ) | | (888 | ) |
| Depreciation and amortization | (1,283 | ) | | (1,355 | ) | | (1,373 | ) |
| Selling, general and administrative expenses | (716 | ) | | (747 | ) | | (674 | ) |
| Franchise and revenue-based taxes | (78 | ) | | (75 | ) | | (80 | ) |
| Impairment of goodwill (Note 4) | (1,600 | ) | | (1,000 | ) | | (1,200 | ) |
| Impairment of long-lived assets (Note 8) | (4,670 | ) | | (140 | ) | | — |
|
| Other income (Note 7) | 31 |
| | 26 |
| | 30 |
|
| Other deductions (Note 7) | (276 | ) | | (53 | ) | | (380 | ) |
| Interest income | 1 |
| | 1 |
| | 2 |
|
| Interest expense and related charges (Note 9) | (2,201 | ) | | (2,704 | ) | | (3,508 | ) |
| Reorganization items (Note 10) | (815 | ) | | — |
| | — |
|
| Loss before income taxes and equity in earnings of unconsolidated subsidiaries | (9,374 | ) | | (3,931 | ) | | (4,862 | ) |
| Income tax benefit (Note 6) | 2,619 |
| | 1,271 |
| | 1,232 |
|
| Equity in earnings of unconsolidated subsidiaries (net of tax) (Note 3) | 349 |
| | 335 |
| | 270 |
|
| Net loss | (6,406 | ) | | (2,325 | ) | | (3,360 | ) |
| Net loss attributable to noncontrolling interests | — |
| | 107 |
| | — |
|
| Net loss attributable to EFH Corp. | $ | (6,406 | ) | | $ | (2,218 | ) | | $ | (3,360 | ) |
See Notes to the Financial Statements.
STATEMENTS OF CONSOLIDATED COMPREHENSIVE INCOME (LOSS)
|
| | | | | | | | | | | |
| | Year Ended December 31, |
| | 2014 | | 2013 | | 2012 |
| | (millions of dollars) |
| Net loss | $ | (6,406 | ) | | $ | (2,325 | ) | | $ | (3,360 | ) |
| Other comprehensive income (loss), net of tax effects: | | | | | |
| Effects related to pension and other retirement benefit obligations (net of tax benefit (expense) of $12, $5 and $(90)) (Note 17) | (21 | ) | | (8 | ) | | 166 |
|
| Cash flow hedges derivative value net loss related to hedged transactions recognized during the period (net of tax benefit of $1, $3 and $3) | 1 |
| | 6 |
| | 7 |
|
| Net effects related to Oncor (net of tax benefit (expense) of $(25), $(8) and $1) | (47 | ) | | (14 | ) | | 2 |
|
| Total other comprehensive income (loss) | (67 | ) | | (16 | ) | | 175 |
|
| Comprehensive loss | (6,473 | ) | | (2,341 | ) | | (3,185 | ) |
| Comprehensive loss attributable to noncontrolling interests | — |
| | 107 |
| | — |
|
| Comprehensive loss attributable to EFH Corp. | $ | (6,473 | ) | | $ | (2,234 | ) | | $ | (3,185 | ) |
See Notes to the Financial Statements.
ENERGY FUTURE HOLDINGS CORP. AND SUBSIDIARIES, A DEBTOR-IN-POSSESSION STATEMENTS OF CONSOLIDATED CASH FLOWS |
| | | | | | | | | | | |
| | Year Ended December 31, |
| | 2014 | | 2013 | | 2012 |
| | (millions of dollars) |
| Cash flows — operating activities: | | | | | |
| Net loss | $ | (6,406 | ) | | $ | (2,325 | ) | | $ | (3,360 | ) |
| Adjustments to reconcile net loss to cash provided by (used in) operating activities: | | | | | |
| Depreciation and amortization | 1,453 |
| | 1,521 |
| | 1,552 |
|
| Deferred income tax benefit, net | (2,539 | ) | | (992 | ) | | (1,252 | ) |
| Income tax benefit due to IRS audit resolutions (Note 5) | 7 |
| | (305 | ) | | — |
|
| Impairment of goodwill (Note 4) | 1,600 |
| | 1,000 |
| | 1,200 |
|
| Impairment of long-lived assets and nuclear generation development joint venture (Note 8) | 4,670 |
| | 140 |
| | — |
|
| Unrealized net loss from mark-to-market valuations of commodity positions | 370 |
| | 1,091 |
| | 1,526 |
|
| Unrealized net gain from mark-to-market valuations of interest rate swaps (Note 9) | (1,303 | ) | | (1,058 | ) | | (172 | ) |
| Liability adjustment arising from termination of interest rate swaps (Note 16) | 278 |
| | — |
| | — |
|
| Noncash loss on termination of interest rate swaps (Note 9) | 1,237 |
| | — |
| | — |
|
| Noncash gain on termination of natural gas hedging positions (Note 16) | (117 | ) | | — |
| | — |
|
| Fees paid for DIP Facilities (Note 11) (reported as financing activities) | 187 |
| | — |
| | — |
|
| Loss on exchange and settlement of EFIH First Lien Notes (Note 11) | 108 |
| | — |
| | — |
|
| Interest expense on toggle notes payable in additional principal (Note 9) | 65 |
| | 176 |
| | 209 |
|
| Amortization of debt related costs, discounts, fair value discounts and losses on dedesignated cash flow hedges (Note 9) | 72 |
| | 235 |
| | 238 |
|
| Equity in earnings of unconsolidated subsidiaries | (349 | ) | | (335 | ) | | (270 | ) |
| Distributions of earnings from unconsolidated subsidiaries | 202 |
| | 213 |
| | 147 |
|
| Charges related to pension plan actions (Note 17) | — |
| | — |
| | 285 |
|
| Impairment of intangible assets (Note 7) | 263 |
| | — |
| | — |
|
| Other asset impairments (Note 7) | — |
| | 37 |
| | 71 |
|
| Bad debt expense (Note 21) | 38 |
| | 33 |
| | 26 |
|
| Accretion expense related primarily to mining reclamation obligations (Note 21) | 25 |
| | 33 |
| | 37 |
|
| Other, net | — |
| | 16 |
| | 15 |
|
| Changes in operating assets and liabilities: | | | | | |
| Accounts receivable — trade | 63 |
| | (33 | ) | | 21 |
|
| Inventories | (67 | ) | | (6 | ) | | 19 |
|
| Accounts payable — trade | 108 |
| | 11 |
| | (142 | ) |
| Payables due to unconsolidated subsidiary | 109 |
| | 109 |
| | (118 | ) |
| Commodity and other derivative contractual assets and liabilities | (25 | ) | | 49 |
| | 9 |
|
| Margin deposits, net | (192 | ) | | (320 | ) | | (476 | ) |
| Accrued interest | 519 |
| | (8 | ) | | 132 |
|
| Other — net assets | (43 | ) | | 131 |
| | (61 | ) |
| Other — net liabilities | 71 |
| | 84 |
| | (454 | ) |
| Cash provided by (used in) operating activities | $ | 404 |
| | $ | (503 | ) | | $ | (818 | ) |
ENERGY FUTURE HOLDINGS CORP. AND SUBSIDIARIES, A DEBTOR-IN-POSSESSION STATEMENTS OF CONSOLIDATED CASH FLOWS
|
| | | | | | | | | | | |
| | Year Ended December 31, |
| | 2014 | | 2013 | | 2012 |
| | (millions of dollars) |
| Cash flows — financing activities: | | | | | |
| Proceeds from DIP Facilities before fees paid (Note 11) | $ | 4,989 |
| | $ | — |
| | $ | — |
|
| Fees paid for DIP Facilities (Note 10) | (187 | ) | | — |
| | — |
|
| Issuances of long-term debt | — |
| | — |
| | 2,253 |
|
| Repayments/repurchases of debt (Notes 11 and 12) | (2,546 | ) | | (105 | ) | | (41 | ) |
| Net repayments under accounts receivable securitization program (Note 21) | — |
| | (82 | ) | | (22 | ) |
| Increase in other borrowings | — |
| | — |
| | 1,384 |
|
| Decrease in note payable to unconsolidated subsidiary (Note 19) | — |
| | — |
| | (20 | ) |
| Settlement of agreements with unconsolidated affiliate (Note 19) | — |
| | — |
| | (159 | ) |
| Other, net | 1 |
| | (9 | ) | | (22 | ) |
| Cash provided by (used in) financing activities | 2,257 |
| | (196 | ) | | 3,373 |
|
| Cash flows — investing activities: | | | | | |
| Capital expenditures | (386 | ) | | (501 | ) | | (664 | ) |
| Nuclear fuel purchases | (77 | ) | | (116 | ) | | (213 | ) |
| Acquisition of combustion turbine trust interest (Note 12) | — |
| | (40 | ) | | — |
|
| Restricted cash investment used to settle TCEH Demand Notes (Note 19) | — |
| | 680 |
| | (680 | ) |
| Other changes in restricted cash | 42 |
| | (2 | ) | | 129 |
|
| Proceeds from sales of nuclear decommissioning trust fund securities | 314 |
| | 175 |
| | 106 |
|
| Investments in nuclear decommissioning trust fund securities | (331 | ) | | (191 | ) | | (122 | ) |
| Other, net | (12 | ) | | (2 | ) | | (24 | ) |
| Cash provided by (used in) investing activities | (450 | ) | | 3 |
| | (1,468 | ) |
| | | | | | |
| Net change in cash and cash equivalents | 2,211 |
| | (696 | ) | | 1,087 |
|
| Cash and cash equivalents — beginning balance | 1,217 |
| | 1,913 |
| | 826 |
|
| Cash and cash equivalents — ending balance | $ | 3,428 |
| | $ | 1,217 |
| | $ | 1,913 |
|
See Notes to the Financial Statements.
ENERGY FUTURE HOLDINGS CORP. AND SUBSIDIARIES, A DEBTOR-IN-POSSESSION CONSOLIDATED BALANCE SHEETS |
| | | | | | | |
| | December 31, |
| | 2014 | | 2013 |
| | (millions of dollars) |
| ASSETS | | | |
| Current assets: | | | |
| Cash and cash equivalents | $ | 3,428 |
| | $ | 1,217 |
|
| Restricted cash (Note 21) | 6 |
| | 949 |
|
| Trade accounts receivable — net (Note 21) | 589 |
| | 718 |
|
| Inventories (Note 21) | 468 |
| | 399 |
|
| Commodity and other derivative contractual assets (Note 16) | 492 |
| | 851 |
|
| Accumulated deferred income taxes | — |
| | 105 |
|
| Margin deposits related to commodity positions | 9 |
| | 93 |
|
| Other current assets | 91 |
| | 135 |
|
| Total current assets | 5,083 |
| | 4,467 |
|
| Restricted cash (Note 21) | 901 |
| | — |
|
| Receivable from unconsolidated subsidiary (Note 19) | 47 |
| | 838 |
|
| Investment in unconsolidated subsidiary (Note 3) | 6,058 |
| | 5,959 |
|
| Other investments (Note 21) | 995 |
| | 891 |
|
| Property, plant and equipment — net (Note 21) | 12,397 |
| | 17,791 |
|
| Goodwill (Note 4) | 2,352 |
| | 3,952 |
|
| Identifiable intangible assets — net (Note 4) | 1,315 |
| | 1,679 |
|
| Commodity and other derivative contractual assets (Note 16) | 5 |
| | 4 |
|
| Other noncurrent assets | 95 |
| | 865 |
|
| Total assets | $ | 29,248 |
| | $ | 36,446 |
|
| LIABILITIES AND EQUITY | | | |
| Current liabilities: | | | |
| Notes, loans and other debt, including $2,054 of borrowings under revolving credit facility (Note 12) | $ | — |
| | $ | 40,252 |
|
| Trade accounts payable | 406 |
| | 401 |
|
| Net payables due to unconsolidated subsidiary (Note 19) | 237 |
| | 128 |
|
| Commodity and other derivative contractual liabilities (Note 16) | 316 |
| | 1,355 |
|
| Margin deposits related to commodity positions | 26 |
| | 302 |
|
| Accumulated deferred income taxes (Note 6) | 135 |
| | — |
|
| Accrued taxes | 157 |
| | 178 |
|
| Accrued interest (Notes 9 and 12) | 119 |
| | 564 |
|
| Other current liabilities (a) | 399 |
| | 326 |
|
| Total current liabilities | 1,795 |
| | 43,506 |
|
| Borrowings under debtor-in-possession credit facilities (Note 11) | 6,825 |
| | — |
|
| Long-term debt, less amounts due currently (Note 11) (b) | 128 |
| | — |
|
| Liabilities subject to compromise (Note 12) | 37,432 |
| | — |
|
| Commodity and other derivative contractual liabilities (Note 16) | 1 |
| | — |
|
| Accumulated deferred income taxes (Note 6) | 713 |
| | 3,433 |
|
| Other noncurrent liabilities and deferred credits (Note 21) | 2,077 |
| | 2,762 |
|
| Total liabilities | 48,971 |
| | 49,701 |
|
| Commitments and Contingencies (Note 13) |
|
| |
|
|
ENERGY FUTURE HOLDINGS CORP. AND SUBSIDIARIES, A DEBTOR-IN-POSSESSION CONSOLIDATED BALANCE SHEETS |
| | | | | | | |
| | December 31, |
| | 2014 | | 2013 |
| | (millions of dollars) |
| Equity (Note 14): | | | |
| Common stock (shares outstanding 2014 — 1,669,861,379; 2013 — 1,669,861,383) | 2 |
| | 2 |
|
| Additional paid-in capital | 7,968 |
| | 7,962 |
|
| Retained deficit | (27,563 | ) | | (21,157 | ) |
| Accumulated other comprehensive loss | (130 | ) | | (63 | ) |
| EFH Corp. shareholders' equity | (19,723 | ) | | (13,256 | ) |
| Noncontrolling interests in subsidiaries | — |
| | 1 |
|
| Total equity | (19,723 | ) | | (13,255 | ) |
| Total liabilities and equity | $ | 29,248 |
| | $ | 36,446 |
|
_______________
| |
| (a) | Balance at December 31, 2014 includes $39 million of current portion of debt described in (b) below. |
| |
| (b) | Represents pre-petition liabilities that are not subject to compromise and consists of a non-Debtor $36 million principal amount of debt related to a building financing (plus $7 million of unamortized fair value premium), $37 million principal amount of debt approved by the Bankruptcy Court for repayment (less $3 million of unamortized fair value discount), $13 million principal amount of debt issued by a trust and secured by assets held by the trust (less $2 million of unamortized discount), $39 million of capitalized lease obligations and $1 million principal amount of debt related to a coal purchase agreement. |
See Notes to the Financial Statements.
ENERGY FUTURE HOLDINGS CORP. AND SUBSIDIARIES, A DEBTOR-IN-POSSESSION
STATEMENTS OF CONSOLIDATED EQUITY
|
| | | | | | | | | | | |
| | Year Ended December 31, |
| | 2014 | | 2013 | | 2012 |
| | (millions of dollars) |
| Common stock stated value of $0.001 effective May 2009 (number of authorized shares — 2,000,000,000): | | | | | |
| Balance at beginning of period | $ | 2 |
| | $ | 2 |
| | $ | 2 |
|
| Balance at end of period (number of shares outstanding: 2014 — 1,669,861,379; 2013 — 1,669,861,383; 2012 — 1,680,539,245) | 2 |
| | 2 |
| | 2 |
|
| Additional paid-in capital: | | | | | |
| Balance at beginning of period | 7,962 |
| | 7,959 |
| | 7,947 |
|
| Effects of stock-based incentive compensation plans | 6 |
| | 7 |
| | 12 |
|
| Common stock repurchases | — |
| | (5 | ) | | — |
|
| Other | — |
| | 1 |
| | — |
|
| Balance at end of period | 7,968 |
| | 7,962 |
| | 7,959 |
|
| Retained earnings (deficit): | | | | | |
| Balance at beginning of period | (21,157 | ) | | (18,939 | ) | | (15,579 | ) |
| Net loss attributable to EFH Corp. | (6,406 | ) | | (2,218 | ) | | (3,360 | ) |
| Balance at end of period | (27,563 | ) | | (21,157 | ) | | (18,939 | ) |
| Accumulated other comprehensive loss, net of tax effects: | | | | | |
| Pension and other postretirement employee benefit liability adjustments: | | | | | |
| Balance at beginning of period | (7 | ) | | 17 |
| | (149 | ) |
| Change in unrecognized (gains) losses related to pension and OPEB plans | (70 | ) | | (24 | ) | | 166 |
|
| Balance at end of period | (77 | ) | | (7 | ) | | 17 |
|
| Amounts related to dedesignated cash flow hedges: | | | | | |
| Balance at beginning of period | (56 | ) | | (64 | ) | | (73 | ) |
| Change during the period | 3 |
| | 8 |
| | 9 |
|
| Balance at end of period | (53 | ) | | (56 | ) | | (64 | ) |
| Total accumulated other comprehensive loss at end of period | (130 | ) | | (63 | ) | | (47 | ) |
| EFH Corp. shareholders' equity at end of period (Note 14) | (19,723 | ) | | (13,256 | ) | | (11,025 | ) |
| Noncontrolling interests in subsidiaries (Note 14): | | | | | |
| Balance at beginning of period | 1 |
| | 102 |
| | 95 |
|
| Net loss attributable to noncontrolling interests | — |
| | (107 | ) | | — |
|
| Investments by noncontrolling interests | 1 |
| | 6 |
| | 7 |
|
| Other | (2 | ) | | — |
| | — |
|
| Noncontrolling interests in subsidiaries at end of period | — |
| | 1 |
| | 102 |
|
| Total equity at end of period | $ | (19,723 | ) | | $ | (13,255 | ) | | $ | (10,923 | ) |
See Notes to the Financial Statements.
ENERGY FUTURE HOLDINGS CORP. AND SUBSIDIARIES, A DEBTOR-IN-POSSESSION
NOTES TO CONSOLIDATED FINANCIAL STATEMENTS
| |
| 1. | BUSINESS AND SIGNIFICANT ACCOUNTING POLICIES |
Description of Business
References in this report to "we," "our," "us" and "the company" are to EFH Corp. and/or its subsidiaries, as apparent in the context. See Glossary for defined terms.
EFH Corp., a Texas corporation, is a Dallas-based holding company that conducts its operations principally through its TCEH and Oncor subsidiaries. EFH Corp. is a subsidiary of Texas Holdings, which is controlled by the Sponsor Group. TCEH is a holding company for subsidiaries engaged in competitive electricity market activities largely in Texas, including electricity generation, wholesale energy sales and purchases, commodity risk management and trading activities, and retail electricity operations. TCEH is a wholly owned subsidiary of EFCH, which is a holding company and a wholly owned subsidiary of EFH Corp. Oncor is engaged in regulated electricity transmission and distribution operations in Texas. Oncor provides distribution services to REPs, including subsidiaries of TCEH, which sell electricity to residential, business and other consumers. Oncor Holdings, a holding company that holds an approximate 80% equity interest in Oncor, is a wholly owned subsidiary of EFIH, which is a holding company and a wholly owned subsidiary of EFH Corp. Oncor Holdings and its subsidiaries (the Oncor Ring-Fenced Entities) are not consolidated in EFH Corp.'s financial statements in accordance with consolidation accounting standards related to variable interest entities (VIEs) (see Note 3).
Various ring-fencing measures have been taken to enhance the credit quality of Oncor. Such measures include, among other things: the sale in November 2008 of a 19.75% equity interest in Oncor to Texas Transmission; maintenance of separate books and records for the Oncor Ring-Fenced Entities; Oncor's board of directors being comprised of a majority of independent directors, and prohibitions on the Oncor Ring-Fenced Entities providing credit support to, or receiving credit support from, any member of the Texas Holdings Group. The assets and liabilities of the Oncor Ring-Fenced Entities are separate and distinct from those of the Texas Holdings Group, and none of the assets of the Oncor Ring-Fenced Entities are available to satisfy the debt or contractual obligations of any member of the Texas Holdings Group. Moreover, Oncor's operations are conducted, and its cash flows managed, independently from the Texas Holdings Group.
Consistent with the ring-fencing measures discussed above, the assets and liabilities of the Oncor Ring-Fenced Entities have not been, and are not expected to be, substantively consolidated with the assets and liabilities of the Debtors in the Chapter 11 Cases.
We have two reportable segments: the Competitive Electric segment, consisting largely of TCEH, and the Regulated Delivery segment, consisting largely of our investment in Oncor. See Note 20 for further information concerning reportable business segments.
Bankruptcy Filing
As discussed further in Note 2, on April 29, 2014 (the Petition Date), EFH Corp. and the substantial majority of its direct and indirect subsidiaries, including EFIH, EFCH and TCEH but excluding the Oncor Ring-Fenced Entities, (collectively, the Debtors), filed voluntary petitions for relief (the Bankruptcy Filing) under Chapter 11 of the United States Bankruptcy Code (the Bankruptcy Code) in the United States Bankruptcy Court for the District of Delaware (the Bankruptcy Court). See Note 11 for discussion of the DIP Facilities.
Basis of Presentation, Including Application of Bankruptcy Accounting
The consolidated financial statements have been prepared in accordance with US GAAP. The consolidated financial statements have been prepared as if EFH Corp. is a going concern and contemplate the realization of assets and liabilities in the normal course of business. The consolidated financial statements reflect the application of Financial Accounting Standards Board Accounting Standards Codification (ASC) 852, Reorganizations. During the pendency of the Bankruptcy Filing, the Debtors will operate their businesses as debtors-in-possession under the jurisdiction of the Bankruptcy Court and in accordance with the applicable provisions of the Bankruptcy Code. ASC 852 applies to entities that have filed a petition for bankruptcy under Chapter 11 of the Bankruptcy Code. The guidance requires that transactions and events directly associated with the reorganization be distinguished from the ongoing operations of the business. In addition, the guidance provides for changes in the accounting and presentation of liabilities. See Notes 10 and 12 for discussion of these accounting and reporting changes.
Investments in unconsolidated subsidiaries, which are 50% or less owned and/or do not meet accounting standards criteria for consolidation, are accounted for under the equity method (see Note 3). All intercompany items and transactions have been eliminated in consolidation. All dollar amounts in the financial statements and tables in the notes are stated in millions of US dollars unless otherwise indicated.
Use of Estimates
Preparation of financial statements requires estimates and assumptions about future events that affect the reporting of assets and liabilities at the balance sheet dates and the reported amounts of revenue and expense, including fair value measurements and estimates of expected allowed claims. In the event estimates and/or assumptions prove to be different from actual amounts, adjustments are made in subsequent periods to reflect more current information.
Derivative Instruments and Mark-to-Market Accounting
We enter into contracts for the purchase and sale of electricity, natural gas, coal, uranium and other commodities and also enter into other derivative instruments such as options, swaps, futures and forwards primarily to manage our commodity price and interest rate risks. If the instrument meets the definition of a derivative under accounting standards related to derivative instruments and hedging activities, changes in the fair value of the derivative are recognized in net income as unrealized gains and losses, unless the criteria for certain exceptions are met, and an offsetting derivative asset or liability is recorded in the consolidated balance sheets. This recognition is referred to as mark-to-market accounting. The fair values of our unsettled derivative instruments under mark-to-market accounting are reported in the consolidated balance sheets as commodity and other derivative contractual assets or liabilities. We report derivative assets and liabilities in the consolidated balance sheets without taking into consideration netting arrangements we have with counterparties. Margin deposits that contractually offset these assets and liabilities are reported separately in the consolidated balance sheets. When derivative instruments are settled and realized gains and losses are recorded, the previously recorded unrealized gains and losses and derivative assets and liabilities are reversed. See Notes 15 and 16 for additional information regarding fair value measurement and commodity and other derivative contractual assets and liabilities. Under the election criteria of accounting standards related to derivative instruments and hedging activities, we may elect the normal purchase and sale exemption. A commodity-related derivative contract may be designated as a normal purchase or sale if the commodity is to be physically received or delivered for use or sale in the normal course of business. If designated as normal, the derivative contract is accounted for under the accrual method of accounting (not marked-to-market) with no balance sheet or income statement recognition of the contract until settlement.
Because derivative instruments are frequently used as economic hedges, accounting standards related to derivative instruments and hedging activities allow for hedge accounting, which provides for the designation of such instruments as cash flow or fair value hedges if certain conditions are met. A cash flow hedge mitigates the risk associated with the variability of the future cash flows related to an asset or liability (e.g., a forecasted sale of electricity in the future at market prices or the payment of interest related to variable rate debt), while a fair value hedge mitigates risk associated with fixed future cash flows (e.g., debt with fixed interest rate payments). In accounting for changes in the fair value of cash flow hedges, derivative assets and liabilities are recorded on the consolidated balance sheets with an offset to other comprehensive income to the extent the hedges are effective and the hedged transaction remains probable of occurring. If the hedged transaction becomes probable of not occurring, hedge accounting is discontinued and the amount recorded in other comprehensive income is immediately reclassified into net income. If the relationship between the hedge and the hedged transaction ceases to exist or is dedesignated, hedge accounting is discontinued, and the amounts recorded in other comprehensive income are reclassified to net income as the previously hedged transaction impacts net income. Changes in value of fair value hedges are recorded as derivative assets or liabilities with an offset to net income, and the carrying value of the related asset or liability (hedged item) is adjusted for changes in fair value with an offset to net income. If the fair value hedge is settled prior to the maturity of the hedged item, the cumulative fair value gain or loss associated with the hedge is amortized into income over the remaining life of the hedged item. In the statement of cash flow, the effects of settlements of derivative instruments are classified consistent with the related hedged transactions.
To qualify for hedge accounting, a hedge must be considered highly effective in offsetting changes in fair value of the hedged item. Assessment of the hedge's effectiveness is tested at least quarterly throughout its term to continue to qualify for hedge accounting. Changes in fair value that represent hedge ineffectiveness, even if the hedge continues to be assessed as effective, are immediately recognized in net income. Ineffectiveness is generally measured as the cumulative excess, if any, of the change in value of the hedging instrument over the change in value of the hedged item.
At December 31, 2014 and 2013, there were no derivative positions accounted for as cash flow or fair value hedges. Accumulated other comprehensive income includes amounts related to interest rate swaps previously designated as cash flow hedges that are being reclassified to net income as the hedged transactions impact net income (see Note 16).
Realized and unrealized gains and losses from transacting in energy-related derivative instruments are primarily reported in the statements of consolidated income (loss) in net gain (loss) from commodity hedging and trading activities. In accordance with accounting rules, upon settlement of physical derivative sales and purchase contracts that are marked-to-market in net income, related wholesale electricity revenues and fuel and purchased power costs are reported at approximated market prices, instead of the contract price. As a result, this noncash difference between market and contract prices is included in the operating revenues and fuel and purchased power costs and delivery fees line items of the statements of consolidated income (loss), with offsetting amounts included in net gain (loss) from commodity hedging and trading activities.
Revenue Recognition
We record revenue from electricity sales and delivery service under the accrual method of accounting. Revenues are recognized when electricity or delivery services are provided to customers on the basis of periodic cycle meter readings and include an estimated accrual for the revenues earned from the meter reading date to the end of the period (unbilled revenue).
We report physically delivered commodity sales and purchases in the statements of consolidated income (loss) on a gross basis in revenues and fuel, purchased power and delivery fees, respectively, and we report all other commodity related contracts and financial instruments (primarily derivatives) in the statements of consolidated income (loss) on a net basis in net gain (loss) from commodity hedging and trading activities. Volumes under bilateral purchase and sales contracts, including contracts intended as hedges, are not scheduled as physical power with ERCOT. Accordingly, unless the volumes represent physical deliveries to customers or purchases from counterparties, such contracts are reported net in the statements of consolidated income (loss) in net gain (loss) from commodity hedging and trading activities instead of reported gross as wholesale revenues or purchased power costs. If volumes delivered to our retail and wholesale customers are less than our generation volumes (as determined on a daily settlement basis), we record additional wholesale revenues, and if volumes delivered to our retail and wholesale customers exceed our generation volumes, we record additional purchased power costs. The additional wholesale revenues or purchased power costs are offset in net gain (loss) from commodity hedging and trading activities.
Impairment of Long-Lived Assets
We evaluate long-lived assets (including intangible assets with finite lives) for impairment whenever indications of impairment exist. The carrying value of such assets is deemed to be impaired if the projected undiscounted cash flows are less than the carrying value. If there is such impairment, a loss would be recognized based on the amount by which the carrying value exceeds the fair value. Fair value is determined primarily by discounted cash flows, supported by available market valuations, if applicable. See Note 8 for discussion of the 2014 impairment of certain long-lived assets and Note 4 for discussion of impairment in 2014 of certain intangible assets. See Note 8 for discussion of the 2013 impairment of assets of our joint venture to develop additional nuclear units and Note 4 for discussion of impairments of intangible assets and mining-related assets in 2012.
We evaluate investments in unconsolidated subsidiaries for impairment when factors indicate that a decrease in the value of the investment has occurred that is not temporary. Indicators that should be evaluated for possible impairment of investments include recurring operating losses of the investee or fair value measures that are less than carrying value. Any impairment recognition is based on fair value that is not reflective of temporary conditions. Fair value is determined primarily by discounted cash flows, supported by available market valuations, if applicable.
Finite-lived intangibles identified as a result of purchase accounting are amortized over their estimated useful lives based on the expected realization of economic effects. See Note 4 for additional information.
Goodwill and Intangible Assets with Indefinite Lives
We evaluate goodwill and intangible assets with indefinite lives for impairment at least annually (at December 1), or when indications of impairment exist. See Note 4 for details of goodwill and intangible assets with indefinite lives, including discussion of fair value determinations and goodwill impairments recorded in 2014, 2013 and 2012.
Amortization of Nuclear Fuel
Amortization of nuclear fuel is calculated on the units-of-production method and is reported as fuel costs.
Major Maintenance
Major maintenance costs incurred during generation plant outages and the costs of other maintenance activities are charged to expense as incurred and reported as operating costs.
Defined Benefit Pension Plans and OPEB Plans
We offer certain health care and life insurance benefits to eligible employees and their eligible dependents upon the retirement of such employees from the company and also offer pension benefits to eligible employees under collective bargaining agreements based on either a traditional defined benefit formula or a cash balance formula. Costs of pension and OPEB plans are dependent upon numerous factors, assumptions and estimates. See Notes 17 and 19 for additional information regarding pension and OPEB plans, including a discussion of amendments to and separation of the EFH Corp. pension plan approved in 2012 and the separation of the EFH Corp. and Oncor OPEB plans effective July 1, 2014.
Stock-Based Incentive Compensation
Our 2007 Stock Incentive Plan authorizes discretionary grants to directors, officers and qualified managerial employees of EFH Corp. or its affiliates of non-qualified stock options, stock appreciation rights, restricted shares, shares of common stock, the opportunity to purchase shares of common stock and other stock-based awards. Stock-based compensation expense is recognized over the vesting period based on the grant-date fair value of those awards. See Note 18 for information regarding stock-based incentive compensation.
Sales and Excise Taxes
Sales and excise taxes are accounted for as a "pass through" item on the consolidated balance sheets with no effect on the statements of consolidated income (loss); i.e., the tax is billed to customers and recorded as trade accounts receivable with an offsetting amount recorded as a liability to the taxing jurisdiction.
Franchise and Revenue-Based Taxes
Unlike sales and excise taxes, franchise and gross receipt taxes are not a "pass through" item. These taxes are assessed to us by state and local government bodies, based on revenues or kWh delivered, as a cost of doing business and are recorded as an expense. Rates we charge to customers are intended to recover our costs, including the franchise and gross receipt taxes, but we are not acting as an agent to collect the taxes from customers.
Income Taxes
EFH Corp. files a consolidated US federal income tax return that includes the results of EFCH, EFIH, Oncor Holdings and TCEH. Oncor is a partnership for US federal income tax purposes and is not a corporate member of the EFH Corp. consolidated group. Deferred income taxes are provided for temporary differences between the book and tax basis of assets and liabilities as required under accounting rules. See Note 6.
We report interest and penalties related to uncertain tax positions as current income tax expense. See Note 5.
Accounting for Contingencies
Our financial results may be affected by judgments and estimates related to loss contingencies. Accruals for loss contingencies are recorded when management determines that it is probable that an asset has been impaired or a liability has been incurred and that such economic loss can be reasonably estimated. Such determinations are subject to interpretations of current facts and circumstances, forecasts of future events and estimates of the financial impacts of such events. See Note 13 for a discussion of contingencies.
Restricted Cash
The terms of certain agreements require the restriction of cash for specific purposes. At December 31, 2014, $901 million of cash was restricted to support letters of credit. See Notes 11, 12 and 21 for more details regarding restricted cash.
Property, Plant and Equipment
As a result of purchase accounting, carrying amounts of property, plant and equipment related to competitive businesses were adjusted to estimated fair values at the Merger date. Subsequent additions have been recorded at cost. The cost of self-constructed property additions includes materials and both direct and indirect labor and applicable overhead, including payroll-related costs. Interest related to qualifying construction projects and qualifying software projects is capitalized in accordance with accounting guidance related to capitalization of interest cost. See Note 9.
Depreciation of our property, plant and equipment is calculated on a straight-line basis over the estimated service lives of the properties. Depreciation expense is calculated on a component asset-by-asset basis. Estimated depreciable lives are based on management's estimates of the assets' economic useful lives. See Note 21.
Asset Retirement Obligations
A liability is initially recorded at fair value for an asset retirement obligation associated with the retirement of tangible long-lived assets in the period in which it is incurred if a fair value is reasonably estimable. These liabilities primarily relate to nuclear generation plant decommissioning, land reclamation related to lignite mining, removal of lignite/coal fueled plant ash treatment facilities and generation plant asbestos removal and disposal costs. Over time, the liability is accreted for the change in present value and the initial capitalized costs are depreciated over the remaining useful lives of the assets. See Note 21.
Inventories
Inventories are reported at the lower of cost (on a weighted average basis) or market unless expected to be used in the generation of electricity. Also see discussion immediately below regarding environmental allowances and credits.
Environmental Allowances and Credits
We account for all environmental allowances and credits as identifiable intangible assets with finite lives that are subject to amortization. The recorded values of these intangible assets were originally established reflecting fair value determinations as of the date of the Merger under purchase accounting. Amortization expense associated with these intangible assets is recognized on a unit of production basis as the allowances or credits are consumed in generation operations. The environmental allowances and credits are assessed for impairment when conditions or events occur that could affect the carrying value of the assets and are evaluated with the generation units to the extent they are planned to be consumed in generation operations. See Note 4 for discussion of the impairment of emission allowances recorded in 2014.
Investments
Investments in a nuclear decommissioning trust fund are carried at current market value in the consolidated balance sheets. Assets related to employee benefit plans represent investments held to satisfy deferred compensation liabilities and are recorded at current market value. See Note 21 for discussion of these and other investments.
Noncontrolling Interests
See Notes 8 and 14 for discussion of accounting for noncontrolling interests in subsidiaries.
Changes in Accounting Standards
In April 2014 the FASB issued ASU No. 2014-08, Presentation of Financial Statements (Topic 205) and Property Plant, and Equipment (Topic 360): Reporting Discontinued Operations and Disclosures of Disposals of Components of an Entity, which changes the requirements for reporting discontinued operations. The ASU states that a disposal of a component of an entity or a group of components of an entity is required to be reported in discontinued operations if the disposal represents a strategic shift that has or will have a major effect on an entity's operations and financial results when the component of an entity or group of components of an entity meets the criteria to be classified as held for sale, is disposed of by sale, or is disposed of other than by sale. The amendments in this ASU also require additional disclosures about discontinued operations. ASU 2014-08 is effective for the Company for the first quarter 2015. This new requirement is relevant to our presentation of the equity method investment in Oncor, which has been proposed for sale within the Chapter 11 Cases. The new guidance will eliminate a scope exception currently applicable to equity method investments, resulting in the requirement of further analysis of the presentation of the Oncor equity method investment within the consolidated financial statements in 2015. We do not currently expect ASU 2014-08 to materially affect our results of operations, financial position, or cash flows, until a plan of sale of the Oncor investment is approved by the Bankruptcy Court, at which time presentation as a discontinued operations may be appropriate.
In May 2014, the FASB and IASB issued Accounting Standards Update No. 2014-09 (ASU 2014-09), Revenue from Contracts with Customers. The ASU is effective for annual reporting periods (including interim reporting periods within those periods) beginning after December 15, 2016 for public entities. Early application is not permitted. The amendments in ASU 2014-09 create a new Accounting Standards Codification (ASC) Topic 606, Revenue from Contracts with Customers, which supersedes revenue recognition requirements in ASC 605, Revenue Recognition. ASU 2014-09 requires that an entity recognize revenues as performance obligations embedded in sales agreements with customers are satisfied by the entity. The rule is intended to eliminate inconsistencies in revenue recognition and thereby improve comparability across entities, industries and capital markets. We are in the process of assessing the effects of the application of the new guidance on our financial statements.
In August 2014, the FASB issued Accounting Standards Update No. 2014-15 (ASU 2014-15), Presentation of Financial Statements – Going Concern. ASU 2014-15 is effective for annual reporting periods (including interim periods within those periods) ending after December 15, 2016. Early application is permitted. The amendments in ASU 2014-15 create a new ASC Sub-topic 205-40, Presentation of Financial Statements – Going Concern and requires management to assess for each annual and interim reporting period if conditions exist that raise substantial doubt about an entity's ability to continue as a going concern. The rule requires various disclosures depending on the facts and circumstances surrounding an entity's ability to continue as a going concern. We are in the process of assessing the effects of the application of the new guidance on our financial statement disclosures.
On the Petition Date, EFH Corp. and the substantial majority of its direct and indirect subsidiaries, including EFIH, EFCH and TCEH but excluding the Oncor Ring-Fenced Entities, filed voluntary petitions for relief under Chapter 11 of the United States Bankruptcy Code in the United States Bankruptcy Court for the District of Delaware. During the pendency of the Bankruptcy Filing (the Chapter 11 Cases), the Debtors will operate their businesses as "debtors-in-possession" under the jurisdiction of the Bankruptcy Court and in accordance with the applicable provisions of the Bankruptcy Code.
The Bankruptcy Filing resulted primarily from the adverse effects on EFH Corp.'s competitive businesses of lower wholesale electricity prices in ERCOT driven by the sustained decline in natural gas prices since mid-2008. Further, the natural gas hedges that TCEH entered into when forward market prices of natural gas were significantly higher than current prices had largely matured before the remaining positions were terminated shortly after the Bankruptcy Filing (see Note 16). These market conditions challenged the profitability and operating cash flows of EFH Corp.'s competitive businesses and resulted in the inability to support their significant interest payments and debt maturities, including the remaining debt obligations due in 2014, and the inability to refinance and/or extend the maturities of their outstanding debt.
After a series of discussions with certain creditors that began in 2013 and in anticipation of the Bankruptcy Filing, on April 29, 2014, the Debtors entered into a Restructuring Support and Lock-Up Agreement (RSA) with various stakeholders (Consenting Parties) in order to effect an agreed upon restructuring of the Debtors through a pre-arranged Chapter 11 plan of reorganization.
Upon receiving competing bids for the sale of EFH Corp.'s indirect economic ownership interest in Oncor, which offered new alternatives to maximize the value of the Debtors' estates, the Debtors terminated the RSA effective July 31, 2014.
In cooperation with various stakeholders, the Debtors are focused on formulating and implementing an effective and efficient plan of reorganization for each of the Debtors under Chapter 11 of the Bankruptcy Code that maximizes enterprise value. The Debtors currently have the exclusive right to file a Chapter 11 plan of reorganization until June 23, 2015 and the exclusive right to solicit the appropriate votes for any such plan it files prior to such date until August 23, 2015 (i.e. the exclusivity period). Upon expiration of this exclusivity period (unless extended by the Bankruptcy Court), any creditor or stakeholder has the ability to file one or more Chapter 11 plans of reorganization.
Proposed Sale of EFH Corp.’s Indirect Economic Ownership Interest in Oncor
In September 2014, with input and support from several key stakeholders, the Debtors filed a motion with the Bankruptcy Court seeking the entry of an order approving bidding procedures with respect to the potential sale of EFH Corp.'s indirect economic ownership interest in Oncor. During October 2014, the bankruptcy court held hearings regarding the motion. In November 2014, the Bankruptcy Court conditionally approved the motion. In January 2015, the Bankruptcy Court approved the Debtors' bidding procedures motion that sets forth the process by which the Debtors are authorized to solicit proposals (i.e. bids) from third parties to acquire (in any form and employing any structure, whether taxable (in whole or in part) or tax-free) EFH Corp.'s indirect economic ownership interest in Oncor in accordance with the Bankruptcy Code. These bidding procedures contemplate that the Debtors select a stalking horse bid after a two-stage closed bidding process, and, after approval by the Bankruptcy Court of such stalking horse bid, the Debtors conduct a round of open bidding culminating in an auction intended to obtain a higher or otherwise best bid for a transaction. Initial bids were received in early March 2015, and each of the Debtors is currently assessing those submissions. We cannot predict the outcome of this process, including whether we will receive any acceptable bid, whether the Bankruptcy Court will approve any such bid or whether any such transaction will (or when it will) ultimately close because any such transaction would be the subject of customary closing conditions, including receipt of all applicable regulatory approvals.
Tax Matters
In June 2014, EFH Corp. filed a request with the IRS for a private letter ruling (Private Letter Ruling) that, among other things, will provide (a) that (i) the transfer by TCEH of all of its assets and its ordinary course operating liabilities to reorganized TCEH completed through a tax-free spin (in accordance with the Private Letter Ruling) in connection with TCEH's emergence from bankruptcy (Reorganized TCEH), (ii) the transfer by the Debtors to Reorganized TCEH of certain assets and liabilities that are reasonably necessary to the operation of Reorganized TCEH and (iii) the distribution by TCEH of (A) the equity it holds in Reorganized TCEH and (B) the cash proceeds TCEH receives from Reorganized TCEH to the holders of TCEH first lien claims, will qualify as a reorganization within the meaning of Sections 368(a)(1)(G), 355 and 356 of the Code and (b) for certain other rulings under Sections 368(a)(1)(G) and 355 of the Code. The Debtors intend to continue to pursue the Private Letter Ruling to support potential Chapter 11 plans of reorganization that could ultimately be proposed. In October 2014, the Debtors filed a memorandum with the Bankruptcy Court that described tax related matters regarding restructuring alternatives.
Operation and Implications of the Chapter 11 Cases
Our ability to continue as a going concern is contingent upon, among other factors, our ability to comply with the financial and other covenants contained in the DIP Facilities described in Note 11, our ability to obtain new debtor in possession financing in the event the DIP Facilities were to expire during the pendency of the Chapter 11 Cases and our ability to complete a Chapter 11 plan of reorganization in a timely manner, including obtaining creditor and Bankruptcy Court approval of such plan as well as applicable regulatory approvals required for such plan and obtaining any exit financing needed to implement such plan.
A Chapter 11 plan of reorganization determines the rights and satisfaction of claims of various creditors and security holders and is subject to the ultimate outcome of negotiations and Bankruptcy Court decisions ongoing through the date on which the Chapter 11 plan is confirmed. The Debtors currently expect that any proposed Chapter 11 plan of reorganization will provide, among other things, mechanisms for settlement of claims against the Debtors' estates, treatment of EFH Corp.'s existing equity holders and the Debtors' respective existing debt holders, potential income tax liabilities and certain corporate governance and administrative matters pertaining to a reorganized EFH Corp. Any proposed Chapter 11 plan of reorganization will be subject to revision prior to submission to the Bankruptcy Court based upon discussions with the Debtors' creditors and other interested parties, and thereafter in response to creditor claims and objections and the requirements of the Bankruptcy Code or the Bankruptcy Court. There can be no assurance that the Debtors will be able to secure approval from the Bankruptcy Court for any Chapter 11 plan of reorganization it ultimately proposes or that any Chapter 11 plan will be accepted by the Debtors' creditors.
In order for the Debtors to emerge successfully from the Chapter 11 Cases as reorganized companies, they must obtain approval from the Bankruptcy Court and certain of their respective creditors for a Chapter 11 plan, which will enable each of the Debtors to transition from the Chapter 11 Cases into reorganized companies conducting ordinary course operations outside of bankruptcy. In connection with an exit from bankruptcy, TCEH and EFIH will require a new credit facility, or exit financing. TCEH's and EFIH's ability to obtain such approval, and TCEH's and EFIH's ability to obtain such financing will depend on, among other things, the timing and outcome of various ongoing matters in the Chapter 11 Cases.
In general, the Debtors have received final bankruptcy court orders with respect to first day motions and other operating motions that allow the Debtors to operate their businesses in the ordinary course, including, among others, providing for the payment of certain pre-petition employee and retiree expenses and benefits, the use of the Debtors' existing cash management system, the continuation of customer contracts and programs at our retail electricity operations, the payment of certain pre-petition amounts to certain critical vendors, the ability to perform under certain pre-petition hedging and trading arrangements and the ability to pay certain pre-petition taxes and regulatory fees. In addition, the Bankruptcy Court has issued orders approving the DIP Facilities discussed in Note 11.
Pursuant to the Bankruptcy Code, the Debtors intend to comply with all applicable regulatory requirements, including all requirements related to environmental and safety law compliance, during the pendency of the Chapter 11 Cases. Further, the Debtors have been complying, and intend to continue to comply, with the various reporting obligations that are required by the Bankruptcy Court during the pendency of the Chapter 11 Cases. In addition, the Debtors will seek all necessary and appropriate regulatory approvals necessary to complete any transactions proposed in a Chapter 11 plan of reorganization. Moreover, to the extent the Debtors either maintain insurance policies or self-insure their regulatory compliance obligations, the Debtors intend to continue such insurance policies or self-insurance in the ordinary course of business.
Pre-Petition Claims
Holders of the substantial majority of pre-petition claims were required to file proofs of claims by the bar date established by the Bankruptcy Court. A bar date is the date by which certain claims against the Debtors must be filed if the claimants wish to receive any distribution in the Chapter 11 Cases. The Bankruptcy Court established a bar date of October 27, 2014 for the substantial majority of claims. We have received approximately 10,000 filed claims since the Petition Date. We are in the process of reconciling those claims to the amounts listed in our schedules of assets and liabilities, which includes communications with claimants to acquire additional information required for reconciliation. As of March 31, 2015, approximately 2,450 of those claims have been settled, withdrawn or expunged. To the extent claims are reconciled and resolved, we have recorded them at the expected allowed amount. Claims that remain unresolved or unreconciled through the filing of this report have been estimated based upon management's best estimate of the likely claim amounts that the Bankruptcy Court will ultimately allow.
Beginning in November 2014, we began the process to request the Bankruptcy Court to disallow claims that we believe are duplicative, have been later amended or superseded, are without merit, are overstated or should be disallowed for other reasons. Given the substantial number of claims filed, the claims resolution process will take considerable time to complete. Differences between liability amounts recorded by the company as liabilities subject to compromise and claims filed by creditors will be investigated and, if necessary, the Bankruptcy Court will make a final determination of the allowable claim. Differences between those final allowed claims and the liabilities recorded in the consolidated balance sheets will be recognized as reorganization items in our statements of consolidated income (loss) as they are resolved. The determination of how liabilities will ultimately be resolved cannot be made until the Bankruptcy Court approves a plan of reorganization or approves orders related to settlement of specific liabilities. Accordingly, the ultimate amount or resolution of such liabilities is not determinable at this time. The resolution of such claims could result in material adjustments to the company's financial statements.
Executory Contracts and Unexpired Leases
Under the Bankruptcy Code, we have the right to assume, assume and assign, or reject certain executory contracts and unexpired leases, subject to the approval of the Bankruptcy Court and certain other conditions. Generally, the assumption of an executory contract or unexpired lease requires a debtor to satisfy pre-petition obligations under contracts, which may include payment of pre-petition liabilities in whole or in part. Rejection of an executory contract or unexpired lease is typically treated as a breach occurring as of the moment immediately preceding the Chapter 11 filing. Subject to certain exceptions, this rejection relieves the Debtor from performing its future obligations under the contract but entitles the counterparty to assert a pre-petition general unsecured claim for damages. Parties to executory contracts or unexpired leases rejected by a Debtor may file proofs of claim against that debtor's estate for damages.
Since the Petition Date we have renegotiated or rejected a limited number of executory contracts and unexpired leases. For the year ended December 31, 2014 this activity has resulted in the recognition of approximately $20 million in contract claim adjustment charges recorded in reorganization items as detailed in Note 10.
| |
| 3. | VARIABLE INTEREST ENTITIES |
A variable interest entity (VIE) is an entity with which we have a relationship or arrangement that indicates some level of control over the entity or results in economic risks to us. Accounting standards require consolidation of a VIE if we have (a) the power to direct the significant activities of the VIE and (b) the right or obligation to absorb profit and loss from the VIE (i.e. we are the primary beneficiary of the VIE). In determining the appropriateness of consolidation of a VIE, we evaluate its purpose, governance structure, decision making processes and risks that are passed on to its interest holders. We also examine the nature of any related party relationships among the interest holders of the VIE and the nature of any special rights granted to the interest holders of the VIE.
As discussed below, our consolidated balance sheets include assets and liabilities of VIEs that meet the consolidation standards. The maximum exposure to loss from our interests in VIEs does not exceed our carrying value.
Oncor Holdings, an indirect wholly owned subsidiary of EFH Corp. that holds an approximate 80% interest in Oncor, is not consolidated in EFH Corp.'s financial statements, and instead is accounted for as an equity method investment, because the structural and operational ring-fencing measures discussed in Note 1 prevent us from having power to direct the significant activities of Oncor Holdings or Oncor. In accordance with accounting standards, we account for our investment in Oncor Holdings under the equity method, as opposed to the cost method, based on our level of influence over its activities. See below for additional information about our equity method investment in Oncor Holdings. There are no other material investments accounted for under the equity or cost method.
See discussion in Note 21 regarding the VIE related to our accounts receivable securitization program that was consolidated under the accounting standards.
Comanche Peak Nuclear Power Company LLC
Prior to the fourth quarter 2014, we also consolidated as a VIE Comanche Peak Nuclear Power Company LLC (CPNPC), a joint venture formed by subsidiaries of TCEH and Mitsubishi Heavy Industries Ltd. (MHI) for the purpose of developing two new nuclear generation units at our existing Comanche Peak nuclear fueled generation facility. In the fourth quarter 2014, the MHI subsidiary withdrew from the joint venture. As a result, the TCEH subsidiary owns 100% of CPNPC, CPNPC no longer qualifies as a VIE and CPNPC is now consolidated as a wholly owned subsidiary. See Note 8 for additional discussion of CPNPC, including the impairment of essentially all of its assets in 2013.
Non-Consolidation of Oncor and Oncor Holdings
The adoption of amended accounting standards resulted in the deconsolidation of Oncor Holdings, which holds an approximate 80% interest in Oncor, and the reporting of our investment in Oncor Holdings under the equity method on a prospective basis effective January 1, 2010.
In reaching the conclusion to deconsolidate, we conducted an extensive analysis of Oncor Holdings' underlying governing documents and management structure. Oncor Holdings' unique governance structure was adopted in conjunction with the Merger, when the Sponsor Group, EFH Corp. and Oncor agreed to implement structural and operational measures to ring-fence (the Ring-Fencing Measures) Oncor Holdings and Oncor as discussed in Note 1. The Ring-Fencing Measures were designed to prevent, among other things, (i) increased borrowing costs at Oncor due to the attribution to Oncor of debt from any of our other subsidiaries, (ii) the activities of our competitive operations following the Merger resulting in the deterioration of Oncor's business, financial condition and/or investment in infrastructure, and (iii) Oncor becoming substantively consolidated into a bankruptcy proceeding involving any member of the Texas Holdings Group. The Ring-Fencing Measures effectively separate the daily operational and management control of Oncor Holdings and Oncor from EFH Corp. and its other subsidiaries. By implementing the Ring-Fencing Measures, Oncor maintained its investment grade credit rating following the Merger, and we reaffirmed Oncor's independence from our competitive businesses to the PUCT.
We determined the most significant activities affecting the economic performance of Oncor Holdings (and Oncor) are the operation, maintenance and growth of Oncor's electric transmission and distribution assets and the preservation of its investment grade credit profile. The boards of directors of Oncor Holdings and Oncor have ultimate responsibility for the management of the day-to-day operations of their respective businesses, including the approval of Oncor's capital expenditure and operating budgets and the timing and prosecution of Oncor's rate cases. While both boards include members appointed by EFH Corp., a majority of the board members are independent in accordance with rules established by the New York Stock Exchange, and therefore, we concluded for purposes of applying the amended accounting standards that EFH Corp. does not have the power to control the activities deemed most significant to Oncor Holdings' (and Oncor's) economic performance.
In assessing EFH Corp.'s ability to exercise control over Oncor Holdings and Oncor, we considered whether it could take actions to circumvent the purpose and intent of the Ring-Fencing Measures (including changing the composition of Oncor Holdings' or Oncor's board) in order to gain control over the day-to-day operations of either Oncor Holdings or Oncor. We also considered whether (i) EFH Corp. has the unilateral power to dissolve, liquidate or force into bankruptcy either Oncor Holdings or Oncor, (ii) EFH Corp. could unilaterally amend the Ring-Fencing Measures contained in the underlying governing documents of Oncor Holdings or Oncor, and (iii) EFH Corp. could control Oncor's ability to pay distributions and thereby enhance its own cash flow. We concluded that, in each case, no such opportunity exists.
Our investment in unconsolidated subsidiary as presented in the consolidated balance sheets totaled $6.058 billion and $5.959 billion at December 31, 2014 and 2013, respectively, and consists almost entirely of our interest in Oncor Holdings, which we account for under the equity method as described above. Oncor provides services, principally electricity distribution, to TCEH's retail operations, and the related revenues represented 25%, 27% and 29% of Oncor Holdings' consolidated operating revenues for the years ended December 31, 2014, 2013 and 2012, respectively.
See Note 19 for discussion of Oncor Holdings' and Oncor's transactions with EFH Corp. and its other subsidiaries.
Distributions from Oncor Holdings and Related Considerations — Oncor Holdings' distributions of earnings to us totaled $202 million, $213 million and $147 million for the years ended December 31, 2014, 2013 and 2012, respectively. Distributions may not be paid except to the extent Oncor maintains a required regulatory capital structure, as discussed below. At December 31, 2014, $184 million was eligible to be distributed to Oncor's members after taking into account the regulatory capital structure limit, of which approximately 80% relates to our ownership interest in Oncor. The boards of directors of each of Oncor and Oncor Holdings can withhold distributions to the extent the applicable board determines in good faith that it is necessary to retain such amounts to meet expected future requirements of Oncor and/or Oncor Holdings.
For the period beginning October 11, 2007 and ending December 31, 2012, distributions (other than distributions of the proceeds of any equity issuance) paid by Oncor to its members were limited by a PUCT order to an amount not to exceed Oncor's cumulative net income determined in accordance with US GAAP, as adjusted. Adjustments consisted of the removal of noncash impacts of purchase accounting and deducting two specific cash commitments. The noncash impacts consisted of removing the effect of an $860 million goodwill impairment charge in 2008 and the cumulative amount of net accretion of fair value adjustments. The two specific cash commitments were a $72 million ($46 million after tax) one-time refund to customers in September 2008 and funds spent as part of a five-year, $100 million commitment for additional energy efficiency initiatives that was completed in 2012.
Oncor's distributions are limited by its regulatory capital structure, which is required to be at or below the assumed debt-to-equity ratio established periodically by the PUCT for ratemaking purposes, which is currently set at 60% debt to 40% equity. At December 31, 2014, Oncor's regulatory capitalization ratio was 58.8% debt and 41.2% equity. For purposes of this ratio, debt is calculated as long-term debt plus unamortized gains on reacquired debt less unamortized issuance expenses, premiums and losses on reacquired debt. The debt calculation excludes bonds issued by Oncor Electric Delivery Transition Bond Company LLC, which were issued in 2003 and 2004 to recover specific generation-related regulatory assets and other qualified costs. Equity is calculated as membership interests determined in accordance with US GAAP, excluding the effects of accounting for the Merger (which included recording the initial goodwill and fair value adjustments and the subsequent related impairments and amortization).
As a result of the Bankruptcy Filing, Oncor had credit risk exposure to trade accounts receivable from subsidiaries of TCEH, which related to delivery services provided by Oncor to TCEH's retail electricity operations. At the Petition Date, these accounts receivable totaled $109 million. In June 2014, the Bankruptcy Court authorized the Debtors to pay all pre-petition delivery charges due Oncor, and such amounts were paid in full.
EFH Corp., Oncor Holdings, Oncor and Oncor's minority investor are parties to a Federal and State Income Tax Allocation Agreement. Additional income tax amounts receivable or payable may arise in the normal course under that agreement.
Oncor Holdings Financial Statements — Condensed statements of consolidated income of Oncor Holdings and its subsidiaries for the years ended December 31, 2014, 2013 and 2012 are presented below:
|
| | | | | | | | | | | |
| | Year Ended December 31, |
| | 2014 | | 2013 | | 2012 |
| Operating revenues | $ | 3,822 |
| | $ | 3,552 |
| | $ | 3,328 |
|
| Operation and maintenance expenses | (1,453 | ) | | (1,269 | ) | | (1,171 | ) |
| Depreciation and amortization | (851 | ) | | (814 | ) | | (771 | ) |
| Taxes other than income taxes | (438 | ) | | (424 | ) | | (415 | ) |
| Other income | 13 |
| | 18 |
| | 26 |
|
| Other deductions | (15 | ) | | (15 | ) | | (64 | ) |
| Interest income | 3 |
| | 4 |
| | 24 |
|
| Interest expense and related charges | (353 | ) | | (371 | ) | | (374 | ) |
| Income before income taxes | 728 |
| | 681 |
| | 583 |
|
| Income tax expense | (289 | ) | | (259 | ) | | (243 | ) |
| Net income | 439 |
| | 422 |
| | 340 |
|
| Net income attributable to noncontrolling interests | (90 | ) | | (87 | ) | | (70 | ) |
| Net income attributable to Oncor Holdings | $ | 349 |
| | $ | 335 |
| | $ | 270 |
|
Assets and liabilities of Oncor Holdings at December 31, 2014 and 2013 are presented below:
|
| | | | | | | |
| | December 31, |
| | 2014 | | 2013 |
| ASSETS | | | |
| Current assets: | | | |
| Cash and cash equivalents | $ | 5 |
| | $ | 28 |
|
| Restricted cash | 56 |
| | 52 |
|
| Trade accounts receivable — net | 407 |
| | 385 |
|
| Trade accounts and other receivables from affiliates | 118 |
| | 135 |
|
| Income taxes receivable from EFH Corp. | 144 |
| | 16 |
|
| Inventories | 73 |
| | 65 |
|
| Accumulated deferred income taxes | 10 |
| | 32 |
|
| Prepayments and other current assets | 91 |
| | 82 |
|
| Total current assets | 904 |
| | 795 |
|
| Restricted cash | 16 |
| | 16 |
|
| Other investments | 97 |
| | 91 |
|
| Property, plant and equipment — net | 12,463 |
| | 11,902 |
|
| Goodwill | 4,064 |
| | 4,064 |
|
| Regulatory assets — net | 1,429 |
| | 1,324 |
|
| Other noncurrent assets | 67 |
| | 71 |
|
| Total assets | $ | 19,040 |
| | $ | 18,263 |
|
| LIABILITIES | | | |
| Current liabilities: | | | |
| Short-term borrowings | $ | 711 |
| | $ | 745 |
|
| Long-term debt due currently | 639 |
| | 131 |
|
| Trade accounts payable — nonaffiliates | 202 |
| | 178 |
|
| Income taxes payable to EFH Corp. | 24 |
| | 23 |
|
| Accrued taxes other than income | 174 |
| | 169 |
|
| Accrued interest | 93 |
| | 95 |
|
| Other current liabilities | 156 |
| | 135 |
|
| Total current liabilities | 1,999 |
| | 1,476 |
|
| Accumulated deferred income taxes | 1,978 |
| | 1,905 |
|
| Long-term debt, less amounts due currently | 4,997 |
| | 5,381 |
|
| Other noncurrent liabilities and deferred credits | 2,245 |
| | 1,822 |
|
| Total liabilities | $ | 11,219 |
| | $ | 10,584 |
|
| |
| 4. | GOODWILL AND IDENTIFIABLE INTANGIBLE ASSETS |
Goodwill
The following table provides information regarding our goodwill balance, all of which relates to the Competitive Electric segment and arose in connection with accounting for the Merger. None of the goodwill is being deducted for tax purposes.
|
| | | |
| Goodwill before impairment charges | $ | 18,342 |
|
| Accumulated noncash impairment charges through 2013 (a) | (14,390 | ) |
| Balance at December 31, 2013 | 3,952 |
|
| Additional noncash impairment charge in 2014 | (1,600 | ) |
| Balance at December 31, 2014 (b) | $ | 2,352 |
|
____________
| |
| (a) | Includes $1.0 billion, $1.2 billion and $4.1 billion recorded in 2013, 2012 and 2010, respectively, and $8.090 billion largely recorded in 2008. |
| |
| (b) | Net of accumulated impairment charges totaling $15.99 billion. |
Goodwill Impairments
Goodwill and intangible assets with indefinite useful lives are required to be tested for impairment at least annually (we have selected a December 1 test date) or whenever events or changes in circumstances indicate an impairment may exist.
We perform the following steps in testing goodwill for impairment: first, we estimate the debt-free enterprise value of the business as of the testing date taking into account future estimated cash flows and current securities values of comparable companies; second, we estimate the fair values of the individual assets and liabilities of the business at that date; third, we calculate implied goodwill as the excess of the estimated enterprise value over the estimated value of the net operating assets; and finally, we compare the implied goodwill amount to the carrying value of goodwill and, if the carrying amount exceeds the implied value, we record an impairment charge for the amount the carrying value of goodwill exceeds implied goodwill.
Wholesale electricity prices in the ERCOT market, in which our Competitive Electric segment largely operates, have generally moved with natural gas prices as marginal electricity demand is generally supplied by natural gas fueled generation facilities. Accordingly, the sustained decline in natural gas prices, which we have experienced since mid-2008, negatively impacts our profitability and cash flows and reduces the value of our generation assets, which consist largely of lignite/coal and nuclear fueled facilities. While we had partially mitigated these effects with hedging activities, we are significantly exposed to this price risk. Because of this market condition, our analyses over the past several years have indicated that the carrying value of the Competitive Electric segment exceeds its estimated fair value (enterprise value). Consequently, we continually monitor trends in natural gas prices, market heat rates, capital spending for environmental and other projects and other operational factors to determine if goodwill impairment testing should be done during the course of a year and not only at the annual December 1 testing date.
During the quarter ended September 30, 2014, we experienced an impairment indicator related to significant decreases in forward wholesale electricity prices when compared to those prices reflected in our December 1, 2013 goodwill impairment testing analysis. As a result, the likelihood of a goodwill impairment had increased, and we initiated further testing of goodwill as of September 30, 2014, which was completed during the fourth quarter. Our testing resulted in an impairment of $1.6 billion of goodwill at September 30, 2014, which we recorded in the fourth quarter of 2014 and is reported in the Competitive Electric segment results.
In the fourth quarter 2014, we also performed our goodwill impairment analysis as of our annual testing date of December 1. During the fourth quarter, we completed our annual update of our long-range financial and operating plan, which reflected extended seasonal outages and reduced operations at several of our older lignite/coal fueled generation facilities as a result of the lower wholesale electricity prices and potential impacts to those facilities from proposed environmental regulations. The resulting impairment charge recorded on our long-lived assets was factored into our December 1 goodwill impairment test. Our testing did not result in an additional impairment of goodwill at December 1.
Key inputs into our goodwill impairment testing at September 30 and December 1, 2014 and December 1, 2013 were as follows:
| |
| • | The carrying value (excluding debt) of the Competitive Electric segment exceeded its estimated enterprise value by approximately 17% and 47% at December 1 and September 30, 2014, respectively, and by 43% at December 1, 2013. |
| |
| • | The fair value of the Competitive Electric segment was estimated using a two-thirds weighting of value based on internally developed cash flow projections and a one-third weighting of value using implied cash flow multiples based on current securities values of comparable publicly traded companies. The internally developed cash flow projections reflect annual estimates through a terminal year calculated using either a terminal year EBITDA multiple approach or a Gordon Growth model. |
| |
| • | The discount rate applied to internally developed cash flow projections was 6.25% at both December 1 and September 30, 2014 under the terminal year EBITDA multiple approach, and was 8.75% at December 1, 2013 under the Gordon Growth model approach. The discount rate represents the weighted average cost of capital consistent with our views of the rate that an expected market participant would utilize for valuation, including the risk inherent in future cash flows, taking into account the capital structure, debt ratings and current debt yields of comparable public companies as well as an estimate of return on equity that reflects historical market returns and current market volatility for the industry. |
| |
| • | The cash flow projections used in 2014 assume rising wholesale electricity prices, although the forecasted electricity prices are less than those assumed in the cash flow projections used in the 2013 goodwill impairment testing, which were less than those assumed in the cash flow projections used in the 2012 goodwill impairment testing. |
Changes in the above and other assumptions could materially affect the calculated amount of implied goodwill and any resulting goodwill impairment charge.
In the fourth quarter 2013, we recorded a $1.0 billion goodwill impairment charge related to the Competitive Electric segment. In the fourth quarter 2012, we recorded an estimated goodwill impairment charge of $1.2 billion related to the Competitive Electric segment. The impairment charges in 2013 and 2012 reflected declines in the estimated fair value of the Competitive Electric segment as a result of lower wholesale electricity prices, the sustained decline in natural gas prices, the maturing of positions in our natural gas hedge program and declines in market values of securities of comparable companies.
The impairment determinations involved significant assumptions and judgments. The calculations supporting the estimates of the fair value of our Competitive Electric segment and the fair values of its assets and liabilities utilized models that take into consideration multiple inputs, including commodity prices, discount rates, capital expenditures, the effects of proposed and final environmental regulations, securities prices of comparable publicly traded companies and other inputs. Assumptions regarding each of these inputs could have a significant effect on the related valuations. In performing these calculations we also take into consideration assumptions on how current market participants would value the Competitive Electric segment and its operating assets and liabilities. Changes to assumptions that reflect the views of current market participants can also have a significant effect on the related valuations. The fair value measurements resulting from these models are classified as non-recurring Level 3 measurements consistent with accounting standards related to the determination of fair value (see Note 15). Because of the volatility of these factors, we cannot predict the likelihood of any future impairment.
Identifiable Intangible Assets
Identifiable intangible assets, including amounts that arose in connection with accounting for the Merger, are comprised of the following:
|
| | | | | | | | | | | | | | | | | | | | | | | | |
| | | December 31, 2014 | | December 31, 2013 |
| Identifiable Intangible Asset | | Gross Carrying Amount | | Accumulated Amortization | | Net | | Gross Carrying Amount | | Accumulated Amortization | | Net |
| Retail customer relationship | | $ | 463 |
| | $ | 425 |
| | $ | 38 |
| | $ | 463 |
| | $ | 402 |
| | $ | 61 |
|
| Favorable purchase and sales contracts (a) | | 169 |
| | 162 |
| | 7 |
| | 352 |
| | 139 |
| | 213 |
|
| Capitalized in-service software | | 362 |
| | 216 |
| | 146 |
| | 355 |
| | 192 |
| | 163 |
|
| Environmental allowances and credits (a) | | 141 |
| | 51 |
| | 90 |
| | 209 |
| | 20 |
| | 189 |
|
| Mining development costs | | 150 |
| | 78 |
| | 72 |
| | 156 |
| | 69 |
| | 87 |
|
| Total identifiable intangible assets subject to amortization | | $ | 1,285 |
| | $ | 932 |
| | 353 |
| | $ | 1,535 |
| | $ | 822 |
| | 713 |
|
| Retail trade name (not subject to amortization) | | | | | | 955 |
| | | | | | 955 |
|
| Mineral interests (not currently subject to amortization) | | | | | | 7 |
| | | | | | 11 |
|
| Total identifiable intangible assets | | | | | | $ | 1,315 |
| | | | | | $ | 1,679 |
|
____________
| |
| (a) | See discussion below regarding impairment charges recorded in 2014 related to favorable purchase and sales contracts and environmental allowances and credits. |
At December 31, 2014, amounts related to fully amortized assets that are expired or of no economic value have been excluded from both the gross carrying and accumulated amortization amounts.
Amortization expense related to identifiable finite-lived intangible assets (including the statements of consolidated income (loss) line item) consisted of:
|
| | | | | | | | | | | | | | | | | | |
| Identifiable Intangible Asset | | Statements of Consolidated Income (Loss) Line | | Segment | | Remaining useful lives at December 31, 2014 (weighted average in years) | | Year Ended December 31, |
| | | | | 2014 | | 2013 | | 2012 |
| Retail customer relationship | | Depreciation and amortization | | Competitive Electric | | 3 | | $ | 23 |
| | $ | 24 |
| | $ | 34 |
|
| Favorable purchase and sales contracts | | Operating revenues/fuel, purchased power costs and delivery fees | | Competitive Electric | | 5 | | 23 |
| | 24 |
| | 25 |
|
| Capitalized in-service software | | Depreciation and amortization | | Competitive Electric and Corporate and Other | | 3 | | 45 |
| | 42 |
| | 40 |
|
| Environmental allowances and credits | | Fuel, purchased power costs and delivery fees | | Competitive Electric | | 23 | | 31 |
| | 14 |
| | 18 |
|
| Mining development costs | | Depreciation and amortization | | Competitive Electric | | 3 | | 34 |
| | 31 |
| | 27 |
|
| Total amortization expense (a) | | | | | | | | $ | 156 |
| | $ | 135 |
| | $ | 144 |
|
____________
| |
| (a) | Amounts recorded in depreciation and amortization totaled $102 million, $97 million and $101 million in 2014, 2013 and 2012, respectively. |
Following is a description of the separately identifiable intangible assets recorded as part of purchase accounting for the Merger. The intangible assets were recorded at estimated fair value as of the Merger date, based on observable prices or estimates of fair value using valuation models.
| |
| • | Retail customer relationship – Retail customer relationship intangible asset represents the fair value of the non-contracted customer base and is being amortized using an accelerated method based on customer attrition rates and reflecting the expected pattern in which economic benefits are realized over their estimated useful life. |
| |
| • | Favorable purchase and sales contracts – Favorable purchase and sales contracts intangible asset primarily represents the above market value of commodity contracts for which: (i) we had made the normal purchase or sale election allowed by accounting standards related to derivative instruments and hedging transactions or (ii) the contracts did not meet the definition of a derivative. The amortization periods of these intangible assets are based on the terms of the contracts. Unfavorable purchase and sales contracts are recorded as other noncurrent liabilities and deferred credits (see Note 21). |
| |
| • | Retail trade name – The trade name intangible asset represents the fair value of the TXU Energy trade name, and was determined to be an indefinite-lived asset not subject to amortization. This intangible asset is evaluated for impairment at least annually in accordance with accounting guidance related to goodwill and other intangible assets. Significant assumptions included within the development of the fair value estimate include TXU Energy's estimated gross margin for future periods and an implied royalty rate. No impairment was recorded as a result of our 2014 analysis. |
| |
| • | Environmental allowances and credits – This intangible asset represents the fair value of environmental credits, substantially all of which were expected to be used in our power generation activities. These credits are amortized utilizing a units-of-production method. See discussion below for discussion of impairment of certain allowances in 2014. |
Intangible Impairments
During the fourth quarter of 2014, we determined that certain intangible assets related to favorable power purchase contracts should be evaluated for impairment. That conclusion was based on the combination of (1) the review of contracts for rejection as part of the Chapter 11 Cases, which could result in termination of contracts before the end of their estimated useful life and (2) declines in wholesale electricity prices. Our fair value measurement was based on a discounted cash flow analysis of the contracts that compared the contractual price and terms of the contract to forecasted wholesale electricity and REC prices in ERCOT. As a result of the analysis, we recorded a noncash impairment charge of $183 million in our Competitive Electric segment (before deferred income tax benefit) in other deductions (see Note 7).
As a result of the CSAPR, which became effective on January 1, 2015, and other new or proposed EPA rules, we project that as of December 31, 2014 we had excess SO2 emission allowances under the Clean Air Act's existing acid rain cap-and-trade program. In addition, the impairments of our Monticello, Martin Lake and Sandow 5 generation facilities (see Note 8) resulted in the impairment of the SO2 allowances associated with those facilities to the extent they are not projected to be used at other sites. The fair market values of the SO2 allowances were estimated to be de minimis based on Level 3 fair value estimates (see Note 15). Accordingly we recorded a noncash impairment charge of $80 million in our Competitive Electric segment (before deferred income tax benefit) in other deductions related to our existing environmental allowances and credits intangible asset in 2014. SO2 emission allowances granted to us were recorded as intangible assets at fair value in connection with purchase accounting related to the Merger in 2007.
Estimated Amortization of Identifiable Intangible Assets
The estimated aggregate amortization expense of identifiable intangible assets for each of the next five fiscal years is as follows:
|
| | | | |
| Year | | Estimated Amortization Expense |
| 2015 | | $ | 95 |
|
| 2016 | | $ | 77 |
|
| 2017 | | $ | 58 |
|
| 2018 | | $ | 35 |
|
| 2019 | | $ | 18 |
|
5. ACCOUNTING FOR UNCERTAINTY IN INCOME TAXES
Accounting guidance related to uncertain tax positions requires that all tax positions subject to uncertainty be reviewed and assessed with recognition and measurement of the tax benefit based on a "more-likely-than-not" standard with respect to the ultimate outcome, regardless of whether this assessment is favorable or unfavorable.
We file or have filed income tax returns in US federal, state and foreign jurisdictions and are subject to examinations by the IRS and other taxing authorities. Examinations of our income tax returns for the years ending prior to January 1, 2008 are complete. Federal income tax returns are under examination for tax years 2008 to 2009. Texas franchise and margin tax returns are under examination or still open for examination for tax years beginning after 2006.
In October 2014, the IRS filed a claim with the Bankruptcy Court for open tax years through 2013 that was consistent with the settlement we reached with IRS Appeals for tax years 2003-2006. As a result of this filing, we effectively settled the 2003-2006 open tax years and reduced the liability for uncertain tax positions related to the 2003-2006 open tax years by $116 million, resulting in a $120 million reclassification to the accumulated deferred income tax liability and the recording of a $4 million income tax expense reflecting the settlement of certain positions. The total income tax expense of $4 million reflected a $7 million income tax benefit reported in Corporate and Other activities and an $11 million income tax expense reported in the Competitive Electric segment results.
In September 2014, we signed a final agreed Revenue Agent Report (RAR) with the IRS and associated documentation for the 2007 tax year. The Bankruptcy Court approved our signing of the RAR in October 2014. As a result of receiving, agreeing to and signing the final RAR, we reduced the liability for uncertain tax positions by $58 million, resulting in a $19 million reclassification to the accumulated deferred income tax liability and the recording of a $39 million income tax benefit reflecting deductions related to lignite depletion and the release of accrued interest on uncertain tax positions. The adjustments did not result in a significant change to the originally filed tax return nor did it result in any cash tax or interest due. The total income tax benefit of $39 million reflected a $24 million income tax benefit recorded in Corporate and Other activities and a $15 million income tax benefit reported in the Competitive Electric segment results.
As a result of the information the Company received in 2014 from the IRS, as described above, we recorded an additional reduction in the liability for unrecognized tax benefits of $166 million, an increase in the payable to the IRS of $50 million (including $18 million of interest), and a payable to Oncor of $64 million. Net accumulated deferred income tax liabilities were increased by approximately $52 million. There was no material impact in income tax benefit as a result of the computations; however, in recording the impacts, the Company identified approximately $90 million of income tax expense related to 2013 which was recorded in December 2014. The impact of recording this expense was not material to the financial statements in 2013 or 2014.
In March 2013, EFH Corp. and the IRS agreed on terms to resolve disputed adjustments related to the IRS audit for the years 2003 through 2006, which was concluded in June 2011. The IRS proposed a significant number of adjustments to the originally filed returns for such years related to one significant accounting method issue and other less significant issues. As a result of the agreement on terms with the IRS, we reduced the liability for uncertain tax positions to reflect the terms of the agreement, resulting in a net decrease of $922 million, including $173 million in interest accruals.
In May 2013, we received approval from the Joint Committee on Taxation of the IRS appeals settlement of all issues arising from the 1997 through 2002 IRS audit, which includes all tax issues related to EFH Corp.'s discontinued Europe operations. The settlement also affected federal and state returns for periods subsequent to 2002. As a result, we reduced the liability for uncertain tax positions to reflect the effects of the settlement, resulting in net decrease of $676 million, including $15 million in interest accruals. Other effects included the recording of a $13 million noncurrent federal income tax liability, an $8 million current federal income tax liability related to an expected interest payment owed as a result of the settlement of all issues arising from the 1997 through 2002 IRS audit, a $15 million current state income tax liability and a $33 million federal income tax receivable from Oncor under the Federal and State Income Tax Allocation Agreement (see Note 6).
The settlements in March and May 2013 resulted in the elimination of a substantial majority of the net operating loss carryforwards and alternative minimum tax credit carryforwards generated through 2013.
In total, the settlements in March and May 2013 resulted in an increase of $1.193 billion in the accumulated deferred income tax liability and an income tax benefit of $305 million. Of the total income tax benefit, $122 million (after-tax) was attributable to the release of accrued interest. The $305 million tax benefit reflected a $226 million income tax benefit reported in Corporate and Other activities and a $79 million income tax benefit reported in the Competitive Electric segment results.
In September 2013, the US Treasury and the IRS issued final tangible property regulations that relate to repair and maintenance costs. As a result of our analysis of these regulations, in the fourth quarter 2013 we reduced the liability for uncertain tax positions by $159 million and reclassified that amount to the accumulated deferred income tax liability and recorded a $6 million income tax benefit representing a reversal of accrued interest.
We classify interest and penalties related to uncertain tax positions as current income tax expense. Amounts recorded related to interest and penalties totaled a benefit of $3 million in 2014 and a benefit of $132 million in 2013, reflecting a reversal of interest previously accrued as a result of the IRS settlements discussed above (all amounts after tax). Ongoing accruals of interest after the IRS settlements were not material in 2014 and 2013.
Noncurrent liabilities included a total of $9 million and $15 million in accrued interest at December 31, 2014 and 2013, respectively. The federal income tax benefit on the interest accrued on uncertain tax positions is recorded as accumulated deferred income taxes.
The following table summarizes the changes to the uncertain tax positions, reported in other noncurrent liabilities in the consolidated balance sheets, during the years ended December 31, 2014, 2013 and 2012:
|
| | | | | | | | | | | |
| | Year Ended December 31, |
| | 2014 | | 2013 | | 2012 |
| Balance at January 1, excluding interest and penalties | $ | 231 |
| | $ | 1,788 |
| | $ | 1,779 |
|
| Additions based on tax positions related to prior years | 61 |
| | 655 |
| | 19 |
|
| Reductions based on tax positions related to prior years | (205 | ) | | (1,817 | ) | | (33 | ) |
| Additions based on tax positions related to the current year | — |
| | 16 |
| | 23 |
|
| Reductions based on tax positions related to the current year | — |
| | (4 | ) | | — |
|
| Settlements with taxing authorities | (22 | ) | | (407 | ) | | — |
|
| Balance at December 31, excluding interest and penalties | $ | 65 |
| | $ | 231 |
| | $ | 1,788 |
|
Of the balance at December 31, 2014, $4 million represents tax positions for which the uncertainty relates to the timing of recognition in tax returns. The disallowance of such positions would not affect the effective tax rate, but could accelerate the payment of cash to the taxing authority to an earlier period.
With respect to tax positions for which the ultimate deductibility is uncertain (permanent items), should we sustain such positions on income tax returns previously filed, tax liabilities recorded would be reduced by $61 million, and accrued interest would be reversed resulting in a $6 million after-tax benefit, resulting in increased net income and a favorable impact on the effective tax rate.
With respect to the items discussed above, we reasonably expect the total amount of liabilities recorded related to uncertain tax positions will significantly decrease in the next twelve months due to the anticipated release of tax reserves related to 2008 and 2009. We expect to receive a final, agreed RAR from the IRS related to the 2008-2009 tax years during 2015, which we expect will effectively settle those years and release the related reserves. We expect an approximately $20 million reclassification to the accumulated deferred income tax liability from the uncertain tax position liability during the next 12 months.
EFH Corp. files a US federal income tax return that includes the results of EFCH, EFIH, Oncor Holdings and TCEH. EFH Corp. is a corporate member of the EFH Corp. consolidated group, while each of EFIH, Oncor Holdings, EFCH and TCEH is classified as a disregarded entity for US federal income tax purposes. Prior to April 2013, EFCH was a corporate member of the EFH Corp. consolidated group. Oncor is a partnership for US federal income tax purposes and is not a corporate member of the EFH Corp. consolidated group. Pursuant to applicable US Treasury regulations and published guidance of the IRS, corporations that are members of a consolidated group have joint and several liability for the taxes of such group.
EFH Corp., Oncor Holdings, Oncor and Oncor's minority investor are parties to the Federal and State Income Tax Allocation Agreement, which governs the computation of federal income tax liability among such parties, and similarly provides, among other things, that each of Oncor Holdings and Oncor will pay EFH Corp. its share of an amount calculated to approximate the amount of tax liability such entity would have owed if it filed a separate corporate tax return.
The components of our income tax expense (benefit) are as follows:
|
| | | | | | | | | | | |
| | Year Ended December 31, |
| | 2014 | | 2013 | | 2012 |
| Current: | | | | | |
| US Federal | $ | (126 | ) | | $ | (283 | ) | | $ | (19 | ) |
| State | 25 |
| | 40 |
| | 39 |
|
| Total current | (101 | ) | | (243 | ) | | 20 |
|
| Deferred: | | | | | |
| US Federal | (2,507 | ) | | (1,027 | ) | | (1,233 | ) |
| State | (11 | ) | | (1 | ) | | (19 | ) |
| Total deferred | (2,518 | ) | | (1,028 | ) | | (1,252 | ) |
| Total | $ | (2,619 | ) | | $ | (1,271 | ) | | $ | (1,232 | ) |
Reconciliation of income taxes computed at the US federal statutory rate to income tax benefit recorded:
|
| | | | | | | | | | | |
| | Year Ended December 31, |
| | 2014 | | 2013 | | 2012 |
| Loss before income taxes and equity in earnings of unconsolidated subsidiaries | $ | (9,374 | ) | | $ | (3,931 | ) | | $ | (4,862 | ) |
| Income taxes at the US federal statutory rate of 35% | $ | (3,281 | ) | | $ | (1,376 | ) | | $ | (1,702 | ) |
| Nondeductible goodwill impairment | 560 |
| | 350 |
| | 420 |
|
| Impairment of joint venture assets attributable to noncontrolling interests (Note 8) | — |
| | 37 |
| | — |
|
| IRS audit and appeals settlements (Note 5) | 7 |
| | (305 | ) | | — |
|
| Texas margin tax, net of federal benefit | 11 |
| | 10 |
| | 12 |
|
| Interest accrued for uncertain tax positions, net of tax | — |
| | (16 | ) | | 16 |
|
| Nondeductible interest expense | 22 |
| | 23 |
| | 22 |
|
| Lignite depletion allowance | (14 | ) | | (12 | ) | | (19 | ) |
| Nondeductible debt restructuring costs | 78 |
| | 6 |
| | — |
|
| Other | (2 | ) | | 12 |
| | 19 |
|
| Income tax benefit | $ | (2,619 | ) | | $ | (1,271 | ) | | $ | (1,232 | ) |
| Effective tax rate | 27.9 | % | | 32.3 | % | | 25.3 | % |
Deferred Income Tax Balances
Deferred income taxes provided for temporary differences based on tax laws in effect at December 31, 2014 and 2013 are as follows:
|
| | | | | | | | | | | | | | | | | | | | | | | |
| | December 31, |
| | 2014 | | 2013 |
| | Total | | Current | | Noncurrent | | Total | | Current | | Noncurrent |
| Deferred Income Tax Assets | | | | | | | | | | | |
| Alternative minimum tax credit carryforwards | $ | 124 |
| | $ | — |
| | $ | 124 |
| | $ | 22 |
| | $ | — |
| | $ | 22 |
|
| Employee benefit obligations | 143 |
| | 8 |
| | 135 |
| | 129 |
| | 13 |
| | 116 |
|
| Net operating loss (NOL) carryforwards | 1,022 |
| | — |
| | 1,022 |
| | 160 |
| | — |
| | 160 |
|
| Unfavorable purchase and sales contracts | 202 |
| | — |
| | 202 |
| | 210 |
| | — |
| | 210 |
|
| Commodity contracts and interest rate swaps | 6 |
| | — |
| | 6 |
| | 212 |
| | 192 |
| | 20 |
|
| Debt extinguishment gains | 879 |
| | — |
| | 879 |
| | 815 |
| | — |
| | 815 |
|
| Accrued interest | — |
| | — |
| | — |
| | 239 |
| | — |
| | 239 |
|
| Other | 85 |
| | 2 |
| | 83 |
| | 97 |
| | 1 |
| | 96 |
|
| Total | 2,461 |
| | 10 |
| | 2,451 |
| | 1,884 |
| | 206 |
| | 1,678 |
|
| Deferred Income Tax Liabilities | | | | | | | | | | | |
| Property, plant and equipment | 2,422 |
| | — |
| | 2,422 |
| | 4,292 |
| | — |
| | 4,292 |
|
| Commodity contracts and interest rate swaps | 44 |
| | 44 |
| | — |
| | — |
| | — |
| | — |
|
| Identifiable intangible assets | 355 |
| | — |
| | 355 |
| | 490 |
| | — |
| | 490 |
|
| Debt fair value discounts | 342 |
| | — |
| | 342 |
| | 329 |
| | — |
| | 329 |
|
| Debt extinguishment gains | 101 |
| | 101 |
| | — |
| | 101 |
| | 101 |
| | — |
|
| Accrued interest | 45 |
| | — |
| | 45 |
| | — |
| | — |
| | — |
|
| Other | — |
| | — |
| | — |
| | — |
| | — |
| | — |
|
| Total | 3,309 |
| | 145 |
| | 3,164 |
| | 5,212 |
| | 101 |
| | 5,111 |
|
| Net Accumulated Deferred Income Tax Liability | $ | 848 |
| | $ | 135 |
| | $ | 713 |
| | $ | 3,328 |
| | $ | (105 | ) | | $ | 3,433 |
|
At December 31, 2014 we had $2.920 billion in net operating loss (NOL) carryforwards for federal income tax purposes that will expire between 2034 and 2035. As discussed in Note 5, audit settlements reached in 2013 resulted in the elimination of substantially all NOL carryforwards generated through 2013 and available AMT credits. The NOL carryforwards can be used to offset future taxable income. We expect to utilize all of our NOL carryforwards prior to their expiration dates. At December 31, 2014 we had $124 million in alternative minimum tax (AMT) credit carryforwards available which may, in certain limited circumstances, be used to offset future tax payments. The AMT credit carryforwards have no expiration date, but may be limited in a change of control.
The income tax effects of the components included in accumulated other comprehensive income at December 31, 2014 and 2013 totaled a net deferred tax asset of $71 million and $34 million, respectively.
See Note 5 for discussion regarding accounting for uncertain tax positions, including the effects of the resolution of IRS audit matters in 2013.
| |
| 7. | OTHER INCOME AND DEDUCTIONS |
|
| | | | | | | | | | | |
| | Year Ended December 31, |
| | 2014 | | 2013 | | 2012 |
| Other income: | | | | | |
| Office space rental income (a) | $ | 11 |
| | $ | 11 |
| | $ | 12 |
|
| Mineral rights royalty income (b) | 4 |
| | 5 |
| | 4 |
|
Consent fee related to novation of hedge positions between
counterparties (b) | — |
| | — |
| | 6 |
|
| All other | 16 |
| | 10 |
| | 8 |
|
| Total other income | $ | 31 |
| | $ | 26 |
| | $ | 30 |
|
| Other deductions: | | | | | |
| Impairment of favorable purchase contracts (Note 4) (b) | $ | 183 |
| | $ | — |
| | $ | — |
|
| Impairment of emission allowances (Note 4) (b) | 80 |
| | — |
| | — |
|
| Impairment of remaining equipment from cancelled generation development program (b) | — |
| | 27 |
| | 35 |
|
| Impairment of mineral interests (b) | — |
| | — |
| | 24 |
|
| Charges related to pension plan actions (Note 17) (c) | — |
| | — |
| | 285 |
|
| Ongoing employee retirement benefit expense related to discontinued businesses (a) | — |
| | — |
| | 10 |
|
| All other | 13 |
| | 26 |
| | 26 |
|
| Total other deductions | $ | 276 |
| | $ | 53 |
| | $ | 380 |
|
____________
| |
| (a) | Reported in Corporate and Other. |
| |
| (b) | Reported in Competitive Electric segment. |
| |
| (c) | Includes $141 million reported in Competitive Electric segment and $144 million reported in Corporate and Other. |
| |
| 8. | IMPAIRMENT OF LONG-LIVED ASSETS |
Impairment of Lignite/Coal Fueled Generation and Mining Assets
We evaluated our generation assets for impairment during the fourth quarter of 2014 as a result of several impairment indicators, including lower forecasted wholesale electricity prices in ERCOT, changes to operating assumptions for certain generation assets as detailed in our updated annual financial and operating plan and potential effects of new and/or proposed environmental regulations. Our evaluation concluded that impairments existed, and the carrying values for our Martin Lake, Monticello and Sandow 5 generation facilities and related mining facilities were reduced by $2.042 billion, $1.499 billion and $1.099 billion, respectively. Our fair value measurement for these assets was determined based on an income approach that utilized probability-weighted estimates of discounted future cash flows, which were Level 3 fair value measurements (see Note 15). Key inputs into the fair value measurement for these assets included current forecasted wholesale electricity prices in ERCOT, forecasted fuel prices, capital and operating expenditure forecasts and discount rates.
Additionally, in 2014, we wrote off previously incurred and deferred costs totaling $30 million for mining projects not expected to be completed due to current economic forecasts and regulatory uncertainty. These charges have been recorded in impairment of long-lived assets in the Competitive Electric segment's results.
Additional material impairments may occur in the future at these or other of our generation facilities if forward wholesale electricity prices continue to decline or if additional environmental regulations increase the cost of producing electricity at our generation facilities.
Impairment of Nuclear Generation Development Joint Venture Assets in 2013
In 2009, subsidiaries of TCEH and Mitsubishi Heavy Industries Ltd. (MHI) formed a joint venture, Comanche Peak Nuclear Power Company LLC (CPNPC), to develop two new nuclear generation units at our existing Comanche Peak nuclear plant site. In the fourth quarter 2014, MHI withdrew from the joint venture, and the TCEH subsidiary now owns 100% of CPNPC. As discussed in Note 3, CPNPC was a consolidated VIE.
In the fourth quarter 2013, MHI notified us and the NRC of its plans to reduce its support of review activities related to the NRC's Design Certification of MHI's US-APWR technology. As a result, Luminant notified the NRC of its intent to suspend (but not withdraw) all reviews associated with the combined operating license application by March 31, 2014. MHI's decision and the expected amendment of the joint venture agreement triggered an analysis of the recoverability of the joint venture's assets. Because of the significant uncertainty regarding the development of the nuclear generation units, considering the wholesale electricity price environment in ERCOT and risks related to financing and cost escalation, in the fourth quarter 2013 essentially all the joint venture's assets were impaired resulting in a charge of $140 million. The charge is reported as other deductions and included in the Competitive Electric segment's results. MHI's allocated portion of the impairment charge totaled $107 million and is reported in net loss attributable to noncontrolling interests in the statements of consolidated income (loss). A deferred income tax benefit was recorded for our $33 million allocated portion of the impairment charge and is included in income tax benefit in the statements of consolidated income (loss).
| |
| 9. | INTEREST EXPENSE AND RELATED CHARGES |
|
| | | | | | | | | | | |
| | Year Ended December 31, |
| | 2014 | | 2013 | | 2012 |
| Interest paid/accrued on debtor-in-possession financing | $ | 162 |
| | $ | — |
| | $ | — |
|
| Adequate protection amounts paid/accrued (a) | 827 |
| | — |
| | — |
|
| Interest paid/accrued on pre-petition debt (including net amounts paid/accrued under interest rate swaps) (b) | 1,158 |
| | 3,376 |
| | 3,269 |
|
| Interest expense on pre-petition toggle notes payable in additional principal (Note 12) | 65 |
| | 176 |
| | 209 |
|
| Noncash realized net loss on termination of interest rate swaps (offset in unrealized net gain) (c) | 1,237 |
| | — |
| | — |
|
| Unrealized mark-to-market net gain on interest rate swaps | (1,303 | ) | | (1,058 | ) | | (172 | ) |
| Amortization of interest rate swap (gains) losses at dedesignation of hedge accounting | (1 | ) | | 7 |
| | 8 |
|
| Amortization of fair value debt discounts resulting from purchase accounting | 7 |
| | 20 |
| | 44 |
|
| Amortization of debt issuance, amendment and extension costs and discounts | 66 |
| | 208 |
| | 186 |
|
| Capitalized interest | (17 | ) | | (25 | ) | | (36 | ) |
| Total interest expense and related charges | $ | 2,201 |
| | $ | 2,704 |
| | $ | 3,508 |
|
____________
| |
| (a) | Post-petition period only. |
| |
| (b) | Includes amounts related to interest rate swaps totaling $194 million, $625 million and $675 million for the years ended December 31, 2014, 2013 and 2012, respectively. Of the $194 million for the year ended December 31, 2014, $127 million is included in the liability arising from the termination of TCEH interest rate swaps discussed in Note 16. |
| |
| (c) | Includes $1.225 billion related to terminated TCEH interest rate swaps (see Note 16) and $12 million related to other interest rate swaps. |
Interest expense for the year ended December 31, 2014 reflects interest paid and accrued on debtor-in-possession financing (see Note 11), as well as adequate protection amounts paid and accrued, as approved by the Bankruptcy Court in June 2014 for the benefit of secured creditors of (a) $22.616 billion principal amount of outstanding borrowings from the TCEH Senior Secured Facilities, (b) $1.750 billion principal amount of outstanding TCEH Senior Secured Notes and (c) the $1.235 billion net liability related to the terminated TCEH interest rate swaps and natural gas hedging positions (see Note 16), in exchange for their consent to the senior secured, super-priority liens contained in the TCEH DIP Facility and any diminution in value of their interests in the pre-petition collateral from the Petition Date. The interest rate applicable to the adequate protection amounts paid/accrued at December 31, 2014 is 4.65% (one-month LIBOR plus 4.50%). In connection with the completion of a plan of reorganization of the Debtors, the amount of adequate protection payments may be adjusted to reflect the valuation of the TCEH Debtors determined in connection with confirmation of the plan of reorganization by the Bankruptcy Court.
The Bankruptcy Code generally restricts payment of interest on pre-petition debt, subject to certain exceptions. However, the Bankruptcy Court ordered the payment of adequate protection amounts as discussed above and post-petition interest payments on EFIH First Lien Notes in connection with the settlement discussed in Note 11. Payments may also be made upon approval by the Bankruptcy Court, at the federal judgment rate (see Note 13). Other than these amounts ordered by the Bankruptcy Court, effective April 29, 2014, we discontinued recording interest expense on outstanding pre-petition debt classified as liabilities subject to compromise (LSTC). Contractual interest represents amounts due under the contractual terms of the outstanding debt, including debt subject to compromise during the Chapter 11 Cases. Interest expense reported in the statements of consolidated income (loss) for the year ended December 31, 2014 does not include $919 million in contractual interest on pre-petition debt classified as LSTC, which has been stayed by the Bankruptcy Court effective on the Petition Date. For the post-petition period ended December 31, 2014, adequate protection paid/accrued excludes $40 million related to the TCEH first-lien interest rate and commodity hedge claims (see Note 16), as such amounts are not included in contractual interest amounts presented below.
|
| | | | | | | | | | | | | | | | |
| | | Post-Petition Period Through December 31, 2014 |
| Entity: | | Contractual Interest on
Debt Classified as LSTC | | Adequate Protection
Paid/Accrued | | Ordered Interest Paid/Accrued (a) | | Contractual Interest on
Debt Classified as LSTC Not
Paid/Accrued |
| EFH Corp. | | $ | 84 |
| | $ | — |
| | $ | — |
| | $ | 84 |
|
| EFIH | | 363 |
| | — |
| | 54 |
| | 309 |
|
| EFCH | | 4 |
| | — |
| | — |
| | 4 |
|
| TCEH | | 1,392 |
| | 787 |
| | — |
| | 605 |
|
| Eliminations (b) | | (83 | ) | | — |
| | — |
| | (83 | ) |
| Total | | $ | 1,760 |
| | $ | 787 |
| | $ | 54 |
| | $ | 919 |
|
___________
| |
| (a) | Interest on EFIH First Lien Notes exchanged and settled in June 2014 (see Note 11). |
| |
| (b) | Represents contractual interest on affiliate debt held by EFH Corp. and EFIH that is classified as liabilities subject to compromise. |
Expenses and income directly associated with the Chapter 11 Cases are reported separately in the statements of consolidated income (loss) as reorganization items as required by ASC 852, Reorganizations. Reorganization items also include adjustments to reflect the carrying value of liabilities subject to compromise (LSTC) at their estimated allowed claim amounts, as such adjustments are determined. The following table presents reorganization items incurred since the Petition Date as reported in the statements of consolidated income (loss):
|
| | | |
| | Post-Petition Period Through December 31, 2014 |
| Noncash liability adjustment arising from termination of interest rate swaps (Note 12) | $ | 278 |
|
| Fees associated with completion of TCEH and EFIH DIP Facilities | 187 |
|
| Loss on exchange and settlement of EFIH First Lien Notes (Note 5) | 108 |
|
| Expenses related to legal advisory and representation services | 127 |
|
| Expenses related to other professional consulting and advisory services | 95 |
|
| Contract claims adjustments and other | 20 |
|
| Total reorganization items | $ | 815 |
|
| |
| 11. | DEBTOR-IN-POSSESSION BORROWING FACILITIES AND LONG-TERM DEBT NOT SUBJECT TO COMPROMISE |
TCEH DIP Facility — The Bankruptcy Court approved the TCEH DIP Facility in June 2014. The TCEH DIP Facility currently provides for up to $3.375 billion of financing consisting of a revolving credit facility of up to $1.95 billion and a term loan facility of up to $1.425 billion. The facility initially provided for an additional $1.1 billion RCT Delayed Draw Letter of Credit commitment that has since been terminated as described below. The TCEH DIP Facility is a Senior Secured, Super-Priority Credit Agreement by and among the TCEH Debtors, the lenders that are party thereto from time to time and an administrative and collateral agent.
The TCEH DIP Facility and related available capacity at December 31, 2014 are presented below. Borrowings are reported in the consolidated balance sheets as borrowings under debtor-in-possession credit facilities.
|
| | | | | | | | | | | | |
| | | December 31, 2014 |
| TCEH DIP Facility | | Facility Limit | | Available Cash Borrowing Capacity | | Available Letter of Credit Capacity |
| TCEH DIP Revolving Credit Facility (a) | | $ | 1,950 |
| | $ | 1,950 |
| | $ | — |
|
| TCEH DIP Term Loan Facility (b) | | 1,425 |
| | — |
| | 450 |
|
| Total TCEH DIP Facility | | $ | 3,375 |
| | $ | 1,950 |
| | $ | 450 |
|
___________
| |
| (a) | Facility used for general corporate purposes. No amounts were borrowed at December 31, 2014. Pursuant to an order of the Bankruptcy Court, the TCEH Debtors may not have more than $1.650 billion of TCEH DIP Revolving Credit Facility cash borrowings outstanding without written consent of the TCEH committee of unsecured creditors and the ad hoc group of TCEH unsecured noteholders or further order of the Bankruptcy Court. |
| |
| (b) | Facility used for general corporate purposes, including but not limited to, $800 million for issuing letters of credit. |
At December 31, 2014, all $1.425 billion of the TCEH DIP Term Loan Facility has been borrowed. Of this borrowing, $800 million represents amounts that support issuances of letters of credit and have been funded to a collateral account. Of the collateral account amount, $450 million is reported as cash and cash equivalents and $350 million is reported as restricted cash, which amount represents outstanding letters of credit at December 31, 2014.
Amounts borrowed under the TCEH DIP Facility bear interest based on applicable LIBOR rates, subject to a 0.75% floor, plus 3%. At December 31, 2014, the interest rate on outstanding borrowings was 3.75%. The TCEH DIP Facility also provides for certain additional fees payable to the agents and lenders, as well as availability fees payable with respect to any unused portions of the available TCEH DIP Facility.
The TCEH DIP Facility will mature on the earlier of (a) the effective date of any reorganization plan, (b) upon the event of the sale of substantially all of TCEH's assets or (c) May 2016. The maturity date may be extended to no later than November 2016 subject to the satisfaction of certain conditions, including the payment of a 25 basis point extension fee, a requirement that an acceptable plan of reorganization has been filed on or prior to such extension and the availability of certain metrics of liquidity applicable to the TCEH Debtors. In addition, TCEH's existing cash collateral order expires in October 2015. The expiration of the cash collateral order is an event of default under the TCEH DIP Facility. Accordingly, absent an extension of the existing cash collateral order or a new cash collateral order (agreed by the facility's lenders and the Bankruptcy Court), the lenders under the TCEH DIP Facility could accelerate the obligations under the facility.
The TCEH Debtors' obligations under the TCEH DIP Facility are secured by a lien covering substantially all of the TCEH Debtors' assets, rights and properties, subject to certain exceptions set forth in the TCEH DIP Facility. The TCEH DIP Facility provides that all obligations thereunder constitute administrative expenses in the Chapter 11 Cases, with administrative priority and senior secured status under the Bankruptcy Code and, subject to certain exceptions set forth in the TCEH DIP Facility, have priority over any and all administrative expense claims, unsecured claims and costs and expenses in the Chapter 11 Cases. EFCH is a parent guarantor to the agreement governing the TCEH DIP Facility along with substantially all of TCEH’s subsidiaries, including all subsidiaries that are debtors in the Chapter 11 Cases.
The TCEH DIP Facility also permits certain hedging agreements to be secured on a pari-passu basis with the TCEH DIP Facility in the event those hedging agreements meet certain criteria set forth in the TCEH DIP Facility.
In June 2014, the RCT agreed to accept a collateral bond from TCEH of up to $1.1 billion, as a substitute for its self-bond, to secure mining land reclamation obligations. The collateral bond is a $1.1 billion carve-out from the super-priority liens under the TCEH DIP Facility that will enable the RCT to be paid before the TCEH DIP Facility lenders. As a result, in July 2014, TCEH terminated the $1.1 billion RCT Delayed Draw Letter of Credit commitment included in the original DIP facility.
The TCEH DIP Facility provides for affirmative and negative covenants applicable to the TCEH Debtors, including affirmative covenants requiring the TCEH Debtors to provide financial information, budgets and other information to the agents under the TCEH DIP Facility, and negative covenants restricting the TCEH Debtors' ability to incur additional indebtedness, grant liens, dispose of assets, make investments, pay dividends or take certain other actions, in each case except as permitted in the TCEH DIP Facility. The TCEH Debtors' ability to borrow under the TCEH DIP Facility is subject to the satisfaction of certain customary conditions precedent set forth therein.
The TCEH DIP Facility provides for certain customary events of default, including events of default resulting from non-payment of principal, interest or other amounts when due, material breaches of representations and warranties, material breaches of covenants in the TCEH DIP Facility or ancillary loan documents, cross-defaults under other agreements or instruments and the entry of material judgments against the TCEH Debtors. The agreement governing the TCEH DIP Facility includes a covenant that requires the Consolidated Superpriority Secured Net Debt to Consolidated EBITDA ratio not exceed 3.50 to 1.00, beginning with the test period ending June 30, 2014. Consolidated Superpriority Secured Net Debt consists of outstanding term loans and revolving credit exposure under the TCEH DIP Facility less unrestricted cash. Upon the existence of an event of default, the TCEH DIP Facility provides that all principal, interest and other amounts due thereunder will become immediately due and payable, either automatically or at the election of specified lenders.
EFIH DIP Facility and EFIH First Lien Notes Settlement — The Bankruptcy Court approved the EFIH DIP Facility in June 2014. The EFIH DIP Facility provides for a $5.4 billion first-lien debtor-in-possession financing facility, all of which was utilized as of December 31, 2014 as follows:
| |
| • | $1.836 billion of loans issued under the facility were issued as an exchange to holders of $1.673 billion principal amount of EFIH First Lien Notes plus accrued and unpaid interest totaling $78 million. Holders of substantially all of the principal amount exchanged received as payment in full a principal amount of loans under the DIP facility equal to 105% of the principal amount of the notes held plus 101% of the accrued and unpaid interest at the non-default rate on such principal; |
| |
| • | $2.438 billion of cash borrowings were used to repay all remaining $2.312 billion principal amount of EFIH First Lien Notes (plus accrued and unpaid interest totaling $128 million), and |
| |
| • | Remaining borrowings under the facility, net of fees, of $1.038 billion are held as cash and cash equivalents. |
The exchange and settlement of the EFIH First Lien Notes resulted in a loss of $108 million, reported in reorganization items, which represents the excess of the principal amounts of debt issued, cash repayments and deferred financing costs associated with the exchanged and settled debt over the carrying value of the exchanged and settled debt and related accrued interest.
The principal amounts outstanding under the EFIH DIP Facility bear interest based on applicable LIBOR rates, subject to a 1% floor, plus 3.25%. At December 31, 2014, outstanding borrowings under the EFIH DIP Facility totaled $5.4 billion at an annual interest rate of 4.25%. The EFIH DIP Facility is a non-amortizing loan that may, subject to certain limitations, be voluntarily prepaid by the EFIH Debtors, in whole or in part, without any premium or penalty.
The EFIH DIP Facility will mature on the earlier of (a) the effective date of any reorganization plan, (b) upon the event of the sale of substantially all of EFIH's assets or (c) June 2016. The maturity date may be extended to no later than December 2016 subject to the satisfaction of certain conditions, including the payment of a 25 basis point extension fee, a requirement that an acceptable plan of reorganization has been filed on or prior to such extension and the availability of certain metrics of liquidity applicable to EFIH and EFIH Finance.
EFIH's obligations under the EFIH DIP Facility are secured by a first lien covering substantially all of EFIH's assets, rights and properties, subject to certain exceptions set forth in the EFIH DIP Facility. The EFIH DIP Facility provides that all obligations thereunder constitute administrative expenses in the Chapter 11 Cases, with administrative priority and senior secured status under the Bankruptcy Code and, subject to certain exceptions set forth in the EFIH DIP Facility, will have priority over any and all administrative expense claims, unsecured claims and costs and expenses in the Chapter 11 Cases.
The EFIH DIP Facility provides for affirmative and negative covenants applicable to EFIH and EFIH Finance, including affirmative covenants requiring EFIH and EFIH Finance to provide financial information, budgets and other information to the agents under the EFIH DIP Facility, and negative covenants restricting EFIH's and EFIH Finance's ability to incur additional indebtedness, grant liens, dispose of assets, pay dividends or take certain other actions, in each case except as permitted in the EFIH DIP Facility. The EFIH DIP Facility also includes a minimum liquidity covenant pursuant to which EFIH cannot allow the amount of its unrestricted cash (as defined in the EFIH DIP Facility) to be less than $150 million. The Oncor Ring-Fenced Entities are not restricted subsidiaries for purposes of the EFIH DIP Facility.
The EFIH DIP Facility provides for certain customary events of default, including events of default resulting from non-payment of principal, interest or other amounts when due, material breaches of representations and warranties, material breaches of covenants in the EFIH DIP Facility or ancillary loan documents, cross-defaults under other agreements or instruments and the entry of material judgments against EFIH. Upon the existence of an event of default, the EFIH DIP Facility provides that all principal, interest and other amounts due thereunder will become immediately due and payable, either automatically or at the election of specified lenders.
The EFIH DIP Facility permits, subject to certain terms, conditions and limitations set forth in the EFIH DIP Facility, EFIH to incur incremental junior lien subordinated debt in an aggregate amount not to exceed $3 billion.
Long-Term Debt Not Subject to Compromise — Long-term debt represents pre-petition liabilities that are not subject to compromise due to the debt being fully collateralized or specific orders from the Bankruptcy Court approving repayment of the debt. As of December 31, 2014, long-term debt not subject to compromise totals $167 million, including $39 million due currently and reported in other current liabilities in the consolidated balance sheets, and consists of a non-Debtor $40 million principal amount of debt related to a building financing (plus $7 million of unamortized fair value premium), $50 million principal amount of debt approved by the Bankruptcy Court for repayment (less $3 million of unamortized fair value discount), $29 million principal amount of debt issued by a trust and secured by assets held by the trust (less $2 million of unamortized discount), $44 million of capitalized lease obligations and $2 million principal amount of debt related to a coal purchase agreement.
| |
| 12. | LIABILITIES SUBJECT TO COMPROMISE |
The amounts classified as liabilities subject to compromise (LSTC) reflect the company's estimate of pre-petition liabilities and other expected allowed claims to be addressed in the Chapter 11 Cases and may be subject to future adjustment as the Chapter 11 Cases proceed. Debt amounts include related unamortized deferred financing costs and discounts/premiums. Amounts classified to LSTC do not include pre-petition liabilities that are fully secured by letters of credit or cash deposits. The following table presents LSTC as reported in the consolidated balance sheets at December 31, 2014:
|
| | | |
| | December 31,
2014 |
| Notes, loans and other debt per the following table | $ | 35,124 |
|
| Accrued interest on notes, loans and other debt | 804 |
|
| Net liability under terminated TCEH interest rate swap and natural gas hedging agreements (Note 16) | 1,235 |
|
| Trade accounts payable and accrued liabilities | 269 |
|
| Total liabilities subject to compromise | $ | 37,432 |
|
Pre-Petition Notes, Loans and Other Debt Reported as Liabilities Subject to Compromise
Amounts reported below as of December 31, 2014 represent principal amounts of pre-petition notes, loans and other debt reported as liabilities subject to compromise. Amounts reported below as of December 31, 2013 represent notes, loans and other debt reported as current liabilities in our consolidated balance sheets.
|
| | | | | | | |
| | December 31, |
| | 2014 | | 2013 |
| EFH Corp. (parent entity) | | | |
| 9.75% Fixed Senior Notes due October 15, 2019 | $ | 2 |
| | $ | 2 |
|
| 10% Fixed Senior Notes due January 15, 2020 | 3 |
| | 3 |
|
| 10.875% Fixed Senior Notes due November 1, 2017 | 33 |
| | 33 |
|
| 11.25% / 12.00% Senior Toggle Notes due November 1, 2017 | 27 |
| | 27 |
|
| 5.55% Fixed Series P Senior Notes due November 15, 2014 (a) | 90 |
| | 90 |
|
| 6.50% Fixed Series Q Senior Notes due November 15, 2024 (a) | 201 |
| | 201 |
|
| 6.55% Fixed Series R Senior Notes due November 15, 2034 (a) | 291 |
| | 291 |
|
| 8.82% Building Financing due semiannually through February 11, 2022 (b) | — |
| | 46 |
|
| Unamortized fair value premium related to Building Financing (b)(c) | — |
| | 9 |
|
| Unamortized fair value discount (c) | (118 | ) | | (121 | ) |
| Total EFH Corp. | 529 |
| | 581 |
|
| EFIH | | | |
| 6.875% Fixed Senior Secured First Lien Notes due August 15, 2017 (d) | — |
| | 503 |
|
| 10% Fixed Senior Secured First Lien Notes due December 1, 2020 (d) | — |
| | 3,482 |
|
| 11% Fixed Senior Secured Second Lien Notes due October 1, 2021 | 406 |
| | 406 |
|
| 11.75% Fixed Senior Secured Second Lien Notes due March 1, 2022 | 1,750 |
| | 1,750 |
|
| 11.25% / 12.25% Senior Toggle Notes due December 1, 2018 | 1,566 |
| | 1,566 |
|
| 9.75% Fixed Senior Notes due October 15, 2019 | 2 |
| | 2 |
|
| Unamortized premium | 243 |
| | 284 |
|
| Unamortized discount | (121 | ) | | (146 | ) |
| Total EFIH | 3,846 |
| | 7,847 |
|
| EFCH | | | |
| 9.58% Fixed Notes due in annual installments through December 4, 2019 (b) | — |
| | 29 |
|
| 8.254% Fixed Notes due in quarterly installments through December 31, 2021 (b) | — |
| | 34 |
|
| Floating Rate Junior Subordinated Debentures, Series D due January 30, 2037 | 1 |
| | 1 |
|
| 8.175% Fixed Junior Subordinated Debentures, Series E due January 30, 2037 | 8 |
| | 8 |
|
| Unamortized fair value discount (c) | (1 | ) | | (6 | ) |
| Total EFCH | 8 |
| | 66 |
|
| TCEH | | | |
| Senior Secured Facilities: | | | |
| TCEH Floating Rate Term Loan Facilities due October 10, 2014 | 3,809 |
| | 3,809 |
|
| TCEH Floating Rate Letter of Credit Facility due October 10, 2014 | 42 |
| | 42 |
|
| TCEH Floating Rate Revolving Credit Facility due October 10, 2016 | 2,054 |
| | 2,054 |
|
| TCEH Floating Rate Term Loan Facilities due October 10, 2017 (a) | 15,691 |
| | 15,691 |
|
| TCEH Floating Rate Letter of Credit Facility due October 10, 2017 | 1,020 |
| | 1,020 |
|
| 11.5% Fixed Senior Secured Notes due October 1, 2020 | 1,750 |
| | 1,750 |
|
| 15% Fixed Senior Secured Second Lien Notes due April 1, 2021 | 336 |
| | 336 |
|
| 15% Fixed Senior Secured Second Lien Notes due April 1, 2021, Series B | 1,235 |
| | 1,235 |
|
| 10.25% Fixed Senior Notes due November 1, 2015 (a) | 1,833 |
| | 1,833 |
|
| 10.25% Fixed Senior Notes due November 1, 2015, Series B (a) | 1,292 |
| | 1,292 |
|
| 10.50% / 11.25% Senior Toggle Notes due November 1, 2016 | 1,749 |
| | 1,749 |
|
|
| | | | | | | |
| | December 31, |
| | 2014 | | 2013 |
| Pollution Control Revenue Bonds: | | | |
| Brazos River Authority: | | | |
| 5.40% Fixed Series 1994A due May 1, 2029 | 39 |
| | 39 |
|
| 7.70% Fixed Series 1999A due April 1, 2033 | 111 |
| | 111 |
|
| 7.70% Fixed Series 1999C due March 1, 2032 | 50 |
| | 50 |
|
| 8.25% Fixed Series 2001A due October 1, 2030 | 71 |
| | 71 |
|
| 8.25% Fixed Series 2001D-1 due May 1, 2033 | 171 |
| | 171 |
|
| Floating Series 2001D-2 due May 1, 2033 (e) | — |
| | 97 |
|
| Floating Taxable Series 2001I due December 1, 2036 (e) | — |
| | 62 |
|
| Floating Series 2002A due May 1, 2037 (e) | — |
| | 45 |
|
| 6.30% Fixed Series 2003B due July 1, 2032 | 39 |
| | 39 |
|
| 6.75% Fixed Series 2003C due October 1, 2038 | 52 |
| | 52 |
|
| 5.40% Fixed Series 2003D due October 1, 2029 | 31 |
| | 31 |
|
| 5.00% Fixed Series 2006 due March 1, 2041 | 100 |
| | 100 |
|
| Sabine River Authority of Texas: | | | |
| 6.45% Fixed Series 2000A due June 1, 2021 | 51 |
| | 51 |
|
| 5.20% Fixed Series 2001C due May 1, 2028 | 70 |
| | 70 |
|
| 5.80% Fixed Series 2003A due July 1, 2022 | 12 |
| | 12 |
|
| 6.15% Fixed Series 2003B due August 1, 2022 | 45 |
| | 45 |
|
| Trinity River Authority of Texas: |
| |
|
| 6.25% Fixed Series 2000A due May 1, 2028 | 14 |
| | 14 |
|
| Unamortized fair value discount related to pollution control revenue bonds (c) | (103 | ) | | (105 | ) |
| Other: | | | |
| 7.48% Fixed Secured Facility Bonds with amortizing payments through January 2017 (b) | — |
| | 36 |
|
| 7.46% Fixed Secured Facility Bonds with amortizing payments through January 2015 (b) | — |
| | 4 |
|
| Capital lease obligations (b) | — |
| | 52 |
|
| Other | 1 |
| | 3 |
|
| Unamortized discount | (91 | ) | | (103 | ) |
| Total TCEH | 31,474 |
| | 31,758 |
|
| Deferred debt issuance and extension costs (f) | (733 | ) | | — |
|
| Total EFH Corp. consolidated notes, loans and other debt | $ | 35,124 |
| | $ | 40,252 |
|
___________
(a)Excludes the following principal amounts of debt held by EFIH or EFH Corp. (parent entity) and eliminated in consolidation. |
| | | | | | | |
| | December 31, |
| | 2014 | | 2013 |
| EFH Corp. 5.55% Fixed Series P Senior Notes due November 15, 2014 | 281 |
| | 281 |
|
| EFH Corp. 6.50% Fixed Series Q Senior Notes due November 15, 2024 | 545 |
| | 545 |
|
| EFH Corp. 6.55% Fixed Series R Senior Notes due November 15, 2034 | 456 |
| | 456 |
|
| TCEH Floating Rate Term Loan Facilities due October 10, 2017 | 19 |
| | 19 |
|
| TCEH 10.25% Fixed Senior Notes due November 1, 2015 | 213 |
| | 213 |
|
| TCEH 10.25% Fixed Senior Notes due November 1, 2015, Series B | 150 |
| | 150 |
|
| Total | $ | 1,664 |
| | $ | 1,664 |
|
| |
| (b) | Represents pre-petition debt not subject to compromise classified as debt in the consolidated balance sheet at December 31, 2014. See notes (a) and (b) to the consolidated balance sheets. |
| |
| (c) | Amount represents unamortized fair value adjustments recorded under purchase accounting. |
| |
| (d) | The EFIH First Lien Notes were exchanged or settled in June 2014 (see Note 11). |
| |
| (e) | These bonds were tendered and settled through letter of credit draws. |
| |
| (f) | Deferred debt issuance and extension costs were reported in other noncurrent assets at December 31, 2013. |
Repayment of EFIH Second Lien Notes
In March 2015, with the approval of the Bankruptcy Court, EFIH used some of its cash to repay (Repayment) $735 million, including interest at contractual rates, in amounts outstanding under EFIH's pre-petition 11.00% Second Lien Notes due 2021 (11.00% Notes) and 11.75% Second Lien Notes due 2022 (11.75% Notes) and $15 million in certain fees and expenses of the trustee for such notes. The Repayment required the requisite consent of the lenders under its DIP Facility. EFIH received such consent from approximately 97% of the lenders under its DIP Facility in consideration of an aggregate consent fee equal to approximately $13 million. As a result of the Repayment, as of the date hereof, the principal amount outstanding on the 11.00% Notes and 11.75% are $322 million and $1.388 billion, respectively.
Debt Related Activity in 2014
Repayments of debt in the year ended December 31, 2014 totaled $241 million and consisted of $233 million of payments of principal at scheduled maturity or mandatory tender and remarketing dates (including $204 million of pollution control revenue bond and $11 million of fixed secured facility bond payments) and $8 million of contractual payments under capital leases.
Borrowings under the TCEH Letter of Credit Facility have been recorded by TCEH as restricted cash that supports issuances of letters of credit. At December 31, 2014, the restricted cash related to the TCEH Letter of Credit Facility totaled $551 million and supports $184 million in letters of credit outstanding. Due to the default under the TCEH Senior Secured Facilities, the remaining $367 million letter of credit capacity is no longer available. In the first quarter of 2014, TCEH issued a $157 million letter of credit to a subsidiary of EFH Corp. to secure its current and future amounts payable to the subsidiary arising from recurring transactions in the normal course of business, and through the fourth quarter of 2014, the subsidiary drew on the letter of credit in the amount of $150 million to settle amounts due from TCEH. The remaining $7 million under the letter of credit expired in July 2014. In the year ended December 31, 2014, $245 million of letters of credit were drawn upon by unaffiliated counterparties to settle amounts receivable from TCEH, including $204 million related to pollution control revenue bonds that were tendered as noted in the table above.
Debt Related Activity in 2013
Principal amounts of debt issued in the year ended December 31, 2013 totaled $1.904 billion. These issuances consisted of $1.302 billion of EFIH 10% Notes issued in exchanges as discussed below, $340 million of incremental term loans under the TCEH Term Loan Facilities in consideration of extension of maturity of the facilities, $173 million of EFIH Toggle Notes issued though the PIK election in lieu of making cash interest payments, and $89 million of EFIH Toggle Notes issued in debt exchanges as discussed below.
Repayments of debt in the year ended December 31, 2013 totaled $105 million and consisted of $93 million of payments of principal at scheduled maturity or mandatory tender and remarketing dates (including $60 million of pollution control revenue bond and $17 million of fixed secured facility bond payments) and $12 million of contractual payments under capital leases.
In April 2013, TCEH acquired for $40 million in cash the owner participant interest in a trust established to lease six natural gas combustion turbines to TCEH. The interest in the trust was held by an unaffiliated party. The trust was consolidated in the second quarter of 2013. No gain or loss was recognized on the transaction. The estimated fair value of the combustion turbine assets of $83 million approximated the total of the estimated fair value of the debt assumed and cash paid. In recording the combustion turbine assets, the fair value was reduced by the remaining deferred lease liability and the unamortized lease valuation reserve established in accounting for the Merger, which were reversed and totaled $18 million.
EFIH Debt Exchanges and Distributions Involving EFH Corp. Debt — In exchanges in January 2013, EFIH and EFIH Finance issued $1.302 billion principal amount of EFIH 10% Senior Secured Notes due 2020 (New EFIH 10% Notes) in exchange for $1.310 billion total principal amount of EFH Corp. and EFIH senior secured notes consisting of: (i) $113 million principal amount of EFH Corp. 9.75% Senior Secured Notes due 2019 (EFH Corp. 9.75% Notes), (ii) $1.058 billion principal amount of EFH Corp. 10% Senior Secured Notes due 2020 (EFH Corp. 10% Notes), and (iii) $139 million principal amount of EFIH 9.75% Senior Secured Notes due 2019 (EFIH 9.75% Notes). The New EFIH 10% Notes had terms and conditions substantially the same as the existing EFIH 10% Notes discussed below. EFIH cancelled the EFIH notes it received in the exchanges.
In connection with these debt exchange transactions, EFH Corp. received the requisite consents from holders of the EFH Corp. 9.75% Notes and EFH Corp. 10% Notes and EFIH received the requisite consents from holders of the EFIH 9.75% Notes to certain amendments to the respective indentures governing such notes. These amendments, among other things, (i) eliminated EFIH's pledge of its 100% ownership of the membership interests it owns in Oncor Holdings as collateral for the EFIH 9.75% Notes, (ii) made EFCH and EFIH unrestricted subsidiaries under the EFH Corp. 9.75% Notes and EFH Corp. 10% Notes, thereby eliminating EFCH's unsecured and EFIH's secured guarantees of the notes, (iii) eliminated substantially all of the restrictive covenants in the indentures and (iv) eliminated certain events of default, modified covenants regarding mergers and consolidations and modified or eliminated certain other provisions in these indentures.
In additional exchanges in January 2013, EFIH and EFIH Finance issued $89 million principal amount of additional 11.25%/12.25% Toggle Notes due 2018 (EFIH Toggle Notes) in exchange for $95 million total principal amount of EFH Corp. senior notes consisting of: (i) $31 million principal amount of EFH Corp. 10.875% Senior Notes due 2017 (EFH Corp. 10.875% Notes), (ii) $33 million principal amount of EFH Corp. 11.25%/12.00% Senior Toggle Notes due 2017 (EFH Corp. Toggle Notes), (iii) $2 million principal amount of EFH Corp. 5.55% Series P Notes due 2014 (EFH Corp. 5.55% Notes) and (iv) $29 million principal amount of EFH Corp. 6.50% Series Q Notes due 2024 (EFH Corp. 6.50% Notes). The additional EFIH Toggle Notes have the same terms and conditions as the existing EFIH Toggle Notes discussed below.
In the first quarter of 2013, EFIH distributed to EFH Corp. $6.360 billion principal amount of EFH Corp. debt that it previously received in debt exchanges, including $1.235 billion received in January 2013. EFH Corp. cancelled the notes, leaving $1.361 billion principal amount of affiliate debt still held by EFIH. The distribution included $1.715 billion principal amount of EFH Corp. 10.875% Notes, $3.474 billion principal amount of EFH Corp. Toggle Notes, $1.058 billion principal amount of EFH Corp. 10% Notes and $113 million principal amount of EFH Corp. 9.75% Notes.
Accounting and Income Tax Effects of the January 2013 Debt Exchanges — In consideration of the circumstances and terms of the exchanges, accounting rules require that the net loss on the exchanges, which totaled $21 million, be deferred and amortized to interest expense over the life of the debt issued. The deferred loss is reported as debt discount associated with the EFIH 10% Notes and EFIH Toggle Notes. For federal income tax purposes, the transactions resulted in cancellation of debt income of $11 million that was offset by operating losses.
Information Regarding Significant Pre-Petition Debt
TCEH elected not to make interest payments due in April 2014 totaling $123 million on certain debt obligations.
The TCEH pre-petition debt described below is junior in right of priority and payment to the TCEH DIP Facility, and the EFIH pre-petition debt described below is junior in right of priority and payment to the EFIH DIP Facility.
TCEH Senior Secured Facilities — Borrowings under the TCEH Senior Secured Facilities total $22.616 billion and consist of:
| |
| • | $3.809 billion of TCEH Term Loan Facilities with interest at LIBOR plus 3.50%; |
| |
| • | $15.691 billion of TCEH Term Loan Facilities with interest at LIBOR plus 4.50%, excluding $19 million aggregate principal amount held by EFH Corp.; |
| |
| • | $42 million of cash borrowed under the TCEH Letter of Credit Facility with interest at LIBOR plus 3.50%; |
| |
| • | $1.020 billion of cash borrowed under the TCEH Letter of Credit Facility with interest at LIBOR plus 4.50%, and |
| |
| • | Amounts borrowed under the TCEH Revolving Credit Facility, which represent the entire amount of commitments under the facility totaling $2.054 billion. |
The TCEH Senior Secured Facilities are fully and unconditionally guaranteed jointly and severally on a senior secured basis by EFCH, and subject to certain exceptions, each existing and future direct or indirect wholly owned US subsidiary of TCEH. The TCEH Senior Secured Facilities, the TCEH Senior Secured Notes and the TCEH first lien hedges (or any termination amounts related thereto), discussed below, are secured on a first priority basis by (i) substantially all of the current and future assets of TCEH and TCEH's subsidiaries who are guarantors of such facilities and (ii) pledges of the capital stock of TCEH and certain current and future direct or indirect subsidiaries of TCEH.
TCEH 11.5% Senior Secured Notes — The principal amount of the TCEH 11.5% Senior Secured Notes totals $1.750 billion with interest payable at a fixed rate of 11.5% per annum. The notes are fully and unconditionally guaranteed on a joint and several basis by EFCH and each subsidiary of TCEH that guarantees the TCEH Senior Secured Facilities (collectively, the Guarantors). The notes are secured, on a first-priority basis, by security interests in all of the assets of TCEH, and the guarantees are secured on a first-priority basis by all of the assets and equity interests held by the Guarantors, in each case, to the extent such assets and equity interests secure obligations under the TCEH Senior Secured Facilities (the TCEH Collateral), subject to certain exceptions and permitted liens.
The notes are (i) senior obligations and rank equally in right of payment with all senior indebtedness of TCEH, (ii) senior in right of payment to all existing or future unsecured and second-priority secured debt of TCEH to the extent of the value of the TCEH Collateral and (iii) senior in right of payment to any future subordinated debt of TCEH. These notes are effectively subordinated to all secured obligations of TCEH that are secured by assets other than the TCEH Collateral, to the extent of the value of the assets securing such obligations.
The guarantees of the TCEH Senior Secured Notes by the Guarantors are effectively senior to any unsecured and second-priority debt of the Guarantors to the extent of the value of the TCEH Collateral. The guarantees are effectively subordinated to all debt of the Guarantors secured by assets that are not part of the TCEH Collateral, to the extent of the value of the collateral securing that debt.
TCEH 15% Senior Secured Second Lien Notes (including Series B) — The principal amount of the TCEH 15% Senior Secured Second Lien Notes totals $1.571 billion with interest at a fixed rate of 15% per annum. The notes are fully and unconditionally guaranteed on a joint and several basis by EFCH and, subject to certain exceptions, each subsidiary of TCEH that guarantees the TCEH Senior Secured Facilities. The notes are secured, on a second-priority basis, by security interests in all of the assets of TCEH, and the guarantees (other than the guarantee of EFCH) are secured on a second-priority basis by all of the assets and equity interests of all of the Guarantors other than EFCH (collectively, the Subsidiary Guarantors), in each case, to the extent such assets and security interests secure obligations under the TCEH Senior Secured Facilities on a first-priority basis, subject to certain exceptions (including the elimination of the pledge of equity interests of any Subsidiary Guarantor to the extent that separate financial statements would be required to be filed with the SEC for such Subsidiary Guarantor under Rule 3-16 of Regulation S-X) and permitted liens. The guarantee from EFCH is not secured.
The notes are senior obligations of the issuer and rank equally in right of payment with all senior indebtedness of TCEH, are senior in right of payment to all existing or future unsecured debt of TCEH to the extent of the value of the TCEH Collateral (after taking into account any first-priority liens on the TCEH Collateral) and are senior in right of payment to any future subordinated debt of TCEH. These notes are effectively subordinated to TCEH's obligations under the TCEH Senior Secured Facilities, the TCEH Senior Secured Notes and TCEH's commodity and interest rate hedges that are secured by a first-priority lien on the TCEH Collateral and any future obligations subject to first-priority liens on the TCEH Collateral, to the extent of the value of the TCEH Collateral, and to all secured obligations of TCEH that are secured by assets other than the TCEH Collateral, to the extent of the value of the assets securing such obligations.
The guarantees of the TCEH Senior Secured Second Lien Notes by the Subsidiary Guarantors are effectively senior to any unsecured debt of the Subsidiary Guarantors to the extent of the value of the TCEH Collateral (after taking into account any first-priority liens on the TCEH Collateral). These guarantees are effectively subordinated to all debt of the Subsidiary Guarantors secured by the TCEH Collateral on a first-priority basis or that is secured by assets that are not part of the TCEH Collateral, to the extent of the value of the collateral securing that debt. EFCH's guarantee ranks equally with its unsecured debt (including debt it guarantees on an unsecured basis) and is effectively subordinated to any of its secured debt to the extent of the value of the collateral securing that debt.
TCEH 10.25% Senior Notes (including Series B) and 10.50%/11.25% Senior Toggle Notes (collectively, the TCEH Senior Notes) — The principal amount of the TCEH Senior Notes totals $4.874 billion, excluding $363 million aggregate principal amount held by EFH Corp. and EFIH, and the notes are fully and unconditionally guaranteed on a joint and several unsecured basis by TCEH's direct parent, EFCH, and by each subsidiary that guarantees the TCEH Senior Secured Facilities. The TCEH 10.25% Notes bore interest at a fixed rate of 10.25% per annum. The TCEH Toggle Notes bore interest at a fixed rate of 10.50% per annum.
EFIH 6.875% Senior Secured First Lien Notes — There were no principal amounts of the EFIH 6.875% Notes outstanding at December 31, 2014 as the notes were exchanged or settled in June 2014 as discussed in Note 11. The notes bore interest at a fixed rate of 6.875% per annum. The EFIH 6.875% Notes were secured on a first-priority basis by EFIH's pledge of its 100% ownership of the membership interests in Oncor Holdings (the EFIH Collateral) on an equal and ratable basis with the EFIH 10% Notes (discussed below).
EFIH 10% Senior Secured First Lien Notes — There were no principal amounts of the EFIH 10% Notes outstanding at December 31, 2014 as the notes were exchanged or settled in June 2014 as discussed in Note 11. The notes bore interest at a fixed rate of 10% per annum. The notes were secured by the EFIH Collateral on an equal and ratable basis with the EFIH 6.875% Notes.
EFIH 11% Senior Secured Second Lien Notes — The principal amount of the EFIH 11% Notes totals $406 million with interest at a fixed rate of 11% per annum. The EFIH 11% Notes are secured on a second-priority basis by the EFIH Collateral on an equal and ratable basis with the EFIH 11.75% Notes. See discussion above related to the repayment of a portion of these notes in March 2015.
The EFIH 11% Notes are senior obligations of EFIH and EFIH Finance and rank equally in right of payment with all senior indebtedness of EFIH and are effectively senior in right of payment to all existing or future unsecured debt of EFIH to the extent of the value of the EFIH Collateral. The notes have substantially the same terms as the EFIH 11.75% Notes discussed below, and the holders of the EFIH 11% Notes will generally vote as a single class with the holders of the EFIH 11.75% Notes.
EFIH 11.75% Senior Secured Second Lien Notes — The principal amount of the EFIH 11.75% Notes totals $1.750 billion with interest at a fixed rate of 11.75% per annum. The EFIH 11.75% Notes are secured on a second-priority basis by the EFIH Collateral on an equal and ratable basis with the EFIH 11% Notes. The EFIH 11.75% Notes have substantially the same covenants as the EFIH 11% Notes, and the holders of the EFIH 11.75% Notes will generally vote as a single class with the holders of the EFIH 11% Notes. See discussion above related to the repayment of a portion of these notes in March 2015.
The EFIH 11.75% Notes were issued in private placements and are not registered under the Securities Act. EFIH had agreed to use its commercially reasonable efforts to register with the SEC notes having substantially identical terms as the EFIH 11.75% Notes (except for provisions relating to transfer restrictions and payment of additional interest) as part of an offer to exchange freely tradable notes for the EFIH 11.75% Notes. Because the exchange offer was not completed, the annual interest rate on the EFIH 11.75% Notes increased by 25 basis points (to 12.00%) on February 6, 2013 and by an additional 25 basis points (to 12.25%) on May 6, 2013.
EFIH 11.25%/12.25% Senior Toggle Notes — The principal amount of the EFIH Toggle Notes totals $1.566 billion with interest at a fixed rate of 11.25% per annum for cash interest and 12.25% per annum for PIK Interest. The terms of the Toggle Notes include an election by EFIH, for any interest period until June 1, 2016, to pay interest on the Toggle Notes (i) entirely in cash; (ii) by increasing the principal amount of the notes or by issuing new EFIH Toggle Notes (PIK Interest); or (iii) 50% in cash and 50% in PIK Interest. EFIH made its pre-petition interest payments on the EFIH Toggle Notes by using the PIK feature of those notes.
The EFIH Toggle Notes were issued in private placements and are not registered under the Securities Act. EFIH had agreed to use its commercially reasonable efforts to register with the SEC notes having substantially identical terms as the EFIH Toggle Notes (except for provisions relating to transfer restrictions and payment of additional interest) as part of an offer to exchange freely tradable notes for the EFIH Toggle Notes. Because the exchange offer was not completed, the annual interest rate on the EFIH Toggle Notes increased by 25 basis points (to 11.50%) in December 2013 and by an additional 25 basis points (to 11.75%) in March 2014.
EFH Corp. 10.875% Senior Notes and 11.25%/12.00% Senior Toggle Notes — The collective principal amount of these notes totals $60 million. The notes are fully and unconditionally guaranteed on a joint and several senior unsecured basis by EFCH and EFIH. The notes bore interest at a fixed rate for the 10.875% Notes of 10.875% per annum and at a fixed rate for the Toggle Notes of 11.25% per annum.
Material Cross Default/Acceleration Provisions — Certain of our pre-petition financing arrangements contain provisions that result in an event of default if there were a failure under other financing arrangements to meet payment terms or to observe other covenants that could or does result in an acceleration of payments due. Such provisions are referred to as "cross default" or "cross acceleration" provisions. The Bankruptcy Filing triggered defaults on our pre-petition debt obligations, but pursuant to the Bankruptcy Code, the creditors are stayed from taking any actions against the Debtors as a result of such defaults.
Intercreditor Agreement — TCEH has entered into an intercreditor agreement with Citibank, N.A. and five secured commodity hedge counterparties (the Secured Commodity Hedge Counterparties). The intercreditor agreement takes into account, among other things, the possibility that TCEH could have issued notes and/or loans secured by collateral (other than the collateral that secures the TCEH Senior Secured Facilities) that ranks on parity with, or junior to, TCEH's existing first lien obligations under the TCEH Senior Secured Facilities. The Intercreditor Agreement provides that the lien granted to the Secured Commodity Hedge Counterparties ranks pari passu with the lien granted with respect to the collateral of the secured parties under the TCEH Senior Secured Facilities. The Intercreditor Agreement also provides that the Secured Commodity Hedge Counterparties are entitled to share, on a pro rata basis, in the proceeds of any liquidation of such collateral in connection with a foreclosure on such collateral in an amount provided in the TCEH Senior Secured Facilities. The Intercreditor Agreement also provides that the Secured Commodity Hedge Counterparties have voting rights with respect to any amendment or waiver of any provision of the Intercreditor Agreement that changes the priority of the Secured Commodity Hedge Counterparties' lien on such collateral relative to the priority of lien granted to the secured parties under the TCEH Senior Secured Facilities or the priority of payments to the Secured Commodity Hedge Counterparties upon a foreclosure and liquidation of such collateral relative to the priority of the lien granted to the secured parties under the TCEH Senior Secured Facilities.
Second Lien Intercreditor Agreement — TCEH has also entered into a second lien intercreditor agreement (the Second Lien Intercreditor Agreement) with Citibank, N.A., as senior collateral agent, and The Bank of New York Mellon Trust Company, N.A., as initial second priority representative. The Second Lien Intercreditor Agreement provides that liens on the collateral that secure the obligations under the TCEH Senior Secured Facilities, the obligations of the Secured Commodity Hedge Counterparties and any other obligations which are permitted to be secured on a pari passu basis therewith (collectively, the First Lien Obligations) rank prior to the liens on such collateral securing the obligations under the TCEH Senior Secured Second Lien Notes, and any other obligations which are permitted to be secured on a pari passu basis (collectively, the Second Lien Obligations). The Second Lien Intercreditor Agreement provides that the holders of the First Lien Obligations are entitled to the proceeds of any liquidation of such collateral in connection with a foreclosure on such collateral until paid in full, and that the holders of the Second Lien Obligations are not entitled to receive any such proceeds until the First Lien Obligations have been paid in full. The Second Lien Intercreditor Agreement also provides that the holders of the First Lien Obligations control enforcement actions with respect to such collateral, and the holders of the Second Lien Obligations are not entitled to commence any such enforcement actions, with limited exceptions. The Second Lien Intercreditor Agreement also provides that releases of the liens on the collateral by the holders of the First Lien Obligations automatically require that the liens on such collateral by the holders of the Second Lien Obligations be automatically released, and that amendments, waivers or consents with respect to any of the collateral documents in connection with the First Lien Obligations apply automatically to any comparable provision of the collateral documents in connection with the Second Lien Obligations.
EFIH Collateral Trust Agreement — EFIH entered into a Collateral Trust Agreement, among EFIH, The Bank of New York Mellon Trust Company, N.A., as First Lien Trustee, the other Secured Debt Representatives named therein and the Collateral Trustee. The Collateral Trust Agreement governing the pledge of collateral generally provides that the holders of a majority of the debt secured by a first priority lien on the collateral, including the notes and other future debt incurred by EFH or EFIH secured by the collateral equally and ratably, have, subject to certain limited exceptions, the exclusive right to manage, perform and enforce the terms of the security documents securing the rights of secured debt holders in the collateral, and to exercise and enforce all privileges, rights and remedies thereunder.
| |
| 13. | COMMITMENTS AND CONTINGENCIES |
Contractual Commitments
At December 31, 2014, we had contractual commitments, some of which are subject to potential rejection in the Chapter 11 Cases, under energy-related contracts, leases and other agreements as follows:
|
| | | | | | | | | | | | | | | |
| | Coal purchase and transportation agreements | | Pipeline transportation and storage reservation fees | | Nuclear Fuel Contracts | | Other Contracts |
| 2015 | $ | 309 |
| | $ | 14 |
| | $ | 156 |
| | $ | 81 |
|
| 2016 | 95 |
| | 1 |
| | 95 |
| | 10 |
|
| 2017 | 86 |
| | 1 |
| | 74 |
| | 3 |
|
| 2018 | — |
| | 1 |
| | 112 |
| | 3 |
|
| 2019 | — |
| | 1 |
| | 66 |
| | 3 |
|
| Thereafter | — |
| | 8 |
| | 313 |
| | 84 |
|
| Total | $ | 490 |
| | $ | 26 |
| | $ | 816 |
| | $ | 184 |
|
Expenditures under our coal purchase and coal transportation agreements totaled $348 million, $353 million and $245 million for the years ended December 31, 2014, 2013 and 2012, respectively.
At December 31, 2014, future minimum lease payments under both capital leases and operating leases are as follows:
|
| | | | | | | |
| | Capital Leases | | Operating Leases (a) |
| 2015 | $ | 6 |
| | $ | 24 |
|
| 2016 | 7 |
| | 25 |
|
| 2017 | 35 |
| | 35 |
|
| 2018 | — |
| | 33 |
|
| 2019 | — |
| | 19 |
|
| Thereafter | — |
| | 116 |
|
| Total future minimum lease payments | 48 |
| | $ | 252 |
|
| Less amounts representing interest | 4 |
| | |
| Present value of future minimum lease payments | 44 |
| | |
| Less current portion | 5 |
| | |
| Long-term capital lease obligation | $ | 39 |
| | |
___________
| |
| (a) | Includes operating leases with initial or remaining noncancellable lease terms in excess of one year. |
Rent reported as operating costs, fuel costs and SG&A expenses totaled $84 million, $90 million and $102 million for the years ended December 31, 2014, 2013 and 2012, respectively.
Guarantees
We have entered into contracts that contain guarantees to unaffiliated parties that could require performance or payment under certain conditions. Material guarantees are discussed below.
Disposed TXU Gas Company Operations — In connection with the sale of the assets of TXU Gas Company to Atmos Energy Corporation (Atmos) in October 2004, EFH Corp. agreed to indemnify Atmos, through October 1, 2014, for up to $500 million for any liability related to assets retained by TXU Gas Company, including certain inactive gas plant sites not acquired by Atmos, and up to $1.4 billion for contingent liabilities associated with pre-closing tax and employee related matters. No indemnity claims were made or asserted by Atmos, and no payments were made pursuant to this indemnity.
See Notes 11 and 12 for discussion of guarantees and security for certain of our post-petition and pre-petition debt.
Letters of Credit
At December 31, 2014, TCEH had outstanding letters of credit under credit facilities totaling $534 million as follows:
| |
| • | $329 million to support commodity risk management and trading margin requirements in the normal course of business, including over-the-counter hedging transactions and collateral postings with ERCOT; |
| |
| • | $84 million to support executory contracts and insurance agreements; |
| |
| • | $62 million to support TCEH's REP financial requirements with the PUCT, and |
| |
| • | $59 million for other credit support requirements. |
The automatic stay under the Bankruptcy Code does not apply to letters of credit issued under the pre-petition credit facility and third parties may draw if the terms of a particular letter of credit so provide. See Note 12 for discussion of letter of credit draws in 2014.
Litigation
Aurelius Derivative Claim — Aurelius Capital Master, Ltd. and ACP Master, Ltd. (Aurelius) filed a lawsuit in March 2013, amended in May 2013, in the US District Court for the Northern District of Texas (Dallas Division) against EFCH as a nominal defendant and each of the current directors and a former director of EFCH. In the lawsuit, Aurelius, as a creditor under the TCEH Senior Secured Facilities and certain TCEH secured bonds, both of which are guaranteed by EFCH, filed a derivative claim against EFCH and its directors. Aurelius alleged that the directors of EFCH breached their fiduciary duties to EFCH and its creditors, including Aurelius, by permitting TCEH to make certain loans "without collecting fair and reasonably equivalent value." The lawsuit sought recovery for the benefit of EFCH. In January 2014, the district court granted EFCH's and the directors' motion to dismiss and in February 2014 dismissed the lawsuit. Aurelius has appealed the district court's judgment to the US Court of Appeals for the Fifth Circuit (Fifth Circuit Court). The appeal was automatically stayed as a result of the Bankruptcy Filing. We cannot predict the outcome of this proceeding, including the financial effects, if any.
Sierra Club Litigation and Settlement Related to Generation Facilities — In May 2012, the Sierra Club filed a lawsuit in the US District Court for the Western District of Texas (Waco Division) against EFH Corp. and Luminant Generation Company LLC (a wholly owned subsidiary of TCEH) for alleged violations of the Clean Air Act (CAA) at Luminant's Big Brown generation facility. The Big Brown trial was held in February 2014. In March 2014, the district court entered final judgment denying all of the Sierra Club's claims and all relief requested by the Sierra Club. The Sierra Club appealed the district court's decision to the Fifth Circuit Court. In August 2014, the district court ordered the Sierra Club to pay $6.4 million in Luminant's attorney and expert witness fees. The Sierra Club appealed to the Fifth Circuit Court the district court's final order granting Luminant's motion for the fees.
In September 2010, the Sierra Club filed a lawsuit in the US District Court for the Eastern District of Texas (Texarkana Division) against EFH Corp. and Luminant Generation Company LLC for alleged violations of the CAA at Luminant's Martin Lake generation facility.
In December 2010 and again in October 2011, the Sierra Club informed Luminant that it may sue Luminant for allegedly violating CAA provisions in connection with Luminant's Monticello generation facility. In May 2012, the Sierra Club informed us that it may sue us for allegedly violating CAA provisions in connection with Luminant's Sandow 4 generation facility.
The affirmative claims asserted against EFH Corp. and Luminant Generation Company LLC described above were automatically stayed as a result of the Bankruptcy Filing. In December 2014, Luminant finalized a settlement agreement with the Sierra Club under which the Sierra Club will, among other obligations, dismiss or withdraw the above pending legal matters against EFH Corp. and Luminant Generation Company LLC. In return, EFH Corp. and Luminant Generation Company LLC will not seek payment from the Sierra Club of $6.4 million in fees awarded in the Big Brown case. The Bankruptcy Court approved the settlement in December 2014. Pursuant to the terms of the settlement, the Sierra Club dismissed its appeal of the Big Brown case and its Martin Lake lawsuit in January 2015. In addition, the Sierra Club withdrew its Notices of Intent to Sue for the Monticello and Sandow 4 facilities. The Sierra Club also provided a general release of, and covenant not to sue or fund lawsuits for, all claims against Luminant and its affiliates based on any conduct occurring through 2014.
Make-whole Claims — In May 2014, the indenture trustee for the EFIH 10% First Lien Notes initiated litigation in the Bankruptcy Court seeking, among other things, a declaratory judgment that EFIH is obligated to pay a make-whole premium in connection with the cash repayment of the EFIH First Lien Notes discussed in Note 11 and that such make-whole premium is an allowed secured claim (EFIH First Lien Make-whole Claims). The indenture trustee has alleged that the EFIH First Lien Make-whole Claims are valued at approximately $432 million plus reimbursement of expenses. Following argument and briefing on cross motions for summary judgment, in March 2015, the Bankruptcy Court issued a ruling and order in favor of the EFIH Debtors on almost all issues, including denying the indenture trustee's motion for summary judgment in full and granting the EFIH Debtors summary judgment on most counts. The remaining open issues are currently scheduled to be heard at a trial beginning on April 20, 2015.
In June 2014, the indenture trustee for the EFIH Second Lien Notes initiated litigation in the Bankruptcy Court seeking similar relief with respect to the EFIH Second Lien Notes, including among other things, that EFIH is obligated to pay a make-whole premium in connection with any repayment of the EFIH Second Lien Notes and that such make-whole premium would be an allowed secured claim (the EFIH Second Lien Make-whole Claims). In the EFIH Second Lien Make-whole Claims, as of December 31, 2014, the amount of such claims alleged would have been equal to approximately $591 million plus reimbursement of expenses. In December 2014, the EFIH Debtors filed counterclaims for relief against the Second Lien indenture trustee, seeking declaratory relief that, among other things, EFIH is not obligated to pay a make-whole premium in connection with any repayment of the EFIH Second Lien Notes and that such make-whole premium, if owing, would not constitute an allowed secured claim (EFIH Second Lien Counterclaims). In December 2014, the indenture trustee for the EFIH Second Lien Notes opposed the EFIH Debtors' motion to assert the EFIH Second Lien Counterclaims and also moved to dismiss its own complaint for relief, arguing that it was no longer necessary to resolve the EFIH Second Lien Make-whole Claims given that the EFIH Debtors had withdrawn their motion to repay the EFIH Second Lien Notes. However, as a result of EFIH's partial repayment of the EFIH Second Lien Notes, the parties have agreed that the litigation is ripe for adjudication. The parties are currently working together on a schedule to propose to the Bankruptcy Court in order to adjudicate this matter.
In December 2014, the EFIH Debtors initiated litigation against the indenture trustee for the EFIH PIK Notes seeking, among other things, a declaratory judgment that EFIH is not obligated to pay a make-whole premium in connection with the cash repayment of the EFIH PIK Notes and that any post-petition interest owing on these notes is to be paid at the statutory Federal Judgment Rate of interest. The indenture trustee for the EFIH PIK Notes filed a motion in February 2015 to dismiss the EFIH Debtors' complaint for declaratory relief, and the EFIH Debtors filed a brief in opposition to that motion in February 2015. If a make-whole claim was allowed, as of December 31, 2014, such claims would be approximately $100 million. The Bankruptcy Court has not yet announced a schedule for hearing argument or ruling on the indenture trustee's motion to dismiss.
In addition, creditors may make additional claims in the Chapter 11 Cases for make-whole or redemption premiums in connection with repayments or settlement of other pre-petition debt. These claims could be material. There can be no assurance regarding the outcome of any of the litigation regarding the validity or, if deemed valid, the amount of these make-whole or redemption claims.
Litigation Related to EPA Reviews — In June 2008, the EPA issued an initial request for information to TCEH under the EPA's authority under Section 114 of the CAA. The stated purpose of the request is to obtain information necessary to determine compliance with the CAA, including New Source Review Standards and air permits issued by the TCEQ for the Big Brown, Monticello and Martin Lake generation facilities. In April 2013, we received an additional information request from the EPA under Section 114 related to the Big Brown, Martin Lake and Monticello facilities as well as an initial information request related to the Sandow 4 generation facility. Historically, as the EPA has pursued its New Source Review enforcement initiative, companies that have received a large and broad request under Section 114, such as the request received by TCEH, have in many instances subsequently received a notice of violation from the EPA, which has in some cases progressed to litigation or settlement.
In July 2012, the EPA sent us a notice of violation alleging noncompliance with the CAA's New Source Review Standards and the air permits at our Martin Lake and Big Brown generation facilities. In September 2012, we filed a petition for review in the Fifth Circuit Court seeking judicial review of the EPA's notice of violation. Given recent legal precedent subjecting agency orders like the notice of violation to judicial review, we filed the petition for review to preserve our ability to challenge the EPA's issuance of the notice and its defects. In October 2012, the EPA filed a motion to dismiss our petition. In December 2012, the Fifth Circuit Court issued an order that delayed a ruling on the EPA's motion to dismiss until after the case was fully briefed and oral arguments heard.
In July 2013, the EPA sent us a second notice of violation alleging noncompliance with the CAA's New Source Review Standards at our Martin Lake and Big Brown generation facilities, which the EPA said "superseded" its July 2012 notice. In July 2013, we filed a petition for review in the Fifth Circuit Court seeking judicial review of the EPA's July 2013 notice of violation. In September 2013, the Fifth Circuit Court consolidated the petitions for review of the July 2012 and July 2013 notices of violation. Oral argument was heard in June 2014. In July 2014, the Fifth Circuit Court ruled that our challenges to the notices of violation must first be heard by the district court and may be presented as defenses to the EPA's civil enforcement lawsuit discussed below.
In August 2013, the US Department of Justice, acting as the attorneys for the EPA, filed a civil enforcement lawsuit against Luminant Generation Company LLC and Big Brown Power Company LLC in federal district court in Dallas, alleging violations of the CAA at our Big Brown and Martin Lake generation facilities. In September 2013, we filed a motion to stay this lawsuit pending the outcome of the Fifth Circuit Court's review of the July 2012 and July 2013 notices of violation. In January 2014, the district court granted our motion to stay the lawsuit until the Fifth Circuit Court resolved our petitions for review of the July 2012 and July 2013 notices of violation. In July 2014, the district court lifted the stay of the lawsuit. We believe that we have complied with all requirements of the CAA and intend to vigorously defend against these allegations. The lawsuit requests the maximum civil penalties available under the CAA to the government of up to $32,500 to $37,500 per day for each alleged violation, depending on the date of the alleged violation, and injunctive relief, including an order requiring the installation of best available control technology at the affected units. An adverse outcome could require substantial capital expenditures that cannot be determined at this time and could possibly require the payment of substantial penalties. We cannot predict the outcome of these proceedings, including the financial effects, if any.
Cross-State Air Pollution Rule (CSAPR)
In July 2011, the EPA issued the CSAPR, compliance with which would have required significant additional reductions of sulfur dioxide (SO2) and nitrogen oxide (NOx) emissions from our fossil fueled generation units. In February 2012, the EPA released a final rule (Final Revisions) and a proposed rule revising certain aspects of the CSAPR, including increases in the emissions budgets for Texas and our generation assets as compared to the July 2011 version of the rule. In June 2012, the EPA finalized the proposed rule (Second Revised Rule). As compared to the proposed revisions to the CSAPR issued by the EPA in October 2011, the Final Revisions and the Second Revised Rule finalize emissions budgets for our generation assets that are approximately 6% lower for SO2, 3% higher for annual NOx and 2% higher for seasonal NOx.
The CSAPR became effective January 1, 2015, but is still subject to further legal challenge before the D.C. Circuit Court on remand from the US Supreme Court. Oral argument took place in February 2015. While we cannot predict the outcome of future proceedings related to the CSAPR, based upon our current operating plans, including Mercury and Air Toxics Standard (MATS) compliance efforts, we do not believe that the CSAPR will cause any material operational, financial or compliance issues.
State Implementation Plan (SIP)
In February 2013, in response to a petition for rulemaking filed by the Sierra Club, the EPA proposed a rule requiring certain states to replace SIP exemptions for excess emissions during malfunctions with an affirmative defense. Texas was not included in that original proposal since it already had an EPA-approved affirmative defense provision in its SIP. In 2014, as a result of a D.C. Circuit Court decision striking down an affirmative defense in another EPA rule, the EPA revised its 2013 proposal to extend the EPA's proposed findings of inadequacy to states that have affirmative defense provisions, including Texas. The EPA's revised proposal would require Texas to remove or replace its EPA-approved affirmative defense provisions for excess emissions during startup, shutdown and maintenance events. We filed comments on the EPA proposal in November 2014, and the EPA is expected to finalize the proposal in May 2015. We cannot predict the timing or outcome of future proceedings related to this rulemaking, including the requirements of any ultimately implemented rule, any compliance timeframe, or the financial effects, if any.
In June 2014, the Sierra Club filed a petition in the D.C. Circuit Court seeking review of several EPA regulations containing affirmative defenses for malfunctions, including the MATS rule for power plants. In the petition, the Sierra Club contends this affirmative defense is no longer permissible in light of a D.C. Circuit Court decision regarding similar defenses applicable to the cement industry. Luminant filed a motion to intervene in this case. In July 2014, the D.C. Circuit Court ordered the case stayed pending the EPA's consideration of a petition for administrative reconsideration of the regulations at issue. In December 2014, the EPA signed a proposal to make technical corrections to the MATS rule. Except as set forth above, we cannot predict the timing or outcome of future proceedings related to this petition, the petition for administrative reconsideration that is pending before the EPA or the financial effects of these proceedings, if any.
Potential Inter/Intra Debtor Claims
In August 2014, the Bankruptcy Court entered an order in the Chapter 11 Cases establishing discovery procedures governing, among other things, certain prepetition transactions among the various Debtors' estates. In February 2015, the ad hoc committee of certain TCEH unsecured noteholders; the official committee representing unsecured interests at EFCH and its direct subsidiary, TCEH; and the official committee representing unsecured interests at EFH and EFIH filed motions with the Bankruptcy Court seeking standing to prosecute derivative claims on behalf of TCEH relating to certain of these prepetition transactions. These motions are currently scheduled to be heard by the Bankruptcy Court at the Debtors' omnibus hearing in April 2015. In addition to the claims described above, certain of the Debtors (or creditors purporting to act derivatively in the name of a Debtor) may bring additional inter-Debtor or intra-Debtor claims (including claims under the Federal and State Income Tax Allocation Agreement among EFH Corp. and certain of its subsidiaries under which TCEH and EFH Corp. have previously filed claims in the Chapter 11 Cases) that could be material in amount. We cannot predict the timing or outcome of future proceedings, if any, related to these transactions. The outcome of any of these claims could be material and could affect the results of operation, liquidity or financial condition of a particular Debtor.
Other Matters
We are involved in various legal and administrative proceedings in the normal course of business, the ultimate resolutions of which, in the opinion of management, are not anticipated to have a material effect on our results of operations, liquidity or financial condition.
Environmental Contingencies
See discussion above regarding the CSAPR issued by the EPA in July 2011 and revised in February 2012 that include provisions which, among other things, place limits on SO2 and NOX emissions produced by electricity generation plants. We do not believe the CSAPR provisions and the MATS rule issued by the EPA in December 2011 will have any material impact on our business, results of operations, liquidity or financial condition.
We must comply with environmental laws and regulations applicable to the handling and disposal of hazardous waste. We believe that we are in compliance with current environmental laws and regulations; however, the impact, if any, of changes to existing regulations or the implementation of new regulations is not determinable and could materially affect our financial condition, results of operations and liquidity.
The costs to comply with environmental regulations could be significantly affected by the following external events or conditions:
| |
| • | enactment of state or federal regulations regarding CO2 and other greenhouse gas emissions; |
| |
| • | other changes to existing state or federal regulation regarding air quality, water quality, control of toxic substances and hazardous and solid wastes, and other environmental matters, including revisions to clean air regulations developed by the EPA as a result of court rulings discussed above and MATS, and |
| |
| • | the identification of sites requiring clean-up or the filing of other complaints in which we may be asserted to be a potential responsible party under applicable environmental laws or regulations. |
Labor Contracts
Certain personnel engaged in TCEH activities are represented by labor unions and covered by collective bargaining agreements with varying expiration dates in 2015. In November 2011, three-year labor agreements were reached covering bargaining unit personnel engaged in lignite fueled generation operations (excluding Sandow) and lignite mining operations (excluding a mine that serves our Sandow generation facility). In March 2014, these agreements were extended for an additional year through November 2015. Also in November 2011, a four-year labor agreement was reached covering bargaining unit personnel engaged in natural gas fueled generation operations. In January and August 2013, labor agreements expiring in November 2015 were reached covering bargaining unit personnel engaged in lignite mining operations that serve our Sandow generation facility and the Sandow lignite fueled generation operations, respectively. In December 2013, a labor agreement expiring in August 2015 was reached covering bargaining unit personnel engaged in nuclear fueled generation operations. We do not expect any changes in collective bargaining agreements to have a material effect on our results of operations, liquidity or financial condition.
Nuclear Insurance
Nuclear insurance includes liability coverage, property damage, decontamination and premature decommissioning coverage and accidental outage and/or extra expense coverage. Nuclear insurance maintained meets or exceeds requirements promulgated by Section 170 (Price-Anderson) of the Atomic Energy Act (Act) and Title 10 of the Code of Federal Regulations. We intend to maintain insurance against nuclear risks as long as such insurance is available. The company is self-insured to the extent that losses (i) are within the policy deductibles, (ii) are not covered per policy exclusions, terms and limitations, (iii) exceed the amount of insurance maintained, or (iv) are not covered due to lack of insurance availability. Such losses could have a material effect on our financial condition and results of operations and liquidity.
With regard to liability coverage, the Act provides for financial protection for the public in the event of a significant nuclear generation plant incident. The Act sets the statutory limit of public liability for a single nuclear incident at $13.6 billion and requires nuclear generation plant operators to provide financial protection for this amount. The US Congress could impose revenue-raising measures on the nuclear industry to pay claims exceeding the $13.6 billion limit for a single incident mandated by the Act. As required, the company provides this financial protection for a nuclear incident at Comanche Peak resulting in public bodily injury and property damage through a combination of private insurance and industry-wide retrospective payment plan known as the Secondary Financial Protection (SFP).
Under the SFP, in the event of an incident at any nuclear generation plant in the US, each operating licensed reactor in the US is subject to an assessment of up to $127.3 million and this amount is subject to increases for inflation every five years, with the next adjustment expected in September 2018. Assessments are currently limited to $19 million per operating licensed reactor per year per incident. The company's maximum potential assessment under the industry retrospective plan would be $254.6 million per incident but no more than $37.9 million in any one year for each incident. The potential assessment is triggered by a nuclear liability loss in excess of $375 million per accident at any nuclear facility.
With respect to nuclear decontamination and property damage insurance, the NRC requires that nuclear generation plant license-holders maintain at least $1.06 billion of such insurance and require the proceeds thereof to be used to place a plant in a safe and stable condition, to decontaminate it pursuant to a plan submitted to and approved by the NRC before the proceeds can be used for plant repair or restoration or to provide for premature decommissioning. The company maintains nuclear decontamination and property damage insurance for Comanche Peak in the amount of $2.25 billion (subject to $5 million deductible per accident), above which the company is self-insured.
The company maintains Accidental Outage insurance to cover the additional costs of obtaining replacement electricity from another source if one or both of the units at Comanche Peak are out of service for more than twelve weeks as a result of covered direct physical damage. The coverage provides for weekly payments of $3.5 million for the first fifty-two weeks and $2.8 million for the next 110 weeks for each outage, respectively, after the initial twelve-week waiting period. The total maximum coverage is $490 million per unit. The coverage amounts applicable to each unit will be reduced to 80% if both units are out of service at the same time as a result of the same accident.
Equity Issuances and Repurchases
Changes in common stock shares outstanding for each of the last three years are reflected (in millions of shares) in the table below. Essentially all shares issued and purchased were as a result of stock-based compensation transactions for the benefit of certain officers, directors and employees. See Note 18 for discussion of stock-based compensation.
|
| | | | | | | | |
| | Year Ended December 31, |
| | 2014 | | 2013 | | 2012 |
| Shares outstanding at beginning of year | 1,669.9 |
| | 1,680.5 |
| | 1,679.5 |
|
| Shares issued (a) | — |
| | 1.7 |
| | 1.0 |
|
| Shares repurchased | — |
| | (12.3 | ) | | — |
|
| Shares outstanding at end of year | 1,669.9 |
| | 1,669.9 |
| | 1,680.5 |
|
____________
| |
| (a) | Includes share awards granted to directors and other nonemployees (see Note 18). 2013 issuances also included 0.7 million shares of previously issued restricted or deferred stock units that vested in 2013. |
Dividend Restrictions
EFH Corp. has not declared or paid any dividends since the Merger.
The agreement governing the TCEH DIP Facility generally restricts TCEH's ability to make distributions or loans to any of its parent companies or their subsidiaries unless such distributions or loans are expressly permitted under the agreement governing such facility.
The agreement governing the EFIH DIP Facility generally restricts EFIH's ability to make distributions or loans to any of its parent companies or their subsidiaries unless such distributions or loans are expressly permitted under the agreement governing such facility.
Under applicable law, we are prohibited from paying any dividend to the extent that immediately following payment of such dividend, there would be no statutory surplus or we would be insolvent. In addition, due to the Chapter 11 Cases, no dividends are eligible to be paid without the approval of the Bankruptcy Court.
Noncontrolling Interests
At December 31, 2014, ownership of Oncor's membership interests was as follows: 80.03% held indirectly by EFH Corp., 0.22% held indirectly by Oncor's management and board of directors and 19.75% held by Texas Transmission. See Note 3 for discussion of the deconsolidation of Oncor effective January 1, 2010.
As discussed in Notes 3 and 8, we consolidated a joint venture formed in 2009 for the purpose of developing two new nuclear generation units, which resulted in a noncontrolling interests component of equity. Net loss attributable to noncontrolling interests of $107 million for the year ended December 31, 2013 reflected the noncontrolling interest share of the impairment of the assets of the nuclear generation development joint venture. Net loss attributable to the noncontrolling interests was immaterial for the years ended December 31, 2014 and 2012.
Accumulated Other Comprehensive Income (Loss)
The following table presents the changes to accumulated other comprehensive income (loss) for the year ended December 31, 2014. In conjunction with the remeasurement of the EFH Corp. OPEB liability during the period (see Note 17), we recognized an additional $17 million of other comprehensive loss.
|
| | | | | | | | | | | |
| | Dedesignated Cash Flow Hedges – Interest Rate Swaps (Note 16) | | Pension and Other Postretirement Employee Benefit Liabilities Adjustments (Note 17) | | Accumulated Other Comprehensive Income (Loss) |
| Balance at December 31, 2013 | $ | (56 | ) | | $ | (7 | ) | | $ | (63 | ) |
| Other comprehensive loss before reclassifications (after tax) | — |
| | (66 | ) | | (66 | ) |
| Amounts reclassified from accumulated other comprehensive income (loss) and reported in: | | | | | |
| Operating costs | — |
| | (4 | ) | | (4 | ) |
| Depreciation and amortization | 2 |
| | — |
| | 2 |
|
| Selling, general and administrative expenses | — |
| | (2 | ) | | (2 | ) |
| Income tax benefit (expense) | (1 | ) | | 2 |
| | 1 |
|
| Equity in earnings of unconsolidated subsidiaries (net of tax) | 2 |
| | — |
| | 2 |
|
| Total amount reclassified from accumulated other comprehensive income (loss) during the period | 3 |
| | (4 | ) | | (1 | ) |
| Total change during the period | 3 |
| | (70 | ) | | (67 | ) |
| Balance at December 31, 2014 | $ | (53 | ) | | $ | (77 | ) | | $ | (130 | ) |
The following table presents the changes to accumulated other comprehensive income (loss) for the year ended December 31, 2013.
|
| | | | | | | | | | | |
| | Dedesignated Cash Flow Hedges – Interest Rate Swaps (Note 16) | | Pension and Other Postretirement Employee Benefit Liabilities Adjustments (Note 17) | | Accumulated Other Comprehensive Income (Loss) |
| Balance at December 31, 2012 | $ | (64 | ) | | $ | 17 |
| | $ | (47 | ) |
| Other comprehensive loss before reclassifications (after tax) | — |
| | (20 | ) | | (20 | ) |
| Amounts reclassified from accumulated other comprehensive income (loss) and reported in: | | | | | |
| Operating costs | — |
| | (4 | ) | | (4 | ) |
| Depreciation and amortization | 2 |
| | — |
| | 2 |
|
| Selling, general and administrative expenses | — |
| | (3 | ) | | (3 | ) |
| Interest expense and related charges | 7 |
| | — |
| | 7 |
|
| Income tax benefit (expense) | (3 | ) | | 3 |
| | — |
|
| Equity in earnings of unconsolidated subsidiaries (net of tax) | 2 |
| | — |
| | 2 |
|
| Total amount reclassified from accumulated other comprehensive income (loss) during the period | 8 |
| | (4 | ) | | 4 |
|
| Total change during the period | 8 |
| | (24 | ) | | (16 | ) |
| Balance at December 31, 2013 | $ | (56 | ) | | $ | (7 | ) | | $ | (63 | ) |
| |
| 15. | FAIR VALUE MEASUREMENTS |
Accounting standards related to the determination of fair value define fair value as the price that would be received to sell an asset or paid to transfer a liability in an orderly transaction between willing market participants at the measurement date. We use a "mid-market" valuation convention (the mid-point price between bid and ask prices) as a practical expedient to measure fair value for the majority of our assets and liabilities subject to fair value measurement on a recurring basis. We primarily use the market approach for recurring fair value measurements and use valuation techniques to maximize the use of observable inputs and minimize the use of unobservable inputs.
We categorize our assets and liabilities recorded at fair value based upon the following fair value hierarchy:
| |
| • | Level 1 valuations use quoted prices in active markets for identical assets or liabilities that are accessible at the measurement date. An active market is a market in which transactions for the asset or liability occur with sufficient frequency and volume to provide pricing information on an ongoing basis. Our Level 1 assets and liabilities include exchange-traded commodity contracts. For example, some of our derivatives are NYMEX or ICE futures and swaps transacted through clearing brokers for which prices are actively quoted. |
| |
| • | Level 2 valuations use inputs that, in the absence of actively quoted market prices, are observable for the asset or liability, either directly or indirectly. Level 2 inputs include: (a) quoted prices for similar assets or liabilities in active markets, (b) quoted prices for identical or similar assets or liabilities in markets that are not active, (c) inputs other than quoted prices that are observable for the asset or liability such as interest rates and yield curves observable at commonly quoted intervals and (d) inputs that are derived principally from or corroborated by observable market data by correlation or other mathematical means. Our Level 2 valuations utilize over-the-counter broker quotes, quoted prices for similar assets or liabilities that are corroborated by correlations or other mathematical means, and other valuation inputs. For example, our Level 2 assets and liabilities include forward commodity positions at locations for which over-the-counter broker quotes are available. |
| |
| • | Level 3 valuations use unobservable inputs for the asset or liability. Unobservable inputs are used to the extent observable inputs are not available, thereby allowing for situations in which there is little, if any, market activity for the asset or liability at the measurement date. We use the most meaningful information available from the market combined with internally developed valuation methodologies to develop our best estimate of fair value. For example, our Level 3 assets and liabilities include certain derivatives with values derived from pricing models that utilize multiple inputs to the valuations, including inputs that are not observable or easily corroborated through other means. See further discussion below. |
Our valuation policies and procedures are developed, maintained and validated by a centralized risk management group that reports to the Chief Financial Officer, who also functions as the Chief Risk Officer. Risk management functions include commodity price reporting and validation, valuation model validation, risk analytics, risk control, credit risk management and risk reporting.
We utilize several different valuation techniques to measure the fair value of assets and liabilities, relying primarily on the market approach of using prices and other market information for identical and/or comparable assets and liabilities for those items that are measured on a recurring basis. These methods include, among others, the use of broker quotes and statistical relationships between different price curves.
In utilizing broker quotes, we attempt to obtain multiple quotes from brokers (generally non-binding) that are active in the commodity markets in which we participate (and require at least one quote from two brokers to determine a pricing input as observable); however, not all pricing inputs are quoted by brokers. The number of broker quotes received for certain pricing inputs varies depending on the depth of the trading market, each individual broker's publication policy, recent trading volume trends and various other factors. In addition, for valuation of interest rate swaps, we used generally accepted interest rate swap valuation models utilizing month-end interest rate curves.
Probable loss of default by either us or our counterparties is considered in determining the fair value of derivative assets and liabilities. These non-performance risk adjustments take into consideration credit enhancements and the credit risks associated with our credit standing and the credit standing of our counterparties (see Note 16 for additional information regarding credit risk associated with our derivatives). We utilize published credit ratings, default rate factors and debt trading values in calculating these fair value measurement adjustments.
Certain derivatives and financial instruments are valued utilizing option pricing models that take into consideration multiple inputs including, but not limited to, commodity prices, volatility factors, discount rates and other market based factors. Additionally, when there is not a sufficient amount of observable market data, valuation models are developed that incorporate proprietary views of market factors. Significant unobservable inputs used to develop the valuation models include volatility curves, correlation curves, illiquid pricing locations and credit/non-performance risk assumptions. Those valuation models are generally used in developing long-term forward price curves for certain commodities. We believe the development of such curves is consistent with industry practice; however, the fair value measurements resulting from such curves are classified as Level 3.
The significant unobservable inputs and valuation models are developed by employees trained and experienced in market operations and fair value measurements and validated by the company's risk management group, which also further analyzes any significant changes in Level 3 measurements. Significant changes in the unobservable inputs could result in significant upward or downward changes in the fair value measurement.
With respect to amounts presented in the following fair value hierarchy tables, the fair value measurement of an asset or liability (e.g., a contract) is required to fall in its entirety in one level, based on the lowest level input that is significant to the fair value measurement. Certain assets and liabilities would be classified in Level 2 instead of Level 3 of the hierarchy except for the effects of credit reserves and non-performance risk adjustments, respectively. Assessing the significance of a particular input to the fair value measurement in its entirety requires judgment, considering factors specific to the asset or liability being measured.
Assets and liabilities measured at fair value on a recurring basis consisted of the following:
|
| | | | | | | | | | | | | | | |
| December 31, 2014 |
| | Level 1 | | Level 2 | | Level 3 (a) | | Total |
| Assets: | | | | | | | |
| Commodity contracts | $ | 402 |
| | $ | 46 |
| | $ | 49 |
| | $ | 497 |
|
Nuclear decommissioning trust –
equity securities (b) | 375 |
| | 217 |
| | — |
| | 592 |
|
Nuclear decommissioning trust –
debt securities (b) | — |
| | 301 |
| | — |
| | 301 |
|
| Total assets | $ | 777 |
| | $ | 564 |
| | $ | 49 |
| | $ | 1,390 |
|
| Liabilities: | | | | | | | |
| Commodity contracts | $ | 278 |
| | $ | 25 |
| | $ | 14 |
| | $ | 317 |
|
| Total liabilities | $ | 278 |
| | $ | 25 |
| | $ | 14 |
| | $ | 317 |
|
|
| | | | | | | | | | | | | | | |
| December 31, 2013 |
| | Level 1 | | Level 2 | | Level 3 (a) | | Total |
| Assets: | | | | | | | |
| Commodity contracts | $ | 161 |
| | $ | 570 |
| | $ | 57 |
| | $ | 788 |
|
| Interest rate swaps | — |
| | 67 |
| | — |
| | 67 |
|
Nuclear decommissioning trust –
equity securities (b) | 330 |
| | 191 |
| | — |
| | 521 |
|
Nuclear decommissioning trust –
debt securities (b) | — |
| | 270 |
| | — |
| | 270 |
|
| Total assets | $ | 491 |
| | $ | 1,098 |
| | $ | 57 |
| | $ | 1,646 |
|
| Liabilities: | | | | | | | |
| Commodity contracts | $ | 231 |
| | $ | 14 |
| | $ | 18 |
| | $ | 263 |
|
| Interest rate swaps | — |
| | 80 |
| | 1,012 |
| | 1,092 |
|
| Total liabilities | $ | 231 |
| | $ | 94 |
| | $ | 1,030 |
| | $ | 1,355 |
|
____________
| |
| (a) | See table below for description of Level 3 assets and liabilities. |
| |
| (b) | The nuclear decommissioning trust investment is included in the other investments line in the consolidated balance sheets. See Note 21. |
Commodity contracts consist primarily of natural gas, electricity, fuel oil, uranium and coal agreements and include financial instruments entered into for hedging purposes as well as physical contracts that have not been designated normal purchases or sales. See Note 16 for further discussion regarding derivative instruments, including the termination of certain natural gas hedging agreements shortly after the Bankruptcy Filing.
Interest rate swaps included variable-to-fixed rate swap instruments that hedged the interest costs of our debt as well as interest rate basis swaps designed to effectively reduce the hedged borrowing costs. See Note 16 for discussion of the termination of interest rate swaps shortly after the Bankruptcy Filing.
Nuclear decommissioning trust assets represent securities held for the purpose of funding the future retirement and decommissioning of our nuclear generation facility. These investments include equity, debt and other fixed-income securities consistent with investment rules established by the NRC and the PUCT.
There were no significant transfers between Level 1 and Level 2 of the fair value hierarchy for the years ended December 31, 2014, 2013 and 2012. See the table of changes in fair values of Level 3 assets and liabilities below for discussion of transfers between Level 2 and Level 3 for the years ended December 31, 2014, 2013 and 2012.
The following tables present the fair value of the Level 3 assets and liabilities by major contract type and the significant unobservable inputs used in the valuations at December 31, 2014 and 2013:
|
| | | | | | | | | | | | | | | | | | |
| December 31, 2014 |
| | | Fair Value | | | | | | |
| Contract Type (a) | | Assets | | Liabilities | | Total | | Valuation Technique | | Significant Unobservable Input | | Range (b) |
| Electricity purchases and sales | | $ | 4 |
| | $ | (5 | ) | | $ | (1 | ) | | Valuation Model | | Illiquid pricing locations (c) | | $30 to $50/ MWh |
| | | | | | | | | | | Hourly price curve shape (d) | | $20 to $70/ MWh |
| | | | | | | | | | | | | |
| Electricity spread options | | 2 |
| | (1 | ) | | 1 |
| | Option Pricing Model | | Gas to power correlation (e) | | 15% to 95% |
| | | | | | | | | | | Power volatility (f) | | 10% to 30% |
| | | | | | | | | | | | | |
| Electricity congestion revenue rights | | 38 |
| | (4 | ) | | 34 |
| | Market Approach (g) | | Illiquid price differences between settlement points (h) | | $0.00 to $20.00 |
| | | | | | | | | | | | | |
| Coal purchases | | — |
| | (4 | ) | | (4 | ) | | Market Approach (g) | | Illiquid price variances between mines (i) | | $0.00 to $1.00 |
| | | | | | | | | | | Illiquid price variances between heat content (j) | | $0.30 to $0.40 |
| | | | | | | | | | | | | |
| Other (n) | | 5 |
| | — |
| | 5 |
| | | | | | |
| Total | | $ | 49 |
| | $ | (14 | ) | | $ | 35 |
| | | | | | |
|
| | | | | | | | | | | | | | | | | | |
| December 31, 2013 |
| | | Fair Value | | | | | | |
| Contract Type (a) | | Assets | | Liabilities | | Total | | Valuation Technique | | Significant Unobservable Input | | Range (b) |
| Electricity purchases and sales | | $ | 2 |
| | $ | (2 | ) | | $ | — |
| | Valuation Model | | Illiquid pricing locations (c) | | $25 to $45/ MWh |
| | | | | | | | | | | Hourly price curve shape (d) | | $20 to $70/ MWh |
| | | | | | | | | | | | | |
| Electricity spread options | | 15 |
| | (2 | ) | | 13 |
| | Option Pricing Model | | Gas to power correlation (e) | | 45% to 95% |
| | | | | | | | | | | Power volatility (f) | | 10% to 30% |
| | | | | | | | | | | | | |
| Electricity congestion revenue rights | | 35 |
| | (2 | ) | | 33 |
| | Market Approach (g) | | Illiquid price differences between settlement points (h) | | $0.00 to $25.00 |
| | | | | | | | | | | | | |
| Coal purchases | | — |
| | (11 | ) | | (11 | ) | | Market Approach (g) | | Illiquid price variances between mines (i) | | $0.00 to $1.00 |
| | | | | | | | | | | Probability of default (k) | | 0% to 40% |
| | | | | | | | | | | Recovery rate (l) | | 0% to 40% |
| | | | | | | | | | | | | |
| Interest rate swaps | | — |
| | (1,012 | ) | | (1,012 | ) | | Valuation Model | | Nonperformance risk adjustment (m) | | 25% to 35% |
| | | | | | | | | | | | | |
| Other (n) | | 5 |
| | (1 | ) | | 4 |
| | | | | | |
| Total | | $ | 57 |
| | $ | (1,030 | ) | | $ | (973 | ) | | | | | | |
____________
| |
| (a) | Electricity purchase and sales contracts include hedging positions in the ERCOT regions, as well as power contracts, the valuations of which include unobservable inputs related to the hourly shaping of the price curve. Electricity spread option contracts consist of physical electricity call options. Electricity congestion revenue rights contracts consist of forward purchase contracts (swaps and options) used to hedge electricity price differences between settlement points within ERCOT. Coal purchase contracts relate to western (Powder River Basin) coal. TCEH used interest rate swaps to hedge exposure to its variable rate debt (see Note 16). |
| |
| (b) | The range of the inputs may be influenced by factors such as time of day, delivery period, season and location. |
| |
| (c) | Based on the historical range of forward average monthly ERCOT hub and load zone prices. |
| |
| (d) | Based on the historical range of forward average hourly ERCOT North Hub prices. |
| |
| (e) | Estimate of the historical range based on forward natural gas and on-peak power prices for the ERCOT hubs most relevant to our spread options. |
| |
| (f) | Based on historical forward price changes. |
| |
| (g) | While we use the market approach, there is either insufficient market data to consider the valuation liquid or the significance of credit reserves or non-performance risk adjustments results in a Level 3 designation. |
| |
| (h) | Based on the historical price differences between settlement points within the ERCOT hubs and load zones. |
| |
| (i) | Based on the historical range of price variances between mine locations. |
| |
| (j) | Based on historical ranges of forward average prices between different heat contents (potential energy in coal for a given mass). |
| |
| (k) | Estimate of the range of probabilities of default based on past experience and the length of the contract as well as our and counterparties' credit ratings. |
| |
| (l) | Estimate of the default recovery rate based on historical corporate rates. |
| |
| (m) | Estimate of nonperformance risk adjustment based on TCEH senior secured debt trading values. See discussion immediately below regarding transfers into Level 3. |
| |
| (n) | Other includes contracts for ancillary services, natural gas, diesel options, coal options and weather dependent power options. |
The following table presents the changes in fair value of the Level 3 assets and liabilities for the years ended December 31, 2014, 2013 and 2012.
|
| | | | | | | | | | | |
| | Year Ended December 31, |
| | 2014 | | 2013 | | 2012 |
| Net asset (liability) balance at beginning of period | $ | (973 | ) | | $ | 29 |
| | $ | 53 |
|
| Total unrealized valuation losses | (97 | ) | | (48 | ) | | (17 | ) |
| Purchases, issuances and settlements (a): | | | | | |
| Purchases | 63 |
| | 92 |
| | 73 |
|
| Issuances | (5 | ) | | (7 | ) | | (23 | ) |
| Settlements | 1,053 |
| | 138 |
| | (12 | ) |
| Transfers into Level 3 (b) | — |
| | (1,181 | ) | | (42 | ) |
| Transfers out of Level 3 (b) | (6 | ) | | 4 |
| | (3 | ) |
| Net change (c) | 1,008 |
| | (1,002 | ) | | (24 | ) |
| Net asset (liability) balance at end of period | $ | 35 |
| | $ | (973 | ) | | $ | 29 |
|
| Unrealized valuation gains (losses) relating to instruments held at end of period | (5 | ) | | 435 |
| | (24 | ) |
____________
| |
| (a) | Settlement amounts in 2014 reflect termination of TCEH interest rate swaps and include the nonperformance risk adjustment as discussed in Note 16. Settlements for all periods presented reflect reversals of unrealized mark-to-market valuations previously recognized in net income. Purchases and issuances reflect option premiums paid or received. |
| |
| (b) | Includes transfers due to changes in the observability of significant inputs. Transfers in and out occur at the end of each quarter, which is when the assessments are performed. All Level 3 transfers during the years presented are in and out of Level 2. Transfers into Level 3 during 2013 reflect a nonperformance risk adjustment in the valuation of the TCEH interest rate swaps, which were secured by a first-lien interest in the same assets of TCEH (on a pari passu basis) with the TCEH Senior Secured Facilities and the TCEH Senior Secured Notes (see Note 12). Transfers out during 2012 reflect increased observability of pricing related to certain congestion revenue rights. Transfers in during 2012 were driven by an increase in nonperformance risk adjustments related to certain coal purchase contracts as well as certain power contracts that include unobservable inputs related to the hourly shaping of the price curve. The amount of the nonperformance risk adjustment was after consideration of derivative assets related to contracts with the same counterparties that are also secured by a first-lien interest in the assets of TCEH, and a master netting agreement in place providing for netting and setoff of amounts related to these contracts. |
| |
| (c) | Substantially all changes in values of commodity contracts are reported in the statements of consolidated income (loss) in net gain (loss) from commodity hedging and trading activities. Changes in values of interest rate swaps transferred into Level 3 in 2013 are reported in the statements of consolidated income (loss) in interest expense and related charges (see Note 9). Activity excludes changes in fair value in the month the positions settled as well as amounts related to positions entered into and settled in the same month. |
| |
| 16. | COMMODITY AND OTHER DERIVATIVE CONTRACTUAL ASSETS AND LIABILITIES |
Strategic Use of Derivatives
We transact in derivative instruments, such as options, swaps, futures and forward contracts, to manage commodity price risk. Because certain of these instruments are deemed to be forward contracts under the Bankruptcy Code, they are not subject to the automatic stay, and counterparties may elect to terminate the agreements. Prior to the Petition Date, we had entered into interest rate swaps to manage our interest rate risk exposure. See Note 15 for a discussion of the fair value of derivatives.
Commodity Hedging and Trading Activity — TCEH has natural gas hedging positions designed to reduce exposure to changes in future electricity prices due to changes in the price of natural gas, thereby hedging future revenues from electricity sales and related cash flows. In ERCOT, the wholesale price of electricity has generally moved with the price of natural gas. TCEH has entered into market transactions involving natural gas-related financial instruments and has sold forward natural gas through 2016 in order to hedge a portion of electricity price exposure related to expected lignite/coal and nuclear fueled generation. TCEH also enters into derivatives, including electricity, natural gas, fuel oil, uranium, emission and coal instruments, generally for short-term hedging purposes. To a limited extent, TCEH also enters into derivative transactions for proprietary trading purposes, principally in natural gas and electricity markets. Unrealized gains and losses arising from changes in the fair value of hedging and trading instruments as well as realized gains and losses upon settlement of the instruments are reported in the statements of consolidated income (loss) in net gain (loss) from commodity hedging and trading activities.
Interest Rate Swap Transactions — Interest rate swap agreements have been used to reduce exposure to interest rate changes by converting floating-rate debt to fixed rates, thereby hedging future interest costs and related cash flows. Interest rate basis swaps were used to effectively reduce the hedged borrowing costs. Unrealized gains and losses arising from changes in the fair value of the swaps as well as realized gains and losses upon settlement of the swaps were reported in the statements of consolidated income (loss) in interest expense and related charges.
Termination of Commodity Hedges and Interest Rate Swaps — Commodity hedges and interest rate swaps entered into prior to the Petition Date are deemed to be forward contracts under the Bankruptcy Code. The Bankruptcy Filing constituted an event of default under these arrangements, and in accordance with the contractual terms, counterparties terminated certain positions shortly after the Bankruptcy Filing. The positions terminated consisted almost entirely of natural gas hedging positions and interest rate swaps that were secured by a first-lien interest in the same assets of TCEH on a pari passu basis with the TCEH Senior Secured Facilities and the TCEH Senior Secured Notes. The terminated natural gas hedging positions represented approximately 70% of the commodity contracts derivative assets, and the terminated interest rate swaps represented all of the interest rate swap derivative assets and liabilities as of December 31, 2013 as presented in the table below.
Entities with a first-lien security interest included counterparties to both our natural gas hedging positions and interest rate swaps, which had entered into master agreements that provided for netting and setoff of amounts related to these positions. Additionally, certain counterparties to only our interest rate swaps hold the same first-lien security interest. The net liability recorded upon the terminations totaled $1.108 billion, which represented a realized loss of $1.225 billion related to the interest rate swaps, net of a realized gain of $117 million related to the natural gas hedging positions. Additionally, net accounts payable amounts related to matured interest rate swaps of $127 million are also secured by the same first-lien secured interest. The total net liability of $1.235 billion is subject to the terms of settlement of TCEH's first-lien claims ultimately approved by the Bankruptcy Court and is reported in the consolidated balance sheets as a liability subject to compromise. Additionally, counterparties associated with the net liability are allowed, and have been receiving, adequate protection payments related to their claims (see Note 9).
The derivative liability related to the TCEH interest rate swaps included a nonperformance risk adjustment (resulting in a Level 3 valuation). This fair value adjustment reflected the counterparties' exposure to our credit risk. The amount of the adjustment was after consideration of derivative assets related to natural gas hedging positions with the same counterparties. The difference between the net liability arising upon the termination of the interest rate swaps and the natural gas hedging positions and the net derivative assets and liabilities recorded totaled $278 million, substantially all of which represented the nonperformance risk adjustment, and is reported as a noncash charge in reorganization items in the statements of consolidated income (loss) in accordance with ASC 852, Reorganizations (see Note 10).
Financial Statement Effects of Derivatives
Substantially all derivative contractual assets and liabilities arise from mark-to-market accounting consistent with accounting standards related to derivative instruments and hedging activities. The following tables provide detail of commodity and other derivative contractual assets and liabilities (with the column totals representing the net positions of the contracts) as reported in the consolidated balance sheets at December 31, 2014 and 2013:
|
| | | | | | | | | | | | | | | | | | | |
| December 31, 2014 |
| | Derivative assets | | Derivative liabilities | | |
| | Commodity contracts | | Interest rate swaps | | Commodity contracts | | Interest rate swaps | | Total |
| Current assets | $ | 492 |
| | $ | — |
| | $ | — |
| | $ | — |
| | $ | 492 |
|
| Noncurrent assets | 5 |
| | — |
| | — |
| | — |
| | 5 |
|
| Current liabilities | — |
| | — |
| | (316 | ) | | — |
| | (316 | ) |
| Noncurrent liabilities | — |
| | — |
| | (1 | ) | | — |
| | (1 | ) |
| Net assets (liabilities) | $ | 497 |
| | $ | — |
| | $ | (317 | ) | | $ | — |
| | $ | 180 |
|
|
| | | | | | | | | | | | | | | | | | | |
| December 31, 2013 |
| | Derivative assets | | Derivative liabilities | | |
| | Commodity contracts | | Interest rate swaps | | Commodity contracts | | Interest rate swaps | | Total |
| Current assets | $ | 784 |
| | $ | 67 |
| | $ | — |
| | $ | — |
| | $ | 851 |
|
| Noncurrent assets | 4 |
| | — |
| | — |
| | — |
| | 4 |
|
| Current liabilities | — |
| | — |
| | (263 | ) | | (1,092 | ) | | (1,355 | ) |
| Net assets (liabilities) | $ | 788 |
| | $ | 67 |
| | $ | (263 | ) | | $ | (1,092 | ) | | $ | (500 | ) |
In consideration of the termination rights of counterparties arising from the Bankruptcy Filing, derivative liabilities classified as current at December 31, 2013 include $647 million that otherwise would be classified as noncurrent, essentially all of which relates to interest rate swaps.
At December 31, 2014 and 2013, there were no derivative positions accounted for as cash flow or fair value hedges.
The following table presents the pretax effect of derivatives on net income (gains (losses)), including realized and unrealized effects:
|
| | | | | | | | | | | | |
| | | Year Ended December 31, |
| Derivative (statements of consolidated income (loss) presentation) | | 2014 | | 2013 | | 2012 |
| Commodity contracts (Net gain (loss) from commodity hedging and trading activities) (a) | | $ | 17 |
| | $ | (54 | ) | | $ | 279 |
|
| Interest rate swaps (Interest expense and related charges) (b) | | (128 | ) | | 433 |
| | (503 | ) |
| Interest rate swaps (Reorganization items) (Note 10) | | (278 | ) | | — |
| | — |
|
| Net gain (loss) | | $ | (389 | ) | | $ | 379 |
| | $ | (224 | ) |
____________
| |
| (a) | Amount represents changes in fair value of positions in the derivative portfolio during the period, as realized amounts related to positions settled are assumed to equal reversals of previously recorded unrealized amounts. |
| |
| (b) | Includes unrealized mark-to-market net gain (loss) as well as the net realized effect on interest paid/accrued, both reported in Interest Expense and Related Charges (see Note 9). |
The following table presents the pretax effect (all losses) on net income and other comprehensive income (OCI) of derivative instruments previously accounted for as cash flow hedges. There were no amounts recognized in OCI for the years ended December 31, 2014, 2013 or 2012.
|
| | | | | | | | | | | | |
| | | Year Ended December 31, |
| Derivative (statements of consolidated income (loss) presentation of loss reclassified from accumulated OCI into income) | | 2014 | | 2013 | | 2012 |
| Interest rate swaps (Interest expense and related charges) | | $ | — |
| | $ | (7 | ) | | $ | (8 | ) |
| Interest rate swaps (Depreciation and amortization) | | (2 | ) | | (2 | ) | | (2 | ) |
| Total | | $ | (2 | ) | | $ | (9 | ) | | $ | (10 | ) |
There were no transactions designated as cash flow hedges during the years ended December 31, 2014, 2013 or 2012.
Accumulated other comprehensive income related to cash flow hedges (excluding Oncor's interest rate hedges) at December 31, 2014 and 2013 totaled $36 million and $37 million in net losses (after-tax), respectively, substantially all of which relates to interest rate swaps previously accounted for as cash flow hedges. We expect that $2 million of net losses (after-tax) related to cash flow hedges included in accumulated other comprehensive income at December 31, 2014 will be reclassified into net income during the next twelve months as the related hedged transactions affect net income.
Balance Sheet Presentation of Derivatives
Consistent with elections under US GAAP to present amounts on a gross basis, we report derivative assets and liabilities in the consolidated balance sheets without taking into consideration netting arrangements we have with counterparties. We may enter into offsetting positions with the same counterparty, resulting in both assets and liabilities. Volatility in underlying commodity prices can result in significant changes in assets and liabilities presented from period to period.
Margin deposits that contractually offset these derivative instruments are reported separately in the consolidated balance sheets. Margin deposits received from counterparties are either used for working capital or other corporate purposes or are deposited in a separate restricted cash account. At December 31, 2014 and 2013, all margin deposits held were unrestricted.
We maintain standardized master netting agreements with certain counterparties that allow for the netting of positive and negative exposures. Generally, we utilize the International Swaps and Derivatives Association (ISDA) standardized contract for financial transactions, the Edison Electric Institute standardized contract for physical power transactions and the North American Energy Standards Board (NAESB) standardized contract for physical natural gas transactions. These contain credit enhancements that allow for the right to offset assets and liabilities and collateral received in order to reduce credit exposure between us and the counterparty. These agreements contain specific language related to margin requirements, monthly settlement netting, cross-commodity netting and early termination netting, which is negotiated with the contract counterparty.
The following tables reconcile our derivative assets and liabilities as presented in the consolidated balance sheets to net amounts after taking into consideration netting arrangements with counterparties and financial collateral:
|
| | | | | | | | | | | | | | | | |
| December 31, 2014 |
| | | Amounts Presented in Balance Sheet | | Offsetting Instruments | | Financial Collateral (Received) Pledged (b) | | Net Amounts |
| Derivative assets: | | | | | | | | |
| Commodity contracts | | $ | 497 |
| | $ | (298 | ) | | $ | (16 | ) | | $ | 183 |
|
| Derivative liabilities: | | | | | | | | |
| Commodity contracts | | (317 | ) | | 298 |
| | 2 |
| | (17 | ) |
| Net amounts | | $ | 180 |
| | $ | — |
| | $ | (14 | ) | | $ | 166 |
|
|
| | | | | | | | | | | | | | | | |
| December 31, 2013 |
| | | Amounts Presented in Balance Sheet | | Offsetting Instruments (a) | | Financial Collateral (Received) Pledged (b) | | Net Amounts |
| Derivative assets: | | | | | | | | |
| Commodity contracts | | $ | 788 |
| | $ | (389 | ) | | $ | (299 | ) | | $ | 100 |
|
| Interest rate swaps | | 67 |
| | (67 | ) | | — |
| | — |
|
| Total derivative assets | | 855 |
| | (456 | ) | | (299 | ) | | 100 |
|
| Derivative liabilities: | | | | | | | | |
| Commodity contracts | | (263 | ) | | 168 |
| | 70 |
| | (25 | ) |
| Interest rate swaps | | (1,092 | ) | | 288 |
| | — |
| | (804 | ) |
| Total derivative liabilities | | (1,355 | ) | | 456 |
| | 70 |
| | (829 | ) |
| Net amounts | | $ | (500 | ) | | $ | — |
| | $ | (229 | ) | | $ | (729 | ) |
____________
| |
| (a) | Offsetting instruments at December 31, 2013 with respect to commodity contracts include amounts related to interest rate swaps and vice versa. All amounts presented exclude trade accounts receivable and payable related to settled financial instruments. |
| |
| (b) | Financial collateral consists entirely of cash margin deposits. |
Derivative Volumes — The following table presents the gross notional amounts of derivative volumes at December 31, 2014 and 2013:
|
| | | | | | | | | | |
| | | December 31, | | |
| | | 2014 | | 2013 | | |
| Derivative type | | Notional Volume | | Unit of Measure |
| Interest rate swaps: | | | | | | |
| Floating/fixed (a) | | $ | — |
| | $ | 32,490 |
| | Million US dollars |
| Basis | | $ | — |
| | $ | 1,050 |
| | Million US dollars |
| Natural gas (b) | | 1,687 |
| | 2,150 |
| | Million MMBtu |
| Electricity | | 22,820 |
| | 16,482 |
| | GWh |
| Congestion Revenue Rights (c) | | 89,484 |
| | 77,799 |
| | GWh |
| Coal | | 10 |
| | 9 |
| | Million US tons |
| Fuel oil | | 36 |
| | 26 |
| | Million gallons |
| Uranium | | 150 |
| | 450 |
| | Thousand pounds |
____________
| |
| (a) | Amounts at December 31, 2013 include notional amount of interest rate swaps that had maturity dates through October 2014 as well as notional amount of swaps effective from October 2014 that had maturity dates through October 2017. |
| |
| (b) | Represents gross notional forward sales, purchases and options transactions, locational basis swaps and other natural gas transactions. |
| |
| (c) | Represents gross forward purchases associated with instruments used to hedge electricity price differences between settlement points within ERCOT. |
Credit Risk-Related Contingent Features of Derivatives
The agreements that govern our derivative instrument transactions may contain certain credit risk-related contingent features that could trigger liquidity requirements in the form of cash collateral, letters of credit or some other form of credit enhancement. Certain of these agreements require the posting of collateral if our credit rating is downgraded by one or more credit rating agencies; however, due to our credit ratings being below investment grade, substantially all of such collateral posting requirements have already been effective.
At December 31, 2014 and 2013, the fair value of liabilities related to derivative instruments under agreements with credit risk-related contingent features that were not fully collateralized totaled $17 million and $4 million, respectively. The liquidity exposure associated with these liabilities was reduced by cash and letter of credit postings with the counterparties totaling $5 million and $3 million at December 31, 2014 and 2013, respectively.
In addition, certain derivative agreements that are collateralized primarily with liens on certain of our assets include indebtedness cross-default provisions that have resulted in the termination of such contracts as a result of the Bankruptcy Filing. Substantially all of the credit risk-related contingent features related to these derivatives, including amounts related to cross-default provisions, were triggered upon the Bankruptcy Filing, and substantially all of the contracts had been cancelled at December 31, 2014. At December 31, 2014 and 2013, the fair value of derivative liabilities subject to such cross-default provisions totaled $1 million and $1.103 billion, respectively, before consideration of the collateral. Amounts at December 31, 2013 were largely related to interest rate swaps. The liquidity exposure associated with these liabilities totaled $1.154 billion at December 31, 2013 and was reduced by cash and letter of credit postings with the counterparties totaling $6 million. There was no liquidity exposure associated with these liabilities at December 31, 2014. See Note 12 for a description of other pre-petition obligations that are supported by liens on certain of our assets.
As discussed immediately above, the aggregate fair values of liabilities under derivative agreements with credit risk-related contingent features, including cross-default provisions, totaled $18 million and $1.107 billion at December 31, 2014 and 2013, respectively. These amounts are before consideration of cash and letter of credit collateral posted, net accounts receivable and derivative assets under netting arrangements and assets subject to related liens.
Some commodity derivative contracts contain credit risk-related contingent features that do not provide for specific amounts to be posted if the features are triggered. These provisions include material adverse change, performance assurance, and other clauses that generally provide counterparties with the right to request additional credit enhancements. The amounts disclosed above exclude credit risk-related contingent features that do not provide for specific amounts or exposure calculations.
Concentrations of Credit Risk Related to Derivatives
We have concentrations of credit risk with the counterparties to our derivative contracts. At December 31, 2014, total credit risk exposure to all counterparties related to derivative contracts totaled $575 million (including associated accounts receivable). The net exposure to those counterparties totaled $245 million at December 31, 2014 after taking into effect netting arrangements, setoff provisions and collateral, with the largest net exposure to a single counterparty totaling $56 million. At December 31, 2014, the credit risk exposure to the banking and financial sector represented 81% of the total credit risk exposure and 62% of the net exposure. The termination of natural gas hedging agreements by counterparties shortly after the Bankruptcy Filing did not significantly affect the net credit risk exposure amount presented.
Exposure to banking and financial sector counterparties is considered to be within an acceptable level of risk tolerance because all of this exposure is with counterparties with investment grade credit ratings. However, this concentration increases the risk that a default by any of these counterparties would have a material effect on our financial condition, results of operations and liquidity. The transactions with these counterparties contain certain provisions that would require the counterparties to post collateral in the event of a material downgrade in their credit rating.
We maintain credit risk policies with regard to our counterparties to minimize overall credit risk. These policies authorize specific risk mitigation tools including, but not limited to, use of standardized master agreements that allow for netting of positive and negative exposures associated with a single counterparty. Credit enhancements such as parent guarantees, letters of credit, surety bonds, liens on assets and margin deposits are also utilized. Prospective material changes in the payment history or financial condition of a counterparty or downgrade of its credit quality result in the reassessment of the credit limit with that counterparty. The process can result in the subsequent reduction of the credit limit or a request for additional financial assurances. An event of default by one or more counterparties could subsequently result in termination-related settlement payments that reduce available liquidity if amounts are owed to the counterparties related to the derivative contracts or delays in receipts of expected settlements if the counterparties owe amounts to us.
| |
| 17. | PENSION AND OTHER POSTRETIREMENT EMPLOYEE BENEFITS (OPEB) PLANS |
EFH Corp. is the plan sponsor of the EFH Retirement Plan (the Retirement Plan), which had provided benefits to eligible employees of its subsidiaries, including Oncor. After the amendments in 2012 discussed below, participating employees in the Retirement Plan now consist entirely of active and retired collective bargaining unit employees in our competitive business. The Retirement Plan is a qualified defined benefit pension plan under Section 401(a) of the Internal Revenue Code of 1986, as amended (Code), and is subject to the provisions of ERISA. The Retirement Plan provides benefits to participants under one of two formulas: (i) a Cash Balance Formula under which participants earn monthly contribution credits based on their compensation and a combination of their age and years of service, plus monthly interest credits or (ii) a Traditional Retirement Plan Formula based on years of service and the average earnings of the three years of highest earnings. The interest component of the Cash Balance Formula is variable and is determined using the yield on 30-year Treasury bonds. Under the Cash Balance Formula, future increases in earnings will not apply to prior service costs. It is our policy to fund the Retirement Plan assets only to the extent deductible under existing federal tax regulations.
In August 2012, EFH Corp. approved certain amendments to the Retirement Plan. These actions were completed in the fourth quarter 2012, and the amendments resulted in:
| |
| • | splitting off assets and liabilities under the Retirement Plan associated with active employees of Oncor and all retirees and terminated vested participants of EFH Corp. and its subsidiaries (including discontinued businesses) to a new plan sponsored and administered by Oncor (the Oncor Plan) and |
| |
| • | the termination of, distributions of benefits under, and settlement of all of EFH Corp.'s liabilities associated with active employees of EFH Corp.'s competitive businesses (the Terminating Plan) other than collective bargaining unit employees. |
EFH Corp.'s competitive operations recorded charges totaling $285 million in the fourth quarter 2012, including $92 million related to the settlement of the Terminating Plan and $193 million related to the competitive business obligations (including discontinued businesses) that were assumed under the Oncor Plan. These amounts represent the previously unrecognized actuarial losses reported in accumulated other comprehensive income (loss). TCEH's allocated share of the charges totaled $141 million. TCEH settled $91 million of this allocation with EFH Corp. in cash in 2012 and $50 million in the first quarter 2013.
Settlement of the liabilities and the full funding of the EFH Corp. competitive operations portion of liabilities (including discontinued businesses) assumed under the Oncor Plan resulted in an aggregate cash contribution by EFH Corp.'s competitive operations of $259 million to the Retirement Plan assets in the fourth quarter 2012.
We also have supplemental unfunded retirement plans for certain employees whose retirement benefits cannot fully be earned under the qualified Retirement Plan, the information for which is included below.
EFH Corp. offers other postretirement employee benefits (OPEB) in the form of health care and life insurance to eligible employees of its subsidiaries and their eligible dependents upon the retirement of such employees. For employees retiring on or after January 1, 2002, the retiree contributions required for such coverage vary based on a formula depending on the retiree's age and years of service. In 2011, we announced a change to the OPEB plan whereby, effective January 1, 2013, Medicare-eligible retirees from the competitive business will be subject to a cap on increases in subsidies received under the plan to offset medical costs.
In accordance with an agreement between Oncor and EFH Corp., Oncor ceased participation in EFH Corp.'s OPEB Plan effective July 1, 2014 and established its own OPEB plan for Oncor's eligible existing and future retirees and their dependents, as well as split service participants as discussed immediately below under Regulatory Recovery of Pension and OPEB Costs and in Note 19. The separation resulted in the transfer of a significant portion of the liability associated with our plan to the new Oncor plan, which resulted in a reduction of our OPEB liability of approximately $758 million and a corresponding reduction of an equal amount in the receivable from unconsolidated subsidiary.
As a result of the separation of OPEB Plans, asset values and obligations were remeasured as of July 1, 2014, resulting in EFH Corp.'s new projected benefit obligation increasing by $16 million as compared to December 31, 2013. Assumptions used in the remeasurement included a decrease in the discount rate to 3.77% for the EFH Corp. plan and 4.39% for the Oncor plan from 4.98% assumed at December 31, 2013. There was no change in the expected return on assets of 7.05% assumed at December 31, 2013. The remeasurement did not materially affect reported OPEB expense for the six months ended December 31, 2014.
Regulatory Recovery of Pension and OPEB Costs
PURA provides for the recovery by Oncor, in its regulated revenue rates, of pension and OPEB costs applicable to services of Oncor's active and retired employees, as well as services of other EFH Corp. active and retired employees prior to the deregulation and disaggregation of our electric utility business effective January 1, 2002. Oncor is authorized to establish a regulatory asset or liability for the difference between the amounts of pension and OPEB costs reflected in Oncor's approved (by the PUCT) revenue rates and the actual amounts that would otherwise have been recorded as charges or credits to earnings, including amounts related to pre-2002 service of EFH Corp. employees. Regulatory assets and liabilities are ultimately subject to PUCT approval. Oncor is contractually obligated to EFH Corp. to fund pension obligations for which the costs are recoverable in its rates.
Pension and OPEB Costs
|
| | | | | | | | | | | |
| | Year Ended December 31, |
| | 2014 | | 2013 | | 2012 |
| Pension costs (a) | $ | 13 |
| | $ | 26 |
| | $ | 512 |
|
| OPEB costs | 27 |
| | 39 |
| | 25 |
|
| Total benefit costs | 40 |
| | 65 |
| | 537 |
|
| Less amounts expensed by Oncor (and not consolidated) | (13 | ) | | (25 | ) | | (36 | ) |
| Less amounts deferred principally as a regulatory asset or property by Oncor | (15 | ) | | (25 | ) | | (165 | ) |
| Net amounts recognized as expense by EFH Corp. and consolidated subsidiaries | $ | 12 |
| | $ | 15 |
| | $ | 336 |
|
___________
| |
| (a) | As a result of pension plan actions discussed in this Note, the 2012 amount includes $285 million recorded by EFH Corp. as a settlement charge and $81 million recorded by Oncor as a regulatory asset. |
At December 31, 2014 and 2013, Oncor had recorded regulatory assets totaling $1.166 billion and $786 million, respectively, related to pension and OPEB costs, including amounts related to deferred expenses as well as amounts related to unfunded liabilities that otherwise would be recorded as other comprehensive income.
Market-Related Value of Assets Held in Postretirement Benefit Trusts
We use the calculated value method to determine the market-related value of the assets held in the trust for purposes of calculating pension costs. We include the realized and unrealized gains or losses in the market-related value of assets over a rolling four-year period. Each year, 25% of such gains and losses for the current year and for each of the preceding three years is included in the market-related value. Each year, the market-related value of assets is increased for contributions to the plan and investment income and is decreased for benefit payments and expenses for that year. We use the fair value method to determine the market-related value of the assets held in the trust for purposes of calculating OPEB costs.
Detailed Information Regarding Pension Benefits
The following information is based on December 31, 2014, 2013 and 2012 measurement dates:
|
| | | | | | | | | | | |
| | Year Ended December 31, |
| | 2014 | | 2013 | | 2012 |
| Assumptions Used to Determine Net Periodic Pension Cost: | | | | | |
| Discount rate (a) | 5.07 | % | | 4.30 | % | | 5.00 | % |
| Expected return on plan assets | 6.17 | % | | 5.40 | % | | 7.40 | % |
| Rate of compensation increase | 3.50 | % | | 3.50 | % | | 3.81 | % |
| Components of Net Pension Cost: | | | | | |
| Service cost | $ | 7 |
| | $ | 8 |
| | $ | 44 |
|
| Interest cost | 14 |
| | 12 |
| | 157 |
|
| Expected return on assets | (12 | ) | | (7 | ) | | (161 | ) |
| Amortization of net actuarial loss | 4 |
| | 8 |
| | 106 |
|
| Effect of pension plan actions (b) | — |
| | 5 |
| | 366 |
|
| Net periodic pension cost | $ | 13 |
| | $ | 26 |
| | $ | 512 |
|
| Other Changes in Plan Assets and Benefit Obligations Recognized in Other Comprehensive Income: | | | | | |
| Net loss | $ | 15 |
| | $ | 5 |
| | $ | 57 |
|
| Amortization of net loss | — |
| | — |
| | (31 | ) |
| Effect of pension plan actions (c) | — |
| | (4 | ) | | (307 | ) |
| Total loss (income) recognized in other comprehensive income | $ | 15 |
| | $ | 1 |
| | $ | (281 | ) |
| Total recognized in net periodic benefit cost and other comprehensive income | $ | 28 |
| | $ | 27 |
| | $ | 231 |
|
| Assumptions Used to Determine Benefit Obligations: | | | | | |
| Discount rate | 4.19 | % | | 5.07 | % | | 4.30 | % |
| Rate of compensation increase | 3.50 | % | | 3.50 | % | | 3.50 | % |
___________
| |
| (a) | As a result of the amendments discussed above, the discount rate reflected in net pension costs for January through July 2012 was 5.00%, for August through September 2012 was 4.15% and for October through December 2012 was 4.20%. |
| |
| (b) | Amount in 2012 includes settlement charges of $285 million recorded by EFH Corp. and $81 million recorded by Oncor as a regulatory asset. |
| |
| (c) | Amount in 2012 includes $285 million in actuarial losses reclassified to net income (loss) as a settlement charge and a $22 million plan curtailment adjustment. |
|
| | | | | | | |
| | Year Ended December 31, |
| | 2014 | | 2013 |
| Change in Pension Obligation: | | | |
| Projected benefit obligation at beginning of year | $ | 272 |
| | $ | 285 |
|
| Service cost | 7 |
| | 8 |
|
| Interest cost | 14 |
| | 12 |
|
| Actuarial (gain) loss | 45 |
| | (21 | ) |
| Benefits paid | (7 | ) | | (5 | ) |
| Settlements | — |
| | (7 | ) |
| Projected benefit obligation at end of year | $ | 331 |
| | $ | 272 |
|
| Accumulated benefit obligation at end of year | $ | 307 |
| | $ | 250 |
|
| Change in Plan Assets: | | | |
| Fair value of assets at beginning of year | $ | 126 |
| | $ | 151 |
|
| Actual return on assets | 26 |
| | (13 | ) |
| Employer contributions | 85 |
| | 7 |
|
| Benefits paid | (7 | ) | | (5 | ) |
| Settlements | — |
| | (14 | ) |
| Fair value of assets at end of year | $ | 230 |
| | $ | 126 |
|
| Funded Status: | | | |
| Projected pension benefit obligation | $ | (331 | ) | | $ | (272 | ) |
| Fair value of assets | 230 |
| | 126 |
|
| Funded status at end of year (a) | $ | (101 | ) | | $ | (146 | ) |
| Amounts Recognized in the Balance Sheet Consist of: | | | |
| Other current liabilities | (1 | ) | | (1 | ) |
| Liabilities subject to compromise | (23 | ) | | — |
|
| Other noncurrent liabilities | (77 | ) | | (145 | ) |
| Net liability recognized | $ | (101 | ) | | $ | (146 | ) |
| Amounts Recognized in Accumulated Other Comprehensive Income Consist of: | | | |
| Net loss | $ | 17 |
| | $ | 3 |
|
| Amounts Recognized by Oncor as Regulatory Assets Consist of: | | | |
| Net loss | $ | 56 |
| | $ | 44 |
|
| Net amount recognized | $ | 56 |
| | $ | 44 |
|
___________
| |
| (a) | Amounts in 2014 and 2013 include $47 million and $93 million, respectively, for which Oncor is contractually responsible and which are expected to be recovered in Oncor's rates. See Note 19. |
The following table provides information regarding pension plans with projected benefit obligation (PBO) and accumulated benefit obligation (ABO) in excess of the fair value of plan assets.
|
| | | | | | | |
| | December 31, |
| | 2014 | | 2013 |
| Pension Plans with PBO and ABO in Excess Of Plan Assets: | | | |
| Projected benefit obligations | $ | 331 |
| | $ | 272 |
|
| Accumulated benefit obligation | $ | 307 |
| | $ | 250 |
|
| Plan assets | $ | 230 |
| | $ | 126 |
|
The increase in the projected benefit obligation during 2014 was driven by actuarial losses resulting from lower discount rates and increased life expectancy rates.
Pension Plan Investment Strategy and Asset Allocations
Our investment objective for the Retirement Plan is to invest in a suitable mix of assets to meet the future benefit obligations at an acceptable level of risk, while minimizing the volatility of contributions. Considering the pension plan actions discussed in this Note, the target allocation ranges have shifted to fixed income securities from equities. US equities, international equities and fixed income securities were previously in the ranges of 12% to 34%, 10% to 26% and 40% to 70%, respectively. Equity securities are held to enhance returns by participating in a wide range of investment opportunities. International equity securities are used to further diversify the equity portfolio and may include investments in both developed and emerging international markets. Fixed income securities include primarily corporate bonds from a diversified range of companies, US Treasuries and agency securities and money market instruments. Our investment strategy for fixed income investments is to maintain a high grade portfolio of securities which assist us in managing the volatility and magnitude of plan contributions and expense while maintaining sufficient cash and short-term investments to pay near-term benefits and expenses.
The target asset allocation ranges of pension plan investments by asset category are as follows:
|
| | | | |
| Asset Category: | Target Allocation Ranges |
| US equities | 8 | % | - | 14% |
| International equities | 6 | % | - | 12% |
| Fixed income | 74 | % | - | 86% |
Fair Value Measurement of Pension Plan Assets
At December 31, 2014 and 2013, pension plan assets measured at fair value on a recurring basis consisted of the following:
|
| | | | | | | |
| | December 31, (a) |
| Asset Category: | 2014 | | 2013 |
| Interest-bearing cash | $ | 21 |
| | $ | 17 |
|
| Equity securities: | | | |
| US | 25 |
| | 16 |
|
| International | 20 |
| | 12 |
|
| Fixed income securities: | | | |
| Corporate bonds (b) | 127 |
| | 51 |
|
| US Treasuries | 19 |
| | 27 |
|
| Other (c) | 18 |
| | 3 |
|
| Total assets | $ | 230 |
| | $ | 126 |
|
___________
| |
| (a) | All amounts are based on Level 2 valuations. See Note 15. |
| |
| (b) | Substantially all corporate bonds are rated investment grade by a major ratings agency such as Moody's. |
| |
| (c) | Other consists primarily of municipal bonds. |
Detailed Information Regarding Postretirement Benefits Other Than Pensions
The following OPEB information is based on December 31, 2014, 2013 and 2012 measurement dates (includes amounts related to Oncor):
|
| | | | | | | | | | | |
| | Year Ended December 31, |
| | 2014 | | 2013 | | 2012 |
| Assumptions Used to Determine Net Periodic Benefit Cost: | | | | | |
| Discount rate | 4.98 | % | | 4.10 | % | | 4.95 | % |
| Expected return on plan assets | 7.05 | % | | 6.70 | % | | 6.80 | % |
| Components of Net Postretirement Benefit Cost: | | | | | |
| Service cost | $ | 8 |
| | $ | 11 |
| | $ | 9 |
|
| Interest cost | 28 |
| | 41 |
| | 44 |
|
| Expected return on assets | (6 | ) | | (12 | ) | | (12 | ) |
| Amortization of net transition obligation | — |
| | — |
| | 1 |
|
| Amortization of prior service cost/(credit) | (21 | ) | | (31 | ) | | (32 | ) |
| Amortization of net actuarial loss | 18 |
| | 30 |
| | 15 |
|
| Net periodic OPEB cost | $ | 27 |
| | $ | 39 |
| | $ | 25 |
|
| Other Changes in Plan Assets and Benefit Obligations Recognized in Other Comprehensive Income: | | | | | |
| Net (gain) loss | $ | 12 |
| | $ | 4 |
| | $ | 17 |
|
| Amortization of net gain | (5 | ) | | (3 | ) | | (1 | ) |
| Amortization of prior service credit | 11 |
| | 11 |
| | 11 |
|
| Total loss recognized in other comprehensive income | $ | 18 |
| | $ | 12 |
| | $ | 27 |
|
| Total recognized in net periodic benefit cost and other comprehensive income | $ | 45 |
| | $ | 51 |
| | $ | 52 |
|
| Assumptions Used to Determine Benefit Obligations at Period End: | | | | | |
| Discount rate (EFH Corp. Plan) | 3.81 | % | | 4.98 | % | | 4.10 | % |
| Discount rate (Oncor Plan) | 4.23 | % | | N/A |
| | N/A |
|
|
| | | | | | | |
| | Year Ended December 31, |
| | 2014 | | 2013 |
| Change in Postretirement Benefit Obligation: | | | |
| Benefit obligation at beginning of year | $ | 1,049 |
| | $ | 1,032 |
|
| Service cost | 8 |
| | 11 |
|
| Interest cost | 28 |
| | 41 |
|
| Participant contributions | 10 |
| | 16 |
|
| Medicare Part D reimbursement | — |
| | 2 |
|
| Actuarial (gain) loss | 84 |
| | 15 |
|
| Benefits paid | (40 | ) | | (68 | ) |
| Transfers to new plan sponsored by Oncor | (1,000 | ) | | — |
|
| Benefit obligation at end of year | $ | 139 |
| | $ | 1,049 |
|
| Change in Plan Assets: | | | |
| Fair value of assets at beginning of year | $ | 179 |
| | $ | 191 |
|
| Actual return on assets | 11 |
| | 22 |
|
| Employer contributions | 16 |
| | 18 |
|
| Participant contributions | 10 |
| | 16 |
|
| Benefits paid | (40 | ) | | (68 | ) |
| Transfers to new plan sponsored by Oncor | (176 | ) | | — |
|
| Fair value of assets at end of year | $ | — |
| | $ | 179 |
|
| Funded Status: | | | |
| Benefit obligation | $ | (139 | ) | | $ | (1,049 | ) |
| Fair value of assets | — |
| | 179 |
|
| Funded status at end of year (a) | $ | (139 | ) | | $ | (870 | ) |
| Amounts Recognized on the Balance Sheet Consist of: | | | |
| Other current liabilities | $ | (8 | ) | | $ | (8 | ) |
| Other noncurrent liabilities | (131 | ) | | (862 | ) |
| Net liability recognized | $ | (139 | ) | | $ | (870 | ) |
| Amounts Recognized in Accumulated Other Comprehensive Income Consist of: | | | |
| Prior service credit | $ | (43 | ) | | $ | (54 | ) |
| Net loss | 41 |
| | 34 |
|
| Net amount recognized | $ | (2 | ) | | $ | (20 | ) |
| Amounts Recognized by Oncor as Regulatory Assets Consist of: | | | |
| Net loss | $ | — |
| | $ | 221 |
|
| Prior service credit | — |
| | (91 | ) |
| Net amount recognized | $ | — |
| | $ | 130 |
|
___________
| |
| (a) | Amounts in 2013 include $745 million for which Oncor is contractually responsible, substantially all of which is expected to be recovered in Oncor's rates. See Note 19. |
The following tables provide information regarding the assumed health care cost trend rates.
|
| | | | | |
| | December 31, |
| | 2014 | | 2013 |
| Assumed Health Care Cost Trend Rates-Not Medicare Eligible: | | | |
| Health care cost trend rate assumed for next year | 8.00 | % | | 8.00 | % |
| Rate to which the cost trend is expected to decline (the ultimate trend rate) | 5.00 | % | | 5.00 | % |
| Year that the rate reaches the ultimate trend rate | 2022 |
| | 2022 |
|
| Assumed Health Care Cost Trend Rates-Medicare Eligible: | | | |
| Health care cost trend rate assumed for next year | 6.50 | % | | 7.00 | % |
| Rate to which the cost trend is expected to decline (the ultimate trend rate) | 5.00 | % | | 5.00 | % |
| Year that the rate reaches the ultimate trend rate | 2022 |
| | 2022 |
|
|
| | | | | | | |
| | 1-Percentage Point Increase | | 1-Percentage Point Decrease |
| Sensitivity Analysis of Assumed Health Care Cost Trend Rates: | | | |
| Effect on accumulated postretirement obligation | $ | (3 | ) | | $ | 2 |
|
| Effect on postretirement benefits cost | $ | — |
| | $ | — |
|
Fair Value Measurement of OPEB Plan Assets
At December 31, 2014, the EFH OPEB plan had no plan assets as the existing assets were transferred to the Oncor OPEB plan as part of the separation discussed above. At December 31, 2013, OPEB plan assets measured at fair value on a recurring basis consisted of the following:
|
| | | | | | | | | | | | | | | |
| Asset Category: | Level 1 | | Level 2 | | Level 3 | | Total |
| Interest-bearing cash | $ | — |
| | $ | 6 |
| | $ | — |
| | $ | 6 |
|
| Equity securities: | | | | | | | |
| US | 53 |
| | 5 |
| | — |
| | 58 |
|
| International | 35 |
| | — |
| | — |
| | 35 |
|
| Fixed income securities: | | | | | | | |
| Corporate bonds (a) | — |
| | 34 |
| | — |
| | 34 |
|
| US Treasuries | — |
| | 1 |
| | — |
| | 1 |
|
| Other (b) | 43 |
| | 2 |
| | — |
| | 45 |
|
| Total assets | $ | 131 |
| | $ | 48 |
| | $ | — |
| | $ | 179 |
|
___________
| |
| (a) | Substantially all corporate bonds are rated investment grade by a major ratings agency such as Moody's. |
| |
| (b) | Other consists primarily of US agency securities. |
Expected Long-Term Rate of Return on Assets Assumption
The Retirement Plan strategic asset allocation is determined in conjunction with the plan's advisors and utilizes a comprehensive Asset-Liability modeling approach to evaluate potential long-term outcomes of various investment strategies. The study incorporates long-term rate of return assumptions for each asset class based on historical and future expected asset class returns, current market conditions, rate of inflation, current prospects for economic growth, and taking into account the diversification benefits of investing in multiple asset classes and potential benefits of employing active investment management.
|
| | |
| Retirement Plan |
| Asset Class: | Expected Long-Term Rate of Return |
| US equity securities | 6.8 | % |
| International equity securities | 7.5 | % |
| Fixed income securities | 4.4 | % |
| Weighted average | 5.4 | % |
Significant Concentrations of Risk
The plans' investments are exposed to risks such as interest rate, capital market and credit risks. We seek to optimize return on investment consistent with levels of liquidity and investment risk which are prudent and reasonable, given prevailing capital market conditions and other factors specific to us. While we recognize the importance of return, investments will be diversified in order to minimize the risk of large losses unless, under the circumstances, it is clearly prudent not to do so. There are also various restrictions and guidelines in place including limitations on types of investments allowed and portfolio weightings for certain investment securities to assist in the mitigation of the risk of large losses.
Assumed Discount Rate
We selected the assumed discount rate using the Aon Hewitt AA Above Median yield curve, which is based on corporate bond yields and at December 31, 2014 consisted of 415 corporate bonds with an average rating of AA using Moody's, Standard &Poor's Rating Services and Fitch Ratings, Ltd. ratings.
Amortization in 2015
We estimate amortization of the net actuarial loss and prior service cost for the defined benefit pension plan from accumulated other comprehensive income into net periodic benefit cost will be immaterial. We estimate amortization of the net actuarial loss and prior service credit for the OPEB plan from accumulated other comprehensive income into net periodic benefit cost will total $4 million and a $11 million credit, respectively.
Contributions in 2014 and 2015
In February 2014, a cash contribution totaling $84 million was made to the Retirement Plan assets, of which $64 million was contributed by Oncor and $20 million was contributed by TCEH, which resulted in the Retirement Plan being fully funded as calculated under the provisions of ERISA. As a result of the Bankruptcy Filing, participants in the Retirement Plan who choose to retire would not be eligible for the lump sum payout option under the Retirement Plan unless the Retirement Plan is fully funded. Pension plan funding in 2015 is expected to total $52 million, including $41 million from Oncor. OPEB plan funding in 2014 totaled $16 million, including $7 million from Oncor, and funding in 2015 is expected to total $9 million, with no contributions from Oncor as a result of Oncor ceasing participation in the plan effective July 1, 2014.
Future Benefit Payments
Estimated future benefit payments to beneficiaries, including amounts related to nonqualified plans, are as follows:
|
| | | | | | | | | | | | | | | | | | | | | | | |
| | 2015 | | 2016 | | 2017 | | 2018 | | 2019 | | 2020-24 |
| Pension benefits | $ | 11 |
| | $ | 12 |
| | $ | 14 |
| | $ | 15 |
| | $ | 18 |
| | $ | 105 |
|
| OPEB | $ | 8 |
| | $ | 8 |
| | $ | 8 |
| | $ | 8 |
| | $ | 9 |
| | $ | 46 |
|
Thrift Plan
Our employees may participate in a qualified savings plan (the Thrift Plan). This plan is a participant-directed defined contribution plan intended to qualify under Section 401(a) of the Code, and is subject to the provisions of ERISA. Under the terms of the Thrift Plan, employees who do not earn more than the IRS threshold compensation limit used to determine highly compensated employees may contribute, through pre-tax salary deferrals and/or after-tax payroll deductions, the lesser of 75% of their regular salary or wages or the maximum amount permitted under applicable law. Employees who earn more than such threshold may contribute from 1% to 20% of their regular salary or wages. Employer matching contributions are also made in an amount equal to 100% (75% for employees covered under the Traditional Retirement Plan Formula) of the first 6% of employee contributions. Employer matching contributions are made in cash and may be allocated by participants to any of the plan's investment options. Our contributions to the Thrift Plan totaled $24 million, $23 million and $21 million for the years ended December 31, 2014, 2013 and 2012, respectively. In accordance with an agreement in 2014 between Oncor and EFH Corp., Oncor ceased participation in EFH Corp.'s Thrift Plan effective January 1, 2015 and established its own plan.
| |
| 18. | STOCK-BASED COMPENSATION |
EFH Corp. 2007 Stock Incentive Plan
In December 2007, we established the 2007 Stock Incentive Plan for Key Employees of EFH Corp. and its Affiliates (2007 SIP). Incentive awards under the 2007 SIP may be granted to directors and officers and qualified managerial employees of EFH Corp. or its subsidiaries or affiliates in the form of non-qualified stock options, stock appreciation rights, restricted shares, deferred shares, shares of common stock, the opportunity to purchase shares of common stock and other awards that are valued in whole or in part by reference to, or are otherwise based on the fair market value of EFH Corp.'s shares of common stock. The 2007 SIP permits the grant of awards for 72 million shares of common stock, subject to adjustments under applicable laws for certain events, such as a change in control, and no such grants may be issued after December 26, 2017. Shares related to grants that are forfeited, terminated, cancelled, expire unexercised, withheld to satisfy tax withholding obligations, or are repurchased by the Company are available for new grants under the 2007 SIP.
Stock-based compensation expense recorded for the years ended December 31, 2014, 2013 and 2012 was as follows:
|
| | | | | | | | | | | |
| | Year Ended December 31, |
| Type of award | 2014 | | 2013 | | 2012 |
| Restricted stock units | $ | 6 |
| | $ | 6 |
| | $ | 6 |
|
| Stock options | — |
| | 1 |
| | 5 |
|
| Total compensation expense | $ | 6 |
| | $ | 7 |
| | $ | 11 |
|
Restricted Stock Units — Restricted stock units vested as common stock of EFH Corp. in September 2014 or on a prorated basis upon certain defined events such as termination of employment. Compensation expense per unit was based on the estimated value of EFH Corp. stock at the grant date, less a marketability discount factor. To determine expense related to units issued in exchange for stock options, the unit value was further reduced by the fair value of the options exchanged. In the year ended December 31, 2014, all remaining restricted stock units vested and $6 million of compensation expense was recognized. See discussion below regarding stock options exchanged for restricted stock units in 2011.
A summary of restricted stock unit activity is presented below:
|
| | | | | | | | | | |
| Restricted Stock Unit Activity in 2014: | Units (millions) | | Weighted Average Grant Date Fair Value |
| Total outstanding at beginning of period | 26.1 |
| | $ | 0.28 |
| - | $ | 0.93 |
|
| Granted | 0.6 |
| | $ | — |
| - | $ | — |
|
| Exercised | — |
| | $ | — |
| - | $ | — |
|
| Forfeited | (0.2 | ) | | $ | 0.28 |
| - | $ | 0.93 |
|
| Total outstanding at end of period | 26.5 |
| | $ | — |
| - | $ | 0.93 |
|
| Expected forfeitures | — |
| | $ | — |
| - | $ | — |
|
| Vested at end of period | 26.5 |
| | $ | — |
| - | $ | 0.93 |
|
|
| | | | | | | | | | |
| Restricted Stock Unit Activity in 2013: | Units (millions) | | Weighted Average Grant Date Fair Value |
| Total outstanding at beginning of period | 27.5 |
| | $ | 0.38 |
| - | $ | 0.93 |
|
| Granted | 4.0 |
| | $ | 0.28 |
| - | $ | 0.28 |
|
| Exercised | — |
| | $ | — |
| - | $ | — |
|
| Forfeited | (5.4 | ) | | $ | 0.38 |
| - | $ | 0.93 |
|
| Total outstanding at end of period | 26.1 |
| | $ | 0.28 |
| - | $ | 0.93 |
|
| Expected forfeitures | — |
| | $ | — |
| - | $ | — |
|
| Expected to vest at end of period | 26.1 |
| | $ | 0.28 |
| - | $ | 0.93 |
|
|
| | | | | | | | | | |
| Restricted Stock Unit Activity in 2012: | Units (millions) | | Weighted Average Grant Date Fair Value |
| Total outstanding at beginning of period | 24.2 |
| | $ | 0.81 |
| - | $ | 0.93 |
|
| Granted | 4.1 |
| | $ | 0.38 |
| - | $ | 0.38 |
|
| Exercised | — |
| | $ | — |
| - | $ | — |
|
| Forfeited | (0.8 | ) | | $ | 0.81 |
| - | $ | 0.93 |
|
| Total outstanding at end of period | 27.5 |
| | $ | 0.38 |
| - | $ | 0.93 |
|
| Expected forfeitures | — |
| | $ | — |
| - | $ | — |
|
| Expected to vest at end of period | 27.5 |
| | $ | 0.38 |
| - | $ | 0.93 |
|
Stock Options — No options were granted in 2014 or 2013. Stock options outstanding at December 31, 2014 are all held by current or former employees. Options to purchase 5 million shares of EFH Corp. common stock at $0.50 per share were granted in 2012 to a board member who became an employee in 2013. These options vested as follows: 1.7 million, 1.1 million and 1.1 million in 2012, 2013 and 2014, respectively, and the remaining 1.1 million vest during 2015.
The exercise period for vested awards was 10 years from grant date. The terms of the options were fixed at grant date. One-half of the options initially granted in 2009 were to vest solely based upon continued employment over a specific period of time, generally five years, with the options vesting ratably on an annual basis over the period (Time-Based Options). One-half of the options initially granted were to vest based upon both continued employment and the achievement of targeted five-year EFH Corp. EBITDA levels (Performance-Based Options). Prior to vesting, expenses were recorded if the achievement of the EBITDA levels was probable, and amounts recorded were adjusted or reversed if the probability of achievement of such levels changed. Probability of vesting was evaluated at least each quarter.
In October 2009, in consideration of the then recent economic dislocation and the desire to provide incentives for retention, grantees of Performance-Based Options (excluding named executive officers and a small group of other employees) were provided an offer, which substantially all accepted, to exchange their unvested Performance-Based Options granted under the 2007 SIP with a strike price of $5.00 per share and a vesting schedule through October 2012 for new time-based stock options (Cliff-Vesting Options) with a strike price of $3.50 per share (the then most recent market valuation of each share), with one-half of these options to vest in September 2012 and one-half of these options to vest in September 2014. Additionally, certain named executive officers and a small group of other employees were granted an aggregate 3.1 million Cliff-Vesting Options with a strike price of $3.50 per share, to vest in September 2014, and substantially all of these employees also accepted an offer to exchange half of their unvested Performance-Based Options with a strike price of $5.00 per share and a vesting schedule through December 2012 for new time-based stock options with a strike price of $3.50 per share, to vest in September 2014.
In December 2010, in consideration of the desire to enhance retention incentives, EFH Corp. offered employee grantees of all stock options (excluding named executive officers and a limited number of other employees) the right to exchange their vested and unvested options for restricted stock units payable in shares (at a ratio of two options for each stock unit). The exchange offer closed in February 2011, and substantially all eligible employees accepted the offer, which resulted in the issuance of 9.4 million restricted stock units in exchange for 16.1 million time-based options (including 5.2 million that were vested) and 2.8 million performance-based options (including 2.0 million that were vested).
In October 2011, in consideration of the desire to enhance retention incentives, EFH Corp. offered its named executive officers and a limited number of other officers the right to exchange their vested and unvested options for restricted stock units payable in shares on terms largely consistent with offers made in December 2010 to other employee grantees of stock options. The exchange offer closed in October 2011, and all eligible employees accepted the offer, which resulted in the issuance of 11.1 million restricted stock units in exchange for 16.7 million time-based options (including 6.2 million that were vested) and 5.5 million performance-based options (including 3.5 million that were vested).
The fair value of all options granted was estimated using the Black-Scholes option pricing model. Since EFH Corp. is a private company, expected volatility was based on actual historical experience of comparable publicly-traded companies for a term corresponding to the expected life of the options. The expected life represents the period of time that options granted were expected to be outstanding and was calculated using the simplified method prescribed by the SEC Staff Accounting Bulletin No. 107. The simplified method was used since EFH Corp. did not have stock option history upon which to base the estimate of the expected life and data for similar companies was not reasonably available. The risk-free rate was based on the US Treasury security with terms equal to the expected life of the option at the grant date.
Compensation expense for Time-Based Options is based on the grant-date fair value and recognized over the original vesting period as employees perform services. At December 31, 2014, there was a de minimis amount of unrecognized compensation expense related to nonvested Time-Based Options granted to employees that is expected to be recognized ratably over a remaining vesting period of one year. The exchange of time-based options for restricted stock units was considered a modification of the option award for accounting purposes.
There was no change in the number of Time-Based Options outstanding during 2014 and 2013. A summary of activity for 2012 is presented below:
|
| | | | | | |
| Time-Based Options Activity in 2012: | Options (millions) | | Weighted Average Exercise Price |
| Total outstanding at beginning of period | 1.5 |
| | $ | 4.67 |
|
| Granted | 5.0 |
| | $ | 0.50 |
|
| Exercised | — |
| | $ | — |
|
| Forfeited | (0.4 | ) | | $ | 4.33 |
|
| Total outstanding at end of period (weighted average remaining term of 5 – 10 years) | 6.1 |
| | $ | 1.32 |
|
| Exercisable at end of period (weighted average remaining term of 5 – 10 years) | — |
| | $ | — |
|
| Expected forfeitures | (6.1 | ) | | $ | 1.32 |
|
| Expected to vest at end of period (weighted average remaining term of 5 – 10 years) | — |
| | $ | — |
|
|
| | | | | | | | | | | | | | | | | | | | |
| | 2014 | | 2013 | | 2012 |
| Nonvested Time-Based Options Activity: | Options (millions) | | Weighted Average Grant- Date Fair Value | | Options (millions) | | Weighted Average Grant- Date Fair Value | | Options (millions) | | Weighted Average Grant- Date Fair Value |
| Total nonvested at beginning of period | 2.2 |
| | $ | 0.17 |
| | 3.3 |
| | $ | 0.17 |
| | — |
| | $ | — |
|
| Granted | — |
| | $ | — |
| | — |
| | $ | — |
| | 5.0 |
| | $ | 0.17 |
|
| Vested | (1.1 | ) | | $ | 0.17 |
| | (1.1 | ) | | $ | 0.17 |
| | (1.7 | ) | | $ | 0.17 |
|
| Forfeited | — |
| | $ | — |
| | — |
| | $ | — |
| | — |
| | $ | — |
|
| Exchanged | — |
| | $ | — |
| | — |
| | $ | — |
| | — |
| | $ | — |
|
| Total nonvested at end of period | 1.1 |
| | $ | 0.17 |
| | 2.2 |
| | $ | 0.17 |
| | 3.3 |
| | $ | 0.17 |
|
Compensation expense for Performance-Based Options was based on the grant-date fair value and recognized over the requisite performance and service periods for each tranche of options depending upon the achievement of financial performance.
At December 31, 2014 and 2013, there was no unrecognized compensation expense related to nonvested Performance-Based Options because the options are no longer expected to vest as a result of exchanges.
There was no change in the number of Performance-Based Options outstanding or vested in 2014 and 2013. A summary of activity for 2012 is presented below:
|
| | | | | | |
| Performance-Based Options Activity in 2012: | Options (millions) | | Weighted Average Exercise Price |
| Outstanding at beginning of period | 1.8 |
| | $ | 5.00 |
|
| Granted | — |
| | $ | — |
|
| Exercised | — |
| | $ | — |
|
| Forfeited | (0.8 | ) | | $ | 5.00 |
|
| Exchanged | — |
| | $ | — |
|
| Total outstanding at end of period (weighted average remaining term of 5 – 7 years) | 1.0 |
| | $ | — |
|
| Exercisable at end of period (weighted average remaining term of 5 – 7 years) | — |
| | $ | — |
|
| Expected forfeitures | (1.0 | ) | | $ | 5.00 |
|
| Expected to vest at end of period (weighted average remaining term of 5 – 7 years) | — |
| | $ | — |
|
|
| | | | | | | | | | |
| | 2012 |
| Performance-Based Nonvested Options Activity: | Options (millions) | | Grant-Date Fair Value |
| Total nonvested at beginning of period | 0.5 |
| | $ | 1.92 |
| - | $ | 2.01 |
|
| Granted | — |
| | $ | — |
| - | $ | — |
|
| Vested | (0.5 | ) | | $ | 1.92 |
| - | $ | 2.01 |
|
| Forfeited | — |
| | $ | — |
| - | $ | — |
|
| Exchanged | — |
| | $ | — |
| - | $ | — |
|
| Total nonvested at end of period | — |
| | $ | — |
| - | $ | — |
|
Other Share and Share-Based Awards — In 2008, we granted 2.4 million deferred share awards, each of which represents the right to receive one share of EFH Corp. stock, to certain management employees who agreed to forego share-based awards that vested at the Merger date. These deferred share awards are payable in cash or stock upon the earlier of a change of control or separation of service. An additional 1.2 million deferred share awards were granted to certain management employees in 2008, approximately half of which are payable in cash or stock and the balance payable in stock. Of the total 3.6 million deferred share awards, 2.3 million have been surrendered upon termination of employment or other surrender. Deferred share awards that are payable in cash or stock are accounted for as liability awards; therefore, the effects of changes in the estimated value of EFH Corp. shares are recognized in earnings. As a result of the decline in estimated value of EFH Corp. shares, share-based compensation expense in 2014, 2013 and 2012 was reduced by $0.5 million, $0.1 million and $1.0 million, respectively.
Directors and other nonemployees were granted no shares of EFH Corp. stock in 2014, 1.0 million shares in 2013 and 1.0 million shares in 2012. Expense recognized in 2013 and 2012 related to these grants totaled $0.4 million and $1.3 million, respectively.
| |
| 19. | RELATED PARTY TRANSACTIONS |
The following represent our significant related-party transactions.
| |
| • | On a quarterly basis, we accrue a management fee payable to the Sponsor Group under the terms of a management agreement. Related amounts expensed and reported as SG&A expense totaled $40 million, $39 million and $38 million for the years ended December 31, 2014, 2013 and 2012, respectively. Amounts paid totaled zero, $29 million and $38 million in the years ended December 31, 2014, 2013 and 2012, respectively. We had previously paid these fees on a quarterly basis, however, beginning with the quarterly management fee due December 31, 2013, the Sponsor Group, while reserving the right to receive the fees, directed EFH Corp. to suspend payments of the management fees for an indefinite period. Effective with the Petition Date, EFH Corp. suspended allocations of such fees to TCEH and EFIH. Fees accrued as of the Petition Date have been reclassified to liabilities subject to compromise (LSTC). |
| |
| • | In 2007, TCEH entered into the TCEH Senior Secured Facilities with syndicates of financial institutions and other lenders. These syndicates included affiliates of GS Capital Partners, which is a member of the Sponsor Group. Affiliates of each member of the Sponsor Group have from time to time engaged in commercial banking transactions with us and/or provided financial advisory services to us, in each case in the normal course of business. |
| |
| • | In January 2013, fees paid to Goldman, Sachs & Co. (Goldman), an affiliate of GS Capital Partners, for services related to debt exchanges totaled $2 million, described as follows: (i) Goldman acted as a dealer manager for the offers by EFIH and EFIH Finance to exchange new EFIH 10% Notes for EFH Corp. 9.75% Notes, EFH Corp. 10% Notes and EFIH 9.75% Notes (collectively, the Old Notes) and as a solicitation agent in the solicitation of consents by EFH Corp. and EFIH and EFIH Finance to amendments to the Old Notes and indentures governing the Old Notes and (ii) Goldman acted as a dealer manager for the offers by EFIH and EFIH Finance to exchange EFIH Toggle Notes for EFH Corp. 10.875% Notes and EFH Corp. Toggle Notes. See Note 12 for further discussion of these exchange offers. |
For the year ended December 31, 2012, fees paid to Goldman related to debt issuances totaled $10 million, described as follows: (i) Goldman acted as a joint book-running manager and initial purchaser in the February 2012 issuance of $1.15 billion principal amount of EFIH 11.750% Notes for which it received fees totaling $7 million; and (ii) Goldman acted as joint book-running manager and initial purchaser in the August 2012 issuance of $600 million principal amount of 11.750% Notes and $250 million principal amount of EFIH 6.875% Notes for which it received fees totaling $3 million. In the October 2012 issuance of $253 million principal amount of EFIH 6.875% Notes, Goldman acted as joint book-running manager and initial purchaser for which it was paid $1 million. A broker-dealer affiliate of KKR served as a co-manager and initial purchaser and an affiliate of TPG served as an advisor in all of these transactions, for which they each received a total of $4 million.
| |
| • | Affiliates of GS Capital Partners were parties to certain commodity and interest rate hedging transactions with us in the normal course of business. |
| |
| • | Affiliates of the Sponsor Group have sold or acquired, and in the future may sell or acquire, debt or debt securities issued by us in open market transactions or through loan syndications. |
| |
| • | TCEH made loans to EFH Corp. in the form of demand notes (TCEH Demand Notes) that were pledged as collateral under the TCEH Senior Secured Facilities for (i) debt principal and interest payments and (ii) other general corporate purposes for EFH Corp. EFH Corp. settled the balance of the TCEH Demand Notes in January 2013 using $680 million of the proceeds from debt issued by EFIH in 2012. |
| |
| • | EFH Corp. and EFIH have purchased, or received in exchanges, certain debt securities of EFH Corp. and TCEH, which they have held. Principal and interest payments received by EFH Corp. and EFIH on these investments have been used, in part, to service their outstanding debt. These investments are eliminated in consolidation in these consolidated financial statements. EFIH held $1.282 billion principal amount of EFH Corp. debt and $79 million principal amount of TCEH debt at both December 31, 2014 and 2013. EFH Corp. held $303 million principal amount of TCEH debt at both December 31, 2014 and 2013. In the first quarter 2013, EFIH distributed to EFH Corp. $6.360 billion principal amount of EFH Corp. debt previously received by EFIH in debt exchanges; EFH Corp. cancelled the debt instruments (see Note 12). |
| |
| • | TCEH's retail operations pay Oncor for services it provides, principally the delivery of electricity. Expenses recorded for these services, reported in fuel, purchased power costs and delivery fees, totaled approximately $1.0 billion for each of the years ended December 31, 2014, 2013 and 2012. The fees are based on rates regulated by the PUCT that apply to all REPs. The consolidated balance sheets at December 31, 2014 and 2013 reflect amounts due currently to Oncor totaling $118 million and $135 million, respectively (included in net payables due to unconsolidated subsidiary), largely related to these electricity delivery fees. Also see discussion below regarding receivables from Oncor under a Federal and State Income Tax Allocation Agreement. |
| |
| • | In August 2012, TCEH and Oncor agreed to settle, at a discount, two agreements related to securitization (transition) bonds issued by Oncor's bankruptcy-remote financing subsidiary in 2003 and 2004 to recover generation-related regulatory assets. Under the agreements, TCEH had been reimbursing Oncor as described immediately below. Under the settlement, TCEH paid, and Oncor received, $159 million in cash. The settlement was executed by EFIH acquiring the right to reimbursement under the agreements from Oncor and then selling these rights for the same amount to TCEH. The transaction resulted in a $2 million (after tax) decrease in investment in unconsolidated subsidiary in accordance with accounting rules for related party transactions. |
Oncor collects transition surcharges from its customers to recover the transition bond payment obligations. Oncor's incremental income taxes related to the transition surcharges it collects had been reimbursed by TCEH quarterly under a noninterest bearing note payable to Oncor that was to mature in 2016. TCEH's payments on the note prior to the August 2012 settlement totaled $20 million for the year ended December 31, 2012.
Under an interest reimbursement agreement, TCEH had reimbursed Oncor on a monthly basis for interest expense on the transition bonds. The remaining interest to be paid through 2016 under the agreement totaled $53 million at the August 2012 settlement date. Only the monthly accrual of interest under this agreement was reported as a liability. This interest expense prior to the August 2012 settlement totaled $16 million for the year ended December 31, 2012.
| |
| • | A subsidiary of EFH Corp. bills Oncor for financial and other administrative services and shared facilities at cost. Such amounts reduced reported SG&A expense by $34 million, $32 million and $35 million for the years ended December 31, 2014, 2013 and 2012, respectively. |
| |
| • | A subsidiary of EFH Corp. bills TCEH subsidiaries for information technology, financial, accounting and other administrative services at cost. These charges totaled $204 million, $241 million and $265 million for the years ended December 31, 2014, 2013 and 2012, respectively. |
| |
| • | See Note 12 for discussion of a letter of credit issued by TCEH in 2014 to a subsidiary of EFH Corp. to secure its amounts payable to the subsidiary arising from recurring transactions in the normal course. |
| |
| • | In April 2014, prior to the Bankruptcy Filing, a subsidiary of EFH Corp. sold information technology assets to TCEH totaling $24 million. TCEH cash settled these transactions in April 2014. Subsequent to the Bankruptcy Filing, additional information technology assets totaling $28 million were sold by a subsidiary of EFH Corp. to TCEH in 2014. TCEH settled $13 million of this obligation in 2014 and the remainder were cash settled in January 2015. The assets are substantially for the use of TCEH and its subsidiaries. |
| |
| • | Under Texas regulatory provisions, the trust fund for decommissioning the Comanche Peak nuclear generation facility is funded by a delivery fee surcharge billed to REPs by Oncor, as collection agent, and remitted monthly to TCEH for contribution to the trust fund with the intent that the trust fund assets, reported in other investments in our consolidated balance sheets, will ultimately be sufficient to fund the actual future decommissioning liability, reported in noncurrent liabilities in our consolidated balance sheets. The delivery fee surcharges remitted to TCEH totaled $17 million for the year ended December 31, 2014 and $16 million for each of the years ended December 31, 2013 and 2012. Income and expenses associated with the trust fund and the decommissioning liability incurred by TCEH are offset by a net change in a receivable/payable that ultimately will be settled through changes in Oncor's delivery fee rates. At December 31, 2014 and 2013, the excess of the trust fund balance over the decommissioning liability resulted in a payable totaling $479 million and $400 million, respectively, reported in noncurrent liabilities. |
| |
| • | We file a consolidated federal income tax return that includes Oncor Holdings' results. Oncor is not a member of our consolidated tax group, but our consolidated federal income tax return includes our portion of Oncor's results due to our equity ownership in Oncor. We also file a consolidated Texas state margin tax return that includes all of Oncor Holdings' and Oncor's results. However, under a Federal and State Income Tax Allocation Agreement, Oncor Holdings' and Oncor's federal income tax and Texas margin tax expense and related balance sheet amounts, including our income taxes receivable from or payable to Oncor Holdings and Oncor, are recorded as if Oncor Holdings and Oncor file their own corporate income tax returns. |
At December 31, 2014, our net current amount payable to Oncor Holdings related to federal and state income taxes (reported in net payables due to unconsolidated subsidiary) totaled $120 million, all of which related to Oncor. The $120 million net payable to Oncor included a $144 million federal income tax payable offset by a $24 million state margin tax receivable. Additionally, we have a noncurrent tax payable to Oncor of $64 million recorded in other noncurrent liabilities and deferred credits. At December 31, 2013, our current amount receivable totaled $7 million, which included $5 million receivable from Oncor. The receivable from Oncor represented a $23 million state margin tax receivable net of an $18 million federal income tax payable.
For the year ended December 31, 2014, EFH Corp. received income tax payments from Oncor Holdings and Oncor totaling $24 million and $237 million, respectively. For the year ended December 31, 2013, EFH Corp. received income tax payments from Oncor Holdings and Oncor totaling $34 million and $90 million, respectively. The 2013 net payment included $33 million from Oncor related to the 1997 through 2002 IRS appeals settlement and a $10 million refund paid to Oncor related to the filing of amended Texas franchise tax returns for 1997 through 2001. For the year ended December 31, 2012, EFH Corp. received income tax payments from Oncor Holdings and Oncor totaling $35 million and $3 million, respectively. The 2012 net payment included a $21 million federal income tax refund paid to Oncor Holdings.
| |
| • | Pursuant to the Federal and State Income Tax Allocation Agreement between EFH Corp. and TCEH, in September 2013, TCEH made a federal income tax payment of $84 million to EFH Corp related to the 1997 through 2002 IRS appeals settlement. |
| |
| • | Certain transmission and distribution utilities in Texas have requirements in place to assure adequate creditworthiness of any REP to support the REP's obligation to collect securitization bond-related (transition) charges on behalf of the utility. Under these requirements, as a result of TCEH's credit rating being below investment grade, TCEH is required to post collateral support in an amount equal to estimated transition charges over specified time periods. Accordingly, at both December 31, 2014 and 2013, TCEH had posted letters of credit and/or cash in the amount of $9 million for the benefit of Oncor. |
| |
| • | As a result of the pension plan actions discussed in Note 17, in December 2012, Oncor became the sponsor of a new pension plan (the Oncor Plan), the participants in which consist of all of Oncor's active employees and all retirees and terminated vested participants of EFH Corp. and its subsidiaries (including discontinued businesses). Oncor had previously contractually agreed to assume responsibility for pension liabilities that are recoverable by Oncor under regulatory rate-setting provisions. As part of the pension plan actions, EFH Corp. fully funded the non-recoverable pension liabilities under the Oncor Plan. After the pension plan actions, participants remaining in the EFH Corp. pension plan consist of active employees under collective bargaining agreements (union employees). Oncor continues to be responsible for the recoverable portion of pension obligations to these union employees. Under ERISA, EFH Corp. and Oncor remain jointly and severally liable for the funding of the EFH Corp. and Oncor pension plans. We view the risk of the retained liability under ERISA related to the Oncor Plan to not be significant. |
| |
| • | In accordance with an agreement between EFH Corp. and Oncor, Oncor ceased participation in EFH Corp.'s OPEB plan effective July 1, 2014 and established its own OPEB plan for Oncor's eligible existing and future retirees and their dependents. Additionally, the Oncor plan participants include those former participants in the EFH Corp. OPEB plan whose employment included service with both Oncor (or a predecessor regulated electricity business) and our competitive businesses (split service participants). Under the agreement, we will retain the liability for split service participants' benefits related to their years of service with the competitive business. The methodology for OPEB cost allocations between EFH Corp. and Oncor has not changed, and the plan separation does not materially affect the net assets or cash flows of EFH Corp. As discussed in Note 17 and reflected in the amounts presented immediately below, our consolidated balance sheet reflects a reduction in other noncurrent liabilities and deferred credits of $758 million and a reduction in our noncurrent receivable from unconsolidated subsidiary in the same amount as a result of the separation of EFH Corp. and Oncor OPEB plans. |
| |
| • | EFH Corp.'s consolidated balance sheets reflect unfunded pension and OPEB liabilities related to plans that it sponsors, but also reflects a receivable from Oncor for that portion of the unfunded liabilities for which Oncor is contractually responsible, substantially all of which is expected to be recovered in Oncor's rates. At December 31, 2014, the receivable amount relates only to the EFH Corp. pension plan due to Oncor's establishment of its own OPEB plan as noted above and totaled $47 million. At December 31, 2013, the receivable amount relates to the pension and OPEB plans and totaled $838 million. The amounts are classified as noncurrent. Net amounts of pension and OPEB expenses recognized in the years ended December 31, 2014 and 2013 are not material. |
| |
| • | Until June 30, 2014, Oncor employees participated in a health and welfare benefit program offered by EFH Corp. In connection with Oncor establishing its own health and welfare benefits program, Oncor agreed to pay us $1 million to reimburse us for our increased costs of providing benefits under the EFH Corp. program as a result of Oncor's withdrawal and to compensate us for the administrative work related to the transition. This amount was paid in June 2014. |
| |
| • | In the first quarter of 2014, a cash contribution totaling $84 million was made to the EFH Corp. retirement plan, of which $64 million was contributed by Oncor and $20 million was contributed by TCEH, which resulted in the EFH Corp. retirement plan being fully funded as calculated under the provisions of ERISA. As a result of the Bankruptcy Filing, participants in the EFH Corp. retirement plan who choose to retire would not be eligible for the lump sum payout option under the retirement plan unless the EFH Corp. retirement plan was fully funded. The payment by TCEH was accounted for as an advance to EFH Corp. that will be settled as pension and OPEB expenses are allocated to TCEH in the normal course. |
| |
| • | Oncor and Texas Holdings agreed to the terms of a stipulation with major interested parties to resolve all outstanding issues in the PUCT review related to the Merger. As part of this stipulation, TCEH would be required to post a letter of credit in an amount equal to $170 million to secure its payment obligations to Oncor in the event, which has not occurred, two or more rating agencies downgrade Oncor's credit rating below investment grade. |
Our operations are aligned into two reportable business segments: Competitive Electric and Regulated Delivery. The segments are managed separately because they are strategic business units that offer different products or services and involve different risks.
The Competitive Electric segment is engaged in competitive market activities consisting of electricity generation, wholesale energy sales and purchases, commodity risk management and trading activities, and retail electricity operations for residential and business customers, all largely in the ERCOT market. These activities are conducted by TCEH.
The Regulated Delivery segment consists largely of our investment in Oncor. Oncor is engaged in regulated electricity transmission and distribution operations in Texas. These activities are conducted by Oncor, including its wholly owned bankruptcy-remote financing subsidiary. See Note 3 for discussion of the reporting of Oncor Holdings and, accordingly, the Regulated Delivery segment, as an equity method investment. See Note 19 for discussion of material transactions with Oncor, including payment to Oncor of electricity delivery fees, which are based on rates regulated by the PUCT.
Corporate and Other represents the remaining non-segment operations consisting primarily of discontinued businesses, general corporate expenses and interest and other expenses related to EFH Corp., EFIH and EFCH.
The business segment results reflect the application of ASC 852, Reorganizations. The accounting policies of the business segments are the same as those described in the summary of significant accounting policies in Note 1. Our chief operating decision maker uses more than one measure to assess segment performance, including reported segment net income (loss), which is the measure most comparable to consolidated net income (loss) prepared based on GAAP. We account for intersegment sales and transfers as if the sales or transfers were to third parties, that is, at current market prices or regulated rates. Certain shared services costs are allocated to the segments.
|
| | | | | | | | | | | |
| | Year Ended December 31, |
| | 2014 | | 2013 | | 2012 |
| Operating revenues (all Competitive Electric) | $ | 5,978 |
| | $ | 5,899 |
| | $ | 5,636 |
|
| Depreciation and amortization | | | | | |
| Competitive Electric | $ | 1,270 |
| | $ | 1,333 |
| | $ | 1,344 |
|
| Corporate and Other | 13 |
| | 22 |
| | 29 |
|
| Consolidated | $ | 1,283 |
| | $ | 1,355 |
| | $ | 1,373 |
|
| Equity in earnings of unconsolidated subsidiaries (net of tax) (all Regulated Delivery) | $ | 349 |
| | $ | 335 |
| | $ | 270 |
|
| Interest income | | | | | |
| Competitive Electric | $ | — |
| | $ | 6 |
| | $ | 46 |
|
| Corporate and Other | 51 |
| | 148 |
| | 143 |
|
| Eliminations | (50 | ) | | (153 | ) | | (187 | ) |
| Consolidated | $ | 1 |
| | $ | 1 |
| | $ | 2 |
|
| Interest expense and related charges | | | | | |
| Competitive Electric | $ | 1,799 |
| | $ | 2,062 |
| | $ | 2,892 |
|
| Corporate and Other | 452 |
| | 795 |
| | 803 |
|
| Eliminations | (50 | ) | | (153 | ) | | (187 | ) |
| Consolidated | $ | 2,201 |
| | $ | 2,704 |
| | $ | 3,508 |
|
| Income tax benefit | | | | | |
| Competitive Electric | $ | 2,339 |
| | $ | 794 |
| | $ | 954 |
|
| Corporate and Other | 280 |
| | 477 |
| | 278 |
|
| Consolidated | $ | 2,619 |
| | $ | 1,271 |
| | $ | 1,232 |
|
| Net income (loss) attributable to EFH Corp. | | | | | |
| Competitive Electric | $ | (6,260 | ) | | $ | (2,309 | ) | | $ | (3,063 | ) |
| Regulated Delivery | 349 |
| | 335 |
| | 270 |
|
| Corporate and Other | (495 | ) | | (244 | ) | | (567 | ) |
| Consolidated | $ | (6,406 | ) | | $ | (2,218 | ) | | $ | (3,360 | ) |
| Investment in equity investees | | | | | |
| Competitive Electric | $ | 8 |
| | $ | 9 |
| | $ | 8 |
|
| Regulated Delivery | 6,050 |
| | 5,950 |
| | 5,842 |
|
| Consolidated | $ | 6,058 |
| | $ | 5,959 |
| | $ | 5,850 |
|
| Total assets | | | | | |
| Competitive Electric | $ | 21,347 |
| | $ | 28,828 |
| | $ | 33,002 |
|
| Regulated Delivery | 6,050 |
| | 5,950 |
| | 5,842 |
|
| Corporate and Other | 4,025 |
| | 3,692 |
| | 4,861 |
|
| Eliminations | (2,174 | ) | | (2,024 | ) | | (2,735 | ) |
| Consolidated | $ | 29,248 |
| | $ | 36,446 |
| | $ | 40,970 |
|
| Capital expenditures | | | | | |
| Competitive Electric | $ | 336 |
| | $ | 472 |
| | $ | 630 |
|
| Corporate and Other | 50 |
| | 29 |
| | 34 |
|
| Consolidated | $ | 386 |
| | $ | 501 |
| | $ | 664 |
|
| |
| 21. | SUPPLEMENTARY FINANCIAL INFORMATION |
Restricted Cash
|
| | | | | | | | | | | | | | | |
| | December 31, 2014 | | December 31, 2013 |
| | Current
Assets | | Noncurrent Assets | | Current
Assets | | Noncurrent Assets |
| Amounts related to TCEH's DIP Facility (Note 11) | $ | — |
| | $ | 350 |
| | $ | — |
| | $ | — |
|
| Amounts related to TCEH's pre-petition Letter of Credit Facility (Note 12) (a) | — |
| | 551 |
| | 945 |
| | — |
|
| Other | 6 |
| | — |
| | 4 |
| | — |
|
| Total restricted cash | $ | 6 |
| | $ | 901 |
| | $ | 949 |
| | $ | — |
|
____________
| |
| (a) | At December 31, 2013, in consideration of the Bankruptcy Filing, all amounts were classified as current. See Note 12 for discussion of letter of credit draws in 2014. |
Trade Accounts Receivable
|
| | | | | | | |
| | December 31, |
| | 2014 | | 2013 |
| Wholesale and retail trade accounts receivable | $ | 604 |
| | $ | 732 |
|
| Allowance for uncollectible accounts | (15 | ) | | (14 | ) |
| Trade accounts receivable — net | $ | 589 |
| | $ | 718 |
|
Gross trade accounts receivable at December 31, 2014 and 2013 included unbilled revenues of $239 million and $272 million, respectively.
Allowance for Uncollectible Accounts Receivable
|
| | | | | | | | | | | |
| | Year Ended December 31, |
| | 2014 | | 2013 | | 2012 |
| Allowance for uncollectible accounts receivable at beginning of period | $ | 14 |
| | $ | 9 |
| | $ | 27 |
|
| Increase for bad debt expense | 38 |
| | 33 |
| | 26 |
|
| Decrease for account write-offs | (37 | ) | | (28 | ) | | (44 | ) |
| Allowance for uncollectible accounts receivable at end of period | $ | 15 |
| | $ | 14 |
| | $ | 9 |
|
Accounts Receivable Securitization Program
In October 2013, TCEH terminated its Accounts Receivable Securitization Program, described in the following paragraphs, and repaid all outstanding obligations under the program. In connection with the termination of the program, TXU Energy repurchased $491 million in accounts receivable from TXU Energy Receivables Company LLC (TXU Energy Receivables Company) for an aggregate purchase price of $474 million, TXU Energy Receivables Company paid TXU Energy $11 million, constituting repayment in full of its outstanding obligations under its subordinated note with TXU Energy, and TXU Energy Receivables Company repaid all of its borrowings from a financial institution providing the financing for the program totaling $126 million.
The TCEH securitization program was implemented in November 2012 upon the termination of a predecessor program that except as noted was substantially the same as TCEH's program and was accounted for similarly. Under the predecessor program, the borrowing entity was a wholly owned subsidiary of EFH Corp.
Under TCEH's Accounts Receivable Securitization Program, TXU Energy (originator) sold all of its trade accounts receivable to TXU Energy Receivables Company, which was an entity created for the special purpose of purchasing receivables from the originator and was a consolidated, wholly owned, bankruptcy-remote subsidiary of TCEH. TXU Energy Receivables Company borrowed funds from a financial institution using the accounts receivable as collateral.
The trade accounts receivable amounts under the program were reported in the financial statements as pledged balances, and the related funding amounts were reported as short-term borrowings.
The maximum funding amount available under the program was $200 million, which approximated the expected usage and applied only to receivables related to non-executory retail sales contracts.
TXU Energy Receivables Company issued a subordinated note payable to the originator in an amount equal to the difference between the face amount of the accounts receivable purchased, less a discount, and cash paid to the originator. Because the subordinated note was limited to 25% of the uncollected accounts receivable purchased, and the amount of borrowings was limited by terms of the financing agreement, any additional funding to purchase the receivables was sourced from cash on hand and/or capital contributions from TCEH. Under the program, the subordinated note issued by TXU Energy Receivables Company was subordinated to the security interests of the financial institution. There was no subordinated note limit under the predecessor program. The balance of the subordinated note payable was eliminated in consolidation.
All new trade receivables under the program generated by the originator were continuously purchased by TXU Energy Receivables Company with the proceeds from collections of receivables previously purchased and, as necessary, increased borrowings or funding sources as described immediately above. Changes in the amount of borrowings by TXU Energy Receivables Company reflected seasonal variations in the level of accounts receivable, changes in collection trends and other factors such as changes in sales prices and volumes.
The discount from face amount on the purchase of receivables from the originator principally funded program fees paid to the financial institution. The program fees consisted primarily of interest costs on the underlying financing and are reported as interest expense and related charges. The discount also funded a servicing fee, which is reported as SG&A expense, paid by TXU Energy Receivables Company to TXU Energy, which provided recordkeeping services and was the collection agent under the program.
Program fee amounts were as follows:
|
| | | | | | | |
| | Year Ended December 31, |
| | 2013 | | 2012 |
| Program fees | $ | 5 |
| | $ | 9 |
|
| Program fees as a percentage of average funding (annualized) | 4.7 | % | | 6.7 | % |
Activities of TXU Energy Receivables Company and its predecessor were as follows:
|
| | | | | | | |
| | Year Ended December 31, |
| | 2013 | | 2012 |
| Cash collections on accounts receivable | $ | 3,589 |
| | $ | 4,566 |
|
| Face amount of new receivables purchased (a) | (3,144 | ) | | (4,496 | ) |
| Discount from face amount of purchased receivables | 32 |
| | 11 |
|
| Program fees paid to financial institution | (5 | ) | | (9 | ) |
| Servicing fees paid for recordkeeping and collection services | (1 | ) | | (2 | ) |
| Decrease in subordinated notes payable | (97 | ) | | (323 | ) |
| Settlement of accrued income taxes payable | (9 | ) | | — |
|
| Cash contribution from TCEH, net of cash held | 52 |
| | 275 |
|
| Capital distribution to TCEH upon termination of the program | (335 | ) | | — |
|
| Cash flows used under the program | $ | 82 |
| | $ | 22 |
|
____________
| |
| (a) | Net of allowance for uncollectible accounts. |
Inventories by Major Category
|
| | | | | | | |
| | December 31, |
| | 2014 | | 2013 |
| Materials and supplies | $ | 214 |
| | $ | 216 |
|
| Fuel stock | 215 |
| | 154 |
|
| Natural gas in storage | 39 |
| | 29 |
|
| Total inventories | $ | 468 |
| | $ | 399 |
|
Other Investments
|
| | | | | | | |
| | December 31, |
| | 2014 | | 2013 |
| Nuclear plant decommissioning trust | $ | 893 |
| | $ | 791 |
|
| Assets related to employee benefit plans, including employee savings programs, net of distributions | 61 |
| | 61 |
|
| Land | 37 |
| | 37 |
|
| Miscellaneous other | 4 |
| | 2 |
|
| Total other investments | $ | 995 |
| | $ | 891 |
|
Nuclear Decommissioning Trust — Investments in a trust that will be used to fund the costs to decommission the Comanche Peak nuclear generation plant are carried at fair value. Decommissioning costs are being recovered from Oncor's customers as a delivery fee surcharge over the life of the plant and deposited by TCEH in the trust fund. Income and expense associated with the trust fund and the decommissioning liability are offset by a corresponding change in a receivable/payable (currently a payable reported in noncurrent liabilities) that will ultimately be settled through changes in Oncor's delivery fees rates (see Note 19). The nuclear decommissioning trust fund is not a debtor under the Chapter 11 Cases. A summary of investments in the fund follows:
|
| | | | | | | | | | | | | | | |
| | December 31, 2014 |
| | Cost (a) | | Unrealized gain | | Unrealized loss | | Fair market value |
| Debt securities (b) | $ | 288 |
| | $ | 13 |
| | $ | — |
| | $ | 301 |
|
| Equity securities (c) | 276 |
| | 320 |
| | (4 | ) | | 592 |
|
| Total | $ | 564 |
| | $ | 333 |
| | $ | (4 | ) | | $ | 893 |
|
|
| | | | | | | | | | | | | | | |
| | December 31, 2013 |
| | Cost (a) | | Unrealized gain | | Unrealized loss | | Fair market value |
| Debt securities (b) | $ | 266 |
| | $ | 8 |
| | $ | (4 | ) | | $ | 270 |
|
| Equity securities (c) | 255 |
| | 271 |
| | (5 | ) | | 521 |
|
| Total | $ | 521 |
| | $ | 279 |
| | $ | (9 | ) | | $ | 791 |
|
____________
| |
| (a) | Includes realized gains and losses on securities sold. |
| |
| (b) | The investment objective for debt securities is to invest in a diversified tax efficient portfolio with an overall portfolio rating of AA or above as graded by S&P or Aa2 by Moody's Investors Services, Inc. The debt securities are heavily weighted with municipal bonds. The debt securities had an average coupon rate of 4.35% and 3.96% at December 31, 2014 and 2013, respectively, and an average maturity of 6 years at both December 31, 2014 and 2013. |
| |
| (c) | The investment objective for equity securities is to invest tax efficiently and to match the performance of the S&P 500 Index. |
Debt securities held at December 31, 2014 mature as follows: $85 million in one to five years, $68 million in five to ten years and $148 million after ten years.
The following table summarizes proceeds from sales of available-for-sale securities and the related realized gains and losses from such sales.
|
| | | | | | | | | | | |
| | Year Ended December 31, |
| | 2014 | | 2013 | | 2012 |
| Realized gains | $ | 11 |
| | $ | 2 |
| | $ | 1 |
|
| Realized losses | $ | (2 | ) | | $ | (4 | ) | | $ | (2 | ) |
| Proceeds from sales of securities | $ | 314 |
| | $ | 175 |
| | $ | 106 |
|
| Investments in securities | $ | (331 | ) | | $ | (191 | ) | | $ | (122 | ) |
Property, Plant and Equipment
|
| | | | | | | |
| | December 31, |
| | 2014 | | 2013 |
| Competitive Electric: | | | |
| Generation and mining (Note 8) | $ | 15,468 |
| | $ | 23,894 |
|
| Nuclear fuel (net of accumulated amortization of $1.237 billion and $1.096 billion) | 265 |
| | 333 |
|
| Other assets | 45 |
| | 34 |
|
| Corporate and Other | 220 |
| | 225 |
|
| Total | 15,998 |
| | 24,486 |
|
| Less accumulated depreciation | 4,065 |
| | 7,056 |
|
| Net of accumulated depreciation | 11,933 |
| | 17,430 |
|
| Construction work in progress: | | | |
| Competitive Electric | 459 |
| | 348 |
|
| Corporate and Other | 5 |
| | 13 |
|
| Total construction work in progress | 464 |
| | 361 |
|
| Property, plant and equipment — net | $ | 12,397 |
| | $ | 17,791 |
|
Depreciation expense totaled $1.181 billion, $1.258 billion and $1.247 billion for the years ended December 31, 2014, 2013 and 2012, respectively.
Assets related to capital leases included above totaled $51 million and $59 million at December 31, 2014 and 2013, respectively, net of accumulated depreciation.
In conjunction with the impairment charges taken in 2014 (see Note 8), we reviewed the estimated useful life of the impaired generation facilities. The estimated remaining lives range from 18 to 55 years for the lignite/coal and nuclear fueled generation units.
Asset Retirement and Mining Reclamation Obligations
These liabilities primarily relate to nuclear generation plant decommissioning, land reclamation related to lignite mining, removal of lignite/coal fueled plant ash treatment facilities and generation plant asbestos removal and disposal costs. There is no earnings impact with respect to changes in the nuclear plant decommissioning liability, as all costs are recoverable through the regulatory process as part of Oncor's delivery fees.
In December 2014, the EPA signed the final Disposal of Coal Combustion Residuals from Electric Utilities rule. While we continue to review the rule, our initial estimates are that it will result in approximately $100 million of capital expenditures from 2015 through 2020 for our lignite/coal fueled generation facilities.
The following table summarizes the changes to these obligations, reported in other current liabilities and other noncurrent liabilities and deferred credits in the consolidated balance sheets, for the years ended December 31, 2014 and 2013:
|
| | | | | | | | | | | | | | | |
| | Nuclear Plant Decommissioning | | Mining Land Reclamation | | Other | | Total |
| Liability at January 1, 2013 | $ | 368 |
| | $ | 135 |
| | $ | 33 |
| | $ | 536 |
|
| Additions: | | | | | | | |
| Accretion | 22 |
| | 30 |
| | 3 |
| | 55 |
|
| Incremental reclamation costs | — |
| | 20 |
| | — |
| | 20 |
|
| Reductions: | | | | | | | |
| Payments | — |
| | (87 | ) | | — |
| | (87 | ) |
| Liability at December 31, 2013 | $ | 390 |
| | $ | 98 |
| | $ | 36 |
| | $ | 524 |
|
| Additions: | | | | | | | |
| Accretion | 23 |
| | 22 |
| | 3 |
| | 48 |
|
| Incremental reclamation costs (a) | — |
| | 127 |
| | — |
| | 127 |
|
| Reductions: | | | | | | | |
| Payments | — |
| | (82 | ) | | (3 | ) | | (85 | ) |
| Adjustment to estimate of reclamation costs | — |
| | — |
| | — |
| | — |
|
| Liability at December 31, 2014 | 413 |
| | 165 |
| | 36 |
| | 614 |
|
| Less amounts due currently | — |
| | (54 | ) | | — |
| | (54 | ) |
| Noncurrent liability at December 31, 2014 | $ | 413 |
| | $ | 111 |
| | $ | 36 |
| | $ | 560 |
|
____________
| |
| (a) | The increase in the mining reclamation liability of $127 million during 2014 was primarily due to final remediation for certain mines occurring sooner than previously estimated and increases in remediation cost estimates at other mining locations. |
Other Noncurrent Liabilities and Deferred Credits
The balance of other noncurrent liabilities and deferred credits consists of the following:
|
| | | | | | | |
| | December 31, |
| | 2014 | | 2013 |
| Uncertain tax positions, including accrued interest (Note 5) | $ | 74 |
| | $ | 246 |
|
| Retirement plan and other employee benefits (a) | 243 |
| | 1,057 |
|
| Asset retirement and mining reclamation obligations | 560 |
| | 440 |
|
| Unfavorable purchase and sales contracts | 566 |
| | 589 |
|
| Nuclear decommissioning cost over-recovery (Note 19) | 479 |
| | 400 |
|
| Other | 155 |
| | 30 |
|
| Total other noncurrent liabilities and deferred credits | $ | 2,077 |
| | $ | 2,762 |
|
____________
| |
| (a) | Includes $47 million and $838 million at December 31, 2014 and 2013, respectively, representing pension and OPEB liabilities related to Oncor (see Note 19). |
Unfavorable Purchase and Sales Contracts — The amortization of unfavorable purchase and sales contracts totaled $23 million, $25 million and $27 million for the years ended December 31, 2014, 2013 and 2012, respectively. See Note 4 for intangible assets related to favorable purchase and sales contracts.
The estimated amortization of unfavorable purchase and sales contracts for each of the next five fiscal years is as follows:
|
| | | | |
| Year | | Amount |
| 2015 | | $ | 24 |
|
| 2016 | | $ | 24 |
|
| 2017 | | $ | 24 |
|
| 2018 | | $ | 24 |
|
| 2019 | | $ | 24 |
|
Fair Value of Debt
|
| | | | | | | | | | | | | | | | |
| | | December 31, 2014 | | December 31, 2013 |
| Debt: | | Carrying Amount | | Fair Value | | Carrying Amount | | Fair Value |
| Borrowings under debtor-in-possession credit facilities (Note 11) | | $ | 6,825 |
| | $ | 6,830 |
| | $ | — |
| | $ | — |
|
| Pre-petition notes, loans and other debt reported as liabilities subject to compromise (Note 12) | | $ | 35,857 |
| | $ | 21,411 |
| | $ | — |
| | $ | — |
|
| Long-term debt, excluding capital lease obligations | | $ | 123 |
| | $ | 119 |
| | $ | — |
| | $ | — |
|
| Pre-petition notes, loans and other debt (excluding capital lease obligations) (Note 12) | | $ | — |
| | $ | — |
| | $ | 40,200 |
| | $ | 26,050 |
|
We determine fair value in accordance with accounting standards as discussed in Note 15, and at December 31, 2014, our debt fair value represents Level 2 valuations. We obtain security pricing from an independent party who uses broker quotes and third-party pricing services to determine fair values. Where relevant, these prices are validated through subscription services such as Bloomberg.
Supplemental Cash Flow Information
|
| | | | | | | | | | | |
| | Year Ended December 31, |
| | 2014 | | 2013 | | 2012 |
| Cash payments related to: | | | | | |
| Interest paid (a) | $ | 1,632 |
| | $ | 3,388 |
| | $ | 3,151 |
|
| Capitalized interest | $ | (17 | ) | | $ | (25 | ) | | $ | (36 | ) |
| Interest paid (net of capitalized interest) (a) | $ | 1,615 |
| | $ | 3,363 |
| | $ | 3,115 |
|
| Income taxes | $ | 55 |
| | $ | 65 |
| | $ | 71 |
|
| Reorganization items (b) | $ | 146 |
| | $ | — |
| | $ | — |
|
| Noncash investing and financing activities: | | | | | |
| Principal amount of toggle notes issued in lieu of cash interest | $ | — |
| | $ | 173 |
| | $ | 235 |
|
| Construction expenditures (c) | $ | 113 |
| | $ | 46 |
| | $ | 50 |
|
| Debt exchange and extension transactions (d) | $ | (85 | ) | | $ | (326 | ) | | $ | 457 |
|
| Debt assumed related to acquired combustion turbine trust interest (Note 12) | $ | — |
| | $ | (45 | ) | | $ | — |
|
| Capital leases | $ | — |
| | $ | — |
| | $ | 15 |
|
____________
| |
| (a) | Net of amounts received under interest rate swap agreements. For the year ended December 31, 2014, this amount also includes amounts paid for adequate protection. |
| |
| (b) | Represents cash payments for legal and other consulting services. |
| |
| (c) | Represents end-of-period accruals. |
| |
| (d) | For the year ended December 31, 2014, represents $1.836 billion principal amount of loans issued under the EFIH DIP Facility in excess of $1.673 billion principal amount of EFIH First Lien Notes exchanged and $78 million of related accrued interest (see Note 11). For the year ended December 31, 2013, represents $340 million principal amount of term loans issued under the TCEH Term Loan Facilities in consideration of extension of maturity of the facilities, $1.302 billion principal amount of EFIH debt issued in exchange for $1.310 billion principal amount of EFH Corp. and EFIH debt and $89 million principal amount of EFIH debt issued in exchange for $95 million principal amount of EFH Corp. debt (see Note 12). For the year ended December 31, 2012 represents $1.304 billion principal amount of EFIH debt issued in exchange for $1.761 billion principal amount of EFH Corp. debt. |
| |
| Item 9. | CHANGES IN AND DISAGREEMENTS WITH ACCOUNTANTS ON ACCOUNTING AND FINANCIAL DISCLOSURE |
None.
| |
| Item 9A. | CONTROLS AND PROCEDURES |
The Company has established disclosure controls and procedures that are designed to ensure that information required to be disclosed in reports filed or submitted under the Securities Exchange Act of 1934, as amended (the “Exchange Act”), is recorded, processed, summarized and reported within the time periods specified in the rules and forms of the Securities and Exchange Commission and, as such, is accumulated and communicated to the Company’s management, including our principal executive officer and principal financial officer, as appropriate to allow timely decisions regarding required disclosure.
An evaluation was performed under the supervision and with the participation of our management, including the principal executive officer and principal financial officer, of the effectiveness of the design and operation of the disclosure controls and procedures in effect at December 31, 2014. Based on the evaluation performed, our management, including the principal executive officer and principal financial officer, concluded that due to the material weakness in our internal controls over financial reporting related to accounting for deferred income taxes, as described below, the disclosure controls and procedures were not effective as of December 31, 2014. In light of the material weakness in internal control over financial reporting, management completed substantive procedures, including validating the completeness and accuracy of the underlying data used for accounting for deferred income taxes, prior to filing this Form 10-K.
These additional procedures have allowed us to conclude that, notwithstanding the material weakness in internal control over financial reporting related to accounting for deferred income taxes, the consolidated financial statements included in this report fairly present, in all material respects, the Company's financial position, results of operations and cash flows for the periods presented in conformity with GAAP. Additionally, no restatement of our previously issued consolidated financial statements was required.
ENERGY FUTURE HOLDINGS CORP.
MANAGEMENT'S ANNUAL REPORT ON
INTERNAL CONTROL OVER FINANCIAL REPORTING
The management of Energy Future Holdings Corp. is responsible for establishing and maintaining adequate internal control over financial reporting (as defined in Rules 13a-15(f) and 15d-15(f) under the Exchange Act) for the Company. Energy Future Holdings Corp.'s internal control over financial reporting is designed to provide reasonable assurance regarding the reliability of financial reporting and the preparation of financial statements for purposes in accordance with generally accepted accounting principles. Because of its inherent limitations, internal control over financial reporting may not prevent or detect misstatements. Also, projections of any evaluation of effectiveness to future periods are subject to the risk that controls may become inadequate because of changes in condition or the deterioration of compliance with procedures or policies.
The management of Energy Future Holdings Corp. performed an evaluation as of December 31, 2014 of the effectiveness of the company's internal control over financial reporting based on the Committee of Sponsoring Organizations of the Treadway Commission's (COSO's) 2013 Internal Control - Integrated Framework. Based on the review performed, management believes that due to a material weakness in accounting for deferred income taxes, as described below, Energy Future Holdings Corp.'s internal control over financial reporting was not effective as of December 31, 2014. In light of the material weakness in internal control over financial reporting, management completed additional substantive procedures, including validating the completeness and accuracy of the underlying data used for accounting for deferred income taxes, prior to filing this Form 10-K. These additional procedures have allowed us to conclude that, notwithstanding the material weakness in internal control over financial reporting, the consolidated financial statements included in this report fairly present, in all material respects, the Company’s financial position, results of operations and cash flows for the periods presented in conformity with GAAP.
The principal factors contributing to the material weakness in accounting for deferred income taxes were as follows:
| |
| • | the significant complexity created as a result of recently resolving numerous open tax years with the IRS (including 1997 to 2007) as detailed in Note 5 to the Financial Statements; |
| |
| • | constraints resulting from the significant time and effort required to be spent by our tax and other finance personnel in supporting the bankruptcy and restructuring activities; and |
| |
| • | turnover of key personnel in our tax department responsible for operating certain key controls. |
Pursuant to SEC rules and regulations, a material weakness is "a deficiency, or a combination of deficiencies, in internal control over financial reporting such that there is a reasonable possibility that a material misstatement of the registrant's annual or interim financial statements will not be prevented or detected on a timely basis". As of December 31, 2014, the Company's management concluded it did not maintain effective controls over the completeness and accuracy of its accounting for deferred income taxes, which constitutes a material weakness. Specifically, there was incomplete underlying data and insufficient documentation used in the operation of our reconciliation of deferred tax balances. These deficiencies in the operating effectiveness of the controls diminished the precision in our reconciliation of our income tax provision and related deferred tax asset and liability accounts. None of these deficiencies resulted in any restatement of our previously issued consolidated financial statements, and as stated above, management has concluded that the consolidated financial statements in this report fairly present, in all material respects, the Company's financial position, results of operations and cash flows for the periods presented in conformity with GAAP.
The independent registered public accounting firm of Deloitte & Touche LLP as auditors of the consolidated financial statements of Energy Future Holdings Corp. has issued an attestation report on Energy Future Holdings Corp.'s internal control over financial reporting.
Remediation Plan for the Material Weakness
The Company is developing and implementing a plan of remediation to strengthen our overall internal control over accounting for deferred income taxes. The remediation plan will include the following steps:
| |
| • | enhancing the formality and rigor of review and documentation related to our deferred income tax reconciliation procedures; |
| |
| • | implementing additional oversight and monitoring controls over our deferred income tax review processes that are designed to operate at a level of precision to detect an error resulting from a related control failure before it results in a material misstatement of our financial statements; and |
| |
| • | hiring key personnel in our tax department and further evaluating staffing levels to ensure the execution of timely and rigorous control procedures. |
The Company is committed to maintaining a strong internal control environment and believes that these remediation efforts will represent improvements in our controls. The Company has started to implement these steps; however, some of these steps will take time to be fully integrated and confirmed to be effective and sustainable. Additional controls may also be required over time. Until the remediation steps set forth above are fully implemented and tested, the material weakness described above will continue to exist.
Changes to Internal Control over Financial Reporting
There has been no change in the Company’s internal control over financial reporting during the most recently completed fiscal quarter that has materially affected, or is reasonably likely to materially affect, our internal control over financial reporting. We will continue to report on changes to internal controls related to the material weakness in future periods.
|
| | |
| /s/ JOHN F. YOUNG | | /s/ PAUL M. KEGLEVIC |
| John F. Young, President and | | Paul M. Keglevic, Executive Vice President, |
| Chief Executive Officer | | Chief Financial Officer and Co-Chief Restructuring Officer |
March 31, 2015
REPORT OF INDEPENDENT REGISTERED PUBLIC ACCOUNTING FIRM
To the Board of Directors and Shareholders of Energy Future Holdings Corp. (Debtor-in-Possession)
Dallas, Texas
We have audited the internal control over financial reporting of Energy Future Holdings Corp. and subsidiaries (“EFH Corp.”) (Debtor-in-Possession) as of December 31, 2014, based on criteria established in Internal Control - Integrated Framework (2013) issued by the Committee of Sponsoring Organizations of the Treadway Commission. EFH Corp.'s management is responsible for maintaining effective internal control over financial reporting and for its assessment of the effectiveness of internal control over financial reporting, included in the accompanying Management's Annual Report on Internal Control Over Financial Reporting. Our responsibility is to express an opinion on EFH Corp.'s internal control over financial reporting based on our audit.
We conducted our audit in accordance with the standards of the Public Company Accounting Oversight Board (United States). Those standards require that we plan and perform the audit to obtain reasonable assurance about whether effective internal control over financial reporting was maintained in all material respects. Our audit included obtaining an understanding of internal control over financial reporting, assessing the risk that a material weakness exists, testing and evaluating the design and operating effectiveness of internal control based on that risk, and performing such other procedures as we considered necessary in the circumstances. We believe that our audit provides a reasonable basis for our opinion.
A company's internal control over financial reporting is a process designed by, or under the supervision of, the company's principal executive and principal financial officers, or persons performing similar functions, and effected by the company's board of directors, management, and other personnel to provide reasonable assurance regarding the reliability of financial reporting and the preparation of financial statements for external purposes in accordance with generally accepted accounting principles. A company's internal control over financial reporting includes those policies and procedures that (1) pertain to the maintenance of records that, in reasonable detail, accurately and fairly reflect the transactions and dispositions of the assets of the company; (2) provide reasonable assurance that transactions are recorded as necessary to permit preparation of financial statements in accordance with generally accepted accounting principles, and that receipts and expenditures of the company are being made only in accordance with authorizations of management and directors of the company; and (3) provide reasonable assurance regarding prevention or timely detection of unauthorized acquisition, use, or disposition of the company's assets that could have a material effect on the financial statements.
Because of the inherent limitations of internal control over financial reporting, including the possibility of collusion or improper management override of controls, material misstatements due to error or fraud may not be prevented or detected on a timely basis. Also, projections of any evaluation of the effectiveness of the internal control over financial reporting to future periods are subject to the risk that the controls may become inadequate because of changes in conditions, or that the degree of compliance with the policies or procedures may deteriorate.
A material weakness is a deficiency, or a combination of deficiencies, in internal control over financial reporting, such that there is a reasonable possibility that a material misstatement of the company’s annual or interim financial statements will not be prevented or detected on a timely basis. The following material weakness has been identified and included in management's assessment: management has identified a material weakness related to ineffective controls over the completeness and accuracy of accounting for deferred income taxes. Specifically, there was incomplete underlying data and insufficient documentation used in the operation of their reconciliation of deferred tax balances. This material weakness was considered in determining the nature, timing, and extent of audit tests applied in our audit of the consolidated financial statements and financial statement schedule as of and for the year ended December 31, 2014 of EFH Corp. and this report does not affect our report on such financial statements and financial statement schedule.
In our opinion, because of the effect of the material weakness identified above on the achievement of the objectives of the control criteria, EFH Corp. has not maintained effective internal control over financial reporting as of December 31, 2014, based on the criteria established in Internal Control - Integrated Framework (2013) issued by the Committee of Sponsoring Organizations of the Treadway Commission.
We have also audited, in accordance with the standards of the Public Company Accounting Oversight Board (United States), the consolidated financial statements and financial statement schedule as of and for the year ended December 31, 2014 of EFH Corp. and our report dated March 31, 2015 expressed an unqualified opinion on those financial statements and financial statement schedule and included explanatory paragraphs regarding (1) EFH Corp.’s voluntary petitions for relief under Chapter 11 of the United States Bankruptcy Code and (2) substantial doubt about EFH Corp.’s ability to continue as a going concern, which is contingent upon its ability to comply with the financial and other covenants contained in the DIP Facilities, its ability to obtain new debtor in possession financing in the event the DIP Facilities were to expire during the pendency of the Chapter 11 Cases, its ability to complete a Chapter 11 plan of reorganization in a timely manner, including obtaining creditor and Bankruptcy Court approval of such plan as well as applicable regulatory approvals required for such plan, and its ability to obtain any exit financing needed to implement such plan, among other factors.
/s/ Deloitte & Touche LLP
Dallas, Texas
March 31, 2015
| |
| Item 9B. | OTHER INFORMATION |
None
PART III.
| |
| Item 10. | DIRECTORS, EXECUTIVE OFFICERS AND CORPORATE GOVERNANCE |
Directors
The names of EFH Corp.'s directors and information about them, as furnished by the directors themselves, are set forth below:
|
| | | | | | | |
| Name | | Age | | Served As Director Since | | Business Experience |
| Arcilia C. Acosta (1)(3) | | 49 |
| | 2008 | | Arcilia C. Acosta has served as a Director of EFH Corp. since May 2008. Ms. Acosta is the founder, President and CEO of CARCON Industries & Construction, L.L.C. (CARCON) and its subsidiaries. She is also the founder, President and CEO of Southwestern Testing Laboratories, L.L.C. (STL). CARCON's principal business is commercial, institutional and transportation, design and build construction. STL's principal business is geotechnical engineering, construction materials testing and environmental consulting services. Ms. Acosta serves on the Board of Directors of EFCH, TCEH, the Dallas Citizens Council, U.T. Southwestern Board of Visitors and The Texas Tech National Alumni Association. She also serves on the Board of Legacy Texas Financial Group, Inc., where she serves on the Audit Committee and Compensation Committee. |
| David Bonderman | | 72 |
| | 2007 | | David Bonderman has served as a Director of EFH Corp. since October 2007. He is a founding partner of TPG Capital, L.P. (TPG). Mr. Bonderman serves on the boards of the following companies: Caesars Entertainment Corporation (formerly Harrah's Entertainment), CoStar Group, Inc., Kite Pharma, Inc. and Ryanair Holdings plc, for which he serves as Chairman of the Board. During the past five years, Mr. Bonderman also served on the boards of Armstrong World Industries, Inc., Gemalto N.V., General Motors Company, JSC VTB Bank, and Univision Communications, Inc. |
| Donald L. Evans (2)(3) | | 68 |
| | 2007 | | Donald L. Evans has served as a Director and Executive Chairman of EFH Corp. since March 2013. Previously, he served as Director and Non-Executive Chairman of EFH Corp. from October 2007 to March 2013. He is also a Senior Partner at Quintana Energy Partners, L.P. He was CEO of the Financial Services Forum from 2005 to 2007, after serving as the 34th secretary of the U.S. Department of Commerce. Before serving as Secretary of Commerce, Mr. Evans was the former CEO of Tom Brown, Inc., a large independent energy company. During the past five years, he served on the board of Genesis Energy, L. P. He also previously served as a member and chairman of the Board of Regents of the University of Texas System. |
| Thomas D. Ferguson | | 61 |
| | 2008 | | Thomas D. Ferguson has served as a Director of EFH Corp. since December 2008. He is a Managing Director of Goldman, Sachs & Co., having joined the firm in 2002. Mr. Ferguson heads the asset management efforts for the merchant bank's U.S. real estate investment activities. Mr. Ferguson serves on the board of managers of EFIH and Oncor, and also serves on the board for Caribbean Fund 2005 and National Golf Properties. He formerly held board seats at Associated British Ports, the largest port company in the UK, Carrix, one of the largest private container terminal operators in the world, as well as Red de Carreteras, a toll road concessionaire in Mexico, and American Golf and Agriculture Company of America. |
| Brandon A. Freiman | | 33 | | 2012 | | Brandon A. Freiman has served as a Director of EFH Corp. since June 2012. He has been with KKR since 2007 where he is a director. He has been directly involved in several of the firm's investments including El Paso Midstream Group, Accelerated Oil Technologies, LLC, Del Monte Foods, Fortune Creek Midstream, Westbrick Energy LTD and Bayonne Water JV and has portfolio company responsibilities for Rockwood Holdings, Inc. Mr. Freiman is a director of Accelerated Oil Technologies, LLC, Bayonne Water JV, Fortune Creek Midstream, Samson Resources Corporation and Westbrick Energy LTD. |
|
| | | | | | | |
| Name | | Age | | Served As Director Since | | Business Experience |
| Scott Lebovitz | | 39 |
| | 2007 | | Scott Lebovitz has served as a Director of EFH Corp. since October 2007. He has been a Managing Director of Goldman, Sachs & Co. in its Principal Investment Area since 2007 having joined Goldman, Sachs & Co. in 1997. Mr. Lebovitz serves on the boards of both public and private companies, including Associated Asphalt Partners, LLC, EdgeMarc Energy Holdings, LLC, EF Energy Holdings, LLC, EW Energy Holdings, LLC, EFCH and TCEH. During the past five years, Mr. Lebovitz also served on the boards of Cobalt International Energy, Inc. and CVR Energy, Inc. |
| Michael MacDougall (2) | | 44 |
| | 2007 | | Michael MacDougall has served as a Director of EFH Corp. since October 2007. He is a partner of TPG. Mr. MacDougall leads the firm's global energy and natural resources investing efforts. Prior to joining TPG in 2002, Mr. MacDougall was a vice president in the Principal Investment Area of the Merchant Banking Division of Goldman, Sachs & Co., where he focused on private equity and mezzanine investments. Mr. MacDougall is a director of both public and private companies, including Amber Holdings, Inc., Harvester Holdings, LLC and its wholly owned subsidiary, Petro Harvester Oil and Gas, LLC, Jonah Energy Holdings LLC, EFCH, and TCEH and is a director of the general partner of Valerus Compression Services, L.P. (doing business as Axip Energy Services, L.P.) During the past five years, he also served on the boards of Aleris International, Copano Energy, L.L.C., Graphic Packaging Holding Company, Kraton Performance Polymers Inc., Maverick American Natural Gas, LLC, Nexeo Solutions Holdings, LLC and Northern Tier Energy, LLC. Mr. MacDougall is also a member of the boards of directors of Islesboro Affordable Property, The Opportunity Network and the University of Texas Development Board. |
| Kenneth Pontarelli (2)(3) | | 44 |
| | 2007 | | Kenneth Pontarelli has served as a Director of EFH Corp. since October 2007. He is a Managing Director of Goldman, Sachs & Co. in its Principal Investment Area. He transferred to the Principal Investment Area in 1999 and was promoted to Managing Director in 2004. Mr. Pontarelli serves as a director of EFIH and Tervita Corporation. During the past five years, he also served on the boards of Cobalt International Energy, L.P., CVR Energy, Inc., Expro International Group Ltd., and Kinder Morgan, Inc. |
| William K. Reilly | | 75 | | 2007 | | William K. Reilly has served as a Director of EFH Corp. since October 2007. He is a Senior Advisor to TPG and a founding partner of Aqua International Partners, an investment group that invests in companies that serve the water and renewable energy sectors, having previously served as the seventh Administrator of the EPA. Mr. Reilly is a director of Royal Caribbean International. During the past five years, he also served on the boards of ConocoPhillips, E.I. DuPont de Nemours, and Eden Springs, Ltd. of Israel. Before serving as EPA Administrator, Mr. Reilly was President of World Wildlife Fund and President of The Conservation Foundation. He previously served as Executive Director of the Rockefeller Task Force on Land Use and Urban Growth, a senior staff member of the President's Council on Environmental Quality, Associate Director of the Urban Policy Center and the National Urban Coalition. He also served as Co-Chairman of the National Commission on Energy Policy. Mr. Reilly was appointed by the President to serve as Co-Chair of the National Commission on the Deepwater Horizon Oil Spill and Offshore Drilling. |
| Jonathan D. Smidt (2) | | 42 |
| | 2007 | | Jonathan D. Smidt has served as a Director of EFH Corp. since October 2007. He has been with KKR since 2000, where he is a partner and senior member of the firm's Energy and Infrastructure team and leads KKR Natural Resources, the firm's platform to acquire and operate oil and natural gas assets. Currently, he is a director of Laureate Education Inc., Samson Resources Corporation, Westbrick Energy LTD, EFCH and TCEH. |
|
| | | | | | | |
| Name | | Age | | Served As Director Since | | Business Experience |
| Billie I. Williamson (1) | | 62 |
| | 2013 | | Billie I. Williamson has served as a Director of EFH Corp. since February 2013. Ms. Williamson has 33 years of experience auditing public companies. She served as a Senior Global Client Serving Partner from 1998 to 2011 at Ernst & Young LLP (E&Y) and E&Y's Americas Inclusiveness Officer from 2007 to 2011 prior to her retirement in 2011. She was a member of E&Y's Americas Executive Board, which functions as its board of directors, and on the U.S. Executive Board of E&Y which handled all partnership matters. Ms. Williamson also previously held executive finance positions at AMX Corp. and Marriott International, Inc. She currently serves on the boards of Pentair PLC, Exelis Inc. and Janus Capital Group Inc. From March 2012 through October 2014, Ms. Williamson was on the Board of Directors of Annie's Inc. Annie's was sold to General Mills in October 2014. |
| John F. Young (2) | | 58 |
| | 2008 | | John F. Young has served as a Director of EFH Corp. since July 2008. He was elected President and Chief Executive Officer of EFH Corp. in January 2008. He also has served as Chair, President and Chief Executive of EFIH and EFCH since July 2010, having previously served as President and Chief Executive of EFIH from July 2008 to July 2010 and EFCH from April 2008 to July 2010. Before joining EFH Corp., Mr. Young served in many leadership roles at Exelon Corporation from March 2003 to January 2008 including Executive Vice President of Finance and Markets and Chief Financial Officer of Exelon Corporation; President of Exelon Generation; and President and Chief Operating Officer of Exelon Power. Prior to joining Exelon Corporation, Mr. Young was Senior Vice President of Sierra Pacific Resources Corporation. Mr. Young is also a director of Baylor Scott & White Health Foundation Advisory Board, EFCH, EFIH, Nuclear Electric Insurance Limited, TCEH, and USAA.
|
| Kneeland Youngblood (1) | | 59 |
| | 2007 | | Kneeland Youngblood has served as a Director of EFH Corp. since October 2007. He is a founding partner of Pharos Capital Group, a private equity firm that focuses on providing growth and expansion capital to businesses in business services and health care services. During the last five years, Mr. Youngblood served on the boards of Burger King Holdings, Inc., Gap Inc. and Starwood Hotels and Resorts Worldwide, Inc. He is a director of EFIH, Oncor and Mallinckrodt public limited company and a member of the Council on Foreign Relations. |
_______________
| |
| (1) | Member of Audit Committee. |
| |
| (2) | Member of Executive Committee. |
| |
| (3) | Member of Organization and Compensation Committee |
There is no family relationship between any of the above-named directors.
Director Qualifications
In October 2007, David Bonderman, Donald L. Evans, Scott Lebovitz, Michael MacDougall, Kenneth Pontarelli, William K. Reilly, Jonathan D. Smidt, and Kneeland Youngblood were elected to EFH Corp.'s board of directors (the Board). Arcilia C. Acosta, Thomas D. Ferguson and John F. Young joined the Board in 2008. Brandon A. Freiman joined the Board in 2012 and Billie I. Williamson joined the Board in 2013. Messrs. Bonderman, Ferguson, Freiman, Lebovitz, MacDougall, Pontarelli, and Smidt are collectively referred to as the "Sponsor Directors." Mses. Acosta and Williamson and Messrs. Evans, Reilly, Young, and Youngblood are collectively referred to as the "Non-Sponsor Directors."
Each of the Sponsor Directors was elected to the Board pursuant to the Limited Partnership Agreement of Texas Energy Future Holdings Limited Partnership, the holder of a majority of the outstanding capital stock of EFH Corp. Pursuant to this agreement, Messrs. Freiman and Smidt were appointed to the Board as a consequence of their relationships with Kohlberg Kravis Roberts & Co.; Messrs. Bonderman and MacDougall were appointed to the Board as a consequence of their relationships with TPG Capital, L.P., and Messrs. Ferguson, Lebovitz and Pontarelli were appointed to the Board as a consequence of their relationships with GS Capital Partners.
When considering whether the Board's directors and nominees have the experience, qualifications, attributes and skills, taken as a whole, to enable the Board to satisfy its oversight responsibilities effectively in light of EFH Corp.'s business and structure, the Board focused primarily on the qualifications summarized in each of the Board member's biographical information set forth above. In addition, EFH Corp. believes that each of its directors possesses high ethical standards, acts with integrity, and exercises careful judgment. Each is committed to employing his/her skills and abilities in the long-term interests of EFH Corp and its stakeholders. Finally, our directors are knowledgeable and experienced in business, governmental, and civic endeavors, further qualifying them for service as members of the Board.
The Sponsor Directors possess experience in owning and managing privately held enterprises and are familiar with corporate finance and strategic business planning activities of highly-leveraged companies such as EFH Corp. Some of the Sponsor Directors also have experience advising and overseeing the operations of large industrial, manufacturing or retail companies similar to our businesses. Finally, several of the Sponsor Directors possess substantial expertise in advising and managing companies in segments of the energy industry, including, among others, power generation, oil and gas, and energy infrastructure and transportation.
As a group and individually, the Non-Sponsor Directors possess extensive experience in governmental and civic endeavors and in the business community, in each case, in the markets where our businesses operate.
Mr. Young's employment agreement provides that he will serve as a member of the Board during the time he is employed by EFH Corp. Before joining EFH Corp. as President and Chief Executive Officer, he held various senior management positions at other companies in the energy industry over twenty years, including, most recently, his role as Executive Vice President of Finance and Markets and Chief Financial Officer of Exelon Corporation.
Ms. Acosta manages the operations of a large commercial construction company in Texas and has significant experience within the local Hispanic business community, having served as the chair of the Greater Dallas Hispanic Chamber of Commerce and the Texas Association of Mexican American Chambers of Commerce. Mr. Evans has demonstrated ability and achievement in both the public and private sectors, serving as U.S. Secretary of Commerce during the Bush Administration, and both before and after his government service, acting as Chairman and Chief Executive Officer of a publicly-owned energy company, Tom Brown, Inc. Mr. Reilly possesses a distinguished record of public service and extensive policy-making experience as a former administrator of the EPA, lectures extensively on environmental issues facing companies operating in the energy industry and has served as Co-Chairman of the National Commission on Energy Policy. Ms. Williamson has considerable financial and accounting knowledge and experience, including increasingly senior level auditing experience culminating with service as Senior Assurance Partner at Ernst & Young LLP where she handled very large multi-national accounts. She also served as chief financial officer of AMX Corp. and as SVP Finance and Corporate Controller of Marriott International, Inc. Ms. Williamson currently serves as a member of the boards of directors of three other public companies and is a member of the audit committees of two other public companies. Ms. Williamson has been licensed as a Certified Public Accountant in the State of Texas since 1976. Her financial and accounting knowledge and experience qualify her to serve as EFH Corp.'s "audit committee financial expert." Mr. Youngblood has served on numerous boards for large public companies, has extensive experience managing and advising companies in his capacity as a partner in a private equity firm (not affiliated with the Sponsor Group), is highly knowledgeable of federal and state political matters, and has served on the board of directors of the United States Enrichment Corporation, a company that contracts with the US Department of Energy to produce enriched uranium for use in nuclear power plants.
Executive Officers
The names and information regarding EFH Corp.'s executive officers are set forth below:
|
| | | | | | | | | |
| Name of Officer | | Age | | Positions and Offices Presently Held | | Date First Elected to Present Offices | | Business Experience (Preceding Five Years) |
| John F. Young | | 58 |
| | President and Chief Executive Officer of EFH Corp. and Chair, President and Chief Executive Officer of EFIH and EFCH | | January 2008 | | John F. Young was elected President and Chief Executive Officer of EFH Corp. in January 2008. He also has served as Chair, President and Chief Executive of EFIH and EFCH since July 2010, having previously served as President and Chief Executive of EFIH from July 2008 to July 2010 and EFCH from April 2008 to July 2010. Before joining EFH Corp., Mr. Young served in many leadership roles at Exelon Corporation from March 2003 to January 2008, including Executive Vice President of Finance and Markets and Chief Financial Officer of Exelon Corporation; President of Exelon Generation; and President and Chief Operating Officer of Exelon Power. Prior to joining Exelon Corporation, Mr. Young was Senior Vice President of Sierra Pacific Resources Corporation. |
| James A. Burke | | 46 |
| | Executive Vice President of EFH Corp. and President and Chief Executive of TXU Energy | | August 2005 | | James A. Burke was elected Executive Vice President of EFH Corp. in February 2013 and President and Chief Executive of TXU Energy in August 2005. Previously, Mr. Burke was Senior Vice President Consumer Markets of TXU Energy. |
| Stacey H. Doré | | 42 |
| | Executive Vice President, General Counsel and Co-Chief Restructuring Officer of EFH Corp., EFIH and EFCH | | October 2013 | | Stacey H. Doré was elected Executive Vice President, General Counsel and Co-Chief Restructuring Officer of EFH Corp. and EFCH in October 2013 and EFIH in February 2014, having previously served as Senior Vice President, General Counsel and Co-Chief Restructuring Officer of EFIH from October 2013 to February 2014, Executive Vice President and General Counsel of EFH Corp. from February 2013 to October 2013 and EFCH from April 2013 to October 2013, and Senior Vice President and General Counsel of EFH Corp. from April 2012 to February 2013, and EFIH and EFCH from April 2012 to October 2013. Ms. Doré was Vice President and General Counsel of Luminant from November 2011 to March 2012, and Vice President and Associate General Counsel of EFH Corp. from July 2008 to November 2011. Prior to joining EFH Corp., she was an attorney at Vinson & Elkins LLP, where she engaged in a business litigation practice.
|
| Paul M. Keglevic | | 61 |
| | Executive Vice President, Chief Financial Officer and Co-Chief Restructuring Officer of EFH Corp., EFIH and EFCH | | October 2013 | | Paul M. Keglevic was elected Executive Vice President, Chief Financial Officer and Co-Chief Restructuring Officer of EFH Corp., EFIH and EFCH in October 2013 having previously served as Executive Vice President and Chief Financial Officer of EFH Corp., EFIH and EFCH from July 2008 to October 2013. Before joining EFH Corp., he was an audit partner at PricewaterhouseCoopers. Mr. Keglevic was PricewaterhouseCoopers' Utility Sector Leader from 2002 to 2008 and Clients and Sector Assurance Leader from 2007 to 2008.
|
|
| | | | | | | | | |
| Name of Officer | | Age | | Positions and Offices Presently Held | | Date First Elected to Present Offices | | Business Experience (Preceding Five Years) |
| Carrie L. Kirby | | 47 |
| | Executive Vice President of EFH Corp. | | February 2013 | | Carrie L. Kirby was elected Executive Vice President of EFH Corp. in February 2013 having previously served as Senior Vice President of EFH Corp. from April 2012 to February 2013 and oversees human resources. Previously she was Vice President of Human Resources of TXU Energy. |
| M. A. McFarland | | 45 |
| | Executive Vice President of EFH Corp. and President and Chief Executive of Luminant | | July 2008 | | M. A. McFarland was elected President and Chief Executive of Luminant in December 2012 and Executive Vice President of EFH Corp. in July 2008. He previously served as Executive Vice President and Chief Commercial Officer of Luminant. Before joining Luminant, Mr. McFarland served as Senior Vice President of Mergers, Acquisitions and Divestitures and as a Vice President in the wholesale marketing and trading division power team at Exelon Corporation. |
| John D. O'Brien | | 55 |
| | Executive Vice President of EFH Corp. | | February 2013 | | John D. O'Brien was elected Executive Vice President of EFH Corp. in February 2013 having previously served as Senior Vice President of EFH Corp. from October 2011 to February 2013. Before joining EFH, he served as Senior Vice President of Government and Regulatory Affairs at NRG Energy from 2007 to 2011 and Vice President of Environmental and Regulatory Affairs at Exelon Power, a subsidiary of Exelon Corporation, from 2004 to 2007. |
There is no family relationship between any of the above-named executive officers.
Audit Committee Financial Expert
The Board has determined that Billie I. Williamson is an "Audit Committee Financial Expert" as defined in Item 407(d)(5) of SEC Regulation S-K.
Code of Conduct
EFH Corp. maintains certain corporate governance documents on EFH Corp's website at www.energyfutureholdings.com. EFH Corp.'s Code of Conduct can be accessed by selecting "Investor Relations" on the EFH Corp. website. EFH Corp.'s Code of Conduct applies to all of its employees, officers (including the Chief Executive Officer, Chief Financial Officer and Principal Accounting Officer) and directors. Any amendments to the Code of Conduct and any grant of a waiver from a provision of the Code of Conduct requiring disclosure under applicable SEC rules will be posted on EFH Corp.'s website. Printed copies of the corporate governance documents that are posted on EFH Corp.'s website are also available to any investor upon request to the Secretary of EFH Corp. at 1601 Bryan Street, Dallas, Texas 75201-3411.
Procedures for Shareholders to Nominate Directors; Arrangement to Serve as Directors
The Amended and Restated Limited Liability Company Agreement of Texas Energy Future Capital Holdings LLC, the general partner of Texas Holdings, generally requires that the members of Texas Energy Future Capital Holdings LLC take all necessary action to ensure that the persons who serve as its managers also serve on the EFH Corp. Board. In addition, Mr. John Young's employment agreement provides that he will be elected as a member of the Board during the time he is employed by EFH Corp.
Because of these requirements, together with Texas Holdings' controlling ownership of EFH Corp.'s outstanding common stock, there is no policy or procedure with respect to shareholder recommendations for nominees to the EFH Corp. Board.
| |
| Item 11. | EXECUTIVE COMPENSATION |
Organization and Compensation Committee
During the majority of 2014, the Organization and Compensation Committee (the "O&C Committee") of EFH Corp.'s Board of Directors (the "Board") consisted of three directors: Arcilia C. Acosta, Donald L. Evans, and Kenneth Pontarelli. Marc S. Lipschultz, a Board and O&C Committee member, resigned from both positions, effective January 17, 2014. The primary responsibilities of the O&C Committee are to:
| |
| • | determine and oversee the compensation program of EFH Corp. and its subsidiaries (other than the Oncor Ring-Fenced Entities), including making recommendations to the Board with respect to the adoption, amendment or termination of compensation and benefits plans, arrangements, policies and practices; |
| |
| • | evaluate the performance of EFH Corp.'s President and Chief Executive Officer (the "CEO"), John F. Young, and the other executive officers of EFH Corp. and its subsidiaries (other than the Oncor Ring-Fenced Entities) (collectively, the "executive officers"), including Paul M. Keglevic, Executive Vice President, Chief Financial Officer and Co-Chief Restructuring Officer of EFH Corp.; James A. Burke, President and Chief Executive Officer of TXU Energy and Executive Vice President of EFH Corp.; Stacey H. Doré, Executive Vice President, General Counsel and Co-Chief Restructuring Officer of EFH Corp.; and M.A. McFarland, President and Chief Executive Officer of Luminant and Executive Vice President of EFH Corp. (collectively, the "Named Executive Officers"); and |
| |
| • | approve executive compensation based on those evaluations. |
Compensation Risk Assessment
Our management team initiates EFH Corp.'s internal risk review and assessment process for our compensation policies and practices by assessing, among other things: (1) the mix of cash and equity payouts at various compensation levels and, more recently, the necessity of adjusting such mix in connection with our Bankruptcy Filing (as defined herein); (2) the performance time horizons used by our plans; (3) the use of multiple financial and operational performance metrics that are readily monitored and reviewed; (4) the lack of an active trading market and other impediments to liquidity associated with EFH Corp. common stock; (5) the incorporation of both operational and financial goals and individual performance modifiers; (6) the inclusion of maximum caps and other plan-based mitigants on the amount of certain of our awards; and (7) multiple levels of review and approval of awards (including approval of our O&C Committee with respect to awards to executive officers and awards to other employees that exceed monetary thresholds). Following their assessment, our management team prepares a report, which is provided to EFH Corp.'s Audit Committee for review. After review and adjustment, if any, as determined by EFH Corp.'s Audit Committee, the Audit Committee provides the report to the O&C Committee. EFH Corp.'s management and Audit Committee have determined that the risks arising from EFH Corp.'s compensation policies and practices are not reasonably likely to have a material adverse effect on EFH Corp.
Compensation Discussion and Analysis
Executive Summary
Effect of Bankruptcy Filing
As previously disclosed, on April 29, 2014 (the Petition Date), EFH Corp. and the substantial majority of its direct and indirect subsidiaries, including EFIH, EFCH and TCEH but excluding the Oncor Ring-Fenced Entities, (the Debtors) filed voluntary petitions for relief (the Bankruptcy Filing) under Chapter 11 of the United States Bankruptcy Code (the Bankruptcy Code) in the United States Bankruptcy Court for the District of Delaware (the Bankruptcy Court). The Bankruptcy Filing resulted primarily from the adverse effects on EFH Corp.'s competitive businesses of lower wholesale electricity prices in ERCOT driven by the sustained decline in natural gas prices since mid-2008, which challenged the profitability and operating cash flows of EFH Corp.'s competitive businesses and resulted in the inability to support their significant interest payments and debt maturities, including the remaining debt obligations due in 2014, and to refinance and/or extend the maturities of their outstanding debt. Since the Petition Date, the Debtors have worked closely with each of their respective stakeholders in an effort to formulate a consensual plan of reorganization that maximizes value to the Debtors' estates.
In 2013 and 2014, the Company achieved strong operational performance due, we believe, to the strength and attributes of our management team and employees, whose continued contributions will be critical throughout the pendency of our restructuring efforts. The Debtors' operations are complex and include, among other things, electricity generation, mining operations, wholesale energy sales and purchases, commodity risk management, and retail electricity sales and marketing. In addition to effectively executing the Debtors’ business strategies and complex operations in a fiercely competitive industry, we believe our employees will drive the success of the Debtors' restructuring and serve a crucial role in maximizing the value of the Debtors' estates. The O&C Committee continues to evaluate and adjust, as appropriate, the elements of our compensation programs to maintain the alignment of our incentive programs and our organizational focus during the dynamic restructuring process. As a result, the O&C Committee approved certain adjustments to our compensation program in January of 2014 and December of 2014 to further align our incentive programs with goals and metrics that are tailored to the unusual circumstances faced by an organization during the pendency of the Chapter 11 Cases. Such adjustments are described more fully herein.
In 2014, the Company adjusted certain previously approved threshold performance metrics under our annual incentive plan for certain senior executives, including our Named Executive Officers. We have historically applied the same performance metrics for incentive compensation for all employees, including our Named Executive Officers. However, in connection with the restructuring, we chose to proactively review mid-year the performance metric targets that trigger incentive compensation under the EAIP (as defined below) to account for year-to-date performance, updated commodity curves (using June 30, 2014 forward pricing), known non-recurring circumstances, and the passage of time. In light of this review, and in recognition of Bankruptcy Code requirements related to the approval of insider compensation programs, we re-calibrated several of the 2014 performance metrics applicable to our Named Executive Officers (described below), in each case making the metrics more difficult to achieve than the previously established 2014 performance metrics. We then recommended that the O&C Committee adopt those certain adjusted 2014 performance metrics, while maintaining the previously established 2014 performance metrics for our non-insider employees, because they were and continued to be incentivizing. The O&C Committee adopted certain amended 2014 performance metrics applicable to certain of our executive officers, including the Named Executive Officers, in August 2014 and modified the potential payout percentage for the achievement of such heightened metrics. Such adjustment is reflected in the Named Executive Officer Financial and Operational Performance Targets tables herein.
During the pendency of the Chapter 11 Cases, our Named Executive Officers are considered "insiders" under the Bankruptcy Code. As a result, any payments made by the Debtors related to our Named Executive Officers require approval by the Bankruptcy Court. In an order dated October 28, 2014, the Bankruptcy Court approved certain 2014 incentive compensation proposed by the O&C Committee (including the change to performance targets described above) and described herein for our Named Executive Officers and the distribution of such incentive compensation. Additionally, on December 17, 2014, the Bankruptcy Court approved the 2015 incentive compensation programs proposed by the O&C Committee for our Named Executive Officers for 2015, as further described herein.
Compensation Philosophy
We have a pay-for-performance compensation philosophy, which places an emphasis on pay-at-risk; a significant portion of an executive officer's compensation is comprised of variable compensation. Our compensation program is intended to attract and motivate top-talent executive officers as leaders and compensate executive officers appropriately for their contribution to the attainment of our financial, operational and strategic objectives. In addition, we believe it is important to retain our top tier talent and strongly align their interests with our stakeholders by emphasizing incentive based compensation. Given the competitive nature of the unregulated market in ERCOT, the evolving regulatory environment, and our current restructuring efforts, we believe maintaining continuity and engagement of such talent is critical to our continued success, and we are sensitive to the challenges related to long-term incentive compensation in connection with our restructuring efforts.
To achieve the goals of our compensation philosophy, we believe that:
| |
| • | the overall compensation program should emphasize variable compensation elements that have a direct link to overall corporate performance and stakeholder value; |
| |
| • | the overall compensation program should place an increased emphasis on pay-at-risk with increased responsibility; |
| |
| • | the overall compensation program should attract, motivate and engage top-talent executive officers to serve in key roles; and |
| |
| • | an executive officer's individual compensation level should be based upon an evaluation of the financial and operational performance of that executive officer's business unit or area of responsibility as well as the executive officer's individual performance. |
We believe our compensation philosophy supports our businesses by:
| |
| • | aligning performance measures with our business objectives to drive the financial and operational performance of EFH Corp. and its business units; |
| |
| • | rewarding business unit and individual performance by providing compensation levels consistent with the relevant employee's level of contribution and degree of accountability; and |
| |
| • | attracting and retaining the best performers. |
Elements of Compensation
The material elements of our executive compensation program are:
| |
| • | a competitive base salary; |
| |
| • | the opportunity to earn an annual performance-based cash bonus based on the achievement of specific corporate, business unit and individual performance goals; and |
| |
| • | additional incentive awards, primarily in the form of (1) cash incentive awards, which were modified in January 2014 as part of our normal compensation review process, and again in December 2014, as described more fully herein, and (2) restricted stock units ("Restricted Stock Units") under and subject to the terms of the 2007 Stock Incentive Plan for Key Employees of EFH Corp. and Affiliates (the "2007 Stock Incentive Plan"). |
In addition, executive officers generally have the opportunity to participate in certain of our broad-based employee benefit plans, including our Thrift (401(k)) Plan and health and welfare plans, and to receive certain perquisites.
Compensation of the CEO
In determining the compensation of the CEO, the O&C Committee annually follows a thorough and detailed process. At the end of each year, the O&C Committee reviews a self-assessment prepared by the CEO regarding his performance and the performance of our businesses and meets (with and without the CEO) to evaluate and discuss his performance and the performance of our businesses.
While the O&C Committee tries to ensure that a substantial portion of the CEO's compensation is directly linked to his performance and the performance of our businesses, the O&C Committee also seeks to set his compensation in a manner that is competitive with compensation for similarly performing executive officers with similar responsibilities in companies we consider our peers.
Compensation of Other Executive Officers
In determining the compensation of each of our executive officers (other than the CEO), the O&C Committee seeks the input of the CEO. At the end of each year, the CEO reviews a self-assessment prepared by each executive officer and assesses the executive officer's performance against business unit (or area of responsibility) and individual goals and objectives. The O&C Committee and the CEO then review the CEO's assessments and, in that context, the O&C Committee approves the compensation for each executive officer.
Assessment of Compensation Elements
We design the majority of our executive officers' compensation to be linked directly to corporate and business unit (or area of responsibility) performance. For example, each executive officer's annual performance-based cash bonus is primarily based on the achievement of certain corporate and business unit financial and operational targets (such as management EBITDA, as discussed herein, cost management, generation output, customer satisfaction, etc.). In addition, each executive officer's additional cash incentive award is based on achievement of certain operational and financial performance metrics. We also try to ensure that our executive compensation program is competitive with our peer companies in order to effectively motivate and retain our executive officers.
The following is a detailed discussion of the principal compensation elements provided to our executive officers and the amendments made thereto in 2014 and 2015. Additional detail about each of the elements can be found in the compensation tables, including the footnotes and the narrative discussion following certain of the tables.
Executive Compensation Evaluation and Adjustment
In October 2012, the O&C Committee engaged Towers Watson & Co. ("Towers Watson"), an independent compensation consultant to review our compensation practices and to confirm whether such practices continue to be aligned with our compensation philosophy. Since being engaged, Towers Watson has annually delivered reports to the O&C Committee, which, in 2014, included market data for a peer group composed of the following companies:
|
| | | | |
| Ameren Corp. | | American Electric Power Co. Inc. | | Calpine Corp. |
| Dominion Resources Inc. | | Duke Energy Corp. | | Edison International |
| Entergy Corp. | | Exelon Corp.(1) | | FirstEnergy Corp.(2) |
| NextEra Energy, Inc. | | NRG Energy, Inc.(3) | | PPL Corp. |
| Public Service Enterprise Group Inc. | | Southern Co. | | Xcel Energy Inc. |
____________
| |
| (1) | Exelon Corp. acquired former peer company Constellation Energy Group Inc. |
| |
| (2) | FirstEnergy Corp. acquired former peer company Allegheny Energy, Inc. |
| |
| (3) | NRG Energy, Inc. is the successor by merger to GenOn Energy, Inc. |
The O&C Committee does not target any particular level of total compensation or individual component of compensation against the peer group; rather the O&C Committee considers the range of total compensation provided by our peers, together with our position as a privately-owned company that is a debtor under Chapter 11 of the Bankruptcy Code, in determining the appropriate mix and level of total compensation for our executives. Because the Towers Watson report indicated that base pay and/or total direct compensation had fallen below market for each of our Named Executive Officers, in December 2014, the O&C Committee approved base salary adjustments for Mr. Keglevic, Mr. Burke, Ms. Doré and Mr. McFarland, described below.
The employment agreements of each of our Named Executive Officers were amended in March 2014 to reflect the addition of an Annual Supplemental Award (defined and described below). The agreements were subsequently amended in March 2015 to reflect amendments to the Annual Supplemental Awards and base salary adjustments for Mr. Keglevic, Mr. Burke, Ms. Doré and Mr. McFarland.
Base Salary
We believe base salary should consider the scope and complexity of an executive officer's position and the level of responsibility required to perform his or her job. We also believe that a competitive level of base salary is required to attract, motivate and retain qualified talent.
We want to ensure our cash compensation is competitive and sufficient to incent executive officers to remain with us, recognizing our high performance expectations across a broad set of operational, financial, customer service and community-oriented goals and objectives, as well as the additional demands placed upon our management team by our restructuring efforts.
The O&C Committee annually reviews base salaries and periodically uses independent compensation consultants to ensure the base salaries are market-competitive. The O&C Committee may also review an executive officer's base salary from time to time during a year, including if the executive officer is given a promotion or if his responsibilities are significantly modified.
In December 2014, following a review of the market data collected by Towers Watson, the O&C Committee approved the following increased base salaries of four of our Named Executive Officers, effective January 1, 2015:
|
| | |
| Name | 2014 Base Salary | 2015 Base Salary |
| Paul M. Keglevic | $735,000 | $785,000 |
| James A. Burke | $675,000 | $700,000 |
| Stacey H. Doré | $600,000 | $650,000 |
| Mark A. McFarland | $675,000 | $700,000 |
These increased base salaries are intended to ensure that the Company continues to provide competitive pay to our Named Executive Officers.
Annual Performance-Based Cash Bonus - Executive Officer Annual Incentive Plan
The Executive Officer Annual Incentive Plan ("EAIP") provides an annual performance-based cash bonus for the successful attainment of certain annual financial and operational performance targets that are established annually at each of the corporate and business unit levels by the O&C Committee. Under the terms of the EAIP, performance against these targets, which are set at challenging levels to incentivize exceptional performance (while at the same time balancing the needs for safety and investment in our business), drives bonus funding. As a general matter, target level performance is based on EFH Corp.'s board-approved financial and operational plan (the "Financial Plan") for the upcoming year. The O&C Committee sets high expectations for our executive officers and therefore annually selects a target performance level that constitutes above average performance for the business, which the O&C Committee expects the business to achieve during the upcoming year. Threshold and superior levels are for performance levels that are below or above Financial Plan-based expectations, respectively. Based on the level of attainment of these performance targets, an aggregate EAIP funding percentage amount for all participants is determined.
Our financial performance targets typically include "management" EBITDA, a non-GAAP financial measure. When the O&C Committee reviews management EBITDA for purposes of determining our performance against the applicable management EBITDA target, it includes our net income (loss) before interest, taxes, depreciation and amortization plus transaction, management and/or similar fees paid to the Sponsor Group, and restructuring costs, together with such adjustments as the O&C Committee shall determine appropriate in its discretion after good faith consultation with our CEO and Chief Financial Officer, including adjustments consistent with those included in the comparable definitions in our TCEH DIP Facility (to the extent considered appropriate for executive compensation purposes). Our management EBITDA targets are also adjusted for acquisitions, divestitures, and major capital investment initiatives, to the extent that they were material and not contemplated in our annual Financial Plan. The management EBITDA targets are intended to measure achievement of the Financial Plan and the adjustments to management EBITDA described above primarily represent elements of our performance that are either beyond the control of management or were not predictable at the time the annual Financial Plan was approved. Given our Named Executive Officer's business unit responsibilities, our management EBITDA calculations for Mr. Young include Oncor, while management EBITDA calculations for the remaining Named Executive Officers exclude Oncor. Under the terms of the EAIP, the O&C Committee has broad authority to make these or any other adjustments to EBITDA that it deems appropriate in connection with its evaluation and compensation of our executive officers. Management EBITDA is an internal measure used only for performance management purposes, and EFH Corp. does not intend for management EBITDA to be an alternative to any measure of financial performance presented in accordance with GAAP. Management EBITDA is calculated similarly to TCEH Adjusted EBITDA, which is disclosed elsewhere in this Form 10-K and defined in the glossary to this Form 10-K, and reflects substantially all the computational elements of TCEH Adjusted EBITDA.
Financial and Operational Performance Targets for our Named Executive Officers
The following table provides a summary of the weight given to the various business unit scorecards, which constitute the performance targets under the EAIP, for each of our Named Executive Officers.
|
| | | | | | | | | | | | | | | | | |
| | Weight |
| Name | EFH Corp. Management EBITDA(2) | | Named Executive Officer EFH Business Services Scorecard Multiplier | | Named Executive Officer Luminant Scorecard Multiplier | | Named Executive Officer TXU Energy Scorecard Multiplier | | Total | | Payout |
John F. Young(1) | 50 | % | | 50 | % | | | | | | 100 | % | | 124 | % |
| Paul M. Keglevic | 50 | % | | 50 | % | | | | | | 100 | % | | 127 | % |
| James A. Burke | 25 | % | | | | | | 75 | % | | 100 | % | | 120 | % |
| Stacey H. Doré | 50 | % | | 50 | % | | | | | | 100 | % | | 127 | % |
| M.A. McFarland | 25 | % | | | | 75 | % | | | | 100 | % | | 118 | % |
____________
| |
| (1) | Mr. Young is measured on EFH Corp. Management EBITDA (including Oncor) while the remaining Named Executive Officers are measured on EFH Corp. Management EBITDA (excluding Oncor). |
| |
| (2) | The targeted EFH Corp. Management EBITDA (including Oncor) for the fiscal year ended December 31, 2014 was $4.055 billion. The targeted EFH Corp. Management EBITDA (excluding Oncor) for the fiscal year ended December 31, 2014 was $2.087 billion. The actual EFH Corp. Management EBITDA (including Oncor) for the fiscal year ended December 31, 2014 was $4.094 billion, which was above target. The actual EFH Corp. Management EBITDA (excluding Oncor) for the fiscal year ended December 31, 2014 was $2.117 billion, which was above target. |
The following table provides a summary of the performance targets included in the EFH Business Services Scorecard Multiplier for our Named Executive Officers.
|
| | | | | | | | |
| Named Executive Officer EFH Business Services Scorecard Multiplier | Weight | | Performance(1) | | Payout |
EFH Corp. Management EBITDA (excluding Oncor)(2) | 20.0 | % | | 115 | % | | 23 | % |
Luminant Scorecard Multiplier(3) | 20.0 | % | | 119 | % | | 24 | % |
TXU Energy Scorecard Multiplier(3) | 20.0 | % | | 121 | % | | 24 | % |
| EFH Corp. (excluding Oncor) Total Spend | 20.0 | % | | 170 | % | | 34 | % |
| EFH Business Services Costs | 20.0 | % | | 165 | % | | 33 | % |
| Total | 100.0 | % | | | | 138 | % |
____________
| |
| (1) | Performance payouts equal 100% if the target amount is achieved for a particular metric, 75% if the threshold amount is achieved and 200% if the superior amount is achieved. The actual performance payouts are interpolated on a linear basis between threshold and target or target and superior, as applicable, with a maximum performance payout for any particular metric being equal to 200%. |
| |
| (2) | The targeted EFH Corp. Management EBITDA (excluding Oncor) for the fiscal year ended December 31, 2014 was $2.087 billion. The actual EFH Corp. Management EBITDA (excluding Oncor) for the fiscal year ended December 31, 2014 was $2.117 billion, which was above target. |
| |
| (3) | The performance targets included in the Luminant Scorecard Multiplier and the TXU Energy Scorecard Multiplier are summarized below. |
The following table provides a summary of the performance targets included in the Luminant Scorecard Multiplier for our Named Executive Officers.
|
| | | | | | | | |
| Named Executive Officer Luminant Scorecard Multiplier | Weight | | Performance(1) | | Payout |
| Luminant Management EBITDA | 37.5 | % | | 117 | % | | 44 | % |
| Luminant Available Generation - Lignite/Coal (June-Sept. 15) | 10.0 | % | | 100 | % | | 10 | % |
| Luminant Available Generation - Lignite/Coal (Jan.-May, Sept. 16-Dec.) | 10.0 | % | | 90 | % | | 9 | % |
| Luminant Available Generation – Nuclear | 7.5 | % | | — | % | | — | % |
| Luminant Operating Costs/SG&A | 15.0 | % | | 113 | % | | 17 | % |
| Luminant Capital Expenditures | 10.0 | % | | 200 | % | | 20 | % |
| Luminant Fossil Fuel Costs | 10.0 | % | | 200 | % | | 20 | % |
| Total | 100.0 | % | | | | 119 | % |
____________
| |
| (1) | Performance payouts equal 100% if the target amount is achieved for a particular metric, 75% if the threshold amount is achieved and 200% if the superior amount is achieved. The actual performance payouts are interpolated on a linear basis between threshold and target or target and superior, as applicable, with a maximum performance payout for any particular metric being equal to 200%. |
The following table provides a summary of the performance targets included in the TXU Energy Scorecard Multiplier for our Named Executive Officers.
|
| | | | | | | | |
| Named Executive Officer TXU Energy Scorecard Multiplier | Weight | | Performance(1) | | Payout |
| TXU Energy Management EBITDA | 40.0 | % | | 130 | % | | 52 | % |
| TXU Energy Total Costs | 20.0 | % | | 90 | % | | 18 | % |
| Contribution Margin | 15.0 | % | | 107 | % | | 16 | % |
| Residential Customer Count | 10.0 | % | | 170 | % | | 17 | % |
| Customer Satisfaction | 3.0 | % | | 100 | % | | 3 | % |
| Average Days Sales Outstanding | 3.0 | % | | 67 | % | | 2 | % |
| TXU Energy Energizing Event Success | 3.0 | % | | 100 | % | | 3 | % |
| TXU Energy Customer Satisfaction (Complaints) | 3.0 | % | | 100 | % | | 3 | % |
| TXU Energy System Availability (Downtime) | 3.0 | % | | 200 | % | | 6 | % |
| Total | 100.0 | % | | | | 121 | % |
____________
| |
| (1) | Performance payouts equal 100% if the target amount is achieved for a particular metric, 75% if the threshold amount is achieved (excluding Average Days Sales Outstanding for which a 50% threshold amount is still applicable) and 200% if the superior amount is achieved. The actual performance payouts are interpolated on a linear basis between threshold and target or target and superior, as applicable, with a maximum performance payout for any particular metric being equal to 200%. |
Individual Performance Modifier
After approving the actual performance against the applicable targets under the EAIP, the O&C Committee and/or the CEO reviews the performance of each of our executive officers on an individual and comparative basis. Based on this review, which includes an analysis of both objective and subjective criteria, as determined by the O&C Committee in its sole discretion, including the CEO's recommendations (with respect to all executive officers other than himself), the O&C Committee approves an individual performance modifier for each executive officer. Under the terms of the EAIP, the individual performance modifier can range from an outstanding rating (150%) to an unacceptable rating (0%). To calculate an executive officer’s final annual cash incentive bonus, the executive officer’s corporate/business unit payout percentages are multiplied by the executive officer’s target incentive level, which is computed as a percentage of annualized base salary, and then by the executive officer’s individual performance modifier.
Actual Awards
The following table provides a summary of the 2014 performance-based cash bonus for each Named Executive Officer under the EAIP.
|
| | | | | | | | | |
| Name | Target (% of salary) | | Target Award ($ Value) | | Actual Award |
John F. Young (1) | 125% | | $ | 1,687,500 |
| | $ | 3,036,327 |
|
Paul M. Keglevic (2) | 85% | | $ | 624,750 |
| | $ | 1,147,578 |
|
James A. Burke (3) | 85% | | $ | 573,750 |
| | $ | 994,415 |
|
Stacey H. Doré(4) | 85% | | $ | 510,000 |
| | $ | 936,799 |
|
M.A. McFarland (5) | 85% | | $ | 573,750 |
| | $ | 983,766 |
|
____________
| |
| (1) | Mr. Young's incentive award is based on the successful achievement of the financial performance targets for EFH Corp. (including Oncor) and EFH Business Services and the financial and operational performance targets for Luminant and TXU Energy and an individual performance modifier. In 2014, Mr. Young maintained our workforce’s focus on "Job One" (the provision of excellent operations) across the Company and successfully managed communications with our employees, regulators and constituents as we entered into and continued through the Bankruptcy Case. Given these and other significant achievements, the O&C Committee approved an individual performance modifier that increased Mr. Young's incentive award. |
| |
| (2) | Mr. Keglevic's incentive award is based on the successful achievement of the financial performance targets for EFH Corp. (excluding Oncor) and EFH Business Services and the financial and operational performance targets for Luminant and TXU Energy and an individual performance modifier. In 2014, Mr. Keglevic as Co-Chief Restructuring Officer and Chief Financial Officer, Mr. Keglevic successfully oversaw and led a team that negotiated our TCEH DIP Facility, EFIH First Lien DIP Facility, and a restructuring support agreement as part of our Bankruptcy Case. Additionally, Mr. Keglevic served as our lead declarant for many of the motions involved in our Bankruptcy Cases, including the first day declaration and the majority of our operational motions, all while continuing to drive strong economic performance from the Company. Given these and other significant achievements, the O&C Committee approved an individual performance modifier that increased Mr. Keglevic's incentive award. |
| |
| (3) | Mr. Burke's incentive award is based on the successful achievement of a financial performance target for EFH Corp. (excluding Oncor) and the financial and operational performance targets for TXU Energy and an individual performance modifier. In 2014, under Mr. Burke's leadership, TXU Energy maintained its strong customer experience performance in spite of the Bankruptcy Case, successfully managed margins despite extreme weather, lowered residential customer attrition, and was named as one of the top 100 places to work by The Dallas Morning News. In addition to his duties as the Chief Executive Officer of TXU Energy, Mr. Burke led a cross-functional and enterprise-wide (excluding Oncor) team focused on contract and vendor management across the enterprise (excluding Oncor) during our Bankruptcy Case. Given these and other significant achievements, the O&C Committee approved an individual performance modifier that increased Mr. Burke's incentive award. |
| |
| (4) | Ms. Doré's incentive award is based on the successful achievement of the financial performance targets for EFH Corp. (excluding Oncor) and EFH Business Services and the financial and operational performance targets for Luminant and TXU Energy and an individual performance modifier. Effective January 1, 2014, the O&C Committee increased Ms. Doré's target incentive level from 65% to 85% to reflect her additional responsibilities and align her incentive target with her peers within the company. In 2014, as Co-Chief Restructuring Officer and General Counsel, Ms. Doré led a team on behalf of the Company through difficult negotiations with our various creditor groups in connection with our Bankruptcy Case, including negotiations with respect to a restructuring support agreement prior to our Bankruptcy Filing, which, among other things, enabled the Company to obtain critical relief through our First Day Motions to continue to operate in the ordinary course of business and maintain strong vendor, customer, partner, employee, industry and community relationships. In addition, Ms. Doré oversaw a team focused on the litigation and negotiation of the plan of reorganization in the Bankruptcy Case. Ms. Doré also led a team that achieved significant positive litigation outcomes for Luminant during 2014. Given these and other significant achievements, the O&C Committee approved an individual performance modifier that increased Ms. Doré's incentive award. |
| |
| (5) | Mr. McFarland's incentive award is based on the successful achievement of the financial performance targets for EFH Corp. (excluding Oncor) and the financial and operational performance targets for Luminant and an individual performance modifier. In 2014, Mr. McFarland spearheaded Luminant's organizational response to continued low power prices while maintaining operational excellence and top decile performance from our generation fleet. Given these and other significant achievements, the O&C Committee approved an individual performance modifier that increased Mr. McFarland's incentive award. |
Supplemental Awards
Long-Term Cash Incentive Awards
Our long-term cash incentive awards are designed to provide incentive to our Named Executive Officers to achieve top operational and financial performance because the awards are based on the achievement of management EBITDA targets (as described above). The following long-term cash incentive awards affected our Named Executive Officers' total compensation for 2014:
| |
| • | 2015 LTI Award - granted in 2011 (other than Ms. Doré, whose award was granted in 2012), provides each Named Executive Officer the opportunity to earn between $500,000 and $1,000,000 ($1,350,000 and $2,700,000 with respect to Mr. Young, and $216,666 and $433,333 for Ms. Doré) in each of 2012, 2013, and 2014, with the amount of the award for each year to be determined based upon the amount of management EBITDA actually achieved by EFH Corp. as compared to the management EBITDA threshold and target amounts previously set by the O&C Committee, in each case, for the years ended December 31, 2012, 2013, and 2014 (as applicable). Payment of the 2015 LTI Award was made in March 2015; |
| |
| • | Additional 2015 LTI Award - granted in 2013 to Ms. Doré, provides her the opportunity to earn an additional amount between $300,000 and $600,000 in each of 2013 and 2014, with the amount of the award for each year to be determined based upon the amount of management EBITDA actually achieved by EFH Corp. as compared to the management EBITDA threshold and target amounts previously set by the O&C Committee, in each case, for the years ended December 31, 2013, and 2014 (as applicable). Payment of the Additional 2015 LTI Award was made in March 2015. |
The table below sets forth the portion of the 2015 LTI Award earned by each Named Executive Officer in 2012, 2013, and 2014 (for Ms. Doré, the 2013 and 2014 portions of the 2015 LTI Award also include the Additional 2015 LTI Award earned in 2013 and 2014), and the amounts paid in March 2015:
2015 LTI Award
|
| | | | | | | |
| Name | 2012 Portion of 2015 LTI Award Previously Earned | | 2013 Portion of 2015 LTI Award Previously Earned | | 2014 Portion of 2015 LTI Award Earned | | Amount of 2015 LTI Distributed 3/2015(2) |
| John F. Young | $2,700,000 | | $2,700,000 | | $2,700,000 | | $8,100,000 |
| Paul M. Keglevic | $1,000,000 | | $1,000,000 | | $1,000,000 | | $3,000,000 |
| James A. Burke | $1,000,000 | | $1,000,000 | | $1,000,000 | | $3,000,000 |
Stacey H. Doré(1) | $433,333 | | $1,033,333 | | $1,033,333 | | $2,500,000 |
| M.A. McFarland | $1,000,000 | | $1,000,000 | | $1,000,000 | | $3,000,000 |
____________
| |
| (1) | In the case of Ms. Doré, each of the columns titled "2013 Portion of 2015 LTI Award Previously Earned" and "2014 Portion of 2015 LTI Award Earned" includes $600,000 with respect to her Additional 2015 LTI Award. |
| |
| (2) | The "Amount of 2015 LTI Distributed in 3/2015" represents the 2012, 2013 and 2014 portions of the 2015 LTI Award earned to date by each Named Executive Officer. |
In connection with the grant of the 2015 LTI Award, in 2011 (2012 in the case of Ms. Doré), the Company issued irrevocable standby letters of credit to each Named Executive Officer for payment under the 2015 LTI awards. In March 2015, our Named Executive Officers drew under these letters of credit to receive payment of compensation earned by them under the 2015 LTI Award.
Annual Supplemental Awards
The performance period for the 2015 LTI Award (and the Additional 2015 LTI Award) ended on December 31, 2014. We have historically offered incentive based awards as part of our overall compensation because we believe such awards incentivize and reward our Named Executive Officers for superior performance and drive performance for the enterprise as a whole. In 2012 and through 2013, the O&C Committee engaged Towers Watson to develop an incentive based program that is market-based and consistent with competitive practices for our peers in the power industry and our peers that are, or have been, debtors under Chapter 11 of the Bankruptcy Code. As a result, in January 2014, the O&C Committee approved additional cash incentive awards for each of our Named Executive Officers (the "Annual Supplemental Awards"), which we believe align the goals of our Named Executive Officers to maintain excellent operational and financial performance while addressing the dynamic challenges we face during the pendency of the Bankruptcy Case.
The Annual Supplemental Awards were introduced as the successors to the 2015 LTI Awards and are based upon the achievement of semi-annual and cumulative annual performance goals established by the O&C Committee for each of 2015 and 2016 and provide each of our Named Executive Officers the opportunity to earn up to $500,000 in each semi-annual period ($1,350,000 for Mr. Young) in 2015 and 2016, provided that he or she is employed by EFH Corp. or an affiliate on the last day of such semi-annual period. The sum of each Named Executive Officer's awards under the Additional Incentive Awards for each of 2015 and 2016 will not exceed $1,000,000 ($2,700,000 for Mr. Young). The actual amount of the awards is based upon semi-annual and year-to-date performance of our businesses as compared to the base and threshold quarterly and year-to-date performance goals for such businesses established semi-annually by the O&C Committee.
In December, 2014, the Bankruptcy Court approved changes to the performance period and frequency of payments under the Annual Supplemental Awards for 2015. The Annual Supplemental Awards for 2016 remain subject to approval by the Bankruptcy Court.
To the extent earned, the Annual Supplemental Awards for 2015 will be distributed in accordance with their terms (Annual Supplemental Awards for 2016 will be paid on terms approved by the Bankruptcy Court, if at all), and will terminate on the earlier of December 31, 2016 or the date on which the Named Executive Officer receives a grant under another long-term equity incentive plan adopted by EFH Corp. or its successor. In the event of such Named Executive Officer's termination without cause, resignation for good reason or termination due to death or disability or upon a change of control, such Annual Supplemental Award will vest and become payable, to the extent earned, on a pro-rated basis, for such applicable performance period.
Long-Term Equity Incentives
We believe it is important to strongly align the interests of our executive officers and stakeholders. The purpose of the 2007 Stock Incentive Plan, which was previously approved by our Board, was to:
| |
| • | promote our long-term financial interests and growth by attracting and retaining management and other personnel with the training, experience and ability to make a substantial contribution to our success; |
| |
| • | motivate management and other personnel by means of growth-related incentives to achieve long-range goals; and |
| |
| • | align the long-term interests of our stakeholders and the interests of our executive officers through opportunities for stock (or stock-based) ownership in EFH Corp. |
Given the Bankruptcy Filing, our equity-based compensation has de minimis monetary value and we have adjusted our compensation practices (as discussed above) to take into account the minimal incentive value related to our equity. We believe such adjustments further align the compensation of our executive officers, including our Named Executive Officers, with the interests of all of our stakeholders, which will evolve during our restructuring, by emphasizing short term, measurable goals in recognition of the dynamic nature of the Bankruptcy Filing.
Because we are a privately-held company, our 2007 Stock Incentive Plan does not contain provisions, and we do not have any equity grant practices in place, designed to coordinate the granting of equity awards with the public release of material information. Please refer to the Grants of Plan-Based Awards - 2014 table, including the footnotes thereto, and the Option Exercises and Stock Vested-2014 table, including the footnotes thereto, for a more detailed description of the outstanding Restricted Stock Units held by each of the Named Executive Officers.
Annual Grant of Restricted Stock Units:
Pursuant to the terms of their employment agreements, each of our Named Executive Officers received an annual grant of Restricted Stock Units ("Annual RSUs"), which resulted in each Named Executive Officer receiving 500,000 Restricted Stock Units (1,500,000 with respect to Mr. Young and 250,000 with respect to Ms. Doré) in each of 2011, 2012 and 2013 (excluding Ms. Doré, who received Annual RSUs in each of 2012, 2013, and 2014). These Annual RSUs cliff vested on September 30, 2014. The O&C Committee approved Ms. Doré's 2014 RSU grant on January 22, 2014, and these RSUs also vested in September 2014.
In 2011, each of our Named Executive Officers received a one-time lump sum grant of RSUs (the "Exchange RSUs" and together with the Annual RSUs, the "RSUs") in exchange for forfeiting all rights in respect of any and all options to purchase shares of EFH Corp.'s common stock that they had been previously granted under the 2007 Stock Incentive Plan. The Exchange RSUs cliff vested on September 30, 2014.
No other equity awards were granted to our Named Executive Officers in 2014. Although the Annual RSUs (and Ms. Doré's additional grant of RSUs) have vested, we have not sought nor obtained Bankruptcy Court approval for the issuance of shares in connection with the vested RSUs. As a result, the shares underlying these RSUs have not been issued. In the future, we may make additional discretionary grants of equity-based compensation to reward high performance or achievement. Please refer to the Option Exercises and Stock Vested - 2014 table, including the footnotes to that table, for a more detailed description of the RSUs granted to Ms. Doré in 2014.
Other Elements of Compensation
General
Our executive officers generally have the opportunity to participate in certain of our broad-based employee compensation plans, including our Thrift (401(k)) Plan, and health and welfare plans. Please refer to the footnotes to the Summary Compensation Table for a more detailed description of our Thrift Plan, and the narrative that follows the Pension Benefits table for a more detailed description of our Supplemental Retirement Plan.
Perquisites
We provide our executives with certain perquisites on a limited basis. The perquisites are generally intended to enhance our executive officers' ability to conduct company business. These benefits include financial planning, preventive health maintenance, and reimbursement for certain club memberships and certain spousal travel expenses. Expenditures for the perquisites described below are disclosed by individual in footnote 4 to the Summary Compensation Table. The following is a summary of perquisites offered to our Named Executive Officers that are not available to all employees:
Executive Financial Planning: We pay for our executive officers to receive financial planning services. This service is intended to support them in managing their financial affairs, which we consider especially important given the high level of time commitment and performance expectation required of our executive officers. Furthermore, we believe that such service helps ensure greater accuracy and compliance with individual tax regulations by our executive officers.
Health Services: We pay for our executive officers to receive annual physical health exams and we purchased an annual membership for Messrs. Young and Keglevic to participate in a comprehensive health plan that provides anytime personal and private physician access and health care. The health of our executive officers is important given the vital leadership role they play in directing and operating the company. Our executive officers are important assets of EFH Corp., and these benefits are designed to help ensure their health and long-term ability to serve our stakeholders.
Club Memberships: We reimburse certain of our executives for the cost of golf and social club memberships, provided that the club membership provides for a business-use opportunity, such as client networking and entertainment. The club membership reimbursements are provided to assist the executives in cultivating business relationships.
Spouse Travel Expenses: From time to time, we pay for an executive officer's spouse to travel with the executive officer when taking a business trip.
Payments Contingent Upon a Change of Control of EFH Corp.
We have entered into employment agreements with each of our Named Executive Officers. Each of the employment agreements provides that certain payments and benefits will be paid upon the expiration or termination of the agreement under various circumstances, including termination without cause, resignation for good reason and termination of employment within a fixed period of time following a change in control of EFH Corp. We believe these provisions are important in order to attract, motivate, and retain the caliber of executive officers that our business requires and provide incentive for our executive officers to fully consider potential changes that are in our and our stakeholders' best interest, even if such changes could result in the executive officers' termination of employment. For a description of the applicable provisions in the employment agreements of our Named Executive Officers see "Potential Payments upon Termination or Change in Control."
Other
Under the terms of Mr. Young's employment agreement, we have purchased a 10-year term life insurance policy (to be paid to a beneficiary of his choice) in an insured amount equal to $10,000,000. In addition, under the terms of Mr. Young's employment agreement on December 31, 2014, Mr. Young became entitled to a Company-purchased single premium annuity contract, with a net value of $3,000,000. The purchase of this single premium annuity contract requires Bankruptcy Court approval, but we have not sought or obtained this approval. As a result, this annuity contract has not been purchased. Each of these benefits was originally included as a part of Mr. Young's compensation package to set his compensation in a manner that is competitive with compensation for chief executive officers in companies we consider our peers.
Accounting and Tax Considerations
Accounting Considerations
Because our common stock is not registered or publicly traded, the O&C Committee does not generally consider the effect of accounting principles when making executive compensation decisions.
Income Tax Considerations
Section 162(m) of the Code limits the tax deductibility by a publicly-held company of compensation in excess of $1 million paid to the CEO or any other of its three most highly compensated executive officers other than the principal financial officer. Because EFH Corp. is a privately-held company, Section 162(m) will not limit the tax deductibility of any executive compensation for 2014, and the O&C Committee does not take it into account when making executive compensation decisions.
Organization and Compensation Committee Report
The O&C Committee has reviewed and discussed with management the Compensation Discussion and Analysis set forth in this Form 10-K. Based on this review and discussions, the committee recommended to the Board that the Compensation Discussion and Analysis be included in this Form 10-K.
Organization and Compensation Committee
Donald L. Evans, Chair
Arcilia C. Acosta
Kenneth Pontarelli
Summary Compensation Table—2014
The following table provides information for the fiscal years ended December 31, 2014, 2013 and 2012 (only 2013 and 2014 for Ms. Doré because she became a Named Executive Officer in 2013) regarding the aggregate compensation paid to our Named Executive Officers.
|
| | | | | | | | | | | | | | | | |
| Name and Principal Position | | Year | | Salary ($) | | Bonus ($)(1) | | Stock Awards ($)(2) | | Non-Equity Incentive Plan Compen-sation ($)(3) | | Change in Pension Value and Non-qualified Deferred Compensation Earnings ($)(4) | | All Other Compen-sation ($)(5) | | Total ($) |
John F. Young President & CEO of EFH Corp. | | 2014 2013 2012 | | 1,350,000
1,350,000 1,200,000 | | — — — | | — 420,000
525,000 — | | 5,736,327 5,511,375
4,968,000 | | — —
4,337 | | 72,993 73,152
72,848 | | 7,159,320 7,354,527
6,770,185 |
Paul M. Keglevic EVP, Chief Financial Officer & Co-CRO of EFH Corp. | | 2014 2013 2012 | | 735,000
735,000 650,000 | | — 375,000
50,000 | | — 140,000
175,000 | | 2,147,578 2,049,580
2,009,418 | | —
4,403
3,788 | | 57,901 54,037
4,326,288 | | 2,940,479 3,353,617
7,215,109 |
James A. Burke EVP-EFH Corp. & President & CEO of TXU Energy | | 2014 2013 2012 | | 675,000
675,000 630,000 | | — — — | | — 140,000
175,000 | | 1,994,415 2,116,518
2,033,783 | | 44,090 6,227
82,916 | | 28,965 29,203
32,977 | | 2,742,470 2,966,948
2,954,676 |
Stacey H. Doré EVP, General Counsel, & Co-CRO of EFH Corp. | | 2014 2013
| | 600,000
600,000
| | — 350,000
| | — 70,000 | | 1,970,132 1,788,533 | | —
—
| | 131,235 32,654 | | 2,701,367 2,841,187 |
M.A. McFarland EVP-EFH Corp. & President & Chief Executive Officer of Luminant | | 2014 2013 2012 | | 675,000 675,000 600,000 | | — —
150,000
| | — 140,000
175,000
| | 1,983,766 2,028,160
1,963,900
| | — — — | | 46,157 46,367
43,406
| | 2,704,923 2,889,527
2,932,306 |
___________
| |
| (1) | The amounts reported in this column represent discretionary cash bonuses that the relevant executive officer earned for the fiscal year listed. |
| |
| (2) | The amounts reported as "Stock Awards" represent the grant date fair value of the Annual RSUs, which cliff vested in September 2014, as computed in accordance with FASB ASC Topic 718. Ms. Doré was our only Named Executive Officer to receive a grant of Annual RSUs in 2014. Please refer to the "Grants of Plan Based Award-2014" table for additional information regarding her Annual RSU grant. |
| |
| (3) | The amounts for 2014 reported as "Non-Equity Incentive Plan Compensation" were earned by the executive officers in 2014 under the EAIP and the 2015 LTI Award (and the Additional 2015 LTI Award for Ms. Doré). Though portions of the 2015 LTI Award were earned in each of 2012, 2013 and 2014, the entire award was paid in March 2015 and was conditioned upon the Named Executive Officer's continued employment (with exceptions in limited circumstances) through March 13, 2015. The amounts reported for 2014 for each Named Executive Officer are as follows: (a) for Mr. Young, $3,036,327 for the EAIP and $2,700,000 for the 2015 LTI Award; (b) for Mr. Keglevic $1,147,578 for the EAIP and $1,000,000 for the 2015 LTI Award; (c) for Mr. Burke $994,415 for the EAIP and $1,000,000 for the 2015 LTI Award; (d) for Ms. Doré $936,799 for the EAIP, $433,333 for the 2015 LTI Award, $600,000 for the Additional 2015 LTI Award; and (e) for Mr. McFarland $983,766 for the EAIP and $1,000,000 for the 2015 LTI Award. The portions of the 2015 LTI Awards that were earned in each of 2012 and 2013 are treated as deferred compensation and thus are also are reported in the table entitled "Nonqualified Deferred Compensation - 2014" under the heading "Aggregate Balance at Last FYE." |
| |
| (4) | The amount for Mr. Burke in 2014 reported under "Change in Pension Value and Nonqualified Deferred Compensation Earnings" includes the aggregate increase in the actuarial value of his balance in the EFH Supplemental Retirement Plan. For a more detailed description of the Supplemental Retirement Plan, please refer to the narrative that follows the table entitled "Pension Benefits - 2014". |
| |
| (5) | The amounts for 2014 reported as "All Other Compensation" are attributable to the Named Executive Officer's receipt of compensation as described in the following table: |
|
| | | | | | | | | | | | | | | | | | | | | | | | | | | | |
| | All Other Compensation(a) |
| Name | Matching Contribution to Thrift
Plan(b) | Cost of Letter of Credit(c) | Premium Payments on Life Insurance Policy | Personal Physical
Care(d) | Financial Planning(e) | Country Club Dues(f) | Executive Physical(g) | Spousal Travel(h) | Other(i) | Total |
| John F. Young |
| $15,250 |
|
| $10,266 |
|
| $17,185 |
|
| $10,000 |
| $10,500 |
| $9,376 |
| — |
| — |
| $416 |
| $72,993 |
|
| Paul M. Keglevic |
| $15,600 |
|
| $3,802 |
| — |
|
| $10,000 |
| — |
|
| $19,776 |
| — |
| $8,723 | — |
|
| $57,901 |
|
| James A. Burke |
| $15,188 |
|
| $3,802 |
| — |
| — |
|
| $9,975 |
| — |
| — |
| — |
| — |
|
| $28,965 |
|
| Stacey H. Doré |
| $15,600 |
|
| $1,648 |
| — |
| — |
|
| $9,975 |
| $99,032 |
| $2,480 |
| — |
| $2,500 |
| $131,235 |
|
| Mark A. McFarland |
| $15,600 |
|
| $3,802 |
| — |
| — |
|
| $2,050 |
|
| $21,964 |
|
| $2,741 |
| — |
| — |
|
| $46,157 |
|
___________
| |
| (a) | For purposes of preparing this table, all perquisites are valued on the basis of the actual cost to EFH Corp. |
| |
| (b) | Our Thrift Plan allows participating employees to contribute a portion of their regular salary or wages to the plan. Under the EFH Thrift Plan, EFH Corp. matches a portion of an employee's contributions. This matching contribution is 100% of each Named Executive Officer's contribution up to 6% of the named Executive Officer's salary up to the IRS annual compensation limit. All matching contributions are invested in Thrift Plan investments as directed by the participant. |
| |
| (c) | For a discussion of the Letters of Credit received by our Named Executive Officers, please see "Compensation Discussion and Analysis -Supplemental Awards." |
| |
| (d) | For a discussion of the Personal Physical Care received by certain of our Named Executive Officers, please see "Compensation Discussion and Analysis - Other Elements of Compensation - Perquisites - Health Services." |
| |
| (e) | For a discussion of the Financial Planning received by certain of our Named Executive Officers, please see "Compensation Discussion and Analysis - Other Elements of Compensation - Perquisites - Executive Financial Planning." |
| |
| (f) | The amounts received by Mr. Keglevic and Mr. McFarland for the costs of a country club membership include a pro-rated portion of the initiation fee. The amounts received by Ms. Doré for the cost of a country club membership include the full initiation fee. |
| |
| (g) | The amounts received by Ms. Doré and Mr. McFarland include expenses related to medical examinations. |
| |
| (h) | The amounts received by Mr. Keglevic include taxable spousal travel expenses. |
| |
| (i) | The amounts received by Mr. Young include expenses related to security services and the amounts received by Ms. Doré include expenses related to entertainment. |
Grants of Plan-Based Awards – 2014
The following table sets forth information regarding grants of compensatory awards to our Named Executive Officers during the fiscal year ended December 31, 2014.
|
| | | | | | | | | | | | | | | | | | |
| | | | Date of Board Action | | Estimated Possible Payouts Under Non-Equity Incentive Plan Awards | | All Other Stock Awards: # of Shares of Stock or Unit (#) | | Grant Date Fair Value of Stock and Option Awards(3) |
| Name | Grant Date | | | Threshold ($) | | Target ($) | | Maximum ($) | | | | |
| John F. Young | 10/28/13(1) | | — | | 1,265,625 |
| | 1,687,500 |
| | 3,375,000 |
| | — |
| | — |
|
| Paul M. Keglevic | 10/28/13(1) | | — | | 468,563 |
| | 624,750 |
| | 1,249,500 |
| | — |
| | — |
|
| James A. Burke | 10/28/13(1) | | — | | 430,313 |
| | 573,750 |
| | 1,147,500 |
| | — |
| | — |
|
| Stacey H. Doré | 10/28/13(1) | | — | | 382,500 |
| | 510,000 |
| | 1,020,000 |
| | — |
| | — |
|
| | 4/23/14(2) | | 1/22/14 | | — |
| | — |
| | — |
| | 250,000 |
| | — |
|
| M.A. McFarland | 10/28/13(1) | | — | | 430,313 |
| | 573,750 |
| | 1,147,500 |
| | — |
| | — |
|
___________
| |
| (1) | Represents the threshold, target and maximum amounts available under the EAIP for each Named Executive Officer. Each payment is reported in the Summary Compensation Table in the year earned under the heading “Non-Equity Incentive Plan Compensation,” and is described above under the section entitled "Annual Performance Bonus - Executive Officer Annual Incentive Plan". |
| |
| (2) | Represents the 2014 grant of additional RSUs to Ms. Doré, which cliff-vested September 30, 2014, as described above under the section entitled "Long-Term Equity Incentives." The issuance of the shares underlying these RSUs may require Bankruptcy Court approval, and we have not sought or obtained this approval. As a result, these shares have not been issued. |
| |
| (3) | The amounts reported under "Grant Date Fair Value of Stock and Option Awards" represent the grant date fair value of restricted stock units related to the grant of Annual RSUs. There is no established public market for our common stock and the most recent independent third-party valuation of our common stock occurred in December 2012. Given the Bankruptcy Filing, our common stock was deemed to have de minimis value as of April 29, 2014. |
For a discussion of certain material terms of the employment agreements with the Named Executive Officers, please see "Assessment of Compensation Elements" and "Potential Payments upon Termination or Change in Control."
Option Exercises and Stock Vested – 2014
|
| | | | | | |
| | | Stock Awards |
| Name | | # of Shares Acquired on Vesting (1) | | Value Realized on Vesting |
| John F. Young | | 9,000,000 |
| | — |
|
| Paul M. Keglevic | | 3,000,000 |
| | — |
|
| James A. Burke | | 2,825,000 |
| | — |
|
| Stacey H. Doré | | 850,000 |
| | — |
|
| M.A. McFarland | | 2,700,000 |
| | — |
|
___________
| |
| (1) | The amounts reported for each Named Executive Officer in the "# of Shares Acquired on Vesting" column include the total number of RSUs that cliff-vested in September of 2014. The issuance of the shares underlying these RSUs would require Bankruptcy Court approval, and we have not sought or obtained this approval. As a result, these shares have not been issued. |
| |
| (2) | There is no established public market for our common stock and the most recent independent third-party valuation of our common stock occurred in December 2012. Given the Bankruptcy Filing, our common stock was deemed to have de minimis value as of April 29, 2014. |
Pension Benefits – 2014
The table set forth below illustrates present value on December 31, 2014 of Mr. Burke's benefits payable under the Supplemental Retirement Plan, based on his years of service and remuneration through December 31, 2014:
|
| | | | | | | | | | |
| Name | Plan Name | | Number of Years Credited Service (#) | | PV of Accumulated Benefit ($) | | Payments During Last Fiscal Year ($) |
| John F. Young | — | | — |
| | — |
| | — |
|
| Paul M. Keglevic | — | | — |
| | — |
| | — |
|
| James A. Burke | Supplemental Retirement Plan | | 6.9167 |
| | 247,434 |
| | — |
|
| Stacey H. Doré | — | | — |
| | — |
| | — |
|
| M.A. McFarland | — | | — |
| | — |
| | — |
|
The Supplemental Retirement Plan provides for the payment of retirement benefits, which would have otherwise been limited by the Code or the definition of earnings under our former retirement plan, which was terminated through a series of transactions in 2012 for those employees who were not members of a collective bargaining unit. The benefits under the Supplemental Retirement Plan were frozen in September 2012 in connection with the termination of our former retirement plan. Participation in EFH Corp.'s Supplemental Retirement Plan was limited to employees of all of its businesses other than Oncor, who were employed by EFH Corp. (or its participating subsidiaries) on or before October 1, 2007. As a result, Mr. Burke is the only Named Executive Officer that participated in the Supplemental Retirement Plan. In connection with the freezing of benefits under the Supplemental Retirement Plan in 2012, additional contributions under the Supplemental Retirement Plan ceased; however, if approved by the Bankruptcy Court, the amounts existing thereunder will be paid out in accordance with the terms of the Supplemental Retirement Plan. Given our Bankruptcy Filing, any amounts due to Mr. Burke under the Supplemental Retirement Plan may be subject to non-payment.
Benefits accrued under the Supplemental Retirement Plan after December 31, 2004, are subject to Section 409A of the Code. Accordingly, certain provisions of the Supplemental Retirement Plan have been modified in order to comply with the requirements of Section 409A and related guidance.
Nonqualified Deferred Compensation – 2014
The following table sets forth information regarding certain plans of EFH Corp. that provide for the deferral of the Named Executive Officers' compensation on a basis that is not tax-qualified for the fiscal year ended December 31, 2014:
|
| | | | | | | | | |
| Name | Aggregate Earnings in Last FY ($)(1) | | Aggregate Withdrawals/ Distributions ($)(2) | | Aggregate Balance at Last FYE ($)(3) |
| John F. Young |
| $14,324 |
| | — |
| | $5,679,495 |
| Paul M. Keglevic | — |
| | — |
| | $2,000,000 |
| James A. Burke |
| $1,401 |
| |
| ($68,911 | ) | | $2,175,794 |
| Stacey H. Doré | — |
| |
| ($200,000 | ) | | $1,466,667 |
| M.A. McFarland | — |
| | — |
| | $2,000,000 |
___________
| |
| (1) | The amounts reported as "Aggregate Earnings in Last FY" include earnings on deferrals previously made under the EFH Corp. Salary Deferral Program. Deferrals are credited with earnings or losses based on the performance of investment alternatives under the Salary Deferral Program selected by each participant. At the end of the applicable maturity period, the trustee for the Salary Deferral Program distributes the deferred compensation and the applicable earnings in cash as a lump sum or in annual installments at the participant's election made at the time of deferral. Since 2010, the Named Executive Officers have not been eligible to defer additional compensation in the Salary Deferral Program. As of December 31, 2014, Messrs. Young, and Burke had balances in the Salary Deferral Program, which will be distributed according to the terms of the plan. |
| |
| (2) | The amount reported as "Aggregate Withdrawals/Distributions" for Mr. Burke includes distributions made to Mr. Burke in connection with his participation in the Salary Deferral Program. The amount reported as "Aggregate Withdrawals/Distributions" for Ms. Doré includes the 2013 portion of Ms. Doré’s 2010 Non-Executive Officer Award, which was paid in January 2014. |
| |
| (3) | The amounts reported as "Aggregate Balance at Last FYE" include the following for all Named Executive Officers: (i) the portion of the 2015 LTI Award based on 2012 management EBITDA, and (ii) the portion of the 2015 LTI Award based on 2013 management EBITDA. The amounts reported for Messrs. Young and Burke also include any amounts deferred under the Salary Deferral Plan, plus any earnings thereon. The amount reported as "Aggregate Balance at Last FYE" for Mr. Burke also includes the fair market value of 443,474 deferred shares that he is entitled to receive on the earlier to occur of the termination of employment or a change of control of EFH Corp. There is no established public market for our common stock and the most recent independent third-party valuation of our common stock occurred in December 2012. Given the Bankruptcy Filing, our common stock was deemed to have de minimis value as of April 29, 2014. The amount reported as "Aggregate Balance at Last FYE" for Ms. Doré also includes the portion of the Additional 2015 LTI Award based on 2013 management EBITDA. |
Potential Payments upon Termination or Change in Control
The tables and narrative below provide information for payments to each of the Named Executive Officers (or, as applicable, enhancements to payments or benefits) in the event of his or her termination, including if such termination is voluntary, for cause, as a result of death, as a result of disability, without cause or for good reason or without cause or for good reason in connection with a change in control.
The information in the tables below is presented assuming termination of employment as of December 31, 2014.
Employment Arrangements with Contingent Payments
As of December 31, 2014, each of Messrs. Young, Keglevic, Burke and McFarland and Ms. Doré had employment agreements with change in control and severance provisions. As of the date of the filing of this Form 10-K, none of the employment agreements with our Named Executive Officers has been assumed by the Debtors in connection with the Bankruptcy Cases. However, the Bankruptcy Court has authorized certain payments contemplated by such agreements for 2014 and 2015.
With respect to each Named Executive Officer's employment agreement, a change in control is generally defined as (i) a transaction that results in a sale of substantially all of our assets or capital stock to another person who is not an affiliate of any member of the Sponsor Group and such person having more seats on our Board than the Sponsor Group, (ii) a transaction that results in a person not in the Sponsor Group owning more than 50% of our common stock and such person having more seats on our Board than the Sponsor Group or (iii) a transaction that results in the Sponsor Group owning less than 20% of our common stock and the Sponsor Group not being able to appoint a majority of the directors to our Board.
Each Named Executive Officer's employment agreement includes customary non-compete and non-solicitation provisions that generally restrict the Named Executive Officer's ability to compete with us or solicit our customers or employees for his or her own personal benefit during the term of the employment agreement and 24 months (with respect to Mr. Young) or 18 months (with respect to Messrs. Keglevic, Burke and McFarland and Ms. Doré) after the employment agreement expires or is terminated.
Each of our Named Executive Officers has been granted long-term cash incentive awards, including the 2015 LTI Award (and the Additional 2015 LTI Award with respect to Ms. Doré) and the Annual Supplemental Award, as more fully described above in "Supplemental Incentive." In the event of such Named Executive Officer's termination without cause, resignation for good reason or termination due to death or disability (or in certain circumstances when the Named Executive Officer's employment term is not extended) the 2015 LTI Award (and the Additional 2015 LTI Award with respect to Ms. Doré) will vest and become payable, to the extent earned, on a pro-rated basis. In the event of termination without cause or resignation for good reason following a change in control of EFH Corp., the 2015 LTI Award (and the Additional 2015 LTI Award with respect to Ms. Doré) will vest and become payable, to the extent earned, on the same pro-rata basis; however, the pro-rata calculation will include the actual management EBITDA for any earned, but unpaid, fiscal years prior to termination and the target level of management EBITDA, for those periods without regard to the actual achievement of management EBITDA, for any subsequent applicable years.
Mr. Burke is entitled to receive 443,474 shares of EFH Corp. common stock pursuant to the terms of his deferred share agreement, on the earlier to occur of his termination for any reason or a change in control of EFH Corp.
Excise Tax Gross-Ups
Pursuant to their employment agreements, if any of our Named Executive Officers is subject to the imposition of the excise tax imposed by Section 4999 of the Code, related to the executive's employment, but the imposition of such tax could be avoided by approval of our shareholders as described in Section 280G(b)(5)(B) of the Code, then such executive may cause EFH Corp. to seek such approval, in which case EFH Corp. will use its reasonable best efforts to cause such approval to be obtained and such executive will cooperate and execute such waivers as may be necessary so that such approval avoids imposition of any excise tax under Section 4999. If such executive fails to cause EFH Corp. to seek such approval or fails to cooperate and execute the waivers necessary in the approval process, such executive shall not be entitled to any gross-up payment for any resulting tax under Section 4999. Because we believe the shareholder approval exception to such excise tax will apply, the tables below do not reflect any amounts for such gross-up payments.
1. Mr. Young
Potential Payments to Mr. Young upon Termination as of December 31, 2014 (per employment agreement and restricted stock agreements, each in effect as of December 31, 2014)
|
| | | | | | | | | | | | | | | | | | | | | | | |
| Benefit | Voluntary | | For Cause | | Death | | Disability | | Without Cause Or For Good Reason | | Without Cause Or For Good Reason In Connection With Change in Control |
| Cash Severance | — |
| | — |
| | — |
| | — |
| | $ | 5,737,500 |
| | $ | 9,112,500 |
|
Supplemental Retirement Benefit(1) | — |
| | — |
| | $ | 3,000,000 |
| | $ | 3,000,000 |
| | $ | 3,000,000 |
| | $ | 3,000,000 |
|
| EAIP | $ | 2,094,019 |
| | $ | 2,094,019 |
| | $ | 2,094,019 |
| | $ | 2,094,019 |
| | — |
| | — |
|
| 2015 LTI Award | — |
| | — |
| | $ | 8,100,000 |
| | $ | 8,100,000 |
| | $ | 8,100,000 |
| | $ | 8,100,000 |
|
LTI Equity Incentive Award(2): | | | | | | | | | | | |
| - Annual RSUs | — |
| | — |
| | — |
| | — |
| | — |
| | — |
|
| - Exchange RSUs | — |
| | — |
| | — |
| | — |
| | — |
| | — |
|
| Health & Welfare: | | | | | | | | | | | |
| - Medical/COBRA | — |
| | — |
| | — |
| | — |
| | $ | 35,953 |
| | $ | 35,953 |
|
| - Dental/COBRA | — |
| | — |
| | — |
| | — |
| | $ | 3,088 |
| | $ | 3,088 |
|
| Totals | $ | 2,094,019 |
| | $ | 2,094,019 |
| | $ | 13,194,019 |
| | $ | 13,194,019 |
| | $ | 16,876,541 |
| | $ | 20,251,541 |
|
____________
| |
| (1) | The purchase of this single premium annuity contract requires Bankruptcy Court approval, but we have not sought or obtained this approval. |
| |
| (2) | The issuance of the shares underlying these RSUs would require Bankruptcy Court approval, but we have not sought or obtained this approval. There is no established public market for our common stock and the most recent independent third-party valuation of our common stock occurred in December 2012. Given the Bankruptcy Filing, our common stock was deemed to have de minimis value as of April 29, 2014. |
Mr. Young has entered into an employment agreement that provides for certain payments and benefits upon the expiration or termination of the agreement under the following circumstances:
| |
| 1. | In the event of Mr. Young's voluntary resignation without good reason or termination with cause: |
| |
| a. | accrued but unpaid base salary and unused vacation earned through the date of termination; |
| |
| b. | accrued but unpaid annual bonus earned under the EAIP for the previously completed year; |
| |
| c. | unreimbursed business expenses; and |
| |
| d. | payment of employee benefits, including equity compensation, if any, to which Mr. Young may be entitled. |
| |
| 2. | In the event of Mr. Young's death or disability: |
| |
| a. | a prorated annual incentive bonus earned under the EAIP for the year of termination; |
| |
| b. | value of supplemental retirement benefit for Mr. Young, payment of which would commence on December 31, 2014; |
| |
| f. | payment of employee benefits, including equity compensation, if any, to which Mr. Young may be entitled. |
| |
| 3. | In the event of Mr. Young's termination without cause or resignation for good reason: |
| |
| a. | a lump sum payment equal to (i) three times his annualized base salary and (ii) a prorated annual incentive bonus earned under the EAIP for the year of termination; |
| |
| b. | value of supplemental retirement benefit for Mr. Young, payment of which would commence on December 31, 2014; |
| |
| f. | payment of employee benefits, including equity compensation, if any, to which Mr. Young may be entitled; and |
| |
| g. | certain continuing health care and company benefits. |
| |
| 4. | In the event of Mr. Young's termination without cause or resignation for good reason within 24 months following a change in control of EFH Corp.: |
| |
| a. | a lump sum payment equal to three times the sum of (i) his annualized base salary and (ii) his annual bonus target under the EAIP; |
| |
| b. | value of supplemental retirement benefit for Mr. Young, payment of which would commence on December 31, 2014; |
| |
| f. | payment of employee benefits, including equity compensation, if any, to which Mr. Young may be entitled; and |
| |
| g. | certain continuing health care and company benefits. |
2. Mr. Keglevic
Potential Payments to Mr. Keglevic upon Termination as of December 31, 2014 (per employment agreement and restricted stock unit agreements, each in effect as of December 31, 2014)
|
| | | | | | | | | | | | | | | | | | | | | | | |
| Benefit | Voluntary | | For Cause | | Death | | Disability | | Without Cause Or For Good Reason | | Without Cause Or For Good Reason In Connection With Change in Control |
| Cash Severance | — |
| | — |
| | — |
| | — |
| | $ | 2,094,750 |
| | $ | 2,719,500 |
|
| EAIP | $ | 791,433 |
| | $ | 791,433 |
| | $ | 791,433 |
| | $ | 791,433 |
| | — |
| | — |
|
| 2015 LTI Award | — |
| | $ | — |
| | $ | 3,000,000 |
| | $ | 3,000,000 |
| | $ | 3,000,000 |
| | $ | 3,000,000 |
|
LTI Equity Incentive Award(1): | | | | | | | | | | | |
| - Annual RSUs | — |
| | — |
| | — |
| | — |
| | — |
| | — |
|
| - Exchange RSUs | — |
| | — |
| | — |
| | — |
| | — |
| | — |
|
| Health & Welfare | | | | | | | | | | | |
| - Dental/COBRA | — |
| | — |
| | — |
| | — |
| | $ | 2,470 |
| | $ | 2,470 |
|
| Totals | $ | 791,433 |
| | $ | 791,433 |
| | $ | 3,791,433 |
| | $ | 3,791,433 |
| | $ | 5,097,220 |
| | $ | 5,721,970 |
|
____________
| |
| (1) | The issuance of the shares underlying these RSUs would require Bankruptcy Court approval, and we have not sought or obtained this approval. There is no established public market for our common stock and the most recent independent third-party valuation of our common stock occurred in December 2012. Given the Bankruptcy Filing, our common stock was deemed to have de minimis value as of April 29, 2014. |
Mr. Keglevic has entered into an employment agreement that provides for certain payments and benefits upon the expiration or termination of the agreement under the following circumstances:
| |
| 1. | In the event of Mr. Keglevic's voluntary resignation without good reason or termination with cause: |
| |
| a. | accrued but unpaid base salary and unused vacation earned through the date of termination; |
| |
| b. | accrued but unpaid annual bonus earned under the EAIP for the previously completed year; |
| |
| c. | unreimbursed business expenses; and |
| |
| d. | payment of employee benefits, including equity compensation, if any, to which Mr. Keglevic may be entitled. |
| |
| 2. | In the event of Mr. Keglevic's death or disability: |
| |
| a. | a prorated annual incentive bonus for the year of termination; |
| |
| e. | payment of employee benefits, including stock compensation, if any, to which Mr. Keglevic may be entitled. |
| |
| 3. | In the event of Mr. Keglevic's termination without cause or resignation for good reason: |
| |
| a. | a lump sum payment equal to (i) two times his annualized base salary and (ii) a prorated annual incentive bonus earned under the EAIP for the year of termination; |
| |
| e. | payment of employee benefits, including stock compensation, if any, to which Mr. Keglevic may be entitled; and |
| |
| f. | certain continuing health care and company benefits. |
| |
| 4. | In the event of Mr. Keglevic's termination without cause or resignation for good reason within 24 months following a change in control of EFH Corp.: |
| |
| a. | a lump sum payment equal to two times the sum of (i) his annualized base salary and (ii) his annual bonus target under the EAIP; |
| |
| e. | payment of employee benefits, including stock compensation, if any, to which Mr. Keglevic may be entitled; and |
| |
| f. | certain continuing health care and company benefits. |
3. Mr. Burke
Potential Payments to Mr. Burke upon Termination as of December 31, 2014 (per employment agreement, deferred share agreement and restricted stock unit agreements, each in effect as of December 31, 2014)
|
| | | | | | | | | | | | | | | | | | | | | | | |
| Benefit | Voluntary | | For Cause | | Death | | Disability | | Without Cause Or For Good Reason | | Without Cause Or For Good Reason In Connection With Change in Control |
| Cash Severance | — |
| | — |
| | — |
| | — |
| | $ | 1,923,750 |
| | $ | 2,497,500 |
|
Distribution of Deferred Shares(1) | — |
| | — |
| | — |
| | — |
| | — |
| | — |
|
| EAIP | $ | 685,803 |
| | $ | 685,803 |
| | $ | 685,803 |
| | $ | 685,803 |
| | — |
| | — |
|
| 2015 LTI Award | — |
| | — |
| | $ | 3,000,000 |
| | $ | 3,000,000 |
| | $ | 3,000,000 |
| | $ | 3,000,000 |
|
LTI Equity Incentive Award(2): | | | | | | | | | | | |
| - Annual RSUs | — |
| | — |
| | — |
| | — |
| | — |
| | — |
|
| - Exchange RSUs | — |
| | — |
| | — |
| | — |
| | — |
| | — |
|
| Health & Welfare | | | | | | | | | | | |
| - Medical/COBRA | — |
| | — |
| | — |
| | — |
| | $ | 39,376 |
| | $ | 39,376 |
|
| - Dental/COBRA | — |
| | — |
| | — |
| | — |
| | $ | 2,470 |
| | $ | 2,470 |
|
| Totals | $ | 685,803 |
| | $ | 685,803 |
| | $ | 3,685,803 |
| | $ | 3,685,803 |
| | $ | 4,965,596 |
| | $ | 5,539,346 |
|
_______________
| |
| (1) | The amount reported under the heading "Distribution of Deferred Shares" represents the 443,474 shares of EFH Corp. common stock as of December 31, 2014 that Mr. Burke is entitled to receive, pursuant to the terms of his deferred share agreement, on the earlier to occur of his termination of employment for any reason or a change in the control of EFH Corp. There is no established public market for our common stock and the most recent independent third-party valuation of our common stock occurred in December 2012. Given the Bankruptcy Filing, our common stock was deemed to have de minimis value as of April 29, 2014. |
| |
| (2) | The issuance of the shares underlying these RSUs would require Bankruptcy Court approval, and we have not sought or obtained this approval. There is no established public market for our common stock and the most recent independent third-party valuation of our common stock occurred in December 2012. |
Mr. Burke has entered into an employment agreement that provides for certain payments and benefits upon the expiration or termination of the agreement under the following circumstances.
| |
| 1. | In the event of Mr. Burke's voluntary resignation without good reason or termination with cause: |
| |
| a. | accrued but unpaid base salary and unused vacation earned through the date of termination; |
| |
| b. | accrued but unpaid annual bonus earned under the EAIP for the previously completed year; |
| |
| c. | unreimbursed business expenses; and |
| |
| d. | payment of employee benefits, including equity compensation, if any, to which Mr. Burke may be entitled. |
| |
| 2. | In the event of Mr. Burke's death or disability: |
| |
| a. | a prorated annual incentive bonus earned under the EAIP for the year of termination; |
| |
| e. | payment of employee benefits, including stock compensation, if any, to which Mr. Burke may be entitled. |
| |
| 3. | In the event of Mr. Burke's termination without cause or resignation for good reason: |
| |
| a. | a lump sum payment equal to (i) two times his annualized base salary and (ii) a prorated annual incentive bonus earned under the EAIP for the year of termination; |
| |
| e. | payment of employee benefits, including stock compensation, if any, to which Mr. Burke may be entitled; and |
| |
| f. | certain continuing health care and company benefits. |
| |
| 4. | In the event of Mr. Burke's termination without cause or resignation for good reason within 24 months following a change in control of EFH Corp.: |
| |
| a. | a lump sum payment equal to two times the sum of (i) his annualized base salary and (ii) his annual bonus target under the EAIP; |
| |
| e. | payment of employee benefits, including stock compensation, if any, to which Mr. Burke may be entitled; and |
| |
| f. | certain continuing health care and company benefits. |
4. Ms. Doré
Potential Payments to Ms. Doré upon Termination as of December 31, 2014 (per employment agreement and restricted stock agreements, each in effect as of December 31, 2014)
|
| | | | | | | | | | | | | | | | | | | | | | | |
| Benefit | Voluntary | | For Cause | | Death | | Disability | | Without Cause Or For Good Reason | | Without Cause Or For Good Reason In Connection With Change in Control |
| Cash Severance | — |
| | — |
| | — |
| | — |
| | $ | 1,710,000 |
| | $ | 2,220,000 |
|
| EAIP | $ | 646,068 |
| | $ | 646,068 |
| | $ | 646,068 |
| | $ | 646,068 |
| | — |
| | — |
|
| 2015 LTI Award | — |
| | — |
| | $ | 1,300,000 |
| | $ | 1,300,000 |
| | $ | 1,300,000 |
| | $ | 1,300,000 |
|
| Additional 2015 LTI Award | — |
| | — |
| | $ | 1,200,000 |
| | $ | 1,200,000 |
| | $ | 1,200,000 |
| | $ | 1,200,000 |
|
LTI Equity Incentive Award(1): | | | | | | | | | | | |
| - Annual RSUs | — |
| | — |
| | — |
| | — |
| | — |
| | — |
|
| - Exchange RSUs | — |
| | — |
| | — |
| | — |
| | — |
| | — |
|
| Health & Welfare | | | | | | | | | | | |
| - Medical/COBRA | — |
| | — |
| | — |
| | — |
| | $ | 39,376 |
| | $ | 39,376 |
|
| - Dental/COBRA | — |
| | — |
| | — |
| | — |
| | $ | 2,470 |
| | $ | 2,470 |
|
| Totals | $ | 646,068 |
| | $ | 646,068 |
| | $ | 3,146,068 |
| | $ | 3,146,068 |
| | $ | 4,251,846 |
| | $ | 4,761,846 |
|
_______________
| |
| (1) | The issuance of the shares underlying these RSUs would require Bankruptcy Court approval, and we have not sought or obtained this approval. There is no established public market for our common stock and the most recent independent third-party valuation of our common stock occurred in December 2012. Given the Bankruptcy Filing, our common stock was deemed to have de minimis value as of April 29, 2014. |
Ms. Doré has entered into an employment agreement that provides for certain payments and benefits upon the expiration or termination of the agreement under the following circumstances.
| |
| 1. | In the event of Ms. Doré's voluntary resignation without good reason or termination with cause: |
| |
| a. | accrued but unpaid base salary and unused vacation earned through the date of termination; |
| |
| b. | accrued but unpaid annual bonus earned under the EAIP for the previously completed year; |
| |
| c. | unreimbursed business expenses; and |
| |
| d. | payment of employee benefits, including equity compensation, if any, to which Ms. Doré may be entitled. |
| |
| 2. | In the event of Ms. Doré's death or disability: |
| |
| a. | a prorated annual incentive bonus earned under the EAIP for the year of termination; |
| |
| c. | the Additional 2015 LTI Award; |
| |
| f. | payment of employee benefits, including equity compensation, if any, to which Ms. Doré may be entitled. |
| |
| 3. | In the event of Ms. Doré's termination without cause or resignation for good reason: |
| |
| a. | a lump sum payment equal to (i) two times her annualized base salary and (ii) a prorated annual incentive bonus earned under the EAIP for the year of termination; |
| |
| c. | the Additional 2015 LTI Award; |
| |
| f. | payment of employee benefits, including equity compensation, if any, to which Ms. Doré may be entitled; and |
| |
| g. | certain continuing health care and company benefits. |
| |
| 4. | In the event of Ms. Doré's termination without cause or resignation for good reason within 24 months following a change in control of EFH Corp.: |
| |
| a. | a lump sum payment equal to two times the sum of (i) her annualized base salary and (ii) her annual bonus target under the EAIP; |
| |
| c. | the Additional 2015 LTI Award; |
| |
| f. | payment of employee benefits, including equity compensation, if any, to which Ms. Doré may be entitled; and |
| |
| g. | certain continuing health care and company benefits. |
5. Mr. McFarland
Potential Payments to Mr. McFarland upon Termination as of December 31, 2014 (per employment agreement and restricted stock unit agreements, each in effect as of December 31, 2014)
|
| | | | | | | | | | | | | | | | | | | | | | | |
| Benefit | Voluntary | | For Cause | | Death | | Disability | | Without Cause Or For Good Reason | | Without Cause Or For Good Reason In Connection With Change in Control |
| Cash Severance | — |
| | — |
| | — |
| | — |
| | $ | 1,923,750 |
| | $ | 2,497,500 |
|
| EAIP | $ | 678,459 |
| | $ | 678,459 |
| | $ | 678,459 |
| | $ | 678,459 |
| | — |
| | — |
|
| 2015 LTI Award: | — |
| | — |
| | $ | 3,000,000 |
| | $ | 3,000,000 |
| | $ | 3,000,000 |
| | $ | 3,000,000 |
|
LTI Equity Incentive Award(1): | | | | | | | | | | | |
| - Annual RSUs | — |
| | — |
| | — |
| | — |
| | — |
| | — |
|
| - Exchange RSUs | — |
| | — |
| | — |
| | — |
| | — |
| | — |
|
| Health & Welfare | | | | | | | | | | | |
| - Medical/COBRA | — |
| | — |
| | — |
| | — |
| | $ | 39,376 |
| | $ | 39,376 |
|
| - Dental/COBRA | — |
| | — |
| | — |
| | — |
| | $ | 2,470 |
| | $ | 2,470 |
|
| Totals | $ | 678,459 |
| | $ | 678,459 |
| | $ | 3,678,459 |
| | $ | 3,678,459 |
| | $ | 4,965,596 |
| | $ | 5,539,346 |
|
_______________
| |
| (1) | The issuance of the shares underlying these RSUs would require Bankruptcy Court approval, and we have not sought or obtained this approval. There is no established public market for our common stock and the most recent independent third-party valuation of our common stock occurred in December 2012. Given the Bankruptcy Filing, our common stock was deemed to have de minimis value as of April 29, 2014. |
Mr. McFarland entered into an employment agreement that provides for certain payments and benefits upon the expiration or termination of the agreement under the following circumstances:
| |
| 1. | In the event of Mr. McFarland's voluntary resignation without good reason or termination with cause: |
| |
| a. | accrued but unpaid base salary and unused vacation earned through the date of termination; |
| |
| b. | accrued but unpaid annual bonus earned under the EAIP for the previously completed year; |
| |
| c. | unreimbursed business expenses; and |
| |
| d. | payment of employee benefits, including equity compensation, if any, to which Mr. McFarland may be entitled. |
| |
| 2. | In the event of Mr. McFarland's death or disability: |
| |
| a. | a prorated annual incentive bonus earned under the EAIP for the year of termination; |
| |
| e. | payment of employee benefits, including stock compensation, if any, to which Mr. McFarland may be entitled. |
| |
| 3. | In the event of Mr. McFarland's termination without cause or resignation for good reason: |
| |
| a. | a lump sum payment equal to (i) two times his annualized base salary, (ii) a prorated annual incentive bonus under the EAIP for the year of termination; |
| |
| e. | payment of employee benefits, including stock compensation, if any, to which Mr. McFarland may be entitled; and |
| |
| f. | certain continuing health care and company benefits. |
| |
| 4. | In the event of Mr. McFarland's termination without cause or resignation for good reason within 24 months following a change in control of EFH Corp.: |
| |
| a. | a lump sum payment equal to two times the sum of (i) his annualized base salary and (ii) his annual bonus target under the EAIP ; |
| |
| e. | payment of employee benefits, including stock compensation, if any, to which Mr. McFarland may be entitled; and |
| |
| f. | certain continuing health care and company benefits. |
Compensation Committee Interlocks and Insider Participation
There are no relationships among our executive officers, members of the O&C Committee or entities whose executives served on the O&C Committee that required disclosure under applicable SEC rules and regulations. For a description of related person transactions involving members of the O&C Committee, see Item 13, entitled "Related Person Transactions."
Director Compensation
The table below sets forth information regarding the aggregate compensation paid to the members of the Board during the year ended December 31, 2014. Directors who are officers of EFH Corp. (other than our Executive Chairman or members of the Sponsor Group (or their respective affiliates) do not receive any fees for service as a director. EFH Corp. reimburses directors for reasonable expenses incurred in connection with their services as directors. In March 2014, given the then likely bankruptcy filing, the Board terminated its annual equity grant program for non-employee and non-Sponsor directors.
|
| | | | | | | | |
| Name | Fees Earned or Paid in Cash ($) | | All Other Compensation ($) | | Total ($) |
| Arcilia C. Acosta | 200,000 |
| | — |
| | 200,000 |
|
| David Bonderman | — |
| | — |
| | — |
|
| Donald L. Evans (1) | — |
| | 2,600,000 |
| | 2,600,000 |
|
| Thomas D. Ferguson | — |
| | — |
| | — |
|
| Brandon Freiman | — |
| | — |
| | — |
|
| Scott Lebovitz | — |
| | — |
| | — |
|
| Marc S. Lipschultz (2) | — |
| | — |
| | — |
|
| Michael MacDougall | — |
| | — |
| | — |
|
| Kenneth Pontarelli | — |
| | — |
| | — |
|
| William K. Reilly | 200,000 |
| | — |
| | 200,000 |
|
| Jonathan D. Smidt | — |
| | — |
| | — |
|
| Billie I. Williamson (3) | 200,000 |
| | | | 200,000 |
|
| John F. Young | — |
| | — |
| | — |
|
| Kneeland Youngblood | 200,000 |
| | — |
| | 200,000 |
|
______________
| |
| (1) | In March 2013, we entered into an Employment Agreement with Mr. Evans, pursuant to which Mr. Evans receives an annual base salary of $2,500,000 for his service as Executive Chairman of the Board. Under the terms of the agreement, Mr. Evans also receives a payment by EFH Corp. of (a) $100,000 annually for office expenses and administrative support, (b) up to $200,000 annually in salary payments to a chief of staff, and (c) executive assistant services in Dallas and Midland, Texas. In April 2014, we entered into an Amended and Restated Employment Agreement, with Mr. Evans, effective March 6, 2013, to extend the initial term of his employment from December 31, 2015 to December 31, 2016 and reflect certain changes in his involvement as a director with other non-affiliated organizations. At December 31, 2014, Mr. Evans had 3,900,000 vested and 1,100,000 non-vested options to purchase common shares of EFH Corp for $0.50 per share. |
| |
| (2) | Mr. Lipschultz resigned from the Board effective January 17, 2014. |
| |
| (3) | In recognition of the additional responsibilities Ms. Williamson has been performing, and will continue to perform, in her role as a disinterested director of EFH Corp., in February 2015, we agreed to pay her an additional $7,500 per day for days substantially spent on matters related to the Company's restructuring. |
| |
| Item 12. | SECURITY OWNERSHIP OF CERTAIN BENEFICIAL OWNERS AND MANAGEMENT AND RELATED STOCKHOLDER MATTERS |
The following table presents information concerning stock-based compensation plans as of December 31, 2014. (See Note 18 to Financial Statements.)
|
| | | | | | | | | |
| | (a) Number of securities to be issued upon exercise of outstanding options, warrants and rights(1) | | (b) Weighted-average exercise price of outstanding options, warrants and
rights(2) | | (c) Number of securities remaining available for future issuance under equity compensation plans, excluding securities reflected in column (a) |
| Equity compensation plans approved by security holders | — |
| | $ | — |
| | — |
|
Equity compensation plans not approved by security holders(3) | 36,314,292 |
| | $ | 1.85 |
| | 31,997,449 |
|
| Total | 36,314,292 |
| | $ | 1.85 |
| | 31,997,449 |
|
____________
| |
| (1) | Includes 19.6 million restricted stock units issued in exchange for previously issued stock options. |
| |
| (2) | The weighted average exercise price does not take into account the shares subject to outstanding restricted stock units which have no exercise price. |
| |
| (3) | See Note 18 to Financial Statements for a description of the material features of equity compensation plans. |
Beneficial Ownership of Common Stock of Energy Future Holdings Corp.
The following table lists the number of shares of common stock of EFH Corp. beneficially owned by each director and certain executive officers of EFH Corp. and the holders of more than 5% of EFH Corp.'s common stock as of March 1, 2015.
The amounts and percentages of shares of common stock of EFH Corp. beneficially owned are reported on the basis of SEC regulations governing the determination of beneficial ownership of securities. Under SEC rules, a person is deemed to be a "beneficial owner" of a security if that person has or shares voting power or investment power, which includes the power to dispose of or to direct the disposition of such security. A person is also deemed to be a beneficial owner of any securities of which that person has a right to acquire beneficial ownership within 60 days. Securities that can be so acquired are deemed to be outstanding for purposes of computing such person's ownership percentage, but not for purposes of computing any other person's percentage. Under these rules, more than one person may be deemed to be a beneficial owner of the same securities, and a person may be deemed to be a beneficial owner of securities as to which such person has no economic interest.
|
| | | | | |
| Name | Number of Shares Beneficially Owned | | Percent of Class |
| Texas Holdings (1)(2)(3)(4) | 1,657,600,000 |
| | 99.073 | % |
| Arcilia C. Acosta (6) | 486,029 |
| | * |
|
| David Bonderman (2) | 1,657,600,000 |
| | 99.073 | % |
| Donald L. Evans (7) | 4,300,000 |
| | * |
|
| Thomas D. Ferguson (3) | 1,657,600,000 |
| | 99.073 | % |
| Brandon Freiman (5) | — |
| | — | % |
| Scott Lebovitz (3) | 1,657,600,000 |
| | 99.073 | % |
| Michael MacDougall (8) | — |
| | — | % |
| Kenneth Pontarelli (3) | 1,657,600,000 |
| | 99.073 | % |
| William K. Reilly (9) | 616,029 |
| | * |
|
| Jonathan D. Smidt (5) | — |
| | — | % |
| Billie I. Williamson | 250,000 |
| | * |
|
| John F. Young | 1,021,222 |
| | * |
|
| Kneeland Youngblood (11) | 556,029 |
| | * |
|
| James A. Burke (10) | 443,474 |
| | * |
|
| M. A. McFarland | — |
| | — | % |
| Stacey H. Doré | — |
| | — | % |
| Paul M. Keglevic | — |
| | — | % |
| All directors and current executive officers as a group (19 persons) | 1,664,172,783 |
| | 99.466 | % |
___________
* Less than 1%.
| |
| (1) | Texas Holdings beneficially owns 1,657,600,000 shares of EFH Corp. The sole general partner of Texas Holdings is Texas Energy Future Capital Holdings LLC ("Texas Capital"), which, pursuant to the Amended and Restated Limited Partnership Agreement of Texas Holdings, has the right to vote all of the EFH Corp. shares owned by Texas Holdings. The TPG Funds, the Goldman Entities and the KKR Entities (each as defined below, and collectively, the "Texas Capital Funds") collectively own 91.08% of the outstanding units of Texas Capital. The Texas Capital Funds exercise control over Texas Capital, and each has the right to designate and remove the managers of Texas Capital appointed by such Texas Capital Fund. Because of these relationships, each of the Texas Capital Funds may be deemed to have beneficial ownership of the shares of EFH Corp. held by Texas Holdings, but each disclaims beneficial ownership of such shares. The address of both Texas Holdings and Texas Capital is 301 Commerce Street, Suite 3300, Fort Worth, Texas 76102. |
| |
| (2) | The TPG Funds (as defined below) beneficially own 302,923,439.752 units of Texas Capital, representing 27.01% of the outstanding units, including (i) 271,639,218.931 units held by TPG Partners V, L.P., a Delaware limited partnership ("TPG Partners V"), whose general partner is TPG GenPar V, L.P., a Delaware limited partnership ("TPG GenPar V"), whose general partner is TPG GenPar V Advisors, LLC, a Delaware limited liability company, whose sole member is TPG Holdings I, L.P., a Delaware limited partnership ("TPG Holdings"), (ii) 29,999,994.650 units held by TPG Partners IV, L.P., a Delaware limited partnership ("TPG Partners IV"), whose general partner is TPG GenPar IV, L.P., a Delaware limited partnership, whose general partner is TPG GenPar IV Advisors, LLC, a Delaware limited liability company, whose sole member is TPG Holdings, (iii) 710,942.673 units held by TPG FOF V-A, L.P., a Delaware limited partnership (“TPG FOF A”), whose general partner is TPG GenPar V and (iv) 573,283.498 units held by TPG FOF V-B, L.P., a Delaware limited partnership ("TPG FOF B" and, together with TPG Partners V, TPG Partners IV and TPG FOF A, the "TPG Funds"), whose general partner is TPG GenPar V. The general partner of TPG Holdings is TPG Holdings I-A, LLC, a Delaware limited liability company, whose sole member is TPG Group Holdings (SBS), L.P., a Delaware limited partnership, whose general partner is TPG Group Holdings (SBS) Advisors, Inc., a Delaware corporation ("Group Advisors"). David Bonderman and James G. Coulter are officers and sole shareholders of Group Advisors and may therefore be deemed to beneficially own the units held by the TPG Funds. David Bonderman is also a manager of Texas Capital. Messrs. Bonderman and Coulter disclaim beneficial ownership of the shares of EFH Corp. held by Texas Holdings except to the extent of their pecuniary interest therein. The address of Group Advisors and Messrs. Bonderman and Coulter is c/o TPG Capital, L.P., 301 Commerce Street, Suite 3300, Fort Worth, Texas 76102. |
| |
| (3) | GS Capital Partners VI Fund, L.P., GSCP VI Offshore TXU Holdings, L.P., GSCP VI Germany TXU Holdings, L.P., GS Capital Partners VI Parallel, L.P., GS Global Infrastructure Partners I, L.P., GS Infrastructure Offshore TXU Holdings, L.P. (GSIP International Fund), GS Institutional Infrastructure Partners I, L.P., Goldman Sachs TXU Investors L.P. and Goldman Sachs TXU Investors Offshore Holdings, L.P. (collectively, the "Goldman Entities") beneficially own 303,049,945.954 units of Texas Capital, representing 27.02% of the outstanding units. Affiliates of The Goldman Sachs Group, Inc. ("Goldman Sachs") are the general partner, managing general partner or investment manager of each of the Goldman Entities, and each of the Goldman Entities shares voting and investment power with certain of their respective affiliates. Each of Goldman Sachs and the Goldman Entities disclaims beneficial ownership of such shares of common stock except to the extent of its pecuniary interest therein. Messrs. Ferguson, Lebovitz and Pontarelli are managers of Texas Capital and executives with affiliates of Goldman Sachs. By virtue of their position in relation to Texas Capital and the Goldman Entities, Messrs. Ferguson, Lebovitz and Pontarelli may be deemed to have beneficial ownership with respect to the units of Texas Capital held by the Goldman Entities. Each of Messrs. Ferguson, Lebovitz and Pontarelli disclaims beneficial ownership of the shares of EFH Corp. held by Texas Holdings except to the extent of their pecuniary interest in those shares. The address of each entity and individual listed in this footnote is c/o Goldman, Sachs & Co., 85 Broad Street, New York, New York 10004. |
| |
| (4) | KKR 2006 Fund L.P., KKR PEI Investments, L.P., KKR Partners III, L.P., KKR North American Co-Invest Fund I L.P., KKR Reference Fund Investments L.P. and TEF TFO Co-Invest, LP (collectively, the "KKR Entities") beneficially own 415,473,419.680 units of Texas Capital, representing 37.05% of the outstanding units. The KKR Entities disclaim beneficial ownership of any shares of our common stock in which they do not have a pecuniary interest. KKR & Co. L.P., as the holding company of affiliates that directly or indirectly control the KKR Entities, other than KKR Partners III, LP., may be deemed to share voting and dispositive power with respect to the shares beneficially owned by such KKR Entities, but disclaims beneficial ownership of such shares except to the extent of its pecuniary interest in those shares. As the designated members of KKR Management LLC (which is the general partner of KKR & Co. L.P.) and the managing members of KKR III GP LLC (which is the general partner of KKR Partners III, L.P.), Henry R. Kravis and George R. Roberts may be deemed to share voting and dispositive power with respect to the shares beneficially owned by the KKR Entities but disclaim beneficial ownership of such shares except to the extent of their pecuniary interest in those shares. The address of each entity and individual listed in this footnote is c/o Kohlberg Kravis Roberts & Co. L.P., 9 West 57th Street, Suite 4200, New York, New York 10019. |
| |
| (5) | Messrs. Freiman and Smidt are managers of Texas Capital and executives of Kohlberg Kravis Roberts & Co. L.P. and/or one or more of its affiliates. Neither Messrs. Freiman nor Smidt have voting or investment power over and each disclaim beneficial ownership of the units held by the KKR Entities and the shares of EFH Corp. held by Texas Holdings, except in each case to the extent of their pecuniary interest. The address of each individual listed in this footnote is c/o Kohlberg Kravis Roberts & Co. L.P., 9 West 57th Street, Suite 4200, New York, New York 10019. |
| |
| (6) | 70,000 shares held in a family limited partnership, ACA Family LP. |
| |
| (7) | Includes 3,900,000 shares issuable upon exercise of vested options. |
| |
| (8) | Michael MacDougall is a TPG partner. Mr. MacDougall is a manager of Texas Capital. Mr. MacDougall does not have voting or investment power over and disclaims beneficial ownership of the units of Texas Capital held by the TPG Funds and the shares of EFH Corp. held by Texas Holdings. The address of Mr. MacDougall is c/o Global, LLC, 301 Commerce Street, Suite 3300, Fort Worth, TX 76102. |
| |
| (9) | William K. Reilly is a TPG senior advisor. Mr. Reilly does not have voting or investment power over and disclaims beneficial ownership of the units of Texas Capital held by the TPG Funds. The address of Mr. Reilly is c/o Global, LLC, 301 Commerce Street, Suite 3300, Fort Worth, TX 76102. |
| |
| (10) | Shares consist of 443,474 vested deferred shares which, in accordance with the terms of the Deferred Share Agreement, will be settled in shares of EFH Corp. common stock upon the earlier of termination of employment or a change in control of EFH Corp. |
| |
| (11) | 100,000 shares held in a limited partnership, Burton Hills Limited, LP. |
| |
| Item 13. | CERTAIN RELATIONSHIPS AND RELATED TRANSACTIONS, AND DIRECTOR INDEPENDENCE |
Policies and Procedures Relating to Related Party Transactions
The Board has adopted a related person transactions policy. Under this policy, a related person transaction shall be consummated or shall continue only if:
| |
| 1. | the Audit Committee of the Board approves or ratifies such transaction in accordance with the policy and determines that the transaction is on terms comparable to those that could be obtained in arm's length dealings with an unrelated third party; |
| |
| 2. | the transaction is approved by the disinterested members of the Board or the Executive Committee; or |
| |
| 3. | the transaction involves compensation approved by the Organization and Compensation Committee of the Board. |
For purposes of this policy, the term "related person" includes EFH Corp.'s directors, executive officers, 5% shareholders and their immediate family members. "Immediate family members" means any child, stepchild, parent, stepparent, spouse, sibling, mother-in-law, father-in-law, son-in-law, daughter-in-law, brother-in-law or sister-in-law or any person (other than a tenant or employee) sharing the household of a director, executive officer or 5% shareholder.
A "related person transaction" is a transaction between EFH Corp. or its subsidiaries and a related person, other than the types of transactions described below, which are deemed to be pre-approved by the Audit Committee of the Board:
| |
| 1. | any compensation paid to a director if the compensation is required to be reported under Item 402 of Regulation S-K of the Securities Act; |
| |
| 2. | any transaction with another company at which a related person's only relationship is as an employee (other than an executive officer), director or beneficial owner of less than 10% of that company's ownership interests; |
| |
| 3. | any charitable contribution, grant or endowment by EFH Corp. to a charitable organization, foundation or university at which a related person's only relationship is as an employee (other than an executive officer) or director; |
| |
| 4. | transactions where the related person's interest arises solely from the ownership of EFH Corp.'s equity securities and all holders of that class of equity securities received the same benefit on a pro rata basis; |
| |
| 5. | transactions involving a related party where the rates or charges involved are determined by competitive bids; |
| |
| 6. | any transaction with a related party involving the rendering of services as a common or contract carrier, or public utility, as rates or charges fixed in conformity with law or governmental authority; |
| |
| 7. | any transaction with a related party involving services as a bank depositary of funds, transfer agent, registrar, trustee under a trust indenture, or similar service; |
| |
| 8. | transactions available to all employees or customers generally (unless required to be disclosed under Item 404 of Regulation S-K of the Securities Act, if applicable); |
| |
| 9. | transactions involving less than $100,000 when aggregated with all similar transactions; |
| |
| 10. | transactions between EFH Corp. and its subsidiaries or between subsidiaries of EFH Corp.; |
| |
| 11. | transactions not required to be disclosed under Item 404 of Regulation S-K under the Securities Act of 1933, and |
| |
| 12. | open market purchases of EFH Corp.'s or its subsidiaries' debt or equity securities and interest payments on such debt. |
The Board has determined that it is appropriate for the Audit Committee of the Board to review and approve or ratify related person transactions. Accordingly, at least annually, management reviews related person transactions to be entered into, or previously entered into, by EFH Corp. or its subsidiaries, if any. After review, the Audit Committee of the Board approves, ratifies or disapproves such transactions. Management updates the Audit Committee of the Board as to any material changes to such related person transactions. In unusual circumstances, EFH Corp. or its subsidiaries may enter into related person transactions in advance of receiving approval, provided that such related person transactions are reviewed as soon as reasonably practicable by the Audit Committee of the Board. If the Audit Committee of the Board determines not to ratify such transactions, EFH Corp. makes all reasonable efforts to cancel or otherwise terminate the affected transactions.
The related person transactions described below were either approved by the Board or its Executive Committee prior to the Board's adoption of this policy or were approved in accordance with this policy. Transactions described below under "Related Person Transactions - Transactions with Sponsor Affiliates" are not related person transactions under the EFH Corp. policy because they are not with a director, executive officer, 5% shareholder or any of their immediate family members, but are described in the interest of greater disclosure.
Related Person Transactions
Limited Partnership Agreement of Texas Energy Future Holdings Limited Partnership; Limited Liability Company Agreement of Texas Energy Future Capital Holdings LLC
The Sponsor Group and certain investors who agreed to co-invest with the Sponsor Group or through a vehicle jointly controlled by the Sponsor Group to provide equity financing for the Merger (Co-Investors) entered into (i) a limited partnership agreement (LP Agreement) in respect of EFH Corp.'s parent company, Texas Holdings and (ii) the LLC Agreement in respect of Texas Holdings' sole general partner, Texas Capital. The LP Agreement provides that Texas Capital has the right to vote or execute consents with respect to any shares of EFH Corp.'s common stock owned by Texas Holdings. The LLC Agreement and LP Agreement contain agreements among the parties with respect to the election of EFH Corp.'s directors, restrictions on the issuance or transfer of interests in EFH Corp., including tag-along rights and drag-along rights, and other corporate governance provisions (including the right to approve various corporate actions).
The LLC Agreement provides that Texas Capital and its members will take all action required to ensure that the managers of Texas Capital are also members of EFH Corp.'s Board. Pursuant to the LLC Agreement each of (i) KKR 2006 Fund L.P. and affiliated investment funds, (ii) TPG Partners V, L.P. and affiliated investment funds and (iii) certain funds affiliated with Goldman, Sachs & Co. (Goldman), an affiliate of GS Capital Partners, has the right to designate three managers of Texas Capital. These rights are subject to maintenance of certain investment levels in Texas Holdings.
Registration Rights Agreement
The Sponsor Group and the Co-Investors entered into a registration rights agreement with EFH Corp. upon completion of the Merger. Pursuant to this agreement, in certain circumstances, the Sponsor Group can cause EFH Corp. to register shares of EFH Corp.'s common stock owned directly or indirectly by them under the Securities Act. In certain circumstances, the Sponsor Group and the Co-Investors are also entitled to participate on a pro rata basis in any registration of EFH Corp.'s common stock under the Securities Act that it may undertake. Ms. Acosta and Messrs. Evans, Reilly and Youngblood, each of whom are members of our Board, and Messrs. Young, Burke, Keglevic, McFarland, and O'Brien, each of whom are executive officers of EFH Corp., are parties to this agreement.
Management Services Agreement
In October 2007, in connection with the Merger, the Sponsor Group and Lehman Brothers Inc. entered into a management agreement with EFH Corp. (Management Agreement), pursuant to which affiliates of the Sponsor Group provide management, consulting, financial and other advisory services to EFH Corp. Pursuant to the Management Agreement, affiliates of the Sponsor Group are entitled to receive an aggregate annual management fee of $35 million, which amount increases 2% annually, and reimbursement of out-of-pocket expenses incurred in connection with the provision of services pursuant to the Management Agreement. The Management Agreement will continue in effect from year to year, unless terminated upon a change of control of EFH Corp. or in connection with an initial public offering of EFH Corp. or if the parties thereto mutually agree to terminate the Management Agreement. In addition, the Management Agreement provides that the Sponsor Group will be entitled to receive a fee equal to a percentage of the gross transaction value in connection with certain subsequent financing, acquisition, disposition, merger combination and change of control transactions, as well as a termination fee based on the net present value of future payment obligations under the Management Agreement in the event of an initial public offering or under certain other circumstances. Beginning with the quarterly management fee due December 31, 2013, the Sponsor Group, while reserving the right to receive the fees, directed EFH Corp. to suspend payments of the management fees for an indefinite period, and no such management fees were paid to the Sponsor Group in 2014.
Indemnification Agreement
Concurrently with entering into the Management Agreement, the Sponsor Group, Texas Holdings and EFH Corp. entered into an indemnification agreement (Indemnification Agreement), pursuant to which EFH Corp. and Texas Holdings agree to indemnify the Sponsor Group and their affiliates against any claims relating to (i) certain securities and financing transactions relating to the Merger, (ii) the performance of transaction services pursuant to the Management Agreement, (iii) actions or failures to act by EFH Corp., Texas Holdings, Texas Capital or their subsidiaries or affiliates (collectively, Company Group), (iv) service as an officer or director of, or at the request of, any member of the Company Group, and (v) any breach or alleged breach of fiduciary duty as a director or officer of any member of the Company Group.
Sale Participation Agreement
Ms. Acosta and Messrs. Evans, Reilly and Youngblood, each of whom are members of our Board, and Mses. Doré and Kirby and Messrs. Young, Burke, Keglevic, McFarland, and O'Brien, each of whom are executive officers, entered into sale participation agreements with EFH Corp. Pursuant to the terms of these agreements, among other things, shares of EFH Corp.'s common stock held by these individuals are subject to tag-along and drag-along rights in the event of a sale by the Sponsor Group of shares of EFH Corp.'s common stock held by the Sponsor Group.
Certain Certificate of Formation Provisions
EFH Corp.'s restated certificate of formation contains provisions limiting our directors' obligations in respect of corporate opportunities.
Management Stockholders' Agreement
Subject to a management stockholders' agreement, certain members of management, including EFH Corp.'s directors, executive officers, along with other members of management, elected to invest in EFH Corp. by contributing cash or common stock, or a combination of both, to EFH Corp. prior to or following the Merger and receiving common stock in EFH Corp. in exchange therefore. The management stockholders' agreement creates certain rights and restrictions on these shares of common stock, including transfer restrictions and tag-along, drag-along, put, call and registration rights in certain circumstances.
Director Stockholders' Agreement
Certain members of our Board have entered into a stockholders' agreement with EFH Corp. These stockholders' agreements create certain rights and restrictions on the equity, including transfer restrictions and tag-along, drag-along, put, call and registration rights in certain circumstances.
Business Affiliation
Ms. Acosta, a member of our board and a member of each of our Audit Committee and Organization and Compensation Committee, is the owner, president and chief executive officer of Southwest Testing Laboratories, LLC, also known as STL Engineers. STL Engineers provides geotechnical engineering and construction materials testing services to Oncor. Since January 1, 2014, Oncor has paid STL Engineers approximately $138,000 for its services, which is also the amount of Ms. Acosta’s interest in the transaction. As discussed in Notes 1 and 3 to the Financial Statements, EFH Corp. and Oncor have implemented certain structural and operational ring-fencing measures. As a result of these ring-fencing measures, neither EFH Corp., EFIH nor Ms. Acosta has any influence over Oncor’s selection of suppliers. STL Engineers was selected as a supplier by Oncor in the ordinary course through its established procurement process.
Transactions with Sponsor Affiliates
TCEH has entered into the TCEH Senior Secured Facilities, and Oncor has entered into a revolving credit facility, each with syndicates of financial institutions and other lenders. These syndicates included affiliates of GS Capital Partners.
Affiliates of GS Capital Partners have from time to time engaged in commercial and investment banking and financial advisory transactions with EFH Corp. in the normal course of business. Affiliates of Goldman are party to certain commodity and interest rate hedging transactions with EFH Corp. in the normal course of business.
From time to time affiliates of the Sponsor Group may acquire debt or debt securities issued by EFH Corp. or its subsidiaries in open market transactions or through loan syndications.
Members of the Sponsor Group and/or their respective affiliates have from time to time entered into, and may continue to enter into, arrangements with the Company to use our products and services in the ordinary course of their business, which often result in revenues to the Company in excess of $120,000 annually. In addition, the Company has entered into, and may continue to enter into, arrangements with members of the Sponsor Group and/or their respective affiliates to use their products and services in the ordinary course of their business, which often result in revenues to members of the Sponsor Group or their respective affiliates in excess of $120,000 annually.
Director Independence
Though not formally considered by the Board because EFH Corp.'s common stock is not currently registered under the Securities Exchange Act of 1934, as amended, with the SEC or traded on any national securities exchange, based upon the listing standards for issuers of equity securities on the New York Stock Exchange (NYSE), the national securities exchange upon which EFH Corp.'s common stock was traded prior to the Merger, only Mses. Acosta and Williamson and Mr. Youngblood would be considered independent. Because of their relationships with the Sponsor Group or with EFH Corp. directly, none of the other directors would be considered independent under the NYSE listing standards for issuers of equity securities. See "Certain Relationships and Related Party Transactions" and Item 11, "Executive Compensation - Director Compensation." Accordingly, we believe that Ms. Acosta is the only member of the Organization and Compensation Committee who would meet the NYSE's independence requirements for issuers of equity securities. Under the NYSE's audit committee independence requirement for issuers of debt securities, Mses. Acosta and Williamson and Mr. Youngblood, who constitute the Audit Committee, are considered independent.
| |
| Item 14. | PRINCIPAL ACCOUNTING FEES AND SERVICES |
Deloitte & Touche LLP has been the independent auditor for EFH Corp. and for its Predecessor (TXU Corp.) since its organization in 1996.
The Audit Committee of the EFH Corp. Board of Directors has adopted a policy relating to the engagement of EFH Corp.'s independent auditor. The policy provides that in addition to the audit of the financial statements, related quarterly reviews and other audit services, and providing services necessary to complete SEC filings, EFH Corp.'s independent auditor may be engaged to provide non-audit services as described herein. Prior to engagement, all services to be rendered by the independent auditor must be authorized by the Audit Committee in accordance with preapproval procedures which are defined in the policy. The preapproval procedures require:
| |
| 1. | The annual review and preapproval by the Audit Committee of all anticipated audit and non-audit services; and |
| |
| 2. | The quarterly preapproval by the Audit Committee of services, if any, not previously approved and the review of the status of previously approved services. |
The Audit Committee may also approve certain ongoing non-audit services not previously approved in the limited circumstances provided for in the SEC rules. All services performed by Deloitte & Touche LLP, the member firms of Deloitte Touche Tohmatsu and their respective affiliates (Deloitte & Touche) for EFH Corp. in 2014 were preapproved by the Audit Committee.
The policy defines those non-audit services which EFH Corp.'s independent auditor may also be engaged to provide as follows:
| |
| 1. | Audit-related services, including: |
| |
| a. | due diligence accounting consultations and audits related to mergers, acquisitions and divestitures; |
| |
| b. | employee benefit plan audits; |
| |
| c. | accounting and financial reporting standards consultation; |
| |
| d. | internal control reviews, and |
| |
| e. | attest services, including agreed-upon procedures reports that are not required by statute or regulation. |
| |
| 2. | Tax-related services, including: |
| |
| b. | general tax consultation and planning; |
| |
| c. | tax advice related to mergers, acquisitions, and divestitures, and |
| |
| d. | communications with and request for rulings from tax authorities. |
| |
| 3. | Other services, including: |
| |
| a. | process improvement, review and assurance; |
| |
| b. | litigation and rate case assistance; |
| |
| c. | forensic and investigative services, and |
The policy prohibits EFH Corp. from engaging its independent auditor to provide:
| |
| 1. | Bookkeeping or other services related to EFH Corp.'s accounting records or financial statements; |
| |
| 2. | Financial information systems design and implementation services; |
| |
| 3. | Appraisal or valuation services, fairness opinions, or contribution-in-kind reports; |
| |
| 5. | Internal audit outsourcing services; |
| |
| 6. | Management or human resource functions; |
| |
| 7. | Broker-dealer, investment advisor, or investment banking services; |
| |
| 8. | Legal and expert services unrelated to the audit, and |
| |
| 9. | Any other service that the Public Company Accounting Oversight Board determines, by regulation, to be impermissible. |
In addition, the policy prohibits EFH Corp.'s independent auditor from providing tax or financial planning advice to any officer of EFH Corp.
Compliance with the Audit Committee's policy relating to the engagement of Deloitte & Touche is monitored on behalf of the Audit Committee by EFH Corp.'s chief accounting officer. Reports describing the services provided by Deloitte & Touche and fees for such services are provided to the Audit Committee no less often than quarterly.
For the years ended December 31, 2014 and 2013, fees billed (in US dollars) to EFH Corp. by Deloitte & Touche were as follows:
|
| | | | | | | |
| | 2014 | | 2013 |
Audit Fees. Fees for services necessary to perform the annual audit, review SEC filings, fulfill statutory and other service requirements, provide comfort letters and consents | $ | 7,233,000 |
| | $ | 6,180,000 |
|
Audit-Related Fees. Fees for services including due diligence related to mergers, acquisitions and divestitures, accounting consultations and audits in connection with acquisitions, internal control reviews, attest services that are not required by statute or regulation, and consultation concerning financial accounting and reporting standards | 360,000 |
| | 475,000 |
|
Tax Fees. Fees for tax compliance, tax planning, and tax advice related to mergers and acquisitions, divestitures, and communications with and requests for rulings from taxing authorities | — |
| | — |
|
All Other Fees. Fees for services including process improvement reviews, forensic accounting reviews, litigation assistance and training services | — |
| | 8,000 |
|
| Total | $ | 7,593,000 |
| | $ | 6,663,000 |
|
PART IV.
| |
| Item 15. | EXHIBITS AND FINANCIAL STATEMENT SCHEDULES |
(a) Schedule I — CONDENSED FINANCIAL INFORMATION OF REGISTRANT
ENERGY FUTURE HOLDINGS CORP. (PARENT), A DEBTOR-IN-POSSESSION SCHEDULE I — CONDENSED FINANCIAL INFORMATION OF REGISTRANT CONDENSED STATEMENTS OF INCOME (LOSS) (Millions of Dollars) |
| | | | | | | | | | | |
| | Year Ended December 31, |
| | 2014 | | 2013 | | 2012 |
| Selling, general and administrative expenses | $ | (61 | ) | | $ | (45 | ) | | $ | (25 | ) |
| Other income | — |
| | 568 |
| | 1 |
|
| Other deductions | (108 | ) | | (646 | ) | | (1 | ) |
| Interest income | 74 |
| | 132 |
| | 164 |
|
| Interest expense and related charges | (83 | ) | | (411 | ) | | (1,115 | ) |
| Reorganization items | (27 | ) | | — |
| | — |
|
| Loss before income taxes and equity in earnings of unconsolidated subsidiaries | (205 | ) | | (402 | ) | | (976 | ) |
| Income tax benefit | 60 |
| | 141 |
| | 340 |
|
| Equity in losses of consolidated subsidiaries (net of tax) | (6,610 | ) | | (2,399 | ) | | (2,994 | ) |
| Equity in earnings of unconsolidated subsidiaries (net of tax) | 349 |
| | 335 |
| | 270 |
|
| Net loss | (6,406 | ) | | (2,325 | ) | | (3,360 | ) |
| Net loss attributable to noncontrolling interests | — |
| | 107 |
| | — |
|
| Net loss attributable to EFH Corp. (parent) | $ | (6,406 | ) | | $ | (2,218 | ) | | $ | (3,360 | ) |
See Notes to the Financial Statements.
CONDENSED STATEMENTS OF COMPREHENSIVE INCOME (LOSS) (Millions of Dollars) |
| | | | | | | | | | | |
| | Year Ended December 31, |
| | 2014 | | 2013 | | 2012 |
| Net loss | $ | (6,406 | ) | | $ | (2,325 | ) | | $ | (3,360 | ) |
| Other comprehensive income (loss) (net of tax benefit (expense) of $36, $9 and $(94)) | (67 | ) | | (16 | ) | | 175 |
|
| Comprehensive loss | (6,473 | ) | | (2,341 | ) | | (3,185 | ) |
| Comprehensive loss attributable to noncontrolling interests | — |
| | 107 |
| | — |
|
| Comprehensive loss attributable to EFH Corp. (parent) | $ | (6,473 | ) | | $ | (2,234 | ) | | $ | (3,185 | ) |
See Notes to the Financial Statements.
ENERGY FUTURE HOLDINGS CORP. (PARENT), A DEBTOR-IN-POSSESSION SCHEDULE I — CONDENSED FINANCIAL INFORMATION OF REGISTRANT CONDENSED STATEMENTS OF CASH FLOWS (Millions of Dollars) |
| | | | | | | | | | | |
| | Year Ended December 31, |
| | 2014 | | 2013 | | 2012 |
| Cash flows — operating activities | | | | | |
| Net loss | $ | (6,406 | ) | | $ | (2,325 | ) | | $ | (3,360 | ) |
| Adjustments to reconcile net loss to cash provided by (used in)operating activities: | | | | | |
| Equity in losses of consolidated subsidiaries | 6,610 |
| | 2,399 |
| | 2,994 |
|
| Equity in earnings of unconsolidated subsidiaries | (349 | ) | | (335 | ) | | (270 | ) |
| Deferred income tax expense (benefit) — net | 3 |
| | 10 |
| | (235 | ) |
| Unrealized net gain from mark-to-market valuations of interest rate swaps | (14 | ) | | — |
| | — |
|
| Noncash loss on termination of interest rate swaps | 12 |
| | — |
| | — |
|
| Income tax benefit due to IRS audit resolutions | (14 | ) | | (132 | ) | | — |
|
| Reserve for income tax receivable from TCEH | 91 |
| | — |
| | — |
|
| Gain on debt exchanges | — |
| | (566 | ) | | — |
|
| Interest expense on toggle notes payable in additional principal | — |
| | — |
| | 334 |
|
| Impairment of investment in debt of affiliates | — |
| | 70 |
| | 27 |
|
| Reserve recorded for intercompany notes receivable | 3 |
| | 642 |
| | — |
|
| Reserve recorded for intercompany interest receivable | 14 |
| | — |
| | — |
|
| Amortization of debt related costs | 12 |
| | 36 |
| | 48 |
|
| Other, net | 2 |
| | 2 |
| | (3 | ) |
| Changes in operating assets and liabilities: | | |
| |
|
| Changes in assets | 13 |
| | 100 |
| | 94 |
|
| Changes in liabilities | 158 |
| | (75 | ) | | (68 | ) |
| Cash provided by (used in) operating activities | 135 |
| | (174 | ) | | (439 | ) |
| Cash flows — financing activities | | | | | |
| Distributions received from subsidiaries | — |
| | 690 |
| | 950 |
|
| Change in notes/advances — affiliate | 60 |
| | (622 | ) | | (871 | ) |
| Other, net | — |
| | (5 | ) | | — |
|
| Cash provided by (used in) financing activities | 60 |
| | 63 |
| | 79 |
|
| Cash flows — investing activities | | | | | |
| Other, net | — |
| | 9 |
| | — |
|
| Cash provided by (used in) investing activities | — |
| | 9 |
| | — |
|
| Net change in cash and cash equivalents | 195 |
| | (102 | ) | | (360 | ) |
| Cash and cash equivalents — beginning balance | 197 |
| | 299 |
| | 659 |
|
| Cash and cash equivalents — ending balance | $ | 392 |
| | $ | 197 |
| | $ | 299 |
|
See Notes to the Financial Statements.
ENERGY FUTURE HOLDINGS CORP. (PARENT), A DEBTOR-IN-POSSESSION SCHEDULE I — CONDENSED FINANCIAL INFORMATION OF REGISTRANT CONDENSED BALANCE SHEETS (Millions of Dollars) |
| | | | | | | |
| | December 31, |
| | 2014 | | 2013 |
| ASSETS | | | |
| Current assets: | | | |
| Cash and cash equivalents | $ | 392 |
| | $ | 197 |
|
| Trade accounts receivable — net | — |
| | 9 |
|
| Accounts receivable from affiliates | 6 |
| | 9 |
|
| Commodity and other derivative contractual assets | — |
| | 67 |
|
| Prepayments | 7 |
| | — |
|
| Other current assets | — |
| | 1 |
|
| Total current assets | 405 |
| | 283 |
|
| Receivables from unconsolidated subsidiary | 47 |
| | 838 |
|
| Investment in debt of subsidiaries | 39 |
| | 32 |
|
| Other investments | 60 |
| | 59 |
|
| Other noncurrent assets | 3 |
| | 7 |
|
| Total assets | $ | 554 |
| | $ | 1,219 |
|
| LIABILITIES AND EQUITY | | | |
| Current liabilities: | | | |
| Notes, loans and other debt | $ | — |
| | $ | 1,565 |
|
| Trade accounts payable | 1 |
| | 2 |
|
| Notes payable to affiliates | 8 |
| | — |
|
| Commodity and other derivative contractual liabilities | — |
| | 80 |
|
| Accumulated deferred income taxes | 18 |
| | 12 |
|
| Accrued interest | — |
| | 25 |
|
| Accrued taxes | 69 |
| | 59 |
|
| Other current liabilities | 40 |
| | 14 |
|
| Total current liabilities | 136 |
| | 1,757 |
|
| Liabilities subject to compromise | 1,899 |
| | — |
|
| Accumulated deferred income taxes | 368 |
| | 411 |
|
| Notes or other liabilities due affiliates/unconsolidated subsidiary | 7 |
| | — |
|
| Other noncurrent liabilities and deferred credits | 374 |
| | 1,097 |
|
| Total liabilities | 2,784 |
| | 3,265 |
|
| Commitments and Contingencies | | | |
| Equity investment in consolidated subsidiaries | 17,493 |
| | 11,210 |
|
| Shareholders' equity | (19,723 | ) | | (13,256 | ) |
| Total equity | (2,230 | ) | | (2,046 | ) |
| Total liabilities and equity | $ | 554 |
| | $ | 1,219 |
|
See Notes to the Financial Statements.
ENERGY FUTURE HOLDINGS CORP. (PARENT), A DEBTOR-IN-POSSESSION
SCHEDULE I — CONDENSED FINANCIAL INFORMATION OF REGISTRANT
NOTES TO CONDENSED FINANCIAL STATEMENTS
The accompanying unconsolidated condensed balance sheets, statements of income (loss) and cash flows present results of operations and cash flows of EFH Corp. (Parent). Certain information and footnote disclosures normally included in financial statements prepared in accordance with US GAAP have been omitted pursuant to the rules of the SEC. Because the unconsolidated condensed financial statements do not include all of the information and footnotes required by US GAAP, they should be read in conjunction with the financial statements and related notes of Energy Future Holdings Corp. and Subsidiaries included in Item 8 of this Annual Report on Form 10-K. EFH Corp.'s subsidiaries have been accounted for under the equity method. All dollar amounts in the financial statements and tables in the notes are stated in millions of US dollars unless otherwise indicated.
| |
| 2. | INVESTMENT IN DEBT OF SUBSIDIARY |
As a result of debt exchanges and purchases in 2009 through 2011, EFH Corp. (Parent) holds debt securities of TCEH with carrying values totaling $39 million and $32 million at December 31, 2014 and 2013, respectively, reported as investment in debt of subsidiaries.
As of December 31, 2014 and 2013, all of these debt securities are classified as available-for-sale. In accordance with accounting guidance for investments classified as available-for-sale, at December 31, 2014 the securities are recorded at fair value and unrealized gains or losses are recorded in other comprehensive income unless such losses are other than temporary, in which case they are reported as impairments. The principal amounts, coupon rates, maturities and carrying value are as follows:
|
| | | | | | | | | | | | | | | |
| | December 31, 2014 | | December 31, 2013 |
| | Principal Amount | | Carrying Value (a) | | Principal Amount | | Carrying Value (a) |
| Available-for-sale securities: | | | | | | | |
| TCEH 4.730% Term Loan Facilities maturing October 10, 2017 | $ | 19 |
| | $ | 12 |
| | $ | 19 |
| | $ | 13 |
|
| TCEH 10.25% Fixed Senior Notes due November 1, 2015 (both periods include $102 million principal amount of Series B Notes) | 284 |
| | 27 |
| | 284 |
| | 19 |
|
| Total available-for-sale securities | $ | 303 |
| | $ | 39 |
| | $ | 303 |
| | $ | 32 |
|
_____________
| |
| (a) | Carrying value equals fair value. |
Impairments — In 2013 and 2012, we deemed the declines in value of the TCEH securities were other than temporary and recorded impairments totaling $70 million and $27 million, respectively, as reductions of interest income. We considered that the securities were in a loss position for more than 12 months and that declines in natural gas prices and other corresponding effects on the profitability and cash flows of TCEH (which has below investment grade credit ratings) were unlikely to reverse in the near term. As a result of the impairments, no cumulative unrealized losses were recorded in accumulated other comprehensive income at December 31, 2013 and 2012. At December 31, 2014, cumulative unrealized losses recorded in accumulative other comprehensive income totaled $1 million.
Interest income recorded on these investments was as follows:
|
| | | | | | | | | | | |
| | Year Ended December 31, |
| | 2014 | | 2013 | | 2012 |
| Available-for-sale securities: | | | | | |
| Interest received/accrued | $ | 12 |
| | $ | 30 |
| | $ | 30 |
|
| Accretion of purchase discount | — |
| | — |
| | 1 |
|
| Impairments related to issuer credit | — |
| | (70 | ) | | (27 | ) |
| Total interest income | $ | 12 |
| | $ | (40 | ) | | $ | 4 |
|
We determine value under the fair value hierarchy established in accounting standards. Under the fair value hierarchy, Level 2 valuations are based on evaluated prices that reflect observable market information, such as actual trade information of similar securities, adjusted for observable differences. The fair value of our investment in debt of subsidiaries is estimated at the lesser of either the call price or the market value as determined by broker quotes and quoted market prices for similar securities in active markets. For the periods presented, the fair values of our investment in debt of subsidiaries represent Level 2 valuations.
On April 29, 2014, EFH Corp. and the substantial majority of its direct and indirect subsidiaries, including EFIH, EFCH and TCEH but excluding the Oncor Ring-Fenced Entities, filed voluntary petitions for relief under Chapter 11 of the United States Bankruptcy Code in the United States Bankruptcy Court for the District of Delaware. Prior to December 31, 2013, EFH Corp. (Parent) had entered into certain transactions with its subsidiaries that upon the Bankruptcy Filing resulted in unsecured prepetition liabilities on the part of the subsidiaries that are subject to settlement under a Chapter 11 plan. Because of the significant uncertainty regarding the ultimate settlement of these amounts, in the fourth quarter 2013 EFH Corp. (Parent) fully reserved the following affiliate receivables:
| |
| • | The net income tax receivable from TCEH was fully reserved, resulting in a charge of $534 million, reported in other deductions. The receivable arose from a Federal and State Income Tax Allocation Agreement, which provides, among other things, that each of EFCH, EFIH, TCEH and other subsidiaries under the agreement is required to make payments to EFH Corp. in an amount calculated to approximate the amount of tax liability such entity would have owed if it filed a separate corporate tax return. |
| |
| • | The demand note receivable from EFCH was fully reserved, resulting in a charge of $103 million reported in other deductions. The receivable arose from borrowings by EFCH to repay certain outstanding debt as it became due. |
| |
| • | The interest receivable from TCEH was fully reserved, resulting in a charge of $5 million reported in other deductions. The receivable represented accrued interest related to the EFH Corp.'s holdings of TCEH debt securities. |
In addition, in the fourth quarter 2013, EFH Corp. (Parent) determined that the likelihood that receivables and payables with certain of its direct subsidiaries would be cash settled was remote. As such $899 million of corporate affiliate receivables and $1.350 billion of corporate affiliate payables were reclassified to equity investment in consolidated subsidiaries. Substantially all of the affiliates represent discontinued operations and are no longer active.
EFH Corp. (Parent) fully reserved an additional net income tax receivable from TCEH, resulting in a charge of $91 million at December 31, 2014, reported in other deductions. EFH Corp. (Parent) also fully reserved pre-petition interest receivable from EFCH, resulting in a charge of $14 million at December 31, 2014, reported in other deductions. EFH Corp. (Parent) also fully reserved a pre-petition intercompany accounts receivable because of significant uncertainty regarding its ultimate settlement, resulting in a charge of $3 million at December 31, 2014, reported in other deductions.
Expenses and income directly associated with the Chapter 11 Cases are reported separately in the statements of consolidated income (loss) as reorganization items as required by ASC 852, Reorganizations. Reorganization items also include adjustments to reflect the carrying value of liabilities subject to compromise (LSTC) at their estimated allowed claim amounts, as such adjustments are determined. The following table presents reorganization items incurred since the Petition Date as reported in the statements of consolidated income (loss):
|
| | | |
| | Post-Petition Period Through December 31, 2014 |
| Expenses related to legal advisory and representation services | $ | 13 |
|
| Expenses related to other professional consulting and advisory services | 13 |
|
| Noncash liability adjustment arising from termination of interest rate swaps | 1 |
|
| Total reorganization items | $ | 27 |
|
| |
| 5. | LIABILITIES SUBJECT TO COMPROMISE |
The amounts classified as liabilities subject to compromise (LSTC) reflect the company's estimate of pre-petition liabilities to be addressed in the Chapter 11 Cases and may be subject to future adjustment as the Chapter 11 Cases proceed. Debt amounts include related unamortized deferred financing costs and discounts/premiums. Amounts classified to LSTC do not include pre-petition liabilities that are fully secured by letters of credit or cash deposits. The following table presents LSTC as reported in the condensed consolidated balance sheets at December 31, 2014:
|
| | | |
| | December 31,
2014 |
| Notes, loans and other debt | $ | 1,577 |
|
| Accrued interest on notes, loans and other debt | 57 |
|
| Tax sharing liability | 212 |
|
| Trade accounts payable and accrued liabilities | 52 |
|
| Advances and other payables to affiliates | 1 |
|
| Total liabilities subject to compromise | $ | 1,899 |
|
As discussed below, EFH Corp. (Parent) has entered into contracts that contain guarantees to unaffiliated parties that could require performance or payment under certain conditions. Material guarantees are discussed below.
Disposed TXU Gas Company Operations — In connection with the sale of the assets of TXU Gas Company to Atmos Energy Corporation (Atmos) in October 2004, EFH Corp. agreed to indemnify Atmos, through October 1, 2014, for up to $500 million for any liability related to assets retained by TXU Gas Company, including certain inactive gas plant sites not acquired by Atmos, and up to $1.4 billion for contingent liabilities associated with pre-closing tax and employee related matters. No indemnity claims were made or asserted by Atmos, and no payments were made pursuant to this indemnity.
Assumption of Indebtedness — In 1990, EFCH purchased an electric co-op's minority ownership interest in the Comanche Peak nuclear generation facilities and assumed the co-op's indebtedness to the US government related to the co-op's investment in the facilities (without the co-op being released from its obligations under such indebtedness). EFCH is making principal and interest payments in an amount sufficient to satisfy the co-op's requirements under the indebtedness. In the event that payments on the indebtedness are not made in a timely manner, the US government would be entitled to enforce the payment of the debt against EFCH. At December 31, 2014, the balance of the indebtedness on EFCH's balance sheet was $50 million with maturities of principal and interest extending to December 2021. The indebtedness is secured by a lien on the Comanche Peak generation facilities. EFH Corp. (Parent) has guaranteed EFCH's obligation under this agreement.
| |
| 7. | COMMITMENTS AND CONTINGENCIES |
In August 2014, the Bankruptcy Court entered an order in the Chapter 11 Cases establishing discovery procedures governing, among other things, certain prepetition transactions among the various Debtors' estates, including EFH Corp. (Parent). In February 2015, the ad hoc committee of certain TCEH unsecured noteholders; the official committee representing unsecured interests at EFCH and its direct subsidiary, TCEH; and the official committee representing unsecured interests at EFH and EFIH filed motions with the Bankruptcy Court seeking standing to prosecute derivative claims on behalf of TCEH relating to certain of these prepetition transactions. These motions are currently scheduled to be heard by the Bankruptcy Court at the Debtors' omnibus hearing in April 2015. In addition to the claims described above, certain of the Debtors (or creditors purporting to act derivatively in the name of a Debtor) may bring additional inter-Debtor or intra-Debtor claims (including claims under the Federal and State Income Tax Allocation Agreement among EFH Corp. (Parent) and certain of its subsidiaries under which TCEH and EFH Corp. have previously filed claims in the Chapter 11 Cases) that could be material in amount. We cannot predict the timing or outcome of future proceedings, if any, related to these transactions. The outcome of any of these claims could be material and could affect the results of operation, liquidity or financial condition of a particular Debtor, including EFH Corp. (Parent).
Under applicable law, we are prohibited from paying any dividend to the extent that immediately following payment of such dividend, there would be no statutory surplus or we would be insolvent. In addition, due to the Bankruptcy Filing, no dividends are eligible to be paid without the approval of the Bankruptcy Court.
EFH Corp. (Parent) has not declared or paid any dividends since the Merger.
EFH Corp. (Parent) received no dividends from its consolidated subsidiaries in the year ended December 31, 2014. EFH Corp. (Parent) received dividends from its consolidated subsidiaries totaling $690 million and $950 million for the years ended December 31, 2013 and 2012, respectively.
| |
| 9. | SUPPLEMENTAL CASH FLOW INFORMATION |
|
| | | | | | | | | | | |
| | Year Ended December 31, |
| | 2014 | | 2013 | | 2012 |
| Cash payments (receipts) related to: | | | | | |
| Interest paid | $ | 30 |
| | $ | 525 |
| | $ | 675 |
|
| Income taxes | (243 | ) | | (224 | ) | | (227 | ) |
| Reorganization items (a) | 14 |
| | — |
| | — |
|
| Noncash investing and financing activities: | | | | | |
| Debt exchange transactions | — |
| | — |
| | — |
|
| Principal amount of toggle notes issued in lieu of cash | — |
| | — |
| | 398 |
|
___________
| |
| (a) | Represents cash payments for legal and other consulting services. |
(b) Oncor Holdings Financial Statements are presented pursuant to Rule 3–09 of Regulation S-X as Exhibit 99(e).
(c) Exhibits:
EFH Corp. Exhibits to Form 10-K for the Fiscal Year Ended December 31, 2014
|
| | | | | | | | |
| Exhibits | | Previously Filed* With File Number | | As Exhibit | | | | |
| | | | | | | | | |
| (2) | | Plan of Acquisition, Reorganization, Arrangement, Liquidation, or Succession |
| 2(a) | | 1-12833 Form 8-K
(filed February 26, 2007) | | 2.1 | | — | | Agreement and Plan of Merger, dated February 25, 2007, by and among Energy Future Holdings Corp. (formerly known as TXU Corp.), Texas Energy Future Holdings Limited Partnership and Texas Energy Future Merger Sub Corp. |
| | | | | | | | | |
| (3(i)) | | Articles of Incorporation |
| | | | | | | | | |
| 3(a) | | 1-12833 Form 10-Q (Quarter ended March 31, 2013) (filed May 2, 2013) | | 3(a) | | — | | Restated Certificate of Formation of Energy Future Holdings Corp. |
| | | | | | | | | |
| (3(ii)) | | By-laws |
| | | | | | | | | |
| 3(b) | | 1-12833 Form 10-Q (Quarter ended March 31, 2013) (filed May 2, 2013) | | 3(b) | | — | | Amended and Restated Bylaws of Energy Future Holdings Corp. |
| | | | | | | | | |
| (4) | | Instruments Defining the Rights of Security Holders, Including Indentures** |
| | | | | | | | | |
| | | Energy Future Holdings Corp. |
| | | | | | | | | |
| 4(a) | | 1-12833 Form 10-K (2007)
(filed March 31, 2008) | | 4(c) | | — | | Indenture (For Unsecured Debt Securities Series P), dated November 1, 2004, between Energy Future Holdings Corp. and The Bank of New York Mellon, as trustee. |
| | | | | | | | | |
| 4(b) | | 1-12833 Form 8-K (filed July 7, 2010) | | 99.1 | | — | | Supplemental Indenture, dated July 1, 2010, to the Indenture, dated November 1, 2004, between Energy Future Holdings Corp. and The Bank of New York Mellon, as trustee (For Unsecured Debt Securities Series P due 2014). |
| | | | | | | | | |
| 4(c) | | 1-12833 Form 10-Q (Quarter ended March 31, 2013) (filed May 2, 2013) | | 4(f) | | — | | Second Supplemental Indenture, dated April 15, 2013, to the Indenture, dated November 1, 2004, between Energy Future Holdings Corp. and The Bank of New York Mellon, as trustee (For Unsecured Debt Securities Series P due 2014). |
| | | | | | | | | |
| 4(d) | | 1-12833 Form 10-K (2004)
(filed March 16, 2005) | | 4(q) | | — | | Officers’ Certificate, dated November 26, 2004, establishing the form and certain terms of Energy Future Holdings Corp.’s 5.55% Series P Senior Notes due 2014. |
| | | | | | | | | |
| 4(e) | | 1-12833 Form 10-K (2010)
(filed February 18, 2011) | | 4(d) | | — | | Indenture (For Unsecured Debt Securities Series Q), dated November 1, 2004, between Energy Future Holdings Corp. and The Bank of New York Mellon, as trustee. Energy Future Holdings Corp.’s Indentures for its Series R Senior Notes are not filed as it is substantially similar to this Indenture. |
| | | | | | | | | |
| 4(f) | | 1-12833 Form 10-K (2004) (filed March 16, 2005) | | 4(r) | | — | | Officers' Certificate, dated November 26, 2004, establishing the form and certain terms of Energy Future Holdings Corp.’s 6.50% Series Q Senior Notes due 2024. |
| | | | | | | | | |
| 4(g) | | 1-12833 Form 8-K (filed December 5, 2012) | | 4.3 | | — | | Supplemental Indenture, dated December 5, 2012, to the Indenture, dated November 1, 2004, between Energy Future Holdings Corp. and The Bank of New York Mellon, as trustee (For Unsecured Debt Securities Series Q due 2024). |
| | | | | | | | | |
| 4(h) | | 1-12833 Form 10-Q (Quarter ended March 31, 2013) (filed May 2, 2013) | | 4(g) | | — | | Second Supplemental Indenture, dated April 15, 2013, to the Indenture, dated November 1, 2004, between Energy Future Holdings Corp. and The Bank of New York Mellon, as trustee (For Unsecured Debt Securities Series Q due 2024). |
| | | | | | | | | |
|
| | | | | | | | |
| Exhibits | | Previously Filed* With File Number | | As Exhibit | | | | |
| 4(i) | | 1-12833 Form 10-K (2004) (filed March 16, 2005) | | 4(s) | | — | | Officer’s Certificate, dated November 26, 2004, establishing the form and certain terms of Energy Future Holdings Corp.’s 6.55% Series R Senior Notes due 2034. |
| | | | | | | | | |
| 4(j) | | 1-12833 Form 8-K (filed December 5, 2012) | | 4.4 | | — | | Supplemental Indenture, dated December 5, 2012, to the Indenture, dated November 1, 2004, between Energy Future Holdings Corp. and The Bank of New York Mellon, as trustee (For Unsecured Debt Securities Series R due 2034). |
| | | | | | | | | |
| 4(k) | | 1-12833 Form 10-Q (Quarter ended March 31, 2013) (filed May 2, 2013) | | 4(h) | | — | | Second Supplemental Indenture, dated April 15, 2013, to the Indenture, dated November 1, 2004, between Energy Future Holdings Corp. and The Bank of New York Mellon, as trustee (For Unsecured Debt Securities Series R due 2034). |
| | | | | | | | | |
| 4(l) | | 1-12833 Form 8-K
(filed October 31, 2007) | | 4.1 | | — | | Indenture, dated October 31, 2007, among Energy Future Holdings Corp., the guarantors named therein and The Bank of New York Mellon, as trustee, relating to Senior Notes due 2017 and Senior Toggle Notes due 2017. |
| | | | | | | | | |
| 4(m) | | 1-12833 Form 10-K (2009)
(filed February 19, 2010) | | 4(f) | | — | | Supplemental Indenture, dated July 8, 2008, to Indenture, dated October 31, 2007. |
| | | | | | | | | |
| 4(n) | | 1-12833 Form 10-Q (Quarter ended June 30, 2009) (filed August 4, 2009) | | 4(a) | | — | | Second Supplemental Indenture, dated August 3, 2009, to Indenture, dated October 31, 2007. |
| | | | | | | | | |
| 4(o) | | 1-12833 Form 8-K
(filed July 30, 2010) | | 99.1 | | — | | Third Supplemental Indenture, dated July 29, 2010, to Indenture, dated October 31, 2007. |
| | | | | | | | | |
| 4(p) | | 1-12833 Form 10-Q (Quarter ended September 30, 2011) (filed October 28, 2011) | | 4(b) | | — | | Fourth Supplemental Indenture, dated October 18, 2011, to Indenture dated October 31, 2007. |
| | | | | | | | | |
| 4(q) | | 1-12833 Form 10-Q (Quarter ended March 31, 2013) (filed May 2, 2013) | | 4(a) | | — | | Fifth Supplemental Indenture, dated April 15, 2013, to the Indenture, dated October 31, 2007, among Energy Future Holdings Corp., the guarantors named therein and The Bank of New York Mellon Trust Company, N.A., as trustee, relating to Senior Notes due 2017 and Senior Toggle Notes due 2017. |
| | | | | | | | | |
| 4(r) | | 1-12833 Form 8-K
(filed November 20, 2009) | | 4.1 | | — | | Indenture, dated November 16, 2009, among Energy Future Holdings Corp., the guarantors named therein and The Bank of New York Mellon Trust Company, N.A., as trustee, relating to 9.75% Senior Secured Notes due 2019. |
| | | | | | | | | |
| 4(s) | | 1-12833 Form 8-K
(January 30, 2013) | | 4.1 | | — | | Supplemental Indenture, dated January 25, 2013, to the Indenture, dated November 16, 2009, among Energy Future Holdings Corp., the guarantors named therein and The Bank of New York Mellon Trust Company, N.A., as trustee, relating to 9.75% Senior Secured Notes due 2019. |
| | | | | | | | | |
| 4(t) | | 1-12833 Form 10-Q (Quarter ended March 31, 2013) (filed May 2, 2013) | | 4(c) | | — | | Second Supplemental Indenture, dated April 15, 2013, to the Indenture, dated November 16, 2009, among Energy Future Holdings Corp. and The Bank of New York Mellon Trust Company, N.A., as trustee, relating to 9.75% Senior Secured Notes due 2019. |
| | | | | | | | | |
| 4(u) | | 333-171253 Form S-4
(filed January 24, 2011) | | 4(k) | | — | | Indenture, dated January 12, 2010, among Energy Future Holdings Corp., the guarantors named therein and The Bank of New York Mellon Trust Company, N.A., as trustee, relating to 10.000% Senior Secured Notes due 2020. |
| | | | | | | | | |
|
| | | | | | | | |
| Exhibits | | Previously Filed* With File Number | | As Exhibit | | | | |
| 4(v) | | 333-165860 Form S-3
(filed April 1, 2010) | | 4(j) | | — | | First Supplemental Indenture, dated March 16, 2010, to the Indenture, dated January 12, 2010, among Energy Future Holdings Corp., the guarantors named therein and The Bank of New York Mellon Trust Company, N.A., as trustee, relating to 10.000% Senior Secured Notes due 2020. |
| | | | | | | | | |
| 4(w) | | 1-12833 Form 10-Q (Quarter ended June 30, 2010) (filed August 2, 2010) | | 4(a) | | — | | Second Supplemental Indenture, dated April 13, 2010, to the Indenture, dated January 12, 2010, among Energy Future Holdings Corp., the guarantors named therein and The Bank of New York Mellon Trust Company, N.A., as trustee, relating to 10.000% Senior Secured Notes due 2020. |
| | | | | | | | | |
| 4(x) | | 1-12833 Form 10-Q (Quarter ended June 30, 2010) (filed August 2, 2010) | | 4(b) | | — | | Third Supplemental Indenture, dated April 14, 2010, to the Indenture, dated January 12, 2010, among Energy Future Holdings Corp., the guarantors named therein and The Bank of New York Mellon Trust Company, N.A., as trustee, relating to 10.000% Senior Secured Notes due 2020. |
| | | | | | | | | |
| 4(y) | | 1-12833 Form 10-Q (Quarter ended June 30, 2010) (filed August 2, 2010) | | 4(c) | | — | | Fourth Supplemental Indenture, dated May 21, 2010, to the Indenture, dated January 12, 2010, among Energy Future Holdings Corp., the guarantors named therein and The Bank of New York Mellon Trust Company, N.A., as trustee, relating to 10.000% Senior Secured Notes due 2020. |
| | | | | | | | | |
| 4(z) | | 1-12833 Form 10-Q (Quarter ended June 30, 2010) (filed August 2, 2010) | | 4(d) | | — | | Fifth Supplemental Indenture, dated July 2, 2010, to the Indenture, dated January 12, 2010, among Energy Future Holdings Corp., the guarantors named therein and The Bank of New York Mellon Trust Company, N.A., as trustee, relating to 10.000% Senior Secured Notes due 2020. |
| | | | | | | | | |
| 4(aa) | | 1-12833 Form 10-Q (Quarter ended June 30, 2010) (filed August 2, 2010) | | 4(e) | | — | | Sixth Supplemental Indenture, dated July 6, 2010, to the Indenture, dated January 12, 2010, among Energy Future Holdings Corp., the guarantors named therein and The Bank of New York Mellon Trust Company, N.A., as trustee, relating to 10.000% Senior Secured Notes due 2020. |
| | | | | | | | | |
| 4(bb) | | 333-171253 Form S-4
(filed January 24, 2011) | | 4(r) | | — | | Seventh Supplemental Indenture, dated July 7, 2010, to the Indenture, dated January 12, 2010, among Energy Future Holdings Corp., the guarantors named therein and The Bank of New York Mellon Trust Company, N.A., as trustee, relating to 10.000% Senior Secured Notes due 2020. |
| | | | | | | | | |
| 4(cc) | | 1-12833 Form 8-K
(January 30, 2013) | | 4.2 | | — | | Eighth Supplemental Indenture, dated January 25, 2013, to the Indenture, dated January 12, 2010, among Energy Future Holdings Corp., the guarantors named therein and The Bank of New York Mellon Trust Company, N.A., as trustee, relating to 10.000% Senior Secured Notes due 2020. |
| | | | | | | | | |
| 4(dd) | | 1-12833 Form 10-Q (Quarter ended March 31, 2013) (filed May 2, 2013) | | 4(e) | | — | | Ninth Supplemental Indenture, dated April 15, 2013, to the Indenture, dated January 12, 2010, among Energy Future Holdings Corp. and The Bank of New York Mellon Trust Company, N.A., as trustee, relating to 10.000% Senior Secured Notes due 2020. |
| | | | | | | | | |
| | | Oncor Electric Delivery Company LLC |
| | | | | | | | | |
| 4(ee) | | 333-100240 Form S-4
(filed October 2, 2002) | | 4(a) | | — | | Indenture and Deed of Trust, dated as of May 1, 2002, between Oncor Electric Delivery Company LLC and The Bank of New York Mellon, as trustee. |
| | | | | | | | | |
| 4(ff) | | 1-12833 Form 8-K
(filed October 31, 2005) | | 10.1 | | — | | Supplemental Indenture No. 1, dated October 25, 2005, to Indenture and Deed of Trust, dated as of May 1, 2002, between Oncor Electric Delivery Company LLC and The Bank of New York Mellon. |
| | | | | | | | | |
| 4(gg) | | 333-100240 Form 10-Q (Quarter ended March 31, 2008) (filed May 15, 2008) | | 4(b) | | — | | Supplemental Indenture No. 2, dated May 15, 2008, to Indenture and Deed of Trust, dated as of May 1, 2002, between Oncor Electric Delivery Company LLC and The Bank of New York Mellon. |
| | | | | | | | | |
|
| | | | | | | | |
| Exhibits | | Previously Filed* With File Number | | As Exhibit | | | | |
| 4(hh) | | 333-100240 Form S-4
(filed October 2, 2002) | | 4(b) | | — | | Officer’s Certificate, dated May 6, 2002, establishing the form and certain terms of Oncor Electric Delivery Company LLC’s 6.375% Senior Notes due 2012 and 7.000% Senior Notes due 2032. |
| | | | | | | | | |
| 4(ii) | | 333-100242 Form S-4
(filed October 2, 2002) | | 4(a) | | — | | Indenture (for Unsecured Debt Securities), dated August 1, 2002, between Oncor Electric Delivery Company LLC and The Bank of New York Mellon, as trustee. |
| | | | | | | | | |
| 4(jj) | | 333-100240 Form 10-Q (Quarter ended March 31, 2008) (filed May 15, 2008) | | 4(c) | | — | | Supplemental Indenture No. 1, dated May 15, 2008, to Indenture and Deed of Trust, dated August 1, 2002, between Oncor Electric Delivery Company LLC and The Bank of New York. |
| | | | | | | | | |
| 4(kk) | | 333-100242 Form S-4
(filed October 2, 2002) | | 4(b) | | — | | Officer’s Certificate, dated August 30, 2002, establishing the form and certain terms of Oncor Electric Delivery Company LLC’s 5% Debentures due 2007 and 7% Debentures due 2022. |
| | | | | | | | | |
| 4(ll) | | 333-106894 Form S-4
(filed July 9, 2003) | | 4(c) | | — | | Officer’s Certificate, dated December 20, 2002, establishing the form and certain terms of Oncor Electric Delivery Company LLC’s 6.375% Senior Notes due 2015 and 7.250% Senior Notes due 2023. |
| | | | | | | | | |
| 4(mm) | | 333-100240 Form 10-Q (Quarter ended March 31, 2008) (filed May 15, 2008) | | 4(a) | | — | | Deed of Trust, Security Agreement and Fixture Filing, dated May 15, 2008, by Oncor Electric Delivery Company LLC, as grantor, to and for the benefit of, The Bank of New York Mellon Trust, as collateral agent and trustee. |
| | | | | | | | | |
| 4(nn) | | 333-100240 Form 10-K (2008)
(filed March 3, 2009) | | 4(n) | | — | | First Amendment, dated March 2, 2009, to Deed of Trust, Security Agreement and Fixture Filing, dated May 15, 2008. |
| | | | | | | | | |
| 4(oo) | | 333-100240 Form 8-K
(filed September 3, 2010) | | 10.1 | | — | | Second Amendment, dated September 3, 2010, to Deed of Trust, Security Agreement and Fixture Filing, dated May 15, 2008. |
| | | | | | | | | |
| 4(pp) | | 333-100240 Form 8-K
(filed November 15, 2011) | | 10.1 | | — | | Third Amendment, dated November 10, 2011, to Deed of Trust, Security Agreement and Fixture Filing, dated May 15, 2008. |
| | | | | | | | | |
| 4(qq) | | 333-100242 Form 8-K
(filed September 9, 2008) | | 4.1 | | — | | Officer’s Certificate, dated September 8, 2008, establishing the form and certain terms of Oncor Electric Delivery Company LLC’s 5.95% Senior Secured Notes due 2013, 6.80% Senior Secured Notes due 2018 and 7.50% Senior Secured Notes due 2038. |
| | | | | | | | | |
| 4(rr) | | 333-100240 Form 8-K
(filed September 16, 2010) | | 4.1 | | — | | Officer’s Certificate, dated September 13, 2010, establishing the form and certain terms of Oncor Electric Delivery Company LLC’s 5.25% Senior Secured Notes due 2040. |
| | | | | | | | | |
| 4(ss) | | 333-100240 Form 8-K
(filed October 12, 2010) | | 4.1 | | — | | Officer's Certificate, dated October 8, 2010, establishing the form and certain terms of Oncor Electric Delivery Company LLC's 5.00% Senior Secured Notes due 2017 and 5.75% Senior Secured Notes due 2020. |
| | | | | | | | | |
| 4(tt) | | 333-100240 Form 8-K
(filed November 23, 2011) | | 4.1 | | — | | Officer's Certificate, dated November 23, 2011, establishing the terms of Oncor's 4.55% Senior Secured Notes due 2041. |
| | | | | | | | | |
| 4(uu) | | 333-100240 Form 8-K
(filed May 18, 2012) | | 4.1 | | — | | Officer's Certificate, dated May 18, 2012, establishing the terms of Oncor's 4.10% Senior Secured Notes due 2022 and 5.30% Senior Secured Notes due 2042. |
| | | | | | | | | |
| 4(vv) | | 333-100240 Form 8-K
(filed May 13, 2013) | | 4.1 | | — | | Registration Rights Agreement, dated May 13, 2013, among Oncor Electric Delivery Company LLC and the representatives of the initial purchasers of the addition 4.55% Senior Secure Notes due 2041. |
| | | | | | | | | |
|
| | | | | | | | |
| Exhibits | | Previously Filed* With File Number | | As Exhibit | | | | |
| 4(ww) | | 333-100240 Form 8-K
(filed May 13, 2014) | | 4.1 | | — | | Officer's Certificate dated May 13, 2014, establishing the terms of Oncor Electric Delivery Company LLC's 2.15% Senior Secured Notes due 2019. |
| | | | | | | | | |
| 4(xx) | | 333-100240 Form 8-K
(filed May 13, 2014) | | 4.2 | | — | | Registration Rights Agreement, dated May 13, 2014, among Oncor Electric Delivery Company LLC and the representatives of the initial purchasers of Oncor Electricity Delivery Company LLC's 2.15% Senior Secured Notes due 2019. |
| | | | | | | | | |
| | | Texas Competitive Electric Holdings Company LLC |
| | | | | | | | | |
| 4(yy) | | 333-108876 Form 8-K
(filed October 31, 2007) | | 4.2 | | — | | Indenture, dated October 31, 2007, among Texas Competitive Electric Holdings Company LLC and TCEH Finance, Inc., the guarantors and The Bank of New York Mellon Trust Company, N.A., as trustee, relating to 10.25% Senior Notes due 2015. |
| | | | | | | | | |
| 4(zz) | | 1-12833 Form 8-K
(filed December 12, 2007) | | 4.1 | | — | | First Supplemental Indenture, dated December 6, 2007, to Indenture, dated October 31, 2007, relating to Texas Competitive Electric Holdings Company LLC’s and TCEH Finance, Inc.’s 10.25% Senior Notes due 2015, Series B, and 10.50%/11.25% Senior Toggle Notes due 2016. |
| | | | | | | | | |
| 4(aaa) | | 1-12833 Form 10-Q (Quarter ended June 30, 2009) (filed August 4, 2009) | | 4(b) | | — | | Second Supplemental Indenture, dated August 3, 2009, to Indenture, dated October 31, 2007, relating to Texas Competitive Electric Holdings Company LLC’s and TCEH Finance, Inc.’s 10.25% Senior Notes due 2015, 10.25% Senior Notes due 2015, Series B, and 10.50%/11.25% Senior Toggle Notes due 2016. |
| | | | | | | | | |
| 4(bbb) | | 1-12833 Form 10-Q (Quarter ended March 31, 2013) (filed May 2, 2013) | | 4(i) | | — | | Third Supplemental Indenture, dated January 11, 2013, to the Indenture dated October 31, 2007, among Texas Competitive Electric Holdings Company LLC, TCEH Finance, Inc., the guarantors party thereto and The Bank of New York Mellon Trust Company, N.A., as trustee, relating to 10.25% Senior Notes due 2015, 10.25% Senior Notes due 2015, Series B, and 10.50%/11.25% Senior Toggle Notes due 2016. |
| | | | | | | | | |
| 4(ccc) | | 1-12833 Form 10-K (2013)
(filed April 30, 2014) | | 4(ccc) | | — | | Fourth Supplemental Indenture, dated February 24, 2014, to the Indenture dated October 31, 2007, among Texas Competitive Electric Holdings Company LLC, TCEH Finance, Inc., the guarantors party thereto and The Bank of New York Mellon Trust Company, N.A., as trustee, relating to 10.25% Senior Notes due 2015, 10.25% Senior Notes due 2015, Series B, and 10.50%/11.25% Senior Toggle Notes due 2016. |
| | | | | | | | | |
| 4(ddd) | | 1-12833 Form 8-K
(filed October 8, 2010) | | 4.1 | | — | | Indenture, dated October 6, 2010, among Texas Competitive Electric Holdings Company LLC and TCEH Finance, Inc., the guarantors and The Bank of New York Mellon Trust Company, N.A., as trustee, relating to 15% Senior Secured Second Lien Notes due 2021. |
| | | | | | | | | |
| 4(eee) | | 1-12833 Form 8-K
(filed October 26, 2010) | | 4.1 | | — | | First Supplemental Indenture, dated October 20, 2010, to the Indenture, dated October 6, 2010. |
| | | | | | | | | |
| 4(fff) | | 1-12833 Form 8-K (filed
November 17, 2010) | | 4.1 | | — | | Second Supplemental Indenture, dated November 15, 2010, to the Indenture, dated October 6, 2010. |
| | | | | | | | | |
| 4(ggg) | | 1-12833 Form 10-Q (Quarter ended September 30, 2011) (filed October 28, 2011) | | 4(a) | | — | | Third Supplemental Indenture, dated as of September 26, 2011, to the Indenture, dated October 6, 2010. |
| | | | | | | | | |
| 4(hhh) | | 1-12833 Form 10-Q (Quarter ended March 31, 2013) (filed May 2, 2013) | | 4(k) | | — | | Fourth Supplemental Indenture, dated January 11, 2013, to the Indenture dated October 6, 2010, among Texas Competitive Electric Holdings Company LLC, TCEH Finance, Inc., the guarantors party thereto and The Bank of New York Mellon Trust Company, N.A., as trustee, relating to 15% Senior Secured Second Lien Notes due 2021 and 15% Senior Secured Second Lien Notes due 2021, Series B. |
|
| | | | | | | | |
| Exhibits | | Previously Filed* With File Number | | As Exhibit | | | | |
| | | | | | | | | |
| 4(iii) | | 1-12833 Form 10-K (2013)
(filed April 30, 2014) | | 4(iii) | | — | | Fifth Supplemental Indenture, dated February 24, 2014, to the Indenture dated October 6, 2010, among Texas Competitive Electric Holdings Company LLC, TCEH Finance, Inc., the guarantors party thereto and The Bank of New York Mellon Trust Company, N.A., as trustee, relating to 15% Senior Secured Second Lien Notes due 2021 and 15% Senior Secured Second Lien Notes due 2021, Series B. |
| | | | | | | | | |
| 4(jjj) | | 1-12833 Form 8-K
(filed October 8, 2010) | | 4.3 | | — | | Second Lien Pledge Agreement, dated October 6, 2010, among Texas Competitive Electric Holdings Company LLC, TCEH Finance, Inc., the subsidiary guarantors named therein and The Bank of New York Mellon Trust Company, N.A., as collateral agent for the benefit of the second lien secured parties. |
| | | | | | | | | |
| 4(kkk) | | 1-12833 Form 8-K
(filed October 8, 2010) | | 4.4 | | — | | Second Lien Security Agreement, dated October 6, 2010, among Texas Competitive Electric Holdings Company LLC, TCEH Finance, Inc., the subsidiary guarantors named therein and The Bank Of New York Mellon Trust Company, N.A., as collateral agent and as the initial second priority representative for the benefit of the second lien secured parties. |
| | | | | | | | | |
| 4(lll) | | 1-12833 Form 8-K
(filed October 8, 2010) | | 4.5 | | — | | Second Lien Intercreditor Agreement, dated October 6, 2010, among Texas Competitive Electric Holdings Company LLC, TCEH Finance, Inc., the subsidiary guarantors named therein, Citibank, N.A., as collateral agent for the senior collateral agent and the administrative agent, The Bank of New York Mellon Trust Company, N.A., as the initial second priority representative. |
| | | | | | | | | |
| 4(mmm) | | 1-12833 Form 10-K (2010)
(filed February 18, 2011) | | 4(aaa) | | — | | Form of Second Deed of Trust, Assignment of Leases and Rents, Security Agreement and Fixture Filing to Fidelity National Title Insurance Company, as trustee, for the benefit of The Bank of New York Mellon Trust Company, N.A., as Collateral Agent and Initial Second Priority Representative for the benefit of the Second Lien Secured Parties, as Beneficiary. |
| | | | | | | | | |
| 4(nnn) | | 1-12833 Form 8-K
(filed April 20, 2011) | | 4.1 | | — | | Indenture, dated as of April 19, 2011, among Texas Competitive Electric Holdings Company LLC, TCEH Finance Inc., the Guarantors party thereto and The Bank of New York Mellon Trust Company, N.A., as trustee, relating to 11.5% Senior Secured Notes due 2020. |
| | | | | | | | | |
| 4(ooo) | | 1-12833 Form 10-Q (Quarter ended March 31, 2013) (filed May 2, 2013) | | 4(j) | | — | | Supplemental Indenture, dated January 11, 2013, to the Indenture dated April 19, 2011, among Texas Competitive Electric Holdings Company LLC, TCEH Finance, Inc., the guarantors party thereto and The Bank of New York Mellon Trust Company, N.A., as trustee, relating to 11.5% Senior Secured Notes due 2020. |
| | | | | | | | | |
| 4(ppp) | | 1-12833 Form 10-K (2013)
(filed April 30, 2014) | | 4(ppp) | | — | | Second Supplemental Indenture, dated February 24, 2014, to the Indenture dated April 19, 2011, among Texas Competitive Electric Holdings Company LLC, TCEH Finance, Inc., the guarantors party thereto and The Bank of New York Mellon Trust Company, N.A., as trustee, relating to 11.5% Senior Secured Notes due 2020. |
| | | | | | | | | |
| 4(qqq) | | 1-12833 Form 8-K
(filed April 20, 2011) | | 4.2 | | — | | Form of Deed of Trust, Assignment of Leases and Rents, Security Agreement and Fixture Fling to Fidelity National Title Insurance Company, as trustee, for the benefit of Citibank, N.A., as Collateral Agent for the benefit of the Holders of the 11.5% Senior Secured Notes due 2020, as Beneficiary. |
| | | | | | | | | |
| 4(rrr) | | 1-12833 Form 8-K
(filed April 20, 2011) | | 4.3 | | — | | Form of Deed of Trust and Security Agreement to Fidelity National Title Insurance Company, as trustee, for the benefit of Citibank, N.A., as Collateral Agent for the benefit of the Holders of the 11.5% Senior Secured Notes due 2020, as Beneficiary. |
| | | | | | | | | |
|
| | | | | | | | |
| Exhibits | | Previously Filed* With File Number | | As Exhibit | | | | |
| 4(rrr) | | 1-12833 Form 8-K
(filed April 20, 2011) | | 4.4 | | — | | Form of Subordination and Priority Agreement, among Citibank, N.A., as beneficiary under the First Lien Credit Deed of Trust, The Bank of New York Mellon Trust Company, N.A., as beneficiary under the Second Lien Indenture Deed of Trust, Citibank, N.A., as beneficiary under the First Lien Indenture Deed of Trust, Texas Competitive Electric Holdings Company LLC and the subsidiary guarantors party thereto. |
| | | | | | | | | |
| | | Energy Future Intermediate Holding Company LLC |
| | | | | | | | | |
| 4(sss) | | 1-12833 Form 8-K (filed
November 20, 2009) | | 4.2 | | — | | Indenture, dated November 16, 2009, among Energy Future Intermediate Holding Company LLC, EFIH Finance Inc. and The Bank of New York Mellon Trust Company, N.A., as trustee, relating to 9.75% Senior Secured Notes due 2019. |
| | | | | | | | | |
| 4(ttt) | | 1-12833 Form 8-K
(filed January 30, 2013) | | 4.3 | | — | | Supplemental Indenture, dated January 25, 2013, to the indenture, dated November 16, 2009, among Energy Future Intermediate Holding Company LLC, EFIH Finance Inc. and The Bank of New York Mellon Trust Company, N.A., as trustee, relating to 9.75% Senior Secured Notes due 2019. |
| | | | | | | | | |
| 4(vvv) | | 1-12833 Form 8-K
(filed August 18, 2010) | | 4.1 | | — | | Indenture, dated August 17, 2010, among Energy Future Intermediate Holding Company LLC, EFIH Finance Inc. and The Bank of New York Mellon Trust Company, N.A., as trustee, relating to 10.000% Senior Secured Notes due 2020. |
| | | | | | | | | |
| 4(www) | | 1-12833 Form 8-K
(filed January 30, 2013) | | 4.4 | | — | | First Supplemental Indenture, dated January 29, 2013, to the indenture, dated August 17, 2010, among Energy Future Intermediate Holding Company LLC, EFIH Finance Inc. and The Bank of New York Mellon Trust Company, N.A., as trustee, relating to 10.000% Senior Secured Notes due 2020. |
| | | | | | | | | |
| 4(xxx) | | 1-12833 Form 10-Q (Quarter ended March 31, 2013) (filed May 2, 2013) | | 4(n) | | — | | Second Supplemental Indenture, dated March 21, 2013, to the Indenture dated August 17, 2010, among Energy Future Intermediate Holding Company LLC, EFIH Finance Inc. and The Bank of New York Mellon Trust Company, N.A., as trustee, relating to 10.000% Senior Secured Notes due 2020. |
| | | | | | | | | |
| 4(yyy) | | 1-12833 Form 10-Q (Quarter ended March 31, 2011)
(filed April 29, 2011) | | 4(e) | | — | | Indenture, dated as of April 25, 2011, among Energy Future Intermediate Holding Company LLC, EFIH Finance, Inc. and The Bank of New York Mellon Trust Company, N.A., as trustee, relating to 11% Senior Secured Second Lien Notes due 2021. |
| | | | | | | | | |
| 4(zzz) | | 1-12833 Form 8-K (filed February 7, 2012) | | 4.1 | | — | | First Supplemental Indenture, dated February 6, 2012, to the indenture dated April 25, 2011, among Energy Future Intermediate Holding Company LLC, EFIH Finance Inc. and The Bank of New York Mellon Trust Company, N.A., as Trustee, relating to 11.750% Senior Secured Second Lien Notes due 2022. |
| | | | | | | | | |
| 4(aaaa) | | 1-12833 Form 8-K (filed February 29, 2012) | | 4.1 | | — | | Second Supplemental Indenture, dated February 28, 2012, to the indenture dated April 25, 2011, among Energy Future Intermediate Holding Company LLC, EFIH Finance Inc. and The Bank of New York Mellon Trust Company, N.A., as Trustee, relating to 11.750% Senior Secured Second Lien Notes due 2022. |
| | | | | | | | | |
| 4(bbbb) | | 1-12833 Form 10-Q (Quarter ended June 30, 2012)
(filed July 31, 2012) | | 4(a) | | — | | Third Supplemental Indenture, dated May 31, 2012, to the indenture dated April 25, 2011, among Energy Future Intermediate Holding Company LLC, EFIH Finance Inc. and The Bank of New York Mellon Trust Company, N.A., as Trustee, relating to 11.750% Senior Secured Second Lien Notes due 2022. |
| | | | | | | | | |
| 4(cccc) | | 1-12833 Form 8-K
(filed August 17, 2012) | | 4.2 | | — | | Fourth Supplemental Indenture, dated August 14, 2012, among Energy Future Intermediate Holding Company LLC, EFIH Finance Inc. and the Bank of New York Mellon Trust Company, N.A., as trustee, relating to 11.75% Senior Secured Second Lien Notes due 2022. |
| | | | | | | | | |
|
| | | | | | | | |
| Exhibits | | Previously Filed* With File Number | | As Exhibit | | | | |
| 4(dddd) | | 1-12833 Form 8-K
(filed August 17, 2012) | | 4.1 | | — | | Indenture, dated August 14, 2012, among Energy Future Intermediate Holding Company LLC, EFIH Finance Inc. and the Bank of New York Mellon Trust Company, N.A., as trustee, relating to 6.875% Senior Secured Notes due 2017. |
| | | | | | | | | |
| 4(eeee) | | 1-12833 Form 8-K
(filed October 24, 2012) | | 4.1 | | — | | First Supplemental Indenture, dated October 23, 2012, to the indenture dated August 14, 2012, among Energy Future Intermediate Holding Company LLC, EFIH Finance Inc., and the Bank of New York Mellon Trust Company, N.A., as trustee, relating to 6.875% Senior Secured Notes due 2017. |
| | | | | | | | | |
| 4(ffff) | | 1-12833 Form 8-K (filed December 5, 2012) | | 4.1 | | — | | Indenture, dated December 5, 2012, among Energy Future Intermediate Holding Company LLC, EFIH Finance Inc., and the Bank of New York Mellon Trust Company, N.A., as trustee, relating to 11.25%/12.25% Senior Toggle Notes due 2018. |
| | | | | | | | | |
| 4(gggg) | | 1-12833 Form 8-K (filed December 21, 2012) | | 4.1 | | — | | First Supplemental Indenture, dated December 19, 2012, to the indenture dated December 5, 2012, among Energy Future Intermediate Holding Company LLC, EFIH Finance Inc., and the Bank of New York Mellon Trust Company, N.A., as trustee, relating to 11.25%/12.25% Senior Toggle Notes due 2018. |
| | | | | | | | | |
| 4(hhhh) | | 1-12833 Form 8-K (filed January 30, 2013) | | 4.5 | | — | | Second Supplemental Indenture, dated January 29, 2013, to the indenture dated December 5, 2012, among Energy Future Intermediate Holding Company LLC, EFIH Finance Inc., and the Bank of New York Mellon Trust Company, N.A., as trustee, relating to 11.25%/12.25% Senior Toggle Notes due 2018. |
| | | | | | | | | |
| 4(iiii) | | 1-12833 Form 10-K (2012) (filed February 19, 2013) | | 4(uuu) | | — | | Third Supplemental Indenture, dated January 30, 2013, to the indenture, dated December 5, 2012, among Energy Future Intermediate Holding Company LLC, EFIH Finance Inc., and the Bank of New York Mellon Trust Company, N.A., as trustee, relating to 11.25%/12.25% Senior Toggle Notes due 2018. |
| | | | | | | | | |
| 4(jjjj) | | 1-12833 Form 10-Q (Quarter ended March 31, 2011)
(filed April 29, 2011) | | 4(f) | | — | | Junior Lien Pledge Agreement, dated as of April 25, 2011, from Energy Future Intermediate Holding Company LLC, as pledgor, to The Bank of New York Mellon Trust Company, N.A., as collateral trustee. |
| | | | | | | | | |
| (10) | | Material Contracts |
| | | | | | | | | |
| | | Management Contracts; Compensatory Plans, Contracts and Arrangements |
| | | | | | | | | |
| 10(a) | | 1-12833 Form 8-K
(filed May 23, 2005) | | 10.6 | | — | | Energy Future Holdings Corp. Executive Change in Control Policy effective May 20, 2005. |
| | | | | | | | | |
| 10(b) | | 333-153529 Amendment No. 2 to Form S-4 (filed December 23, 2008) | | 10(p) | | — | | Amendment to the Energy Future Holdings Corp. Executive Change in Control Policy, dated December 23, 2008. |
| | | | | | | | | |
| 10(c) | | 1-12833 Form 10-K (2010)
(filed February 18, 2011) | | 10(e) | | — | | Amendment to the Energy Future Holdings Corp. Executive Change in Control Policy, dated December 20, 2010. |
| | | | | | | | | |
| 10(d) | | 1-12833 Form 8-K
(filed May 23, 2005) | | 10.7 | | — | | Energy Future Holdings Corp. 2005 Executive Severance Plan and Summary Plan Description. |
| | | | | | | | | |
| 10(e) | | 333-153529 Amendment No. 2 to Form S-4 (filed December 23, 2008) | | 10(n) | | — | | Amendment to the Energy Future Holdings Corp. 2005 Executive Severance Plan and Summary Plan Description, dated December 23, 2008. |
| | | | | | | | | |
| 10(f) | | 1-12833 Form 10-K (2010)
(filed February 18, 2011) | | 10(f) | | — | | Amendment to the Energy Future Holdings Corp. 2005 Executive Severance Plan and Summary Plan Description, dated December 10, 2010. |
| | | | | | | | | |
|
| | | | | | | | |
| Exhibits | | Previously Filed* With File Number | | As Exhibit | | | | |
| 10(g) | | 1-12833 Form 10-K (2007)
(filed March 31, 2008) | | 10(a) | | — | | 2007 Stock Incentive Plan for Key Employees of Energy Future Holdings Corp. and its affiliates. |
| | | | | | | | | |
| 10(h) | | 1-12833 Form 10-K (2009)
(filed February 19, 2010) | | 10(ii) | | — | | Amendment No. 1 to the 2007 Stock Incentive Plan for Key Employees of Energy Future Holdings Corp. and its Affiliates, dated July 14, 2009, effective as of December 23, 2008. |
| | | | | | | | | |
| 10(i) | | 1-12833 Form 10-K (2010)
(filed February 18, 2011) | | 10(i) | | — | | EFH Executive Annual Incentive Plan, effective as of January 1, 2010. |
| | | | | | | | | |
| 10(j) | | 1-12833 Form 10-K (2008)
(filed March 3, 2009) | | 10(q) | | — | | EFH Second Supplemental Retirement Plan, effective as of October 10, 2007. |
| | | | | | | | | |
| 10(k) | | 1-12833 Form 10-K (2009)
(filed February 19, 2010) | | 10(ee) | | — | | Amendment to EFH Second Supplemental Retirement Plan, dated July 31, 2009. |
| | | | | | | | | |
| 10(l) | | 1-12833 Form 10-K (2010)
(filed February 18, 2011) | | 10(l) | | — | | Second Amendment to EFH Second Supplemental Retirement Plan, dated April 9, 2010 with effect as of January 1, 2010. |
| | | | | | | | | |
| 10(m) | | 1-12833 Form 10-K (2010)
(filed February 18, 2011) | | 10(m) | | — | | Third Amendment to EFH Second Supplemental Retirement Plan, dated April 21, 2010 with effect as of January 1, 2010. |
| | | | | | | | | |
| 10(n) | | 1-12833 Form 10-K (2011)
(filed February 21, 2012) | | 10(n) | | — | | Fourth Amendment to EFH Second Supplemental Retirement Plan, dated June 17, 2011. |
| | | | | | | | | |
| 10(o) | | 1-12833 Form 10-K (2009)
(filed February 19, 2010) | | 10(dd) | | — | | EFH Salary Deferral Program, effective January 1, 2010. |
| | | | | | | | | |
| 10(p) | | 1-12833 Form 10-K (2010)
(filed February 18, 2011) | | 10(o) | | — | | Amendment to EFH Salary Deferral Program, effective January 20, 2011. |
| | | | | | | | | |
| 10(q) | | 1-12833 Form 10-K (2011)
(filed February 21, 2012) | | 10(q) | | — | | Second Amendment to EFH Salary Deferral Program, dated June 17, 2011. |
| | | | | | | | | |
| 10(r) | | 1-12833 Form 10-Q (Quarter ended September 30, 2012)
(filed October 30, 2012) | | 10(a) | | — | | Third Amendment to the EFH Salary Deferral Program, effective September 20, 2012. |
| | | | | | | | | |
| 10(s) | | 1-12833 Form 10-K (2007)
(filed March 31, 2008) | | 10(b) | | — | | Registration Rights Agreement, dated October 10, 2007, among Texas Energy Future Holdings Limited Partnership, Energy Future Holdings Corp. and the stockholders party thereto. |
| | | | | | | | | |
| 10(t) | | 1-12833 Form 10-Q (Quarter ended March 31, 2008) (filed May 15, 2008) | | 10(a) | | — | | Form of Stockholder’s Agreement (for Directors) among Energy Future Holdings Corp., Texas Energy Future Holdings Limited Partnership and the stockholder party thereto. |
| | | | | | | | | |
| 10(u) | | 1-12833 Form 10-Q (Quarter ended March 31, 2008) (filed May 15, 2008) | | 10(b) | | — | | Form of Sale Participation Agreement (for Directors) between Texas Energy Future Holdings Limited Partnership and the stockholder party hereto. |
| | | | | | | | | |
| 10(v) | | 1-12833 Form 10-Q (Quarter ended June 30, 2008) (filed August 14, 2008) | | 10(f) | | — | | Form of Management Stockholder’s Agreement (For Executive Officers) among Energy Future Holdings Corp., Texas Energy Future Holdings Limited Partnership and the stockholder party thereto. |
| | | | | | | | | |
|
| | | | | | | | |
| Exhibits | | Previously Filed* With File Number | | As Exhibit | | | | |
| 10(w) | | 1-12833 Form 10-Q (Quarter ended June 30, 2008) (filed August 14, 2008) | | 10(g) | | — | | Form of Sale Participation Agreement (For Executive Officers) between Texas Energy Future Holdings Limited Partnership and the stockholder party thereto. |
| | | | | | | | | |
| 10(x) | | 1-12833 Form 10-K (2009)
(filed February 19, 2010) | | 10(m) | | — | | Form of Amended and Restated Non-Qualified Stock Option Agreement (For Executive Officers) between Energy Future Holdings Corp. and the optionee thereto. |
| | | | | | | | | |
| 10(y) | | 1-12833 Form 10-Q (Quarter ended September 30, 2011) (filed October 28, 2011) | | 10(i) | | — | | Form of Restricted Stock Unit Agreement between Energy Future Holdings Corp. and the stockholder party thereto. |
| | | | | | | | | |
| 10(z) | | 1-12833 Form 10-K (2011)
(filed February 21, 2012) | | 10(y) | | — | | EFH Corp. Retention Award Plan (For Key Employees), effective December 20, 2011. |
| | | | | | | | | |
| 10(aa) | | 1-12833 Form 10-K (2011)
(filed February 21, 2012) | | 10(z) | | — | | Form of Participation Agreement (For Key Employees) between Energy Future Holdings Corp. and the participant party thereto. |
| | | | | | | | | |
| 10(bb) | | | | | | — | | Energy Future Holdings Corp. Non-Employee Director Compensation Arrangements. |
| | | | | | | | | |
| 10(cc) | | 1-12833 Form 10-K (2013)
(filed April 30, 2014) | | 10(cc) | | — | | Amended and Restated Employment Agreement, dated April 23, 2014, between Energy Future Holdings Corp. and Donald L. Evans. |
| | | | | | | | | |
| 10(dd) | | | | | | — | | Amended and Restated Employment Agreement, dated March 30, 2015, between Energy Future Holdings Corp. and John Young. |
| | | | | | | | | |
| 10(ee) | | 1-12833 Form 10-K (2007)
(filed March 31, 2008) | | 10(r) | | — | | Management Stockholder’s Agreement, dated February 1, 2008, among Energy Future Holdings Corp., Texas Energy Future Holdings Limited Partnership and John Young. |
| | | | | | | | | |
| 10(ff) | | 1-12833 Form 10-K (2007)
(filed March 31, 2008) | | 10(s) | | — | | Sale Participation Agreement, dated February 1, 2008, between Texas Energy Future Holdings Limited Partnership and John F. Young. |
| | | | | | | | | |
| 10(gg) | | | | | | — | | Amended and Restated Employment Agreement, dated March 27, 2015, between EFH Corporate Services Company, Energy Future Holdings Corp. and Paul Keglevic. |
| | | | | | | | | |
| 10(hh) | | | | | | — | | Amended and Restated Employment Agreement, dated March 27, 2015, between TXU Energy Retail Company LLC, Energy Future Holdings Corp. and James A. Burke. |
| | | | | | | | | |
| 10(ii) | | 1-12833 Form 10-K (2007)
(filed March 31, 2008) | | 10(ff) | | — | | Additional Payment Agreement, dated October 10, 2007, among Energy Future Holdings Corp., Texas Energy Future Holdings Limited Partnership, Texas Competitive Electric Holdings Company LLC and James Burke. |
| | | | | | | | | |
| 10(jj) | | 1-12833 Form 10-K (2007)
(filed March 31, 2008) | | 10(nn) | | — | | Deferred Share Agreement, dated October 9, 2007, between Texas Energy Future Holdings Limited Partnership and James Burke. |
| | | | | | | | | |
| 10(kk) | | | | | | — | | Amended and Restated Employment Agreement, dated March 27, 2015, between Luminant Holding Company LLC, Energy Future Holdings Corp. and Mark Allen McFarland. |
| | | | | | | | | |
| 10(ll) | | | | | | — | | Amended and Restated Employment Agreement, dated March 27, 2015, between EFH Corporate Services Company, Energy Future Holdings Corp. and John D. O'Brien, Jr. |
| | | | | | | | | |
|
| | | | | | | | |
| Exhibits | | Previously Filed* With File Number | | As Exhibit | | | | |
| 10(mm) | | | | | | — | | Amended and Restated Employment Agreement, dated March 27, 2015, between EFH Corporate Services Company, Energy Future Holdings Corp. and Stacey H. Doré. |
| | | | | | | | | |
| 10(nn) | | | | | | — | | Amended and Restated Employment Agreement, dated March 27, 2015, between EFH Corporate Services Company, Energy Future Holdings Corp. and Carrie L. Kirby. |
| | | | | | | | | |
| | | Credit Agreements and Related Agreements |
| | | | | | | | | |
| 10(oo) | | 333-100240 Form 8-K
(filed October 11, 2011) | | 10.1 | | — | | Amended and Restated Revolving Credit Agreement, dated as of October 11, 2011, among Oncor Electric Delivery Company LLC, as borrower, the lenders listed therein, JPMorgan Chase Bank, N.A., as administrative agent for the lenders, JPMorgan Chase Bank, N.A., as swingline lender, and JPMorgan Chase Bank, N.A., Barclays Bank PLC, The Royal Bank of Scotland plc, Bank of America, N.A. and Citibank N.A., as fronting banks for letters of credit issued thereunder. |
| | | | | | | | | |
| 10(pp) | | 333-100240 Form 8-K
(filed May 15, 2012) | | 10.1 | | — | | Joinder Agreement, dated as of May 15, 2012, by and among Oncor, as Borrower, JPMorgan Chase Bank, N.A., as administrative agent under the Credit Agreement, swingline lender and fronting bank, Barclays Bank PLC, Bank of America, N.A., Citibank, N.A. and The Royal Bank of Scotland PLC, as fronting banks, and each party identified as an “Incremental Lender” on the signature pages thereto. |
| | | | | | | | | |
| 10(qq) | | 333-171253 Post-Effective Amendment #1 to
Form S-4
(filed February 7, 2011) | | 10(rr) | | — | | $24,500,000,000 Credit Agreement, dated October 10, 2007, among Energy Future Competitive Holdings Company; Texas Competitive Electric Holdings Company LLC, as the borrower; the several lenders from time to time parties thereto; Citibank, N.A., as administrative agent, collateral agent, swingline lender, revolving letter of credit issuer and deposit letter of credit issuer; Goldman Sachs Credit Partners L.P., as posting agent, posting syndication agent and posting documentation agent; JPMorgan Chase Bank, N.A., as syndication agent and revolving letter of credit issuer; Citigroup Global Markets Inc., J.P. Morgan Securities Inc., Goldman Sachs Credit Partners L.P., Lehman Brothers Inc., Morgan Stanley Senior Funding, Inc. and Credit Suisse Securities (USA) LLC, as joint lead arrangers and bookrunners; Goldman Sachs Credit Partners L.P., as posting lead arranger and bookrunner; Credit Suisse, Goldman Sachs Credit Partners L.P., Lehman Commercial Paper Inc., Morgan Stanley Senior Funding, Inc., as co-documentation agents; and J. Aron & Company, as posting calculation agent. |
| | | | | | | | | |
| 10(rr) | | 1-12833 Form 8-K
(filed August 10, 2009) | | 10.1 | | — | | Amendment No. 1, dated August 7, 2009, to the $24,500,000,000 Credit Agreement. |
| | | | | | | | | |
| 10(ss) | | 1-12833 Form 8-K
(filed April 20, 2011) | | 10.1 | | — | | Amendment No. 2, dated April 7, 2011, to the $24,500,000,000 Credit Agreement. |
| | | | | | | | | |
| 10(tt) | | 1-12833 Form 8-K
(filed January 7, 2013) | | 10.1 | | — | | December 2012 Extension Amendment, dated January 4, 2013, to the $24,500,000,000 Credit Agreement. |
| | | | | | | | | |
| 10(uu) | | 1-12833 Form 8-K
(filed January 7, 2013) | | 10.2 | | — | | Incremental Amendment No. 1, dated January 4, 2013, to the $24,500,000,000 Credit Agreement. |
| | | | | | | | | |
| 10(vv) | | 1-12833 Form 10-K (2007)
(filed March 31, 2008) | | 10(ss) | | — | | Guarantee, dated October 10, 2007, by the guarantors party thereto in favor of Citibank, N.A., as collateral agent for the benefit of the secured parties under the $24,500,000,000 Credit Agreement, dated October 10, 2007. |
| | | | | | | | | |
| 10(ww) | | 1-12833 Form 10-K (2007)
(filed March 31, 2008) | | 10(vv) | | — | | Form of Deed of Trust, Assignment of Leases and Rents, Security Agreement and Fixture Filing to Fidelity National Title Insurance Company, as trustee, for the benefit of Citibank, N.A., as beneficiary. |
| | | | | | | | | |
|
| | | | | | | | |
| Exhibits | | Previously Filed* With File Number | | As Exhibit | | | | |
| 10(xx) | | 1-12833 Form 10-Q (Quarter ended March 31, 2011) (filed April 29, 2011) | | 10(b) | | — | | Form of First Amendment to Deed of Trust, Assignment of Leases and Rents, Security Agreement and Fixture Filing to Fidelity National Title Insurance Company, as trustee, for the benefit of Citibank, N.A., as Beneficiary. |
| | | | | | | | | |
| 10(yy) | | 1-12833 Form 8-K
(filed August 10, 2009) | | 10.2 | | — | | Amended and Restated Collateral Agency and Intercreditor Agreement, dated October 10, 2007, as amended and restated as of August 7, 2009, among Energy Future Competitive Holdings Company; Texas Competitive Electric Holdings Company LLC; the subsidiary guarantors party thereto; Citibank, N.A., as administrative agent and collateral agent; Credit Suisse Energy LLC, J. Aron & Company, Morgan Stanley Capital Group Inc., Citigroup Energy Inc., each as a secured hedge counterparty; and any other person that becomes a secured party pursuant thereto. |
| | | | | | | | | |
| 10(zz) | | 1-12833 Form 8-K
(filed August 10, 2009) | | 10.3 | | — | | Amended and Restated Security Agreement, dated October 10, 2007, as amended and restated as of August 7, 2009, among Texas Competitive Electric Holdings Company LLC, the subsidiary grantors party thereto, and Citibank, N.A., as collateral agent for the benefit of the first lien secured parties, including the secured parties under the $24,500,000,000 Credit Agreement, dated October 10, 2007. |
| | | | | | | | | |
| 10(aaa) | | 1-12833 Form 8-K
(filed August 10, 2009) | | 10.4 | | — | | Amended and Restated Pledge Agreement, dated October 10, 2007, as amended and restated as of August 7, 2009, among Energy Future Competitive Holdings Company, Texas Competitive Electric Holdings Company LLC, the subsidiary pledgors party thereto, and Citibank, N.A., as collateral agent for the benefit first lien secured parties, including the secured parties under the $24,500,000,000 Credit Agreement, dated October 10, 2007. |
| | | | | | | | | |
| 10(bbb) | | 1-12833
Form 8-K
filed November 20, 2009) | | 4.3 | | — | | Pledge Agreement, dated November 16, 2009, made by Energy Future Intermediate Holding Company LLC and the additional pledgers to The Bank of New York Mellon Trust Company, N.A., as collateral trustee for the holders of parity lien obligations. |
| | | | | | | | | |
| 10(ccc) | | 1-12833
Form 8-K
(filed November 20, 2009) | | 4.4 | | — | | Collateral Trust Agreement, dated November 16, 2009, among Energy Future Intermediate Holding Company LLC, The Bank of New York Mellon Trust Company, N.A., as first lien trustee and as collateral trustee, and the other secured debt representatives party thereto. |
| | | | | | | | | |
| | | Other Material Contracts |
| | | | | | | | | |
| 10(ddd) | | 1-12833 Form 10-K (2003)
(filed March 15, 2004) | | 10(qq) | | — | | Lease Agreement, dated February 14, 2002, between State Street Bank and Trust Company of Connecticut, National Association, an owner trustee of ZSF/Dallas Tower Trust, a Delaware grantor trust, as lessor and EFH Properties Company, as Lessee (Energy Plaza Property). |
| | | | | | | | | |
| 10(eee) | | 1-12833 Form 10-Q (Quarter ended June 30, 2007) (filed August 9, 2007) | | 10.1 | | — | | First Amendment, dated June 1, 2007, to Lease Agreement, dated February 14, 2002. |
| | | | | | | | | |
| 10(fff) | | 333-100240 Form 10-K (2004)
(filed March 23, 2005) | | 10(i) | | — | | Agreement, dated March 10, 2005, between Oncor Electric Delivery Company LLC and TXU Energy Company LLC, allocating to Oncor Electric Delivery Company LLC the pension and post-retirement benefit costs for all Oncor Electric Delivery Company LLC employees who had retired or had terminated employment as vested employees prior to January 1, 2002. |
| | | | | | | | | |
|
| | | | | | | | |
| Exhibits | | Previously Filed* With File Number | | As Exhibit | | | | |
| 10(ggg) | | 1-12833 Form 10-K (2006)
(filed March 2, 2007) | | 10(iii) | | — | | Amended and Restated Transaction Confirmation by Generation Development Company LLC, dated February 2007 (subsequently assigned to Texas Competitive Electric Holdings Company LLC on October 10, 2007) (confidential treatment has been requested for portions of this exhibit). |
| | | | | | | | | |
| 10(hhh) | | 1-12833 Form 10-K (2007)
(filed March 31, 2008) | | 10(eee) | | — | | Stipulation as approved by the PUCT in Docket No. 34077. |
| | | | | | | | | |
| 10(iii) | | 1-12833 Form 10-K (2007)
(filed March 31, 2008) | | 10(fff) | | — | | Amendment to Stipulation Regarding Section 1, Paragraph 35 and Exhibit B in Docket No. 34077. |
| | | | | | | | | |
| 10(jjj) | | 333-100240 Form 10-K (2010) (filed February 18, 2011) | | 10(ae) | | — | | PUCT Order on Rehearing in Docket No. 34077. |
| | | | | | | | | |
| 10(kkk) | | 1-12833 Form 10-K (2007)
(filed March 31, 2008) | | 10(sss) | | — | | ISDA Master Agreement, dated October 25, 2007, between Texas Competitive Electric Holdings Company LLC and Goldman Sachs Capital Markets, L.P. |
| | | | | | | | | |
| 10(lll) | | 1-12833 Form 10-K (2007)
(filed March 31, 2008) | | 10(ttt) | | — | | Schedule to the ISDA Master Agreement, dated October 25, 2007, between Texas Competitive Electric Holdings Company LLC and Goldman Sachs Capital Markets, L.P. |
| | | | | | | | | |
| 10(mmm) | | 1-12833 Form 10-K (2007)
(filed March 31, 2008) | | 10(uuu) | | — | | Form of Confirmation between Texas Competitive Electric Holdings Company LLC and Goldman Sachs Capital Markets, L.P. |
| | | | | | | | | |
| 10(nnn) | | 1-12833 Form 10-K (2007)
(filed March 31, 2008) | | 10(vvv) | | — | | ISDA Master Agreement, dated October 29, 2007, between Texas Competitive Electric Holdings Company LLC and Credit Suisse International. |
| | | | | | | | | |
| 10(ooo) | | 1-12833 Form 10-K (2007)
(filed March 31, 2008) | | 10(www) | | — | | Schedule to the ISDA Master Agreement, dated October 29, 2007, between Texas Competitive Electric Holdings Company LLC and Credit Suisse International. |
| | | | | | | | | |
| 10(ppp) | | 1-12833 Form 10-K (2007)
(filed March 31, 2008) | | 10(xxx) | | — | | Form of Confirmation between Texas Competitive Electric Holdings Company LLC and Credit Suisse International. |
| | | | | | | | | |
| 10(qqq) | | 1-12833 Form 10-K (2007)
(filed March 31, 2008) | | 10(yyy) | | — | | Management Agreement, dated October 10, 2007, among Energy Future Holdings Corp., Texas Energy Future Holdings Limited Partnership, Kohlberg Kravis Roberts & Co. L.P., TPG Capital, L.P., Goldman, Sachs & Co. and Lehman Brothers Inc. |
| | | | | | | | | |
| 10(rrr) | | 1-12833 Form 10-K (2007)
(filed March 31, 2008) | | 10(cccc) | | — | | Indemnification Agreement, dated October 10, 2007, among Texas Energy Future Holdings Limited Partnership, Energy Future Holdings Corp., Kohlberg Kravis Roberts & Co., L.P., TPG Capital, L.P. and Goldman, Sachs & Co. |
| | | | | | | | | |
| 10(sss) | | 1-12833 Form 10-Q (Quarter ended September 30, 2008) (filed November 6, 2008) | | 10(g) | | — | | Second Amended and Restated Limited Liability Company Agreement of Oncor Electric Delivery Holdings Company LLC, dated November 5, 2008. |
| | | | | | | | | |
| 10(ttt) | | 333-100240 Form 10-K (2008)
(filed March 3, 2009) | | 3(c) | | — | | Amendment No. 1, dated February 18, 2009, to Second Amended and Restated Limited Liability Company Agreement of Oncor Electric Delivery LLC. |
| | | | | | | | | |
| 10(uuu) | | 333-100240 Form 10-Q (Quarter ended September 30, 2008) (filed November 6, 2008) | | 4(c) | | — | | Investor Rights Agreement, dated November 5, 2008, among Oncor Electric Delivery Company LLC, Oncor Electric Delivery Holdings Company LLC, Texas Transmission Investment LLC and Energy Future Holdings Corp. |
| | | | | | | | | |
|
| | | | | | | | |
| Exhibits | | Previously Filed* With File Number | | As Exhibit | | | | |
| 10(vvv) | | 333-100240 Form 10-Q (Quarter ended September 30, 2008) (filed November 6, 2008) | | 4(d) | | — | | Registration Rights Agreement, dated November 5, 2008, among Oncor Electric Delivery Company LLC, Oncor Electric Delivery Holdings Company LLC, Texas Transmission Investment LLC and Energy Future Holdings Corp. |
| | | | | | | | | |
| 10(www) | | 333-100240 Form 10-Q (Quarter ended September 30, 2008) (filed November 6, 2008) | | 10(b) | | — | | Amended and Restated Tax Sharing Agreement, dated November 5, 2008, among Oncor Electric Delivery Company LLC, Oncor Electric Delivery Holdings Company LLC, Oncor Management Investment LLC, Texas Transmission Investment LLC, Energy Future Intermediate Holding Company LLC and Energy Future Holdings Corp. |
| | | | | | | | | |
| 10(xxx) | | 1-12833 Form 10-Q (Quarter ended September 30, 2012)
(filed October 30, 2012) | | 10(b) | | — | | Federal and State Income Tax Allocation Agreement, effective January 1, 2010, by and among members of the Energy Future Holdings Corp. consolidated group. |
| | | | | | | | | |
| 10(yyy) | | 1-12833
Form 8-K
(filed December 6, 2012) | | 10.1 | | — | | First Lien Trade Receivables Financing Agreement, dated as of November 30, 2012, among TXU Energy Receivables Company LLC, as Borrower, TXU Energy Retail Company LLC, as Collection Agent, certain Investors, CitiBank, N.A., as the Initial Bank, and CitiBank, N.A., as Administrative Agent and as a Group Managing Agent. |
| | | | | | | | | |
| 10(zzz) | | 1-12833
Form 8-K
(filed December 6, 2012) | | 10.2 | | — | | Trade Receivables Sale Agreement, dated as of November 30, 2012, among TXU Energy Retail Company LLC, as Originator, as Collection Agent and as Originator Agent and TXU Energy Receivables Company LLC, as Buyer, and Energy Future Holdings Corp. |
| | | | | | | | | |
| 10(aaaa) | | 1-12833 Form 10-K/A (2013)
(filed May 1, 2014) | | 10(cccc) | | — | | Restructuring Support and Lock-Up Agreement, dated April 29, 2014, by and among EFH Corp. and the parties thereto. |
| | | | | | | | | |
| 10(bbbb) | | 1-12833 Form 8-K
(filed May 13, 2014) | | 99.1 | | — | | First Amendment to the Restructuring Support and Lock-Up Agreement dated May 7, 2014, among EFH Corp. and the parties thereto. |
| | | | | | | | | |
| 10(cccc) | | 1-12833 Form 8-K
(filed May 27, 2014) | | 99.2 | | — | | Second Amendment to the Restructuring Support and Lock-Up Agreement dated May 16, 2014, among the Reorganizing Entities and the other parties thereto. |
| | | | | | | | | |
| | | Debtor-In-Possession Facilities |
| | | | | | | | | |
| 10(dddd) | | 1-12833 Form 8-K
(filed May 7, 2014) | | 10.1 | | — | | Senior Secured Superpriority Debtor-in-Possession Credit Agreement dated as of May 5, 2014 among EFCH, as Parent Guarantor, TCEH, as Borrower, the Several Lenders from Time to Time Parties Thereto, Citibank, N.A., as Administrative Agent and Collateral Agent, the Co-Syndication Agents Parties Thereto, the Co-Documentation Agents Parties thereto and the Joint Lead Arrangers and Joint Bookrunners Parties thereto. |
| | | | | | | | | |
| 10(eeee) | | 1-12833 Form 8-K
(filed June 25, 2014) | | 10(a) | | — | | Senior Secured Superpriority Debtor-In-Possession Credit Agreement, dated as of June 19, 2014, among the EFIH Debtors, the lenders party thereto, Deutsche Bank AG New York Branch, as Administrative Agent and Collateral Agent, Citibank, N.A., Bank of America, N.A. and Morgan Stanley Senior Funding, Inc., as Co-Syndication Agents, Barclays Bank PLC, Royal Bank of Canada and Union Bank, N.A., as Co-Documentation Agents, Deutsche Bank Securities Inc., Citigroup Global Markets Inc., Merrill Lynch, Pierce, Fenner & Smith Incorporated, Morgan Stanley Senior Funding, Inc., Barclays Bank PLC, RBC Capital Markets and Union Bank, N.A., as Joint Lead Arrangers and Joint Bookrunners, and Loop Capital Markets, LLC and Williams Capital Group, LLC, as Co-Managers. |
| | | | | | | | | |
|
| | | | | | | | |
| Exhibits | | Previously Filed* With File Number | | As Exhibit | | | | |
| 10(ffff) | | 1-12833 Form 8-K
(filed June 25, 2014) | | 10(b) | | — | | Pledge Agreement, dated as of June 19, 2014, by and among the EFIH Debtors and Deutsche Bank AG New York Branch, as collateral agent. |
| | | | | | | | | |
| 10(gggg) | | 1-12833 Form 8-K
(filed June 25, 2014) | | 10(c) | | — | | Security Agreement, dated as of June 19, 2014, by and among the EFIH Debtors and Deutsche Bank AG New York Branch, as collateral agent. |
| | | | | | | | | |
| 10(hhhh) | | 1-12833 Form 8-K
(filed June 25, 2014) | | 10(d) | | — | | Amendment No. 1 to the TCEH DIP Credit Agreement, dated May 13, 2014, among the TCEH Debtors and the other parties thereto. |
| | | | | | | | | |
| 10(iiii) | | 1-12833 Form 8-K
(filed June 25, 2014) | | 10(e) | | — | | Amendment No. 2 to the TCEH DIP Credit Agreement, dated June 12, 2014, among the TCEH Debtors and the other parties thereto. |
| | | | | | | | | |
| 10(jjjj) | | | | | | | | Amendment No. 3 to the TCEH DIP Credit Agreement, dated November 6, 2014, among the TCEH Debtors and the other parties thereto. |
| | | | | | | | | |
| (12) | | Statement Regarding Computation of Ratios |
| | | | | | | | | |
| 12(a) | | | | | | — | | Computation of Ratio of Earnings to Fixed Charges. |
| | | | | | | | | |
| (21) | | Subsidiaries of the Registrant |
| | | | | | | | | |
| 21(a) | | | | | | — | | Subsidiaries of Energy Future Holdings Corp. |
| | | | | | | | | |
| (23) | | Consent of Experts |
| | | | | | | | | |
| 23(a) | | | | | | — | | Consent of Deloitte & Touche LLP, an independent registered public accounting firm, relating to the consolidated financial statements of Energy Future Holdings Corp. |
| | | | | | | | | |
| 23(b) | | | | | | — | | Consent of Deloitte & Touche LLP, an independent registered public accounting firm, relating to the consolidated financial statements of Oncor Electric Delivery Holdings Company LLC |
| | | | | | | | | |
| 31 | | Rule 13a - 14(a)/15d-14(a) Certifications |
| | | | | | | | | |
| 31(a) | | | | | | — | | Certification of John F. Young, principal executive officer of Energy Future Holdings Corp., pursuant to Section 302 of the Sarbanes-Oxley Act of 2002. |
| | | | | | | | | |
| 31(b) | | | | | | — | | Certification of Paul M. Keglevic, principal financial officer of Energy Future Holdings Corp., pursuant to Section 302 of the Sarbanes-Oxley Act of 2002. |
| | | | | | | | | |
| 32 | | Section 1350 Certifications |
| | | | | | | | | |
| 32(a) | | | | | | — | | Certification of John F. Young, principal executive officer of Energy Future Holdings Corp., pursuant to 18 U.S.C. Section 1350, as adopted pursuant to Section 906 of the Sarbanes-Oxley Act of 2002. |
| | | | | | | | | |
| 32(b) | | | | | | — | | Certification of Paul M. Keglevic, principal financial officer of Energy Future Holdings Corp., pursuant to 18 U.S.C. Section 1350, as adopted pursuant to Section 906 of the Sarbanes-Oxley Act of 2002. |
| | | | | | | | | |
| (95) | | Mine Safety Disclosures |
| | | | | | | | | |
| 95(a) | | | | | | — | | Mine Safety Disclosures |
| | | | | | | | | |
| | | | | | | | | |
| (99) | | Additional Exhibits |
| | | | | | | | | |
| 99(a) | | 33-55408 Post-Effective Amendment No. 1 to Form S-3 (filed July, 1993) | | 99(b) | | — | | Amended Agreement dated January 30, 1990, between Energy Future Competitive Holdings Company and Tex-La Electric Cooperative of Texas, Inc. |
| | | | | | | | | |
|
| | | | | | | | |
| Exhibits | | Previously Filed* With File Number | | As Exhibit | | | | |
| 99(b) | | | | | | — | | Texas Competitive Electric Holdings Company LLC Consolidated EBITDA reconciliation for the year ended December 31, 2014 |
| | | | | | | | | |
| 99(c) | | | | | | — | | Oncor Electric Delivery Holdings Company LLC financial statements presented pursuant to Rules 3–09 and 3–16 of Regulation S–X. |
| | | | | | | | | |
| | | XBRL Data Files |
| | | | | | | | | |
| 101.INS | | | | | | — | | XBRL Instance Document |
| | | | | | | | | |
| 101.SCH | | | | | | — | | XBRL Taxonomy Extension Schema Document |
| | | | | | | | | |
| 101.CAL | | | | | | — | | XBRL Taxonomy Extension Calculation Document |
| | | | | | | | | |
| 101.DEF | | | | | | — | | XBRL Taxonomy Extension Definition Document |
| | | | | | | | | |
| 101.LAB | | | | | | — | | XBRL Taxonomy Extension Labels Document |
| | | | | | | | | |
| 101.PRE | | | | | | — | | XBRL Taxonomy Extension Presentation Document |
____________
| |
| * | Incorporated herein by reference |
| |
| ** | Certain instruments defining the rights of holders of debt of the Company’s subsidiaries included in the financial statements filed herewith have been omitted because the total amount of securities authorized thereunder does not exceed 10 percent of the total assets of the Company and its subsidiaries on a consolidated basis. The Company hereby agrees, upon request of the SEC, to furnish a copy of any such omitted instrument. |
SIGNATURES
Pursuant to the requirements of Section 13 or 15(d) of the Securities Exchange Act of 1934, Energy Future Holdings Corp. has duly caused this report to be signed on its behalf by the undersigned, thereunto duly authorized.
|
| | | |
| | | ENERGY FUTURE HOLDINGS CORP. |
| Date: | March 31, 2015 | By | /s/ JOHN F. YOUNG |
| | | | (John F. Young, President and Chief Executive Officer) |
Pursuant to the requirements of the Securities Exchange Act of 1934, this report has been signed below by the following persons on behalf of Energy Future Holdings Corp. and in the capacities and on the date indicated. |
| | |
| Signature | Title | Date |
| | | |
| /s/ JOHN F. YOUNG | Principal Executive | March 31, 2015 |
| (John F. Young, President and Chief Executive Officer) | Officer and Director | |
| | | |
| /s/ PAUL M. KEGLEVIC | Principal Financial Officer | March 31, 2015 |
| (Paul M. Keglevic, Executive Vice President, Chief Financial Officer and Co-Chief Restructuring Officer) | | |
| | | |
| /s/ TERRY L. NUTT | Principal Accounting Officer | March 31, 2015 |
| (Terry L. Nutt, Senior Vice President and Controller) | | |
| | | |
| /s/ DONALD L. EVANS | Director | March 31, 2015 |
| (Donald L. Evans, Chairman of the Board) | | |
| | | |
| /s/ ARCILIA C. ACOSTA | Director | March 31, 2015 |
| (Arcilia C. Acosta) | | |
| | | |
| /s/ DAVID BONDERMAN | Director | March 31, 2015 |
| (David Bonderman) | | |
| | | |
| /s/ THOMAS D. FERGUSON | Director | March 31, 2015 |
| (Thomas D. Ferguson) | | |
| | | |
| /s/ BRANDON A. FREIMAN | Director | March 31, 2015 |
| (Brandon A. Freiman) | | |
| | | |
| /s/ SCOTT LEBOVITZ | Director | March 31, 2015 |
| (Scott Lebovitz) | | |
| | | |
| /s/ MICHAEL MACDOUGALL | Director | March 31, 2015 |
| (Michael MacDougall) | | |
| | | |
| /s/ KENNETH PONTARELLI | Director | March 31, 2015 |
| (Kenneth Pontarelli) | | |
| | | |
| /s/ WILLIAM K. REILLY | Director | March 31, 2015 |
| (William K. Reilly) | | |
| | | |
| /s/ JONATHAN D. SMIDT | Director | March 31, 2015 |
| (Jonathan D. Smidt) | | |
| | | |
| /s/ BILLIE I. WILLIAMSON | Director | March 31, 2015 |
| (Billie I. Williamson) | | |
| | | |
| /s/ KNEELAND YOUNGBLOOD | Director | March 31, 2015 |
| (Kneeland Youngblood) | | |