Exhibit 99.1
EEI Conference
C. John Wilder Chief Executive Officer
November 8, 2005
Safe Harbor Statement
This presentation contains forward-looking statements, which are subject to various risks and uncertainties. Discussion of risks and uncertainties that could cause actual results to differ materially from management’s current projections, forecasts, estimates and expectations is contained in the company’s SEC filings. In addition to the risks and uncertainties set forth in the company’s SEC filings, the forward-looking statements in this release could be affected by the ability of the company to implement the initiatives that are part of its operational improvement and cost reduction program and financial and growth strategies, and the terms under which the company executes those initiatives, the ability of the company to execute its share repurchase program and the actions of its board of directors with respect to future dividends and other cash distributions to shareholders, which will be based upon a number of factors, including the company’s profit levels, operating cash flow levels and capital requirements as well as financial and other business conditions existing at the time.
Regulation G
This presentation includes certain non-GAAP financial measures. A reconciliation of these measures to the most directly comparable GAAP measure is included in the appendix of the printed version of the slides and the version included on the company’s website at www.txucorp.com under Investor Resources/Presentations.
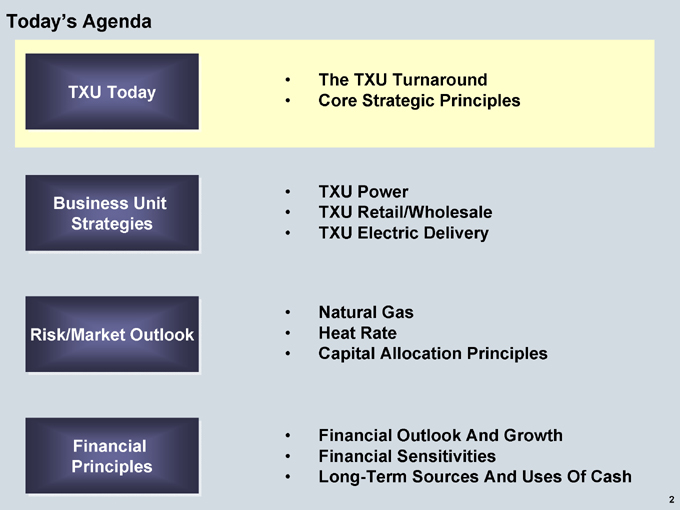
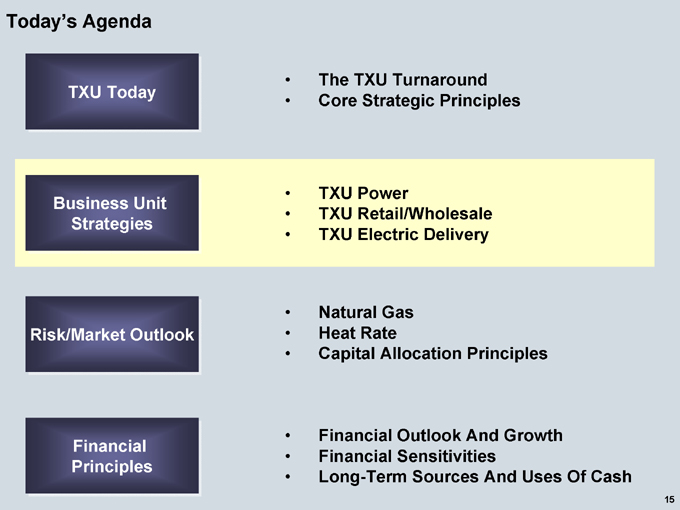
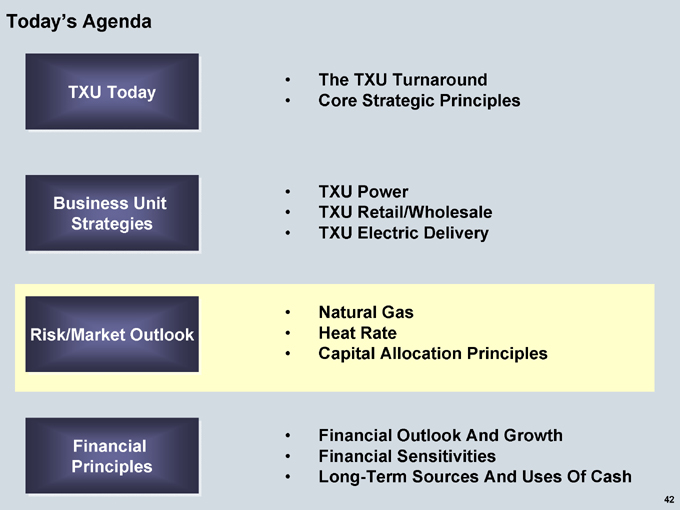
Today’s Agenda
TXU Today
The TXU Turnaround Core Strategic Principles
Business Unit Strategies
TXU Power
TXU Retail/Wholesale TXU Electric Delivery
Risk/Market Outlook
Natural Gas Heat Rate
Capital Allocation Principles
Financial Principles
Financial Outlook And Growth Financial Sensitivities
Long-Term Sources And Uses Of Cash
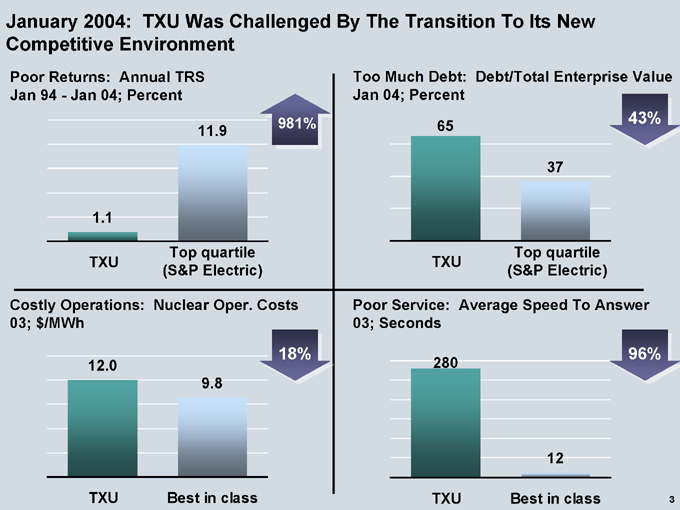
January 2004: TXU Was Challenged By The Transition To Its New Competitive Environment
Poor Returns: Annual TRS Jan 94—Jan 04; Percent
1.1
TXU
11.9
Top quartile (S&P Electric)
981%
Costly Operations: Nuclear Oper. Costs 03; $/MWh
12.0
TXU
9.8
Best in class
18%
Too Much Debt: Debt/Total Enterprise Value Jan 04; Percent
65
TXU
37
Top quartile (S&P Electric)
43%
Poor Service: Average Speed To Answer 03; Seconds
280
TXU
12
Best in class
96%
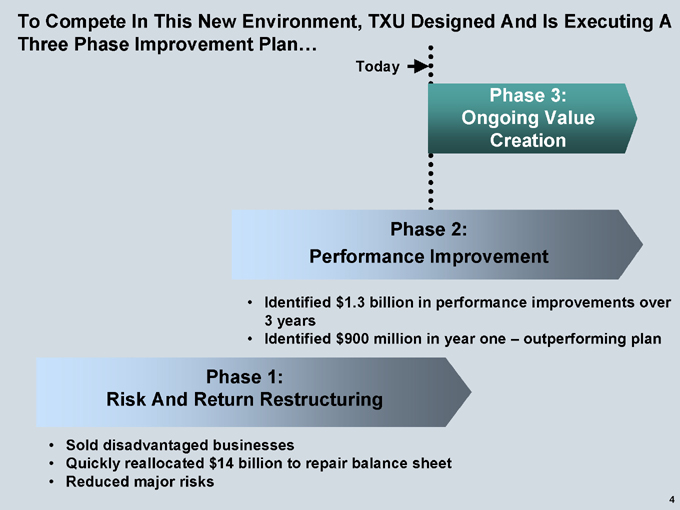
To Compete In This New Environment, TXU Designed And Is Executing A Three Phase Improvement Plan…
Today
Phase 3: Ongoing Value Creation
Phase 2:
Performance Improvement
Identified $1.3 billion in performance improvements over 3 years Identified $900 million in year one – outperforming plan
Phase 1:
Risk And Return Restructuring
Sold disadvantaged businesses
Quickly reallocated $14 billion to repair balance sheet Reduced major risks
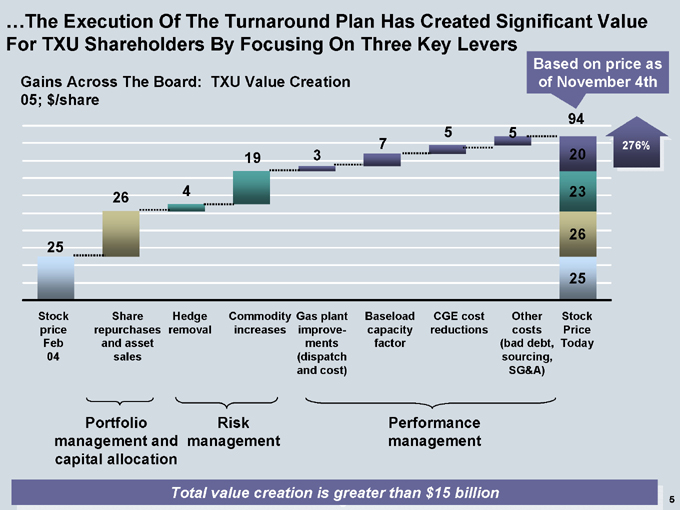
…The Execution Of The Turnaround Plan Has Created Significant Value For TXU Shareholders By Focusing On Three Key Levers
Based on price as of November 4th
Gains Across The Board: TXU Value Creation 05; $/share
25
26
19
94
20
23
26
25
276%
Stock Share Hedge Commodity Gas plant Baseload CGE cost Other Stock price repurchases removal increases improvements capacity reductions costs Price Feb and asset factor (bad debt, Today 04 sales (dispatch sourcing, and cost) SG&A)
Portfolio Risk Performance management and management management capital allocation
Total value creation is greater than $ 15 billion
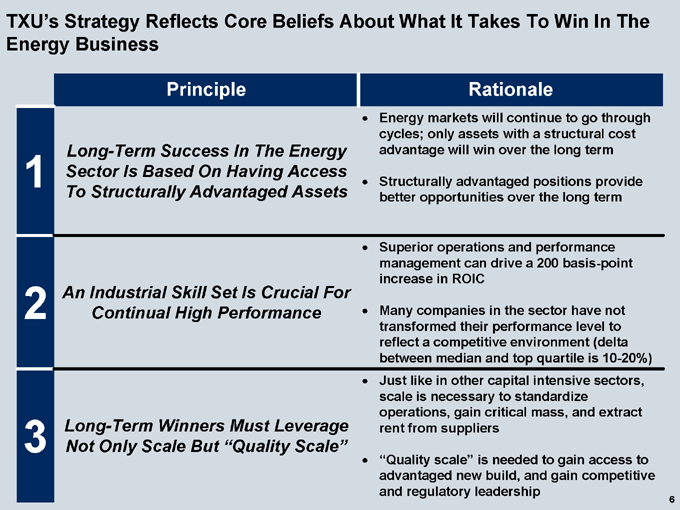
TXU’s Strategy Reflects Core Beliefs About What It Takes To Win In The Energy Business
Principle
Long-Term Success In The Energy
1 | | Sector Is Based On Having Access To Structurally Advantaged Assets |
An Industrial Skill Set Is Crucial For
2 | | Continual High Performance |
Long-Term Winners Must Leverage
3 | | Not Only Scale But “Quality Scale” |
Rationale
Energy markets will continue to go through cycles; only assets with a structural cost advantage will win over the long term
Structurally advantaged positions provide better opportunities over the long term
Superior operations and performance management can drive a 200 basis-point increase in ROIC
Many companies in the sector have not transformed their performance level to reflect a competitive environment (delta between median and top quartile is 10-20%)
Just like in other capital intensive sectors, scale is necessary to standardize operations, gain critical mass, and extract rent from suppliers
“Quality scale” is needed to gain access to advantaged new build, and gain competitive and regulatory leadership
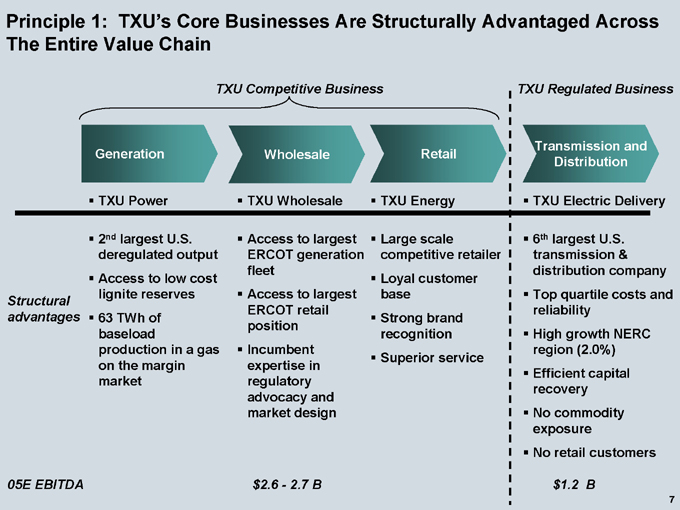
Principle 1: TXU’s Core Businesses Are Structurally Advantaged Across The Entire Value Chain
TXU Competitive Business
Generation
TXU Power
Wholesale
TXU Wholesale
Retail
TXU Energy
Transmission and Distribution
TXU Electric Delivery
Structural advantages
2nd largest U.S. deregulated output Access to low cost lignite reserves 63 TWh of baseload production in a gas on the margin market
Access to largest ERCOT generation fleet Access to largest ERCOT retail position Incumbent expertise in regulatory advocacy and market design
Large scale competitive retailer Loyal customer base Strong brand recognition Superior service
6th largest U.S. transmission & distribution company Top quartile costs and reliability High growth NERC region (2.0%) Efficient capital recovery No commodity exposure No retail customers
05E EBITDA $2.6—2.7 B $1.2 B
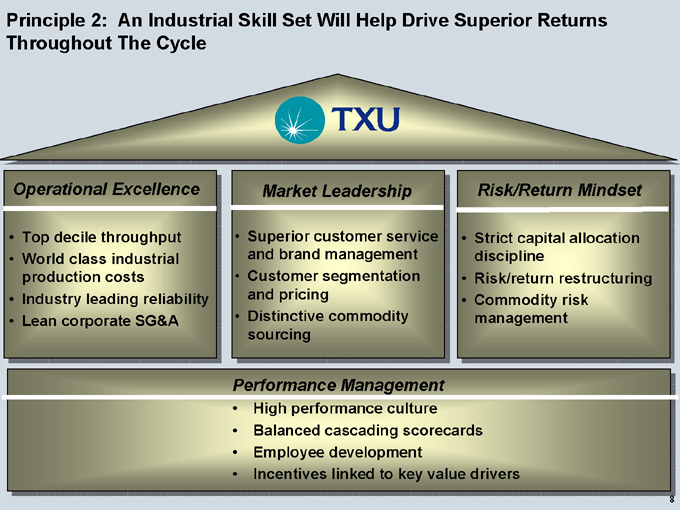
Principle 2: An Industrial Skill Set Will Help Drive Superior Returns Throughout The Cycle
Operational Excellence
Top decile throughput World class industrial production costs Industry leading reliability Lean corporate SG&A
Market Leadership
Superior customer service and brand management Customer segmentation and pricing Distinctive commodity sourcing
Risk/Return Mindset
Strict capital allocation discipline Risk/return restructuring Commodity risk management
Performance Management
High performance culture Balanced cascading scorecards Employee development Incentives linked to key value drivers
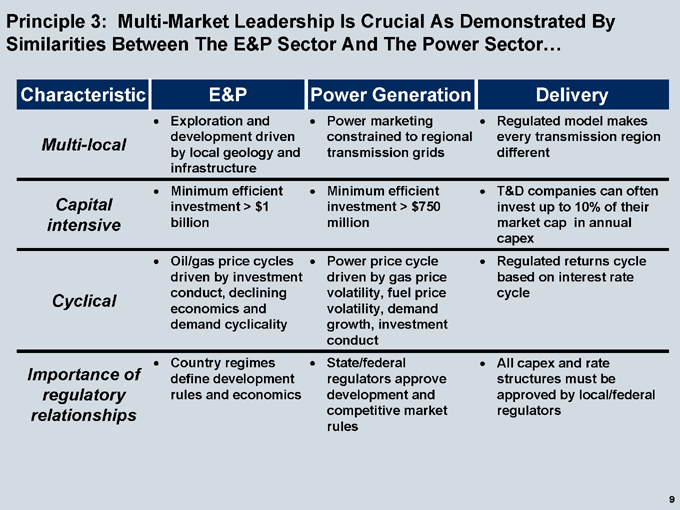
Principle 3: Multi-Market Leadership Is Crucial As Demonstrated By Similarities Between The E&P Sector And The Power Sector…
Characteristic
Multi-local
Capital intensive
Cyclical
Importance of regulatory relationships
E&P
Exploration and development driven by local geology and infrastructure Minimum efficient investment > $1 billion
Oil/gas price cycles driven by investment conduct, declining economics and demand cyclicality
Country regimes define development rules and economics
Power Generation
Power marketing constrained to regional transmission grids
Minimum efficient investment > $750 million
Power price cycle driven by gas price volatility, fuel price volatility, demand growth, investment conduct State/federal regulators approve development and competitive market rules
Delivery
Regulated model makes every transmission region different
T&D companies can often invest up to 10% of their market cap in annual capex Regulated returns cycle based on interest rate cycle
All capex and rate structures must be approved by local/federal regulators
9
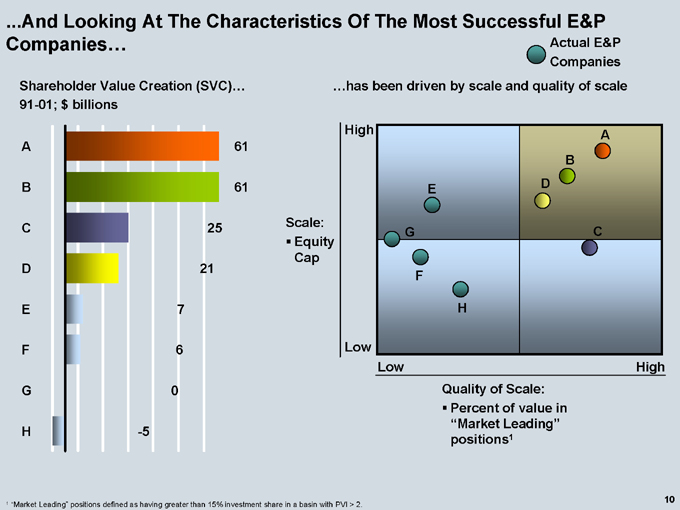
.And Looking At The Characteristics Of The Most Successful E&P Companies… Actual E&P
Companies
Shareholder Value Creation (SVC)… 91-01; $ billions
A B C D E F G H
-5
0
21
25
61
61
…has been driven by scale and quality of scale
High
Low
Low
High
Quality of Scale: Percent of value in “Market Leading” positions1
1 | | “Market Leading” positions defined as having greater than 15% investment share in a basin with PVI > 2. |
E
G
F
H
A
B
D
C
10

…The Winning Strategy In The Power Sector Will Require The Combination Of Scale And Quality Of Scale
Key Principle
Scale
Competitive Advantages
Standardization of operating practices
Ability to take part in needed large capital investments
Ability to extract excess rents from equipment suppliers
TXU Application
Applying TXU Operating System across larger portfolio of assets
Taking part in infrastructure build out without “betting the company”
Leveraging bulk purchases to reduce equipment supplier costs and increase returns
Quality of scale
Better access to future development opportunities
Providing competitive leadership and capital discipline
Providing regulatory leadership
Taking advantage of sites like Oak Grove for new build
Ensuring capital is invested appropriately in needed infrastructure
Advocating that market rules (e.g., Nodal) develop to ensure fair competition
In the E&P sector, the combination of both factors was needed to drive significant value creation over time
11
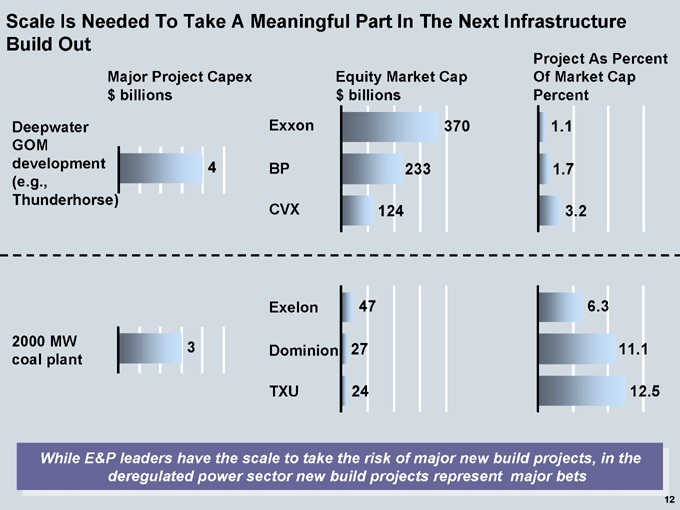
Scale Is Needed To Take A Meaningful Part In The Next Infrastructure Build Out
Major Project Capex $ billions
Deepwater GOM development (e.g., Thunderhorse)
Equity Market Cap $ billions
Exxon
BP
CVX
370
233
124
Project As Percent Of Market Cap Percent
1.1
1.7
3.2
2000 MW coal plant
Exelon
Dominion
TXU
47
27
24
6.3
11.1
12.5
While E&P leaders have the scale to take the risk of major new build projects, in the deregulated power sector new build projects represent major bets
12
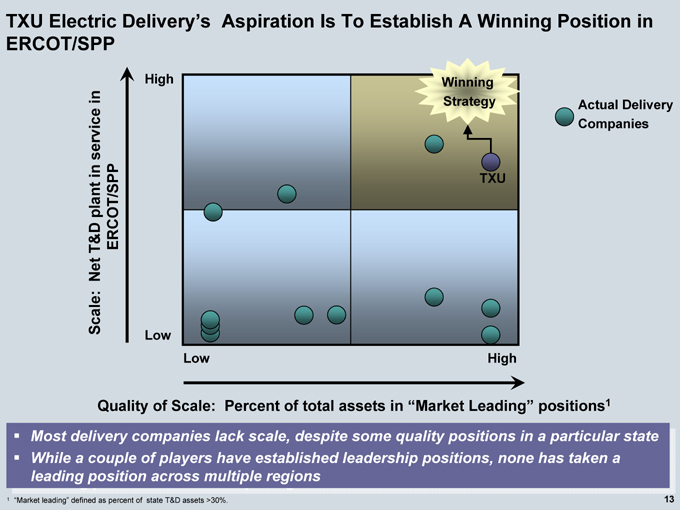
TXU Electric Delivery’s Aspiration Is To Establish A Winning Position in ERCOT/SPP
Scale: Net T&D plant in service in ERCOT/SPP
High
Low
Winning Strategy
TXU
Low
High
Actual Delivery Companies
Quality of Scale: Percent of total assets in “Market Leading” positions1
Most delivery companies lack scale, despite some quality positions in a particular state While a couple of players have established leadership positions, none has taken anone has taken a leading position across multiple regions
1 | | “Market leading” defined as percent of state T&D assets >30%. |
13
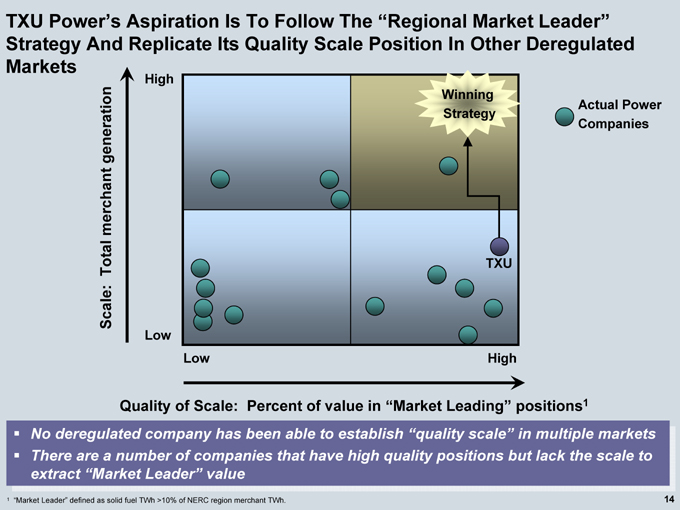
TXU Power’s Aspiration Is To Follow The “Regional Market Leader” Strategy And Replicate Its Quality Scale Position In Other Deregulated
Markets
Scale: Total merchant generation
High
Low
TXU
Winning Strategy
Actual Power Companies
Low
High
Quality of Scale: Percent of value in “Market Leading” positions1
No deregulated company has been able to establish “quality scale” in multiple markets There are a number of companies that have high quality positions but lack the scale to extract “Market Leader” value
1 | | “Market Leader” defined as solid fuel TWh >10% of NERC region merchant TWh. |
14
Today’s Agenda
TXU Today
The TXU Turnaround
Core Strategic Principles
Business Unit Strategies
TXU Power
TXU Retail/Wholesale
TXU Electric Delivery
Risk/Market Outlook
Natural Gas
Heat Rate
Capital Allocation Principles
Financial Principles
Financial Outlook And Growth
Financial Sensitivities
Long-Term Sources And Uses Of Cash
15
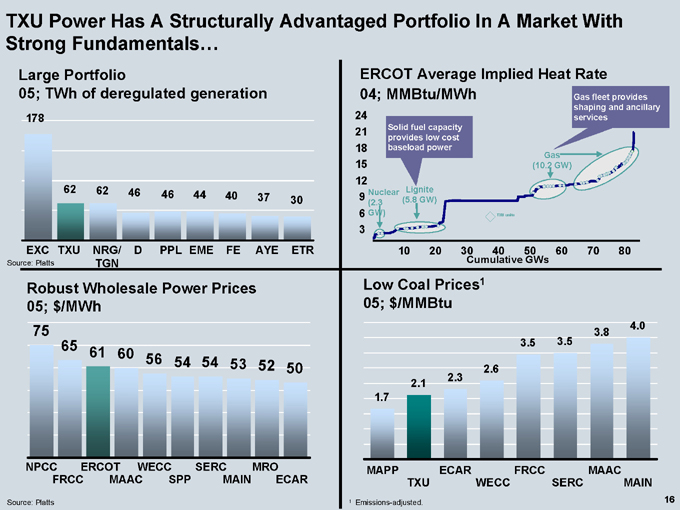
TXU Power Has A Structurally Advantaged Portfolio In A Market With Strong Fundamentals…
Large Portfolio
05; TWh of deregulated generation
178
62
62
46
46
44
40
37
30
EXC
TXU
NRG/ TGN
D
PPL
EME
FE
AYE
ETR
ERCOT Average Implied Heat Rate
04; MMBtu/MWh
24 21 18 15 12 9 6 3
Solid fuel capacity provides low cost baseload power
Gas fleet provides shaping and ancillary services
Nuclear 2.3 GW)
Lignite (5.8 GW)
Gas (10.2 GW)
TXU units
10 20 30 40 50 60 70 80
Robust Wholesale Power Prices 05; $/MWh
75
65
61
60
56
54
54
53
52
50
NPCC
FRCC
ERCOT
MAAC
WECC
SPP
SERC
MAIN
MRO
Source: Platts
Low Coal Prices1 05; $/MMBtu
1.7
2.1
2.3
2.6
3.5
3.5
3.8
4.0
MAPP
TXU
ECAR
WECC
FRCC
SERC
MAAC
MAIN
16
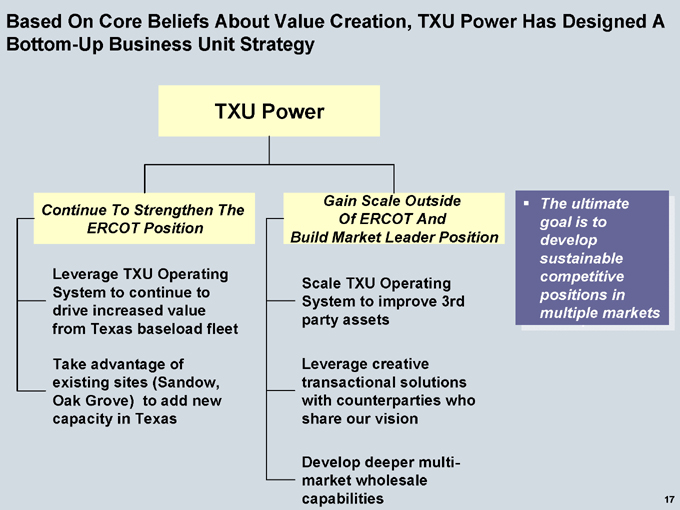
Based On Core Beliefs About Value Creation, TXU Power Has Designed A Bottom-Up Business Unit Strategy
TXU Power
Continue To Strengthen The ERCOT Position
Leverage TXU Operating System to continue to drive increased value from Texas baseload fleet
Take advantage of existing sites (Sandow, Oak Grove) to add new capacity in Texas
Gain Scale Outside Of ERCOT And Build Market Leader Position
Scale TXU Operating System to improve 3rd party assets
Leverage creative transactional solutions with counterparties who share our vision
Develop deeper multi-market wholesale capabilities
The ultimate goal is to develop sustainable competitive positions in multiple markets
17
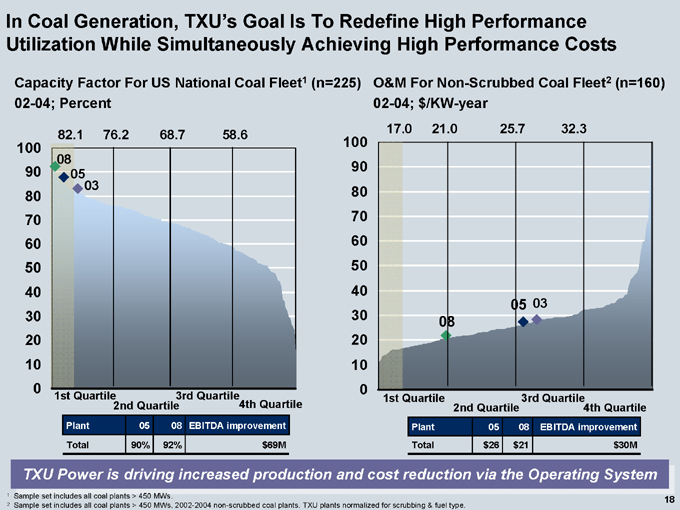
In Coal Generation, TXU’s Goal Is To Redefine High Performance Utilization While Simultaneously Achieving High Performance Costs
Capacity Factor For US National Coal Fleet1 (n=225) 02-04; Percent
82.1 76.2 68.7 58.6
100 90 80 70 60 50 40 30 20 10 0
08 05 03
1st Quartile 2nd Quartile 3rd Quartile 4th Quartile
Plant
Total
05
90%
08
92%
EBITDA improvement $69M
O&M For Non-Scrubbed Coal Fleet2 (n=160) 02-04; $/KW-year
17.0 21.0 25.7 32.3
100 90 80 70 60 50 40 30 20 10 0
08
05 03
1st Quartile 2nd Quartile 3rd Quartile 4th Quartile
Plant
Total
05 $26
08 $21
EBITDA improvement $30M
TXU Power is driving increased production and cost reduction via the Operating System
1 | | Sample set includes all coal plants > 450 MWs. |
2 Sample set includes all coal plants > 450 MWs, 2002-2004 non-scrubbed coal plants. TXU plants normalized for scrubbing & fuel type.
18
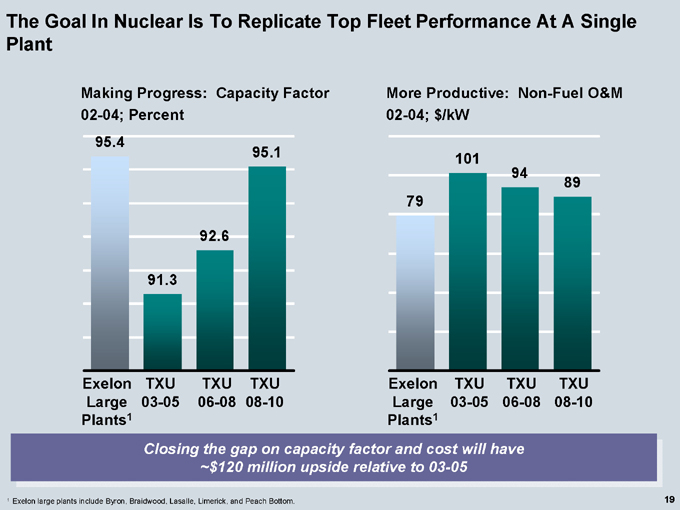
The Goal In Nuclear Is To Replicate Top Fleet Performance At A Single Plant
Making Progress: Capacity Factor 02-04; Percent
95.4
91.3
92.6
95.1
Exelon TXU TXU TXU Large 03-05 06-08 08-10 Plants1
More Productive: Non-Fuel O&M 02-04; $/kW
79
101
94
89
Exelon TXU TXU TXU Large 03-05 06-08 08-10 Plants1
Closing the gap on capacity factor and cost will have ~$120 million upside relative to 03-05
1 | | Exelon large plants include Byron, Braidwood, Lasalle, Limerick, and Peach Bottom. |
19
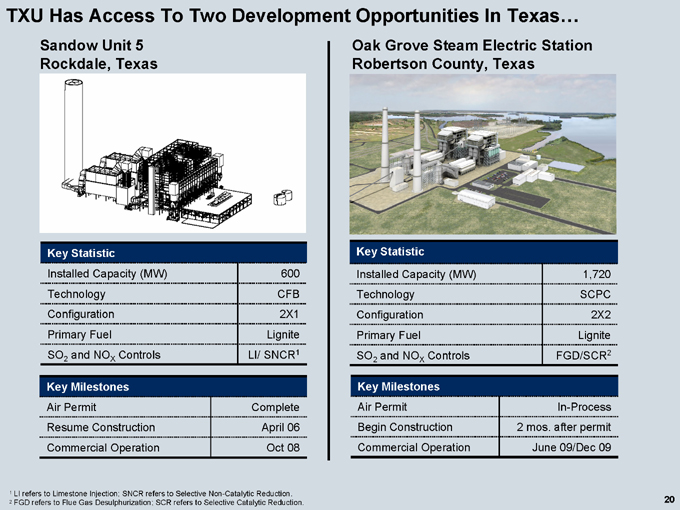
TXU Has Access To Two Development Opportunities In Texas…
Sandow Unit 5 Rockdale, Texas
Key Statistic
Installed Capacity (MW) 600
Technology CFB
Configuration 2X1
Primary Fuel Lignite
SO2 and NOX Controls LI/ SNCR1
Key Milestones
Air Permit Complete
Resume Construction April 06
Commercial Operation Oct 08
Oak Grove Steam Electric Station Robertson County, Texas
Key Statistic
Installed Capacity (MW) 1,720
Technology SCPC
Configuration 2X2
Primary Fuel Lignite
SO2 and NOX Controls FGD/SCR2
Key Milestones
Air Permit In-Process
Begin Construction 2 mos. after permit
Commercial Operation June 09/Dec 09
1 | | LI refers to Limestone Injection; SNCR refers to Selective Non-Catalytic Reduction. |
2 | | FGD refers to Flue Gas Desulphurization; SCR refers to Selective Catalytic Reduction. |
20
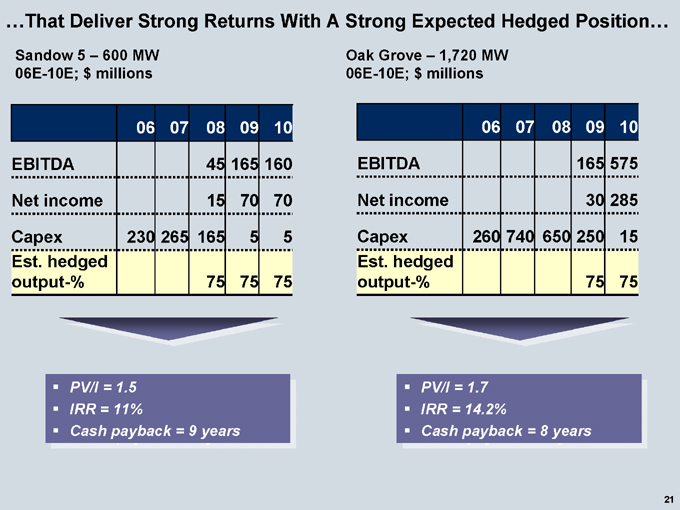
…That Deliver Strong Returns With A Strong Expected Hedged Position…
Sandow 5 – 600 MW 06E-10E; $ millions
06 07 08 09 10
EBITDA 45 165 160
Net income 15 70 70
Capex 230 265 165 5 5
Est. hedged
output-% 75 75 75
PV/I = 1.5 IRR = 11%
Cash payback = 9 years
Oak Grove – 1,720 MW 06E-10E; $ millions
06 07 08 09 10
EBITDA 165 575
Net income 30 285
Capex 260 740 650 250 15
Est. hedged
output-% 75 75
PV/I = 1.7 IRR = 14.2%
Cash payback = 8 years
21
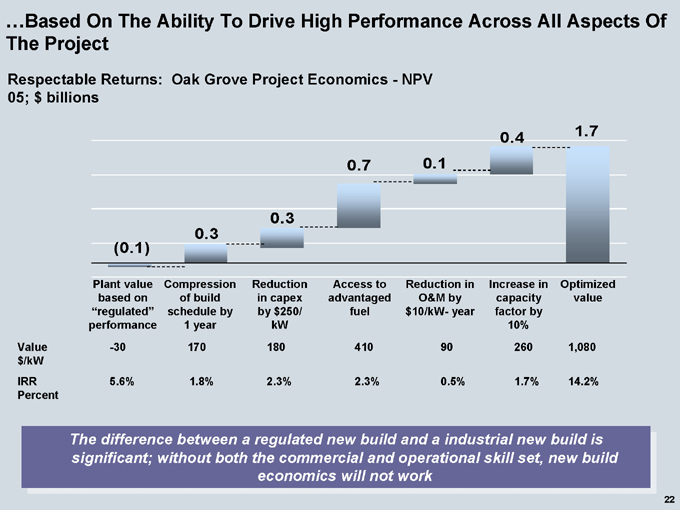
…Based On The Ability To Drive High Performance Across All Aspects Of The Project
Respectable Returns: Oak Grove Project Economics—NPV 05; $ billions
(0.1)
0.3
0.3
0.7
0.1
0.4
1.7
Plant value based on “regulated” performance
Compression of build schedule by 1 year
Reduction in capex by $250/ kW
Access to advantaged fuel
Reduction in O&M by $10/kW- year
Increase in capacity factor by 10%
Optimized value
Value -30 170 180 410 90 260 1,080
$/kW
IRR 5.6% 1.8% 2.3% 2.3% 0.5% 1.7% 14.2%
Percent
The difference between a regulated new build and a industrial new build is significant; without both the commercial and operational skill set, new build economics will not work
22
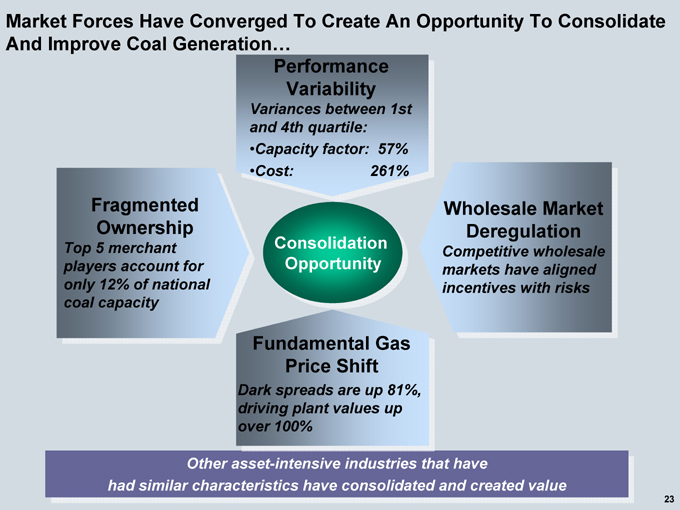
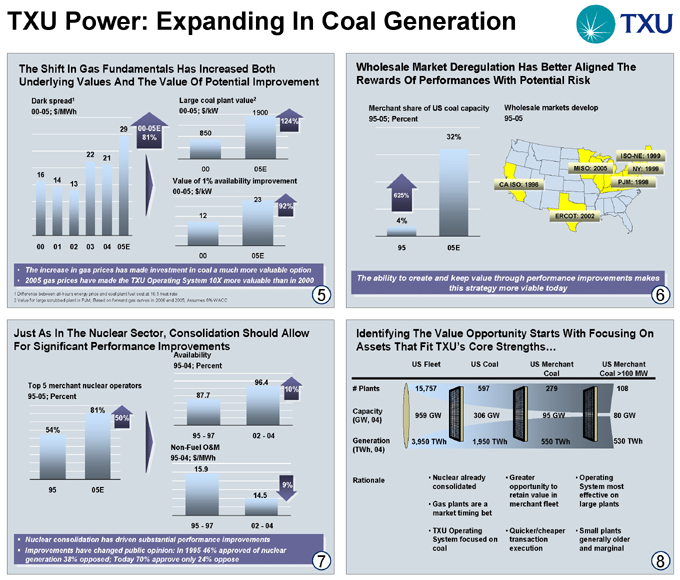
Market Forces Have Converged To Create An Opportunity To Consolidate And Improve Coal Generation…
Performance Variability
Variances between 1st and 4th quartile: Capacity factor: 57% Cost: 261%
Fragmented Ownership
Top 5 merchant players account for only 12% of national coal capacity
Consolidation Opportunity
Fundamental Gas Price Shift
Dark spreads are up 81%, driving plant values up over 100%
Wholesale Market Deregulation
Competitive wholesale markets have aligned incentives with risks
Other asset-intensive industries that have had similar characteristics have consolidated and created value
23
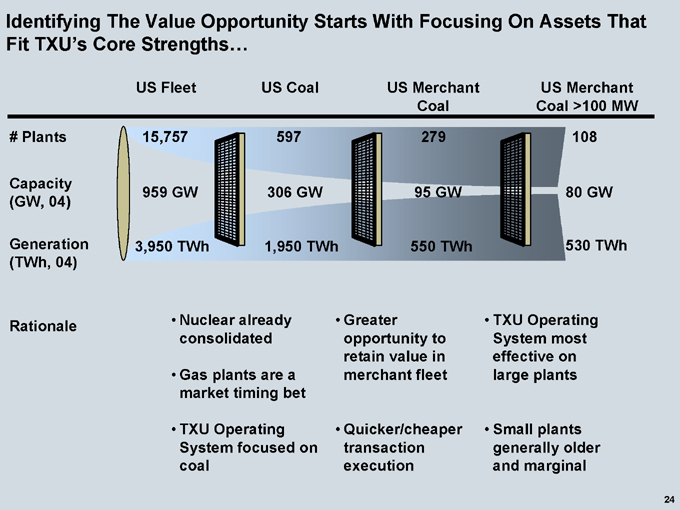
Identifying The Value Opportunity Starts With Focusing On Assets That Fit TXU’s Core Strengths…
US Fleet US Coal US Merchant US Merchant Coal Coal >100 MW
# Plants
Capacity (GW, 04)
Generation (TWh, 04)
959 GW 15,757
3,950 TWh
597 306 GW 1,950 TWh
279 95 GW 550 TWh
108 80 GW 530 TWh
Rationale Nuclear already Greater TXU Operating consolidated opportunity to System most retain value in effective on Gas plants are a merchant fleet large plants market timing bet
• TXU Operating Quicker/cheaper Small plants System focused on transaction generally older coal execution and marginal
24
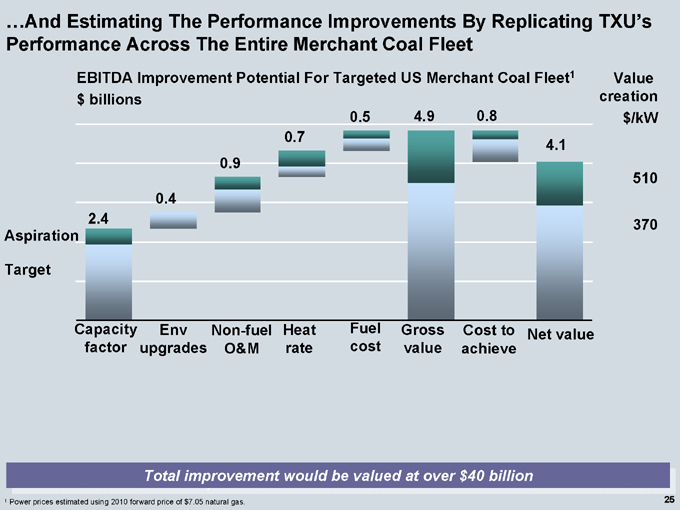
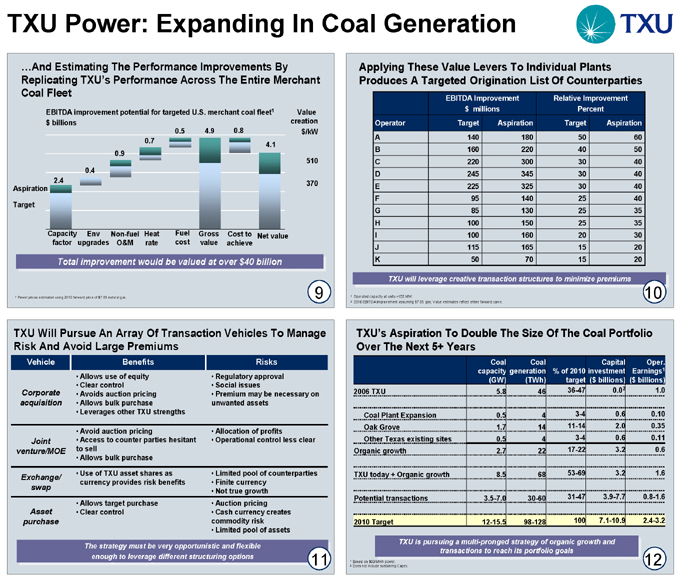
…And Estimating The Performance Improvements By Replicating TXU’s Performance Across The Entire Merchant Coal Fleet
EBITDA Improvement Potential For Targeted US Merchant Coal Fleet1 $ billions
Aspiration
Target
2.4
0.4
0.9
0.7
0.5
4.9
0.8
4.1
Value creation $/kW
510
370
Capacity Env Non-fuel Heat Fuel Gross Cost to Net value factor upgrades O&M rate cost value achieve
Total improvement would be valued at over $40 billion
1 | | Power prices estimated using 2010 forward price of $7.05 natural gas. |
25
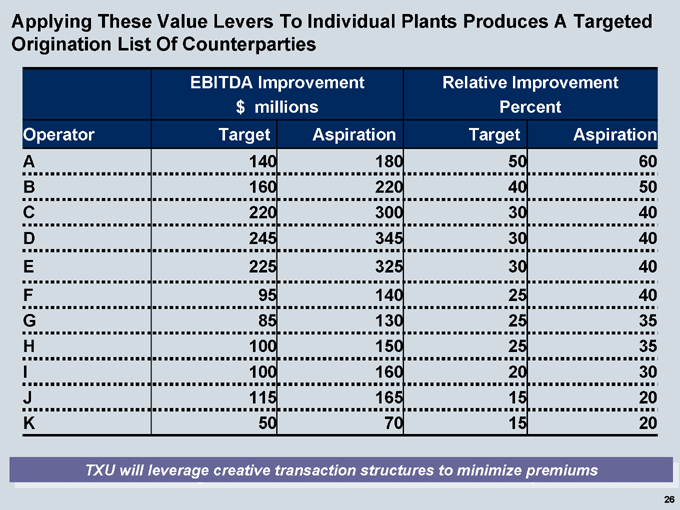
Applying These Value Levers To Individual Plants Produces A Targeted Origination List Of Counterparties
EBITDA Improvement Relative Improvement
$ millions Percent
Operator Target Aspiration Target Aspiration
A 140 180 50 60
B 160 220 40 50
C 220 300 30 40
D 245 345 30 40
E 225 325 30 40
F 95 140 25 40
G 85 130 25 35
H 100 150 25 35
I 100 160 20 30
J 115 165 15 20
K 50 70 15 20
TXU will leverage creative transaction structures to minimize premiums
26
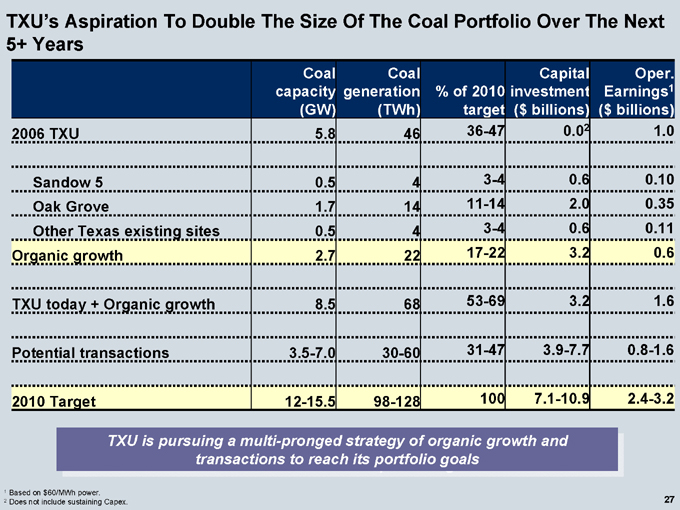
TXU’s Aspiration To Double The Size Of The Coal Portfolio Over The Next 5+ Years
Coal Coal Capital Oper.
capacity generation % of 2010 investment Earnings1
(GW) (TWh) target ($ billions) ($ billions)
2006 TXU 5.8 46 36-47 0.02 1.0
Sandow 5 0.5 4 3-4 0.6 0.10
Oak Grove 1.7 14 11-14 2.0 0.35
Other Texas existing sites 0.5 4 3-4 0.6 0.11
Organic growth 2.7 22 17-22 3.2 0.6
TXU today + Organic growth 8.5 68 53-69 3.2 1.6
Potential transactions 3.5-7.0 30-60 31-47 3.9-7.7 0.8-1.6
2010 Target 12-15.5 98-128 100 7.1-10.9 2.4-3.2
TXU is pursuing a multi-pronged strategy of organic growth and transactions to reach its portfolio goals
1 | | Based on $60/MWh power. |
2 | | Does not include sustaining Capex. |
27
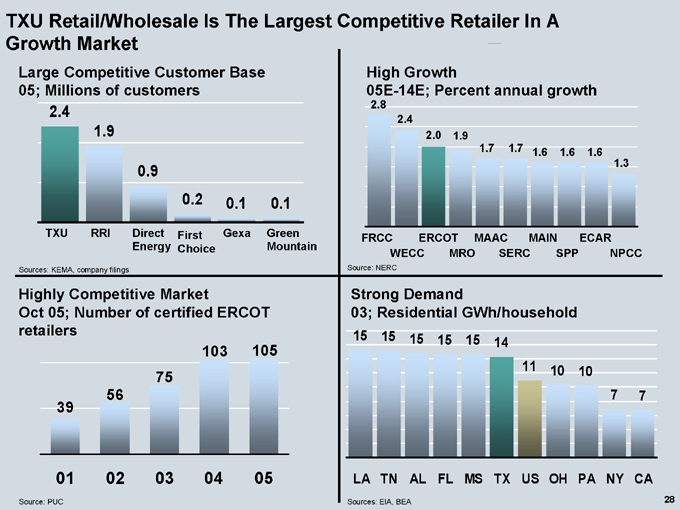
TXU Retail/Wholesale Is The Largest Competitive Retailer In A Growth Market
Large Competitive Customer Base 05; Millions of customers
2.4
1.9
0.9
0.2
0.1
0.1
TXU RRI Direct First Gexa Green Energy Choice Mountain
Sources: KEMA, company filings
Highly Competitive Market
Oct 05; Number of certified ERCOT retailers
39
56
75
103
105
01 02 03 04 05
Source: PUC
High Growth
05E-14E; Percent annual growth
2.8
2.4
2.0 1.9
1.7
1.7
1.6 1.6 1.6
1.3
FRCC ERCOT MAAC MAIN ECAR
WECC MRO SERC SPP NPCC
Source: NERC
Strong Demand
03; Residential GWh/household
15 15 15 15 15 14
11 10 10
LA TN AL FL MS TX US OH PA NY CA
Sources: EIA, BEA
28
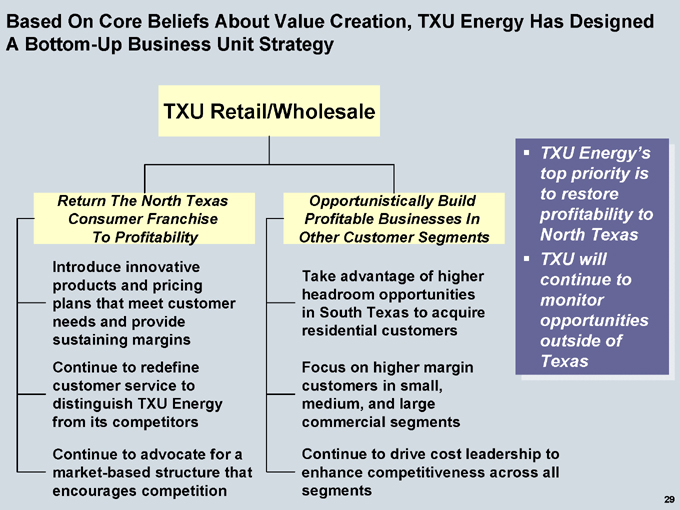
Based On Core Beliefs About Value Creation, TXU Energy Has Designed A Bottom-Up Business Unit Strategy
TXU Retail/Wholesale
Return The North Texas Consumer Franchise To Profitability
Introduce innovative products and pricing plans that meet customer needs and provide sustaining margins
Continue to redefine customer service to distinguish TXU Energy from its competitors
Continue to advocate for a market-based structure that encourages competition
Opportunistically Build Profitable Businesses In Other Customer Segments
Take advantage of higher headroom opportunities in South Texas to acquire residential customers
Focus on higher margin customers in small, medium, and large commercial segments
Continue to drive cost leadership to enhance competitiveness across all segments
TXU Energy’s top priority is to restore profitability to North Texas TXU will continue to monitor opportunities outside of Texas
29
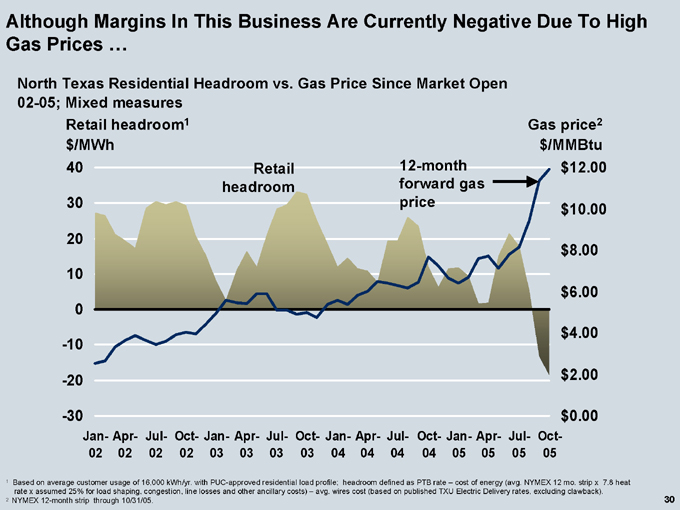
Although Margins In This Business Are Currently Negative Due To High Gas Prices …
North Texas Residential Headroom vs. Gas Price Since Market Open 02-05; Mixed measures
Retail headroom1 $/MWh
40 30 20 10 0 -10 -20 -30
Retail headroom
12-month forward gas price
Gas price2 $/MMBtu $12.00 $10.00 $8.00 $6.00 $4.00 $2.00 $0.00
Jan- Apr- Jul- Oct- Jan- Apr- Jul- Oct- Jan- Apr- Jul- Oct- Jan- Apr- Jul- Oct-
02 02 02 02 03 03 03 03 04 04 04 04 05 05 05 05
1 Based on average customer usage of 16,000 kWh/yr. with PUC-approved residential load profile; headroom defined as PTB rate – cost of energy (avg. NYMEX 12 mo. strip x 7.8 heat rate x assumed 25% for load shaping, congestion, line losses and other ancillary costs) – avg. wires cost (based on published TXU Electric Delivery rates, excluding clawback).
2 | | NYMEX 12-month strip through 10/31/05. |
30
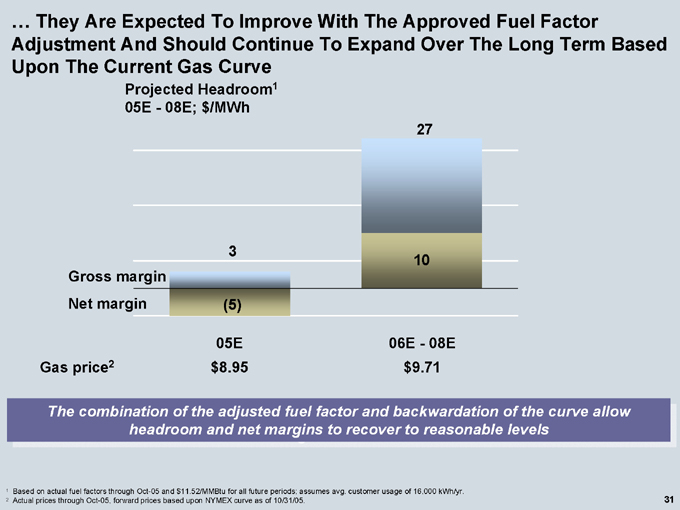
… They Are Expected To Improve With The Approved Fuel Factor Adjustment And Should Continue To Expand Over The Long Term Based Upon The Current Gas Curve
Projected Headroom1 05E—08E; $/MWh
Gross margin Net margin
27
10
Gas price2
05E $8.95
06E—08E $9.71
The combination of the adjusted fuel factor and backwardation of the curve allow headroom and net margins to recover to reasonable levels
1 Based on actual fuel factors through Oct-05 and $11.52/MMBtu for all future periods; assumes avg. customer usage of 16,000 kWh/yr.
2 | | Actual prices through Oct-05, forward prices based upon NYMEX curve as of 10/31/05. |
31
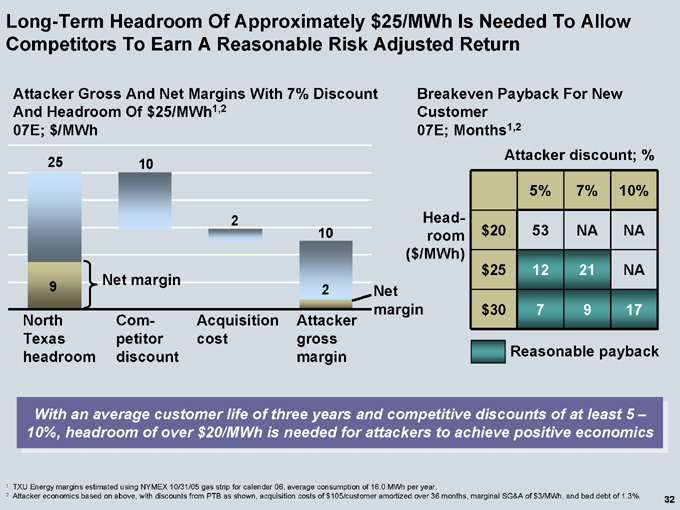
Long-Term Headroom Of Approximately $25/MWh Is Needed To Allow Competitors To Earn A Reasonable Risk Adjusted Return
Attacker Gross And Net Margins With 7% Discount And Headroom Of $25/MWh1,2 07E; $/MWh
25
9
10
10
Net margin
Net margin
North Com- Acquisition Attacker Texas petitor cost gross headroom discount margin
With an average customer life of three years and competitive discounts of at least 5 – 10%, headroom of over $20/MWh is needed for attackers to achieve positive economics
Breakeven Payback For New Customer 07E; Months1,2
Attacker discount; %
Headroom
($ /MWh)
5% 7% 10%
$20 53 NA NA
$25 12 21 NA
$30 7 9 17
Reasonable payback
1 TXU Energy margins estimated using NYMEX 10/31/05 gas strip for calendar 06, average consumption of 16.0 MWh per year.
2 Attacker economics based on above, with discounts from PTB as shown, acquisition costs of $105/customer amortized over 36 months, marginal SG&A of $3/MWh, and bad debt of 1.3%.
32
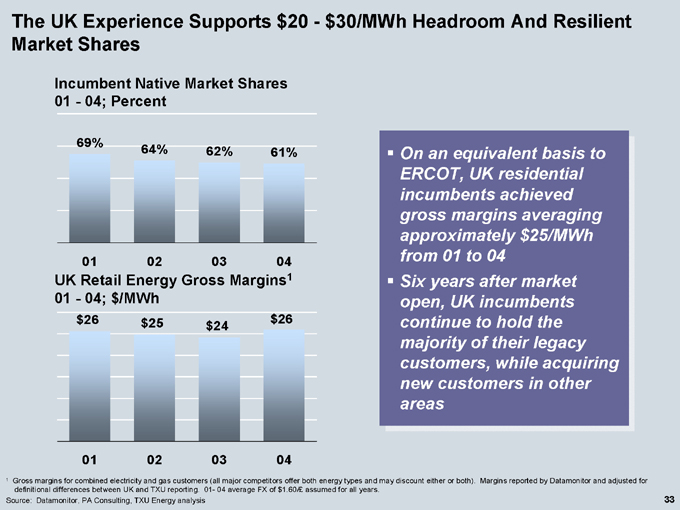
The UK Experience Supports $20—$30/MWh Headroom And Resilient Market Shares
Incumbent Native Market Shares 01—04; Percent
69%
64%
62%
61%
01 02 03 04
UK Retail Energy Gross Margins1 01—04; $/MWh
$26$ 25 $26 $24
01 02 03 04
On an equivalent basis to ERCOT, UK residential incumbents achieved gross margins averaging approximately$25/MWh from 01 to 04
Six years after market open, UK incumbent continue to hold the majority of their legacy customers, while acquiring new customers in other areas
1 Gross margins for combined electricity and gas customers (all major competitors offer both energy types and may discount either or both). Margins reported by Datamonitor and adjusted for definitional differences between UK and TXU reporting. 01- 04 average FX of $1.60/£ assumed for all years.
Source: Datamonitor, PA Consulting, TXU Energy analysis
33

TXU Electric Delivery Has An Advantaged Structural Position…
Size: Large Customer Base 04; Millions of customers
5.3
5.2
4.2
4.2
3.1
3.0
2.9
2.6
2.3
2.2
PCG EXC FPL SO ED TXU PGN ETR D DUK
Source: FERC
Scope: Large Infrastructure
04; Thousands of miles of primary distribution lines
146
105
87
87
69
69
65
63
59
54
TXU
Source: Proprietary benchmarking study
Demand: High Growth
05E-14E; Percent annual growth
2.8
2.4
2.0
1.9
1.7
1.7
1.6
1.6
1.6
1.3
FRCC ERCOT MAAC MAIN ECAR
WECC MRO SERC SPP NPCC
Source: NERC
Supportive Regulatory Environment
Source: Banc of America Securities Research
Outstanding Above Average Average Below Average
TXU Electric Delivery is a scale player in a high-growth region
34
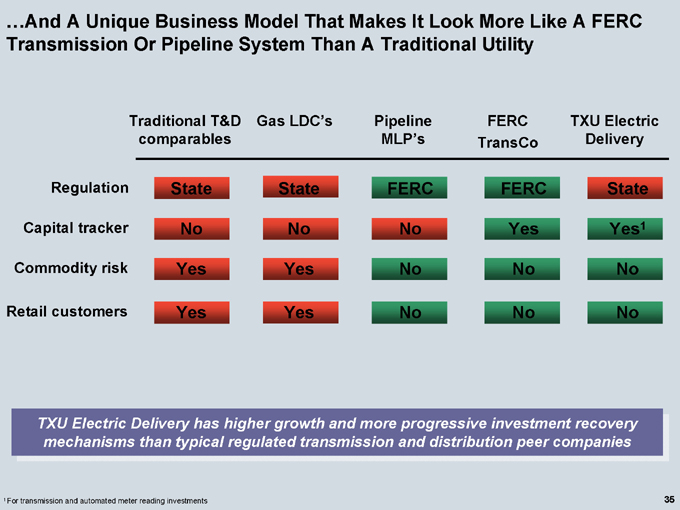
…And A Unique Business Model That Makes It Look More Like A FERC Transmission Or Pipeline System Than A Traditional Utility
Traditional T&D Gas LDC’s Pipeline FERC TXU Electric comparables MLP’s TransCo Delivery
Regulation Capital tracker Commodity risk
Retail customers
State State FERC FERC State
No No No Yes Yes1
Yes Yes No No No
Yes Yes No No No
TXU Electric Delivery has higher growth and more progressive investment recovery mechanisms than typical regulated transmission and distribution peer companies
1 | | For transmission and automated meter reading investments |
35
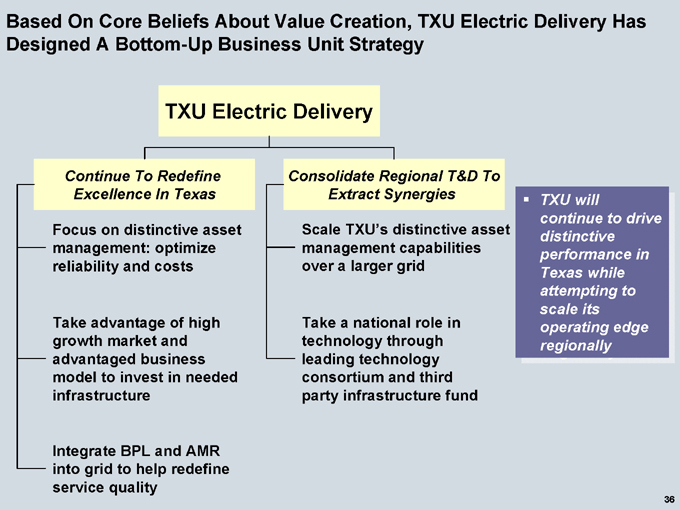
Based On Core Beliefs About Value Creation, TXU Electric Delivery Has Designed A Bottom-Up Business Unit Strategy
TXU Electric Delivery
Continue To Redefine Excellence In Texas
Focus on distinctive asset management: optimize reliability and costs
Take advantage of high growth market and advantaged business model to invest in needed infrastructure
Integrate BPL and AMR into grid to help redefine service quality
Consolidate Regional T&D To Extract Synergies
Scale TXU’s distinctive asset management capabilities over a larger grid
Take a national role in technology through leading technology consortium and third party infrastructure fund
TXU will continue to drive distinctive performance in Texas while attempting to scale its operating edge regionally
36

TXU Electric Delivery Has Achieved Top Quartile Reliability While Simultaneously Maintaining Top Quartile Costs
Non-Storm SAIDI1 (n=33) 04; Minutes
260 234 208 182 156 130 104 78 52 26 0
71.3 87.5 145.1 183.0
08
05 03
1st Quartile 2nd Quartile 3rd Quartile 4th Quartile
O&M Costs2 Per Customer (n=33) 04; $/customer $220 $198 $176 $154 $132 $110 $88 $66 $44 $22 $0
85.8 112.0 128.0 139.6
08
03 05
1st Quartile 2nd Quartile 3rd Quartile 4th Quartile
Significant capital investments are planned to ensure consistent top quartile reliability, while rigorous focus on cost efficiency will result in top decile cost performance by 08
1 TXU Electric Delivery is evaluating adoption of the IEEE 1366 standard for reporting reliability performance. Projected 2008 non-storm SAIDI calculated under this method would be 74.59.2.
2 | | Benchmark includes specific O&M accounts as well as maintenance capital. |
37
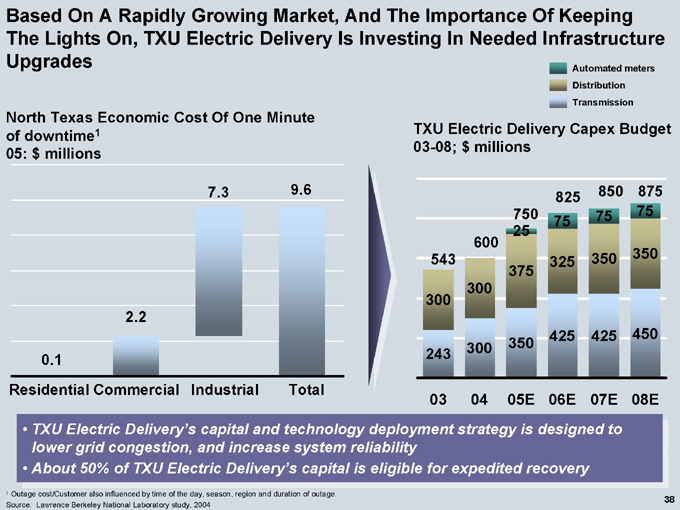
Based On A Rapidly Growing Market, And The Importance Of Keeping The Lights On, TXU Electric Delivery Is Investing In Needed Infrastructure
Upgrades
Automated meters Distribution Transmission
North Texas Economic Cost Of One Minute of downtime1 05: $ millions
0.1
2.2
7.3
9.6
Residential Commercial Industrial Total
TXU Electric Delivery Capex Budget 03-08; $ millions
543
300
243
600
300
300
750 25
375
350
825
75
325
425
850
75
350
425
875
75
350
450
03 04 05E 06E 07E 08E
TXU Electric Delivery’s capital and technology deployment strategy is designed to lower grid congestion, and increase system reliability lower grid congestion, and increase system reliability About 50% of TXU Electric Delivery’s capital is eligible for expedited recovery
1 | | Outage cost/Customer also influenced by time of the day, season, region and duration of outage. |
Source: Lawrence Berkeley National Laboratory study, 2004
38
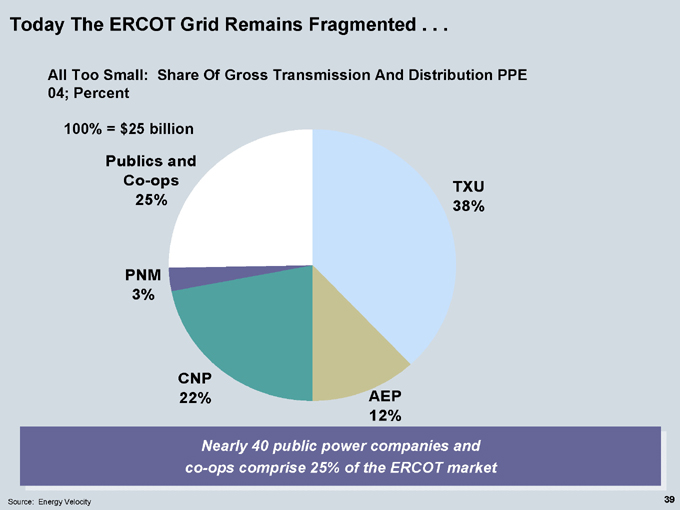
Today The ERCOT Grid Remains Fragmented . . .
All Too Small: Share Of Gross Transmission And Distribution PPE 04; Percent
100% = $25 billion
Publics and Co-ops 25%
PNM 3%
CNP 22%
TXU 38%
AEP 12%
Nearly 40 public power companies and co-ops comprise 25% of the ERCOT market
Source: Energy Velocity
39
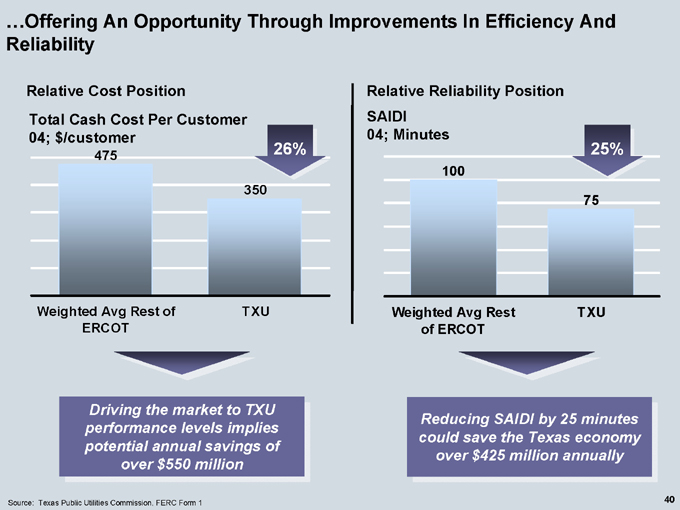
…Offering An Opportunity Through Improvements In Efficiency And Reliability
Relative Cost Position
Total Cash Cost Per Customer 04; $/customer
475
350
26%
Weighted Avg Rest of ERCOT
TXU
Driving the market to TXU performance levels implies potential annual savings of$550 million
Source: Texas Public Utilities Commission, FERC Form 1
Relative Reliability Position
SAIDI 04; Minutes
100
75
25%
Weighted Avg Rest of ERCOT
TXU
Reducing SAIDI by 25 minutes could save the Texas economy over$425 million annually
40
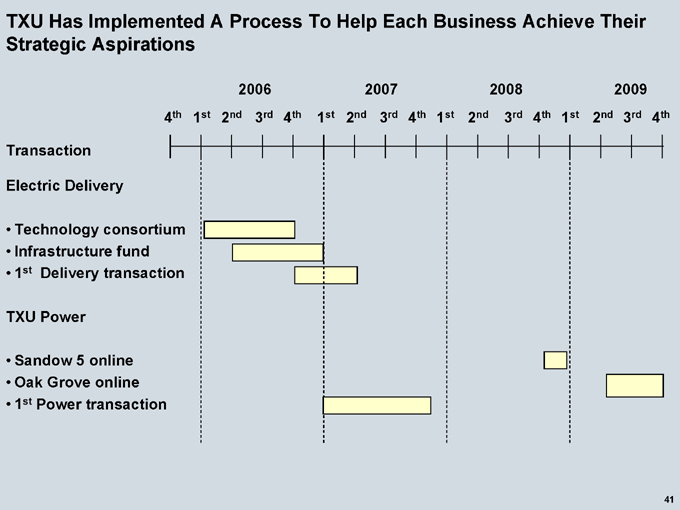
TXU Has Implemented A Process To Help Each Business Achieve Their Strategic Aspirations
2006
2007
2008
2009
4th 1st 2nd 3rd 4th 1st 2nd 3rd 4th 1st 2nd 3rd 4th 1st 2nd 3rd 4th
Transaction
Electric Delivery
Technology consortium Infrastructure fund 1st Delivery transaction
TXU Power
Sandow 5 online Oak Grove online 1st Power transaction
41
Today’s Agenda
TXU Today
Business Unit Strategies
Risk/Market Outlook
Financial Principles
The TXU Turnaround Core Strategic Principles
TXU Power
TXU Retail/Wholesale TXU Electric Delivery
Natural Gas Heat Rate
Capital Allocation Principles
Financial Outlook And Growth Financial Sensitivities
Long-Term Sources And Uses Of Cash
42
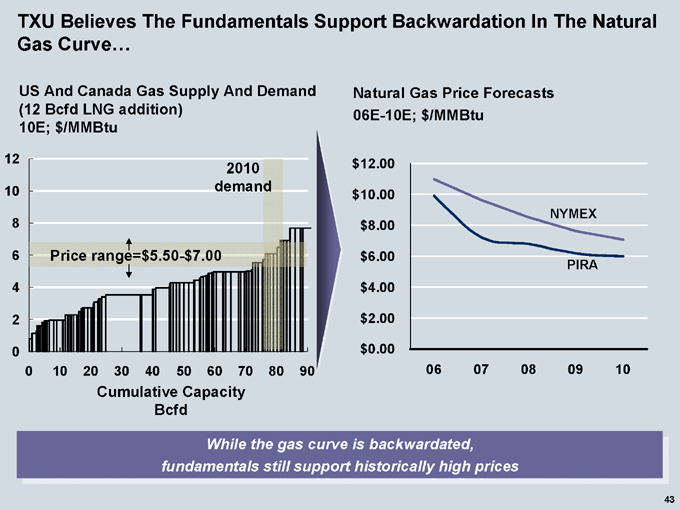
TXU Believes The Fundamentals Support Backwardation In The Natural Gas Curve…
US And Canada Gas Supply And Demand (12 Bcfd LNG addition) 10E; $/MMBtu
12 10 8 6 4 2 0
2010 demand
Price range=$5.50-$7.00
0 10 20 30 40 50 60 70 80 90
Cumulative Capacity Bcfd
Natural Gas Price Forecasts 06E-10E; $/MMBtu $12.00 $10.00 $8.00 $6.00 $4.00 $2.00 $0.00
06 07 08 09 10
NYMEX
PIRA
While the gas curve is backwardated, fundamentals still support historically high prices
43
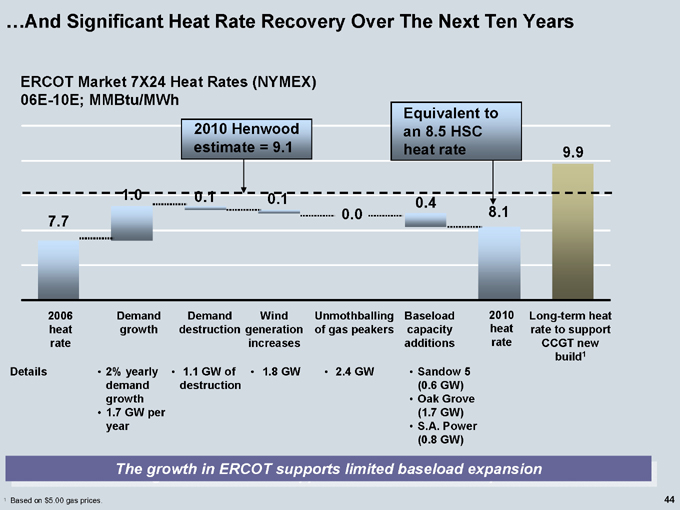
…And Significant Heat Rate Recovery Over The Next Ten Years
ERCOT Market 7X24 Heat Rates (NYMEX) 06E-10E; MMBtu/MWh
2010 Henwood estimate = 9.1
Equivalent to an 8.5 HSC heat rate
7.7
1.0
0.1
0.1
0.0
0.4
8.1
9.9
2006 heat rate
Demand growth
Demand destruction
Wind generation increases
Unmothballing of gas peakers
Baseload capacity additions
2010 heat rate
Long-term heat rate to support CCGT new build1
Details
2% yearly demand growth 1.7 GW per year
1.1 GW of destruction
1.8 GW
2.4 GW
Sandow 5 (0.6 GW) Oak Grove (1.7 GW) S.A. Power (0.8 GW)
The growth in ERCOT supports limited baseload expansion
1 | | Based on $5.00 gas prices. |
44
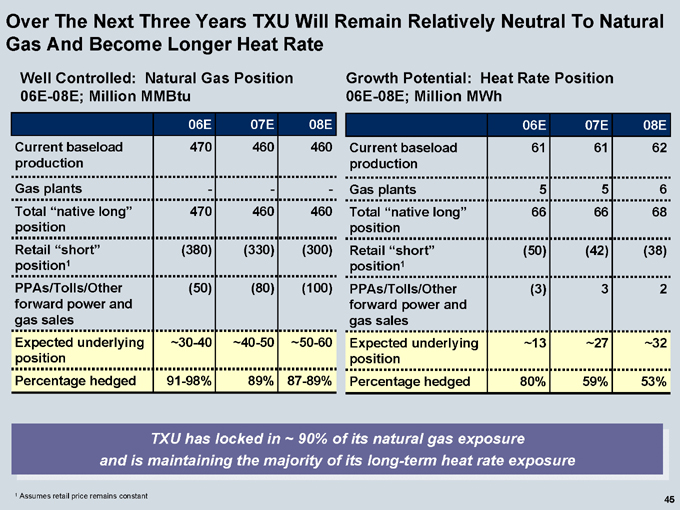
Over The Next Three Years TXU Will Remain Relatively Neutral To Natural Gas And Become Longer Heat Rate
Well Controlled: Natural Gas Position 06E-08E; Million MMBtu
Growth Potential: Heat Rate Position 06E-08E; Million MWh
06E 07E 08E 06E 07E 08E
Current baseload production 470 460 460 Current baseload production 61 61 62
Gas plants ——— Gas plants 5 5 6
Total “native long” position 470 460 460 Total “native long” position 66 66 68
Retail “short” position1 (380) (330) (300) Retail “short” position1 (50) (42) (38)
PPAs/Tolls/Other forward power and gas sales (50) (80) (100) PPAs/Tolls/Other forward power and gas sales (3) 3 2
Expected underlying position ~30-40 ~40-50 ~50-60 Expected underlying position ~13 ~27 ~32
Percentage hedged 91-98% 89% 87-89% Percentage hedged 80% 59% 53%
TXU has locked in ~ 90% of its natural gas exposure and is maintaining the majority of its long-term heat rate exposure
1 | | Assumes retail price remains constant |
45
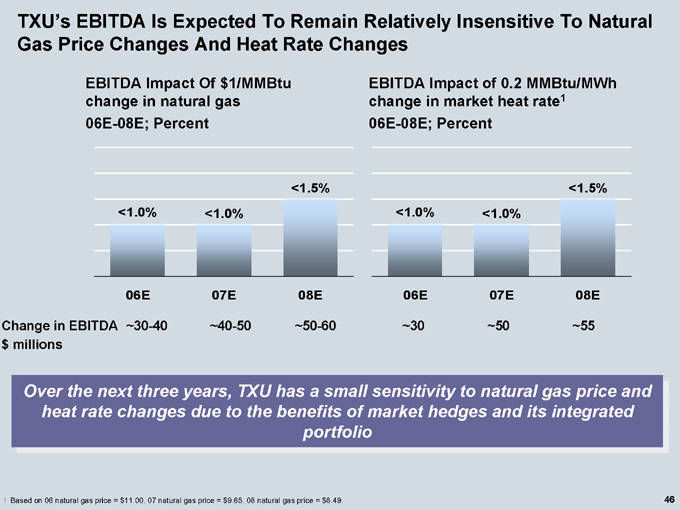
TXU’s EBITDA Is Expected To Remain Relatively Insensitive To Natural Gas Price Changes And Heat Rate Changes
EBITDA Impact Of $1/MMBtu change in natural gas 06E-08E; Percent
EBITDA Impact of 0.2 MMBtu/MWh change in market heat rate1 06E-08E; Percent
<1.0%
<1.0%
<1.5%
<1.0%
<1.0%
<1.5%
06E 07E 08E 06E 07E 08E
Change in EBITDA ~30-40 ~40-50 ~50-60 ~30 ~50 ~55 $ millions
Over the next three years, TXU has a small sensitivity to natural gas price and heat rate changes due to the benefits of market hedges and its integrated portfolio
1 | | Based on 06 natural gas price = $11.00, 07 natural gas price = $9.65, 08 natural gas price = $8.49. |
46
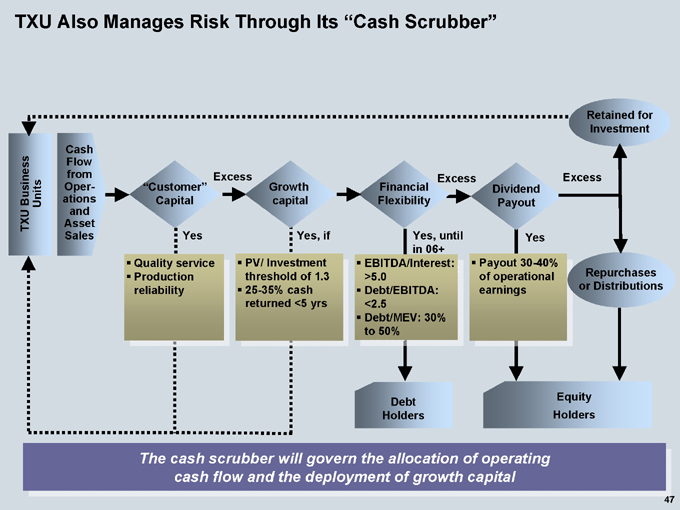
TXU Also Manages Risk Through Its “Cash Scrubber”
TXU Business Units
Cash Flow from Operations and Asset Sales
“Customer” Capital
Excess
Growth capital
Financial Flexibility
Excess
Dividend Payout
Excess
Retained for Investment
Yes
Yes, if
Yes, until in 06+
Yes
Quality service Production reliability
PV/ Investment threshold of 1.3 25-35% cash returned <5 yrs
EBITDA/Interest: >5.0 Debt/EBITDA: <2.5 Debt/MEV: 30% to 50%
Payout 30-40% of operational earnings
Repurchases or Distributions
Debt Holders
Equity Holders
The cash scrubber will govern the allocation of operating cash flow and the deployment of growth capital
47
Today’s Agenda
TXU Today
Business Unit Strategies
Risk/Market Outlook
Financial Principles
The TXU Turnaround Core Strategic Principles
TXU Power
TXU Retail/Wholesale TXU Electric Delivery
Natural Gas Heat Rate
Capital Allocation Principles
Financial Outlook And Growth Financial Sensitivities
Long-Term Sources And Uses Of Cash
48
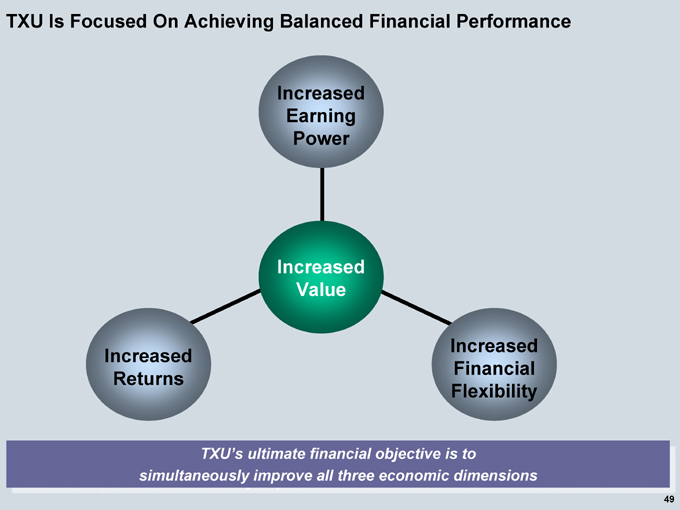
TXU Is Focused On Achieving Balanced Financial Performance
Increased Earning Power
Increased Value
Increased Returns
Increased Financial Flexibility
TXU’s ultimate financial objective is to simultaneously improve all three economic dimensions
49
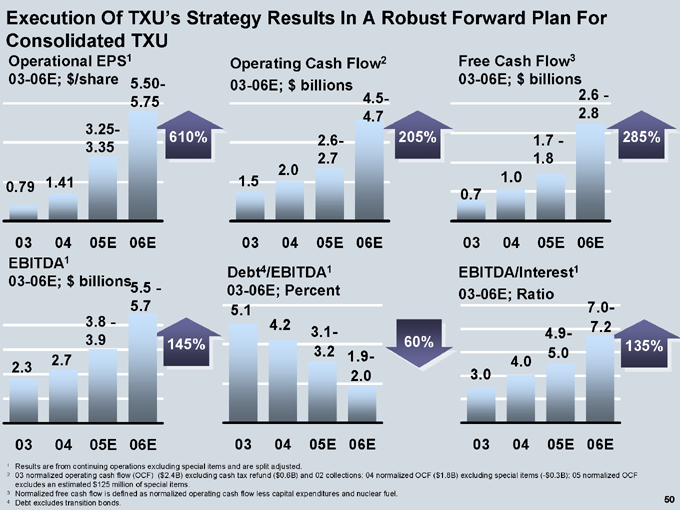
Execution Of TXU’s Strategy Results In A Robust Forward Plan For
Consolidated TXU
Operational EPS1
03-06E; $/share
5.50-5.75
0.79
1.41
3.25-3.35
610%
03 04 05E 06E
EBITDA1
03-06E; $ billions 5.5 -5.7
3.8 -3.9
2.7
2.3
145%
03 04 05E 06E
Operating Cash Flow2
03-06E; $ billions
4.5-4.7
2.6-2.7
2.0
1.5
205%
Free Cash Flow3 03-06E; $ billions
2.6 -2.8
1.7 -1.8
1.0
0.7
285%
03 04 05E 06E
03 04 05E 06E
Debt4/EBITDA1 03-06E; Percent
5.1
4.2
3.1-3.2
1.9-2.0
60%
03 04 05E 06E
EBITDA/Interest1 03-06E; Ratio
7.0-7.2
4.9-5.0
4.0
3.0
135%
03 04 05E 06E
1 | | Results are from continuing operations excluding special items and are split adjusted. |
2 03 normalized operating cash flow (OCF) ($2.4B) excluding cash tax refund ($0.6B) and 02 collections; 04 normalized OCF ($1.8B) excluding special items (-$0.3B); 05 normalized OCF excludes an estimated $125 million of special items.
3 | | Normalized free cash flow is defined as normalized operating cash flow less capital expenditures and nuclear fuel. |
4 | | Debt excludes transition bonds. |
50
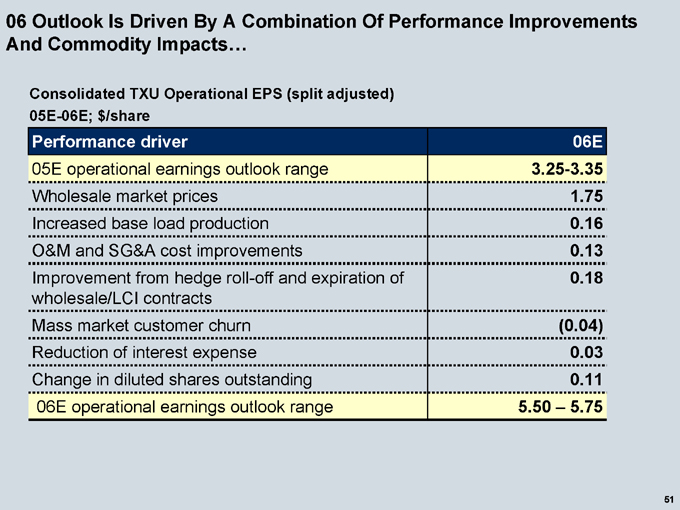
06 Outlook Is Driven By A Combination Of Performance Improvements And Commodity Impacts…
Consolidated TXU Operational EPS (split adjusted) 05E-06E; $/share
Performance driver 06E
05E operational earnings outlook range 3.25-3.35
Wholesale market prices 1.75
Increased base load production 0.16
O&M and SG&A cost improvements 0.13
Improvement from hedge roll-off and expiration of 0.18
wholesale/LCI contracts
Mass market customer churn (0.04)
Reduction of interest expense 0.03
Change in diluted shares outstanding 0.11
06E operational earnings outlook range 5.50 – 5.75
51
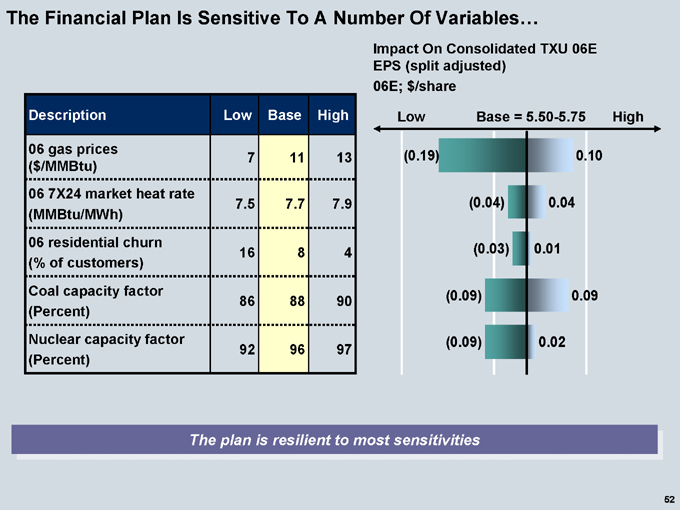
The Financial Plan Is Sensitive To A Number Of Variables…
Description Low Base High
06 gas prices ($/MMBtu) 7 11 13
06 7X24 market heat rate (MMBtu/MWh) 7.5 7.7 7.9
06 residential churn (% of customers) 16 8 4
Coal capacity factor (Percent) 86 88 90
Nuclear capacity factor (Percent) 92 96 97
Impact On Consolidated TXU 06E EPS (split adjusted) 06E; $/share
Low
Base = 5.50-5.75
High
(0.19)
(0.04)
(0.03)
(0.09)
(0.09)
0.10
0.04
0.01
0.09
0.02
The plan is resilient to most sensitivities
52
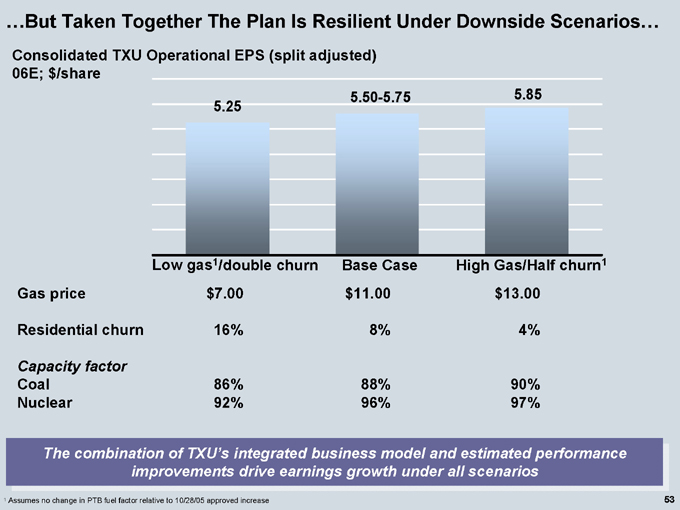
…But Taken Together The Plan Is Resilient Under Downside Scenarios…
Consolidated TXU Operational EPS (split adjusted) 06E; $/share
5.25
5.50-5.75
5.85
Low gas1/double churn Base Case High Gas/Half churn1
Gas price $7.00 $11.00 $13.00
Residential churn 16% 8% 4%
Capacity factor
Coal 86% 88% 90%
Nuclear 92% 96% 97%
The combination of TXU’s integrated business model and estimated performance improvements drive earnings growth under all scenarios
1 | | Assumes no change in PTB fuel factor relative to 10/28/05 approved increase |
53
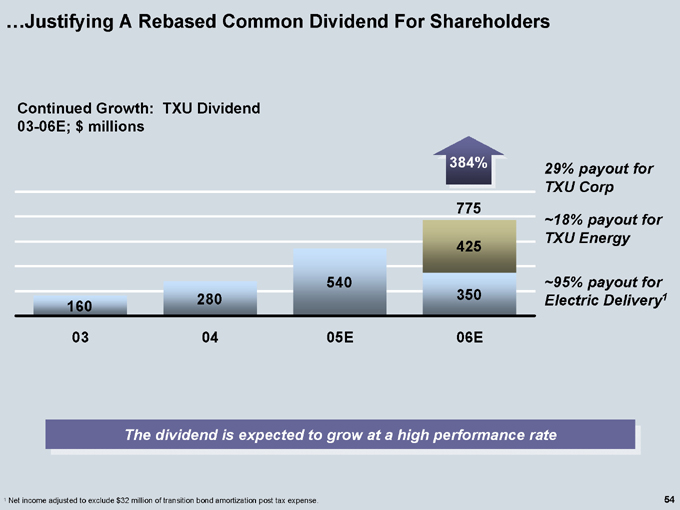
…Justifying A Rebased Common Dividend For Shareholders
Continued Growth: TXU Dividend 03-06E; $ millions
160
280
540
384%
775
425
350
03 04 05E 06E
29% payout for TXU Corp
~18% payout for TXU Energy
~95% payout for Electric Delivery1
The dividend is expected to grow at a high performance rate
1 | | Net income adjusted to exclude $32 million of transition bond amortization post tax expense. |
54
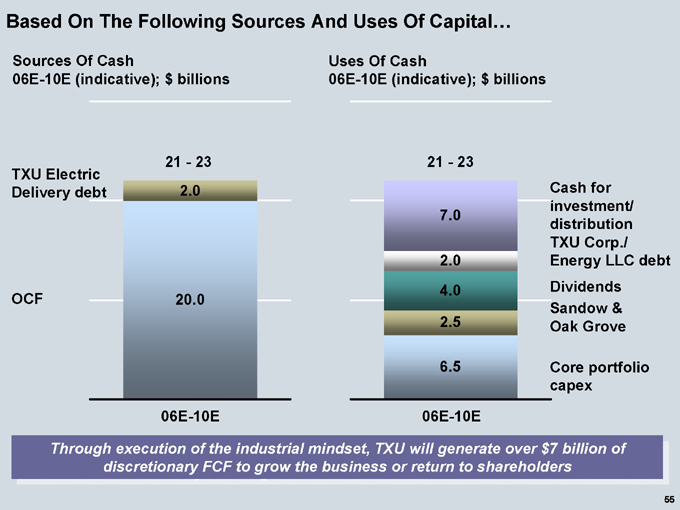
Based On The Following Sources And Uses Of Capital…
Sources Of Cash
06E-10E (indicative); $ billions
TXU Electric Delivery debt
OCF
21—23
2.0
20.0
06E-10E
Uses Of Cash
06E-10E (indicative); $ billions
21—23
7.0
2.0
4.0
2.5
6.5
06E-10E
Cash for investment/ distribution TXU Corp./ Energy LLC debt Dividends Sandow & Oak Grove
Core portfolio capex
Through execution of the industrial mindset, TXU will generate over $ 7 billion of discretionary FCF to grow the business or return to shareholders
55
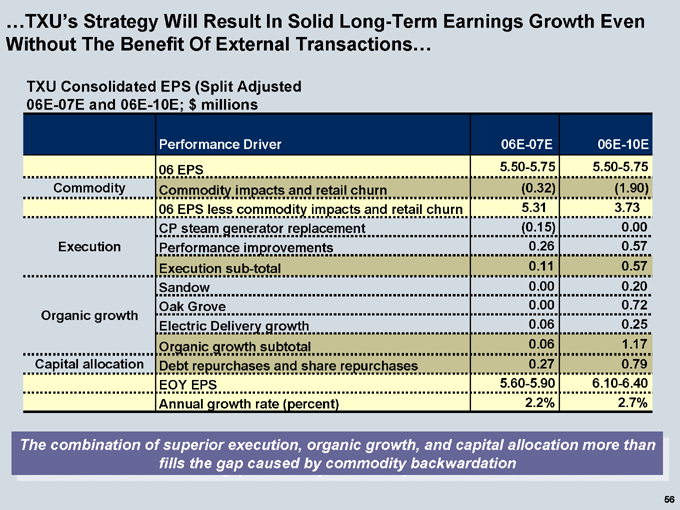
…TXU’s Strategy Will Result In Solid Long-Term Earnings Growth Even Without The Benefit Of External Transactions…
TXU Consolidated EPS (Split Adjusted 06E-07E and 06E-10E; $ millions
Performance Driver 06E-07E 06E-10E
06 EPS 5.50-5.75 5.50-5.75
Commodity Commodity impacts and retail churn (0.32) (1.90)
06 EPS less commodity impacts and retail churn 5.31 3.73
CP steam generator replacement (0.15) 0.00
Execution Performance improvements 0.26 0.57
Execution sub-total 0.11 0.57
Sandow 0.00 0.20
Oak Grove 0.00 0.72
Organic growth
Electric Delivery growth 0.06 0.25
Organic growth subtotal 0.06 1.17
Capital allocation Debt repurchases and share repurchases 0.27 0.79
EOY EPS 5.60-5.90 6.10-6.40
Annual growth rate (percent) 2.2% 2.7%
The combination of superior execution, organic growth, and capital allocation more than fills the gap caused by commodity backwardation
56
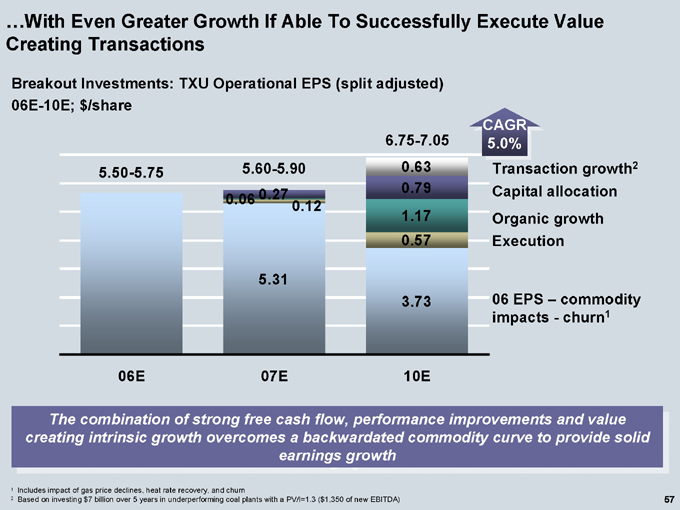
…With Even Greater Growth If Able To Successfully Execute Value Creating Transactions
Breakout Investments: TXU Operational EPS (split adjusted) 06E-10E; $/share
5.50-5.75
5.60-5.90
0.06 0.27 0.12
5.31
6.75-7.05
0.63
0.79
1.17
0.57
3.73
CAGR 5.0%
06E 07E 10E
Transaction growth2 Capital allocation Organic growth Execution
06 EPS – commodity impacts—churn1
The combination of strong free cash flow, performance improvements and value creating intrinsic growth overcomes a backwardated commodity curve to provide solid earnings
1 | | Includes impact of gas price declines, heat rate recovery, and churn |
2 | | Based on investing $7 billion over 5 years in underperforming coal plants with a PV/I=1.3 ($1,350 of new EBITDA) |
57
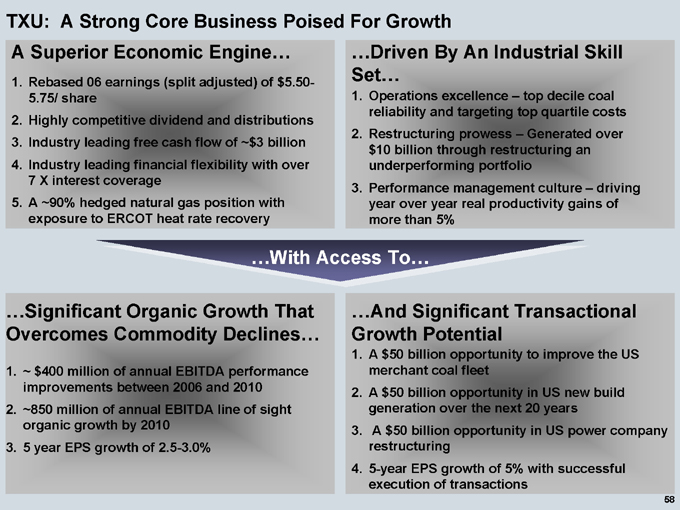
TXU: A Strong Core Business Poised For Growth
A Superior Economic Engine…
1. Rebased 06 earnings (split adjusted) of $5.50-5.75/ share
2. Highly competitive dividend and distributions
3. Industry leading free cash flow of ~$3 billion
4. Industry leading financial flexibility with over 7 X interest coverage
5. A ~90% hedged natural gas position with exposure to ERCOT heat rate recovery
…Driven By An Industrial Skill Set…
1. Operations excellence – top decile coal reliability and targeting top quartile costs
2. Restructuring prowess – Generated over $10 billion through restructuring an underperforming portfolio
3. Performance management culture – driving year over year real productivity gains of more than 5%
…With Access To…
…Significant Organic Growth That Overcomes Commodity Declines…
1. ~ $400 million of annual EBITDA performance improvements between 2006 and 2010
2. ~850 million of annual EBITDA line of sight organic growth by 2010
3. 5 year EPS growth of 2.5-3.0%
…And Significant Transactional Growth Potential
1. A $50 billion opportunity to improve the US merchant coal fleet
2. A $50 billion opportunity in US new build generation over the next 20 years
3. A $50 billion opportunity in US power company restructuring
4. 5-year EPS growth of 5% with successful execution of transactions
58
Regulation G Reconciliations
For future periods, TXU is currently unable to estimate the impact of special items or changes in accounting principles or policies on free cash flow, return on invested capital, total debt to capitalization or interest coverage. TXU is therefore currently unable to reconcile the most directly comparable GAAP measures to these items for forecasted periods.
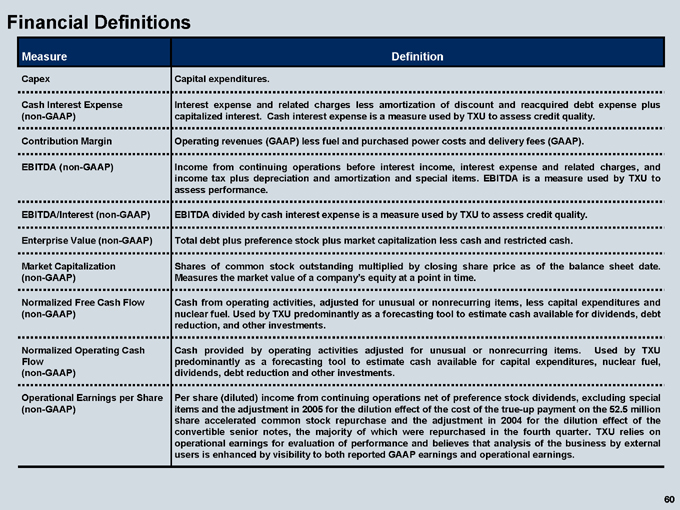
Financial Definitions
Measure Definition
Capex Capital expenditures.
Cash Interest Expense (non-GAAP) Interest expense and related charges less amortization of discount and reacquired debt expense plus capitalized interest. Cash interest expense is a measure used by TXU to assess credit quality.
Contribution Margin Operating revenues (GAAP) less fuel and purchased power costs and delivery fees (GAAP).
EBITDA (non-GAAP) Income from continuing operations before interest income, interest expense and related charges, and income tax plus depreciation and amortization and special items. EBITDA is a measure used by TXU to assess performance.
EBITDA/Interest (non-GAAP) EBITDA divided by cash interest expense is a measure used by TXU to assess credit quality.
Enterprise Value (non-GAAP) Total debt plus preference stock plus market capitalization less cash and restricted cash.
Market Capitalization (non-GAAP) Shares of common stock outstanding multiplied by closing share price as of the balance sheet date Measures the market value of a company’s equity at a point in time.
Normalized Free Cash Flow (non-GAAP) Cash from operating activities, adjusted for unusual or nonrecurring items, less capital expenditures and nuclear fuel. Used by TXU predominantly as a forecasting tool toestimate cash available for dividends, debt reduction, and other investments.
Normalized Operating Cash Flow (non-GAAP) Cash provided by operating activities adjusted for unusual or nonrecurring items. Used by TXU predominantly as a forecasting tool to estimate cash available for capital expenditures, nuclear fuel, dividends, debt reduction and other investments.
Operational Earnings per Share (non-GAAP) Per share (diluted) income from continuing operations net of preference stock dividends, excluding special items and the adjustment in 2005 for the dilution effect of the cost of the true-up payment on the 52.5 million share accelerated common stock repurchase and the adjustment in 2004 for the dilution effect of the convertible senior notes, the majority of which were repurchased in the fourth quarter. TXU relies on operational earnings for evaluation of performance and believes that analysis of the business by external users is enhanced by visibility to both reported GAAP earnings and operational earnings.
60
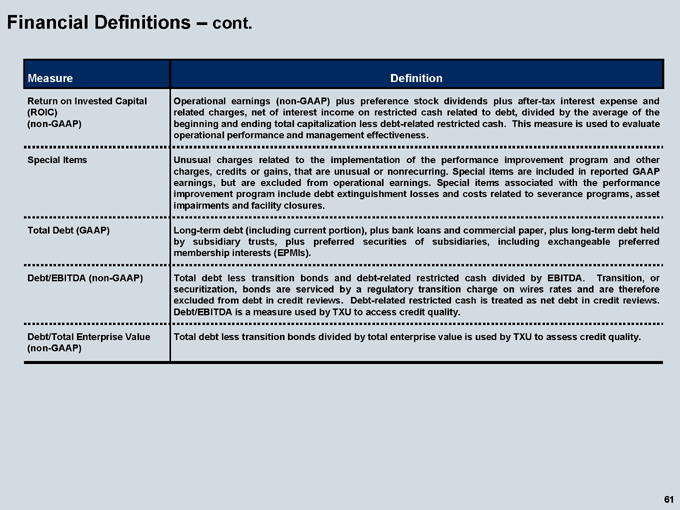
Financial Definitions – cont.
Measure Definition
Return on Invested Capital (ROIC) (non-GAAP) Operational earnings (non-GAAP) plus preference stock dividends plus after-tax interest expense and related charges, net of interest income on restricted cash related to debt, divided by the average of the beginning and ending total capitalization less debt-related restricted cash. This measure is used to evaluate operational performance and management effectiveness.
Special Items Unusual charges related to the implementation of the performance improvement program and other charges, credits or gains, that are unusual or nonrecurring. Special items are included in reported GAAP earnings, but are excluded from operational earnings. Special items associated with the performance improvement program include debt extinguishment losses and costs related to severance programs, asset impairments and facility closures.
Total Debt (GAAP) Long-term debt (including current portion), plus bank loans and commercial paper, plus long-term debt held by subsidiary trusts, plus preferred securities of subsidiaries, including exchangeable preferred membership interests (EPMIs).
Debt/EBITDA (non-GAAP) Total debt less transition bonds and debt-related restricted cash divided by EBITDA. Transition, or securitization, bonds are serviced by a regulatory transition charge on wires rates and are therefore excluded from debt in credit reviews. Debt-related restricted cash is treated as net debt in credit reviews. Debt/EBITDA is a measure used by TXU to access credit quality.
Debt/Total Enterprise Value (non-GAAP) Total debt less transition bonds divided by total enterprise value is used by TXU to assess credit quality.
61

Table 1: TXU Corp. Operational Earnings Reconciliation Twelve Months Ended December 31, 2004 and 2003 $/share after tax
04 03
Net income (loss) to common (1.29) 1.62
Discontinued operations (1.26) (0.20)
Extraordinary gain (0.05) -
Cum. effect of changes in accounting principles (0.03) 0.15
Premium on EPMIs 2.83 -
Preference stock dividends 0.07 0.06
Income from continuing operations 0.27 1.63
Preference stock dividends (0.07) (0.06)
Effect of diluted shares calculation 0.04 0.01
Special items 2.58 -
Operational earnings 2.82 1.58
62
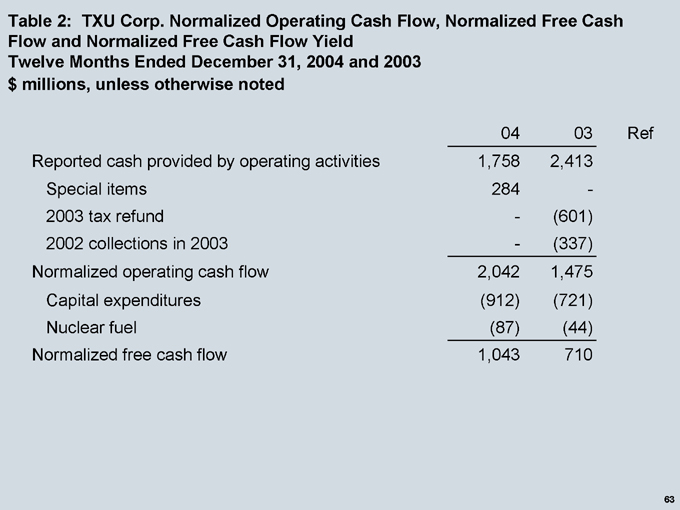
Table 2: TXU Corp. Normalized Operating Cash Flow, Normalized Free Cash Flow and Normalized Free Cash Flow Yield Twelve Months Ended December 31, 2004 and 2003 $ millions, unless otherwise noted
04 03 Ref
Reported cash provided by operating activities 1,758 2,413
Special items 284 —
2003 tax refund — (601)
2002 collections in 2003 — (337)
Normalized operating cash flow 2,042 1,475
Capital expenditures (912) (721)
Nuclear fuel (87) (44)
Normalized free cash flow 1,043 710
63

Table 3: TXU Corp. Interest and Debt Coverage Ratios Twelve Months Ended December 31, 2004 and 2003 $ millions, unless otherwise noted
04 03 Ref
Cash provided by operating activities 1,758 2,413 A
Reconciling adjustments from cash flow statement (1,677) (1,847) B
Income from continuing operations 81 566
Income tax expense 42 252
Interest expense and related charges 695 784
Interest income (28) (36)
Depreciation and amortization 760 724
EBITDA 1,550 2,290
Special Items 1,190 —
EBITDA (excluding special items) 2,740 2,290 C
Interest expense and related charges 695 784
Amortization of discount and reacquired debt expense (27) (31)
Capitalized interest 12 12
Cash interest expense 680 765 D
Total debt 12,889 12,591 E
Transition bonds (1,258) (500)
Debt-related restricted cash — (525)
Total debt less transition bonds and debt-related restricted cash 11,631 11,566 F
EBITDA/interest – ratio (C/D) 4.0 3.0
Debt/EBITDA – ratio (F/C) 4.2 5.1
Cash provided by operating activities + cash interest expense/cash interest expense – ratio (A+D/D) 3.6 4.2
Total debt/cash provided by operating activities – ratio (E/A) 7.3 5.2
64
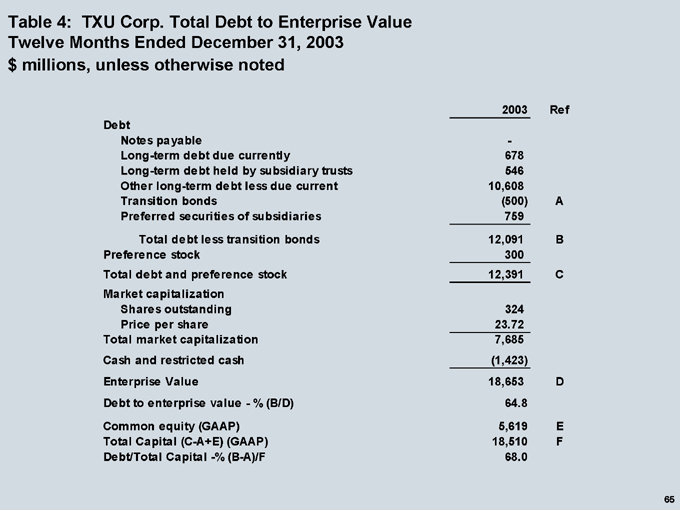
Table 4: TXU Corp. Total Debt to Enterprise Value Twelve Months Ended December 31, 2003 $ millions, unless otherwise noted
2003 Ref
Debt
Notes payable —
Long-term debt due currently 678
Long-term debt held by subsidiary trusts 546
Other long-term debt less due current 10,608
Transition bonds (500) A
Preferred securities of subsidiaries 759
Total debt less transition bonds 12,091 B
Preference stock 300
Total debt and preference stock 12,391 C
Market capitalization
Shares outstanding 324
Price per share 23.72
Total market capitalization 7,685
Cash and restricted cash (1,423)
Enterprise Value 18,653 D
Debt to enterprise value—% (B/D) 64.8
Common equity (GAAP) 5,619 E
Total Capital (C-A+E) (GAAP) 18,510 F
Debt/Total Capital -% (B-A)/F 68.0
65
Earnings Growth
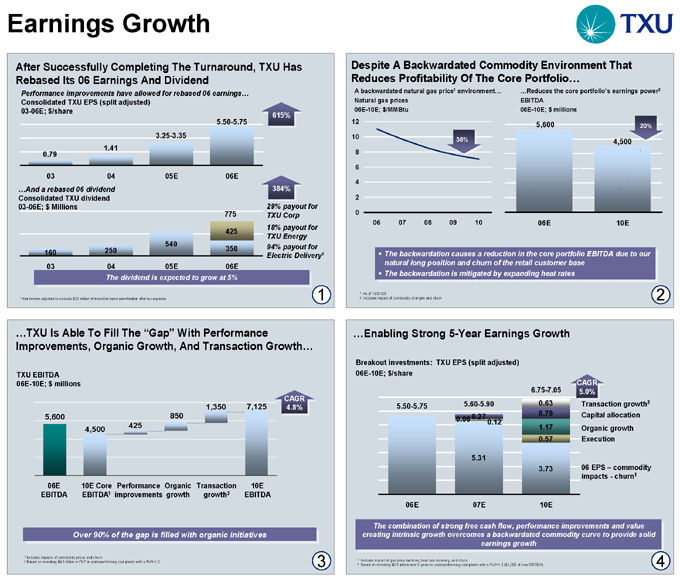
After Successfully Completing The Turnaround, TXU Has Rebased Its 06 Earnings And Dividend
Performance improvements have allowed for rebased 06 earnings…
Consolidated TXU EPS (split adjusted) 03-06E; $/share
0.79 03 1.41 04 3.25-3.35 05E 5.50-5.75 06E
615% 384%
…And a rebased 06 dividend
Consolidated TXU dividend 03-06E; $ Millions
160 03 250 04 540 05E 775 425 350 06E
29% payout for TXU Corp 18% payout for TXU Energy 94% payout for Electric Delivery1
The dividend is expected to grow at 5%
1 Net income adjusted to exclude $32 million of transition bond amortization after tax expense
Despite A Backwardated Commodity Environment That Reduces Profitability Of The Core Portfolio…
A backwardated natural gas price1 environment… Natural gas prices 06E-10E; $/MMBtu
12 10 8 6 4 2 0
36%
06 07 08 09 10
…Reduces the core portfolio’s earnings power2 EBITDA
06E-10E; $ millions
5,600 06E
4,500 10E
20%
The backwardation causes a reduction in the core portfolio EBITDA due to our natural long position and churn of the retail customer base
The backwardation is mitigated by expanding heat rates
1 As of 10/31/05
2 Includes impact of commodity changes and churn
…TXU Is Able To Fill The “Gap” With Performance
Improvements, Organic Growth, And Transaction Growth…
TXU EBITDA 06E-10E; $ millions
5,600 4,500 425 850 1,350 7,125 CAGR 4.8%
06E EBITDA
10E Core EBITDA1
Performance improvements
Organic growth
Transaction growth2
10E EBITDA
Over 90% of the gap is filled with organic initiatives
1 Includes impacts of commodity prices and churn
2 Based on investing $6.5 billion in FCF in underperforming coal plants with a PV/I=1.3
…Enabling Strong 5-Year Earnings Growth
Breakout investments: TXU EPS (split adjusted) 06E-10E; $/share
5.50-5.75
5.60-5.90
0.06 0.27 0.12 5.31
6.75-7.05
0.63 0.79 1.17 0.57
3.73
06E 07E 10E
CAGR 5.0%
Transaction growth2 Capital allocation Organic growth Execution
06 EPS – commodity impacts - churn1
The combination of strong free cash flow, performance improvements and value creating intrinsic growth overcomes a backwardated commodity curve to provide solid earnings growth
1 Includes impact of gas price declines, heat rate recovery, and churn
2 Based on investing $6.5 billion over 5 years in underperforming coal plants with a PV/I=1.3 ($1,350 of new EBITDA)
TXU Energy: Winning In Competitive Retail
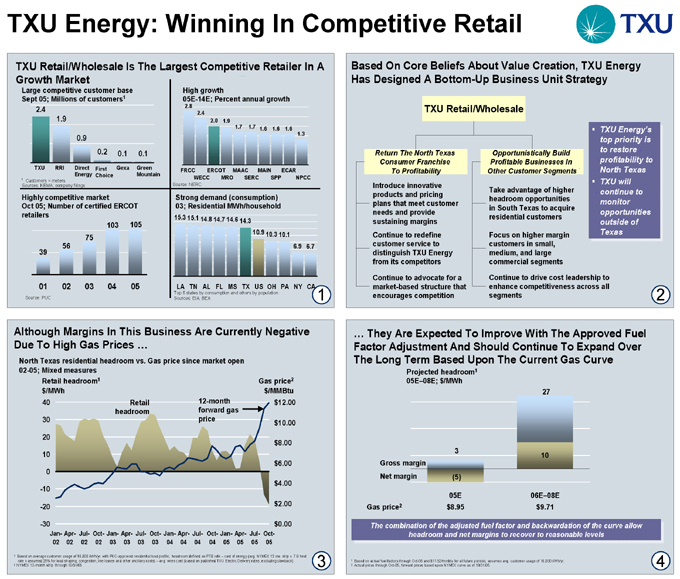
TXU Retail/Wholesale Is The Largest Competitive Retailer In A Growth Market
Large competitive customer base Sept 05; Millions of customers1
2.4 1.9
0.9
0.2 0.1 0.1
TXU RRI Direct First Gexa Green Energy Choice Mountain
1 Customers = meters
Sources: KEMA, company filings
Highly competitive market
Oct 05; Number of certified ERCOT retailers
103 105 75 56 39
01 02 03 04 05
Source: PUC
High growth
05E-14E; Percent annual growth
2.8 2.4
2.0 1.9
1.7 1.7 1.6 1.6 1.6 1.3
FRCC ERCOT MAAC MAIN ECAR
WECC MRO SERC SPP NPCC
Source: NERC
Strong demand (consumption) 03; Residential MWh/household
15.3 15.1 14.8
14.7 14.6 14.3
10.9 10.3 10.1
6.9 6.7
LA TN AL FL MS TX US OH PA NY CA
Top 6 states by consumption and others by population Sources: EIA, BEA
Based On Core Beliefs About Value Creation, TXU Energy Has Designed A Bottom-Up Business Unit Strategy
TXU Retail/Wholesale
Return The North Texas Consumer Franchise To Profitability
Introduce innovative products and pricing plans that meet customer needs and provide sustaining margins
Continue to redefine customer service to distinguish TXU Energy from its competitors
Continue to advocate for a market-based structure that encourages competition
Opportunistically Build Profitable Businesses In Other Customer Segments
Take advantage of higher headroom opportunities in South Texas to acquire residential customers
Focus on higher margin customers in small, medium, and large commercial segments
Continue to drive cost leadership to enhance competitiveness across all segments
TXU Energy’s top priority is to restore profitability to North Texas
TXU will continue to monitor opportunities outside of Texas
Although Margins In This Business Are Currently Negative Due To High Gas Prices …
North Texas residential headroom vs. Gas price since market open 02-05; Mixed measures
Retail headroom1 $/MWh
40 30 20 10 0 -10 -20 -30
Jan- Apr- Jul- Oct- Jan- Apr- Jul- Oct- Jan- Apr- Jul- Oct- Jan- Apr- Jul- Oct-
02 02 02 02 03 03 03 03 04 04 04 04 05 05 05 05
Gas price2 $/MMBtu $12.00 $10.00 $8.00 $6.00 $4.00 $2.00 $0.00
Retail 12-month headroom forward gas price
1 Based on average customer usage of 16,000 kWh/yr. with PUC-approved residential load profile; headroom defined as PTB rate – cost of energy (avg. NYMEX 12 mo. strip x 7.8 heat rate x assumed 25% for load shaping, congestion, line losses and other ancillary costs) – avg. wires cost (based on published TXU Electric Delivery rates, excluding clawback).
2 NYMEX 12-month strip through 10/31/05.
… They Are Expected To Improve With The Approved Fuel Factor Adjustment And Should Continue To Expand Over The Long Term Based Upon The Current Gas Curve
Projected headroom1 05E–08E; $/MWh
Gross margin Net margin
27
10
05E 06E–08E Gas price2 $8.95 $9.71
The combination of the adjusted fuel factor and backwardation of curve allow headroom and net margins to recover to reasonable levels
1 Based on actual fuel factors through Oct-05 and $11.52/mmbtu for all future periods; assumes avg. customer usage of 16,000 kWh/yr.
2 Actual prices through Oct-05, forward prices based upon NYMEX curve as of 10/31/05. 4
TXU Energy: Winning In Competitive Retail
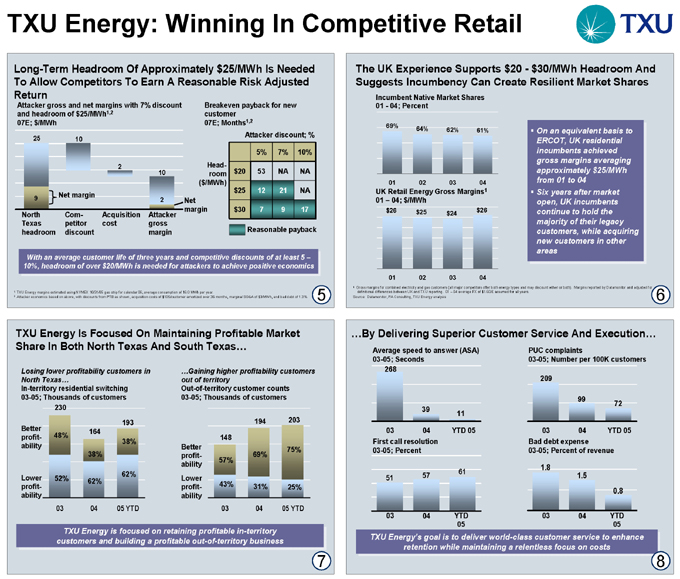
Long-Term Headroom Of Approximately $25/MWh Is Needed To Allow Competitors To Earn A Reasonable Risk Adjusted Return
Attacker gross and net margins with 7% discount and headroom of $25/MWh1,2 07E; $/MWh
25 10
2
10
9
Net margin
North Com- Acquisition Attacker Texas petitor cost gross headroom discount margin
Net margin
Breakeven payback for new customer 07E; Months1,2
Attacker discount; %
Headroom
($/MWh)
5% 7% 10%
$20 53 NA NA
$25 12 21 NA
$30 7 9 17
Reasonable payback
With an average customer life of three years and competitive discounts of at least 5 – 10%, headroom of over $20/MWh is needed for attackers to achieve positive economics
1 TXU Energy margins estimated using NYMEX 10/31/05 gas strip for calendar 06, average consumption of 16.0 MWh per year.
2 Attacker economics based on above, with discounts from PTB as shown, acquisition costs of $105/customer amortized over 36 months, marginal SG&A of $3/MWh, and bad debt of 1.3%.
5
The UK Experience Supports $20—$30/MWh Headroom And Suggests Incumbency Can Create Resilient Market Shares
Incumbent Native Market Shares 01—04; Percent
69%
64% 62% 61%
01 02 03 04
UK Retail Energy Gross Margins1 01 – 04; $/MWh
$26 $ 25 $26 $24
01 02 03 04
On an equivalent basis to ERCOT, UK residential incumbents achieved gross margins averaging approximately $25/MWh from 01 to 04 from 01 to 04
Six years after market open, UK incumbents continue to hold thecontinue to hold the majority of their legacy customers, while acquiring new customers in other areas
1 Gross margins for combined electricity and gas customers (all major competitors offer both energy types and may discount either or both). Margins reported by Datamonitor and adjusted for definitional differences between UK and TXU reporting. 01 – 04 average FX of $1.60/£ assumed for all years.
Source: Datamonitor, PA Consulting, TXU Energy analysis 6
TXU Energy Is Focused On Maintaining Profitable Market Share In Both North Texas And South Texas…
Losing lower profitability customers in North Texas…
In-territory residential switching 03-05; Thousands of customers
Better profitability
Lower profitability
230
193 164 48% 38% 38%
62% 52% 62%
03 04 05 YTD
…Gaining higher profitability customers out of territory
Out-of-territory customer counts 03-05; Thousands of customers
Better profitability Lower profitability
194 203 148 75% 69% 57%
43% 31% 25%
03 04 05 YTD
TXU Energy is focused on retaining profitable in-territory customers and building a profitable out-of-territory business
…By Delivering Superior Customer Service And Execution…
Average speed to answer (ASA) 03-05; Seconds
268
39
11
03 04 YTD 05
First call resolution 03-05; Percent
61
51 57
03 04 YTD 05
PUC complaints
03-05; Number per 100K customers
209
99
72
03 04 YTD 05
Bad debt expense 03-05; Percent of revenue
1.8
1.5
0.8
03 04 YTD 05
TXU Energy’s goal is to deliver world-class customer service to enhance retention while maintaining a relentless focus on costs
8
TXU Energy: Winning In Competitive Retail
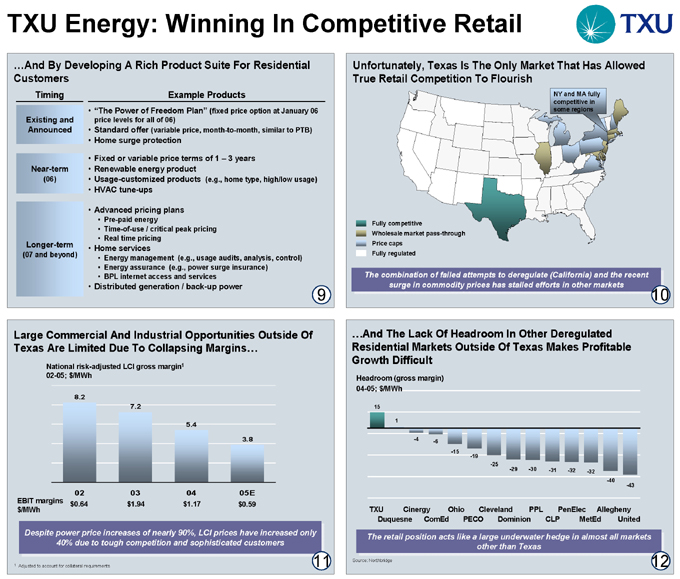
…And By Developing A Rich Product Suite For Residential Customers
Timing Example Products
Existing and Announced
Near-term
Longer-term
(07 and beyond)
“The Power of Freedom Plan” (fixed price option at January 06 price levels for all of 06) Standard offer (variable price, month-to-month, similar to PTB)
Home surge protection
Fixed or variable price terms of 1 – 3 years Renewable energy product
Usage-customized products (e.g., home type, high/low usage)
HVAC tune-ups
Advanced pricing plans
Pre-paid energy
Time-of-use / critical peak pricing Real time pricing
Home services
Energy management (e.g., usage audits, analysis, control) Energy assurance (e.g., power surge insurance) BPL internet access and services
Distributed generation / back-up power
9
Unfortunately, Texas Is The Only Market That Has Allowed True Retail Competition To Flourish
NY and MA fully competitive in some regions
Fully competitive
Wholesale market pass-through Price caps Fully regulated
The combination of failed attempts to deregulate (California) and the recent surge in commodity prices has stalled efforts in other markets
10
Large Commercial And Industrial Opportunities Outside Of Texas Are Limited Due To Collapsing Margins…
National risk-adjusted LCI gross margin1 02-05; $/MWh
8.2
7.2
5.4
3.8
02 03 04 05E
EBIT margins $0.64 $1.94 $1.17 $0.59 $/MWh
Despite power price increases of nearly 90%, LCI prices have increased only 40% due to tough competition and sophisticated customers 11
1 Adjusted to account for collateral requirements
…And The Lack Of Headroom In Other Deregulated Residential Markets Outside Of Texas Makes Profitable Growth Difficult
Headroom (gross margin) 04-05; $/MWh
15
-4 -6 -15 -19 -25
-29 -30 -31 -32 -32 -40 -43
TXU Cinergy Ohio Cleveland PPL PenElec Allegheny Duquesne ComEd PECO Dominion CLP MetEd United
The retail position acts like a large underwater hedge in almost all markets other than Texas
Source: Northbridge
12
TXU Power: Driving Operational Excellence
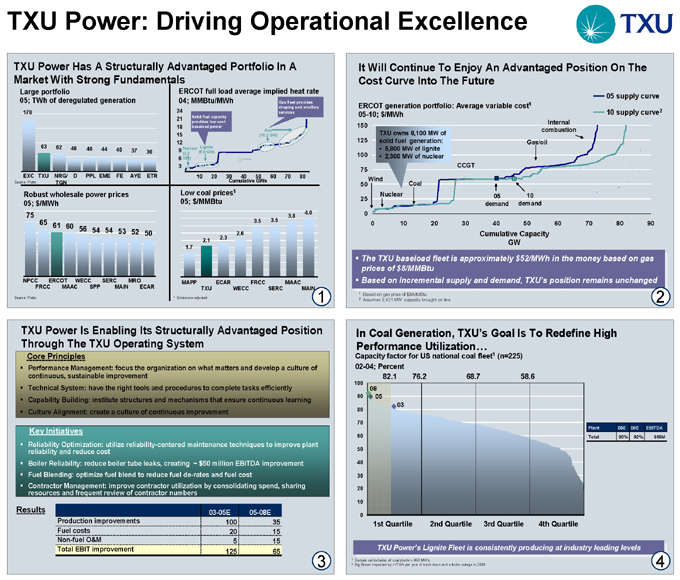
TXU Power Has A Structurally Advantaged Portfolio In A Market With Strong Fundamentals
Large portfolio
05; TWh of deregulated generation
178
63 62 46 46
44 40 37 30
EXC
Source: Platts
TXU
NRG/TGN
D
PPL
EME
FE
AYE
ETR
Robust wholesale power prices 05; $/MWh
75
65
61 60
56 54 54 53 52 50
NPCC ERCOT WECC SERC MRO
FRCC MAAC SPP MAIN ECAR
Source: Platts
ERCOT full load average implied heat rate
04; MMBtu/MWh
Gas fleet provides shaping and ancillary services
Solid fuel capacity provides low cost baseload power
Nuclear (2.3 GW) TXU Units
Lignite (5.8 GW)
Gas (10.2 GW)
24 21 18 15 12 9 6 3
10 20 30 40 50 60 70 80
Cumulative GWs
Low coal prices1 05; $/MMBtu
1.7
2.1
2.3
2.6
3.5
3.5
3.8
4.0
MAPP ECAR FRCC MAAC
TXU WECC SERC MAIN
It Will Continue To Enjoy An Advantaged Position On The Cost Curve Into The Future
ERCOT generation portfolio: Average variable cost1 05-10; $/MWh
150 125 100 75 50 25 0
TXU owns 8,100 MW of solid fuel generation:
5,800 MW of lignite
2,300 MW of nuclear
Wind
Nuclear
Coal
CCGT
05 demand
10 demand
Gas/oil
Internal combustion
05 supply curve
10 supply curve2
0 10 20 30 40 50 60 70 80 90
Cumulative Capacity GW
The TXU baseload fleet is approximately$52/MWh in the money based on gas prices of $8/MMBtu
Based on incremental supply and demand, TXU’s position remains unchanged
1 | | Based on gas price of $8/MMBtu |
2 | | Assumes 8,421 MW capacity brought on line |
TXU Power Is Enabling Its Structurally Advantaged Position Through The TXU Operating System
Core Principles
Performance Management: focus the organization on what matters and develop a culture of continuous, sustainable improvement Technical System: have the right tools and procedures to complete tasks efficiently Capability Building: institute structures and mechanisms that ensure continuous learning Culture Alignment: create a culture of continuous improvement
Key Initiatives
Reliability Optimization: utilize reliability-centered maintenance techniques to improve plant reliability and reduce cost Boiler Reliability: reduce boiler tube leaks, creating ~ $50 million EBITDA improvement Fuel Blending: optimize fuel blend to reduce fuel de-rates and fuel cost Contractor Management: improve contractor utilization by consolidating spend, sharing resources and frequent review of contractor numbers
Results
03-05E 05-08E Production improvements 100 35 Fuel costs 20 15 Non-fuel O&M 5 15 Total EBIT improvement 125 65
In Coal Generation, TXU’s Goal Is To Redefine High Performance Utilization…
Capacity factor for US national coal fleet1 (n=225) 02-04; Percent
100 90 80 70 60 50 40 30 20 10 0
82.1 76.2 68.7 58.6
08
05
03
1st Quartile 2nd Quartile 3rd Quartile 4th Quartile
Plant 05E 08E EBITDA
Total 90% 92% $69M
TXU Power’s Lignite Fleet is consistently producing at industry leading levels
1 | | Sample set includes all coal plants > 450 MW’s |
2 | | Big Brown impacted by >1TWh per year of back-down and a boiler outage in 2008 |
TXU Power: Driving Operational Excellence
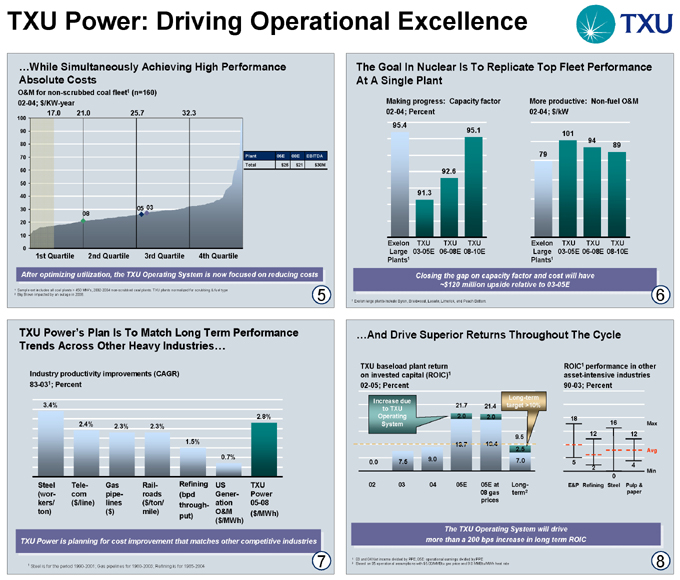
…While Simultaneously Achieving High Performance Absolute Costs
O&M for non-scrubbed coal fleet1 (n=160) 02-04; $/KW-year
100 90 80 70 60 50 40 30 20 10 0
17.0 21.0 25.7 32.3
08
05
03
Plant 05E 08E EBITDA
Total $26 $21 $30M
1st Quartile 2nd Quartile 3rd Quartile 4th Quartile
After optimizing utilization, the TXU Operating System is now focused on reducing costs
1 Sample set includes all coal plants > 450 MW’s, 2002-2004 non-scrubbed coal plants. TXU plants normalized for scrubbing & fuel type
2 | | Big Brown impacted by an outage in 2008. |
The Goal In Nuclear Is To Replicate Top Fleet Performance At A Single Plant
Making progress: Capacity factor 02-04; Percent
95.4
91.3
92.6
95.1
Exelon Large Plants1
TXU 03-05E
TXU 06-08E
TXU 08-10E
More productive: Non-fuel O&M 02-04; $/kW
79
101
94
89
Exelon Large Plants1
TXU 03-05E
TXU 06-08E
TXU 08-10E
Closing the gap on capacity factor and cost will have ~ $120 million upside relative to 03-05E
1 | | Exelon large plants include Byron, Braidwood, Lasalle, Limerick, and Peach Bottom. |
TXU Power’s Plan Is To Match Long Term Performance Trends Across Other Heavy Industries…
Industry productivity improvements (CAGR) 83-031; Percent
3.4%
2.4%
2.3%
2.3%
1.5%
0.7%
2.8%
Steel (workers/ ton)
Tele-com
($/line)
Gas pipelines
($)
Railroads
($/ton/ mile)
Refining (bpd throughput)
US Generation O&M
($/MWh)
TXU Power 05-08
($/MWh)
TXU Power is planning for cost improvement that matches other competitive industries
1 | | Steel is for the period 1990-2001; Gas pipelines for 1980-2003; Refining is for 1985-2004 |
…And Drive Superior Returns Throughout The Cycle
TXU baseload plant return on invested capital (ROIC)1 02-05; Percent
Increase due to TXU
Operating System
0.0
7.5
9.0
21.7
2.0
19.7
21.4
2.0
19.4
Long-term target >10%
9.5
2.5 7.0
02 03 04 05E
05E at 08 gas prices
Long-term2
ROIC1 performance in other asset-intensive industries 90-03; Percent
18
12
16
0
12
Max
Avg
Min
E&P
Refining
Steel
Pulp & paper
The TXU Operating System will drive more than a 200 bps increase in long term ROIC
1 | | 03 and 04 Net income divided by PPE; 05E: operational earnings divided by PPE |
2 | | Based on 05 operational assumptions with $5.00/MMBtu gas price and 9.0 MMBtu/MWh heat rate |
TXU Power: Expanding In Coal Generation
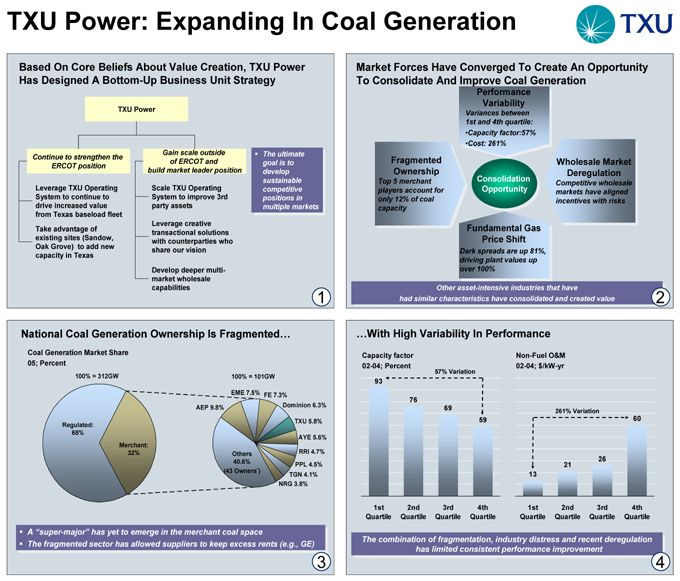
Based On Core Beliefs About Value Creation, TXU Power Has Designed A Bottom-Up Business Unit Strategy
TXU Power
Continue to strengthen the ERCOT position
Leverage TXU Operating System to continue to drive increased value from Texas baseload fleet Take advantage of existing sites (Sandow, Oak Grove) to add new capacity in Texas
Gain scale outside of ERCOT and build market leader position
Scale TXU Operating System to improve 3rd party assets
Leverage creative transactional solutions with counterparties who share our vision
Develop deeper multi-market wholesale capabilities
The ultimate goal is to develop sustainable competitive positions in multiple markets
Market Forces Have Converged To Create An Opportunity To Consolidate And Improve Coal Generation
Performance Variability
Variances between 1st and 4th quartile: •Capacity factor:57% •Cost: 261%
Fragmented Ownership
Top 5 merchant players account for only 12% of coal capacity
Consolidation Opportunity
Wholesale Market Deregulation
Competitive wholesale markets have aligned incentives with risks
Fundamental Gas Price Shift
Dark spreads are up 81%, driving plant values up over 100%
Other asset-intensive industries that have had similar characteristics have consolidated and created value
National Coal Generation Ownership Is Fragmented…
Coal Generation Market Share 05; Percent
100% = 312GW
Regulated: 68%
Merchant: 32%
100% = 101GW
AEP 9.8%
EME 7.5% FE 7.3%
Dominion 6.3%
TXU 5.8%
AYE 5.6%
RRI 4.7%
PPL 4.5%
TGN 4.1%
NRG 3.8%
Others 40.6% (43 Owners*)
A “super-major” has yet to emerge in the merchant coal space
The fragmented sector has allowed suppliers to keep excess rents (e.g., GE)
…With High Variability In Performance
Capacity factor 02-04; Percent
57% Variation
93
76
69
59
1st Quartile
2nd Quartile
3rd Quartile
4th Quartile
Non-Fuel O&M 02-04; $/kW-yr
261% Variation
13
21
26
60
1st Quartile
2nd Quartile
3rd Quartile
4th Quartile
The combination of fragmentation, industry distress and recent deregulation has limited consistent performance improvement
TXU Power: Expanding In Coal Generation
The Shift In Gas Fundamentals Has Increased Both Underlying Values And The Value Of Potential Improvement
Dark spread1 00-05; $/MWh
16
14
13
22
21
29
00-05E 00-05E
81% 81%
00 01 02 03 04 05E
Large coal plant value2 00-05; $/kW
850
1900
124% 124% 00 05E
Value of 1% availability improvement 00-05; $/kW
12
23
92% 92%
00 05E
The increase in gas prices has made investment in coal a much more valuable option 2005 gas prices have made the TXU Operating System 10X more valuable than in 2000
1 | | Difference between all-hours energy price and coal plant fuel cost at 10.5 heat rate |
2 | | Value for large scrubbed plant in PJM; Based on forward gas curves in 2000 and 2005; Assumes 6% WACC |
Wholesale Market Deregulation Has Better Aligned The Rewards Of Performances With Potential Risk
Merchant share of US coal capacity 95-05; Percent
625% 625%
4%
32%
95 05E
Wholesale markets develop 95-05
CA ISO: 1996 CA
MISO: 2005
ERCOT: 2002
ISO-NE: 1999 ISO-NE:
NY: 1999 NY:
PJM: 1998
The ability to create and keep value through performance improvements makes this strategy more viable today
Just As In The Nuclear Sector, Consolidation Should Allow For Significant Performance Improvements
Top 5 merchant nuclear operators 95-05; Percent
54%
81%
50% 50%
95 05E
Availability 95-04; Percent
87.7
96.4
10% 10%
95—97 02—04
Non-Fuel O&M 95-04; $/MWh
15.9
14.5
9%
95—97 02—04
Nuclear consolidation has driven substantial performance improvements Improvements have changed public opinion: In 1995 46% approved of nuclear generation 38% opposed; Today 70% approve only 24% oppose
Identifying The Value Opportunity Starts With Focusing On Assets That Fit TXU’s Core Strengths…
US Fleet US Coal US Merchant Coal US Merchant Coal >100 MW
# Plants 15,757 597 279 108
Capacity (GW, 04) 959 GW 306 GW 95 GW 80 GW
Generation (TWh, 04) 3,950 TWh 1,950 TWh 550 TWh 530 TWh
Rationale
Nuclear already consolidated
Gas plants are a market timing bet
TXU Operating System focused on coal
Greater opportunity to retain value in merchant fleet
Quicker/cheaper transaction execution
Operating System most effective on large plants
Small plants generally older and marginal
TXU Power: Expanding In Coal Generation
…And Estimating The Performance Improvements By Replicating TXU’s Performance Across The Entire Merchant Coal Fleet
EBITDA improvement potential for targeted U.S. merchant coal fleet1 $ billions
Aspiration
Target
2.4
0.4
0.9
0.7
0.5
4.9
0.8
4.1
Value creation $/kW
510
370
Capacity factor
Env upgrades
Non-fuel O&M
Heat rate
Fuel cost
Gross value
Cost to achieve
Net value
Total improvement would be valued at over $ 40 billion
1 | | Power prices estimated using 2010 forward price of $7.05 natural gas. |
9
Applying These Value Levers To Individual Plants Produces A Targeted Origination List Of Counterparties
EBITDA Improvement Relative Improvement
$ millions Percent
Operator Target Aspiration Target Aspiration
A 140 180 50 60
B 160 220 40 50
C 220 300 30 40
D 245 345 30 40
E 225 325 30 40
F 95 140 25 40
G 85 130 25 35
H 100 150 25 35
I 100 160 20 30
J 115 165 15 20
K 50 70 15 20
TXU will leverage creative transaction structures to minimize premiums
1 | | Operated capacity at units >100 MW. |
2 | | 2010 EBITDA improvement assuming $7.05 gas; Value estimates reflect entire forward curve. |
10
TXU Will Pursue An Array Of Transaction Vehicles To Manage Risk And Avoid Large Premiums
Vehicle Benefits Risks
Allows use of equity Regulatory approval
Clear control Social issues
Corporate acquisition Avoids auction pricing
Allows bulk purchase Premium may be necessary on unwanted assets
Leverages other TXU strengths
Avoid auction pricing Allocation of profits
Joint venture/MOE Access to counter parties hesitant to sell Operational control less clear
Allows bulk purchase
Exchange/ swap Use of TXU asset shares as Limited pool of counterparties
currency provides risk benefits Finite currency
Not true growth
Asset purchase Allows target purchase Auction pricing
Clear control Cash currency creates commodity risk
Limited pool of assets
The strategy must be very opportunistic and flexible enough to leverage different structuring options
11
TXU’s Aspiration To Double The Size Of The Coal Portfolio Over The Next 5+ Years
Coal capacity (GW) Coal generation (TWh) % of 2010 target Capital investment ($ billions) Oper. Earnings1 ($ billions)
2006 TXU 5.8 46 36-47 0.02 1.0
Coal Plant Expansion 0.5 4 3-4 0.6 0.10
Oak Grove 1.7 14 11-14 2.0 0.35
Other Texas existing sites 0.5 4 3-4 0.6 0.11
Organic growth 2.7 22 17-22 3.2 0.6
TXU today + Organic growth 8.5 68 53-69 3.2 1.6
Potential transactions 3.5-7.0 30-60 31-47 3.9-7.7 0.8-1.6
2010 Target 12-15.5 98-128 100 7.1-10.9 2.4-3.2
TXU is pursuing a multi-pronged strategy of organic growth and transactions to reach its portfolio goals
1 | | Based on $60/MWh power. |
2 | | Does not include sustaining Capex. |
12

TXU Wholesale: Understanding Markets –Managing Risk
TXU’s Gas Position Is Derived From Its Baseload Generation Fleet…
ERCOT generation portfolio: average variable cost 04-06E; $/MWh
200 150 100 50 0
At $6 gas: Power price = $48 Coal margin = $32 Nuclear margin = $43
At $12 gas: Power price = $96 Coal margin = $80 Nuclear margin = $91
Gas price= $12.00
Gas price= $6.00
Demand
0 10 20 30 40 50 60 70
Wind costs
Nuclear costs
Coal costs
CCGT costs
Cumulative Capacity (GW)
Gas/oil costs
Gas prices set ERCOT power prices 95% of the time
If Gas prices go…
…Price of wholesale power goes…
…TXU Power’s margin goes…
= “Long” Gas
…But Is Balanced By Its Retail Position
Economics of TXU Energy (retail) and TXU Power (generation) 02-05; $/MWh (illustrative)
Price-to-Beat (PTB)
Wires and shaping costs
Wholesale 7X24 power price
Solid fuel fixed cost
Energy margin
Power margin
02 03 04 05E
TXU Energy and TXU Power margins are counter-cyclical:
As gas prices rise and Power margins expand, Energy margins fall the retail price (PTB until 1/1/07) is raised As gas prices fall and Power margins contract, Energy margins expand
2
TXU Believes The Fundamentals Support Backwardation In The Natural Gas Curve…
U.S. and Canada gas supply and demand (12 Bcfd LNG addition) 10E; $/MMBtu
12 10 8 6 4 2 0
Price range=$5.50-$7.00
2010 demand
0 10 20 30 40 50 60 70 80 90
Cumulative Capacity Bcfd
Natural gas price forecasts 06E-10E; $/MMBtu $12.00 $10.00 $8.00 $6.00 $4.00 $2.00 $0.00
NYMEX
PIRA
06 07 08 09 10
While the gas curve is backwardated, fundamentals still support historically high prices
3
…And Significant Heat Rate Recovery Over The Next Ten Years
ERCOT market 7X24 heat rates (NYMEX) 06E-10E; MMBtu/MWh
2010 Henwood estimate = 9.1
Equivalent to an 8.5 HSC heat rate
7.7
1.0
0.1
0.1
0.0
0.4
8.1
9.9
2006 heat rate
Demand growth
Demand destruction
Wind generation increases
Unmothballing of gas peakers
Baseload capacity additions
2010 heat rate
Long term heat rate to support CCGT new build1
Details
• 2% yearly demand growth
• 1.7 GW per year
• 1.1 GW of destruction
1.8 GW
2.4 GW
Coal Plant Expansion (0.6 GW) Oak Grove (1.7 GW) S.A. Power (0.8 GW)
The growth in ERCOT supports limited baseload expansion
1 | | Based on $5.00 gas prices. |
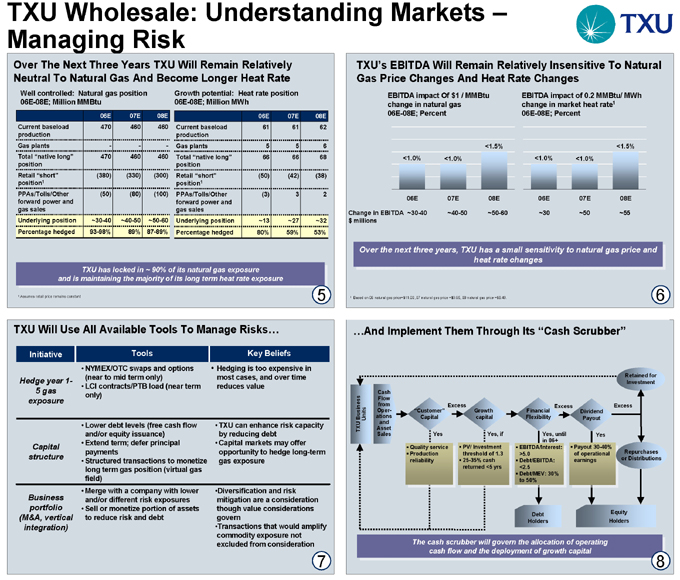
TXU Wholesale: Understanding Markets –Managing Risk
Over The Next Three Years TXU Will Remain Relatively Neutral To Natural Gas And Become Longer Heat Rate
Well controlled: Natural gas position 06E-08E; Million MMBtu
06E 07E 08E
Current baseload production 470 460 460
Gas plants ——
Total “native long” position 470 460 460
Retail “short” position1 (380) (330) (300)
PPAs/Tolls/Other forward power and gas sales (50) (80) (100)
Underlying position ~30-40 ~40-50 ~50-60
Percentage hedged 93-98% 89% 87-89%
Growth potential: Heat rate position 06E-08E; Million MWh
06E 07E 08E
Current baseload production 61 61 62
Gas plants 5 5 6
Total “native long” position 66 66 68
Retail “short” position1 (50) (42) (38)
PPAs/Tolls/Other forward power and gas sales (3) 3 2
Underlying position ~13 ~27 ~32
Percentage hedged 80% 59% 53%
TXU has locked in ~ 90% of its natural gas exposure and is maintaining the majority of its long term heat rate exposure
5
TXU’s EBITDA Will Remain Relatively Insensitive To Natural Gas Price Changes And Heat Rate Changes
EBITDA impact Of $1 / MMBtu change in natural gas 06E-08E; Percent
<1.0%
<1.0%
<1.5%
06E 07E 08E
EBITDA impact of 0.2 MMBtu/ MWh change in market heat rate1 06E-08E; Percent
<1.0%
<1.0%
<1.5%
06E 07E 08E
~30 ~50 ~55
Change in EBITDA $ millions
~30-40 ~40-50 ~50-60
Over the next three years, TXU has a small sensitivity to natural gas price and heat rate changes
1 Based on 06 natural gas price=$11.00, 07 natural gas price =$9.65, 08 natural gas price =$8.49.
6
TXU Will Use All Available Tools To Manage Risks…
Initiative Tools Key Beliefs
Hedge year 1- NYMEX/OTC swaps and options (near to mid term only) Hedging is too expensive in most cases, and over time reduces value
5 | | gas exposure LCI contracts/PTB load (near term only) |
Lower debt levels (free cash flow and/or equity issuance) TXU can enhance risk capacity by reducing debt
Capital structure Extend term; defer principal payments Capital markets may offer opportunity to hedge long-term gas exposure
Structured transactions to monetize long term gas position (virtual gas field)
Business portfolio (M&A, vertical integration) Merge with a company with lower and/or different risk exposures
Sell or monetize portion of assets to reduce risk and debt Diversification and risk mitigation are a consideration though value considerations govern
Transactions that would amplify commodity exposure not excluded from consideration
7
…And Implement Them Through Its “Cash Scrubber”
TXU Business Units
Cash Flow from Operations and Asset Sales
“Customer” Capital
Excess
Growth capital
Financial Flexibility
Excess
Dividend Payout
Excess
Retained for Investment
Yes
Yes, if
Yes, until in 06+
Yes
Quality service Quality service Production reliability
PV/ Investment threshold of 1.3 25-35% cash returned <5 yrs
EBITDA/Interest: >5.0 Debt/EBITDA: <2.5 Debt/MEV: 30% to 50%
Payout 30-40% of operational earnings
Repurchases or Distributions
Debt Holders
Equity Holders
The cash scrubber will govern the allocation of operating cash flow and the deployment of growth capital
8
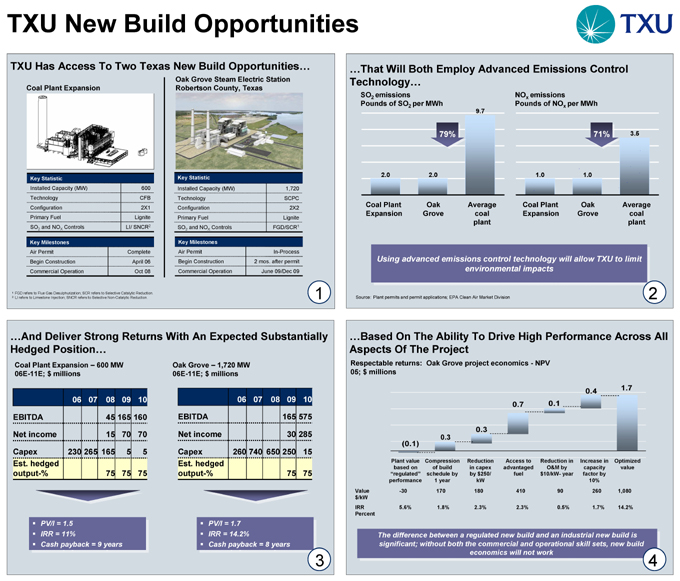
TXU New Build Opportunities
TXU Has Access To Two Texas New Build Opportunities…
Coal Plant Expansion
Oak Grove Steam Electric Station Robertson County, Texas
Key Statistic
Installed Capacity (MW) 600
Technology CFB
Configuration 2X1
Primary Fuel Lignite
SO2 and NOX Controls LI/ SNCR2
Key Milestones
Air Permit Complete
Begin Construction April 06
Commercial Operation Oct 08
Key Statistic
Installed Capacity (MW) 1,720
Technology SCPC
Configuration 2X2
Primary Fuel Lignite
SO2 and NOX Controls FGD/SCR1
Key Milestones
Air Permit In-Process
Begin Construction 2 mos. after permit
Commercial Operation June 09/Dec 09
1 | | FGD refers to Flue Gas Desulphurization; SCR refers to Selective Catalytic Reduction. |
2 | | LI refers to Limestone Injection; SNCR refers to Selective Non-Catalytic Reduction. |
…That Will Both Employ Advanced Emissions Control Technology…
SO2 emissions
Pounds of SO2 per MWh
2.0
2.0
79%
9.7
Coal Plant Expansion
Oak Grove
Average coal plant
NOx emissions
Pounds of NOx per MWh
1.0
1.0
71%
3.5
Coal Plant Expansion
Oak Grove
Average coal plant
Using advanced emissions control technology will allow TXU to limit environmental impacts
Source: Plant permits and permit applications; EPA Clean Air Market Division
…And Deliver Strong Returns With An Expected Substantially Hedged Position…
Coal Plant Expansion – 600 MW 06E-11E; $ millions
06 07 08 09 10
EBITDA 45 165 160
Net income 15 70 70
Capex 230 265 165 5 5
Est. hedged
output-% 75 75 75
PV/I = 1.5 IRR = 11%
Cash payback = 9 years
Oak Grove – 1,720 MW 06E-11E; $ millions
06 07 08 09 10
EBITDA 165 575
Net income 30 285
Capex 260 740 650 250 15
Est. hedged output-% 75 75
PV/I = 1.7 IRR = 14.2%
Cash payback = 8 years
…Based On The Ability To Drive High Performance Across All Aspects Of The Project
Respectable returns: Oak Grove project economics—NPV 05; $ millions
Value $/kW IRR Percent
(0.1)
0.3
0.3
0.7
0.1
0.4
1.7
Plant value based on “regulated” performance -30
5.6%
Compression of build schedule by 1 year 170
1.8%
Reduction in capex by $250/kW
180
2.3%
Access to advantaged fuel
410
2.3%
Reduction in O&M by $10/kW- year
90
0.5%
Increase in capacity factor by 10% 260
1.7%
Optimized value
1,080
14.2%
The difference between a regulated new build and an industrial new build is significant; without both the commercial and operational skill sets, new build economics will not work
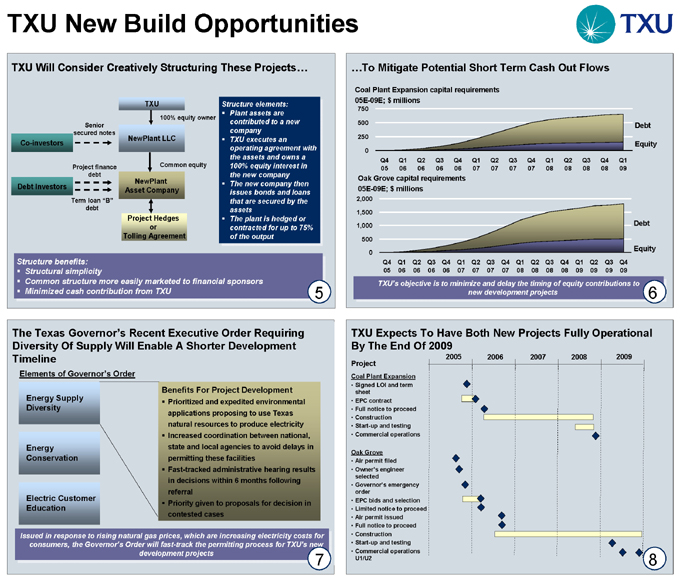
TXU New Build Opportunities
TXU Will Consider Creatively Structuring These Projects…
Co-investors
Debt Investors
Senior secured notes
Project finance debt
Term loan “B” debt
TXU
100% equity owner
NewPlant LLC
Common equity
NewPlant Asset Company
Project Hedges or Tolling Agreement
Structure elements: Plant assets are contributed to a new company TXU executes an operating agreement with the assets and owns a 100% equity interest in the new company The new company then issues bonds and loans that are secured by the assets The plant is hedged or contracted for up to 75% of the output
Structure benefits: Structural simplicity
Common structure more easily marketed to financial sponsors Minimized cash contribution from TXU
…To Mitigate Potential Short Term Cash Out Flows
Coal Plant Expansion capital requirements 05E-09E; $ millions
750 500 250 0
Q4 05
Q1 06
Q2 06
Q3 06
Q4 06
Q1 07
Q2 07
Q3 07
Q4 07
Q1 08
Q2 08
Q3 08
Q4 08
Q1 09
Debt
Equity
Oak Grove capital requirements 05E-09E; $ millions
2,000 1,500 1,000 500 0
Q4 05
Q1 06
Q2 06
Q3 06
Q4 06
Q1 07
Q2 07
Q3 07
Q4 07
Q1 08
Q2 08
Q3 08
Q4 08
Q1 09
Q2 09
Q3 09
Q4 09
Debt
Equity
TXU’s objective is to minimize and delay the timing of equity contributions to new development projects
The Texas Governor’s Recent Executive Order Requiring Diversity Of Supply Will Enable A Shorter Development Timeline
Elements of Governor’s Order
Energy Supply Diversity
Energy Conservation
Electric Customer Education
Benefits For Project Development
Prioritized and expedited environmental applications proposing to use Texas natural resources to produce electricity Increased coordination between national, state and local agencies to avoid delays in permitting these facilities Fast-tracked administrative hearing results in decisions within 6 months following referral Priority given to proposals for decision in contested cases
Issued in response to rising natural gas prices, which are increasing electricity costs for consumers, the Governor’s Order will fast-track the permitting process for TXU’s new development projects
TXU Expects To Have Both New Projects Fully Operational By The End Of 2009
Project
Coal Plant Expansion
Signed LOI and term sheet
EPC contract
Full notice to proceed
Construction
Start-up and testing
Commercial operations
Oak Grove
Air permit filed
Owner’s engineer selected
Governor’s emergency order
EPC bids and selection
Limited notice to proceed
Air permit issued
Full notice to proceed
Construction
Start-up and testing
Commercial operations U1/U2
2005 2006 2007 2008 2009
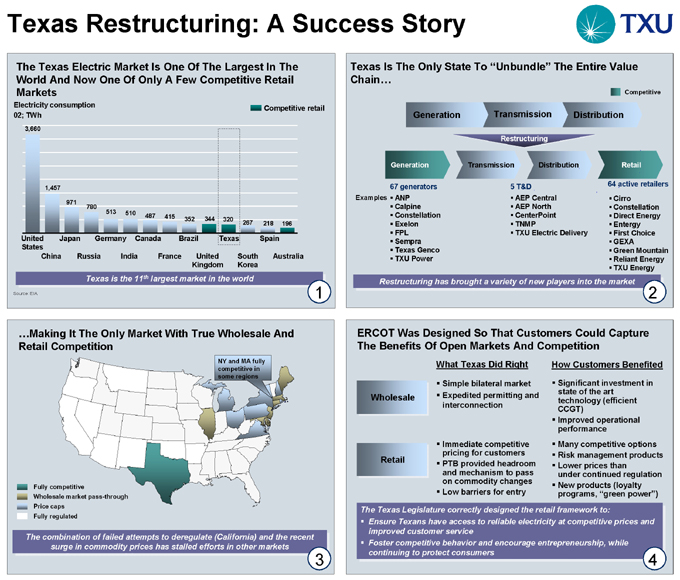
Texas Restructuring: A Success Story
The Texas Electric Market Is One Of The Largest In The World And Now One Of Only A Few Competitive Retail Markets
Electricity consumption 02; TWh
3,660
1,457
971
780
513
510
487
415
352
344
320
267
218
196
United States
Japan Germany Canada Brazil Texas Spain
China Russia India France
United Kingdom
South Korea
Australia
Texas is the 11th largest market in the world
Source: EIA
Competitive retail
Texas Is The Only State To “Unbundle” The Entire Value Chain…
Generation
Transmission
Distribution
Restructuring
Generation Transmission Distribution Retail
Competitive
Examples
67 generators ANP
Calpine Constellation Exelon FPL
Sempra Texas Genco TXU Power
5 | | T&D AEP Central AEP North CenterPoint TNMP |
TXU Electric Delivery
64 active retailers Cirro Constellation Direct Energy Entergy First Choice GEXA
Green Mountain Reliant Energy TXU Energy
Restructuring has brought a variety of new players into the market
…Making It The Only Market With True Wholesale And Retail Competition
NY and MA fully competitive in some regions
Fully competitive
Wholesale market pass-through Price caps Fully regulated
The combination of failed attempts to deregulate (California) and the recent surge in commodity prices has stalled efforts in other markets
ERCOT Was Designed So That Customers Could Capture The Benefits Of Open Markets And Competition
What Texas Did Right How Customers Benefited
Simple bilateral market Significant investment in state of the art technology (efficient CCGT)
Wholesale Expedited permitting and interconnection
Improved operational performance
Immediate competitive pricing for customers Many competitive options
Risk management products
Retail PTB provided headroom and mechanism to pass on commodity changes
Lower prices than under continued regulation
New products (loyalty programs, “green power”)
Low barriers for entry
The Texas Legislature correctly designed the retail framework to:
Ensure Texans have access to reliable electricity at competitive prices and improved customer service Foster competitive behavior and encourage entrepreneurship, while continuing to protect consumers
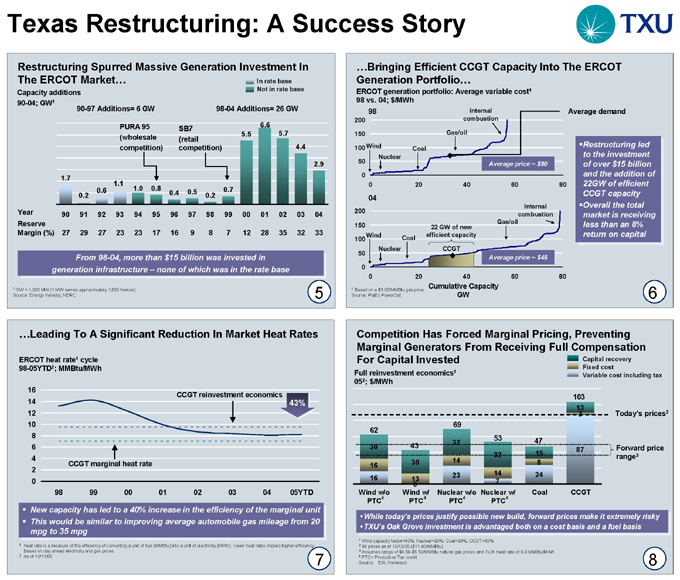
Texas Restructuring: A Success Story
Restructuring Spurred Massive Generation Investment In The ERCOT Market… In rate base
Capacity additions 90-04; GW1
90-97 Additions= 6 GW
PURA 95 (wholesale competition)
SB7 (retail competition)
98-04 Additions= 26 GW
In rate base Not in rate base
1.7
0.2
0.6
1.1
1.0
0.8
0.4
0.5
0.2
0.7
5.5
6.6
5.7
4.4
2.9
Year Reserve Margin (%)
90 91 92 93 94 95 96 97 98 99 00 01 02 03 04
27 29 27 23 23 17 16 9 8 7 12 28 35 32 33
From 98-04, more than $ 15 billion was invested in generation infrastructure –none of which was in the rate base
1 | | GW = 1,000 MW (1 MW serves approximately 1,000 homes) Source: Energy Velocity; NERC |
…Bringing Efficient CCGT Capacity Into The ERCOT Generation Portfolio…
ERCOT generation portfolio: Average variable cost1 98 vs. 04; $/MWh
200 150 100 50 0
98
Wind
Nuclear
Coal
Gas/oil
Internal combustion
Average demand
0 20 40 60 80
0 20 40 60 80
200
150
100
50
0
04
Wind
Nuclear
Coal
22 GW of new efficient capacity
CCGT
Gas/oil
Internal combustion
Average price ~ $45
Average price ~ $80
Restructuring led to the investment of over $15 billion and the addition of 22GW of efficient CCGT capacity Overall the total market is receiving less than an 8% return on capital
Cumulative Capacity GW
1 | | Based on a $6.00/MMBtu gas price Source: Platt’s PowerDat |
…Leading To A Significant Reduction In Market Heat Rates
ERCOT heat rate1 cycle 98-05YTD2; MMBtu/MWh
16 14 12 10 8 6 4 2 0
98 99 00 01 02 03 04 05YTD
CCGT marginal heat rate
CCGT reinvestment economics
43%
New capacity has led to a 40% increase in the efficiency of the marginal unit This would be similar to improving average automobile gas mileage from 20 mpg to 35 mpg
1 Heat rate is a measure of the efficiency of converting a unit of fuel (MMBtu) into a unit of electricity (MWh); lower heat rates implies higher efficiency. Based on day ahead electricity and gas prices.
Competition Has Forced Marginal Pricing, Preventing Marginal Generators From Receiving Full Compensation
For Capital Invested
Full reinvestment economics1
052; $/MWh
Capital recovery Fixed cost
Variable cost including tax
62
30
16 16
43
30
13 0
69
32 14 23
53
32
14 7
47
15 8 24
103
13 3
87
Today’s prices2
Forward price range3
Wind w/o PTC4
Wind w/PTC4
Nuclear w/o PTC 4
Nuclear w/PTC4
Coal
CCGT
While today’s prices justify possible new build, forward prices make it extremely risky TXU’s Oak Grove investment is advantaged both on a cost basis and a fuel basis
1 | | Wind capacity factor=40%, Nuclear=90%, Coal=90%, CCGT=60% |
2 | | 06 prices as of 10/13/05 ($11.40/MMBtu) |
3 | | Assumes range of $4.50-$5.50/MMBtu natural gas prices and 7x24 Heat rate of 8-9 MMBtu/MWh |
4 | | PTC= Production Tax credit Source: EIA, Henwood |

Texas Restructuring: A Success Story
Customers Have Already Begun To Reap The Benefits Of Competition
Average residential prices1 02-05E2; $/MWh
102
17%
84
If regulation continued
Competitive
Average large business prices1 02-05E2; $/MWh
71
14%
61
If regulation continued
Competitive
Even with historically high natural gas prices, customers have benefited from access to lower electricity prices than they would have experienced under regulation
1 Competitive Residential price based on average 15% discount (‘02-’05E) to TXU PTB offered by market competitors. Competitive large business rates include 10% wholesale gross-up and 1% net margin. Regulated world assumes 4.7 GW added capacity in the rate base at a cost of $600/kw, O&M costs approximately $38/kw-yr resulting in an average cost of $129/kw-yr in the rate base, SB7 mandated environmental costs approx. $400 million resulting in average cost of $12/kw-yr in the rate base, Comanche Peak stranded costs $1.2 billion resulting in average cost of $87/kw-yr in the rate base.
2 Based on forward curve as of 10/4/05.
9
Source: TXU Energy, ECOM model
ERCOT Accounts For Nearly 50% Of US Switching…
Total US electricity sales 04; 100% = 3,550 TWh
Rest of US
91%
9%
ERCOT
Residential switching by state 04; 100% = ~ 38 TWh
Pennsylvania
New York
All other markets1
ERCOT
78%
9%
4%
9%
Large commercial switching by state 04; 100% ~ 133 TWh
All other markets2
Maryland
Illinois
New York
ERCOT
30%
36%
9%
12%
13%
While ERCOT is only 8% of total electric sales in the US, it comprises 78% of residential switching and 36% of LCI switching
1 | | Includes AZ, CA, CT, DC, DE, IL, MA, MD, ME, MI, MT, NH, NJ, NV, OH, OR, RI, VA |
2 | | Includes MI, PA, CA, ME |
10
…With All Segments Taking Advantage Of The Competitive Environment
Significant competition: Net incumbent switch rates May 05; Percent of load
72
73
28
14
Large Business
Small and Medium Business
Residential
Local telephone 3 years after restructuring
Long distance 3 years after restructuring
ERCOT retail switching
Even customers that have remained with the incumbent receive multiple competitive bids (often more than 10 bidders)
Source: KEMA, FCC, CERA
11
Despite Recent Price Increases, Customer Support Continues To Be Strong
Percent of customers
91%
63%
62%
74%
10%
Support ERCOT electric deregulation
Prefer prices to be set by competitive market vs. regulation
Believe competition lowers electric prices better than regulation
Believe electric prices have increased over the past year
Believe recent higher electric prices are due to deregulation
Source: TXU Energy, random digit dial among all households in the competitive ERCOT electricity market
12
TXU Corporate Strategy: Achieving Market Leadership
TXU’s Strategy Reflects Core Beliefs About What It Takes To Win In The Energy Business
Principle Rationale
Energy markets will continue to go through cycles; only assets with a structural cost advantage will win over the long term
Long-Term Success In The Energy Sector Is Based On Having Access To Structurally Advantaged Assets
Structurally advantaged positions provide better opportunities over the long term
Superior operations and performance management can drive a 200 basis-point increase in ROIC
An Industrial Skill Set Is Crucial For Continual High Performance
2 Many companies in the sector have not transformed their performance level to reflect a competitive environment (delta between median and top quartile is 10-20%)
Just like in other capital intensive sectors, scale is necessary to standardize operations, gain critical mass, and extract rent from suppliers
Long-Term Winners Must Leverage Not Only Scale But “Quality Scale”
“Quality scale” is needed to gain access to advantaged new build, and gain competitive and regulatory leadership
Principle 1: TXU’s Core Businesses Are Structurally Advantaged Across The Entire Value Chain
TXU Competitive Business
TXU Regulated Business
Generation Wholesale Retail Transmission and Distribution
TXU Power TXU Wholesale TXU Energy TXU Electric Delivery
2nd largest U.S. deregulated output Access to largest ERCOT generation fleet Large scale competitive retailer 6th largest U.S. transmission & distribution company
Access to low cost lignite reserves Access to largest ERCOT retail position Loyal customer base Top quartile costs and reliability
Structural advantages 63 TWh of baseload production in a gas on the margin market Incumbent expertise in regulatory advocacy and market design Strong brand recognition
Superior service
High growth NERC region (2.0%)
Efficient capital recovery
No commodity exposure
No retail customers
05E EBITDA $2.7 B $1.2 B
Principle 2: An Industrial Skill Set Can Drive Superior Returns Over The Long Term
TXU baseload plant return on invested capital (ROIC)1 02-05; Percent
Increase due to TXU
Operating System
0.0
7.5
9.0
21.7
2.0
19.7
21.4
2.0
19.4
9.5
2.5 7.0
Long-term target = 10%
02 03 04 05E
05E at 08 gas prices
Long-term2
ROIC1 performance in other asset-intensive industries 90-03; Percent
18
12
16
0
12
Max
Avg
Min
E&P Refining Steel
Pulp & paper
•The Industrial Skill Set combines operational excellence, market The Industrial Skill Set combines operational excellence, marketleadership,leadership, risk/return mindset and performance managementrisk/return mindset and performance management •Application of this skill set will drive more than a 200 bps increase in long termApplication of this skill set will drive more than a 200 bps increase in long term ROICROIC
1 | | Net income divided by PPE |
2 | | Based on 05 operational assumptions with $5.00/MMBtu gas price and 9.0 MMBtu/MWh heat rate |
Principle 3: Based On Similarities Between The E&P Sector And The Power Sector…
Characteristic E&P Power generation Delivery
Multi-local ? Exploration and development driven by local geology and infrastructure ? Power marketing constrained to regional transmission grids Regulated model makes every transmission region different
Capital intensive ? Minimum efficient investment > $ 1 billion ? Minimum efficient investment > $ 750 million T&D companies can often invest up to 10% of their market cap in annual capex
Cyclical ? Oil/gas price cycles driven by investment conduct, declining economics and demand cyclicality ? Power price cycle driven by gas price volatility, fuel price volatility, demand growth and investment conduct Regulated returns cycle based on interest rate cycle
Importance of regulatory relationships ? Country regimes define development rules and economics ? State/federal regulators approve development and competitive market rules All capex and rate structures must be approved by local/federal regulators
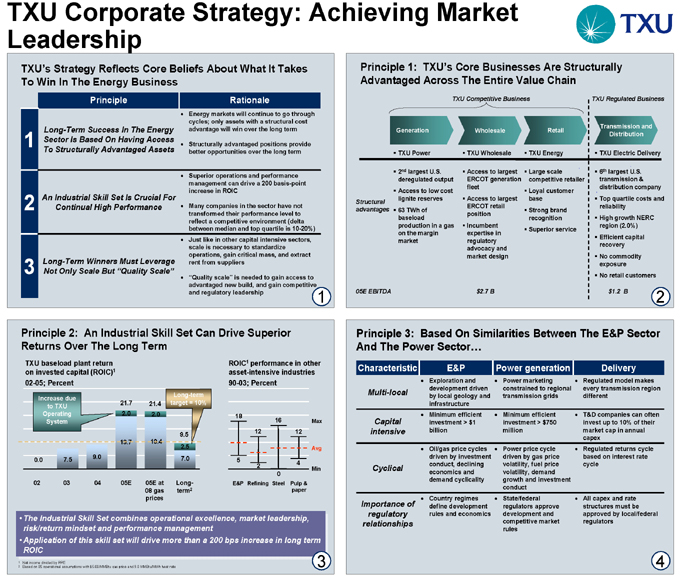
TXU Corporate Strategy: Achieving Market Leadership
TXU’s Strategy Reflects Core Beliefs About What It Takes To Win In The Energy Business
1 Long-Term Success In The Energy Sector Is Based On Having Access To Structurally Advantaged Assets Energy markets will continue to go through cycles; only assets with a structural cost advantage will win over the long term Structurally advantaged positions provide better opportunities over the long term
An Industrial Skill Set Is Crucial For Continual High Performance Superior operations and performance management can drive a 200 basis-point increase in ROIC
2 Many companies in the sector have not transformed their performance level to reflect a competitive environment (delta between median and top quartile is 10-20%) Just like in other capital intensive sectors, scale is necessary to standardize operations, gain critical mass, and extract rent from suppliers
3 Long-Term Winners Must Leverage Not Only Scale But “Quality Scale” “Quality scale” is needed to gain access to advantaged new build, and gain competitive and regulatory leadership
Principle 1: TXU’s Core Businesses Are Structurally Advantaged Across The Entire Value Chain
TXU Competitive Business
TXU Regulated Business
Generation | | Wholesale Retail Transmission and Distribution |
TXU | | Power TXU Wholesale TXU Energy TXU Electric Delivery |
2nd largest U.S. deregulated output Access to largest ERCOT generation fleet Large scale competitive retailer 6th largest U.S. transmission & distribution company
Access | | to low cost lignite reserves Access to largest Loyal customer base Top quartile costs and reliability |
Structural | | advantages 63 TWh of baseload production in a gas on the margin market ERCOT retail position |
Incumbent | | expertise in regulatory advocacy and market design Strong brand recognition |
Superior | | service High growth NERC region (2.0%) |
Efficient capital recovery
No commodity exposure
No retail customers
05E EBITDA $2.7 B $1.2 B
Principle 2: An Industrial Skill Set Can Drive Superior Returns Over The Long Term
TXU baseload plant return on invested capital (ROIC)1 02-05; Percent
Increase due to TXU
Operating System
0.0 7.5 9.0 21.7 2.0 19.7 21.4 2.0 19.4 9.5 2.5 7.0
Long-term target = 10%
02 03 04 05E
05E at 08 gas prices
Long-term2
ROIC1 performance in other asset-intensive industries 90-03; Percent
18 5 12 2 16 0 12 4
Max Avg Min
E&P Refining Steel
Pulp & paper
The Industrial Skill Set combines operational excellence, market market leadership, risk/return mindset and performance management Application of this skill set will drive more than a 200 bps increase in long term ROIC
1 | | Net income divided by PPE |
2 | | Based on 05 operational assumptions with $5.00/MMBtu gas price and 9.0 MMBtu/MWh heat rate |
Principle 3: Based On Similarities Between The E&P Sector And The Power Sector…
Characteristic Multi-local E&P Exploration and development driven by local geology and infrastructure Power generation Power marketing constrained to regional transmission grids Delivery Regulated model makes every transmission region different
Capital intensive Minimum efficient investment > $ 1 billion Minimum efficient investment > $ 750 million T&D companies can often invest up to 10% of their market cap in annual capex
Cyclical Oil/gas price cycles driven by investment conduct, declining economics and demand cyclicality Power price cycle driven by gas price volatility, fuel price volatility, demand growth and investment conduct Regulated returns cycle based on interest rate cycle
Importance of regulatory relationships Country regimes define development rules and economics State/federal regulators approve development and competitive market rules All capex and rate structures must be approved by local/federal regulators
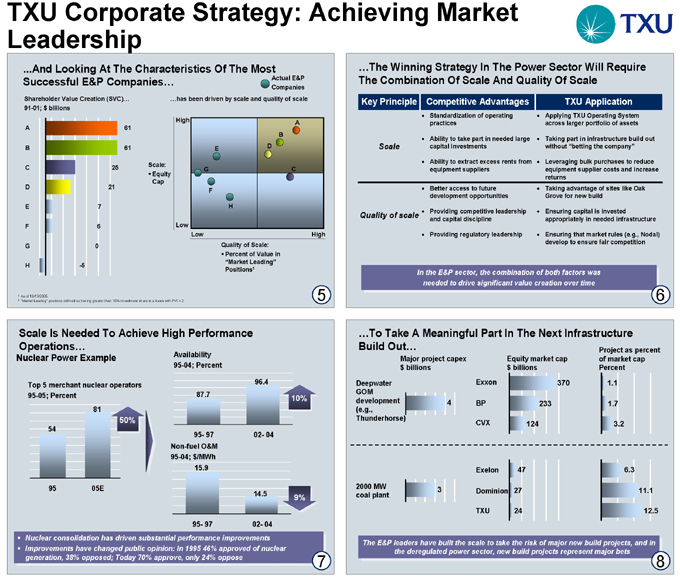
TXU Corporate Strategy: Achieving Market Leadership
…And Looking At The Characteristics Of The Most Successful E&P Companies…
Shareholder Value Creation (SVC)… 91-01; $ billions
A B C D E F G H
61 6125 21 7 6 0 -5
…has been driven by scale and quality of scale
Actual E&P Companies
Scale: Equity Cap
High Low Low High
E G F H D B A C
Quality of Scale: Percent of Value in “Market Leading” Positions1
2 | | “Market Leading” positions defined as having greater than 15% investment share in a basin with PVI > 2. |
…The Winning Strategy In The Power Sector Will Require The Combination Of Scale And Quality Of Scale
Key | | Principle Competitive Advantages TXU Application |
Standardization | | of operating practices Applying TXU Operating System across larger portfolio of assets |
Scale Ability to take part in needed large capital investments Taking part in infrastructure build out without “betting the company”
Ability to extract excess rents from equipment suppliers Leveraging bulk purchases to reduce equipment supplier costs and increase returns
Better | | access to future development opportunities Taking advantage of sites like Oak Grove for new build |
Quality of scale Providing competitive leadership and capital discipline Ensuring capital is invested appropriately in needed infrastructure
Providing | | regulatory leadership Ensuring that market rules (e.g., Nodal) develop to ensure fair competition |
In the E&P sector, the combination of both factors was needed to drive significant value creation over time
Scale Is Needed To Achieve High Performance Operations…
Nuclear Power Example
Top 5 merchant nuclear operators 95-05; Percent
54 81 50% 95 05E
Availability 95-04; Percent
87.7 96.4 10% 95- 97 02- 04
Non-fuel O&M 95-04; $/MWh
15.9 14.5 9% 95- 97 02- 04
Nuclear consolidation has driven substantial performance improvements Improvements have changed public opinion: In 1995 46% approved of nuclear generation, 38% opposed; Today 70% approve, only 24% oppose
…To Take A Meaningful Part In The Next Infrastructure Build Out…
Major project capex $ billions
Deepwater GOM development (e.g., Thunderhorse)
Exxon BP CVX
Equity market cap $ billions
124 233 370
Project as percent of market cap Percent
1.1 1.7 3.2
2000 MW coal plant
Exelon
Dominion
TXU
47 27 24 6.3 11.1 12.5
The E&P leaders have built the scale to take the risk of major new build projects, and in the deregulated power sector, new build projects represent major bets
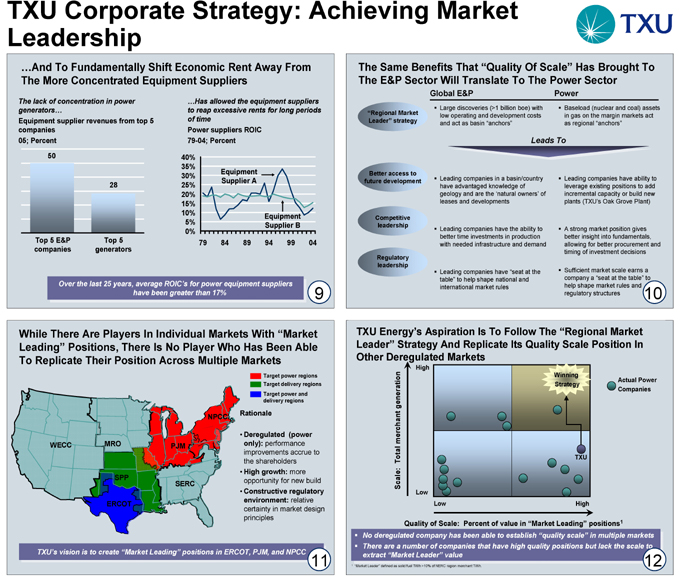
TXU Corporate Strategy: Achieving Market Leadership
…And To Fundamentally Shift Economic Rent Away From The More Concentrated Equipment Suppliers
The lack of concentration in power generators…
Equipment supplier revenues from top 5 companies 05; Percent
50 28
Top 5 E&P companies
Top 5 generators
…Has allowed the equipment suppliers to reap excessive rents for long periods of time
Power suppliers ROIC 79-04; Percent
40% 35% 30% 25% 20% 15% 10% 5% 0%
Equipment Supplier A
Equipment Supplier B
79 84 89 94 99 04
Over the last 25 years, average ROIC’s for power equipment suppliers have been greater than 17%
9
The Same Benefits That “Quality Of Scale” Has Brought To The E&P Sector Will Translate To The Power Sector
“Regional Market Leader” strategy ?Large discoveries (>1 billion boe) with low operating and development costs and act as basin “anchors” ?Baseload (nuclear and coal) assets in gas on the margin markets act as regional “anchors”
Leads To
Better access to future development ?Leading companies in a basin/country ?Leading companies have ability to have advantaged knowledge of leverage existing positions to add geology and are the ‘natural owners’ of incremental capacity or build new leases and developments plants (TXU’s Oak Grove Plant)
Competitive leadership
?Leading companies have the ability to ?A strong market position gives better time investments in production better insight into fundamentals, with needed infrastructure and demand allowing for better procurement and timing of investment decisions
Regulatory leadership
Leading companies have “seat at the table” to help shape national and international market rules
Sufficient market scale earns a company a “seat at the table” to help shape market rules and regulatory structures
10
While There Are Players In Individual Markets With “Market Leading” Positions, There Is No Player Who Has Been Able To Replicate Their Position Across Multiple Markets
Target power regions Target delivery regions Target power and delivery regions
WECC MRO SPP ERCOT PJM NPCC SERC
Rationale
Deregulated (power only): performance improvements accrue to the shareholders
High growth: more opportunity for new build
Constructive regulatory environment: relative certainty in market design principles
TXU’s vision is to create “Market Leading” positions in ERCOT, PJM, and NPCC
11
TXU Energy’s Aspiration Is To Follow The “Regional Market Leader” Strategy And Replicate Its Quality Scale Position In Other Deregulated Markets
Scale: Total merchant generation
High Low Low High
Winning Strategy
TXU
Actual Power Companies
Quality of Scale: Percent of value in “Market Leading” positions1
No deregulated company has been able to establish “quality scale” in multiple markets There are a number of companies that have high quality positions but lack the scale to extract “Market Leader” value
1 | | “Market Leader” defined as solid fuel TWh >10% of NERC region merchant TWh. |
12
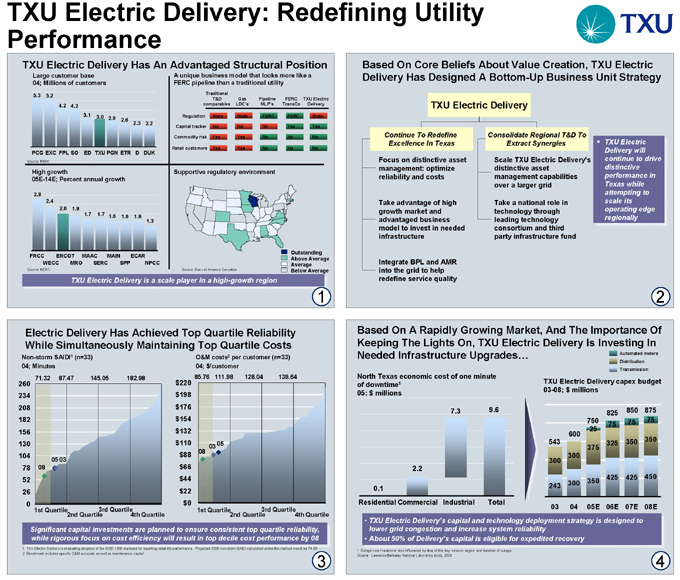
TXU Electric Delivery: Redefining Utility Performance
TXU Electric Delivery Has An Advantaged Structural Position
Large customer base 04; Millions of customers
5.3 5.2 4.2 4.2 3.1 3.0 2.9 2.6 2.3 2.2
PCG EXC FPL SO ED TXU PGN ETR D DUK
Source: FERC
A unique business model that looks more like a FERC pipeline than a traditional utility
Traditional | | T&D comparables Gas LDC’s Pipeline MLP’s FERC TransCo TXU Electric Delivery |
Regulation | | State State FERC FERC State |
Capital | | tracker No No No Yes Yes |
Commodity | | risk Yes Yes No No No |
Retail | | customers Yes Yes No No No |
High growth
05E-14E; Percent annual growth
2.8 2.4 2.0 1.9 1.7 1.7 1.6 1.6 1.6 1.3
FRCC ERCOT MAAC MAIN ECAR
WECC MRO SERC SPP NPCC
Source: NERC
Supportive regulatory environment
Outstanding Above Average Average Below Average
Source: Banc of America Securities
TXU Electric Delivery is a scale player in a high-growth region
Based On Core Beliefs About Value Creation, TXU Electric Delivery Has Designed A Bottom-Up Business Unit Strategy
TXU Electric Delivery
Continue To Redefine Excellence In Texas
Focus on distinctive asset management: optimize reliability and costs
Take advantage of high growth market and advantaged business model to invest in needed infrastructure
Integrate BPL and AMR into the grid to help redefine service quality
Consolidate Regional T&D To Extract Synergies
Scale TXU Electric Delivery’s distinctive asset management capabilities over a larger grid
Take a national role in technology through leading technology consortium and third party infrastructure fund
TXU Electric Delivery will continue to drive distinctive performance in Texas while attempting to scale its operating edgeoperating edge regionally 2
Electric Delivery Has Achieved Top Quartile Reliability While Simultaneously Maintaining Top Quartile Costs
Non-storm SAIDI1 (n=33) 04; Minutes
71.32 87.47 145.05 182.98
260 234 208 182 156 130 104 78 52 26 0
1st Quartile 2nd Quartile 3rd Quartile 4th Quartile
08
05 03
O&M costs2 per customer (n=33) 04; $/customer
85.76 111.98 128.04 139.64 $220 $198 $176 $154 $132 $110 $88 $66 $44 $22 $0
08 03 05
1st Quartile 2nd Quartile 3rd Quartile 4th Quartile
Significant capital investments are planned to ensure consistent top quartile reliability, while rigorous focus on cost efficiency will result in top decile cost performance by 08
1 TXU Electric Delivery is evaluating adoption of the IEEE 1366 standard for reporting reliability performance. Projected 2008 non-storm SAIDI calculated under this method would be 74.59.
2 | | Benchmark includes specific O&M accounts as well as maintenance capital. |
Based On A Rapidly Growing Market, And The Importance Of Keeping The Lights On, TXU Electric Delivery Is Investing In
Needed Infrastructure Upgrades…
Automated meters Distribution Transmission
North Texas economic cost of one minute of downtime1 05: $ millions
0.1 2.2 7.3 9.6
Residential Commercial Industrial Total
TXU Electric Delivery capex budget 03-08; $ millions
543 300 243 600 300 300 750 25 375 350 825 75 325 425 850 75 350 425 875 75 350 450
03 04 05E 06E 07E 08E
TXU Electric Delivery’s capital and technology deployment strategy is designed to lower grid congestion and increase system reliability lower grid congestion and increase system reliability About 50% of Delivery’s capital is eligible for expedited recovery
1 | | Outage cost / customer also influenced by time of the day, season, region and duration of outage. |
Source: Lawrence Berkeley National Laboratory study, 2004
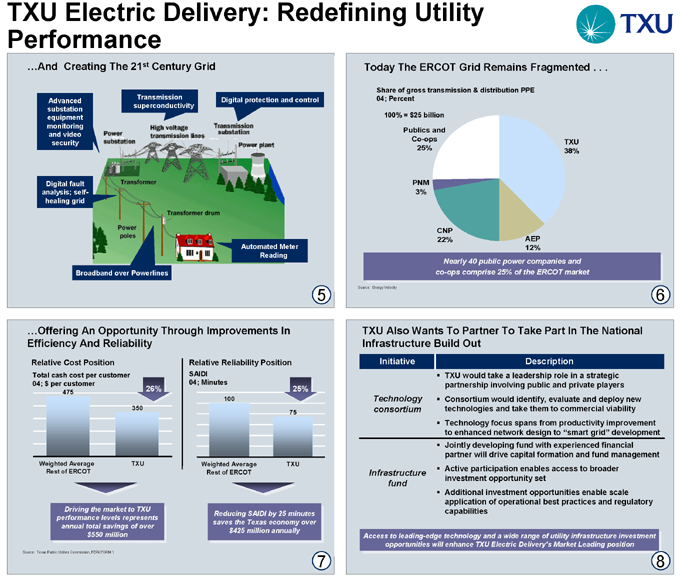
TXU Electric Delivery: Redefining Utility Performance
…And Creating The 21st Century Grid
Advanced substation equipment monitoring and video security
Transmission superconductivity
Digital protection and control
Digital fault analysis; self-healing grid
Broadband over Powerlines
Automated Meter Reading
Today The ERCOT Grid Remains Fragmented . . .
Share of gross transmission & distribution PPE 04; Percent
100% = $25 billion
Publics and Co-ops 25%
PNM 3% CNP 22% AEP 12% TXU 38%
Nearly 40 public power companies and co-ops comprise 25% of the ERCOT market
Source: Energy Velocity
…Offering An Opportunity Through Improvements In Efficiency And Reliability
Relative Cost Position
Total cash cost per customer 04; $ per customer
475 350 26%
Relative Reliability Position
SAIDI 04; Minutes
100 75 25%
Weighted Average Rest of ERCOT
TXU
Weighted Average Rest of ERCOT
TXU
Driving the market to TXU performance levels represents annual total savings of over over $550 million
Reducing SAIDI by 25 minutes saves the Texas economy over $425 million annually
Source: Texas Public Utilities Commission, FERCFORM 1
TXU Also Wants To Partner To Take Part In The National Infrastructure Build Out
Initiative Description
TXU would take a leadership role in a strategic partnership involving public and private players Technology ?Consortium would identify, evaluate and deploy new consortium technologies and take them to commercial viability ?Technology focus spans from productivity improvement to enhanced network design to “smart grid” development ?Jointly developing fund with experienced financial partner will drive capital formation and fund management ?Active participation enables access to broader
Infrastructure investment opportunity set fund
Additional investment opportunities enable scale application of operational best practices and regulatory capabilities
Access to leading-edge technology and a wide range of utility infrastructure investment opportunities will enhance TXU Electric Delivery’s Market Leading position