UNITED STATES
SECURITIES AND EXCHANGE COMMISSION
Washington, D.C. 20549
FORM 10-K
| x | ANNUAL REPORT PURSUANT TO SECTION 13 OR 15(d) OF THE SECURITIES EXCHANGE ACT OF 1934 |
For the fiscal year ended December 31, 2010
— OR—
| ¨ | TRANSITION REPORT PURSUANT TO SECTION 13 OR 15(d) OF THE SECURITIES EXCHANGE ACT OF 1934 |
Commission File Number 1-12833
Energy Future Holdings Corp.
(Exact name of registrant as specified in its charter)
| | |
| Texas | | 75-2669310 |
(State or other jurisdiction of incorporation or organization) | | (I.R.S. Employer Identification No.) |
| |
| 1601 Bryan Street Dallas, TX 75201-3411 | | (214) 812-4600 |
| (Address of principal executive offices)(Zip Code) | | (Registrant’s telephone number, including area code) |
Securities registered pursuant to Section 12(b) of the Act:
| | |
Title of Each Class | | Name of Each Exchange in Which Registered |
| 9.75% Senior Secured Notes due 2019 | | New York Stock Exchange |
Securities registered pursuant to Section 12(g) of the Act: None
Indicate by check mark if the registrant is a well-known seasoned issuer, as defined in Rule 405 of the Securities Act. Yes ¨ No x
Indicate by check mark if the registrant is not required to file reports pursuant to Section 13 or Section 15(d) of the Act. Yes ¨ No x
Indicate by check mark whether the registrant (1) has filed all reports required to be filed by Section 13 or 15(d) of the Securities Exchange Act of 1934 during the preceding 12 months (or for such shorter period that the registrant was required to file such reports), and (2) has been subject to such filing requirements for the past 90 days. Yes x No ¨
Indicate by check mark whether the registrant has submitted electronically and posted on its corporate Web site, if any, every Interactive Data File required to be submitted and posted pursuant to Rule 405 of Regulation S-T (§232.405 of this chapter) during the preceding 12 months (or for such shorter period that the registrant was required to submit and post such files). Yes ¨ No ¨ (The registrant is not currently required to submit such files.)
Indicate by check mark if disclosure of delinquent filers pursuant to Item 405 of Regulation S-K (229.405 of this chapter) is not contained herein, and will not be contained, to the best of registrant’s knowledge, in definitive proxy or information statements incorporated by reference in Part III of this Form 10-K or any amendment to this Form 10-K. x
Indicate by check mark whether the registrant is a large accelerated filer, an accelerated filer, a non-accelerated filer, or a smaller reporting company. See definitions of “large accelerated filer”, “accelerated filer” and “smaller reporting company” in Rule 12b-2 of the Exchange Act.
| | | | | | |
| Large accelerated filer | | ¨ | | Accelerated filer | | ¨ |
| | | |
| Non-Accelerated filer | | x (Do not check if a smaller reporting company) | | Smaller reporting company | | ¨ |
Indicate by check mark if the registrant is a shell company (as defined in Rule 12b-2 of the Exchange Act). Yes ¨ No x
As of February 15, 2011, there were 1,671,912,118 shares of common stock, without par value, outstanding of Energy Future Holdings Corp. (substantially all of which were owned by Texas Energy Future Holdings Limited Partnership, Energy Future Holdings Corp.’s parent holding company, and none of which is publicly traded).
DOCUMENTS INCORPORATED BY REFERENCE
None
TABLE OF CONTENTS
i
Energy Future Holdings Corp.’s (EFH Corp.) annual reports on Form 10-K, quarterly reports on Form 10-Q, current reports on Form 8-K and any amendments to those reports are made available to the public, free of charge, on the EFH Corp. website at http://www.energyfutureholdings.com, as soon as reasonably practicable after they have been filed with or furnished to the Securities and Exchange Commission. The information on EFH Corp.’s website shall not be deemed a part of, or incorporated by reference into, this report on Form 10-K. Readers should not rely on or assume the accuracy of any representation or warranty in any agreement that EFH Corp. has filed as an exhibit to this Form 10-K because such representation or warranty may be subject to exceptions and qualifications contained in separate disclosure schedules, may represent the parties’ risk allocation in the particular transaction, may be qualified by materiality standards that differ from what may be viewed as material for securities law purposes or may no longer continue to be true as of any given date.
This Form 10-K and other Securities and Exchange Commission filings of EFH Corp. and its subsidiaries occasionally make references to EFH Corp. (or “we,” “our,” “us” or “the company”), EFCH, EFIH, TCEH, TXU Energy, Luminant, Oncor Holdings or Oncor when describing actions, rights or obligations of their respective subsidiaries. These references reflect the fact that the subsidiaries are consolidated with, or otherwise reflected in, their respective parent companies’ financial statements for financial reporting purposes. However, these references should not be interpreted to imply that the parent company is actually undertaking the action or has the rights or obligations of the relevant subsidiary company or vice versa.
ii
GLOSSARY
When the following terms and abbreviations appear in the text of this report, they have the meanings indicated below.
| | |
| 1999 Restructuring Legislation | | Texas Electric Choice Plan, the legislation that restructured the electric utility industry in Texas to provide for retail competition |
| |
| 2009 Form 10-K | | EFH Corp.’s Annual Report on Form 10-K for the year ended December 31, 2009 |
| |
| Adjusted EBITDA | | Adjusted EBITDA means EBITDA adjusted to exclude noncash items, unusual items and other adjustments allowable under certain of our debt arrangements. See the definition of EBITDA below. Adjusted EBITDA and EBITDA are not recognized terms under GAAP and, thus, are non-GAAP financial measures. We are providing Adjusted EBITDA in this Form 10-K (see reconciliations in Exhibit 99(b), 99(c) and 99(d)) solely because of the important role that Adjusted EBITDA plays in respect of certain covenants contained in our debt arrangements. We do not intend for Adjusted EBITDA (or EBITDA) to be an alternative to net income as a measure of operating performance or an alternative to cash flows from operating activities as a measure of liquidity or an alternative to any other measure of financial performance presented in accordance with US GAAP. Additionally, we do not intend for Adjusted EBITDA (or EBITDA) to be used as a measure of free cash flow available for management’s discretionary use, as the measure excludes certain cash requirements such as interest payments, tax payments and other debt service requirements. Because not all companies use identical calculations, our presentation of Adjusted EBITDA (and EBITDA) may not be comparable to similarly titled measures of other companies. |
| |
| ancillary services | | Refers to services necessary to support the transmission of energy and maintain reliable operations for the entire transmission system. |
| |
| baseload | | Refers to the minimum constant level of electricity demand in a system, such as ERCOT, and/or to the electricity generation facilities or capacity normally expected to operate continuously throughout the year to serve such demand, such as our nuclear and lignite/coal-fueled generation units. |
| |
| CAIR | | Clean Air Interstate Rule |
| |
| Capgemini | | Capgemini Energy LP, a provider of business support services to EFH Corp. and its subsidiaries |
| |
| CATR | | Clean Air Transport Rule |
| |
| CFTC | | Commodity Futures Trading Commission |
| |
| CO2 | | carbon dioxide |
| |
| Competitive Electric segment | | Refers to the EFH Corp. business segment that consists principally of TCEH. |
| |
| CREZ | | Competitive Renewable Energy Zone |
| |
| DOE | | US Department of Energy |
| |
| EBITDA | | Refers to earnings (net income) before interest expense, income taxes, depreciation and amortization. See the definition of Adjusted EBITDA above. |
| |
| EFCH | | Refers to Energy Future Competitive Holdings Company, a direct, wholly-owned subsidiary of EFH Corp. and the direct parent of TCEH, and/or its subsidiaries, depending on context. |
iii
| | |
| EFH Corp. | | Refers to Energy Future Holdings Corp., a holding company, and/or its subsidiaries, depending on context. Its major subsidiaries include TCEH and Oncor. |
| |
| EFH Corp. Senior Notes | | Refers collectively to EFH Corp.’s 10.875% Senior Notes due November 1, 2017 (EFH Corp. 10.875% Notes) and EFH Corp.’s 11.25%/12.00% Senior Toggle Notes due November 1, 2017 (EFH Corp. Toggle Notes). |
| |
| EFH Corp. Senior Secured Notes | | Refers collectively to EFH Corp.’s 9.75% Senior Secured Notes due October 15, 2019 (EFH Corp. 9.75% Notes) and EFH Corp.’s 10.000% Senior Secured Notes due January 15, 2020 (EFH Corp. 10% Notes). |
| |
| EFIH | | Refers to Energy Future Intermediate Holding Company LLC, a direct, wholly-owned subsidiary of EFH Corp. and the direct parent of Oncor Holdings. |
| |
| EFIH Finance | | Refers to EFIH Finance Inc., a direct, wholly-owned subsidiary of EFIH, formed for the sole purpose of serving as co-issuer with EFIH of certain debt securities. |
| |
| EFIH Notes | | Refers collectively to EFIH’s and EFIH Finance’s 9.75% Senior Secured Notes due October 15, 2019 (EFIH 9.75% Notes) and EFIH’s and EFIH Finance’s 10.000% Senior Secured Notes due December 1, 2020 (EFIH 10% Notes). |
| |
| EPA | | US Environmental Protection Agency |
| |
| EPC | | engineering, procurement and construction |
| |
| ERCOT | | Electric Reliability Council of Texas, the independent system operator and the regional coordinator of various electricity systems within Texas |
| |
| ERISA | | Employee Retirement Income Security Act of 1974, as amended |
| |
| FASB | | Financial Accounting Standards Board, the designated organization in the private sector for establishing standards for financial accounting and reporting |
| |
| FERC | | US Federal Energy Regulatory Commission |
| |
| GAAP | | generally accepted accounting principles |
| |
| GHG | | greenhouse gas |
| |
| GWh | | gigawatt-hours |
| |
| IRS | | US Internal Revenue Service |
| |
| kV | | kilovolts |
| |
| kWh | | kilowatt-hours |
| |
| Lehman | | Refers to certain subsidiaries of Lehman Brothers Holdings Inc., which filed for bankruptcy under Chapter 11 of the US Bankruptcy Code in 2008. |
| |
| LIBOR | | London Interbank Offered Rate. An interest rate at which banks can borrow funds, in marketable size, from other banks in the London interbank market. |
| |
| Luminant | | Refers to subsidiaries of TCEH engaged in competitive market activities consisting of electricity generation and wholesale energy sales and purchases as well as commodity risk management and trading activities, all largely in Texas. |
iv
| | |
| market heat rate | | Heat rate is a measure of the efficiency of converting a fuel source to electricity. Market heat rate is the implied relationship between wholesale electricity prices and natural gas prices and is calculated by dividing the wholesale market price of electricity, which is based on the price offer of the marginal supplier in ERCOT (generally natural gas plants), by the market price of natural gas. Forward wholesale electricity market price quotes in ERCOT are generally limited to two or three years; accordingly, forward market heat rates are generally limited to the same time period. Forecasted market heat rates for time periods for which market price quotes are not available are based on fundamental economic factors and forecasts, including electricity supply, demand growth, capital costs associated with new construction of generation supply, transmission development and other factors. |
| |
| Merger | | The transaction referred to in “Merger Agreement” (defined immediately below) that was completed on October 10, 2007 |
| |
| Merger Agreement | | Agreement and Plan of Merger, dated February 25, 2007, under which Texas Holdings agreed to acquire EFH Corp. |
| |
| Merger Sub | | Texas Energy Future Merger Sub Corp, a Texas corporation and a wholly-owned subsidiary of Texas Holdings that was merged into EFH Corp. on October 10, 2007 |
| |
| MMBtu | | million British thermal units |
| |
| Moody’s | | Moody’s Investors Services, Inc. (a credit rating agency) |
| |
| MW | | megawatts |
| |
| MWh | | megawatt-hours |
| |
| NERC | | North American Electric Reliability Corporation |
| |
| NOx | | nitrogen oxide |
| |
| NRC | | US Nuclear Regulatory Commission |
| |
| NYMEX | | Refers to the New York Mercantile Exchange, a physical commodity futures exchange. |
| |
| Oncor | | Refers to Oncor Electric Delivery Company LLC, a direct, majority-owned subsidiary of Oncor Holdings and an indirect subsidiary of EFH Corp., and/or its consolidated bankruptcy-remote financing subsidiary, Oncor Electric Delivery Transition Bond Company LLC, depending on context, that is engaged in regulated electricity transmission and distribution activities. |
| |
| Oncor Holdings | | Refers to Oncor Electric Delivery Holdings Company LLC, a direct, wholly-owned subsidiary of EFIH and the direct majority owner of Oncor, and/or its subsidiaries, depending on context. |
| |
| Oncor Ring-Fenced Entities | | Refers to Oncor Holdings and its direct and indirect subsidiaries, including Oncor. |
| |
| OPEB | | other postretirement employee benefits |
| |
| PUCT | | Public Utility Commission of Texas |
| |
| PURA | | Texas Public Utility Regulatory Act |
v
| | |
| purchase accounting | | The purchase method of accounting for a business combination as prescribed by US GAAP, whereby the cost or “purchase price” of a business combination, including the amount paid for the equity and direct transaction costs are allocated to identifiable assets and liabilities (including intangible assets) based upon their fair values. The excess of the purchase price over the fair values of assets and liabilities is recorded as goodwill. |
| |
| Regulated Delivery segment | | Refers to the EFH Corp. business segment that consists of the operations of Oncor. |
| |
| REP | | retail electric provider |
| |
| RRC | | Railroad Commission of Texas, which among other things, has oversight of lignite mining activity in Texas |
| |
| S&P | | Standard & Poor’s Ratings Services, a division of the McGraw-Hill Companies Inc. (a credit rating agency) |
| |
| SARs | | Stock Appreciation Rights |
| |
| SARs Plan | | Refers to the Oncor Electric Delivery Company Stock Appreciation Rights Plan |
| |
| SEC | | US Securities and Exchange Commission |
| |
| Securities Act | | Securities Act of 1933, as amended |
| |
| SG&A | | selling, general and administrative |
| |
| SO2 | | sulfur dioxide |
| |
| Sponsor Group | | Refers collectively to the investment funds affiliated with Kohlberg Kravis Roberts & Co. L.P., TPG Capital, L.P. and GS Capital Partners, an affiliate of Goldman, Sachs & Co. (See Texas Holdings below.) |
| |
| TCEH | | Refers to Texas Competitive Electric Holdings Company LLC, a direct, wholly-owned subsidiary of EFCH and an indirect subsidiary of EFH Corp., and/or its subsidiaries, depending on context, that are engaged in electricity generation and wholesale and retail energy markets activities. Its major subsidiaries include Luminant and TXU Energy. |
| |
| TCEH Finance | | Refers to TCEH Finance, Inc., a direct, wholly-owned subsidiary of TCEH, formed for the sole purpose of serving as co-issuer with TCEH of certain debt securities. |
| |
| TCEH Senior Notes | | Refers collectively to TCEH’s 10.25% Senior Notes due November 1, 2015 and 10.25% Senior Notes due November 1, 2015, Series B (collectively, TCEH 10.25% Notes) and TCEH’s 10.50%/11.25% Senior Toggle Notes due November 1, 2016 (TCEH Toggle Notes). |
| |
| TCEH Senior Secured Facilities | | Refers collectively to the TCEH Initial Term Loan Facility, TCEH Delayed Draw Term Loan Facility, TCEH Revolving Credit Facility, TCEH Letter of Credit Facility and TCEH Commodity Collateral Posting Facility. See Note 11 to Financial Statements for details of these facilities. |
| |
| TCEH Senior Secured Second Lien Notes | | Refers collectively to TCEH’s 15% Senior Secured Second Lien Notes due April 1, 2021 and TCEH’s 15% Senior Secured Second Lien Notes due April 1, 2021, Series B. |
| |
| TCEQ | | Texas Commission on Environmental Quality |
vi
| | |
| Texas Holdings | | Refers to Texas Energy Future Holdings Limited Partnership, a limited partnership controlled by the Sponsor Group that owns substantially all of the common stock of EFH Corp. |
| |
| Texas Holdings Group | | Refers to Texas Holdings and its direct and indirect subsidiaries other than the Oncor Ring-Fenced Entities. |
| |
| Texas Transmission | | Refers to Texas Transmission Investment LLC, a limited liability company that owns a 19.75% equity interest in Oncor. Texas Transmission is not affiliated with EFH Corp., any of its subsidiaries or any member of the Sponsor Group. |
| |
| TRE | | Refers to Texas Reliability Entity, Inc., an independent organization that develops reliability standards for the ERCOT region and monitors and enforces compliance with NERC standards and ERCOT protocols. |
| |
| TXU Energy | | Refers to TXU Energy Retail Company LLC, a direct, wholly-owned subsidiary of TCEH engaged in the retail sale of electricity to residential and business customers. TXU Energy is a REP in competitive areas of ERCOT. |
| |
| TXU Gas | | TXU Gas Company, a former subsidiary of EFH Corp. |
| |
| US | | United States of America |
| |
| VIE | | variable interest entity |
vii
PART I
Items 1. and 2. BUSINESS AND PROPERTIES
References in this report to “we,” “our,” “us” and “the company” are to EFH Corp. and/or its subsidiaries as apparent in the context. See “Glossary” for descriptions of major subsidiaries and other defined terms.
EFH Corp. Business and Strategy
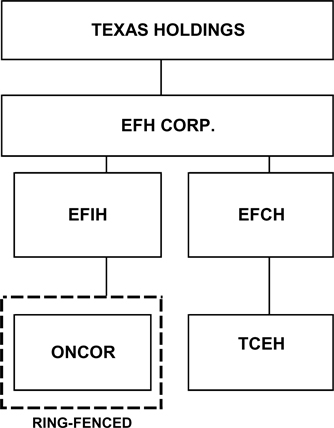
We are a Dallas, Texas-based energy company with a portfolio of competitive and regulated energy businesses in Texas. EFH Corp. is a holding company conducting its operations principally through its TCEH and Oncor subsidiaries. TCEH is wholly-owned, and EFH Corp. holds an approximately 80% equity interest in Oncor. Immediately below is an organization chart of the key subsidiaries discussed in this report.
TCEH is a holding company for subsidiaries engaged in competitive electricity market activities largely in Texas including electricity generation, wholesale energy sales and purchases, commodity risk management and trading activities, and retail electricity sales.
TCEH owns or leases 15,427 MW of generation capacity in Texas, which consists of lignite/coal, nuclear and natural gas-fueled generation facilities. This capacity includes two new lignite-fueled units that achieved substantial completion (as defined in the EPC agreements for the units) in the fourth quarter 2009 and a third new lignite-fueled unit that achieved substantial completion (as defined in the EPC agreement for the unit) in the second quarter 2010. In addition, TCEH is the largest purchaser of wind-generated electricity in Texas and the fifth largest in the US. TCEH provides competitive electricity and related services to approximately two million retail electricity customers in Texas.
1
Oncor is engaged in regulated electricity transmission and distribution operations in Texas that are primarily regulated by the PUCT. Oncor provides both distribution services to retail electric providers that sell electricity to consumers and transmission services to other electricity distribution companies, cooperatives and municipalities. Oncor operates the largest transmission and distribution system in Texas, delivering electricity to approximately three million homes and businesses and operating more than 118,000 miles of transmission and distribution lines. A significant portion of Oncor’s revenues represent fees for delivery services provided to TCEH. Distribution revenues from TCEH represented 36% and 38% of Oncor’s total revenues for the years ended December 31, 2010 and 2009, respectively.
EFH Corp. and Oncor have implemented certain structural and operational “ring-fencing” measures based on commitments made by Texas Holdings and Oncor to the PUCT that are intended to enhance the credit quality of Oncor. These measures serve to mitigate Oncor’s and Oncor Holdings’ credit exposure to the Texas Holdings Group and to reduce the risk that the assets and liabilities of Oncor or Oncor Holdings would be substantively consolidated with the assets and liabilities of the Texas Holdings Group in the event of a bankruptcy of one or more of those entities. See Note 1 to Financial Statements for a description of the material features of these “ring-fencing” measures.
As of December 31, 2010, we had approximately 9,200 full-time employees (including approximately 3,800 at Oncor), including approximately 2,750 employees under collective bargaining agreements (including approximately 650 at Oncor).
EFH Corp.’s Market
We operate primarily within the ERCOT market. This market represents approximately 85% of the electricity consumption in Texas. ERCOT is the regional reliability coordinating organization for member electricity systems in Texas and the system operator of the interconnected transmission grid for those systems. ERCOT’s membership consists of approximately 300 corporate and associate members, including electric cooperatives, municipal power agencies, independent generators, independent power marketers, investor-owned utilities, REPs and consumers.
The ERCOT market operates under reliability standards set by the NERC. The PUCT has primary jurisdiction over the ERCOT market to ensure adequacy and reliability of power supply across Texas’s main interconnected transmission grid. The ERCOT independent system operator is responsible for procuring energy on behalf of its members while maintaining reliable operations of the electricity supply system in the market. Its responsibilities include centralized dispatch of the power pool and ensuring that electricity production and delivery are accurately accounted for among the generation resources and wholesale buyers and sellers. The ERCOT independent system operator also serves as agent for procuring ancillary services for those members who elect not to provide their own ancillary services.
Significant changes in the operations of the wholesale electricity market resulted from the change from a zonal to a nodal market implemented by ERCOT in December 2010. The nodal market design reflects a substantial increase in settlement price points for participants and establishes a new “day-ahead market,” operated by ERCOT, in which participants can enter into forward sales and purchases of electricity. The nodal market also establishes hub trading prices, which represent the average of node prices within geographic regions, at which participants can hedge and trade power through bilateral transactions. See Item 7, “Management’s Discussion and Analysis of Financial Condition and Results of Operations – Significant Activities and Events – Wholesale Market Design – Nodal Market” for additional discussion of the ERCOT nodal market.
Oncor, along with other owners of transmission and distribution facilities in Texas, assists the ERCOT independent system operator in its operations. Oncor has planning, design, construction, operation and maintenance responsibility for the portion of the transmission grid and for the load-serving substations it owns, primarily within its certificated distribution service area. Oncor participates with the ERCOT independent system operator and other ERCOT utilities in obtaining regulatory approvals and planning, designing and constructing new transmission lines in order to remove existing constraints on the ERCOT transmission grid. The transmission lines are necessary to meet reliability needs, support renewable energy production and increase bulk power transfer capability.
2
The following data is derived from information published by ERCOT:
Installed generation capacity in the ERCOT market estimated for 2011 totals approximately 85,000 MW, including approximately 3,000 MW mothballed (idled) capacity, as well as more than 10,000 MW of wind, water and other resources that may not be available coincident with system need. In August 2010, ERCOT’s hourly demand peaked at a record 65,776 MW. Of ERCOT’s estimate of total available capacity for 2011, approximately 60% is natural gas-fueled generation, approximately 28% is lignite/coal and nuclear-fueled baseload generation and approximately 12% in wind and other renewable resources. In November 2010, ERCOT changed its minimum reserve margin planning criterion to 13.75% from 12.5%; the reserve margin is projected by ERCOT to be 15.94% in 2011, 15.78% in 2012, and 13.14% by 2013. Reserve margin is the difference between system generation capability and anticipated peak load.
The ERCOT market has limited interconnections to other markets in the US, which currently limits potential imports into and exports out of the ERCOT market to 1,106 MW of generation capacity (or approximately 2% of peak demand). In addition, wholesale transactions within the ERCOT market are generally not subject to regulation by the FERC.
Natural gas-fueled generation is the predominant electricity capacity resource in the ERCOT market and accounted for approximately 39% of the electricity produced in the ERCOT market in 2010. Because of the significant natural gas-fueled capacity and the ability of such facilities to more readily increase or decrease production when compared to baseload generation, marginal demand for electricity is usually met by natural gas-fueled facilities. As a result, wholesale electricity prices in ERCOT largely correlate with natural gas prices.
EFH Corp.’s Strategies
Each of our businesses focuses its operations on key safety, reliability, economic and environmental drivers for that business, as described below:
| | • | | TCEH focuses on optimizing and developing its generation fleet to safely provide reliable electricity supply in a cost-effective manner and in consideration of environmental impacts, hedging its electricity price risk and providing high quality service and innovative energy products to retail and wholesale customers. |
| | • | | Oncor focuses on delivering electricity in a safe and reliable manner, minimizing service interruptions and investing in its transmission and distribution infrastructure to maintain its system, serve its growing customer base with a modernized grid and support renewable energy production. |
Other elements of our strategies include:
| | • | | Increase value from existing business lines. Our strategy focuses on striving for top quartile or better performance across our operations in terms of safety, reliability, cost and customer service. In establishing tactical objectives, we incorporate the following core operating principles: |
| | • | | Safety: Placing the safety of communities, customers and employees first; |
| | • | | Environmental Stewardship: Continuing to make strategic and operational improvements that lead to cleaner air, land and water; |
| | • | | Customer Focus: Delivering products and superior service to help customers more effectively manage their use of electricity; |
| | • | | Community Focus: Being an integral part of the communities in which we live, work and serve; |
| | • | | Operational Excellence: Incorporating continuous improvement and financial discipline in all aspects of the business to achieve top-tier results that maximize the value of the company for stakeholders, including operating world-class facilities that produce and deliver safe and dependable electricity at affordable prices, and |
| | • | | Performance-Driven Culture: Fostering a strong values- and performance-based culture designed to attract, develop and retain best-in-class talent. |
3
| | • | | Pursue growth opportunities across business lines. Scale in our operating businesses allows us to take part in large capital investments, such as new generation projects and investments in the transmission and distribution system, with a smaller fraction of overall capital at risk and with an enhanced ability to streamline costs. We expect to also explore smaller-scale growth initiatives that are not expected to be material to our performance over the near term but can enhance our growth profile over time. Specific growth initiatives include: |
| | • | | Pursue generation development opportunities to help meet ERCOT’s growing electricity needs over the longer term from a diverse range of alternatives such as nuclear, renewable energy and advanced coal technologies. |
| | • | | Profitably increase the number of retail customers served throughout the competitive ERCOT market areas by delivering superior value through high quality customer service and innovative energy products, including leading energy efficiency initiatives and service offerings. |
| | • | | Invest in transmission and distribution technology upgrades, including advanced metering systems and energy efficiency initiatives, and construct new transmission and distribution facilities to meet the needs of the growing Texas market. These growth initiatives benefit from regulatory capital recovery mechanisms known as “capital trackers” that enable adequate and timely recovery of transmission and advanced metering investments through regulated rates. |
| | • | | Reduce the volatility of cash flows through an electricity price risk management strategy. We actively manage our exposure to wholesale electricity prices in ERCOT through contracts for physical delivery of electricity, exchange traded and “over-the-counter” financial contracts, ERCOT “day-ahead market” transactions and bilateral contracts with other wholesale market participants, including other generators and end-use customers. These hedging activities include shorter-term agreements, longer-term electricity sales contracts and forward sales of natural gas. |
The strong historical correlation between natural gas prices and wholesale electricity prices in the ERCOT market provides us an opportunity to manage our exposure to variability of wholesale electricity prices. We have established a long-term hedging program designed to reduce exposure to changes in future electricity prices due to changes in the price of natural gas. Under the program, TCEH has entered into market transactions involving natural gas-related financial instruments, and as of December 31, 2010, has effectively sold forward approximately 1.0 billion MMBtu of natural gas (equivalent to the natural gas exposure of approximately 125,000 GWh at an assumed 8.0 market heat rate) for the period January 1, 2011 through December 31, 2014 at weighted average annual hedge prices ranging from $7.19 per MMBtu to $7.80 per MMBtu.
These transactions, as well as forward power sales, have effectively hedged an estimated 62% of the natural gas price exposure related to TCEH’s expected generation output for the period beginning January 1, 2011 and ending December 31, 2014 (on an average basis for such period and assuming an 8.0 market heat rate). The hedges were entered into with the continuing expectation that wholesale electricity prices in ERCOT will largely correlate with natural gas prices, which are expected to be the marginal fuel for the purpose of setting electricity prices approximately 75% to 90% of the time. If this correlation changes, the cash flows targeted under the long-term hedging program may not be achieved. As of December 31, 2010, more than 95% of the long-term hedging program transactions were directly or indirectly secured by a first-lien interest in TCEH’s assets (including the transactions supported by the TCEH Commodity Collateral Posting Facility), thereby reducing the cash and letter of credit collateral requirements for the hedging program. For additional discussion of the long-term hedging program, see Item 7, “Management’s Discussion and Analysis of Financial Condition and Results of Operations,” specifically sections entitled “Significant Activities and Events – Natural Gas Prices and Long-Term Hedging Program,” “Key Risks and Challenges – Natural Gas Price and Market Heat-Rate Exposure” and “Financial Condition – Liquidity and Capital Resources – Liquidity Effects of Commodity Hedging and Trading Activities.”
4
| | • | | Strengthen balance sheet through a liability management program. In 2009, we initiated a liability management program focused on improving our balance sheet, and we expect to opportunistically look for ways to reduce the amount and extend the maturity of our outstanding debt. Activities under the liability management program do not include debt issued by Oncor or its subsidiaries. The program has resulted in the capture of $2.0 billion of debt discount and the extension of approximately $5.0 billion of maturities from 2014-2017 to 2019-2021. Activities to date have included debt exchanges, issuances and repurchases completed in 2010 and 2009 discussed below under Item 7, “Management’s Discussion and Analysis of Financial Condition and Results of Operations – Significant Activities and Events – Liability Management Program” and the August 2009 amendment to the Credit Agreement governing the TCEH Senior Secured Facilities that provided additional flexibility in restructuring debt obligations. See Note 11 to Financial Statements for additional discussion of these transactions. |
Future activities under the liability management program may include the purchase of our outstanding debt for cash in open market purchases or privately negotiated transactions (including pursuant to a Section 10b-5(1) plan) or via public or private exchange or tender offers. Moreover, as part of our liability management program, we may refinance our existing debt, including the TCEH Senior Secured Credit Facilities.
In evaluating whether to undertake any liability management transaction, including any refinancing, we will take into account liquidity requirements, prospects for future access to capital, contractual restrictions, the market price of our outstanding debt and other factors. Any liability management transaction, including any refinancing, may occur on a stand-alone basis or in connection with, or immediately following, other liability management transactions.
| | • | | Pursue new environmental initiatives. We are committed to continue to operate in compliance with all environmental laws, rules and regulations and to reduce our impact on the environment. EFH Corp.’s Sustainable Energy Advisory Board advises in the pursuit of technology development opportunities that reduce our impact on the environment while balancing the need to help address the energy requirements of Texas. The Sustainable Energy Advisory Board is comprised of individuals who represent the following interests, among others: the environment, labor unions, customers, economic development in Texas and technology/reliability standards. In addition, we are focused on and are pursuing opportunities to reduce emissions from our existing and new lignite/coal-fueled generation units. We have voluntarily committed to reduce emissions of mercury, NOx and SO2 at our existing units. We expect to make these reductions through a combination of investment in new emission control equipment, new coal cleaning technologies and optimizing fuel blends. In addition, we expect to invest $400 million over a five-year period that began in 2008 in programs designed to encourage customer electricity demand efficiencies, representing $200 million more than amounts planned to be invested by Oncor to meet regulatory requirements. As of December 31, 2010, we invested a cumulative total of $229 million in these programs. |
Seasonality
Our revenues and results of operations are subject to seasonality, weather conditions and other electricity usage drivers, with revenues being highest in the summer.
5
Operating Segments
We have aligned and report our business activities as two operating segments: the Competitive Electric segment (primarily represented by TCEH) and the Regulated Delivery segment (primarily represented by Oncor). See Note 23 to Financial Statements for additional financial information for the segments.
Competitive Electric Segment
Key management activities, including commodity price risk management and electricity sourcing for our retail and wholesale customers, are performed on an integrated basis. However, for purposes of operational accountability, performance management and market identity, the segment operations have been grouped into Luminant, which is engaged in electricity generation and wholesale markets activities, and TXU Energy, which is engaged in retail electricity sales activities. These activities are conducted through separate legal entities.
Luminant — Luminant’s existing electricity generation fleet consists of 14 plants in Texas with total installed nameplate generating capacity as shown in the table below:
| | | | | | | | | | | | |
Fuel Type | | Installed Nameplate
Capacity (MW) | | | Number of
Plants | | | Number of
Units (a) | |
Nuclear | | | 2,300 | | | | 1 | | | | 2 | |
Lignite/coal | | | 8,017 | | | | 5 | | | | 12 | |
Natural gas (b)(c) | | | 5,110 | | | | 8 | | | | 26 | |
| | | | | | | | | | | | |
Total | | | 15,427 | | | | 14 | | | | 40 | |
| | | | | | | | | | | | |
| | (a) | Leased units consist of six natural gas-fueled combustion turbine units totaling 390 MW of capacity. All other units are owned. |
| | (b) | Includes 1,655 MW representing four units mothballed and not currently available for dispatch. See “Natural Gas-Fueled Generation Operations” below. |
| | (c) | Includes 1,268 MW representing eight units currently operated for unaffiliated parties. |
The generation plants are located primarily on land owned in fee. Nuclear and lignite/coal-fueled (baseload) plants are generally scheduled to run at capacity except for periods of scheduled maintenance activities or, in the case of lignite/coal-fueled units, short-term production backdown in periods of low wholesale power prices (i.e., economic backdown). The natural gas-fueled generation units supplement the baseload generation capacity in meeting consumption in peak demand periods as production from a certain number of these units can more readily be ramped up or down as demand warrants.
Nuclear Generation Operations — Luminant operates two nuclear generation units at the Comanche Peak facility, each of which is designed for a capacity of 1,150 MW. Comanche Peak’s Unit 1 and Unit 2 went into commercial operation in 1990 and 1993, respectively, and are generally operated at full capacity to meet the load requirements in ERCOT. Refueling (nuclear fuel assembly replacement) outages for each unit are scheduled to occur every eighteen months during the spring or fall off-peak demand periods. Every three years, the refueling cycle results in the refueling of both units during the same year, which is planned for 2011 and last occurred in 2008. While one unit is undergoing a refueling outage, the remaining unit is intended to operate at full capacity. During a refueling outage, other maintenance, modification and testing activities are completed that cannot be accomplished when the unit is in operation. Over the last three years the refueling outage period per unit has ranged from 19 to 26 days. The Comanche Peak facility operated at a capacity factor of 95% in 2008, reflecting refueling of both units, and 100% in both 2009 and 2010.
Luminant has contracts in place for all of its uranium, nuclear fuel conversion services and nuclear fuel enrichment services for 2011. For the period of 2012 through 2018, Luminant has contracts in place for the acquisition of approximately 65% of its uranium requirements and 51% of its nuclear fuel conversion services requirements. In addition, Luminant has contracts in place for all of its nuclear fuel enrichment services through 2013, as well as all of its nuclear fuel fabrication services through 2018. Luminant does not anticipate any significant difficulties in acquiring uranium and contracting for associated conversion services and enrichment services in the foreseeable future.
6
Luminant believes its on-site used nuclear fuel storage capability is sufficient for a minimum of three years. The nuclear industry is continuing to review ways to enhance security of used-fuel storage with the NRC to fully utilize physical storage capacity. Future on-site used nuclear fuel storage capability will require the use of the industry technique of dry cask storage.
The Comanche Peak nuclear generation units have an estimated useful life of 60 years from the date of commercial operation. Therefore, assuming that Luminant receives 20-year license extensions, similar to what has been granted by the NRC to several other commercial generation reactors over the past several years, plant decommissioning activities would be scheduled to begin in 2050 for Comanche Peak Unit 1 and 2053 for Unit 2 and common facilities. Decommissioning costs will be paid from a decommissioning trust that, pursuant to state law, is funded from Oncor’s customers through an ongoing delivery surcharge. (See Note 18 to Financial Statements for discussion of the decommissioning trust fund.)
Nuclear insurance provisions are discussed in Note 12 to Financial Statements.
Nuclear Generation Development —In September 2008, a subsidiary of TCEH filed a combined operating license application with the NRC for two new nuclear generation units, each with approximately 1,700 MW (gross capacity), at its existing Comanche Peak nuclear generation site. In connection with the filing of the application, in January 2009, subsidiaries of TCEH and Mitsubishi Heavy Industries Ltd. (MHI) formed a joint venture, Comanche Peak Nuclear Power Company (CPNPC), to further the development of the two new nuclear generation units using MHI’s US–Advanced Pressurized Water Reactor technology. The TCEH subsidiary owns an 88% interest in CPNPC, and a MHI subsidiary owns a 12% interest.
In March 2009, the NRC announced an official review schedule for the license application. Based on the schedule, the NRC expects to complete its review by December 2011, and it is expected that a license would be issued approximately one year later. In November 2009, CPNPC filed a comprehensive revision to the license application that updated the license application for developments occurring after the initial filing.
In 2009, the DOE announced that it had selected four applicants to proceed to the due diligence phase of its Loan Guarantee Program and to commence negotiations towards potential loan guarantees for their respective generation projects. CPNPC was not among the initial four applicants selected by the DOE; however, CPNPC continues to update the DOE on its progress, with the goal of securing a DOE loan guarantee for financing the proposed units prior to commencement of construction.
Lignite/Coal-Fueled Generation Operations — Luminant’s lignite/coal-fueled generation fleet capacity totals 8,017 MW (including three recently constructed new units) and consists of the Big Brown (2 units), Monticello (3 units), Martin Lake (3 units), Oak Grove (2 units) and Sandow (2 units) plants. These plants are generally operated at full capacity to help meet the load requirements in ERCOT, and maintenance outages are scheduled during seasonal off-peak demand periods. Over the last three years, the total annual scheduled and unscheduled outages per unit (excluding the three new units) averaged 33 days. Luminant’s lignite/coal-fueled generation fleet operated at a capacity factor of 87.6% in 2008, 86.5% in 2009 and 82.2% in 2010, which represents top quartile performance of US coal-fueled generation facilities. The 2008 performance reflects extended unplanned outages at several units, and the 2010 and 2009 performance reflects increased economic backdown of the units, reflecting short-term periods when wholesale electricity market prices were less than production costs.
Luminant recently completed the construction of three lignite-fueled generation units with a total capacity of 2,180 MW. The three units consist of one unit at a leased site that is adjacent to an existing lignite-fueled generation unit (Sandow) and two units at an owned site (Oak Grove). The Sandow unit and the first Oak Grove unit achieved substantial completion (as defined in the EPC agreements for the respective units) in the fourth quarter 2009. The second Oak Grove unit achieved substantial completion (as defined in the EPC agreement for the unit) in the second quarter 2010. Accordingly, Luminant has operational control of these units.
7
Aggregate cash capital expenditures for these three units totaled approximately $3.25 billion including all construction, site preparation and mining development costs. The investment included approximately $500 million for state-of-the-art emissions controls for the three new units. Including capitalized interest and the step-up in construction work-in-process balances to fair value as a result of purchase accounting for the Merger in 2007, carrying value of the units totaled approximately $4.8 billion upon completion.
Luminant also has an environmental retrofit program under which it plans to install additional environmental control systems at its existing lignite/coal-fueled generation facilities. Capital expenditures associated with these additional environmental control systems could exceed $1.0 billion, of which $377 million was spent through 2010. Luminant has not yet completed all detailed cost and engineering studies for the additional environmental systems, and the cost estimates could change materially as it determines the details of and further evaluates the engineering and construction costs related to these investments.
Approximately 58% of the fuel used at Luminant’s lignite/coal-fueled generation plants in 2010 was supplied from lignite reserves owned in fee or leased surface-minable deposits dedicated to the Big Brown, Monticello, Martin Lake and Oak Grove plants, which were constructed adjacent to the reserves. Luminant owns in fee or has under lease an estimated 800 million tons of lignite reserves dedicated to its generation plants, including 246 million tons associated with an undivided interest in the lignite mine that provides fuel for the Sandow facility. Luminant also owns in fee or has under lease in excess of 85 million tons of reserves not currently dedicated to specific generation plants. In 2010, Luminant recovered approximately 27.5 million tons of lignite to fuel its generation plants. Luminant utilizes owned and/or leased equipment to remove the overburden and recover the lignite.
Luminant’s lignite mining operations include extensive reclamation activities that return the land to productive uses such as wildlife habitats, commercial timberland and pasture land. In 2010, Luminant reclaimed 1,729 acres of land. In addition, Luminant planted 1.2 million trees in 2010, the majority of which were part of the reclamation effort.
Luminant supplements its lignite fuel at Big Brown, Monticello and Martin Lake with western coal from the Powder River Basin in Wyoming. The coal is purchased from multiple suppliers under contracts of various lengths and is transported from the Powder River Basin to Luminant’s generation plants by railcar. Based on its current usage, Luminant believes that it has sufficient lignite reserves for the foreseeable future and has contracted more than 95% of its western coal resources and all of the related transportation through 2012.
Natural Gas-Fueled Generation Operations — Luminant’s fleet of 26 natural gas-fueled generation units totaling 5,110 MW of capacity includes 2,187 MW of currently available capacity, 1,268 MW of capacity being operated for unaffiliated third parties and 1,655 MW of capacity currently mothballed (idled). The natural gas-fueled units predominantly serve as peaking units that can be ramped up or down to balance electricity supply and demand.
Wholesale Operations — Luminant’s wholesale operations play a pivotal role in our competitive business portfolio by optimally dispatching the generation fleet, including the baseload facilities, sourcing all of TXU Energy’s electricity requirements and managing commodity price risk associated with electricity sales and generation fuel requirements.
Our electricity price exposure is managed across the complementary Luminant generation and TXU Energy retail businesses on a portfolio basis. Under this approach, Luminant’s wholesale operations manage the risks of imbalances between generation supply and sales load, as well as exposures to natural gas price movements and market heat rate changes (variations in the relationships between natural gas prices and wholesale electricity prices), through wholesale market activities that include physical purchases and sales and transacting in financial instruments.
Luminant’s wholesale operations provide TXU Energy and other retail and wholesale customers with electricity and related services to meet their demands and the operating requirements of ERCOT. In consideration of operational production and customer consumption levels that can be highly variable, as well as opportunities for long-term purchases and sales with large wholesale market participants, Luminant buys and sells electricity in short-term transactions and executes longer-term forward electricity purchase and sales agreements. Luminant is the largest purchaser of wind-generated electricity in Texas and the fifth largest in the US with more than 900 MW of existing wind power under contract.
Fuel price exposure, primarily relating to Powder River Basin coal, natural gas and fuel oil and the transportation of the fuel, is managed primarily through short- and long-term contracts for physical delivery of fuel as well as financial contracts.
8
In its hedging activities, Luminant enters into contracts for the physical delivery of electricity and fuel commodities, exchange traded and “over-the-counter” financial contracts and bilateral contracts with other wholesale electricity market participants, including generators and end-use customers. A major part of these hedging activities is a long-term hedging program, described above under “EFH Corp.’s Strategies”, designed to reduce exposure to changes in future electricity prices due to changes in the price of natural gas, principally utilizing natural gas-related financial instruments.
The wholesale operations also dispatch Luminant’s available generation capacity. These dispatching activities result in economic backdown of lignite/coal-fueled units and ramping up and down of natural gas-fueled units as market conditions warrant. Luminant’s dispatching activities are performed through a centrally managed real-time operational staff that synthesizes operational activities across the fleet and interfaces with various wholesale market channels. In addition, the wholesale operations manage the fuel procurement requirements for Luminant’s fossil fuel generation facilities.
Luminant’s wholesale operations include electricity and natural gas trading and third-party energy management activities. Natural gas transactions include direct purchases from natural gas producers, transportation agreements, storage leases and commercial retail sales. Luminant currently manages approximately 11 billion cubic feet of natural gas storage capacity.
Luminant’s wholesale operations manage exposure to wholesale commodity and credit-related risk within established transactional risk management policies, limits and controls. These policies, limits and controls have been structured so that they are practical in application and consistent with stated business objectives. Risk management processes include capturing transactions, performing and validating valuations and reporting exposures on a daily basis using risk management information systems designed to support a large transactional portfolio. A risk management forum meets regularly to ensure that business practices comply with approved transactional limits, commodities, instruments, exchanges and markets. Transactional risks are monitored to ensure limits comply with the established risk policy. Luminant has a disciplinary program to address any violations of the risk management policies and periodically reviews these policies to ensure they are responsive to changing market and business conditions.
TXU Energy — TXU Energy serves approximately two million residential and commercial retail electricity customers in Texas with approximately 62% of retail revenues in 2010 from residential customers. Texas is one of the fastest growing states in the nation with a diverse economy and, as a result, has attracted a number of competitors into the retail electricity market; consequently, competition is robust. TXU Energy, as an active participant in this competitive market, provides retail electric service to all areas of the ERCOT market now open to competition, including the Dallas/Fort Worth, Houston, Corpus Christi, and lower Rio Grande Valley areas of Texas. TXU Energy continues to market its services in Texas to add new customers and to retain its existing customers. There are approximately 120 active REPs certified to compete within the State of Texas. Based upon data published by the PUCT, as of September 30, 2010, approximately 53% of residential customers in competitive areas of ERCOT are served by REPs not affiliated with the pre-competition utility.
TXU Energy’s strategy focuses on providing its customers with high quality customer service and creating new products and services to meet customer needs; accordingly, a new customer management computer system was implemented in 2009, and other customer care enhancements are being implemented to further improve customer satisfaction. TXU Energy offers a wide range of residential products to meet various customer needs. TXU Energy is investing $100 million over the five-year period ending 2012, including a cumulative total of $39 million spent as of December 31, 2010, in energy efficiency initiatives as part of a program to offer customers a broad set of innovative energy products and services.
A subsidiary of EFH Corp. was recently certified by the Pennsylvania Public Utility Commission to sell retail electricity in Pennsylvania. While we have made no commitments to enter markets outside of Texas, we continuously monitor competitive retail markets for potential opportunities.
9
Regulation —Luminant is an exempt wholesale generator under the Energy Policy Act of 2005 and is subject to the jurisdiction of the NRC with respect to its nuclear generation plant. NRC regulations govern the granting of licenses for the construction and operation of nuclear-fueled generation facilities and subject such facilities to continuing review and regulation. Luminant also holds a power marketer license from the FERC and, with respect to any wholesale power sales outside the ERCOT market, is subject to market behavior and any other competition-related rules and regulations under the Federal Power Act that are administered by the FERC.
Luminant is also subject to the jurisdiction of the PUCT’s oversight of the competitive ERCOT wholesale electricity market. PUCT rules establish robust oversight, certain limits and a framework for wholesale power pricing and market behavior. Luminant is also subject to the requirements of the ERCOT Protocols, including Nodal Protocols and ERCOT reliability standards as adopted and enforced by the TRE and the NERC, including NERC critical infrastructure protection (CIP) standards.
TXU Energy is a licensed REP under the Texas Electric Choice Act and is subject to the jurisdiction of the PUCT with respect to provision of electricity service in ERCOT. PUCT rules govern the granting of licenses for REPs, including oversight but not setting of prices charged. TXU Energy is also subject to the requirements of the ERCOT Protocols, including Nodal Protocols and ERCOT reliability standards as adopted and enforced by the TRE and the NERC, including NERC CIP standards.
Regulated Delivery Segment
The Regulated Delivery segment consists of the operations of Oncor. Oncor is a regulated electricity transmission and distribution company that provides the service of delivering electricity safely, reliably and economically to end-use consumers through its distribution systems, as well as providing transmission grid connections to merchant generation facilities and interconnections to other transmission grids in Texas. Oncor’s service territory comprises 91 counties and over 400 incorporated municipalities, including Dallas/Fort Worth and surrounding suburbs, as well as Waco, Wichita Falls, Odessa, Midland, Tyler and Killeen. Oncor’s transmission and distribution assets are located principally in the north-central, eastern and western parts of Texas. Most of Oncor’s power lines have been constructed over lands of others pursuant to easements or along public highways, streets and rights-of-way as permitted by law. Oncor’s transmission and distribution rates are regulated by the PUCT.
Oncor is not a seller of electricity, nor does it purchase electricity for resale. It provides transmission services to other electricity distribution companies, cooperatives and municipalities. It provides distribution services to REPs, which sell electricity to retail customers. Oncor is also subject to the requirements of the ERCOT Protocols, including Nodal Protocols and ERCOT reliability standards as adopted and enforced by the TRE and the NERC.
Performance — Oncor achieved market-leading electricity delivery performance in 12 out of 14 key PUCT market metrics in 2010. These metrics measure the success of transmission and distribution companies in facilitating customer transactions in the competitive Texas electricity market.
Investing in Infrastructure and Technology —In 2010, Oncor invested $1.0 billion in its network to construct, rebuild and upgrade transmission lines and associated facilities, to extend the distribution infrastructure, and to pursue certain initiatives in infrastructure maintenance and information technology. Reflecting its commitment to infrastructure, in September 2008, Oncor and several other ERCOT utilities filed with the PUCT a plan to participate in the construction of transmission improvements designed to interconnect existing and future renewable energy facilities to transmit electricity from Competitive Renewable Energy Zones (CREZs) identified by the PUCT. In 2009, the PUCT awarded CREZ construction projects to Oncor, and Oncor currently estimates the costs of the projects to be approximately $1.75 billion. The projects involve the construction of transmission lines to support the transmission of electricity from renewable energy sources, principally wind generation facilities, in west Texas to population centers in the eastern part of the state. Through 2010, Oncor’s cumulative CREZ-related capital expenditures totaled $316 million, including $202 million invested in 2010. See Item 7, “Management’s Discussion and Analysis of Financial Condition and Results of Operations — Regulatory Matters – Oncor Matters with the PUCT.”
10
Oncor’s technology upgrade initiatives include development of a modernized grid through the replacement of existing meters with advanced digital metering equipment and development of advanced digital communication, data management, real-time monitoring and outage detection capabilities. This modernized grid is expected to produce electricity service reliability improvements and provide the potential for additional products and services from REPs that will enable businesses and consumers to better manage their electricity usage and costs. Oncor’s plans provide for the full deployment of over three million advanced meters to all residential and most non-residential retail electricity customers in Oncor’s service area. The advanced meters can be read remotely, rather than by a meter reader physically visiting the location of each meter. Advanced meters facilitate automated demand side management, which allows consumers to monitor the amount of electricity they are consuming and adjust their electricity consumption habits. As of December 31, 2010, Oncor has installed approximately 1,514,000 advanced digital meters, including 854,000 during the year ended December 31, 2010. As the new meters are integrated, Oncor reports 15-minute interval, billing-quality electricity consumption data to ERCOT for market settlement purposes. The data makes it possible for REPs to support new programs and pricing options. Cumulative capital expenditures for the deployment of the advanced meter system totaled $360 million as of December 31, 2010, including $164 million invested in 2010. Oncor expects to complete installations of the advanced meters by the end of 2012.
In addition to the potential energy efficiencies from advanced metering, Oncor expects to invest over $300 million ($100 million in excess of regulatory requirements) over the five-year period ending 2012 in programs designed to improve customer electricity demand efficiencies. As of December 31, 2010, Oncor has invested $190 million in these programs, including $65 million in 2010, and 47% of the amount in excess of regulatory requirements has been spent.
In a stipulation with several parties that was approved by the PUCT in 2007 (as discussed in Note 6 to Financial Statements), Oncor has committed to a variety of actions, including minimum capital spending of $3.6 billion over the five-year period ending December 31, 2012, subject to certain defined conditions. Approximately 72% of this total was spent as of December 31, 2010. This spending does not include the CREZ facilities.
Electricity Transmission —Oncor’s electricity transmission business is responsible for the safe and reliable operations of its transmission network and substations. These responsibilities consist of the construction and maintenance of transmission facilities and substations and the monitoring, controlling and dispatching of high-voltage electricity over Oncor’s transmission facilities in coordination with ERCOT.
Oncor is a member of ERCOT, and its transmission business actively assists the operations of ERCOT and market participants. Through its transmission business, Oncor participates with ERCOT and other member utilities to plan, design, construct and operate new transmission lines, with regulatory approval, necessary to maintain reliability, interconnect to merchant generation facilities, increase bulk power transfer capability and minimize limitations and constraints on the ERCOT transmission grid.
Transmission revenues are provided under tariffs approved by either the PUCT or, to a small degree related to an interconnection to other markets, the FERC. Network transmission revenues compensate Oncor for delivery of electricity over transmission facilities operating at 60 kV and above. Other services offered by Oncor through its transmission business include, but are not limited to: system impact studies, facilities studies, transformation service and maintenance of transformer equipment, substations and transmission lines owned by other parties.
PURA allows Oncor to update its transmission rates periodically to reflect changes in invested capital. This “capital tracker” provision encourages investment in the transmission system to help ensure reliability and efficiency by allowing for timely recovery of and return on new transmission investments.
As of December 31, 2010, Oncor’s transmission facilities included approximately 5,325 circuit miles of 345-kV transmission lines and approximately 9,979 circuit miles of 138-and 69-kV transmission lines. Sixty generation facilities totaling 34,357 MW are directly connected to Oncor’s transmission system, and 278 transmission stations and 705 distribution substations are served from Oncor’s transmission system.
11
As of December 31, 2010, Oncor’s transmission facilities have the following connections to other transmission grids in Texas:
| | | | | | | | | | | | |
| | | Number of Interconnected Lines | |
Grid Connections | | 345kV | | | 138kV | | | 69kV | |
Centerpoint Energy Inc. | | | 8 | | | | — | | | | — | |
American Electric Power Company, Inc (a) | | | 4 | | | | 7 | | | | 11 | |
Lower Colorado River Authority | | | 6 | | | | 21 | | | | 3 | |
Texas Municipal Power Agency | | | 8 | | | | 6 | | | | — | |
Texas New Mexico Power | | | 2 | | | | 9 | | | | 11 | |
Brazos Electric Power Cooperative, Inc. | | | 6 | | | | 109 | | | | 20 | |
Rayburn Country Electric Cooperative, Inc. | | | — | | | | 35 | | | | 7 | |
City of Georgetown | | | — | | | | 2 | | | | — | |
Tex-La Electric Cooperative of Texas, Inc. | | | — | | | | 12 | | | | 1 | |
Other small systems operating wholly within Texas | | | — | | | | 3 | | | | 3 | |
| | (a) | One of the 345-kV lines is an asynchronous high-voltage direct current connection with the Southwest Power Pool. |
Electricity Distribution— Oncor’s electricity distribution business is responsible for the overall safe and efficient operation of distribution facilities, including electricity delivery, power quality and system reliability. These responsibilities consist of the ownership, management, construction, maintenance and operation of the distribution system within Oncor’s certificated service area. Oncor’s distribution system receives electricity from the transmission system through substations and distributes electricity to end-users and wholesale customers through approximately 3,118 distribution feeders.
The Oncor distribution system includes over 3.1 million points of delivery. Over the past five years, the number of distribution system points of delivery served by Oncor, excluding lighting sites, grew an average of approximately 1.23% per year, adding approximately 29,378 points of delivery in 2010.
The Oncor distribution system consists of approximately 56,374 miles of overhead primary conductors, approximately 21,559 miles of overhead secondary and street light conductors, approximately 15,490 miles of underground primary conductors and approximately 9,640 miles of underground secondary and street light conductors. The majority of the distribution system operates at 25-kV and 12.5-kV.
Oncor’s distribution rates for residential and small commercial users are based on actual monthly consumption (kWh), and rates for large commercial and industrial users are based on the greater of actual monthly demand (kilowatt) or 80% of peak monthly demand during the prior eleven months.
Customers —Oncor’s transmission customers consist of municipalities, electric cooperatives and other distribution companies. Oncor’s distribution customers consist of more than 75 REPs in Oncor’s certificated service area, including TCEH. Distribution revenues from TCEH represented 36% of Oncor’s total revenues for 2010. Revenues from subsidiaries of Reliant Energy, Inc., each of which is a non-affiliated REP, represented 12% of Oncor’s total revenues for 2010. No other customer represented more than 10% of Oncor’s total operating revenues. The consumers of the electricity delivered by Oncor are free to choose their electricity supplier from REPs who compete for their business.
Regulation and Rates —As its operations are wholly within Texas, Oncor is not a public utility as defined in the Federal Power Act and, as a result, it is not subject to general regulation under this Act. However, Oncor is subject to reliability standards adopted and enforced by the TRE and the NERC, including NERC CIP standards, under the Federal Power Act.
The PUCT has original jurisdiction over transmission and distribution rates and services in unincorporated areas and in those municipalities that have ceded original jurisdiction to the PUCT and has exclusive appellate jurisdiction to review the rate and service orders and ordinances of municipalities. Generally, PURA prohibits the collection of any rates or charges by a public utility (as defined by PURA) that does not have the prior approval of the appropriate regulatory authority (PUCT or municipality with original jurisdiction). In accordance with a stipulation approved by the PUCT, Oncor filed a rate review with the PUCT in June 2008, based on a test year ended December 31, 2007. In August 2009, the PUCT issued a final order with respect to the rate review as discussed in Item 7, “Management’s Discussion and Analysis of Financial Condition and Results of Operations – Regulatory Matters.”
12
In January 2011, Oncor filed for a rate review with the PUCT and 203 cities (PUCT Docket No. 38929) based on a test year ended June 30, 2010. If approved as requested, this review would result in an aggregate annual rate increase of approximately $353 million over the test year period adjusted for the impact of weather. Oncor also requested a revised regulatory capital structure of 55% debt to 45% equity. The debt-to-equity ratio established by the PUCT is currently set at 60% debt to 40% equity. The PUCT, cities and other participating parties, with input from Oncor, established a procedural schedule for the review in January 2011. A hearing on the merits of Oncor’s request is scheduled to commence in May 2011, and resolution of the proposed increase is expected to occur during the second half of 2011.
At the state level, PURA requires owners or operators of transmission facilities to provide open-access wholesale transmission services to third parties at rates and terms that are nondiscriminatory and comparable to the rates and terms of the utility’s own use of its system. The PUCT has adopted rules implementing the state open-access requirements for utilities, including Oncor, that are subject to the PUCT’s jurisdiction over transmission services.
Securitization Bonds—The Regulated Delivery segment includes Oncor’s wholly-owned, bankruptcy-remote financing subsidiary, Oncor Electric Delivery Transition Bond Company LLC. This financing subsidiary was organized for the limited purpose of issuing certain securitization (transition) bonds in 2003 and 2004. Oncor Electric Delivery Transition Bond Company LLC issued $1.3 billion principal amount of transition bonds to recover generation-related regulatory asset stranded costs and other qualified costs under an order issued by the PUCT in 2002. At December 31, 2010, $663 million principal amount of transition bonds were outstanding, which mature in the period from 2011 to 2016.
13
Environmental Regulations and Related Considerations
Global Climate Change
Background — A growing concern has emerged nationally and internationally about global climate change and how greenhouse gas (GHG) emissions, such as CO2, might contribute to global climate change. We produce GHG emissions from the direct combustion of fossil fuels at our generation plants, primarily our lignite/coal-fueled generation units. CO2, methane and nitrous oxide are emitted in this combustion process, with CO2 representing the largest portion of these GHG emissions. GHG emissions (primarily CO2) from our combustion of fossil fuels represent the substantial majority of our total GHG emissions. For 2010, we estimate that our generation facilities produced 64 million short tons of CO2 based on continuously monitored data reported to and subject to approval by the EPA. Other aspects of our operations result in emissions of GHGs including, among other things, coal piles at our generation plants, sulfur hexafluoride in our electric operations, refrigerant from our chilling and cooling equipment, fossil fuel combustion in our motor vehicles and electricity usage at our facilities and headquarters. Because a substantial portion of our generation portfolio consists of lignite/coal-fueled generation facilities, our financial condition and/or results of operations could be materially adversely affected by the enactment of statutes or regulations that mandate a reduction in GHG emissions or that impose financial penalties, costs or taxes on those that produce GHG emissions. See Item 1A, “Risk Factors” for additional discussion of risks posed to us regarding global climate change regulation.
Global Climate Change Legislation — Several bills have been introduced in the US Congress or advocated by the Obama Administration that are intended to address climate change using different approaches, including most prominently a cap on carbon emissions with emitters allowed to trade unused emission allowances (cap-and-trade). In addition to potential federal legislation to regulate GHG emissions, the US Congress might also consider other legislation that could result in the reduction of GHG emissions, such as the establishment of renewable or clean energy portfolio standards.
Through our own evaluation and working in tandem with other companies and industry trade associations, we have supported the development of an integrated package of recommendations for the federal government to address the global climate change issue through federal legislation, including GHG emissions reduction targets for total US GHG emissions and rigorous cost containment measures to ensure that program costs are not prohibitive. In the event GHG legislation involving a cap-and-trade program is enacted, we believe that such a program should be mandatory, economy-wide, consistent with expected technology development timelines and designed in a way to limit potential harm to the economy and protect consumers. We believe that any mechanism for allocation of GHG emission allowances should include substantial allocation of allowances to offset the cost of GHG regulation, including the cost to electricity consumers. In addition, we participate in a voluntary electric utility industry sector climate change initiative in partnership with the DOE. Our strategies are generally consistent with the “EEI Global Climate Change Points of Agreement” published by the Edison Electric Institute in January 2009 and “The Carbon Principles” announced in February 2008 by three major financial institutions. Finally, we have created a Sustainable Energy Advisory Board that advises us on technology development opportunities that reduce the effects of our operations on the environment while balancing the need to address the energy requirements of Texas. Our Sustainable Energy Advisory Board is comprised of individuals who represent the following interests, among others: the environment, customers, economic development in Texas and technology/reliability standards. If, despite these efforts, a substantial number of our customers or others refuse to do business with us because of our GHG emissions, it could have a material adverse effect on our results of operations, financial position and liquidity.
Federal Level —Recent developments in the US Congress indicate that the prospects for passage of any cap-and-trade legislation in the near-term are not likely. However, if such legislation were to be adopted, our costs of compliance could be material.
14
In December 2009, the EPA issued a finding that GHG emissions endanger human health and the environment and that emissions from motor vehicles contribute to that endangerment. The EPA’s finding required it to begin regulating GHG emissions from motor vehicles and ultimately stationary sources under existing provisions of the federal Clean Air Act. Following its endangerment finding, the EPA took three regulatory actions with respect to the control of GHG emissions. First, in March 2010, the EPA completed a reconsideration of a memorandum issued in December 2008 by then EPA Administrator Stephen Johnson on the issue of when the Clean Air Act’s Prevention of Significant Deterioration (PSD) program would apply to newly identified pollutants such as GHG’s. The EPA determined that the Clean Air Act’s PSD permit requirements would apply when a nation-wide rule requiring the control of a pollutant takes effect. Under this determination, PSD permitting requirements became applicable to GHG emissions from planned stationary sources or planned modifications to stationary sources that had not been issued a PSD permit by January 2, 2011 – the first date that new motor vehicles must meet the new GHG standards. Second, in April 2010, the EPA adopted GHG emission standards for certain new motor vehicles. Third, in June 2010, the EPA finalized its so-called “tailoring rule” that established new thresholds of GHG emissions for the applicability of permits under the Clean Air Act for stationary sources, including our power generation facilities. The EPA’s tailoring rule defines the threshold of GHG emissions for determining applicability of the Clean Air Act’s PSD and Title V permitting programs at levels greater than the emission thresholds contained in the Clean Air Act. In December 2010, the EPA announced agreements with state and environmental groups to propose New Source Performance Standards for electric power plants by July 2011 and to finalize those standards by May 2012. In addition, in September 2009, the EPA issued a final rule requiring the reporting, by March 2011, of calendar year 2010 GHG emissions from specified large GHG emissions sources in the US (such reporting rule would apply to our lignite/coal-fueled generation facilities). If limitations on emissions of GHGs from existing sources are enacted, our costs of compliance could be material.
In December 2010, in response to the State of Texas’s indication that it would not take regulatory action to implement the EPA’s tailoring rule, the EPA adopted a rule to take over the issuance of permits for GHG emissions from the Texas Commission on Environmental Quality (TCEQ). The State of Texas is challenging that rule and the GHG permitting rules through litigation and has refused to implement the GHG permitting rules issued by the EPA. A number of members of the US Congress from both parties have introduced legislation to either block or delay EPA regulation of GHGs under the Clean Air Act, and legislative activity in this area over the next year is possible.
In September 2009, the US Court of Appeals for the Second Circuit issued a decision in the case ofState of Connecticut v. American Electric Power Company Inc. holding that various states, a municipality and certain private trusts have standing to sue and have sufficiently alleged a cause of action under the federal common law of nuisance for injuries allegedly caused by the defendant power generation companies’ emissions of GHGs. The decision does not address the merits of the nuisance claim. The US Supreme Court has agreed to review the Second Circuit’s decision.
In October 2009, the US Court of Appeals for the Fifth Circuit issued a decision in the case ofComer v. Murphy Oil USAreversing the district court’s dismissal of the case and holding that certain Mississippi residents did have standing to pursue state law nuisance, negligence and trespass claims for injuries purportedly suffered because the defendants’ emissions of GHGs allegedly increased the destructive force of Hurricane Katrina. The Fifth Circuit subsequently agreed to rehear the case, but then dismissed the appeal in its entirety when several judges recused themselves in the case. The Fifth Circuit’s order dismissing the appeal and vacating the earlier panel’s decision had the effect of reinstating the district court’s original dismissal of the case. In January 2011, the US Supreme Court rejected the plaintiffs’ request that their appeal be reinstated in the Fifth Circuit.
In September 2009, the US District Court for the Northern District of California issued a decision in the case ofNative Village of Kivalina v. ExxonMobil Corporation dismissing claims asserted by an Eskimo village that emissions of GHGs from approximately 24 oil and energy companies are causing global warming, which has damaged the arctic sea ice that protects the village from winter storms and erosion. The court dismissed the claims because they raised political (not judicial) questions and because plaintiffs lacked standing to sue. An appeal of the district court’s decision is currently pending in the US Court of Appeals for the Ninth Circuit.
While we are not a party to these suits, they could encourage or form the basis for a lawsuit asserting similar nuisance claims regarding emissions of GHGs. If any similar suit is successfully asserted against us in the future, it could have a material adverse effect on our business, results of operations and financial condition.
15
State and Regional Level —There are currently no Texas state regulations in effect concerning GHGs, and there are no regional initiatives concerning GHGs in which the State of Texas is a participant. We oppose state-by-state regulation of GHGs. In October 2009, Public Citizen Inc. filed a lawsuit against the TCEQ and its commissioners seeking to compel the TCEQ to regulate GHG emissions under the Texas Clean Air Act. The Attorney General of Texas has filed special exceptions to the Public Citizen pleading. We are not a party to this litigation.
International Level —The US currently is not a party to the Kyoto Protocol, which is a protocol to the United Nations Framework Convention on Climate Change (UNFCCC). The United Nations’ Kyoto Protocol process generally requires developed countries to cap GHG emissions at certain levels during the 2008 to 2012 time period. At the conclusion of the December 2007 United Nations Climate Change Conference, the Bali Action Plan was adopted, which identifies a work group, process and timeline for the consideration of possible post-2012 international actions to further address climate change. In December 2009, leaders of developed and developing countries met in Copenhagen under the UNFCCC and issued the Copenhagen Accord. The Copenhagen Accord provides a mechanism for countries to make economy-wide GHG emission mitigation commitments for reducing emissions of GHGs by 2020 and provides for developed countries to fund GHG emission mitigation projects in developing countries. President Obama participated in the development of, and endorsed, the Copenhagen Accord. In January 2010, the US informed the United Nations that it would reduce GHG emissions by 17% from 2005 levels by 2020, contingent on Congress passing climate change legislation.
We continue to assess the risks posed by possible future legislative or regulatory changes pertaining to GHG emissions. Because some of the proposals described above are in their formative stages, we are unable to predict the potential effects on our business, financial condition and/or results of operations; however, any such effects could be material. The effect will depend, in large part, on the specific requirements of the legislation or regulation and how much, if any, of the costs are included in wholesale electricity prices.
EFH Corp.’s Voluntary Energy Efficiency, Renewable Energy, and Global Climate Change Efforts — We are considering, or expect to be actively engaged in, business activities that could result in reduced GHG emissions including:
| | • | | Investing in Energy Efficiency or Related Initiatives by Our Competitive Businesses — Our competitive businesses expect to invest $100 million in BrightenSMenergy saving solutions (energy efficiency) or related initiatives over a five-year period that began in 2008, including software- and hardware-based services deployed behind the meter. These programs leverage advanced meter interval data and in-home devices to provide usage and other information and insights to customers, as well as to control energy-consuming equipment. Examples of these initiatives include: the TXU Energy Electricity Usage Report, an electronic report which shows residential usage by week; the BrightenSM Personal Energy Advisor, an online energy audit tool with personalized tips and projects for saving electricity; the BrightenSM Online Energy Store that provides customers the opportunity to purchase hard-to-find, cost-effective energy-saving products; the BrightenSM Power Monitor, an in-home display device that enables residential customers to monitor whole-house energy usage and cost in real-time and projects month-end bill amounts; the BrightenSM iThermostat, a web-enabled programmable thermostat with a load control feature for cycling air conditioners during times of peak energy demand; time-based electricity rates that work in conjunction with advanced metering infrastructure; rate plans that include electricity from renewable resources; the BrightenSM Energy Efficiency Assistance Program that delivers products and services, as well as grants through social service agencies, to save energy at participating low income customer homes and apartment complexes; a program to refer customers to energy efficiency contractors, and the provision of rebates to business customers for purchasing new energy efficient equipment for their facilities through the Energy Efficiency Rebate Program; |
| | • | | Investing in Energy Efficiency Initiatives by Oncor — In addition to the potential energy efficiencies from advanced metering, Oncor expects to invest over $300 million in energy efficiency initiatives over a five-year period that began in 2008 through such efforts as traveling across the State of Texas educating consumers about electricity, including the benefits of energy efficiency, advanced meters and renewable energy, and investment of over $18 million in the installation of solar photovoltaic systems in customer homes and facilities that is expected to result in savings of up to 12.7 million kWh of electricity; |
| | • | | Participating in the CREZ Program — Oncor has been selected by the PUCT to construct CREZ transmission facilities (currently estimated by Oncor to cost $1.75 billion) that are designed to connect existing and future renewable energy facilities to the electricity transmission system in ERCOT; |
16
| | • | | Purchasing Electricity from Renewable Sources — We expect to remain a leader in the ERCOT market in providing electricity from renewable sources by purchasing up to 1,500 MW of wind power. Our total wind power portfolio is currently more than 900 MW; |
| | • | | Promoting the Use of Solar Power— TXU Energy provides qualified customers, through its SolarLease program, the ability to finance the addition of solar panels to their homes. TXU Energy also purchases surplus renewable distributed generation from qualified customers. In addition, TXU Energy’s Solar Academy works with Texas school districts to teach and demonstrate the benefits of solar power; |
| | • | | Investing in Technology — We continue to evaluate the development and commercialization of cleaner power facility technologies; technologies that support sequestration and/or reduction of CO2; incremental renewable sources of electricity, including wind and solar power; energy storage, including advanced battery and compressed air storage, as well as related technologies that seek to lower emissions intensity. Additionally, we continue to explore and participate in opportunities to accelerate the adoption of electric cars and plug-in hybrid electric vehicles that have the potential to reduce overall GHG emissions and are furthering the advance of such vehicles by supporting, and helping develop infrastructure for, networks of charging stations for electric vehicles; |
| | • | | Evaluating the Development of a New Nuclear Generation Facility — We have filed an application with the NRC for combined construction and operating licenses for up to 3,400 MW of new nuclear generation capacity (the lowest GHG emission source of baseload generation currently available) at our Comanche Peak nuclear generation facility. In addition, we have (i) filed a loan guarantee application with the DOE for financing of the proposed units and (ii) formed a joint venture with Mitsubishi Heavy Industries Ltd. (MHI) to further develop the units using MHI’s US-Advanced Pressurized Water Reactor technology, and |
| | • | | Offsetting GHG Emissions by Planting Trees —We are engaged in a number of tree planting programs that offset GHG emissions, resulting in the planting of over 1.3 million trees in 2010. The majority of these trees were planted as part of our mining reclamation efforts but also include TXU Energy’s Urban Tree Farm program, which has planted more than 165,000 trees since its inception in 2002. |
Other Recent EPA Actions—The EPA has recently completed several regulatory actions establishing new requirements for control of certain emissions from sources that include lignite/coal-fueled generation facilities. It is also currently considering several other regulatory actions, as well as contemplating future additional regulatory actions, (the more material of which are discussed further below) in each case that may affect our lignite/coal-fueled generation facilities.
Each of our lignite/coal-fueled generation facilities is currently equipped with substantial emissions control equipment, including equipment installed as part of our commitment (in connection with the construction of the three recently completed lignite-fueled generation units) to reduce emissions of NOx, SO2 and mercury through the installation of emissions control equipment at both new and existing units and fuel blending at some existing units. All of our lignite/coal-fueled generation facilities are equipped with activated carbon injection systems to reduce mercury emissions. Flue gas desulfurization systems designed primarily to reduce SO2 emissions are installed at Oak Grove Units 1 and 2, Sandow Units 4 and 5, Martin Lake Units 1, 2, and 3, and Monticello Unit 3. Selective catalytic reduction systems designed to reduce NOx emissions are installed at Oak Grove Units 1 and 2 and Sandow Unit 4. Selective non-catalytic reduction systems designed to reduce NOx emissions are installed at Sandow Unit 5, Monticello Units 1, 2, and 3, and Big Brown Units 1 and 2. Fabric filter systems designed primarily to reduce particulate matter emissions are installed at Oak Grove Units 1 and 2, Sandow Unit 5, Monticello Units 1 and 2, and Big Brown Units 1 and 2. Electrostatic precipitator systems designed primarily to reduce particulate matter emissions are installed at Sandow Unit 4, Martin Lake Units 1, 2, and 3, Monticello Units 1, 2, and 3, and Big Brown Units 1 and 2. Sandow Unit 5 uses a fluidized bed combustion process that facilitates control of NOx and SO2. Flue gas desulfurization systems, fabric filter systems, and electrostatic precipitator systems also assist in reducing mercury and other emissions.
There is no assurance that the currently-installed emissions control equipment at our lignite/coal-fueled generation facilities will satisfy the requirements under any future EPA or TCEQ regulations. Some of the potential EPA or TCEQ regulatory actions could require us to install significant additional control equipment, resulting in material costs of compliance for our generation units, including capital expenditures and higher operating costs. These costs could result in material adverse effects on our financial condition, liquidity and results of operations.
17
Sulfur Dioxide, Nitrogen Oxide and Mercury Air Emissions
The EPA has promulgated Acid Rain Program rules that require fossil-fueled plants to have sufficient SO2 emission allowances and meet certain NOxemission standards. Our generation plants meet these SO2 allowance requirements and NOx emission rates.
In 2005, the EPA issued a final rule to further reduce SO2 and NOx emissions from power plants. The SO2 and NOx reductions required under the Clean Air Interstate Rule (CAIR), which were required to be phased in between 2009 and 2015, were based on a cap and trade approach (market-based) in which a cap was put on the total quantity of emissions allowed in 28 eastern states (including Texas). Emitters were required to have allowances for each ton emitted, and emitters were allowed to trade emissions under the cap. In July 2008, the US Court of Appeals for the D.C. Circuit (D.C. Circuit Court) vacated CAIR. In December 2008, in response to an EPA petition, the D.C. Circuit Court reversed, in part, its previous ruling. Such reversal confirmed CAIR is not valid, but allowed it to remain in place while the EPA revises CAIR to correct the previously identified shortcomings. In July 2010, the EPA released a proposed rule called the Clean Air Transport Rule (CATR). The CATR, as proposed, would replace CAIR in 2012 and would require no additional emission reductions for Luminant. However, we cannot predict the impact of a final rule on our business, results of operations and financial condition. See Note 4 to Financial Statements for discussion of the impairment of emission allowances intangible assets in 2008.
SO2 reductions required under the proposed regional haze/visibility rule (or so-called BART rule) only apply to units built between 1962 and 1977. The reductions are required on a unit-by-unit basis. In February 2009, the TCEQ submitted a State Implementation Plan (SIP) concerning regional haze to the EPA, which we believe will not have a material impact on our generation facilities. The EPA has not made a decision on this SIP submittal.
The Clean Air Act requires each state to monitor air quality for compliance with federal health standards. The EPA is required to periodically review, and if appropriate, revise all national ambient quality standards. The standards for ozone are not being achieved in several areas of Texas. The TCEQ adopted SIP rules in May 2007 to deal with eight-hour ozone standards, which required NOx emission reductions from certain of our peaking natural gas-fueled units in the Dallas-Fort Worth area. In March 2008, the EPA made the eight-hour ozone standards more stringent. In January 2010, the EPA proposed to further reduce the eight-hour ozone standard and to adopt a secondary standard for the protection of sensitive vegetation from ozone-related damage. Since the EPA projects that SIP rules to address attainment of these new more stringent standards will not be required until December 2013, we cannot yet predict the impact of this action on our generation facilities. In January 2010, the EPA added a new one-hour NOx National Ambient Air Quality standard that may require actions within Texas to reduce emissions. The TCEQ will be required to revise its monitoring network and submit an implementation plan with compliance required no earlier than January 2021. In June 2010, the EPA adopted a new one-hour SO2 national ambient air quality standard that may require action within Texas to reduce SO2 emissions. The TCEQ will be required to conduct modeling and develop an implementation plan by 2014, pursuant to which compliance will be required by 2017, according to the EPA’s implementation timeline. We cannot predict the impact of the new standards on our business, results of operations or financial condition until the TCEQ adopts (if required) an implementation plan with respect to the standards.
In 2005, the EPA also published a final rule requiring reductions of mercury emissions from lignite/coal-fueled generation plants. The Clean Air Mercury Rule (CAMR) was based on a nationwide cap and trade approach. The mercury reductions were required to be phased in between 2010 and 2018. In March 2008, the D.C. Circuit Court vacated CAMR. In February 2009, the US Supreme Court refused to hear the appeal of the D.C. Circuit Court’s ruling. The EPA agreed in a consent decree submitted for court approval to propose Maximum Achievable Control Technology rules by March 2011 and finalize those rules by November 2011. We cannot predict the substance of any final EPA regulations on such hazardous air pollutants. However, the EPA has informally indicated that recently proposed regulations regarding hazardous air pollutants from industrial boilers may serve as a template for the forthcoming electricity generation unit regulations. The industrial boiler regulations, if applied to electricity generation units, would likely require material capital expenditures for additions of control equipment at our lignite/coal-fueled generation facilities.
18
In September 2010, the EPA disapproved a portion of the SIP pursuant to which the TCEQ implements its program to achieve the EPA’s National Ambient Air Quality Standards (NAAQS) under the Clean Air Act. The EPA disapproved the Texas standard permit for pollution control projects. We hold several permits issued pursuant to the TCEQ standard permit conditions for pollution control projects. We have challenged the EPA’s disapproval by filing a lawsuit in the US Court of Appeals for the Fifth Circuit arguing that the TCEQ’s adoption of the standard permit conditions for pollution control projects was consistent with the Clean Air Act. We have also formally asked the EPA to stay, reconsider or clarify its disapproval. If the EPA declines to stay or reconsider its disapproval, we asked the EPA to clarify whether it intends that entities, including us, who obtained such permits for pollution control projects should stop operating the pollution control equipment permitted under the standard permit conditions. We cannot predict the outcome of the litigation or the EPA’s response to our request.
In November 2010, the EPA disapproved a different portion of the SIP under which the TCEQ had been phasing out a long-standing exemption for certain emissions that unavoidably occur during startup, shutdown and maintenance activities and replacing that exemption with a more limited affirmative defense that will itself be phased out and replaced by TCEQ-issued generation facility-specific permit conditions. We, like many other electricity generation facility operators in Texas, have asserted applicability of the exemption or affirmative defense, and the TCEQ has not objected to that assertion. We have also applied for the generation facility-specific permit conditions. The TCEQ is currently reviewing these applications. We have challenged the EPA’s disapproval by filing a lawsuit in the US Court of Appeals for the Fifth Circuit arguing that the TCEQ’s adoption of the affirmative defense and phase-out of that affirmative defense as permits are issued is consistent with the Clean Air Act. We cannot predict the outcome of this litigation.
In January 2011, the EPA retroactively disapproved a portion of the SIP pursuant to which the TCEQ issued permits for certain formerly non-permitted “grandfathered” facilities approximately 10 years ago. We hold such permits. The EPA took this action despite acknowledging that emissions covered by these standard permits do not threaten attainment or maintenance of the NAAQS under the Clean Air Act. We intend to challenge the EPA’s disapproval by filing a lawsuit in the US Court of Appeals for the Fifth Circuit arguing that the TCEQ’s adoption of the standard permit was consistent with the Clean Air Act. If the EPA’s action stands, and if it causes us to undertake additional permitting activity and install additional emissions control equipment at our affected generation facilities, we could incur material capital expenditures.
We believe that we hold all required emissions permits for facilities in operation. If the TCEQ adopts implementation plans that require us to install additional emissions controls, or if the EPA adopts more stringent requirements through any of the number of potential rulemaking activities in which it is or may be engaged, we could incur material capital expenditures, higher operating costs and potential production curtailments, resulting in material adverse effects on our financial condition, liquidity and results of operations.
Water
The TCEQ and the EPA have jurisdiction over water discharges (including storm water) from facilities in Texas. We believe our facilities are presently in material compliance with applicable state and federal requirements relating to discharge of pollutants into water. We believe we hold all required waste water discharge permits from the TCEQ for facilities in operation and have applied for or obtained necessary permits for facilities under construction. We also believe we can satisfy the requirements necessary to obtain any required permits or renewals.
We recently obtained a renewed and amended permit for discharge of waste water from our Oak Grove generation facility. Opponents to that permit renewal have initiated a challenge in Travis County, Texas District Court. We and the State of Texas are defending the issuance of the permit. We cannot predict the outcome of the litigation. If the permit is ultimately rejected by the courts, and we are required to undertake additional permitting activity and install additional temperature-control equipment, we could incur material capital expenditures, which could result in material adverse effects on our results of operations, liquidity and financial condition. (See Note 12 to Financial Statements.)
Recent changes to federal rules pertaining to the Spill Prevention, Control and Countermeasure (SPCC) plans for oil-filled electrical equipment and bulk storage facilities for oil will require updating of certain of our facilities. We have developed and implemented SPCC plans as required for those substations, work centers and distribution systems, and we believe we are currently in compliance with the new rules that become effective in November 2011.
19
Diversion, impoundment and withdrawal of water for cooling and other purposes are subject to the jurisdiction of the TCEQ and the EPA. We believe we possess all necessary permits for these activities from the TCEQ for our present operations. Clean Water Act Section 316(b) regulations pertaining to existing water intake structures at large generation facilities were published by the EPA in 2004. As prescribed in the regulations, we began implementing a monitoring program to determine the future actions that might need to be taken to comply with these regulations. In January 2007, a federal court ruled against the EPA in a lawsuit brought by environmental groups challenging aspects of these regulations, and in July 2007, the EPA announced that it was suspending the regulations pending further rulemaking. The US Supreme Court issued a decision in April 2009 reversing the federal court’s decision, in part, and finding that the EPA permissibly used cost-benefit analysis in the Section 316(b) regulations. In the absence of regulations, the EPA has instructed the states implementing the Section 316(b) program to use best professional judgment in reviewing applications and issuing permits under Section 316(b). The EPA has entered into a settlement agreement that requires it to propose new rules by March 2011 and to finalize those rules by July 2012. We cannot predict the impact on our operations of the suspended regulations or of new regulations that replace them.
Radioactive Waste
We currently ship low-level waste material to a disposal facility outside of Texas. Under the federal Low-Level Radioactive Waste Policy Act of 1980, as amended, the State of Texas is required to provide, either on its own or jointly with other states in a compact, for the disposal of all low-level radioactive waste generated within the state. The State of Texas has agreed to a compact for a disposal facility that would be located in Texas. That compact was ratified by Congress and signed by the President in 1998. In 2003, the State of Texas enacted legislation allowing a private entity to be licensed to accept low-level radioactive waste for disposal, and in 2004 the State received a license application from such an entity for review. In January 2009, the TCEQ approved this permit. We expect to continue to ship low-level waste material off-site for as long as an alternative disposal site is available. Should existing off-site disposal become unavailable, the low-level waste material will be stored on-site. (See discussion under “Luminant – Nuclear Generation Operations” above.) A rate case is currently before the TCEQ to determine the rates to be charged by the owner of waste disposal facilities to customers (potentially including TCEH) for disposal of low-level radioactive waste in Texas.
We believe our on-site used nuclear fuel storage capability is sufficient for a minimum of three years. The nuclear industry is continuing to review ways to enhance security of used-fuel storage with the NRC to fully utilize physical storage capacity. Future on-site used nuclear fuel storage capability will require the use of the industry technique of dry cask storage.
Solid Waste, Including Fly Ash Associated with Lignite/Coal-Fueled Generation
Treatment, storage and disposal of solid waste and hazardous waste are regulated at the state level under the Texas Solid Waste Disposal Act and at the federal level under the Resource Conservation and Recovery Act of 1976, as amended, and the Toxic Substances Control Act. The EPA has issued regulations under the Resource Conservation and Recovery Act of 1976 and the Toxic Substances Control Act, and the TCEQ has issued regulations under the Texas Solid Waste Disposal Act applicable to our facilities. We believe we are in material compliance with all applicable solid waste rules and regulations. In addition, we have registered solid waste disposal sites and have obtained or applied for permits required by such regulations.
In December 2008, an ash impoundment facility at a Tennessee Valley Authority (TVA) site ruptured releasing a significant quantity of coal ash slurry. No impoundment failures of this magnitude have ever occurred at any of our impoundments, which are significantly smaller than the TVA’s and are inspected on a regular basis. We routinely sample groundwater monitoring wells to ensure compliance with all applicable regulations. As a result of the TVA ash impoundment failure, in May 2010, the EPA released a proposed rule that considers regulating coal combustion residuals as either a hazardous waste or a non-hazardous waste. We are unable to predict the requirements of a final rule; however, the potential cost of compliance could be material.
20
The EPA issued a notice in December 2009 that it had identified several industries, including the electric power industry, which should be subject to financial responsibility requirements under the Comprehensive Environmental Response, Compensation and Liability Act consistent with the risk associated with their production, transportation, treatment, storage or disposal of hazardous substances. The EPA indicated in its notice that it would develop regulations that define the scope of those financial responsibility requirements. We do not know, at this time, the scope of these requirements, nor are we able to estimate the potential cost (which could be material) of complying with any such new requirements.
Environmental Capital Expenditures
Capital expenditures for our environmental projects totaled $106 million in 2010 and are expected to total approximately $75 million in 2011, consisting primarily of environmental projects at existing lignite/coal-fueled generation plants. The 2010 amount is exclusive of emissions control equipment investment as part of the three-unit generation development program, which totaled approximately $500 million over the construction period. See discussion above under “Luminant – Lignite/Coal-Fueled Generation Operations” regarding planned investments in emissions control systems.
21
Some important factors, in addition to others specifically addressed in Item 7, “Management’s Discussion and Analysis of Financial Condition and Results of Operations,” that could have a material negative impact on our operations, financial results and financial condition, or could cause our actual results or outcomes to differ materially from any projected outcome contained in any forward-looking statement in this report, include:
Risks Related to Substantial Indebtedness and Debt Agreements
Our substantial leverage could adversely affect our ability to raise additional capital to fund our operations, limit our ability to react to changes in the economy or our industry, expose us to interest rate risk to the extent of our variable rate debt and prevent us from meeting obligations under the various debt agreements governing our debt.
We are highly leveraged. As of December 31, 2010, our consolidated principal amount of debt (short-term borrowings and long-term debt, including amounts due currently) totaled $36.7 billion (see Note 11 to Financial Statements), which does not include $5.446 billion principal amount of debt of Oncor. Our substantial leverage could have important consequences, including:
| | • | | making it more difficult for us to make payments on our debt; |
| | • | | requiring a substantial portion of cash flow to be dedicated to the payment of principal and interest on our debt, thereby reducing our ability to use our cash flow to fund operations, capital expenditures and future business opportunities and execute our strategy; |
| | • | | increasing our vulnerability to adverse economic, industry or competitive developments; |
| | • | | exposing us to the risk of increased interest rates because, as of December 31, 2010, taking into consideration interest swap transactions, 13% of our long-term borrowings were at variable rates of interest; |
| | • | | limiting our ability to make strategic acquisitions or causing us to make non-strategic divestitures; |
| | • | | limiting our ability to obtain additional financing for working capital, capital expenditures, product development, debt service requirements, acquisitions and general corporate or other purposes, or to refinance existing debt, and |
| | • | | limiting our ability to adjust to changing market conditions and placing us at a competitive disadvantage compared to competitors who are less highly leveraged and who therefore, may be able to take advantage of opportunities that we cannot due to our substantial leverage. |
We may not be able to repay or refinance the TCEH Revolving Credit Facility, which matures in October 2013, other debt incurred under the TCEH Senior Secured Facilities, which matures in October 2014, or our other debt as or before it becomes due, particularly if forward natural gas prices do not significantly increase.
We may not be able to repay or refinance our debt obligations as or before they become due, or may be able to refinance such amounts only on terms that will increase our cost of borrowing or on terms that may be more onerous. Our ability to successfully implement any future refinancing of our debt will depend, among other things, on our financial condition and operating performance, which is subject to prevailing economic and competitive conditions and to certain financial, business and other factors beyond our control, including, without limitation, wholesale electricity prices in ERCOT (which are primarily driven by the price of natural gas and ERCOT market heat rates) and general conditions in the credit markets. Refinancing may be difficult because of the slow economic recovery, the possibility of rising interest rates and the impending surge of large debt maturities of other borrowers. Due to the weakness of our credit, we may be more heavily exposed to these refinancing risks than other borrowers.
22
A substantial amount of our debt is comprised of debt incurred under the TCEH Senior Secured Facilities, the majority of which matures in October 2014. The TCEH Revolving Credit Facility, which has a facility limit of $2.7 billion and availability of $1.4 billion (including $94 million of commitments from Lehman that are only available from the fronting banks and the swingline lenders) as of December 31, 2010, matures in October 2013. The TCEH Revolving Credit Facility is used for letters of credit and borrowings for general corporate purposes. We may not be able to refinance the TCEH Senior Secured Facilities, including the TCEH Revolving Credit Facility, or our other debt because of our high levels of existing debt. For example, we may not be able to refinance the TCEH Revolving Credit Facility unless prior to or concurrently with such refinancing we refinance or otherwise extend the maturity of a substantial portion of our debt due in 2014. Consequently, even though most of our debt matures in October 2014, the earlier maturity of the TCEH Revolving Credit Facility may effectively cause us to address the 2014 debt maturities at an earlier time than we might otherwise choose. Similarly, lenders of debt due in 2014 may be unwilling to refinance or otherwise extend the maturity of their lendings unless prior to or concurrently with such refinancing we refinance or otherwise extend the maturity of a substantial portion of our debt due in the period 2015 to 2017. As of December 31, 2010, $5.6 billion principal amount of our debt matures in the period 2015 to 2017. This “pull-forward” effect, which may cause us to refinance several maturities at once as the first becomes due, could increase our near-term refinancing needs.
Wholesale electricity prices in the ERCOT market largely correlate with the price of natural gas. Accordingly, the contribution to earnings and the value of our baseload generation assets are dependent in significant part upon the price of natural gas. Forward natural gas prices have generally trended downward since mid-2008. In recent years natural gas supply has outpaced demand as a result of increased drilling of shale gas deposits combined with lingering demand weakness associated with the economic recession, and many industry experts expect this supply/demand imbalance to continue for a number of years, thereby depressing natural gas prices for a long-term period. These market conditions are challenging to the long-term profitability of our generation assets. Specifically, low natural gas prices and their correlated effect in ERCOT on wholesale electricity prices could have a material adverse impact on the overall profitability of our generation assets for periods in which we do not have significant hedge positions. As of December 31, 2010, we have hedged only approximately 51% and 19% of our wholesale natural gas price exposure related to expected generation output for 2013 and 2014, respectively, and do not have any significant amounts of hedges in place for periods after 2014. A continuation of current forward natural gas prices or a further decline of forward natural gas prices could limit our ability to hedge our wholesale electricity revenues at sufficient price levels to support our interest payments and debt maturities, result in further declines in the values of our baseload generation assets and adversely impact our ability to refinance the TCEH Revolving Credit Facility due in October 2013 or our substantial debt due in October 2014.
In addition, our liabilities and those of EFCH exceed our and EFCH’s assets as shown on our and EFCH’s respective balance sheet prepared in accordance with US GAAP as of December 31, 2010. Our assets include $6.2 billion of goodwill as of December 31, 2010. In the third quarter 2010, we recorded a $4.1 billion noncash goodwill impairment charge reflecting the estimated effect of lower wholesale electricity prices on the enterprise value of TCEH, driven by the sustained decline in forward natural gas prices, as indicated by our cash flow projections and declines in market values of securities of comparable companies. The value of our goodwill will continue to depend on, among other things, wholesale electricity prices in the ERCOT market. Recent valuation analyses of TCEH’s business indicate that the principal amount of its outstanding debt currently exceeds its enterprise value. We may have difficulty successfully implementing any refinancing of our debt due to our financial position as reflected in our balance sheet and the valuation analyses.
We may pursue transactions and initiatives that are unsuccessful or do not produce the desired outcome.
Future transactions and initiatives that we may pursue may have significant effects on our business, capital structure, liquidity and/or results of operations. For example, in addition to the exchanges and repurchases of our debt that are described in Note 11 to Financial Statements, we have and may continue to pursue, from time to time, transactions and initiatives of various types, including, without limitation, debt exchange transactions, debt repurchases, equity or debt issuances, debt refinancing transactions (including extensions of maturity dates of our debt), asset sales, joint ventures, recapitalizations, business combinations and other strategic transactions. There can be no guarantee that any of such transactions or initiatives would be successful or produce the desired outcome, which could ultimately affect us in a material and adverse manner. Moreover, the effects of any of these transactions or initiatives could be material and adverse to holders of our debt and could be disproportionate, and directionally different, with respect to one class or type of debt than with respect to others.
23
Despite our current high debt level, we may still be able to incur substantially more debt. This could further exacerbate the risks associated with our substantial debt.
We may be able to incur additional debt in the future. Although our debt agreements contain restrictions on the incurrence of additional debt, these restrictions are subject to a number of significant qualifications and exceptions. Under certain circumstances, the amount of debt, including secured debt, that could be incurred in compliance with these restrictions could be substantial. If new debt is added to our existing debt levels, the related risks that we now face would intensify.
Increases in interest rates may negatively impact our results of operations, liquidity and financial condition.
Certain of our borrowings, to the extent the interest rate is not fixed by interest rate swaps, are at variable rates of interest. An increase in interest rates would have a negative impact on our results of operations by causing an increase in interest expense.
As of December 31, 2010, we had $4.494 billion aggregate principal amount of variable rate long-term debt (excluding $1.135 billion of long-term borrowings associated with the TCEH Letter of Credit Facility that are invested at a variable rate), taking into account interest rate swaps that fix the interest rate on $15.8 billion in notional amount of variable rate debt. As a result, as of December 31, 2010, a 100 basis point increase in interest rates would increase our annual interest expense by approximately $45 million. See discussion of interest rate swap transactions in Item 7, “Management’s Discussion and Analysis of Financial Condition and Results of Operations – Significant Activities and Events.”
Our interest expense and related charges for the year ended December 31, 2010 totaled $3.554 billion, including $207 million of unrealized mark-to-market net losses on interest rate swaps.
Our debt agreements and the Oncor “ring-fencing” measures contain restrictions that limit flexibility in operating our businesses.
Our debt agreements contain various covenants and other restrictions that limit our ability to engage in specified types of transactions and may adversely affect our ability to operate our businesses. These covenants and other restrictions limit our ability to, among other things:
| | • | | incur additional debt or issue preferred shares; |
| | • | | pay dividends on, repurchase or make distributions in respect of capital stock or make other restricted payments; |
| | • | | sell or transfer assets; |
| | • | | create liens on assets to secure debt; |
| | • | | consolidate, merge, sell or otherwise dispose of all or substantially all of our assets; |
| | • | | enter into transactions with affiliates; |
| | • | | designate subsidiaries as unrestricted subsidiaries, and |
| | • | | repay, repurchase or modify certain subordinated and other material debt. |
There are a number of important limitations and exceptions to these covenants and other restrictions. See Note 11 to Financial Statements for a description of these covenants and other restrictions.
Under the TCEH Senior Secured Facilities, TCEH is required to maintain a consolidated secured debt to consolidated EBITDA ratio below specified levels. TCEH’s ability to maintain the consolidated secured debt to consolidated EBITDA ratio below such levels can be affected by events beyond its control, including, without limitation, wholesale electricity prices (which are primarily derived by the price of natural gas and ERCOT market heat rates), and there can be no assurance that TCEH will comply with this ratio.
24
A breach of any of these covenants or restrictions could result in an event of default under one or more of our debt agreements, including as a result of cross default provisions. Upon the occurrence of an event of default under one of the debt agreements, our lenders or noteholders could elect to declare all amounts outstanding under that debt agreement to be immediately due and payable and/or terminate all commitments to extend further credit. Such actions by those lenders or noteholders could cause cross defaults under our other debt. If we were unable to repay those amounts, the lenders or noteholders could proceed against any collateral granted to them to secure such debt. If lenders or noteholders accelerate the repayment of borrowings, we may not have sufficient assets and funds to repay those borrowings.
In addition, as described in Note 1 to Financial Statements, EFH Corp. and Oncor have implemented a number of “ring-fencing” measures to enhance the credit quality of Oncor Holdings and its subsidiaries, including Oncor. Those measures, many of which were agreed to and required by the PUCT’s Order on Rehearing in Docket No. 34077, include, among other things:
| | • | | Oncor Holdings’ and Oncor’s board of directors being comprised of a majority of directors that are independent from the Texas Holdings Group, EFH Corp. and its other subsidiaries; |
| | • | | Oncor being treated as an unrestricted subsidiary with respect to EFH Corp.’s and EFIH’s debt; |
| | • | | Oncor not being restricted from incurring its own debt; |
| | • | | Oncor not guaranteeing or pledging any of its assets to secure the debt of any member of the Texas Holdings Group; |
| | • | | restrictions on distributions by Oncor, and the right of the independent members of Oncor’s board of directors and the largest non-majority member of Oncor to block the payment of distributions to Oncor Holdings (i.e., such distributions not being available to EFH Corp. under certain circumstances), and |
| | • | | restrictions on the ability to sell a majority interest in Oncor until October 2012. |
We may not be able to generate sufficient cash to service all of our debt and may be forced to take other actions to satisfy our obligations under our debt agreements, which may not be successful.
Our ability to make scheduled payments on our debt obligations depends on our financial condition and operating performance, which is subject to prevailing economic and competitive conditions and to certain financial, business and other factors beyond our control, including, without limitation, wholesale electricity prices (which are primarily driven by the price of natural gas and ERCOT market heat rates). We may not be able to maintain a level of cash flows sufficient to permit us to pay the principal, premium, if any, and interest on our debt.
If cash flows and capital resources are insufficient to fund our debt service obligations, we could face substantial liquidity problems and might be forced to reduce or delay investments and capital expenditures, or to dispose of assets or operations, seek additional capital or restructure or refinance debt. These alternative measures may not be successful, may not be completed on economically attractive terms or may not be adequate for us to meet our debt service obligations when due. Additionally, our debt agreements limit the use of the proceeds from many dispositions of assets or operations. As a result, we may not be allowed, under these documents, to use proceeds from these dispositions to satisfy our debt service obligations.
25
Under the terms of the indentures governing the TCEH Senior Notes and the TCEH Senior Secured Second Lien Notes and the terms of the TCEH Senior Secured Facilities, TCEH is restricted from making certain payments to EFH Corp.
EFH Corp. is a holding company and substantially all of its reported consolidated assets are held by its subsidiaries. As of December 31, 2010, TCEH and its subsidiaries held approximately 80% of EFH Corp.’s reported consolidated assets and for the year ended December 31, 2010, TCEH and its subsidiaries represented all of EFH Corp.’s reported consolidated revenues. Accordingly, EFH Corp. depends upon TCEH for a significant amount of its cash flows and relies on such cash flows in order to pay its obligations. However, under the terms of the indentures governing the TCEH Senior Notes and the TCEH Senior Secured Second Lien Notes and the terms of the TCEH Senior Secured Facilities, TCEH is restricted from making certain payments to EFH Corp., except in the form of certain loans to cover certain of EFH Corp.’s obligations and dividends and distributions in certain other limited circumstances if permitted by applicable state law. Further, the indentures governing the TCEH Senior Notes and the TCEH Senior Secured Second Lien Notes and the terms of the TCEH Senior Secured Facilities do not permit such intercompany loans to service EFH Corp. debt unless required for EFH Corp. to pay principal, premium and interest when due on debt incurred by EFH Corp. to finance the Merger or that was in existence prior to the Merger, or any debt incurred by EFH Corp. to replace, refund or refinance such debt. Such loans are also permitted to service other debt, subject to limitations on the amount of the loans. As a result, unless and until the net proceeds from the offering of any notes by EFH Corp. are used to replace, refund or refinance EFH Corp. debt, intercompany loans from TCEH to EFH Corp. to make payments on such notes are restricted. In addition, TCEH is prohibited from making certain loans to EFH Corp. if certain events of default under the indentures governing the TCEH Senior Notes or the TCEH Senior Secured Second Lien Notes or the terms of the TCEH Senior Secured Facilities have occurred and are continuing.
Under the terms of the indentures governing the EFIH Notes, EFIH is restricted from making certain payments to EFH Corp.
EFH Corp. is a holding company and substantially all of its consolidated assets are held by its subsidiaries. As of December 31, 2010, EFIH and its subsidiaries held approximately 12% of EFH Corp.’s consolidated assets, which assets consist primarily of EFIH’s investment in Oncor Holdings. Accordingly, EFH Corp. depends upon EFIH for a significant amount of its cash flows and relies on such cash flows in order to pay its obligations. However, under the terms of the indenture governing the EFIH Notes, EFIH is restricted from making certain payments, including dividends and loans, to EFH Corp., except in limited circumstances.
EFH Corp. has a very limited ability to control activities at Oncor due to structural and operational “ring-fencing” measures.
EFH Corp. depends upon Oncor for a significant amount of its cash flows and relies on such cash flows in order to pay its obligations. However, EFH Corp. has a very limited ability to control the activities of Oncor. As part of the “ring-fencing” measures implemented by EFH Corp. and Oncor, a majority of the members of Oncor’s board of directors are required to meet the New York Stock Exchange requirements for independence in all material respects, and the unanimous, or majority, consent of such directors is required for Oncor to take certain actions. In addition, any new independent directors are required to be appointed by the nominating committee of Oncor Holdings’ board of directors, a majority of whose members are independent directors. No member of EFH Corp.’s management is a member of Oncor’s board of directors. Under Oncor Holdings’ and Oncor’s organizational documents, EFH Corp. has limited indirect consent rights with respect to the activities of Oncor, including the following: new issuances of equity securities by Oncor, material transactions with third parties involving Oncor outside of the ordinary course of business, actions that cause Oncor’s assets to increase the level of jurisdiction of the FERC, any changes to the state of formation of Oncor, material changes to accounting methods not required by US GAAP, and actions that fail to enforce certain tax sharing obligations between Oncor and EFH Corp. In addition, there are restrictions on Oncor’s ability to make distributions to its members, including indirectly to EFH Corp.
26
Risks Related to Structure
EFH Corp. is a holding company and its obligations are structurally subordinated to existing and future liabilities and preferred stock of its subsidiaries.
EFH Corp.’s cash flows and ability to meet its obligations are largely dependent upon the earnings of its subsidiaries and the payment of such earnings to EFH Corp. in the form of dividends, distributions, loans or otherwise, and repayment of loans or advances from EFH Corp. These subsidiaries are separate and distinct legal entities and have no obligation to provide EFH Corp. with funds for its payment obligations. Any decision by a subsidiary to provide EFH Corp. with funds for its payment obligations, whether by dividends, distributions, loans or otherwise, will depend on, among other things, the subsidiary’s results of operations, financial condition, cash requirements, contractual restrictions and other factors. In addition, a subsidiary’s ability to pay dividends may be limited by covenants in its existing and future debt agreements or applicable law. Further, the distributions that may be paid by Oncor are limited as discussed below.
Because EFH Corp. is a holding company, its obligations to its creditors are structurally subordinated to all existing and future liabilities and existing and future preferred stock of its subsidiaries that do not guarantee such obligations. Therefore, with respect to subsidiaries that do not guarantee EFH Corp.’s obligations, EFH Corp.’s rights and the rights of its creditors to participate in the assets of any subsidiary in the event that such a subsidiary is liquidated or reorganized are subject to the prior claims of such subsidiary’s creditors and holders of such subsidiary’s preferred stock. To the extent that EFH Corp. may be a creditor with recognized claims against any such subsidiary, EFH Corp.’s claims would still be subject to the prior claims of such subsidiary’s creditors to the extent that they are secured or senior to those held by EFH Corp. Subject to restrictions contained in financing arrangements, EFH Corp.’s subsidiaries may incur additional debt and other liabilities.
Oncor may or may not make any distributions to EFH Corp.
Upon the consummation of the Merger, EFH Corp. and Oncor implemented certain structural and operational “ring-fencing” measures, including certain measures required by the PUCT’s Order on Rehearing in Docket No. 34077, that were based on principles articulated by rating agencies and commitments made by Texas Holdings and Oncor to the PUCT and the FERC to further enhance Oncor’s credit quality. These measures were put in place to mitigate Oncor’s credit exposure to the Texas Holdings Group and to reduce the risk that the assets and liabilities of Oncor would be substantively consolidated with the assets and liabilities of the Texas Holdings Group in the event of a bankruptcy of one or more of those entities.
As part of the ring-fencing measures, a majority of the members of the board of directors of Oncor are required to be, and are, independent from EFH Corp. Any new independent directors of Oncor are required to be appointed by the nominating committee of Oncor Holdings. The organizational documents of Oncor give these independent directors, acting by majority vote, and, during certain periods, any director designated by Texas Transmission, the express right to prevent distributions from Oncor if they determine that it is in the best interests of Oncor to retain such amounts to meet expected future requirements. Accordingly, there can be no assurance that Oncor will make any distributions to EFH Corp.
In addition, Oncor’s organizational documents limit Oncor’s distributions to its owners, including EFH Corp., through December 31, 2012 to an amount not to exceed Oncor’s net income (determined in accordance with US GAAP, subject to certain defined adjustments, including goodwill impairments) and prohibit Oncor from making any distribution to EFH Corp. so long as and to the extent that such distribution would cause Oncor’s regulatory capital structure to exceed the debt-to-equity ratio established from time to time by the PUCT for ratemaking purposes, which is currently set at 60% debt to 40% equity. See Item 7, “Management’s Discussion and Analysis of Financial Condition and Results of Operations — Regulatory Matters — Oncor Matters with the PUCT” for discussion of a rate review filed by Oncor in January 2011 that, among other things, requested a revised regulatory capital structure of 55% debt to 45% equity.
27
In March 2009, the PUCT awarded Oncor the right to construct transmission lines and facilities associated with its CREZ Transmission Plan, the cost of which is currently estimated by Oncor to be approximately $1.75 billion (see discussion in Item 7, “Management’s Discussion and Analysis of Financial Condition and Results of Operations — Regulatory Matters”). With the award, it is likely Oncor will incur additional debt. In addition, Oncor may incur additional debt in connection with other investments in infrastructure or technology, including automated accounting systems. Accordingly, while Oncor is required to maintain a specified debt-to-equity ratio, there can be no assurance that Oncor’s equity balance will be sufficient to maintain the required debt-to-equity ratio established from time to time by the PUCT for ratemaking purposes, thereby restricting Oncor from making any distributions to EFH Corp. In addition, any increase in Oncor’s interest expense may reduce the amounts available to be distributed to EFH Corp.
Oncor’s ring-fencing measures may not work as planned.
In 2007, EFH Corp. and Oncor implemented certain structural and operational “ring-fencing” measures, including certain measures required by the PUCT’s Order on Rehearing in Docket No. 34077, that were based on principles articulated by rating agencies and commitments made by Texas Holdings and Oncor to the PUCT and the FERC to further enhance Oncor’s credit quality. These measures were put in place to mitigate Oncor’s credit exposure to the Texas Holdings Group and to reduce the risk that a court would order any of the Oncor Ring-Fenced Entities’ assets and liabilities to be substantively consolidated with those of any member of the Texas Holdings Group in the event that a member of the Texas Holdings Group were to become a debtor in a bankruptcy case. Nevertheless, bankruptcy courts have broad equitable powers, and as a result, outcomes in bankruptcy proceedings are inherently difficult to predict. Accordingly, if any member of the Texas Holdings Group were to become a debtor in a bankruptcy case, there can be no assurance that a court would not order an Oncor Ring-Fenced Entity’s assets and liabilities to be substantively consolidated with those of such member of the Texas Holdings Group or that a proceeding would not result in a disruption of services Oncor receives from or jointly with affiliates. See Note 1 to Financial Statements for additional information on ring-fencing measures.
In addition, Oncor’s access to capital markets and cost of debt could be directly affected by its credit ratings. Any adverse action with respect to Oncor’s credit ratings would generally cause borrowing costs to increase and the potential pool of investors and funding sources to decrease. Oncor’s credit ratings are currently substantially higher than those of the Texas Holdings Group. If credit rating agencies were to change their views of Oncor’s independence from any member of the Texas Holdings Group, Oncor’s credit ratings would likely decline. Despite the ring-fencing measures, rating agencies could take an adverse action with respect to Oncor’s credit ratings in response to liability management activities by EFH Corp. or any of its subsidiaries. In the event any such adverse action takes place and causes Oncor’s borrowing costs to increase, it may not be able to recover these increased costs if they exceed Oncor’s PUCT-approved cost of debt determined in its 2008 general rate case or subsequent rate cases.
28
Risks Related to Businesses
Our businesses are subject to ongoing complex governmental regulations and legislation that have impacted, and may in the future impact, our businesses and/or results of operations.
Our businesses operate in changing market environments influenced by various state and federal legislative and regulatory initiatives regarding the restructuring of the energy industry, including competition in the generation and sale of electricity. We will need to continually adapt to these changes.
Our businesses are subject to changes in state and federal laws (including PURA, the Federal Power Act, the Atomic Energy Act, the Public Utility Regulatory Policies Act of 1978, the Clean Air Act and the Energy Policy Act of 2005), changing governmental policy and regulatory actions (including those of the PUCT, the NERC, the TRE, the RRC, the TCEQ, the FERC, the EPA, the NRC and the CFTC) and the rules, guidelines and protocols of ERCOT with respect to matters including, but not limited to, market structure and design, operation of nuclear generation facilities, construction and operation of other generation facilities, construction and operation of transmission facilities, acquisition, disposal, depreciation and amortization of regulated assets and facilities, recovery of costs and investments, decommissioning costs, return on invested capital for regulated businesses, market behavior rules, present or prospective wholesale and retail competition and environmental matters. TCEH, along with other market participants, is subject to electricity pricing constraints and market behavior and other competition-related rules and regulations under PURA that are administered by the PUCT and ERCOT, and, with respect to any wholesale power sales outside the ERCOT market, is subject to market behavior and other competition-related rules and regulations under the Federal Power Act that are administered by the FERC. Changes in, revisions to, or reinterpretations of existing laws and regulations (for example, with respect to prices at which TCEH may sell electricity, or the cost of emitting greenhouse gases) may have a material and adverse effect on our businesses.
The Texas Legislature meets every two years (the current legislative session began in January 2011), and from time to time bills are introduced and considered that could materially affect our businesses. The State of Texas currently faces a substantial budget deficit, and the Texas Legislature is expected to enact spending cuts to address this shortfall. We cannot predict whether spending cuts or other actions taken with respect to the budget deficit will affect the PUCT or other agencies that relate to our business or whether any such spending cuts or other actions taken with respect to the budget deficit will have a material impact on our business. There can be no assurance that future action of the Texas Legislature will not result in legislation that could have a material adverse effect on us and our financial prospects.
PURA, the PUCT, ERCOT, the RRC, the TCEQ and the Office of Public Utility Council (OPC) are subject to a “Sunset” review by the Texas Sunset Advisory Commission. PURA will expire, and the PUCT and the RRC will be abolished, on September 1, 2011 unless extended by the Texas Legislature following such review. If any of PURA, the PUCT, ERCOT, the RRC, the TCEQ or the OPC are not renewed by the Texas Legislature pursuant to Sunset review, it could have a material effect on our business.
Sunset review is the regular assessment of the continuing need for a state agency to exist, and is grounded in the premise that an agency will be abolished unless legislation is passed to continue its functions. The Texas Sunset Advisory Commission (Sunset Commission) closely reviews each agency and recommends action on each agency to the Texas Legislature, which action may include modifying or even abolishing the agency. Of the agencies scheduled for Sunset review by the Sunset Commission in 2010 and 2011, the following hold primary interest for us and are subject to a focused, limited scope, or special purpose review: the TCEQ, the PUCT, the OPC, the RRC and ERCOT. These agencies, for the most part, govern and operate the electricity and mining markets in Texas upon which our business model is based. PURA, which expires September 1, 2011, is also subject to Sunset review. If the Texas Legislature fails to renew PURA or any of these agencies, it could result in a significant restructuring of the Texas electricity market or regulatory regime that could have a material impact on our business. There can be no assurance that future action of the Sunset Commission will not result in legislation that could have a material adverse effect on us and our financial prospects.
29
Litigation, legal proceedings, regulatory investigations or other administrative proceedings could expose us to significant liabilities and reputation damage, and have a material adverse effect on our results of operations, and the litigation environment in which we operate poses a significant risk to our businesses.
We are involved in the ordinary course of business in a number of lawsuits involving employment, commercial, and environmental issues, and other claims for injuries and damages, among other matters. We evaluate litigation claims and legal proceedings to assess the likelihood of unfavorable outcomes and to estimate, if possible, the amount of potential losses. Based on these assessments and estimates, we establish reserves and disclose the relevant litigation claims or legal proceedings, as appropriate. These assessments and estimates are based on the information available to management at the time and involve a significant amount of judgment. Actual outcomes or losses may differ materially from current assessments and estimates. The settlement or resolution of such claims or proceedings may have a material adverse effect on our results of operations. In addition, judges and juries in the State of Texas have demonstrated a willingness to grant large verdicts, including punitive damages, to plaintiffs in personal injury, property damage and business tort cases. We use appropriate means to contest litigation threatened or filed against us, but the litigation environment in the State of Texas poses a significant business risk.
We are involved in the ordinary course of business in permit applications and renewals, and we are exposed to the risk that certain of our operating permits may not be granted or renewed on satisfactory terms. Failure to obtain and maintain the necessary permits to conduct our businesses could have a material adverse effect on our results of operations.
We are also involved in the ordinary course of business in regulatory investigations and other administrative proceedings, and we are exposed to the risk that we may become the subject of additional regulatory investigations or administrative proceedings. See Item 3, “Legal Proceedings — Regulatory Investigations and Reviews.” While we cannot predict the outcome of any regulatory investigation or administrative proceeding, any such regulatory investigation or administrative proceeding could result in us incurring material penalties and/or other costs and have a material adverse effect on our results of operations and liquidity.
TCEH’s revenues and results of operations may be negatively impacted by decreases in market prices for electricity, decreases in natural gas prices, and/or decreases in market heat rates.
TCEH (our largest business) is not guaranteed any rate of return on capital investments in its competitive businesses. We market and trade electricity and natural gas, including electricity from our own generation facilities and generation contracted from third parties, as part of our wholesale markets operation. TCEH’s results of operations depend in large part upon wholesale market prices for electricity, natural gas, uranium, coal and transportation in its regional market and other competitive markets and upon prevailing retail electricity rates, which may be impacted by actions of regulatory authorities. Market prices may fluctuate substantially over relatively short periods of time. Demand for electricity can fluctuate dramatically, creating periods of substantial under- or over-supply. During periods of over-supply, prices might be depressed. Also, at times there may be political pressure, or pressure from regulatory authorities with jurisdiction over wholesale and retail energy commodity and transportation rates, to impose price limitations, bidding rules and other mechanisms to address volatility and other issues in these markets.
Some of the fuel for our generation facilities is purchased under short-term contracts. Prices of fuel, including diesel, natural gas, coal, and nuclear fuel, may also be volatile, and the price we can obtain for electricity sales may not change at the same rate as changes in fuel costs. In addition, we purchase and sell natural gas and other energy related commodities, and volatility in these markets may affect costs incurred in meeting obligations.
Volatility in market prices for fuel and electricity may result from the following:
| | • | | volatility in natural gas prices; |
| | • | | volatility in market heat rates; |
| | • | | volatility in coal and rail transportation prices; |
| | • | | severe or unexpected weather conditions; |
| | • | | changes in electricity and fuel usage; |
| | • | | illiquidity in the wholesale power or other markets; |
30
| | • | | transmission or transportation constraints, inoperability or inefficiencies; |
| | • | | availability of competitively-priced alternative energy sources; |
| | • | | changes in market structure; |
| | • | | changes in supply and demand for energy commodities, including nuclear fuel and related enrichment and conversion services; |
| | • | | changes in the manner in which we operate our facilities, including curtailed operation due to market pricing, environmental, safety or other factors; |
| | • | | changes in generation efficiency; |
| | • | | outages or otherwise reduced output from our generation facilities or those of our competitors; |
| | • | | changes in the credit risk or payment practices of market participants; |
| | • | | changes in production and storage levels of natural gas, lignite, coal, crude oil, diesel and other refined products; |
| | • | | natural disasters, wars, sabotage, terrorist acts, embargoes and other catastrophic events, and |
| | • | | federal, state and local energy, environmental and other regulation and legislation. |
All of our generation facilities are located in the ERCOT market, a market with limited interconnections to other markets. Wholesale electricity prices in the ERCOT market generally correlate with the price of natural gas because marginal electricity demand is generally supplied by natural gas-fueled generation facilities. Accordingly, our earnings and the value of our baseload generation assets, which provided a substantial portion of our supply volumes in 2010, are dependent in significant part upon the price of natural gas. Forward natural gas prices have generally trended downward since mid-2008. In recent years natural gas supply has outpaced demand as a result of increased drilling of shale gas deposits combined with lingering demand weakness associated with the economic recession, and many industry experts expect this supply/demand imbalance to continue for a number of years, thereby depressing natural gas prices for a long-term period. While our hedging activities, in particular our long-term hedging program, are designed to mitigate the effect on earnings of low wholesale electricity prices, due to low natural gas prices, these market conditions are challenging to the long-term profitability of our generation assets. Specifically, the low natural gas prices and the correlated effect in ERCOT on wholesale power prices could have a material adverse impact on the overall profitability of our generation assets for periods in which we do not have significant hedge positions. While we have significantly hedged our natural gas price exposure for 2011 and 2012 (approximately 99% and 87%, respectively), as of December 31, 2010, we have hedged only approximately 51% and 19% of our wholesale natural gas price exposure related to expected generation output for 2013 and 2014, respectively, and do not have any significant amounts of hedges in place for periods after 2014. A continuation of current forward natural gas prices or a further decline of forward natural gas prices could limit our ability to hedge our wholesale electricity revenues at sufficient price levels to support our interest payments and debt maturities, result in further declines in the value of our baseload generation assets and could adversely impact our ability to refinance the TCEH Revolving Credit Facility due in October 2013 or our substantial debt due in October 2014.
Wholesale electricity prices also correlate with market heat rates (a measure of efficiency of the marginal price-setting generator of electricity), which could fall if demand for electricity were to decrease or if additional generation facilities are built in ERCOT. Accordingly, our earnings and the value of our baseload (lignite/coal-fueled and nuclear) generation assets, which provided a substantial portion of our supply volumes in 2010, are also dependent in significant part upon market heat rates. As a result, our baseload generation assets could significantly decrease in profitability and value if market heat rates continue at current levels or decline.
Our assets or positions cannot be fully hedged against changes in commodity prices and market heat rates, and hedging transactions may not work as planned or hedge counterparties may default on their obligations.
We cannot fully hedge the risk associated with changes in commodity prices, most notably natural gas prices, or market heat rates because of the expected useful life of our generation assets and the size of our position relative to market liquidity. To the extent we have unhedged positions, fluctuating commodity prices and/or market heat rates can materially impact our results of operations, liquidity and financial position, either favorably or unfavorably.
31
To manage our financial exposure related to commodity price fluctuations, we routinely enter into contracts to hedge portions of purchase and sale commitments, fuel requirements and inventories of natural gas, lignite, coal, crude oil, diesel fuel and refined products, and other commodities, within established risk management guidelines. As part of this strategy, we routinely utilize fixed-price forward physical purchase and sale contracts, futures, financial swaps and option contracts traded in over-the-counter markets or on exchanges. Although we devote a considerable amount of time and effort to the establishment of risk management procedures, as well as the ongoing review of the implementation of these procedures, the procedures in place may not always function as planned and cannot eliminate all the risks associated with these activities. For example, we hedge the expected needs of our wholesale and retail customers, but unexpected changes due to weather, natural disasters, market constraints or other factors could cause us to purchase power to meet unexpected demand in periods of high wholesale market prices or resell excess power into the wholesale market in periods of low prices. As a result of these and other factors, we cannot precisely predict the impact that risk management decisions may have on our businesses, results of operations, liquidity or financial position.
With the tightening of credit markets, there has been some decline in the number of market participants in the wholesale energy commodities markets, resulting in less liquidity, particularly in the ERCOT electricity market. Participation by financial institutions and other intermediaries (including investment banks) has particularly declined. Extended declines in market liquidity could materially affect our ability to hedge our financial exposure to desired levels.
To the extent we engage in hedging and risk management activities, we are exposed to the risk that counterparties that owe us money, energy or other commodities as a result of market transactions will not perform their obligations. Should the counterparties to these arrangements fail to perform, we could be forced to enter into alternative hedging arrangements or honor the underlying commitment at then-current market prices. In such event, we could incur losses in addition to amounts, if any, already paid to the counterparties. ERCOT market participants are also exposed to risks that another ERCOT market participant may default on its obligations to pay ERCOT for power taken, in which case such costs, to the extent not offset by posted security and other protections available to ERCOT, may be allocated to various non-defaulting ERCOT market participants, including us.
Our collateral requirements for hedging arrangements could be materially impacted if the rules implementing the Financial Reform Act broaden the scope of the Act’s provisions regarding the regulation of over-the-counter financial derivatives and make them applicable to us.
In July 2010, financial reform legislation known as the Dodd-Frank Wall Street Reform and Consumer Protection Act (the Financial Reform Act) was enacted. While the legislation is broad and detailed, substantial portions of the legislation are currently under rulemakings by federal governmental agencies to implement the standards set out in the legislation and adopt new standards.
Title VII of the Financial Reform Act provides for the regulation of the over-the-counter (OTC) derivatives market. The Financial Reform Act generally requires OTC derivatives (including the types of asset-backed OTC derivatives that we use to hedge risks associated with commodity and interest rate exposure) to be cleared by a derivatives clearing organization. However, entities are exempt from these clearing requirements if they (i) are not “Swap Dealers” or “Major Swap Participants” as will be defined in the rulemakings and (ii) use the swaps to hedge or mitigate commercial risk. The proposed definition of Swap Dealer is broad and will, as drafted, include many end users. We are evaluating whether or not the type of asset-backed OTC derivatives that we use to hedge commodity and interest rate risk is exempt from the clearing requirements. Existing swaps are grandfathered from the clearing requirements. The legislation mandates significant reporting and compliance requirements for any entity that is determined to be a Swap Dealer or Major Swap Participant.
The Financial Reform Act also requires the posting of cash collateral for uncleared swaps. Because these cash collateral requirements are unclear as to whether an end-user or its counterparty (e.g., swap dealer) is required to post cash collateral, there is risk that the cash collateral requirement could be used to effectively negate the end-user clearing exemption. However, the legislative history of the Financial Reform Act suggests that it was not Congress’ intent to require end-users to post cash collateral with respect to swaps. If we were required to post cash collateral on our swap transactions with swap dealers, our liquidity would likely be materially impacted, and our ability to enter into OTC derivatives to hedge our commodity and interest rate risks would be significantly limited.
32
We cannot predict the outcome of the rulemakings to implement the OTC derivative market provisions of the Financial Reform Act. These rulemakings could negatively affect our ability to hedge our commodity and interest rate risks. The inability to hedge these risks would likely have a material adverse effect on our results of operations, liquidity or financial condition.
We may suffer material losses, costs and liabilities due to ownership and operation of the Comanche Peak nuclear generation facility.
The ownership and operation of a nuclear generation facility involves certain risks. These risks include:
| | • | | unscheduled outages or unexpected costs due to equipment, mechanical, structural or other problems; |
| | • | | inadequacy or lapses in maintenance protocols; |
| | • | | the impairment of reactor operation and safety systems due to human error; |
| | • | | the costs of storage, handling and disposal of nuclear materials, including availability of storage space; |
| | • | | the costs of procuring nuclear fuel; |
| | • | | the costs of securing the plant against possible terrorist attacks; |
| | • | | limitations on the amounts and types of insurance coverage commercially available, and |
| | • | | uncertainties with respect to the technological and financial aspects of decommissioning nuclear facilities at the end of their useful lives. |
The prolonged unavailability of Comanche Peak could materially affect our financial condition and results of operations. The following are among the more significant of these risks:
| | • | | Operational Risk — Operations at any nuclear generation facility could degrade to the point where the facility would have to be shut down. If such degradations were to occur, the process of identifying and correcting the causes of the operational downgrade to return the facility to operation could require significant time and expense, resulting in both lost revenue and increased fuel and purchased power expense to meet supply commitments. Furthermore, a shut-down or failure at any other nuclear generation facility could cause regulators to require a shut-down or reduced availability at Comanche Peak. |
| | • | | Regulatory Risk — The NRC may modify, suspend or revoke licenses and impose civil penalties for failure to comply with the Atomic Energy Act, the regulations under it or the terms of the licenses of nuclear generation facilities. Unless extended, the NRC operating licenses for Comanche Peak Unit 1 and Unit 2 will expire in 2030 and 2033, respectively. Changes in regulations by the NRC could require a substantial increase in capital expenditures or result in increased operating or decommissioning costs. |
| | • | | Nuclear Accident Risk — Although the safety record of Comanche Peak and other nuclear generation facilities generally has been very good, accidents and other unforeseen problems have occurred both in the US and elsewhere. The consequences of an accident can be severe and include loss of life, injury, lasting negative health impact and property damage. Any accident, or perceived accident, could result in significant liabilities and damage our reputation. Any such resulting liability from a nuclear accident could exceed our resources, including insurance coverage. |
33
The operation and maintenance of electricity generation and delivery facilities involves significant risks that could adversely affect our results of operations, liquidity and financial condition.
The operation and maintenance of electricity generation and delivery facilities involves many risks, including, as applicable, start-up risks, breakdown or failure of facilities, lack of sufficient capital to maintain the facilities, the dependence on a specific fuel source or the impact of unusual or adverse weather conditions or other natural events, as well as the risk of performance below expected levels of output, efficiency or reliability, the occurrence of any of which could result in lost revenues and/or increased expenses. A significant number of our facilities were constructed many years ago. In particular, older generating equipment and transmission and distribution equipment, even if maintained in accordance with good engineering practices, may require significant capital expenditures to keep operating at peak efficiency or reliability. The risk of increased maintenance and capital expenditures arises from (a) increased starting and stopping of generation equipment due to the volatility of the competitive generation market and the prospect of continuing low wholesale electricity prices that may not justify sustained or year-round operation of all our generating facilities, (b) any unexpected failure to generate electricity, including failure caused by equipment breakdown or forced outage and (c) damage to facilities due to storms, natural disasters, wars, terrorist acts and other catastrophic events. Further, our ability to successfully and timely complete capital improvements to existing facilities or other capital projects is contingent upon many variables and subject to substantial risks. Should any such efforts be unsuccessful, we could be subject to additional costs and/or losses and write downs on our investment in the project or improvement.
Insurance, warranties or performance guarantees may not cover all or any of the lost revenues or increased expenses that could result from the risks discussed above, including the cost of replacement power. Likewise, the ability to obtain insurance, and the cost of and coverage provided by such insurance, could be affected by events outside our control.
Maintenance, expansion and refurbishment of power generation facilities involve significant risks that could result in unplanned power outages or reduced output and could have a material adverse effect on our results of operations, liquidity and financial condition.
Many of our facilities are old and require periodic upgrading and improvement. Any unexpected failure, including failure associated with breakdowns, forced outages or any unanticipated capital expenditures could materially adversely affect our results of operations, liquidity and financial condition.
We cannot be certain of the level of capital expenditures that will be required due to changing environmental and safety laws and regulations (including changes in the interpretation or enforcement thereof), needed facility repairs and unexpected events (such as natural disasters or terrorist attacks). The unexpected requirement of large capital expenditures could materially adversely affect our results of operations, liquidity and financial condition.
If we make any major modifications to our power generation facilities, we may be required to install the best available control technology or to achieve the lowest achievable emission rates as such terms are defined under the new source review provisions of the Clean Air Act. Any such modifications would likely result in substantial additional capital expenditures.
Our cost of compliance with environmental laws and regulations and our commitments, and the cost of compliance with new environmental laws, regulations or commitments could materially adversely affect our results of operations, liquidity and financial condition.
We are subject to extensive environmental regulation by governmental authorities, including the EPA and the TCEQ. In operating our facilities, we are required to comply with numerous environmental laws and regulations and to obtain numerous governmental permits. We may incur significant additional costs beyond those currently contemplated to comply with these requirements. If we fail to comply with these requirements, we could be subject to civil or criminal liabilities and fines. Existing environmental regulations could be revised or reinterpreted, new laws and regulations could be adopted or become applicable to us or our facilities, and future changes in environmental laws and regulations could occur, including potential regulatory and enforcement developments related to air emissions, all of which could result in significant additional costs beyond those currently contemplated to comply with existing requirements.
34
The EPA has recently completed several regulatory actions establishing new requirements for control of certain emissions from sources that include coal-fueled generation facilities. It is also currently considering several other regulatory actions, as well as contemplating future additional regulatory actions, in each case that may affect our coal-fueled generation facilities. There is no assurance that the currently-installed emissions control equipment at our coal-fueled generation facilities will satisfy the requirements under any future EPA or TCEQ regulations. Some of the potential EPA or TCEQ regulatory actions could require us to install significant additional control equipment, resulting in material costs of compliance for our generation units, including capital expenditures, higher operating costs and potential production curtailments. These costs could result in material adverse effects on our results of operations, liquidity and financial condition.
In conjunction with the building of three new generation units, we have committed to reduce emissions of mercury, NOX and SO2 through the installation of emissions control equipment at both the new and existing lignite-fueled generation units. We may incur significantly greater costs than those contemplated in order to achieve this commitment.
We have formed a Sustainable Energy Advisory Board that advises us in our pursuit of technology development opportunities that, among other things, are designed to reduce our impact on the environment. Any adoption of Sustainable Energy Advisory Board recommendations may cause us to incur significant costs in addition to the costs referenced above.
We may not be able to obtain or maintain all required environmental regulatory approvals. If there is a delay in obtaining any required environmental regulatory approvals, if we fail to obtain, maintain or comply with any such approval or if an approval is retroactively disallowed, the operation and/or construction of our facilities could be stopped, curtailed or modified or become subject to additional costs.
In addition, we may be responsible for any on-site liabilities associated with the environmental condition of facilities that we have acquired, leased or developed, regardless of when the liabilities arose and whether they are known or unknown. In connection with certain acquisitions and sales of assets, we may obtain, or be required to provide, indemnification against certain environmental liabilities. Another party could, depending on the circumstances, assert an environmental claim against us or fail to meet its indemnification obligations to us.
Our results of operations, liquidity and financial condition may be materially adversely affected if new federal and/or state legislation or regulations are adopted to address global climate change.
In recent years, a growing concern has emerged about global climate change and how greenhouse gas (GHG) emissions, such as CO2, contribute to global climate change. Several bills addressing climate change have been introduced in the US Congress or discussed by the Obama Administration that are intended to address climate change using different approaches, including a cap on carbon emissions with emitters allowed to trade unused emission allowances (cap-and-trade), incentives for the development of low-carbon technology and federal renewable portfolio standards. In addition, a number of federal court cases have been recently decided that could result in the future regulation of GHG emissions.
The EPA recently issued a rule, known as the Prevention of Significant Deterioration (PSD) tailoring rule, which establishes new thresholds for regulating GHG emissions from stationary sources under the Clean Air Act. Beginning in January 2011, the rule requires any source subject to the PSD permitting program due to emissions of non-GHG pollutants that increases its GHG emissions by 75,000 tons per year (tpy) to have an operating permit under the Title V Operating Permit Program of the Clean Air Act and install the best available control technology in conjunction with construction activities or plant modifications. Beginning in July 2011, PSD permitting requirements will also apply to new projects with GHG emissions of at least 100,000 tpy and modifications to existing facilities that increase GHG emissions by at least 75,000 tpy (even if no non-GHG PSD thresholds are exceeded). The EPA also finalized regulations in 2009 that will require certain categories of GHG emitters (including our lignite-fueled generation facilities) to monitor and report their annual GHG emissions beginning in March 2011.
The EPA also announced in late 2010 its intent to promulgate, in 2011, GHG emission limits known as New Source Performance Standards that would apply to new and modified sources, as well as GHG emission guidelines that states might apply to existing sources of GHGs. The EPA has indicated that such new standards and guidelines would be applicable to electricity generation facilities. We cannot predict what limits or guidelines the EPA might adopt. If the limits or guidelines become applicable to our generation facilities and require us to install new control equipment or substantially alter our operations, it could have a material adverse effect on our results of operations, liquidity and financial condition.
35
We produce GHG emissions from the combustion of fossil fuels at our generation facilities. For 2010, we estimate that our generation facilities produced 64 million short tons of CO2 based on continuously monitored data reported to and subject to approval by the EPA. Because a substantial portion of our generation portfolio consists of lignite/coal-fueled generation facilities, our results of operations, liquidity and financial condition could be materially adversely affected by the enactment of any legislation or regulation that mandates a reduction in GHG emissions or that imposes financial penalties, costs or taxes upon those that produce GHG emissions. For example, to the extent a cap-and-trade program is adopted, we may be required to incur material costs to reduce our GHG emissions or to procure emission allowances or credits to comply with such a program. The EPA regulation of GHGs under the Clean Air Act, or judicially imposed limits on GHG emissions, may require us to make material expenditures to reduce our GHG emissions. If a significant number of our customers or others refuse to do business with us because of our GHG emissions, it could have a material adverse effect on our results of operations, liquidity or financial condition.
Our results of operations, liquidity and financial condition may be materially adversely affected by the effects of extreme weather conditions.
Our results of operations may be affected by weather conditions and may fluctuate substantially on a seasonal basis as the weather changes. In addition, we could be subject to the effects of extreme weather. Extreme weather conditions could stress our transmission and distribution system or our generation facilities resulting in outages, increased maintenance and capital expenditures. Extreme weather events, including sustained cold temperatures, hurricanes or storms or other natural disasters, could be destructive and result in casualty losses that are not ultimately offset by insurance proceeds or in increased capital expenditures or costs, including supply chain costs.
Moreover, an extreme weather event could cause disruption in service to customers due to downed wires and poles or damage to other operating equipment, which could result in us foregoing sales of electricity and lost revenue. Similarly, an extreme weather event might affect the availability of generation and transmission capacity, limiting our ability to source or deliver electricity to where it is needed. These conditions, which cannot be reliably predicted, could have an adverse consequence by requiring us to seek additional sources of electricity when wholesale market prices are high or to seek to sell excess electricity when those market prices are low.
The rates of Oncor’s electricity delivery business are subject to regulatory review, and may be reduced below current levels, which could adversely impact Oncor’s results of operations, liquidity and financial condition.
The rates charged by Oncor are regulated by the PUCT and certain cities and are subject to cost-of-service regulation and annual earnings oversight. This regulatory treatment does not provide any assurance as to achievement of earnings levels. Oncor’s rates are regulated based on an analysis of Oncor’s costs and capital structure, as reviewed and approved in a regulatory proceeding. While rate regulation is premised on the full recovery of prudently incurred costs and a reasonable rate of return on invested capital, there can be no assurance that the PUCT will judge all of Oncor’s costs to have been prudently incurred, that the PUCT will not reduce the amount of invested capital included in the capital structure that Oncor’s rates are based upon, or that the regulatory process in which rates are determined will always result in rates that will produce full recovery of Oncor’s costs, including regulatory assets reported in Oncor’s balance sheet, and the return on invested capital allowed by the PUCT. In January 2011, Oncor filed for a rate review with the PUCT and 203 cities as discussed in Item 7, “Management’s Discussion and Analysis of Financial Condition and Results of Operations – Regulatory Matters.” In its filing, Oncor requested an aggregate annual rate increase of approximately $353 million and a revised regulatory capital structure of 55% debt to 45% equity. The debt-to-equity ratio established by the PUCT is currently set at 60% debt to 40% equity. We cannot predict the outcome of this rate review.
In addition, in connection with the Merger, Oncor has made several commitments to the PUCT regarding its rates. For example, Oncor committed that it will, in rate cases after its 2008 general rate case through proceedings initiated prior to December 31, 2012, support a cost of debt that will be no greater than the then-current cost of debt of electric utilities with investment grade credit ratings equal to Oncor’s ratings as of October 1, 2007. As a result, Oncor may not be able to recover all of its debt costs if they are above those levels.
36
Ongoing performance improvement initiatives may not achieve desired cost reductions and may instead result in significant additional costs if unsuccessful.
The implementation of performance improvement initiatives identified by management may not produce the desired reduction in costs and if unsuccessful, may instead result in significant additional costs as well as significant disruptions in our operations due to employee displacement and the rapid pace of changes to organizational structure and operating practices and processes. Such additional costs or operational disruptions could have an adverse effect on our businesses and financial prospects.
Attacks on our infrastructure that breach cyber/data security measures could expose us to significant liabilities and reputation damage and disrupt business operations, which could have a material adverse effect on our financial condition, results of operations and liquidity.
A breach of cyber/data security measures that impairs our information technology infrastructure could disrupt normal business operations and affect our ability to control our generation and transmission and distribution assets, access retail customer information and limit communication with third parties. Any loss of confidential or proprietary data through a breach could adversely affect our reputation, expose the company to legal claims, impair our ability to execute on business strategies and/or materially and adversely affect our financial condition, results of operations and liquidity.
TXU Energy may lose a significant number of retail customers due to competitive marketing activity by other retail electric providers.
TXU Energy faces competition for customers. Competitors may offer lower prices and other incentives, which, despite TXU Energy’s long-standing relationship with customers, may attract customers away from TXU Energy.
In some retail electricity markets, TXU Energy’s principal competitor may be the incumbent REP. The incumbent REP has the advantage of long-standing relationships with its customers, including well-known brand recognition.
In addition to competition from the incumbent REP, TXU Energy may face competition from a number of other energy service providers, other energy industry participants, or nationally branded providers of consumer products and services who may develop businesses that will compete with TXU Energy. Some of these competitors or potential competitors may be larger or better capitalized than TXU Energy. If there is inadequate potential margin in these retail electricity markets, it may not be profitable for TXU Energy to compete in these markets.
TXU Energy’s retail business is subject to the risk that sensitive customer data may be compromised, which could result in an adverse impact to its reputation and/or the results of operations of the retail business.
TXU Energy’s retail business requires access to sensitive customer data in the ordinary course of business. Examples of sensitive customer data are names, addresses, account information, historical electricity usage, expected patterns of use, payment history, credit bureau data, credit and debit card account numbers, drivers license numbers, social security numbers and bank account information. TXU Energy’s retail business may need to provide sensitive customer data to vendors and service providers who require access to this information in order to provide services, such as call center operations, to the retail business. If a significant breach occurred, the reputation of TXU Energy’s retail business may be adversely affected, customer confidence may be diminished, or TXU Energy’s retail business may be subject to legal claims, any of which may contribute to the loss of customers and have a negative impact on the business and/or results of operations.
37
TXU Energy relies on the infrastructure of local utilities or independent transmission system operators to provide electricity to, and to obtain information about, its customers. Any infrastructure failure could negatively impact customer satisfaction and could have a material negative impact on its business and results of operations.
TXU Energy depends on transmission and distribution facilities owned and operated by unaffiliated utilities, as well as Oncor’s facilities, to deliver the electricity it sells to its customers. If transmission capacity is inadequate, TXU Energy’s ability to sell and deliver electricity may be hindered, and it may have to forgo sales or buy more expensive wholesale electricity than is available in the capacity-constrained area. For example, during some periods, transmission access is constrained in some areas of the Dallas-Fort Worth metroplex, where TXU Energy has a significant number of customers. The cost to provide service to these customers may exceed the cost to provide service to other customers, resulting in lower profits. In addition, any infrastructure failure that interrupts or impairs delivery of electricity to TXU Energy’s customers could negatively impact the satisfaction of its customers with its service.
TXU Energy offers bundled services to its retail customers, with some bundled services offered at fixed prices and for fixed terms. If TXU Energy’s costs for these bundled services exceed the prices paid by its customers, its results of operations could be materially adversely affected.
TXU Energy offers its customers a bundle of services that include, at a minimum, electricity plus transmission, distribution and related services. The prices TXU Energy charges for its bundle of services or for the various components of the bundle, any of which may be fixed by contract with the customer for a period of time, could fall below TXU Energy’s underlying cost to provide the components of such services.
TXU Energy’s REP certification is subject to PUCT review.
The PUCT may at any time initiate an investigation into whether TXU Energy is compliant with PUCT Substantive Rules and whether it has met all of the requirements for REP certification, including financial requirements. Any removal or revocation of a REP certification would mean that TXU Energy would no longer be allowed to provide electricity service to retail customers. Such decertification would have a material and adverse effect on the company and its financial prospects.
Changes in technology or increased electricity conservation efforts may reduce the value of our generation facilities and/or Oncor’s electricity delivery facilities and may significantly impact our businesses in other ways as well.
Research and development activities are ongoing to improve existing and alternative technologies to produce electricity, including gas turbines, fuel cells, microturbines, photovoltaic (solar) cells and concentrated solar thermal devices. It is possible that advances in these or other technologies will reduce the costs of electricity production from these technologies to a level that will enable these technologies to compete effectively with our traditional generation facilities. Consequently, where we have facilities, the profitability and market value of our generation assets could be significantly reduced. Changes in technology could also alter the channels through which retail customers buy electricity. To the extent self-generation facilities become a more cost-effective option for certain customers, our revenues could be materially reduced.
Also, electricity demand could be reduced by increased conservation efforts and advances in technology, which could likewise significantly reduce the value of our generation assets and electricity delivery facilities. Certain regulatory and legislative bodies have introduced or are considering requirements and/or incentives to reduce energy consumption by a fixed date. Effective energy conservation by our customers could result in reduced energy demand or significantly slow the growth in demand. Such reduction in demand could materially reduce our revenues. Furthermore, we may incur increased capital expenditures if we are required to invest in conservation measures.
Our revenues and results of operations may be adversely impacted by decreases in market prices of power due to the development of wind generation power sources.
A significant amount of investment in wind generation in the ERCOT market over the past few years has increased overall wind power generation capacity. Generally, the increased capacity has led to lower wholesale electricity prices (driven by lower market heat rates) in the regions at or near wind power development. As a result, the profitability of our generation facilities and power purchase contracts, including certain wind generation power purchase contracts, has been impacted and could be further impacted by the effects of the wind power development, and the value could significantly decrease if wind power generation has a material sustained effect on market heat rates.
38
Our revenues and results of operations may be adversely impacted by the ERCOT market’s recent transition from a zonal to a nodal wholesale market structure.
Substantially all of our competitive businesses are located in the ERCOT market, which has recently transitioned from a zonal market structure with four congestion management zones to a nodal market structure that directly manages congestion on a localized basis. In a nodal market, the prices received and paid for power are based on pricing determined at specific interconnection points on the transmission grid (i.e., Locational Marginal Pricing), which could result in lower revenues or higher costs for our competitive businesses. This market structure change could have a significant impact on the profitability and value of our competitive businesses depending on how the Locational Marginal Pricing develops, particularly if such development ultimately results in lower revenue due to lower wholesale electricity prices, increased costs to service end-user electricity demand or increased collateral posting requirements with ERCOT. See Item 7, “Management’s Discussion and Analysis of Financial Condition and Results of Operations — Significant Activities and Events — Wholesale Market Design — Nodal Market.”
Our future results of operations may be negatively impacted by settlement adjustments determined by ERCOT related to prior periods.
ERCOT is the independent system operator that is responsible for maintaining reliable operation of the bulk electric power supply system in the ERCOT market. Its responsibilities include the clearing and settlement of electricity volumes and related ancillary services among the various participants in the deregulated Texas market. Settlement information for most operating activity is due from ERCOT within two months after the operating day, and true-up settlements are due from ERCOT within six months after the operating day. Likewise, ERCOT has the ability to resettle any operating day at any time after the six month settlement period, usually the result of a lingering dispute, an alternative dispute resolution process or litigated event. As a result, we are subject to settlement adjustments from ERCOT related to prior periods, which may result in charges or credits impacting our future reported results of operations.
Our results of operations and financial condition could be negatively impacted by any development or event beyond our control that causes economic weakness in the ERCOT market.
We derive substantially all of our revenues from operations in the ERCOT market, which covers approximately 75% of the geographical area in the State of Texas. As a result, regardless of the state of the economy in areas outside the ERCOT market, economic weakness in the ERCOT market could lead to reduced demand for electricity in the ERCOT market. Such a reduction could have a material negative impact on our results of operations, liquidity and financial condition.
EFH Corp.’s (or any applicable subsidiary’s) credit ratings could negatively affect EFH Corp.’s (or the pertinent subsidiary’s) ability to access capital and could require EFH Corp. or its subsidiaries to post collateral or repay certain indebtedness.
Downgrades in EFH Corp.’s or any of its applicable subsidiaries’ long-term debt ratings generally cause borrowing costs to increase and the potential pool of investors and funding sources to decrease and could trigger liquidity demands pursuant to the terms of new commodity contracts, leases or other agreements. Future transactions by EFH Corp. or any of its subsidiaries, including the issuance of additional debt or the consummation of additional debt exchanges, could result in temporary or permanent downgrades of EFH Corp.’s or its subsidiaries’ credit ratings.
Most of EFH Corp.’s large customers, suppliers and counterparties require an expected level of creditworthiness in order for them to enter into transactions. If EFH Corp.’s (or an applicable subsidiary’s) credit ratings decline, the costs to operate its businesses would likely increase because counterparties could require the posting of collateral in the form of cash-related instruments, or counterparties could decline to do business with EFH Corp. (or its applicable subsidiary).
39
Market volatility may have impacts on our businesses and financial condition that we currently cannot predict.
Because our operations are capital intensive, we expect to rely over the long-term upon access to financial markets (particularly the attainment of liquidity facilities) as a significant source of liquidity for capital requirements not satisfied by cash-on-hand, operating cash flows or our revolving credit facilities. The capital and credit markets experienced extreme volatility and disruption in 2008 and 2009. Our ability to access the capital or credit markets may be severely restricted at a time when we would like, or need, to access those markets, which could have an impact on our flexibility to react to changing economic and business conditions. In addition, the cost of debt financing may be materially impacted by these market conditions. Accordingly, there can be no assurance that the capital and credit markets will continue to be a reliable or acceptable source of short-term or long-term financing for us. Additionally, disruptions in the capital and credit markets could have a broader impact on the economy in general in ways that could lead to reduced electricity usage, which could have a negative impact on our revenues, or have an impact on our customers, counterparties and/or lenders, causing them to fail to meet their obligations to us.
Our liquidity needs could be difficult to satisfy, particularly during times of uncertainty in the financial markets and/or during times when there are significant changes in commodity prices. The inability to access liquidity, particularly on favorable terms, could materially adversely affect results of operations and/or financial condition.
Our businesses are capital intensive. We rely on access to financial markets and liquidity facilities as a significant source of liquidity for capital requirements not satisfied by cash-on-hand or operating cash flows. The inability to raise capital on favorable terms or access liquidity facilities, particularly during times of uncertainty similar to those experienced in the financial markets in 2008 and 2009, could impact our ability to sustain and grow our businesses and would likely increase capital costs. Our access to the financial markets and liquidity facilities could be adversely impacted by various factors, such as:
| | • | | changes in financial markets that reduce available credit or the ability to obtain or renew liquidity facilities on acceptable terms; |
| | • | | economic weakness in the ERCOT or general US market; |
| | • | | changes in interest rates; |
| | • | | a deterioration of EFH Corp.’s credit or the credit of its subsidiaries or a reduction in EFH Corp.’s or its applicable subsidiaries’ credit ratings; |
| | • | | a deterioration of the credit or bankruptcy of one or more lenders or counterparties under our liquidity facilities that affects the ability of such lender(s) to make loans to us; |
| | • | | volatility in commodity prices that increases margin or credit requirements; |
| | • | | a material breakdown in our risk management procedures, and |
| | • | | the occurrence of changes in our businesses that restrict our ability to access liquidity facilities. |
Although we expect to actively manage the liquidity exposure of existing and future hedging arrangements, given the size of the long-term hedging program, any significant increase in the price of natural gas could result in us being required to provide cash or letter of credit collateral in substantial amounts. While these potential posting obligations are primarily supported by the liquidity facilities, for certain transactions there is a potential for the timing of postings on the commodity contract obligations to vary from the timing of borrowings from the TCEH Commodity Collateral Posting Facility. Any perceived reduction in our credit quality could result in clearing agents or other counterparties requesting additional collateral. We have credit concentration risk related to the limited number of lenders that provide liquidity to support our hedging program. A deterioration of the credit quality of such lenders could materially affect our ability to continue such program on acceptable terms. An event of default by one or more of our hedge counterparties could result in termination-related settlement payments that reduce available liquidity if we owe amounts related to commodity contracts or delays in receipts of expected settlements if the hedge counterparties owe amounts to us. These events could have a material negative impact on our results of operations, liquidity and financial condition.
In the event that the governmental agencies that regulate the activities of our businesses determine that the creditworthiness of any such business is inadequate to support our activities, such agencies could require us to provide additional cash or letter of credit collateral in substantial amounts to qualify to do business.
40
In the event our liquidity facilities are being used largely to support the long-term hedging program as a result of a significant increase in the price of natural gas or significant reduction in credit quality, we may have to forego certain capital expenditures or other investments in our competitive businesses or other business opportunities.
Further, a lack of available liquidity could adversely impact the evaluation of our creditworthiness by counterparties and rating agencies. In particular, such concerns by existing and potential counterparties could significantly limit TCEH’s wholesale markets activities, including its long-term hedging program.
The costs of providing pension and OPEB and related funding requirements are subject to changes in pension fund values, changing demographics and fluctuating actuarial assumptions and may have a material adverse effect on our results of operations, liquidity and financial condition.
We provide pension benefits based on either a traditional defined benefit formula or a cash balance formula and also provide certain health care and life insurance benefits to eligible employees and their eligible dependents upon the retirement of such employees. Our costs of providing such benefits and related funding requirements are dependent upon numerous factors, assumptions and estimates and are subject to changes in these factors, assumptions and estimates, including the market value of the assets funding the pension and OPEB plans. Fluctuations in financial market returns as well as changes in general interest rates may result in increased or decreased benefit costs in future periods.
The values of the investments that fund our pension and OPEB plans are subject to changes in financial market conditions, such as the substantial dislocation that began in 2008. Significant decreases in the values of these investments could increase the expenses of the pension plan and the costs of the OPEB plans and related funding requirements in the future. Our costs of providing such benefits and related funding requirements are also subject to changing employee demographics (including but not limited to age, compensation levels and years of accredited service), the level of contributions made to retiree plans, expected and actual earnings on plan assets and the discount rates used in determining the projected benefit obligation. Changes made to the provisions of the plans may also impact current and future benefit costs. Fluctuations in financial market returns as well as changes in general interest rates may result in increased or decreased benefit costs in future periods. See Note 20 to Financial Statements for further discussion of our pension and OPEB plans.
As was the case in the third quarter 2010 (as discussed in Note 4 to Financial Statements), goodwill and/or other intangible assets not subject to amortization that we have recorded in connection with the Merger are subject to at least annual impairment evaluations, and as a result, we could be required to write off some or all of this goodwill and other intangible assets, which may cause adverse impacts on our results of operations and financial condition.
In accordance with accounting standards, goodwill and certain other indefinite-lived intangible assets that are not subject to amortization are reviewed annually or more frequently for impairment, if certain conditions exist, and may be impaired. Any reduction in or impairment of the value of goodwill or other intangible assets will result in a charge against earnings, which could cause a material adverse impact on our reported results of operations and financial position.
The loss of the services of our key management and personnel could adversely affect our ability to operate our businesses.
Our future success will depend on our ability to continue to attract and retain highly qualified personnel. We compete for such personnel with many other companies, in and outside our industry, government entities and other organizations. We may not be successful in retaining current personnel or in hiring or retaining qualified personnel in the future. Our failure to attract new personnel or retain existing personnel could have a material adverse effect on our businesses.
41
The Sponsor Group controls and may have conflicts of interest with us in the future.
The Sponsor Group indirectly owns approximately 60% of EFH Corp.’s capital stock on a fully-diluted basis through its investment in Texas Holdings. As a result of this ownership and the Sponsor Group’s ownership in interests of the general partner of Texas Holdings, the Sponsor Group has control over decisions regarding our operations, plans, strategies, finances and structure, including whether to enter into any corporate transaction, and will have the ability to prevent any transaction that requires the approval of EFH Corp.’s shareholders.
Additionally, each member of the Sponsor Group is in the business of making investments in companies and may from time to time acquire and hold interests in businesses that compete directly or indirectly with us. Members of the Sponsor Group may also pursue acquisition opportunities that may be complementary to our businesses and, as a result, those acquisition opportunities may not be available to us. So long as the members of the Sponsor Group, or other funds controlled by or associated with the members of the Sponsor Group, continue to indirectly own, in the aggregate, a significant amount of the outstanding shares of EFH Corp.’s common stock, even if such amount is less than 50%, the Sponsor Group will continue to be able to strongly influence or effectively control our decisions.
| Item 1B. | UNRESOLVED STAFF COMMENTS |
None.
42
Litigation Related to Generation Facilities
In November 2010, an administrative appeal challenging the decision of the TCEQ to renew and amend Oak Grove Management Company LLC’s (Oak Grove) (a wholly-owned subsidiary of TCEH) Texas Pollutant Discharge Elimination System (TPDES) permit related to water discharges was filed by Robertson County: Our Land, Our Lives and Roy Henrichson in the Travis County, Texas District Court. Plaintiffs seek a reversal of the TCEQ’s order and a remand back to the TCEQ for further proceedings. In addition to this administrative appeal, in November 2010, two other petitions were filed in Travis County, Texas District Court by Sustainable Energy and Economic Development Coalition and Paul and Lisa Rolke, respectively, who were non-parties to the administrative hearing before the State Office of Administrative Hearings, challenging the TCEQ’s decision to renew and amend Oak Grove’s TPDES permit and asking the District Court to remand the matter to the TCEQ for further proceedings. Although we cannot predict the outcome of these proceedings, we believe that the renewal and amendment of the Oak Grove TPDES permit are protective of the environment and that the application for and the processing of Oak Grove’s TPDES permit renewal and amendment by the TCEQ were in accordance with applicable law. There can be no assurance that the outcome of these matters would not result in an adverse impact on our financial condition, results of operations or liquidity.
In September 2010, the Sierra Club filed a lawsuit in the US District Court for the Eastern District of Texas (Texarkana Division) against EFH Corp. and Luminant Generation Company LLC (a wholly-owned subsidiary of TCEH) for alleged violations of the Clean Air Act at Luminant’s Martin Lake generation facility. While we are unable to estimate any possible loss or predict the outcome of the litigation, we believe that the Sierra Club’s claims are without merit, and we intend to vigorously defend this litigation. In addition, in February 2010, the Sierra Club informed Luminant that it may sue Luminant, after the expiration of a 60-day waiting period, for allegedly violating federal Clean Air Act provisions in connection with Luminant’s Big Brown generation facility. Subsequently, in December 2010, Sierra Club informed Luminant that it may sue Luminant, after the expiration of a 60-day waiting period, for allegedly violating federal Clean Air Act provisions in connection with Luminant’s Monticello generation facility. We cannot predict whether the Sierra Club will actually file suit or the outcome of any resulting proceedings.
Regulatory Reviews
In June 2008, the EPA issued a request for information to TCEH under the EPA’s authority under Section 114 of the Clean Air Act. The stated purpose of the request is to obtain information necessary to determine compliance with the Clean Air Act, including New Source Review Standards and air permits issued by the TCEQ for the Big Brown, Monticello and Martin Lake generation facilities. Historically, as the EPA has pursued its New Source Review enforcement initiative, companies that have received a large and broad request under Section 114, such as the request received by TCEH, have in many instances subsequently received a notice of violation from the EPA, which has in some cases progressed to litigation or settlement. The company is cooperating with the EPA and is responding in good faith to the EPA’s request, but is unable to predict the outcome of this matter.
Other Proceedings
In addition to the above, we are involved in various other legal and administrative proceedings in the normal course of business, the ultimate resolution of which, in the opinion of management, should not have a material effect on our financial position, results of operations or cash flows.
| Item 4. | (REMOVED AND RESERVED) |
43
PART II
| Item 5. | MARKET FOR REGISTRANT’S COMMON EQUITY, RELATED STOCKHOLDER MATTERS AND ISSUER PURCHASES OF EQUITY SECURITIES |
As a result of the Merger, EFH Corp.’s common stock is privately held, and there is no established public trading market for EFH Corp.’s common stock.
See Note 13 to Financial Statements for a description of the restrictions on EFH Corp.’s ability to pay dividends.
The number of holders of the common stock of EFH Corp. as of February 15, 2011 was 119.
44
| Item 6. | SELECTED FINANCIAL DATA |
EFH CORP. AND SUBSIDIARIES
SELECTED FINANCIAL DATA
(millions of dollars, except ratios)
| | | | | | | | | | | | | | | | | | | | | | | | |
| | | Successor | | | Predecessor | |
| | | Year Ended December 31, | | | Period from
October 11,
2007 through
December 31, | | | Period from
January 1,
2007 through
October 10,
2007 | | | Year Ended
December 31,
2006 | |
| | | 2010 | | | 2009 | | | 2008 | | | 2007 | | | |
Operating revenues | | $ | 8,235 | | | $ | 9,546 | | | $ | 11,364 | | | $ | 1,994 | | | $ | 8,044 | | | $ | 10,703 | |
Income (loss) from continuing operations | | | (2,812 | ) | | | 408 | | | | (9,998 | ) | | | (1,361 | ) | | | 699 | �� | | | 2,465 | |
Income from discontinued operations, net of tax effect | | | — | | | | — | | | | — | | | | 1 | | | | 24 | | | | 87 | |
Net income (loss) | | | (2,812 | ) | | | 408 | | | | (9,998 | ) | | | (1,360 | ) | | | 723 | | | | 2,552 | |
Net (income) loss attributable to noncontrolling interests | | | — | | | | (64 | ) | | | 160 | | | | — | | | | — | | | | — | |
Net income (loss) attributable to EFH Corp. | | | (2,812 | ) | | | 344 | | | | (9,838 | ) | | | (1,360 | ) | | | 723 | | | | 2,552 | |
Ratio of earnings to fixed charges (a) | | | — | | | | 1.24 | | | | — | | | | — | | | | 2.30 | | | | 5.11 | |
Capital expenditures, including nuclear fuel | | $ | 944 | | | $ | 2,545 | | | $ | 3,015 | | | $ | 716 | | | $ | 2,542 | | | $ | 2,337 | |
See Notes to Financial Statements.
45
EFH CORP. AND SUBSIDIARIES
SELECTED FINANCIAL DATA (CONTINUED)
(millions of dollars, except ratios)
| | | | | | | | | | | | | | | | | | | | |
| | | Successor | | | Predecessor | |
| | | As of December 31, | | | As of
December 31,
2006 | |
| | | 2010 | | | 2009 | | | 2008 | | | 2007 | | |
Total assets | | $ | 46,388 | | | $ | 59,662 | | | $ | 59,263 | | | $ | 64,804 | | | $ | 27,216 | |
Property, plant & equipment — net | | $ | 20,366 | | | $ | 30,108 | | | $ | 29,522 | | | $ | 28,650 | | | $ | 18,569 | |
Goodwill and intangible assets | | $ | 8,552 | | | $ | 17,192 | | | $ | 17,379 | | | $ | 27,319 | | | $ | 729 | |
| | | | | |
Capitalization | | | | | | | | | | | | | | | | | | | | |
Long-term debt, less amounts due currently | | $ | 34,226 | | | $ | 41,440 | | | $ | 40,838 | | | $ | 38,603 | | | $ | 10,631 | |
EFH Corp. common stock equity | | | (5,990 | ) | | | (3,247 | ) | | | (3,673 | ) | | | 6,685 | | | | 2,140 | |
Noncontrolling interests in subsidiaries | | | 79 | | | | 1,411 | | | | 1,355 | | | | — | | | | — | |
| | | | | | | | | | | | | | | | | | | | |
Total | | $ | 28,315 | | | $ | 39,604 | | | $ | 38,520 | | | $ | 45,288 | | | $ | 12,771 | |
| | | | | | | | | | | | | | | | | | | | |
Capitalization ratios | | | | | | | | | | | | | | | | | | | | |
Long-term debt, less amounts due currently | | | 120.9 | % | | | 104.6 | % | | | 106.0 | % | | | 85.2 | % | | | 83.2 | % |
EFH Corp. common stock equity | | | (21.2 | ) | | | (8.2 | ) | | | (9.5 | ) | | | 14.8 | | | | 16.8 | |
Noncontrolling interests in subsidiaries | | | 0.3 | | | | 3.6 | | | | 3.5 | | | | — | | | | — | |
| | | | | | | | | | | | | | | | | | | | |
Total | | | 100.0 | % | | | 100.0 | % | | | 100.0 | % | | | 100.0 | % | | | 100.0 | % |
| | | | | | | | | | | | | | | | | | | | |
Short-term borrowings | | $ | 1,221 | | | $ | 1,569 | | | $ | 1,237 | | | $ | 1,718 | | | $ | 1,491 | |
Long-term debt due currently | | $ | 669 | | | $ | 417 | | | $ | 385 | | | $ | 513 | | | $ | 485 | |
| (a) | Fixed charges exceeded “earnings” by $2.531 billion, $10.469 billion and $2.034 billion for the years ended December 31, 2010 and 2008 and for the period from October 11, 2007 through December 31, 2007, respectively. |
Note: Although EFH Corp. continued as the same legal entity after the Merger, its “Selected Financial Data” for periods preceding the Merger and for periods succeeding the Merger are presented as the consolidated financial statements of the “Predecessor” and the “Successor,” respectively. See Note 1 to Financial Statements “Basis of Presentation.” The consolidated financial statements of the Successor reflect the application of “purchase accounting.” Results for 2010 reflect the prospective adoption of amended guidance regarding consolidation accounting standards related to variable interest entities that resulted in the deconsolidation of Oncor Holdings as discussed in Note 3 to Financial Statements and amended guidance regarding transfers of financial assets that resulted in the accounts receivable securitization program no longer being accounted for as a sale of accounts receivable and the funding under the program now reported as short-term borrowings as discussed in Note 10 to Financial Statements. Results for 2010 were significantly impacted by a goodwill impairment charge as discussed in Note 4 to Financial Statements. Results for 2008 were significantly impacted by impairment charges related to goodwill, trade name and emission allowances intangible assets and natural gas-fueled generation facilities as discussed in Notes 4 and 5 to Financial Statements.
46
Quarterly Information (Unaudited)
Results of operations by quarter are summarized below. In our opinion, all adjustments (consisting of normal recurring accruals) necessary for a fair statement of such amounts have been made. Quarterly results are not necessarily indicative of a full year’s operations because of seasonal and other factors. All amounts are in millions of dollars.
| | | | | | | | | | | | | | | | |
| | | First
Quarter | | | Second
Quarter | | | Third
Quarter (a) | | | Fourth
Quarter | |
| 2010: | | | | |
Operating revenues | | $ | 1,999 | | | $ | 1,993 | | | $ | 2,607 | | | $ | 1,636 | |
| | | | | | | | | | | | | | | | |
Net income (loss) | | | 355 | | | | (426 | ) | | | (2,902 | ) | | | 161 | |
| | | | | | | | | | | | | | | | |
Net income (loss) attributable to EFH Corp. | | $ | 355 | | | $ | (426 | ) | | $ | (2,902 | ) | | $ | 161 | |
| | | | | | | | | | | | | | | | |
| | | | | | | | | | | | | | | | |
| | | First
Quarter (a) | | | Second
Quarter | | | Third
Quarter | | | Fourth
Quarter | |
| 2009: | | | | |
Operating revenues | | $ | 2,139 | | | $ | 2,342 | | | $ | 2,885 | | | $ | 2,180 | |
| | | | | | | | | | | | | | | | |
Net income (loss) | | | 454 | | | | (139 | ) | | | (54 | ) | | | 147 | |
Net income attributable to noncontrolling interests | | | (12 | ) | | | (16 | ) | | | (26 | ) | | | (10 | ) |
| | | | | | | | | | | | | | | | |
Net income (loss) attributable to EFH Corp. | | $ | 442 | | | $ | (155 | ) | | $ | (80 | ) | | $ | 137 | |
| | | | | | | | | | | | | | | | |
| (a) | Net income (loss) amounts include the effects of impairment charges related to goodwill (see Note 4 to Financial Statements). |
47
| Item 7. | MANAGEMENT’S DISCUSSION AND ANALYSIS OF FINANCIAL CONDITION AND RESULTS OF OPERATIONS |
The following discussion and analysis of our financial condition and results of operations for the fiscal years ended December 31, 2010, 2009 and 2008 should be read in conjunction with Selected Financial Data and our audited consolidated financial statements and the notes to those statements.
All dollar amounts in the tables in the following discussion and analysis are stated in millions of US dollars unless otherwise indicated.
Business
We are a Dallas, Texas-based holding company with operations consisting principally of our TCEH and Oncor subsidiaries. TCEH is a holding company for subsidiaries engaged in competitive electricity market activities largely in Texas including electricity generation, wholesale energy sales and purchases, commodity risk management and trading activities, and retail electricity sales. Oncor is a majority-owned (approximately 80%) subsidiary engaged in regulated electricity transmission and distribution operations in Texas. Various “ring-fencing” measures have been taken to enhance the credit quality of Oncor. See Notes 1 and 3 to Financial Statements for a description of the material features of these “ring-fencing” measures and for a discussion of the deconsolidation of Oncor (and its majority owner, Oncor Holdings) in 2010 as the result of a change in accounting principles.
Operating Segments
We have aligned and report our business activities as two operating segments: the Competitive Electric segment and the Regulated Delivery segment. The Competitive Electric segment is principally comprised of TCEH. The Regulated Delivery segment is comprised of Oncor Holdings and its subsidiaries. See Notes 1 and 3 to Financial Statements for discussion of the deconsolidation of Oncor Holdings and it subsidiaries in 2010.
See Note 23 to Financial Statements for further information regarding reportable business segments.
Significant Activities and Events
Natural Gas Prices and Long-Term Hedging Program — TCEH has a long-term hedging program designed to reduce exposure to changes in future electricity prices due to changes in the price of natural gas. Under the program, the company has entered into market transactions involving natural gas-related financial instruments, and as of December 31, 2010, has effectively sold forward approximately 1.0 billion MMBtu of natural gas (equivalent to the natural gas exposure of approximately 125,000 GWh at an assumed 8.0 market heat rate) for the period from January 1, 2011 through December 31, 2014 at weighted average annual hedge prices ranging from $7.19 per MMBtu to $7.80 per MMBtu.
These transactions, as well as forward power sales, have effectively hedged an estimated 62% of the natural gas price exposure related to TCEH’s expected generation output for the period beginning January 1, 2011 and ending December 31, 2014 (on an average basis for such period and assuming an 8.0 market heat rate). The hedges were entered into with the continuing expectation that wholesale electricity prices in ERCOT will be highly correlated with natural gas prices, which is expected to be the marginal fuel for the purpose of setting electricity prices approximately 75% to 90% of the time. If the correlation changes in the future, the cash flows targeted under the long-term hedging program may not be achieved.
The long-term hedging program is comprised primarily of contracts with prices based on the New York Mercantile Exchange (NYMEX) Henry Hub pricing point. However, because there are other local and regional natural gas pricing points such as Houston Ship Channel, future wholesale power prices in ERCOT may not correlate as closely to the Henry Hub pricing as other pricing points, which could decrease the effectiveness of the positions in the long-term hedging program in mitigating power price exposure. The company has hedged more than 95% of the Houston Ship Channel versus Henry Hub pricing point risk for 2011.
48
The company has entered into related put and call transactions (referred to as collars), primarily for 2014, that effectively hedge natural gas prices within a range. These transactions represented 11% of the positions in the long-term hedging program as of December 31, 2010, with the approximate weighted average strike prices under the collars being a floor of $7.80 per MMBtu and a ceiling of $11.75 per MMBtu. The company expects to use financial instruments, including collars, in future hedging activity under the long-term hedging program.
The following table summarizes the natural gas hedges in the long-term hedging program as of December 31, 2010:
| | | | | | | | | | | | | | | | | | | | | | | | |
| | | Measure | | | 2011 | | | 2012 | | | 2013 | | | 2014 | | | Total | |
Natural gas hedge volumes (a) | | | mm MMBtu | | | | ~220 | | | | ~398 | | | | ~282 | | | | ~110 | | | | ~1,010 | |
Weighted average hedge price (b) | | | $/MMBtu | | | | ~7.56 | | | | ~7.36 | | | | ~7.19 | | | | ~7.80 | | | | — | |
Weighted average market price (c) | | | $/MMBtu | | | | ~4.55 | | | | ~5.08 | | | | ~5.33 | | | | ~5.49 | | | | — | |
| (a) | Where collars are reflected, the volumes are estimated based on the natural gas price sensitivity (i.e., delta position) of the derivatives. The notional volumes for collars are approximately 150 million MMBtu, which corresponds to a delta position of approximately 110 million MMBtu in 2014. |
| (b) | Weighted average hedge prices are based on NYMEX Henry Hub prices of forward natural gas sales positions in the long-term hedging program (excluding the impact of offsetting purchases for rebalancing and pricing point basis transactions). Where collars are reflected, sales price represents the collar floor price. |
| (c) | Based on NYMEX Henry Hub prices. |
Changes in the fair value of the instruments in the long-term hedging program are being recorded as unrealized gains and losses in net gain (loss) from commodity hedging and trading activities in the statement of income, which has and could continue to result in significant volatility in reported net income. Based on the size of the long-term hedging program as of December 31, 2010, a $1.00/MMBtu change in natural gas prices across the hedged period would result in the recognition of up to $1.0 billion in pretax unrealized mark-to-market gains or losses.
Unrealized mark-to-market net gains related to the long-term hedging program are as follows:
| | | | | | | | | | | | |
| | | Year Ended December 31, | |
| | | 2010 | | | 2009 | | | 2008 | |
Effect of natural gas market price changes on open positions | | $ | 2,317 | | | $ | 1,857 | | | $ | 2,483 | |
Reversals of previously recorded amounts on positions settled | | | (1,152 | ) | | | (750 | ) | | | 104 | |
| | | | | | | | | | | | |
Total unrealized effect (pre-tax) | | $ | 1,165 | | | $ | 1,107 | | | $ | 2,587 | |
| | | | | | | | | | | | |
The cumulative unrealized mark-to-market net gain related to positions in the long-term hedging program totaled $3.143 billion and $1.978 billion as of December 31, 2010 and 2009, respectively. See discussion below under “Results of Operations” for realized net gains from hedging activities, which amounts are largely related to the long-term hedging program.
Given the volatility of natural gas prices, it is not possible to predict future reported unrealized mark-to-market gains or losses and the actual gains or losses that will ultimately be realized upon settlement of the hedge positions in future years. If natural gas prices at settlement are lower than the prices of the hedge positions, the hedges are expected to mitigate the otherwise negative effect on earnings of lower wholesale electricity prices. However, if natural gas prices at settlement are higher than the prices of the hedge positions, the hedges are expected to dampen the otherwise positive effect on earnings of higher wholesale electricity prices and will in this context be viewed as having resulted in an opportunity cost.
49
The significant cumulative unrealized mark-to-market net gain related to positions in the long-term hedging program reflects declining forward market natural gas prices. Forward natural gas prices have generally trended downward since mid-2008 as shown in the table of forward NYMEX Henry Hub natural gas prices below. While the long-term hedging program is designed to mitigate the effect on earnings of low wholesale electricity prices, depressed forward natural gas prices are challenging to the long-term profitability of our generation assets. Specifically, these lower natural gas prices and the correlated effect in ERCOT on wholesale power prices could have a material adverse impact on the overall profitability of our generation assets for periods in which we have less significant hedge positions (i.e., beginning in 2013). In addition, a continuation or worsening of these market conditions would limit our ability to hedge our wholesale electricity revenues at sufficient price levels to support our interest payments and debt maturities and could adversely impact our ability to refinance the TCEH Revolving Credit Facility that matures in October 2013 and/or our substantial long-term debt that matures in 2014.
Also see discussion below regarding the goodwill impairment charge recorded in the third quarter 2010.
| | | | | | | | | | | | | | | | | | | | |
| | | Forward Market Prices for Calendar Year ($/MMBtu) (a) | |
Date | | 2010 (b) | | | 2011 | | | 2012 | | | 2013 | | | 2014 | |
June 30, 2008 | | $ | 11.24 | | | $ | 10.78 | | | $ | 10.74 | | | $ | 10.90 | | | $ | 11.12 | |
September 30, 2008 | | $ | 8.58 | | | $ | 8.54 | | | $ | 8.41 | | | $ | 8.30 | | | $ | 8.30 | |
December 31, 2008 | | $ | 7.13 | | | $ | 7.31 | | | $ | 7.23 | | | $ | 7.15 | | | $ | 7.15 | |
March 31, 2009 | | $ | 5.93 | | | $ | 6.67 | | | $ | 6.96 | | | $ | 7.11 | | | $ | 7.18 | |
June 30, 2009 | | $ | 6.06 | | | $ | 6.89 | | | $ | 7.16 | | | $ | 7.30 | | | $ | 7.43 | |
September 30, 2009 | | $ | 6.21 | | | $ | 6.87 | | | $ | 7.00 | | | $ | 7.06 | | | $ | 7.17 | |
December 31, 2009 | | $ | 5.79 | | | $ | 6.34 | | | $ | 6.53 | | | $ | 6.67 | | | $ | 6.84 | |
March 31, 2010 | | $ | 4.27 | | | $ | 5.34 | | | $ | 5.79 | | | $ | 6.07 | | | $ | 6.36 | |
June 30, 2010 | | $ | 4.82 | | | $ | 5.34 | | | $ | 5.68 | | | $ | 5.89 | | | $ | 6.10 | |
September 30, 2010 | | $ | 3.94 | | | $ | 4.44 | | | $ | 5.07 | | | $ | 5.29 | | | $ | 5.42 | |
December 31, 2010 | | $ | — | | | $ | 4.55 | | | $ | 5.08 | | | $ | 5.33 | | | $ | 5.49 | |
| (a) | Based on NYMEX Henry Hub prices. |
| (b) | For September 30, 2010, June 30, 2010 and March 31, 2010, natural gas prices for 2010 represent the average of forward prices for October through December, July through December and April through December, respectively. |
As of December 31, 2010, more than 95% of the long-term hedging program transactions were directly or indirectly secured by a first-lien interest in TCEH’s assets (including the transactions supported by the TCEH Commodity Collateral Posting Facility – see discussion below under “Financial Condition — Liquidity and Capital Resources”) thereby reducing the cash and letter of credit collateral requirements for the hedging program.
See discussion below under “Key Risks and Challenges,” specifically, “Substantial Leverage, Uncertain Financial Markets and Liquidity Risk” and “Natural Gas Price and Market Heat Rate Exposure.”
Impairment of Goodwill— In the third quarter 2010, we recorded a $4.1 billion noncash goodwill impairment charge (which was not deductible for income tax purposes) related to the Competitive Electric segment. The write-off reflected the estimated effect of lower wholesale power prices on the enterprise value of the Competitive Electric segment, driven by the sustained decline in forward natural gas prices as discussed above. Recorded goodwill related to the Competitive Electric segment totaled $6.2 billion as of December 31, 2010.
The noncash impairment charge did not cause EFH Corp. or its subsidiaries to be in default under any of their respective debt covenants or impact counterparty trading agreements or have a material impact on liquidity.
See Note 4 to Financial Statements and “Application of Critical Accounting Policies” below for more information on goodwill impairment charges.
50
Liability Management Program — As of December 31, 2010, EFH Corp. and its subsidiaries (excluding Oncor and its subsidiaries) had $35.5 billion aggregate principal amount of long-term debt outstanding. The majority of that amount matures during the period 2014 to 2017, and the TCEH Revolving Credit Facility matures in October 2013. In October 2009, we implemented a liability management program focused on improving our balance sheet by reducing debt and extending debt maturities through debt exchanges, repurchases and issuances. Activities under the liability management program do not include debt issued by Oncor or its subsidiaries.
The following table details our debt exchange and repurchase activities in the year ended December 31, 2010 and since the inception of our liability management program in October 2009 (debt amounts are principal amounts):
| | | | | | | | | | | | | | | | |
| | | Year Ended
December 31, 2010 | | | Since Inception | |
Security | | Debt
Acquired | | | Debt Issued/
Cash Paid | | | Debt
Acquired | | | Debt Issued/
Cash Paid | |
EFH Corp 10.875% Notes due 2017 | | $ | 1,472 | | | $ | — | | | $ | 1,641 | | | $ | — | |
EFH Corp. Toggle Notes due 2017 | | | 2,420 | | | | — | | | | 2,432 | | | | — | |
EFH Corp. 5.55% Series P Senior Notes due 2014 | | | 549 | | | | — | | | | 566 | | | | — | |
EFH Corp. 6.50% Series Q Senior Notes due 2024 | | | — | | | | — | | | | 10 | | | | — | |
EFH Corp. 6.55% Series R Senior Notes due 2034 | | | — | | | | — | | | | 6 | | | | — | |
TCEH 10.25% Notes due 2015 | | | 1,692 | | | | — | | | | 1,835 | | | | — | |
TCEH Toggle Notes due 2016 | | | 751 | | | | — | | | | 751 | | | | — | |
Term Loans under the TCEH Senior Secured Facilities due 2014 | | | 20 | | | | — | | | | 20 | | | | — | |
EFH Corp. and EFIH 9.75% Notes due 2019 | | | — | | | | — | | | | — | | | | 256 | |
EFH Corp 10% Notes due 2020 | | | — | | | | 561 | | | | — | | | | 561 | |
EFIH 10% Notes due 2020 | | | — | | | | 2,180 | | | | — | | | | 2,180 | |
TCEH 15% Notes due 2021 | | | — | | | | 1,221 | | | | — | | | | 1,221 | |
Cash paid, including use of proceeds from debt issuances in 2010 (a) | | | — | | | | 1,042 | | | | — | | | | 1,042 | |
| | | | | | | | | | | | | | | | |
Total | | $ | 6,904 | | | $ | 5,004 | | | $ | 7,261 | | | $ | 5,260 | |
| | | | | | | | | | | | | | | | |
| (a) | Includes $95 million of the proceeds from the issuance of $500 million principal amount of EFH Corp. 10% Notes in January 2010 and $290 million of the proceeds from the issuance of $350 million principal amount of TCEH 15% Senior Secured Second Lien Notes in October 2010. |
Since inception, the transactions resulted in the capture of $2 billion of debt discount and aggregate projected interest savings (pre-tax) over five years of approximately $1.2 billion, the majority of which represents interest on the EFH Corp. and TCEH Toggle Notes.
No liability management transactions were completed in 2011 through February 15.
See Note 11 to Financial Statements for further discussion of the transactions completed under our liability management program.
51
Wholesale Market Design – Nodal Market — In accordance with a rule adopted by the PUCT in 2003, ERCOT developed a new wholesale market, using a stakeholder process, designed to assign congestion costs to the market participants causing the congestion. The nodal market design was implemented December 1, 2010. Under this new market design, ERCOT:
| | • | | establishes nodes, which are metered locations across the ERCOT grid, for purposes of more granular price determination; |
| | • | | operates a voluntary “day-ahead electricity market” for forward sales and purchases of electricity and other related transactions, in addition to the existing “real-time market” that primarily functions to balance power consumption and generation; |
| | • | | establishes hub trading prices, which represent the average of certain node prices within four major geographic regions, at which participants can hedge or trade power under bilateral contracts; |
| | • | | establishes pricing for load-serving entities based on weighted-average node prices within new geographical load-zones, and |
| | • | | provides congestion revenue rights, which are instruments auctioned by ERCOT that allow market participants to hedge price differences between settlement points. |
ERCOT previously had a zonal wholesale market structure consisting of four geographic zones. The new location-based congestion-management market is referred to as a “nodal” market because wholesale pricing differs across the various nodes on the transmission grid instead of across the geographic zones. There are over 500 nodes in the ERCOT market. The nodal market design was implemented in conjunction with transmission improvements designed to reduce current congestion. We are fully certified to participate in both the “day-ahead” and “real-time markets.” Additionally, all of our operational and mothballed generation assets and our qualified scheduling entities are certified and operate in the nodal market. While the initial implementation of the nodal market has not had a material impact on our profitability, we cannot predict the ultimate impact of the market design on our operations or financial results, and it could ultimately have an adverse impact on the profitability and value of our competitive business and/or our liquidity, particularly if such change ultimately results in lower revenue due to lower wholesale power prices, increased costs to service end-user electricity demand or increased collateral posting requirements with ERCOT. The opening of the nodal market resulted in an increase of approximately $200 million in the amount of letters of credit posted with ERCOT to support our market participation.
As discussed above, the nodal market design includes the establishment of a “day-ahead market” and hub trading prices to facilitate hedging and trading of electricity by participants. Under the previous zonal market, volumes under our nontrading bilateral purchase and sales contracts, including contracts intended as hedges, were scheduled as physical power with ERCOT and, therefore, reported gross as wholesale revenues or purchased power costs. In conjunction with the transition to the nodal market, unless the volumes represent physical deliveries to retail and wholesale customers or purchases from counterparties, these contracts are reported on a net basis in the income statement in net gain/(loss) from commodity hedging and trading activities. As a result of these changes, reported wholesale revenues and purchased power costs in 2011 will be materially less than amounts reported in prior periods.
TCEH Interest Rate Swap Transactions— As of December 31, 2010, TCEH had entered into a series of interest rate swaps that effectively fix the interest rates at between 7.3% and 8.3% on $15.80 billion principal amount of its senior secured debt maturing from 2011 to 2014. Swaps related to an aggregate $500 million principal amount of debt expired in 2010, and no swaps were entered into in 2010. Taking into consideration these swap transactions, 13% of our total long-term debt portfolio as of December 31, 2010 was exposed to variable interest rate risk. As of December 31, 2010, TCEH also entered into interest rate basis swap transactions, which further reduce the fixed (through swaps) borrowing costs, related to an aggregate of $15.20 billion principal amount of senior secured debt, including swaps entered into in 2010 related to $2.55 billion principal amount of debt. Swaps related to an aggregate $3.60 billion principal amount of debt expired in 2010. We may enter into additional interest rate hedges from time to time.
52
Unrealized mark-to-market net gains and losses related to all TCEH interest rate swaps, which are reported in interest expense and related charges, totaled $207 million in net losses for the year ended December 31, 2010 and $696 million in net gains for the year ended December 31, 2009. The cumulative unrealized mark-to-market net liability related to all TCEH interest rate swaps totaled $1.419 billion and $1.212 billion as of December 31, 2010 and 2009, respectively, of which $105 million and $194 million (both pre-tax), respectively, was reported in accumulated other comprehensive income. These fair values can change materially as market conditions change, which could result in significant volatility in reported net income. See discussion in Note 11 to Financial Statements regarding interest rate swap transactions.
Texas Generation Facilities Development —TCEH has completed a program to develop three lignite-fueled generation units (2 units at Oak Grove and 1 unit at Sandow) in Texas with a total estimated capacity of approximately 2,200 MW. The Sandow and first Oak Grove units achieved substantial completion (as defined in the EPC agreement) in the fourth quarter 2009, and the second Oak Grove unit achieved substantial completion (as defined in the EPC agreement) in the second quarter 2010. We began depreciating the units and recognizing revenues and fuel costs for accounting purposes in those respective periods. Aggregate cash capital expenditures for these three units totaled approximately $3.25 billion including all construction, site preparation and mining development costs. Total recorded costs, including purchase accounting fair value adjustments and capitalized interest, totaled approximately $4.8 billion.
Idling of Natural Gas-Fueled Units — In December 2010, after receiving approval from ERCOT, we retired eight previously mothballed natural gas-fueled units totaling 2,633 MW of capacity (2,777 MW installed nameplate capacity). We also retired an additional natural gas-fueled unit with 112 MW of capacity (115 MW installed nameplate capacity) in December 2010 upon expiration of an RMR (operational standby) agreement (discussed below) related to the unit. No impairment was recorded as a result of the retirements. In September 2010, after receiving approval from ERCOT, we mothballed (idled) four of our natural gas-fueled units totaling 1,856 MW of capacity (1,933 MW installed nameplate capacity). In 2009 we retired 10 units totaling 2,114 MW of capacity (2,226 MW installed nameplate capacity), mothballed three units totaling 1,081 MW capacity (1,135 MW installed nameplate capacity) and entered into RMR agreements with ERCOT for two units totaling 627 MW capacity (655 MW installed nameplate capacity). Upon expiration of the RMR agreements in December 2010, we retired the unit discussed above and mothballed the other unit.
As of December 31, 2010, TCEH’s operational fleet of natural gas-fueled generation facilities, which are generally used as peaking resources, consists of 14 units totaling 2,187 MW installed nameplate capacity, excluding eight units operated for unaffiliated parties and four mothballed units.
Global Climate Change and Other Environmental Matters —See Items 1 and 2 “Business and Properties – Environmental Regulations and Related Considerations” for discussion of global climate change and various other environmental matters and their effects on the company.
Oncor Technology Initiatives— Oncor continues to invest in technology initiatives that include development of a modernized grid through the replacement of existing meters with advanced digital metering equipment and development of advanced digital communication, data management, real-time monitoring and outage detection capabilities. This modernized grid is expected to produce electricity service reliability improvements and provide the potential for additional products and services from REPs that will enable businesses and consumers to better manage their electricity usage and costs. Oncor’s plans provide for the full deployment of over three million advanced meters to all residential and most non-residential retail electricity customers in Oncor’s service area. The advanced meters can be read remotely, rather than by a meter reader physically visiting the location of each meter. Advanced meters facilitate automated demand side management, which allows consumers to monitor the amount of electricity they are consuming and adjust their electricity consumption habits.
As of December 31, 2010, Oncor has installed approximately 1,514,000 advanced digital meters, including approximately 854,000 during the year ended December 31, 2010. As the new meters are integrated, Oncor reports 15-minute interval, billing-quality electricity consumption data to ERCOT for market settlement purposes. The data makes it possible for REPs to support new programs and pricing options. Cumulative capital expenditures for the deployment of the advanced meter system totaled $360 million as of December 31, 2010. Oncor expects to complete installations of the remaining approximately 1.5 million advanced meters by the end of 2012.
Oncor Matters with the PUCT— See discussion of these matters, including the construction of CREZ-related transmission lines, below under “Regulatory Matters.”
53
KEY RISKS AND CHALLENGES
Following is a discussion of key risks and challenges facing management and the initiatives currently underway to manage such challenges. These matters involve risks that could have a material adverse effect on our results of operations, liquidity or financial condition.
Substantial Leverage, Uncertain Financial Markets and Liquidity Risk
Our substantial leverage, resulting in large part from debt incurred to finance the Merger, requires significant cash flows to be dedicated to interest and principal payments and could adversely affect our ability to raise additional capital to fund operations, limit our ability to react to changes in the economy, our industry or our business, and expose us to interest rate risk to the extent not hedged. Principal amounts of short-term borrowings and long-term debt, including amounts due currently, totaled $36.721 billion as of December 31, 2010. Taking into consideration interest-rate swap transactions, as of December 31, 2010 approximately 87% of our total long-term debt portfolio is subject to fixed interest rates, at a weighted average interest rate of 8.9%. Interest payments on long-term debt in 2011 are expected to total approximately $2.750 billion, and principal payments are expected to total $651 million.
While we believe our cash on hand and cash flow from operations combined with availability under existing credit facilities provide sufficient liquidity to fund current and projected expenses and capital requirements for 2011 (see “Financial Condition – Liquidity and Capital Resources” section below), there can be no assurance that counterparties to our credit facility and hedging arrangements will perform as expected and meet their obligations to us. Failure of such counterparties to meet their obligations or substantial changes in financial markets, the economy, regulatory requirements, our industry or our operations could result in constraints in our liquidity. While traditional counterparties with physical assets to hedge, as well as financial institutions and other parties, continue to participate in the markets, as a result of the financial crisis that arose in 2008, there has been a reduction of available counterparties for our hedging and trading activities, particularly for longer-dated transactions, which could impact our ability to hedge our commodity price and interest rate exposure to desired levels at reasonable costs. See discussion of credit risk in Item 7A, “Quantitative and Qualitative Disclosures About Market Risk,” discussion of available liquidity and liquidity effects of the long-term hedging program in “Financial Condition – Liquidity and Capital Resources” and discussion of potential impact of legislative rulemakings on the OTC derivatives market in “Significant Activities and Events – Financial Services Reform Legislation.”
In addition, as discussed above under “Significant Activities and Events – Natural Gas Prices and Long-Term Hedging Program,” a continuation or worsening of low forward natural gas prices (and the related low wholesale electricity prices in ERCOT) could also limit our ability to hedge our wholesale electricity revenues at sufficient price levels to support our interest payments and debt maturities, result in further declines in the value of our baseload generation assets and adversely impact our efforts to refinance our substantial debt as discussed immediately below.
The TCEH Revolving Credit Facility matures in October 2013, and a substantial amount of our long-term debt matures in the period from 2014 through 2017. We are focused on improving the balance sheet and expect to opportunistically look for ways to reduce the amount, and extend the maturity, of our outstanding debt. Progress to date on this initiative includes the debt exchanges, issuances and repurchases completed in 2010 and 2009 discussed above under “Significant Activities and Events – Liability Management Program” and the August 2009 amendment to the Credit Agreement governing the TCEH Senior Secured Facilities that provided additional flexibility in restructuring debt obligations. See Note 11 to Financial Statements for additional discussion of these transactions.
In addition, because our operations are capital intensive, we expect to rely over the long-term upon access to financial markets as a significant source of liquidity for capital requirements not satisfied by cash-on-hand, operating cash flows or our available credit facilities. Our ability to economically access the capital or credit markets could be restricted at a time when we would like, or need, to access those markets. Lack of such access could have an impact on our flexibility to react to changing economic and business conditions.
54
Natural Gas Price and Market Heat-Rate Exposure
Wholesale electricity prices in the ERCOT market generally move with the price of natural gas because marginal demand for electricity supply is generally met with natural gas-fueled generation facilities. Historically the price of natural gas has fluctuated due to changes in industrial demand, supply availability, weather effects and other economic and market factors and such prices have been very volatile in recent years. Since 2005, forward natural gas prices ranged from above $13 per MMBtu to below $4 per MMBtu. More recent declines in forward natural gas prices reflect discovery and increased drilling of shale gas deposits combined with lingering demand weakness associated with the economic recession. The wholesale market price of electricity divided by the market price of natural gas represents the market heat rate. Market heat rate movements also affect wholesale electricity prices. Market heat rate can be affected by a number of factors including the efficiency of the marginal supplier (generally natural gas-fueled generation facilities) in generating electricity.
In contrast to our natural gas-fueled generation facilities, changes in natural gas prices have no significant effect on the cost of generating electricity from our nuclear and lignite/coal-fueled facilities. All other factors being equal, these baseload generation assets, which provided the substantial majority of supply volumes in 2010, increase or decrease in value as natural gas prices and market heat rates rise or fall, respectively, because of the effect on wholesale electricity prices in ERCOT.
With the exposure to variability of natural gas prices, retail sales price management and hedging activities are critical to the profitability of the business and maintaining consistent cash flow levels.
Our approach to managing electricity price risk focuses on the following:
| | • | | employing disciplined hedging and risk management strategies through physical and financial energy-related (electricity and natural gas) contracts intended to partially hedge gross margins; |
| | • | | continuing focus on cost management to better withstand gross margin volatility; |
| | • | | following a retail pricing strategy that appropriately reflects the magnitude and costs of commodity price and liquidity risk, and |
| | • | | improving retail customer service to attract and retain high-value customers. |
As discussed above in “Significant Activities and Events,” we have implemented a long-term hedging program to mitigate the risk of lower wholesale electricity prices due to declines in natural gas prices.
The following sensitivity table provides estimates of the potential impact (in $ millions) of movements in natural gas and certain other commodity prices and market heat rates on realized pre-tax earnings for the periods presented. The estimates related to price sensitivity are based on TCEH’s unhedged position and forward prices as of December 31, 2010, which for natural gas reflects estimates of electricity generation less amounts hedged through the long-term natural gas hedging program and amounts under existing wholesale and retail sales contracts. On a rolling twelve-month basis, the substantial majority of retail sales under month-to-month arrangements are deemed to be under contract.
| | | | | | | | | | | | | | | | |
| | | Balance 2011(a) | | | 2012 | | | 2013 | | | 2014 | |
$1.00/MMBtu change in gas price (b) | | $ | ~5 | | | $ | ~80 | | | $ | ~305 | | | $ | ~490 | |
0.1/MMBtu/MWh change in market heat rate (c) | | $ | ~4 | | | $ | ~32 | | | $ | ~44 | | | $ | ~46 | |
$1.00/gallon change in diesel fuel price | | $ | — | | | $ | ~1 | | | $ | ~48 | | | $ | ~40 | |
| (a) | Balance of 2011 is from February 1, 2011 through December 31, 2011 |
| (b) | Assumes conversion of electricity positions based on an approximate 8.0 market heat rate with natural gas being on the margin 75% to 90% of the time (i.e., when coal is forecast to be on the margin, no natural gas position is assumed to be generated). |
| (c) | Based on Houston Ship Channel natural gas prices as of December 31, 2010. |
55
Our market heat rate exposure is impacted by changes in the mix of generation assets resulting from generation capacity changes such as additions and retirements of generation facilities. Increased wind generation capacity could result in lower market heat rates. We expect that decreases in market heat rates would decrease the value of our generation assets because lower market heat rates generally result in lower wholesale electricity prices, and vice versa. We mitigate market heat rate risk through retail and wholesale electricity sales contracts and shorter-term market heat rate hedging transactions. We evaluate opportunities to mitigate market heat rate risk over extended periods through longer-term electricity sales contracts where practical considering pricing, credit, liquidity and related factors.
On an ongoing basis, we will continue monitoring our overall commodity risks and seek to balance our portfolio based on our desired level of exposure to natural gas prices and market heat rates and potential changes to our operational forecasts of overall generation and consumption (which is also subject to volatility resulting from customer churn, weather, economic and other factors) in our native and growth business. Portfolio balancing may include the execution of incremental transactions, including heat rate hedges, the unwinding of existing transactions and the substitution of natural gas hedges with commitments for the sale of electricity at fixed prices. As a result, commodity price exposures and their effect on earnings could materially change from time to time.
Competitive Retail Markets and Customer Retention
Competitive retail activity in Texas has resulted in retail customer churn. Our total retail customer counts rose 2% in 2008 but declined 3% in 2009 and 6% in 2010. Based upon 2010 results discussed below in “Results of Operations – Competitive Electric Segment,” a 1% decline in residential customers would result in a decline in annual revenues of approximately $40 million. In responding to the competitive landscape in the ERCOT marketplace, we are focusing on the following key initiatives:
| | • | | Maintaining competitive pricing initiatives as evidenced by price reductions on most residential service plans; |
| | • | | Profitably growing the retail customer base by actively competing for new and existing customers in areas in Texas open to competition. The customer retention strategy remains focused on continuing to implement initiatives to deliver world-class customer service and improve the overall customer experience; |
| | • | | Establishing TXU Energy as the most innovative retailer in the Texas market by continuing to develop tailored product offerings to meet customer needs. TXU Energy plans to invest $100 million over the five-year period beginning in 2008 (including $39 million invested through 2010) in retail initiatives aimed at helping consumers conserve energy and other demand-side management initiatives that are intended to moderate consumption and reduce peak demand for electricity, and |
| | • | | Focusing business market initiatives largely on programs targeted to retain the existing highest-value customers and to recapture customers who have switched REPs. Initiatives include maintaining and continuously refining a disciplined contracting and pricing approach and economic segmentation of the business market to enhance targeted sales and marketing efforts and to more effectively deploy the direct-sales force. Tactical programs put into place include improved customer service, aided by a new customer management system implemented in 2009, new product price/service offerings and a multichannel approach for the small business market. |
Volatile Energy Prices and Regulatory Risk
Natural gas prices rose to unprecedented levels in the latter part of 2005, reflecting a world-wide increase in energy prices compounded by hurricane-related infrastructure damage. The related rise in electricity prices elevated public awareness of energy costs and dampened customer demand. Natural gas prices remain subject to events that create price volatility, and while not reaching 2005 levels, forward natural gas prices rose substantially in 2007 and part of 2008 before falling in the second half of 2008 through most of 2010. Sustained high energy prices and/or ongoing price volatility also creates a risk for regulatory and/or legislative intervention with the mechanisms that govern the competitive wholesale and retail markets in ERCOT. We believe that competitive markets result in a broad range of innovative pricing and service alternatives to consumers and ultimately the most efficient use of resources and that regulatory entities should continue to take actions that encourage competition in the industry. Regulatory and/or legislative intervention could materially affect the competitive electricity industry in ERCOT, including disrupting the relationship between natural gas prices and electricity prices, which could materially impact the results of our long-term hedging program. (Also see “Regulatory Matters – Sunset Review.”) We continue to closely monitor any potential legislative and regulatory changes and work with legislators and regulators, providing them information on the market and related matters.
56
Financial Services Reform Legislation
In July 2010, financial reform legislation known as the Dodd-Frank Wall Street Reform and Consumer Protection Act (the Financial Reform Act) was enacted. The primary purposes of the Financial Reform Act are, among other things, to address systemic risk in the financial system; to establish a Bureau of Consumer Financial Protection with broad powers to enforce consumer protection laws and promulgate rules against unfair, deceptive or abusive practices; to enhance regulation of the derivatives markets, including the requirement for central clearing of over-the-counter derivative instruments and additional capital and margin requirements for certain derivative market participants; and to implement a number of new corporate governance requirements for companies with listed or, in some cases, publicly-traded securities. While the legislation is broad and detailed, substantial portions of the legislation are currently under rulemakings by federal governmental agencies to implement the standards set out in the legislation and adopt new standards. As a result, the full scope and effect of the legislation will likely not be known for several years.
Title VII of the Financial Reform Act provides for the regulation of the over-the-counter (OTC) derivatives market. The Financial Reform Act generally requires OTC derivatives (including the types of asset-backed OTC derivatives that we use to hedge risks associated with commodity and interest rate exposure) to be cleared by a derivatives clearing organization. However, entities are exempt from these clearing requirements if they (i) are not “Swap Dealers” or “Major Swap Participants” as will be defined in the rulemakings and (ii) use the swaps to hedge or mitigate commercial risk. The proposed definition of Swap Dealer is broad and will, as drafted, include many end users. We are evaluating whether or not the type of asset-backed OTC derivatives that we use to hedge commodity and interest rate risk is exempt from the clearing requirements. Existing swaps are grandfathered from the clearing requirements. The legislation mandates significant reporting and compliance requirements for any entity that is determined to be a Swap Dealer or Major Swap Participant.
The Financial Reform Act also requires the posting of cash collateral for uncleared swaps. Because these cash collateral requirements are unclear as to whether an end-user or its counterparty (e.g., swap dealer) is required to post cash collateral, there is a risk that the cash collateral requirement could be used to effectively negate the end-user clearing exemption. However, the legislative history of the Financial Reform Act suggests that it was not Congress’ intent to require end-users to post cash collateral with respect to swaps. If we were required to post cash collateral on our swap transactions with swap dealers, our liquidity would likely be materially impacted, and our ability to enter into OTC derivatives to hedge our commodity and interest rate risks would be significantly limited.
We cannot predict the outcome of the rulemakings to implement the OTC derivative market provisions of the Financial Reform Act. These rulemakings could negatively affect our ability to hedge our commodity and interest rate risks. Accordingly, we continue to closely monitor the rulemakings and any other potential legislative and regulatory changes and work with regulators and legislators, providing them information on our operations, the types of transactions in which we engage, our concerns regarding potential regulatory impacts, market characteristics and related matters.
New and Changing Environmental Regulations
We are subject to various environmental laws and regulations related to SO2, NOx and mercury as well as other emissions that impact air and water quality. We believe we are in compliance with all current laws and regulations, but regulatory authorities continue to evaluate existing requirements and consider proposals for changes. If we make any major modifications to our power generation facilities, we may be required to install the best available control technology or to achieve the lowest achievable emission rates as such terms are defined under the new source review provisions of the Clean Air Act. Any such modifications would likely result in substantial additional capital expenditures. (See Note 12 to Financial Statements for discussion of “Litigation Related to Generation Facilities,” “Regulatory Reviews” and “Environmental Contingencies.”)
57
We also continue to closely monitor any potential legislative, regulatory and judicial changes pertaining to global climate change. In view of the fact that a substantial portion of our generation portfolio consists of lignite/coal-fueled generation facilities, our results of operations, liquidity or financial condition could be materially adversely affected by the enactment of any legislation, regulation or judicial action that mandates a reduction in GHG emissions or that imposes financial penalties, costs or taxes on entities that produce GHG emissions, or that establishes federal renewable energy portfolio standards. For example, federal, state or regional legislation or regulation addressing global climate change could result in us either incurring increased material costs to reduce our GHG emissions or to procure emission allowances or credits to comply with a mandatory cap-and-trade emissions reduction program. See further discussion under Items 1 and 2, “Business and Properties – Environmental Regulations and Related Considerations.”
Exposures Related to Nuclear Asset Outages
Our nuclear assets are comprised of two generation units at Comanche Peak, each with an installed nameplate capacity of 1,150 MW. The Comanche Peak plant represents approximately 15% of our total generation capacity. The nuclear generation units represent our lowest marginal cost source of electricity. Assuming both nuclear generation units experienced an outage, the unfavorable impact to pretax earnings is estimated (based upon market prices as of December 31, 2010) to be approximately $2 million per day before consideration of any insurance proceeds. Also see discussion of nuclear facilities insurance in Note 12 to Financial Statements.
The inherent complexities and related regulations associated with operating nuclear generation facilities result in environmental, regulatory and financial risks. The operation of nuclear generation facilities is complex and subject to continuing review and regulation by the NRC, covering, among other things, operations, maintenance, emergency planning, security, and environmental and safety protection. The NRC may implement changes in regulations that result in increased capital or operating costs, and it may require extended outages, modify, suspend or revoke operating licenses and impose fines for failure to comply with its existing regulations and the provisions of the Atomic Energy Act. In addition, an unplanned outage at another nuclear generation facility could result in the NRC taking action to shut down the Comanche Peak plant as a precautionary measure.
We participate in industry groups and with regulators to remain current on the latest developments in nuclear safety, operation and maintenance and on emerging threats and mitigating techniques. These groups include, but are not limited to, the NRC and the Institute of Nuclear Power Operations (INPO). We also apply the knowledge gained by continuing to invest in technology, processes and services to improve our operations and detect, mitigate and protect our nuclear generation assets. The Comanche Peak plant has not experienced an extended unplanned outage, and management continues to focus on the safe, reliable and efficient operations at the plant.
Oncor’s Ring-Fencing and Credit Risk
Our investment in Oncor, which represents approximately 80% of its membership interests, is a significant value driver of our overall business. Oncor’s access to capital markets and cost of debt could be directly affected by its credit ratings. Any adverse action with respect to Oncor’s credit ratings would generally cause borrowing costs to increase and the potential pool of investors and funding sources to decrease. Oncor’s credit ratings are currently substantially higher than those of the Texas Holdings Group. If credit rating agencies were to change their views of Oncor’s independence from any member of the Texas Holdings Group, Oncor’s credit ratings would likely decline. This risk is substantially mitigated by the ring-fencing measures as described in Note 1 to Financial Statements.
58
Cyber Security and Infrastructure Protection Risk
A breach of cyber/data security measures that impairs our information technology infrastructure could disrupt normal business operations and affect our ability to control our generation and transmission assets, access retail customer information and limit communication with third parties. Any loss of confidential or proprietary data through a breach could materially and adversely affect our reputation, expose the company to legal claims or impair our ability to execute on business strategies.
We participate in industry groups and with regulators to remain current on emerging threats and mitigating techniques. These groups include, but are not limited to: the US Cyber Emergency Response Team, the National Electric Sector Cyber Security Organization, the NRC and NERC. We also apply the knowledge gained by continuing to invest in technology, processes and services to detect, mitigate and protect our cyber assets. These investments include upgrades to network architecture, regular intrusion detection monitoring and compliance with emerging industry regulation.
APPLICATION OF CRITICAL ACCOUNTING POLICIES
Our significant accounting policies are discussed in Note 1 to Financial Statements. We follow accounting principles generally accepted in the US. Application of these accounting policies in the preparation of our consolidated financial statements requires management to make estimates and assumptions about future events that affect the reporting of assets and liabilities at the balance sheet dates and revenues and expenses during the periods covered. The following is a summary of certain critical accounting policies that are impacted by judgments and uncertainties and under which different amounts might be reported using different assumptions or estimation methodologies.
Purchase Accounting
In 2007, the Merger was accounted for under purchase accounting, whereby the purchase price of the transaction was allocated to our identifiable assets acquired and liabilities assumed based upon their fair values. The estimates of the fair values recorded were determined based on the principles in accounting standards related to the determination of fair value (see Note 15 to Financial Statements) and reflect significant assumptions and judgments. Material valuation inputs for long-lived assets and liabilities included forward electricity and natural gas price curves and market heat rates, discount rates, nonperformance risk adjustments related to liabilities, retail customer attrition rates, generation plant operating and construction costs and asset lives. The valuations reflected considerations unique to the competitive wholesale power market in ERCOT as well as our assets. For example, the valuation of the baseload generation facilities considered our lignite fuel reserves and mining capabilities.
The results of the purchase price allocation included an increase in the total carrying value of our baseload generation plants and the recording of intangible assets related to the retail customer base, the TXU Energy trade name and emission credits. Further, commodity and other contracts not already subject to fair value accounting were valued, and amounts representing favorable or unfavorable contracts (versus market conditions as of the date of the Merger) were recorded as intangible assets or liabilities, respectively. Management believes all material intangible assets were identified. See Note 4 to Financial Statements for details of the intangible assets recorded.
With respect to Oncor, the realization of its assets and settlement of its liabilities are largely subject to cost-based regulatory rate-setting processes. Accordingly, the historical carrying values of a majority of Oncor’s assets and liabilities were deemed to represent fair values. See discussion in Note 24 to Financial Statements regarding adjustments to the carrying values of Oncor’s regulatory asset and related long-term debt.
59
The excess of the purchase price over the estimated fair values of the net assets acquired was recorded as goodwill. The goodwill amount recorded upon finalization of purchase accounting totaled $23.2 billion. Management believes the drivers of the goodwill amount included the incremental value of the future cash flow potential of the baseload generation facilities, including facilities under construction, over the values assigned to those assets under purchase accounting rules, considering the market-pricing mechanisms and growth potential in the ERCOT market, as well as the value derived from the scale of the retail business. Management also believes that the goodwill reflected the value of the relatively stable, long-lived cash flows of the regulated business, considering the constructive regulatory environment and market growth potential. In accordance with accounting guidance related to goodwill and other intangible assets, goodwill is not amortized to net income, but is required to be tested for impairment at least annually. This guidance requires that goodwill be assigned to “reporting units,” which management has determined to be the Competitive Electric segment and the Regulated Delivery segment, which are almost entirely comprised of TCEH and Oncor, respectively. The assignment of goodwill was based on the relative estimated enterprise values of the operations as of the date of the Merger. Goodwill amounts assigned totaled $18.3 billion to the Competitive Electric segment and $4.9 billion to the Regulated Delivery segment. None of this goodwill balance is being deducted for tax purposes.
In the third quarter 2010, we recorded a goodwill impairment charge related to the Competitive Electric segment totaling $4.1 billion. In the first quarter 2009 and fourth quarter 2008, we recorded goodwill impairment charges totaling $8.950 billion, of which $8.070 billion related to the Competitive Electric segment. The $90 million charge in the first quarter 2009 resulted from the completion of the previously estimated fair value calculations supporting the initial $8.860 billion goodwill impairment charge that was recorded in the fourth quarter 2008. See discussion immediately below under “Impairment of Goodwill and Other Long-Lived Assets.”
Impairment of Goodwill and Other Long-Lived Assets
We evaluate long-lived assets (including intangible assets with finite lives) for impairment, in accordance with accounting standards related to impairment or disposal of long-lived assets, whenever events or changes in circumstances indicate that their carrying amount may not be recoverable. One of those indications is a current expectation that “more likely than not” a long-lived asset will be sold or otherwise disposed of significantly before the end of its previously estimated useful life (as was the case for the natural gas-fueled generation assets in 2008 discussed below). For our baseload generation assets, another possible indication would be an expected long-term decline in natural gas prices and/or market heat rates. We evaluate investments in unconsolidated subsidiaries for impairment when factors indicate that a decrease in the value of the investment has occurred that is not temporary. Indications of a loss in value might include a series of operating losses of the investee or a fair value of the investment that is less than its carrying amount. The determination of the existence of these and other indications of impairment involves judgments that are subjective in nature and may require the use of estimates in forecasting future results and cash flows related to an asset, group of assets or investment in unconsolidated subsidiary. Further, the unique nature of our property, plant and equipment, which includes a fleet of generation assets with a diverse fuel mix and individual plants that have varying production or output rates, requires the use of significant judgments in determining the existence of impairment indications and the grouping of assets for impairment testing.
Goodwill and intangible assets with indefinite useful lives are required to be tested for impairment at least annually (we have selected December 1) or whenever events or changes in circumstances indicate an impairment may exist, such as the possible impairments to long-lived assets discussed above. As required by accounting guidance related to goodwill and other intangible assets, we have allocated goodwill to our reporting units, which are our two segments: Competitive Electric and Regulated Delivery, and goodwill impairment testing is performed at the reporting unit level. (See Notes 1 and 3 to Financial Statements for discussion of the deconsolidation of Oncor Holdings as of January 1, 2010, which resulted in a reduction in reported goodwill for the amount related to the Regulated Delivery segment, and see above for discussion of impairment testing for equity-method investments such as Oncor Holdings.) Under this goodwill impairment analysis, if at the assessment date, a reporting unit’s carrying value exceeds its estimated fair value (enterprise value), the estimated enterprise value of the reporting unit is compared to the estimated fair values of the reporting unit’s operating assets (including identifiable intangible assets) and liabilities at the assessment date, and the resultant implied goodwill amount is then compared to the recorded goodwill amount. Any excess of the recorded goodwill amount over the implied goodwill amount is written off as an impairment charge.
60
The determination of enterprise value involves a number of assumptions and estimates. We use a combination of three fair value inputs to estimate enterprise values of our reporting units: internal discounted cash flow analyses (income approach), comparable company values and any recent pending and/or completed relevant transactions. The income approach involves estimates of future performance that reflect assumptions regarding, among other things, forward natural gas and electricity prices, market heat rates, generation plant performance and retail sales volume trends. Another key variable in the income approach is the discount rate, or weighted average cost of capital. The determination of the discount rate takes into consideration the capital structure, debt ratings and current debt yields of comparable companies as well as an estimate of return on equity that reflects historical market returns and current market volatility for the industry. Enterprise value estimates based on comparable company values involve using trading multiples of EBITDA of those selected companies to derive appropriate multiples to apply to the EBITDA of the reporting units. This approach requires an estimate, using historical acquisition data, of an appropriate control premium to apply to the reporting unit values calculated from such multiples. Critical judgments include the selection of comparable companies and the weighting of the three value inputs in developing the best estimate of enterprise value.
The 2010 annual impairment testing performed as of December 1, 2010 for goodwill and intangible assets with indefinite useful lives in accordance with accounting guidance resulted in no impairment. The goodwill testing determined that the carrying value of the Competitive Electric segment exceeded its estimated fair value (enterprise value), so the estimated enterprise value of the segment was compared to the estimated fair values of its operating assets and liabilities. This additional testing indicated that the recorded goodwill amount did not exceed the estimated implied goodwill amount, and thus no additional goodwill impairment was indicated beyond the charge recorded in the third quarter 2010 as discussed immediately below. Key variables in the tests included forward natural gas prices, electricity prices, market heat rates and discount rates, assumptions regarding each of which could have a significant effect on valuations. Because of the volatility of these factors, we cannot predict the likelihood of any future impairment.
See Note 4 to Financial Statements for a discussion of the goodwill impairment charges of $4.1 billion recorded in 2010 and $8.950 billion recorded largely in 2008. The total of $13.050 billion in impairment charges represented almost 60% of the goodwill balance resulting from purchase accounting for the Merger and reflected a decline of approximately 20% in the estimated enterprise value as of December 1, 2010 from the indicated value at the October 2007 Merger date. The impairment in 2010 reflected the estimated effect of lower wholesale power prices on the enterprise value of the Competitive Electric segment, driven by the sustained decline in forward natural gas prices. The impairment in 2008 primarily arose from the dislocation in the capital markets that increased interest rate spreads and the resulting discount rates used in estimating fair values and the effect of declines in market values of debt and equity securities of comparable companies in the second half of 2008. Also see Note 4 to Financial Statements for discussion of the impairment charge of $481 million ($310 million after-tax) related to the trade name intangible asset recorded in the fourth quarter 2008. The estimated fair value of this intangible asset is based on an assumed royalty methodology. Impairment charges totaling $501 million in 2008 related to environmental allowances and credits are also discussed in Note 4 to Financial Statements.
In 2008, we recorded an impairment charge of $229 million ($147 million after-tax) related to our natural gas-fueled generation facilities. The natural gas-fueled generation units are generally operated to meet peak demands for electricity, and the facilities were tested for impairment as an asset group. See Note 5 to Financial Statements for a discussion of the impairment. The estimated impairment was based on numerous judgments including forecasted production, forward prices of natural gas and electricity, overall generation availability in ERCOT and ERCOT grid congestion. See “Business – Significant Activities and Events” for discussion of natural gas-fueled units mothballed (idled) or retired in 2009 consistent with the factors that resulted in the impairment.
Derivative Instruments and Mark-to-Market Accounting
We enter into contracts for the purchase and sale of energy-related commodities, and also enter into other derivative instruments such as options, swaps, futures and forwards primarily to manage commodity price and interest rate risks. Under accounting standards related to derivative instruments and hedging activities, these instruments are subject to mark-to-market accounting, and the determination of market values for these instruments is based on numerous assumptions and estimation techniques.
61
Mark-to-market accounting recognizes changes in the fair value of derivative instruments in the financial statements as market prices change. Such changes in fair value are accounted for as unrealized mark-to-market gains and losses in net income with an offset to derivative assets and liabilities. The availability of quoted market prices in energy markets is dependent on the type of commodity (e.g., natural gas, electricity, etc.), time period specified and delivery point. In computing fair value for derivatives, each forward pricing curve is separated into liquid and illiquid periods. The liquid period varies by delivery point and commodity. Generally, the liquid period is supported by exchange markets, broker quotes and frequent trading activity. For illiquid periods, fair value is estimated based on forward price curves developed using modeling techniques that take into account available market information and other inputs that might not be readily observable in the market. We estimate fair value as described in Note 15 to Financial Statements and discussed under “Fair Value Measurements” below.
Accounting standards related to derivative instruments and hedging activities allow for “normal” purchase or sale elections and hedge accounting designations at the inception of the contract, which generally eliminate or defer the requirement for mark-to-market recognition in net income and thus reduce the volatility of net income that can result from fluctuations in fair values. “Normal” purchases and sales are contracts that provide for physical delivery of quantities expected to be used or sold over a reasonable period in the normal course of business and are not subject to mark-to-market accounting if the election as normal is made. Hedge accounting designations are made with the intent to match the accounting recognition of the contract’s financial performance to that of the transaction the contract is intended to hedge.
Under hedge accounting, changes in fair value of instruments designated as cash flow hedges are recorded in other comprehensive income with an offset to derivative assets and liabilities to the extent the change in value is effective; that is, it mirrors the offsetting change in fair value of the forecasted hedged transaction. Changes in value that represent ineffectiveness of the hedge are recognized in net income immediately, and the effective portion of changes in fair value initially recorded in other comprehensive income are recognized in net income in the period that the hedged transactions are recognized. Although as of December 31, 2010, we do not have any derivatives designated as cash flow or fair value hedges, we continually assess potential hedge elections and could designate positions as cash flow hedges in the future. In March 2007, the instruments making up a significant portion of the long-term hedging program that were previously designated as cash flow hedges were dedesignated as allowed under accounting standards related to derivative instruments and hedging activities, and subsequent changes in their fair value are being marked-to-market in net income. In addition, in August 2008, interest rate swap transactions in effect at that time were dedesignated as cash flow hedges in accordance with accounting standards, and subsequent changes in their fair value are being marked-to-market in net income. See further discussion of the long-term hedging program and interest rate swap transactions under “Business – Significant Activities and Events.”
62
The following tables provide the effects on both net income and other comprehensive income of mark-to-market accounting for those derivative instruments that we have determined to be subject to fair value measurement under accounting standards related to derivative instruments and hedging activities.
| | | | | | | | | | | | |
| | | Year Ended December 31, | |
| | | 2010 | | | 2009 | | | 2008 | |
Amounts recognized in net income (loss) (after-tax): | | | | | | | | | | | | |
Unrealized net gains on positions marked-to-market in net income (a) | | $ | 1,257 | | | $ | 1,573 | | | $ | 518 | |
Unrealized net (gains) losses representing reversals of previously recognized fair values of positions settled in the period (a) | | | (607 | ) | | | (333 | ) | | | 25 | |
Unrealized ineffectiveness net losses on positions accounted for as cash flow hedges | | | — | | | | — | | | | (3 | ) |
Reversals of previously recognized unrealized net losses related to cash flow hedge positions settled in the period | | | 1 | | | | 1 | | | | — | |
| | | | | | | | | | | | |
Total | | $ | 651 | | | $ | 1,241 | | | $ | 540 | |
| | | | | | | | | | | | |
| | | |
Amounts recognized in other comprehensive income (after-tax): | | | | | | | | | | | | |
Net losses in fair value of positions accounted for as cash flow hedges | | $ | — | | | $ | (20 | ) | | $ | (183 | ) |
Net losses on cash flow hedge positions recognized in net income to offset hedged transactions | | | 59 | | | | 130 | | | | 122 | |
| | | | | | | | | | | | |
Total | | $ | 59 | | | $ | 110 | | | $ | (61 | ) |
| | | | | | | | | | | | |
| (a) | Amounts for 2010, 2009 and 2008 include $785 million, $788 million and $1.503 billion in net after-tax gains related to commodity positions, respectively, and $135 million in net after-tax losses, $452 million in net after-tax gains and $960 million in net after-tax losses related to interest rate swaps, respectively. |
The effect of mark-to-market and hedge accounting for derivatives on the balance sheet is as follows:
| | | | | | | | |
| | | December 31, | |
| | | 2010 | | | 2009 | |
Commodity contract assets | | $ | 4,705 | | | $ | 3,860 | |
Commodity contract liabilities | | $ | (1,608 | ) | | $ | (2,146 | ) |
Interest rate swap assets | | $ | 98 | | | $ | 64 | |
Interest rate swap liabilities | | $ | (1,544 | ) | | $ | (1,306 | ) |
Net accumulated other comprehensive loss included in shareholders’ equity (amounts after tax) | | $ | (69 | ) | | $ | (128 | ) |
We report derivative assets and liabilities in the balance sheet without taking into consideration netting arrangements we have with counterparties. Margin deposits that contractually offset these assets and liabilities are reported separately in the balance sheet. See Note 15 to Financial Statements.
63
Fair Value Measurements
We determine value under the fair value hierarchy established in accounting standards. We utilize several valuation techniques to measure the fair value of assets and liabilities, relying primarily on the market approach of using prices and other market information for identical and/or comparable assets and liabilities for those items that are measured on a recurring basis. These techniques include, but are not limited to, the use of broker quotes and statistical relationships between different price curves and are intended to maximize the use of observable inputs and minimize the use of unobservable inputs. In applying the market approach, we use a mid-market valuation convention (the mid-point between bid and ask prices) as a practical expedient.
Under the fair value hierarchy, Level 1 and Level 2 valuations generally apply to our commodity-related contracts for natural gas and electricity derivative instruments entered into for hedging purposes, securities associated with the nuclear decommissioning trust, and interest rate swaps intended to fix and/or lower interest payments on long-term debt. Level 1 valuations use quoted prices in active markets for identical assets or liabilities that are accessible at the measurement date. Level 2 valuations are based on evaluated prices that reflect observable market information, such as actual trade information of similar securities, adjusted for observable differences. Level 2 inputs include:
| | • | | quoted prices for similar assets or liabilities in active markets; |
| | • | | quoted prices for identical or similar assets or liabilities in markets that are not active; |
| | • | | inputs other than quoted prices that are observable for the asset or liability such as interest rates and yield curves observable at commonly quoted intervals, and |
| | • | | inputs that are derived principally from or corroborated by observable market data by correlation or other means. |
Examples of Level 2 valuation inputs utilized include over-the-counter broker quotes and quoted prices for similar assets or liabilities that are corroborated by correlation or through statistical relationships between different price curves. For example, certain physical power derivatives are executed for a particular location at specific time periods that might not have active markets; however, an active market might exist for such derivatives for a different time period at the same location. We utilize correlation techniques to compare prices for inputs at both time periods to provide a basis to value the non-active derivative. (See Note 15 to Financial Statements for additional discussion of how broker quotes are utilized.)
Level 3 valuations generally apply to our more complex long-term power purchases and sales agreements, including longer-term wind and other power purchase and sales contracts and certain natural gas positions (collars) in the long-term hedging program. Level 3 valuations use largely unobservable inputs, with little or no supporting market activity, and assets and liabilities are classified as Level 3 if such inputs are significant to the fair value determination. We use the most meaningful information available from the market, combined with our own internally developed valuation methodologies, to develop our best estimate of fair value. The determination of fair value for Level 3 assets and liabilities requires significant management judgment and estimation.
Valuations of Level 3 assets and liabilities are sensitive to the assumptions used for the significant inputs. Where market data is available, the inputs used for valuation reflect that information as of our valuation date. In periods of extreme volatility, lessened liquidity or in illiquid markets, there may be more variability in market pricing or a lack of market data to use in the valuation process. An illiquid market is one in which little or no observable activity has occurred or one that lacks willing buyers. Valuation risk is mitigated through the performance of stress testing of the significant inputs to understand the impact that varying assumptions may have on the valuation and other review processes performed to ensure appropriate valuation.
As part of our valuation of assets subject to fair value accounting, counterparty credit risk is taken into consideration by measuring the extent of netting arrangements in place with the counterparty along with credit enhancements and the estimated credit rating of the counterparty. Our valuation of liabilities subject to fair value accounting takes into consideration the market’s view of our credit risk along with the existence of netting arrangements in place with the counterparty and credit enhancements posted by us. We consider the credit risk adjustment to be a Level 3 input since judgment is used to assign credit ratings, recovery rate factors and default rate factors.
64
Level 3 assets totaled $401 million and $350 million as of December 31, 2010 and 2009, respectively, and represented approximately 8% of the assets measured at fair value, or less than 1% of total assets in both years. Level 3 liabilities totaled $59 million and $269 million as of December 31, 2010 and 2009, respectively, and represented approximately 2% and 8%, respectively, of the liabilities measured at fair value, or less than 1% of total liabilities.
Valuations of several of our Level 3 assets and liabilities are sensitive to changes in discount rates, option-pricing model inputs such as volatility factors and credit risk adjustments. As of December 31, 2010, a $5.00 per MWh change in electricity price assumptions across unobservable inputs would cause an approximate $5 million change in net Level 3 assets. A 10% change in coal price assumptions across unobservable inputs would cause an approximate $1 million change in net Level 3 assets. See Note 15 to Financial Statements for additional information about fair value measurements, including a table presenting the changes in Level 3 assets and liabilities for the twelve months ended December 31, 2010, 2009 and 2008.
Variable Interest Entities
A variable interest entity (VIE) is an entity with which we have a relationship or arrangement that indicates some level of control over the entity or results in economic risks to us. Determining whether or not to consolidate a VIE requires interpretation of accounting rules and their application to existing business relationships and underlying agreements. Amended accounting rules related to VIEs became effective January 1, 2010 and resulted in the deconsolidation of Oncor Holdings, which holds an approximate 80% interest in Oncor. In determining the appropriateness of consolidation of a VIE, we evaluate its purpose, governance structure, decision making processes and risks that are passed on to its interest holders. We also examine the nature of any related party relationships among the interest holders of the VIE and the rights granted to the interest holders of the VIE to determine whether we have the right or obligation to absorb profit and loss from the VIE and the power to direct the significant activities of the VIE. See Notes 2 and 3 to Financial Statements for our analysis of the Oncor relationship and information regarding our consolidated variable interest entities.
Revenue Recognition
Our revenue includes an estimate for unbilled revenue that represents estimated daily kWh consumption after the meter read date to the end of the period multiplied by the applicable billing rates. Estimated daily kWh usage is derived using historical kWh usage information adjusted for weather and other measurable factors affecting consumption. Calculations of unbilled revenues during certain interim periods are generally subject to more estimation variability because of seasonal changes in demand. Accrued unbilled revenues totaled $297 million, $546 million and $505 million as of December 31, 2010, 2009 and 2008, respectively.
Accounting for Contingencies
Our financial results may be affected by judgments and estimates related to loss contingencies. A significant contingency that we account for is the loss associated with uncollectible trade accounts receivable. The determination of such bad debt expense is based on factors such as historical write-off experience, aging of accounts receivable balances, changes in operating practices, regulatory rulings, general economic conditions, effects of hurricanes and other natural disasters and customers’ behaviors. Changes in customer count and mix due to competitive activity and seasonal variations in amounts billed add to the complexity of the estimation process. Historical results alone are not always indicative of future results, causing management to consider potential changes in customer behavior and make judgments about the collectability of accounts receivable. Bad debt expense, the substantial majority of which relates to our competitive retail operations, totaled $108 million, $113 million and $81 million for the years ended December 31, 2010, 2009 and 2008, respectively.
Litigation contingencies also may require significant judgment in estimating amounts to accrue. We accrue liabilities for litigation contingencies when such liabilities are considered probable of occurring and the amount is reasonably estimable. No significant amounts have been accrued for such contingencies during the three-year period ended December 31, 2010. See Item 3, “Legal Proceedings” for discussion of major litigation.
65
Accounting for Income Taxes
Our income tax expense and related balance sheet amounts involve significant management estimates and judgments. Amounts of deferred income tax assets and liabilities, as well as current and noncurrent accruals, involve judgments and estimates of the timing and probability of recognition of income and deductions by taxing authorities. In assessing the likelihood of realization of deferred tax assets, management considers estimates of the amount and character of future taxable income. Actual income taxes could vary from estimated amounts due to the future impacts of various items, including changes in income tax laws, our forecasted financial condition and results of operations in future periods, as well as final review of filed tax returns by taxing authorities. Our income tax returns are regularly subject to examination by applicable tax authorities. In management’s opinion, the liability recorded pursuant to income tax accounting guidance related to uncertain tax positions reflects future taxes that may be owed as a result of any examination. In 2010, we reduced our liability for uncertain tax positions by $162 million as a result of negotiations with the IRS. This reduction consisted of a $225 million reversal of accrued interest ($146 million after-tax), partially offset by a $63 million reclassification to net deferred tax liabilities. See Notes 1, 7 and 8 to Financial Statements for discussion of income tax matters.
Depreciation and Amortization
Depreciation expense related to generation facilities is based on the estimates of fair value and economic useful lives as determined in the application of purchase accounting described above. The accuracy of these estimates directly affects the amount of depreciation expense. If future events indicate that the estimated lives are no longer appropriate, depreciation expense will be recalculated prospectively from the date of such determination based on the new estimates of useful lives.
The estimated remaining lives range from 22 to 59 years for the lignite/coal- and nuclear-fueled generation units.
Finite-lived intangibles identified as a result of purchase accounting are amortized over their estimated useful lives based on the expected realization of economic effects. See Note 4 to Financial Statements for additional information.
Defined Benefit Pension Plans and OPEB Plans
We provide pension benefits based on either a traditional defined benefit formula or a cash balance formula and also provide certain health care and life insurance benefits to eligible employees and their eligible dependents upon the retirement of such employees from our company. Reported costs of providing noncontributory defined pension benefits and OPEB are dependent upon numerous factors, assumptions and estimates.
PURA provides for the recovery by Oncor of pension and OPEB costs for all applicable former employees of the regulated predecessor integrated electric utility. These costs are associated with Oncor’s active and retired employees, as well as active and retired personnel engaged in other EFH Corp. activities related to their service prior to the deregulation and disaggregation of our business effective January 1, 2002. Oncor is authorized to establish a regulatory asset or liability for the difference between the amounts of pension and OPEB costs reflected in Oncor’s approved (by the PUCT) billing rates and the actual amounts that would otherwise have been recorded as charges or credits to earnings. Accordingly, Oncor defers (principally as a regulatory asset or property) additional pension and OPEB costs consistent with PURA. Amounts deferred are ultimately subject to regulatory approval.
Benefit costs are impacted by actual employee demographics (including but not limited to age, compensation levels and years of accredited service), the level of contributions made to retiree plans, expected and actual earnings on plan assets and the discount rates used in determining the projected benefit obligation. Changes made to the provisions of the plans may also impact current and future benefit costs. Fluctuations in actual equity market returns as well as changes in general interest rates may result in increased or decreased benefit costs in future periods.
66
In accordance with accounting rules, changes in benefit obligations associated with these factors may not be immediately recognized as costs in the income statement, but are recognized in future years over the remaining average service period of plan participants. As such, significant portions of benefit costs recorded in any period may not reflect the actual level of cash benefits provided to plan participants. Pension and OPEB costs as determined under applicable accounting rules are summarized in the following table:
| | | | | | | | | | | | |
| | | Year Ended December 31, | |
| | | 2010 | | | 2009 | | | 2008 | |
Pension costs | | $ | 100 | | | $ | 44 | | | $ | 21 | |
OPEB costs | | | 80 | | | | 70 | | | | 58 | |
| | | | | | | | | | | | |
Total benefit costs | | $ | 180 | | | $ | 114 | | | $ | 79 | |
Less amounts expensed by Oncor (and not consolidated) | | | (37 | ) | | | — | | | | — | |
Less amounts deferred principally as a regulatory asset or property by Oncor | | | (93 | ) | | | (66 | ) | | | (42 | ) |
| | | | | | | | | | | | |
Net amounts recognized as expense | | $ | 50 | | | $ | 48 | | | $ | 37 | |
| | | | | | | | | | | | |
Discount rate (a) | | | 5.90 | % | | | 6.90 | % | | | 6.55 | % |
| |
| | (a) | Discount rate for OPEB was 6.85% in 2009. |
See Note 20 to Financial Statements regarding other disclosures related to pension and OPEB obligations.
Sensitivity of these costs to changes in key assumptions is as follows:
| | | | |
Assumption | | Increase/
(decrease) in
2010 Pension and
OPEB Costs | |
Discount rate – 1% increase | | $ | (52 | ) |
Discount rate – 1% decrease | | $ | 62 | |
Expected return on assets – 1% increase | | $ | (22 | ) |
Expected return on assets – 1% decrease | | $ | 22 | |
67
RESULTS OF OPERATIONS
Effects of Change in Wholesale Electricity Market
As discussed above under “Significant Activities and Events,” the nodal wholesale market design implemented by ERCOT in December 2010 resulted in operational changes that facilitate hedging and trading of power. As part of ERCOT’s transition to a nodal wholesale market, volumes under nontrading bilateral purchase and sales contracts are no longer scheduled as physical power with ERCOT. As a result of these changes in market operations, reported wholesale revenues and purchased power costs in 2011 will be materially less than amounts reported in prior periods. Effective with the nodal market implementation, if volumes delivered to our retail and wholesale customers are less than our generation volumes (as determined on a daily settlement basis), we record additional wholesale revenues. Conversely, if volumes delivered to our retail and wholesale customers exceed our generation volumes, we record additional purchased power costs. The resulting additional wholesale revenues or purchased power costs are offset in net gain/(loss) from commodity hedging and trading activities.
Pro Forma Consolidated Financial Results
As the result of deconsolidation of Oncor Holdings effective 2010, the results of Oncor Holdings are reflected in the 2010 consolidated statement of income as equity in earnings of unconsolidated subsidiary (net of tax) instead of separately as revenues and expenses as they are shown for periods prior to January 1, 2010. The following pro forma results for the year ended December 31, 2009 are presented to provide for a meaningful comparison, along with the analyses on the following pages, of consolidated operating results in consideration of the deconsolidation of Oncor Holdings as discussed in Notes 1 and 3 to Financial Statements.
| | | | | | | | | | | | | | | | |
| | | Year Ended | | | Year Ended December 31, 2009 | |
| | | December 31,
2010 | | | As Reported | | | Pro Forma
Adjustments (a) | | | Pro Forma | |
| | | (millions of dollars) | |
Operating revenues | | $ | 8,235 | | | $ | 9,546 | | | $ | (1,632 | ) | | $ | 7,914 | |
Fuel, purchased power costs and delivery fees | | | (4,371 | ) | | | (2,878 | ) | | | (1,058 | ) | | | (3,936 | ) |
Net gain from commodity hedging and trading activities | | | 2,161 | | | | 1,736 | | | | — | | | | 1,736 | |
Operating costs | | | (837 | ) | | | (1,598 | ) | | | 908 | | | | (690 | ) |
Depreciation and amortization | | | (1,407 | ) | | | (1,754 | ) | | | 557 | | | | (1,197 | ) |
Selling, general and administrative expenses | | | (751 | ) | | | (1,068 | ) | | | 193 | | | | (875 | ) |
Franchise and revenue-based taxes | | | (106 | ) | | | (359 | ) | | | 250 | | | | (109 | ) |
Impairment of goodwill | | | (4,100 | ) | | | (90 | ) | | | — | | | | (90 | ) |
Other income | | | 2,051 | | | | 204 | | | | (50 | ) | | | 154 | |
Other deductions | | | (31 | ) | | | (97 | ) | | | 34 | | | | (63 | ) |
Interest income | | | 10 | | | | 45 | | | | (1 | ) | | | 44 | |
Interest expense and related charges | | | (3,554 | ) | | | (2,912 | ) | | | 306 | | | | (2,606 | ) |
| | | | | | | | | | | | | | | | |
| | | | |
Income (loss) before income taxes and equity in earnings of unconsolidated subsidiaries | | | (2,700 | ) | | | 775 | | | | (493 | ) | | | 282 | |
| | | | |
Income tax (expense) benefit | | | (389 | ) | | | (367 | ) | | | 173 | | | | (194 | ) |
| | | | |
Equity in earnings of unconsolidated subsidiaries (net of tax) | | | 277 | | | | — | | | | 256 | | | | 256 | |
| | | | | | | | | | | | | | | | |
| | | | |
Net income (loss) | | | (2,812 | ) | | | 408 | | | | (64 | ) | | | 344 | |
Net income attributable to noncontrolling interests | | | — | | | | (64 | ) | | | 64 | | | | — | |
| | | | | | | | | | | | | | | | |
Net income (loss) attributable to EFH Corp. | | $ | (2,812 | ) | | $ | 344 | | | $ | — | | | $ | 344 | |
| | | | | | | | | | | | | | | | |
| (a) | All pro forma adjustments relate to Oncor Holdings and result in the presentation of the investment in Oncor Holdings under the equity method of accounting for the year ended December 31, 2009. |
68
Consolidated Financial Results — Year Ended December 31, 2010 Compared to Pro Forma Year Ended December 31, 2009
See comparison of results of the Competitive Electric segment for discussion of variances in: operating revenues; fuel, purchased power costs and delivery fees; net gain (loss) from commodity hedging and trading activities, operating costs; depreciation and amortization, and franchise and revenue-based taxes.
SG&A expenses decreased $124 million, or 14%, to $751 million in 2010 driven by $66 million in lower transition costs associated with outsourced support services and the retail customer information system implemented in 2009, $18 million in lower employee compensation-related expense and $12 million of accounts receivable securitization program fees that are reported as interest expense and related charges in 2010 (see Notes 10 and 19 to Financial Statements).
See Note 4 to Financial Statements for discussion of the $4.1 billion impairment of goodwill recorded in the Competitive Electric segment in 2010. The $90 million impairment of goodwill recorded in 2009 largely related to the Competitive Electric segment and resulted from the completion of fair value calculations supporting a goodwill impairment charge recorded in the fourth quarter 2008 as discussed in Note 4 to Financial Statements.
Other income totaled $2.051 billion in 2010 and $154 million in 2009. Debt extinguishment gains totaled $1.814 billion and $87 million in 2010 and 2009, respectively (see discussion of debt exchanges and repurchases in Note 11 to Financial Statements). The 2010 amount also included a $116 million gain on termination of a long-term power sales contract, a $44 million gain on sale of land and related water rights and a $37 million gain on sale of interests in a natural gas gathering pipeline business. The 2009 amount included $23 million of income arising from the reversal of a use tax accrual recorded in purchase accounting related to periods prior to the Merger, which was triggered by a state ruling in the third quarter 2009, and $11 million of income arising from the reversal of exit liabilities recorded in purchase accounting due to sooner than expected transition of outsourcing services (see Note 19 to Financial Statements).
Other deductions totaled $31 million in 2010 and $63 million in 2009. The 2009 amount included an impairment charge of $34 million related to land expected to be sold. See Note 9 to Financial Statements for details of other income and deductions.
Interest income decreased $34 million, or 77%, to $10 million in 2010 reflecting lower interest on $465 million in collateral under a funding arrangement, due to settlement of the arrangement as described in Note 17 to Financial Statements.
Interest expense and related charges increased $948 million to $3.554 billion in 2010 reflecting a $207 million unrealized mark-to-market net loss related to interest rate swaps in 2010 compared to a $696 million net gain in 2009 and a $214 million decrease in capitalized interest due to completion of new generation facility construction activities, partially offset by $97 million in decreased noncash amortization of losses on interest rate swaps dedesignated as cash flow hedges, reflecting values attributed to earlier periods, as well as lower interest expense resulting from reduced debt under the liability management program as described above under “Significant Activities and Events.” Also, see Note 24 to Financial Statements.
Income tax expense totaled $389 million in 2010 compared to $194 million in 2009. Excluding the effects of the $4.1 billion and $90 million nondeductible goodwill impairment charges in 2010 and 2009, respectively, the effective tax rates were 27.8% in 2010 and 52.2% in 2009. The decrease in the effective tax rate in 2010 was driven by lower interest accrued related to uncertain tax positions, including the effect of a $146 million reversal of previously accrued interest (see Note 7 to Financial Statements) net of the effect of an $8 million deferred tax charge related to the Patient Protection and Affordable Care Act (see Note 8 to Financial Statements).
Equity in earnings of unconsolidated subsidiaries (net of tax) increased $21 million to $277 million in 2010 driven by improved earnings of Oncor, which reflected higher revenues, primarily due to weather effects and rate increases, and the effect of a $25 million write off of regulatory assets in 2009, partially offset by increased noncash expenses recognized as a result of the PUCT’s final order in the June 2008 rate review.
69
The consolidated net loss of $2.812 billion in 2010 represented a $3.156 billion decrease in results.
| | • | | Results in the Competitive Electric segment decreased $4.094 billion to a loss of $3.463 billion. |
| | • | | Earnings from the Regulated Delivery segment increased $21 million to $277 million as discussed above. |
| | • | | Corporate and Other net income totaled $374 million in 2010 compared to net expenses of $543 million in 2009. The amounts in 2010 and 2009 include recurring interest expense on outstanding debt and notes payable to subsidiaries, as well as corporate general and administrative expenses. The change of $917 million reflected $670 million in higher debt extinguishment gains in 2010, the $121 million Corporate and Other portion of the 2010 reversal of accrued interest on uncertain tax positions discussed above, $68 million in lower SG&A expense primarily reflecting lower transition costs associated with outsourced support services and costs allocated to the competitive operations effective 2010 and a $20 million goodwill impairment charge in 2009, partially offset by an $8 million deferred tax charge due to the implementation of the Patient Protection and Affordable Care Act in 2010 (all amounts after-tax). |
Consolidated Financial Results — Year Ended December 31, 2009 Compared to Year Ended December 31, 2008
Reference is made to comparisons of results by business segment following the discussion of consolidated results. The business segment comparisons provide additional detail and quantification of items affecting financial results.
Operating revenues decreased $1.818 billion, or 16%, to $9.546 billion in 2009.
| | • | | Operating revenues in the Competitive Electric segment decreased $1.876 billion, or 19%, to $7.911 billion. |
| | • | | Operating revenues in the Regulated Delivery segment increased $110 million, or 4%, to $2.690 billion. |
| | • | | Net intercompany sales eliminations increased $52 million, reflecting Oncor’s higher distribution revenues from REP subsidiaries of TCEH. |
Fuel, purchased power costs and delivery fees decreased $1.717 billion, or 37%, to $2.878 billion in 2009, driven by lower purchased power costs. See discussion below in the analysis of Competitive Electric segment results of operations.
Net gains from commodity hedging and trading activities totaled $1.736 billion in 2009 and $2.184 billion in 2008. Results in 2009 and 2008 included unrealized mark-to-market net gains totaling $1.277 billion and $2.281 billion, respectively, driven by the effect of lower forward market prices of natural gas on the value of positions in the long-term hedging program. See discussion below in the analysis of Competitive Electric segment results of operations.
Operating costs increased $95 million, or 6%, to $1.598 billion in 2009.
| | • | | Operating costs in the Competitive Electric segment increased $16 million, or 2%, to $693 million. |
| | • | | Operating costs in the Regulated Delivery segment increased $80 million, or 10%, to $908 million. |
Depreciation and amortization increased $144 million, or 9%, to $1.754 billion in 2009.
| | • | | Depreciation and amortization in the Competitive Electric segment increased $80 million, or 7%, to $1.172 billion. |
| | • | | Depreciation and amortization in the Regulated Delivery segment increased $65 million, or 13%, to $557 million. |
70
SG&A expenses increased $111 million, or 12%, to $1.068 billion in 2009.
| | • | | SG&A expenses in the Competitive Electric segment increased $59 million, or 9%, to $741 million. |
| | • | | SG&A expenses in the Regulated Delivery segment increased $30 million, or 18%, to $194 million. |
| | • | | Corporate and Other SG&A expenses increased $22 million, or 20%, to $133 million driven by higher transition costs associated with outsourced support services. |
See Note 4 to Financial Statements for discussion of the $90 million and $8.860 billion impairments of goodwill in 2009 and 2008, respectively.
Other income totaled $204 million in 2009 and $80 million in 2008, including $39 million and $44 million, respectively, in accretion of the fair value adjustment to certain regulatory assets due to purchase accounting. The 2009 amount also included an $87 million debt extinguishment gain (see discussion of debt exchanges in Note 11 to Financial Statements), $23 million of income arising from the reversal of a use tax accrual recorded in purchase accounting related to periods prior to the Merger, which was triggered by a state ruling in the third quarter of 2009, and $21 million of income arising from the reversal of exit liabilities recorded in purchase accounting due to sooner than expected transition of outsourcing services (see Note 19 to Financial Statements). The 2008 amount also included a $21 million net insurance recovery for damage to certain mining equipment.
Other deductions totaled $97 million in 2009 and $1.301 billion in 2008. The 2009 amount included an impairment charge of $34 million related to land expected to be sold within the next 12 months and a $25 million write off of regulatory assets as discussed in Note 24 to Financial Statements. The 2008 amount included impairment charges of $501 million related to NOx and SO2 environmental allowances intangible assets and $481 million related to trade name intangible assets, both discussed in Note 4 to Financial Statements, $229 million in impairment charges related to the natural gas-fueled generation facilities and $26 million in charges to reserve for net receivables (excluding termination related costs) from terminated hedging transactions with subsidiaries of Lehman Brothers Holdings Inc., which filed for bankruptcy under Chapter 11 of the US Bankruptcy Code. See Note 9 to Financial Statements for details of other income and deductions.
Interest income increased $18 million, or 67%, to $45 million driven by interest on $465 million in collateral under a funding arrangement described in Note 17 to Financial Statements.
Interest expense and related charges decreased $2.023 billion to $2.912 billion in 2009 reflecting a $696 million unrealized mark-to-market net gain related to interest rate swaps in 2009 as compared to a $1.477 billion net loss in 2008, which was partially offset by $118 million in increased noncash amortization of losses on interest rate swaps dedesignated as cash flow hedges and a $34 million decrease in capitalized interest. See Note 24 to Financial Statements.
Income tax expense totaled $367 million in 2009 compared to an income tax benefit of $471 million in 2008. The effective rate on income in 2009 was 47.4%, and the effective rate on a loss in 2008 was 4.5%. The increase in the rate reflects the impacts of nondeductible goodwill impairments of $90 million in 2009 and $8.860 billion in 2008, which increased the effective rate by 5.0 percentage points in 2009 and decreased the effective rate by 24.8 percentage points in 2008. The increase also reflects the effect of interest accrued for uncertain tax positions, which increased the rate on income in 2009 and decreased the rate on a loss in 2008.
71
Reflecting the goodwill and other impairment charges recorded in 2008, after tax-results improved $10.406 billion to $408 million in net income in 2009.
| | • | | After-tax results in the Competitive Electric segment improved $9.560 billion to $631 million in net income in 2009. |
| | • | | After-tax results in the Regulated Delivery segment improved $806 million to $320 million in net income in 2009. |
| | • | | Corporate and Other net expenses totaled $543 million in 2009 and $583 million in 2008. The amounts in 2009 and 2008 include recurring interest expense on outstanding debt and notes payable to subsidiaries, as well as corporate general and administrative expenses. The after-tax decrease of $40 million reflected the debt extinguishment gain of $57 million and $16 million in interest income related to the collateral discussed above, partially offset by a $20 million goodwill impairment charge and the $14 million increase in SG&A expense as discussed above. |
Non-GAAP Earnings Measures
In communications with investors, we use a non-GAAP earnings measure that reflects adjustments to earnings reported in accordance with US GAAP in order to review underlying operating performance. These adjusting items, which are generally noncash, consist of unrealized mark-to-market gains and losses, impairment charges, debt extinguishment gains and other charges, credits or gains that are unusual or nonrecurring. All such items and related amounts are disclosed in our annual report on Form 10-K and quarterly reports on Form 10-Q. Our communications with investors also reference “Adjusted EBITDA,” which is a non-GAAP measure used in calculation of ratios in covenants of certain of our debt securities (see “Financial Condition – Liquidity and Capital Resources – Financial Covenants, Credit Rating Provisions and Cross Default Provisions” below).
72
Competitive Electric Segment
Financial Results
| | | | | | | | | | | | |
| | | Year Ended December 31, | |
| | | 2010 | | | 2009 | | | 2008 | |
Operating revenues | | $ | 8,235 | | | $ | 7,911 | | | $ | 9,787 | |
Fuel, purchased power costs and delivery fees | | | (4,371 | ) | | | (3,934 | ) | | | (5,600 | ) |
Net gain from commodity hedging and trading activities | | | 2,161 | | | | 1,736 | | | | 2,184 | |
Operating costs | | | (837 | ) | | | (693 | ) | | | (677 | ) |
Depreciation and amortization | | | (1,380 | ) | | | (1,172 | ) | | | (1,092 | ) |
Selling, general and administrative expenses | | | (722 | ) | | | (741 | ) | | | (682 | ) |
Franchise and revenue-based taxes | | | (106 | ) | | | (108 | ) | | | (110 | ) |
Impairment of goodwill | | | (4,100 | ) | | | (70 | ) | | | (8,000 | ) |
Other income | | | 903 | | | | 59 | | | | 34 | |
Other deductions | | | (21 | ) | | | (68 | ) | | | (1,274 | ) |
Interest income | | | 91 | | | | 64 | | | | 61 | |
Interest expense and related charges | | | (2,957 | ) | | | (1,946 | ) | | | (4,010 | ) |
| | | | | | | | | | | | |
| | | |
Income (loss) before income taxes | | | (3,104 | ) | | | 1,038 | | | | (9,379 | ) |
| | | |
Income tax (expense) benefit | | | (359 | ) | | | (407 | ) | | | 450 | |
| | | | | | | | | | | | |
Net income (loss) | | $ | (3,463 | ) | | $ | 631 | | | $ | (8,929 | ) |
| | | | | | | | | | | | |
73
Competitive Electric Segment
Sales Volume and Customer Count Data
| | | | | | | | | | | | | | | | | | | | |
| | | Year Ended December 31, | | | 2010 | | | 2009 | |
| | | 2010 | | | 2009 | | | 2008 | | | % Change | | | % Change | |
Sales volumes: | | | | | | | | | | | | | | | | | | | | |
| | | | | |
Retail electricity sales volumes – (GWh): | | | | | | | | | | | | | | | | | | | | |
Residential | | | 28,208 | | | | 28,046 | | | | 28,135 | | | | 0.6 | | | | (0.3 | ) |
Small business (a) | | | 8,042 | | | | 7,962 | | | | 7,363 | | | | 1.0 | | | | 8.1 | |
Large business and other customers | | | 15,339 | | | | 14,573 | | | | 13,945 | | | | 5.3 | | | | 4.5 | |
| | | | | | | | | | | | | | | | | | | | |
Total retail electricity | | | 51,589 | | | | 50,581 | | | | 49,443 | | | | 2.0 | | | | 2.3 | |
Wholesale electricity sales volumes (b) | | | 51,359 | | | | 42,320 | | | | 46,743 | | | | 21.4 | | | | (9.5 | ) |
| | | | | | | | | | | | | | | | | | | | |
Total sales volumes | | | 102,948 | | | | 92,901 | | | | 96,186 | | | | 10.8 | | | | (3.4 | ) |
| | | | | | | | | | | | | | | | | | | | |
| | | | | |
Average volume (kWh) per residential customer (c) | | | 15,532 | | | | 14,855 | | | | 14,780 | | | | 4.6 | | | | 0.5 | |
| | | | | |
Weather (North Texas average) – percent of normal (d): | | | | | | | | | | | | | | | | | | | | |
| | | | | |
Cooling degree days | | | 108.9 | % | | | 98.1 | % | | | 107.3 | % | | | 11.0 | | | | (8.6 | ) |
Heating degree days | | | 116.6 | % | | | 105.8 | % | | | 98.3 | % | | | 10.2 | | | | 7.6 | |
| | | | | |
Customer counts: | | | | | | | | | | | | | | | | | | | | |
| | | | | |
Retail electricity customers (end of period and in thousands) (e): | | | | | | | | | | | | | | | | | | | | |
Residential | | | 1,771 | | | | 1,862 | | | | 1,914 | | | | (4.9 | ) | | | (2.7 | ) |
Small business (a) | | | 217 | | | | 262 | | | | 275 | | | | (17.2 | ) | | | (4.7 | ) |
Large business and other customers | | | 20 | | | | 23 | | | | 25 | | | | (13.0 | ) | | | (8.0 | ) |
| | | | | | | | | | | | | | | | | | | | |
Total retail electricity customers | | | 2,008 | | | | 2,147 | | | | 2,214 | | | | (6.5 | ) | | | (3.0 | ) |
| | | | | | | | | | | | | | | | | | | | |
| (a) | Customers with demand of less than 1 MW annually. |
| (b) | Includes net amounts related to sales and purchases of balancing energy in the “real-time market.” |
| (c) | Calculated using average number of customers for the period. |
| (d) | Weather data is obtained from Weatherbank, Inc., an independent company that collects and archives weather data from reporting stations of the National Oceanic and Atmospheric Administration (a federal agency under the US Department of Commerce). Normal is defined as the average over a 10-year period. |
| (e) | Based on number of meters. Typically, large business and other customers have more than one meter; therefore, number of meters does not reflect the number of individual customers. The year ended December 31, 2008 reflects reclassification of 18 thousand meters from residential to small business to conform to current presentation. |
74
Competitive Electric Segment
Revenue and Commodity Hedging and Trading Activities
| | | | | | | | | | | | | | | | | | | | |
| | | Year Ended December 31, | | | 2010
% Change | | | 2009
% Change | |
| | | 2010 | | | 2009 | | | 2008 | | | |
Operating revenues: | | | | | | | | | | | | | | | | | | | | |
Retail electricity revenues: | | | | | | | | | | | | | | | | | | | | |
Residential | | $ | 3,663 | | | $ | 3,806 | | | $ | 3,782 | | | | (3.8 | ) | | | 0.6 | |
Small business (a) | | | 1,052 | | | | 1,164 | | | | 1,099 | | | | (9.6 | ) | | | 5.9 | |
Large business and other customers | | | 1,211 | | | | 1,261 | | | | 1,447 | | | | (4.0 | ) | | | (12.9 | ) |
| | | | | | | | | | | | | | | | | | | | |
Total retail electricity revenues | | | 5,926 | | | | 6,231 | | | | 6,328 | | | | (4.9 | ) | | | (1.5 | ) |
Wholesale electricity revenues (b) (c) | | | 2,005 | | | | 1,383 | | | | 3,115 | | | | 45.0 | | | | (55.6 | ) |
Amortization of intangibles (d) | | | 16 | | | | 5 | | | | (36 | ) | | | — | | | | — | |
Other operating revenues | | | 288 | | | | 292 | | | | 380 | | | | (1.4 | ) | | | (23.2 | ) |
| | | | | | | | | | | | | | | | | | | | |
Total operating revenues | | $ | 8,235 | | | $ | 7,911 | | | $ | 9,787 | | | | 4.1 | | | | (19.2 | ) |
| | | | | | | | | | | | | | | | | | | | |
| | | | | |
Net gain from commodity hedging and trading activities: | | | | | | | | | | | | | | | | | | | | |
Unrealized net gains from changes in fair value | | $ | 2,162 | | | $ | 1,741 | | | $ | 2,290 | | | | 24.2 | | | | (24.0 | ) |
Unrealized net losses representing reversals of previously recognized fair values of positions settled in the current period | | | (1,009 | ) | | | (464 | ) | | | (9 | ) | | | — | | | | — | |
Realized net gains (losses) on settled positions | | | 1,008 | | | | 459 | | | | (97 | ) | | | — | | | | — | |
| | | | | | | | | | | | | | | | | | | | |
Total gain | | $ | 2,161 | | | $ | 1,736 | | | $ | 2,184 | | | | 24.5 | | | | (20.5 | ) |
| | | | | | | | | | | | | | | | | | | | |
| (a) | Customers with demand of less than 1 MW annually. |
| (b) | Upon settlement of physical derivative power sales and purchase contracts that are marked-to-market in net income, wholesale electricity revenues and fuel and purchased power costs are reported at approximated market prices, as required by accounting rules, instead of the contract price. As a result, these line item amounts include a noncash component, which the company considers “unrealized.” (The offsetting differences between contract and market prices are reported in net gain from commodity hedging and trading activities.) These amounts are as follows: |
| | | | | | | | | | | | |
| | | Year Ended December 31, | |
| | | 2010 | | | 2009 | | | 2008 | |
Reported in revenues | | $ | (28 | ) | | $ | (166 | ) | | $ | 42 | |
Reported in fuel and purchased power costs | | | 96 | | | | 114 | | | | 6 | |
| | | | | | | | | | | | |
Net gain (loss) | | $ | 68 | | | $ | (52 | ) | | $ | 48 | |
| | | | | | | | | | | | |
| (c) | Includes net amounts related to sales and purchases of balancing energy in the “real-time market.” |
| (d) | Represents amortization of the intangible net asset value of retail and wholesale power sales agreements resulting from purchase accounting. |
75
Competitive Electric Segment
Production, Purchased Power and Delivery Cost Data
| | | | | | | | | | | | | | | | | | | | |
| | | Year Ended December 31, | | | 2010
% Change | | | 2009
% Change | |
| | | 2010 | | | 2009 | | | 2008 | | | |
Fuel, purchased power costs and delivery fees ($ millions): | | | | | | | | | | | | | | | | | | | | |
Nuclear fuel | | $ | 159 | | | $ | 121 | (f) | | $ | 95 | | | | 31.4 | | | | 27.4 | |
Lignite/coal | | | 910 | | | | 670 | | | | 640 | | | | 35.8 | | | | 4.7 | |
| | | | | | | | | | | | | | | | | | | | |
Total baseload fuel | | | 1,069 | | | | 791 | | | | 735 | | | | 35.1 | | | | 7.6 | |
Natural gas fuel and purchased power (a) | | | 1,502 | | | | 1,224 | | | | 2,881 | | | | 22.7 | | | | (57.5 | ) |
Amortization of intangibles (b) | | | 161 | | | | 285 | (f) | | | 318 | | | | (43.5 | ) | | | (10.4 | ) |
Other costs | | | 187 | | | | 202 | | | | 351 | | | | (7.4 | ) | | | (42.5 | ) |
| | | | | | | | | | | | | | | | | | | | |
Fuel and purchased power costs | | | 2,919 | | | | 2,502 | | | | 4,285 | | | | 16.7 | | | | (41.6 | ) |
Delivery fees (c) | | | 1,452 | | | | 1,432 | | | | 1,315 | | | | 1.4 | | | | 8.9 | |
| | | | | | | | | | | | | | | | | | | | |
Total | | $ | 4,371 | | | $ | 3,934 | | | $ | 5,600 | | | | 11.1 | | | | (29.8 | ) |
| | | | | | | | | | | | | | | | | | | | |
| | | | | |
Fuel and purchased power costs (which excludes generation facilities operating costs) per MWh: | | | | | | | | | | | | | | | | | | | | |
Nuclear fuel | | $ | 7.89 | | | $ | 5.98 | (f) | | $ | 4.92 | | | | 31.9 | | | | 21.5 | |
Lignite/coal (d) | | $ | 19.19 | | | $ | 16.47 | | | $ | 15.80 | | | | 16.5 | | | | 4.2 | |
Natural gas fuel and purchased power | | $ | 52.37 | | | $ | 44.36 | | | $ | 81.99 | | | | 18.1 | | | | (45.9 | ) |
| | | | | |
Delivery fees per MWh | | $ | 28.06 | | | $ | 28.09 | | | $ | 26.33 | | | | (0.1 | ) | | | 6.7 | |
| | | | | |
Production and purchased power volumes (GWh): | | | | | | | | | | | | | | | | | | | | |
Nuclear | | | 20,208 | | | | 20,104 | | | | 19,218 | | | | 0.5 | | | | 4.6 | |
Lignite/coal | | | 54,775 | | | | 45,684 | | | | 44,923 | | | | 19.9 | | | | 1.7 | |
| | | | | | | | | | | | | | | | | | | | |
Total baseload generation | | | 74,983 | | | | 65,788 | | | | 64,141 | | | | 14.0 | | | | 2.6 | |
Natural gas-fueled generation | | | 1,648 | | | | 2,447 | | | | 4,122 | | | | (32.7 | ) | | | (40.6 | ) |
Purchased power (e) | | | 26,317 | | | | 24,666 | | | | 27,923 | | | | 6.7 | | | | (11.7 | ) |
| | | | | | | | | | | | | | | | | | | | |
Total energy supply volumes | | | 102,948 | | | | 92,901 | | | | 96,186 | | | | 10.8 | | | | (3.4 | ) |
| | | | | | | | | | | | | | | | | | | | |
| | | | | |
Baseload capacity factors: | | | | | | | | | | | | | | | | | | | | |
Nuclear | | | 100.3 | % | | | 100.0 | % | | | 95.2 | % | | | 0.3 | | | | 5.0 | |
Lignite/coal | | | 82.2 | % | | | 86.5 | % | | | 87.6 | % | | | (5.0 | ) | | | (1.3 | ) |
Total baseload | | | 86.6 | % | | | 90.3 | % | | | 89.8 | % | | | (4.1 | ) | | | 0.6 | |
| (a) | See note (b) on previous page. |
| (b) | Represents amortization of the intangible net asset values of emission credits, coal purchase contracts, nuclear fuel contracts and power purchase agreements and the stepped up value of nuclear fuel resulting from purchase accounting. |
| (c) | Includes delivery fee charges from Oncor that prior to 2010 were eliminated in consolidation. |
| (d) | Includes depreciation and amortization of lignite mining assets, which is reported in the depreciation and amortization expense line item, but is part of overall fuel costs. |
| (e) | Includes amounts related to line loss and power imbalances. |
| (f) | Reflects reclassification to correct amortization. |
76
Competitive Electric Segment – Financial Results – Year Ended December 31, 2010 Compared to Year Ended December 31, 2009
Operating revenues increased $324 million, or 4%, to $8.235 billion in 2010.
Wholesale electricity revenues increased $622 million, or 45%, to $2.005 billion in 2010. A 21% increase in wholesale electricity sales volumes, reflecting production from the new generation units and increased sales to third-party REPs, increased revenues by $332 million. An 8% increase in average wholesale electricity prices, reflecting higher natural gas prices at the time the underlying contracts were executed, increased revenues by $149 million. The balance of the revenue increase reflected lower unrealized losses in 2010 related to physical derivative commodity sales contracts as discussed in footnote (b) to the “Revenue and Commodity Hedging and Trading Activities” table above.
Retail electricity revenues decreased $305 million, or 5%, to $5.926 billion and reflected the following:
| | • | | Lower average pricing decreased revenues by $429 million reflecting declines in both the business and residential markets. Lower average pricing is reflective of competitive activity in a lower wholesale power price environment and a change in business customer mix. |
| | • | | A 2% increase in sales volumes increased revenues by $124 million reflecting increases in both the business and residential markets. A 4% increase in business markets sales volumes reflected a change in customer mix resulting from contracts executed with new customers. Residential sales volumes increased 1% reflecting higher average consumption driven by colder winter weather and hotter summer weather, partially offset by a decline in residential customer counts. |
Fuel, purchased power costs and delivery fees increased $437 million, or 11%, to $4.371 billion in 2010. Higher purchased power costs contributed $255 million to the increase and reflected increased planned generation unit outages and higher retail demand, as well as increased prices driven by the effect of higher natural gas prices at the time the underlying contracts were executed. Other factors contributing to the increase included $126 million in higher lignite/coal costs at existing plants, reflecting higher purchased coal transportation and commodity costs, $114 million in increased lignite fuel costs related to production from the new generation units, a $39 million increase in nuclear fuel expense reflecting increased uranium and conversion costs, a $23 million increase in natural gas and fuel oil costs driven by higher prices, $20 million in higher delivery fees, reflecting increased retail sales volumes and tariffs, and an $18 million decrease in unrealized gains related to physical derivative commodity purchase contracts. These increases were partially offset by $124 million in lower amortization of the intangible net asset values (including the stepped-up value of nuclear fuel) resulting from purchase accounting, which reflected expiration of commodity contracts and consumption of the nuclear fuel.
Overall baseload generation production increased 14% in 2010 driven by production from the new generation units. Nuclear production increased 1%, and existing lignite/coal-fueled generation decreased 2% driven by increased economic backdown.
77
Following is an analysis of amounts reported as net gain from commodity hedging and trading activities for the years ended December 31, 2010 and 2009, which totaled $2.161 billion and $1.736 billion, respectively:
Year Ended December 31, 2010 —Unrealized mark-to-market net gains totaling $1.153 billion included:
| | • | | $1.157 billion in net gains related to hedge positions, which includes $2.133 billion in net gains from changes in fair value, driven by the impact of lower forward natural gas prices on the value of positions in the long-term hedging program, and $976 million in net losses that represent reversals of previously recorded net gains on positions settled in the period, and |
| | • | | $4 million in net losses related to trading positions, which includes $29 million in net gains from changes in fair value, and $33 million in net losses that represent reversals of previously recorded net gains on positions settled in the period. |
Realized net gains totaling $1.008 billion included:
| | • | | $961 million in net gains related to positions that primarily hedged electricity revenues recognized in the period, and |
| | • | | $47 million in net gains related to trading positions. |
Year Ended December 31, 2009 —Unrealized mark-to-market net gains totaling $1.277 billion included:
| | • | | $1.260 billion in net gains related to hedge positions, which includes $1.719 billion in net gains from changes in fair value, driven by the impact of lower forward natural gas prices on the value of positions in the long-term hedging program, and $459 million in net losses that represent reversals of previously recorded net gains on positions settled in the period, and |
| | • | | $17 million in net gains related to trading positions, which includes $22 million in net gains from changes in fair value, and $5 million in net losses that represent reversals of previously recorded net gains on positions settled in the period. |
Realized net gains totaling $459 million included:
| | • | | $449 million in net gains related to positions that primarily hedged electricity revenues recognized in the period, and |
| | • | | $10 million in net gains related to trading positions. |
Unrealized gains and losses that are related to physical derivative commodity contracts and are reported as revenues and purchased power costs, as required by accounting rules, totaled $68 million in net gains in 2010 and $52 million in net losses in 2009.
Operating costs increased $144 million, or 21%, to $837 million in 2010. The increase reflected $90 million in incremental expense related to the new generation units. The balance of the increase was driven by installation and maintenance of emissions control equipment at the existing lignite/coal-fueled generation facilities and higher maintenance costs at both the nuclear and existing lignite/coal-fueled facilities reflecting timing and scope of project work.
Depreciation and amortization increased $208 million, or 18%, to $1.380 billion in 2010. The increase reflected $162 million in incremental expense related to the new generation units and associated mining operations. The balance of the increase was driven by equipment additions.
78
SG&A expenses decreased $19 million, or 3%, to $722 million in 2010. The decrease reflected:
| | • | | $31 million in lower transition costs associated with outsourced services and the retail customer information management system implemented in 2009; |
| | • | | $16 million in lower employee compensation-related expense in 2010; |
| | • | | $12 million of accounts receivable securitization program fees that are reported in 2010 as interest expense and related charges (see Note 10 to Financial Statements), and |
| | • | | $8 million in lower bad debt expense, |
partially offset by $46 million of costs allocated from corporate in 2010, principally fees paid to the Sponsor Group.
See Note 4 to Financial Statements for discussion of the $4.1 billion impairment of goodwill recorded in 2010 and of the $70 million impairment of goodwill recorded in 2009 that resulted from the completion of fair value calculations supporting a goodwill impairment charge recorded in the fourth quarter of 2008.
Other income totaled $903 million in 2010 and $59 million in 2009. Other income in 2010 included debt extinguishment gains of $687 million, a $116 million gain on termination of a power sales contract, a $44 million gain on the sale of land and related water rights and a $37 million gain associated with the sale of interests in a natural gas gathering pipeline business. The 2009 amount included a $23 million reversal of a use tax accrual, an $11 million reversal of exit liabilities recorded in connection with the termination of outsourcing arrangements and $25 million in several individually immaterial items. Other deductions totaled $21 million in 2010 and $68 million in 2009. The 2010 amount included several individually immaterial items. The 2009 amount included $34 million in charges for the impairment of land expected to be sold, $7 million in severance charges and other individually immaterial miscellaneous expenses. See Note 9 to Financial Statements for additional details.
Interest income increased $27 million, or 42%, to $91 million in 2010 reflecting higher notes receivable balances from affiliates.
Interest expense and related charges increased by $1.011 billion, or 52%, to $2.957 billion in 2010 reflecting a $207 million unrealized mark-to-market net loss related to interest rate swaps in 2010 compared to a $696 million net gain in 2009 and a $214 million decrease in capitalized interest due to completion of new generation facility construction activities, partially offset by a $97 million decrease in noncash amortization of losses on interest rate swaps dedesignated as cash flow hedges.
Income tax expense totaled $359 million in 2010 compared to $407 million in 2009. Excluding the $4.1 billion and $70 million nondeductible goodwill impairment charges in 2010 and 2009, respectively, the effective tax rates were 36.0% and 36.7%, respectively.
Results for the segment decreased $4.094 billion in 2010 to a loss of $3.463 billion reflecting the $4.1 billion goodwill impairment charge and increased interest expense, partially offset by debt extinguishment gains and an increase in net gains from commodity hedging and trading activities.
79
Competitive Electric Segment – Financial Results – Year Ended December 31, 2009 Compared to Year Ended December 31, 2008
Operating revenues decreased $1.876 billion, or 19%, to $7.911 billion in 2009.
Wholesale electricity revenues decreased $1.732 billion, or 56%, to $1.383 billion in 2009 as compared to 2008. Volatility in wholesale revenues and purchased power costs reflects movements in natural gas prices, as lower natural gas prices in 2009 drove a 46% decline in average wholesale electricity sales prices. Reported wholesale revenues and purchased power costs also reflect changes in volumes of bilateral contracting activity entered into to mitigate the effects of demand volatility and congestion. Results in 2009 reflect lower demand volatility and a decline in congestion, which drove a 10% decline in wholesale sales volumes. Net purchases of balancing electricity from ERCOT totaling $80 million in 2009 and $214 million in 2008, which were previously disclosed separately, are now included within wholesale electricity revenues.
Retail electricity revenues declined $97 million, or 2%, to $6.231 billion and reflected the following:
| | • | | Lower average pricing contributed $242 million to the revenue decline. The change in average pricing reflected lower average contracted business rates driven by lower wholesale electricity prices, partially offset by higher average pricing in the residential and non-contract business markets resulting from advanced meter surcharges as well as customer mix. |
| | • | | Retail sales volume growth of 2% increased revenues by $145 million. Volumes rose in the business markets driven by changes in customer mix resulting from contracting activity, but declined slightly in the residential market driven by a 3% decrease in customers. |
Other operating revenues decreased $88 million, or 23%, to $292 million in 2009 due to lower natural gas prices and lower volumes on sales of natural gas to industrial customers.
The change in operating revenues also reflected a $41 million decrease in amortization of intangible assets arising from purchase accounting reflecting expiration of retail sales contracts.
Fuel, purchased power costs and delivery fees decreased $1.666 billion, or 30%, to $3.934 billion in 2009. This decrease was driven by lower purchased power costs due to the effect of lower natural gas prices, decreased demand volatility and reduced congestion as discussed above regarding wholesale revenues. Lower costs of replacement power during unplanned generation unit repair outages contributed to improved margin. Other factors contributing to lower fuel and purchased power costs included lower natural gas-fueled generation and lower related fuel costs ($374 million), the effect of lower natural gas prices on natural gas purchased for sale to industrial customers ($116 million) and lower amortization of intangible assets arising from purchase accounting ($26 million).
Overall baseload generation production increased 3% in 2009 reflecting a 5% increase in nuclear production and a 2% increase in lignite/coal-fueled production. The increase in nuclear production, which reflects two refueling outages in 2008 compared to one refueling outage in 2009 and investments to increase generation capacity, resulted in improved margin. The increase in lignite/coal-fueled production reflected generation from the new units placed in service in the fourth quarter 2009, partially offset by generation reductions during certain periods when power could be purchased in the wholesale market at prices below production costs, which was largely due to lower natural gas prices and higher wind generation availability.
80
Following is an analysis of amounts reported as net gain from commodity hedging and trading activities for the years ended December 31, 2009 and 2008, which totaled $1.736 billion and $2.184 billion, respectively:
Year Ended December 31, 2009 —Unrealized mark-to-market net gains totaling $1.277 billion included:
| | • | | $1.260 billion in net gains related to hedge positions, which includes $1.719 billion in net gains from changes in fair value, driven by the impact of lower forward natural gas prices on the value of positions in the long-term hedging program, and $459 million in net losses that represent reversals of previously recorded net gains on positions settled in the period, and |
| | • | | $17 million in net gains related to trading positions, which includes $22 million in net gains from changes in fair value and $5 million in net losses that represent reversals of previously recorded net gains on positions settled in the period. |
Realized net gains totaling $459 million included:
| | • | | $449 million in net gains related to positions that primarily hedged electricity revenues recognized in the period, and |
| | • | | $10 million in net gains related to trading positions. |
Year Ended December 31, 2008— Unrealized mark-to-market net gains totaling $2.281 billion included:
| | • | | $2.324 billion in net gains related to hedge positions, which includes $2.282 billion in net gains from changes in fair value and $42 million in net gains that represent reversals of previously recorded fair values of positions settled in the period; |
| | • | | $68 million in “day one” net losses related to large hedge positions (see Note 17 to Financial Statements), and |
| | • | | $25 million in net gains related to trading positions, which includes $76 million in net gains from changes in fair value and $51 million in net losses that represent reversals of previously recorded fair values of positions settled in the period. |
Realized net losses totaling $97 million included:
| | • | | $177 million in net losses related to hedge positions that primarily offset hedged electricity revenues and fuel and purchased power costs recognized in the period, and |
| | • | | $80 million in net gains related to trading positions. |
Unrealized gains and losses that are related to physically settled derivative commodity contracts and are reported as revenues and purchased power costs, as required by accounting rules, totaled $52 million in net losses in 2009 and $48 million in net gains in 2008.
Operating costs increased $16 million, or 2%, to $693 million in 2009 driven by $28 million in costs related to the new lignite-fueled generation facilities. The change also reflected $19 million in higher maintenance costs incurred during planned and unplanned lignite-fueled generation unit outages in 2009 that was more than offset by the $31 million effect of two planned nuclear generation unit outages in 2008 as compared to one in 2009.
81
Depreciation and amortization increased $80 million, or 7%, to $1.172 billion in 2009. The increase was driven by $39 million in higher amortization expense related to the intangible asset representing retail customer relationships recorded in purchase accounting and $24 million due to the placement in service of two new generation units and related mining assets. Increased lignite generation unit depreciation as a result of normal capital additions as well as adjustments to useful lives of components was partially offset by lower natural gas generation unit depreciation resulting from an impairment in 2008.
SG&A expenses increased $59 million, or 9%, to $741 million in 2009. The increase reflected $36 million in higher retail bad debt expense, reflecting higher delinquencies due to delays in final bills and disconnects resulting from a system conversion, customer losses and general economic conditions. The increase also reflected higher employee related expenses, the implementation of a new retail customer information management system and the transition of certain previously outsourced customer operations, partially offset by $13 million in lower fees associated with the sale of receivables program.
See Note 4 to Financial Statements for discussion of the impairments of goodwill of $70 million in 2009 and $8.0 billion in 2008.
Other income totaled $59 million in 2009 and $34 million in 2008. The 2009 amount included a $23 million reversal of a use tax accrual, an $11 million reversal of exit liabilities recorded in connection with the termination of outsourcing arrangements (see Note 19 to Financial Statements), a $6 million fee received related to an interest rate swap/commodity hedge derivative agreement, $5 million in royalty income and $5 million in sales/use tax refunds. The 2008 amount included an insurance recovery of $21 million and $4 million in royalty income. See Note 9 to Financial Statements for more details.
Other deductions totaled $68 million in 2009 and $1.274 billion in 2008. The 2009 amount included $34 million in charges for the impairment of land expected to be sold within the next 12 months, $7 million in charges for severance and other individually immaterial miscellaneous expenses. The 2008 amount included $501 million in impairment charges related to NOx and SO2 environmental allowances intangible assets and $481 million related to trade name intangible assets, both discussed in Note 4 to Financial Statements, $229 million in impairment charges related to the natural gas-fueled generation facilities discussed in Note 5 to Financial Statements and $26 million in charges to reserve for net receivables (excluding termination related costs) from terminated hedging transactions with subsidiaries of Lehman Brothers Holdings Inc., which filed for bankruptcy under Chapter 11 of the US Bankruptcy Code. See Note 9 to Financial Statements for more details.
Interest expense and related charges decreased $2.064 billion, or 51%, to $1.946 billion in 2009. The decrease reflected a $696 million unrealized mark-to-market net gain related to interest rate swaps in 2009 compared to a $1.477 billion net loss in 2008, partially offset by $118 million in increased noncash amortization of losses on interest rate swaps dedesignated as cash flow hedges in August 2008.
Income tax expense totaled $407 million in 2009 compared to an income tax benefit totaling $450 million in 2008. Excluding the impacts of the goodwill impairment of $70 million in 2009 and $8.0 billion in 2008, the effective income tax rate was 36.7% in 2009 and 32.6% in 2008. (These nondeductible charges distort the comparison; therefore, they have been excluded for purposes of a more meaningful discussion.) The increase in the rate reflects the effect of interest accrued for uncertain tax positions, which increased the rate on income in 2009 and decreased the rate on a loss in 2008.
After-tax results for the segment improved $9.560 billion to net income of $631 million in 2009, reflecting the 2008 impairment of goodwill, the 2008 impairment charges reported in other deductions and the change in unrealized mark-to-market values of interest rate swaps reported in interest expense, partially offset by lower net gains from commodity hedging and trading activities driven by lower unrealized mark-to-market net gains.
82
Regulated Delivery Segment
The following tables present financial operating results of the Regulated Delivery segment for the years ended December 31, 2009 and 2008. Comparative segment results for the years ended December 31, 2010 and 2009 are discussed above with consolidated results of equity in earnings of unconsolidated subsidiaries. Effective January 1, 2010, Oncor (and its majority owner, Oncor Holdings) was deconsolidated as a result of amended consolidation accounting standards related to variable interest entities (see Note 3 to Financial Statements).
Financial Results
| | | | | | | | |
| | | Year Ended December 31, | |
| | | 2009 | | | 2008 | |
Operating revenues | | $ | 2,690 | | | $ | 2,580 | |
Operating costs | | | (908 | ) | | | (828 | ) |
Depreciation and amortization | | | (557 | ) | | | (492 | ) |
Selling, general and administrative expenses | | | (194 | ) | | | (164 | ) |
Franchise and revenue-based taxes | | | (250 | ) | | | (255 | ) |
Impairment of goodwill | | | — | | | | (860 | ) |
Other income | | | 49 | | | | 45 | |
Other deductions | | | (34 | ) | | | (19 | ) |
Interest income | | | 43 | | | | 45 | |
Interest expense and related charges | | | (346 | ) | | | (317 | ) |
| | | | | | | | |
Income (loss) before income taxes | | | 493 | | | | (265 | ) |
Income tax expense (a) | | | (173 | ) | | | (221 | ) |
| | | | | | | | |
Net income (loss) | | $ | 320 | | | $ | (486 | ) |
| | | | | | | | |
| (a) | Effective with the sale of noncontrolling interests (see Note 14 to Financial Statements), Oncor is taxed as a partnership and thus not subject to income taxes; however, subsequent to the sale, Oncor reflects a “provision in lieu of income taxes,” and the results of segments are evaluated as if they file their own income tax returns. |
83
Operating Data
| | | | | | | | |
| | | Year Ended December 31, | |
| | | 2009 | | | 2008 | |
Operating statistics – volumes: | | | | | | | | |
Electric energy billed volumes (GWh) | | | 103,376 | | | | 107,828 | |
| | |
Reliability statistics (a): | | | | | | | | |
System Average Interruption Duration Index (SAIDI) (nonstorm) | | | 84.5 | | | | 85.4 | |
System Average Interruption Frequency Index (SAIFI) (nonstorm) | | | 1.1 | | | | 1.1 | |
Customer Average Interruption Duration Index (CAIDI) (nonstorm) | | | 77.2 | | | | 74.7 | |
| | |
Electric points of delivery (end of period and in thousands): | | | | | | | | |
Electricity distribution points of delivery (based on number of meters) | | | 3,145 | | | | 3,123 | |
| | |
Operating revenues: | | | | | | | | |
Electricity distribution revenues (b): | | | | | | | | |
Affiliated (TCEH) | | $ | 1,017 | | | $ | 998 | |
Nonaffiliated | | | 1,339 | | | | 1,264 | |
| | | | | | | | |
Total distribution revenues | | | 2,356 | | | | 2,262 | |
Third-party transmission revenues | | | 299 | | | | 280 | |
Other miscellaneous revenues | | | 35 | | | | 38 | |
| | | | | | | | |
Total operating revenues | | $ | 2,690 | | | $ | 2,580 | |
| | | | | | | | |
| (a) | SAIDI is the average number of minutes electric service is interrupted per consumer in a year. SAIFI is the average number of electric service interruptions per consumer in a year. CAIDI is the average duration in minutes per electric service interruption in a year. The statistics presented are based on the preceding twelve months’ data. |
| (b) | Includes transition charge revenue associated with the issuance of securitization bonds totaling $147 million and $140 million for the years ended December 31, 2009 and 2008, respectively. Also includes disconnect/reconnect fees and other discretionary revenues for services requested by REPs. |
Regulated Delivery Segment — Financial Results — Year Ended December 31, 2009 Compared to Year Ended December 31, 2008
Operating revenues increased $110 million, or 4%, to $2.690 billion in 2009. The increase reflected:
| | • | | $55 million from increased distribution tariffs, including the August 2009 rate review order; |
| | • | | $28 million from a surcharge to recover advanced metering deployment costs and $11 million from a surcharge to recover additional energy efficiency costs, both of which became effective with the January 2009 billing cycle; |
| | • | | $20 million in higher transmission revenues reflecting rate increases to recover ongoing investment in the transmission system; |
| | • | | an estimated $14 million impact from growth in points of delivery; |
| | • | | $9 million performance bonus for meeting PUCT energy efficiency targets, and |
| | • | | $7 million in higher charges to REPs related to transition bonds (with an offsetting increase in amortization of the related regulatory asset), |
partially offset by an estimated $27 million in lower average consumption primarily due to the effects of milder weather and general economic conditions and $7 million due to less requested REP discretionary and third-party maintenance services.
84
Operating costs increased $80 million, or 10%, to $908 million in 2009. The increase reflected $45 million in higher fees paid to other transmission entities, $21 million in additional expense recognition as a result of the PUCT’s August 2009 final order in the rate review (see discussion immediately below) and $10 million in costs related to programs designed to improve customer electricity demand efficiency, the majority of which are reflected in the revenue increases discussed above.
Under accounting rules for rate regulated utilities, certain costs are deferred as regulatory assets (see Note 24 to Financial Statements) when incurred and are recognized as expense when recovery of the costs are allowed in revenue under regulatory approvals. Accordingly, beginning in September 2009, the effective date of the new tariffs resulting from the rate review, Oncor began to amortize as operating costs or SG&A expenses certain costs previously deferred as regulatory assets over the recoverability period under the rate review order and recognized higher costs related to the current period. The additional expense recognized included $14 million related to storm recovery costs and $10 million related to pension and OPEB costs (including $3 million reported in SG&A expense).
Depreciation and amortization increased $65 million, or 13%, to $557 million in 2009. The increase reflected $34 million in higher depreciation due to ongoing investments in property, plant and equipment (including $11 million related to advanced meters), $24 million due to increased depreciation and amortization rates implemented upon the PUCT approval of new tariffs in September 2009 and $7 million in higher amortization of regulatory assets associated with securitization bonds (with an offsetting increase in revenues).
SG&A expenses increased $30 million, or 18%, to $194 million in 2009. The increase reflected $12 million related to advanced meters and $3 million in additional expense recognition as a result of the PUCT’s final order in the rate review, both of which have related revenue increases, $8 million in higher professional and contractor fees driven by outsourcing transition and CREZ development activities and $6 million in higher costs related to employee benefit plans, partially offset by a $3 million one-time reversal of bad debt expense due to the PUCT’s finalization of the Certification of Retail Electric Providers rule in April 2009. Write-offs of uncollectible amounts owed by nonaffiliated REPs are deferred as a regulatory asset.
Taxes other than amounts related to income taxes decreased $5 million, or 2%, to $250 million in 2009 reflecting a decrease in local franchise fees due to decreased volumes of electricity delivered.
See Note 4 to Financial Statements for a discussion of the $860 million goodwill impairment charge recorded in 2008.
Other income totaled $49 million in 2009 and $45 million in 2008. The 2009 and 2008 amounts included accretion of an adjustment (discount) to regulatory assets resulting from purchase accounting totaling $39 million and $44 million, respectively. The 2009 amount also included $10 million due to the reversal of exit liabilities recorded in purchase accounting related to the termination of outsourcing arrangements. See Note 19 to Financial Statements.
Other deductions totaled $34 million in 2009 and $19 million in 2008. The 2009 amount included a $25 million write off of regulatory assets (see Note 24 to Financial Statements). The 2009 and 2008 amounts included costs totaling $2 million and $13 million, respectively, associated with a rate settlement with certain cities in 2006.
Interest income decreased $2 million, or 4%, to $43 million in 2009. The decrease reflected $4 million in lower reimbursement of transition bond interest from TCEH due to lower remaining principal amounts of the bonds and $2 million in lower interest income on temporary cash investments and restricted cash due to lower interest rates, partially offset by $4 million in higher earnings on investments held for certain employee benefit plans.
Interest expense and related charges increased $29 million, or 9%, to $346 million in 2009. The increase reflected $17 million in higher average borrowings, reflecting ongoing capital investments. The increase also reflected $12 million due to higher average interest rates, which was driven by refinancing of short-term borrowings with $1.5 billion of senior secured notes issued in September 2008. The majority of the proceeds of the September 2008 notes issuance was used to pay outstanding short-term borrowings under Oncor’s credit facility.
85
Income tax expense totaled $173 million in 2009 compared to $221 million in 2008. The effective rate decreased to 35.1% in 2009 from 37.2% in 2008, excluding the impact of the $860 million goodwill impairment in 2008. (This nondeductible charge distorts the comparison; therefore, it has been excluded for purposes of a more meaningful discussion.) The decrease in the rate was driven by the reversal of accrued interest due to the favorable resolution of uncertain tax positions.
Net income for 2009 totaled $320 million and net loss for 2008 totaled $486 million. The change reflects the $860 million goodwill impairment charge recorded in 2008, as well as $53 million in lower results in 2009 driven by the effect of lower average consumption on revenues, the write-off of certain regulatory assets and increased interest expense.
86
Energy-Related Commodity Contracts and Mark-to-Market Activities
The table below summarizes the changes in commodity contract assets and liabilities for the periods presented. The net changes in these assets and liabilities, excluding “other activity” as described below, represent the pretax effect on earnings of positions in the commodity contract portfolio that are marked-to-market in net income (see Note 17 to Financial Statements). The portfolio consists primarily of economic hedges but also includes trading positions.
| | | | | | | | | | | | |
| | | Year Ended December 31, | |
| | | 2010 | | | 2009 | | | 2008 | |
Commodity contract net asset (liability) as of beginning of period | | $ | 1,718 | | | $ | 430 | | | $ | (1,917 | ) |
Settlements of positions (a) | | | (943 | ) | | | (518 | ) | | | 39 | |
Changes in fair value (b) | | | 2,162 | | | | 1,741 | | | | 2,294 | |
Other activity (c) | | | 160 | | | | 65 | | | | 14 | |
| | | | | | | | | | | | |
Commodity contract net asset as of end of period | | $ | 3,097 | | | $ | 1,718 | | | $ | 430 | |
| | | | | | | | | | | | |
| (a) | Represents reversals of previously recognized unrealized gains and losses upon settlement (offsets realized gains and losses recognized in the settlement period). |
| (b) | Represents unrealized gains and losses recognized, primarily related to positions in the long-term hedging program (see discussion above under “Long-Term Hedging Program”). Includes gains and losses recorded at contract inception dates (see Note 17 to the Financial Statements). |
| (c) | The 2010 amount includes a $116 million noncash gain on termination of a long-term power sales contract. Includes amounts related to options purchased and sold and physical natural gas exchange transactions. |
Unrealized gains and losses related to commodity contracts are summarized as follows:
| | | | | | | | | | | | |
| | | Year Ended December 31, | |
| | | 2010 | | | 2009 | | | 2008 | |
Unrealized gains (losses) related to contracts marked-to-market | | $ | 1,219 | | | $ | 1,223 | | | $ | 2,333 | |
Ineffectiveness gains (losses) related to cash flow hedges | | | 2 | | | | 2 | | | | (4 | ) |
| | | | | | | | | | | | |
Total unrealized gains (losses) related to commodity contracts | | $ | 1,221 | | | $ | 1,225 | | | $ | 2,329 | |
| | | | | | | | | | | | |
87
Maturity Table — The following table presents the net commodity contract asset arising from recognition of fair values under mark-to-market accounting as of December 31, 2010, scheduled by the source of fair value and contractual settlement dates of the underlying positions.
| | | | | | | | | | | | | | | | | | | | |
| | | Maturity dates of unrealized commodity contract asset as of December 31, 2010 | |
Source of fair value | | Less than
1 year | | | 1-3 years | | | 4-5 years | | | Excess of
5 years | | | Total | |
Prices actively quoted | | $ | (139 | ) | | $ | (9 | ) | | $ | — | | | $ | — | | | $ | (148 | ) |
Prices provided by other external sources | | | 1,248 | | | | 1,655 | | | | — | | | | — | | | | 2,903 | |
Prices based on models | | | (7 | ) | | | (21 | ) | | | 370 | | | | — | | | | 342 | |
| | | | | | | | | | | | | | | | | | | | |
Total | | $ | 1,102 | | | $ | 1,625 | | | $ | 370 | | | $ | — | | | $ | 3,097 | |
| | | | | | | | | | | | | | | | | | | | |
Percentage of total fair value | | | 36 | % | | | 52 | % | | | 12 | % | | | — | % | | | 100 | % |
The “prices actively quoted” category reflects only exchange traded contracts for which active quotes are readily available. The “prices provided by other external sources” category represents forward commodity positions valued using prices for which over-the-counter broker quotes are available in active markets. Over-the-counter quotes for power in ERCOT that are deemed active markets (excluding the West hub) generally extend through 2013 and over-the-counter quotes for natural gas generally extend through 2015, depending upon delivery point. The “prices based on models” category contains the value of all nonexchange traded options, valued using option pricing models. In addition, this category contains other contractual arrangements that may have both forward and option components, as well as other contracts that are valued using proprietary long-term pricing models that utilize certain market based inputs. See Note 15 to Financial Statements for fair value disclosures and discussion of fair value measurements.
88
COMPREHENSIVE INCOME
Cash flow hedge activity reported in other comprehensive income included (all amounts after-tax):
| | | | | | | | | | | | |
| | | Year Ended December 31, | |
| | | 2010 | | | 2009 | | | 2008 | |
Net decrease in fair value of cash flow hedges: | | | | | | | | | | | | |
Commodities | | $ | — | | | $ | (20 | ) | | $ | (8 | ) |
Financing – interest rate swaps | | | — | | | | — | | | | (175 | ) |
| | | | | | | | | | | | |
| | | — | | | | (20 | ) | | | (183 | ) |
| | | | | | | | | | | | |
Derivative value net losses reported in net income that relate to hedged transactions recognized in the period: | | | | | | | | | | | | |
Commodities | | | 1 | | | | 11 | | | | 11 | |
Financing – interest rate swaps | | | 58 | | | | 119 | | | | 111 | |
| | | | | | | | | | | | |
| | | 59 | | | | 130 | | | | 122 | |
| | | | | | | | | | | | |
Total income (loss) effect of cash flow hedges reported in other comprehensive income | | $ | 59 | | | $ | 110 | | | $ | (61 | ) |
| | | | | | | | | | | | |
We have historically used, and expect to continue to use, derivative instruments that are effective in offsetting future cash flow variability in interest rates and energy commodity prices, but as of December 31, 2010 and 2009, there were no such instruments accounted for as cash flow or fair value hedges. Amounts in accumulated other comprehensive income include the value of dedesignated and terminated cash flow hedges at the time of such dedesignation/termination, less amounts reclassified to earnings as the original hedged transactions are recognized, unless the hedged transactions become probable of not occurring. The effects of the hedge will be recorded in the statement of income as the hedged transactions are actually settled and affect earnings. Also see Note 17 to Financial Statements.
89
FINANCIAL CONDITION
Liquidity and Capital Resources
Operating Cash Flows
Year Ended December 31, 2010 Compared to Year Ended December 31, 2009 — Cash provided by operating activities declined $605 million to $1.106 billion in 2010. The deconsolidation of Oncor in 2010 reduced reported cash provided by operating activities by $932 million. The decrease also reflected a $350 million effect of the amended accounting standard related to the accounts receivable securitization program (see Note 10 to Financial Statements), under which the $383 million of funding under the program upon the January 1, 2010 adoption is reported as a use of operating cash flows and a source of financing cash flows, with subsequent 2010 activity reported as financing, and the $33 million decline in funding in 2009 is reported as use of operating cash flows. These accounting effects were partially offset by improved working capital performance, particularly in retail accounts receivable due to the effects in 2009 of implementing a new customer information management system and more timely collections in 2010, as well as higher cash earnings from the competitive business driven by the contribution of the new generation units.
Year Ended December 31, 2009 Compared to Year Ended December 31, 2008 —Cash provided by operating activities totaled $1.711 billion and $1.505 billion in 2009 and 2008, respectively. The $206 million increase reflected:
| | • | | a $489 million decrease in cash interest paid due to the payment of approximately $465 million of interest with an increase in toggle notes instead of cash as discussed under “Toggle Notes Interest Election” below, and |
| | • | | a $57 million favorable impact of timing of advanced metering surcharges, |
partially offset by a $347 million decrease in net margin deposits received primarily due to the effects of forward natural gas prices on positions in the long-term hedging program.
Depreciation and amortization expense reported in the statement of cash flows exceeded the amount reported in the statement of income by $371 million, $418 million and $460 million for the years ended December 31, 2010, 2009 and 2008, respectively. The difference represented amortization of nuclear fuel, which is reported as fuel costs in the statement of income consistent with industry practice, and amortization of intangible net assets and debt fair value discounts arising from purchase accounting that is reported in various other income statement line items including operating revenues, fuel and purchased power costs and delivery fees, other income and interest expense and related charges.
Financing Cash Flows
Year Ended December 31, 2010 Compared to Year Ended December 31, 2009 — Cash used in financing activities totaled $264 million in 2010 compared to cash provided of $422 million in 2009. The $686 million change was driven by debt repurchases under our liability management program (see Note 11 to Financial Statements), partially offset by the effect of the amended accounting standard related to the accounts receivable securitization program (see Note 10 to Financial Statements), under which the $96 million of funding under the program in 2010 is reported as financing cash flows.
Year Ended December 31, 2009 Compared to Year Ended December 31, 2008 —Cash provided by financing activities totaled $422 million and $2.837 billion in 2009 and 2008, respectively. The $2.415 billion decrease was driven by $1.253 billion in net proceeds from the sale of noncontrolling interests in 2008 (see Note 14 to Financial Statements) and reduced borrowings in 2009 related to the construction of new generation facilities, which were nearing completion.
See Note 11 to Financial Statements for further detail of short-term borrowings and long-term debt.
90
Investing Cash Flows
Year Ended December 31, 2010 Compared to Year Ended December 31, 2009 — Cash used in investing activities totaled $468 million and $2.633 billion in 2010 and 2009, respectively. Capital expenditures (excluding nuclear fuel) totaled $838 million and $2.348 billion in 2010 and 2009, respectively. The $1.510 billion decline in capital spending reflected the deconsolidation of Oncor ($998 million capital expenditures in 2009) (see Note 3 to Financial Statements) in 2010 and a decrease in spending related to the construction of the now complete new generation facilities. The decline in cash used in investing activities also reflected a $400 million cash investment posted with a derivative counterparty in 2009 that was returned in 2010.
Capital expenditures in 2010 consisted of:
| | • | | $487 million for major maintenance, primarily in existing generation operations; |
| | • | | $140 million related to completion of the construction of a second generation unit and mine development at Oak Grove; |
| | • | | $106 million for environmental expenditures related to existing generation units; |
| | • | | $42 million for information technology and other corporate investments; |
| | • | | $34 million related to nuclear generation development, and |
| | • | | $29 million primarily related to the new retail customer information system. |
Year Ended December 31, 2009 Compared to Year Ended December 31, 2008 —Cash used in investing activities totaled $2.633 billion and $2.934 billion in 2009 and 2008, respectively, including capital expenditures totaling $2.348 billion and $2.849 billion, respectively. The decline in capital spending primarily reflected a decrease in spending related to the construction of the new generation facilities, partially offset by capital expenditures in the regulated business for advanced metering deployment and CREZ.
Debt Financing Activity—Activities related to short-term borrowings and long-term debt during the year ended December 31, 2010 are as follows (all amounts presented are principal, and repayments and repurchases include amounts related to capital leases and exclude amounts related to debt discount, financing and reacquisition expenses):
| | | | | | | | |
| | | Borrowings (a) | | | Repayments
and
Repurchases (b) | |
TCEH | | $ | 1,779 | | | $ | 2,758 | |
EFCH | | | — | | | | 9 | |
EFIH | | | 2,180 | | | | — | |
EFH Corp. | | | 1,255 | | | | 4,444 | |
| | | | | | | | |
Total long-term | | | 5,214 | | | | 7,211 | |
| | | | | | | | |
Total short-term – TCEH (c) | | | 172 | | | | — | |
| | | | | | | | |
Total | | $ | 5,386 | | | $ | 7,211 | |
| | | | | | | | |
| |
| | (a) | Includes the following activities (see Note 11 to Financial Statements): |
| | • | | $500 million of EFH Corp. 10% Notes issued by EFH Corp., the proceeds of which may be used in debt exchanges or repurchases. |
| | • | | $350 million of TCEH 15% Notes issued by TCEH, the net proceeds from which were used to repurchase TCEH Senior Notes. |
| | • | | Principal increases in payment of accrued interest totaling $194 million and $205 million of EFH Corp. and TCEH Toggle Notes, respectively. |
| | • | | $561 million of EFH Corp. 10% Notes issued by EFH Corp. in debt exchanges. |
| | • | | $2.180 billion of EFIH 10% Notes issued by EFIH in debt exchanges. |
| | • | | $1.221 billion of TCEH 15% Notes issued by TCEH in debt exchanges. |
| | (b) | Includes $5.862 billion of noncash retirements (including discounts captured on cash repurchases) as a result of 2010 debt exchange and repurchase transactions discussed in Note 11 to Financial Statements. |
| | (c) | Short-term amounts represent net borrowings/repayments. |
See Note 11 to Financial Statements for further detail of long-term debt and other financing arrangements.
91
We regularly monitor the capital and bank credit markets for liability management opportunities that we believe will improve our balance sheet, including capturing debt discount and extending debt maturities. As a result, we may engage, from time to time, in liability management transactions. Future activities under the liability management program may include the purchase of our outstanding debt for cash in open market purchases or privately negotiated transactions (including pursuant to a Section 10b-5(1) plan) or via public or private exchange or tender offers. Moreover, as part of our liability management program, we may refinance our existing debt, including the TCEH Senior Secured Credit Facilities.
In evaluating whether to undertake any liability management transaction, including any refinancing, we will take into account liquidity requirements, prospects for future access to capital, contractual restrictions, the market price of our outstanding debt and other factors. Any liability management transaction, including any refinancing, may occur on a stand-alone basis or in connection with, or immediately following, other liability management transactions.
Available Liquidity — The following table summarizes changes in available liquidity for the year ended December 31, 2010 (excluding Oncor):
| | | | | | | | | | | | |
| | | Available Liquidity | |
| | | December 31, 2010 | | | December 31, 2009 | | | Change | |
Cash and cash equivalents | | $ | 1,534 | | | $ | 1,161 | | | $ | 373 | |
TCEH Revolving Credit Facility (a) | | | 1,440 | | | | 1,721 | | | | (281 | ) |
TCEH Letter of Credit Facility | | | 261 | | | | 399 | | | | (138 | ) |
| | | | | | | | | | | | |
Subtotal | | $ | 3,235 | | | $ | 3,281 | | | $ | (46 | ) |
Short-term investment (b) | | | — | | | | 490 | | | | (490 | ) |
| | | | | | | | | | | | |
Total liquidity (c) | | $ | 3,235 | | | $ | 3,771 | | | $ | (536 | ) |
| | | | | | | | | | | | |
| (a) | As of December 31, 2010 and 2009, the TCEH Revolving Credit Facility includes $94 million and $141 million, respectively, of commitments from Lehman that are only available from the fronting banks and the swingline lender. |
| (b) | December 31, 2009 amount includes $425 million cash investment (including accrued interest) and $65 million in letters of credit posted related to certain interest rate and commodity hedge transactions. Pursuant to the related agreement, the collateral was returned in March 2010. See Note 17 to Financial Statements. |
| (c) | As of December 31, 2010 and 2009, total liquidity includes $465 million and $333 million, respectively, of net receipts of margin deposits from counterparties related to commodity positions (net of $166 million and $187 million, respectively, posted with counterparties). |
Note: Available liquidity in the future could benefit from additional exercises of the payment-in-kind (PIK) option on the EFH Corp. Toggle Notes and TCEH Toggle Notes, which for the remaining payment dates from May 2011 through November 2012 would avoid cash interest payments of approximately $424 million.
See Note 11 to Financial Statements for additional discussion of the credit facilities.
The $536 million decrease in available liquidity reflected the impact of the liability management program and an increase in letters of credit posted as collateral support with ERCOT in conjunction with ERCOT’s transition to a nodal wholesale market structure.
Pension and OPEB Plan Funding— Pension and OPEB plan funding is expected to total $175 million and $26 million, respectively, in 2011. Based on the funded status of the pension plan as of December 31, 2010, funding is expected to total $932 million for the 2011 to 2015 period. The increase in funding reflects requirements under the Pension Protection Act of 2006, which were impacted by the effect of lower interest rates in the computation of our pension liability. Oncor is expected to fund 72% of this amount consistent with its share of the pension liability. We made pension and OPEB contributions of $45 million and $25 million, respectively, in 2010, of which $58 million was contributed by Oncor.
See Note 20 to Financial Statements for more information regarding the pension and OPEB plans, including the funded status of the plans as of December 31, 2010.
92
Toggle Notes Interest Election — EFH Corp. and TCEH have the option every six months at their discretion, ending with the interest payment due November 2012, to use the payment-in-kind (PIK) feature of their respective toggle notes in lieu of making cash interest payments. We elected to do so beginning with the May 2009 interest payment as an efficient and cost-effective method to further enhance liquidity. Once EFH Corp. and/or TCEH make a PIK election, the election is valid for each succeeding interest payment period until EFH Corp. and/or TCEH revoke the applicable election. Use of the PIK feature will be evaluated at each election period, taking into account market conditions and other relevant factors at such time.
EFH Corp. made its 2010 and 2009 interest payments and will make its May 2011 interest payment on the EFH Corp. Toggle Notes by using the PIK feature of those notes. During such applicable interest periods, the interest rate on these notes is increased from 11.25% to 12.00%. EFH Corp. increased the aggregate principal amount of the notes by $194 million in 2010 (excluding $130 million principal amount issued to EFIH as holder of $2.166 billion principal amount of EFH Corp. Toggle Notes acquired in the debt exchange completed in August 2010 that is eliminated in consolidation) and $309 million in 2009 and is expected to further increase the aggregate principal amount of the notes by $34 million in May 2011 (excluding $138 million principal amount expected to be issued to EFIH). The elections increased liquidity in 2010 by an amount equal to $182 million (excluding $122 million related to notes held by EFIH) and is expected to further increase liquidity in May 2011 by an amount equal to a currently estimated $32 million (excluding $129 million related to notes held by EFIH), constituting the amounts of cash interest that otherwise would have been payable on the notes.
Similarly, TCEH made its 2010 and 2009 interest payments and will make its May 2011 interest payment on the TCEH Toggle Notes by using the PIK feature of those notes. During the applicable interest periods, the interest rate on the notes is increased from 10.50% to 11.25%. TCEH increased the aggregate principal amount of the notes by approximately $212 million in 2010, including $7 million principal amount paid to EFH Corp. and eliminated in consolidation, and $202.5 million in 2009 and is expected to further increase the aggregate principal amount of the notes by $79 million in May 2011. The elections increased liquidity in 2010 by an amount equal to $198 million and is expected to further increase liquidity in May 2011 by an amount equal to an estimated $74 million, constituting the amounts of cash interest that otherwise would have been payable on the notes.
Liquidity Effects of Commodity Hedging and Trading Activities — Commodity hedging and trading transactions typically require a counterparty to post collateral if the forward price of the underlying commodity moves such that the hedging or trading instrument held by such counterparty has declined in value. TCEH uses cash, letters of credit, asset-backed liens and other forms of credit support to satisfy such collateral obligations. In addition, TCEH’s Commodity Collateral Posting Facility (CCP facility), an uncapped senior secured revolving credit facility that matures in December 2012, funds the cash collateral posting requirements for a significant portion of the positions in the long-term hedging program not otherwise secured by a first-lien in the assets of TCEH. The aggregate principal amount of the CCP facility is determined by the exposure arising from higher forward market prices, regardless of the amount of such exposure, on a portfolio of certain natural gas hedging transaction volumes. Including those hedging transactions where margin deposits are covered by unlimited borrowings under the CCP facility, as of December 31, 2010, more than 95% of the long-term natural gas hedging program transactions were secured by a first-lien interest in the assets of TCEH that is pari passu with the TCEH Senior Secured Facilities, the effect of which is a significant reduction in the liquidity exposure associated with collateral requirements for those hedging transactions. Due to declines in forward natural gas prices, no amounts were borrowed against the CCP facility at December 31, 2010 and 2009. See Note 11 to Financial Statements for more information about the TCEH Senior Secured Facilities, which includes the CCP facility.
93
As of December 31, 2010, TCEH received or posted cash and letters of credit for commodity hedging and trading activities as follows:
| | • | | $165 million in cash has been posted with counterparties for exchange cleared transactions (including initial margin), as compared to $183 million posted as of December 31, 2009; |
| | • | | $630 million in cash has been received from counterparties, net of $1 million in cash posted, for over-the-counter and other non-exchange cleared transactions, as compared to $516 million received, net of $4 million in cash posted, as of December 31, 2009; |
| | • | | $473 million in letters of credit have been posted with counterparties, as compared to $379 million posted as of December 31, 2009, and |
| | • | | $25 million in letters of credit have been received from counterparties, as compared to $44 million received as of December 31, 2009. |
With respect to exchange cleared transactions, these transactions typically require initial margin (i.e., the upfront cash and/or letter of credit posted to take into account the size and maturity of the positions and credit quality) in addition to variance margin (i.e., the daily cash margin posted to take into account changes in the value of the underlying commodity). The amount of initial margin required is generally defined by exchange rules. Clearing agents, however, typically have the right to request additional initial margin based on various factors including market depth, volatility and credit quality, which may be in the form of cash, letters of credit, a guaranty or other forms as negotiated with the clearing agent. With respect to cash collateral that is received, such cash collateral is either used for working capital and other corporate purposes, including reducing short-term borrowings under credit facilities, or it is required to be deposited in a separate account and restricted from being used for working capital and other corporate purposes. With respect to over-the-counter transactions, counterparties generally have the right to substitute letters of credit for such cash collateral. In such event, the cash collateral previously posted would be returned to such counterparties thereby reducing liquidity in the event that it was not restricted. As of December 31, 2010, restricted cash collateral held totaled $33 million. See Note 24 to Financial Statements regarding restricted cash.
With the long-term hedging program, increases in natural gas prices generally result in increased cash collateral and letter of credit postings to counterparties. As of December 31, 2010, approximately 300 million MMBtu of positions related to the long-term hedging program were not directly secured on an asset-lien basis and thus have cash collateral posting requirements. The uncapped CCP facility supports the collateral posting requirements related to most of these transactions.
Interest Rate Swap Transactions —See Note 11 to Financial Statements for TCEH interest rate swaps entered into as of December 31, 2010.
Income Tax Refunds/Payments —Income tax payments related to the Texas margin tax are expected to total approximately $65 million, and net refunds of federal income taxes are expected to total approximately $57 million in the next 12 months. Payments in the year ended December 31, 2010 totaled $64 million. In 2009, we received a refund totaling $98 million in income taxes and related interest related to IRS audits of 1993 and 1994 income tax returns and made net payments totaling approximately $44 million related to the Texas margin tax. In 2008, we received net federal income tax refunds of $229 million, including $98 million related to 2007 tax payments and $142 million related to a net operating loss carryback to the 2006 tax year.
As discussed in Note 7 to Financial Statements, we assess uncertain tax positions under a “more-likely-than-not” standard. We cannot reasonably estimate the ultimate amounts and timing of tax payments associated with uncertain tax positions, but expect that no material federal income tax payments related to such positions will be made in 2011.
94
Accounts Receivable Securitization Program — TXU Energy participates in EFH Corp.’s accounts receivable securitization program with financial institutions (the funding entities). As discussed in Note 1 to Financial Statements, in accordance with amended transfers and servicing accounting standards, the trade accounts receivable amounts under the program are reported as pledged balances and the related funding amounts are reported as short-term borrowings. Under the program, TXU Energy (originator) sells retail trade accounts receivable to TXU Receivables Company, a consolidated wholly-owned bankruptcy-remote direct subsidiary of EFH Corp., which sells undivided interests in the purchased accounts receivable for cash to entities established for this purpose by the funding entities. All new trade receivables under the program generated by the originator are continuously purchased by TXU Receivables Company with the proceeds from collections of receivables previously purchased. Funding under the program totaled $96 million and $383 million as of December 31, 2010 and 2009, respectively. See Note 10 to Financial Statements for a more complete description of the program including amendments to the program in June 2010 and a related reduction in funding, the impact of the program on the financial statements for the periods presented and the contingencies that could result in termination of the program and a reduction of liquidity should the underlying financing be settled.
Liquidity Needs, Including Capital Expenditures —Capital expenditures, including capitalized interest, for 2011 are expected to total approximately $700 million and include:
| | • | | $525 million for investments in TCEH generation facilities, including approximately: |
| | • | | $450 million for major maintenance, primarily in generation operations, and |
| | • | | $75 million for environmental expenditures related to generation units (a); |
| | • | | $125 million for nuclear fuel purchases, and |
| | • | | $50 million for information technology and other corporate investments. |
| | (a) | Expenditures are classified as environmental in nature if the projects are the direct result of environmental regulations. |
We expect cash flows from operations combined with availability under our credit facilities discussed in Note 11 to Financial Statements to provide sufficient liquidity to fund our current obligations, projected working capital requirements and capital spending for a period that includes the next twelve months.
Distributions from Oncor —Until December 31, 2012, distributions paid by Oncor to its members are limited to an amount not to exceed Oncor’s net income determined in accordance with GAAP, subject to certain defined adjustments. Distributions are further limited by an agreement that Oncor’s regulatory capital structure, as determined by the PUCT, will be at or below the assumed debt-to-equity ratio established periodically by the PUCT for ratemaking purposes, which is currently set at 60% debt to 40% equity. (See Note 13 to Financial Statements.) Also, see “Regulatory Matters — Oncor Matters with the PUCT” for discussion of a rate review filed by Oncor in January 2011 that, among other things, requests a revised regulatory capital structure of 55% debt to 45% equity.
In January 2009, the PUCT awarded certain CREZ construction projects to Oncor. See discussion below under “Regulatory Matters – Oncor Matters with the PUCT.” As a result of the increased capital expenditures for CREZ and the debt-to-equity ratio cap, we expect distributions to EFH Corp. from Oncor will be substantially reduced or temporarily discontinued during the CREZ construction period, which is expected to be completed in 2013.
Capitalization — Our capitalization ratios consisted of 120.9% and 104.6% long-term debt, less amounts due currently, and (20.9)% and (4.6)% common stock equity, as of December 31, 2010 and 2009, respectively. Total debt to capitalization, including short-term debt, was 119.6% and 104.4% as of December 31, 2010 and 2009, respectively.
95
Financial Covenants, Credit Rating Provisions and Cross Default Provisions — The terms of certain of our financing arrangements contain maintenance covenants with respect to leverage ratios and/or minimum net worth. As of December 31, 2010, we were in compliance with all such maintenance covenants.
Covenants and Restrictions under Financing Arrangements—Each of the TCEH Senior Secured Facilities and the indentures governing substantially all of the debt we have issued in connection with, and subsequent to, the Merger contain covenants that could have a material impact on the liquidity and operations of EFH Corp. and its subsidiaries.
Adjusted EBITDA (as used in the restricted payments covenant contained in the indenture governing the EFH Corp. Senior Secured Notes) for the year ended December 31, 2010 totaled $5.240 billion for EFH Corp. See Exhibits 99(b), 99(c) and 99(d) for a reconciliation of net income to Adjusted EBITDA for EFH Corp., TCEH and EFIH, respectively, for the years ended December 31, 2010 and 2009.
96
The table below summarizes TCEH’s secured debt to Adjusted EBITDA ratio under the maintenance covenant in the TCEH Senior Secured Facilities and various other financial ratios of EFH Corp., EFIH and TCEH that are applicable under certain other threshold covenants in the TCEH Senior Secured Facilities and the indentures governing the TCEH Senior Notes, the TCEH Senior Secured Second Lien Notes (for 2010), the EFH Corp. Senior Notes, the EFH Corp. Senior Secured Notes and the EFIH Notes as of December 31, 2010 and 2009. The debt incurrence and restricted payments/limitations on investments covenants thresholds described below represent levels that must be met in order for EFH Corp., EFIH or TCEH to incur certain permitted debt or make certain restricted payments and/or investments. EFH Corp. and its consolidated subsidiaries are in compliance with their maintenance covenants.
| | | | | | | | | | | | |
| | | December 31,
2010 | | | December 31,
2009 | | | Threshold Level as of
December 31, 2010 | |
Maintenance Covenant: | | | | | | | | | | | | |
TCEH Senior Secured Facilities: | | | | | | | | | | | | |
Secured debt to Adjusted EBITDA ratio (a) | | | 5.19 to 1.00 | | | | 4.76 to 1.00 | | | | Must not exceed 6.75 to 1.00 (b) | |
| | | |
Debt Incurrence Covenants: | | | | | | | | | | | | |
EFH Corp. Senior Secured Notes: | | | | | | | | | | | | |
EFH Corp. fixed charge coverage ratio | | | 1.3 to 1.0 | | | | 1.2 to 1.0 | | | | At least 2.0 to 1.0 | |
TCEH fixed charge coverage ratio | | | 1.5 to 1.0 | | | | 1.5 to 1.0 | | | | At least 2.0 to 1.0 | |
EFIH Notes: | | | | | | | | | | | | |
EFIH fixed charge coverage ratio (c) | | | (d) | | | | 53.8 to 1.0 | | | | At least 2.0 to 1.0 | |
TCEH Senior Notes and TCEH Senior Secured Second Lien Notes: | | | | | | | | | | | | |
TCEH fixed charge coverage ratio | | | 1.5 to 1.0 | | | | 1.5 to 1.0 | | | | At least 2.0 to 1.0 | |
TCEH Senior Secured Facilities: | | | | | | | | | | | | |
TCEH fixed charge coverage ratio | | | 1.5 to 1.0 | | | | 1.5 to 1.0 | | | | At least 2.0 to 1.0 | |
| | | |
Restricted Payments/Limitations on Investments Covenants: | | | | | | | | | | | | |
EFH Corp. Senior Notes: | | | | | | | | | | | | |
General restrictions (Sponsor Group payments): | | | | | | | | | | | | |
EFH Corp. leverage ratio | | | 8.5 to 1.0 | | | | 9.4 to 1.0 | | | | Equal to or less than 7.0 to 1.0 | |
EFH Corp. Senior Secured Notes: | | | | | | | | | | | | |
General restrictions (non-Sponsor Group payments): | | | | | | | | | | | | |
EFH Corp. fixed charge coverage ratio (e) | | | 1.6 to 1.0 | | | | 1.4 to 1.0 | | | | At least 2.0 to 1.0 | |
General restrictions (Sponsor Group payments): | | | | | | | | | | | | |
EFH Corp. fixed charge coverage ratio (e) | | | 1.3 to 1.0 | | | | 1.2 to 1.0 | | | | At least 2.0 to 1.0 | |
EFH Corp. leverage ratio | | | 8.5 to 1.0 | | | | 9.4 to 1.0 | | | | Equal to or less than 7.0 to 1.0 | |
EFIH Notes: | | | | | | | | | | | | |
General restrictions (non-EFH Corp. payments): | | | | | | | | | | | | |
EFIH fixed charge coverage ratio (c) (f) | | | 23.9 to 1.0 | | | | 3.9 to 1.0 | | | | At least 2.0 to 1.0 | |
General restrictions (EFH Corp. payments): | | | | | | | | | | | | |
EFIH fixed charge coverage ratio (c) (f) | | | (d) | | | | 53.8 to 1.0 | | | | At least 2.0 to 1.0 | |
EFIH leverage ratio | | | 5.3 to 1.0 | | | | 4.4 to 1.0 | | | | Equal to or less than 6.0 to 1.0 | |
TCEH Senior Notes and TCEH Senior Secured Second Lien Notes: | | | | | | | | | | | | |
TCEH fixed charge coverage ratio | | | 1.5 to 1.0 | | | | 1.5 to 1.0 | | | | At least 2.0 to 1.0 | |
TCEH Senior Secured Facilities: | | | | | | | | | | | | |
Payments to Sponsor Group: | | | | | | | | | | | | |
TCEH total debt to Adjusted EBITDA ratio | | | 7.9 to 1.0 | | | | 8.4 to 1.0 | | | | Equal to or less than 6.5 to 1.0 | |
| (a) | In accordance with the terms of the TCEH Senior Secured Facilities and as the result of the new Sandow and first Oak Grove generating units achieving average capacity factors of greater than or equal to 70% for the three months ended March 31, 2010, the maintenance covenant as of December 31, 2010 includes Adjusted EBITDA for the units and the proportional amount of outstanding debt under the Delayed Draw Term Loan (see Note 11 to Financial Statements) applicable to the two units. |
| (b) | Threshold level will decrease to a maximum of 6.50 to 1.00 effective December 31, 2011. Calculation excludes secured debt that ranks junior to the TCEH Senior Secured Facilities. |
| (c) | Although EFIH currently meets the fixed charge coverage ratio threshold applicable to certain covenants contained in the indentures governing the EFIH Notes, EFIH’s ability to use such thresholds to incur debt or make restricted payments/investments is currently limited by the covenants contained in the EFH Corp. Senior Notes and the EFH Corp. Senior Secured Notes. |
| (d) | EFIH meets the ratio threshold. Because EFIH’s interest income exceeds interest expense, the result of the ratio calculation is not meaningful. |
| (e) | The EFH Corp. fixed charge coverage ratio for non-Sponsor Group payments includes the results of Oncor Holdings and its subsidiaries. The EFH Corp. fixed charge coverage ratio for Sponsor Group payments excludes the results of Oncor Holdings and its subsidiaries. |
| (f) | The EFIH fixed charge coverage ratio for non-EFH Corp. payments includes the results of Oncor Holdings and its subsidiaries. The EFIH fixed charge coverage ratio for EFH Corp. payments excludes the results of Oncor Holdings and its subsidiaries. |
97
Material Credit Rating Covenants and Credit Worthiness Effects on Liquidity — As a result of TCEH’s non-investment grade credit rating and considering collateral thresholds of certain retail and wholesale commodity contracts, as of December 31, 2010, counterparties to those contracts could have required TCEH to post up to an aggregate of $17 million in additional collateral. This amount largely represents the below market terms of these contracts as of December 31, 2010; thus, this amount will vary depending on the value of these contracts on any given day.
Certain transmission and distribution utilities in Texas have tariffs in place to assure adequate credit worthiness of any REP to support the REP’s obligation to collect securitization bond-related (transition) charges on behalf of the utility. Under these tariffs, as a result of TCEH’s below investment grade credit rating, TCEH is required to post collateral support in an amount equal to estimated transition charges over specified time periods. The amount of collateral support required to be posted, as well as the time period of transition charges covered, varies by utility. As of December 31, 2010, TCEH has posted collateral support in the form of letters of credit to the applicable utilities in an aggregate amount equal to $28 million, with $14 million of this amount posted for the benefit of Oncor.
The PUCT has rules in place to assure adequate credit worthiness of each REP, including the ability to return customer deposits, if necessary. Under these rules, as of December 31, 2010, TCEH posted letters of credit in the amount of $73 million, which are subject to adjustments.
The RRC has rules in place to assure adequate credit worthiness of parties that have mining reclamation obligations. Under these rules, should the RRC determine that the credit worthiness of Luminant Generation Company LLC (a subsidiary of TCEH) is not sufficient to support its reclamation obligations, TCEH may be required to post cash or letter of credit collateral support in an amount currently estimated to be approximately $650 million to $900 million. The actual amount (if required) could vary depending upon numerous factors, including Luminant Generation Company LLC’s credit worthiness and the level of mining reclamation obligations.
ERCOT has rules in place to assure adequate credit worthiness of parties that participate in the “day-ahead” and “real-time markets” operated by ERCOT. Under these rules, TCEH has posted collateral support, predominantly in the form of letters of credit, totaling $240 million as of December 31, 2010 (which is subject to weekly adjustments based on settlement activity with ERCOT). This amount includes an increase of approximately $200 million in letters of credit in the fourth quarter 2010 driven by the December 2010 implementation of the nodal wholesale market.
Other arrangements of EFH Corp. and its subsidiaries, including Oncor’s credit facility, the accounts receivable securitization program (see Note 10 to Financial Statements) and certain leases, contain terms pursuant to which the interest rates charged under the agreements may be adjusted depending on the relevant credit ratings.
In the event that any or all of the additional collateral requirements discussed above are triggered, we believe we will have adequate liquidity to satisfy such requirements.
Material Cross Default Provisions — Certain financing arrangements contain provisions that may result in an event of default if there were a failure under other financing arrangements to meet payment terms or to observe other covenants that could or does result in an acceleration of payments due. Such provisions are referred to as “cross default” provisions.
A default by TCEH or any of its restricted subsidiaries in respect of indebtedness, excluding indebtedness relating to the accounts receivable securitization program, in an aggregate amount in excess of $200 million may result in a cross default under the TCEH Senior Secured Facilities. Under these facilities, such a default will allow the lenders to accelerate the maturity of outstanding balances ($22.304 billion as of December 31, 2010) under such facilities.
The indentures governing the TCEH Senior Notes and the TCEH Senior Secured Second Lien Notes contain a cross acceleration provision where a payment default at maturity or on acceleration of principal indebtedness under any instrument or instruments of TCEH or any of its restricted subsidiaries in an aggregate amount equal to or greater than $250 million may cause the acceleration of the TCEH Senior Notes and TCEH Senior Secured Second Lien Notes.
98
Under the terms of a TCEH rail car lease, which had $45 million in remaining lease payments as of December 31, 2010 and terminates in 2017, if TCEH failed to perform under agreements causing its indebtedness in aggregate principal amount of $100 million or more to become accelerated, the lessor could, among other remedies, terminate the lease and effectively accelerate the payment of any remaining lease payments due under the lease.
Under the terms of another TCEH rail car lease, which had $50 million in remaining lease payments as of December 31, 2010 and terminates in 2028, if obligations of TCEH in excess of $200 million in the aggregate for payments of obligations to third party creditors under lease agreements, deferred purchase agreements or loan or credit agreements are accelerated prior to their original stated maturity, the lessor could, among other remedies, terminate the lease and effectively accelerate the payment of any remaining lease payments due under the lease.
The indentures governing the EFH Corp. Senior Secured Notes contain a cross acceleration provision whereby a payment default at maturity or on acceleration of principal indebtedness under any instrument or instruments of EFH Corp. or any of its restricted subsidiaries in an aggregate amount equal to or greater than $250 million may cause the acceleration of the EFH Corp. Senior Secured Notes.
The indentures governing the EFIH Notes contain a cross acceleration provision whereby a payment default at maturity or on acceleration of principal indebtedness under any instrument or instruments of EFIH or any of its restricted subsidiaries in an aggregate amount equal to or greater than $250 million may cause the acceleration of the EFIH Notes.
The accounts receivable securitization program contains a cross default provision with a threshold of $200 million that applies in the aggregate to the originator, any parent guarantor of an originator or any subsidiary acting as collection agent under the program. TXU Receivables Company and EFH Corporate Services Company (a direct subsidiary of EFH Corp.), as collection agent, in the aggregate have a cross default threshold of $50,000. If any of the aforementioned defaults on indebtedness of the applicable threshold were to occur, the program could terminate.
We enter into energy-related and financial contracts, the master forms of which contain provisions whereby an event of default or acceleration of settlement would occur if we were to default under an obligation in respect of borrowings in excess of thresholds, which vary, stated in the contracts. The subsidiaries whose default would trigger cross default vary depending on the contract.
Each of TCEH’s natural gas hedging agreements and interest rate swap agreements that are secured with a lien on its assets on a pari passu basis with the TCEH Senior Secured Facilities contains a cross default provision. In the event of a default by TCEH or any of its subsidiaries relating to indebtedness (such amounts varying by contract but ranging from $200 million to $250 million) that results in the acceleration of such debt, then each counterparty under these hedging agreements would have the right to terminate its hedge or interest rate swap agreement with TCEH and require all outstanding obligations under such agreement to be settled.
Other arrangements, including leases, have cross default provisions, the triggering of which would not be expected to result in a significant effect on liquidity.
99
Long-Term Contractual Obligations and Commitments— The following table summarizes our contractual cash obligations as of December 31, 2010 (see Notes 11 and 12 to Financial Statements for additional disclosures regarding these long-term debt and noncancellable purchase obligations).
| | | | | | | | | | | | | | | | | | | | |
Contractual Cash Obligations | | Less Than
One Year | | | One to
Three
Years | | | Three to
Five
Years | | | More
Than Five
Years | | | Total | |
Long-term debt – principal (a) | | $ | 651 | | | $ | 533 | | | $ | 24,233 | | | $ | 10,003 | | | $ | 35,420 | |
Long-term debt – interest (b) | | | 2,749 | | | | 5,378 | | | | 3,519 | | | | 5,517 | | | | 17,163 | |
Operating and capital leases (c) | | | 69 | | | | 124 | | | | 96 | | | | 275 | | | | 564 | |
Obligations under commodity purchase and services agreements (d) | | | 1,357 | | | | 1,347 | | | | 719 | | | | 1,023 | | | | 4,446 | |
| | | | | | | | | | | | | | | | | | | | |
Total contractual cash obligations | | $ | 4,826 | | | $ | 7,382 | | | $ | 28,567 | | | $ | 16,818 | | | $ | 57,593 | |
| | | | | | | | | | | | | | | | | | | | |
| (a) | Excludes capital lease obligations, unamortized discounts and fair value premiums and discounts related to purchase accounting. Also excludes $113 million of additional principal amount of notes expected to be issued in May 2011 and due in 2016 and 2017, reflecting the election of the PIK feature on toggle notes as discussed above under “Toggle Notes Interest Election.” |
| (b) | Includes net amounts payable under interest rate swaps. Variable interest payments and net amounts payable under interest rate swaps are calculated based on interest rates in effect as of December 31, 2010. |
| (c) | Includes short-term noncancellable leases. |
| (d) | Includes capacity payments, nuclear fuel and natural gas take-or-pay contracts, coal contracts, business services and nuclear-related outsourcing and other purchase commitments. Amounts presented for variable priced contracts assumed the year-end 2010 price remained in effect for all periods except where contractual price adjustment or index-based prices were specified. |
The following are not included in the table above:
| | • | | contracts between affiliated entities and intercompany debt; |
| | • | | individual contracts that have an annual cash requirement of less than $1 million (however, multiple contracts with one counterparty that are more than $1 million on an aggregated basis have been included); |
| | • | | contracts that are cancellable without payment of a substantial cancellation penalty; |
| | • | | employment contracts with management; |
| | • | | estimated funding of pension plan totaling $175 million in 2011 and approximately $932 million for the 2011 to 2015 period as discussed above under “Pension and OPEB Plan Funding,” and |
| | • | | liabilities related to uncertain tax positions totaling $1.6 billion discussed in Note 7 to Financial Statements as the ultimate timing of payment is not known. |
Guarantees — See Note 12 to Financial Statements for details of guarantees.
OFF–BALANCE SHEET ARRANGEMENTS
See Notes 3 and 12 to Financial Statements regarding VIEs and guarantees.
COMMITMENTS AND CONTINGENCIES
See Note 12 to Financial Statements for discussion of commitments and contingencies.
CHANGES IN ACCOUNTING STANDARDS
See Note 1 to Financial Statements for a discussion of changes in accounting standards.
100
REGULATORY MATTERS
See discussions in Part I under “Environmental Regulations and Related Considerations” and in Note 12 to Financial Statements.
Sunset Review
PURA, the PUCT, the RRC, ERCOT, the TCEQ and the Office of Public Utility Counsel (OPUC) will be subject to “sunset” review by the Texas Legislature in the 2011 legislative session. Sunset review includes, generally, a comprehensive review of the need for and effectiveness of an administrative agency (the PUCT, the RRC, ERCOT, the TCEQ or the OPUC), along with an evaluation of the advisability of any changes to that agency’s authorizing legislation (PURA). In 2010, the Texas Sunset Advisory Commission adopted various recommendations regarding these agencies and submitted its recommendations for the Texas Legislature’s consideration early in the session, which began in January 2011. We cannot predict the outcome of the sunset review process.
Oncor Matters with the PUCT
Stipulation Approved by the PUCT—In April 2008, the PUCT entered an order (PUCT Docket No. 34077), which became final in June 2008, approving the terms of a stipulation relating to the filing in 2007 by Oncor and Texas Holdings with the PUCT pursuant to Section 14.101(b) of PURA and PUCT Substantive Rule 25.75. The filing reported an ownership change involving Texas Holdings’ purchase of EFH Corp. Among other things, the stipulation required the filing of a rate case by Oncor no later than July 1, 2008 based on a test year ended December 31, 2007, which Oncor filed in June 2008 as discussed below. In July 2008, Nucor Steel filed an appeal of the PUCT’s order in the 200th District Court of Travis County, Texas. A hearing on the appeal was held in June 2010, and the District Court affirmed the PUCT order in its entirety. Nucor Steel appealed that ruling to the Third District Court of Appeals in Austin, Texas in July 2010. Oral argument before the court is scheduled for March 2011. While Oncor is unable to predict the outcome of the appeal, it does not expect the appeal to affect the major provisions of the stipulation.
Rate Cases — In January 2011, Oncor filed for a rate review with the PUCT and 203 cities (PUCT Docket No. 38929) based on a test year ended June 30, 2010. If approved as requested, this review would result in an aggregate annual rate increase of approximately $353 million over the test year period adjusted for the impact of weather. Oncor also requested a revised regulatory capital structure of 55% debt to 45% equity. The debt-to-equity ratio established by the PUCT is currently set at 60% debt to 40% equity. The PUCT, cities and other participating parties, with input from Oncor, established a procedural schedule for the review. A hearing on the merits of Oncor’s request is scheduled to commence in May 2011, and resolution of the proposed increase is expected to occur during the second half of 2011. Oncor cannot predict the outcome of this rate review.
In June 2008, Oncor filed for a rate review with the PUCT and 204 cities (PUCT Docket No. 35717). In August 2009, the PUCT issued a final order with respect to the rate review. The final order approved a total annual revenue requirement for Oncor of $2.64 billion, based on a 2007 test year cost of service and customer characteristics. New rates were calculated for all customer classes using 2007 test year billing metrics and the approved class cost allocation and rate design. The PUCT staff estimated that the final order resulted in an approximate $115 million increase in base rate revenues over Oncor’s 2007 adjusted test year revenues, before recovery of rate case expenses. Prior to implementing the new rates in September 2009, Oncor had already begun recovering $45 million of the $115 million increase as a result of approved transmission cost recovery factor and energy efficiency cost recovery factor filings, such as those discussed below.
101
Key findings by the PUCT in the rate review included:
| | • | | recognizing and affirming Oncor’s corporate ring-fence from EFH Corp. and its unregulated affiliates by rejecting a proposed consolidated tax savings adjustment arising out of EFH Corp.’s ability to offset Oncor’s taxable income against losses from other investments; |
| | • | | approving the recovery of all of Oncor’s capital investment in its transmission and distribution system, including investment in certain automated meters that will be replaced pursuant to Oncor’s advanced meter deployment plan; |
| | • | | denying recovery of $25 million of regulatory assets, which resulted in a $16 million after-tax loss being recognized in the third quarter 2009, and |
| | • | | setting Oncor’s return on equity at 10.25%. |
New rates were implemented upon approval of new tariffs in September 2009. In November 2009, the PUCT issued an Order on Rehearing that established a new rate class but did not change the revenue requirements. In January 2010, the PUCT denied all Second Motions for Rehearing, which made the November 2009 Order on Rehearing final and appealable. Oncor and four other parties appealed various portions of the rate case final order to a state district court. Oral arguments in the appeal were held in October 2010. In January 2011, the District Court signed its judgment reversing the PUCT with respect to two issues: the PUCT’s disallowance of certain franchise fees and the PUCT’s decision that PURA no longer requires imposition of a rate discount for state colleges and universities. Oncor intends to file an appeal with the Austin Court of Appeals in February 2011 with respect to the issues it appealed to the District Court and did not prevail upon, as well as the District Court’s decision on discounts for state colleges and universities.
Competitive Renewable Energy Zones (CREZs) — In January 2009, the PUCT awarded Oncor 17 CREZ construction projects (PUCT Docket Nos. 35665 and 37902) requiring 14 related Certificate of Convenience and Necessity (CCN) amendment proceedings before the PUCT. As of February 2011, 16 of the 17 projects and 13 of the 14 CCN amendments have been approved by the PUCT. The projects involve the construction of transmission lines to support the transmission of electricity from renewable energy sources, principally wind generation facilities, in west Texas to population centers in the eastern part of the state. Based on the selection of final routes for the three default and nine priority projects, identification of additional costs not included in the original ERCOT estimate (e.g., wind interconnection facilities and required modifications to existing facilities) and Oncor’s preferred routes for the remaining five subsequent projects, Oncor currently estimates that the cost of these projects will total approximately $1.75 billion. Individual project costs could change based on final route specifications for the subsequent projects as determined by the PUCT. In addition, ERCOT completed a study in December 2010 that will allow Oncor and other transmission service providers to build additional facilities to provide further voltage support to the transmission grid as a result of CREZ. Oncor and other transmission service providers are working with ERCOT to complete cost estimates for the required work by the second half of 2011. As of December 31, 2010, Oncor’s cumulative CREZ-related capital expenditures totaled $316 million, including $202 million during the year ended December 31, 2010. It is expected that the necessary permitting actions and other requirements and all construction activities for Oncor’s CREZ construction projects will be completed by the end of 2013.
Advanced Metering Deployment Surcharge Filing (PUCT Docket Nos. 35718 and 36157)— In May 2008, Oncor filed with the PUCT a description and request for approval of its proposed advanced metering system deployment plan and proposed surcharge for the recovery of estimated future investment for advanced metering deployment. In September 2008, a PUCT order became final approving a settlement reached with the majority of the parties to this surcharge filing. The settlement included the following major provisions, as amended by the final order in the 2008 rate review:
| | • | | the full deployment of over three million advanced meters to all residential and most non-residential retail electricity customers in Oncor’s service area; |
| | • | | a surcharge beginning on January 1, 2009 and continuing for 11 years; |
| | • | | a total revenue requirement over the surcharge period of $1.023 billion; |
| | • | | estimated capital expenditures for advanced metering facilities of $686 million; |
| | • | | related operation and maintenance expenses for the surcharge period of $153 million; |
| | • | | $204 million of operation and maintenance expense savings, and |
| | • | | an advanced metering cost recovery factor of $2.19 per month per residential retail customer and varying from $2.39 to $5.15 per month for non-residential retail customers. |
102
As of December 31, 2010, Oncor has installed approximately 1,514,000 advanced digital meters, including approximately 854,000 during the year ended December 31, 2010. As the new meters are integrated, Oncor reports 15-minute interval, billing-quality electricity consumption data to ERCOT for market settlement purposes. The data makes it possible for REPs to support new programs and pricing options. Cumulative capital expenditures for the deployment of the advanced meter system totaled $360 million as of December 31, 2010, including $164 million in 2010. Oncor expects to complete installations of the advanced meters by the end of 2012.
Oncor may, through subsequent reconciliation proceedings, request recovery of additional costs that are reasonable and necessary. While there is a presumption that costs spent in accordance with a plan approved by the PUCT are reasonable and necessary, recovery of any costs that are found not to have been spent or properly allocated, or not to be reasonable or necessary, must be refunded.
Transmission Cost Recovery and Rates (PUCT Docket Nos. 37882, 38460, 38938 and 38495)— In order to recover increases in its transmission costs, including incremental fees paid to other transmission service providers due to an increase in their rates, Oncor is allowed to request an update twice a year to the transmission cost recovery factor (TCRF) component of its retail delivery rates charged to REPs. In January 2010, an application was filed to increase the TCRF, which was administratively approved in February 2010 and became effective March 1, 2010. This application increased Oncor’s annualized revenues by approximately $13 million. In July 2010, an application was filed to increase the TCRF, which was administratively approved in August 2010 and became effective September 1, 2010. This application increased Oncor’s annualized revenues by approximately $15 million. In December 2010, an application was filed to increase the TCRF, which was administratively approved in January 2011 for implementation effective March 1, 2011. This application is expected to increase Oncor’s annualized revenues by approximately $33 million.
In July 2010, Oncor filed an application for an interim update of its wholesale transmission rate, and the PUCT approved the new rate effective September 29, 2010. Oncor’s annualized revenues increased by an estimated $43 million with $27 million of this increase recoverable through transmission rates charged to wholesale customers and the remaining $16 million recoverable from REPs through the TCRF component of Oncor’s delivery rates.
PUCT Rulemaking— In 2010, the PUCT published rule changes in two proceedings that impact transmission rates. In the first proceeding (PUCT Project No. 37909), the PUCT changed the TCRF rule to allow for more complete cost recovery of wholesale transmission charges incurred by distribution service providers. Previously, increased wholesale transmission charges were recoverable by distribution service providers, effective with the March 1 and September 1 TCRF updates, but distribution service providers could not recover increased charges incurred prior to such updates. TCRF filings are still effective March 1 and September 1, but distribution service providers will be allowed to include wholesale transmission charges based on the effective date of the wholesale transmission rate changes. As a result, Oncor defers such increased costs as a regulatory asset until they are recovered in rates. In the second proceeding (PUCT Project No. 37519), the PUCT changed the wholesale transmission rules to allow transmission service providers to update their wholesale transmission rates twice in a calendar year, as compared to once per year under the previous rules, providing more timely recovery of incremental capital investment. Other changes included in this rule (i) tie the effective date of the biannual update portion of the rule to the effective date of the TCRF rule in PUCT Project No. 37909, (ii) require the PUCT to consider the effects of reduced regulatory lag when setting rates in the next full rate review and (iii) provide for administrative approval of uncontested interim wholesale transmission rate applications.
103
Remand of 1999 Wholesale Transmission Matrix Case (PUCT Docket No. 38780)— In October 2010, the PUCT established Docket No. 38780 for the remand of Docket No. 20381, the 1999 wholesale transmission charge matrix case. A joint settlement agreement was entered into effective October 6, 2003. This settlement resolves disputes regarding wholesale transmission pricing and charges for the period of January 1997 through August 1999, the period prior to the September 1, 1999 effective date of the legislation that authorized 100% postage stamp pricing for ERCOT wholesale transmission. Since a series of appeals has become final, the 1999 matrix docket has been remanded to the PUCT to address additional issues. If the appealing parties prevail and the PUCT rules adversely with respect to these issues, Oncor could be subject to liabilities totaling up to approximately $22 million. At this time, Oncor cannot predict the outcome of these matters.
Application for 2011 Energy Efficiency Cost Recovery Factor (PUCT Docket No. 38217) — In April 2010, Oncor filed an application with the PUCT to request approval of an energy efficiency cost recovery factor (EECRF) for 2011. PUCT rules require Oncor to make an annual EECRF filing by May 1 for implementation at the beginning of the next calendar year. In September 2010, the PUCT ruled that Oncor will be allowed to recover $51 million through its 2011 EECRF, including $45 million for 2011 program costs and an $11 million performance bonus based on 2009 results partially offset by a $5 million reduction for over-recovery of 2009 costs, as compared to $54 million recovered through its 2010 EECRF. The resulting monthly charge for residential customers will be $0.91, as compared to the 2010 residential charge of $0.89 per month.
104
Mine Safety Disclosures — Required by the Dodd-Frank Wall Street Reform and Consumer Protection Act
Safety is a top priority in all our businesses, and accordingly, it is a key component of our focus on operational excellence, our employee performance reviews and employee compensation. Our health and safety program objectives are to prevent workplace accidents and ensure that all employees return home safely and comply with all regulations.
We currently own and operate 12 surface lignite coal mines in Texas to provide fuel for our electricity generation facilities. These mining operations are regulated by the US Mine Safety and Health Administration (MSHA) under the Federal Mine Safety and Health Act of 1977, as amended (the Mine Act) as well as other regulatory agencies such as the RRC. The MSHA inspects US mines, including ours, on a regular basis and if it believes a violation of the Mine Act or any health or safety standard or other regulation has occurred, it may issue a citation or order, generally accompanied by a proposed fine or assessment. Such citations and orders can be contested and appealed to the Federal Mine Safety and Health Review Commission (FMSHRC), which often results in a reduction of the severity and amount of fines and assessments and sometimes results in dismissal. The number of citations, orders and proposed assessments vary depending on the size of the mine as well as other factors.
Disclosures related to specific mines pursuant to Section 1503 of the recently enacted Dodd-Frank Wall Street Reform and Consumer Protection Act sourced from data documented as of January 10, 2011 and January 17, 2011 in the MSHA Data Retrieval System for the three months and year ended December 31, 2010, respectively (except pending legal actions, which are as of December 31, 2010), are as follows:
| | | | | | | | | | | | | | | | | | | | | | | | |
| | | Three Months Ended December 31, 2010 | | | Year Ended December 31, 2010 | |
Mine (a) | | Section 104
S and S
Citations (b) | | | Proposed
MSHA
Assessments
($ thousands)
(c) | | | Pending
Legal
Action (d) | | | Section 104
S and S
Citations (b) | | | Proposed
MSHA
Assessments
($ thousands)
(c) | | | Pending
Legal
Action (d) | |
Beckville | | | 1 | | | | — | | | | 1 | | | | 8 | | | | 18 | | | | 1 | |
Big Brown | | | — | | | | — | | | | 2 | | | | 4 | | | | 9 | | | | 2 | |
Kosse | | | 6 | | | | — | | | | — | | | | 6 | | | | 1 | | | | — | |
Oak Hill | | | 3 | | | | 11 | | | | 1 | | | | 7 | | | | 13 | | | | 1 | |
Sulphur Springs | | | 1 | | | | 2 | | | | 3 | | | | 3 | | | | 3 | | | | 3 | |
Tatum | | | — | | | | — | | | | 1 | | | | — | | | | — | | | | 1 | |
Three Oaks | | | 1 | | | | — | | | | 1 | | | | 3 | | | | 9 | | | | 1 | |
Winfield South | | | — | | | | 1 | | | | 1 | | | | 1 | | | | 4 | | | | 1 | |
| (a) | Excludes mines for which there were no applicable events. |
| (b) | Includes MSHA citations for health or safety standards that could significantly and substantially contribute to a serious injury if left unabated. |
| (c) | Total dollar value for proposed assessments received from MSHA for all citations and orders issued in the period ended December 31, 2010, including but not limited to Sections 104, 107 and 110 citations and orders that are not required to be reported. |
| (d) | Pending actions before the FMSHRC involving a coal or other mine. |
During the three months ended December 31, 2010, our mining operations received two citations and orders under Section 104(d) (Oak Hill mine), no citations, orders or written notices under Sections 104(b), 104(e), 107(a) or 110(b)(2) of the Mine Act, and they experienced no fatalities. During the year ended December 31, 2010, our mining operations received two citations and orders under Section 104(d) (Oak Hill Mine), one order under Section 107(a) (Beckville mine), no citations, orders or written notices under Sections 104(b), 104(e) or 110(b)(2) of the Mine Act, and they experienced no fatalities.
Summary
We cannot predict future regulatory or legislative actions or any changes in economic and securities market conditions. Such actions or changes could significantly alter our basic financial position, results of operations or cash flows.
105
| Item 7A. | QUANTITATIVE AND QUALITATIVE DISCLOSURES ABOUT MARKET RISK |
Market risk is the risk that we may experience a loss in value as a result of changes in market conditions affecting factors, such as commodity prices and interest rates that may be experienced in the ordinary course of business. Our exposure to market risk is affected by a number of factors, including the size, duration and composition of our energy and financial portfolio, as well as the volatility and liquidity of markets. Instruments used to manage this exposure include interest rate swaps to manage interest rate risk related to debt, as well as exchange traded, over-the-counter contracts and other contractual arrangements to manage commodity price risk.
Risk Oversight
We manage the commodity price, counterparty credit and commodity-related operational risk related to the unregulated energy business within limitations established by senior management and in accordance with overall risk management policies. Interest rate risk is managed centrally by the corporate treasury function. Market risks are monitored by risk management groups that operate independently of the wholesale commercial operations, utilizing defined practices and analytical methodologies. These techniques measure the risk of change in value of the portfolio of contracts and the hypothetical effect on this value from changes in market conditions and include, but are not limited to, Value at Risk (VaR) methodologies. Key risk control activities include, but are not limited to, transaction review and approval (including credit review), operational and market risk measurement, validation of transaction capture, portfolio valuation and reporting, including mark-to-market valuation, VaR and other risk measurement metrics.
We have a corporate risk management organization that is headed by the Chief Financial Officer, who also functions as the Chief Risk Officer. The Chief Risk Officer, through his designees, enforces applicable risk limits, including the respective policies and procedures to ensure compliance with such limits and evaluates the risks inherent in our businesses.
Commodity Price Risk
The competitive business is subject to the inherent risks of market fluctuations in the price of electricity, natural gas and other energy-related products it markets or purchases. We actively manage the portfolio of owned generation assets, fuel supply and retail sales load to mitigate the near-term impacts of these risks on results of operations. Similar to other participants in the market, we cannot fully manage the long-term value impact of structural declines or increases in natural gas and power prices and spark spreads (differences between the market price of electricity and its cost of production).
In managing energy price risk, we enter into a variety of market transactions including, but not limited to, short- and long-term contracts for physical delivery, exchange traded and over-the-counter financial contracts and bilateral contracts with customers. Activities include hedging, the structuring of long-term contractual arrangements and proprietary trading. We continuously monitor the valuation of identified risks and adjust positions based on current market conditions. We strive to use consistent assumptions regarding forward market price curves in evaluating and recording the effects of commodity price risk.
Long-Term Hedging Program— See “Significant Activities and Events” above for a description of the program, including potential effects on reported results.
106
VaR Methodology — A VaR methodology is used to measure the amount of market risk that exists within the portfolio under a variety of market conditions. The resultant VaR produces an estimate of a portfolio’s potential for loss given a specified confidence level and considers among other things, market movements utilizing standard statistical techniques given historical and projected market prices and volatilities.
A Monte Carlo simulation methodology is used to calculate VaR and is considered by management to be the most effective way to estimate changes in a portfolio’s value based on assumed market conditions for liquid markets. The use of this method requires a number of key assumptions, such as use of (i) an assumed confidence level; (ii) an assumed holding period (i.e., the time necessary for management action, such as to liquidate positions); and (iii) historical estimates of volatility and correlation data.
Trading VaR — This measurement estimates the potential loss in fair value, due to changes in market conditions, of all contracts entered into for trading purposes based on a 95% confidence level and an assumed holding period of five to 60 days.
| | | | | | | | |
| | | Year Ended
December 31, 2010 | | | Year Ended
December 31, 2009 | |
Month-end average Trading VaR: | | $ | 3 | | | $ | 4 | |
Month-end high Trading VaR: | | $ | 4 | | | $ | 7 | |
Month-end low Trading VaR: | | $ | 1 | | | $ | 2 | |
VaR for Energy-Related Contracts Subject to Mark-to-Market (MtM) Accounting — This measurement estimates the potential loss in fair value, due to changes in market conditions, of all contracts marked-to-market in net income (principally hedges not accounted for as cash flow hedges and trading positions), based on a 95% confidence level and an assumed holding period of five to 60 days.
| | | | | | | | |
| | | Year Ended
December 31, 2010 | | | Year Ended
December 31, 2009 | |
Month-end average MtM VaR: | | $ | 426 | | | $ | 1,050 | |
Month-end high MtM VaR: | | $ | 621 | | | $ | 1,470 | |
Month-end low MtM VaR: | | $ | 321 | | | $ | 638 | |
Earnings at Risk (EaR)— This measurement estimates the potential reduction of pretax earnings for the periods presented, due to changes in market conditions, of all energy-related contracts marked-to-market in net income and contracts not marked-to-market in net income that are expected to be settled within the fiscal year (physical purchases and sales of commodities). Transactions accounted for as cash flow hedges are also included for this measurement. A 95% confidence level and a five to 60 day holding period are assumed in determining EaR.
| | | | | | | | |
| | | Year Ended
December 31, 2010 | | | Year Ended
December 31, 2009 | |
Month-end average EaR: | | $ | 477 | | | $ | 1,088 | |
Month-end high EaR: | | $ | 662 | | | $ | 1,511 | |
Month-end low EaR: | | $ | 323 | | | $ | 676 | |
The decreases in the risk measures (MtM VaR and EaR) above reflected fewer positions in the long-term hedging program due to settlement upon maturity, lower market volatility and lower underlying commodity prices.
107
Interest Rate Risk
The table below provides information concerning our financial instruments as of December 31, 2010 and 2009 that are sensitive to changes in interest rates, which include debt obligations and interest rate swaps. We have entered into interest rate swaps under which we have exchanged the difference between fixed-rate and variable-rate interest amounts calculated with reference to specified notional principal amounts at dates that generally coincide with interest payments under our credit facilities. In addition, in connection with entering into certain interest rate basis swaps to further reduce fixed borrowing costs, we have changed the variable interest rate terms of certain TCEH debt from three-month LIBOR to one-month LIBOR, as discussed in Note 11 to Financial Statements. The weighted average interest rate presented is based on the rate in effect at the reporting date. Capital leases and the effects of unamortized premiums and discounts and fair value hedges are excluded from the table. See Note 11 to Financial Statements for a discussion of changes in debt obligations.
| | | | | | | | | | | | | | | | | | | | | | | | | | | | | | | | | | | | | | | | |
| | | Expected Maturity Date | | | | |
| | | (millions of dollars, except percentages) | |
| | | 2011 | | | 2012 | | | 2013 | | | 2014 | | | 2015 | | | There-
After | | | 2010
Total
Carrying
Amount | | | 2010
Total
Fair
Value | | | 2009
Total
Carrying
Amount | | | 2009
Total
Fair
Value | |
Long-term debt (including current maturities): | | | | | | | | | | | | | | | | | | | | | | | | | | | | | | | | | | | | | | | | |
Fixed rate debt amount (a) | | $ | 446 | | | $ | 32 | | | $ | 91 | | | $ | 483 | | | $ | 3,187 | | | $ | 9,798 | | | $ | 14,037 | | | $ | 10,052 | | | $ | 20,861 | | | $ | 17,296 | |
Average interest rate | | | 5.86 | % | | | 8.17 | % | | | 7.24 | % | | | 5.66 | % | | | 10.24 | % | | | 10.32 | % | | | 9.98 | % | | | | | | | 8.95 | % | | | | |
Variable rate debt amount | | $ | 205 | | | $ | 205 | | | $ | 205 | | | $ | 20,563 | | | $ | — | | | $ | 205 | | | $ | 21,383 | | | $ | 16,542 | | | $ | 21,608 | | | $ | 17,463 | |
Average interest rate | | | 3.76 | % | | | 3.76 | % | | | 3.76 | % | | | 3.76 | % | | | — | % | | | 0.32 | % | | | 3.73 | % | | | | | | | 3.71 | % | | | | |
| | | | | | | | | | | | | | | | | | | | | | | | | | | | | | | | | | | | | | | | |
Total debt | | $ | 651 | | | $ | 237 | | | $ | 296 | | | $ | 21,046 | | | $ | 3,187 | | | $ | 10,003 | | | $ | 35,420 | | | $ | 26,594 | | | $ | 42,469 | | | $ | 34,759 | |
| | | | | | | | | | | | | | | | | | | | | | | | | | | | | | | | | | | | | | | | |
Debt swapped to fixed: | | | | | | | | | | | | | | | | | | | | | | | | | | | | | | | | | | | | | | | | |
Amount | | $ | 600 | | | $ | 2,600 | | | $ | 3,600 | | | $ | 9,000 | | | $ | — | | | $ | — | | | $ | 15,800 | | | | | | | $ | 16,300 | | | | | |
Average pay rate | | | 7.57 | % | | | 7.99 | % | | | 7.60 | % | | | 8.18 | % | | | — | | | | — | | | | 7.99 | % | | | | | | | 7.98 | % | | | | |
Average receive rate | | | 3.79 | % | | | 3.79 | % | | | 3.79 | % | | | 3.79 | % | | | — | | | | — | | | | 3.79 | % | | | | | | | 3.74 | % | | | | |
Variable basis swaps: | | | | | | | | | | | | | | | | | | | | | | | | | | | | | | | | | | | | | | | | |
Amount | | $ | 5,450 | | | $ | 7,200 | | | $ | 1,500 | | | $ | 1,050 | | | $ | — | | | $ | — | | | $ | 15,200 | | | | | | | $ | 16,250 | | | | | |
Average pay rate | | | 0.32 | % | | | 0.33 | % | | | 0.29 | % | | | 0.33 | % | | | — | | | | — | | | | 0.32 | % | | | | | | | 0.33 | % | | | | |
Average receive rate | | | 0.26 | % | | | 0.26 | % | | | 0.26 | % | | | 0.26 | % | | | — | | | | — | | | | 0.26 | % | | | | | | | 0.24 | % | | | | |
| (a) | Reflects the remarketing date and not the maturity date for certain debt that is subject to mandatory tender for remarketing prior to maturity. See Note 11 to Financial Statements for details concerning long-term debt subject to mandatory tender for remarketing. |
As of December 31, 2010, the potential reduction of annual pretax earnings due to a one percentage point (100 basis points) increase in floating interest rates on long-term debt totaled approximately $45 million, taking into account the interest rate swaps discussed in Note 11 to Financial Statements.
108
Credit Risk
Credit risk relates to the risk of loss associated with nonperformance by counterparties. We maintain credit risk policies with regard to our counterparties to minimize overall credit risk. These policies prescribe practices for evaluating a potential counterparty’s financial condition, credit rating and other quantitative and qualitative credit criteria and specify authorized risk mitigation tools including, but not limited to, use of standardized master netting contracts and agreements that allow for netting of positive and negative exposures associated with a single counterparty. We have processes for monitoring and managing credit exposure of our businesses including methodologies to analyze counterparties’ financial strength, measurement of current and potential future exposures and contract language that provides rights for netting and set-off. Credit enhancements such as parental guarantees, letters of credit, surety bonds and margin deposits are also utilized. Additionally, individual counterparties and credit portfolios are managed to assess overall credit exposure. This evaluation results in establishing exposure limits or collateral requirements for entering into an agreement with a counterparty that creates exposure. Additionally, we have established controls to determine and monitor the appropriateness of these limits on an ongoing basis. Prospective material adverse changes in the payment history or financial condition of a counterparty or downgrade of its credit quality result in the reassessment of the credit limit with that counterparty. This process can result in the subsequent reduction of the credit limit or a request for additional financial assurances.
Credit Exposure — Our gross exposure to credit risk associated with trade accounts receivable (retail and wholesale) and net asset positions (before credit collateral) arising from commodity contracts and hedging and trading activities totaled $2.869 billion as of December 31, 2010. The components of this exposure are discussed in more detail below.
Assets subject to credit risk as of December 31, 2010 include $615 million in retail trade accounts receivable before taking into account cash deposits held as collateral for these receivables totaling $70 million. The risk of material loss (after consideration of bad debt allowances) from nonperformance by these customers is unlikely based upon historical experience. Allowances for uncollectible accounts receivable are established for the potential loss from nonpayment by these customers based on historical experience, market or operational conditions and changes in the financial condition of large business customers.
The remaining credit exposure arises from wholesale trade receivables, commodity contracts and hedging and trading activities, including interest rate hedging. Counterparties to these transactions include energy companies, financial institutions, electric utilities, independent power producers, oil and gas producers, local distribution companies and energy trading and marketing companies. As of December 31, 2010, the exposure to credit risk from these counterparties totaled $2.254 billion taking into account the standardized master netting contracts and agreements described above but before taking into account $648 million in credit collateral (cash, letters of credit and other credit support). The net exposure (after credit collateral) of $1.606 billion increased $309 million in the year ended December 31, 2010, reflecting the increase in derivative assets related to the long-term hedging program due to the decline in forward natural gas prices, partially offset by the return of the $400 million in collateral discussed in Note 17 to Financial Statements and the increase in derivative liabilities related to interest rate swaps due to lower interest rates.
Of this $1.606 billion net exposure, essentially all is with investment grade customers and counterparties, as determined using publicly available information including major rating agencies’ published ratings and our internal credit evaluation process. Those customers and counterparties without a S&P rating of at least BBB- or similar rating from another major rating agency are rated using internal credit methodologies and credit scoring models to estimate a S&P equivalent rating. The company routinely monitors and manages credit exposure to these customers and counterparties on this basis.
109
The following table presents the distribution of credit exposure as of December 31, 2010 arising from wholesale trade receivables, commodity contracts and hedging and trading activities. This credit exposure represents wholesale trade accounts receivable and net asset positions on the balance sheet arising from hedging and trading activities after taking into consideration netting provisions within each contract, setoff provisions in the event of default and any master netting contracts with counterparties. See Note 17 to Financial Statements for further discussion of portions of this exposure related to activities marked-to-market in the financial statements.
| | | | | | | | | | | | | | | | | | | | | | | | | | | | |
| | | | | | | | | | | | Gross Exposure by Maturity | |
| | | Exposure
Before Credit
Collateral | | | Credit
Collateral | | | Net
Exposure | | | 2 years or
less | | | Between
2-5 years | | | Greater
than 5
years | | | Total | |
Investment grade | | $ | 2,229 | | | $ | 646 | | | $ | 1,583 | | | $ | 1,597 | | | $ | 632 | | | $ | — | | | $ | 2,229 | |
Noninvestment grade | | | 25 | | | | 2 | | | | 23 | | | | 26 | | | | (1 | ) | | | — | | | | 25 | |
| | | | | | | | | | | | | | | | | | | | | | | | | | | | |
Totals | | $ | 2,254 | | | $ | 648 | | | $ | 1,606 | | | $ | 1,623 | | | $ | 631 | | | $ | — | | | $ | 2,254 | |
| | | | | | | | | | | | | | | | | | | | | | | | | | | | |
| | | | | | | |
Investment grade | | | 98.9 | % | | | | | | | 98.6 | % | | | | | | | | | | | | | | | | |
Noninvestment grade | | | 1.1 | % | | | | | | | 1.4 | % | | | | | | | | | | | | | | | | |
In addition to the exposures in the table above, contracts classified as “normal” purchase or sale and non-derivative contractual commitments are not marked-to-market in the financial statements. Such contractual commitments may contain pricing that is favorable considering current market conditions and therefore represent economic risk if the counterparties do not perform. Nonperformance could have a material adverse impact on future results of operations, financial condition and cash flows.
Significant (10% or greater) concentration of credit exposure exists with three counterparties, which represented 41%, 35% and 12% of the net $1.606 billion exposure. We view exposure to these counterparties to be within an acceptable level of risk tolerance due to the applicable counterparty’s credit rating and the importance of our business relationship with the counterparty. However, this concentration increases the risk that a default would have a material effect on results of operations.
With respect to credit risk related to the long-term hedging program, essentially all of the transaction volumes are with counterparties with an A credit rating or better. However, there is current and potential credit concentration risk related to the limited number of counterparties that comprise the substantial majority of the program with such counterparties being in the banking and financial sector. The transactions with these counterparties contain certain credit rating provisions that would require the counterparties to post collateral in the event of a material downgrade in the credit rating of the counterparties. An event of default by one or more hedge counterparties could subsequently result in termination-related settlement payments that reduce available liquidity if amounts are owed to the counterparties related to the commodity contracts or delays in receipts of expected settlements if the hedge counterparties owe amounts to us. While the potential concentration of risk with these counterparties is viewed to be within an acceptable risk tolerance, the exposure to hedge counterparties is managed through the various ongoing risk management measures described above.
110
FORWARD-LOOKING STATEMENTS
This report and other presentations made by us contain “forward-looking statements.” All statements, other than statements of historical facts, that are included in this report, or made in presentations, in response to questions or otherwise, that address activities, events or developments that we expect or anticipate to occur in the future, including such matters as projections, capital allocation, future capital expenditures, business strategy, competitive strengths, goals, future acquisitions or dispositions, development or operation of power generation assets, market and industry developments and the growth of our businesses and operations (often, but not always, through the use of words or phrases such as “intends,” “plans,” “will likely result,” “are expected to,” “will continue,” “is anticipated,” “estimated,” “should,” “projection,” “target,” “goal,” “objective” and “outlook”), are forward-looking statements. Although we believe that in making any such forward-looking statement our expectations are based on reasonable assumptions, any such forward-looking statement involves uncertainties and is qualified in its entirety by reference to the discussion of risk factors under Item 1A, “Risk Factors” and the discussion under Item 7, “Management’s Discussion and Analysis of Financial Condition and Results of Operations” in this report and the following important factors, among others, that could cause our actual results to differ materially from those projected in such forward-looking statements:
| | • | | prevailing governmental policies and regulatory actions, including those of the Texas Legislature, the Governor of Texas, the US Congress, the FERC, the NERC, the TRE, the PUCT, the RRC, the NRC, the EPA, the TCEQ and the CFTC, with respect to, among other things: |
| | • | | allowed rates of return; |
| | • | | permitted capital structure; |
| | • | | industry, market and rate structure; |
| | • | | purchased power and recovery of investments; |
| | • | | operations of nuclear generating facilities; |
| | • | | operations of fossil-fueled generating facilities; |
| | • | | acquisition and disposal of assets and facilities; |
| | • | | development, construction and operation of facilities; |
| | • | | present or prospective wholesale and retail competition; |
| | • | | changes in tax laws and policies; |
| | • | | changes in and compliance with environmental and safety laws and policies, including climate change initiatives, and |
| | • | | clearing over the counter derivatives through exchanges and posting of cash collateral therewith; |
| | • | | legal and administrative proceedings and settlements; |
| | • | | general industry trends; |
| | • | | economic conditions, including the impact of a recessionary environment; |
| | • | | our ability to attract and retain profitable customers; |
| | • | | our ability to profitably serve our customers; |
| | • | | restrictions on competitive retail pricing; |
| | • | | changes in wholesale electricity prices or energy commodity prices; |
| | • | | changes in prices of transportation of natural gas, coal, crude oil and refined products; |
| | • | | unanticipated changes in market heat rates in the ERCOT electricity market; |
| | • | | our ability to effectively hedge against unfavorable commodity prices, market heat rates and interest rates; |
| | • | | weather conditions and other natural phenomena, and acts of sabotage, wars or terrorist activities; |
| | • | | unanticipated population growth or decline, or changes in market demand and demographic patterns, particularly in ERCOT; |
| | • | | changes in business strategy, development plans or vendor relationships; |
| | • | | access to adequate transmission facilities to meet changing demands; |
| | • | | unanticipated changes in interest rates, commodity prices, rates of inflation or foreign exchange rates; |
| | • | | unanticipated changes in operating expenses, liquidity needs and capital expenditures; |
| | • | | commercial bank market and capital market conditions and the potential impact of disruptions in US and international credit markets; |
111
| | • | | the willingness of our lenders to amend and extend the maturities of our debt agreements and the terms and conditions of any such amendments; |
| | • | | access to capital, the cost of such capital, and the results of financing and refinancing efforts, including availability of funds in capital markets; |
| | • | | financial restrictions placed on us by the agreements governing our debt instruments; |
| | • | | our ability to generate sufficient cash flow to make interest payments on, or refinance, our debt instruments; |
| | • | | our ability to successfully execute our liability management program; |
| | • | | competition for new energy development and other business opportunities; |
| | • | | inability of various counterparties to meet their obligations with respect to our financial instruments; |
| | • | | changes in technology used by and services offered by us; |
| | • | | changes in electricity transmission that allow additional electricity generation to compete with our generation assets; |
| | • | | significant changes in our relationship with our employees, including the availability of qualified personnel, and the potential adverse effects if labor disputes or grievances were to occur; |
| | • | | changes in assumptions used to estimate costs of providing employee benefits, including medical and dental benefits, pension and OPEB, and future funding requirements related thereto; |
| | • | | changes in assumptions used to estimate future executive compensation payments; |
| | • | | hazards customary to the industry and the possibility that we may not have adequate insurance to cover losses resulting from such hazards; |
| | • | | significant changes in critical accounting policies; |
| | • | | actions by credit rating agencies; |
| | • | | our ability to effectively execute our operational strategy, and |
| | • | | our ability to implement cost reduction initiatives. |
Any forward-looking statement speaks only as of the date on which it is made, and except as may be required by law, we undertake no obligation to update any forward-looking statement to reflect events or circumstances after the date on which it is made or to reflect the occurrence of unanticipated events. New factors emerge from time to time, and it is not possible for us to predict all of them; nor can we assess the impact of each such factor or the extent to which any factor, or combination of factors, may cause results to differ materially from those contained in any forward-looking statement. As such, you should not unduly rely on such forward-looking statements.
INDUSTRY AND MARKET INFORMATION
The industry and market data and other statistical information used throughout this report are based on independent industry publications, government publications, reports by market research firms or other published independent sources, including certain data published by ERCOT, the PUCT and NYMEX. We did not commission any of these publications or reports. Some data is also based on good faith estimates, which are derived from our review of internal surveys, as well as the independent sources listed above. Independent industry publications and surveys generally state that they have obtained information from sources believed to be reliable, but do not guarantee the accuracy and completeness of such information. While we believe that each of these studies and publications is reliable, we have not independently verified such data and make no representation as to the accuracy of such information. Forecasts are particularly likely to be inaccurate, especially over long periods of time, and we do not know what assumptions regarding general economic growth are used in preparing the forecasts included in this report. Similarly, while we believe that such internal and external research is reliable, it has not been verified by any independent sources, and we make no assurances that the predictions contained therein are accurate.
112
| Item 8. | FINANCIAL STATEMENTS AND SUPPLEMENTARY DATA |
REPORT OF INDEPENDENT REGISTERED PUBLIC ACCOUNTING FIRM
To the Board of Directors and Shareholders of Energy Future Holdings Corp.
Dallas, Texas
We have audited the accompanying consolidated balance sheets of Energy Future Holdings Corp. and subsidiaries (“EFH Corp.”) as of December 31, 2010 and 2009, and the related statements of consolidated income (loss), comprehensive income (loss), cash flows and equity for each of the three years in the period ended December 31, 2010. These financial statements are the responsibility of EFH Corp.’s management. Our responsibility is to express an opinion on these financial statements based on our audits.
We conducted our audits in accordance with the standards of the Public Company Accounting Oversight Board (United States). Those standards require that we plan and perform the audit to obtain reasonable assurance about whether the financial statements are free of material misstatement. An audit includes examining, on a test basis, evidence supporting the amounts and disclosures in the financial statements. An audit also includes assessing the accounting principles used and significant estimates made by management, as well as evaluating the overall financial statement presentation. We believe that our audits provide a reasonable basis for our opinion.
In our opinion, such consolidated financial statements present fairly, in all material respects, the financial position of Energy Future Holdings Corp. and subsidiaries as of December 31, 2010 and 2009, and the results of their operations and their cash flows for each of the three years in the period ended December 31, 2010, in conformity with accounting principles generally accepted in the United States of America.
As discussed in Notes 1 and 2 to the consolidated financial statements, EFH Corp. adopted amended consolidation accounting standards related to variable interest entities, and as also discussed in Notes 1 and 10 to the consolidated financial statements, EFH Corp. adopted amended guidance regarding transfers of financial assets effective January 1, 2010, on a prospective basis.
We have also audited, in accordance with the standards of the Public Company Accounting Oversight Board (United States), EFH Corp.’s internal control over financial reporting as of December 31, 2010, based on the criteria established inInternal Control – Integrated Framework issued by the Committee of Sponsoring Organizations of the Treadway Commission and our report dated February 17, 2011 expressed an unqualified opinion on EFH Corp.’s internal control over financial reporting.
|
| /s/ Deloitte & Touche LLP |
|
| Dallas, Texas |
| February 17, 2011 |
113
ENERGY FUTURE HOLDINGS CORP. AND SUBSIDIARIES
STATEMENTS OF CONSOLIDATED INCOME (LOSS)
(Millions of Dollars)
| | | | | | | | | | | | |
| | | Year Ended December 31, | |
| | | 2010 | | | 2009 | | | 2008 | |
Operating revenues | | $ | 8,235 | | | $ | 9,546 | | | $ | 11,364 | |
Fuel, purchased power costs and delivery fees | | | (4,371 | ) | | | (2,878 | ) | | | (4,595 | ) |
Net gain from commodity hedging and trading activities | | | 2,161 | | | | 1,736 | | | | 2,184 | |
Operating costs | | | (837 | ) | | | (1,598 | ) | | | (1,503 | ) |
Depreciation and amortization | | | (1,407 | ) | | | (1,754 | ) | | | (1,610 | ) |
Selling, general and administrative expenses | | | (751 | ) | | | (1,068 | ) | | | (957 | ) |
Franchise and revenue-based taxes | | | (106 | ) | | | (359 | ) | | | (363 | ) |
Impairment of goodwill (Note 4) | | | (4,100 | ) | | | (90 | ) | | | (8,860 | ) |
Other income (Note 9) | | | 2,051 | | | | 204 | | | | 80 | |
Other deductions (Note 9) | | | (31 | ) | | | (97 | ) | | | (1,301 | ) |
Interest income | | | 10 | | | | 45 | | | | 27 | |
Interest expense and related charges (Note 24) | | | (3,554 | ) | | | (2,912 | ) | | | (4,935 | ) |
| | | | | | | | | | | | |
| | | |
Income (loss) before income taxes and equity in earnings of unconsolidated subsidiaries | | | (2,700 | ) | | | 775 | | | | (10,469 | ) |
| | | |
Income tax (expense) benefit (Note 8) | | | (389 | ) | | | (367 | ) | | | 471 | |
| | | |
Equity in earnings of unconsolidated subsidiaries (net of tax) (Note 2) | | | 277 | | | | — | | | | — | |
| | | | | | | | | | | | |
| | | |
Net income (loss) | | | (2,812 | ) | | | 408 | | | | (9,998 | ) |
Net (income) loss attributable to noncontrolling interests | | | — | | | | (64 | ) | | | 160 | |
| | | | | | | | | | | | |
Net income (loss) attributable to EFH Corp. | | $ | (2,812 | ) | | $ | 344 | | | $ | (9,838 | ) |
| | | | | | | | | | | | |
See Notes to Financial Statements.
114
ENERGY FUTURE HOLDINGS CORP. AND SUBSIDIARIES
STATEMENTS OF CONSOLIDATED COMPREHENSIVE INCOME (LOSS)
(Millions of Dollars)
| | | | | | | | | | | | |
| | | Year Ended December 31, | |
| | | 2010 | | | 2009 | | | 2008 | |
Net income (loss) | | $ | (2,812 | ) | | $ | 408 | | | $ | (9,998 | ) |
| | | |
Other comprehensive income (loss), net of tax effects: | | | | | | | | | | | | |
Effects related to pension and other retirement benefit obligations (net of tax benefit of $8, $20 and $69) (Note 20) | | | (13 | ) | | | (40 | ) | | | (84 | ) |
| | | |
Cash flow hedges: | | | | | | | | | | | | |
Net decrease in fair value of derivatives (net of tax benefit of $—, $10 and $99) | | | — | | | | (20 | ) | | | (183 | ) |
Derivative value net loss related to hedged transactions recognized during the period and reported in net income (loss) (net of tax benefit of $31, $72 and $66) | | | 59 | | | | 130 | | | | 122 | |
| | | | | | | | | | | | |
Total effect of cash flow hedges | | | 59 | | | | 110 | | | | (61 | ) |
| | | | | | | | | | | | |
Total other comprehensive income (loss) | | | 46 | | | | 70 | | | | (145 | ) |
| | | | | | | | | | | | |
| | | |
Comprehensive income (loss) | | | (2,766 | ) | | | 478 | | | | (10,143 | ) |
Comprehensive (income) loss attributable to noncontrolling interests | | | — | | | | (64 | ) | | | 160 | |
| | | | | | | | | | | | |
Comprehensive income (loss) attributable to EFH Corp. | | $ | (2,766 | ) | | $ | 414 | | | $ | (9,983 | ) |
| | | | | | | | | | | | |
See Notes to Financial Statements.
115
ENERGY FUTURE HOLDINGS CORP. AND SUBSIDIARIES
STATEMENTS OF CONSOLIDATED CASH FLOWS
(Millions of Dollars)
| | | | | | | | | | | | |
| | | Year Ended December 31, | |
| | | 2010 | | | 2009 | | | 2008 | |
Cash flows — operating activities | | | | | | | | | | | | |
Net income (loss) | | $ | (2,812 | ) | | $ | 408 | | | $ | (9,998 | ) |
Adjustments to reconcile net income to cash provided by operating activities: | | | | | | | | | | | | |
Depreciation and amortization | | | 1,778 | | | | 2,172 | | | | 2,070 | |
Deferred income tax expense (benefit) – net | | | 604 | | | | 253 | | | | (477 | ) |
Impairment of goodwill (Note 4) | | | 4,100 | | | | 90 | | | | 8,860 | |
Debt extinguishment gains (Note 11) | | | (1,814 | ) | | | (87 | ) | | | — | |
Unrealized net gains from mark-to-market valuations of commodity positions | | | (1,221 | ) | | | (1,225 | ) | | | (2,329 | ) |
Interest expense on toggle notes payable in additional principal (Notes 11 and 24) | | | 446 | | | | 524 | | | | 83 | |
Equity in earnings of unconsolidated subsidiaries | | | (277 | ) | | | — | | | | — | |
Unrealized net (gains) losses from mark-to-market valuations of interest rate swaps (Note 11) | | | 207 | | | | (696 | ) | | | 1,477 | |
Distributions of earnings from unconsolidated subsidiaries | | | 169 | | | | — | | | | — | |
Gain on termination of long-term power sales contract (Note 9) | | | (116 | ) | | | — | | | | — | |
Bad debt expense (Note 10) | | | 108 | | | | 113 | | | | 81 | |
Losses on dedesignated cash flow hedges (interest rate swaps) | | | 87 | | | | 184 | | | | 66 | |
Net gain on sale of assets | | | (81 | ) | | | (5 | ) | | | (1 | ) |
Stock-based incentive compensation expense | | | 19 | | | | 14 | | | | 30 | |
Reversal of reserves recorded in purchase accounting (Note 9) | | | — | | | | (44 | ) | | | — | |
Impairment of land | | | — | | | | 34 | | | | — | |
Write off of regulatory assets (Note 24) | | | — | | | | 25 | | | | — | |
Impairment of emission allowances intangible assets (Note 4) | | | — | | | | — | | | | 501 | |
Impairment of trade name intangible asset (Note 4) | | | — | | | | — | | | | 481 | |
Impairment of natural gas-fueled generation facilities (Note 5) | | | — | | | | — | | | | 229 | |
Charge related to Lehman bankruptcy (Note 9) | | | — | | | | — | | | | 26 | |
Other, net | | | 11 | | | | (4 | ) | | | (20 | ) |
Changes in operating assets and liabilities: | | | | | | | | | | | | |
Accounts receivable – trade | | | 258 | | | | (125 | ) | | | (505 | ) |
Impact of accounts receivable securitization program (Note 10) | | | (383 | ) | | | (33 | ) | | | 53 | |
Inventories | | | (6 | ) | | | (59 | ) | | | (21 | ) |
Accounts payable – trade | | | (93 | ) | | | (141 | ) | | | 385 | |
Commodity and other derivative contractual assets and liabilities | | | (44 | ) | | | (64 | ) | | | (28 | ) |
Margin deposits – net | | | 132 | | | | 248 | | | | 595 | |
Deferred advanced metering system revenues (Note 24) | | | — | | | | 57 | | | | — | |
Other – net assets | | | 151 | | | | (43 | ) | | | 440 | |
Other – net liabilities | | | (117 | ) | | | 115 | | | | (493 | ) |
| | | | | | | | | | | | |
Cash provided by operating activities | | $ | 1,106 | | | $ | 1,711 | | | $ | 1,505 | |
| | | | | | | | | | | | |
116
ENERGY FUTURE HOLDINGS CORP. AND SUBSIDIARIES
STATEMENTS OF CONSOLIDATED CASH FLOWS (CONT.)
(Millions of Dollars)
| | | | | | | | | | | | |
| | | Year Ended December 31, | |
| | | 2010 | | | 2009 | | | 2008 | |
Cash flows — financing activities | | | | | | | | | | | | |
Issuances of long-term debt/securities (Note 11): | | | | | | | | | | | | |
Pollution control revenue bonds | | $ | — | | | $ | — | | | $ | 242 | |
Oncor long-term debt | | | — | | | | — | | | | 1,500 | |
Other long-term debt | | | 853 | | | | 522 | | | | 1,443 | |
Common stock | | | — | | | | — | | | | 34 | |
Repayments/repurchases of long-term debt/securities (Note 11): | | | | | | | | | | | | |
Pollution control revenue bonds | | | — | | | | — | | | | (242 | ) |
Other long-term debt | | | (1,351 | ) | | | (396 | ) | | | (925 | ) |
Common stock | | | — | | | | — | | | | (3 | ) |
Net short-term borrowings under accounts receivable securitization program (Note 10) | | | 96 | | | | — | | | | — | |
Increase (decrease) in other short-term borrowings (Note 11) | | | 172 | | | | 332 | | | | (481 | ) |
Proceeds from sale of noncontrolling interests, net of transaction costs (Note 14) | | | — | | | | — | | | | 1,253 | |
Decrease in note payable to unconsolidated subsidiary | | | (37 | ) | | | — | | | | — | |
Contributions from noncontrolling interests | | | 32 | | | | 48 | | | | — | |
Distributions paid to noncontrolling interests | | | — | | | | (56 | ) | | | (2 | ) |
Debt exchange and issuance costs | | | (62 | ) | | | (49 | ) | | | (21 | ) |
Other, net | | | 33 | | | | 21 | | | | 39 | |
| | | | | | | | | | | | |
Cash provided by (used in) financing activities | | $ | (264 | ) | | $ | 422 | | | $ | 2,837 | |
| | | | | | | | | | | | |
| | | |
Cash flows — investing activities | | | | | | | | | | | | |
Capital expenditures | | | (838 | ) | | | (2,348 | ) | | | (2,849 | ) |
Nuclear fuel purchases | | | (106 | ) | | | (197 | ) | | | (166 | ) |
Money market fund redemptions (investments) | | | — | | | | 142 | | | | (142 | ) |
Investment redeemed/(posted) with derivative counterparty (Note 17) | | | 400 | | | | (400 | ) | | | — | |
Reduction of letter of credit facility deposited with trustee (Note 11) | | | — | | | | 115 | | | | — | |
Reduction of restricted cash related to pollution control revenue bonds | | | — | | | | — | | | | 29 | |
Other changes in restricted cash | | | (33 | ) | | | 9 | | | | 1 | |
Proceeds from sale of assets | | | 147 | | | | 42 | | | | 80 | |
Proceeds from sale of environmental allowances and credits | | | 12 | | | | 19 | | | | 39 | |
Purchases of environmental allowances and credits | | | (30 | ) | | | (19 | ) | | | (34 | ) |
Proceeds from sales of nuclear decommissioning trust fund securities | | | 974 | | | | 3,064 | | | | 1,623 | |
Investments in nuclear decommissioning trust fund securities | | | (990 | ) | | | (3,080 | ) | | | (1,639 | ) |
Cash settlements related to outsourcing contract termination (Note 19) | | | — | | | | — | | | | 70 | |
Settlement of loan (Note 19) | | | — | | | | — | | | | 25 | |
Other, net | | | (4 | ) | | | 20 | | | | 29 | |
| | | | | | | | | | | | |
Cash used in investing activities | | $ | (468 | ) | | $ | (2,633 | ) | | $ | (2,934 | ) |
| | | | | | | | | | | | |
| | | |
Net change in cash and cash equivalents | | | 374 | | | | (500 | ) | | | 1,408 | |
| | | |
Effect of deconsolidation of Oncor Holdings | | | (29 | ) | | | — | | | | — | |
| | | |
Cash and cash equivalents — beginning balance | | | 1,189 | | | | 1,689 | | | | 281 | |
| | | | | | | | | | | | |
| | | |
Cash and cash equivalents — ending balance | | $ | 1,534 | | | $ | 1,189 | | | $ | 1,689 | |
| | | | | | | | | | | | |
See Notes to Financial Statements.
117
ENERGY FUTURE HOLDINGS CORP. AND SUBSIDIARIES
CONSOLIDATED BALANCE SHEETS
(Millions of Dollars)
| | | | | | | | |
| | | December 31, | |
| | | 2010 | | | 2009
(see Note 2) | |
ASSETS | | | | | | | | |
Current assets: | | | | | | | | |
Cash and cash equivalents (Note 1) | | $ | 1,534 | | | $ | 1,189 | |
Investment posted with counterparty (Note 17) | | | — | | | | 425 | |
Restricted cash (Note 24) | | | 33 | | | | 48 | |
Trade accounts receivable — net (2010 includes $612 in pledged amounts related to a VIE (Notes 3 and 10)) | | | 999 | | | | 1,260 | |
Inventories (Note 24) | | | 395 | | | | 485 | |
Commodity and other derivative contractual assets (Note 17) | | | 2,732 | | | | 2,391 | |
Accumulated deferred income taxes (Note 8) | | | — | | | | 5 | |
Margin deposits related to commodity positions | | | 166 | | | | 187 | |
Other current assets | | | 60 | | | | 136 | |
| | | | | | | | |
Total current assets | | | 5,919 | | | | 6,126 | |
| | |
Restricted cash (Note 24) | | | 1,135 | | | | 1,149 | |
Receivables from unconsolidated subsidiary (Note 22) | | | 1,463 | | | | — | |
Investments in unconsolidated subsidiaries (Note 2) | | | 5,544 | | | | 44 | |
Other investments (Note 18) | | | 697 | | | | 706 | |
Property, plant and equipment — net (Note 24) | | | 20,366 | | | | 30,108 | |
Goodwill (Note 4) | | | 6,152 | | | | 14,316 | |
Identifiable intangible assets — net (Note 4) | | | 2,400 | | | | 2,876 | |
Regulatory assets — net (Note 24) | | | — | | | | 1,959 | |
Commodity and other derivative contractual assets (Note 17) | | | 2,071 | | | | 1,533 | |
Other noncurrent assets, principally unamortized debt issuance costs | | | 641 | | | | 845 | |
| | | | | | | | |
Total assets | | $ | 46,388 | | | $ | 59,662 | |
| | | | | | | | |
| | |
LIABILITIES AND EQUITY | | | | | | | | |
| | |
Current liabilities: | | | | | | | | |
Short-term borrowings (2010 includes $96 related to a VIE (Notes 3 and 11)) | | $ | 1,221 | | | $ | 1,569 | |
Long-term debt due currently (Note 11) | | | 669 | | | | 417 | |
Trade accounts payable | | | 681 | | | | 896 | |
Payables due to unconsolidated subsidiary (Note 22) | | | 254 | | | | — | |
Commodity and other derivative contractual liabilities (Note 17) | | | 2,283 | | | | 2,392 | |
Margin deposits related to commodity positions | | | 631 | | | | 520 | |
Accumulated deferred income taxes (Note 8) | | | 11 | | | | — | |
Accrued interest | | | 411 | | | | 526 | |
Other current liabilities | | | 442 | | | | 744 | |
| | | | | | | | |
Total current liabilities | | | 6,603 | | | | 7,064 | |
| | |
Accumulated deferred income taxes (Note 8) | | | 5,350 | | | | 6,131 | |
Investment tax credits | | | — | | | | 37 | |
Commodity and other derivative contractual liabilities (Note 17) | | | 869 | | | | 1,060 | |
Notes or other liabilities due to unconsolidated subsidiary (Note 22) | | | 384 | | | | — | |
Long-term debt, less amounts due currently (Note 11) | | | 34,226 | | | | 41,440 | |
Other noncurrent liabilities and deferred credits (Note 24) | | | 4,867 | | | | 5,766 | |
| | | | | | | | |
Total liabilities | | | 52,299 | | | | 61,498 | |
| | |
Commitments and Contingencies (Note 12) | | | | | | | | |
| | |
Equity (Note 13): | | | | | | | | |
Common stock (shares outstanding 2010 — 1,671,812,118; 2009 — 1,668,065,133) | | | 2 | | | | 2 | |
Additional paid-in capital | | | 7,937 | | | | 7,914 | |
Retained earnings (deficit) | | | (13,666 | ) | | | (10,854 | ) |
Accumulated other comprehensive income (loss) | | | (263 | ) | | | (309 | ) |
| | | | | | | | |
EFH Corp. shareholders’ equity | | | (5,990 | ) | | | (3,247 | ) |
Noncontrolling interests in subsidiaries | | | 79 | | | | 1,411 | |
| | | | | | | | |
Total equity | | | (5,911 | ) | | | (1,836 | ) |
| | | | | | | | |
Total liabilities and equity | | $ | 46,388 | | | $ | 59,662 | |
| | | | | | | | |
See Notes to Financial Statements.
118
ENERGY FUTURE HOLDINGS CORP. AND SUBSIDIARIES
STATEMENTS OF CONSOLIDATED EQUITY
(Millions of Dollars)
| | | | | | | | | | | | |
| | | Year Ended December 31, | |
| | | 2010 | | | 2009 | | | 2008 | |
Common stock stated value of $0.001 effective May 2009 (number of authorized shares — 2,000,000,000): | | | | | | | | | | | | |
Balance as of beginning of period | | $ | 2 | | | $ | — | | | $ | — | |
Effects of shareholder actions related to stated value of common stock | | | — | | | | 2 | | | | — | |
| | | | | | | | | | | | |
Balance as of end of period (number of shares outstanding: 2010 — 1,671,812,118; 2009 — 1,668,065,133; 2008 — 1,667,149,663 | | | 2 | | | | 2 | | | | — | |
| | | | | | | | | | | | |
Additional paid-in capital: | | | | | | | | | | | | |
Balance as of beginning of period | | | 7,914 | | | | 7,904 | | | | 8,279 | |
Effects of stock-based incentive compensation plans | | | 24 | | | | 11 | | | | 29 | |
Effects of shareholder actions related to stated value of common stock | | | — | | | | (2 | ) | | | — | |
Effect of sale of noncontrolling interests (Note 13) | | | — | | | | — | | | | (406 | ) |
Common stock repurchases | | | (2 | ) | | | — | | | | — | |
Other | | | 1 | | | | 1 | | | | 2 | |
| | | | | | | | | | | | |
Balance as of end of period | | | 7,937 | | | | 7,914 | | | | 7,904 | |
| | | | | | | | | | | | |
| | | |
Retained earnings (deficit): | | | | | | | | | | | | |
Balance as of beginning of period | | | (10,854 | ) | | | (11,198 | ) | | | (1,360 | ) |
Net income (loss) attributable to EFH Corp. | | | (2,812 | ) | | | 344 | | | | (9,838 | ) |
| | | | | | | | | | | | |
Balance as of end of period | | | (13,666 | ) | | | (10,854 | ) | | | (11,198 | ) |
| | | | | | | | | | | | |
Accumulated other comprehensive income (loss), net of tax effects: | | | | | | | | | | | | |
Pension and other postretirement employee benefit liability adjustments: | | | | | | | | | | | | |
Balance as of beginning of period | | | (181 | ) | | | (141 | ) | | | (57 | ) |
Change in unrecognized gains (losses) related to pension and other retirement benefit costs | | | (13 | ) | | | (40 | ) | | | (84 | ) |
| | | | | | | | | | | | |
Balance as of end of period | | | (194 | ) | | | (181 | ) | | | (141 | ) |
| | | | | | | | | | | | |
Amounts related to cash flow hedges: | | | | | | | | | | | | |
Balance as of beginning of period | | | (128 | ) | | | (238 | ) | | | (177 | ) |
Change during the period | | | 59 | | | | 110 | | | | (61 | ) |
| | | | | | | | | | | | |
Balance as of end of period | | | (69 | ) | | | (128 | ) | | | (238 | ) |
| | | | | | | | | | | | |
Total accumulated other comprehensive income (loss) as of end of period | | | (263 | ) | | | (309 | ) | | | (379 | ) |
| | | | | | | | | | | | |
| | | |
EFH Corp. shareholders’ equity as of end of period (Note 13) | | | (5,990 | ) | | | (3,247 | ) | | | (3,673 | ) |
| | | | | | | | | | | | |
| | | |
Noncontrolling interests in subsidiaries (Note 14): | | | | | | | | | | | | |
Balance as of beginning of period | | | 1,411 | | | | 1,355 | | | | — | |
Net income (loss) attributable to noncontrolling interests | | | — | | | | 64 | | | | (160 | ) |
Effect of deconsolidation of Oncor Holdings (Notes 1 and 3) | | | (1,363 | ) | | | — | | | | — | |
Investments by noncontrolling interests | | | 32 | | | | 48 | | | | 1,253 | |
Effect of sale of noncontrolling interests | | | — | | | | — | | | | 265 | |
Distributions to noncontrolling interests | | | — | | | | (56 | ) | | | (2 | ) |
Other | | | (1 | ) | | | — | | | | (1 | ) |
| | | | | | | | | | | | |
Noncontrolling interests in subsidiaries as of end of period | | | 79 | | | | 1,411 | | | | 1,355 | |
| | | | | | | | | | | | |
| | | |
Total equity as of end of period | | $ | (5,911 | ) | | $ | (1,836 | ) | | $ | (2,318 | ) |
| | | | | | | | | | | | |
See Notes to Financial Statements.
119
ENERGY FUTURE HOLDINGS CORP. AND SUBSIDIARIES
NOTES TO CONSOLIDATED FINANCIAL STATEMENTS
| 1. | BUSINESS AND SIGNIFICANT ACCOUNTING POLICIES |
Description of Business
EFH Corp., a Texas corporation, is a Dallas-based holding company with operations consisting principally of our TCEH and Oncor subsidiaries. TCEH is a holding company for subsidiaries engaged in competitive electricity market activities largely in Texas, including electricity generation, wholesale energy sales and purchases, commodity risk management and trading activities, and retail electricity sales. Oncor is a majority (approximately 80%) owned subsidiary engaged in regulated electricity transmission and distribution operations in Texas. See Note 3 regarding the deconsolidation of Oncor (and it majority owner, Oncor Holdings) as a result of amended consolidation accounting standards related to variable interest entities (VIEs) effective January 1, 2010.
On October 10, 2007, EFH Corp. completed its Merger with Merger Sub. As a result of the Merger, EFH Corp. became a subsidiary of Texas Holdings, which is controlled by the Sponsor Group.
References in this report to “we,” “our,” “us” and “the company” are to EFH Corp. and/or its subsidiaries, TCEH and/or its subsidiaries, or Oncor and/or its subsidiary as apparent in the context. See “Glossary” for other defined terms.
Various “ring-fencing” measures have been taken to enhance the credit quality of Oncor. Such measures include, among other things: the sale of a 19.75% equity interest in Oncor to Texas Transmission in November 2008; maintenance of separate books and records for the Oncor Ring-Fenced Entities; Oncor’s board of directors being comprised of a majority of independent directors, and prohibitions on the Oncor Ring-Fenced Entities providing credit support to, or receiving credit support from, any member of the Texas Holdings Group. The assets and liabilities of the Oncor Ring-Fenced Entities are separate and distinct from those of the Texas Holdings Group and none of the assets of the Oncor Ring-Fenced Entities are available to satisfy the debt or contractual obligations of any member of the Texas Holdings Group. Moreover, Oncor’s operations are conducted, and its cash flows managed, independently from the Texas Holdings Group.
See Note 14 for discussion of noncontrolling interests sold by Oncor in November 2008.
We have two reportable segments: the Competitive Electric segment, which is comprised principally of TCEH, and the Regulated Delivery segment, which is comprised of Oncor Holdings and its subsidiaries. See Note 23 for further information concerning reportable business segments.
Basis of Presentation
The consolidated financial statements have been prepared in accordance with US GAAP. The consolidated financial statements have been prepared on the same basis as the audited financial statements included in the 2009 Form 10-K with the exception of the prospective adoption of amended guidance regarding consolidation accounting standards related to VIEs that resulted in the deconsolidation of Oncor Holdings as discussed in Note 3 and amended guidance regarding transfers of financial assets that resulted in the accounts receivable securitization program no longer being accounted for as a sale of accounts receivable and the funding under the program now reported as short-term borrowings as discussed in Note 10. All intercompany items and transactions have been eliminated in consolidation. All acquisitions of outstanding debt for cash, including notes that had been issued in lieu of cash interest, are presented in the financing activities section of the statement of cash flows. All dollar amounts in the financial statements and tables in the notes are stated in millions of US dollars unless otherwise indicated.
120
Use of Estimates
Preparation of financial statements requires estimates and assumptions about future events that affect the reporting of assets and liabilities as of the balance sheet dates and the reported amounts of revenue and expense, including fair value measurements. In the event estimates and/or assumptions prove to be different from actual amounts, adjustments are made in subsequent periods to reflect more current information. No material adjustments, other than those disclosed elsewhere herein, were made to previous estimates or assumptions during the current year.
Derivative Instruments and Mark-to-Market Accounting
We enter into contracts for the purchase and sale of electricity, natural gas and other commodities and also enter into other derivative instruments such as options, swaps, futures and forwards primarily to manage our commodity price and interest rate risks. If the instrument meets the definition of a derivative under accounting standards related to derivative instruments and hedging activities, changes in the fair value of the derivative are recognized in net income as unrealized gains and losses, unless the criteria for certain exceptions are met, and an offsetting derivative asset or liability is recorded in the balance sheet. This recognition is referred to as “mark-to-market” accounting. The fair values of our unsettled derivative instruments under mark-to-market accounting are reported in the balance sheet as commodity and other derivative contractual assets or liabilities. When derivative instruments are settled and realized gains and losses are recorded, the previously recorded unrealized gains and losses and derivative assets and liabilities are reversed. See Notes 15 and 17 for additional information regarding fair value measurement and commodity and other derivative contractual assets and liabilities. Under the election criteria of accounting standards related to derivative instruments and hedging activities, we may elect the “normal” purchase and sale exemption. A commodity-related derivative contract may be designated as a “normal” purchase or sale if the commodity is to be physically received or delivered for use or sale in the normal course of business. If designated as normal, the derivative contract is accounted for under the accrual method of accounting (not marked-to-market) with no balance sheet or income statement recognition of the contract until settlement.
Because derivative instruments are frequently used as economic hedges, accounting standards related to derivative instruments and hedging activities allow for “hedge accounting,” which provides for the designation of such instruments as cash flow or fair value hedges if certain conditions are met. A cash flow hedge mitigates the risk associated with the variability of the future cash flows related to an asset or liability (e.g., a forecasted sale of electricity in the future at market prices or the payment of interest related to variable rate debt), while a fair value hedge mitigates risk associated with fixed future cash flows (e.g., debt with fixed interest rate payments). In accounting for changes in the fair value of cash flow hedges, derivative assets and liabilities are recorded on the balance sheet with an offset to other comprehensive income or loss to the extent the hedges are effective and the hedged transaction remains probable of occurring. If the hedged transaction becomes probable of not occurring, hedge accounting is discontinued and the amount recorded in other comprehensive income is immediately reclassified into net income. If the relationship between the hedge and the hedged transaction ceases to exist or is dedesignated, hedge accounting is discontinued, and the amounts recorded in other comprehensive income are recognized as the previously hedged transaction impacts earnings. Changes in value of fair value hedges are recorded as derivative assets or liabilities with an offset to net income, and the carrying value of the related asset or liability (hedged item) is adjusted for changes in fair value with an offset to net income. If the fair value hedge is settled prior to the maturity of the hedged item, the cumulative fair value gain or loss associated with the hedge is amortized into income over the remaining life of the hedged item. In the statement of cash flow, the effects of settlements of derivative instruments are classified consistent with the related hedged transactions.
To qualify for hedge accounting, a hedge must be considered highly effective in offsetting changes in fair value of the hedged item. Assessment of the hedge’s effectiveness is tested at least quarterly throughout its term to continue to qualify for hedge accounting. Changes in fair value that represent hedge ineffectiveness, even if the hedge continues to be assessed as effective, are immediately recognized in net income. Ineffectiveness is generally measured as the cumulative excess, if any, of the change in value of the hedging instrument over the change in value of the hedged item. See Notes 11 and 17 for additional information concerning hedging activity.
At December 31, 2010 and 2009, there were no derivative positions accounted for as cash flow or fair value hedges. Accumulated other comprehensive income includes amounts related to interest rate swaps previously designated as cash flow hedges that will be recognized in net income as the hedged transactions impact net income (see Note 11).
121
Realized and unrealized gains and losses from transacting in energy-related derivative instruments are primarily reported in the income statement in net gain (loss) from commodity hedging and trading activities. In accordance with accounting rules, upon settlement of physical derivative sales and purchase contracts that are marked-to-market in net income, related wholesale electricity revenues and fuel and purchased power costs are reported at approximated market prices, instead of the contract price. As a result, this noncash difference between market and contract prices is included in the operating revenues and fuel and purchased power costs and delivery fees line items of the income statement, with offsetting amounts included in net gain (loss) from commodity hedging and trading activities.
Revenue Recognition
We record revenue from electricity sales and delivery service under the accrual method of accounting. Revenues are recognized when electricity or delivery services are provided to customers on the basis of periodic cycle meter readings and include an estimated accrual for the revenues earned from the meter reading date to the end of the period (unbilled revenue).
We report physically delivered commodity sales and purchases in the income statement on a gross basis in revenues and fuel, purchased power and delivery fees, respectively, and we report all other commodity related contracts and financial instruments (primarily derivatives) in the income statement on a net basis in net gain/(loss) from commodity hedging and trading activities. As part of ERCOT’s transition to a nodal wholesale market effective December 1, 2010, volumes under nontrading bilateral purchase and sales contracts, including contracts intended as hedges, are no longer scheduled as physical power with ERCOT. Accordingly, unless the volumes represent physical deliveries to customers or purchases from counterparties, effective with the nodal market implementation, such contracts are reported net in the income statement in net gain/(loss) from commodity hedging and trading activities instead of reported gross as wholesale revenues or purchased power costs. As a result of the changes in wholesale market operations, effective with the nodal market implementation, if volumes delivered to our retail and wholesale customers are less than our generation volumes (as determined on a daily settlement basis), we record additional wholesale revenues, and if volumes delivered to our retail and wholesale customers exceed our generation volumes, we record additional purchased power costs. The additional wholesale revenues or purchased power costs are offset in net gain/(loss) from commodity hedging and trading activities.
Impairment of Long-Lived Assets
We evaluate long-lived assets (including intangible assets with finite lives) for impairment whenever indications of impairment exist. The carrying value of such assets is deemed to be impaired if the projected undiscounted cash flows are less than the carrying value. If there is such impairment, a loss would be recognized based on the amount by which the carrying value exceeds the fair value. Fair value is determined primarily by discounted cash flows, supported by available market valuations, if applicable. See Note 5 for details of the impairment of the natural gas-fueled generation facilities recorded in 2008.
We evaluate investments in unconsolidated subsidiaries for impairment when factors indicate that a decrease in the value of the investment has occurred that is not temporary. Indicators that should be evaluated for possible impairment of investments include recurring operating losses of the investee or fair value measures that are less than carrying value. Any impairment recognition is based on fair value that is not reflective of temporary conditions. Fair value is determined primarily by discounted long-term cash flows, supported by available market valuations, if applicable.
Finite-lived intangibles identified as a result of purchase accounting are amortized over their estimated useful lives based on the expected realization of economic effects. See Note 4 for additional information.
122
Goodwill and Intangible Assets with Indefinite Lives
We evaluate goodwill and intangible assets with indefinite lives for impairment at least annually (as of December 1). See Note 4 for details of goodwill and intangible assets with indefinite lives, including discussion of fair value determinations and impairments of goodwill and trade name intangible assets recorded in 2010, 2009 and 2008.
Amortization of Nuclear Fuel
Amortization of nuclear fuel is calculated on the units-of-production method and is reported as fuel costs.
Major Maintenance
Major maintenance costs incurred during generation plant outages and the costs of other maintenance activities are charged to expense as incurred and reported as operating costs.
Defined Benefit Pension Plans and Other Postretirement Employee Benefit Plans
We offer pension benefits based on either a traditional defined benefit formula or a cash balance formula and also offer certain health care and life insurance benefits to eligible employees and their eligible dependents upon the retirement of such employees from the company. Costs of pension and OPEB plans are dependent upon numerous factors, assumptions and estimates. The pension and OPEB accrued benefit obligations reported in the balance sheet are in accordance with accounting standards related to employers’ accounting for defined benefit pension and other postretirement plans. See Note 20 for additional information regarding pension and OPEB plans.
Stock-Based Incentive Compensation
Our 2007 Stock Incentive Plan authorizes discretionary grants to directors, officers and qualified managerial employees of EFH Corp. or its affiliates of non-qualified stock options, stock appreciation rights, restricted shares, shares of common stock, the opportunity to purchase shares of common stock and other stock-based awards. Stock-based compensation expense is recognized over the vesting period based on the grant-date fair value of those awards. See Note 21 for information regarding stock-based incentive compensation.
Sales and Excise Taxes
Sales and excise taxes are accounted for as a “pass through” item on the balance sheet; i.e., the tax is billed to customers and recorded as trade accounts receivable with an offsetting amount recorded as a liability to the taxing jurisdiction.
Franchise and Revenue-Based Taxes
Unlike sales and excise taxes, franchise and gross receipt taxes are not a “pass through” item. These taxes are assessed to us by state and local government bodies, based on revenues or kWh delivered, as a cost of doing business and are recorded as an expense. Rates we charge to customers are intended to recover our costs, including the franchise and gross receipt taxes, but we are not acting as an agent to collect the taxes from customers.
123
Income Taxes
We file a consolidated federal income tax return, and federal income taxes are calculated for our subsidiaries substantially as if the entities file separate income tax returns. Deferred income taxes are provided for temporary differences between the book and tax basis of assets and liabilities. Effective with the sale of noncontrolling interests in Oncor in 2008 (see Note 14), Oncor became a partnership for US federal income tax purposes, and we provide deferred income taxes on the difference between the book and tax basis of our investment in Oncor. Investment tax credits related to Oncor’s regulated operations are deferred and amortized over the lives of the related properties in accordance with regulatory treatment. Certain provisions of the accounting guidance for income taxes allow regulated enterprises to recognize deferred taxes as regulatory tax assets or tax liabilities if it is probable that such amounts will be recovered from, or returned to, customers in future rates.
We report interest and penalties related to uncertain tax positions as current income tax expense.
Accounting for Contingencies
Our financial results may be affected by judgments and estimates related to loss contingencies. Accruals for loss contingencies are recorded when management determines that it is probable that an asset has been impaired or a liability has been incurred and that such economic loss can be reasonably estimated. Such determinations are subject to interpretations of current facts and circumstances, forecasts of future events and estimates of the financial impacts of such events. See Note 12 for a discussion of contingencies.
Cash and Cash Equivalents
For purposes of reporting cash and cash equivalents, temporary cash investments purchased with a remaining maturity of three months or less are considered to be cash equivalents.
Restricted Cash
The terms of certain agreements require the restriction of cash for specific purposes. As of December 31, 2010, $1.135 billion of cash was restricted to support letters of credit. See Notes 11 and 24 for more details regarding restricted cash.
Property, Plant and Equipment
As a result of purchase accounting, carrying amounts of property, plant and equipment related to unregulated businesses were adjusted to estimated fair values at the Merger date. Subsequent additions have been recorded at cost. Oncor’s properties are reported at original cost, which is considered to be fair value due to the cost-based regulated recovery and returns associated with those assets. The cost of self-constructed property additions includes materials and both direct and indirect labor and applicable overhead, including payroll-related costs.
Depreciation of our property, plant and equipment is calculated on a straight-line basis over the estimated service lives of the properties. Depreciation expense for unregulated properties is calculated on a component asset-by-asset basis. As is common in the industry for regulated operations, Oncor’s depreciation expense is calculated using composite depreciation rates that reflect blended estimates of the lives of major asset groups. Estimated depreciable lives are based on management’s estimates of the assets’ economic useful lives or, in the case of Oncor, as set by PUCT orders. See Note 24.
Capitalized Interest
Interest related to qualifying construction projects and qualifying software projects is capitalized in accordance with accounting guidance related to capitalization of interest cost. See Note 24.
124
Inventories
Inventories are reported at the lower of cost (on a weighted average basis) or market unless expected to be used in the generation of electricity. Also see discussion immediately below regarding environmental allowances and credits.
Environmental Allowances and Credits
We account for all environmental allowances and credits as identifiable intangible assets with finite lives that are subject to amortization. The recorded values of these intangible assets were originally established reflecting fair value determinations as of the date of the Merger under purchase accounting. Amortization expense associated with these intangible assets is recognized on a unit of production basis as the allowances or credits are consumed in generation operations. The environmental allowances and credits are assessed for impairment when conditions or events occur that could affect the carrying value of the assets. See Note 4 for details of impairment amounts recorded in 2008.
Regulatory Assets and Liabilities
The financial statements of our regulated electricity delivery operations reflect regulatory assets and liabilities under cost-based rate regulation in accordance with accounting standards related to the effect of certain types of regulation. Regulatory decisions can have an impact on the recovery of costs, the rate earned on invested capital and the timing and amount of assets to be recovered by rates. See Note 24 for details of the regulatory assets and liabilities.
Investments
Investments in unconsolidated subsidiaries, which are 50% or less owned and/or do not meet accounting standards criteria for consolidation, are accounted for under the equity method. See Note 2 for discussion of equity method investments and Note 3 for discussion of VIEs.
Investments in a nuclear decommissioning trust fund are carried at current market value in the balance sheet. Assets related to employee benefit plans represent investments held to satisfy deferred compensation liabilities and are recorded at current market value. See Note 18 for discussion of these and other investments.
Noncontrolling Interests
See Note 14 for discussion of accounting for noncontrolling interests in subsidiaries.
Changes in Accounting Standards
As of January 1, 2010, we adopted new FASB guidance that requires reconsideration of consolidation conclusions for all VIEs and other entities with which we are involved. See Note 3 for discussion of our evaluation of VIEs and the resulting deconsolidation of Oncor Holdings and its subsidiaries that resulted in our investment in Oncor Holdings and its subsidiaries being prospectively reported as an equity method investment. There were no other material effects on our financial statements as a result of the adoption of this new guidance.
As of January 1, 2010, we adopted new FASB guidance regarding accounting for transfers of financial assets that eliminates the concept of a qualifying special purpose entity, changes the requirements for derecognizing financial assets and requires additional disclosures. Accordingly, the trade accounts receivable amounts under the accounts receivable securitization program discussed in Note 10 are now reported as pledged balances, and the related funding amounts are reported as short-term borrowings. Prior to January 1, 2010, the activity was accounted for as a sale of accounts receivable in accordance with previous accounting standards, which resulted in the funding being recorded as a reduction of accounts receivable. This new guidance does not impact the covenant-related ratio calculations in our debt agreements.
125
| 2. | EQUITY METHOD INVESTMENTS |
Investments in unconsolidated subsidiaries consisted of the following:
| | | | | | | | |
| | | December 31, | |
| | | 2010 | | | 2009 | |
| | |
Investment in Oncor Holdings (100% owned) (a) | | $ | 5,544 | | | $ | — | |
Investment in natural gas gathering pipeline business (b) | | | — | | | | 44 | |
| | | | | | | | |
Total investments in unconsolidated subsidiaries | | $ | 5,544 | | | $ | 44 | |
| | | | | | | | |
| |
| | (a) | Oncor Holdings owns approximately 80% of the membership interests of Oncor and was deconsolidated effective January 1, 2010 (see Notes 1 and 3). |
| | (b) | A controlling interest in this previously consolidated subsidiary was sold in 2009, and the remaining interests were sold in June 2010. |
Oncor Holdings
Effective January 1, 2010, we account for our investment in Oncor Holdings under the equity method (see Note 3). Prior to this date, Oncor Holdings was a consolidated subsidiary. Oncor Holdings owns approximately 80% of Oncor (an SEC registrant), which is engaged in regulated electricity transmission and distribution operations in Texas. Distribution revenues from TCEH represented 36%, 38% and 39% of total revenues for Oncor Holdings for the years ended December 31, 2010, 2009 and 2008, respectively. Condensed statements of consolidated income of Oncor Holdings for the years ended December 31, 2010, 2009 and 2008 are presented below:
| | | | | | | | | | | | |
| | | Year Ended December 31, | |
| | | 2010 | | | 2009 | | | 2008 | |
| | | |
Operating revenues | | $ | 2,914 | | | $ | 2,690 | | | $ | 2,580 | |
Operation and maintenance expenses | | | (1,009 | ) | | | (962 | ) | | | (852 | ) |
Write off of regulatory assets | | | — | | | | (25 | ) | | | — | |
Depreciation and amortization | | | (673 | ) | | | (557 | ) | | | (492 | ) |
Taxes other than income taxes | | | (384 | ) | | | (385 | ) | | | (391 | ) |
Impairment of goodwill | | | — | | | | — | | | | (860 | ) |
Other income | | | 36 | | | | 49 | | | | 45 | |
Other deductions | | | (8 | ) | | | (14 | ) | | | (25 | ) |
Interest income | | | 38 | | | | 43 | | | | 45 | |
Interest expense and related charges | | | (347 | ) | | | (346 | ) | | | (316 | ) |
| | | | | | | | | | | | |
| | | |
Income (loss) before income taxes | | | 567 | | | | 493 | | | | (266 | ) |
| | | |
Income tax expense | | | (220 | ) | | | (173 | ) | | | (217 | ) |
| | | | | | | | | | | | |
| | | |
Net income (loss) | | | 347 | | | | 320 | | | | (483 | ) |
Net (income) loss attributable to noncontrolling interests | | | (70 | ) | | | (64 | ) | | | 160 | |
| | | | | | | | | | | | |
Net income (loss) attributable to Oncor Holdings | | $ | 277 | | | $ | 256 | | | $ | (323 | ) |
| | | | | | | | | | | | |
126
Assets and liabilities of Oncor Holdings as of December 31, 2010 and 2009 are presented below:
| | | | | | | | |
| | | December 31, | |
| | | 2010 | | | 2009 | |
| | | (millions of dollars) | |
ASSETS | | | | | | | | |
Current assets: | | | | | | | | |
Cash and cash equivalents | | $ | 33 | | | $ | 29 | |
Restricted cash | | | 53 | | | | 47 | |
Trade accounts receivable — net | | | 254 | | | | 243 | |
Trade accounts and other receivables from affiliates | | | 182 | | | | 188 | |
Income taxes receivable from EFH Corp. | | | 72 | | | | — | |
Inventories | | | 96 | | | | 92 | |
Accumulated deferred income taxes | | | 10 | | | | 10 | |
Prepayments | | | 75 | | | | 76 | |
Other current assets | | | 5 | | | | 8 | |
| | | | | | | | |
Total current assets | | | 780 | | | | 693 | |
| | |
Restricted cash | | | 16 | | | | 14 | |
Other investments | | | 78 | | | | 72 | |
Property, plant and equipment — net | | | 9,676 | | | | 9,174 | |
Goodwill | | | 4,064 | | | | 4,064 | |
Note receivable due from TCEH | | | 178 | | | | 217 | |
Regulatory assets — net | | | 1,782 | | | | 1,959 | |
Other noncurrent assets | | | 264 | | | | 51 | |
| | | | | | | | |
Total assets | | $ | 16,838 | | | $ | 16,244 | |
| | | | | | | | |
LIABILITIES | | | | | | | | |
| | |
Current liabilities: | | | | | | | | |
Short-term borrowings | | $ | 377 | | | $ | 616 | |
Long-term debt due currently | | | 113 | | | | 108 | |
Trade accounts payable — nonaffiliates | | | 125 | | | | 129 | |
Income taxes payable to EFH Corp. | | | — | | | | 5 | |
Accrued taxes other than income | | | 133 | | | | 137 | |
Accrued interest | | | 108 | | | | 104 | |
Other current liabilities | | | 109 | | | | 106 | |
| | | | | | | | |
Total current liabilities | | | 965 | | | | 1,205 | |
| | |
Accumulated deferred income taxes | | | 1,516 | | | | 1,369 | |
Investment tax credits | | | 32 | | | | 37 | |
Long-term debt, less amounts due currently | | | 5,333 | | | | 4,996 | |
Other noncurrent liabilities and deferred credits | | | 1,996 | | | | 1,879 | |
| | | | | | | | |
Total liabilities | | $ | 9,842 | | | $ | 9,486 | |
| | | | | | | | |
127
Oncor Debt Issuances and Exchanges
In September 2010, Oncor issued $475 million aggregate principal amount of 5.250% senior secured notes maturing in September 2040. Oncor used the net proceeds of approximately $465 million from the sale of the notes to repay borrowings under its revolving credit facility, including loans under the revolving credit facility made by certain of the initial purchasers of the notes or their affiliates, and for general corporate purposes. The notes are secured by a first priority lien on Oncor’s assets equally and ratably with all of Oncor’s other secured indebtedness.
In October 2010, Oncor issued approximately $324.4 million aggregate principal amount of 5.000% senior secured notes due 2017 and approximately $126.3 million aggregate principal amount of 5.750% senior secured notes due 2020 in exchange for an equivalent principal amount of its outstanding 6.375% senior secured notes due 2012 and 5.950% senior secured notes due 2013, respectively. Oncor did not receive any cash proceeds from the exchange.
128
| 3. | CONSOLIDATION OF VARIABLE INTEREST ENTITIES |
A variable interest entity (VIE) is an entity with which we have a relationship or arrangement that indicates some level of control over the entity or results in economic risks to us. We adopted amended accounting standards on January 1, 2010 that require consolidation of a VIE if we have (a) the power to direct the significant activities of the VIE and (b) the right or obligation to absorb profit and loss from the VIE (primary beneficiary). The previous standards did not require power to direct significant activities of the VIE in order to consolidate. As discussed below, our balance sheet includes assets and liabilities of VIEs that meet the consolidation standards and also reflects the deconsolidation of Oncor Holdings, which holds an approximate 80% interest in Oncor.
Our VIEs consist of equity investees. In determining the appropriateness of consolidation of a VIE, we evaluate its purpose, governance structure, decision making processes and risks that are passed on to its interest holders. We also examine the nature of any related party relationships among the interest holders of the VIE and the nature of any special rights granted to the interest holders of the VIE.
Consolidated VIEs
No additional VIEs were consolidated as a result of the new accounting standards. See discussion in Note 10 regarding the VIE related to our accounts receivable securitization program that continues to be consolidated under the amended accounting standards.
We also continue to consolidate Comanche Peak Nuclear Power Company LLC (CPNPC), which was formed by subsidiaries of TCEH and Mitsubishi Heavy Industries Ltd. (MHI) for the purpose of developing two new nuclear generation units at our existing Comanche Peak nuclear-fueled generation facility using MHI’s US-Advanced Pressurized Water Reactor technology and to obtain a combined operating license from the NRC. CPNPC is currently financed through capital contributions from the subsidiaries of TCEH and MHI that hold 88% and 12% of CPNPC’s equity interests, respectively (see Note 14).
The carrying amounts and classifications of the assets and liabilities related to our consolidated VIEs as of December 31, 2010 are as follows:
| | | | | | | | | | |
Assets: | | | Liabilities: | |
Cash and cash equivalents | | $ | 9 | | | Short-term borrowings (a) | | $ | 96 | |
Accounts receivable (a) | | | 612 | | | Trade accounts payable | | | 3 | |
Property, plant and equipment | | | 112 | | �� | Other current liabilities | | | 1 | |
| | | | | | | | | | |
Other assets, including $2 of current assets | | | 8 | | | | | | | |
| | | | | | | | | | |
Total assets | | $ | 741 | | | Total liabilities | | $ | 100 | |
| | | | | | | | | | |
| (a) | As a result of the January 1, 2010 adoption of new accounting guidance related to transfers of financial assets, the balance sheet as of December 31, 2010 reflects $612 million of pledged accounts receivable and $96 million of short-term borrowings (see Note 10). |
The assets of our consolidated VIEs can only be used to settle the obligations of the VIE, and the creditors of our consolidated VIEs do not have recourse to our general credit.
129
Non-Consolidated VIEs
The adoption of the amended accounting standards resulted in the deconsolidation of Oncor Holdings, which holds an approximate 80% interest in Oncor, and the reporting of our investment in Oncor Holdings under the equity method on a prospective basis.
In reaching the conclusion to deconsolidate, we conducted an extensive analysis of Oncor Holdings’ underlying governing documents and management structure. Oncor Holdings’ unique governance structure was adopted in conjunction with the Merger, when the Sponsor Group, EFH Corp. and Oncor agreed to implement structural and operational measures to “ring-fence” (the Ring-Fencing Measures) Oncor Holdings and Oncor as discussed in Note 1. The Ring-Fencing Measures were designed to prevent, among other things, (i) increased borrowing costs at Oncor due to the attribution to Oncor of debt from any of our other subsidiaries, (ii) the activities of our unregulated operations following the Merger resulting in the deterioration of Oncor’s business, financial condition and/or investment in infrastructure, and (iii) Oncor becoming substantively consolidated into a bankruptcy proceeding involving any member of the Texas Holdings Group. The Ring-Fencing Measures effectively separated the daily operational and management control of Oncor Holdings and Oncor from EFH Corp. and its other subsidiaries. By implementing the Ring-Fencing Measures, Oncor maintained its investment grade credit rating following the Merger, and we reaffirmed Oncor’s independence from our unregulated businesses to the PUCT.
We determined the most significant activities affecting the economic performance of Oncor Holdings (and Oncor) are the operation, maintenance and growth of Oncor’s electric transmission and distribution assets and the preservation of its investment grade credit profile. The boards of directors of Oncor Holdings and Oncor have ultimate responsibility for the management of the day-to-day operations of their respective businesses, including the approval of Oncor’s capital expenditure and operating budgets and the timing and prosecution of Oncor’s rate cases. While both boards include members appointed by EFH Corp., a majority of the board members are independent in accordance with rules established by the New York Stock Exchange, and therefore, we concluded for purposes of applying the amended accounting standards that EFH Corp. does not have the power to control the activities deemed most significant to Oncor Holdings’ (and Oncor’s) economic performance.
In assessing EFH Corp.’s ability to exercise control over Oncor Holdings and Oncor, we considered whether it could take actions to circumvent the purpose and intent of the Ring-Fencing Measures (including changing the composition of Oncor Holdings’ or Oncor’s board) in order to gain control over the day-to-day operations of either Oncor Holdings or Oncor. We also considered whether (i) EFH Corp. has the unilateral power to dissolve, liquidate or force into bankruptcy either Oncor Holdings or Oncor, (ii) EFH Corp. could unilaterally amend the Ring-Fencing Measures contained in the underlying governing documents of Oncor Holdings or Oncor, and (iii) EFH Corp. could control Oncor’s ability to pay distributions and thereby enhance its own cash flow. We concluded that, in each case, no such opportunity exists.
We account for our investment in Oncor Holdings under the equity method, as opposed to the cost method, because we have the ability to exercise significant influence (as defined by US GAAP) over its activities. Our maximum exposure to loss from our variable interests in VIEs does not exceed our carrying value. See Note 2 for additional information about equity method investments including condensed income statement and balance sheet data for Oncor Holdings.
130
| 4. | GOODWILL AND IDENTIFIABLE INTANGIBLE ASSETS |
Goodwill
The following table provides the goodwill balances as of December 31, 2010 and the changes in such balances for the year ended December 31, 2010. With the deconsolidation of Oncor (including its $4.064 billion goodwill balance) effective January 1, 2010, the amounts below relate only to our competitive business. None of the goodwill is being deducted for tax purposes.
| | | | |
Goodwill before impairment charges | | $ | 18,342 | |
Accumulated impairment charges through 2009 (a) | | | (8,090 | ) |
| | | | |
Balance as of January 1, 2010 | | | 10,252 | |
Additional impairment charge in 2010 | | | (4,100 | ) |
| | | | |
Balance as of December 31, 2010 (b) | | $ | 6,152 | |
| | | | |
| |
| | (a) | Includes $90 million in 2009 ($20 million of which was recorded in Corporate and Other results) and $8.0 billion in 2008. |
| | (b) | Net of accumulated impairment charges totaling $12.190 billion. |
Goodwill and Trade Name Intangible Asset Impairments
In the third quarter 2010, we recorded a $4.1 billion noncash goodwill impairment charge related to the Competitive Electric segment. The impairment testing and resulting charge was driven by the sustained decline in forward natural gas prices and reflected the estimated effect of lower wholesale power prices on the enterprise value of the business as indicated by our cash flow projections and declines in market values of securities of comparable companies.
The calculation of the goodwill impairment involved the following steps: first, we estimated the debt-free enterprise value of the business as of July 31, 2010 taking into account future estimated cash flows and current securities values of comparable companies; second, we estimated the fair values of the individual operating assets and liabilities of the business at that date; third, we calculated “implied” goodwill as the excess of the estimated enterprise value over the estimated value of the net operating assets; and finally, we compared the implied goodwill amount to the carrying value of goodwill and recorded an impairment charge for the amount the carrying value of goodwill exceeded implied goodwill.
The annual impairment testing performed as of December 1, 2010 for goodwill and intangible assets with indefinite useful lives resulted in no additional impairment beyond the charge recorded in the third quarter 2010 discussed immediately above. The annual goodwill test determined that the Competitive Electric segment carrying value exceeded its estimated fair value (enterprise value) by approximately 11%. The estimated enterprise value as of December 1, 2010 did not change materially from the estimate at July 31, 2010. Additional testing was performed to ascertain that the estimated implied goodwill amount as of December 1 had not declined further from the amount estimated at July 31.
In the first quarter 2009, we completed the fair value calculations supporting an initial $8.860 billion goodwill impairment charge that was recorded in the fourth quarter 2008 and consisted of an estimated impairment of $8.0 billion related to the Competitive Electric segment and $860 million related to the Regulated Delivery segment. A $90 million increase in the charge, largely related to the Competitive Electric segment, was recorded in the first quarter 2009. The impairment charge primarily reflected the dislocation in the capital markets during the fourth quarter 2008 that increased interest rate spreads and the resulting discount rates used in estimating fair values and the effect of declines in market values of debt and equity securities of comparable companies. The calculation involved the same steps as those discussed above for the 2010 impairment. The total $8.950 billion charge was the first goodwill impairment recorded subsequent to the Merger date.
Also in the fourth quarter 2008, we recorded a trade name intangible asset impairment charge totaling $481 million ($310 million after-tax). The impairment primarily arose from the increase in the discount rate used in estimating fair value as discussed above.
131
Although the annual impairment test date for goodwill and intangible assets with indefinite lives set by management at that time was October 1, management determined that in consideration of the continuing deterioration of securities values during the fourth quarter 2008, an impairment testing trigger occurred subsequent to that test date; consequently, the impairment charges were based on estimated fair values as of December 31, 2008.
The impairment determinations involved significant assumptions and judgments. The calculations supporting the estimates of the enterprise value of our businesses and the fair values of their operating assets and liabilities utilized models that take into consideration multiple inputs, including commodity prices, discount rates, debt yields, securities prices of comparable companies and other inputs, assumptions regarding each of which could have a significant effect on valuations. The fair value measurements resulting from these models are classified as non-recurring Level 3 measurements consistent with accounting standards related to the determination of fair value (see Note 15). Because of the volatility of these factors, we cannot predict the likelihood of any future impairment.
Identifiable Intangible Assets
Identifiable intangible assets reported in the balance sheet are comprised of the following:
| | | | | | | | | | | | | | | | | | | | | | | | |
| | | As of December 31, 2010 (a) | | | As of December 31, 2009 | |
| | | Gross
Carrying | | | Accumulated | | | | | | Gross
Carrying | | | Accumulated | | | | |
Identifiable Intangible Asset | | Amount | | | Amortization | | | Net | | | Amount | | | Amortization | | | Net | |
Retail customer relationship | | $ | 463 | | | $ | 293 | | | $ | 170 | | | $ | 463 | | | $ | 215 | | | $ | 248 | |
Favorable purchase and sales contracts | | | 548 | | | | 257 | | | | 291 | | | | 700 | | | | 374 | | | | 326 | |
Capitalized in-service software | | | 278 | | | | 97 | | | | 181 | | | | 490 | | | | 167 | | | | 323 | |
Environmental allowances and credits | | | 986 | | | | 304 | | | | 682 | | | | 992 | | | | 212 | | | | 780 | |
Land easements | | | — | | | | — | | | | — | | | | 188 | | | | 72 | | | | 116 | |
Mining development costs | | | 47 | | | | 17 | | | | 30 | | | | 32 | | | | 5 | | | | 27 | |
| | | | | | | | | | | | | | | | | | | | | | | | |
Total intangible assets subject to amortization | | $ | 2,322 | | | $ | 968 | | | | 1,354 | | | $ | 2,865 | | | $ | 1,045 | | | | 1,820 | |
| | | | | | | | | | | | | | | | | | | | | | | | |
Trade name (not subject to amortization) | | | | | | | | | | | 955 | | | | | | | | | | | | 955 | |
| | | | | | | | | | | | | | | | | | | | | | | | |
Mineral interests (not currently subject to amortization) | | | | | | | | | | | 91 | | | | | | | | | | | | 101 | |
| | | | | | | | | | | | | | | | | | | | | | | | |
Total intangible assets | | | | | | | | | | $ | 2,400 | | | | | | | | | | | $ | 2,876 | |
| | | | | | | | | | | | | | | | | | | | | | | | |
| (a) | See Notes 1 and 3 for discussion of the deconsolidation of Oncor Holdings effective January 1, 2010. |
132
Amortization expense related to intangible assets (including income statement line item) consisted of:
| | | | | | | | | | | | | | | | | | | | |
| | | | | | | Useful lives as
of December 31,
2010 (weighted
average in | | | Year Ended December 31, | |
Identifiable Intangible Asset | | Income Statement Line | | Segment | | years) | | | 2010 | | | 2009 | | | 2008 | |
Retail customer relationship | | Depreciation and amortization | | Competitive Electric | | | 7 | | | $ | 78 | | | $ | 85 | | | $ | 51 | |
Favorable purchase and sales contracts | | Operating revenues/fuel, purchased power costs and delivery fees | | Competitive Electric | | | 12 | | | | 35 | | | | 125 | | | | 168 | |
Capitalized in-service software | | Depreciation and amortization | | All (a) | | | 5 | | | | 35 | | | | 53 | | | | 44 | |
Environmental allowances and credits | | Fuel, purchased power costs and delivery fees | | Competitive Electric | | | 27 | | | | 92 | | | | 91 | | | | 102 | |
Land easements | | Depreciation and amortization | | Regulated Delivery (a) | | | N/A | | | | — | | | | 3 | | | | 3 | |
Mining development costs | | Depreciation and amortization | | Competitive Electric | | | 3 | | | | 11 | | | | 3 | | | | 1 | |
| | | | | | | | | | | | �� | | | | | | | | |
Total amortization expense | | | | | | | | | | $ | 251 | | | $ | 360 | | | $ | 369 | |
| | | | | | | | | | | | | | | | | | | | |
| (a) | See Notes 1 and 3 for discussion of the deconsolidation of Oncor Holdings effective January 1, 2010. |
Separately identifiable and previously unrecognized intangible assets acquired and recorded as part of purchase accounting for the Merger are described as follows:
| | • | | Retail Customer Relationship – Retail customer relationship intangible asset represents the estimated fair value of the non-contracted customer base and is being amortized using an accelerated method based on customer attrition rates and reflecting the expected pattern in which economic benefits are realized over their estimated useful life. |
| | • | | Favorable Purchase and Sales Contracts – Favorable purchase and sales contracts intangible asset primarily represents the above market value, based on observable prices or estimates, of commodity contracts for which: (i) we have made the “normal” purchase or sale election allowed by accounting standards related to derivative instruments and hedging transactions or (ii) the contracts did not meet the definition of a derivative. The amortization periods of these intangible assets are based on the terms of the contracts. Unfavorable purchase and sales contracts are recorded as other noncurrent liabilities and deferred credits (see Note 24). |
| | • | | Trade name – The trade name intangible asset represents the estimated fair value of the TXU Energy trade name, and was determined to be an indefinite-lived asset not subject to amortization. This intangible asset is evaluated for impairment at least annually in accordance with accounting guidance related to goodwill and other intangible assets. See above for discussion of an impairment charge recorded in 2008. |
| | • | | Environmental Allowances and Credits –This intangible asset represents the fair value, based on observable prices or estimates, of environmental credits, substantially all of which were expected to be used in our power generation activities. These credits are amortized utilizing a units-of-production method. |
133
Impairment of Environmental Allowances and Credits Intangible Assets
In March 2005, the EPA issued regulations called the Clean Air Interstate Rule (CAIR) for 28 states, including Texas, where our generation facilities are located. CAIR requires reductions of SO2 and NOx emissions from power generation facilities in these states. The SO2 reductions were beyond the reductions required under the Clean Air Act’s existing acid rain cap-and-trade program (the Acid Rain Program). CAIR also established a new regional cap-and-trade program for NOx emissions reductions.
In July 2008, the US Court of Appeals for the D.C. Circuit (the D.C. Circuit Court) invalidated CAIR. The D.C. Circuit Court did not overturn the existing cap-and-trade program for SO2 reductions under the Acid Rain Program.
Based on the D.C. Circuit Court’s ruling, we recorded a noncash impairment charge to earnings in 2008. We impaired NOx allowances in the amount of $401 million (before deferred income tax benefit). As a result of the D.C. Circuit Court’s decision, NOx allowances would no longer be needed, and thus there would not be an actively traded market for such allowances. Consequently, our NOx allowances would likely have very little value absent reversal of the D.C. Circuit Court’s decision or promulgation of new rules by the EPA. In addition, we impaired SO2 allowances in the amount of $100 million (before deferred income tax benefit). While the D.C. Circuit Court did not invalidate the Acid Rain Program, we would have more SO2 allowances than we would need to comply with the Acid Rain Program. While there continued to be a market for SO2 allowances, the D.C. Circuit Court’s decision resulted in a material decrease in the market price of SO2 allowances.
The impairment amounts recorded in 2008 were reported in other deductions and reflected in the results of the Competitive Electric segment.
In December 2008, in response to an EPA petition, the D.C. Circuit Court reversed, in part, its previous ruling. Such reversal confirmed CAIR is not valid, but allowed it to remain in place while the EPA revises CAIR to correct the previously identified shortcomings. In July 2010, the EPA released a proposed rule called the Clean Air Transport Rule (CATR). The CATR, as proposed, would replace CAIR in 2012. We cannot predict the impact of a final rule on our business, results of operations and financial condition.
Estimated Amortization of Intangible Assets–The estimated aggregate amortization expense of intangible assets for each of the next five fiscal years is as follows:
| | | | |
Year | | Amortization
Expense | |
2011 | | $ | 198 | |
2012 | | | 154 | |
2013 | | | 132 | |
2014 | | | 116 | |
2015 | | | 98 | |
134
| 5. | IMPAIRMENT OF NATURAL GAS-FUELED GENERATION FACILITIES |
In 2008, we performed an evaluation of our natural gas-fueled generation facilities for impairment. The impairment test was triggered by a determination that it was more likely than not that certain generation units would be retired or mothballed (idled) earlier than previously expected. The natural gas-fueled generation units are generally operated to meet peak demands for electricity and all such facilities are tested for impairment as an asset group. As a result of the evaluation, it was determined that an impairment existed, and a charge of $229 million ($147 million after-tax) was recorded to write down the assets to fair value of approximately $28 million, which was determined based on discounted estimated future cash flows. The impairment was reported in other deductions in the Competitive Electric segment.
| 6. | MERGER-RELATED STIPULATION APPROVED BY THE PUCT |
In 2008, the PUCT issued a final order approving a stipulation to resolve all outstanding issues in the PUCT review related to the Merger. The terms of the stipulation were agreed to by Oncor and Texas Holdings as well as major interested parties, conditioned on completion of the Merger. The order has been appealed with respect to certain elements, none of which are expected to affect the following major provisions of the stipulation:
| | • | | Oncor provided a one-time $72 million refund to its REP customers in the September 2008 billing cycle. The refund was in the form of a credit on distribution fee billings. The liability for the refund was recorded as part of purchase accounting. |
| | • | | Consistent with a rate settlement with certain cities in 2006, Oncor filed a system-wide rate case in June 2008 based on a test-year ended December 31, 2007. In August 2009, the PUCT issued a final order on this rate case. See Note 24. |
| | • | | Oncor agreed not to request recovery of approximately $56 million of regulatory assets related to self-insurance reserve costs and 2002 restructuring expenses. These regulatory assets were eliminated as part of purchase accounting. |
| | • | | The cash distributions paid by Oncor to its members will be limited through December 31, 2012, to an amount not to exceed Oncor’s net income (determined in accordance with US GAAP, subject to certain defined adjustments) for the period beginning October 11, 2007 and ending December 31, 2012, and are further limited by an agreement that Oncor’s regulatory capital structure, as determined by the PUCT, will be at or below the assumed debt-to-equity ratio established periodically by the PUCT for ratemaking purposes, which is currently set at 60% debt to 40% equity (see Note 13). |
| | • | | Oncor committed to minimum capital spending of $3.6 billion over the five-year period ending December 31, 2012, subject to certain defined conditions. |
| | • | | Oncor committed to an additional $100 million in spending over the five-year period ending December 31, 2012 on demand-side management or other energy efficiency initiatives. These additional expenditures will not be recoverable in rates, and this amount was recorded as a regulatory liability as part of purchase accounting and consistent with accounting standards related to the effect of certain types of regulation. |
| | • | | If Oncor’s credit rating is below investment grade with two or more rating agencies, TCEH will post a letter of credit in an amount of $170 million to secure TXU Energy’s payment obligations to Oncor. |
| | • | | Oncor agreed not to request recovery of the $4.9 billion of goodwill resulting from purchase accounting or any future impairment of the goodwill in its rates. |
135
| 7. | ACCOUNTING FOR UNCERTAINTY IN INCOME TAXES |
Accounting guidance related to uncertain tax positions requires that all tax positions subject to uncertainty be reviewed and assessed with recognition and measurement of the tax benefit based on a “more-likely-than-not” standard with respect to the ultimate outcome, regardless of whether this assessment is favorable or unfavorable.
We file income tax returns in US federal, state and foreign jurisdictions and are subject to examinations by the IRS and other taxing authorities. Examinations of our income tax returns for the years ending prior to January 1, 2003 are complete, but the tax years 1997 to 2002 remain in appeals with the IRS. An IRS audit of tax years 2003 to 2006 is in progress and is expected to be completed in 2011. Texas franchise and margin tax returns are under examination or still open for examination for tax years beginning after 2002.
In 2008, we participated in negotiations with the IRS regarding the 2002 worthlessness loss associated with our discontinued Europe business, and we reduced the liability for uncertain tax positions in accordance with accounting guidance. The reduction in the liability of approximately $375 million was largely offset by a reduction of deferred tax assets related to alternative minimum tax.
In 2010, we again engaged in negotiations with the IRS regarding this worthlessness loss as well as other matters. Accordingly, we have adjusted the liability for uncertain tax positions to reflect the most likely settlement of the issues. The adjustment resulted in a net reduction of the liability for uncertain tax positions totaling $162 million. This reduction consisted of a $225 million reversal of accrued interest ($146 million after tax), reported as a reduction of income tax expense, principally related to the discontinued Europe business, partially offset by $63 million in adjustments related to several other positions that have been accounted for as reclassifications to net deferred tax liabilities. The conclusion of all issues contested from the 1997 through 2002 audit, including IRS Joint Committee review, is expected to occur before the end of 2012. Upon such conclusion, we expect to further reduce the liability for uncertain tax positions by approximately $700 million with an offsetting decrease in deferred tax assets that arose largely from previous payments of alternative minimum taxes. No cash income tax liability is expected related to the conclusion of the 1997 through 2002 audit.
We classify interest and penalties related to uncertain tax positions as current income tax expense. Amounts recorded related to interest and penalties totaled a benefit of $115 million in 2010, and expenses of $42 million in 2009 and $88 million in 2008, including $29 million recorded as goodwill (all amounts after tax).
Noncurrent liabilities included a total of $164 million and $361 million in accrued interest as of December 31, 2010 and 2009, respectively. Oncor Holdings, which had $20 million in noncurrent liabilities related to accrued interest, was deconsolidated as of January 1, 2010 as discussed in Note 2. The federal income tax benefit on the interest accrued on uncertain tax positions is recorded as accumulated deferred income taxes.
The following table summarizes the changes to the uncertain tax positions, reported in other noncurrent liabilities in the consolidated balance sheet, during the years ended December 31, 2010, 2009 and 2008:
| | | | | | | | | | | | |
| | | 2010 | | | 2009 | | | 2008 | |
Balance as of January 1, excluding interest and penalties (a) | | $ | 1,566 | | | $ | 1,583 | | | $ | 1,834 | |
Additions based on tax positions related to prior years | | | 312 | | | | 71 | | | | 124 | |
Reductions based on tax positions related to prior years | | | (308 | ) | | | (82 | ) | | | (451 | ) |
Additions based on tax positions related to the current year | | | 72 | | | | 66 | | | | 33 | |
Settlements with taxing authorities | | | — | | | | — | | | | 43 | |
| | | | | | | | | | | | |
Balance as of December 31, excluding interest and penalties | | $ | 1,642 | | | $ | 1,638 | | | $ | 1,583 | |
| | | | | | | | | | | | |
| (a) | 2010 reflects the deconsolidation of Oncor Holdings, which had a balance of $72 million, as of January 1, 2010. |
Of the balance as of December 31, 2010, $1.442 billion represents tax positions for which the uncertainty relates to the timing of recognition in tax returns. The disallowance of such positions would not affect the effective tax rate, but could accelerate the payment of cash to the taxing authority to an earlier period.
136
With respect to tax positions for which the ultimate deductibility is uncertain (permanent items), should we sustain such positions on income tax returns previously filed, tax liabilities recorded would be reduced by $200 million, and accrued interest would be reversed resulting in a $28 million after-tax benefit, resulting in increased net income and a favorable impact on the effective tax rate.
Other than the items discussed above, we do not expect the total amount of liabilities recorded related to uncertain tax positions will significantly increase or decrease within the next 12 months.
The components of our income tax expense (benefit) applicable to continuing operations are as follows:
| | | | | | | | | | | | |
| | | Year Ended December 31, | |
| | | 2010 | | | 2009 | | | 2008 | |
Current: | | | | | | | | | | | | |
US Federal | | $ | (256 | ) | | $ | 64 | | | $ | (46 | ) |
State | | | 41 | | | | 51 | | | | 52 | |
| | | | | | | | | | | | |
Total | | | (215 | ) | | | 115 | | | | 6 | |
| | | | | | | | | | | | |
Deferred: | | | | | | | | | | | | |
US Federal | | | 590 | | | | 256 | | | | (482 | ) |
State | | | 14 | | | | 1 | | | | 10 | |
| | | | | | | | | | | | |
Total | | | 604 | | | | 257 | | | | (472 | ) |
| | | | | | | | | | | | |
Amortization of investment tax credits | | | — | | | | (5 | ) | | | (5 | ) |
| | | | | | | | | | | | |
Total | | $ | 389 | | | $ | 367 | | | $ | (471 | ) |
| | | | | | | | | | | | |
Reconciliation of income taxes computed at the US federal statutory rate to income tax expense:
| | | | | | | | | | | | |
| | | Year Ended December 31, | |
| | | 2010 | | | 2009 | | | 2008 | |
Income (loss) before income taxes | | $ | (2,700 | ) | | $ | 775 | | | $ | (10,469 | ) |
| | | | | | | | | | | | |
| | | |
Income taxes at the US federal statutory rate of 35% | | $ | (945 | ) | | $ | 271 | | | $ | (3,664 | ) |
| | | |
Nondeductible goodwill impairment | | | 1,435 | | | | 32 | | | | 3,101 | |
Lignite depletion allowance | | | (21 | ) | | | (18 | ) | | | (29 | ) |
Amortization of investment tax credits, net of tax | | | — | | | | (5 | ) | | | (5 | ) |
Amortization (under regulatory accounting) of statutory rate changes | | | — | | | | 5 | | | | 2 | |
Medicare subsidy — retiree benefits | | | — | | | | (7 | ) | | | (6 | ) |
Nondeductible interest expense | | | 11 | | | | 13 | | | | 11 | |
Nondeductible losses (earnings) on benefit plans | | | — | | | | (1 | ) | | | 9 | |
Texas margin tax, net of federal benefit | | | 34 | | | | 30 | | | | 39 | |
Interest accrued for uncertain tax positions, net of tax | | | (115 | ) | | | 42 | | | | 59 | |
Deferred tax charge for effect of health care legislation | | | 8 | | | | — | | | | — | |
Reversal of previously disallowed interest resulting from debt exchanges | | | (21 | ) | | | — | | | | — | |
Other, including audit settlements | | | 3 | | | | 5 | | | | 12 | |
| | | | | | | | | | | | |
Income tax expense (benefit) | | $ | 389 | | | $ | 367 | | | $ | (471 | ) |
| | | | | | | | | | | | |
| | | |
Effective tax rate | | | (14.4 | )% | | | 47.4 | % | | | 4.5 | % |
137
Deferred Income Tax Balances
Deferred income taxes provided for temporary differences based on tax laws in effect as of December 31, 2010 and 2009 balance sheet dates are as follows:
| | | | | | | | | | | | | | | | | | | | | | | | |
| | | December 31, | |
| | | 2010 (a) | | | 2009 | |
| | | Total | | | Current | | | Noncurrent | | | Total | | | Current | | | Noncurrent | |
Deferred Income Tax Assets | | | | | | | | | | | | | | | | | | | | | | | | |
Alternative minimum tax credit carryforwards | | $ | 406 | | | $ | — | | | $ | 406 | | | $ | 438 | | | $ | — | | | $ | 438 | |
Employee benefit liabilities | | | 216 | | | | 25 | | | | 191 | | | | 206 | | | | 22 | | | | 184 | |
Net operating loss (NOL) carryforwards | | | 833 | | | | — | | | | 833 | | | | 422 | | | | — | | | | 422 | |
Unfavorable purchase and sales contracts | | | 240 | | | | — | | | | 240 | | | | 249 | | | | — | | | | 249 | |
Accrued interest | | | 157 | | | | — | | | | 157 | | | | 211 | | | | — | | | | 211 | |
Other | | | 317 | | | | 2 | | | | 315 | | | | 351 | | | | 13 | | | | 338 | |
| | | | | | | | | | | | | | | | | | | | | | | | |
Total | | | 2,169 | | | | 27 | | | | 2,142 | | | | 1,877 | | | | 35 | | | | 1,842 | |
| | | | | | | | | | | | | | | | | | | | | | | | |
| | | | | | |
Deferred Income Tax Liabilities | | | | | | | | | | | | | | | | | | | | | | | | |
Property, plant and equipment | | | 4,321 | | | | — | | | | 4,321 | | | | 4,141 | | | | — | | | | 4,141 | |
Basis difference in Oncor partnership | | | — | | | | — | | | | — | | | | 1,369 | | | | — | | | | 1,369 | |
Commodity contracts and interest rate swaps | | | 1,692 | | | | 31 | | | | 1,661 | | | | 1,325 | | | | 30 | | | | 1,295 | |
Identifiable intangible assets | | | 846 | | | | — | | | | 846 | | | | 921 | | | | — | | | | 921 | |
Debt fair value discounts | | | 126 | | | | — | | | | 126 | | | | 184 | | | | — | | | | 184 | |
Debt extinguishment gains | | | 503 | | | | — | | | | 503 | | | | 35 | | | | — | | | | 35 | |
Other | | | 42 | | | | 7 | | | | 35 | | | | 28 | | | | — | | | | 28 | |
| | | | | | | | | | | | | | | | | | | | | | | | |
Total | | | 7,530 | | | | 38 | | | | 7,492 | | | | 8,003 | | | | 30 | | | | 7,973 | |
| | | | | | | | | | | | | | | | | | | | | | | | |
Net Deferred Income Tax (Asset) Liability | | $ | 5,361 | | | $ | 11 | | | $ | 5,350 | | | $ | 6,126 | | | $ | (5 | ) | | $ | 6,131 | |
| | | | | | | | | | | | | | | | | | | | | | | | |
| (a) | See Notes 1 and 3 for discussion of the deconsolidation of Oncor Holdings effective January 1, 2010. |
As of December 31, 2010 we had $406 million of alternative minimum tax credit carryforwards (AMT) available to offset future tax payments. The AMT credit carryforwards have no expiration date. As of December 31, 2010, we had net operating loss (NOL) carryforwards for federal income tax purposes of $2.4 billion that expire between 2028 and 2031. The NOL carryforwards can be used to offset future taxable income. We expect to utilize all of our NOL carryforwards prior to their expiration dates.
The component of deferred income tax liabilities referred to as “basis difference in Oncor partnership” arose as a result of the sale of noncontrolling interests in Oncor (see Note 14) at which time Oncor became a partnership for US federal income tax purposes. The amount of this basis difference at the date of the transaction represented our interest (approximately 80%) in the net deferred tax liabilities related to Oncor’s individual operating assets and liabilities. The remaining net deferred tax liabilities associated with Oncor ($321 million as of December 31, 2009) that were attributable to the noncontrolling interests were reclassified as other noncurrent liabilities and deconsolidated with Oncor Holdings in 2010 as discussed in Notes 1 and 3 (see Note 24).
The income tax effects of the components included in accumulated other comprehensive income as of December 31, 2010 and 2009 totaled a net deferred tax asset of $141 million and $165 million, respectively.
See Note 7 for discussion regarding accounting for uncertain tax positions.
138
Effect of Health Care Legislation — The Patient Protection and Affordable Care Act and the Health Care and Education Reconciliation Act enacted in March 2010 reduces, effective in 2013, the amount of OPEB costs deductible for federal income tax purposes by the amount of the Medicare Part D subsidy we receive. Under income tax accounting rules, deferred tax assets related to accrued OPEB liabilities must be reduced immediately for the future effect of the legislation. Accordingly, in the first quarter 2010, EFH Corp.’s and Oncor’s deferred tax assets were reduced by $50 million. Of this amount, $8 million was recorded as a charge to income tax expense and $42 million was recorded in receivables from unconsolidated subsidiary, reflecting a regulatory asset recorded by Oncor (before gross-up for liability in lieu of deferred income taxes) as the additional income taxes are expected to be recoverable in Oncor’s future rates.
139
| 9. | OTHER INCOME AND DEDUCTIONS |
| | | | | | | | | | | | |
| | | Year Ended December 31, | |
| | | 2010 | | | 2009 | | | 2008 | |
Other income: | | | | | | | | | | | | |
Debt extinguishment gains (Note 11) (a) | | $ | 1,814 | | | $ | 87 | | | $ | — | |
Gain on termination of long-term power sales contract (b) (c) | | | 116 | | | | — | | | | — | |
Gain on sale of land/water rights (c) | | | 44 | | | | — | | | | — | |
Gain on sale of interest in natural gas gathering pipeline business (c) | | | 37 | | | | — | | | | — | |
Office space rental income (a) | | | 12 | | | | — | | | | — | |
Insurance/litigation settlements (c) (d) | | | 6 | | | | — | | | | 21 | |
Sales tax refund | | | 5 | | | | 5 | | | | — | |
Mineral rights royalty income (c) | | | 1 | | | | 6 | | | | 4 | |
Reversal of reserves recorded in purchase accounting (e) | | | — | | | | 44 | | | | — | |
Accretion of adjustment (discount) of regulatory assets resulting from purchase accounting (Note 24) (f) | | | — | | | | 39 | | | | 44 | |
Fee received related to interest rate swap/commodity hedge derivative agreement (Note 17) (c) | | | — | | | | 6 | | | | — | |
Other | | | 16 | | | | 17 | | | | 11 | |
| | | | | | | | | | | | |
Total other income | | $ | 2,051 | | | $ | 204 | | | $ | 80 | |
| | | | | | | | | | | | |
Other deductions: | | | | | | | | | | | | |
Impairment of trade name intangible asset (Note 4) (c) | | $ | — | | | $ | — | | | $ | 481 | |
Impairment of emission allowances intangible assets (Note 4) (c) | | | — | | | | — | | | | 501 | |
Charge for impairment of natural gas-fueled generation facilities (Note 5) (c) | | | — | | | | — | | | | 229 | |
Impairment of land (c) | | | — | | | | 34 | | | | — | |
Charge related to Lehman bankruptcy (g) | | | — | | | | — | | | | 26 | |
Write-off of regulatory assets (Note 24) (f) | | | — | | | | 25 | | | | — | |
Ongoing pension and OPEB expense related to discontinued businesses (a) | | | 7 | | | | — | | | | — | |
Professional fees incurred related to the Merger (h) | | | 5 | | | | — | | | | 14 | |
Net charges related to cancelled development of generation facilities (c) | | | 3 | | | | 6 | | | | 12 | |
Severance charges | | | 3 | | | | 7 | | | | — | |
Costs related to 2006 cities rate settlement (f) | | | — | | | | 2 | | | | 13 | |
Litigation/regulatory settlements | | | — | | | | 3 | | | | 10 | |
Other | | | 13 | | | | 20 | | | | 15 | |
| | | | | | | | | | | | |
Total other deductions | | $ | 31 | | | $ | 97 | | | $ | 1,301 | |
| | | | | | | | | | | | |
| (a) | Reported in Corporate and Other segment, except for $687 million of debt extinguishment gain reported in Competitive Electric segment. |
| (b) | In November 2010, the counterparty to a long-term power sales agreement terminated the contract, which had a remaining term of 27 years. The contract was a derivative and subject to mark-to-market accounting. The termination resulted in a noncash gain of $116 million, which represented the derivative liability as of the termination date. |
| (c) | Reported in Competitive Electric segment. |
| (d) | 2008 amount represents insurance recovery for damage to mining equipment. |
| (e) | Includes $23 million for reversal of a use tax accrual, related to periods prior to the Merger, due to a state ruling in 2009 (reported in Competitive Electric segment) and $21 million for reversal of excess exit liabilities recorded in connection with the termination of outsourcing arrangements (see Note 19) (reported in Competitive Electric ($11 million) and Regulated Delivery segments ($10 million)). |
| (f) | Reported in Regulated Delivery segment. |
| (g) | Represents reserve established against amounts due (excluding termination related costs) from subsidiaries of Lehman Brothers Holdings Inc. (Lehman) arising from commodity hedging and trading activities. Reported in Competitive Electric segment. |
| (h) | Includes post-Merger consulting expenses related to optimizing business performance. Reported in Corporate and Other activities. |
140
| 10. | TRADE ACCOUNTS RECEIVABLE AND ACCOUNTS RECEIVABLE SECURITIZATION PROGRAM |
TXU Energy participates in EFH Corp.’s accounts receivable securitization program with financial institutions (the funding entities). Under the program, TXU Energy (originator) sells trade accounts receivable to TXU Receivables Company, which is an entity created for the special purpose of purchasing receivables from the originator and is a consolidated, wholly-owned, bankruptcy-remote, direct subsidiary of EFH Corp. TXU Receivables Company sells undivided interests in the purchased accounts receivable for cash to entities established for this purpose by the funding entities. In accordance with the amended transfers and servicing accounting standard as discussed in Note 1, the trade accounts receivable amounts under the program are reported as pledged balances, and the related funding amounts are reported as short-term borrowings. Prior to the January 1, 2010 effective date of the new accounting standard, the activity was accounted for as a sale of accounts receivable in accordance with previous accounting standards, which resulted in the funding being recorded as a reduction of accounts receivable.
In June 2010, the accounts receivable securitization program was amended. The amendments, among other things, reduced the maximum funding amount under the program to $350 million from $700 million. Program funding declined from $383 million as of December 31, 2009 to $96 million as of December 31, 2010. Under the terms of the program, available funding was reduced by $38 million of customer deposits held by the originator because TCEH’s credit ratings were lower than Ba3/BB-. The declines in actual and maximum funding amounts reflected exclusion of receivables under contractual sales agreements.
All new trade receivables under the program generated by the originator are continuously purchased by TXU Receivables Company with the proceeds from collections of receivables previously purchased. Ongoing changes in the amount of funding under the program, through changes in the amount of undivided interests sold by TXU Receivables Company, reflect seasonal variations in the level of accounts receivable, changes in collection trends and other factors such as changes in sales prices and volumes. TXU Receivables Company has issued a subordinated note payable to the originator for the difference between the face amount of the uncollected accounts receivable purchased, less a discount, and cash paid to the originator that was funded by the sale of the undivided interests. The subordinated note issued by TXU Receivables Company is subordinated to the undivided interests of the funding entities in the purchased receivables. The balance of the subordinated note payable, which is eliminated in consolidation, totaled $516 million and $463 million as of December 31, 2010 and 2009, respectively.
The discount from face amount on the purchase of receivables from the originator principally funds program fees paid to the funding entities. The program fees consist primarily of interest costs on the underlying financing. Consistent with the change in balance sheet presentation of the funding discussed above, the program fees are currently reported as interest expense and related charges but were previously reported as losses on sale of receivables reported in SG&A expense. The discount also funds a servicing fee, which is reported as SG&A expense, paid by TXU Receivables Company to EFH Corporate Services Company (Service Co.), a direct wholly-owned subsidiary of EFH Corp., which provides recordkeeping services and is the collection agent for the program.
Program fee amounts were as follows:
| | | | | | | | | | | | |
| | | Year Ended December 31, | |
| | | 2010 | | | 2009 | | | 2008 | |
Program fees | | $ | 10 | | | $ | 12 | | | $ | 25 | |
Program fees as a percentage of average funding (annualized) | | | 3.8 | % | | | 2.4 | % | | | 5.2 | % |
141
Activities of TXU Receivables Company were as follows:
| | | | | | | | | | | | |
| | | Year Ended December 31, | |
| | | 2010 | | | 2009 | | | 2008 | |
Cash collections on accounts receivable | | $ | 6,334 | | | $ | 6,125 | | | $ | 6,393 | |
Face amount of new receivables purchased | | | (6,100 | ) | | | (6,287 | ) | | | (6,418 | ) |
Discount from face amount of purchased receivables | | | 12 | | | | 14 | | | | 29 | |
Program fees paid to funding entities | | | (10 | ) | | | (12 | ) | | | (25 | ) |
Servicing fees paid to Service Co. for recordkeeping and collection services | | | (2 | ) | | | (2 | ) | | | (4 | ) |
Increase (decrease) in subordinated notes payable | | | 53 | | | | 195 | | | | (28 | ) |
| | | | | | | | | | | | |
Financing/operating cash flows used by (provided to) originator under the program | | $ | 287 | | | $ | 33 | | | $ | (53 | ) |
| | | | | | | | | | | | |
Changes in funding under the program have previously been reported as operating cash flows, and the amended accounting rule requires that the amount of funding under the program as of the January 1, 2010 adoption ($383 million) be reported as a use of operating cash flows and a source of financing cash flows. All changes in funding subsequent to adoption of the amended standard are reported as financing activities.
The program, which expires in October 2013, may be terminated upon the occurrence of a number of specified events, including if the delinquency ratio (delinquent for 31 days) for the sold receivables, the default ratio (delinquent for 91 days or deemed uncollectible), the dilution ratio (reductions for discounts, disputes and other allowances) or the days collection outstanding ratio exceed stated thresholds, and the funding entities do not waive such event of termination. The thresholds apply to the entire portfolio of sold receivables. In addition, the program may be terminated if TXU Receivables Company or Service Co. defaults in any payment with respect to debt in excess of $50,000 in the aggregate for such entities, or if TCEH, any affiliate of TCEH acting as collection agent other than Service Co., any parent guarantor of the originator or the originator shall default in any payment with respect to debt (other than hedging obligations) in excess of $200 million in the aggregate for such entities. As of December 31, 2010, there were no such events of termination.
Upon termination of the program, liquidity would be reduced as collections of sold receivables would be used by TXU Receivables Company to repurchase the undivided interests from the funding entities instead of purchasing new receivables. The level of cash flows would normalize in approximately 16 to 30 days.
Trade Accounts Receivable
| | | | | | | | |
| | | December 31, | |
| | | 2010 (a) | | | 2009 | |
Wholesale and retail trade accounts receivable, including $612 in pledged retail receivables as of December 31, 2010 | | $ | 1,063 | | | $ | 1,726 | |
Undivided interests in retail accounts receivable sold by TXU Receivables Company | | | — | | | | (383 | ) |
Allowance for uncollectible accounts | | | (64 | ) | | | (83 | ) |
| | | | | | | | |
Trade accounts receivable — reported in balance sheet | | $ | 999 | | | $ | 1,260 | |
| | | | | | | | |
| | (a) | See Notes 1 and 3 for discussion of the deconsolidation of Oncor Holdings effective January 1, 2010. |
Gross trade accounts receivable as of December 31, 2010 and 2009 included unbilled revenues of $297 million and $546 million, respectively.
142
Allowance for Uncollectible Accounts Receivable
| | | | | | | | | | | | |
| | | Year Ended December 31, | |
| | | 2010 | | | 2009 | | | 2008 | |
Allowance for uncollectible accounts receivable as of beginning of period | | $ | 81 | | | $ | 70 | | | $ | 32 | |
Increase for bad debt expense | | | 108 | | | | 113 | | | | 81 | |
Decrease for account write-offs | | | (125 | ) | | | (99 | ) | | | (69 | ) |
Charge related to Lehman bankruptcy | | | — | | | | — | | | | 26 | |
Other | | | — | | | | (1 | ) | | | — | |
| | | | | | | | | | | | |
Allowance for uncollectible accounts receivable as of end of period | | $ | 64 | | | $ | 83 | | | $ | 70 | |
| | | | | | | | | | | | |
Receivables from Unconsolidated Subsidiary
Receivables from unconsolidated subsidiary are measured at historical cost and primarily consist of Oncor’s obligation under the EFH Corp. pension and OPEB plans. EFH Corp. reviews Oncor’s credit scores to assess the overall collectability of its affiliated receivables, which totaled $1.463 billion as of December 31, 2010. There were no credit loss allowances as of December 31, 2010. See Note 22 for additional information about related party transactions.
143
| 11. | SHORT-TERM BORROWINGS AND LONG-TERM DEBT |
Short-Term Borrowings
As of December 31, 2010, outstanding short-term borrowings totaled $1.221 billion, which included $1.125 billion under TCEH credit facilities at a weighted average interest rate of 3.80%, excluding certain customary fees, and $96 million under the accounts receivable securitization program discussed in Note 10.
As of December 31, 2009, we had outstanding short-term borrowings of $1.569 billion at a weighted average interest rate of 2.50%, excluding certain customary fees, at the end of the period. Short-term borrowings under credit facilities totaled $953 million for TCEH and $616 million for Oncor.
Credit Facilities
Credit facilities with cash borrowing and/or letter of credit availability as of December 31, 2010 are presented below. The facilities are all senior secured facilities of TCEH.
| | | | | | | | | | | | | | | | | | | | |
| | | | | | As of December 31, 2010 | |
Authorized Borrowers and Facility | | Maturity
Date | | | Facility
Limit | | | Letters of
Credit | | | Cash
Borrowings | | | Availability | |
TCEH Revolving Credit Facility (a) | | | October 2013 | | | $ | 2,700 | | | $ | — | | | $ | 1,125 | | | $ | 1,440 | |
TCEH Letter of Credit Facility (b) | | | October 2014 | | | | 1,250 | | | | — | | | | 1,250 | | | | — | |
| | | | | | | | | | | | | | | | | | | | |
Subtotal TCEH | | | | | | $ | 3,950 | | | $ | — | | | $ | 2,375 | | | $ | 1,440 | |
| | | | | | | | | | | | | | | | | | | | |
TCEH Commodity Collateral Posting Facility (c) | | | December 2012 | | | | Unlimited | | | $ | — | | | $ | — | | | | Unlimited | |
| (a) | Facility used for letters of credit and borrowings for general corporate purposes. Borrowings are classified as short-term borrowings. Availability amount includes $94 million of commitments from Lehman that are only available from the fronting banks and the swingline lender and excludes $135 million of requested cash draws that have not been funded by Lehman. All outstanding borrowings under this facility as of December 31, 2010 bear interest at LIBOR plus 3.5%, and a commitment fee is payable quarterly in arrears at a rate per annum equal to 0.50% of the average daily unused portion of the facility. |
| (b) | Facility used for issuing letters of credit for general corporate purposes, including, but not limited to, providing collateral support under hedging arrangements and other commodity transactions that are not eligible for funding under the TCEH Commodity Collateral Posting Facility. The borrowings under this facility were drawn at the inception of the facility, are classified as long-term debt, and except for $115 million related to a letter of credit drawn in June 2009, have been retained as restricted cash. Letters of credit totaling $874 million issued as of December 31, 2010 are supported by the restricted cash, and the remaining letter of credit availability totals $261 million. |
| (c) | Revolving facility used to fund cash collateral posting requirements for specified volumes of natural gas hedges totaling approximately 330 million MMBtu as of December 31, 2010. As of December 31, 2010, there were no borrowings under this facility. See “TCEH Senior Secured Facilities” below for additional information. |
144
Long-Term Debt
As of December 31, 2010 and December 31, 2009, long-term debt consisted of the following:
| | | | | | | | |
| | | December 31,
2010 | | | December 31,
2009 | |
| TCEH | | | | | | | | |
Pollution Control Revenue Bonds: | | | | | | | | |
Brazos River Authority: | | | | | | | | |
5.400% Fixed Series 1994A due May 1, 2029 | | $ | 39 | | | $ | 39 | |
7.700% Fixed Series 1999A due April 1, 2033 | | | 111 | | | | 111 | |
6.750% Fixed Series 1999B due September 1, 2034, remarketing date April 1, 2013 (a) | | | 16 | | | | 16 | |
7.700% Fixed Series 1999C due March 1, 2032 | | | 50 | | | | 50 | |
8.250% Fixed Series 2001A due October 1, 2030 | | | 71 | | | | 71 | |
5.750% Fixed Series 2001C due May 1, 2036, remarketing date November 1, 2011 (a) | | | 217 | | | | 217 | |
8.250% Fixed Series 2001D-1 due May 1, 2033 | | | 171 | | | | 171 | |
0.320% Floating Series 2001D-2 due May 1, 2033 (b) | | | 97 | | | | 97 | |
0.310% Floating Taxable Series 2001I due December 1, 2036 (c) | | | 62 | | | | 62 | |
0.320% Floating Series 2002A due May 1, 2037 (b) | | | 45 | | | | 45 | |
6.750% Fixed Series 2003A due April 1, 2038, remarketing date April 1, 2013 (a) | | | 44 | | | | 44 | |
6.300% Fixed Series 2003B due July 1, 2032 | | | 39 | | | | 39 | |
6.750% Fixed Series 2003C due October 1, 2038 | | | 52 | | | | 52 | |
5.400% Fixed Series 2003D due October 1, 2029, remarketing date October 1, 2014 (a) | | | 31 | | | | 31 | |
5.000% Fixed Series 2006 due March 1, 2041 | | | 100 | | | | 100 | |
| | |
Sabine River Authority of Texas: | | | | | | | | |
6.450% Fixed Series 2000A due June 1, 2021 | | | 51 | | | | 51 | |
5.500% Fixed Series 2001A due May 1, 2022, remarketing date November 1, 2011 (a) | | | 91 | | | | 91 | |
5.750% Fixed Series 2001B due May 1, 2030, remarketing date November 1, 2011 (a) | | | 107 | | | | 107 | |
5.200% Fixed Series 2001C due May 1, 2028 | | | 70 | | | | 70 | |
5.800% Fixed Series 2003A due July 1, 2022 | | | 12 | | | | 12 | |
6.150% Fixed Series 2003B due August 1, 2022 | | | 45 | | | | 45 | |
| | |
Trinity River Authority of Texas: | | | | | | | | |
6.250% Fixed Series 2000A due May 1, 2028 | | | 14 | | | | 14 | |
| | |
Unamortized fair value discount related to pollution control revenue bonds (d) | | | (132 | ) | | | (147 | ) |
| | |
Senior Secured Facilities: | | | | | | | | |
3.764% TCEH Initial Term Loan Facility maturing October 10, 2014 (e)(f)(g) | | | 15,895 | | | | 16,079 | |
3.764% TCEH Delayed Draw Term Loan Facility maturing October 10, 2014 (e)(f) | | | 4,034 | | | | 4,075 | |
3.761% TCEH Letter of Credit Facility maturing October 10, 2014 (f) | | | 1,250 | | | | 1,250 | |
0.250% TCEH Commodity Collateral Posting Facility maturing December 31, 2012 (h) | | | — | | | | — | |
| | |
Other: | | | | | | | | |
10.25% Fixed Senior Notes due November 1, 2015 (i) | | | 1,873 | | | | 2,944 | |
10.25% Fixed Senior Notes due November 1, 2015, Series B (i) | | | 1,292 | | | | 1,913 | |
10.50 / 11.25% Senior Toggle Notes due November 1, 2016 | | | 1,406 | | | | 1,952 | |
15.00% Senior Secured Second Lien Notes due April 1, 2021 | | | 336 | | | | — | |
15.00% Senior Secured Second Lien Notes due April 1, 2021, Series B | | | 1,235 | | | | — | |
7.000% Fixed Senior Notes due March 15, 2013 | | | 5 | | | | 5 | |
7.460% Fixed Secured Facility Bonds with amortizing payments through January 2015 | | | 42 | | | | 55 | |
Capital lease obligations | | | 76 | | | | 153 | |
Other | | | 3 | | | | — | |
Unamortized fair value discount (d) | | | (2 | ) | | | (4 | ) |
| | | | | | | | |
Total TCEH | | $ | 28,848 | | | $ | 29,810 | |
| | | | | | | | |
145
| | | | | | | | |
| | | December 31,
2010 | | | December 31,
2009 | |
| EFCH | | | | | | | | |
9.580% Fixed Notes due in semiannual installments through December 4, 2019 | | $ | 46 | | | $ | 51 | |
8.254% Fixed Notes due in quarterly installments through December 31, 2021 | | | 46 | | | | 50 | |
1.087% Floating Rate Junior Subordinated Debentures, Series D due January 30, 2037 (f) | | | 1 | | | | 1 | |
8.175% Fixed Junior Subordinated Debentures, Series E due January 30, 2037 | | | 8 | | | | 8 | |
Unamortized fair value discount (d) | | | (10 | ) | | | (11 | ) |
| | | | | | | | |
Total EFCH | | | 91 | | | | 99 | |
| | | | | | | | |
| | |
| EFH Corp. (parent entity) | | | | | | | | |
10.875% Fixed Senior Notes due November 1, 2017 (j) | | | 359 | | | | 1,831 | |
11.25 / 12.00% Senior Toggle Notes due November 1, 2017 (j) | | | 571 | | | | 2,797 | |
9.75% Fixed Senior Secured Notes due October 15, 2019 | | | 115 | | | | 115 | |
10.000% Fixed Senior Secured Notes due January 15, 2020 | | | 1,061 | | | | — | |
5.550% Fixed Senior Notes Series P due November 15, 2014 (k) | | | 434 | | | | 983 | |
6.500% Fixed Senior Notes Series Q due November 15, 2024 (k) | | | 740 | | | | 740 | |
6.550% Fixed Senior Notes Series R due November 15, 2034 (k) | | | 744 | | | | 744 | |
8.820% Building Financing due semiannually through February 11, 2022 (l) | | | 68 | | | | 75 | |
Unamortized fair value premium related to Building Financing (d) | | | 15 | | | | 17 | |
Capital lease obligations | | | 4 | | | | — | |
Unamortized fair value discount (d) | | | (476 | ) | | | (599 | ) |
| | | | | | | | |
Total EFH Corp. | | | 3,635 | | | | 6,703 | |
| | | | | | | | |
| | |
| EFIH | | | | | | | | |
9.75% Fixed Senior Secured Notes due October 15, 2019 | | | 141 | | | | 141 | |
10.000% Fixed Senior Secured Notes due December 1, 2020 | | | 2,180 | | | | — | |
| | | | | | | | |
Total EFIH | | | 2,321 | | | | 141 | |
| | | | | | | | |
| | |
| Oncor (m) (n) | | | | | | | | |
6.375% Fixed Senior Notes due May 1, 2012 | | | — | | | | 700 | |
5.950% Fixed Senior Notes due September 1, 2013 | | | — | | | | 650 | |
6.375% Fixed Senior Notes due January 15, 2015 | | | — | | | | 500 | |
6.800% Fixed Senior Notes due September 1, 2018 | | | — | | | | 550 | |
7.000% Fixed Debentures due September 1, 2022 | | | — | | | | 800 | |
7.000% Fixed Senior Notes due May 1, 2032 | | | — | | | | 500 | |
7.250% Fixed Senior Notes due January 15, 2033 | | | — | | | | 350 | |
7.500% Fixed Senior Notes due September 1, 2038 | | | — | | | | 300 | |
Unamortized discount | | | — | | | | (15 | ) |
| | | | | | | | |
Total Oncor | | | — | | | | 4,335 | |
| | |
Oncor Electric Delivery Transition Bond Company LLC (n) (o) | | | | | | | | |
4.030% Fixed Series 2003 Bonds due in semiannual installments through February 15, 2010 | | | — | | | | 13 | |
4.950% Fixed Series 2003 Bonds due in semiannual installments through February 15, 2013 | | | — | | | | 130 | |
5.420% Fixed Series 2003 Bonds due in semiannual installments through August 15, 2015 | | | — | | | | 145 | |
4.810% Fixed Series 2004 Bonds due in semiannual installments through November 15, 2012 | | | — | | | | 197 | |
5.290% Fixed Series 2004 Bonds due in semiannual installments through May 15, 2016 | | | — | | | | 290 | |
| | | | | | | | |
Total Oncor Electric Delivery Transition Bond Company LLC | | | — | | | | 775 | |
Unamortized fair value discount related to transition bonds (d) | | | — | | | | (6 | ) |
| | | | | | | | |
Total Oncor consolidated | | | — | | | | 5,104 | |
| | | | | | | | |
| | |
Total EFH Corp. consolidated | | | 34,895 | | | | 41,857 | |
Less amount due currently | | | (669 | ) | | | (417 | ) |
| | | | | | | | |
Total long-term debt | | $ | 34,226 | | | $ | 41,440 | |
| | | | | | | | |
| (a) | These series are in the multiannual interest rate mode and are subject to mandatory tender prior to maturity on the mandatory remarketing date. On such date, the interest rate and interest rate period will be reset for the bonds. |
| (b) | Interest rates in effect as of December 31, 2010. These series are in a daily interest rate mode and are classified as long-term as they are supported by long-term irrevocable letters of credit. |
| (c) | Interest rate in effect as of December 31, 2010. This series is in a weekly interest rate mode and is classified as long-term as it is supported by long-term irrevocable letters of credit. |
| (d) | Amount represents unamortized fair value adjustments recorded under purchase accounting. |
| (e) | Interest rate swapped to fixed on $15.80 billion principal amount. |
| (f) | Interest rates in effect as of December 31, 2010. |
146
| (g) | 2010 amount excludes $20 million that is held by EFH Corp. and eliminated in consolidation. |
| (h) | Interest rate in effect as of December 31, 2010, excluding a quarterly maintenance fee of $11 million. See “Credit Facilities” above for more information. |
| (i) | 2010 amounts exclude $173 million and $150 million of the TCEH Senior Notes and TCEH Senior Notes, Series B, respectively, that are held either by EFH Corp. or EFIH and eliminated in consolidation. |
| (j) | 2010 amounts exclude $1.428 billion and $2.296 billion of EFH Corp. 10.875% Notes and EFH Corp. Toggle Notes, respectively, that are held by EFIH and eliminated in consolidation. |
| (k) | Amounts exclude $9 million, $6 million and $3 million of the Series P, Series Q and Series R notes, respectively, that are held by EFIH and eliminated in consolidation. |
| (l) | This financing is secured and will be serviced with cash drawn by the beneficiary of a letter of credit. |
| (m) | Secured with first priority lien. |
| (n) | See Notes 1 and 3 for discussion of the deconsolidation of Oncor Holdings effective as of January 1, 2010. |
| (o) | These bonds are nonrecourse to Oncor and were issued to securitize a regulatory asset. |
Debt-Related Activity in 2010— Repayments of long-term debt in 2010 totaling $309 million included $205 million of principal payments at scheduled maturity dates as well as other repayments totaling $104 million principally related to capitalized leases. See “2010 Debt Exchanges, Repurchases and Issuances” below for discussion of $6.904 billion principal amount of debt acquired in debt exchanges and repurchases completed in the year ended December 31, 2010.
During 2010, EFH Corp. issued, through the payment-in-kind (PIK) election, $194 million principal amount of its 11.25%/12.00% Senior Toggle Notes due November 2017 (EFH Corp. Toggle Notes), and TCEH issued, through the PIK election, $205 million principal amount of its 10.50%/11.25% Senior Toggle Notes due November 2016 (TCEH Toggle Notes), in each case, in lieu of making cash interest payments.
2010 Debt Exchanges, Repurchases and Issuances — Debt exchanges and repurchases completed in 2010 resulted in acquisitions of $6.904 billion aggregate principal amount of outstanding EFH Corp. and TCEH debt with due dates largely 2017 or earlier in exchange for $3.962 billion aggregate principal amount of new debt and $1.042 billion in cash. The new debt issued in exchange transactions consisted of $2.180 billion aggregate principal amount of EFIH 10% Notes due 2020, $561 million aggregate principal amount of EFH Corp. 10% Notes due 2020, $336 million aggregate principal amount of TCEH 15% Senior Secured Second Lien Notes due 2021 and $885 million aggregate principal amount of TCEH 15% Senior Secured Second Lien Notes due 2021 (Series B). EFH Corp. also issued $500 million principal amount of EFH Corp. 10% Notes due 2020 for cash, and TCEH issued $350 million principal amount of TCEH 15% Senior Secured Second Lien Notes (Series B) due 2021 for cash. A discussion of these transactions and descriptions of the EFIH 10% Notes, EFH Corp. 10% Notes and TCEH 15% Senior Secured Second Lien Notes are presented below.
Transactions completed in the year ended December 31, 2010 were as follows:
| | • | | In November, TCEH and TCEH Finance issued $885 million aggregate principal amount of TCEH 15% Senior Secured Second Lien Notes (Series B) due 2021 in exchange for $850 million aggregate principal amount of TCEH 10.25% Notes and $420 million aggregate principal amount of TCEH Toggle Notes. |
| | • | | In October, TCEH and TCEH Finance issued $336 million aggregate principal amount of TCEH 15% Senior Secured Second Lien Notes due 2021 in exchange for $423 million aggregate principal amount of TCEH 10.25% Notes (plus accrued interest paid in cash) and $55 million aggregate principal amount of TCEH Toggle Notes (together, the TCEH Senior Notes). |
| | • | | In October, TCEH and TCEH Finance issued $350 million aggregate principal amount of TCEH 15% Senior Secured Second Lien Notes (Series B) due 2021, and used the $343 million of net proceeds to repurchase $240 million principal amount of TCEH 10.25% Notes (including $14 million from EFH Corp.) and $283 million principal amount of TCEH Toggle Notes (including $83 million from EFH Corp.) and paid accrued interest from cash on hand. TCEH paid $53 million of the net proceeds for the TCEH notes held by EFH Corp., which were retired. |
147
| | • | | In a public (registered with the SEC) debt exchange transaction in August, EFIH and EFIH Finance (together, the Issuers) issued $2.180 billion aggregate principal amount of EFIH 10% Notes due 2020 and paid $500 million in cash, plus accrued interest, in exchange for $2.166 billion aggregate principal amount of EFH Corp. Toggle Notes and $1.428 billion aggregate principal amount of EFH Corp. 10.875% Notes (together, the EFH Corp. Senior Notes). |
| | • | | Between April and July, EFH Corp. issued $527 million principal amount of EFH Corp. 10% Notes due 2020 in exchange for $549 million principal amount of EFH Corp. 5.55% Series P Senior Notes (EFH Corp. 5.55% Notes), $110 million principal amount of EFH Corp. Toggle Notes, $25 million principal amount of EFH Corp. 10.875% Notes, $13 million principal amount of TCEH 10.25% Notes and $17 million principal amount of TCEH Toggle Notes. |
| | • | | In March, EFH Corp. issued $34 million principal amount of EFH Corp. 10% Notes due 2020 in exchange for $20 million principal amount of EFH Corp. Toggle Notes and $27 million principal amount of TCEH Toggle Notes. |
| | • | | In January, EFH Corp. issued $500 million aggregate principal amount of EFH Corp. 10% Notes due 2020, with the proceeds intended to be used for general corporate purposes including debt exchanges and repurchases. |
| | • | | In addition, from time to time in 2010, EFH Corp. repurchased $124 million principal amount of EFH Corp. Toggle Notes, $19 million principal amount of EFH Corp. 10.875% Notes, $181 million principal amount of TCEH 10.25% Notes, $32 million principal amount of TCEH Toggle Notes and $20 million principal amount of initial term loans under the TCEH Senior Secured Facilities for $252 million in cash plus accrued interest. |
These transactions resulted in debt extinguishment gains totaling $1.814 billion (reported as other income).
In connection with the debt exchange transactions, EFH Corp. received the requisite consents from holders of the EFH Corp. Senior Notes and EFH Corp. 5.55% Notes applicable to certain amendments to the respective indentures governing such notes. These amendments, among other things, eliminated substantially all of the restrictive covenants, eliminated certain events of default, modified covenants regarding mergers and consolidations and modified or eliminated certain other provisions in such indentures.
The EFH Corp. notes acquired by EFIH and the majority of the TCEH notes and initial term loans under the TCEH Senior Secured Facilities acquired by EFH Corp. are held as investments by EFIH and EFH Corp., and are eliminated in consolidation. All other securities acquired in the above transactions have been cancelled.
Debt-Related Activity in 2009— Repayments of long-term debt in 2009 totaling $396 million represented principal payments at scheduled maturity dates as well as other repayments totaling $50 million, principally related to capitalized leases. Payments at scheduled amortization or maturity dates included $165 million repaid under the TCEH Initial Term Loan Facility, $104 million of Oncor transition bond principal payments, $65 million repaid under a TCEH promissory note, $9 million repaid under the TCEH Delayed Draw Term Loan Facility and $3 million of EFH Corp. senior notes.
Increases in long-term debt during 2009 totaling $522 million consisted of increased borrowings under the TCEH Delayed Draw Term Loan Facility, which was fully drawn as of July 2009, to fund expenditures related to construction of new generation facilities and environmental upgrades of existing lignite/coal-fueled generation facilities. In addition, long-term debt increased as a result of EFH Corp. increasing, through the PIK election, the principal amount of its EFH Corp. Toggle Notes by $309 million, and TCEH increasing, through the PIK election, the principal amount of its TCEH Toggle Notes by $202 million, in each case, in lieu of making cash interest payments.
148
2009 Debt Exchanges — In November 2009, EFH Corp., EFIH and EFIH Finance completed debt exchange transactions, which resulted in the issuance of $115 million principal amount of 9.75% Senior Secured Notes due 2019 by EFH Corp. (the EFH Corp. 9.75% Notes) and $141 million principal amount of 9.75% Senior Secured Notes due 2019 by EFIH and EFIH Finance (the EFIH 9.75% Notes) (both discussed further below) in exchange for $169 million principal amount of EFH Corp. 10.875% Notes, $12 million principal amount of EFH Corp. Toggle Notes, $143 million principal amount of TCEH 10.25% Notes, $17 million of EFH Corp. 5.55% Series P Senior Notes, $10 million of EFH Corp. 6.50% Series Q Senior Notes and $6 million principal amount of EFH Corp. 6.55% Series R Senior Notes.
Maturities— Long-term debt maturities as of December 31, 2010 are as follows:
| | | | |
Year | | | |
2011 | | $ | 651 | |
2012 | | | 237 | |
2013 | | | 296 | |
2014 | | | 21,046 | |
2015 | | | 3,187 | |
Thereafter (a) | | | 10,003 | |
Unamortized fair value premium | | | 15 | |
Unamortized fair value discount (b) | | | (620 | ) |
Capital lease obligations | | | 80 | |
| | | | |
Total | | $ | 34,895 | |
| | | | |
| | (a) | Long-term debt maturities for EFH Corp. (parent entity) total $7.766 billion, including $3.742 billion held by EFIH that is not included above. |
| | (b) | Unamortized fair value discount for EFH Corp. (parent entity) totals $(476) million. |
TCEH Senior Secured Facilities—The applicable rate on borrowings under the TCEH Initial Term Loan Facility, the TCEH Delayed Draw Term Loan Facility, the TCEH Revolving Credit Facility and the TCEH Letter of Credit Facility as of December 31, 2010 is provided in the long-term debt table and in the discussion of short-term borrowings above and reflects LIBOR-based borrowings. These borrowings totaled $22.304 billion as of December 31, 2010, excluding $20 million held by EFH Corp. as a result of debt repurchases.
In August 2009, the TCEH Senior Secured Facilities were amended to reduce the existing first lien capacity under the TCEH Senior Secured Facilities by $1.25 billion in exchange for the ability for TCEH to issue up to an additional $4 billion of secured notes or loans ranking junior to TCEH’s first lien obligations, provided that:
| | • | | such notes or loans mature later than the latest maturity date of any of the initial term loans under the TCEH Senior Secured Facilities, and |
| | • | | any net cash proceeds from any such issuances are used (i) in exchange for, or to refinance, repay, retire, refund or replace indebtedness of TCEH or (ii) to acquire, directly or indirectly, all or substantially all of the property and assets or business of another person or to finance the purchase price, cost of design, acquisition, construction, repair, restoration, replacement, expansion, installation or improvement of certain fixed or capital assets. |
149
In addition, the amended facilities permit TCEH to, among other things:
| | • | | issue new secured notes or loans, which may include, in each case, debt secured on a pari passu basis with the obligations under the TCEH Senior Secured Facilities, so long as, in each case, among other things, the net cash proceeds from any such issuance are used to prepay certain loans under the TCEH Senior Secured Facilities at par; |
| | • | | upon making an offer to all lenders within a particular series, agree with lenders of that series to extend the maturity of their term loans or extend or refinance their revolving credit commitments under the TCEH Senior Secured Facilities, and pay increased interest rates or otherwise modify the terms of their loans or revolving commitments in connection with such an extension, and |
| | • | | exclude from the financial maintenance covenant under the TCEH Senior Secured Facilities any new debt issued that ranks junior to TCEH’s first lien obligations under the TCEH Senior Secured Facilities. |
Under the terms of the TCEH Senior Secured Facilities, the commitments of the lenders to make loans to TCEH are several and not joint. Accordingly, if any lender fails to make loans to TCEH, TCEH’s available liquidity could be reduced by an amount up to the aggregate amount of such lender’s commitments under the TCEH Senior Secured Facilities.
The TCEH Senior Secured Facilities are unconditionally guaranteed jointly and severally on a senior secured basis by EFCH, and subject to certain exceptions, each existing and future direct or indirect wholly-owned US restricted subsidiary of TCEH. The TCEH Senior Secured Facilities, including the guarantees thereof, certain commodity hedging transactions and the interest rate swaps described under “TCEH Interest Rate Swap Transactions” below are secured by (a) substantially all of the current and future assets of TCEH and TCEH’s subsidiaries who are guarantors of such facilities and (b) pledges of the capital stock of TCEH and certain current and future direct or indirect subsidiaries of TCEH.
The TCEH Initial Term Loan Facility is required to be repaid in equal quarterly installments in an aggregate annual amount equal to 1% of the original principal amount of such facility ($41 million quarterly), with the balance payable in October 2014. The TCEH Delayed Draw Term Loan Facility is required to be repaid in equal quarterly installments in an aggregate annual amount equal to 1% of the actual principal outstanding under such facility as of December 2009 ($10 million quarterly), with the balance payable in October 2014. Amounts borrowed under the TCEH Revolving Facility may be reborrowed from time to time until October 2013. The TCEH Letter of Credit Facility and TCEH Commodity Collateral Posting Facility will mature in October 2014 and December 2012, respectively.
The TCEH Senior Secured Facilities contain customary negative covenants that, among other things, restrict, subject to certain exceptions, TCEH and its restricted subsidiaries’ ability to:
| | • | | create additional liens; |
| | • | | enter into mergers and consolidations; |
| | • | | sell or otherwise dispose of assets; |
| | • | | make dividends, redemptions or other distributions in respect of capital stock; |
| | • | | make acquisitions, investments, loans and advances, and |
| | • | | pay or modify certain subordinated and other material debt. |
In addition, the TCEH Senior Secured Facilities contain a maintenance covenant that prohibits TCEH and its restricted subsidiaries from exceeding a maximum consolidated secured leverage ratio and to observe certain customary reporting requirements and other affirmative covenants.
The TCEH Senior Secured Facilities contain certain customary events of default for senior leveraged acquisition financings, the occurrence of which would allow the lenders to accelerate all outstanding loans and terminate their commitments.
150
TCEH 15% Senior Secured Second Lien Notes —The TCEH 15% Senior Secured Second Lien Notes and the TCEH 15% Senior Secured Second Lien Notes (Series B) (collectively, the TCEH Senior Secured Second Lien Notes) mature in April 2021, with interest payable in cash quarterly in arrears on January 1, April 1, July 1 and October 1, beginning January 1, 2011, at a fixed rate of 15% per annum. The notes are unconditionally guaranteed on a joint and several basis by EFCH and, subject to certain exceptions, each subsidiary of TCEH (collectively, the Guarantors). The notes are secured, on a second-priority basis, by security interests in all of the assets of TCEH, and the guarantees (other than the guarantee of EFCH) are secured on a second-priority basis by all of the assets and equity interests of all of the Guarantors other than EFCH (collectively, the Subsidiary Guarantors), in each case, to the extent such assets and security interests secure obligations under the TCEH Senior Secured Credit Facilities on a first-priority basis (the TCEH Collateral), subject to certain exceptions (including the elimination of the pledge of equity interests of any subsidiary Guarantor to the extent that separate financial statements would be required to be filed with the SEC for such subsidiary Guarantor under Rule 3-16 of Regulation S-X) and permitted liens. The guarantee from EFCH is not secured.
As of December 31, 2010, there were $1.571 billion total principal amount of TCEH Senior Secured Second Lien Notes. The TCEH Senior Secured Second Lien Notes are a senior obligation and rank equally in right of payment with all senior indebtedness of TCEH, are senior in right of payment to all existing or future unsecured debt of TCEH to the extent of the value of the TCEH Collateral (after taking into account any first-priority liens on the TCEH Collateral) and are senior in right of payment to any future subordinated debt of TCEH. These notes are effectively subordinated to TCEH’s obligations under the TCEH Senior Secured Credit Facilities and TCEH’s commodity and interest rate hedges that are secured by a first-priority lien on the TCEH Collateral and any future obligations subject to first-priority liens on the TCEH Collateral, to the extent of the value of the TCEH Collateral, and to all secured obligations of TCEH that are secured by assets other than the TCEH Collateral, to the extent of the value of the assets securing such obligations.
The guarantees of the TCEH Senior Secured Second Lien Notes by the Subsidiary Guarantors are effectively senior to any unsecured debt of the Subsidiary Guarantors to the extent of the value of the TCEH Collateral (after taking into account any first-priority liens on the TCEH Collateral). These guarantees are effectively subordinated to all debt of the Subsidiary Guarantors secured by the TCEH Collateral on a first-priority basis or that is secured by assets that are not part of the TCEH Collateral, to the extent of the value of the collateral securing that debt. EFCH’s guarantee ranks equally with its unsecured debt (including debt it guarantees on an unsecured basis) and is effectively subordinated to any of its secured debt to the extent of the value of the collateral securing that debt.
The indenture for the TCEH Senior Secured Second Lien Notes contains a number of covenants that, among other things, restrict, subject to certain exceptions, TCEH’s and its restricted subsidiaries’ ability to:
| | • | | make restricted payments, including certain investments; |
| | • | | incur debt and issue preferred stock; |
| | • | | enter into mergers or consolidations; |
| | • | | sell or otherwise dispose of certain assets, and |
| | • | | engage in certain transactions with affiliates. |
The indenture also contains customary events of default, including, among others, failure to pay principal or interest on the notes when due. In general, all of the series of TCEH Senior Secured Second Lien Notes vote together as a single class. As a result, if certain events of default occur under the indenture, the trustee or the holders of at least 30% of aggregate principal amount of all outstanding TCEH Senior Secured Second Lien Notes may declare the principal amount on all such notes to be due and payable immediately.
151
Until October 1, 2013, TCEH may redeem, with the net cash proceeds of certain equity offerings, up to 35% of the aggregate principal amount of each series of the TCEH Senior Secured Second Lien Notes from time to time at a redemption price of 115.00% of the aggregate principal amount of the notes being redeemed, plus accrued interest. TCEH may redeem each series of the notes at any time prior to October 1, 2015 at a price equal to 100% of their principal amount, plus accrued interest and the applicable premium as defined in the indenture. TCEH may also redeem each series of the notes, in whole or in part, at any time on or after October 1, 2015, at specified redemption prices, plus accrued interest. Upon the occurrence of a change of control (as described in the indenture), TCEH must offer to repurchase each series of the notes at 101% of their principal amount, plus accrued interest.
The TCEH Senior Secured Second Lien Notes were issued in private placements and have not been registered under the Securities Act. TCEH has agreed to use its commercially reasonable efforts to register with the SEC notes having substantially identical terms as the TCEH Senior Secured Second Lien Notes (except for provisions relating to transfer restrictions and payment of additional interest) as part of an offer to exchange freely tradable exchange notes for the TCEH Senior Secured Second Lien Notes unless such notes meet certain transferability conditions (as described in the related registration rights agreement). If the registration statement has not been filed and declared effective within 365 days after the original issue date (a Registration Default), the annual interest rate on the notes will increase by 25 basis points for the first 90-day period during which a Registration Default continues, and thereafter the annual interest rate on the notes will increase by 50 basis points for the remaining period during which the Registration Default continues. If the Registration Default is cured, the interest rate on the notes will revert to the original level.
TCEH Senior Notes—The TCEH 10.25% Notes mature in November 2015, with interest payable in cash semi-annually in arrears on May 1 and November 1 at a fixed rate of 10.25% per annum. The TCEH Toggle Notes mature in November 2016, with interest payable semi-annually in arrears on May 1 and November 1 at a fixed rate of 10.50% per annum for cash interest and at a fixed rate of 11.25% per annum for PIK Interest. For any interest period until November 2012, TCEH may elect to pay interest on the notes (i) entirely in cash; (ii) by increasing the principal amount of the notes or by issuing new TCEH Toggle Notes (PIK Interest); or (iii) 50% in cash and 50% in PIK Interest. Once TCEH makes a PIK election, the election is valid for each succeeding interest payment period until TCEH revokes the election.
The TCEH 10.25% and Toggle Notes (collectively, the TCEH Senior Notes) had a total principal amount as of December 31, 2010 of $4.570 billion (excluding $323 million principal amount held by EFH Corp. and EFIH) and are fully and unconditionally guaranteed on a joint and several unsecured basis by TCEH’s direct parent, EFCH (which owns 100% of TCEH and its subsidiary guarantors), and by each subsidiary that guarantees the TCEH Senior Secured Facilities.
TCEH may redeem the TCEH 10.25% Notes and TCEH Toggle Notes at any time prior to November 1, 2011 and 2012, respectively, at a price equal to 100% of their principal amount, plus accrued and unpaid interest and the applicable premium as defined in the indenture. TCEH may redeem the TCEH 10.25% Notes and TCEH Toggle Notes, in whole or in part, at any time on or after November 1, 2011 and 2012, respectively, at specified redemption prices, plus accrued and unpaid interest, if any. Upon the occurrence of a change of control of EFCH or TCEH, TCEH must offer to repurchase the TCEH Senior Notes at 101% of their principal amount, plus accrued and unpaid interest, if any.
The indenture for the TCEH Senior Notes contains a number of covenants that, among other things, restrict, subject to certain exceptions, TCEH’s and its restricted subsidiaries’ ability to:
| | • | | make restricted payments; |
| | • | | incur debt and issue preferred stock; |
| | • | | enter into mergers or consolidations; |
| | • | | sell or otherwise dispose of certain assets, and |
| | • | | engage in certain transactions with affiliates. |
The indenture also contains customary events of default, including, among others, failure to pay principal or interest on the notes when due. If certain events of default occur and are continuing under the indenture, the trustee or the holders of at least 30% in principal amount of the notes may declare the principal amount on the notes to be due and payable immediately.
152
EFH Corp. 10% Notes— The EFH Corp. 10% Notes mature in January 2020, with interest payable in cash semi-annually in arrears on January 15 and July 15 at a fixed rate of 10% per annum. The notes are fully and unconditionally guaranteed on a joint and several basis by EFCH and EFIH. The guarantee from EFIH is secured by EFIH’s pledge of 100% of the membership interests and other investments it owns in Oncor Holdings (such membership interests and other investments, the EFIH Collateral). The guarantee from EFCH is not secured. EFIH’s guarantee of the EFH Corp. 10% Notes is secured by the EFIH Collateral on an equal and ratable basis with the EFIH Notes and EFIH’s guarantee of the EFH Corp. 9.75% Notes.
As of December 31, 2010, there were $1.061 billion total principal amount of EFH Corp. 10% Notes. The EFH Corp. 10% Notes are a senior obligation and rank equally in right of payment with all senior indebtedness of EFH Corp. and are senior in right of payment to any future subordinated indebtedness of EFH Corp. These notes are effectively subordinated to any indebtedness of EFH Corp. secured by assets of EFH Corp. to the extent of the value of the assets securing such indebtedness and structurally subordinated to all indebtedness and other liabilities of EFH Corp.’s non-guarantor subsidiaries.
The guarantees of the EFH Corp. 10% Notes are the general senior obligations of each guarantor and rank equally in right of payment with all existing and future senior indebtedness of each guarantor. The guarantee from EFIH is effectively senior to all unsecured indebtedness of EFIH to the extent of the value of the EFIH Collateral. The guarantees are effectively subordinated to all secured indebtedness of each guarantor secured by assets other than the EFIH Collateral to the extent of the value of the assets securing such indebtedness and are structurally subordinated to any existing and future indebtedness and liabilities of EFH Corp.’s subsidiaries that are not guarantors.
The indenture for the EFH Corp. 10% Notes contains a number of covenants that, among other things, restrict, subject to certain exceptions, EFH Corp.’s and its restricted subsidiaries’ ability to:
| | • | | make restricted payments; |
| | • | | incur debt and issue preferred stock; |
| | • | | enter into mergers or consolidations; |
| | • | | sell or otherwise dispose of certain assets, and |
| | • | | engage in certain transactions with affiliates. |
These notes and indenture also contain customary events of default, including, among others, failure to pay principal or interest on the notes when due. If certain events of default occur and are continuing under these notes and the indenture, the trustee or the holders of at least 30% in principal amount outstanding of the notes may declare the principal amount of the notes to be due and payable immediately.
Until January 15, 2013, EFH Corp. may redeem, with the net cash proceeds of certain equity offerings, up to 35% of the aggregate principal amount of the EFH Corp. 10% Notes from time to time at a redemption price of 110.000% of the aggregate principal amount of the notes being redeemed, plus accrued and unpaid interest. EFH Corp. may redeem the notes at any time prior to January 15, 2015 at a price equal to 100% of their principal amount, plus accrued and unpaid interest and the applicable premium as defined in the indenture. EFH Corp. may also redeem the notes, in whole or in part, at any time on or after January 15, 2015, at specified redemption prices, plus accrued and unpaid interest. Upon the occurrence of a change of control (as described in the indenture), EFH Corp. must offer to repurchase the notes at 101% of their principal amount, plus accrued and unpaid interest.
153
The EFH Corp. 10% Notes were issued in private placements with registration rights. EFH Corp. has offered to exchange notes that have substantially identical terms as the EFH Corp. 10% Notes (other than transfer restrictions). The exchange offer is expected to be completed in March 2011. Because the exchange offer was not completed within 360 days after the issue date of the EFH Corp. 10% Notes, the annual interest rate on the EFH Corp. 10% Notes increased by 25 basis points effective January 8, 2011 and will remain at that level until the exchange offer closes. Once the exchange offer closes, the interest rate on the notes will revert to the original level.
EFH Corp. Senior Notes —The EFH Corp. 10.875% Notes mature in November 2017, with interest payable in cash semi-annually in arrears on May 1 and November 1 at a fixed rate of 10.875% per annum. The EFH Corp. Toggle Notes mature in November 2017, with interest payable semiannually in arrears on May 1 and November 1 at a fixed rate of 11.250% per annum for cash interest and at a fixed rate of 12.000% per annum for PIK Interest. For any interest period until November 1, 2012, EFH Corp. may elect to pay interest on the notes (i) entirely in cash; (ii) by increasing the principal amount of the notes or by issuing new EFH Corp. Toggle Notes (PIK Interest); or (iii) 50% in cash and 50% in PIK Interest. Once EFH Corp. makes a PIK election, the election is valid for each succeeding interest payment period until EFH Corp. revokes the election.
The EFH Corp. 10.875% and Toggle Notes (collectively, the EFH Corp. Senior Notes) had a total principal amount as of December 31, 2010 of $930 million (excluding $3.724 billion principal amount held by EFIH) and are fully and unconditionally guaranteed on a joint and several unsecured basis by EFCH and EFIH.
EFH Corp. may redeem these notes at any time prior to November 1, 2012 at a price equal to 100% of their principal amount, plus accrued and unpaid interest and the applicable premium as defined in the related indenture. EFH Corp. may also redeem these notes, in whole or in part, at any time on or after November 1, 2012, at specified redemption prices, plus accrued and unpaid interest, if any. Upon the occurrence of a change of control of EFH Corp., EFH Corp. must offer to repurchase the EFH Corp. Senior Notes at 101% of their principal amount, plus accrued and unpaid interest, if any.
The indenture also contains customary events of default, including, among others, failure to pay principal or interest on the notes or the guarantees when due. If an event of default occurs under the indenture, the trustee or the holders of at least 30% in principal amount outstanding of the notes may declare the principal amount on the notes to be due and payable immediately.
EFH Corp. 9.75% Notes and EFIH 9.75% Notes —The EFH Corp. 9.75% Notes and EFIH 9.75% Notes mature in October 2019, with interest payable in cash semi-annually in arrears on April 15 and October 15 at a fixed rate of 9.75% per annum. The EFH Corp. 9.75% Notes are fully and unconditionally guaranteed on a joint and several basis by EFCH and EFIH. The guarantee from EFIH is secured by the pledge of the EFIH Collateral. The guarantee from EFCH is not secured. The EFIH 9.75% Notes are secured by the EFIH Collateral on an equal and ratable basis with the EFIH 10% Notes and EFIH’s guarantee of the EFH Corp. 10% Notes and the EFH Corp. 9.75% Notes.
As of December 31, 2010, there were $115 million and $141 million total principal amount of EFH Corp. 9.75% Notes and EFIH 9.75% Notes, respectively. The EFH Corp. 9.75% Notes and EFIH 9.75% Notes are senior obligations of each issuer and rank equally in right of payment with all senior indebtedness of each issuer and are senior in right of payment to any future subordinated indebtedness of each issuer. The EFH Corp. 9.75% Notes are effectively subordinated to any indebtedness of EFH Corp. secured by assets of EFH Corp. to the extent of the value of the assets securing such indebtedness and structurally subordinated to all indebtedness and other liabilities of EFH Corp.’s non-guarantor subsidiaries. The EFIH 9.75% Notes are effectively senior to all unsecured indebtedness of EFIH, to the extent of the value of the EFIH Collateral, and will be effectively subordinated to any indebtedness of EFIH secured by assets of EFIH other than the EFIH Collateral, to the extent of the value of the assets securing such indebtedness. Furthermore, the EFIH 9.75% Notes will be structurally subordinated to all indebtedness and other liabilities of EFIH’s subsidiaries (other than EFIH Finance), including Oncor Holdings and its subsidiaries.
The guarantees of the EFH Corp. 9.75% Notes are the general senior obligations of each guarantor and rank equally in right of payment with all existing and future senior indebtedness of each guarantor. The guarantee from EFIH is effectively senior to all unsecured indebtedness of EFIH to the extent of the value of the EFIH Collateral. The guarantee will be effectively subordinated to all secured indebtedness of each guarantor secured by assets other than the EFIH Collateral to the extent of the value of the assets securing such indebtedness and will be structurally subordinated to any existing and future indebtedness and liabilities of EFH Corp.’s subsidiaries that are not guarantors.
154
The indentures for the EFH Corp. 9.75% Notes and EFIH 9.75% Notes contain a number of covenants that, among other things, restrict, subject to certain exceptions, the issuers’ and their restricted subsidiaries’ ability to:
| | • | | make restricted payments; |
| | • | | incur debt and issue preferred stock; |
| | • | | enter into mergers or consolidations; |
| | • | | sell or otherwise dispose of certain assets, and |
| | • | | engage in certain transactions with affiliates. |
The indentures also contain customary events of default, including, among others, failure to pay principal or interest on the notes or the guarantees when due. If certain events of default occur and are continuing under a series of notes and the related indenture, the trustee or the holders of at least 30% in principal amount outstanding of the notes of such series may declare the principal amount of the notes of such series to be due and payable immediately.
There currently are no restricted subsidiaries under the indenture related to the EFIH 9.75% Notes (other than EFIH Finance, which has no assets). Oncor Holdings, the immediate parent of Oncor, and its subsidiaries are unrestricted subsidiaries under the EFIH indenture and, accordingly, are not subject to any of the restrictive covenants in the indenture.
The respective issuers may redeem the EFH Corp. 9.75% Notes and EFIH 9.75% Notes, in whole or in part, at any time on or after October 15, 2014, at specified redemption prices, plus accrued and unpaid interest, if any. In addition, before October 15, 2012, the respective issuers may redeem up to 35% of the aggregate principal amount of each series of the notes from time to time at a redemption price of 109.750% of the aggregate principal amount of such series of notes, plus accrued and unpaid interest, if any, with the net cash proceeds of certain equity offerings. The respective issuers may also redeem each series of the notes at any time prior to October 15, 2014 at a price equal to 100% of their principal amount, plus accrued and unpaid interest and the applicable premium as defined in the indenture. Upon the occurrence of a change of control (as described in the indenture), the respective issuers may be required to offer to repurchase each series of the notes at 101% of their principal amount, plus accrued and unpaid interest, if any.
EFIH 10% Notes — The EFIH 10% Notes mature in December 2020, with interest payable in cash semi-annually in arrears on June 1 and December 1 at a fixed rate of 10% per annum. The EFIH 10% Notes are secured by the EFIH Collateral. The EFIH 10% Notes are secured on an equal and ratable basis with the EFIH 9.75% Notes and EFIH’s guarantee of the EFH Corp. Senior Secured Notes.
As of December 31, 2010, there were $2.180 billion total principal amount of EFIH 10% Notes. The EFIH 10% Notes are senior obligations of EFIH and rank equally in right of payment with all existing and future senior indebtedness of EFIH (including the EFIH 9.75% Notes and EFIH’s guarantees of the EFH Corp. Senior Secured Notes). The EFIH 10% Notes are effectively senior to all unsecured indebtedness of EFIH, to the extent of the value of the EFIH Collateral, and are effectively subordinated to any indebtedness of EFIH secured by assets of EFIH other than the EFIH Collateral, to the extent of the value of the assets securing such indebtedness. Furthermore, the EFIH 10% Notes are (i) structurally subordinated to all indebtedness and other liabilities of EFIH’s subsidiaries (other than EFIH Finance), including Oncor Holdings and its subsidiaries, any of EFIH’s future foreign subsidiaries and any other unrestricted subsidiaries and (ii) senior in right of payment to any future subordinated indebtedness of the Issuers.
The indenture for the EFIH 10% Notes contains a number of covenants that, among other things, restrict, subject to certain exceptions, EFIH’s and its restricted subsidiaries’ ability to:
| | • | | make restricted payments; |
| | • | | incur debt and issue preferred stock; |
| | • | | enter into mergers or consolidations; |
| | • | | sell or otherwise dispose of certain assets, and |
| | • | | engage in certain transactions with affiliates. |
155
The indenture also contains customary events of default, including, among others, failure to pay principal or interest on the notes or the guarantees when due. If certain events of default occur and are continuing under the notes and the indenture, the trustee or the holders of at least 30% in principal amount outstanding of the notes may declare the principal amount of the notes to be due and payable immediately. Currently, there are no restricted subsidiaries under the indenture (other than EFIH Finance, which has no assets). Oncor Holdings, Oncor and their respective subsidiaries are unrestricted subsidiaries under the EFIH 10% Notes and the indenture and, accordingly, are not subject to any of the restrictive covenants in the notes and the related indenture.
Until December 1, 2013, EFIH may redeem, with the net cash proceeds of certain equity offerings, up to 35% of the aggregate principal amount of the EFIH 10% Notes from time to time at a redemption price of 110% of the aggregate principal amount of the notes being redeemed, plus accrued and unpaid interest, if any. EFIH may redeem the EFIH 10% Notes, in whole or in part, at any time prior to December 1, 2015 at a price equal to 100% of their principal amount, plus accrued and unpaid interest, if any, and the applicable premium as defined in the indenture. EFIH may redeem any of the EFIH 10% Notes, in whole or in part, at any time on or after December 1, 2015, at specified redemption prices, plus accrued and unpaid interest, if any. Upon the occurrence of a change of control (as defined in the indenture), EFIH may be required to offer to repurchase the notes at 101% of their principal amount, plus accrued and unpaid interest, if any.
Intercreditor Agreement — In October 2007, TCEH entered into an intercreditor agreement with Citibank, N.A. and five secured commodity hedge counterparties (the Secured Commodity Hedge Counterparties). In connection with the August 2009 amendment to the TCEH Secured Facilities described above, the intercreditor agreement was amended and restated (as amended and restated, the Intercreditor Agreement) to take into account, among other things, the possibility that TCEH could issue notes and/or loans secured by collateral (other than the collateral that secures the TCEH Senior Secured Facilities) that ranks on parity with, or junior to, TCEH’s existing first lien obligations under the TCEH Senior Secured Facilities. The Intercreditor Agreement provides that the lien granted to the Secured Commodity Hedge Counterparties will rank pari passu with the lien granted with respect to the collateral of the secured parties under the TCEH Senior Secured Facilities. The Intercreditor Agreement also provides that the Secured Commodity Hedge Counterparties will be entitled to share, on a pro rata basis, in the proceeds of any liquidation of such collateral in connection with a foreclosure on such collateral in an amount provided in the TCEH Senior Secured Facilities. The Intercreditor Agreement also provides that the Secured Commodity Hedge Counterparties will have voting rights with respect to any amendment or waiver of any provision of the Intercreditor Agreement that changes the priority of the Secured Commodity Hedge Counterparties’ lien on such collateral relative to the priority of lien granted to the secured parties under the TCEH Senior Secured Facilities or the priority of payments to the Secured Commodity Hedge Counterparties upon a foreclosure and liquidation of such collateral relative to the priority of the lien granted to the secured parties under the TCEH Senior Secured Facilities.
Second Lien Intercreditor Agreement — In October 2010, TCEH entered into a second lien intercreditor agreement (the Second Lien Intercreditor Agreement) with Citibank, N.A., as senior collateral agent, and The Bank of New York Mellon Trust Company, N.A., as initial second priority representative. The Second Lien Intercreditor Agreement provides that liens on the collateral that secure the obligations under the TCEH Senior Secured Facilities, the obligations of the Secured Commodity Hedge Counterparties and any other obligations which are permitted to be secured on a pari passu basis therewith (collectively, the First Lien Obligations) will rank prior to the liens on such collateral securing the obligations under the TCEH Senior Secured Second Lien Notes, and any other obligations which are permitted to be secured on a pari passu basis (collectively, the Second Lien Obligations). The Second Lien Intercreditor Agreement provides that the holders of the First Lien Obligations will be entitled to the proceeds of any liquidation of such collateral in connection with a foreclosure on such collateral until paid in full, and that the holders of the Second Lien Obligations will not be entitled to receive any such proceeds until the First Lien Obligations have been paid in full. The Second Lien Intercreditor Agreement also provides that the holders of the First Lien Obligations will control enforcement actions with respect to such collateral, and the holders of the Second Lien Obligations will not be entitled to commence any such enforcement actions, with limited exceptions. The Second Lien Intercreditor Agreement also provides that releases of the liens on the collateral by the holders of the First Lien Obligations will automatically require that the liens on such collateral by the holders of the Second Lien Obligations be automatically released, and that amendments, waivers or consents with respect to any of the collateral documents in connection with the First Lien Obligations apply automatically to any comparable provision of the collateral documents in connection with the Second Lien Obligations.
156
TCEH Interest Rate Swap Transactions—As of December 31, 2010, TCEH has entered into interest rate swap transactions pursuant to which payment of the floating interest rates on an aggregate of $15.80 billion principal amount of senior secured term loans of TCEH were exchanged for interest payments at fixed rates of between 7.3% and 8.3% on debt maturing from 2011 to 2014. Swaps related to an aggregate $500 million principal amount of debt expired in 2010, and no interest rate swap transactions were entered into in 2010. Interest rate swaps on an aggregate of $15.05 billion were being accounted for as cash flow hedges related to variable interest rate cash flows until August 29, 2008, at which time these swaps were dedesignated as cash flow hedges as a result of the intent to change the variable interest rate terms of the hedged debt (from three-month LIBOR to one-month LIBOR) in connection with the planned execution of interest rate basis swaps (discussed immediately below) to further reduce the fixed borrowing costs. Based on the fair value of the positions, the cumulative unrealized mark-to-market net losses related to these interest rate swaps totaled $431 million (pre-tax) at the dedesignation date and was recorded in accumulated other comprehensive income. This balance is being reclassified into net income as interest on the hedged debt is reflected in net income.
As of December 31, 2010, TCEH has entered into interest rate basis swap transactions pursuant to which payments at floating interest rates of three-month LIBOR on an aggregate of $15.20 billion principal amount of senior secured term loans of TCEH were exchanged for floating interest rates of one-month LIBOR plus spreads ranging from 0.0625% to 0.2055%. These transactions include swaps entered into in the year ended December 31, 2010 related to an aggregate $2.55 billion principal amount of TCEH senior secured term loans. Swaps related to an aggregate $3.60 billion principal amount of TCEH senior secured term loans expired in 2010.
The interest rate swap counterparties are proportionately secured by the same collateral package granted to the lenders under the TCEH Senior Secured Facilities. Changes in the fair value of such swaps are being reported in the income statement in interest expense and related charges, and such unrealized mark-to-market value changes totaled $207 million in net losses in the year ended December 31, 2010 and $696 million in net gains in the year ended December 31, 2009. The cumulative unrealized mark-to-market net liability related to the swaps totaled $1.419 billion as of December 31, 2010, of which $105 million (pre-tax) was reported in accumulated other comprehensive income.
See Note 17 for discussion of collateral investments in 2009 related to certain of these interest rate swaps.
157
| 12. | COMMITMENTS AND CONTINGENCIES |
Contractual Commitments
As of December 31, 2010, we had noncancellable commitments under energy-related contracts, leases and other agreements as follows:
| | | | | | | | | | | | | | | | | | | | |
| | | Coal purchase
agreements and coal
transportation
agreements | | | Pipeline
transportation and
storage reservation
fees | | | Capacity payments
under power purchase
agreements (a) | | | Nuclear
Fuel Contracts | | | Water
Rights Contracts | |
2011 | | $ | 473 | | | $ | 35 | | | $ | 63 | | | $ | 183 | | | $ | 9 | |
2012 | | | 366 | | | | 28 | | | | 3 | | | | 195 | | | | 9 | |
2013 | | | 334 | | | | — | | | | — | | | | 123 | | | | 8 | |
2014 | | | 306 | | | | — | | | | — | | | | 114 | | | | 8 | |
2015 | | | — | | | | — | | | | — | | | | 164 | | | | 8 | |
Thereafter | | | — | | | | — | | | | — | | | | 736 | | | | 56 | |
| | | | | | | | | | | | | | | | | | | | |
Total | | $ | 1,479 | | | $ | 63 | | | $ | 66 | | | $ | 1,515 | | | $ | 98 | |
| | | | | | | | | | | | | | | | | | | | |
| (a) | On the basis of current expectations of demand from electricity customers as compared with capacity and take-or-pay payments, management does not consider it likely that any material payments will become due for electricity not taken beyond capacity payments. |
Expenditures under our coal purchase and coal transportation agreements totaled $445 million, $316 million and $268 million for the years ended December 31, 2010, 2009 and 2008, respectively.
As of December 31, 2010, future minimum lease payments under both capital leases and operating leases are as follows:
| | | | | | | | |
| | | Capital
Leases | | | Operating
Leases (a) | |
2011 | | $ | 21 | | | $ | 48 | |
2012 | | | 18 | | | | 47 | |
2013 | | | 12 | | | | 47 | |
2014 | | | 7 | | | | 43 | |
2015 | | | 5 | | | | 41 | |
Thereafter | | | 38 | | | | 237 | |
| | | | | | | | |
Total future minimum lease payments | | | 101 | | | $ | 463 | |
| | | | | | | | |
Less amounts representing interest | | | 21 | | | | | |
| | | | | | | | |
Present value of future minimum lease payments | | | 80 | | | | | |
Less current portion | | | 17 | | | | | |
| | | | | | | | |
Long-term capital lease obligation | | $ | 63 | | | | | |
| | | | | | | | |
| |
| | (a) | Includes operating leases with initial or remaining noncancellable lease terms in excess of one year. |
Rent reported as operating costs, fuel costs and SG&A expenses totaled $89 million for the year ended December 31, 2010 and $92 million for each of the years ended December 31, 2009 and 2008.
158
Commitment to Fund Demand Side Management Initiatives
In connection with the Merger, Texas Holdings committed to spend $100 million over the five-year period ending December 31, 2012 on demand side management or other energy efficiency initiatives. As of December 31, 2010, we had spent 39% of this commitment. This commitment is expected to be funded by EFH Corp. and/or its subsidiaries other than Oncor. This commitment is in addition to over $300 million to be invested by Oncor for similar initiatives. See Note 6 for other provisions of the stipulation, including a similar commitment made by Oncor.
Guarantees
We have entered into contracts that contain guarantees to unaffiliated parties that could require performance or payment under certain conditions. Material guarantees are discussed below.
Disposed TXU Gas operations —In connection with the sale of TXU Gas in October 2004, EFH Corp. agreed to indemnify Atmos Energy Corporation (Atmos), until October 1, 2014, for up to $500 million for any liability related to assets retained by TXU Gas, including certain inactive gas plant sites not acquired by Atmos, and up to $1.4 billion for contingent liabilities associated with preclosing tax and employee related matters. The maximum aggregate amount under these indemnities that we may be required to pay is $1.9 billion. To date, we have not been required to make any payments to Atmos under any of these indemnity obligations, and no such payments are currently anticipated.
Residual value guarantees in operating leases — We are the lessee under various operating leases that guarantee the residual values of the leased assets. As of December 31, 2010, the aggregate maximum amount of residual values guaranteed was $13 million with an estimated residual recovery of $13 million. These leased assets consist primarily of rail cars. The average life of the residual value guarantees under the lease portfolio is approximately six years.
See Note 11 for discussion of guarantees and security for certain of our debt.
Letters of Credit
As of December 31, 2010, TCEH had outstanding letters of credit under its credit facilities totaling $874 million as follows:
| | • | | $473 million to support risk management and trading margin requirements in the normal course of business, including over-the-counter hedging transactions and collateral postings with ERCOT; |
| | • | | $208 million to support floating rate pollution control revenue bond debt with an aggregate principal amount of $204 million (the letters of credit are available to fund the payment of such debt obligations and expire in 2014); |
| | • | | $73 million to support TCEH’s REP financial requirements with the PUCT, and |
| | • | | $120 million for miscellaneous credit support requirements. |
159
Litigation Related to Generation Facilities
In November 2010, an administrative appeal challenging the decision of the TCEQ to renew and amend Oak Grove Management Company LLC’s (Oak Grove) (a wholly-owned subsidiary of TCEH) Texas Pollutant Discharge Elimination System (TPDES) permit related to water discharges was filed by Robertson County: Our Land, Our Lives and Roy Henrichson in the Travis County, Texas District Court. Plaintiffs seek a reversal of the TCEQ’s order and a remand back to the TCEQ for further proceedings. In addition to this administrative appeal, in November 2010, two other petitions were filed in Travis County, Texas District Court by Sustainable Energy and Economic Development Coalition and Paul and Lisa Rolke, respectively, who were non-parties to the administrative hearing before the State Office of Administrative Hearings, challenging the TCEQ’s decision to renew and amend Oak Grove’s TPDES permit and asking the District Court to remand the matter to the TCEQ for further proceedings. Although we cannot predict the outcome of these proceedings, we believe that the renewal and amendment of the Oak Grove TPDES permit are protective of the environment and that the application for and the processing of Oak Grove’s TPDES permit renewal and amendment by the TCEQ were in accordance with applicable law. There can be no assurance that the outcome of these matters would not result in an adverse impact on our financial condition, results of operations or liquidity.
In September 2010, the Sierra Club filed a lawsuit in the US District Court for the Eastern District of Texas (Texarkana Division) against EFH Corp. and Luminant Generation Company LLC (a wholly-owned subsidiary of TCEH) for alleged violations of the Clean Air Act at Luminant’s Martin Lake generation facility. While we are unable to estimate any possible loss or predict the outcome of the litigation, we believe that the Sierra Club’s claims are without merit, and we intend to vigorously defend this litigation. In addition, in February 2010, the Sierra Club informed Luminant that it may sue Luminant, after the expiration of a 60-day waiting period, for allegedly violating federal Clean Air Act provisions in connection with Luminant’s Big Brown generation facility. Subsequently, in December 2010, Sierra Club informed Luminant that it may sue Luminant, after the expiration of a 60-day waiting period, for allegedly violating federal Clean Air Act provisions in connection with Luminant’s Monticello generation facility. We cannot predict whether the Sierra Club will actually file suit or the outcome of any resulting proceedings.
Regulatory Reviews
In June 2008, the EPA issued a request for information to TCEH under the EPA’s authority under Section 114 of the Clean Air Act. The stated purpose of the request is to obtain information necessary to determine compliance with the Clean Air Act, including New Source Review Standards and air permits issued by the TCEQ for the Big Brown, Monticello and Martin Lake generation facilities. Historically, as the EPA has pursued its New Source Review enforcement initiative, companies that have received a large and broad request under Section 114, such as the request received by TCEH, have in many instances subsequently received a notice of violation from the EPA, which has in some cases progressed to litigation or settlement. The company is cooperating with the EPA and is responding in good faith to the EPA’s request, but is unable to predict the outcome of this matter.
Other Proceedings
In addition to the above, we are involved in various other legal and administrative proceedings in the normal course of business, the ultimate resolution of which, in the opinion of management, should not have a material effect on our financial condition, results of operations or liquidity.
Labor Contracts
Certain personnel engaged in TCEH activities are represented by labor unions and covered by collective bargaining agreements with varying expiration dates. In November 2010, new one-year labor agreements were reached covering bargaining unit personnel engaged in lignite-fueled generation operations (excluding Sandow), lignite mining operations (excluding Three Oaks) and natural gas-fueled generation operations. In October 2010, new two-year labor agreements were reached covering bargaining unit personnel engaged in the Sandow lignite-fueled generation operations and the Three Oaks lignite mining operations. In August 2010, a new three-year labor agreement was reached covering bargaining unit personnel engaged in nuclear-fueled generation operations. We do not expect any changes in collective bargaining agreements to have a material effect on our results of operations, liquidity or financial condition.
160
Environmental Contingencies
The federal Clean Air Act, as amended (Clean Air Act) includes provisions which, among other things, place limits on SO2 and NOx emissions produced by electricity generation plants. The capital requirements of the company have not been significantly affected by the requirements of the Clean Air Act. In addition, all air pollution control provisions of the 1999 Restructuring Legislation have been satisfied.
We must comply with environmental laws and regulations applicable to the handling and disposal of hazardous waste. We believe that we are in compliance with current environmental laws and regulations; however, the impact, if any, of changes to existing regulations or the implementation of new regulations is not determinable and could materially and adversely affect our financial condition, results of operations and liquidity.
The costs to comply with environmental regulations can be significantly affected by the following external events or conditions:
| | • | | enactment of state or federal regulations regarding CO2 and other greenhouse gas emissions; |
| | • | | other changes to existing state or federal regulation regarding air quality, water quality, control of toxic substances and hazardous and solid wastes, and other environmental matters, including revisions to CAIR currently being developed by the EPA as a result of court rulings discussed in Note 4 and revisions to the federal Clean Air Mercury Rule (CAMR) also being developed by the EPA as a result of similar court rulings, and |
| | • | | the identification of sites requiring clean-up or the filing of other complaints in which we may be asserted to be potential responsible parties. |
Nuclear Insurance
Nuclear insurance includes liability coverage, property damage, decontamination and premature decommissioning coverage and accidental outage and/or extra expense coverage. The liability coverage is governed by the Price-Anderson Act (Act), while the property damage, decontamination and premature decommissioning coverage are promulgated by the rules and regulations of the NRC. We intend to maintain insurance against nuclear risks as long as such insurance is available. The company is self-insured to the extent that losses (i) are within the policy deductibles, (ii) are not covered per policy exclusions, terms and limitations, (iii) exceed the amount of insurance maintained, or (iv) are not covered due to lack of insurance availability. Such losses could have a material adverse effect on our financial condition and results of operations and liquidity.
With regard to liability coverage, the Act provides financial protection for the public in the event of a significant nuclear generation plant incident. The Act sets the statutory limit of public liability for a single nuclear incident at $12.5 billion and requires nuclear generation plant operators to provide financial protection for this amount. The US Congress could impose revenue-raising measures on the nuclear industry to pay claims exceeding the $12.5 billion limit for a single incident mandated by the Act. As required, the company provides this financial protection for a nuclear incident at Comanche Peak resulting in public bodily injury and property damage through a combination of private insurance and industry-wide retrospective payment plans. As the first layer of financial protection, the company has $375 million of liability insurance from American Nuclear Insurers (ANI), which provides such insurance on behalf of a major stock insurance company pool, Nuclear Energy Liability Insurance Association. The second layer of financial protection is provided under an industry-wide retrospective payment program called Secondary Financial Protection (SFP).
Under the SFP, in the event of an incident at any nuclear generation plant in the US, each operating licensed reactor in the US is subject to an assessment of up to $117.5 million plus a 3% insurance premium tax, subject to increases for inflation every five years. Assessments are limited to $17.5 million per operating licensed reactor per year per incident. The company’s maximum potential assessment under the industry retrospective plan would be $235 million (excluding taxes) per incident but no more than $35 million in any one year for each incident. The potential assessment is triggered by a nuclear liability loss in excess of $375 million per accident at any nuclear facility. The SFP and liability coverage are not subject to any deductibles.
161
With respect to nuclear decontamination and property damage insurance, the NRC requires that nuclear generation plant license-holders maintain at least $1.06 billion of such insurance and require the proceeds thereof to be used to place a plant in a safe and stable condition, to decontaminate it pursuant to a plan submitted to and approved by the NRC before the proceeds can be used for plant repair or restoration or to provide for premature decommissioning. The company maintains nuclear decontamination and property damage insurance for Comanche Peak in the amount of $2.25 billion (subject to $5 million deductible per accident), above which the company is self-insured. This insurance coverage consists of a primary layer of coverage of $500 million provided by Nuclear Electric Insurance Limited (NEIL), a nuclear electric utility industry mutual insurance company and $1.40 billion of premature decommissioning coverage also provided by NEIL. The European Mutual Association for Nuclear Insurance provides additional insurance limits of $350 million in excess of NEIL’s $1.9 billion coverage.
The company maintains Accidental Outage Insurance through NEIL to cover the additional costs of obtaining replacement electricity from another source if one or both of the units at Comanche Peak are out of service for more than twelve weeks as a result of covered direct physical damage. The coverage provides for weekly payments of $3.5 million for the first fifty-two weeks and $2.8 million for the next 110 weeks for each outage, respectively, after the initial twelve-week waiting period. The total maximum coverage is $490 million per unit. The coverage amounts applicable to each unit will be reduced to 80% if both units are out of service at the same time as a result of the same accident.
If NEIL’s losses exceeded its reserves for the applicable coverage, potential assessments in the form of a retrospective premium call could be made up to ten times annual premiums. The company maintains insurance coverage against these potential retrospective premium calls.
Also, under the NEIL policies, if there were multiple terrorism losses occurring within a one-year time frame, NEIL would make available one industry aggregate limit of $3.2 billion plus any amounts it recovers from other sources up to the limits for each claimant. If terrorism losses occurred beyond the one-year period, a new set of limits and resources would apply.
162
Equity Issuances and Repurchases
In the year ended December 31, 2008, EFH Corp. issued an aggregate of approximately 5.5 million shares of its common stock to, or for the benefit of, certain of its officers, directors and employees for an aggregate consideration of $27.4 million, which included shares previously subscribed. In addition, in the years ended December 31, 2010, 2009 and 2008, EFH Corp. issued an aggregate of 3.9 million, 1.5 million and 1.7 million shares, respectively, of its common stock to, or for the benefit of, certain officers, directors and employees as stock-based compensation as discussed in Note 21. The 2010 issuances included 1.2 million shares of previously issued restricted or deferred stock units that vested in 2010. In 2008, EFH Corp. repurchased 0.8 million shares of its common stock from employees primarily upon termination of employment or amendment of agreements, for an aggregate consideration of $3.9 million.
Effect of Sale of Noncontrolling Interests
The total amount of proceeds from the sale of noncontrolling interests in Oncor discussed in Note 14 was less than the carrying value of the interests sold by $265 million, which reflects the fact that Oncor’s carrying value after purchase accounting is based on the Merger value, while the noncontrolling interests sale value does not include a control premium. This difference was accounted for as a reduction of additional paid-in capital.
As a result of the sale of the noncontrolling interests and the application of rules for income tax accounting related to outside basis differences, activity in 2008 reflects an increase in the balance of noncurrent accumulated deferred income tax liabilities of $141 million and a decrease in additional paid-in capital by the same amount.
Dividend Restrictions
The indentures governing the EFH Corp. Senior Notes and EFH Corp. Senior Secured Notes include covenants that, among other things and subject to certain exceptions, restrict our ability to pay dividends or make other distributions in respect of our common stock. Accordingly, essentially all of our net income is restricted from being used to make distributions on our common stock unless such distributions are expressly permitted under these indentures and/or on a pro forma basis, after giving effect to such distribution, EFH Corp.’s consolidated leverage ratio is equal to or less than 7.0 to 1.0. For purposes of this calculation, “consolidated leverage ratio” is defined as the ratio of consolidated total debt (as defined in the indenture) to Adjusted EBITDA, in each case, consolidated with its subsidiaries other than Oncor Holdings and its subsidiaries. EFH Corp.’s consolidated leverage ratio was 8.5 to 1.0 as of December 31, 2010.
In addition, the indentures governing the EFIH Notes generally restrict EFIH from making any cash distribution to EFH Corp. for the ultimate purpose of making a cash dividend on our common stock unless at the time, and after giving effect to such dividend, EFIH’s consolidated leverage ratio is equal to or less than 6.0 to 1.0. Under the indentures governing the EFIH Notes, the term “consolidated leverage ratio” is defined as the ratio of EFIH’s consolidated total debt (as defined in the indentures) to EFIH’s Adjusted EBITDA on a consolidated basis (including Oncor’s Adjusted EBITDA). EFIH’s consolidated leverage ratio was 5.3 to 1.0 as of December 31, 2010.
The TCEH Senior Secured Facilities generally restrict TCEH from making any cash distribution to any of its parent companies for the ultimate purpose of making a cash dividend on our common stock unless at the time, and after giving effect to such dividend, its consolidated total debt (as defined in the TCEH Senior Secured Facilities) to Adjusted EBITDA would be equal to or less than 6.5 to 1.0. As of December 31, 2010, that ratio was 7.9 to 1.0.
163
In addition, the TCEH Senior Secured Facilities and indentures governing the TCEH Senior Notes and TCEH Senior Secured Second Lien Notes generally restrict TCEH’s ability to make distributions or loans to any of its parent companies, EFCH and EFH Corp., unless such distributions or loans are expressly permitted under the TCEH Senior Secured Facilities and the indentures governing the TCEH Senior Notes and TCEH Senior Secured Second Lien Notes. Those agreements generally permit TCEH to make unlimited distributions or loans to its parent companies for corporate overhead costs, SG&A expenses, taxes and principal and interest payments. In addition, those agreements contain certain investment and dividend baskets that would allow TCEH to make additional distributions and/or loans to its parent companies up to the amount of such baskets. As of December 31, 2010 and 2009, EFH Corp. demand notes payable to TCEH totaled $1.921 billion and $1.406 billion, respectively, of which $916 million and $416 million, respectively, was related to principal and interest payments. Such principal and interest amounts are guaranteed by EFCH and EFIH on a pari passu basis with their guarantees of the EFH Corp. Senior Notes; the remaining balance of the demand notes is not guaranteed.
In addition, under applicable law, we would be prohibited from paying any dividend to the extent that immediately following payment of such dividend, there would be no statutory surplus or we would be insolvent.
EFH Corp. did not declare or pay any dividends in 2010, 2009 or 2008.
Distributions from Oncor —Until December 31, 2012, distributions paid by Oncor to its members are limited to an amount not to exceed Oncor’s net income determined in accordance with GAAP, subject to certain defined adjustments. Such adjustments include deducting the $72 million ($46 million after-tax) one-time refund to customers in September 2008, net accretion of fair value adjustments resulting from purchase accounting and funds spent as part of the $100 million commitment for additional demand-side management or other energy efficiency initiatives (see Note 6) of which $46 million ($30 million after tax) has been spent through December 31, 2010, and removing the effects of the $860 million goodwill impairment charge from fourth quarter 2008 net income available for distribution. As of December 31, 2010, $140 million was available for distribution to Oncor’s members under the cumulative net income restriction, of which approximately 80% relates to EFH Corp.’s ownership interest.
Oncor’s distributions are further limited by an agreement with the PUCT that its regulatory capital structure, as determined by the PUCT, will be at or below the assumed debt-to-equity ratio established periodically by the PUCT for ratemaking purposes, which is currently set at 60% debt to 40% equity. As of December 31, 2010, the regulatory capitalization ratio was 59.7% debt and 40.3% equity. The PUCT has the authority to determine what types of debt and equity are included in a utility’s debt-to-equity ratio. For purposes of this ratio, debt is calculated as long-term debt plus unamortized gains on reacquired debt less unamortized issuance expenses, premiums and losses on reacquired debt. The debt calculation excludes transition bonds issued by Oncor Electric Delivery Transition Bond Company. Equity is calculated as membership interests determined in accordance with GAAP, excluding the effects of accounting for the Merger (which included recording the initial goodwill and fair value adjustments and the subsequent related impairments and amortization). As of December 31, 2010, $44 million was available for distribution under the capital structure restriction, of which approximately 80% relates to EFH Corp.’s ownership interest. In January 2011, Oncor filed for a rate review with the PUCT and 203 cities that, among other things, requested a revised regulatory capital structure of 55% debt to 45% equity, which if approved as requested, would further limit distributions from Oncor.
Shareholder Actions
In May 2009, the shareholders of EFH Corp. approved the change of the stated capital of EFH Corp.’s common stock, no par value per share, to an amount equal to $0.001 for each outstanding share of common stock, resulting in total stated value of outstanding common stock of $2 million. Also in May 2009, EFH Corp.’s board of directors approved a decrease in additional paid-in capital of the same amount and the allocation of $0.001 per share to stated value of common stock upon issuance of any authorized but unissued shares of common stock that may occur from time to time, with the remainder of any amounts received for such shares allocated to additional paid-in capital.
164
Common Stock Registration Rights
The Sponsor Group and certain other investors entered into a registration rights agreement with EFH Corp. upon closing of the Merger. Pursuant to this agreement, in certain instances, the Sponsor Group can cause EFH Corp. to register shares of EFH Corp.’s common stock owned directly or indirectly by them under the Securities Act. In certain instances, the Sponsor Group and certain other investors are also entitled to participate on a pro rata basis in any registration of EFH Corp.’s common stock under the Securities Act that it may undertake.
See Note 21 for discussion of stock-based compensation plans.
| 14. | NONCONTROLLING INTERESTS |
In November 2008, equity interests in Oncor were sold to Texas Transmission for $1.254 billion in cash. Equity interests were also indirectly sold to certain members of Oncor’s board of directors and its management team. Accordingly, after giving effect to all equity issuances, as of December 31, 2010, ownership of Oncor’s membership interests was as follows: 80.03% held indirectly by EFH Corp., 0.22% held indirectly by Oncor’s management and board of directors and 19.75% held by Texas Transmission.
The proceeds (net of closing costs) of $1.253 billion received by Oncor from Texas Transmission and the members of Oncor management upon completion of these transactions were distributed ultimately to EFH Corp. Under the terms of certain financing arrangements of EFH Corp. and TCEH, upon such distribution, under certain circumstances, EFH Corp. (parent entity) was required to repay certain outstanding intercompany loans from TCEH. In November 2008, EFH Corp. repaid the $253 million balance of notes payable to TCEH that related to payments of principal and interest on EFH Corp. (parent entity) debt.
See Note 13 for discussion of amounts recorded as a reduction of shareholders’ equity as a result of the sale of Oncor interests.
Of the noncontrolling interests balance reported in the December 31, 2009 consolidated balance sheet, $1.363 billion related to Oncor. The noncontrolling interests balance reported in the December 31, 2009 consolidated balance sheet represented the proportional share of Oncor’s net assets at the date of the transaction less $96 million representing the noncontrolling interests’ share of Oncor’s net losses for the periods subsequent to the transaction (including the goodwill impairment charge), net of $58 million in cash distributions. See Notes 1 and 3 for discussion of the deconsolidation of Oncor in 2010.
In connection with the filing of a combined operating license application with the NRC for two new nuclear generation units, in January 2009, TCEH and Mitsubishi Heavy Industries Ltd. (MHI) formed a joint venture, CPNPC, to further the development of the two new nuclear generation units using MHI’s US–Advanced Pressurized Water Reactor technology. Under the terms of the joint venture agreement, a subsidiary of TCEH owns an 88% interest in the venture and a subsidiary of MHI owns a 12% interest. This joint venture is a variable interest entity, and a subsidiary of TCEH is considered the primary beneficiary (see Note 3).
165
| 15. | FAIR VALUE MEASUREMENTS |
Accounting standards related to the determination of fair value define fair value as the price that would be received to sell an asset or paid to transfer a liability in an orderly transaction between market participants at the measurement date. We use a “mid-market” valuation convention (the mid-point price between bid and ask prices) as a practical expedient to measure fair value for the majority of our assets and liabilities subject to fair value measurement on a recurring basis. We primarily use the market approach for recurring fair value measurements and use valuation techniques to maximize the use of observable inputs and minimize the use of unobservable inputs.
We categorize our assets and liabilities recorded at fair value based upon the following fair value hierarchy:
| | • | | Level 1 valuations use quoted prices in active markets for identical assets or liabilities that are accessible at the measurement date. An active market is a market in which transactions for the asset or liability occur with sufficient frequency and volume to provide pricing information on an ongoing basis. Our Level 1 assets and liabilities include exchange traded commodity contracts. For example, a significant number of our derivatives are NYMEX futures and swaps transacted through clearing brokers for which prices are actively quoted. |
| | • | | Level 2 valuations use inputs, in the absence of actively quoted market prices, that are observable for the asset or liability, either directly or indirectly. Level 2 inputs include: (a) quoted prices for similar assets or liabilities in active markets, (b) quoted prices for identical or similar assets or liabilities in markets that are not active, (c) inputs other than quoted prices that are observable for the asset or liability such as interest rates and yield curves observable at commonly quoted intervals and (d) inputs that are derived principally from or corroborated by observable market data by correlation or other means. Our Level 2 valuations utilize over-the-counter broker quotes, quoted prices for similar assets or liabilities that are corroborated by correlations or other mathematical means and other valuation inputs. For example, our Level 2 assets and liabilities include forward commodity positions at locations for which over-the-counter broker quotes are available. |
| | • | | Level 3 valuations use unobservable inputs for the asset or liability. Unobservable inputs are used to the extent observable inputs are not available, thereby allowing for situations in which there is little, if any, market activity for the asset or liability at the measurement date. We use the most meaningful information available from the market combined with internally developed valuation methodologies to develop our best estimate of fair value. For example, our Level 3 assets and liabilities include certain derivatives whose values are derived from pricing models that utilize multiple inputs to the valuations, including inputs that are not observable or easily corroborated through other means. |
We utilize several different valuation techniques to measure the fair value of assets and liabilities, relying primarily on the market approach of using prices and other market information for identical and/or comparable assets and liabilities for those items that are measured on a recurring basis. These methods include, among others, the use of broker quotes and statistical relationships between different price curves.
In utilizing broker quotes, we attempt to obtain multiple quotes from brokers that are active in the commodity markets in which we participate (and require at least one quote from two brokers to determine a pricing input as observable); however, not all pricing inputs are quoted by brokers. The number of broker quotes received for certain pricing inputs varies depending on the depth of the trading market, each individual broker’s publication policy, recent trading volume trends and various other factors. In addition, for valuation of interest rate swaps, we use a combination of dealer provided market valuations (generally non-binding) and Bloomberg valuations based on month-end interest rate curves and standard rate swap valuation models.
166
Certain derivatives and financial instruments are valued utilizing option pricing models that take into consideration multiple inputs including commodity prices, volatility factors, discount rates and other inputs. Additionally, when there is not a sufficient amount of observable market data, valuation models are developed that incorporate proprietary views of market factors. Those valuation models are generally used in developing long-term forward price curves for certain commodities. We believe the development of such curves is consistent with industry practice; however, the fair value measurements resulting from such curves are classified as Level 3.
With respect to amounts presented in the following fair value hierarchy tables, the fair value measurement of an asset or liability (e.g., a contract) is required to fall in its entirety in one level, based on the lowest level input that is significant to the fair value measurement. Certain assets and liabilities would be classified in Level 2 instead of Level 3 of the hierarchy except for the effects of credit reserves and non-performance risk adjustments, respectively. Assessing the significance of a particular input to the fair value measurement in its entirety requires judgment, considering factors specific to the asset or liability being measured.
As of December 31, 2010, assets and liabilities measured at fair value on a recurring basis consisted of the following:
| | | | | | | | | | | | | | | | | | | | |
| | | Level 1 | | | Level 2 | | | Level 3 (a) | | | Reclassification(b) | | | Total | |
Assets: | | | | | | | | | | | | | | | | | | | | |
Commodity contracts | | $ | 727 | | | $ | 3,575 | | | $ | 401 | | | $ | 2 | | | $ | 4,705 | |
Interest rate swaps | | | — | | | | 98 | | | | — | | | | — | | | | 98 | |
Nuclear decommissioning trust –
equity securities (c) | | | 192 | | | | 121 | | | | — | | | | — | | | | 313 | |
Nuclear decommissioning trust –
debt securities (c) | | | — | | | | 223 | | | | — | | | | — | | | | 223 | |
| | | | | | | | | | | | | | | | | | | | |
Total assets | | $ | 919 | | | $ | 4,017 | | | $ | 401 | | | $ | 2 | | | $ | 5,339 | |
| | | | | | | | | | | | | | | | | | | | |
Liabilities: | | | | | | | | | | | | | | | | | | | | |
Commodity contracts | | $ | 875 | | | $ | 672 | | | $ | 59 | | | $ | 2 | | | $ | 1,608 | |
Interest rate swaps | | | — | | | | 1,544 | | | | — | | | | — | | | | 1,544 | |
| | | | | | | | | | | | | | | | | | | | |
Total liabilities | | $ | 875 | | | $ | 2,216 | | | $ | 59 | | | $ | 2 | | | $ | 3,152 | |
| | | | | | | | | | | | | | | | | | | | |
| | (a) | Level 3 assets and liabilities consist primarily of a complex wind generation purchase contract, certain natural gas positions (collars) in the long-term hedging program and certain power transactions valued at illiquid pricing locations as discussed below. |
| | (b) | Represents the effects of reclassification of the assets and liabilities to conform to the balance sheet presentation of current and long-term assets and liabilities. |
| | (c) | The nuclear decommissioning trust investment is included in the other investments line on the balance sheet. See Note 18. |
See Note 20 for fair value measurements related to pension and OPEB plan assets.
In conjunction with ERCOT’s transition to a nodal wholesale market structure effective December 2010, we have entered (and expect to increasingly enter) into certain derivative transactions that are valued at illiquid pricing locations (unobservable inputs), thus requiring classification as Level 3 assets or liabilities. As the nodal market matures and more transactions and pricing information becomes available for these pricing locations, we expect more of the valuation inputs to become observable.
167
As of December 31, 2009, assets and liabilities measured at fair value on a recurring basis consisted of the following:
| | | | | | | | | | | | | | | | | | | | |
| | | Level 1 | | | Level 2 | | | Level 3 (a) | | | Reclassification(b) | | | Total | |
Assets: | | | | | | | | | | | | | | | | | | | | |
Commodity contracts | | $ | 918 | | | $ | 2,588 | | | $ | 350 | | | $ | 4 | | | $ | 3,860 | |
Interest rate swaps | | | — | | | | 64 | | | | — | | | | — | | | | 64 | |
Nuclear decommissioning trust – equity securities (c) | | | 154 | | | | 105 | | | | — | | |
| —
|
| | | 259 | |
Nuclear decommissioning trust – debt securities (c) | | | — | | | | 216 | | | | — | | | | — | | | | 216 | |
| | | | | | | | | | | | | | | | | | | | |
Total assets | | $ | 1,072 | | | $ | 2,973 | | | $ | 350 | | | $ | 4 | | | $ | 4,399 | |
| | | | | | | | | | | | | | | | | | | | |
| | | | | |
Liabilities: | | | | | | | | | | | | | | | | | | | | |
Commodity contracts | | $ | 1,077 | | | $ | 796 | | | $ | 269 | | | $ | 4 | | | $ | 2,146 | |
Interest rate swaps | | | — | | | | 1,306 | | | | — | | | | — | | | | 1,306 | |
| | | | | | | | | | | | | | | | | | | | |
Total liabilities | | $ | 1,077 | | | $ | 2,102 | | | $ | 269 | | | $ | 4 | | | $ | 3,452 | |
| | | | | | | | | | | | | | | | | | | | |
| | (a) | Level 3 assets and liabilities consist primarily of complex long-term power purchase and sales agreements, including a long-term wind generation purchase contract and certain natural gas positions (collars) in the long-term hedging program. |
| | (b) | Represents the effects of reclassification of the assets and liabilities to conform to the balance sheet presentation of current and long-term assets and liabilities. |
| | (c) | The nuclear decommissioning trust investment is included in the other investments line on the balance sheet. See Note 18. |
Commodity contracts consist primarily of natural gas, electricity, fuel oil and coal derivative instruments entered into for hedging purposes and include physical contracts that have not been designated “normal” purchases or sales. See Note 17 for further discussion regarding the company’s use of derivative instruments.
Interest rate swaps include variable-to-fixed rate swap instruments that are economic hedges of interest on long-term debt as well as interest rate basis swaps designed to effectively reduce the hedged borrowing costs. See Note 11 for discussion of interest rate swaps.
Nuclear decommissioning trust assets represent securities held for the purpose of funding the future retirement and decommissioning of the nuclear generation units. These investments include equity, debt and other fixed-income securities consistent with investment rules established by the NRC and the PUCT.
There were no significant transfers between the levels of the fair value hierarchy for the year ended December 31, 2010.
168
The following table presents the changes in fair value of the Level 3 assets and liabilities (all related to commodity contracts) for the years ended December 31, 2010, 2009 and 2008:
| | | | | | | | | | | | |
| | | Year Ended December 31, | |
| | | 2010 | | | 2009 | | | 2008 | |
Balance as of beginning of period | | $ | 81 | | | $ | (72 | ) | | $ | (173 | ) |
Total realized and unrealized gains (losses) (a): | | | | | | | | | | | | |
Included in net income (loss) | | | 266 | | | | 115 | | | | (5 | ) |
Included in other comprehensive income (loss) | | | — | | | | (30 | ) | | | — | |
Purchases, sales, issuances and settlements (net) (b) | | | 26 | | | | 51 | | | | (13 | ) |
Transfers into Level 3 (c) | | | (12 | )�� | | | 2 | | | | 70 | |
Transfers out of Level 3 (c) | | | (19 | ) | | | 15 | | | | 49 | |
| | | | | | | | | | | | |
Balance as of end of period | | $ | 342 | | | $ | 81 | | | $ | (72 | ) |
| | | | | | | | | | | | |
| | | |
Net change in unrealized gains (losses) included in net income relating to instruments held as of end of period | | $ | 111 | | | $ | 105 | | | $ | 87 | |
| | (a) | In 2008 and 2009, substantially all changes in values of commodity contracts are reported in the income statement in net gain from commodity hedging and trading activities. In 2010, net gains of $150 million are reported in net gain from commodity hedging and trading activities, and a gain of $116 million on the termination of a long-term power sales contract is reported in other income in the income statement. |
| | (b) | Settlements represent reversals of unrealized mark-to-market valuations of these positions previously recognized in net income. Purchases and issuances reflect option premiums paid or received. |
| | (c) | Includes transfers due to changes in the observability of significant inputs. For 2010, in accordance with new accounting guidance issued by the FASB in January 2010, transfers in and out occur at the end of each quarter, which is when the assessments are performed. Prior period transfers in were assumed to transfer in at the beginning of the quarter and transfers out at the end of the quarter. |
| 16. | FAIR VALUE OF NONDERIVATIVE FINANCIAL INSTRUMENTS |
The carrying amounts and related estimated fair values of significant nonderivative financial instruments as of December 31, 2010 and 2009 were as follows:
| | | | | | | | | | | | | | | | |
| | | December 31, 2010 | | | December 31, 2009 | |
| | | Carrying
Amount | | | Fair
Value (a) | | | Carrying
Amount | | | Fair
Value (a) | |
On balance sheet liabilities: | | | | | | | | | | | | | | | | |
Long-term debt (including current maturities) (b): | | | | | | | | | | | | | | | | |
TCEH, EFH Corp., and other | | $ | 34,815 | | | $ | 26,594 | | | $ | 36,600 | | | $ | 29,115 | |
Oncor (c) | | $ | — | | | $ | — | | | $ | 5,104 | | | $ | 5,644 | |
| | | | | | | | | | | | | | | | |
Total | | $ | 34,815 | | | $ | 26,594 | | | $ | 41,704 | | | $ | 34,759 | |
| | | | |
Off balance sheet liabilities: | | | | | | | | | | | | | | | | |
Financial guarantees | | $ | — | | | $ | 9 | | | $ | — | | | $ | 6 | |
| | (a) | Fair value determined in accordance with accounting standards related to the determination of fair value. |
| | (b) | Excludes capital leases. |
| | (c) | See Notes 1 and 3 for discussion of the deconsolidation of Oncor Holdings effective as of January 1, 2010. |
See Notes 15 and 17 for discussion of accounting for financial instruments that are derivatives.
169
| 17. | COMMODITY AND OTHER DERIVATIVE CONTRACTUAL ASSETS AND LIABILITIES |
Strategic Use of Derivatives
We enter into physical and financial derivative instruments, such as options, swaps, futures and forward contracts, primarily to manage commodity price risk and interest rate risk exposure. Our principal activities involving derivatives consist of a long-term commodity hedging program and the hedging of interest costs on our long-term debt. See Note 15 for a discussion of the fair value of all derivatives.
Long-Term Hedging Program —TCEH has a long-term hedging program designed to reduce exposure to changes in future electricity prices due to changes in the price of natural gas, thereby hedging future revenues from electricity sales and related cash flows. In ERCOT, the wholesale price of electricity is largely correlated to the price of natural gas. Under the program, TCEH has entered into market transactions involving natural gas-related financial instruments and has sold forward natural gas through 2014. These transactions are intended to hedge a majority of electricity price exposure related to expected baseload generation for this period. Changes in the fair value of the instruments under the long-term hedging program are reported in the income statement in net gain (loss) from commodity hedging and trading activities.
Interest Rate Swap Transactions — Interest rate swap agreements are used to reduce exposure to interest rate changes by converting floating-rate debt to fixed rates, thereby hedging future interest costs and related cash flows. Interest rate basis swaps are used to effectively reduce the hedged borrowing costs. Changes in the fair value of the swaps are recorded as unrealized gains and losses in interest expense and related charges. See Note 11 for additional information about interest rate swap agreements.
Other Commodity Hedging and Trading Activity —In addition to the long-term hedging program, TCEH enters into derivatives, including electricity, natural gas, fuel oil and coal instruments, generally for shorter-term hedging purposes. To a limited extent, TCEH also enters into derivative transactions for proprietary trading purposes, principally in natural gas and electricity markets.
Financial Statement Effects of Derivatives
Substantially all commodity and other derivative contractual assets and liabilities arise from mark-to-market accounting consistent with accounting standards related to derivative instruments and hedging activities. The following tables provide detail of commodity and other derivative contractual assets and liabilities (with the column totals representing the net positions of the contracts) as reported in the balance sheets as of December 31, 2010 and 2009:
| | | | | | | | | | | | | | | | | | | | |
December 31, 2010 | |
| | | Derivative assets | | | Derivative liabilities | | | | |
| | | Commodity
contracts | | | Interest rate
swaps | | | Commodity
contracts | | | Interest rate
swaps | | | Total | |
Current assets | | $ | 2,637 | | | $ | 95 | | | $ | — | | | $ | — | | | $ | 2,732 | |
Noncurrent assets | | | 2,068 | | | | 3 | | | | — | | | | — | | | | 2,071 | |
Current liabilities | | | (2 | ) | | | — | | | | (1,542 | ) | | | (739 | ) | | | (2,283 | ) |
Noncurrent liabilities | | | — | | | | — | | | | (64 | ) | | | (805 | ) | | | (869 | ) |
| | | | | | | | | | | | | | | | | | | | |
Net assets (liabilities) | | $ | 4,703 | | | $ | 98 | | | $ | (1,606 | ) | | $ | (1,544 | ) | | $ | 1,651 | |
| | | | | | | | | | | | | | | | | | | | |
170
| | | | | | | | | | | | | | | | | | | | |
December 31, 2009 | |
| | | Derivative assets | | | Derivative liabilities | | | | |
| | | Commodity
contracts | | | Interest rate
swaps | | | Commodity
contracts | | | Interest rate
swaps | | | Total | |
Current assets | | $ | 2,327 | | | $ | 60 | | | $ | 4 | | | $ | — | | | $ | 2,391 | |
Noncurrent assets | | | 1,529 | | | | 4 | | | | — | | | | — | | | | 1,533 | |
Current liabilities | | | — | | | | — | | | | (1,705 | ) | | | (687 | ) | | | (2,392 | ) |
Noncurrent liabilities | | | — | | | | — | | | | (441 | ) | | | (619 | ) | | | (1,060 | ) |
| | | | | | | | | | | | | | | | | | | | |
Net assets (liabilities) | | $ | 3,856 | | | $ | 64 | | | $ | (2,142 | ) | | $ | (1,306 | ) | | $ | 472 | |
| | | | | | | | | | | | | | | | | | | | |
As of December 31, 2010 and 2009, there were no derivative positions accounted for as cash flow or fair value hedges.
Margin deposits that contractually offset these derivative instruments are reported separately in the balance sheet and totaled $479 million and $358 million in net liabilities as of December 31, 2010 and 2009, respectively, which do not include the collateral investments related to certain interest rate swaps and commodity positions discussed immediately below. Reported amounts as presented in the above table do not reflect netting of assets and liabilities with the same counterparties under existing netting arrangements. This presentation can result in significant volatility in derivative assets and liabilities because we may enter into offsetting positions with the same counterparties, resulting in both assets and liabilities, and the underlying commodity prices can change significantly from period to period.
In 2009, we entered into collateral funding transactions with counterparties to certain interest rate swap agreements related to TCEH debt. Under the terms of these transactions, which we elected to enter into as a cash management measure, as of December 31, 2009, EFH Corp. (parent) had posted $400 million in cash and TCEH had posted $65 million in letters of credit to the counterparties, with the outstanding balance of such collateral earning interest. TCEH had also entered into commodity hedging transactions with one of these counterparties, and under an arrangement effective August 2009, both the interest rate swaps and certain of the commodity hedging transactions with the counterparty are under the same derivative agreement, which continues to be secured by a first-lien interest in the assets of TCEH. In accordance with the agreements, the counterparties returned the collateral, along with accrued interest, on March 31, 2010. As of December 31, 2009, the cash collateral was recorded as an investment and was presented in the balance sheet (including accrued interest) as a separate line item under current assets.
The following table presents the pre-tax effect on net income of derivatives not under hedge accounting, including realized and unrealized effects:
| | | | | | | | |
| | | Year Ended December 31, | |
Derivative (Income statement presentation) | | 2010 | | | 2009 | |
Commodity contracts (Net gain from commodity hedging and trading activities) | | $ | 2,162 | | | $ | 1,741 | |
Commodity contracts (Other income) (a) | | | 116 | | | | — | |
Interest rate swaps (Interest expense and related charges) | | | (880 | ) | | | 12 | |
| | | | | | | | |
Net gain | | $ | 1,398 | | | $ | 1,753 | |
| | | | | | | | |
| | (a) | Represents a gain on termination of a long-term power sales contract (see Note 9). |
Amounts reported in the income statement in net gain from commodity hedging and trading activities include net “day one” mark-to-market gains of $5 million in the year ended December 31, 2010 and net “day one” mark-to-market losses of $2 million and $68 million in the years ended December 31, 2009 and 2008, respectively. Substantially all of these losses arose from a related series of derivative transactions entered into under the long-term hedging program.
171
The following table presents the pre-tax effect on net income and other comprehensive income (OCI) of derivative instruments previously accounted for as cash flow hedges:
| | | | | | | | | | | | | | | | | | |
| | | Amount of loss
recognized in OCI
(effective portion) | | | Income statement presentation of loss reclassified | | | | | | |
| | | Year Ended December 31, | | | from accumulated OCI into income | | Year Ended December 31, | |
Derivative | | 2010 | | | 2009 | | | (effective portion) | | 2010 | | | 2009 | |
Interest rate swaps | | $ | — | | | $ | — | | | Interest expense and related charges | | $ | (87 | ) | | $ | (184 | ) |
| | | | | | | | | | Depreciation and amortization | | | (2 | ) | | | — | |
Commodity contracts | | | — | | | | (30 | ) | | Fuel, purchased power costs and delivery fees | | | — | | | | (16 | ) |
| | | | | | | | | | | | | | | | | | |
| | | | | | | | | | Operating revenues | | | (1 | ) | | | (2 | ) |
| | | | | | | | | | | | | | | | | | |
Total | | $ | — | | | $ | (30 | ) | | | | $ | (90 | ) | | $ | (202 | ) |
| | | | | | | | | | | | | | | | | | |
There were no transactions designated as cash flow hedges during the year ended December 31, 2010. There were no ineffectiveness net gains or losses related to transactions designated as cash flow hedges in the year ended December 31, 2009.
Accumulated other comprehensive income related to cash flow hedges as of December 31, 2010 and 2009 totaled $69 million and $128 million in net losses (after-tax), respectively, substantially all of which relates to interest rate swaps. We expect that $19 million of net losses related to cash flow hedges included in accumulated other comprehensive income as of December 31, 2010 will be reclassified into net income during the next twelve months as the related hedged transactions affect net income.
Derivative Volumes
The following table presents the gross notional amounts of derivative volumes as of December 31, 2010 and 2009:
| | | | | | | | | | | | |
| | | December 31, | | | | |
| | | 2010 | | | 2009 | | | | |
Derivative type | | Notional Volume | | | Unit of Measure | |
| | | |
Interest rate swaps: | | | | | | | | | | | | |
Floating/fixed | | $ | 17,500 | | | $ | 18,000 | | | | Million US dollars | |
Basis | | $ | 15,200 | | | $ | 16,250 | | | | Million US dollars | |
Natural gas: | | | | | | | | | | | | |
Long-term hedge forward sales and purchases (a) | | | 2,681 | | | | 3,402 | | | | Million MMBtu | |
Locational basis swaps | | | 1,092 | | | | 1,010 | | | | Million MMBtu | |
All other | | | 887 | | | | 1,433 | | | | Million MMBtu | |
Electricity | | | 143,776 | | | | 198,230 | | | | GWh | |
Congestion Revenue Rights (b) | | | 15,782 | | | | — | | | | GWh | |
Coal | | | 6 | | | | 6 | | | | Million tons | |
Fuel oil | | | 109 | | | | 161 | | | | Million gallons | |
| | (a) | Represents gross notional forward sales, purchases and options of fixed and basis (price point) transactions in the long-term hedging program. The net amount of these transactions, excluding basis transactions, was 1.0 billion MMBtu and 1.6 billion MMBtu as of December 31, 2010 and 2009, respectively. |
| | (b) | Represents gross forward sales and purchases associated with instruments used to hedge price differences between settlement points in the new nodal wholesale market design implemented by ERCOT. |
172
Credit Risk-Related Contingent Features of Derivatives
The agreements that govern our derivative instrument transactions may contain certain credit risk-related contingent features that could trigger liquidity requirements in the form of cash collateral, letters of credit or some other form of credit enhancement. Certain of those agreements require the posting of collateral if our credit rating is downgraded by one or more credit rating agency; however, due to our credit ratings being below investment grade, substantially all of such collateral posting requirements are already effective.
As of December 31, 2010 and 2009, the fair value of liabilities related to derivative instruments under agreements with credit risk-related contingent features that were not fully cash collateralized totaled $408 million and $687 million, respectively. The liquidity exposure associated with these liabilities was reduced by cash and letter of credit postings with the counterparties totaling $65 million and $152 million as of December 31, 2010 and 2009, respectively. If all the credit risk-related contingent features related to these derivatives had been triggered, including cross default provisions, as of December 31, 2010 and 2009, the remaining related liquidity requirement would have totaled $18 million and $20 million, respectively, after reduction for net accounts receivable and derivative assets under netting arrangements.
In addition, certain derivative agreements that are collateralized primarily with asset liens include indebtedness cross-default provisions that could result in the settlement of such contracts if there were a failure under other financing arrangements to meet payment terms or to comply with other covenants that could result in the acceleration of such indebtedness. As of December 31, 2010 and 2009, the fair value of derivative liabilities subject to such cross-default provisions, largely related to interest rate swaps, totaled $1.865 billion and $1.482 billion, respectively, (before consideration of the amount of assets under the liens). No cash collateral or letters of credit were posted with these counterparties as of December 31, 2010 to reduce the liquidity exposure, but $489 million of such collateral was posted as of December 31, 2009, with the decline reflecting the return of collateral from counterparties to certain interest rate swaps related to TCEH debt as discussed above in this note. If all the credit risk-related contingent features related to these derivatives, including amounts related to cross-default provisions, had been triggered as of December 31, 2010 and 2009, the remaining related liquidity requirement would have totaled $674 million and $480 million, respectively, after reduction for derivative assets under netting arrangements (before consideration of the amount of assets under the liens). See Note 11 for a description of other obligations that are supported by asset liens.
As discussed immediately above, the aggregate fair values of liabilities under derivative agreements with credit risk-related contingent features, including cross-default provisions, totaled $2.273 billion and $2.169 billion as of December 31, 2010 and 2009, respectively. This amount is before consideration of cash and letter of credit collateral posted, net accounts receivable and derivative assets under netting arrangements and assets under related liens.
Some commodity derivative contracts contain credit risk-related contingent features that do not provide for specific amounts to be posted if the features are triggered. These provisions include material adverse change, performance assurance, and other clauses that generally provide counterparties with the right to request additional credit enhancements. The amounts disclosed above exclude credit risk-related contingent features that do not provide for specific amounts or exposure calculations.
173
Concentrations of Credit Risk Related to Derivatives
TCEH has significant concentrations of credit risk with the counterparties to its derivative contracts. As of December 31, 2010, total credit risk exposure to all counterparties related to derivative contracts totaled $4.9 billion (including associated accounts receivable). The net exposure to those counterparties totaled $1.8 billion as of December 31, 2010 after taking into effect master netting arrangements, setoff provisions and collateral. The net exposure, assuming setoff provisions in the event of default across all EFH Corp. consolidated subsidiaries, totaled $1.6 billion. As of December 31, 2010, the credit risk exposure to the banking and financial sector represented 95% of the total credit risk exposure, a significant amount of which is related to the long-term hedging program, and the largest net exposure to a single counterparty totaled approximately $800 million. Exposure to the banking and financial sector counterparties is considered to be within an acceptable level of risk tolerance because substantially all of this exposure is with counterparties with credit ratings of “A” or better. However, this concentration increases the risk that a default by any of these counterparties would have a material adverse effect on our financial condition, results of operations and liquidity.
The transactions with these counterparties contain certain provisions that would require the counterparties to post collateral in the event of a material downgrade in their credit rating. We maintain credit risk policies with regard to our counterparties to minimize overall credit risk. These policies specify authorized risk mitigation tools including, but not limited to, use of standardized master netting contracts and agreements that allow for netting of positive and negative exposures associated with a single counterparty. Credit enhancements such as parent guarantees, letters of credit, surety bonds, liens on assets and margin deposits are also utilized. Prospective material adverse changes in the payment history or financial condition of a counterparty or downgrade of its credit quality result in the reassessment of the credit limit with that counterparty. The process can result in the subsequent reduction of the credit limit or a request for additional financial assurances. An event of default by one or more counterparties could subsequently result in termination-related settlement payments that reduce available liquidity if amounts are owed to the counterparties related to the derivative contracts or delays in receipts of expected settlements if the counterparties owe amounts to us.
174
The other investments balance consists of the following:
| | | | | | | | |
| | | December 31, | |
| | | 2010 | | | 2009 | |
Nuclear decommissioning trust | | $ | 536 | | | $ | 475 | |
Assets related to employee benefit plans, including employee savings programs, net of distributions (a) | | | 117 | | | | 184 | |
Land | | | 41 | | | | 43 | |
Miscellaneous other | | | 3 | | | | 4 | |
| | | | | | | | |
Total investments | | $ | 697 | | | $ | 706 | |
| | | | | | | | |
| (a) | See Notes 1 and 3 for discussion of the deconsolidation of Oncor Holdings effective as of January 1, 2010. |
Nuclear Decommissioning Trust
Investments in a trust that will be used to fund the costs to decommission the Comanche Peak nuclear generation plant are carried at fair value. Decommissioning costs are being recovered from Oncor’s customers as a delivery fee surcharge over the life of the plant and deposited in the trust fund. Net gains and losses on investments in the trust fund are offset by a corresponding change in receivables from/payables due to unconsolidated subsidiary, reflecting changes in Oncor’s regulatory asset/liability. A summary of investments in the fund follows:
| | | | | | | | | | | | | | | | |
| | | December 31, 2010 | |
| | | Cost (a) | | | Unrealized gain | | | Unrealized loss | | | Fair market value | |
Debt securities (b) | | $ | 221 | | | $ | 6 | | | $ | (4 | ) | | $ | 223 | |
Equity securities (c) | | | 213 | | | | 115 | | | | (15 | ) | | | 313 | |
| | | | | | | | | | | | | | | | |
Total | | $ | 434 | | | $ | 121 | | | $ | (19 | ) | | $ | 536 | |
| | | | | | | | | | | | | | | | |
| |
| | | December 31, 2009 | |
| | | Cost (a) | | | Unrealized gain | | | Unrealized loss | | | Fair market value | |
Debt securities (b) | | $ | 211 | | | $ | 8 | | | $ | (3 | ) | | $ | 216 | |
Equity securities (c) | | | 195 | | | | 83 | | | | (19 | ) | | | 259 | |
| | | | | | | | | | | | | | | | |
Total | | $ | 406 | | | $ | 91 | | | $ | (22 | ) | | $ | 475 | |
| | | | | | | | | | | | | | | | |
| (a) | Includes realized gains and losses of securities sold. |
| (b) | The investment objective for debt securities is to invest in a diversified tax efficient portfolio with an overall portfolio rating of AA or above as graded by S&P or Aa2 by Moody’s. The debt securities are heavily weighted with municipal bonds. The debt securities had an average coupon rate of 4.61% and 4.44% and an average maturity of 8.8 years and 7.8 years as of December 31, 2010 and 2009, respectively. |
| (c) | The investment objective for equity securities is to invest tax efficiently and to match the performance of the S&P 500 Index. |
Debt securities held as of December 31, 2010 mature as follows: $76 million in one to five years, $52 million in five to ten years and $95 million after ten years.
175
The following table summarizes proceeds from sales of available-for-sale securities and the related realized gains and losses from such sales.
| | | | | | | | | | | | |
| | | Year Ended December 31, | |
| | | 2010 | | | 2009 | | | 2008 | |
Realized gains | | $ | 1 | | | $ | 1 | | | $ | 1 | |
Realized losses | | | (2 | ) | | | (6 | ) | | | (4 | ) |
Proceeds from sale of securities | | | 974 | | | | 3,064 | | | | 1,623 | |
Assets Related to Employee Benefit Plans
The majority of these assets represent cash surrender values of life insurance policies that are purchased to fund liabilities under deferred compensation plans. We pay the premiums and are the beneficiary of these life insurance policies. As of December 31, 2010 and 2009, the face amount of these policies totaled $175 million and $322 million, and the net cash surrender values totaled $68 million and $124 million, respectively. Changes in cash surrender value are netted against premiums paid. Other investment assets held to satisfy deferred compensation liabilities are recorded at fair value.
176
| 19. | TERMINATION OF OUTSOURCING ARRANGEMENTS |
In connection with the closing of the Merger, EFH Corp., TCEH and Oncor commenced a review, under the change of control provision, of certain outsourcing arrangements with Capgemini, Capgemini America, Inc. and Capgemini North America, Inc. (collectively, CgE). In 2008, EFH Corp. and TCEH executed a Separation Agreement with CgE. Simultaneous with the execution of that Separation Agreement, Oncor entered into a substantially similar Separation Agreement with CgE. The Separation Agreements principally provide for (i) notice of termination of each of the Master Framework Agreements, dated as of May 17, 2004, as each has been amended, between Capgemini and each of TCEH and Oncor and the related service agreements under each of the Master Framework Agreements and (ii) termination of the joint venture arrangements between EFH Corp. (and its applicable subsidiaries) and CgE. Under the Master Framework Agreements and related services agreements, Capgemini provided outsourced support services, including information technology, customer care and billing, human resources, procurement and certain finance and accounting activities. As a result, during 2008:
| | • | | the 2.9% limited partnership interest in Capgemini owned by a subsidiary of EFH Corp. was redeemed in exchange for the termination of the license that was granted by a subsidiary of EFH Corp. to Capgemini at the time the Master Framework Agreements were executed in order for Capgemini to use certain information technology assets primarily consisting of capitalized software to provide services to us and third parties; |
| | • | | we received approximately $70 million in exchange for the termination of a purchase option agreement pursuant to which our subsidiaries had the right to “put” to Capgemini (and Capgemini had the right to “call” from a subsidiary of ours) our 2.9% limited partnership interest in Capgemini and the licensed assets upon the expiration of the Master Framework Agreements in 2014 or, in some circumstances, earlier, and |
| | • | | Capgemini repaid $25 million (plus accrued interest) representing all amounts owed by Capgemini under the working capital loan provided by us in July 2004. |
Under the Separation Agreements, the parties also entered into a mutual release of all claims under the Master Framework Agreements and related services agreements and the joint venture agreements, subject to certain defined exceptions, resulting in our receipt of $10 million in cash settlement.
The carrying value of the partnership interest was $2.9 million, and the carrying value of the purchase option was $177 million prior to the application of purchase accounting (recorded as a noncurrent asset). The effects of the termination of the outsourcing arrangements, including an accrued liability of $54 million for incremental costs to exit and transition the services, were included in the final purchase price allocation.
The following table summarizes the changes to the exit liability:
| | | | | | | | | | | | |
| | | Competitive
Electric
segment | | | Regulated
Delivery
segment | | | Total | |
Liability for exit activities as of January 1, 2009 | | $ | 38 | | | $ | 16 | | | $ | 54 | |
Payments recorded against liability | | | (24 | ) | | | (4 | ) | | | (28 | ) |
Other adjustments to the liability (a) | | | (11 | ) | | | (10 | ) | | | (21 | ) |
| | | | | | | | | | | | |
Liability for exit activities as of December 31, 2009 | | $ | 3 | | | $ | 2 | | | $ | 5 | |
| | | | | | | | | | | | |
Payments recorded against liability | | | (1 | ) | | | (2 | ) | | | (3 | ) |
Other adjustments to the liability (a) | | | (2 | ) | | | — | | | | (2 | ) |
| | | | | | | | | | | | |
Liability for exit activities as of December 31, 2010 | | $ | — | | | $ | — | | | $ | — | |
| | | | | | | | | | | | |
| | (a) | Represents reversal of exit liabilities due primarily to a shorter than expected outsourcing services transition period. |
177
| 20. | PENSION AND OTHER POSTRETIREMENT EMPLOYEE BENEFITS (OPEB) PLANS |
EFH Corp. is the plan sponsor of the EFH Retirement Plan (Retirement Plan), which provides benefits to eligible employees of subsidiaries (participating employers). The Retirement Plan is a qualified defined benefit pension plan under Section 401(a) of the Internal Revenue Code of 1986, as amended (Code), and is subject to the provisions of ERISA. The Retirement Plan provides benefits to participants under one of two formulas: (i) a Cash Balance Formula under which participants earn monthly contribution credits based on their compensation and a combination of their age and years of service, plus monthly interest credits or (ii) a Traditional Retirement Plan Formula based on years of service and the average earnings of the three years of highest earnings. The interest component of the Cash Balance Formula is variable and is determined using the yield on 30-year Treasury bonds. Under the Cash Balance Formula, future increases in earnings will not apply to prior service costs.
Effective October 1, 2007, all new employees, with the exception of employees hired by Oncor, are not eligible to participate in the Retirement Plan. New hires at Oncor are eligible to participate in the Cash Balance Formula of the Retirement Plan. It is our policy to fund the plans on a current basis to the extent deductible under existing federal tax regulations.
We also have supplemental unfunded retirement plans for certain employees whose retirement benefits cannot fully be earned under the qualified Retirement Plan, the information for which is included below.
We offer OPEB in the form of health care and life insurance to eligible employees and their eligible dependents upon the retirement of such employees. For employees retiring on or after January 1, 2002, the retiree contributions required for such coverage vary based on a formula depending on the retiree’s age and years of service.
Regulatory Recovery of Pension and OPEB Costs
PURA provides for the recovery by Oncor of pension and OPEB costs for all applicable former employees of the regulated predecessor integrated electric utility, which in addition to Oncor’s own employees consists largely of active and retired personnel engaged in TCEH’s activities, related to service of those additional personnel prior to the deregulation and disaggregation of our businesses effective January 1, 2002. Oncor is authorized to establish a regulatory asset or liability for the difference between the amounts of pension and OPEB costs approved in current billing rates and the actual amounts that would otherwise have been recorded as charges or credits to earnings. Amounts deferred are ultimately subject to regulatory approval. As of December 31, 2010 and 2009, Oncor had recorded regulatory assets totaling $1.048 billion and $889 million, respectively, related to pension and OPEB costs, including amounts related to deferred expenses as well as amounts related to unfunded liabilities that otherwise would be recorded as other comprehensive income.
Pension and OPEB Costs Recognized as Expense
| | | | | | | | | | | | |
| | | Year Ended December 31, | |
| | | 2010 | | | 2009 | | | 2008 | |
Pension costs | | $ | 100 | | | $ | 44 | | | $ | 21 | |
OPEB costs | | | 80 | | | | 70 | | | | 58 | |
| | | | | | | | | | | | |
Total benefit costs | | $ | 180 | | | $ | 114 | | | $ | 79 | |
| | | |
Less amounts expensed by Oncor (and not consolidated) | | | (37 | ) | | | — | | | | — | |
Less amounts deferred principally as a regulatory asset or property by Oncor | | | (93 | ) | | | (66 | ) | | | (42 | ) |
| | | | | | | | | | | | |
Net amounts recognized as expense by EFH Corp. and consolidated subsidiaries | | $ | 50 | | | $ | 48 | | | $ | 37 | |
| | | | | | | | | | | | |
178
We use the calculated value method to determine the market-related value of the assets held in trust. We include the realized and unrealized gains or losses in the market-related value of assets over a rolling four-year period. Each year, 25% of such gains and losses for the current year and for each of the preceding three years is included in the market-related value. Each year, the market-related value of assets is increased for contributions to the plan and investment income and is decreased for benefit payments and expenses for that year.
Detailed Information Regarding Pension Benefits
The following information is based on December 31, 2010, 2009 and 2008 measurement dates:
| | | | | | | | | | | | |
| | | Year Ended December 31, | |
| | | 2010 | | | 2009 | | | 2008 | |
Assumptions Used to Determine Net Periodic Pension Cost: | | | | | | | | | | | | |
Discount rate | | | 5.90 | % | | | 6.90 | % | | | 6.55 | % |
Expected return on plan assets | | | 8.00 | % | | | 8.25 | % | | | 8.25 | % |
Rate of compensation increase | | | 3.71 | % | | | 3.75 | % | | | 3.70 | % |
| | | |
Components of Net Pension Cost: | | | | | | | | | | | | |
Service cost | | $ | 42 | | | $ | 38 | | | $ | 36 | |
Interest cost | | | 160 | | | | 159 | | | | 148 | |
Expected return on assets | | | (160 | ) | | | (166 | ) | | | (165 | ) |
Amortization of prior service cost | | | 1 | | | | 1 | | | | 1 | |
Amortization of net loss | | | 57 | | | | 12 | | | | 1 | |
Recognized curtailment loss | | | — | | | | — | | | | — | |
| | | | | | | | | | | | |
Net periodic pension cost | | $ | 100 | | | $ | 44 | | | $ | 21 | |
| | | | | | | | | | | | |
| | | |
Other Changes in Plan Assets and Benefit Obligations Recognized in Other Comprehensive Income: | | | | | | | | | | | | |
Net loss | | $ | 27 | | | $ | 45 | | | $ | 204 | |
Amortization of net gain | | | (19 | ) | | | — | | | | — | |
Reclassification to regulatory asset | | | — | | | | — | | | | (6 | ) |
Purchase accounting adjustment | | | — | | | | — | | | | (10 | ) |
| | | | | | | | | | | | |
Total loss (income) recognized in other comprehensive income | | $ | 8 | | | $ | 45 | | | $ | 188 | |
| | | | | | | | | | | | |
Total recognized in net periodic benefit cost and other comprehensive income | | $ | 108 | | | $ | 89 | | | $ | 209 | |
| | | | | | | | | | | | |
| |
| | | Year Ended December 31, | |
| | | 2010 | | | 2009 | | | 2008 | |
Assumptions Used to Determine Benefit Obligations: | | | | | | | | | | | | |
Discount rate | | | 5.50 | % | | | 5.90 | % | | | 6.90 | % |
Rate of compensation increase | | | 3.74 | % | | | 3.71 | % | | | 3.75 | % |
179
| | | | | | | | |
| | | Year Ended December 31, | |
| | | 2010 | | | 2009 | |
Change in Pension Obligation: | | | | | | | | |
Projected benefit obligation as of beginning of year | | $ | 2,742 | | | $ | 2,337 | |
Service cost | | | 42 | | | | 38 | |
Interest cost | | | 160 | | | | 160 | |
Actuarial loss | | | 253 | | | | 326 | |
Benefits paid | | | (125 | ) | | | (133 | ) |
Settlements | | | — | | | | 14 | |
| | | | | | | | |
Projected benefit obligation as of end of year | | $ | 3,072 | | | $ | 2,742 | |
| | | | | | | | |
Accumulated benefit obligation as of end of year | | $ | 2,863 | | | $ | 2,581 | |
| | | | | | | | |
| | |
Change in Plan Assets: | | | | | | | | |
Fair value of assets as of beginning of year | | $ | 2,004 | | | $ | 1,736 | |
Actual return on assets | | | 261 | | | | 292 | |
Employer contributions (a) | | | 45 | | | | 109 | |
Benefits paid | | | (125 | ) | | | (133 | ) |
| | | | | | | | |
Fair value of assets as of end of year | | $ | 2,185 | | | $ | 2,004 | |
| | | | | | | | |
| | |
Funded Status: | | | | | | | | |
Projected pension benefit obligation | | $ | (3,072 | ) | | $ | (2,742 | ) |
Fair value of assets | | | 2,185 | | | | 2,004 | |
| | | | | | | | |
Funded status as of end of year | | $ | (887 | ) | | $ | (738 | ) |
| | | | | | | | |
| |
| | | Year Ended December 31, | |
| | | 2010 | | | 2009 | |
Amounts Recognized in the Balance Sheet Consist of: | | | | | | | | |
Other noncurrent assets (b) | | $ | 10 | | | $ | 10 | |
Other current liabilities | | | (5 | ) | | | (4 | ) |
Other noncurrent liabilities | | | (892 | ) | | | (744 | ) |
| | | | | | | | |
Net liability recognized | | $ | (887 | ) | | $ | (738 | ) |
| | | | | | | | |
Amounts Recognized in Accumulated Other Comprehensive Income Income Consist of: | | | | | | | | |
Net loss | | $ | 261 | | | $ | 252 | |
| | | | | | | | |
| | |
Amounts Recognized by Oncor as Regulatory Assets Consist of (c): | | | | | | | | |
Net loss | | $ | 616 | | | $ | 529 | |
Prior service cost | | | — | | | | 1 | |
| | | | | | | | |
Net amount recognized | | $ | 616 | | | $ | 530 | |
| | | | | | | | |
| (a) | 2009 amount included transfers of investments related to the salary deferral and supplemental retirement plans totaling $31 million. |
| (b) | Amounts represent overfunded plans. |
| (c) | Amounts are reflected by EFH Corp. in receivables from unconsolidated subsidiary. |
180
The following table provides information regarding pension plans with projected benefit obligation (PBO) and accumulated benefit obligation (ABO) in excess of the fair value of plan assets.
| | | | | | | | |
| | | December 31, | |
| | | 2010 | | | 2009 | |
Pension Plans with PBO and ABO in Excess Of Plan Assets: | | | | | | | | |
Projected benefit obligations | | $ | 3,067 | | | $ | 2,738 | |
Accumulated benefit obligation | | | 2,858 | | | | 2,577 | |
Plan assets | | | 2,170 | | | | 1,989 | |
Pension Plan Investment Strategy and Asset Allocations
Our investment objective for the Retirement Plan is to invest in a suitable mix of assets to meet the future benefit obligations at an acceptable level of risk, while minimizing the volatility of contributions. Equity securities are held to achieve returns in excess of passive indexes by participating in a wide range of investment opportunities. International equity securities are used to further diversify the equity portfolio and may include investments in both developed and emerging international markets. Fixed income securities include primarily corporate bonds from a diversified range of companies, US Treasuries and agency securities and money market instruments. Our investment strategy for fixed income investments is to maintain a high grade portfolio of securities which assist us in managing the volatility and magnitude of plan contributions and expense while maintaining sufficient cash and short-term investments to pay near-term benefits and expenses.
The target asset allocation ranges of pension plan investments by asset category are as follows:
| | |
Asset Category | | Target
Allocation
Ranges |
US equities | | 15% - 50% |
International equities | | 5% - 20% |
Fixed income | | 40% - 70% |
Other | | 0% - 10% |
Fair Value Measurement of Pension Plan Assets
As of December 31, 2010, pension plan assets measured at fair value (see Note 15) on a recurring basis consisted of the following:
| | | | | | | | | | | | | | | | |
Asset Category | | Level 1 | | | Level 2 | | | Level 3 | | | Total | |
Interest-bearing cash | | $ | — | | | $ | 69 | | | $ | — | | | $ | 69 | |
Equity securities: | | | | | | | | | | | | | | | | |
US | | | 422 | | | | 94 | | | | — | | | | 516 | |
International | | | 248 | | | | 84 | | | | — | | | | 332 | |
Fixed income securities: | | | | | | | | | | | | | | | | |
Corporate bonds (a) | | | — | | | | 1,137 | | | | — | | | | 1,137 | |
US Treasuries | | | — | | | | 21 | | | | — | | | | 21 | |
Other (b) | | | — | | | | 96 | | | | — | | | | 96 | |
Preferred securities | | | — | | | | — | | | | 14 | | | | 14 | |
| | | | | | | | | | | | | | | | |
Total assets | | $ | 670 | | | $ | 1,501 | | | $ | 14 | | | $ | 2,185 | |
| | | | | | | | | | | | | | | | |
| | (a) | Substantially all corporate bonds are rated investment grade by a major ratings agency such as Moody’s. |
| | (b) | Other consists primarily of US agency securities. |
181
As of December 31, 2009, pension plan assets measured at fair value on a recurring basis consisted of the following:
| | | | | | | | | | | | | | | | |
Asset Category | | Level 1 | | | Level 2 | | | Level 3 | | | Total | |
Interest-bearing cash | | $ | — | | | $ | 99 | | | $ | — | | | $ | 99 | |
Equity securities: | | | | | | | | | | | | | | | | |
US | | | 340 | | | | 242 | | | | — | | | | 582 | |
International | | | 257 | | | | 79 | | | | — | | | | 336 | |
Fixed income securities: | | | | | | | | | | | | | | | | |
Corporate bonds (a) | | | — | | | | 908 | | | | — | | | | 908 | |
US Treasuries | | | — | | | | 21 | | | | — | | | | 21 | |
Other (b) | | | — | | | | 44 | | | | — | | | | 44 | |
Preferred securities | | | — | | | | — | | | | 14 | | | | 14 | |
| | | | | | | | | | | | | | | | |
Total assets | | $ | 597 | | | $ | 1,393 | | | $ | 14 | | | $ | 2,004 | |
| | | | | | | | | | | | | | | | |
| | (a) | Substantially all corporate bonds are rated investment grade by a major ratings agency such as Moody’s. |
| | (b) | Other consists primarily of US agency securities. |
There was no significant change in the fair values of Level 3 assets in the periods presented.
182
Detailed Information Regarding Postretirement Benefits Other Than Pensions
The following OPEB information is based on December 31, 2010, 2009 and 2008 measurement dates:
| | | | | | | | | | | | |
| | | Year Ended December 31, | |
| | | 2010 | | | 2009 | | | 2008 | |
Assumptions Used to Determine Net Periodic Benefit Cost: | | | | | | | | | | | | |
Discount rate | | | 5.90 | % | | | 6.85 | % | | | 6.55 | % |
Expected return on plan assets | | | 7.60 | % | | | 7.64 | % | | | 7.90 | % |
| | | |
Components of Net Postretirement Benefit Cost: | | | | | | | | | | | | |
Service cost | | $ | 13 | | | $ | 10 | | | $ | 10 | |
Interest cost | | | 61 | | | | 61 | | | | 59 | |
Expected return on assets | | | (15 | ) | | | (13 | ) | | | (20 | ) |
Amortization of net transition obligation | | | 1 | | | | 1 | | | | 1 | |
Amortization of prior service cost/(credit) | | | (1 | ) | | | (1 | ) | | | (1 | ) |
Amortization of net loss | | | 21 | | | | 12 | | | | 9 | |
| | | | | | | | | | | | |
Net periodic OPEB cost | | $ | 80 | | | $ | 70 | | | $ | 58 | |
| | | | | | | | | | | | |
| | | |
Other Changes in Plan Assets and Benefit Obligations Recognized in Other Comprehensive Income: | | | | | | | | | | | | |
Net loss | | $ | 14 | | | $ | 15 | | | $ | 1 | |
Amortization of net gain | | | (1 | ) | | | — | | | | — | |
Reclassification to regulatory asset | | | — | | | | — | | | | (28 | ) |
Purchase accounting adjustment | | | — | | | | — | | | | (1 | ) |
| | | | | | | | | | | | |
Total loss (income) recognized in other comprehensive income | | $ | 13 | | | $ | 15 | | | $ | (28 | ) |
| | | | | | | | | | | | |
Total recognized in net periodic benefit cost and other comprehensive income | | $ | 93 | | | $ | 85 | | | $ | 30 | |
| | | | | | | | | | | | |
| |
| | | Year Ended December 31, | |
| | | 2010 | | | 2009 | | | 2008 | |
Assumptions Used to Determine Benefit Obligations at Period End: | | | | | | | | | | | | |
Discount rate | | | 5.55 | % | | | 5.90 | % | | | 6.85 | % |
183
| | | | | | | | |
| | | Year Ended December 31, | |
| | | 2010 | | | 2009 | |
Change in Postretirement Benefit Obligation: | | | | | | | | |
Benefit obligation as of beginning of year | | $ | 1,063 | | | $ | 919 | |
Service cost | | | 13 | | | | 10 | |
Interest cost | | | 61 | | | | 61 | |
Participant contributions | | | 17 | | | | 23 | |
Medicare Part D reimbursement | | | 4 | | | | 6 | |
Actuarial loss | | | 98 | | | | 108 | |
Benefits paid | | | (65 | ) | | | (64 | ) |
| | | | | | | | |
Benefit obligation as of end of year | | $ | 1,191 | | | $ | 1,063 | |
| | | | | | | | |
| | |
Change in Plan Assets: | | | | | | | | |
Fair value of assets as of beginning of year | | $ | 211 | | | $ | 198 | |
Actual return on assets | | | 24 | | | | 32 | |
Employer contributions | | | 24 | | | | 22 | |
Participant contributions | | | 17 | | | | 23 | |
Benefits paid | | | (65 | ) | | | (64 | ) |
| | | | | | | | |
Fair value of assets as of end of year | | $ | 211 | | | $ | 211 | |
| | | | | | | | |
| | |
Funded Status: | | | | | | | | |
Benefit obligation | | $ | (1,191 | ) | | $ | (1,063 | ) |
Fair value of assets | | | 211 | | | | 211 | |
| | | | | | | | |
Funded status as of end of year | | $ | (980 | ) | | $ | (852 | ) |
| | | | | | | | |
| |
| | | Year Ended December 31, | |
| | | 2010 | | | 2009 | |
Amounts Recognized on the Balance Sheet Consist of: | | | | | | | | |
Other noncurrent liabilities | | $ | (980 | ) | | $ | (852 | ) |
| | | | | | | | |
Amounts Recognized in Accumulated Other Comprehensive Income Consist of: | | | | | | | | |
Net loss | | $ | 36 | | | $ | 23 | |
| | | | | | | | |
Amounts Recognized by Oncor as Regulatory Assets Consist of (a): | | | | | | | | |
Net loss | | $ | 296 | | | $ | 242 | |
Prior service cost credit | | | (5 | ) | | | (7 | ) |
Net transition obligation | | | 3 | | | | 4 | |
| | | | | | | | |
Net amount recognized | | $ | 294 | | | $ | 239 | |
| | | | | | | | |
| (a) | Amounts are reflected by EFH Corp. in receivables from unconsolidated subsidiary. |
184
The following tables provide information regarding the assumed health care cost trend rates.
| | | | | | | | |
| | | December 31, | |
| | | 2010 | | | 2009 | |
Assumed Health Care Cost Trend Rates-Not Medicare Eligible : | | | | | | | | |
| | |
Health care cost trend rate assumed for next year | | | 9.00 | % | | | 8.00 | % |
Rate to which the cost trend is expected to decline (the ultimate trend rate) | | | 5.00 | % | | | 5.00 | % |
Year that the rate reaches the ultimate trend rate | | | 2021 | | | | 2016 | |
| | |
Assumed Health Care Cost Trend Rates-Medicare Eligible : | | | | | | | | |
| | |
Health care cost trend rate assumed for next year | | | 8.00 | % | | | 7.00 | % |
Rate to which the cost trend is expected to decline (the ultimate trend rate) | | | 5.00 | % | | | 5.00 | % |
Year that the rate reaches the ultimate trend rate | | | 2021 | | | | 2016 | |
| | |
| | | 1-Percentage Point
Increase | | | 1-Percentage Point
Decrease | |
Sensitivity Analysis of Assumed Health Care Cost Trend Rates : | | | | | | | | |
Effect on accumulated postretirement obligation | | $ | 156 | | | $ | (131 | ) |
Effect on postretirement benefits cost | | | 12 | | | | (10 | ) |
OPEB Plan Investment Strategy and Asset Allocations
Our investment objective for the OPEB plan primarily follows the objectives of the Retirement Plan discussed above, while maintaining sufficient cash and short-term investments to pay near-term benefits and expenses. The actual amounts as of December 31, 2010 provided below are consistent with the Company’s asset allocation targets.
185
Fair Value Measurement of OPEB Plan Assets
As of December 31, 2010, OPEB plan assets measured at fair value on a recurring basis consisted of the following:
| | | | | | | | | | | | | | | | |
Asset Category | | Level 1 | | | Level 2 | | | Level 3 | | | Total | |
Interest-bearing cash | | $ | — | | | $ | 11 | | | $ | — | | | $ | 11 | |
Equity securities: | | | | | | | | | | | | | | | | |
US | | | 62 | | | | 4 | | | | — | | | | 66 | |
International | | | 27 | | | | 4 | | | | — | | | | 31 | |
Fixed income securities: | | | | | | | | | | | | | | | | |
Corporate bonds (a) | | | — | | | | 55 | | | | — | | | | 55 | |
US Treasuries | | | — | | | | 1 | | | | — | | | | 1 | |
Other (b) | | | 42 | | | | 4 | | | | — | | | | 46 | |
Preferred securities | | | — | | | | — | | | | 1 | | | | 1 | |
| | | | | | | | | | | | | | | | |
Total assets | | $ | 131 | | | $ | 79 | | | $ | 1 | | | $ | 211 | |
| | | | | | | | | | | | | | | | |
| | (a) | Substantially all corporate bonds are rated investment grade by a major ratings agency such as Moody’s. |
| | (b) | Other consists primarily of US agency securities. |
As of December 31, 2009, OPEB plan assets measured at fair value on a recurring basis consisted of the following:
| | | | | | | | | | | | | | | | |
Asset Category | | Level 1 | | | Level 2 | | | Level 3 | | | Total | |
Interest-bearing cash | | $ | — | | | $ | 18 | | | $ | — | | | $ | 18 | |
Equity securities: | | | | | | | | | | | | | | | | |
US | | | 56 | | | | 13 | | | | — | | | | 69 | |
International | | | 27 | | | | 4 | | | | — | | | | 31 | |
Fixed income securities: | | | | | | | | | | | | | | | | |
Corporate bonds (a) | | | — | | | | 50 | | | | — | | | | 50 | |
US Treasuries | | | — | | | | 1 | | | | — | | | | 1 | |
Other (b) | | | 39 | | | | 2 | | | | — | | | | 41 | |
Preferred securities | | | — | | | | — | | | | 1 | | | | 1 | |
| | | | | | | | | | | | | | | | |
Total assets | | $ | 122 | | | $ | 88 | | | $ | 1 | | | $ | 211 | |
| | | | | | | | | | | | | | | | |
| | (a) | Substantially all corporate bonds are rated investment grade by a major ratings agency such as Moody’s. |
| | (b) | Other consists primarily of US agency securities. |
There was no significant change in the fair values of Level 3 assets in the periods presented.
186
Expected Long-Term Rate of Return on Assets Assumption
The Retirement Plan strategic asset allocation is determined in conjunction with the plan’s advisors and utilizes a comprehensive Asset-Liability modeling approach to evaluate potential long-term outcomes of various investment strategies. The study incorporates long-term rate of return assumptions for each asset class based on historical and future expected asset class returns, current market conditions, rate of inflation, current prospects for economic growth, and taking into account the diversification benefits of investing in multiple asset classes and potential benefits of employing active investment management.
| | | | |
Retirement Plan | |
Asset Class | | Expected Long-Term
Rate of Return | |
US equity securities | | | 8.4 | % |
International equity securities | | | 8.8 | % |
Fixed income securities | | | 5.9 | % |
Preferred securities | | | 0.0 | % |
| | | | |
| | | 7.7 | % |
| | | | |
OPEB Plan | |
Plan Type | | Expected Long-Term
Returns | |
401(h) accounts | | | 7.7 | % |
Life Insurance VEBA | | | 6.7 | % |
Union VEBA | | | 6.7 | % |
Non-Union VEBA | | | 2.9 | % |
| | | | |
| | | 7.1 | % |
Significant Concentrations of Risk
The plans’ investments are exposed to risks such as interest rate, capital market and credit risks. We seek to optimize return on investment consistent with levels of liquidity and investment risk which are prudent and reasonable, given prevailing capital market conditions and other factors specific to us. While we recognize the importance of return, investments will be diversified in order to minimize the risk of large losses unless, under the circumstances, it is clearly prudent not to do so. There are also various restrictions and guidelines in place including limitations on types of investments allowed and portfolio weightings for certain investment securities to assist in the mitigation of the risk of large losses.
Assumed Discount Rate
We selected the assumed discount rate using the Hewitt Top Quartile yield curve, which is based on actual corporate bond yields and as of December 31, 2010 consisted of 141 corporate bonds rated AA or higher as reported by either Moody’s or S&P.
Amortization in 2011
In 2011, we estimate amortization of the net actuarial loss and prior service cost for the defined benefit pension plan from accumulated other comprehensive income into net periodic benefit cost will be $92 million and $1 million, respectively. We estimate amortization of the net actuarial loss, prior service credit, and transition obligation for the OPEB plan from accumulated other comprehensive income into net periodic benefit cost will be $29 million, a $1 million credit and $1 million, respectively.
Contributions in 2011 and 2010
Estimated funding for calendar year 2011 totals $175 million for the Retirement Plan and $26 million for the OPEB plan. We made pension and OPEB contributions of $45 million and $25 million, respectively, in 2010, of which $58 million was contributed by Oncor.
187
Future Benefit Payments
Estimated future benefit payments to beneficiaries are as follows:
| | | | | | | | | | | | | | | | | | | | | | | | |
| | | 2011 | | | 2012 | | | 2013 | | | 2014 | | | 2015 | | | 2016-20 | |
Pension benefits | | $ | 144 | | | $ | 153 | | | $ | 164 | | | $ | 169 | | | $ | 179 | | | $ | 1,070 | |
OPEB | | $ | 62 | | | $ | 65 | | | $ | 62 | | | $ | 66 | | | $ | 70 | | | $ | 404 | |
Medicare Part D subsidies | | $ | (7 | ) | | $ | (7 | ) | | $ | (8 | ) | | $ | (8 | ) | | $ | (9 | ) | | $ | (52 | ) |
Thrift Plan
Our employees may participate in a qualified savings plan (the Thrift Plan). This plan is a participant-directed defined contribution plan intended to qualify under Section 401(a) of the Code, and is subject to the provisions of ERISA. Under the terms of the Thrift Plan, employees who do not earn more than the IRS threshold compensation limit used to determine highly compensated employees may contribute, through pre-tax salary deferrals and/or after-tax payroll deductions, the lesser of 75% of their regular salary or wages or the maximum amount permitted under applicable law. Employees who earn more than such threshold may contribute from 1% to 16% of their regular salary or wages. Employer matching contributions are also made in an amount equal to 100% of the first 6% of employee contributions for employees who are covered under the Cash Balance Formula of the Retirement Plan, and 75% of the first 6% of employee contributions for employees who are covered under the Traditional Retirement Plan Formula of the Retirement Plan. Employer matching contributions are made in cash and may be allocated by participants to any of the plan’s investment options. Our contributions to the Thrift Plan totaled $19 million, $28 million and $25 million in the years ended December 31, 2010, 2009 and 2008, respectively.
188
| 21. | STOCK-BASED COMPENSATION |
EFH Corp. 2007 Stock Incentive Plan
In December 2007, we established the 2007 Stock Incentive Plan for Key Employees of EFH Corp. and its Affiliates (2007 SIP). Incentive awards under the 2007 SIP may be granted to directors and officers and qualified managerial employees of EFH Corp. or its subsidiaries or affiliates in the form of non-qualified stock options, stock appreciation rights, restricted shares, deferred shares, shares of common stock, the opportunity to purchase shares of common stock and other awards that are valued in whole or in part by reference to, or are otherwise based on the fair market value of EFH Corp.’s shares of common stock. The 2007 SIP permits the grant of awards for 72 million shares of common stock, subject to adjustments under applicable laws for certain events, such as a change in control, and no such grants may be issued after December 26, 2017. Shares related to grants that are forfeited, terminated, cancelled, expire unexercised, withheld to satisfy tax withholding obligations, or are repurchased by the Company are available for new grants under the 2007 SIP.
Stock Options— Under the terms of the 2007 SIP, options to purchase 3.8 million, 14.7 million and 33.1 million shares of EFH Corp. common stock were granted to certain management employees in 2010, 2009 and 2008, respectively. Of the options granted in 2010 and 2009, 1.6 million and 9.2 million, respectively, were granted in exchange for previously granted options. Vested awards must be exercised within 10 years of the grant date. The options initially provided the holder the right to purchase EFH Corp. common stock for $5.00 per share. The terms of the options were fixed at grant date. The stock option awards under the 2007 SIP consist of three types of stock options. One-half of the options initially granted vest solely based upon continued employment over a specific period of time, generally five years, with the options vesting ratably on an annual basis over the period (Time-Based Options). One-half of the options initially granted vest based upon both continued employment and the achievement of targeted five-year EFH Corp. EBITDA levels (Performance-Based Options). The Performance-Based Options may also vest in part or in full upon the occurrence of certain specified liquidity events. All options remain exercisable for ten years from the date of grant. Prior to vesting, expenses are recorded if the achievement of the EBITDA levels is probable, and amounts recorded are adjusted or reversed if the probability of achievement of such levels changes. Probability of vesting is evaluated at least each quarter.
In October 2009, in consideration of the recent economic dislocation and the desire to provide incentives for retention, grantees of Performance-Based Options (excluding named executive officers and a small group of other employees) were provided an offer, which substantially all accepted, to exchange their unvested Performance-Based Options granted under the 2007 SIP with a strike price of $5.00 per share and a vesting schedule through October 2012 for new time-based stock options (Cliff-Vesting Options) granted under the 2007 SIP with a strike price of $3.50 per share (the then most recent market valuation of each share), with one-half of these options vesting in September 2012 and one-half of these options vesting in September 2014. Additionally, 3.1 million Cliff-Vesting Options were granted to certain named executive officers and a small group of other employees under the 2007 SIP with a strike price of $3.50 per share, vesting in September 2014. Substantially all of this group of employees also accepted an offer to exchange half of their unvested Performance-Based Options under the 2007 SIP with a strike price of $5.00 per share and a vesting schedule through December 2012 for new time-based stock options granted under the 2007 SIP with a strike price of $3.50 per share, vesting in September 2014.
In December 2010, in consideration of the desire to enhance retention incentives, EFH Corp. offered employee grantees of all stock options (excluding named executive officers and a limited number of other employees) the right to exchange their vested and unvested options for restricted stock units (at a ratio of two options for each stock unit). The restricted stock units vest as common shares of EFH Corp. in September 2014. The exchange offer is expected to close in late February 2011.
The fair value of all options granted was estimated using the Black-Scholes option pricing model and the assumptions noted in the table below. Since EFH Corp. is a private company, expected volatility is based on actual historical experience of comparable publicly-traded companies for a term corresponding to the expected life of the options. The expected life represents the period of time that options granted are expected to be outstanding and is calculated using the simplified method prescribed by the SEC Staff Accounting Bulletin No. 107. The simplified method was used since EFH Corp. does not have stock option history upon which to base the estimate of the expected life and data for similar companies was not reasonably available. The risk-free rate is based on the US Treasury security with terms equal to the expected life of the option as of the grant date.
189
The weighted average grant-date fair value of the Time-Based Options granted in 2010, 2009 and 2008 was $1.16, $1.32 and $1.89 per option, respectively. The weighted-average grant-date fair value of the Performance-Based Options granted in 2009 and 2008 ranged from $1.16 to $1.91 and $1.73 to $2.25, respectively, depending upon the performance period. There were no Performance-Based Options granted in 2010.
Assumptions supporting the fair values were as follows:
| | | | | | | | | | | | |
| | | Year Ended December 31, |
| | | 2010 | | 2009 | | 2008 | | 2010 | | 2009 | | 2008 |
Assumptions | | Time-Based Options | | Performance-Based Options |
Expected volatility | | 30% – 35% | | 30% | | 30% – 33% | | N/A | | 30% | | 30% – 33% |
Expected annual dividend | | — | | — | | — | | — | | — | | — |
Expected life (in years) | | 6.1 – 7.3 | | 6.4 – 7.4 | | 6.0 – 6.5 | | N/A | | 5.3 – 7.6 | | 5.0 – 7.3 |
Risk-free rate | | 2.69% – 3.20% | | 2.54% – 3.14% | | 1.51% – 3.50% | | N/A | | 2.51% – 3.25% | | 1.35% – 3.64% |
Compensation expense for Time-Based Options is based on the grant-date fair value and recognized over the vesting period as employees perform services. During 2010, 2009 and 2008, $13.5 million, $8.6 million and $11.9 million, respectively, was recognized as expense for Time-Based Options.
As of December 31, 2010, there was approximately $30.6 million of unrecognized compensation expense related to nonvested Time-Based Options, which is expected to be recognized ratably over a remaining weighted-average period of approximately three to five years.
A summary of Time-Based Options activity is presented below:
| | | | | | | | | | | | |
| | | Year Ended December 31, 2010 | |
Options | | Options
(millions) | | | Weighted
Average
Exercise
Price | | | Aggregate
Intrinsic
Value
(millions) | |
Total outstanding as of beginning of period | | | 35.6 | | | $ | 4.42 | | | $ | — | |
Granted | | | 3.8 | | | | 3.41 | | | | — | |
Exercised | | | — | | | | — | | | | — | |
Forfeited | | | (2.2 | ) | | | 4.53 | | | | — | |
| | | | | | | | | | | | |
Total outstanding as of end of period (weighted average remaining term of 7 – 10 years) | | | 37.2 | | | | 4.31 | | | | — | |
Exercisable as of end of period (weighted average remaining term of 7 – 10 years) | | | (4.8 | ) | | | 4.71 | | | | — | |
Expected forfeitures | | | (0.1 | ) | | | 5.00 | | | | — | |
| | | | | | | | | | | | |
Expected to vest as of end of period (weighted average remaining term of 7 – 10 years) | | | 32.3 | | | | 4.25 | | | | — | |
| | | | | | | | | | | | |
| | | | | | | | | | | | |
| | | Year Ended December 31, 2009 | |
Options | | Options
(millions) | | | Weighted
Average
Exercise
Price | | | Aggregate
Intrinsic
Value
(millions) | |
Total outstanding as of beginning of period | | | 24.6 | | | $ | 5.00 | | | $ | — | |
Granted | | | 13.9 | | | | 3.50 | | | | — | |
Exercised | | | — | | | | — | | | | — | |
Forfeited | | | (2.9 | ) | | | 5.00 | | | | — | |
| | | | | | | | | | | | |
Total outstanding as of end of period (weighted average remaining term of 8 – 10 years) | | | 35.6 | | | | 4.42 | | | | — | |
Exercisable as of end of period (weighted average remaining term of 8 – 10 years) | | | (4.7 | ) | | | 5.00 | | | | — | |
Expected forfeitures | | | (0.3 | ) | | | 5.00 | | | | — | |
| | | | | | | | | | | | |
Expected to vest as of end of period (weighted average remaining term of 8 – 10 years) | | | 30.6 | | | | 4.32 | | | | — | |
| | | | | | | | | | | | |
190
| | | | | | | | | | | | |
| | | Year Ended December 31, 2008 | |
Options | | Options
(millions) | | | Weighted
Average
Exercise
Price | | | Aggregate
Intrinsic
Value
(millions) | |
Total outstanding as of beginning of period | | | 9.8 | | | $ | 5.00 | | | $ | — | |
Granted | | | 16.8 | | | | 5.00 | | | | — | |
Exercised | | | — | | | | — | | | | — | |
Forfeited | | | (2.0 | ) | | | 5.00 | | | | — | |
| | | | | | | | | | | | |
Total outstanding as of end of period (weighted average remaining term of 9 years) | | | 24.6 | | | | 5.00 | | | | — | |
Exercisable as of end of period (weighted average remaining term of 9 years) | | | (4.7 | ) | | | 5.00 | | | | — | |
Expected forfeitures | | | (0.4 | ) | | | 5.00 | | | | — | |
| | | | | | | | | | | | |
Expected to vest as of end of period (weighted average remaining term of 9 years) | | | 19.5 | | | | 5.00 | | | | — | |
| | | | | | | | | | | | |
| | | | | | | | | | | | | | | | | | | | | | | | |
| | | Year Ended December 31, | |
| | | 2010 | | | 2009 | | | 2008 | |
Nonvested Options | | Options
(millions) | | | Weighted
Average
Grant-
Date Fair
Value | | | Options
(millions) | | | Weighted
Average
Grant-
Date Fair
Value | | | Options
(millions) | | | Weighted
Average
Grant-
Date Fair
Value | |
Total nonvested as of beginning of period | | | 26.2 | | | $ | 1.67 | | | | 19.9 | | | $ | 2.05 | | | | 9.8 | | | $ | 1.92 | |
Granted | | | 3.8 | | | | 1.16 | | | | 13.9 | | | | 1.32 | | | | 16.8 | | | | 1.89 | |
Vested | | | (4.8 | ) | | | 1.63 | | | | (4.7 | ) | | | 1.86 | | | | (4.7 | ) | | | 1.80 | |
Forfeited | | | (2.2 | ) | | | 1.70 | | | | (2.9 | ) | | | 1.85 | | | | (2.0 | ) | | | 1.92 | |
| | | | | | | | | | | | | | | | | | | | | | | | |
Total nonvested as of end of period | | | 23.0 | | | | 1.59 | | | | 26.2 | | | | 1.67 | | | | 19.9 | | | | 2.05 | |
| | | | | | | | | | | | | | | | | | | | | | | | |
Compensation expense for Performance-Based Options is based on the grant-date fair value and recognized over the requisite performance and service periods for each tranche of options depending upon the achievement of financial performance, or if certain liquidity events occur, as discussed above. Additionally, most participants’ Performance-Based Options were exchanged for Time-Based Options in 2009. Expense recognized for Performance-Based Options totaled $3.4 million in 2010 and $8.1 million in 2008.
191
As of December 31, 2010, there was approximately $10.5 million of unrecognized compensation expense related to nonvested Performance-Based Options, which we could record as an expense over a remaining weighted-average period of approximately three to five years, subject to the achievement of financial performance being probable. A total of 4.8 million of the 2008 and 2.0 million of the 2009 Performance-Based Options have vested.
A summary of Performance-Based Options activity is presented below:
| | | | | | | | | | | | |
| | | Year Ended December 31, 2010 | |
Options | | Options
(millions) | | | Weighted
Average
Exercise
Price | | | Aggregate
Intrinsic
Value
(millions) | |
Outstanding as of beginning of period | | | 12.5 | | | $ | 4.90 | | | $ | — | |
Granted | | | — | | | | — | | | | — | |
Exercised | | | — | | | | — | | | | — | |
Forfeited | | | (1.4 | ) | | | 5.00 | | | | — | |
Exchanged | | | — | | | | — | | | | — | |
| | | | | | | | | | | | |
Total outstanding as of end of period (weighted average remaining term of 7 – 10 years) | | | 11.1 | | | | 4.89 | | | | — | |
Exercisable as of end of period (weighted average remaining term of 7 – 10 years) | | | (2.0 | ) | | | 5.00 | | | | — | |
Expected forfeitures | | | — | | | | — | | | | — | |
| | | | | | | | | | | | |
Expected to vest as of end of period (weighted average remaining term of 7 – 10 years) | | | 9.1 | | | | 4.87 | | | | — | |
| | | | | | | | | | | | |
| | | | | | | | | | | | |
| | | Year Ended December 31, 2009 | |
Options | | Options
(millions) | | | Weighted
Average
Exercise
Price | | | Aggregate
Intrinsic
Value
(millions) | |
Outstanding as of beginning of period | | | 23.9 | | | $ | 5.00 | | | $ | — | |
Granted | | | 0.8 | | | | 3.50 | | | | — | |
Exercised | | | — | | | | — | | | | — | |
Forfeited | | | (3.0 | ) | | | 5.00 | | | | — | |
Exchanged | | | (9.2 | ) | | | 5.00 | | | | — | |
| | | | | | | | | | | | |
Total outstanding as of end of period (weighted average remaining term of 8 – 10 years) | | | 12.5 | | | | 4.90 | | | | — | |
Exercisable as of end of period (weighted average remaining term of 8 – 10 years) | | | (4.8 | ) | | | 5.00 | | | | — | |
Expected forfeitures | | | (0.3 | ) | | | 5.00 | | | | — | |
| | | | | | | | | | | | |
Expected to vest as of end of period (weighted average remaining term of 8 – 10 years) | | | 7.4 | | | | 4.90 | | | | — | |
| | | | | | | | | | | | |
| | | | | | | | | | | | |
| | | Year Ended December 31, 2008 | |
Options | | Options
(millions) | | | Weighted
Average
Exercise
Price | | | Aggregate
Intrinsic
Value
(millions) | |
Outstanding as of beginning of period | | | 9.8 | | | $ | 5.00 | | | $ | — | |
Granted | | | 16.2 | | | | 5.00 | | | | — | |
Exercised | | | — | | | | — | | | | — | |
Forfeited | | | (2.1 | ) | | | 5.00 | | | | — | |
| | | | | | | | | | | | |
Total outstanding as of end of period (weighted average remaining term of 9 years) | | | 23.9 | | | | 5.00 | | | | — | |
Exercisable as of end of period (weighted average remaining term of 9 years) | | | — | | | | — | | | | — | |
Expected forfeitures | | | (0.5 | ) | | | 5.00 | | | | — | |
| | | | | | | | | | | | |
Expected to vest as of end of period (weighted average remaining term of 9 years) | | | 23.4 | | | | 5.00 | | | | — | |
| | | | | | | | | | | | |
192
| | | | | | | | | | | | | | | | | | | | | | | | |
| | | Year Ended December 31, | |
| | | 2010 | | | 2009 | | | 2008 | |
Nonvested Options | | Options
(millions) | | | Grant-Date
Fair Value | | | Options
(millions) | | | Grant-Date
Fair Value | | | Options
(millions) | | | Grant-Date
Fair Value | |
Total nonvested as of beginning of period | | | 7.7 | | | $ | 1.16 – 2.11 | | | | 23.9 | | | $ | 1.73 – 2.21 | | | | 9.8 | | | $ | 1.74 – 2.09 | |
Granted | | | — | | | | — | | | | 0.8 | | | | 1.16 – 1.91 | | | | 16.2 | | | | 1.73 – 2.25 | |
Vested | | | (2.0 | ) | | | 1.62 – 1.87 | | | | (4.8 | ) | | | 1.73 – 2.21 | | | | — | | | | — | |
Forfeited | | | (1.4 | ) | | | 1.60 – 1.87 | | | | (3.0 | ) | | | 1.73 – 2.21 | | | | (2.1 | ) | | | 1.74 – 2.09 | |
Exchanged | | | — | | | | — | | | | (9.2 | ) | | | — | | | | — | | | | — | |
| | | | | | | | | | | | | | | | | | | | | | | | |
Total nonvested as of end of period | | | 4.3 | | | | 1.16 – 2.11 | | | | 7.7 | | | | 1.16 – 2.11 | | | | 23.9 | | | | 1.73 – 2.21 | |
| | | | | | | | | | | | | | | | | | | | | | | | |
Other Share and Share-Based Awards —In 2008, we granted 2.4 million deferred share awards, each of which represents the right to receive one share of EFH Corp. stock, to certain management employees who agreed to forego share-based awards that vested at the Merger date. The deferred share awards are fully vested and are payable in cash or stock upon the earlier of a change of control or separation of service. No expense was recorded in 2008 related to these awards. An additional 1.2 million deferred share awards were granted to certain management employees in 2008, approximately half of which are payable in cash or stock and the balance payable in stock; 1.0 million of these awards have since vested or have been surrendered upon termination of employment. Expenses recognized in 2010, 2009 and 2008 related to these grants totaled $0.4 million, $3.7 million and $2.2 million, respectively. Deferred share awards that are payable in cash or stock are accounted for as liability awards; therefore, the effects of changes in value of EFH Corp. shares are recognized in earnings. As a result of the decline in value of EFH Corp. shares, share-based compensation expense in 2010 and 2009 was reduced by $3.3 million and $3.6 million, respectively.
We granted 2.7 million shares of EFH Corp. stock in 2010, 1.5 million shares in 2009 and 1.7 million shares in 2008, to board members and other non-employees. The shares vest over periods of one to two years, and a portion may be settled in cash. Expense recognized in 2010, 2009 and 2008 related to these grants totaled $4.7 million, $4.0 million and $8.2 million, respectively.
Stock Appreciation Rights –In 2008, Oncor established the Oncor Electric Delivery Company LLC Stock Appreciation Rights Plan (the SARs Plan) under which certain employees of Oncor and its subsidiaries may be granted stock appreciation rights (SARs) payable in cash, or in some circumstances, Oncor units. Two types of SARs may be granted under the SARs Plan. Time-based SARs (Time SARs) vest solely based upon continued employment ratably on an annual basis on each of the first five anniversaries of the grant date. Performance-based SARs (Performance SARs) vest based upon both continued employment and the achievement of a predetermined level of Oncor EBITDA over time, generally ratably over five years based upon annual Oncor EBITDA levels, with provisions for vesting if the annual levels are not achieved but cumulative two- or three-year total Oncor EBITDA levels are achieved. Time and Performance SARs may also vest in part or in full upon the occurrence of certain specified liquidity events and are exercisable only upon the occurrence of certain specified liquidity events. Since the exercisability of the Time and Performance SARs is conditioned upon the occurrence of a liquidity event, compensation expense will not be recorded until it is probable that a liquidity event will occur. Generally, awards under the SARs Plan terminate on the tenth anniversary of the grant, unless the participant’s employment is terminated earlier under certain circumstances.
In February 2009, Oncor implemented a similar plan for primarily non-employee members of Oncor’s board of directors. The terms and conditions are similar to the SARs Plan with the exception that SARs granted to non-employee board members vest in eight equal quarterly installments over a two-year period.
SARs are generally payable in cash based on the fair market value of the SAR on the date of exercise. No SARs were granted under the SARs Plan during the year ended December 31, 2009. Oncor granted 6.9 million Time SARs under the SARs Plan during the year ended December 31, 2008, and Time SARS vested as of December 31, 2009 totaled 2.8 million. Oncor granted 6.9 million Performance SARs under the SARs Plan during the year ended December 31, 2008, and Performance SARs vested as of December 31, 2009 totaled 1.4 million. Oncor granted 55 thousand SARs under the Director SARs Plan during the year ended December 31, 2009, and SARs vested under the Director SARs Plan as of December 31, 2009 totaled 27.5 thousand. There were no SARs under either plan eligible for exercise as of December 31, 2009. See Notes 1 and 3 for discussion of the deconsolidation of Oncor Holdings effective January 1, 2010.
193
| 22. | RELATED–PARTY TRANSACTIONS |
The following represent the significant related-party transactions of EFH Corp.:
| | • | | We incur an annual management fee under the terms of a management agreement with the Sponsor Group for which we accrued $37 million, $36 million and $35 million for the years ended December 31, 2010, 2009 and 2008, respectively. The fee is reported as SG&A expense. |
| | • | | In 2007, TCEH entered into the TCEH Senior Secured Facilities with syndicates of financial institutions and other lenders. These syndicates included affiliates of GS Capital Partners, which is a member of the Sponsor Group. Affiliates of GS Capital Partners and Kohlberg Kravis Roberts & Co. L.P. (KKR), a member of the Sponsor Group, have from time to time engaged in commercial banking and financial advisory transactions with us in the normal course of business. |
| | • | | Fees paid to Goldman, Sachs & Co. (Goldman), an affiliate of GS Capital Partners, related to debt issuances and exchanges totaled $11 million in 2010, described as follows. Goldman acted as an initial purchaser in the issuance of $500 million principal amount of EFH Corp. 10% Notes in January 2010 as discussed in Note 11 and received fees totaling $3 million. Goldman acted as a dealer manager and solicitation agent in the debt exchange offers completed in August 2010 as discussed in Note 11 and received fees of $7 million. Goldman also acted as an initial purchaser in the issuance of $350 million principal amount of TCEH 15% Senior Secured Second Lien Notes (Series B) in October 2010 as discussed in Note 11 and received fees totaling $1 million. |
| | • | | Affiliates of the Sponsor Group participated in debt exchange offers completed in November 2009 by EFH Corp., EFIH and EFIH Finance to exchange new senior secured notes for certain EFH Corp. and TCEH notes as discussed in Note 11. Goldman and KKR Capital Markets LLC, an affiliate of KKR, acted as dealer managers and TPG Capital, L.P. served as an advisor in the exchange offers. These affiliates were compensated for their services in accordance with the terms of the agreement. These fees totaled $1 million. |
| | • | | Affiliates of Goldman are parties to certain commodity and interest rate hedging transactions with us in the normal course of business. |
| | • | | Affiliates of the Sponsor Group may sell or acquire debt or debt securities issued by us in open market transactions or through loan syndications. |
The following transactions reflect the deconsolidation of Oncor Holdings effective January 1, 2010 as discussed in Notes 1 and 3.
| | • | | TCEH’s retail operations incur electricity delivery fees charged by Oncor, which totaled $1.1 billion for the year ended December 31, 2010. The fees are based on rates regulated by the PUCT that apply to all REPs. The balance sheet as of December 31, 2010 reflects amounts due currently to Oncor totaling $143 million (included in payables due to unconsolidated subsidiary), primarily related to these electricity delivery fees. |
| | • | | Oncor’s bankruptcy-remote financing subsidiary has issued securitization bonds to recover generation-related regulatory assets through a transition surcharge to its customers. Oncor’s incremental income taxes related to the transition surcharges it collects are being reimbursed by TCEH. Therefore, the balance sheet reflects a noninterest bearing note payable to Oncor of $217 million ($39 million current portion included in payables due to unconsolidated subsidiary) as of December 31, 2010. TCEH’s payments on the note totaled $37 million for the year ended December 31, 2010. |
| | • | | TCEH reimburses Oncor for interest expense on Oncor’s bankruptcy-remote financing subsidiary’s securitization bonds. This interest expense, which is paid on a monthly basis, totaled $37 million for the year ended December 31, 2010. |
194
| | • | | A subsidiary of EFH Corp. charges Oncor for financial and other administrative services at cost, which totaled $36 million for the year ended December 31, 2010. |
| | • | | Under Texas regulatory provisions, the trust fund for decommissioning the Comanche Peak nuclear generation facility, reported in other investments on the balance sheet, is funded by a delivery fee surcharge billed to REPs by Oncor and remitted monthly to TCEH (totaling $16 million for the year ended December 31, 2010), with the intent that the trust fund assets will be sufficient to fund the decommissioning liability, reported in noncurrent liabilities on the balance sheet. Income and expenses associated with the trust fund and the decommissioning liability incurred by us are offset by a net change in the intercompany receivable/payable with Oncor, which in turn results in a change in Oncor’s net regulatory asset/liability. As of December 31, 2010, the excess of the trust fund balance over the decommissioning liability resulted in a payable to Oncor totaling $206 million included in noncurrent liabilities due to unconsolidated subsidiary in the balance sheet. |
The intercompany receivable/payable with Oncor has changed from a receivable of $85 million as of January 1, 2010 to a payable of $206 million as of December 31, 2010 due to a new decommissioning cost estimate completed in the second quarter 2010 that resulted in a decline of the liability. The new cost estimate was completed in accordance with regulatory requirements to perform a cost estimate every five years. The lower estimated liability was driven by lower cost escalation assumptions in the new estimate. (Also see Note 24 under “Asset Retirement Obligations.”)
| | • | | We file a consolidated federal income tax return; however, Oncor Holdings’ federal income tax and Texas margin tax expense and related balance sheet amounts, including income taxes payable to or receivable from EFH Corp., are recorded as if Oncor Holdings files its own income tax return. As of December 31, 2010, the amount due to Oncor Holdings totaled $72 million and is included in payables due to unconsolidated subsidiary. Income tax payments from Oncor totaled $107 million in the year ended December 31, 2010. |
| | • | | Certain transmission and distribution utilities in Texas have tariffs in place to assure adequate credit worthiness of any REP to support the REP’s obligation to collect securitization bond-related (transition) charges on behalf of the utility. Under these tariffs, as a result of TCEH’s credit rating being below investment grade, TCEH is required to post collateral support in an amount equal to estimated transition charges over specified time periods. Accordingly, as of December 31, 2010, TCEH had posted a letter of credit in the amount of $14 million for the benefit of Oncor. |
| | • | | EFH Corp. and Oncor are jointly and severally liable for the funding of the EFH Corp. pension plan and a portion of the OPEB plan obligations. EFH Corp. is liable for the majority of the OPEB plan obligations. Oncor has contractually agreed to reimburse EFH Corp. with respect to certain pension plan and OPEB liabilities. Accordingly, as of December 31, 2010, the balance sheet of EFH Corp. reflects such unfunded liabilities and a corresponding receivable from Oncor in the amount of $1.463 billion, classified as noncurrent, which represents the portion of the obligations recoverable by Oncor under regulatory rate-setting provisions and reported by Oncor in its balance sheet. |
| | • | | Oncor and Texas Holdings agreed to the terms of a stipulation with major interested parties to resolve all outstanding issues in the PUCT review related to the Merger. As part of this stipulation, TCEH would be required to post a letter of credit in an amount equal to $170 million to secure its payment obligations to Oncor in the event, which has not occurred, two or more rating agencies downgrade Oncor’s credit ratings below investment grade. |
195
Our operations are aligned into two reportable business segments: Competitive Electric and Regulated Delivery. The segments are managed separately because they are strategic business units that offer different products or services and involve different risks.
The Competitive Electric segment is engaged in competitive market activities consisting of electricity generation, wholesale energy sales and purchases, commodity risk management and trading activities, and retail electricity sales to residential and business customers, all largely in Texas. These activities are conducted by TCEH.
The Regulated Delivery segment is engaged in regulated electricity transmission and distribution operations in Texas. These activities are conducted by Oncor, including its wholly-owned bankruptcy-remote financing subsidiary. See Notes 1 and 3 for discussion of the deconsolidation of Oncor Holdings and its subsidiaries effective as of January 1, 2010.
Corporate and Other represents the remaining nonsegment operations consisting primarily of discontinued businesses, general corporate expenses and interest on EFH Corp. (parent entity), EFIH and EFCH debt.
The accounting policies of the business segments are the same as those described in the summary of significant accounting policies in Note 1. We evaluate performance based on income from continuing operations. We account for intersegment sales and transfers as if the sales or transfers were to third parties, that is, at current market prices.
196
| | | | | | | | | | | | |
| | | Year Ended December 31, | |
| | | 2010 | | | 2009 | | | 2008 | |
Operating revenues | | | | | | | | | | | | |
Competitive Electric | | $ | 8,235 | | | $ | 7,911 | | | $ | 9,787 | |
Regulated Delivery | | | — | | | | 2,690 | | | | 2,580 | |
Corp. and Other | | | — | | | | 20 | | | | 37 | |
Eliminations | | | — | | | | (1,075 | ) | | | (1,040 | ) |
| | | | | | | | | | | | |
Consolidated | | $ | 8,235 | | | $ | 9,546 | | | $ | 11,364 | |
| | | | | | | | | | | | |
| | | |
Regulated revenues — included in operating revenues | | | | | | | | | | | | |
Competitive Electric | | $ | — | | | $ | — | | | $ | — | |
Regulated Delivery | | | — | | | | 2,690 | | | | 2,580 | |
Corp. and Other | | | — | | | | — | | | | — | |
Eliminations | | | — | | | | (1,051 | ) | | | (1,001 | ) |
| | | | | | | | | | | | |
Consolidated | | $ | — | | | $ | 1,639 | | | $ | 1,579 | |
| | | | | | | | | | | | |
| | | |
Affiliated revenues — included in operating revenues | | | | | | | | | | | | |
Competitive Electric | | $ | — | | | $ | 8 | | | $ | 7 | |
Regulated Delivery | | | — | | | | 1,051 | | | | 1,001 | |
Corp. and Other | | | — | | | | 16 | | | | 32 | |
Eliminations | | | — | | | | (1,075 | ) | | | (1,040 | ) |
| | | | | | | | | | | | |
Consolidated | | $ | — | | | $ | — | | | $ | — | |
| | | | | | | | | | | | |
| | | |
Depreciation and amortization | | | | | | | | | | | | |
Competitive Electric | | $ | 1,380 | | | $ | 1,172 | | | $ | 1,092 | |
Regulated Delivery | | | — | | | | 557 | | | | 492 | |
Corp. and Other | | | 27 | | | | 25 | | | | 26 | |
Eliminations | | | — | | | | — | | | | — | |
| | | | | | | | | | | | |
Consolidated | | $ | 1,407 | | | $ | 1,754 | | | $ | 1,610 | |
| | | | | | | | | | | | |
| | | |
Equity in earnings (losses) of unconsolidated subsidiaries (net of tax) | | | | | | | | | | | | |
Competitive Electric | | $ | — | | | $ | (7 | ) | | $ | (10 | ) |
Regulated Delivery | | | 277 | | | | (2 | ) | | | (4 | ) |
Corp. and Other | | | — | | | | (3 | ) | | | (5 | ) |
Eliminations | | | — | | | | 12 | | | | 19 | |
| | | | | | | | | | | | |
Consolidated | | $ | 277 | | | $ | — | | | $ | — | |
| | | | | | | | | | | | |
| | | |
Interest income | | | | | | | | | | | | |
Competitive Electric | | $ | 91 | | | $ | 64 | | | $ | 61 | |
Regulated Delivery | | | — | | | | 43 | | | | 45 | |
Corp. and Other | | | 151 | | | | 147 | | | | 100 | |
Eliminations | | | (232 | ) | | | (209 | ) | | | (179 | ) |
| | | | | | | | | | | | |
Consolidated | | $ | 10 | | | $ | 45 | | | $ | 27 | |
| | | | | | | | | | | | |
| | | |
Interest expense and related charges | | | | | | | | | | | | |
Competitive Electric | | $ | 2,957 | | | $ | 1,946 | | | $ | 4,010 | |
Regulated Delivery | | | — | | | | 346 | | | | 317 | |
Corp. and Other | | | 829 | | | | 829 | | | | 787 | |
Eliminations | | | (232 | ) | | | (209 | ) | | | (179 | ) |
| | | | | | | | | | | | |
Consolidated | | $ | 3,554 | | | $ | 2,912 | | | $ | 4,935 | |
| | | | | | | | | | | | |
| | | |
Income tax expense (benefit) | | | | | | | | | | | | |
Competitive Electric | | $ | 359 | | | $ | 407 | | | $ | (450 | ) |
Regulated Delivery | | | — | | | | 173 | | | | 221 | |
Corp. and Other | | | 30 | | | | (213 | ) | | | (242 | ) |
Eliminations | | | — | | | | — | | | | — | |
| | | | | | | | | | | | |
Consolidated | | $ | 389 | | | $ | 367 | | | $ | (471 | ) |
| | | | | | | | | | | | |
197
| | | | | | | | | | | | |
| | | Year Ended December 31, | |
| | | 2010 | | | 2009 | | | 2008 | |
Net income (loss) | | | | | | | | | | | | |
Competitive Electric | | $ | (3,463 | ) | | $ | 631 | | | $ | (8,929 | ) |
Regulated Delivery | | | 277 | | | | 320 | | | | (486 | ) |
Corp. and Other | | | 374 | | | | (543 | ) | | | (583 | ) |
Eliminations | | | — | | | | — | | | | — | |
| | | | | | | | | | | | |
Consolidated | | $ | (2,812 | ) | | $ | 408 | | | $ | (9,998 | ) |
| | | | | | | | | | | | |
| | | |
Investment in equity investees | | | | | | | | | | | | |
Competitive Electric | | $ | — | | | $ | 42 | | | $ | (2 | ) |
Regulated Delivery | | | 5,544 | | | | — | | | | — | |
Corp. and Other | | | — | | | | — | | | | — | |
Eliminations | | | — | | | | — | | | | — | |
| | | | | | | | | | | | |
Consolidated | | $ | 5,544 | | | $ | 42 | | | $ | (2 | ) |
| | | | | | | | | | | | |
| | | |
Total assets | | | | | | | | | | | | |
Competitive Electric | | $ | 39,202 | | | $ | 43,302 | | | $ | 43,061 | |
Regulated Delivery | | | 5,544 | | | | 16,246 | | | | 15,772 | |
Corp. and Other | | | 5,045 | | | | 4,355 | | | | 3,526 | |
Eliminations | | | (3,403 | ) | | | (4,241 | ) | | | (3,096 | ) |
| | | | | | | | | | | | |
Consolidated | | $ | 46,388 | | | $ | 59,662 | | | $ | 59,263 | |
| | | | | | | | | | | | |
| | | |
Capital expenditures | | | | | | | | | | | | |
Competitive Electric | | $ | 796 | | | $ | 1,324 | | | $ | 1,914 | |
Regulated Delivery | | | — | | | | 998 | | | | 919 | |
Corp. and Other | | | 42 | | | | 26 | | | | 16 | |
Eliminations | | | — | | | | — | | | | — | |
| | | | | | | | | | | | |
Consolidated | | $ | 838 | | | $ | 2,348 | | | $ | 2,849 | |
| | | | | | | | | | | | |
198
| 24. | SUPPLEMENTARY FINANCIAL INFORMATION |
Regulated Versus Unregulated Operations
| | | | | | | | | | | | |
| | | Year Ended December 31, | |
| | | 2010 | | | 2009 | | | 2008 | |
Operating revenues | | | | | | | | | | | | |
Regulated | | $ | — | | | $ | 2,690 | | | $ | 2,580 | |
Unregulated | | | 8,235 | | | | 7,931 | | | | 9,824 | |
Intercompany sales eliminations — regulated | | | — | | | | (1,051 | ) | | | (1,001 | ) |
Intercompany sales eliminations — unregulated | | | — | | | | (24 | ) | | | (39 | ) |
| | | | | | | | | | | | |
Total operating revenues | | | 8,235 | | | | 9,546 | | | | 11,364 | |
Fuel, purchased power and delivery fees — unregulated (a) | | | (4,371 | ) | | | (2,878 | ) | | | (4,595 | ) |
Net gain from commodity hedging and trading activities — unregulated | | | 2,161 | | | | 1,736 | | | | 2,184 | |
Operating costs — regulated | | | — | | | | (908 | ) | | | (828 | ) |
Operating costs — unregulated | | | (837 | ) | | | (690 | ) | | | (675 | ) |
Depreciation and amortization — regulated | | | — | | | | (557 | ) | | | (492 | ) |
Depreciation and amortization — unregulated | | | (1,407 | ) | | | (1,197 | ) | | | (1,118 | ) |
Selling, general and administrative expenses — regulated | | | — | | | | (194 | ) | | | (164 | ) |
Selling, general and administrative expenses — unregulated | | | (751 | ) | | | (874 | ) | | | (793 | ) |
Franchise and revenue-based taxes — regulated | | | — | | | | (250 | ) | | | (255 | ) |
Franchise and revenue-based taxes — unregulated | | | (106 | ) | | | (109 | ) | | | (108 | ) |
Impairment of goodwill | | | (4,100 | ) | | | (90 | ) | | | (8,860 | ) |
Other income | | | 2,051 | | | | 204 | | | | 80 | |
Other deductions | | | (31 | ) | | | (97 | ) | | | (1,301 | ) |
Interest income | | | 10 | | | | 45 | | | | 27 | |
Interest expense and other charges | | | (3,554 | ) | | | (2,912 | ) | | | (4,935 | ) |
| | | | | | | | | | | | |
Income (loss) before income taxes and equity in earnings of unconsolidated subsidiaries | | $ | (2,700 | ) | | $ | 775 | | | $ | (10,469 | ) |
| | | | | | | | | | | | |
| (a) | Includes unregulated cost of fuel consumed of $1.430 billion in 2010, $1.269 billion in 2009 and $1.604 billion in 2008. The balance represents energy purchased for resale and delivery fees net of intercompany eliminations. |
Interest Expense and Related Charges
| | | | | | | | | | | | |
| | | Year Ended December 31, | |
| | | 2010 | | | 2009 | | | 2008 | |
Interest paid/accrued (including net amounts settled/accrued under interest rate swaps) | | $ | 2,681 | | | $ | 2,955 | | | $ | 3,399 | |
Accrued interest to be paid with additional toggle notes (Note 11) | | | 446 | | | | 524 | | | | 83 | |
Unrealized mark-to-market net (gain) loss on interest rate swaps | | | 207 | | | | (696 | ) | | | 1,477 | |
Amortization of interest rate swap losses at dedesignation of hedge accounting | | | 87 | | | | 184 | | | | 66 | |
Amortization of fair value debt discounts resulting from purchase accounting | | | 63 | | | | 82 | | | | 75 | |
Amortization of debt issuance costs and discounts | | | 130 | | | | 140 | | | | 146 | |
Capitalized interest | | | (60 | ) | | | (277 | ) | | | (311 | ) |
| | | | | | | | | | | | |
Total interest expense and related charges | | $ | 3,554 | | | $ | 2,912 | | | $ | 4,935 | |
| | | | | | | | | | | | |
199
Restricted Cash
| | | | | | | | | | | | | | | | |
| | | December 31, 2010 | | | December 31, 2009 | |
| | | Current
Assets | | | Noncurrent
Assets | | | Current
Assets | | | Noncurrent
Assets | |
Amounts related to TCEH’s Letter of Credit Facility (See Note 11) | | $ | — | | | $ | 1,135 | | | $ | — | | | $ | 1,135 | |
Amounts related to margin deposits held | | | 33 | | | | — | | | | 1 | | | | — | |
Amounts related to securitization (transition) bonds (a) | | | — | | | | — | | | | 47 | | | | 14 | |
| | | | | | | | | | | | | | | | |
Total restricted cash | | $ | 33 | | | $ | 1,135 | | | $ | 48 | | | $ | 1,149 | |
| | | | | | | | | | | | | | | | |
| | (a) | See Notes 1 and 3 for discussion of the deconsolidation of Oncor Holdings effective as of January 1, 2010. |
Inventories by Major Category
| | | | | | | | |
| | | December 31, | |
| | | 2010 | | | 2009 | |
Materials and supplies (a) | | $ | 162 | | | $ | 248 | |
Fuel stock | | | 198 | | | | 204 | |
Natural gas in storage | | | 35 | | | | 33 | |
| | | | | | | | |
Total inventories | | $ | 395 | | | $ | 485 | |
| | | | | | | | |
| | (a) | See Notes 1 and 3 for discussion of the deconsolidation of Oncor Holdings effective as of January 1, 2010. |
Property, Plant and Equipment
| | | | | | | | |
| | | December 31, | |
| | | 2010 | | | 2009 | |
Competitive Electric: | | | | | | | | |
Generation and mining | | $ | 22,686 | | | $ | 20,755 | |
Nuclear fuel (net of accumulated amortization of $610 and $426) | | | 353 | | | | 430 | |
Other assets | | | 30 | | | | 27 | |
Regulated Delivery (a): | | | | | | | | |
Transmission | | | — | | | | 3,917 | |
Distribution | | | — | | | | 8,778 | |
Other assets | | | — | | | | 174 | |
Corporate and Other | | | 186 | | | | 161 | |
| | | | | | | | |
Total | | | 23,255 | | | | 34,242 | |
Less accumulated depreciation | | | 3,545 | | | | 6,633 | |
| | | | | | | | |
Net of accumulated depreciation | | | 19,710 | | | | 27,609 | |
Construction work in progress: | | | | | | | | |
Competitive Electric | | | 646 | | | | 2,163 | |
Regulated Delivery (a) | | | — | | | | 321 | |
Corporate and Other | | | 10 | | | | 15 | |
| | | | | | | | |
Total construction work in progress | | | 656 | | | | 2,499 | |
| | | | | | | | |
Property, plant and equipment — net | | $ | 20,366 | | | $ | 30,108 | |
| | | | | | | | |
| | (a) | See Notes 1 and 3 for discussion of the deconsolidation of Oncor Holdings effective as of January 1, 2010. |
200
Depreciation expense totaled $1.255 billion, $1.454 billion and $1.355 billion for the years ended December 31, 2010, 2009 and 2008, respectively, including $394 million and $330 million for the years ended December 31, 2009 and 2008, respectively, related to Oncor.
We began depreciating two completed lignite-fueled generation units in the fourth quarter 2009 and the third new unit in the second quarter 2010.
Assets related to capitalized leases included above totaled $82 million and $167 million as of December 31, 2010 and 2009, respectively, net of accumulated depreciation.
Asset Retirement Obligations
These liabilities primarily relate to nuclear generation plant decommissioning, land reclamation related to lignite mining, removal of lignite/coal-fueled plant ash treatment facilities and generation plant asbestos removal and disposal costs. There is no earnings impact with respect to the recognition of the asset retirement costs for nuclear decommissioning, as all costs are recoverable through the regulatory process as part of Oncor’s rates.
The following table summarizes the changes to the asset retirement liability, reported in other current liabilities and other noncurrent liabilities and deferred credits in the balance sheet, during the years ended December 31, 2010 and 2009:
| | | | |
Asset retirement liability as of January 1, 2009 | | $ | 859 | |
Additions: | | | | |
Accretion | | | 59 | |
Incremental mining reclamation costs | | | 59 | |
Reductions: | | | | |
Payments, essentially all mining reclamation | | | (29 | ) |
| | | | |
Asset retirement liability as of December 31, 2009 | | $ | 948 | |
Additions: | | | | |
Accretion | | | 57 | |
Reductions: | | | | |
Payments, essentially all mining reclamation | | | (48 | ) |
Adjustment for new cost estimate (a) | | | (464 | ) |
| | | | |
Asset retirement liability as of December 31, 2010 | | | 493 | |
Less amounts due currently | | | (41 | ) |
| | | | |
Noncurrent asset retirement liability as of December 31, 2010 | | $ | 452 | |
| | | | |
| | (a) | Essentially all of the adjustment relates to the nuclear decommissioning liability, which resulted from a new cost estimate completed in the second quarter 2010. In accordance with regulatory requirements, a new cost estimate is completed every five years. A decline in the liability was driven by lower cost escalation assumptions in the new estimate. The reduction in the liability was offset in part by a reduction in the carrying value of the nuclear facility with the balance offset by an increase in the noncurrent liability to Oncor, which in turn resulted in a regulatory liability on Oncor’s balance sheet. (Also see Note 22.) |
201
Oncor’s Regulatory Assets and Liabilities
Recognition of regulatory assets and liabilities and the amortization periods over which they are expected to be recovered or refunded through rate regulation reflect the decisions of the PUCT. Components of the regulatory assets and liabilities are provided in the table below. Amounts not earning a return through rate regulation are noted. On August 31, 2009, the PUCT issued a final order on Oncor’s rate review filed in June 2008. The rate review included a determination of the recoverability of regulatory assets as of December 31, 2007, including the recoverability period of those assets deemed allowable by the PUCT. The PUCT’s findings included denial of recovery of certain regulatory assets primarily related to business restructuring costs and rate case expenses, which resulted in a $25 million charge ($16 million after-tax) in the third quarter 2009 reported in other deductions in the Regulated Delivery segment.
| | | | | | |
| | | Remaining Rate
Recovery/Amortization
Period as of December 31, 2009 | | Carrying Amount | |
| | | | December 31,
2009 | |
Regulatory assets: | | | | | | |
Generation-related regulatory assets securitized by transition bonds (a) | | 7 years | | $ | 759 | |
Employee retirement costs | | 5 years | | | 80 | |
Employee retirement costs to be reviewed (b)(c) | | To be determined | | | 41 | |
Employee retirement liability (a)(c)(d) | | To be determined | | | 768 | |
Self-insurance reserve (primarily storm recovery costs) — net | | 7 years | | | 137 | |
Self-insurance reserve to be reviewed (b)(c) | | To be determined | | | 106 | |
Nuclear decommissioning cost under-recovery (a)(c)(e) | | Not applicable | | | 85 | |
Securities reacquisition costs (pre-industry restructure) | | 8 years | | | 62 | |
Securities reacquisition costs (post-industry restructure) | | Terms of related debt | | | 27 | |
Recoverable amounts for/in lieu of deferred income taxes — net | | Life of related asset or liability | | | 68 | |
Rate case expenses (f) | | Largely 3 years | | | 9 | |
Rate case expenses to be reviewed (b)(c) | | To be determined | | | 1 | |
Advanced meter customer education costs | | 10 years | | | 4 | |
Deferred conventional meter depreciation | | 10 years | | | 14 | |
Energy efficiency performance bonus | | 1 year | | | 9 | |
Business restructuring costs (g) | | Not applicable | | | — | |
| | | | | | |
Total regulatory assets | | | | | 2,170 | |
| | | | | | |
Regulatory liabilities: | | | | | | |
Committed spending for demand-side management initiatives (a) | | 3 years | | | 78 | |
Deferred advanced metering system revenues | | 10 years | | | 57 | |
Investment tax credit and protected excess deferred taxes | | Various | | | 44 | |
Over-collection of securitization (transition) bond revenues (a) | | 7 years | | | 27 | |
Other regulatory liabilities (a) | | Various | | | 5 | |
| | | | | | |
Total regulatory liabilities | | | | | 211 | |
| | | | | | |
Net regulatory asset | | | | $ | 1,959 | |
| | | | | | |
| (a) | Not earning a return in the regulatory rate-setting process. |
| (b) | Costs incurred since the period covered under the last rate review. |
| (c) | Recovery is specifically authorized by statute, subject to reasonableness review by the PUCT. |
| (d) | Represents unfunded liabilities recorded in accordance with pension and OPEB accounting standards. |
| (e) | Offset by an intercompany payable to TCEH. |
| (f) | Rate case expenses totaling $4 million were disallowed by the PUCT and written off in the third quarter 2009. |
| (g) | All previously recorded business restructuring costs were disallowed by the PUCT and written off in the third quarter 2009. |
202
As part of purchase accounting, the carrying value of the generation-related regulatory assets was reduced by $213 million, and this amount is being accreted to other income over the approximate nine-year recovery period remaining as of the date of the Merger.
In September 2008, the PUCT approved a settlement for Oncor to recover its estimated future investment for advanced metering deployment. Oncor began billing the advanced metering surcharge in the January 2009 billing month cycle. The surcharge is expected to total $1.023 billion over the 11-year recovery period and includes a cost recovery factor of $2.19 per month per residential retail customer and $2.39 to $5.15 per month for non-residential retail customers. Oncor accounts for the difference between the surcharge billings for advanced metering facilities and the allowed revenues under the surcharge provisions, which are based on expenditures and an allowed return, as a regulatory asset or liability. Such differences arise principally as a result of timing of expenditures. As indicated in the table above, the regulatory liability at December 31, 2009 totaled $57 million.
See Note 6 for discussion of effects on regulatory assets and liabilities of the stipulation approved by the PUCT and Note 18 for additional information regarding nuclear decommissioning cost recovery.
Other Noncurrent Liabilities and Deferred Credits
The balance of other noncurrent liabilities and deferred credits consists of the following:
| | | | | | | | |
| | | December 31, | |
| | | 2010 | | | 2009 | |
Uncertain tax positions (including accrued interest) (Note 7) | | $ | 1,806 | | | $ | 1,999 | |
Retirement plan and other employee benefits | | | 1,895 | | | | 1,711 | |
Asset retirement obligations | | | 452 | | | | 948 | |
Unfavorable purchase and sales contracts | | | 673 | | | | 700 | |
Liabilities related to subsidiary tax sharing agreement (a) | | | — | | | | 321 | |
Other | | | 41 | | | | 87 | |
| | | | | | | | |
Total other noncurrent liabilities and deferred credits | | $ | 4,867 | | | $ | 5,766 | |
| | | | | | | | |
| | (a) | See Notes 1 and 3 for discussion of the deconsolidation of Oncor Holdings effective as of January 1, 2010. |
Unfavorable Purchase and Sales Contracts — Unfavorable purchase and sales contracts primarily represent the extent to which contracts on a net basis were unfavorable to market prices as of the date of the Merger. These are contracts for which: (i) TCEH has made the “normal” purchase or sale election allowed or (ii) the contract did not meet the definition of a derivative under accounting standards related to derivative instruments and hedging transactions. Under purchase accounting, TCEH recorded the value as of October 10, 2007 as a deferred credit. Amortization of the deferred credit related to unfavorable contracts is primarily on a straight-line basis, which approximates the economic realization, and is recorded as revenues or a reduction of purchased power costs as appropriate. The amortization amount totaled $27 million, $27 million and $30 million in 2010, 2009 and 2008, respectively. Favorable purchase and sales contracts are recorded as intangible assets (see Note 4).
The estimated amortization of unfavorable purchase and sales contracts for each of the next five fiscal years is as follows:
| | | | |
Year | | Amount | |
2011 | | $ | 27 | |
2012 | | | 27 | |
2013 | | | 26 | |
2014 | | | 25 | |
2015 | | | 25 | |
203
Liabilities Related to Subsidiary Tax Sharing Agreement —Amount represents the previously recorded net deferred tax liabilities of Oncor related to the noncontrolling interests. Upon the sale of noncontrolling interests in Oncor (see Note 14), Oncor became a partnership for US federal income tax purposes, and the temporary differences that gave rise to the deferred taxes will, over time, become taxable to the noncontrolling interests. Under a tax sharing agreement among Oncor and its equity holders, Oncor reimburses the equity holders for federal income taxes as the partnership earnings become taxable to such holders. Accordingly, as the temporary differences become taxable, the equity holders will be reimbursed by Oncor. In the unlikely event such amounts are not reimbursed under the tax sharing agreement, it is probable they would be refunded to rate payers.
Supplemental Cash Flow Information
| | | | | | | | | | | | |
| | | Year Ended December 31, | |
| | | 2010 | | | 2009 | | | 2008 | |
Cash payments (receipts) related to: | | | | | | | | | | | | |
Interest paid (a) | | $ | 2,693 | | | $ | 2,972 | | | $ | 3,495 | |
Capitalized interest | | | (60 | ) | | | (277 | ) | | | (311 | ) |
| | | | | | | | | | | | |
Interest paid (net of capitalized interest) (a) | | | 2,633 | | | | 2,695 | | | | 3,184 | |
Income taxes | | | 64 | | | | (42 | ) | | | (204 | ) |
Noncash investing and financing activities: | | | | | | | | | | | | |
Noncash construction expenditures (b) | | | 84 | | | | 197 | | | | 183 | |
Capital leases | | | 9 | | | | 15 | | | | 16 | |
Gain on termination of long-term power sales contract (Note 9) | | | (116 | ) | | | — | | | | — | |
| (a) | Net of interest received on interest rate swaps. |
| (b) | Represents end-of-period accruals. |
See Note 11 for noncash exchanges of debt and issuance of toggle notes in lieu of cash interest.
204
| 25. | SUPPLEMENTAL GUARANTOR CONDENSED FINANCIAL INFORMATION |
As of December 31, 2010, EFH Corp. had outstanding $359 million principal amount of EFH Corp. 10.875% Notes and $571 million principal amount of EFH Corp. Toggle Notes (collectively, the EFH Corp. Senior Notes) and $115 million principal amount of EFH Corp. 9.75% Notes and $1.061 billion principal amount of EFH Corp. 10% Notes (collectively, the EFH Corp. Senior Secured Notes). The EFH Corp. Senior Notes and Senior Secured Notes are unconditionally guaranteed by EFCH and EFIH, 100% owned subsidiaries of EFH Corp. (collectively, the Guarantors) on an unsecured basis except for EFIH’s guarantee of the EFH Corp. Senior Secured Notes, which is secured by a pledge of all membership interests and other investments EFIH owns or holds in Oncor Holdings or any of Oncor Holdings’ subsidiaries as described in Note 11. The guarantees issued by the Guarantors are full and unconditional, joint and several guarantees of the EFH Corp. Senior Notes and Senior Secured Notes. The guarantees by EFCH and the guarantee of the EFH Corp. Senior Notes by EFIH rank equally with any senior unsecured indebtedness of the Guarantors and rank effectively junior to all of the secured indebtedness of the Guarantors to the extent of the assets securing that indebtedness. All other subsidiaries of EFH Corp., either direct or indirect, do not guarantee the EFH Corp. Senior Notes and EFH Corp. Senior Secured Notes (collectively, the Non-Guarantors). The indentures governing the EFH Corp. Senior Notes and EFH Corp. Senior Secured Notes contain certain restrictions, subject to certain exceptions, on EFH Corp.’s ability to pay dividends or make investments. See Note 13.
The following tables have been prepared in accordance with Regulation S-X Rule 3-10, “Financial Statements of Guarantors and Issuers of Guaranteed Securities Registered or Being Registered” in order to present the condensed consolidating statements of income and cash flows of EFH Corp. (the Parent/Issuer), the Guarantors and the Non-Guarantors for the years ended December 31, 2010, 2009 and 2008 and the consolidating balance sheets as of December 31, 2010 and 2009 of the Parent/Issuer, the Guarantors and the Non-Guarantors. Investments in consolidated subsidiaries are accounted for under the equity method. The presentations reflect the application of SEC Staff Accounting Bulletin Topic 5-J, “Push Down Basis of Accounting Required in Certain Limited Circumstances,” including the effects of the push down of the $930 million and $4.63 billion principal amount of EFH Corp. Senior Notes and $771 million and $115 million principal amount of the EFH Corp. Senior Secured Notes to the Guarantors as of December 31, 2010 and 2009, respectively (see Note 11). Amounts pushed down reflect Merger-related debt and additional debt guaranteed by the Guarantors that was issued by EFH Corp. to refinance Merger-related or other debt existing at the time of the Merger.
EFH Corp. (Parent) received dividends/distributions from its consolidated subsidiaries totaling $2 million, $216 million and $329 million for the years ended December 31, 2010, 2009 and 2008, respectively. EFH Corp. also received a distribution of $1.253 billion indirectly from Oncor in 2008 as discussed in Note 14.
205
ENERGY FUTURE HOLDINGS CORP. AND SUBSIDIARIES
Condensed Consolidating Statements of Income (Loss)
For the Year Ended December 31, 2010
(Millions of Dollars)
| | | | | | | | | | | | | | | | | | | | |
| | | Parent/Issuer | | | Guarantors | | | Non-Guarantors | | | Eliminations | | | Consolidated | |
Operating revenues | | $ | — | | | $ | — | | | $ | 8,235 | | | $ | — | | | $ | 8,235 | |
Fuel, purchased power costs and delivery fees | | | — | | | | — | | | | (4,371 | ) | | | — | | | | (4,371 | ) |
Net gain from commodity hedging and trading activities | | | — | | | | — | | | | 2,161 | | | | — | | | | 2,161 | |
Operating costs | | | — | | | | — | | | | (837 | ) | | | — | | | | (837 | ) |
Depreciation and amortization | | | — | | | | — | | | | (1,407 | ) | | | — | | | | (1,407 | ) |
Selling, general and administrative expenses | | | (32 | ) | | | — | | | | (719 | ) | | | — | | | | (751 | ) |
Franchise and revenue-based taxes | | | — | | | | — | | | | (106 | ) | | | — | | | | (106 | ) |
Impairment of goodwill | | | — | | | | — | | | | (4,100 | ) | | | — | | | | (4,100 | ) |
Other income | | | 137 | | | | — | | | | 920 | | | | 994 | | | | 2,051 | |
Other deductions | | | — | | | | — | | | | (33 | ) | | | 2 | | | | (31 | ) |
Interest income | | | 178 | | | | 209 | | | | 327 | | | | (704 | ) | | | 10 | |
Interest expense and related charges | | | (1,082 | ) | | | (545 | ) | | | (3,057 | ) | | | 1,130 | | | | (3,554 | ) |
| | | | | | | | | | | | | | | | | | | | |
| | | | | |
Income (loss) before income taxes and equity in earnings of subsidiaries | | | (799 | ) | | | (336 | ) | | | (2,987 | ) | | | 1,422 | | | | (2,700 | ) |
| | | | | |
Income tax (expense) benefit | | | 305 | | | | 125 | | | | (309 | ) | | | (510 | ) | | | (389 | ) |
| | | | | |
Equity in earnings of consolidated subsidiaries | | | (2,595 | ) | | | (3,383 | ) | | | — | | | | 5,978 | | | | — | |
| | | | | |
Equity in earnings of unconsolidated subsidiaries (net of tax) | | | 277 | | | | 277 | | | | — | | | | (277 | ) | | | 277 | |
| | | | | | | | | | | | | | | | | | | | |
| | | | | |
Net loss | | | (2,812 | ) | | | (3,317 | ) | | | (3,296 | ) | | | 6,613 | | | | (2,812 | ) |
Net (income) loss attributable to noncontrolling interests | | | — | | | | — | | | | — | | | | — | | | | — | |
| | | | | | | | | | | | | | | | | | | | |
Net loss attributable to EFH Corp. | | $ | (2,812 | ) | | $ | (3,317 | ) | | $ | (3,296 | ) | | $ | 6,613 | | | $ | (2,812 | ) |
| | | | | | | | | | | | | | | | | | | | |
206
ENERGY FUTURE HOLDINGS CORP. AND SUBSIDIARIES
Condensed Consolidating Statements of Income
For the Year Ended December 31, 2009
(Millions of Dollars)
| | | | | | | | | | | | | | | | | | | | |
| | | Parent/Issuer | | | Guarantors | | | Non-Guarantors | | | Eliminations | | | Consolidated | |
Operating revenues | | $ | — | | | $ | — | | | $ | 9,546 | | | $ | — | | | $ | 9,546 | |
Fuel, purchased power costs and delivery fees | | | — | | | | — | | | | (2,878 | ) | | | — | | | | (2,878 | ) |
Net gain from commodity hedging and trading activities | | | — | | | | — | | | | 1,736 | | | | — | | | | 1,736 | |
Operating costs | | | — | | | | — | | | | (1,598 | ) | | | — | | | | (1,598 | ) |
Depreciation and amortization | | | — | | | | — | | | | (1,754 | ) | | | — | | | | (1,754 | ) |
Selling, general and administrative expenses | | | (123 | ) | | | — | | | | (945 | ) | | | — | | | | (1,068 | ) |
Franchise and revenue-based taxes | | | — | | | | — | | | | (359 | ) | | | — | | | | (359 | ) |
Impairment of goodwill | | | — | | | | — | | | | (90 | ) | | | — | | | | (90 | ) |
Other income | | | 49 | | | | — | | | | 114 | | | | 41 | | | | 204 | |
Other deductions | | | (6 | ) | | | — | | | | (91 | ) | | | — | | | | (97 | ) |
Interest income | | | 235 | | | | 5 | | | | 149 | | | | (344 | ) | | | 45 | |
Interest expense and related charges | | | (981 | ) | | | (570 | ) | | | (2,258 | ) | | | 897 | | | | (2,912 | ) |
| | | | | | | | | | | | | | | | | | | | |
| | | | | |
Income (loss) before income taxes and equity earnings of subsidiaries | | | (826 | ) | | | (565 | ) | | | 1,572 | | | | 594 | | | | 775 | |
| | | | | |
Income tax (expense) benefit | | | 268 | | | | 188 | | | | (622 | ) | | | (201 | ) | | | (367 | ) |
| | | | | |
Equity earnings of subsidiaries | | | 902 | | | | 965 | | | | — | | | | (1,867 | ) | | | — | |
| | | | | | | | | | | | | | | | | | | | |
| | | | | |
Net income | | | 344 | | | | 588 | | | | 950 | | | | (1,474 | ) | | | 408 | |
Net income attributable to noncontrolling interests | | | — | | | | — | | | | (64 | ) | | | — | | | | (64 | ) |
| | | | | | | | | | | | | | | | | | | | |
Net income attributable to EFH Corp. | | $ | 344 | | | $ | 588 | | | $ | 886 | | | $ | (1,474 | ) | | $ | 344 | |
| | | | | | | | | | | | | | | | | | | | |
207
ENERGY FUTURE HOLDINGS CORP. AND SUBSIDIARIES
Condensed Consolidating Statements of Income (Loss)
For the Year Ended December 31, 2008
(Millions of Dollars)
| | | | | | | | | | | | | | | | | | | | |
| | | Parent/Issuer | | | Guarantors | | | Non-Guarantors | | | Eliminations | | | Consolidated | |
Operating revenues | | $ | — | | | $ | — | | | $ | 11,364 | | | $ | — | | | $ | 11,364 | |
Fuel, purchased power costs and delivery fees | | | — | | | | — | | | | (4,595 | ) | | | — | | | | (4,595 | ) |
Net gain from commodity hedging and trading activities | | | — | | | | — | | | | 2,184 | | | | — | | | | 2,184 | |
Operating costs | | | — | | | | — | | | | (1,503 | ) | | | — | | | | (1,503 | ) |
Depreciation and amortization | | | — | | | | — | | | | (1,610 | ) | | | — | | | | (1,610 | ) |
Selling, general and administrative expenses | | | (105 | ) | | | — | | | | (852 | ) | | | — | | | | (957 | ) |
Franchise and revenue-based taxes | | | — | | | | 1 | | | | (364 | ) | | | — | | | | (363 | ) |
Impairment of goodwill | | | — | | | | — | | | | (8,860 | ) | | | — | | | | (8,860 | ) |
Other income | | | — | | | | — | | | | 80 | | | | — | | | | 80 | |
Other deductions | | | (22 | ) | | | — | | | | (1,279 | ) | | | — | | | | (1,301 | ) |
Interest income | | | 168 | | | | 7 | | | | 147 | | | | (295 | ) | | | 27 | |
Interest expense and related charges | | | (919 | ) | | | (537 | ) | | | (4,298 | ) | | | 819 | | | | (4,935 | ) |
| | | | | | | | | | | | | | | | | | | | |
| | | | | |
Income (loss) before income taxes and equity earnings of subsidiaries | | | (878 | ) | | | (529 | ) | | | (9,586 | ) | | | 524 | | | | (10,469 | ) |
| | | | | |
Income tax (expense) benefit | | | 291 | | | | 180 | | | | 176 | | | | (176 | ) | | | 471 | |
| | | | | |
Equity earnings of subsidiaries | | | (9,251 | ) | | | (9,184 | ) | | | — | | | | 18,435 | | | | — | |
| | | | | | | | | | | | | | | | | | | | |
| | | | | |
Net loss | | | (9,838 | ) | | | (9,533 | ) | | | (9,410 | ) | | | 18,783 | | | | (9,998 | ) |
Net loss attributable to noncontrolling interests | | | — | | | | — | | | | 160 | | | | — | | | | 160 | |
| | | | | | | | | | | | | | | | | | | | |
Net loss attributable to EFH Corp. | | $ | (9,838 | ) | | $ | (9,533 | ) | | $ | (9,250 | ) | | $ | 18,783 | | | $ | (9,838 | ) |
| | | | | | | | | | | | | | | | | | | | |
208
ENERGY FUTURE HOLDINGS CORP. AND SUBSIDIARIES
Condensed Consolidating Statements of Cash Flows
For the Year Ended December 31, 2010
(Millions of Dollars)
| | | | | | | | | | | | | | | | | | | | |
| | | Parent/Issuer | | | Guarantors | | | Non-guarantors | | | Eliminations | | | Consolidated | |
Cash provided by operating activities | | $ | 168 | | | $ | 111 | | | $ | 835 | | | $ | (8 | ) | | $ | 1,106 | |
| | | | | | | | | | | | | | | | | | | | |
Cash flows — financing activities: | | | | | | | | | | | | | | | | | | | | |
Issuances of long-term borrowings | | | 500 | | | | — | | | | 353 | | | | — | | | | 853 | |
Repayments/repurchases of long-term borrowings | | | (96 | ) | | | (8 | ) | | | (642 | ) | | | (605 | ) | | | (1,351 | ) |
Net short-term borrowings under accounts receivable securitization program | | | — | | | | — | | | | 96 | | | | — | | | | 96 | |
Change in other short-term borrowings | | | — | | | | — | | | | 172 | | | | — | | | | 172 | |
Capital contribution from parent | | | — | | | | 440 | | | | — | | | | (440 | ) | | | — | |
Contributions from noncontrolling interests | | | — | | | | — | | | | 32 | | | | — | | | | 32 | |
Cash dividends paid | | | — | | | | (2 | ) | | | — | | | | 2 | | | | — | |
Repayment of note — affiliate | | | 770 | | | | — | | | | (770 | ) | | | — | | | | — | |
Change in notes/advances — affiliates | | | (785 | ) | | | 33 | | | | 733 | | | | (18 | ) | | | (37 | ) |
Other, net | | | (28 | ) | | | (31 | ) | | | 24 | | | | 6 | | | | (29 | ) |
| | | | | | | | | | | | | | | | | | | | |
Cash provided by (used in) financing activities | | | 361 | | | | 432 | | | | (2 | ) | | | (1,055 | ) | | | (264 | ) |
| | | | | | | | | | | | | | | | | | | | |
| | | | | |
Cash flows — investing activities: | | | | | | | | | | | | | | | | | | | | |
Capital expenditures and nuclear fuel purchases | | | — | | | | — | | | | (944 | ) | | | — | | | | (944 | ) |
Capital contribution to subsidiary | | | (440 | ) | | | — | | | | — | | | | 440 | | | | — | |
Investment in affiliate debt | | | (105 | ) | | | (500 | ) | | | — | | | | 605 | | | | — | |
Investment redeemed from derivative counterparty | | | 400 | | | | — | | | | — | | | | — | | | | 400 | |
Proceeds from sale of assets | | | — | | | | — | | | | 147 | | | | — | | | | 147 | |
Proceeds from sale of environmental allowances and credits | | | — | | | | — | | | | 12 | | | | — | | | | 12 | |
Purchases of environmental allowances and credits | | | — | | | | — | | | | (30 | ) | | | — | | | | (30 | ) |
Proceeds from sales of nuclear decommissioning trust fund securities | | | — | | | | — | | | | 974 | | | | — | | | | 974 | |
Investments in nuclear decommissioning trust fund securities | | | — | | | | — | | | | (990 | ) | | | — | | | | (990 | ) |
Change in notes/advances — affiliates | | | — | | | | — | | | | (18 | ) | | | 18 | | | | — | |
Other, net | | | — | | | | — | | | | (37 | ) | | | — | | | | (37 | ) |
| | | | | | | | | | | | | | | | | | | | |
Cash used in investing activities | | | (145 | ) | | | (500 | ) | | | (886 | ) | | | 1,063 | | | | (468 | ) |
| | | | | | | | | | | | | | | | | | | | |
| | | | | |
Net change in cash and cash equivalents | | | 384 | | | | 43 | | | | (53 | ) | | | — | | | | 374 | |
Effects of deconsolidation of Oncor Holdings | | | — | | | | — | | | | (29 | ) | | | — | | | | (29 | ) |
Cash and cash equivalents — beginning balance | | | 1,059 | | | | — | | | | 130 | | | | — | | | | 1,189 | |
| | | | | | | | | | | | | | | | | | | | |
Cash and cash equivalents — ending balance | | $ | 1,443 | | | $ | 43 | | | $ | 48 | | | $ | — | | | $ | 1,534 | |
| | | | | | | | | | | | | | | | | | | | |
209
ENERGY FUTURE HOLDINGS CORP. AND SUBSIDIARIES
Condensed Consolidating Statements of Cash Flows
For the Year Ended December 31, 2009
(Millions of Dollars)
| | | | | | | | | | | | | | | | | | | | |
| | | Parent/Issuer | | | Guarantors | | | Non-Guarantors | | | Eliminations | | | Consolidated | |
Cash provided by (used in) operating activities | | $ | (42 | ) | | $ | 208 | | | $ | 1,977 | | | $ | (432 | ) | | $ | 1,711 | |
| | | | | | | | | | | | | | | | | | | | |
Cash flows — financing activities: | | | | | | | | | | | | | | | | | | | | |
Issuances of long-term borrowings | | | — | | | | — | | | | 522 | | | | — | | | | 522 | |
Retirements of long-term borrowings | | | (4 | ) | | | (7 | ) | | | (385 | ) | | | — | | | | (396 | ) |
Change in short-term borrowings | | | — | | | | — | | | | 332 | | | | — | | | | 332 | |
Contributions from noncontrolling interests | | | — | | | | — | | | | 48 | | | | — | | | | 48 | |
Distributions paid to noncontrolling interests | | | — | | | | — | | | | (56 | ) | | | — | | | | (56 | ) |
Cash dividends paid | | | — | | | | (216 | ) | | | (216 | ) | | | 432 | | | | — | |
Change in notes/advances — affiliates | | | 425 | | | | 15 | | | | — | | | | (440 | ) | | | — | |
Other, net | | | 5 | | | | — | | | | (33 | ) | | | — | | | | (28 | ) |
| | | | | | | | | | | | | | | | | | | | |
Cash provided by (used in) financing activities | | | 426 | | | | (208 | ) | | | 212 | | | | (8 | ) | | | 422 | |
| | | | | | | | | | | | | | | | | | | | |
| | | | | |
Cash flows — investing activities: | | | | | | | | | | | | | | | | | | | | |
Capital expenditures and nuclear fuel purchases | | | — | | | | — | | | | (2,545 | ) | | | — | | | | (2,545 | ) |
Money market fund redemptions | | | — | | | | — | | | | 142 | | | | — | | | | 142 | |
Investment posted with derivative counterparty | | | (400 | ) | | | — | | | | — | | | | — | | | | (400 | ) |
Proceeds from sale of assets | | | — | | | | — | | | | 42 | | | | — | | | | 42 | |
Reduction of restricted cash related to letter of credit facility | | | — | | | | — | | | | 115 | | | | — | | | | 115 | |
Proceeds from sale of environmental allowances and credits | | | — | | | | — | | | | 19 | | | | — | | | | 19 | |
Purchases of environmental allowances and credits | | | — | | | | — | | | | (19 | ) | | | — | | | | (19 | ) |
Proceeds from sales of nuclear decommissioning trust fund securities | | | — | | | | — | | | | 3,064 | | | | — | | | | 3,064 | |
Investments in nuclear decommissioning trust fund securities | | | — | | | | — | | | | (3,080 | ) | | | — | | | | (3,080 | ) |
Change in notes/advances — affiliates | | | — | | | | — | | | | (440 | ) | | | 440 | | | | — | |
Other, net | | | — | | | | — | | | | 29 | | | | — | | | | 29 | |
| | | | | | | | | | | | | | | | | | | | |
Cash used in investing activities | | | (400 | ) | | | — | | | | (2,673 | ) | | | 440 | | | | (2,633 | ) |
| | | | | | | | | | | | | | | | | | | | |
| | | | | |
Net change in cash and cash equivalents | | | (16 | ) | | | — | | | | (484 | ) | | | — | | | | (500 | ) |
Cash and cash equivalents — beginning balance | | | 1,075 | | | | — | | | | 614 | | | | — | | | | 1,689 | |
| | | | | | | | | | | | | | | | | | | | |
Cash and cash equivalents — ending balance | | $ | 1,059 | | | $ | — | | | $ | 130 | | | $ | — | | | $ | 1,189 | |
| | | | | | | | | | | | | | | | | | | | |
210
ENERGY FUTURE HOLDINGS CORP. AND SUBSIDIARIES
Condensed Consolidating Statements of Cash Flows
For the Year Ended December 31, 2008
(Millions of Dollars)
| | | | | | | | | | | | | | | | | | | | |
| | | Parent/Issuer | | | Guarantors | | | Non-guarantors | | | Eliminations | | | Consolidated | |
Cash provided by (used in) operating activities | | $ | (251 | ) | | $ | (924 | ) | | $ | 832 | | | $ | 1,848 | | | $ | 1,505 | |
| | | | | | | | | | | | | | | | | | | | |
Cash flows — financing activities: | | | | | | | | | | | | | | | | | | | | |
Issuances of long-term borrowings/securities: | | | | | | | | | | | | | | | | | | | | |
Long-term debt | | | — | | | | — | | | | 3,185 | | | | — | | | | 3,185 | |
Common stock | | | 34 | | | | — | | | | — | | | | — | | | | 34 | |
Repayments/repurchases of long-term borrowings/ securities: | | | | | | | | | | | | | | | | | | | | |
Long-term debt | | | (200 | ) | | | (7 | ) | | | (960 | ) | | | — | | | | (1,167 | ) |
Common stock | | | (3 | ) | | | — | | | | — | | | | — | | | | (3 | ) |
Change in short-term borrowings | | | — | | | | — | | | | (481 | ) | | | — | | | | (481 | ) |
Proceeds from sale of noncontrolling interests, net of transaction costs | | | 1,253 | | | | 1,253 | | | | 1,253 | | | | (2,506 | ) | | | 1,253 | |
Cash dividends paid | | | — | | | | (329 | ) | | | (329 | ) | | | 658 | | | | — | |
Change in notes/advances — affiliates | | | 205 | | | | 7 | | | | — | | | | (212 | ) | | | — | |
Other, net | | | — | | | | — | | | | 16 | | | | — | | | | 16 | |
| | | | | | | | | | | | | | | | | | | | |
Cash provided by financing activities | | | 1,289 | | | | 924 | | | | 2,684 | | | | (2,060 | ) | | | 2,837 | |
| | | | | | | | | | | | | | | | | | | | |
| | | | | |
Cash flows — investing activities: | | | | | | | | | | | | | | | | | | | | |
Capital expenditures and nuclear fuel purchases | | | — | | | | — | | | | (2,978 | ) | | | — | | | | (2,978 | ) |
Money market fund investments | | | — | | | | — | | | | (142 | ) | | | — | | | | (142 | ) |
Proceeds from sale of environmental allowances and credits | | | — | | | | — | | | | 39 | | | | — | | | | 39 | |
Purchases of environmental allowances and credits | | | — | | | | — | | | | (34 | ) | | | — | | | | (34 | ) |
Proceeds from sales of nuclear decommissioning trust fund securities | | | — | | | | — | | | | 1,623 | | | | — | | | | 1,623 | |
Investments in nuclear decommissioning trust fund securities | | | — | | | | — | | | | (1,639 | ) | | | — | | | | (1,639 | ) |
Change in notes/advances — affiliates | | | — | | | | — | | | | (212 | ) | | | 212 | | | | — | |
Other, net | | | 5 | | | | — | | | | 192 | | | | — | | | | 197 | |
| | | | | | | | | | | | | | | | | | | | |
Cash provided by (used in) investing activities | | | 5 | | | | — | | | | (3,151 | ) | | | 212 | | | | (2,934 | ) |
| | | | | | | | | | | | | | | | | | | | |
| | | | | |
Net change in cash and cash equivalents | | | 1,043 | | | | — | | | | 365 | | | | — | | | | 1,408 | |
Cash and cash equivalents — beginning balance | | | 32 | | | | — | | | | 249 | | | | — | | | | 281 | |
| | | | | | | | | | | | | | | | | | | | |
Cash and cash equivalents — ending balance | | $ | 1,075 | | | $ | — | | | $ | 614 | | | $ | — | | | $ | 1,689 | |
| | | | | | | | | | | | | | | | | | | | |
211
ENERGY FUTURE HOLDINGS CORP. AND SUBSIDIARIES
Condensed Consolidating Balance Sheets
As of December 31, 2010
(Millions of Dollars)
| | | | | | | | | | | | | | | | | | | | |
| | | Parent/Issuer | | | Guarantors | | | Non-Guarantors | | | Eliminations | | | Consolidated | |
| ASSETS | | | | | | | | | | | | | | | | | | | | |
Current assets: | | | | | | | | | | | | | | | | | | | | |
Cash and cash equivalents | | $ | 1,443 | | | $ | 43 | | | $ | 48 | | | $ | — | | | $ | 1,534 | |
Restricted cash | | | — | | | | — | | | | 33 | | | | — | | | | 33 | |
Advances to affiliates | | | — | | | | — | | | | 219 | | | | (219 | ) | | | — | |
Trade accounts receivable — net | | | 12 | | | | 73 | | | | 991 | | | | (77 | ) | | | 999 | |
Income taxes receivable | | | 47 | | | | — | | | | — | | | | (47 | ) | | | — | |
Accounts receivable from affiliates | | | 26 | | | | — | | | | — | | | | (26 | ) | | | — | |
Notes receivable from affiliates | | | 165 | | | | — | | | | 1,921 | | | | (2,086 | ) | | | — | |
Inventories | | | — | | | | — | | | | 395 | | | | — | | | | 395 | |
Commodity and other derivative contractual assets | | | 92 | | | | — | | | | 2,640 | | | | — | | | | 2,732 | |
Accumulated deferred income taxes | | | — | | | | 3 | | | | — | | | | (3 | ) | | | — | |
Margin deposits related to commodity positions | | | — | | | | — | | | | 166 | | | | — | | | | 166 | |
Other current assets | | | 2 | | | | — | | | | 58 | | | | — | | | | 60 | |
| | | | | | | | | | | | | | | | | | | | |
Total current assets | | | 1,787 | | | | 119 | | | | 6,471 | | | | (2,458 | ) | | | 5,919 | |
| | | | | |
Restricted cash | | | — | | | | — | | | | 1,135 | | | | — | | | | 1,135 | |
Receivables from unconsolidated subsidiary | | | 1,463 | | | | — | | | | — | | | | — | | | | 1,463 | |
Investments in unconsolidated subsidiaries | | | — | | | | 5,544 | | | | — | | | | — | | | | 5,544 | |
Other investments | | | 2,924 | | | | (2,300 | ) | | | 628 | | | | (555 | ) | | | 697 | |
Property, plant and equipment — net | | | — | | | | — | | | | 20,366 | | | | — | | | | 20,366 | |
Notes receivable from affiliates | | | 12 | | | | — | | | | 1,282 | | | | (1,294 | ) | | | — | |
Goodwill | | | — | | | | — | | | | 6,152 | | | | — | | | | 6,152 | |
Identifiable intangible assets — net | | | — | | | | — | | | | 2,400 | | | | — | | | | 2,400 | |
Commodity and other derivative contractual assets | | | — | | | | — | | | | 2,071 | | | | — | | | | 2,071 | |
Accumulated deferred income taxes | | | 714 | | | | — | | | | — | | | | (714 | ) | | | — | |
Other noncurrent assets, principally unamortized issuance costs | | | 95 | | | | 53 | | | | 577 | | | | (84 | ) | | | 641 | |
| | | | | | | | | | | | | | | | | | | | |
Total assets | | $ | 6,995 | | | $ | 3,416 | | | $ | 41,082 | | | $ | (5,105 | ) | | $ | 46,388 | |
| | | | | | | | | | | | | | | | | | | | |
| | | | | |
| LIABILITIES AND EQUITY | | | | | | | | | | | | | | | | | | | | |
Current liabilities: | | | | | | | | | | | | | | | | | | | | |
Short-term borrowings | | $ | — | | | $ | — | | | $ | 1,221 | | | $ | — | | | $ | 1,221 | |
Notes/advances from affiliates | | | 211 | | | | 8 | | | | — | | | | (219 | ) | | | — | |
Long-term debt due currently | | | — | | | | 9 | | | | 660 | | | | — | | | | 669 | |
Trade accounts payable | | | 1 | | | | 1 | | | | 679 | | | | — | | | | 681 | |
Payables to affiliates/unconsolidated subsidiary | | | 1,921 | | | | 46 | | | | 326 | | | | (2,039 | ) | | | 254 | |
Commodity and other derivative contractual liabilities | | | 119 | | | | — | | | | 2,164 | | | | — | | | | 2,283 | |
Margin deposits related to commodity positions | | | — | | | | — | | | | 631 | | | | — | | | | 631 | |
Accumulated deferred income taxes | | | 12 | | | | — | | | | 2 | | | | (3 | ) | | | 11 | |
Accrued interest | | | 165 | | | | 72 | | | | 302 | | | | (128 | ) | | | 411 | |
Other current liabilities | | | 3 | | | | 46 | | | | 507 | | | | (114 | ) | | | 442 | |
| | | | | | | | | | | | | | | | | | | | |
Total current liabilities | | | 2,432 | | | | 182 | | | | 6,492 | | | | (2,503 | ) | | | 6,603 | |
| | | | | |
Accumulated deferred income taxes | | | — | | | | 159 | | | | 5,738 | | | | (547 | ) | | | 5,350 | |
Commodity and other derivative contractual liabilities | | | — | | | | — | | | | 869 | | | | — | | | | 869 | |
Notes or other liabilities due affiliates/unconsolidated subsidiary | | | 1,282 | | | | — | | | | 396 | | | | (1,294 | ) | | | 384 | |
Long-term debt, less amounts due currently | | | 7,286 | | | | 4,106 | | | | 28,617 | | | | (5,783 | ) | | | 34,226 | |
Other noncurrent liabilities and deferred credits | | | 1,985 | | | | 12 | | | | 2,870 | | | | — | | | | 4,867 | |
| | | | | | | | | | | | | | | | | | | | |
Total liabilities | | | 12,985 | | | | 4,459 | | | | 44,982 | | | | (10,127 | ) | | | 52,299 | |
| | | | | |
EFH Corp. shareholders’ equity | | | (5,990 | ) | | | (1,043 | ) | | | (3,987 | ) | | | 5,030 | | | | (5,990 | ) |
Noncontrolling interests in subsidiaries | | | — | | | | — | | | | 87 | | | | (8 | ) | | | 79 | |
| | | | | | | | | | | | | | | | | | | | |
Total equity | | | (5,990 | ) | | | (1,043 | ) | | | (3,900 | ) | | | 5,022 | | | | (5,911 | ) |
| | | | | | | | | | | | | | | | | | | | |
Total liabilities and equity | | $ | 6,995 | | | $ | 3,416 | | | $ | 41,082 | | | $ | (5,105 | ) | | $ | 46,388 | |
| | | | | | | | | | | | | | | | | | | | |
212
ENERGY FUTURE HOLDINGS CORP. AND SUBSIDIARIES
Condensed Consolidating Balance Sheets
As of December 31, 2009
(Millions of Dollars)
| | | | | | | | | | | | | | | | | | | | |
| | | Parent/Issuer | | | Guarantors | | | Non-Guarantors | | | Eliminations | | | Consolidated | |
| ASSETS | | | | | | | | | | | | | | | | | | | | |
Current assets: | | | | | | | | | | | | | | | | | | | | |
Cash and cash equivalents | | $ | 1,059 | | | $ | — | | | $ | 130 | | | $ | — | | | $ | 1,189 | |
Investment posted with counterparty | | | 425 | | | | — | | | | — | | | | — | | | | 425 | |
Restricted cash | | | — | | | | — | | | | 48 | | | | — | | | | 48 | |
Advances to affiliates | | | 471 | | | | 5 | | | | — | | | | (476 | ) | | | — | |
Trade accounts receivable — net | | | 8 | | | | 2 | | | | 1,253 | | | | (3 | ) | | | 1,260 | |
Income taxes receivable | | | 23 | | | | 2 | | | | — | | | | (25 | ) | | | — | |
Accounts receivable from affiliates | | | — | | | | — | | | | 22 | | | | (22 | ) | | | — | |
Notes receivable from affiliates | | | 114 | | | | — | | | | 1,469 | | | | (1,583 | ) | | | — | |
Inventories | | | — | | | | — | | | | 485 | | | | — | | | | 485 | |
Commodity and other derivative contractual assets | | | 52 | | | | — | | | | 2,339 | | | | — | | | | 2,391 | |
Accumulated deferred income taxes | | | — | | | | 3 | | | | 11 | | | | (9 | ) | | | 5 | |
Margin deposits related to commodity positions | | | — | | | | — | | | | 187 | | | | — | | | | 187 | |
Other current assets | | | 2 | | | | — | | | | 134 | | | | — | | | | 136 | |
| | | | | | | | | | | | | | | | | | | | |
Total current assets | | | 2,154 | | | | 12 | | | | 6,078 | | | | (2,118 | ) | | | 6,126 | |
| | | | | |
Restricted cash | | | — | | | | — | | | | 1,149 | | | | — | | | | 1,149 | |
Investments in unconsolidated subsidiaries | | | — | | | | — | | | | 44 | | | | — | | | | 44 | |
Other investments | | | 4,586 | | | | 3,634 | | | | 638 | | | | (8,152 | ) | | | 706 | |
Property, plant and equipment — net | | | — | | | | — | | | | 30,108 | | | | — | | | | 30,108 | |
Notes receivable from affiliates | | | 12 | | | | — | | | | 2,236 | | | | (2,248 | ) | | | — | |
Goodwill | | | — | | | | — | | | | 14,316 | | | | — | | | | 14,316 | |
Identifiable intangible assets — net | | | — | | | | — | | | | 2,876 | | | | — | | | | 2,876 | |
Regulatory assets — net | | | — | | | | — | | | | 1,959 | | | | — | | | | 1,959 | |
Commodity and other derivative contractual assets | | | — | | | | — | | | | 1,533 | | | | — | | | | 1,533 | |
Accumulated deferred income taxes | | | 647 | | | | 111 | | | | — | | | | (758 | ) | | | — | |
Noncurrent assets, principally unamortized debt issuance costs | | | 108 | | | | 99 | | | | 733 | | | | (95 | ) | | | 845 | |
| | | | | | | | | | | | | | | | | | | | |
Total assets | | $ | 7,507 | | | $ | 3,856 | | | $ | 61,670 | | | $ | (13,371 | ) | | $ | 59,662 | |
| | | | | | | | | | | | | | | | | | | | |
| | | | | |
| LIABILITIES AND EQUITY | | | | | | | | | | | | | | | | | | | | |
Current liabilities: | | | | | | | | | | | | | | | | | | | | |
Short-term borrowings | | $ | — | | | $ | — | | | $ | 1,569 | | | $ | — | | | $ | 1,569 | |
Notes/advances from affiliates | | | — | | | | — | | | | 476 | | | | (476 | ) | | | — | |
Long-term debt due currently | | | — | | | | 8 | | | | 409 | | | | — | | | | 417 | |
Trade accounts payable | | | 4 | | | | — | | | | 892 | | | | — | | | | 896 | |
Accounts payable to affiliates | | | 16 | | | | 6 | | | | — | | | | (22 | ) | | | — | |
Notes payable to affiliates | | | 1,406 | | | | 27 | | | | 150 | | | | (1,583 | ) | | | — | |
Commodity and other derivative contractual liabilities | | | 82 | | | | — | | | | 2,310 | | | | — | | | | 2,392 | |
Margin deposits related to commodity positions | | | — | | | | — | | | | 520 | | | | — | | | | 520 | |
Accumulated deferred income taxes | | | 9 | | | | — | | | | — | | | | (9 | ) | | | — | |
Accrued interest | | | 119 | | | | 93 | | | | 408 | | | | (94 | ) | | | 526 | |
Other current liabilities | | | 7 | | | | — | | | | 761 | | | | (24 | ) | | | 744 | |
| | | | | | | | | | | | | | | | | | | | |
Total current liabilities | | | 1,643 | | | | 134 | | | | 7,495 | | | | (2,208 | ) | | | 7,064 | |
| | | | | |
Accumulated deferred income taxes | | | — | | | | — | | | | 6,764 | | | | (633 | ) | | | 6,131 | |
Investment tax credits | | | — | | | | — | | | | 37 | | | | — | | | | 37 | |
Commodity and other derivative contractual liabilities | | | — | | | | — | | | | 1,060 | | | | — | | | | 1,060 | |
Notes or other liabilities due affiliates | | | 2,019 | | | | — | | | | 229 | | | | (2,248 | ) | | | — | |
Long-term debt, less amounts due currently | | | 6,626 | | | | 4,975 | | | | 34,740 | | | | (4,901 | ) | | | 41,440 | |
Other noncurrent liabilities and deferred credits | | | 466 | | | | 3 | | | | 5,297 | | | | — | | | | 5,766 | |
| | | | | | | | | | | | | | | | | | | | |
Total liabilities | | | 10,754 | | | | 5,112 | | | | 55,622 | | | | (9,990 | ) | | | 61,498 | |
| | | | | |
EFH Corp. shareholders’ equity | | | (3,247 | ) | | | (1,256 | ) | | | 4,637 | | | | (3,381 | ) | | | (3,247 | ) |
Noncontrolling interests in subsidiaries | | | — | | | | — | | | | 1,411 | | | | — | | | | 1,411 | |
| | | | | | | | | | | | | | | | | | | | |
Total equity | | | (3,247 | ) | | | (1,256 | ) | | | 6,048 | | | | (3,381 | ) | | | (1,836 | ) |
| | | | | | | | | | | | | | | | | | | | |
Total liabilities and equity | | $ | 7,507 | | | $ | 3,856 | | | $ | 61,670 | | | $ | (13,371 | ) | | $ | 59,662 | |
| | | | | | | | | | | | | | | | | | | | |
213
| Item 9. | CHANGES IN AND DISAGREEMENTS WITH ACCOUNTANTS ON ACCOUNTING AND FINANCIAL DISCLOSURE |
None.
| Item 9A. | CONTROLS AND PROCEDURES |
An evaluation was performed under the supervision and with the participation of our management, including the principal executive officer and principal financial officer, of the effectiveness of the design and operation of the disclosure controls and procedures in effect as of December 31, 2010. Based on the evaluation performed, our management, including the principal executive officer and principal financial officer, concluded that the disclosure controls and procedures were effective.
There has been no change in our internal control over financial reporting during the most recently completed fiscal quarter that has materially affected, or is reasonably likely to materially affect, our internal control over financial reporting.
214
ENERGY FUTURE HOLDINGS CORP.
MANAGEMENT’S ANNUAL REPORT ON
INTERNAL CONTROL OVER FINANCIAL REPORTING
The management of Energy Future Holdings Corp. is responsible for establishing and maintaining adequate internal control over financial reporting (as defined in Rules 13a-15(f) and 15d-15(f) under the Securities Exchange Act of 1934) for the company. Energy Future Holdings Corp.’s internal control over financial reporting is designed to provide reasonable assurance regarding the reliability of financial reporting and the preparation of financial statements for external purposes in accordance with generally accepted accounting principles. Because of its inherent limitations, internal control over financial reporting may not prevent or detect misstatements. Also, projections of any evaluation of effectiveness to future periods are subject to the risk that controls may become inadequate because of changes in condition or the deterioration of compliance with procedures or policies.
The management of Energy Future Holdings Corp. performed an evaluation as of December 31, 2010 of the effectiveness of the company’s internal control over financial reporting based on the Committee of Sponsoring Organizations of the Treadway Commission’s (COSO’s)Internal Control—Integrated Framework. Based on the review performed, management believes that as of December 31, 2010 Energy Future Holdings Corp.’s internal control over financial reporting was effective.
The independent registered public accounting firm of Deloitte & Touche LLP as auditors of the consolidated financial statements of Energy Future Holdings Corp. has issued an attestation report on Energy Future Holdings Corp.’s internal control over financial reporting.
| | | | |
/s/ JOHN F. YOUNG | | | | /s/ PAUL M. KEGLEVIC |
| John F. Young, President and | | | | Paul M. Keglevic, Executive Vice President |
| Chief Executive Officer | | | | and Chief Financial Officer |
February 17, 2011
215
REPORT OF INDEPENDENT REGISTERED PUBLIC ACCOUNTING FIRM
To the Board of Directors and Shareholders of Energy Future Holdings Corp.
Dallas, Texas
We have audited the internal control over financial reporting of Energy Future Holdings Corp. and subsidiaries (“EFH Corp.”) as of December 31, 2010 based on criteria established inInternal Control – Integrated Framework issued by the Committee of Sponsoring Organizations of the Treadway Commission. EFH Corp.’s management is responsible for maintaining effective internal control over financial reporting and for its assessment of the effectiveness of internal control over financial reporting, included in the accompanying Management’s Annual Report on Internal Control Over Financial Reporting. Our responsibility is to express an opinion on EFH Corp.’s internal control over financial reporting based on our audit.
We conducted our audit in accordance with the standards of the Public Company Accounting Oversight Board (United States). Those standards require that we plan and perform the audit to obtain reasonable assurance about whether effective internal control over financial reporting was maintained in all material respects. Our audit included obtaining an understanding of internal control over financial reporting, assessing the risk that a material weakness exists, testing and evaluating the design and operating effectiveness of internal control based on the assessed risk, and performing such other procedures as we considered necessary in the circumstances. We believe that our audit provides a reasonable basis for our opinion.
A company’s internal control over financial reporting is a process designed by, or under the supervision of, the company’s principal executive and principal financial officers, or persons performing similar functions, and effected by the company’s board of directors, management, and other personnel to provide reasonable assurance regarding the reliability of financial reporting and the preparation of financial statements for external purposes in accordance with generally accepted accounting principles. A company’s internal control over financial reporting includes those policies and procedures that (1) pertain to the maintenance of records that, in reasonable detail, accurately and fairly reflect the transactions and dispositions of the assets of the company; (2) provide reasonable assurance that transactions are recorded as necessary to permit preparation of financial statements in accordance with generally accepted accounting principles, and that receipts and expenditures of the company are being made only in accordance with authorizations of management and directors of the company; and (3) provide reasonable assurance regarding prevention or timely detection of unauthorized acquisition, use, or disposition of the company’s assets that could have a material effect on the financial statements.
Because of the inherent limitations of internal control over financial reporting, including the possibility of collusion or improper management override of controls, material misstatements due to error or fraud may not be prevented or detected on a timely basis. Also, projections of any evaluation of the effectiveness of the internal control over financial reporting to future periods are subject to the risk that the controls may become inadequate because of the changes in conditions, or that the degree of compliance with the policies or procedures may deteriorate.
In our opinion, EFH Corp. maintained, in all material respects, effective internal control over financial reporting as of December 31, 2010, based on the criteria established inInternal Control – Integrated Framework issued by the Committee of Sponsoring Organizations of the Treadway Commission.
We have also audited, in accordance with the standards of the Public Company Accounting Oversight Board (United States), the consolidated financial statements as of December 31, 2010 and for the year ended December 31, 2010 of EFH Corp. and our report dated February 17, 2011 expressed an unqualified opinion on those financial statements and included an explanatory paragraph regarding EFH Corp’s adoption of amended consolidation accounting standards related to variable interest entities and EFH Corp.’s adoption of amended guidance regarding transfers of financial assets effective January 1, 2010, on a prospective basis.
|
| /s/ Deloitte & Touche LLP |
|
| Dallas, Texas |
| February 17, 2011 |
216
| Item 9B. | OTHER INFORMATION |
On February 15, 2011, the Organization and Compensation Committee (O&C Committee) of the Board approved several modifications to our executive officers’ compensation arrangements, including certain amendments to their employment agreements. After considering relevant market data and other pertinent considerations, the O&C Committee made these modifications to provide additional incentives to ensure strong performance and retention, and to maintain alignment between our executive officers and our shareholders.
Long Term Cash Incentive Awards
The O&C Committee approved a modification to the retention incentive awards that were granted to the Named Executive Officers in October 2009 (February 2010, with respect to Mr. Young). Under the terms of the original retention incentive award, each of the Named Executive Officers will be entitled to receive on September 30, 2012, to the extent such Named Executive Officer remains employed by EFH Corp. on such date, a one-time, lump-sum cash payment equal to 75% (100% with respect to Mr. Young) of the aggregate AIP award received by such executive officer for fiscal years 2009, 2010 and 2011 (the Initial LTI Award). As modified, the Initial LTI Award will include an additional amount (such additional amount, the 2011 LTI Award) of between $650,000.00 and $1,300,000.00 ($750,000.00 and $1,500,000.00 with respect to Mr. Young), which is only payable if the executive is paid the full Initial LTI Award. The actual amount of the 2011 LTI Award will be determined (subject to interpolation) by company performance as indicated by the level of management EBITDA actually achieved for the fiscal year ended December 31, 2011 relative to the management EBITDA threshold and target amounts set by the O&C Committee for the fiscal year ended December 31, 2011. Provided that the executive remains employed by EFH Corp. on such dates, half of the 2011 LTI Award will be deferred and paid on September 30, 2012, and the other half of the 2011 LTI Award will be deferred and paid on September 30, 2013.
In addition, each of the Named Executive Officers will be entitled to receive additional retention incentive awards (collectively, the 2014 LTI Award) as follows:
| | • | | An award of between $500,000 and $1,000,000 ($1,350,000 and $2,700,000 with respect to Mr. Young), with the actual amount of the award to be determined (subject to interpolation) by company performance as indicated by the level of management EBITDA actually achieved for the fiscal year ended December 31, 2012 relative to the management EBITDA threshold and target amounts set by the O&C Committee for the fiscal year ended December 31, 2012; and |
| | • | | An award of between $500,000 and $1,000,000 ($1,350,000 and $2,700,000 with respect to Mr. Young), with the actual amount of the award to be determined (subject to interpolation) by company performance as indicated by the level of management EBITDA actually achieved for the fiscal year ended December 31, 2013 relative to the management EBITDA threshold and target amounts set by the O&C Committee for the fiscal year ended December 31, 2013; and |
| | • | | An award of between $500,000 and $1,000,000 ($1,350,000 and $2,700,000 with respect to Mr. Young), with the actual amount of the award to be determined (subject to interpolation) by company performance as indicated by the level of management EBITDA actually achieved for the fiscal year ended December 31, 2014 relative to the management EBITDA threshold and target amounts set by the O&C Committee for the fiscal year ended December 31, 2014. |
Payment of the 2014 LTI Award will be deferred until March 13, 2015, and will be subject to the condition that the Named Executive Officer continues to be employed by EFH Corp. on such date. Both the 2011 LTI Award and the 2014 LTI Award will be subject, in limited circumstances, to acceleration and/or pro-ration in the event of the Named Executive Officer’s termination without “cause” or resignation for “good reason,” or in the event of such Named Executive Officer’s death or disability, as described in greater detail in the Named Executive Officer’s amended employment agreement.
Exchange of Stock Options for Restricted Stock Units
The O&C Committee also approved an exchange program, pursuant to which each of its executive officers, including the Named Executive Officers, would be entitled to receive a one-time lump sum grant of restricted stock units that cliff-vest 100% on September 30, 2014 (the Exchange RSUs) under and subject to the terms of the 2007 Stock Incentive Plan for Key Employees of EFH Corp. and Affiliates (the 2007 Plan), in exchange for forfeiting all rights in respect of any and all options to purchase shares of EFH Corp.’s common stock that were granted to the executive officers under the 2007 Plan as set forth below:
| | | | |
Executive Officer | | Surrendered Options | | Exchange RSUs |
| | |
John F. Young | | 9,000,000 | | 4,500,000 |
| | |
Paul M. Keglevic | | 3,000,000 | | 1,500,000 |
| | |
David A. Campbell | | 4,800,000 | | 2,400,000 |
| | |
James A. Burke | | 2,650,000 | | 1,325,000 |
| | |
M.A. McFarland | | 2,400,000 | | 1,200,000 |
The grant of Exchange RSUs will be made as soon as reasonably practical following an exchange period, and will be evidenced by a written agreement that is approved by the O&C Committee with the concurrence of the executive officer.
Annual Grant of RSUs:
In addition, under the terms of their amended employment agreements, the Company’s executive officers, including each of the Named Executive Officers, will be entitled to receive annual grants of restricted stock units (the Annual RSUs) under and subject to the terms of the 2007 Plan, in each of 2011, 2012 and 2013. For the Named Executive Officers, the grant of Annual RSUs for each of the 2011, 2012 and 2013 calendar years will consist of 500,000 cliff-vesting restricted stock units (666,667 with respect to Mr. Campbell and 1,500,000 with respect to Mr. Young) that will vest 100% on September 30, 2014. The initial Annual RSU grant for 2011 will be made as soon as reasonably practical, and the annual awards for 2012 and 2013 will be made following, and in connection with such year’s February meeting of the O&C Committee.
The Annual RSU awards will be subject to such terms, conditions and restrictions contained in the executive officer’s amended employment agreement, including, but not limited to, a provision that if there is a Change in Control (as that term is defined in the agreement) of EFH Corp., all ungranted Annual RSUs that would have been made to the executive in each of 2011, 2012 and 2013 will be immediately granted and vested.
PART III
| Item 10. | DIRECTORS, EXECUTIVE OFFICERS AND CORPORATE GOVERNANCE |
Directors
The names of EFH Corp.’s directors and information about them, as furnished by the directors themselves, are set forth below:
| | | | | | |
Name | | Age | | Served As
Director
Since | | Business Experience |
| | | |
| Arcilia C. Acosta (1)(4) | | 45 | | 2008 | | Arcilia C. Acosta has served as a Director of EFH Corp. since May 2008. During the last seven years, Ms. Acosta’s principal occupation and employment has been serving as the CEO of CARCON Industries & Construction, L.L.C. (CARCON) and its subsidiaries. She is also the CEO of Southwestern Testing Laboratories, L.L.C. (STL). CARCON’s principal business is commercial, institutional and transportation construction. STL’s principal business is geotechnical engineering, construction materials testing and environmental consulting. Ms. Acosta is a former Chair of the State of Texas Hispanic chambers organization known as the Texas Association of Mexican American Chambers of Commerce (TAMACC) and the Greater Dallas Hispanic Chamber of Commerce. Ms. Acosta serves on the Board of Advisors for BBVA Compass Bank and the Board of Directors of the Dallas Citizens Council. |
| | | |
| David Bonderman | | 68 | | 2007 | | David Bonderman has served as a Director of EFH Corp. since October 2007. He is a founding partner of TPG Capital, L.P. (TPG). Mr. Bonderman serves on the boards of the following companies: Armstrong World Industries, Inc., Ceasars Entertainment Corporation (formerly Harrahs’s Entertainment), CoStar Group, Inc., General Motors Company, Ryanair Holdings plc, for which he serves as Chairman of the Board, and Univision Communications, Inc. During the past five years, Mr. Bonderman also served on the boards of Burger King Corporation, Burger King Holdings, Inc., Ducati Motor Holding S.P.A., Gemplus International S.A. (predecessor to Gemalto N.V.), Gemalto N.V., IASIS Healthcare Corporation, and Washington Mutual, Inc. |
| | | |
| Donald L. Evans (2)(3)(4) | | 64 | | 2007 | | Donald L. Evans has served as a Director and Non-Executive Chairman of EFH Corp. since October 2007. He is also a Senior Partner at Quintana Energy Partners, L.P. He was CEO of the Financial Services Forum from 2005 to 2007, after serving as the 34th secretary of the U.S. Department of Commerce. Before serving as Secretary of Commerce, Mr. Evans was the former CEO of Tom Brown, Inc., a large independent energy company. He also previously served as a member and chairman of the Board of Regents of the University of Texas System. |
217
| | | | | | |
Name | | Age | | Served As
Director
Since | | Business Experience |
| | | |
| Thomas D. Ferguson (3) | | 57 | | 2008 | | Thomas D. Ferguson has served as a Director of EFH Corp. since December 2008. He is a Managing Director of Goldman, Sachs & Co., having joined the firm in 2002. Mr. Ferguson heads the asset management efforts for the merchant bank’s U.S. real estate and infrastructure investment activity. He currently serves on the board of Carrix, one of the largest private container terminal operators in the world, American Golf, for which he serves as the company’s non-executive Chairman, Agriculture Company of America, EFIH and Oncor. He formerly held board seats at Associated British Ports, the largest port company in the UK, as well as Red de Carreteras, a toll road concessionaire in Mexico. |
| | | |
| Frederick M. Goltz (2)(3) | | 39 | | 2007 | | Frederick M. Goltz has served as a Director of EFH Corp. since October 2007. He has been with Kohlberg Kravis Roberts and Co., L.P. (KKR) for 15 years. Mr. Goltz has played a significant role in the development of many of the themes pursued by KKR in the energy space, including those related to integrated utilities, merchant generation, and oil and gas exploration and production. He now heads KKR’s Mezzanine Fund headquartered in San Francisco. He is a director of EFCH and TCEH. During the past five years, Mr. Goltz also served on the boards of Accuride Corp. and Texas Genco Holdings, Inc. |
| | | |
| James R. Huffines (1)(3) | | 59 | | 2007 | | James R. Huffines has served as a Director of EFH Corp. since October 2007. He is President and Chief Operating Officer of PlainsCapital Corporation, a $5.5 billion bank and financial service firm. He previously served as Chairman, Central and South Texas Region, of PlainsCapital Bank and Senior Executive Vice President of Plains Capital Corporation from March 2001 to November 2010, Chairman of the University of Texas System Board of Regents from April 2009 to July 2010, Vice Chairman from November 2007 to April 2009 and Chairman from June 2004 to November 2007. Mr. Huffines is a director of Andrew Harper Travel Publications, Inc., EFIH and PlainsCapital Bank. |
| | | |
| Scott Lebovitz | | 35 | | 2007 | | Scott Lebovitz has served as a Director of EFH Corp. since October 2007. He is a Managing Director of Goldman, Sachs & Co. in its Principal Investment Area since 2007 having joined Goldman, Sachs & Co. in 1997. Mr. Lebovitz serves on the boards of both public and private companies, including CVR Energy, Inc., EFCH and TCEH. |
| | | |
| Jeffrey Liaw | | 34 | | 2007 | | Jeffrey Liaw has served as a Director of EFH Corp. since October 2007. He is a principal of TPG and is active in TPG’s energy and industrial investing practice areas. Before joining TPG in 2005, he worked for Bain Capital in its industrials practice. Mr. Liaw serves on the boards of both public and private companies, including EFIH, Graphic Packaging Holding Company, American Tire Distributors, Inc. and Oncor. |
218
| | | | | | |
Name | | Age | | Served As
Director
Since | | Business Experience |
| | | |
| Marc S. Lipschultz (4) | | 42 | | 2007 | | Marc S. Lipschultz has served as a Director of EFH Corp. since October 2007. He joined KKR in 1995 and is the global head of KKR’s Energy and Infrastructure business. Mr. Lipschultz serves on KKR’s Management Committee and its Infrastructure Investment Committee. Currently, he is on the board of Accel-KKR Company. During the past five years, Mr. Lipschultz also served on the boards of Texas Genco Holdings, Inc. and The Boyds Collection, Ltd.. |
| | | |
| Michael MacDougall (2)(3) | | 40 | | 2007 | | Michael MacDougall has served as a Director of EFH Corp. since October 2007. He is a partner of TPG. Mr. MacDougall leads the firm’s global energy and natural resources investing efforts. Prior to joining TPG in 2002, Mr. MacDougall was a vice president in the Principal Investment Area of the Merchant Banking Division of Goldman, Sachs & Co., where he focused on private equity and mezzanine investments. Mr. MacDougall is a director of both public and private companies, including Copano Energy, L.L.C., Graphic Packaging Holding Company, Harvester Holdings, LLC and its two subsidiaries, Petro Harvester Oil and Gas, LLC and 2CO Energy Limited, Kraton Performance Polymers Inc., Northern Tier Energy, LLC, EFCH, and TCEH and is a director of the general partner of Valerus Compression Services, L.P. During the past five years, he also served on the boards of Aleris International and Texas Genco LLC prior to its sale to NRG Energy, Inc. in February 2006. Mr. MacDougall also serves as the Chairman of the Board of The Opportunity Network and is a member of the Board of the Dwight School Foundation and Islesboro Affordable Property. |
| | | |
| Lyndon L. Olson, Jr. (3) | | 63 | | 2007 | | Lyndon L. Olson, Jr. has served as a Director of EFH Corp. since October 2007. He was a Senior Advisor with Citigroup Inc. from 2002 to 2008, after serving as United States Ambassador to Sweden from 1998 to 2001. He previously was affiliated with Citigroup from 1990 to 1998, as President and CEO of Travelers Insurance Holdings and the Associated Madison Companies, predecessor companies. Before joining Citigroup, he had been President of the National Group Corporation and CEO of its National Group Insurance Company. Ambassador Olson also is a former Chairman and a Member of the Texas 173 State Board of Insurance, former President of the National Association of Insurance Commissioners, and a former member of the Texas House of Representatives. Ambassador Olson also serves on the board of First Acceptance Corporation, Sammons Enterprises and Texas Meter and Device Company. |
| | | |
| Kenneth Pontarelli (2)(4) | | 40 | | 2007 | | Kenneth Pontarelli has served as a Director of EFH Corp. since October 2007. He is a Managing Director of Goldman, Sachs & Co. in its Principal Investment Area. He transferred to the Principal Investment Area in 1999 and was promoted to Managing Director in 2004. Mr. Pontarelli serves as a director of both public and private companies, including CCS, Inc., Cobalt International Energy, L.P., EFIH, Expro International Group Ltd. and Kinder Morgan, Inc. During the past five years, he also served on the board of CVR Energy, Inc. |
219
| | | | | | |
Name | | Age | | Served As
Director
Since | | Business Experience |
| | | |
| William K. Reilly | | 71 | | 2007 | | William K. Reilly has served as a Director of EFH Corp. since October 2007. He is a Senior Advisor to TPG and a founding partner of Aqua International Partners, an investment group that invests in companies that serve the water and renewable energy sectors, having previously served as the seventh Administrator of the EPA. Mr. Reilly is a director of the following public companies: E.I DuPont de Nemours and Company, ConocoPhillips and Royal Caribbean International. During the past five years, he also served on the board of Eden Springs, Ltd. of Israel. Before serving as EPA Administrator, Mr. Reilly was President of World Wildlife Fund and President of The Conservation Foundation. He previously served as Executive Director of the Rockefeller Task Force on Land Use and Urban Growth, a senior staff member of the President’s Council on Environmental Quality, Associate Director of the Urban Policy Center and the National Urban Coalition and Co-Chairman of the National Commission on Energy Policy. Mr. Reilly was appointed by the President to serve as Co-Chair of the National Commission on the Deepwater Horizon Oil Spill and Offshore Drilling. |
| | | |
| Jonathan D. Smidt | | 38 | | 2007 | | Jonathan D. Smidt has served as a Director of EFH Corp. since October 2007. He has been with KKR since 2000, where he is a partner and senior member of the firm’s Energy and Infrastructure team and leads KKR Natural Resources, the firm’s platform to acquire and operate oil and natural gas assets. Currently, he is a director of Laureate Education Inc. |
| | | |
| John F. Young (2)(3) | | 54 | | 2008 | | John F. Young has served as a Director and President and Chief Executive of EFH Corp. since January 2008. Before joining EFH Corp., Mr. Young served in many leadership roles at Exelon Corporation from March 2003 to January 2008 including Executive Vice President of Finance and Markets and Chief Financial Officer of Exelon Corporation; President of Exelon Generation; and President and Chief Operating Officer of Exelon Power. Prior to joining Exelon Corporation, Mr. Young was Senior Vice President of Sierra Pacific Resources Corporation. Mr. Young is also a director of EFCH, EFIH, TCEH and Luminant. |
| | | |
| Kneeland Youngblood (1) | | 55 | | 2007 | | Kneeland Youngblood has served as a Director of EFH Corp. since October 2007. He is a founding partner of Pharos Capital Group, a private equity firm that focuses on providing growth and expansion capital to businesses in technology, business services and health care services. Mr. Youngblood is a director of the following public companies: Starwood Hotels and Resorts Worldwide, Inc. and Gap Inc. During the last five years, he served on the board of Burger King Holdings, Inc. Mr. Youngblood is a member of the Council on Foreign Relations. |
| (1) | Member of Audit Committee. |
| (2) | Member of Executive Committee. |
| (3) | Member of Governance and Public Affairs Committee |
| (4) | Member of Organization and Compensation Committee |
There is no family relationship between any of the above-named directors.
220
Director Qualifications
In October 2007, David Bonderman, Donald L. Evans, Frederick M. Goltz, James R. Huffines, Scott Lebovitz, Jeffrey Liaw, Marc S. Lipschultz, Michael MacDougall, Lyndon L. Olson, Jr., Kenneth Pontarelli, William K. Reilly, Jonathan D. Smidt, and Kneeland Youngblood were elected to EFH Corp.’s board of directors (the Board). Arcilia C. Acosta, Thomas D. Ferguson and John F. Young joined the Board in 2008. Messrs. Bonderman, Ferguson, Goltz, Lebovitz, Liaw, Lipschultz, MacDougall, Pontarelli, and Smidt are collectively referred to as the “Sponsor Directors.” Ms. Acosta and Messrs. Evans, Huffines, Olson, Reilly, Young, and Youngblood are collectively referred to as the “Non-Sponsor Directors.”
Each of the Sponsor Directors was elected to the Board pursuant to the Limited Partnership Agreement of Texas Energy Future Holdings Limited Partnership, the holder of a majority of the outstanding capital stock of EFH Corp. Pursuant to this agreement, Messrs. Goltz, Lipschultz and Smidt were appointed to the Board as a consequence of their relationships with Kohlberg Kravis Roberts & Co.; Messrs. Bonderman, Liaw and MacDougall were appointed to the Board as a consequence of their relationships with TPG Capital, L.P., and Messrs. Ferguson, Lebovitz and Pontarelli were appointed to the Board as a consequence of their relationships with GS Capital Partners.
When considering whether the Board’s directors and nominees have the experience, qualifications, attributes and skills, taken as a whole, to enable the Board to satisfy its oversight responsibilities effectively in light of EFH Corp.’s business and structure, the Board focused primarily on the qualifications summarized in each of the Board member’s or nominee’s biographical information set forth on the pages above. In addition, EFH Corp. believes that each of its directors possesses high ethical standards, acts with integrity, and exercises careful judgment. Each is committed to employing his/her skills and abilities in the long-term interests of EFH Corp and its stakeholders. Finally, our directors are knowledgeable and experienced in business, governmental, and civic endeavors, further qualifying them for service as members of the Board.
The Sponsor Directors possess experience in owning and managing privately held enterprises and are familiar with corporate finance and strategic business planning activities of highly-leveraged companies such as EFH Corp. Some of the Sponsor Directors also have experience advising and overseeing the operations of large industrial, manufacturing or retail companies similar to our businesses. Finally, several of the Sponsor Directors possess substantial expertise in advising and managing companies in segments of energy industry, including, among others, power generation, oil and gas, and energy infrastructure and transportation.
As a group and individually, the Non-Sponsor Directors possess extensive experience in governmental and civic endeavors and in the business community, in each case, in the markets where our businesses operate.
Mr. Young’s employment agreement provides that he will serve as a member of the Board during the time he is employed by EFH Corp. Before joining EFH Corp. as President and Chief Executive Officer, he held various senior management positions at other companies in the energy industry over twenty years, including, most recently, his role as Executive Vice President of Finance and Markets and Chief Financial Officer of Exelon Corporation.
221
Ms. Acosta manages the operations of a large commercial construction company in Texas and has significant experience within the local Hispanic business community, having served as the chair of the Greater Dallas Hispanic Chamber of Commerce and the Texas Association of Mexican American Chambers of Commerce. Mr. Evans has demonstrated ability and achievement in both the private and public sectors, serving as U.S. Secretary of Commerce during the Bush Administration, and both before and after his government service, acting as Chairman and Chief Executive Officer of a publicly-owned energy company, Tom Brown, Inc. Mr. Huffines has demonstrated achievement in both business and academic endeavors, and, given his employment in various senior management positions in the banking industry, has sufficient experience and expertise in financial matters to qualify him to serve as EFH Corp.’s “audit committee financial expert.” Mr. Olson possesses substantial experience in both federal and state government through, among other things, his service as the former US Ambassador to Sweden and as a former member of the Texas House of Representatives, and has advised and overseen the operations of large companies, in particular his service in the insurance industry. Mr. Reilly possesses a distinguished record of public service and extensive policy-making experience as a former administrator of the EPA, lectures extensively on environmental issues facing companies operating in the energy industry and has served as Co-Chairman of the National Commission on Energy Policy. Mr. Youngblood has served on numerous boards for large public companies, has extensive experience managing and advising companies in his capacity as a partner in a private equity firm (not affiliated with the Sponsor Group), is highly knowledgeable of federal and state political matters, and has served on the board of directors of the United States Enrichment Corporation, a company that contracts with the US Department of Energy to produce enriched uranium for use in nuclear power plants.
222
Executive Officers
The names and information regarding EFH Corp.’s executive officers are set forth below:
| | | | | | | | |
Name of Officer | | Age | | Positions and Offices Presently Held | | Date First Elected to Present Offices | | Business Experience (Preceding Five Years) |
| | | | |
| John F. Young | | 54 | | President and Chief Executive Officer of EFH Corp. | | January 2008 | | John F. Young was elected President and Chief Executive Officer of EFH Corp. in January 2008. Before joining EFH Corp., Mr. Young served in many leadership roles at Exelon Corporation from March 2003 to January 2008, including Executive Vice President of Finance and Markets and Chief Financial Officer of Exelon Corporation; President of Exelon Generation; and President and Chief Operating Officer of Exelon Power. Prior to joining Exelon, Mr. Young was Senior Vice President of Sierra Pacific Resources Corporation. |
| | | | |
| James A. Burke | | 42 | | President and Chief Executive of TXU Energy | | August 2005 | | James A. Burke was elected President and Chief Executive of TXU Energy in August 2005. Previously, Mr. Burke was Senior Vice President Consumer Markets of TXU Energy. |
| | | | |
| David A. Campbell | | 42 | | President and Chief Executive of Luminant | | June 2008 | | David A. Campbell was elected President and Chief Executive of Luminant in June 2008. Mr. Campbell was Executive Vice President and Chief Financial Officer of EFH Corp. from April 2007 to June 2008 having previously served as Acting Chief Financial Officer beginning in March 2006 and as Executive Vice President for Corporate Planning, Strategy & Risk when he joined EFH Corp. in May 2004. |
| | | | |
| Joel D. Kaplan | | 41 | | Executive Vice President of EFH Corp. | | November 2009 | | Joel D. Kaplan was elected Executive Vice President of EFH Corp. in November 2009 and oversees the company’s public affairs organization. Prior to joining EFH Corp., Mr. Kaplan served as Deputy Chief of Staff in the George W. Bush White House from 2006 to 2008 and Deputy Director of the Office of Management and Budget from 2003 to 2006. |
| | | | |
| Paul M. Keglevic | | 57 | | Executive Vice President and Chief Financial Officer of EFH Corp. | | July 2008 | | Paul M. Keglevic was elected Executive Vice President and Chief Financial Officer of EFH Corp. in July 2008. Before joining EFH Corp., he was an audit partner at PricewaterhouseCoopers. Mr. Keglevic was PricewaterhouseCoopers’ Utility Sector Leader from 2002 to 2008 and Clients and Sector Assurance Leader from 2007 to 2008. |
223
| | | | | | | | |
Name of Officer | | Age | | Positions and Offices Presently Held | | Date First Elected to Present Offices | | Business Experience (Preceding Five Years) |
| | | | |
| Richard J. Landy | | 65 | | Executive Vice President of EFH Corp. | | February 2010 | | Richard J. Landy was elected Executive Vice President of EFH Corp. in February 2010 and oversees human resources. Prior to joining EFH Corp., Mr. Landy was owner and consultant of Richard J. Landy, LLC from 2007 to 2009 and Senior Vice President of Exelon Corporation from 2002 to 2007. |
| | | | |
| M. A. McFarland | | 41 | | Executive Vice President and Chief Commercial Officer of Luminant and Executive Vice President of EFH Corp. | | July 2008 | | M. A. McFarland was elected Executive Vice President and Chief Commercial Officer of Luminant and Executive Vice President of EFH Corp. in July 2008. Before joining Luminant, Mr. McFarland served as Senior Vice President of Mergers, Acquisitions and Divestitures and as a Vice President in the wholesale marketing and trading division power team at Exelon Corporation. |
| | | | |
| Robert C. Walters (1) | | 52 | | Executive Vice President and General Counsel of EFH Corp. | | March 2008 | | Robert C. Walters was elected Executive Vice President and General Counsel of EFH Corp. in March 2008. Prior to joining EFH Corp., Mr. Walters was a Partner of Vinson & Elkins LLP and served on the firm’s management committee. Mr. Walters was co-managing partner of the Dallas office of Vinson & Elkins LLP from 1998 through 2005. |
| (1) | Mr. Walters has announced his plan to resign from EFH Corp. during the first quarter 2011. |
There is no family relationship between any of the above-named executive officers.
Audit Committee Financial Expert
The Board has determined that James R. Huffines is an “Audit Committee Financial Expert” as defined in Item 407(d)(5) of SEC Regulation S-K and Mr. Huffines is independent under the New York Stock Exchange’s audit committee independence requirements for issuers of debt securities.
Code of Conduct
EFH Corp. maintains certain corporate governance documents on EFH Corp’s website atwww.energyfutureholdings.com. EFH Corp.’s Code of Conduct can be accessed by selecting “Investor Relations” on the EFH Corp. website. EFH Corp.’s Code of Conduct applies to all of its employees, officers (including the Chief Executive Officer, Chief Financial Officer and Principal Accounting Officer) and directors. Any amendments to the Code of Conduct will be posted on EFH Corp.’s website. Printed copies of the corporate governance documents that are posted on EFH Corp.’s website are also available to any investor upon request to the Secretary of EFH Corp. at 1601 Bryan Street, Dallas, Texas 75201-3411.
224
Procedures for Shareholders to Nominate Directors; Arrangement to Serve as Directors
The Amended and Restated Limited Liability Company Agreement of Texas Energy Future Capital Holdings LLC, the general partner of Texas Holdings, generally requires that the members of Texas Energy Future Capital Holdings LLC take all necessary action to ensure that the persons who serve as its managers also serve on the EFH Corp. Board. In addition, Mr. John Young’s employment agreement provides that he will be elected as a member of the Board during the time he is employed by EFH Corp.
Because of these requirements, together with Texas Holdings’ controlling ownership of EFH Corp.’s outstanding common stock, there is no policy or procedure with respect to shareholder recommendations for nominees to the EFH Corp. Board.
225
| Item 11. | EXECUTIVE COMPENSATION |
Organization and Compensation Committee
The Organization and Compensation Committee (the “O&C Committee”) of EFH Corp.’s Board of Directors (the “Board”) is comprised of four non-employee directors: Arcilia C. Acosta, Donald L. Evans, Marc S. Lipschultz and Kenneth Pontarelli. The primary responsibility of the O&C Committee is to:
| | • | | determine and oversee the compensation program of EFH Corp. and its subsidiaries (other than the Oncor Ring-Fenced Entities), including making recommendations to the Board with respect to the adoption, amendment or termination of compensation and benefits plans, arrangements, policies and practices; |
| | • | | evaluate the performance of EFH Corp.’s Chief Executive Officer (the “CEO”) and the other executive officers of EFH Corp. and its subsidiaries (other than the Oncor Ring-Fenced Entities) (collectively, the “executive officers”), including all of the executive officers named in the Summary Compensation Table (the “Named Executive Officers”), and |
| | • | | approve executive compensation based on those evaluations. |
Compensation Risk Assessment
EFH Corp.’s management has determined that the risks arising from EFH Corp.’s compensation policies and practices are not reasonably likely to have a material adverse effect on EFH Corp. This determination was based upon, among other things, the following: (1) the mix of cash and equity payouts at various compensation levels; (2) the performance time horizons used by our plans; (3) the use of financial performance metrics that are readily monitored and reviewed; (4) the equity investment that most of our senior and middle management employees have in EFH Corp. common stock; (5) the lack of an active trading market and other impediments to liquidity associated with EFH Corp. common stock; (6) the incorporation of both operational and financial goals and individual performance modifiers; (7) the inclusion of maximum caps and other plan-based mitigants on the amount of certain of our awards; (8) multiple levels of review and approval of awards (including approval of our O&C Committee with respect to awards to executive officers and awards to other employees that exceed monetary thresholds); and (9) our internal risk review and assessment processes.
Compensation Discussion and Analysis
Compensation of the CEO
In determining the compensation of the CEO, the O&C Committee annually follows a thorough and detailed process. At the end of each year, the O&C Committee reviews a self-assessment prepared by the CEO regarding his performance and the performance of our businesses and meets (with and without the CEO) to evaluate and discuss his performance and the performance of our businesses.
In addition to conducting an annual review of the CEO’s performance, the O&C Committee periodically uses independent compensation consultants to assess the compensation of the CEO against a variety of market reference points and competitive data, including the compensation practices of a number of companies that we consider to comprise our peer group, size-adjusted energy services industry survey data and size-adjusted general industry survey data. While the O&C Committee tries to ensure that the bulk of the CEO’s compensation is directly linked to his performance and the performance of our businesses, the O&C Committee also seeks to set his compensation in a manner that is competitive for retention purposes. The most recent assessment of the CEO’s compensation was performed in late 2010, when the O&C Committee engaged Pay Governance LLC to perform a competitive analysis of the CEO’s compensation. In December 2010, Pay Governance delivered its report to the O&C Committee, which report included market data for a peer group composed of the following companies:
| | | | |
| Allegheny Energy, Inc. | | Ameren Corp. | | American Electric Power Co. Inc |
| Calpine Corp. | | Constellation Energy Group Inc. | | Dominion Resources Inc. |
| Duke Energy Corp. | | Edison International | | Entergy Corp. |
| Exelon Corp. | | FirstEnergy Corp. | | GenOn Energy, Inc. |
| NextEra Energy, Inc. | | NRG Energy, Inc. | | PPL Corp. |
| Progress Energy Inc. | | Public Service Enterprise Group Inc. | | Southern Co. |
| Xcel Energy Inc. | | | | |
226
The data for CEO compensation of the peer group was developed at both the 50th and 75th percentiles of market in order to provide the O&C Committee with a broad market view and multiple benchmarks. The O&C Committee targets total direct compensation at approximately the 75th percentile of the peer group.
While the O&C Committee considers market reference points and competitive data in determining the appropriate compensation of the CEO (and the other executive officers), the O&C Committee also considers qualitative and subjective factors that are more specific to EFH Corp. in making such determinations. One such factor is that EFH Corp. is a highly-leveraged, privately-owned company.
After a comprehensive review of the CEO’s performance and the performance of our businesses in 2010, and taking into consideration the Pay Governance report, the sustained decline in ERCOT wholesale power prices and forward natural gas prices, and other qualitative and subjective factors as described above, the O&C Committee approved certain changes to the long-term incentive compensation for the CEO in February 2011. The O&C Committee made these changes, which are described in more detail in Item 9B above, to provide incentives for retention and performance and to maintain a strong alignment between the CEO and our shareholders. We believe these changes are consistent with our compensation philosophy as described below.
Compensation of Other Executive Officers
In determining whether to make any adjustments to the compensation of any of our executive officers (other than the CEO), the O&C Committee seeks the input of the CEO. At the end of each year, the CEO reviews a self-assessment prepared by each of these executive officers and assesses the executive officer’s performance against business unit and individual goals and objectives. The O&C Committee and the CEO then review the CEO’s assessments and, in that context, the O&C Committee approves any adjustments to the compensation for each of these executive officers.
In addition to these annual reviews/assessments, the CEO periodically assesses the compensation of each of these executive officers. The last assessment of the compensation of the executive officers by the CEO was performed in late 2010. Following that assessment, and taking into consideration the sustained decline in ERCOT wholesale power prices and forward natural gas prices, and other qualitative and subjective factors as described above, the CEO suggested certain changes to the long-term incentive compensation for certain of our executive officers in order to provide incentives for retention and performance and to maintain alignment between our executive officers and shareholders. These changes, which are described in more detail in Item 9B above, were approved by the O&C Committee in February 2011 with respect to such executive officers, including each of Messrs. Keglevic, Campbell, Burke and McFarland. We believe these changes are consistent with our compensation philosophy as described below.
Compensation Philosophy
We have a pay-for-performance compensation philosophy, which places an emphasis on pay-at-risk. In other words, a significant portion of an executive officer’s compensation is comprised of variable, at-risk incentive compensation. Our compensation program is intended to compensate executive officers appropriately for their contribution to the attainment of our financial, operational and strategic objectives. In addition, we believe it is important to retain our executive officers and strongly align their interests with EFH Corp.’s shareholders by emphasizing long-term incentive compensation, including equity-based compensation.
227
To achieve the goals of our compensation philosophy, we believe that:
| | • | | compensation plans should balance both long-term and short-term objectives; |
| | • | | the overall compensation program should emphasize variable compensation elements that have a direct link to overall corporate performance and shareholder value, and |
| | • | | an executive officer’s individual compensation level should be based upon an evaluation of the financial and operational performance of that executive officer’s business unit as well as the executive officer’s individual performance. |
We believe our compensation philosophy supports our businesses by:
| | • | | aligning performance measures with our business objectives to drive the financial and operational performance of EFH Corp. and its business units; |
| | • | | rewarding business unit and individual performance by providing compensation levels consistent with the level of contribution and degree of accountability; |
| | • | | attracting and retaining the best performers, and |
| | • | | strengthening the correlation between the long-term interests of our executive officers and shareholders. |
Elements of Compensation
The material elements of our executive compensation program are:
| | • | | the opportunity to earn an annual performance-based cash bonus based on the achievement of specific corporate, business unit and individual performance goals, and |
| | • | | long-term incentive awards, primarily in the form of (i) long-term cash incentive awards, including the modifications to these awards approved by the O&C Committee in February 2011, as described in more detail in Item 9B above, and (ii) equity awards granted pursuant to our 2007 Stock Incentive Plan for Key Employees of EFH Corp. and Affiliates (the “2007 Stock Incentive Plan”), including options to purchase shares of EFH Corp.’s common stock (the “Stock Option Awards”) and restricted stock units (the “Restricted Stock Units”). |
In addition, executive officers generally have the opportunity to participate in certain of our broad-based employee compensation plans, including our Thrift (401(k)) Plan, retirement plans and non-qualified benefit plans, and to receive certain perquisites.
Assessment of Compensation Elements
We design the majority of an executive officer’s compensation to be directly linked to corporate and business unit performance. For example, an executive officer’s annual performance-based cash bonus is primarily based on the achievement of certain corporate and business unit financial and operational targets (such as management EBITDA, cost management, generation output and customer satisfaction). In addition, each executive officer’s long-term cash incentive award (described below) is based on achievement of certain operational and financial performance metrics. We also try to ensure that our executive compensation program is competitive in order to reduce the risk of losing our executive officers.
228
The following is a detailed discussion of the principal compensation elements provided to our executive officers. More detail about each of the elements can be found in the compensation tables, including the footnotes to the tables, and the narrative discussion following certain of the tables.
Base Salary
Base salary should reward executive officers for the scope and complexity of their position and the level of responsibility required. We believe that a competitive level of base salary is required to attract and retain qualified talent.
The O&C Committee annually reviews base salaries and periodically uses independent compensation consultants to ensure the base salaries are market-competitive. The O&C Committee may also review an executive officer’s base salary from time to time during a year, including if the executive officer is given a promotion or if his responsibilities are significantly modified.
We want to ensure our cash compensation is competitive and sufficient to incent executive officers to remain with us, recognizing our high performance expectations across a broad set of operational, financial, customer service and community-oriented goals and objectives and the higher risk levels associated with being a significantly-leveraged company.
In light of the significant market dislocation and uncertainty that began in late 2008 and continued into 2009, our Named Executive Officers’ base salaries were increased, effective January 1, 2010. These increases reflect, in part, that none of the Named Executive Officers received a salary increase in 2009. The following table indicates the Named Executive Officers’ base salaries for 2010.
| | | | | | |
Name | | Title | | Base Salary—2010 | |
| John F. Young | | President and Chief Executive Officer of EFH Corp. | | $ | 1,200,000 | |
| | |
| Paul M. Keglevic | | Executive Vice President and Chief Financial Officer of EFH Corp. | | $ | 650,000 | |
| | |
| David A. Campbell | | Chief Executive Officer of Luminant | | $ | 700,000 | |
| | |
| James A. Burke | | Chief Executive Officer of TXU Energy | | $ | 630,000 | |
| | |
| M.A. McFarland | | Executive Vice President of EFH Corp. and Executive Vice President and Chief Commercial Officer of Luminant | | $ | 600,000 | |
Annual Performance-Based Cash Bonus - Executive Annual Incentive Plan
The Executive Annual Incentive Plan (“EAIP”) provides an annual performance-based cash bonus for the successful attainment of certain annual financial and operational performance targets that are established annually at each of the corporate and business unit levels by the O&C Committee. Under the terms of the EAIP, performance against these targets, which are generally set at challenging levels to incent high performance, drives bonus funding. Based on the level of attainment of these performance targets, an aggregate EAIP funding percentage amount for all participants is determined.
229
Our financial performance targets typically include “management” EBITDA, a non-GAAP financial measure. When the O&C Committee reviews management EBITDA for purposes of determining our performance against the applicable management EBITDA target, it includes our earnings before interest, taxes, depreciation and amortization plus transaction, management and/or similar fees paid to the Sponsor Group, together with such adjustments as the O&C Committee shall determine appropriate in its discretion after good faith consultation with the CEO and the Chief Financial Officer, including adjustments consistent with those included in the comparable definitions in TCEH’s Senior Secured Facilities (to the extent considered appropriate for executive compensation purposes). Our management EBITDA targets are also expected to be adjusted for acquisitions, divestitures or major capital investment initiatives to the extent that they were not contemplated in our financial plan (the “Financial Plan”). The management EBITDA targets are intended to measure achievement of the Financial Plan and the adjustments to management EBITDA described above primarily represent elements of our performance that are either beyond the control of management or were not predictable at the time the Financial Plan was approved. Under the terms of the EAIP, the O&C Committee has broad authority to make these or any other adjustments to EBITDA that it deems appropriate in connection with its evaluation and compensation of our executive officers. Management EBITDA is an internal measure used only for performance management purposes, and EFH Corp. does not intend for management EBITDA to be an alternative to any measure of financial performance presented in accordance with GAAP. Management EBITDA is not the same as Adjusted EBITDA, which is disclosed elsewhere in this Form 10-K and defined in the glossary to this Form 10-K.
Financial and Operational Performance Targets
The following table provides a summary of the performance targets for each of the Named Executive Officers.
| | | | | | | | | | | | | | | | | | | | | | | | | | | | |
| | | Weight | |
Name | | EFH Corp.
Management
EBITDA(1) | | | EFH Business
Services
Scorecard
Multiplier | | | Luminant
Scorecard
Multiplier | | | TXU Energy
Scorecard
Multiplier | | | Luminant
Energy
Scorecard
Multiplier | | | Total | | | Payout | |
John F. Young | | | 50 | % | | | 50 | % | | | | | | | | | | | | | | | 100 | % | | | 131 | % |
Paul M. Keglevic | | | 50 | % | | | 50 | % | | | | | | | | | | | | | | | 100 | % | | | 130 | % |
David A. Campbell | | | 25 | % | | | | | | | 75 | % | | | | | | | | | | | 100 | % | | | 132 | % |
James A. Burke | | | 25 | % | | | | | | | | | | | 75 | % | | | | | | | 100 | % | | | 134 | % |
M.A. McFarland | | | 25 | % | | | 25 | % | | | 25 | % | | | | | | | 25 | % | | | 100 | % | | | 143 | % |
| (1) | Mr. Young is measured on EFH Corp. Management EBITDA, including Oncor, while the remainder of the Named Executive Officers is measured on EFH Corp. Management EBITDA, excluding Oncor. |
230
The following table provides a summary of the performance targets included in the EFH Business Services Scorecard Multiplier.
| | | | | | | | | | |
EFH Business Services Scorecard Multiplier | | Weight | | | Performance(1) | | | Payout |
EFH Corp. Management EBITDA (excluding Oncor) | | | 20.0 | % | | | 126% | | | 25% |
| | | |
Luminant Scorecard Multiplier(2) | | | 20.0 | % | | | 134% | | | 27% |
| | | |
TXU Energy Scorecard Multiplier(2) | | | 20.0 | % | | | 137% | | | 27% |
| | | |
EFH Corp. (excluding Oncor) Total Spend | | | 20.0 | % | | | 129% | | | 26% |
| | | |
EFH Business Services Costs | | | 20.0 | % | | | 139% | | | 28% |
| | | | | | | | | | |
| | | |
Total | | | 100.0 | % | | | | | | 133% |
| | | | | | | | | | |
| | (1) | Performance payouts equal 100% if the target amount is achieved for a particular metric, 50% if the threshold amount is achieved and 200% if the superior amount is achieved. The actual performance payouts are interpolated between threshold and target or target and superior, as applicable, with a maximum performance payout for any particular metric being equal to 200%. |
| | (2) | The performance targets included in the Luminant Scorecard Multiplier and the TXU Energy Scorecard Multiplier are summarized below. |
The following table provides a summary of the performance targets included in the Luminant Scorecard Multiplier.
| | | | | | | | | | |
Luminant Scorecard Multiplier | | Weight | | | Performance(1) | | | Payout |
Luminant Management EBITDA (excluding Oak Grove and Sandow 5) | | | 35.0 | % | | | 177% | | | 62% |
| | | |
Luminant Baseload Generation - Coal (excluding Oak Grove and Sandow 5) | | | 16.0 | % | | | 99% | | | 16% |
| | | |
Luminant Generation – Nuclear | | | 9.0 | % | | | 109% | | | 10% |
| | | |
Luminant O&M/SG&A | | | 15.0 | % | | | 124% | | | 18% |
| | | |
Luminant Capital Expenditures | | | 5.0 | % | | | 200% | | | 10% |
| | | |
Luminant Fossil Fuel Costs | | | 10.0 | % | | | 111% | | | 11% |
| | | |
Management EBITDA for Oak Grove and Sandow 5 | | | 10.0 | % | | | 67% | | | 7% |
| | | | | | | | | | |
| | | |
Total | | | 100.0 | % | | | | | | 134% |
| | | | | | | | | | |
| | (1) | Performance payouts equal 100% if the target amount is achieved for a particular metric, 50% if the threshold amount is achieved and 200% if the superior amount is achieved. The actual performance payouts are interpolated between threshold and target or target and superior, as applicable, with a maximum performance payout for any particular metric being equal to 200%. |
231
The following table provides a summary of the performance targets included in the TXU Energy Scorecard Multiplier.
| | | | | | | | |
TXU Energy Scorecard Multiplier | | Weight | | | Performance(1) | | Payout |
TXU Energy Management EBITDA | | | 40.0 | % | | 179% | | 72% |
| | | |
Contribution Margin | | | 15.0 | % | | 200% | | 30% |
| | | |
TXU Energy Total Costs | | | 20.0 | % | | 79% | | 16% |
| | | |
Residential Customer Count | | | 10.0 | % | | 50% | | 5% |
| | | |
Residential Days Meter to Cash | | | 5.0 | % | | 100% | | 5% |
| | | |
PUCT Complaints | | | 5.0 | % | | 84% | | 4% |
| | | |
Customer Satisfaction | | | 5.0 | % | | 100% | | 5% |
| | | | | | | | |
| | | |
Total | | | 100.0 | % | | | | 137% |
| | | | | | | | |
| | (1) | Performance payouts equal 100% if the target amount is achieved for a particular metric, 50% if the threshold amount is achieved and 200% if the superior amount is achieved. The actual performance payouts are interpolated between threshold and target or target and superior, as applicable, with a maximum performance payout for any particular metric being equal to 200%. |
The following table provides a summary of the performance targets included in the Luminant Energy Scorecard Multiplier.
| | | | | | | | |
Luminant Energy Scorecard Multiplier | | Weight | | | Performance(1) | | Payout(2) |
Luminant Management EBITDA (excluding Oak Grove and Sandow 5) | | | 30.0 | % | | 177% | | 53% |
| | | |
Management EBITDA for Oak Grove and Sandow 5 | | | 10.0 | % | | 79% | | 8% |
| | | |
Luminant Energy SG&A | | | 10.0 | % | | 200% | | 20% |
| | | |
Incremental Value Created | | | 40.0 | % | | 200% | | 80% |
| | | |
Liquidity Utilization | | | 10.0 | % | | 200% | | 20% |
| | | | | | | | |
| | | |
Total | | | 100.0 | % | | | | 181% |
| | | | | | | | |
| |
Adjusted Total | | 178% |
| | | | | | | | |
| | (1) | Performance payouts equal 100% if the target amount is achieved for a particular metric, 50% if the threshold amount is achieved and 200% if the superior amount is achieved. The actual performance payouts are interpolated between threshold and target or target and superior, as applicable, with a maximum performance payout for any particular metric being equal to 200%. |
| | (2) | Due to plan funding limitations, the actual payout related to the Luminant Energy Scorecard Multiplier has been reduced from 181% to 178%. |
Individual Performance Modifier
After approving the actual performance against the applicable targets under the plan, the O&C Committee and/or the CEO reviews the performance of each of our executive officers on an individual and comparative basis. Based on this review, which includes an analysis of both objective and subjective criteria, including the CEO’s recommendations (with respect to all executive officers other than himself), the O&C Committee approves an individual modifier for each executive officer. Under the terms of the EAIP, the individual performance modifier can range from an outstanding rating (150%) to an unacceptable rating (0%). To calculate an executive officer’s final performance-based cash bonus, the executive officer’s corporate/business unit payout percentages are multiplied by the executive officer’s target incentive level, which is computed as a percentage of annualized base salary, and then by the executive officer’s individual performance modifier.
232
Actual Award
The following table provides a summary of the 2010 performance-based cash bonus for each Named Executive Officer under the EAIP.
| | | | | | | | | | | | |
Name | | Target
(% of salary) (1) | | | Target Award
($ Value) | | | Actual Award | |
John F. Young (2) | | | 100 | % | | $ | 1,200,000 | | | | 2,043,600 | |
| | | |
Paul M. Keglevic (3) | | | 85 | % | | $ | 552,500 | | | | 933,725 | |
| | | |
David A. Campbell (4) | | | 85 | % | | $ | 595,000 | | | | 981,750 | |
| | | |
James A. Burke (5) | | | 85 | % | | $ | 535,500 | | | | 932,841 | |
| | | |
M.A. McFarland (6) | | | 85 | % | | $ | 510,000 | | | | 948,090 | |
| | (1) | Effective with the 2010 award period, the O&C Committee approved an increase in the annual target award under the EAIP from 75% of base salary to 85% of base salary for Messrs. Keglevic, Campbell, Burke and McFarland. |
| | (2) | Mr. Young’s incentive award is based on the successful achievement of the financial performance targets for EFH Corp. and the financial and operational performance targets for Luminant and TXU Energy and an individual performance modifier that increased his incentive award. In 2010, Mr. Young successfully led the company in a difficult year in which wholesale power prices continued to decline. Notwithstanding the difficulties that accompany a sustained decline in forward natural gas prices, Mr. Young created value in many parts of the company’s businesses. In particular, Mr. Young led the company’s efforts in, among other things: liquidity and liability management efforts that captured long-term debt discounts of approximately $2 billion and extended the maturity date for approximately $5 billion of our long-term debt; improving financial and operational results for our legacy baseload generation fleet, including top decile safety, generation and cost performance by our nuclear facility; providing strong contributions to the state and national debates regarding legislative and regulatory issues facing the company, including proposals on federal climate change legislation and resolution of critical regulatory matters between the EPA and the TCEQ; transitioning our generation and wholesale energy businesses to operate successfully within ERCOT’s new nodal wholesale market structure; our continued commitment to build a strong retail brand and customer-focused culture at TXU Energy; and exceeding EFH Corp.’s planned EBITDA for 2010. Given these and other significant achievements, the O&C Committee approved an individual performance modifier that increased Mr. Young’s incentive award. |
| | (3) | Mr. Keglevic’s incentive award is based on the successful achievement of the financial performance targets for EFH Corp. and EFH Business Services and the financial and operational performance targets for Luminant and TXU Energy and an individual performance modifier that increased his incentive award. In 2010, Mr. Keglevic successfully managed several new financial processes at EFH Corp. and its business units, including processes for managing the varied risks of our businesses and preserving effective liquidity levels. In addition, Mr. Keglevic led the company’s liquidity and liability management efforts, including capturing long-term debt discounts of approximately $2 billion, extending the maturity date for approximately $5 billion of our long-term debt, and a resulting reduction in our interest expense of approximately $1.2 billion. Given these significant accomplishments and other achievements (including the successful resolution of a significant tax matter related to our discontinued Europe business), the O&C Committee approved an individual performance modifier that increased Mr. Keglevic’s incentive award. |
| | (4) | Mr. Campbell’s incentive award is based on the successful achievement of a financial performance target for EFH Corp. and the financial and operational performance targets for Luminant and an individual performance modifier that increased his incentive award. In 2010, Mr. Campbell was successful in overseeing strong financial and operational results, primarily at Luminant’s nuclear and lignite/coal-fueled plants and in Luminant’s wholesale energy organization. Also, Mr. Campbell continued to provide significant contributions in the public affairs arena on a local, state and national level, particularly with regard to environmental issues facing Luminant. In addition, under Mr. Campbell’s leadership, Luminant had a strong year for safety in its nuclear and mining operations, while implementing improved safety processes and metrics for its gas and lignite/coal-fueled plants and mines. Given these significant accomplishments and other achievements (including his focus on developing a collaborative, team-oriented culture across the organization), the O&C Committee approved an individual performance modifier that increased Mr. Campbell’s incentive award. |
| | (5) | Mr. Burke’s incentive award is based on the successful achievement of a financial performance target for EFH Corp. and the financial and operational performance targets for TXU Energy and an individual performance modifier that increased his incentive award. In 2010, Mr. Burke continued to build on TXU Energy’s brand and reputation with its customers and public stakeholders, while driving continuous improvement in customer service, billing, marketing and retention activities. Given these significant accomplishments and other achievements (including his continued commitment to build a strong retail and customer-focused culture at TXU Energy), the O&C Committee approved an individual performance modifier that increased Mr. Burke’s incentive award. |
| | (6) | Mr. McFarland’s incentive award is based on the successful achievement of the financial performance targets for EFH Corp., the financial and operational performance targets for Luminant and Luminant Energy and an individual performance modifier that increased his incentive award. In 2010, Mr. McFarland successfully transitioned our generation and wholesale energy businesses to operate successfully within ERCOT’s new nodal wholesale market structure, successfully managed Luminant’s fuel strategy, and developed several new processes for managing Luminant’s long-term hedging strategy with minimal impacts to liquidity. Given these significant accomplishments and other achievements (including his strategic contributions with regard to a number of development opportunities), the O&C Committee approved an individual performance modifier that increased Mr. McFarland’s incentive award. |
233
Long-Term Incentive Awards
Long-Term Cash Incentive
In October 2009 (and in February 2010, with respect to Mr. Young), each of our Named Executive Officers was granted a long-term cash incentive award (the “LTI”) that entitles such Named Executive Officer to receive on September 30, 2012, to the extent such Named Executive Officer remains employed by EFH Corp. on such date (with customary exceptions in limited circumstances, including death, disability, and leaving for “good reason” or termination without “cause”), an additional one-time, lump-sum cash payment equal to 75% (100% with respect to Mr. Young) of the aggregate EAIP award received by such executive officer for fiscal years 2009, 2010 and 2011. These awards provide significant retentive value because an award is not paid to an executive officer unless the executive officer remains employed with us until September 30, 2012 (subject to the customary exceptions described above). In addition, these awards provide additional incentive to our executive officers to achieve top operational and financial performance because the award is based on a percentage of the executive officers’ annual performance-based cash bonuses.
Long-Term Equity Incentives
We believe it is important to strongly align the interests of our executive officers and shareholders through equity-based compensation. In December 2007, our Board approved and adopted our 2007 Stock Incentive Plan pursuant to which we granted Stock Option Awards to our executive officers. The purpose of the 2007 Stock Incentive Plan is to:
| | • | | promote our long-term financial interests and growth by attracting and retaining management and other personnel with the training, experience and ability to make a substantial contribution to our success; |
| | • | | motivate management and other personnel by means of growth-related incentives to achieve long-range goals, and |
| | • | | strengthen the correlation between the long-term interests of our shareholders and the interests of our executive officers through opportunities for stock (or stock-based) ownership in EFH Corp. |
Please refer to the outstanding Equity Awards at Fiscal Year-End—2010 table, including the footnotes thereto, for a more detailed description of the outstanding Stock Option Awards held by each of the Named Executive Officers. In the future, we may make additional discretionary grants of stock options or other equity-based compensation to reward high performance or achievement.
As described in greater detail in Item 9B above, the O&C Committee recently approved an exchange program pursuant to which our executive officers, including the Named Executive Officers, may exchange any and all of their outstanding Stock Option Awards for restricted stock units that cliff-vest on September 30, 2014.
Other Elements of Compensation
General
Our executive officers generally have the opportunity to participate in certain of our broad-based employee compensation plans, including our Thrift (401(k)) Plan, retirement plans and non-qualified benefit plans. Please refer to the footnotes to the Summary Compensation table for a more detailed description of our Thrift Plan, the narrative that follows the Pension Benefits table for a more detailed description of our Retirement Plan and Supplemental Retirement Plan and the footnotes to the Nonqualified Deferred Compensation table for a more detailed description of our Salary Deferral Program. However, beginning in 2010, our Named Executive Officers are no longer eligible to participate in the Salary Deferral Program.
234
Perquisites
We provide our executives with certain perquisites on a limited basis. Those perquisites that exist are generally intended to enhance our executive officers’ ability to conduct company business. These benefits include, financial planning, preventive health maintenance, and reimbursement for certain club memberships and certain spousal travel expenses. Expenditures for the perquisites described below are disclosed by individual in footnotes to the Summary Compensation Table. The following is a summary of perquisites offered to our Named Executive Officers that are not available to all employees:
Executive Financial Planning:We pay for our executive officers to receive financial planning services. This service is intended to support them in managing their financial affairs, which we consider especially important given the high level of time commitment and performance expectation required of our executive officers. Furthermore, we believe that such service helps ensure greater accuracy and compliance with individual tax regulations by our executive officers.
Health Services:We pay for our executive officers to receive annual physical health exams. Also, in 2010, we purchased an annual membership for Messrs. Young and Keglevic to participate in a comprehensive health plan that provides anytime personal and private physician access and health care. The health of our executive officers is important given the vital leadership role they play in directing and operating the company. Our executive officers are important assets of EFH Corp., and these benefits are designed to help ensure their health and long-term ability to serve our shareholders.
Club Memberships:We reimburse certain of our executives for the cost of golf and social club memberships, provided that the club membership provides for a business-use opportunity, such as client networking and entertainment. The club membership reimbursements are provided to assist the executives in cultivating business relationships.
Spouse Travel Expenses:From time to time, we pay for an executive officer’s spouse to travel with the executive officer when taking a business trip.
Contingent Payments
We have entered into employment agreements with Messrs. Young, Keglevic, Campbell, Burke and McFarland. Each of the employment agreements provides that certain payments and benefits will be paid upon the expiration or termination of the agreement under various circumstances, including termination without cause, resignation for good reason and termination of employment within a fixed period of time following a change in control. We believe these provisions are important in order to attract and retain the caliber of executive officers that our business requires and provide incentive for our executive officers to fully consider potential changes that are in our and our shareholders’ best interest, even if such changes would result in the executive officers’ termination of employment. For a description of the applicable provisions in the employment agreements of our Named Executive Officers see “Potential Payments upon Termination or Change in Control.”
Other
After a comprehensive review of the CEO’s performance and the performance of our businesses in 2009, the O&C Committee approved several changes to Mr. Young’s compensation arrangement in February 2010, each of which was described in greater detail in last year’s annual report on Form 10-K. In connection with these changes, Mr. Young’s employment arrangement was amended to provide him a 10-year term life insurance policy in an insured amount equal to $10,000,000 and a supplemental retirement plan that vests on December 31, 2014 (with customary exceptions for death, disability and leaving for “good reason” or termination “without cause”) with a value of $3,000,000.
235
Accounting and Tax Considerations
Accounting Considerations
Under FASB ASC Topic 718, the total amount of compensation expense to be recorded for stock-based awards (e.g., Stock Option Awards granted under the 2007 Stock Incentive Plan) is based on the fair value of the award on the grant date. This fair value is then recorded as expense over the vesting period, with an offsetting increase in paid-in capital. The amount of compensation expense is not subsequently adjusted for changes in our share price, for the actual number of shares distributed, or for any other factors except for true-ups related to estimated forfeitures compared to actual forfeitures.
As previously disclosed, in connection with a grant of new stock options in February 2010, Mr. Young surrendered unvested performance-related stock options that were granted to him when he joined EFH Corp. The shares surrendered by Mr. Young in February 2010 are considered modifications to the original awards and are treated as an exchange of the original award for a new award. The compensation expense related to the new award represents the incremental costs of the new award over the surrendered award and is based on the new grant date fair value and is recognized over its new vesting period.
Income Tax Considerations
Section 162(m) of the Code limits the tax deductibility by a publicly held company of compensation in excess of $1 million paid to the CEO or any other of its three most highly compensated executive officers other than the principal financial officer. Because EFH Corp. is a privately-held company, Section 162(m) will not limit the tax deductibility of any executive compensation for 2010.
The O&C Committee administers our compensation programs with the good faith intention of complying with Section 409A of the Code.
Organization and Compensation Committee Report
The O&C Committee has reviewed and discussed with management the Compensation Discussion and Analysis set forth in this Form 10-K. Based on this review and discussions, the committee recommended to the Board that the Compensation Discussion and Analysis be included in this Form 10-K.
Organization and Compensation Committee
Donald L. Evans, Chair
Arcilia C. Acosta
Marc S. Lipschultz
Kenneth Pontarelli
236
Summary Compensation Table—2010
The following table provides information for the fiscal years ended December 31, 2010, 2009 and 2008 regarding the aggregate compensation paid to our Named Executive Officers.
| | | | | | | | | | | | | | | | | | | | | | | | | | | | | | | | | | |
Name and Principal Position | | Year | | Salary
($) | | | Bonus
($) | | | Stock
Awards
($) | | | Option
Awards
($)(6) | | | Non-Equity
Incentive
Plan
Compensation
($)(7) | | | Change in
Pension Value
and
Non-qualified
Deferred
Compensation
Earnings
($)(8) | | | All Other
Compensation
($)(9) | | | Total
($) | |
John F. Young (1)
President & CEO of EFH Corp. | | 2010
2009 2008 | |
| 1,200,000
1,000,000 912,500 |
| |
| —
— — |
| |
| —
— 3,000,000 |
| |
| 3,405,000
— 13,635,000 |
| |
| 2,043,600
1,469,000 1,418,000 |
| |
| 2,761
— — |
| |
| 210,826
105,291 462,258 |
| |
| 6,862,187
2,574,291 19,427,758 |
|
| | | | | | | | | |
Paul M. Keglevic(2)
EVP & Chief Financial Officer of EFH Corp. | | 2010
2009 2008 | |
| 650,000
600,000 293,182 |
| |
| 50,000
150,000 250,000 |
| |
| —
— 1,125,000 |
| |
| —
1,325,000 6,442,500 |
| |
| 933,725
664,200 613,800 |
| |
| 3,185
— — |
| |
| 39,416
73,320 88,508 |
| |
| 1,676,326
2,812,520
8,812,990 |
|
| | | | | | | | | |
David A. Campbell(3)
President & CEO of Luminant | | 2010
2009 2008 | |
| 700,000
600,000
545,500 |
| |
| —
— 5,092,250 |
| |
| —
— 2,500,000 |
| |
| —
2,120,000 7,272,000 |
| |
| 981,750
642,600 625,950 |
| |
| 76,485
68,861 22,779 |
| |
| 17,911
15,020 3,395,878 |
| |
| 1,776,146
3,446,481 19,454,357 |
|
| | | | | | | | | |
James A. Burke(4)
President & CEO of TXU Energy | | 2010
2009 2008 | |
| 630,000
600,000 600,000 |
| |
| —
— — |
| |
| —
— — |
| |
| —
933,100 4,454,100 |
| |
| 932,841
856,800 473,918 |
| |
| 76,713
55,931 25,501 |
| |
| 17,305
23,885 639,136 |
| |
| 1,656,859
2,469,716 6,192,655 |
|
| | | | | | | | | |
M.A. McFarland (5)
EVP-EFH Corp. & EVP & Chief Commercial Officer of Luminant | | 2010
2009 2008 | |
| 600,000
500,000 236,744 |
| |
| —
— 150,000 |
| |
| —
— 500,000 |
| |
| —
1,060,000 5,114,000 |
| |
| 948,090
687,750 529,032 |
| |
| —
— — |
| |
| 17,418
7,424 87,725 |
| |
| 1,565,508
2,255,174 6,617,501 |
|
| (1) | Mr. Young commenced employment with EFH Corp. in January 2008. The amounts for 2010 reported as “All Other Compensation” for Mr. Young represent (i) the costs of providing certain perquisites, including $3,299 for an executive physical, $11,169 for an annual membership in a comprehensive personal physician care program, $140,922 for the cost of his country club membership, including the one-time initiation fee, $10,120 for financial planning, $17,185 for insurance premiums in respect of a 10-year term life insurance policy, $1,121 for personal use of a car service and $12,310 of taxable reimbursements partially related to his spouse’s travel and (ii) $14,700 for our matching contributions to the EFH Thrift Plan. |
| (2) | Mr. Keglevic commenced employment with EFH Corp. in July 2008. Mr. Keglevic’s employment agreement provides that we pay him a signing bonus equal to $550,000 as follows: (i) $250,000 payable in July 2008; (ii) $150,000 payable in July 2009 and (iii) $50,000 payable in July 2010, 2011 and 2012. The amount for 2010 reported as “Bonus” for Mr. Keglevic represents the 2010 portion of his signing bonus. The amounts for 2010 reported as “All Other Compensation” for Mr. Keglevic represent (i) the costs of providing certain perquisites, including $11,026 for an annual membership in a comprehensive personal physician care program, and $18,853 for the cost of his country club membership, including a pro-rated portion of his initiation fee and (ii) $9,537 for our matching contributions to the EFH Thrift Plan. |
| (3) | The amount reported as “All Other Compensation” in 2010 for Mr. Campbell represents (i) the costs of providing certain perquisites, including $10,120 for financial planning and $2,891 for an executive physical and (ii) $4,900 for our matching contributions to the EFH Thrift Plan. |
| (4) | The amounts for 2010 reported as “All Other Compensation” for Mr. Burke represent (i) the costs of providing certain perquisites, including $8,875 for financial planning, and (ii) $8,430 for our matching contributions to the EFH Thrift Plan. |
| (5) | Mr. McFarland commenced employment with EFH Corp. in July 2008. The amounts for 2010 reported as “All Other Compensation” for Mr. McFarland represent (i) the costs of providing certain perquisites, including $2,718 for an executive physical and (ii) $14,700 for our matching contributions to the EFH Thrift Plan. |
| (6) | The amounts reported as “Option Awards” represent the grant date fair value of Stock Option Awards granted in the fiscal year computed for the stock options awarded under the 2007 Stock Incentive Plan in accordance with FASB ASC Topic 718 and do not take into account estimated forfeitures. Mr. Young’s 2010 options were granted with an exercise price of $3.50 per share. Please refer to the table below entitled “Grants of Plan-Based Awards – 2010” for more information. |
| (7) | The amounts in 2010 reported as “Non-Equity Incentive Plan Compensation” were earned by the executive officers in 2010 under the EAIP and are expected to be paid in March 2011. |
237
| (8) | The amounts in 2010 reported under “Change in Pension Value and Nonqualified Deferred Compensation Earnings” include the aggregate increase in actuarial value of EFH Corp.’s Retirement Plan and Supplemental Retirement Plan. For a more detailed description of EFH Corp.’s retirement plans, including the transfers of certain assets and liabilities from the Supplemental Retirement Plan and/or Salary Deferral Program to the cash balance component of the Retirement Plan, please refer to the narrative that follows the table titled “Pension Benefits”. There are no above market earnings for nonqualified deferred compensation that is deferred under the Salary Deferral Program. |
| (9) | For purposes of preparing this column, all perquisites are valued on the basis of the actual cost to the company. As described above, “All Other Compensation” includes amounts associated with our matching contributions to the EFH Thrift Plan. Our Thrift Plan allows participating employees to contribute a portion of their regular salary or wages to the plan. Under the EFH Thrift Plan, EFH Corp. matches a portion of an employee’s contributions. This matching contribution is 100% of each Named Executive Officer’s contribution up to 6% of the named Executive Officer’s salary up to the IRS annual compensation limit. All matching contributions are invested in Thrift Plan investments as directed by the participant. |
238
Grants of Plan-Based Awards – 2010
The following table sets forth information regarding grants of compensatory awards to our Named Executive Officers during the fiscal year ended December 31, 2010.
| | | | | | | | | | | | | | | | | | | | | | | | | | | | | | | | |
Name | | Grant
Date | | | Date of
Board
Action | | | Estimated Possible Payouts Under
Non-Equity Incentive Plan
Awards(1) | | | All Other
Option
Awards: #
of Securities
Underlying
Options
(#)(2) | | | Exercise or
Base Price
of Option
Awards
($/sh)(3) | | | Grant Date
Fair Value
of Stock
and Option
Awards(4) | |
| | | | Threshold
($) | | | Target
($) | | | Max.
($) | | | | | | | | | | |
John F. Young | | | 02/18/10 | | | | 02/18/10 | | | | 600,000 | | | | 1,200,000 | | | | 2,400,000 | | | | 3,000,000 | | | | 3.50 | | | | 3,405,000 | |
| | | | | | | | |
Paul M. Keglevic | | | | | | | 02/18/10 | | | | 276,250 | | | | 552,500 | | | | 1,105,000 | | | | | | | | | | | | | |
| | | | | | | | |
David A. Campbell | | | | | | | 02/18/10 | | | | 297,500 | | | | 595,000 | | | | 1,190,000 | | | | | | | | | | | | | |
| | | | | | | | |
James A. Burke | | | | | | | 02/18/10 | | | | 267,750 | | | | 535,500 | | | | 1,071,000 | | | | | | | | | | | | | |
| | | | | | | | |
M.A. McFarland | | | | | | | 02/18/10 | | | | 255,000 | | | | 510,000 | | | | 1,020,000 | | | | | | | | | | | | | |
| (1) | The amounts disclosed under the heading “Estimated Possible Payouts under Non-Equity Incentive Plan Awards” reflect the threshold, target and maximum amounts available under the EAIP for each executive officer and each executive officer’s employment agreement. The actual awards for the 2010 plan year are expected to be paid in March 2011 and are reported in the Summary Compensation Table under the heading “Non-Equity Incentive Plan Compensation” and described above under the section entitled “Annual Performance Bonus - EAIP”. |
| (2) | Represents grants of new Time Vested Options and Cliff Vested Options under the 2007 Stock Incentive Plan, as described above under “Long-Term Incentive Awards.” |
| (3) | There is no established public market for our common stock. Our board of directors values our common stock on a semi-annual basis (on June 30th and December 31st of each year). The valuation is primarily done to set the exercise or base price of awards granted under the 2007 Stock Incentive Plan. In determining the valuation of our common stock, our Board, with the assistance of third party valuation experts, utilizes several valuation techniques, including discounted cash flow and comparable company analysis. |
| (4) | The amounts reported under “Grant Date Fair Value of Stock and Option Awards” represent the grant date fair value of stock options related to the 2010 Awards in accordance with FASB ASC Topic 718. |
For a discussion of certain material terms of the employment agreements with the Named Executive Officers, please see “Assessment of Compensation Elements” and “Potential Payments upon Termination or Change in Control.”
239
Outstanding Equity Awards at Fiscal Year-End– 2010
| | | | | | | | | | | | | | | | | | | | | | | | | | | | | | | | | | |
| | | Option Awards (1) | | Stock Awards | |
| | | | | | Equity
Incentive Plan
Awards: # of
Securities
Underlying
Unexercised
Unearned
Options (5) | | | Option
Exercise
Price | | | Option Expiration Date | | # of
Shares
or Units
of Stock
That
Have Not
Vested (6) | | | Market
Value of
Shares or
Units of
Stock
That
Have
Not Vested (7) | | | Equity
Incentive Plan
Awards: # of
Unearned
Shares, Units
or Other
Rights That
Have Not
Vested | | | Equity
Incentive Plan
Awards:
Market
Payout Value
of Unearned
Shares, Units
or Rights
That Have
Not Vested | |
| | | # of Securities Underlying
Unexercised
Options | | | | | | | | |
Name | | Exercisable | | | Unexercisable | | | | | | | | |
John F. Young | |
| 3,375,000
300,000 |
| |
| 1,500,000
1,200,000 1,500,000 | (2)
(3) (4) | | | 1,125,000 | | |
| 5.00
3.50 3.50 |
| | 02/01/2018 02/18/2020 02/18/2020 | | | | | | | | | | | | | | | | |
| | | | | | | | | |
Paul M. Keglevic | |
| 1,125,000
100,000 |
| |
| 500,000
400,000 500,000 | (2)
(3) (4) | | | 375,000 | | |
| 5.00
3.50 3.50 |
| | 12/22/2018 12/17/2019 12/17/2019 | | | 225,000 | | | | 281,250 | | | | | | | | | |
| | | | | | | | | |
David A. Campbell | |
| 1,800,000
160,000 |
| |
| 800,000
640,000 800,000 | (2)
(3) (4) | | | 600,000 | | |
| 5.00
3.50 3.50 |
| | 05/20/2018 12/17/2019 12/17/2019 | | | | | | | | | | | | | | | | |
| | | | | | | | | |
James A. Burke | |
| 1,102,500
40,000 |
| |
| 490,000
160,000 490,000 | (2)
(3) (4) | | | 367,500 | | |
| 5.00
3.50 3.50 |
| | 05/20/2018 12/17/2019 12/17/2019 | | | | | | | | | | | | | | | | |
| | | | | | | | | |
M.A. McFarland | |
| 900,000
80,000 |
| |
| 400,000
320,000 400,000 | (2)
(3) (4) | | | 300,000 | | |
| 5.00
3.50 3.50 |
| | 12/22/2018 12/17/2019 12/17/2019 | | | | | | | | | | | | | | | | |
| (1) | In 2008, Messrs. Young, Keglevic, Campbell, Burke and McFarland were granted 7,500,000, 2,500,000, 4,000,000, 2,450,000 and 2,000,000 Stock Option Awards, respectively, half of which were “Time Vested Options” and half of which were “Performance Vested Options”. The exercise price of the Stock Option Awards granted in 2008 (the fair market value on the grant date) is $5.00 per share. In late 2009 (February 2010, with respect to Mr. Young), the O&C Committee granted Messrs. Young, Keglevic, Campbell, Burke and McFarland 1,500,000, 500,000, 800,000, 200,000 and 400,000 new Time Vested Options, respectively, and 1,500,000, 500,000, 800,000, 490,000 and 400,000 “Cliff Vested Options,” respectively. In connection with these new Stock Option Award grants, each Named Executive Officer surrendered to EFH Corp. a portion of the Performance Vested Options that were granted to him in 2008. The exercise price of the Stock Option Awards granted in 2009 (2010, with respect to Mr. Young) is $3.50 per share. As described in greater detail in Item 9B above, the O&C Committee recently approved an exchange program pursuant to which our executive officers, including the Named Executive Officers, may exchange any and all of their outstanding Stock Option Awards for restricted stock units that cliff-vest on September 30, 2014. |
| (2) | The Time Vested Options vest in 20% increments on each of the first five anniversaries of September 30, 2007 and September 30, 2009, respectively. Accordingly, the Time Vested Options granted in 2008 are scheduled to become exercisable ratably in September 2010, 2011 and 2012 provided the Named Executive Officer has remained continuously employed by EFH Corp. through the applicable vesting date (with customary exceptions for death, disability, and leaving for “good reason” or termination without “cause”). |
| (3) | The Time Vested Options granted in 2009 (2010, with respect to Mr. Young) are scheduled to become exercisable ratably in September 2010, 2011, 2012, 2013 and 2014 provided the Named Executive Officer has remained continuously employed by EFH Corp. through the applicable vesting date (with customary exceptions for death, disability, and leaving for “good reason” or termination without “cause”). |
| (4) | The Cliff Vested Options are scheduled to become exercisable in September 2014 provided the Named Executive Officer has remained continuously employed by EFH Corp. through that date (with customary exceptions for death, disability, and leaving for “good reason” or termination without “cause”). |
240
| (5) | The Performance Vested Options vest in 20% increments on each of the first five anniversaries of December 31, 2007, subject to our achievement of the annual management EBITDA target for the given fiscal year (or certain cumulative performance targets) as detailed in the stock option agreements. In deciding whether to vest the Performance Vested Options, the O&C Committee considers EFH Corp.’s quantitative performance against certain management EBITDA targets. The method of calculating management EBITDA for purposes of vesting the Performance Vested Options is the same as the method for calculating management EBITDA for purposes of the EAIP, as described above. The O&C Committee also has broad discretion to consider other qualitative and quantitative criteria that it deems appropriate in connection with its decision to vest the Performance Vested Options. |
| (6) | This column reflects restricted stock units described above under “Long-Term Incentive Awards-Equity Investment.” Pursuant to his employment arrangement, Mr. Keglevic is entitled to receive 225,000 shares of EFH Corp.’s common stock if he is employed by EFH Corp. on September 30, 2012, or if his employment terminates for any reason prior to September 30, 2012, other than for “cause” or without “good reason.” If Mr. Keglevic receives the 225,000 shares, he has the right to sell the shares to EFH Corp. for $3,140,000, at any time during the period beginning on September 30, 2012 and ending on the sixtieth business day following his termination of employment (or, in the event Mr. Keglevic receives the shares upon his termination of employment, at any time during the period ending on the sixtieth business day following his termination of employment). |
| (7) | There is no established public market for our common stock. Our board of directors values our common stock on a semi-annual basis (on June 30th and December 31st of each year). The valuation is primarily done to set the exercise or base price of awards granted under the 2007 Stock Incentive Plan. In determining the valuation of our common stock, our Board, with the assistance of third party valuation experts, utilizes several valuation techniques, including discounted cash flow and comparable company analysis. The amount reported above under the heading “Market Value of Shares or Units of Stock That Have Not Vested” reflects the fair market value (as determined by our Board) of our common stock as of December 31, 2010. |
Options Exercised and Stock Vested – 2010
The table sets forth information regarding the vesting of equity awards held by the Named Executive Officers during 2010:
| | | | | | | | | | | | | | | | |
| | | Option Awards | | | Stock Awards | |
Name | | Number of Shares
Acquired or
Exercised | | | Value Realized on
Exercise($) | | | Number of Shares
Acquired on Vesting | | | Value Realized
on Vesting ($) | |
John F. Young (1) | | | 0 | | | | 0 | | | | 600,000 | | | | 1,950,000 | |
| | | | |
Paul M. Keglevic | | | 0 | | | | 0 | | | | 0 | | | | 0 | |
| | | | |
David A. Campbell | | | 0 | | | | 0 | | | | 0 | | | | 0 | |
| | | | |
James A. Burke | | | 0 | | | | 0 | | | | 0 | | | | 0 | |
| | | | |
M.A. McFarland (1) (2) | | | 0 | | | | 0 | | | | 100,000 | | | | 200,000 | |
| (1) | As described in greater detail above, our board of directors values our common stock on a semi-annual basis (on June30th and December 31st of each year). The valuation is conducted, in part, to set the price of shares granted under the 2007 Stock Incentive Plan. At the time that Mr. Young’s shares vested, our board of directors valued our common stock at $3.25 per share. At the time that Mr. McFarland’s shares vested, our board of directors valued our common stock at $2.00 per share. |
| (2) | Mr. McFarland’s deferred shares were distributed to him in October 2010, but they remain subject to a substantial risk of forfeiture. |
241
Pension Benefits – 2010
The table set forth below illustrates present value on December 31, 2010 of each Named Executive Officer’s Retirement Plan benefit and benefits payable under the Supplemental Retirement Plan, based on their years of service and remuneration through December 31, 2010:
| | | | | | | | | | |
Name | | Plan Name | | Number of Years
Credited Service
(#)(1) | | | PV of Accumulated
Benefit ($) | |
John F. Young | | Retirement Plan Supplemental Retirement Plan | |
| —
— |
| |
| 36,074
0 |
|
| | | |
Paul M. Keglevic | | Retirement Plan Supplemental Retirement Plan | |
| —
— |
| |
| 47,594
0 |
|
| | | |
David A. Campbell | | Retirement Plan Supplemental Retirement Plan | |
| 5.5833
8.5000 |
| |
| 135,418
85,817 |
|
| | | |
James A. Burke | | Retirement Plan Supplemental Retirement Plan | |
| 5.1667
5.1667 |
| |
| 123,253
82,253 |
|
| | | |
M.A. McFarland | | Retirement Plan Supplemental Retirement Plan | |
| —
— |
| |
| 0
0 |
|
| (1) | Because they were hired after October 1, 2007, Messrs. Young, Keglevic and McFarland are not eligible to receive monthly contribution credits under the cash balance component of our Retirement Plan. However, as described further in the narrative that follows, Messrs. Young and Keglevic participate in the cash balance component of the Retirement Plan solely with respect to amounts that were transferred from the Salary Deferral Program in 2009. |
EFH Corp. and its participating subsidiaries maintain the Retirement Plan, which is intended to be qualified under applicable provisions of the Code and covered by ERISA. The Retirement Plan contains both a traditional defined benefit component and a cash balance component. Only employees hired before January 1, 2002 may participate in the traditional defined benefit component. Because none of our Named Executive Officers were hired before January 1, 2002, no Named Executive Officer participates in the traditional defined benefit component. Employees hired after January 1, 2002 and before October 1, 2007 are eligible to participate in the cash balance component and receive monthly contribution credits based on age and years of accredited service. In addition, effective December 31, 2009, certain assets and liabilities under the Salary Deferral Program and the Supplemental Retirement Plan were transferred to the cash balance component of the Retirement Plan. Because they were hired in 2004, Messrs. Campbell and Burke have participated and may continue to participate in the cash balance component of the Retirement Plan, and because they were hired after October 2007, Messrs. Young and Keglevic participate in the cash balance component of the Retirement Plan solely with respect to amounts that were transferred from the Salary Deferral Program.
Under the cash balance component of the Retirement Plan, hypothetical accounts are established for participants and credited with monthly contribution credits equal to a percentage of the participant’s compensation (3.5%, 4.5%, 5.5% or 6.5% depending on the participant’s combined age and years of accredited service), contribution credits equal to the amounts transferred from the Salary Deferral Program and/or the Supplemental Retirement Plan in 2009 and interest credits on all of such amounts based on the average yield of the 30-year Treasury bond for the 12 months ending November 30 of the prior year.
The Supplemental Retirement Plan provides for the payment of retirement benefits, which would otherwise be limited by the Code or the definition of earnings under the Retirement Plan. Under the Supplemental Retirement Plan, retirement benefits under the cash balance component are calculated in accordance with the same formula used under the Retirement Plan. Participation in EFH Corp.’s Supplemental Retirement Plan has been limited to employees of all of its businesses other than Oncor, who were employed by EFH Corp. (or its participating subsidiaries) on or before October 1, 2007. Because they were hired in 2004, Messrs. Campbell and Burke participate in the Supplemental Retirement Plan, and because they were hired after October 2007, Messrs. Young, Keglevic and McFarland are not eligible to participate in the Supplemental Retirement Plan.
242
Benefits accrued under the Supplemental Retirement Plan after December 31, 2004, are subject to Section 409A of the Code. Accordingly, certain provisions of the Supplemental Retirement Plan have been modified in order to comply with the requirements of Section 409A and related guidance.
The present value of the accumulated benefit for the Retirement Plan (the cash balance component) was calculated as the value of their cash balance account projected to age 65 at an assumed growth rate of 4.75% and then discounted back to December 31, 2010 at 5.5%. No mortality or turnover assumptions were applied.
Nonqualified Deferred Compensation – 2010(1)
The following table sets forth information regarding plans that provide for the deferral of the Named Executive Officers’ compensation on a basis that is not tax-qualified for the fiscal year ended December 31, 2010:
| | | | | | | | | | | | | | | | | | | | |
Name | | Executive Contributions
in Last FY ($) | | | Registrant
Contributions in
Last FY ($) | | | Aggregate Earnings
in Last FY ($) | | | Aggregate
Withdrawals/
Distributions ($) | | | Aggregate
Balance at
Last FYE ($)(2) | |
John F. Young | | | 0 | | | | 0 | | | | 27,686 | | | | | | | | 309,402 | |
| | | | | |
Paul M. Keglevic | | | 0 | | | | 0 | | | | (46 | ) | | | | | | | 87,656 | |
| | | | | |
David A. Campbell (3) | | | 0 | | | | 0 | | | | 42,965 | | | | | | | | 863,856 | |
| | | | | |
James A. Burke (3) | | | 0 | | | | 0 | | | | 44,135 | | | | | | | | 839,898 | |
| | | | | |
M.A. McFarland | | | 0 | | | | 0 | | | | 0 | | | | | | | | 0 | |
| (1) | The amounts reported in the Nonqualified Deferred Compensation table include deferrals and the company match under the Salary Deferral Program. Under EFH Corp.’s Salary Deferral Program each employee of EFH Corp. and its participating subsidiaries who is in a designated job level and whose annual salary is equal to or greater than an amount established under the Salary Deferral Program ($110,840 for the program year beginning January 1, 2010) may elect to defer up to 50% of annual base salary, and/or up to 85% of the annual incentive award, for a maturity period of seven years, for a maturity period ending with the retirement of such employee, or for a combination thereof. EFH Corp. provided no matching contributions for 2010. Deferrals are credited with earnings or losses based on the performance of investment alternatives under the Salary Deferral Program selected by each participant. At the end of the applicable maturity period, the trustee for the Salary Deferral Program distributes the deferred compensation, any vested matching awards and the applicable earnings in cash as a lump sum or in annual installments at the participant’s election made at the time of deferral. EFH Corp. is financing the retirement option portion of the Salary Deferral Program through the purchase of corporate-owned life insurance on the lives of participants. The proceeds from such insurance are expected to allow EFH Corp. to fully recover the cost of the retirement option. Beginning in 2010, certain executive officers, including the Named Executive Officers, are not eligible to participate in the Salary Deferral Program. |
| (2) | A portion of the amounts reported as “Aggregate Balance at Last FYE” are also included in the Summary Compensation Table as follows: for Mr. Young, $80,000 and $66,667 of executive contributions are included as “Salary” for 2009 and 2008, respectively, and $80,000 and $66,667 of company matching contributions are included as “All Other Compensation” for 2009 and 2008, respectively; for Mr. Keglevic, $48,000 and $20,000 of executive contributions are included as “Salary” for, 2009 and 2008, respectively, and $48,000 and $20,000 of company matching contributions are included as “All Other Compensation” for 2009 and 2008, respectively; for Mr. Burke, $48,000 and $27,417 of executive contributions are included as “Salary” for 2009 and 2008, respectively, and $48,000 and $27,417 of company matching contributions are included as “All Other Compensation” for 2009 and 2008, respectively. |
| (3) | The amounts reported as “Aggregate Balance at Last FYE” for Messrs. Campbell and Burke include the fair market value of deferred shares (500,000 with respect to Mr. Campbell and 450,000 with respect to Mr. Burke) that each of them is entitled to receive on the earlier to occur of their termination of employment or a change in the effective control of EFH Corp. |
243
Potential Payments upon Termination or Change in Control
The tables and narrative below provide information for payments to each of the Named Executive Officers (or, as applicable, enhancements to payments or benefits) in the event of his termination, including if such termination is voluntary, for cause, as a result of death, as a result of disability, without cause or for good reason or without cause or for good reason in connection with a change in control.
The information in the tables below is presented in accordance with SEC rules, assuming termination of employment as of December 31, 2010.
Employment Arrangements with Contingent Payments
As of December 31, 2010, each of Messrs. Young, Keglevic, Campbell, Burke and McFarland had employment agreements with change in control and severance provisions as described in the following tables. In addition, in 2010, the O&C Committee approved certain changes to the compensation arrangements for Messrs. Young and Keglevic, which changes were effective on or before December 31, 2010 but not yet documented in such Named Executive Officers’ employment agreements. Certain of these changes affected the potential payments of Messrs. Young and Keglevic and are reflected in the following tables.
With respect to each Named Executive Officer’s employment agreement, a change in control is generally defined as (i) a transaction that results in a sale of substantially all of our assets to another person and such person having more seats on our Board than the Sponsor Group, (ii) a transaction that results in a person not in the Sponsor Group owning more than 50% of our common stock and such person having more seats on our Board than the Sponsor Group or (iii) a transaction that results in the Sponsor Group owning less than 20% of our common stock and the Sponsor Group not being able to appoint a majority of the directors to our Board.
Each Named Executive Officer’s employment agreement includes customary non-compete and non-solicitation provisions that generally restrict the Named Executive Officer’s ability to compete with us or solicit our customers or employees for his own personal benefit during the term of the employment agreement and 24 months (with respect to Mr. Young) or 18 months (with respect to Messrs. Keglevic, Campbell, Burke and McFarland) after the employment agreement expires or is terminated.
Each of our Named Executive Officers has been granted a long-term cash incentive award (the “LTI”) that entitles such Named Executive Officer to receive on September 30, 2012, to the extent such Named Executive Officer remains employed by EFH Corp. on such date (with customary exceptions for death, disability, and leaving for “good reason” or termination without “cause”), an additional one-time, lump-sum cash payment equal to 75% (100% with respect to Mr. Young) of the aggregate EAIP award received by such executive officer for fiscal years 2009, 2010 and 2011.
As of December 31, 2010, each of Messrs. Young, Keglevic, Campbell, Burke and McFarland had stock option agreements. Under the stock option agreement for each Named Executive Officer, in the event of such Named Executive Officer’s termination without cause or resignation for good reason (or in certain circumstances when the Named Executive Officer’s employment term is not extended) following a change in control of EFH Corp., such Named Executive Officer’s Time Vested Options would become immediately exercisable as to 100% of the shares of EFH Corp. common stock subject to such options immediately prior to the change in control. As of December 31, 2010, the fair market value of the shares of EFH Corp. common stock underlying each Named Executive Officer’s Time Vested Options (as determined from time to time by our Board) was less than the exercise price of such options.
244
1. Mr. Young
Potential Payments to Mr. Young upon Termination as of December 31, 2010 (per employment agreement, restricted stock agreement and stock option agreement, each in effect as of December 31, 2010, and revisions to such employment agreement that were adopted by the O&C Committee and effective as of December 31, 2010)
| | | | | | | | | | | | | | | | | | | | | | | | |
Benefit | | Voluntary | | | For Cause | | | Death | | | Disability | | | Without
Cause Or
For Good
Reason | | | Without Cause Or
For Good Reason In
Connection With
Change in Control | |
Cash Severance | | | N/A | | | | N/A | | | | | | | | | | | $ | 6,869,000 | | | $ | 9,869,000 | |
EAIP | | | N/A | | | | N/A | | | $ | 1,200,000 | | | $ | 1,200,000 | | | | | | | | | |
Annuity | | | N/A | | | | N/A | | | $ | 3,000,000 | | | $ | 3,000,000 | | | $ | 3,000,000 | | | $ | 3,000,000 | |
LTI Cash Retention Award | | | N/A | | | | N/A | | | $ | 2,669,000 | | | $ | 2,669,000 | | | | | | | | | |
Deferred Compensation | | | | | | | | | | | | | | | | | | | | | | | | |
- Salary Deferral Program | | | N/A | | | | N/A | | | $ | 175,346 | | | $ | 175,346 | | | | | | | $ | 175,346 | |
Health & Welfare | | | | | | | | | | | | | | | | | | | | | | | | |
- Medical/COBRA | | | N/A | | | | N/A | | | | | | | | | | | $ | 33,323 | | | $ | 33,323 | |
- Dental/COBRA | | | N/A | | | | N/A | | | | | | | | | | | $ | 2,990 | | | $ | 2,990 | |
Totals | | | N/A | | | | N/A | | | $ | 7,044,346 | | | $ | 7,044,346 | | | $ | 9,905,313 | | | $ | 13,080,659 | |
Mr. Young has entered into an employment agreement that provides for certain payments and benefits upon the expiration or termination of the agreement under the following circumstances:
| | 1. | In the event of Mr. Young’s death or disability: |
| | a. | a prorated annual incentive bonus for the year of termination; |
| | b. | value of supplemental retirement plan (the “Annuity”) for Mr. Young that vests on December 31, 2014 |
| | c. | the pro-rata retention award earned prior to termination date, and |
| | d. | payment of employee benefits, including stock compensation, if any, to which Mr. Young may be entitled. |
2. In the event of Mr. Young’s termination without cause or resignation for good reason:
| | a. | a lump sum payment equal to two and one-half times the sum of (i) his annualized base salary and (ii) a prorated annual incentive bonus for the year of termination; |
| | b. | value of supplemental retirement plan (the “Annuity”) for Mr. Young that vests on December 31, 2014 |
| | c. | the pro-rata retention award earned prior to termination date; |
| | d. | payment of employee benefits, including stock compensation, if any, to which Mr. Young may be entitled, and |
| | e. | certain continuing health care and company benefits. |
3. In the event of Mr. Young’s termination without cause or resignation for good reason within 24 months following a change in control of EFH Corp.:
| | a. | a lump sum payment equal to two and one-half times the sum of (i) his annualized base salary and (ii) his annual bonus target; |
| | b. | value of supplemental retirement plan (the “Annuity”) for Mr. Young that vests on December 31, 2014 |
| | c. | the pro-rata retention award earned prior to termination date; |
| | d. | a prorated annual incentive bonus for the year of termination; |
| | e. | payment of employee benefits, including stock compensation, if any, to which Mr. Young may be entitled; |
| | f. | certain continuing health care and company benefits, and |
| | g. | a tax gross-up payment to offset any excise tax which may result from the change in control payments. |
245
2. Mr. Keglevic
Potential Payments to Mr. Keglevic upon Termination as of December 31, 2010 (per employment agreement, deferred share agreement and stock option agreement, each in effect as of December 31, 2010, and revisions to such employment agreement that were adopted by the O&C Committee and effective as of December 31, 2010)
| | | | | | | | | | | | | | | | | | | | | | | | |
Benefit | | Voluntary | | | For Cause | | | Death | | | Disability | | | Without
Cause Or
For Good
Reason | | | Without Cause
Or For Good
Reason In
Connection
With Change in
Control | |
Cash Severance | | | N/A | | | | N/A | | | | | | | | | | | $ | 2,765,025 | | | $ | 3,317,525 | |
EAIP | | | N/A | | | | N/A | | | $ | 552,500 | | | $ | 552,500 | | | | | | | | | |
Payment of EFH Corp. Common Stock in respect of Restricted Stock Units (1) | | | N/A | | | | N/A | | | $ | 3,140,000 | | | $ | 3,140,000 | | | $ | 3,140,000 | | | $ | 3,140,000 | |
Acceleration of Stock Option Awards | | | N/A | | | | N/A | | | | | | | | | | | | | | | | | |
LTI Cash Retention Award | | | N/A | | | | N/A | | | $ | 912,525 | | | $ | 912,525 | | | | | | | | | |
Deferred Compensation | | | | | | | | | | | | | | | | | | | | | | | | |
- Salary Deferral Program | | | N/A | | | | N/A | | | $ | 68,071 | | | $ | 68,071 | | | | | | | $ | 68,071 | |
Health & Welfare | | | | | | | | | | | | | | | | | | | | | | | | |
- Dental/COBRA | | | N/A | | | | N/A | | | | | | | | | | | $ | 1,590 | | | $ | 1,590 | |
Totals | | | N/A | | | | N/A | | | $ | 4,673,096 | | | $ | 4,673,096 | | | $ | 5,906,615 | | | $ | 6,527,186 | |
| (1) | Pursuant to his amended employment arrangement, Mr. Keglevic is entitled to receive 225,000 shares of EFH Corp.’s common stock if he is employed by EFH Corp. on September 30, 2012, or if his employment terminates for any reason prior to September 30, 2012, other than for “cause” or without “good reason.” If Mr. Keglevic receives the 225,000 shares, he has the right to sell the shares to EFH Corp. for $3,140,000, at any time during the period beginning on September 30, 2012 and ending on the sixtieth business day following his termination of employment (or, in the event Mr. Keglevic receives the shares upon his termination of employment, at any time during the period ending on the sixtieth business day following his termination of employment). |
Mr. Keglevic entered into an employment agreement that provides for certain payments and benefits upon the expiration or termination of the agreement under the following circumstances:
| | 1. | In the event of Mr. Keglevic’s death or disability: |
| | a. | a prorated annual incentive bonus for the year of termination; |
| | b. | the pro-rata retention award earned prior to termination, and |
| | c. | payment of employee benefits, including stock compensation, if any, to which Mr. Keglevic may be entitled. |
2. In the event of Mr. Keglevic’s termination without cause or resignation for good reason:
| | a. | a lump sum payment equal to (i) two times his annualized base salary, (ii) a prorated annual incentive bonus for the year of termination; |
| | b. | the pro-rata retention award earned prior to termination; |
| | c. | payment of employee benefits, including stock compensation, if any, to which Mr. Keglevic may be entitled, and |
| | d. | certain continuing health care and company benefits. |
3. In the event of Mr. Keglevic’s termination without cause or resignation for good reason within 24 months following a change in control of EFH Corp.:
| | a. | a lump sum payment equal to two times the sum of (i) his annualized base salary and (ii) his annual bonus target; |
| | b. | the pro-rata retention award earned prior to termination; |
| | c. | payment of employee benefits, including stock compensation, if any, to which Mr. Keglevic may be entitled; |
| | d. | certain continuing health care and company benefits, and |
| | e. | a tax gross-up payment to offset any excise tax which may result from the change in control payments. |
246
3. Mr. Campbell
Potential Payments to Mr. Campbell upon Termination as of December 31, 2010 (per employment agreement, deferred share agreement and stock option agreement, each in effect as of December 31, 2010)
| | | | | | | | | | | | | | | | | | | | | | | | |
Benefit | | Voluntary | | | For Cause | | | Death | | | Disability | | | Without
Cause Or
For Good
Reason | | | Without Cause
Or For Good
Reason In
Connection
With Change
in Control | |
Cash Severance | | | | | | | | | | | | | | | | | | $ | 2,923,200 | | | $ | 3,518,200 | |
EAIP | | | | | | | | | | $ | 595,000 | | | $ | 595,000 | | | | | | | | | |
Distribution of Deferred Shares (1) | | $ | 625,000 | | | $ | 625,000 | | | $ | 625,000 | | | $ | 625,000 | | | $ | 625,000 | | | $ | 625,000 | |
Acceleration of Stock Option Awards | | | | | | | | | | | | | | | | | | | | | | | | |
LTI Cash Retention Award | | | | | | | | | | $ | 928,200 | | | $ | 928,200 | | | | | | | | | |
Retirement Benefits | | | | | | | | | | | | | | | | | | | | | | | | |
- Supplemental Retirement Plan | | $ | 99,096 | | | $ | 99,096 | | | $ | 99,096 | | | $ | 99,096 | | | $ | 99,096 | | | $ | 99,096 | |
Deferred Compensation | | | | | | | | | | | | | | | | | | | | | | | | |
- Salary Deferral Program (2) | | | | | | | | | | | | | | | | | | | | | | | | |
Health & Welfare | | | | | | | | | | | | | | | | | | | | | | | | |
- Medical/COBRA | | | | | | | | | | | | | | | | | | $ | 25,873 | | | $ | 25,873 | |
- Dental/COBRA | | | | | | | | | | | | | | | | | | $ | 2,392 | | | $ | 2,392 | |
Totals | | $ | 725,096 | | | $ | 725,096 | | | $ | 2,247,296 | | | $ | 2,247,296 | | | $ | 3,675,561 | | | $ | 4,270,561 | |
| (1) | The amount reported under the heading “Distribution of Deferred Shares” represents the fair market value of 500,000 shares of EFH Corp. common stock that Mr. Campbell is entitled to receive, pursuant to the terms of his deferred share agreement, on the earlier to occur of his termination of employment for any reason or a change in the effective control of EFH Corp. |
| (2) | Mr. Campbell is fully vested in the company matching portion of the Salary Deferral Plan. |
Mr. Campbell entered into an employment agreement that provides for certain payments and benefits upon the expiration or termination of the agreement under the following circumstances:
| | 1. | In the event of Mr. Campbell’s death or disability: |
| | a. | a prorated annual incentive bonus for the year of termination, |
| | b. | the pro-rata retention award earned prior to the date of termination, and |
| | c. | payment of employee benefits, including stock compensation, if any, to which Mr. Campbell may be entitled. |
2. In the event of Mr. Campbell’s termination without cause or resignation for good reason:
| | a. | a lump sum payment equal to (i) two times his annualized base salary, (ii) a prorated annual incentive bonus for the year of termination and (iii) the pro-rata retention award earned prior to the date of termination; |
| | b. | payment of employee benefits, including stock compensation, if any, to which Mr. Campbell may be entitled, and |
| | c. | certain continuing health care and company benefits. |
3. In the event of Mr. Campbell’s termination without cause or resignation for good reason within 24 months following a change in control of EFH Corp.:
| | a. | a lump sum payment equal to two times the sum of (i) his annualized base salary and (ii) his annual bonus target; |
| | b. | the pro-rata retention award; |
| | c. | payment of employee benefits, including stock compensation, if any, to which Mr. Campbell may be entitled; |
| | d. | certain continuing health care and company benefits, and |
| | e. | a tax gross-up payment to offset any excise tax which may result from the change in control payments. |
247
4. Mr. Burke
Potential Payments to Mr. Burke upon Termination as of December 31, 2010 (per employment agreement and stock option agreement, each in effect as of December 31, 2010)
| | | | | | | | | | | | | | | | | | | | | | | | |
Benefit | | Voluntary | | | For Cause | | | Death | | | Disability | | | Without
Cause Or
For Good
Reason | | | Without Cause
Or For Good
Reason In
Connection
With Change
in Control | |
Cash Severance | | | | | | | | | | | | | | | | | | $ | 2,839,725 | | | $ | 3,375,225 | |
EAIP | | | | | | | | | | $ | 535,500 | | | $ | 535,500 | | | | | | | | | |
Acceleration of Stock Option Awards Vesting of Options Distribution of Deferred Shares (1) | | $ | 562,500 | | | $ | 562,500 | | | $ | 562,500 | | | $ | 562,500 | | | $ | 562,500 | | | $ | 562,500 | |
LTI Cash Retention Award | | | | | | | | | | $ | 1,044,225 | | | $ | 1,044,225 | | | | | | | | | |
Retirement Benefits | | | | | | | | | | | | | | | | | | | | | | | | |
- Supplemental Retirement Plan | | $ | 93,464 | | | $ | 93,464 | | | $ | 93,464 | | | $ | 93,464 | | | $ | 93,464 | | | $ | 93,464 | |
Deferred Compensation | | | | | | | | | | | | | | | | | | | | | | | | |
- Salary Deferral Program | | | | | | | | | | $ | 74,077 | | | $ | 74,077 | | | | | | | $ | 74,077 | |
Health & Welfare | | | | | | | | | | | | | | | | | | | | | | | | |
- Medical/COBRA | | | | | | | | | | | | | | | | | | $ | 25,873 | | | $ | 25,873 | |
- Dental/COBRA | | | | | | | | | | | | | | | | | | $ | 2,392 | | | $ | 2,392 | |
Totals | | $ | 655,964 | | | $ | 655,964 | | | $ | 2,309,766 | | | $ | 2,309,766 | | | $ | 3,523,954 | | | $ | 4,133,531 | |
| (1) | The amount reported under the heading “Distribution of Deferred Shares” represents the fair market value of 450,000 shares of EFH Corp. common stock that Mr. Burke is entitled to receive, pursuant to the terms of his deferred share agreement, on the earlier to occur of his termination of employment for any reason or a change in the effective control of EFH Corp. |
Mr. Burke entered into an employment agreement that provides for certain payments and benefits upon the expiration or termination of the agreement under the following circumstances:
| | 1. | In the event of Mr. Burke’s death or disability: |
| | a. | a prorated annual incentive bonus for the year of termination; |
| | b. | the pro-rata retention award earned prior to termination, and |
| | c. | payment of employee benefits, including stock compensation, if any, to which Mr. Burke may be entitled. |
2. In the event of Mr. Burke’s termination without cause or resignation for good reason:
| | a. | a lump sum payment equal to (i) two times his annualized base salary, (ii) a prorated annual incentive bonus for the year of termination; |
| | b. | the pro-rata retention award earned prior to termination; |
| | c. | payment of employee benefits, including stock compensation, if any, to which Mr. Burke may be entitled, and |
| | d. | certain continuing health care and company benefits. |
3. In the event of Mr. Burke’s termination without cause or resignation for good reason within 24 months following a change in control of EFH Corp.:
| | a. | a lump sum payment equal to two times the sum of (i) his annualized base salary and (ii) his annual bonus target; |
| | b. | the pro-rata retention award earned prior to termination; |
| | c. | payment of employee benefits, including stock compensation, if any, to which Mr. Burke may be entitled; |
| | d. | certain continuing health care and company benefits and |
| | e. | a tax gross-up payment to offset any excise tax which may result from the change in control payments. |
248
5. Mr. McFarland
Potential Payments to Mr. McFarland upon Termination as of December 31, 2010 (per employment agreement and stock option agreement, each in effect as of December 31, 2010)
| | | | | | | | | | | | | | | | | | | | | | | | |
Benefit | | Voluntary | | | For Cause | | | Death | | | Disability | | | Without
Cause Or
For Good
Reason | | | Without Cause
Or For Good
Reason In
Connection
With Change
in Control | |
Cash Severance | | | N/A | | | | N/A | | | | | | | | | | | $ | 2,608,313 | | | $ | 3,118,313 | |
EAIP | | | N/A | | | | N/A | | | $ | 510,000 | | | $ | 510,000 | | | | | | | | | |
Acceleration of Stock Option Awards | | | N/A | | | | N/A | | | | | | | | | | | | | | | | | |
LTI Cash Retention Award | | | N/A | | | | N/A | | | $ | 898,313 | | | $ | 898,313 | | | | | | | | | |
Lump Sum Payment | | | N/A | | | | N/A | | | | | | | | | | | | | | | | | |
Deferred Compensation | | | | | | | | | | | | | | | | | | | | | | | | |
- Salary Deferral Program | | | N/A | | | | N/A | | | | | | | | | | | | | | | | | |
Health & Welfare | | | | | | | | | | | | | | | | | | | | | | | | |
- Medical/COBRA | | | N/A | | | | N/A | | | | | | | | | | | $ | 25,873 | | | $ | 25,873 | |
- Dental/COBRA | | | N/A | | | | N/A | | | | | | | | | | | $ | 2,392 | | | $ | 2,392 | |
Totals | | | N/A | | | | N/A | | | $ | 1,408,313 | | | $ | 1,408,313 | | | $ | 2,636,578 | | | $ | 3,146,578 | |
Mr. McFarland entered into an employment agreement that provides for certain payments and benefits upon the expiration or termination of the agreement under the following circumstances:
| | 1. | In the event of Mr. McFarland’s death or disability: |
| | a. | a prorated annual incentive bonus for the year of termination; |
| | b. | the pro-rata retention award earned prior to termination, and |
| | c. | payment of employee benefits, including stock compensation, if any, to which Mr. McFarland may be entitled. |
2. In the event of Mr. McFarland’s termination without cause or resignation for good reason:
| | a. | a lump sum payment equal to (i) two times his annualized base salary, (ii) a prorated annual incentive bonus for the year of termination; |
| | b. | the pro-rata retention award earned prior to termination; |
| | c. | payment of employee benefits, including stock compensation, if any, to which Mr. McFarland may be entitled, and |
| | d. | certain continuing health care and company benefits. |
3. In the event of Mr. McFarland’s termination without cause or resignation for good reason within 24 months following a change in control of EFH Corp.:
| | a. | a lump sum payment equal to two times the sum of (i) his annualized base salary and (ii) his annual bonus target; |
| | b. | the pro-rata retention award earned prior to termination; |
| | c. | payment of employee benefits, including stock compensation, if any, to which Mr. McFarland may be entitled; |
| | d. | certain continuing health care and company benefits, and |
| | e. | a tax gross-up payment to offset any excise tax which may result from the change in control payments. |
249
Excise Tax Gross-Ups
Pursuant to their employment agreements, if any of our Named Executive Officers would be subject to the imposition of the excise tax imposed by Section 4999 of the Code, related to the executive’s employment, but the imposition of such tax could be avoided by approval of our shareholders as described in Section 280G(b)(5)(B) of the Code, then such executive may cause EFH Corp. to seek such approval, in which case EFH Corp. will use its reasonable best efforts to cause such approval to be obtained and such executive will cooperate and execute such waivers as may be necessary so that such approval avoids imposition of any excise tax under Section 4999. If such executive fails to cause EFH Corp. to seek such approval or fails to cooperate and execute the waivers necessary in the approval process, such executive shall not be entitled to any gross-up payment for any resulting tax under Section 4999.
Compensation Committee Interlocks and Insider Participation
There are no relationships among our executive officers, members of the O&C Committee or entities whose executives served on the O&C Committee that required disclosure under applicable SEC rules and regulations. For a description of related person transactions involving members of the O&C Committee, see Item 13, entitled “Related Person Transactions.”
250
Director Compensation
The table below sets forth information regarding the aggregate compensation paid to the members of the Board during the year ended December 31, 2010. Directors who are officers of EFH Corp. or members of the Sponsor Group (or their respective affiliates) do not receive any fees for service as a director. EFH Corp. reimburses directors for certain reasonable expenses incurred in connection with their services as directors.
| | | | | | | | | | | | | | | | |
Name | | Fees Earned or
Paid in Cash
($) | | | Stock Awards
($) | | | All Other
Compensation
($) | | | Total ($) | |
Arcilia C. Acosta (1) | | | 150,000 | | | | 100,000 | | | | — | | | | 250,000 | |
David Bonderman | | | — | | | | — | | | | — | | | | — | |
Donald L. Evans (2) | | | 2,000,000 | | | | — | | | | — | | | | 2,000,000 | |
Thomas D. Ferguson | | | — | | | | — | | | | — | | | | — | |
Frederick M. Goltz | | | — | | | | — | | | | — | | | | — | |
James R. Huffines (1) | | | 150,000 | | | | 100,000 | | | | — | | | | 250,000 | |
Scott Lebovitz | | | — | | | | — | | | | — | | | | — | |
Jeffrey Liaw | | | — | | | | — | | | | — | | | | — | |
Marc S. Lipschultz | | | — | | | | — | | | | — | | | | — | |
Michael MacDougall | | | — | | | | — | | | | — | | | | — | |
Lyndon L. Olson, Jr. (1) | | | 150,000 | | | | 100,000 | | | | — | | | | 250,000 | |
Kenneth Pontarelli | | | — | | | | — | | | | — | | | | — | |
William K. Reilly (1) | | | 150,000 | | | | 100,000 | | | | — | | | | 250,000 | |
Jonathan D. Smidt | | | — | | | | — | | | | — | | | | — | |
John F. Young | | | — | | | | — | | | | — | | | | — | |
Kneeland Youngblood (1) | | | 150,000 | | | | 100,000 | | | | — | | | | 250,000 | |
| (1) | Ms. Acosta and Messrs. Huffines, Olson, Reilly and Youngblood receive $150,000 annually and an annual equity award (paid in shares of EFH Corp. common stock) valued at $100,000 (the grant date fair value) for their service as a director. |
| (2) | In February 2010, EFH Corp. entered into a new consulting agreement with Mr. Evans effective retroactively to October 10, 2009, pursuant to which Mr. Evans receives an annual fee of $2,000,000. The term of the new consulting agreement expires in October 2012. |
251
| Item 12. | SECURITY OWNERSHIP OF CERTAIN BENEFICIAL OWNERS AND MANAGEMENT AND RELATED STOCKHOLDER MATTERS |
The following table presents information concerning stock-based compensation plans as of December 31, 2010. (See Note 21 to Financial Statements.)
| | | | | | | | | | | | |
| | | (a)
Number of securities to
be issued upon exercise
of outstanding options,
warrants and rights | | | (b)
Weighted-average
exercise price of
outstanding options,
warrants and rights | | | (c)
Number of securities
remaining available for
future issuance under
equity compensation
plans, excluding
securities reflected in
column (a) | |
| | | |
Equity compensation plans approved by security holders | | | — | | | $ | — | | | | — | |
| | | |
Equity compensation plans not approved by security holders | | | 65,333,309 | | | $ | 4.29 | | | | 6,666,691 | |
| | | |
| | | | | | | | | | | | |
| | | |
Total | | | 65,333,309 | | | $ | 4.29 | | | | 6,666,691 | |
| | | | | | | | | | | | |
| | |
| Note: | | Includes 48.4 million stock options with a weighted average exercise price of $4.50. |
| |
| | Includes 8.4 million vested and unvested restricted shares, deferred shares and stock granted to directors as part of their compensation plan. |
252
Beneficial Ownership of Common Stock of Energy Future Holdings Corp.
The following table lists the number of shares of common stock of EFH Corp. beneficially owned by each director and certain executive officers of EFH Corp. and the holders of more than 5% of EFH Corp.’s common stock as of February 1, 2011.
| | | | | | | | |
Name | | Number of Shares
Beneficially Owned | | | Percent of
Class | |
Texas Energy Future Holdings Limited Partnership (1) | | | 1,657,600,000 | | | | 97.81 | % |
Arcilia C. Acosta (2) | | | 100,770 | | | | * | |
David Bonderman (3) | | | 1,657,600,000 | | | | 97.81 | % |
Donald L. Evans (4) | | | 1,000,000 | | | | * | |
Thomas D. Ferguson (5) | | | 1,657,600,000 | | | | 97.81 | % |
Frederick M. Goltz (6) | | | 1,657,600,000 | | | | 97.81 | % |
James R. Huffines | | | 390,770 | | | | * | |
Scott Lebovitz (5) | | | 1,657,600,000 | | | | 97.81 | % |
Jeffrey Liaw (3) | | | 1,657,600,000 | | | | 97.81 | % |
Marc S. Lipschultz (6) | | | 1,657,600,000 | | | | 97.81 | % |
Michael MacDougall (3) | | | 1,657,600,000 | | | | 97.81 | % |
Lyndon L. Olson, Jr. | | | 250,770 | | | | * | |
Kenneth Pontarelli (5) | | | 1,657,600,000 | | | | 97.81 | % |
William K. Reilly | | | 230,770 | | | | * | |
Jonathan D. Smidt (6) | | | 1,657,600,000 | | | | 97.81 | % |
John F. Young (7) | | | 5,062,009 | | | | * | |
Kneeland Youngblood | | | 170,770 | | | | * | |
James A. Burke (8) | | | 1,715,000 | | | | * | |
David A. Campbell (9) | | | 2,660,000 | | | | * | |
Paul M. Keglevic (10) | | | 1,575,000 | | | | | |
M. A. McFarland (11) | | | 1,143,550 | | | | * | |
All directors and current executive officers as a group (24 persons) (12) | | | 1,674,219,409 | | | | 98.79 | % |
| | (1) | Texas Holdings beneficially owns 1,657,600,000 shares of EFH Corp. The sole general partner of Texas Holdings is Texas Energy Future Capital Holdings LLC (Texas Capital), which, pursuant to the Amended and Restated Limited Partnership Agreement of Texas Holdings, has the right to vote all of the EFH Corp. shares owned by Texas Holdings. The address of both Texas Holdings and Texas Capital is 301 Commerce Street, Suite 3300, Fort Worth, Texas 76102. |
| | (2) | 70,000 shares held in a family limited partnership, ACA Family LP. |
| | (3) | Includes the 1,657,600,000 shares owned by Texas Holdings, over which TPG Partners V, L.P., TPG Partners IV, L.P., TPG FOF V-A, L.P. and TPG FOF V-B, L.P. (TPG Entities) may be deemed, as a result of their ownership of 27.01% of Texas Capital’s outstanding units and certain provisions of Texas Capital’s Amended and Restated Limited Liability Company Agreement (TC LLC Agreement), to have shared voting or dispositive power. The ultimate general partners of the TPG Entities are TPG Advisors IV, Inc. and TPG Advisors V, Inc. David Bonderman and James Coulter are the sole shareholders and directors of TPG Advisors IV Inc. and TPG Advisors V Inc., and therefore, Messrs. Bonderman and Coulter, TPG Advisors IV Inc. and TPG Advisors V Inc. may each be deemed to beneficially own the shares held by the TPG Entities. Messrs. Bonderman, Liaw and MacDougall are managers of Texas Capital. By virtue of their position in relation to Texas Capital and the TPG Entities, Messrs. Bonderman, Liaw and MacDougall may be deemed to have beneficial ownership with respect to the shares of EFH Corp. common stock owned by Texas Holdings. Each of Messrs. Liaw and MacDougall disclaims beneficial ownership of such shares except to the extent of their pecuniary interest in those shares. The address of each entity and individual listed in this footnote is 301 Commerce Street, Suite 3300, Fort Worth, Texas 76102. |
253
| | (4) | Includes 600,000 shares issuable upon exercise of vested options. |
| | (5) | Includes the 1,657,600,000 shares owned by Texas Holdings, over which GS Capital Partners VI Fund, L.P., GSCP VI Offshore TXU Holdings, L.P., GSCP VI Germany TXU Holdings, L.P., GS Capital Partners VI Parallel, L.P., GS Global Infrastructure Partners I, L.P., GS Infrastructure Offshore TXU Holdings, L.P. (GSIP International Fund), GS Institutional Infrastructure Partners I, L.P., Goldman Sachs TXU Investors L.P. and Goldman Sachs TXU Investors Offshore Holdings, L.P. (collectively, Goldman Entities) may be deemed, as a result of their ownership of 27.02% of Texas Capital’s outstanding units and certain provision of the TC LLC Agreement, to have shared voting or dispositive power. Affiliates of The Goldman Sachs Group, Inc. (Goldman Sachs) are the general partner, managing general partner or investment manager of each of the Goldman Entities, and each of the Goldman Entities shares voting and investment power with certain of their respective affiliates. Each of Goldman Sachs and the Goldman Entities disclaims beneficial ownership of such shares of common stock except to the extent of its pecuniary interest therein. Messrs. Ferguson, Lebovitz and Pontarelli are managers of Texas Capital and executives with affiliates of Goldman Sachs. By virtue of their position in relation to Texas Capital and the Goldman Entities, Messrs. Ferguson, Lebovitz and Pontarelli may be deemed to have beneficial ownership with respect to the shares of EFH Corp. common stock owned by Texas Holdings. Each of Messrs. Ferguson, Lebovitz and Pontarelli disclaims beneficial ownership of such shares except to the extent of their pecuniary interest in those shares. The address of each entity and individual listed in this footnote is c/o Goldman, Sachs & Co., 85 Broad Street, New York, New York 10004. |
| | (6) | Includes the 1,657,600,000 shares owned by Texas Holdings, over which KKR 2006 Fund L.P., KKR PEI Investments, L.P., KKR Partners III, L.P., KKR North American Co-Invest Fund I L.P. and TEF TFO Co-Invest, LP (KKR Entities) may be deemed, as a result of their ownership of 37.05% of Texas Capital’s outstanding units and certain provision of the TC LLC Agreement, to have shared voting or dispositive power. The KKR Entities disclaim beneficial ownership of any shares of our common stock in which they do not have a pecuniary interest. Messrs. Goltz, Lipschultz and Smidt are managers of Texas Capital and executives of Kohlberg Kravis Roberts & Co. L.P. By virtue of their position in relation to Texas Capital and the KKR Entities, Messrs. Goltz, Lipschultz and Smidt may be deemed to have beneficial ownership with respect to the shares of EFH Corp. common stock owned by Texas Holdings. Each of Messrs. Goltz, Lipschultz and Smidt disclaims beneficial ownership of such shares except to the extent of their pecuniary interest in those shares. The address of each entity and individual listed in this footnote is c/o Kohlberg Kravis Roberts & Co. L.P., 9 West 57th Street, Suite 4200, New York, New York 10019. |
| | (7) | Includes 4,050,000 shares issuable upon exercise of vested options. |
| | (8) | Includes 450,000 deferred shares which, in accordance with the terms of the Deferred Share Agreement, will be settled in shares of EFH Corp. common stock upon the earlier of termination of employment or a change in control of EFH Corp. and 1,265,00 shares issuable upon exercise of vested options. |
| | (9) | Includes 500,000 deferred shares which, in accordance with the terms of the Deferred Share Agreement, will be settled in shares of EFH Corp. common stock upon the earlier of termination of employment or a change in control of EFH Corp. and 2,160,000 shares issuable upon exercise of vested options. |
| | (10) | Includes 225,000 deferred shares which, in accordance with the terms of the Deferred Share Agreement, will be settled in shares of EFH Corp. common stock upon the earlier of termination of employment or a change in control of EFH Corp. and 1,350,000 shares issuable upon exercise of vested options. |
| | (11) | Includes 1,080,000 shares issuable upon exercise of vested options. |
| | (12) | The Organization and Compensation Committee of EFH Corp.’s Board of Directors recently approved an exchange program pursuant to which EFH Corp.’s executive officers may exchange any and all of their outstanding options for restricted stock units that cliff-vest on September 30, 2014. |
254
| Item 13. | CERTAIN RELATIONSHIPS AND RELATED TRANSACTIONS, AND DIRECTOR INDEPENDENCE |
Policies and Procedures Relating to Related Party Transactions
The Board has adopted a policy regarding related person transactions. Under this policy, a related person transaction shall be consummated or shall continue only if:
| | 1. | the Audit Committee of the Board approves or ratifies such transaction in accordance with the policy and determines that the transaction is on terms comparable to those that could be obtained in arm’s length dealings with an unrelated third party; |
| | 2. | the transaction is approved by the disinterested members of the Board or the Executive Committee; or |
| | 3. | the transaction involves compensation approved by the Organization and Compensation Committee of the Board. |
For purposes of this policy, the term “related person” includes EFH Corp.’s directors, executive officers, 5% shareholders and their immediate family members. “Immediate family members” means any child, stepchild, parent, stepparent, spouse, sibling, mother-in-law, father-in-law, son-in-law, daughter-in-law, brother-in-law or sister-in-law or any person (other than a tenant or employee) sharing the household of a director, executive officer or 5% shareholder.
A “related person transaction” is a transaction between EFH Corp. or its subsidiaries and a related person, other than the types of transactions described below, which are deemed to be pre-approved by the Audit Committee of the Board:
| | 1. | any compensation paid to a director if the compensation is required to be reported under Item 402 of Regulation S-K of the Securities Act; |
| | 2. | any transaction with another company at which a related person’s only relationship is as an employee (other than an executive officer), director or beneficial owner of less than 10% of that company’s ownership interests; |
| | 3. | any charitable contribution, grant or endowment by EFH Corp. to a charitable organization, foundation or university at which a related person’s only relationship is as an employee (other than an executive officer) or director; |
| | 4. | transactions where the related person’s interest arises solely from the ownership of EFH Corp.’s equity securities and all holders of that class of equity securities received the same benefit on a pro rata basis; |
| | 5. | transactions involving a related party where the rates or charges involved are determined by competitive bids; |
| | 6. | any transaction with a related party involving the rendering of services as a common or contract carrier, or public utility, as rates or charges fixed in conformity with law or governmental authority; |
| | 7. | any transaction with a related party involving services as a bank depositary of funds, transfer agent, registrar, trustee under a trust indenture, or similar service; |
| | 8. | transactions available to all employees or customers generally (unless required to be disclosed under Item 404 of Regulation S-K of the Securities Act, if applicable); |
| | 9. | transactions involving less than $100,000 when aggregated with all similar transactions; |
| | 10. | transactions between EFH Corp. and its subsidiaries or between subsidiaries of EFH Corp.; |
| | 11. | transactions not required to be disclosed under Item 404 of Regulation S-K under the Securities Act of 1933, and |
| | 12. | open market purchases of the EFH Corp. or its subsidiaries’ debt or equity securities and interest payments on such debt. |
255
The Board has determined that it is appropriate for the Audit Committee of the Board to review and approve or ratify related person transactions. Accordingly, at least annually, management reviews related person transactions to be entered into by EFH Corp. or its subsidiaries, if any. After review, the Audit Committee of the Board approves/ratifies or disapproves such transactions. Management updates the Audit Committee of the Board as to any material changes to such related person transactions. In unusual circumstances, EFH Corp. or its subsidiaries may enter into related person transactions in advance of receiving approval, provided that such related person transactions are reviewed and ratified as soon as reasonably practicable by the Audit Committee of the Board. If the Audit Committee of the Board determines not to ratify such transactions, EFH Corp. makes all reasonable efforts to cancel or otherwise terminate the affected transactions.
The related person transactions described below under “Related Person Transactions – Business Affiliations,” were ratified by the Audit Committee of the Board pursuant to the policy described above. All other related person transactions were approved prior to the Board’s adoption of this policy, but were approved by either the Board or its Executive Committee. Transactions described below under “Related Person Transactions – Transactions with Sponsor Affiliates” are not related person transactions under the EFH Corp. policy because they are not with a director, executive officer, 5% shareholder or any of their immediate family members, but are described in the interest of greater disclosure.
Related Person Transactions
Limited Partnership Agreement of Texas Energy Future Holdings Limited Partnership; Limited Liability Company Agreement of Texas Energy Future Capital Holdings LLC
The Sponsor Group and certain investors who agreed to co-invest with the Sponsor Group or through a vehicle jointly controlled by the Sponsor Group to provide equity financing for the Merger (Co-Investors) entered into (i) a limited partnership agreement (LP Agreement) in respect of EFH Corp.’s parent company, Texas Holdings and (ii) the LLC Agreement in respect of Texas Holdings’ sole general partner, Texas Capital. The LP Agreement provides that Texas Capital has the right to vote or execute consents with respect to any shares of EFH Corp.’s common stock owned by Texas Holdings. The LLC Agreement and LP Agreement contain agreements among the parties with respect to the election of EFH Corp.’s directors, restrictions on the issuance or transfer of interests in EFH Corp., including tag-along rights and drag-along rights, and other corporate governance provisions (including the right to approve various corporate actions).
The LLC Agreement provides that Texas Capital and its members will take all action required to ensure that the managers of Texas Capital are also members of EFH Corp.’s Board. Pursuant to the LLC Agreement each of (i) KKR 2006 Fund L.P. and affiliated investment funds, (ii) TPG Partners V, L.P. and affiliated investment funds and (iii) certain funds affiliated with Goldman Sachs, has the right to designate three managers of Texas Capital. These rights are subject to maintenance of certain investment levels in Texas Holdings.
Registration Rights Agreement
The Sponsor Group and the Co-Investors entered into a registration rights agreement with EFH Corp. upon completion of the Merger. Pursuant to this agreement, in certain circumstances, the Sponsor Group can cause EFH Corp. to register shares of EFH Corp.’s common stock owned directly or indirectly by them under the Securities Act. In certain circumstances, the Sponsor Group and the Co-Investors are also entitled to participate on a pro rata basis in any registration of EFH Corp.’s common stock under the Securities Act that it may undertake. In 2008 and 2009, Ms. Acosta and Messrs. Evans, Huffines, Olson, Reilly and Youngblood, each of whom are members of our Board, and Messrs. Young, Campbell, Walters, Burke, Keglevic, McFarland, Kaplan and Landy, each of whom are executive officers of EFH Corp., became parties to this agreement.
256
Management Services Agreement
In October 2007, in connection with the Merger, the Sponsor Group and Lehman Brothers Inc. entered into a management agreement with EFH Corp. (Management Agreement), pursuant to which affiliates of the Sponsor Group provide management, consulting, financial and other advisory services to EFH Corp. Pursuant to the Management Agreement, affiliates of the Sponsor Group are entitled to receive an aggregate annual management fee of $35 million, which amount increases 2% annually, and reimbursement of out-of-pocket expenses incurred in connection with the provision of services pursuant to the Management Agreement. The Management Agreement will continue in effect from year to year, unless terminated upon a change of control of EFH Corp. or in connection with an initial public offering of EFH Corp. or if the parties thereto mutually agree to terminate the Management Agreement. Pursuant to the Management Agreement, affiliates of the Sponsor Group and Lehman Brothers Inc. were paid transaction fees an aggregate $300 million for certain services provided in connection with the Merger and related transactions. In addition, the Management Agreement provides that the Sponsor Group will be entitled to receive a fee equal to a percentage of the gross transaction value in connection with certain subsequent financing, acquisition, disposition, merger combination and change of control transactions, as well as a termination fee based on the net present value of future payment obligations under the Management Agreement in the event of an initial public offering or under certain other circumstances. Under terms of the Management Agreement, EFH Corp. paid approximately $37 million, inclusive of expenses, to the Sponsor Group during 2010.
Indemnification Agreement
Concurrently with entering into the Management Agreement, the Sponsor Group, Texas Holdings and EFH Corp. entered into an indemnification agreement (Indemnification Agreement), pursuant to which EFH Corp. and Texas Holdings agree to indemnify the Sponsor Group and their affiliates against any claims relating to (i) certain securities and financing transactions relating to the Merger, (ii) the performance of transaction services pursuant to the Management Agreement, (iii) actions or failures to act by EFH Corp., Texas Holdings, Texas Capital or their subsidiaries or affiliates (collectively, Company Group), (iv) service as an officer or director of, or at the request of, any member of the Company Group, and (v) any breach or alleged breach of fiduciary duty as a director or officer of any member of the Company Group.
Sale Participation Agreement
Ms. Acosta and Messrs. Evans, Huffines, Olson, Reilly and Youngblood, each of whom are members of our Board, and Messrs. Young, Campbell, Walters, Burke, Keglevic, McFarland, Kaplan and Landry, each of whom are executive officers, entered into sale participation agreements with EFH Corp. Pursuant to the terms of these agreements, among other things, shares of EFH Corp.’s common stock held by these individuals are subject to tag-along and drag-along rights in the event of a sale by the Sponsor Group of shares of EFH Corp.’s common stock held by the Sponsor Group.
Certain Charter Provisions
EFH Corp.’s restated certificate of formation contains provisions limiting our directors’ obligations in respect of corporate opportunities.
Management Stockholders’ Agreement
Subject to a management stockholders’ agreement, certain members of management, including EFH Corp.’s directors, executive officers, along with other members of management, elected to invest in EFH Corp. by contributing cash or common stock, or a combination of both, to EFH Corp. prior to or following the Merger and receiving common stock in EFH Corp. in exchange therefore. The net aggregate amount of this investment as of December 31, 2010 is approximately $40.5 million. The management stockholders’ agreement creates certain rights and restrictions on these shares of common stock, including transfer restrictions and tag-along, drag-along, put, call and registration rights in certain circumstances.
257
Director Stockholders’ Agreement
Certain members of our Board have entered into a stockholders’ agreement with EFH Corp. These stockholders’ agreements create certain rights and restrictions on the equity, including transfer restrictions and tag-along, drag-along, put, call and registration rights in certain circumstances.
Business Affiliations
Mr. Olson, a member of our board, has an ownership interest in Texas Meter and Device Company (TMD), a company that conducts tests on Oncor’s high voltage personal protective equipment. Mr. Olson and his brother collectively directly own approximately 24% of TMD. This entity is majority owned by its chief executive officer who is not related to Mr. Olson. In 2010, Oncor paid TMD approximately $1 million. The business relationship with TMD commenced several years prior to Mr. Olson joining the Board.
Transactions with Sponsor Affiliates
TCEH has entered into the TCEH Senior Secured Facilities, and Oncor has entered into a revolving credit facility, each with syndicates of financial institutions and other lenders. These syndicates included affiliates of GS Capital Partners. These transactions were approved by the Board.
Goldman participated in the issuance of new senior secured notes by EFH Corp. in January 2010 and senior secured second lien notes by TCEH in October 2010 and was paid fees in the amounts of approximately $3 million and $1 million, respectively, as compensation for its services. Also, Goldman acted as dealer manager and solicitation agent in connection with the debt exchange offers completed in August 2010 by EFIH and EFIH Finance and was paid a fee in the amount of $7 million for its services (see Note 22 to Financial Statements for additional information).
Affiliates of GS Capital Partners have from time to time engaged in commercial and investment banking and financial advisory transactions with EFH Corp. in the normal course of business. Affiliates of Goldman are party to certain commodity and interest rate hedging transactions with EFH Corp. in the normal course of business.
From time to time affiliates of the Sponsor Group may acquire debt or debt securities issued by EFH Corp. or its subsidiaries in open market transactions or through loan syndications.
Members of the Sponsor Group and/or their respective affiliates have from time to time entered into, and may continue to enter into, arrangements with us to use our products and services in the ordinary course of their business, which often result in revenues to us in excess of $120,000 annually. In addition, we have entered into, and may continue to enter into, arrangements with members of the Sponsor Group and/or their respective affiliates to use their products and services in the ordinary course of their business, which often result in revenues to members of the Sponsor Group or their respective affiliates in excess of $120,000 annually.
258
Director Independence
Though not formally considered by the Board because EFH Corp.’s common stock is not currently registered under the Exchange Act of 1934 with the SEC or traded on any national securities exchange, based upon the listing standards for issuers of equity securities on the New York Stock Exchange (NYSE), the national securities exchange upon which EFH Corp.’s common stock was traded prior to the Merger, only Ms. Acosta and Mr. Youngblood would be considered independent. Because of their relationships with the Sponsor Group or with EFH Corp. directly, none of the other directors would be considered independent under the NYSE listing standards for issuers of equity securities. See “Certain Relationships and Related Party Transactions” and Item 11, “Executive Compensation – Director Compensation.” Accordingly, we believe that Ms. Acosta is the only member of the Organization and Compensation Committee who would meet the NYSE’s independence requirements for issuers of equity securities. We believe that none of the members of EFH Corp.’s Governance and Public Affairs Committee would meet the NYSE’s independence requirements for issuers of equity securities. Under the NYSE’s audit committee independence requirement for issuers of debt securities, Messrs. Huffines and Youngblood and Ms. Acosta, who constitute the Audit Committee, are considered independent.
259
| Item 14. | PRINCIPAL ACCOUNTING FEES AND SERVICES |
Deloitte & Touche LLP has been the independent auditor for EFH Corp. and for its Predecessor (TXU Corp.) since its organization in 1996.
The Audit Committee of the EFH Corp. Board of Directors has adopted a policy relating to the engagement of EFH Corp.’s independent auditor. The policy provides that in addition to the audit of the financial statements, related quarterly reviews and other audit services, and providing services necessary to complete SEC filings, EFH Corp.’s independent auditor may be engaged to provide non-audit services as described herein. Prior to engagement, all services to be rendered by the independent auditor must be authorized by the Audit Committee in accordance with pre-approval procedures which are defined in the policy. The pre-approval procedures require:
| | 1. | The annual review and pre-approval by the Audit Committee of all anticipated audit and non-audit services; and |
| | 2. | The quarterly pre-approval by the Audit Committee of services, if any, not previously approved and the review of the status of previously approved services. |
The Audit Committee may also approve certain on-going non-audit services not previously approved in the limited circumstances provided for in the SEC rules. All services performed by Deloitte & Touche LLP, the member firms of Deloitte Touche Tohmatsu and their respective affiliates (Deloitte & Touche) for EFH Corp. in 2010 were pre-approved by the Audit Committee.
The policy defines those non-audit services which EFH Corp.’s independent auditor may also be engaged to provide as follows:
| 1. | Audit-related services, including: |
| | a. | due diligence accounting consultations and audits related to mergers, acquisitions and divestitures; |
| | b. | employee benefit plan audits; |
| | c. | accounting and financial reporting standards consultation; |
| | d. | internal control reviews, and |
| | e. | attest services, including agreed-upon procedures reports that are not required by statute or regulation. |
| 2. | Tax-related services, including: |
| | b. | general tax consultation and planning; |
| | c. | tax advice related to mergers, acquisitions, and divestitures, and |
| | d. | communications with and request for rulings from tax authorities. |
| 3. | Other services, including: |
| | a. | process improvement, review and assurance; |
| | b. | litigation and rate case assistance; |
| | c. | forensic and investigative services, and |
260
The policy prohibits EFH Corp. from engaging its independent auditor to provide:
| 1. | Bookkeeping or other services related to EFH Corp.’s accounting records or financial statements; |
| 2. | Financial information systems design and implementation services; |
| 3. | Appraisal or valuation services, fairness opinions, or contribution-in-kind reports; |
| 5. | Internal audit outsourcing services; |
| 6. | Management or human resource functions; |
| 7. | Broker-dealer, investment advisor, or investment banking services; |
| 8. | Legal and expert services unrelated to the audit, and |
| 9. | Any other service that the Public Company Accounting Oversight Board determines, by regulation, to be impermissible. |
In addition, the policy prohibits EFH Corp.’s independent auditor from providing tax or financial planning advice to any officer of EFH Corp.
Compliance with the Audit Committee’s policy relating to the engagement of Deloitte & Touche is monitored on behalf of the Audit Committee by EFH Corp.’s chief accounting officer. Reports describing the services provided by Deloitte & Touche and fees for such services are provided to the Audit Committee no less often than quarterly.
For the years ended December 31, 2010 and 2009, fees billed to EFH Corp. by Deloitte & Touche were as follows:
| | | | | | | | |
| | | 2010 (a) | | | 2009 | |
Audit Fees. Fees for services necessary to perform the annual audit, review SEC filings, fulfill statutory and other service requirements, provide comfort letters and consents | | $ | 5,833,000 | | | $ | 7,549,000 | |
Audit-Related Fees.Fees for services including employee benefit plan audits, due diligence related to mergers, acquisitions and divestitures, accounting consultations and audits in connection with acquisitions, internal control reviews, attest services that are not required by statute or regulation, and consultation concerning financial accounting and reporting standards | | | 706,000 | | | | 1,811,000 | |
Tax Fees.Fees for tax compliance, tax planning, and tax advice related to mergers and acquisitions, divestitures, and communications with and requests for rulings from taxing authorities | | | 102,000 | | | | 904,000 | |
All Other Fees.Fees for services including process improvement reviews, forensic accounting reviews, litigation and rate case assistance, and training services | | | 0 | | | | 0 | |
Total | | $ | 6,641,000 | | | $ | 10,264,000 | |
| (a) | See Notes 1 and 3 to Financial Statements for discussion of the deconsolidation of Oncor Holdings effective January 1, 2010. |
261
PART IV
| Item 15. | EXHIBITS AND FINANCIAL STATEMENT SCHEDULES |
(a) Oncor Holdings Financial Statements are presented pursuant to Rules 3–09 and 3–16 of Regulation S-X as Exhibit 99(e).
(b) Exhibits:
EFH Corp. Exhibits to Form 10-K for the Fiscal Year Ended December 31, 2010
| | | | | | | | |
Exhibits | | Previously Filed* With File Number | | As
Exhibit | | | | |
| |
| (2) | | Plan of Acquisition, Reorganization, Arrangement, Liquidation, or Succession |
| | | | |
| 2(a) | | 1-12833 Form 8-K (filed February 26, 2007) | | 2.1 | | — | | Agreement and Plan of Merger, dated February 25, 2007, by and among Energy Future Holdings Corp. (formerly known as TXU Corp.), Texas Energy Future Holdings Limited Partnership and Texas Energy Future Merger Sub Corp. |
| |
| (3(i)) | | Articles of Incorporation |
| | | | |
| 3(a) | | 1-12833 Form 8-K (filed October 11, 2007) | | 3.1 | | — | | Restated Certificate of Formation of Energy Future Holdings Corp. |
| |
| (3(ii)) | | By-laws |
| | | | |
| 3(b) | | 1-12833 Form 10-Q (Quarter ended March 31, 2008) (filed May 15, 2008) | | 3(a) | | — | | Amended and Restated Bylaws of Energy Future Holdings Corp. |
| |
| (4) | | Instruments Defining the Rights of Security Holders, Including Indentures** Energy Future Holdings Corp. |
| | | | |
| 4(a) | | 1-12833 Form 10-K (2007) (filed March 31, 2008) | | 4(c) | | — | | Indenture (For Unsecured Debt Securities Series P), dated November 1, 2004, between Energy Future Holdings Corp. and The Bank of New York Mellon, as trustee. |
| | | | |
| 4(b) | | 1-12833 Form 8-K (filed July 7, 2010) | | 99.1 | | — | | Supplemental Indenture, dated July 1, 2010, to Indenture (For Unsecured Debt Securities Series P), dated November 1, 2004. |
262
| | | | | | | | |
Exhibits | | Previously Filed* With File Number | | As
Exhibit | | | | |
| 4(c) | | 1-12833 Form 10-K (2004)(filed March 16, 2005) | | 4(q) | | — | | Officers’ Certificate, dated November 26, 2004, establishing the form and certain terms of Energy Future Holdings Corp.’s 5.55% Series P Senior Notes due 2014. |
| | | | |
| 4(d) | | | | | | — | | Indenture (For Unsecured Debt Securities Series Q), dated November 1, 2004, between Energy Future Holdings Corp. and The Bank of New York Mellon, as trustee. Energy Future Holdings Corp.’s Indentures for its Series R Senior Notes are not filed as it is substantially similar to this Indenture. |
| | | | |
| 4(e) | | 1-12833 Form 10-K (2004) (filed March 16, 2005) | | 4(r) | | — | | Officer’s Certificate, dated November 26, 2004, establishing the form and certain terms of Energy Future Holdings Corp.’s 6.50% Series Q Senior Notes due 2024. |
| | | | |
| 4(f) | | 1-12833 Form 10-K (2004) (filed March 16, 2005) | | 4(s) | | — | | Officer’s Certificate, dated November 26, 2004, establishing the form and certain terms of Energy Future Holdings Corp.’s 6.55% Series R Senior Notes due 2034. |
| | | | |
| 4(g) | | 1-12833 Form 8-K (filed October 31, 2007) | | 4.1 | | — | | Indenture, dated October 31, 2007, among Energy Future Holdings Corp., the guarantors named therein and The Bank of New York Mellon, as trustee, relating to Senior Notes due 2017 and Senior Toggle Notes due 2017. |
| | | | |
| 4(h) | | 1-12833 Form 10-K (2009) (filed February 19, 2010) | | 4(f) | | — | | Supplemental Indenture, dated July 8, 2008, to Indenture, dated October 31, 2007. |
| | | | |
| 4(i) | | 1-12833 Form 10-Q (Quarter ended June 30, 2009) (filed August 4, 2009) | | 4(a) | | — | | Second Supplemental Indenture, dated August 3, 2009, to Indenture, dated October 31, 2007. |
| | | | |
| 4(j) | | 1-12833 Form 8-K (filed July 30, 2010) | | 99.1 | | — | | Third Supplemental Indenture, dated July 29, 2010, to Indenture, dated October 31, 2007. |
| | | | |
| 4(k) | | 1-12833 Form 8-K (filed November 20, 2009) | | 4.1 | | — | | Indenture, dated November 16, 2009, among Energy Future Holdings Corp., the guarantors named therein and The Bank of New York Mellon Trust Company, N.A., as trustee, relating to 9.75% Senior Secured Notes due 2019. |
| | | | |
4(l) | | 333-171253 Form S-4 (filed January 24, 2011) | | 4(k) | | — | | Indenture, dated January 12, 2010, among Energy Future Holdings Corp., the guarantors named therein and The Bank of New York Mellon Trust Company, N.A., as trustee, relating to 10.000% Senior Secured Notes due 2020. |
263
| | | | | | | | |
Exhibits | | Previously Filed* With File Number | | As
Exhibit | | | | |
| 4(m) | | 333-165860 Form S-3 (filed April 1, 2010) | | 4(j) | | — | | First Supplemental Indenture, dated March 16, 2010, to Indenture, dated January 12, 2010. |
| | | | |
| 4(n) | | 1-12833 Form 10-Q (Quarter ended June 30, 2010) (filed August 2, 2010) | | 4(a) | | — | | Second Supplemental Indenture, dated April 13, 2010, to Indenture, dated January 12, 2010. |
| | | | |
| 4(o) | | 1-12833 Form 10-Q (Quarter ended June 30, 2010) (filed August 2, 2010) | | 4(b) | | — | | Third Supplemental Indenture, dated April 14, 2010, to Indenture, dated January 12, 2010. |
| | | | |
| 4(p) | | 1-12833 Form 10-Q (Quarter ended June 30, 2010) (filed August 2, 2010) | | 4(c) | | — | | Fourth Supplemental Indenture, dated May 21, 2010, to Indenture, dated January 12, 2010. |
| | | | |
| 4(q) | | 1-12833 Form 10-Q (Quarter ended June 30, 2010) (filed August 2, 2010) | | 4(d) | | — | | Fifth Supplemental Indenture, dated July 2, 2010, to Indenture, dated January 12, 2010. |
| | | | |
| 4(r) | | 1-12833 Form 10-Q (Quarter ended June 30, 2010) (filed August 2, 2010) | | 4(e) | | — | | Sixth Supplemental Indenture, dated July 6, 2010, to Indenture, dated January 12, 2010. |
| | | | |
| 4(s) | | 333-171253 Form S-4 (filed January 24, 2011) | | 4(r) | | — | | Seventh Supplemental Indenture, dated July 7, 2010, to Indenture, dated January 12, 2010. |
| | | | |
| 4(t) | | 1-12833 Form 8-K (filed January 19, 2010) | | 4.2 | | — | | Registration Rights Agreement, dated January 12, 2010, among Energy Future Holdings Corp., the guarantors named therein and the initial purchasers named therein, relating to 10.000% Senior Secured Notes due 2020. |
| | | | |
| 4(u) | | 333-165860 Form S-3 (filed April 1, 2010) | | 4(l) | | — | | Registration Rights Agreement, dated March 16, 2010, among Energy Future Holdings Corp., the guarantors named therein and the initial purchasers named therein, relating to 10.000% Senior Secured Notes due 2020. |
264
| | | | | | | | |
Exhibits | | Previously Filed* With File Number | | As
Exhibit | | | | |
| 4(v) | | 1-12833 Form 10-Q (Quarter ended June 30, 2010) (filed August 2, 2010) | | 4(h) | | — | | Registration Rights Agreement, dated April 12, 2010, among Energy Future Holdings Corp., the guarantors named therein and the initial purchasers named therein, relating to 10.000% Senior Secured Notes due 2020. |
| | | | |
| 4(w) | | 1-12833 Form 10-Q (Quarter ended June 30, 2010) (filed August 2, 2010) | | 4(i) | | — | | Registration Rights Agreement, dated April 13, 2010, among Energy Future Holdings Corp., the guarantors named therein and the initial purchasers named therein, relating to 10.000% Senior Secured Notes due 2020. |
| | | | |
| 4(x) | | 1-12833 Form 10-Q (Quarter ended June 30, 2010) (filed August 2, 2010) | | 4(j) | | — | | Registration Rights Agreement, dated May 20, 2010, among Energy Future Holdings Corp., the guarantors named therein and the initial purchasers named therein, relating to 10.000% Senior Secured Notes due 2020. |
| | | | |
| 4(y) | | 1-12833 Form 10-Q (Quarter ended June 30, 2010) (filed August 2, 2010) | | 4(k) | | — | | Registration Rights Agreement, dated July 2, 2010, among Energy Future Holdings Corp., the guarantors named therein and the initial purchasers named therein, relating to 10.000% Senior Secured Notes due 2020. |
| | | | |
| 4(z) | | 1-12833 Form 10-Q (Quarter ended June 30, 2010) (filed August 2, 2010) | | 4(l) | | — | | Registration Rights Agreement, dated July 6, 2010, among Energy Future Holdings Corp., the guarantors named therein and the initial purchasers named therein, relating to 10.000% Senior Secured Notes due 2020. |
| | | | |
| 4(aa) | | 1-12833 Form 10-Q (Quarter ended June 30, 2010) (filed August 2, 2010) | | 4(m) | | — | | Registration Rights Agreement, dated July 7, 2010, among Energy Future Holdings Corp., the guarantors named therein and the initial purchasers named therein, relating to 10.000% Senior Secured Notes due 2020. |
| |
| | Oncor Electric Delivery Company LLC |
| | | | |
| 4(bb) | | 333-100240 Form S-4(filed October 2, 2002) | | 4(a) | | — | | Indenture and Deed of Trust, dated as of May 1, 2002, between Oncor Electric Delivery Company LLC and The Bank of New York Mellon, as trustee. |
| | | | |
| 4(cc) | | 1-12833 Form 8-K (filed October 31, 2005) | | 10.1 | | — | | Supplemental Indenture No. 1, dated October 25, 2005, to Indenture and Deed of Trust, dated as of May 1, 2002, between Oncor Electric Delivery Company LLC and The Bank of New York Mellon. |
265
| | | | | | | | |
Exhibits | | Previously Filed* With File Number | | As
Exhibit | | | | |
| 4(dd) | | 333-100240 Form 10-Q (Quarter ended March 31, 2008) (filed May 15, 2008) | | 4(b) | | — | | Supplemental Indenture No. 2, dated October 25, 2005, to Indenture and Deed of Trust, dated as of May 1, 2002, between Oncor Electric Delivery Company LLC and The Bank of New York Mellon. |
| | | | |
| 4(ee) | | 333-100240 Form S-4 (filed October 2, 2002) | | 4(b) | | — | | Officer’s Certificate, dated May 6, 2002, establishing the form and certain terms of Oncor Electric Delivery Company LLC’s 6.375% Senior Notes due 2012 and 7.000% Senior Notes due 2032. |
| | | | |
| 4(ff) | | 333-100242 Form S-4 (filed October 2, 2002) | | 4(a) | | — | | Indenture (for Unsecured Debt Securities), dated August 1, 2002, between Oncor Electric Delivery Company LLC and The Bank of New York Mellon, as trustee. |
| | | | |
| 4(gg) | | 333-100240 Form 10-Q (Quarter ended March 31, 2008) (filed May 15, 2008) | | 4(c) | | — | | Supplemental Indenture No. 1, dated May 15, 2008, to Indenture and Deed of Trust, dated August 1, 2002, between Oncor Electric Delivery Company LLC and The Bank of New York. |
| | | | |
| 4(hh) | | 333-100242 Form S-4 (filed October 2, 2002) | | 4(b) | | — | | Officer’s Certificate, dated August 30, 2002, establishing the form and certain terms of Oncor Electric Delivery Company LLC’s 5% Debentures due 2007 and 7% Debentures due 2022. |
| | | | |
| 4(ii) | | 333-106894 Form S-4 (filed July 9, 2003) | | 4(c) | | — | | Officer’s Certificate, dated December 20, 2002, establishing the form and certain terms of Oncor Electric Delivery Company LLC’s 6.375% Senior Notes due 2015 and 7.250% Senior Notes due 2023. |
| | | | |
| 4(jj) | | 333-100240 Form 10-Q (Quarter ended March 31, 2008) (filed May 15, 2008) | | 4(a) | | — | | Deed of Trust, Security Agreement and Fixture Filing, dated May 15, 2008, by Oncor Electric Delivery Company LLC, as grantor, to and for the benefit of, The Bank of New York Mellon Trust, as collateral agent and trustee. |
| | | | |
| 4(kk) | | 333-100240 Form 10-K (2008) (filed March 2, 2009) | | 4(n) | | — | | First Amendment, dated March 2, 2009, to Deed of Trust, Security Agreement and Fixture Filing, dated May 15, 2008. |
| | | | |
| 4(ll) | | 333-100240 Form 8-K (filed September 3, 2010) | | 10.1 | | — | | Second Amendment, dated September 3, 2010, to Deed of Trust, Security Agreement and Fixture Filing, dated September 3, 2010. |
266
| | | | | | | | |
Exhibits | | Previously Filed* With File Number | | As
Exhibit | | | | |
| 4(mm) | | 333-100242 Form 8-K (filed September 9, 2008) | | 4.1 | | — | | Officer’s Certificate, dated September 8, 2008, establishing the form and certain terms of Oncor Electric Delivery Company LLC’s 5.95% Senior Secured Notes due 2013, 6.80% Senior Secured Notes due 2018 and 7.50% Senior Secured Notes due 2038. |
| | | | |
| 4(nn) | | 333-100240 Form 8-K (filed September 16, 2010) | | 4.1 | | — | | Officer’s Certificate, dated September 13, 2010, establishing the form and certain terms of Oncor Electric Delivery Company LLC’s 5.25% Senior Secured Notes due 2040. |
| | | | |
| 4(oo) | | 333-100240 Form 8-K (filed September 16, 2010) | | 4.2 | | — | | Registration Rights Agreement, dated September 13, 2010, among Oncor Electric Delivery Company LLC, Barclays Capital Inc., Citigroup Global Markets Inc., Banc of America Securities LLC and Credit Suisse Securities (USA) LLC, as representatives of the initial purchasers of Oncor Electric Delivery Company LLC’s 5.25% Senior Secured Notes due 2040, relating to 5.25% Senior Secured Notes due 2040. |
| | | | |
| 4(pp) | | 333-100240 Form 8-K (filed October 12, 2010) | | 4.1 | | — | | Officer’s Certificate, dated October 8, 2010, establishing the form and certain terms of Oncor Electric Delivery Company LLC’s 5.00% Senior Secured Notes due 2017 and 5.75% Senior Secured Notes due 2020. |
| | | | |
| 4(qq) | | 333-100240 Form 8-K (filed October 12, 2010) | | 4.2 | | — | | Registration Rights Agreement, dated October 8, 2010, among Oncor Electric Delivery Company LLC and the dealer managers named therein, relating to 5.00% Senior Secured Notes due 2017 and 5.75% Senior Secured Notes due 2020. |
| |
| | Texas Competitive Electric Holdings Company LLC |
| | | | |
| 4(rr) | | 333-108876 Form 8-K(filed October 31, 2007) | | 4.2 | | — | | Indenture, dated October 31, 2007, among Texas Competitive Electric Holdings Company LLC and TCEH Finance, Inc., the guarantors and The Bank of New York Mellon Trust Company, N.A., as trustee, relating to 10.25% Senior Notes due 2015. |
| | | | |
| 4(ss) | | 1-12833 Form 8-K(filed December 12, 2007) | | 4.1 | | — | | First Supplemental Indenture, dated December 6, 2007, to Indenture, dated October 31, 2007, relating to Texas Competitive Electric Holdings Company LLC’s and TCEH Finance, Inc.’s 10.25% Senior Notes due 2015, Series B, and 10.50%/11.25% Senior Toggle Notes due 2016. |
| | | | |
| 4(tt) | | 1-12833 Form 10-Q(Quarter ended June 30, 2009) (filed August 4, 2009) | | 4(b) | | — | | Second Supplemental Indenture, dated August 3, 2009, to Indenture, dated October 31, 2007, relating to Texas Competitive Electric Holdings Company LLC’s and TCEH Finance, Inc.’s 10.25% Senior Notes due 2015, 10.25% Senior Notes due 2015, Series B, and 10.50%/11.25% Senior Toggle Notes due 2016. |
267
| | | | | | | | |
Exhibits | | Previously Filed* With File Number | | As
Exhibit | | | | |
| 4(uu) | | 1-12833 Form 8-K(filed October 8, 2010) | | 4.1 | | — | | Indenture, dated October 6, 2010, among Texas Competitive Electric Holdings Company LLC and TCEH Finance, Inc., the guarantors and The Bank of New York Mellon Trust Company, N.A., as trustee, relating to 15% Senior Secured Second Lien Notes due 2021. |
| | | | |
| 4(vv) | | 1-12833 Form 8-K(filed October 26, 2010) | | 4.1 | | — | | First Supplemental Indenture, dated October 20, 2010, to the Indenture, dated October 6, 2010. |
| | | | |
| 4(ww) | | 1-12833 Form 8-K(filed November 17, 2010) | | 4.1 | | — | | Second Supplemental Indenture, dated November 15, 2010, to the Indenture, dated October 6, 2010. |
| | | | |
| 4(xx) | | 1-12833 Form 8-K(filed October 8, 2010) | | 4.3 | | — | | Second Lien Pledge Agreement, dated October 6, 2010, among Texas Competitive Electric Holdings Company LLC, TCEH Finance, Inc., the subsidiary guarantors named therein and The Bank of New York Mellon Trust Company, N.A., as collateral agent for the benefit of the second lien secured parties. |
| | | | |
| 4(yy) | | 1-12833 Form 8-K(filed October 8, 2010) | | 4.4 | | — | | Second Lien Security Agreement, dated October 6, 2010, among Texas Competitive Electric Holdings Company LLC, TCEH Finance, Inc., the subsidiary guarantors named therein and The Bank Of New York Mellon Trust Company, N.A., as collateral agent and as the initial second priority representative for the benefit of the second lien secured parties. |
| | | | |
| 4(zz) | | 1-12833 Form 8-K(filed October 8, 2010) | | 4.5 | | — | | Second Lien Intercreditor Agreement, dated October 6, 2010, among Texas Competitive Electric Holdings Company LLC, TCEH Finance, Inc., the subsidiary guarantors named therein, Citibank, N.A., as collateral agent for the senior collateral agent and the administrative agent, The Bank of New York Mellon Trust Company, N.A., as the initial second priority representative. |
| | | | |
| 4(aaa) | | | | | | — | | Form of Second Deed of Trust, Assignment of Leases and Rents, Security Agreement and Fixture Filing to Fidelity National Title Insurance Company, as trustee, for the benefit of The Bank of New York Mellon Trust Company, N.A., as Collateral Agent and Initial Second Priority Representative for the benefit of the Second Lien Secured Parties, as Beneficiary. |
| | | | |
| 4(bbb) | | 1-12833 Form 8-K(filed October 8, 2010) | | 4.2 | | — | | Registration Rights Agreement, dated October 6, 2010, among Texas Competitive Electric Holdings Company LLC, TCEH Finance, Inc., the holders named therein and the guarantors named therein, relating to 15% Senior Secured Second Lien Notes due 2021. |
| | | | |
| 4(ccc) | | 1-12833 Form 8-K(filed October 26, 2010) | | 4.2 | | — | | Registration Rights Agreement, dated October 20, 2010, among Texas Competitive Electric Holdings Company LLC, TCEH Finance, Inc., the initial purchasers and the guarantors named therein, relating to 15% Senior Secured Second Lien Notes due 2021, Series B. |
268
| | | | | | | | |
Exhibits | | Previously Filed* With File Number | | As
Exhibit | | | | |
| | Energy Future Intermediate Holding Company LLC |
| | | | |
| 4(ddd) | | 1-12833 Form 8-K(filed November 20, 2009) | | 4.2 | | — | | Indenture, dated November 16, 2009, among Energy Future Intermediate Holding Company LLC, EFIH Finance Inc. and The Bank of New York Mellon Trust Company, N.A., as trustee. |
| | | | |
| 4(eee) | | 1-12833 Form 8-K(filed August 18, 2010) | | 4.1 | | — | | Indenture, dated August 17, 2010, among Energy Future Intermediate Holding Company LLC, EFIH Finance Inc. and The Bank of New York Mellon Trust Company, N.A., as trustee, relating to 10.000% Senior Secured Notes due 2020. |
| |
(10) | | Material Contracts |
| |
| | Management Contracts; Compensatory Plans, Contracts and Arrangements |
| | | | |
| 10(a) | | 1-12833 Form 8-K (filed May 23, 2005) | | 10.6 | | — | | Energy Future Holdings Corp. Executive Change in Control Policy effective May 20, 2005. |
| | | | |
| 10(b) | | 333-153529 Amendment No. 2 to Form S-4 (filed December 23, 2008) | | 10(p) | | — | | Amendment to the Energy Future Holdings Corp. Executive Change in Control Policy, dated December 23, 2008. |
| | | | |
| 10(c) | | | | | | — | | Amendment to the Energy Future Holdings Corp. Executive Change in Control Policy, dated December 20, 2010. |
| | | | |
| 10(d) | | 1-12833 Form 8-K (filed May 23, 2005) | | 10.7 | | — | | Energy Future Holdings Corp. 2005 Executive Severance Plan and Summary Plan Description. |
| | | | |
| 10(e) | | 333-153529 Amendment No. 2 to Form S-4 (filed December 23, 2008) | | 10(n) | | — | | Amendment to the Energy Future Holdings Corp. 2005 Executive Severance Plan and Summary Plan Description, dated December 23, 2008. |
| | | | |
| 10(f) | | | | | | — | | Amendment to the Energy Future Holdings Corp. 2005 Executive Severance Plan and Summary Plan Description, dated December 10, 2010. |
| | | | |
| 10(g) | | 1-12833 Form 10-K (2007) (filed March 31, 2008) | | 10(a) | | — | | 2007 Stock Incentive Plan for Key Employees of Energy Future Holdings Corp. and its affiliates. |
| | | | |
| 10(h) | | 1-12833 Form 10-K (2009) (filed February 19, 2010) | | 10(ii) | | — | | Amendment No. 1 to the 2007 Stock Incentive Plan for Key Employees of Energy Future Holdings Corp. and its Affiliates, dated July 14, 2009, effective as of December 23, 2008. |
| | | | |
| 10(i) | | | | | | — | | EFH Executive Annual Incentive Plan, effective as of January 1, 2010. |
269
| | | | | | | | |
Exhibits | | Previously Filed* With File Number | | As
Exhibit | | | | |
| 10(j) | | 1-12833 Form 10-K (2008) (filed March 3, 2009) | | 10(q) | | — | | EFH Second Supplemental Retirement Plan, effective as of October 10, 2007. |
| | | | |
| 10(k) | | 1-12833 Form 10-K (2009) (filed February 19, 2010) | | 10(ee) | | — | | Amendment to EFH Second Supplemental Retirement Plan, dated July 31, 2009. |
| | | | |
| 10(l) | | | | | | — | | Second Amendment to EFH Second Supplemental Retirement Plan, dated April 9, 2010 with effect as of January 1, 2010. |
| | | | |
| 10(m) | | | | | | — | | Third Amendment to EFH Second Supplemental Retirement Plan, dated April 21, 2010 with effect as of January 1, 2010. |
| | | | |
| 10(n) | | 1-12833 Form 10-K (2009) (filed February 19, 2010) | | 10(dd) | | — | | EFH Salary Deferral Program, effective January 1, 2010. |
| | | | |
| 10(o) | | | | | | — | | Amendment to EFH Salary Deferral Program, effective January 20, 2011. |
| | | | |
| 10(p) | | 1-12833 Form 10-K (2007) (filed March 31, 2008) | | 10(b) | | — | | Registration Rights Agreement, dated October 10, 2007, among Texas Energy Future Holdings Limited Partnership, Energy Future Holdings Corp. and the stockholders party thereto. |
| | | | |
| 10(q) | | 1-12833 Form 10-Q (Quarter ended March 31, 2008) (filed May 15, 2008) | | 10(a) | | — | | Form of Stockholder’s Agreement (for Directors) among Energy Future Holdings Corp., Texas Energy Future Holdings Limited Partnership and the stockholder party thereto. |
| | | | |
| 10(r) | | 1-12833 Form 10-Q (Quarter ended March 31, 2008) (filed May 15, 2008) | | 10(b) | | — | | Form of Sale Participation Agreement (for Directors) between Texas Energy Future Holdings Limited Partnership and the stockholder party hereto. |
| | | | |
| 10(s) | | 1-12833 Form 10-Q (Quarter ended June 30, 2008) (filed August 14, 2008) | | 10(f) | | — | | Form of Management Stockholder’s Agreement (For Executive Officers) among Energy Future Holdings Corp., Texas Energy Future Holdings Limited Partnership and the stockholder party thereto. |
270
| | | | | | | | |
Exhibits | | Previously Filed* With File Number | | As
Exhibit | | | | |
| 10(t) | | 1-12833 Form 10-Q (Quarter ended June 30, 2008) (filed August 14, 2008) | | 10(g) | | — | | Form of Sale Participation Agreement (For Executive Officers) between Texas Energy Future Holdings Limited Partnership and the stockholder party thereto. |
| | | | |
| 10(u) | | 1-12833 Form 10-K (2009) (filed February 19, 2010) | | 10(m) | | — | | Form of Amended and Restated Non-Qualified Stock Option Agreement (For Executive Officers) between Energy Future Holdings Corp. and the optionee thereto. |
| | | | |
| 10(v) | | 1-12833 Form 10-K (2007) (filed March 31, 2008) | | 10(f) | | — | | Energy Future Holdings Corp. Non-Employee Director Compensation Arrangements. |
| | | | |
| 10(w) | | 1-12833 Form 10-K (2009) (filed February 19, 2010) | | 10(nn) | | — | | Consulting Agreement, dated February 18, 2010, between Energy Future Holdings Corp. and Donald L. Evans. |
| | | | |
| 10(x) | | 1-12833 Form 10-K (2007) (filed March 31, 2008) | | 10(p) | | — | | Employment Agreement, dated January 6, 2008, between Energy Future Holdings Corp. and John Young. |
| | | | |
| 10(y) | | 1-12833 Form 10-K (2009) (filed February 19, 2010) | | 10(jj) | | — | | Employment Arrangement with John Young. |
| | | | |
| 10(z) | | 1-12833 Form 10-K (2007) (filed March 31, 2008) | | 10(r) | | — | | Management Stockholder’s Agreement, dated February 1, 2008, among Energy Future Holdings Corp., Texas Energy Future Holdings Limited Partnership and John Young. |
| | | | |
| 10(aa) | | 1-12833 Form 10-K (2007) (filed March 31, 2008) | | 10(s) | | — | | Sale Participation Agreement, dated February 1, 2008, between Texas Energy Future Holdings Limited Partnership and John F. Young. |
| | | | |
| 10(bb) | | 1-12833 Form 10-K (2009) (filed February 19, 2010) | | 10(hh) | | — | | Restricted Stock Unit Award Agreement, effective as of January 6, 2008, between Energy Future Holdings Corp. and John Young. |
| | | | |
| 10(cc) | | 1-12833 Form 10-K (2008) (filed March 3, 2009) | | 10(y) | | — | | Amended and Restated Employment Agreement, dated July 1, 2008, between Energy Future Holdings Corp. and Paul M. Keglevic. |
271
| | | | | | | | |
Exhibits | | Previously Filed* With File Number | | As
Exhibit | | | | |
| 10(dd) | | | | | | — | | Employment Arrangement with Paul Keglevic. |
| | | | |
| 10(ee) | | | | | | — | | Deferred Share Agreement, dated July 1, 2008, between Energy Future Holdings Corp. and Paul Keglevic. |
| | | | |
| 10(ff) | | 1-12833 Form 10-Q (Quarter ended June 30, 2010) (filed August 2, 2010) | | 10(d) | | — | | Amended and Restated Employment Agreement, effective January 1, 2010, between Luminant Holding Company LLC, Energy Future Holdings Corp. and David A. Campbell. |
| | | | |
| 10(gg) | | 1-12833 Form 10-K (2007) (filed March 31, 2008) | | 10(y) | | — | | Additional Payment Agreement, dated October 10, 2007, among Energy Future Holdings Corp., Texas Energy Future Holdings Limited Partnership, Texas Competitive Electric Holdings Company LLC and David Campbell. |
| | | | |
| 10(hh) | | | | | | — | | Deferred Share Agreement, dated May 20, 2008, between Energy Future Holdings Corp. and David Campbell. |
| | | | |
| 10(ii) | | 1-12833 Form 10-Q (Quarter ended June 30, 2010) (filed August 2, 2010) | | 10(c) | | — | | Amended and Restated Employment Agreement, effective January 1, 2010, between TXU Retail Company LLC, Energy Future Holdings Corp. and James A. Burke. |
| | | | |
| 10(jj) | | 1-12833 Form 10-K (2007) (filed March 31, 2008) | | 10(ff) | | — | | Additional Payment Agreement, dated October 10, 2007, among Energy Future Holdings Corp., Texas Energy Future Holdings Limited Partnership, Texas Competitive Electric Holdings Company LLC and James Burke. |
| | | | |
| 10(kk) | | 1-12833 Form 10-K (2007) (filed March 31, 2008) | | 10(nn) | | — | | Deferred Share Agreement, dated October 9, 2007, between Texas Energy Future Holdings Limited Partnership and James Burke. |
| | | | |
| 10(ll) | | 1-12833 Form 10-Q (Quarter ended June 30, 2010) (filed August 2, 2010) | | 10(a) | | — | | Amended and Restated Employment Agreement, effective January 1, 2010, between EFH Corporate Services Company, Energy Future Holdings Corp. and Robert C. Walters. |
| | | | |
| 10(mm) | | 1-12833 Form 10-Q (Quarter ended June 30, 2010) (filed August 2, 2010) | | 10(b) | | — | | Amended and Restated Employment Agreement, effective January 1, 2010, between Luminant Holding Company LLC, Energy Future Holdings Corp. and Mark Allen McFarland. |
272
| | | | | | | | |
Exhibits | | Previously Filed* With File Number | | As
Exhibit | | | | |
| 10(nn) | | 1-12833 Form 10-Q (Quarter ended June 30, 2010) (filed August 2, 2010) | | 10(e) | | — | | Employment Agreement, effective January 1, 2010, between EFH Corporate Services Company, Energy Future Holdings Corp. and Richard J. Landy. |
| | | | |
| 10(oo) | | 1-12833 Form 10-K (2009) (filed February 19, 2010) | | 10(gg) | | — | | Energy Future Holdings Corp. Key Employee Non-Qualified Stock Option Agreement, dated January 26, 2010, between Energy Future Holdings Corp. and Richard Landy. |
| | | | |
| 10(pp) | | 1-12833 Form 10-Q (Quarter ended June 30, 2010) (filed August 2, 2010) | | 10(f) | | — | | Employment Agreement, effective January 1, 2010, between EFH Corporate Services Company, Energy Future Holdings Corp. and Joel D. Kaplan. |
| | | | |
| 10(qq) | | 1-12833 Form 10-K (2009) (filed February 19, 2010) | | 10(ff) | | — | | Energy Future Holdings Corp. Key Employee Non-Qualified Stock Option Agreement, dated December 17, 2009, between Energy Future Holdings Corp. and Joel Kaplan. |
| |
| | Credit Agreements and Related Agreements |
| | | | |
| 10(rr) | | 333-100240 Form 10-Q (Quarter ended September 30, 2007) (filed November 14, 2007) | | 10(a) | | — | | $2,000,000,000 Revolving Credit Agreement, dated October 10, 2007, among Oncor Electric Delivery Company LLC, as the borrower; the several lenders from time to time parties thereto; JPMorgan Chase Bank, N.A., as administrative agent, fronting bank and swingline lender, Citibank, N.A., as syndication agent and fronting bank; Credit Suisse, Cayman Islands Branch, Goldman Sachs Credit Partners L.P., Lehman Commercial Paper Inc., Morgan Stanley Senior Funding, Inc., as co-documentation agents; J.P. Morgan Securities Inc., Citigroup Global Markets Inc., Credit Suisse Securities (USA) LLC, Goldman Sachs Credit Partners L.P., Lehman Brothers Inc. and Morgan Stanley Senior Funding, Inc., as joint lead arrangers and bookrunners. |
273
| | | | | | | | |
Exhibits | | Previously Filed* With File Number | | As
Exhibit | | | | |
| 10(ss) | | 333-171253 Post-Effective Amendment #1 to Form S-4 (filed February 7, 2011) | | 10(rr) | | — | | $24,500,000,000 Credit Agreement, dated October 10, 2007, among Energy Future Competitive Holdings Company; Texas Competitive Electric Holdings Company LLC, as the borrower; the several lenders from time to time parties thereto; Citibank, N.A., as administrative agent, collateral agent, swingline lender, revolving letter of credit issuer and deposit letter of credit issuer; Goldman Sachs Credit Partners L.P., as posting agent, posting syndication agent and posting documentation agent; JPMorgan Chase Bank, N.A., as syndication agent and revolving letter of credit issuer; Citigroup Global Markets Inc., J.P. Morgan Securities Inc., Goldman Sachs Credit Partners L.P., Lehman Brothers Inc., Morgan Stanley Senior Funding, Inc. and Credit Suisse Securities (USA) LLC, as joint lead arrangers and bookrunners; Goldman Sachs Credit Partners L.P., as posting lead arranger and bookrunner; Credit Suisse, Goldman Sachs Credit Partners L.P., Lehman Commercial Paper Inc., Morgan Stanley Senior Funding, Inc., as co-documentation agents; and J. Aron & Company, as posting calculation agent. |
| | | | |
| 10(tt) | | 1-12833 Form 8-K (filed August 10, 2009) | | 10.1 | | — | | Amendment No. 1, dated August 7, 2009, to the $24,500,000,000 Credit Agreement. |
| | | | |
| 10(uu) | | 1-12833 Form 10-K (2007) (filed March 31, 2008) | | 10(ss) | | — | | Guarantee, dated October 10, 2007, by the guarantors party thereto in favor of Citibank, N.A., as collateral agent for the benefit of the secured parties under the $24,500,000,000 Credit Agreement, dated October 10, 2007. |
| | | | |
| 10(vv) | | 1-12833 Form 10-K (2007) (filed March 31, 2008) | | 10(vv) | | — | | Form of Deed of Trust, Assignment of Leases and Rents, Security Agreement and Fixture Filing to Fidelity National Title Insurance Company, as trustee, for the benefit of Citibank, N.A., as beneficiary. |
| | | | |
| 10(ww) | | 1-12833 Form 8-K (filed August 10, 2009) | | 10.2 | | — | | Amended and Restated Collateral Agency and Intercreditor Agreement, dated October 10, 2007, as amended and restated as of August 7, 2009, among Energy Future Competitive Holdings Company; Texas Competitive Electric Holdings Company LLC; the subsidiary guarantors party thereto; Citibank, N.A., as administrative agent and collateral agent; Credit Suisse Energy LLC, J. Aron & Company, Morgan Stanley Capital Group Inc., Citigroup Energy Inc., each as a secured hedge counterparty; and any other person that becomes a secured party pursuant thereto. |
| | | | |
| 10(xx) | | 1-12833 Form 8-K (filed August 10, 2009) | | 10.3 | | — | | Amended and Restated Security Agreement, dated October 10, 2007, as amended and restated as of August 7, 2009, among Texas Competitive Electric Holdings Company LLC, the subsidiary grantors party thereto, and Citibank, N.A., as collateral agent for the benefit of the first lien secured parties, including the secured parties under the $24,500,000,000 Credit Agreement, dated October 10, 2007. |
274
| | | | | | | | |
Exhibits | | Previously Filed* With File Number | | As
Exhibit | | | | |
10(yy) | | 1-12833 Form 8-K (filed August 10, 2009) | | 10.4 | | — | | Amended and Restated Pledge Agreement, dated October 10, 2007, as amended and restated as of August 7, 2009, among Energy Future Competitive Holdings Company, Texas Competitive Electric Holdings Company LLC, the subsidiary pledgors party thereto, and Citibank, N.A., as collateral agent for the benefit first lien secured parties, including the secured parties under the $24,500,000,000 Credit Agreement, dated October 10, 2007. |
| | | | |
10(zz) | | 1-12833 Form 8-K (filed November 20, 2009) | | 4.3 | | — | | Pledge Agreement, dated November 16, 2009, made by Energy Future Intermediate Holding Company LLC and the additional pledgers to The Bank of New York Mellon Trust Company, N.A., as collateral trustee for the holders of parity lien obligations. |
| | | | |
10(aaa) | | 1-12833 Form 8-K (filed November 20, 2009) | | 4.4 | | — | | Collateral Trust Agreement, dated November 16, 2009, among Energy Future Intermediate Holding Company LLC, The Bank of New York Mellon Trust Company, N.A., as first lien trustee and as collateral trustee, and the other secured debt representatives party thereto. |
| | | |
| | Other Material Contracts | | | | |
| | | | |
10(bbb) | | 1-12833 Form 10-K (2003) (filed March 15, 2004) | | 10(qq) | | — | | Lease Agreement, dated February 14, 2002, between State Street Bank and Trust Company of Connecticut, National Association, a owner trustee of ZSF/Dallas Tower Trust, a Delaware grantor trust, as lessor and EFH Properties Company, as Lessee (Energy Plaza Property). |
| | | | |
10(ccc) | | 1-12833 Form 10-Q (Quarter ended June 30, 2007) (filed August 9, 2007) | | 10.1 | | — | | First Amendment, dated June 1, 2007, to Lease Agreement, dated February 14, 2002. |
| | | | |
10(ddd) | | 333-100240 Form 10-K (2004) (filed March 23, 2005) | | 10(i) | | — | | Agreement, dated March 10, 2005, between Oncor Electric Delivery Company LLC and TXU Energy Company LLC, allocating to Oncor Electric Delivery Company LLC the pension and post-retirement benefit costs for all Oncor Electric Delivery Company LLC employees who had retired or had terminated employment as vested employees prior to January 1, 2002. |
| | | | |
10(eee) | | 1-12833 Form 10-K (2006) (filed March 2, 2007) | | 10(iii) | | — | | Amended and Restated Transaction Confirmation by Generation Development Company LLC, dated February 2007 (subsequently assigned to Texas Competitive Electric Holdings Company LLC on October 10, 2007) (confidential treatment has been requested for portions of this exhibit). |
| | | | |
10(fff) | | 1-12833 Form 10-K (2007) (filed March 31, 2008) | | 10(eee) | | — | | Stipulation as approved by the PUCT in Docket No. 34077. |
275
| | | | | | | | |
Exhibits | | Previously Filed* With File Number | | As Exhibit | | | | |
10(ggg) | | 1-12833 Form 10-K (2007) (filed March 31, 2008) | | 10(fff) | | — | | Amendment to Stipulation Regarding Section 1, Paragraph 35 and Exhibit B in Docket No. 34077. |
| | | | |
10(hhh) | | 333-100240 Form 10-K (2010) (filed February 18, 2011) | | 10(ae) | | — | | PUCT Order on Rehearing in Docket No. 34077. |
| | | | |
10(iii) | | 1-12833 Form 10-K (2007) (filed March 31, 2008) | | 10(sss) | | — | | ISDA Master Agreement, dated October 25, 2007, between Texas Competitive Electric Holdings Company LLC and Goldman Sachs Capital Markets, L.P. |
| | | | |
10(jjj) | | 1-12833 Form 10-K (2007) (filed March 31, 2008) | | 10(ttt) | | — | | Schedule to the ISDA Master Agreement, dated October 25, 2007, between Texas Competitive Electric Holdings Company LLC and Goldman Sachs Capital Markets, L.P. |
| | | | |
10(kkk) | | 1-12833 Form 10-K (2007) (filed March 31, 2008) | | 10(uuu) | | — | | Form of Confirmation between Texas Competitive Electric Holdings Company LLC and Goldman Sachs Capital Markets, L.P. |
| | | | |
10(lll) | | 1-12833 Form 10-K (2007) (filed March 31, 2008) | | 10(vvv) | | — | | ISDA Master Agreement, dated October 29, 2007, between Texas Competitive Electric Holdings Company LLC and Credit Suisse International. |
| | | | |
10(mmm) | | 1-12833 Form 10-K (2007) (filed March 31, 2008) | | 10(www) | | — | | Schedule to the ISDA Master Agreement, dated October 29, 2007, between Texas Competitive Electric Holdings Company LLC and Credit Suisse International. |
| | | | |
10(nnn) | | 1-12833 Form 10-K (2007) (filed March 31, 2008) | | 10(xxx) | | — | | Form of Confirmation between Texas Competitive Electric Holdings Company LLC and Credit Suisse International. |
| | | | |
10(ooo) | | 1-12833 Form 10-K (2007) (filed March 31, 2008) | | 10(yyy) | | — | | Management Agreement, dated October 10, 2007, among Energy Future Holdings Corp., Texas Energy Future Holdings Limited Partnership, Kohlberg Kravis Roberts & Co. L.P., TPG Capital, L.P., Goldman, Sachs & Co. and Lehman Brothers Inc. |
| | | | |
10(ppp) | | 1-12833 Form 10-K (2007) (filed March 31, 2008) | | 10(cccc) | | — | | Indemnification Agreement, dated October 10, 2007, among Texas Energy Future Holdings Limited Partnership, Energy Future Holdings Corp., Kohlberg Kravis Roberts & Co., L.P., TPG Capital, L.P. and Goldman, Sachs & Co. |
| | | | |
10(qqq) | | 333-100240 Form 8-K (filed August 13, 2008) | | 10.1 | | — | | Contribution and Subscription Agreement, dated August 12, 2008, between Oncor Electric Delivery Company LLC and Texas Transmission Investment LLC. |
276
| | | | | | | | |
Exhibits | | Previously Filed* With File Number | | As Exhibit | | | | |
| 10(rrr) | | 1-12833 Form 10-Q (Quarter ended September 30, 2008) (filed November 6, 2008) | | 10(g) | | — | | Second Amended and Restated Limited Liability Company Agreement of Oncor Electric Delivery Holdings Company LLC, dated November 5, 2008. |
| | | | |
| 10(sss) | | 333-100240 Form 10-K (2008) (filed March 3, 2009) | | 3(c) | | — | | Amendment No. 1, dated February 18, 2009, to Second Amended and Restated Limited Liability Company Agreement of Oncor Electric Delivery LLC. |
| | | | |
| 10(ttt) | | 333-100240 Form 10-Q (Quarter ended September 30, 2008) (filed November 6, 2008) | | 4(c) | | — | | Investor Rights Agreement, dated November 5, 2008, among Oncor Electric Delivery Company LLC, Oncor Electric Delivery Holdings Company LLC, Texas Transmission Investment LLC and Energy Future Holdings Corp. |
| | | | |
| 10(uuu) | | 333-100240 Form 10-Q (Quarter ended September 30, 2008) (filed November 6, 2008) | | 4(d) | | — | | Registration Rights Agreement, dated November 5, 2008, among Oncor Electric Delivery Company LLC, Oncor Electric Delivery Holdings Company LLC, Texas Transmission Investment LLC and Energy Future Holdings Corp. |
| | | | |
| 10(vvv) | | 333-100240 Form 10-Q (Quarter ended September 30, 2008) (filed November 6, 2008) | | 10(b) | | — | | Amended and Restated Tax Sharing Agreement, dated November 5, 2008, among Oncor Electric Delivery Company LLC, Oncor Electric Delivery Holdings Company LLC, Oncor Management Investment LLC, Texas Transmission Investment LLC, Energy Future Intermediate Holding Company LLC and Energy Future Holdings Corp. |
| |
| (12) | | Statement Regarding Computation of Ratios |
| | | | |
| 12(a) | | | | | | — | | Computation of Ratio of Earnings to Fixed Charges. |
| | |
| (21) | | Subsidiaries of the Registrant | | |
| | | | |
| 21(a) | | | | | | — | | Subsidiaries of Energy Future Holdings Corp. |
| | |
| (23) | | Consent of Experts | | |
| | | | |
| 23(a) | | | | | | — | | Consent of Deloitte & Touche LLP, an independent registered public accounting firm, relating to the consolidated financial statements of Energy Future Holdings Corp. |
| | | | |
| 23(b) | | | | | | — | | Consent of Deloitte & Touche LLP, an independent registered public accounting firm, relating to the consolidated financial statements of Oncor Electric Delivery Holdings Company LLC |
277
| | | | | | | | |
Exhibits | | Previously Filed* With File Number | | As Exhibit | | | | |
| (31) | | Rule 13a - 14(a)/15d - 14(a) Certifications |
| | | | |
| 31(a) | | | | | | — | | Certification of John Young, principal executive officer of Energy Future Holdings Corp., pursuant to Section 302 of the Sarbanes-Oxley Act of 2002. |
| | | | |
| 31(b) | | | | | | — | | Certification of Paul M. Keglevic, principal financial officer of Energy Future Holdings Corp., pursuant to Section 302 of the Sarbanes-Oxley Act of 2002. |
| |
| 32 | | Section 1350 Certifications |
| | | | |
| 32(a) | | | | | | — | | Certification of John Young, principal executive officer of Energy Future Holdings Corp., pursuant to 18 U.S.C. Section 1350, as adopted pursuant to Section 906 of the Sarbanes-Oxley Act of 2002. |
| | | | |
| 32(b) | | | | | | — | | Certification of Paul M. Keglevic, principal financial officer of Energy Future Holdings Corp., pursuant to 18 U.S.C. Section 1350, as adopted pursuant to Section 906 of the Sarbanes-Oxley Act of 2002. |
| |
| (99) | | Additional Exhibits |
| | | | |
| 99(a) | | 33-55408 Post-Effective Amendment No. 1 to Form S-3 (filed July, 1993) | | 99(b) | | — | | Amended Agreement dated January 30, 1990, between Energy Future Competitive Holdings Company and Tex-La Electric Cooperative of Texas, Inc. |
| | | | |
| 99(b) | | | | | | — | | Energy Future Holdings Corp. Consolidated Adjusted EBITDA reconciliation for the years ended December 31, 2010 and 2009. |
| | | | |
| 99(c) | | | | | | — | | Texas Competitive Electric Holdings Company LLC Consolidated Adjusted EBITDA reconciliation for the years ended December 31, 2010 and 2009. |
| | | | |
| 99(d) | | | | | | — | | Energy Future Intermediate Holding Company LLC Consolidated Adjusted EBITDA reconciliation for the years ended December 31, 2010 and 2009. |
| | | | |
| 99(e) | | | | | | — | | Oncor Electric Delivery Holdings Company LLC financial statements presented pursuant to Rules 3–09 and 3–16 of Regulation S–X. |
| * | Incorporated herein by reference |
| ** | Certain instruments defining the rights of holders of long-term debt of the Company’s subsidiaries included in the financial statements filed herewith have been omitted because the total amount of securities authorized thereunder does not exceed 10 percent of the total assets of the Company and its subsidiaries on a consolidated basis. The Company hereby agrees, upon request of the SEC, to furnish a copy of any such omitted instrument. |
278
SIGNATURES
Pursuant to the requirements of Section 13 or 15(d) of the Securities Exchange Act of 1934, Energy Future Holdings Corp. has duly caused this report to be signed on its behalf by the undersigned, thereunto duly authorized.
| | | | |
| | ENERGY FUTURE HOLDINGS CORP. |
| | |
| Date: February 17, 2011 | | By | | /s/ JOHN F. YOUNG |
| | | | (John F. Young, President and Chief Executive Officer) |
Pursuant to the requirements of the Securities Exchange Act of 1934, this report has been signed below by the following persons on behalf of Energy Future Holdings Corp. and in the capacities and on the date indicated.
| | | | |
Signature | | Title | | Date |
| | |
/s/ JOHN F. YOUNG | | Principal Executive | | February 17, 2011 |
| (John F. Young, President and Chief Executive Officer) | | Officer and Director | | |
| | |
/s/ PAUL M. KEGLEVIC | | Principal Financial Officer | | February 17, 2011 |
| (Paul M. Keglevic, Executive Vice President and Chief Financial Officer) | | | | |
| | |
/s/ STANLEY J. SZLAUDERBACH | | Principal Accounting Officer | | February 17, 2011 |
| (Stanley J. Szlauderbach, Senior Vice President and Controller) | | | | |
| | |
/s/ DONALD L. EVANS | | Director | | February 17, 2011 |
| (Donald L. Evans, Chairman of the Board) | | | | |
| | |
/s/ ARCILIA C. ACOSTA | | Director | | February 17, 2011 |
| (Arcilia C. Acosta) | | | | |
| | |
/s/ DAVID BONDERMAN | | Director | | February 17, 2011 |
| (David Bonderman) | | | | |
| | |
/s/ THOMAS D. FERGUSON | | Director | | February 17, 2011 |
| (Thomas D. Ferguson) | | | | |
| | |
/s/ FREDERICK M. GOLTZ | | Director | | February 17, 2011 |
| (Frederick M. Goltz) | | | | |
| | |
/s/ JAMES R. HUFFINES | | Director | | February 17, 2011 |
| (James R. Huffines) | | | | |
| | |
/s/ SCOTT LEBOVITZ | | Director | | February 17, 2011 |
| (Scott Lebovitz) | | | | |
| | |
/s/ JEFFREY LIAW | | Director | | February 17, 2011 |
| (Jeffrey Liaw) | | | | |
| | |
/s/ MARC S. LIPSCHULTZ | | Director | | February 17, 2011 |
| (Marc S. Lipschultz) | | | | |
| | |
/s/ MICHAEL MACDOUGALL | | Director | | February 17, 2011 |
| (Michael MacDougall) | | | | |
279
| | | | |
Signature | | Title | | Date |
| | |
/S/ LYNDON L. OLSON, JR. | | Director | | February 17, 2011 |
| (Lyndon L. Olson, Jr.) | | | | |
| | |
/S/ KENNETH PONTARELLI | | Director | | February 17, 2011 |
| (Kenneth Pontarelli) | | | | |
| | |
/S/ WILLIAM K. REILLY | | Director | | February 17, 2011 |
| (William K. Reilly) | | | | |
| | |
/S/ JONATHAN D. SMIDT | | Director | | February 17, 2011 |
| (Jonathan D. Smidt) | | | | |
| | |
/S/ KNEELAND YOUNGBLOOD | | Director | | February 17, 2011 |
| (Kneeland Youngblood) | | | | |
280