Exhibit 99.1

Simulations Plus, Inc.
(NASDAQ:SLP)
First Quarter FY 2011
Conference Call and Webinar
January 14, 2011

With the exception of historical information, the matters discussed in this
presentation are forward looking statements that involve a number of risks
and uncertainties. The actual results of the Company could differ
significantly from those statements. Factors that could cause or contribute
to such differences include, but are not limited to: continuing demand for
the Company’s products, competitive factors, the Company’s ability to
finance future growth, the Company’s ability to produce and market new
products in a timely fashion, the Company’s ability to continue to attract
and retain skilled personnel, and the Company’s ability to sustain or
improve current levels of productivity. Further information on the
Company’s risk factors is contained in the Company’s quarterly and
annual reports and filed with the Securities and Exchange Commission.
Safe Harbor Statement
• 1Q11 was another record 1st quarter:
– 13th consecutive profitable quarter
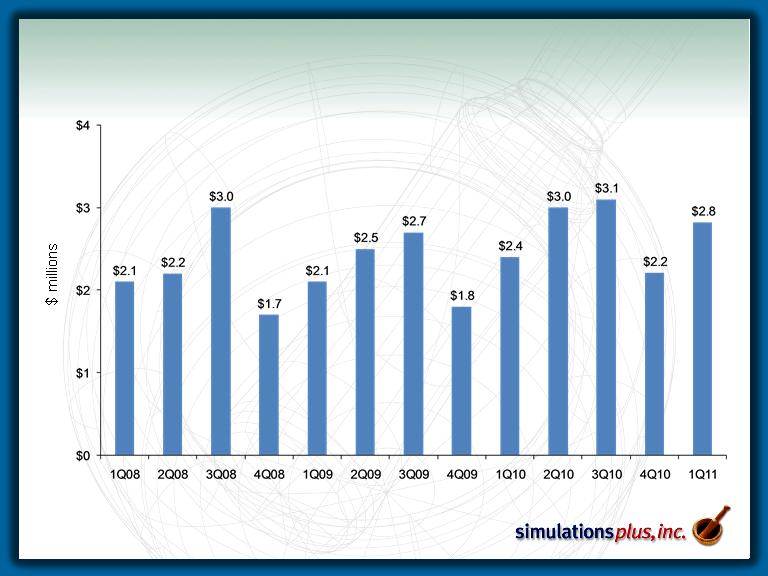
– 1Q11 sales up 15.4% to $2.81 MM from $2.44 MM in 1Q10.
– Net Income up 32.0% for the quarter over 1Q10
– Pharmaceutical segment sales up 18.2% over 1Q10
– Words+ subsidiary sales up 8.3% over 1QFY10
• Strong balance sheet:
– Cash $8.87 MM at 11/30/10, after using cash of $2.2 million for share repurchases ($1.198
million in Phase I plus $1.002 million in Phase II)
million in Phase I plus $1.002 million in Phase II)
– Shareholders’ equity up 15.4% to $12.5 million from $10.8 million at 11/30/09. Note: Since
August 30, 2010, shareholders’ equity decreased 4.5% to $12.5 million (due to cash used
for share repurchases).
August 30, 2010, shareholders’ equity decreased 4.5% to $12.5 million (due to cash used
for share repurchases).
– No debt.
SLP 1Q11 Highlights
Three months ended 11/30/10
Three months ended 11/30/10
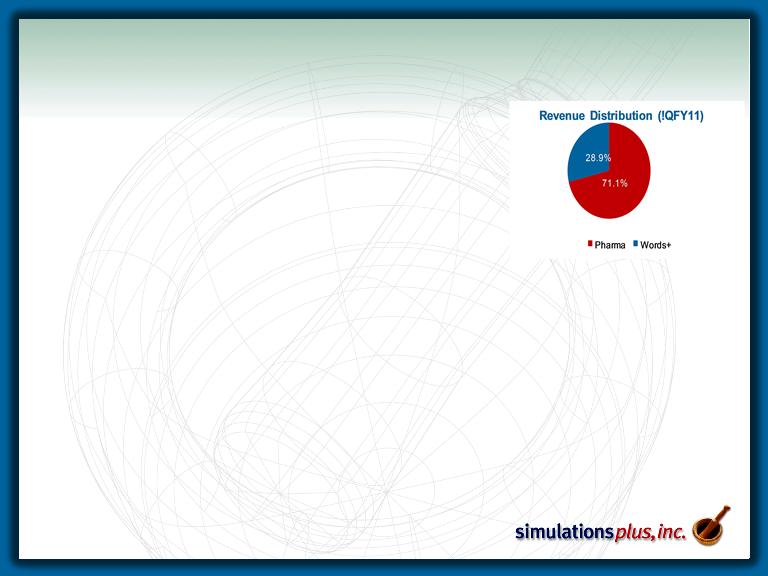
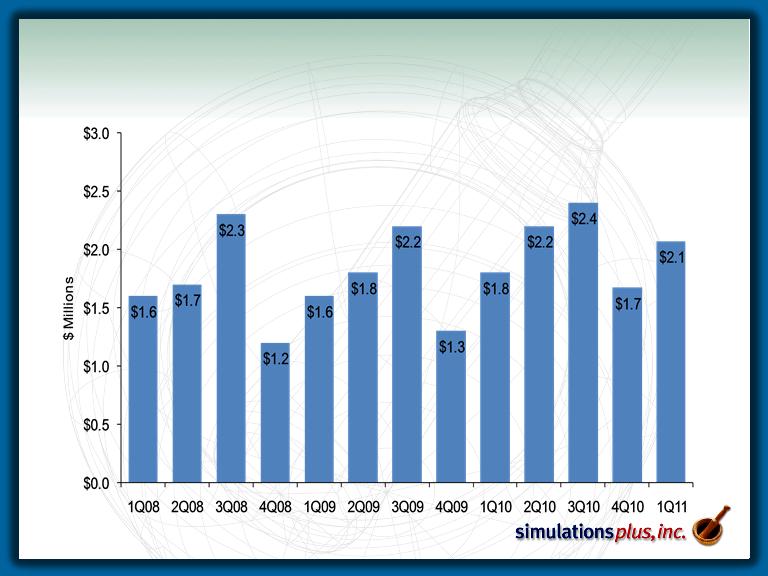
Consolidated Revenue
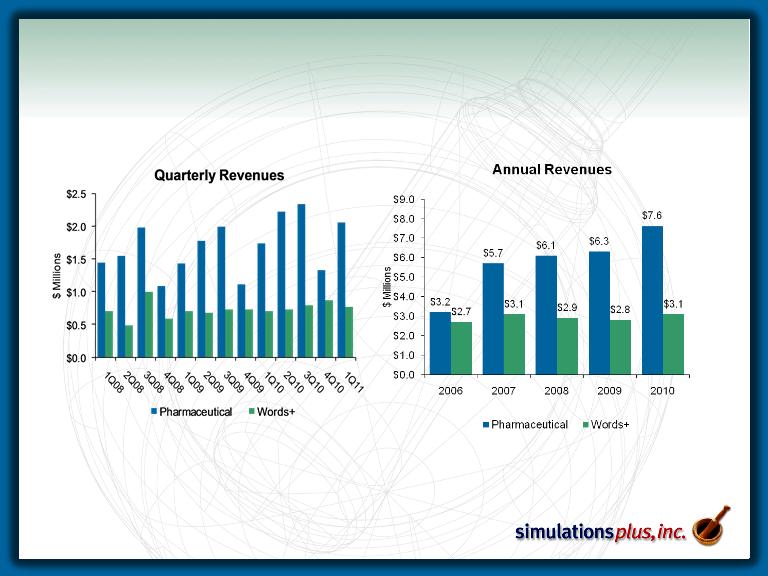
Revenue History
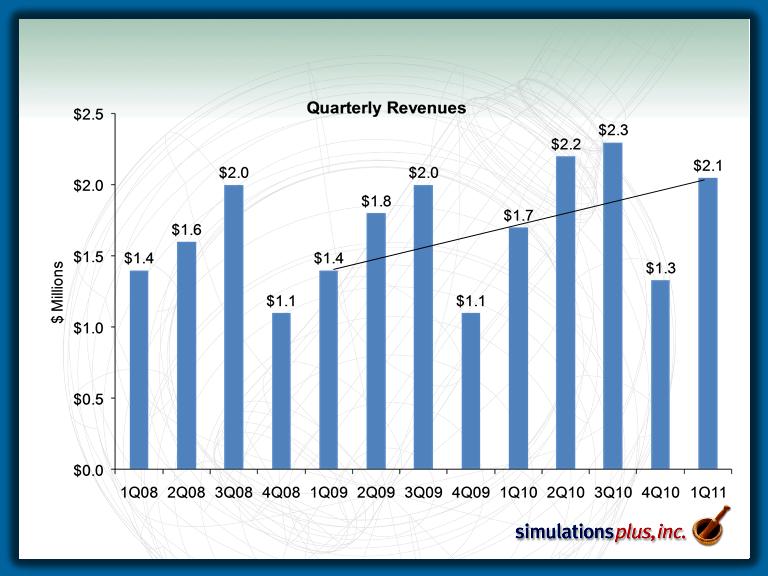
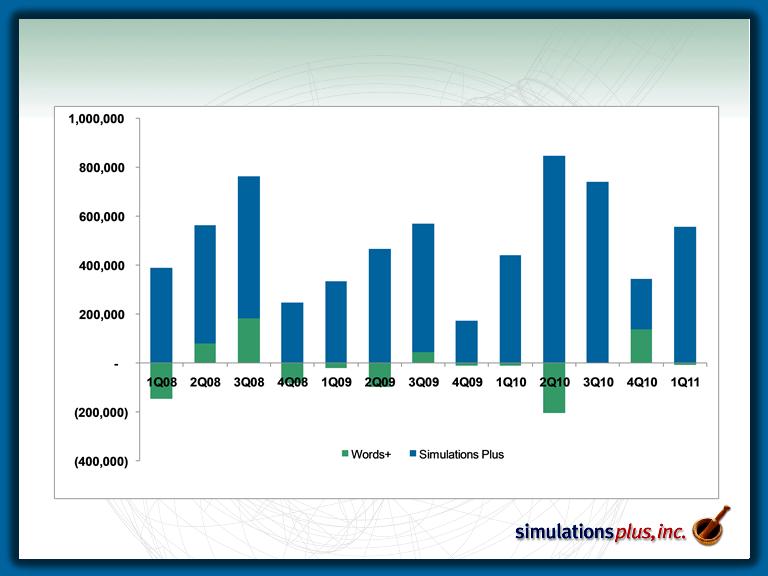
Pharmaceutical Growth
Gross Margin (consolidated)
75.6%
78.9%
78.8%
70.4%
73.8%
74.4%
80.0%
67.9%
75.0%
76.3%
77.6%
75.6%
73.6%
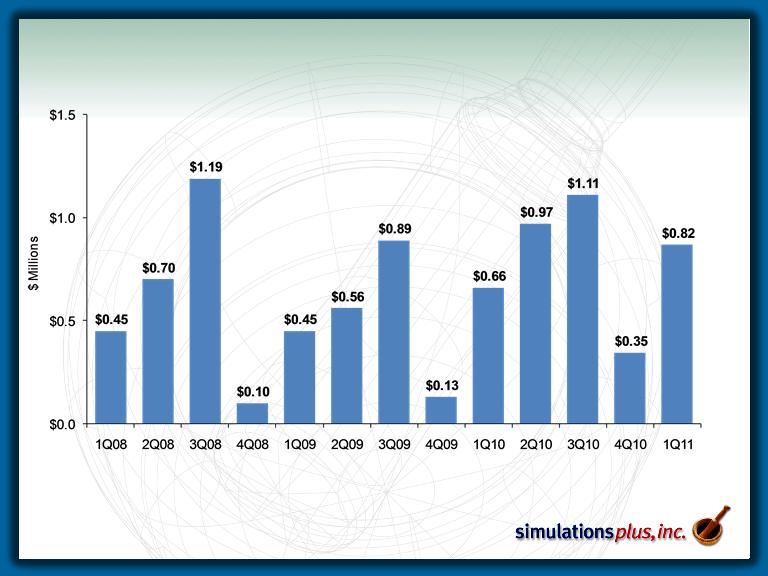
Income Before Taxes
Net Income
$243K
$565K
$764K
$165K
$312K
$368K
$569K
$163K
$430K
$641K
$740K
$345K
$567K
Consolidated Income Statement
($ millions)
1Q11 | 1Q10 | |
Pharmaceutical software and services revenue | 2.050 | 1.735 |
Words+ revenue | 0.761 | 0.702 |
Consolidated revenue | 2.811 | 2.437 |
Gross profit | 2.070 | 1.830 |
Gross profit margin | 73.6% | 75.1% |
SG&A | 1.062 | 1.004 |
R&D | 0.208 | 0.261 |
Total operating expenses | 1.270 | 1.265 |
Income before income taxes | 0.825 | 0.661 |
Net income | 0.567 | 0.430 |
Earnings per share (diluted) | 0.034 | 0.026 |
Select Balance Sheet Items
($ millions)
November 30, 2010 | November 30, 2009 | |
Cash and cash equivalents | $8.87 | $7.97 |
Total current assets | 11.775 | 10.750 |
Total assets | $14.063 | $12.828 |
Total current liabilities | 1.095 | 1.227 |
Total liabilities | 1.581 | 2.017 |
Shareholders’ equity | 12.482 | 10.812 |
Total liabilities and shareholders’ equity | 14.063 | 12.828 |

Share Repurchase Program
• The board of directors approved a second share repurchase
program beginning February 2010 for one year (Phase II)
program beginning February 2010 for one year (Phase II)
• The Phase II program authorizes repurchase of up to
1,000,000 shares through February 2011
1,000,000 shares through February 2011
• The purpose of the program is to use some of our excess cash
to increase shareholder value by reducing the number of
shares outstanding and increasing the per-share metrics (EPS,
sales/share, etc.)
to increase shareholder value by reducing the number of
shares outstanding and increasing the per-share metrics (EPS,
sales/share, etc.)
• As of today, the company has repurchased approximately
816,000 shares at an average price of $2.6935 per share, so
an additional approximately 184,000 shares are authorized to
be repurchased. We intend to continue the repurchase;
however, the company does not announce when and if further
repurchases may be made, nor a price range for repurchases.
816,000 shares at an average price of $2.6935 per share, so
an additional approximately 184,000 shares are authorized to
be repurchased. We intend to continue the repurchase;
however, the company does not announce when and if further
repurchases may be made, nor a price range for repurchases.
Aggressive Marketing and Sales Program
• Our development and consulting scientists
continue to be actively involved in scientific
meetings, with numerous poster and podium
presentations and staffing exhibit booths
continue to be actively involved in scientific
meetings, with numerous poster and podium
presentations and staffing exhibit booths
• Fundamental industry shift continues
– Pharma increasingly utilizing simulation software and modeling
tools to increase productivity
tools to increase productivity
– Software tools are always evolving, and as the technology
advances, new capabilities attract new users, such as the improved
and expanded structure-property models in ADMET Predictor 5.0;
the drug-drug interaction, ocular and nasal/pulmonary delivery
capabilities in GastroPlus 7.0; and the powerful de novo molecule
design capabilities in MedChem Studio, all of which were released
in the 4th quarter of FY10
– Collaborations/Consulting/Grants
– Marketing and sales emphasis on our consulting capabilities is
paying off - consulting, training, and collaboration revenues
increased from $773,000 in FY09 to $907,000 in FY10
paying off - consulting, training, and collaboration revenues
increased from $773,000 in FY09 to $907,000 in FY10
– Funded longer-term collaborations completed in FY10 resulted in
lower revenue from $210K in 1QFY10 to $145K in 1QFY11.
lower revenue from $210K in 1QFY10 to $145K in 1QFY11.
• Simulations Plus continues to increase its technological advantage
Ongoing Enhancements
• Version 7.0 was released in August - a major upgrade
• Three new market-expanding capabilities plus numerous features:
• Drug-to-drug interaction
• Ocular drug delivery
• Nasal/pulmonary drug delivery
• Version 5.0 was released in August - major upgrade
• SBIR grant is funding major effort toward very rapid calculation of
proprietary quantum-level descriptors, which have been incorporated
proprietary quantum-level descriptors, which have been incorporated
• Prediction of sites of metabolism in final test - release expected Q2
• Version 1.0 was released in August - major upgrade and name change
• Major enhancements to graphical user interface in development version
• Significant speed improvements achieved in development version
• Exciting new developments are in beta test in-house - release expected Q2
• Stable product with fine-tuning of capabilities
• Growing customer base shows gradual acceptance of this unique
technology by formulation scientists
technology by formulation scientists
• FDA Office of Generic Drugs added more licenses last year

WAR EAGLE! Auburn University wins National Championship!
Q&A