UNITED STATES SECURITIES AND EXCHANGE COMMISSION
WASHINGTON, D.C. 20549
FORM
20-F
☐
REGISTRATION STATEMENT PURSUANT TO SECTION 12(b) OR (g) OF THE SECURITIES EXCHANGE ACT OF 1934
OR
☑
ANNUAL REPORT PURSUANT TO SECTION 13 OR 15(d) OF THE SECURITIES EXCHANGE ACT OF 1934 For the fiscal year
ended
June 30, 2022
OR
☐
TRANSITION REPORT PURSUANT TO SECTION 13 OR 15(d) OF THE SECURITIES EXCHANGE ACT OF 1934
OR
☐
SHELL COMPANY REPORT PURSUANT TO SECTION 13 OR 15(d) OF THE SECURITIES EXCHANGE ACT 1934
Commission file number
0-28800
DRDGOLD LIMITED
(Exact name of Registrant as specified in its charter and translation of Registrant's name into English)
REPUBLIC OF SOUTH AFRICA
(Jurisdiction of incorporation or organization)
Constantia Office Park Cnr 14th Avenue and Hendrik Potgieter Road Cycad House, Building 17, Ground Floor
Weltevreden Park
1709
,
South Africa
Riaan Davel
, Chief Financial Officer, Tel. no. +
27
11
470 2600
, Email
riaan.davel@drdgold.com
Mpho Mashatola, Group Financial Manager Tel. no. +27 11 470 2600, Email mpho
.
mashatola@drdgold.com
(Name, Telephone, Email and/or Facsimile number and Address of Company Contact Person)
Securities registered or to be registered pursuant to Section 12(b) of the Act
Title of each class:
Trading symbol
Name of each exchange on which registered:
Ordinary shares (traded in the form of American Depositary
Shares, each American Depositary Share representing ten
underlying ordinary shares.)
DRD
The
New York Stock Exchange
, Inc.
Securities registered or to be registered pursuant to Section 12(g) of the Act
None
Securities for which there is a reporting obligation pursuant to Section 15(d) of the Act
None
Indicate the number of outstanding shares of each of the issuer's classes of capital or common stock as of the close of the period
covered by the annual report.
864,588,711
Indicate by check mark if the registrant is a well-known seasoned issuer, as defined in Rule 405 of the Securities Act.
Yes
☐
No
☑
If this report is an annual report or transition report, indicate by check mark if the registrant is not required to file reports pursuant
to Section 13 or 15(d) of the Securities Exchange Act of 1934 Yes
☐
No
☑
Indicate by check mark whether the registrant (1) has filed all reports required to be filed by Section 13 or 15(d) of the Securities
Exchange Act of 1934 during the preceding 12 months (or for such shorter period that the registrant was required to file such reports), and
(2) has been subject to such filing requirements for the past 90 days.
Yes
☑
☐
Indicate by check mark whether the registrant has submitted electronically every Interactive Date File required to be submitted
pursuant to Rule 405 of Regulation S-T (§ 232.405 of this chapter) during the preceding 12 months (or for such shorter period that the
registrant was required to submit such files).
Yes
☑
☐
Indicate by check mark whether the registrant is a large accelerated filer, an accelerated filer, a non-accelerated filer, or an emerging
growth company. See definition of “large accelerated filer,” “accelerated filer,” and “emerging growth company” in Rule 12b-2 of the
Exchange Act.
Large accelerated filer
☐
Accelerated filer
☑
☐
Emerging growth company
☐
If any emerging growth company that prepares its financial statements in accordance with U.S. GAAP, indicate by check mark if
the registrant has elected not to use the extended transition period for complying with any new or revised financial accounting standards
provided pursuant to Section 13(a) of the Exchange Act
☐
to its Accounting Standards Codification after April 5, 2012.
Indicate by check mark whether the registrant has filed a report on and attestation to its management’s assessment of the
effectiveness of its internal control over financial reporting under Section 404(b) of the Sarbanes-Oxley Act (15 U.S.C. 7262(b)) by the
registered public accounting firm that prepared or issued its audit report.
☑
Indicate by check mark which basis of accounting the registrant has used to prepare the financial statements included in this filing
.
U.S. GAAP
☐
International Accounting Standards Board
☑
Other
☐
If “Other” has been checked in response to the previous question, indicate by check mark which financial statement item the
registrant has elected to follow. Item 17
☐
☐
If this is an annual report, indicate by check mark whether the registrant is a shell company (as defined in Rule 12b-2 of the
Exchange Act). Yes
☐
☑
TABLE OF CONTENTS
Page
PART I
ITEM 1.
IDENTITY OF DIRECTORS, SENIOR MANAGEMENT AND ADVISERS
7
ITEM 2.
OFFER STATISTICS AND EXPECTED TIMETABLE
7
ITEM 3.
KEY INFORMATION
7
3A.
[Reserved]
7
3B.
Capitalization And Indebtedness
8
3C.
Reasons For The Offer And Use Of Proceeds
8
3D.
Risk Factors
8
ITEM 4.
INFORMATION ON THE COMPANY
22
4A.
History And Development Of The Company
22
4B.
Business Overview
24
4C.
Organizational Structure
29
4D.
Property, Plant And Equipment
30
ITEM 4A.
UNRESOLVED STAFF COMMENTS
43
ITEM 5.
OPERATING AND FINANCIAL REVIEW AND PROSPECTS
44
5A.
Operating Results
44
5B.
Liquidity And Capital Resources
53
5C.
Research And Development, Patents And Licenses, Etc
54
5D.
Trend Information
54
5E.
Critical Accounting Estimates
58
ITEM 6.
DIRECTORS, SENIOR MANAGEMENT AND EMPLOYEES
58
6A.
Directors And Senior Management
58
6B.
Compensation
62
6C.
Board Practices
65
6D.
Employees
69
6E.
Share Ownership
70
ITEM 7.
MAJOR SHAREHOLDERS AND RELATED PARTY TRANSACTIONS
72
7A.
Major Shareholders
72
7B.
Related Party Transactions
73
7C.
Interests Of Experts And Counsel
73
ITEM 8.
FINANCIAL INFORMATION
73
8A.
Consolidated statements And Other Financial Information
73
8B.
Significant Changes
73
ITEM 9.
THE OFFER AND LISTING
74
9A.
Offer And Listing Details
74
9B.
Plan Of Distribution
74
9C.
Markets
74
9D.
Selling Shareholders
74
9E.
Dilution
74
9F.
Expenses Of The Issue
74
ITEM 10.
ADDITIONAL INFORMATION
74
10A.
Share Capital
74
10B.
Memorandum and articles of association
74
10C.
Material Contracts
77
10D.
Exchange Controls
78
10E.
Taxation
80
10F.
Dividends And Paying Agents
85
10G.
Statement By Experts
85
10H.
Documents On Display
85
10I.
Subsidiary Information
85
ITEM 11.
QUANTITATIVE AND QUALITATIVE DISCLOSURES ABOUT MARKET RISK
85
TABLE OF CONTENTS
Page
PART II
ITEM 12.
DESCRIPTION OF SECURITIES OTHER THAN EQUITY SECURITIES
86
12A.
Debt Securities
86
12B.
Warrants and Rights
86
12C.
Other Securities
86
12D
American Depositary Shares
87
ITEM 13.
DEFAULTS, DIVIDEND ARREARAGES AND DELINQUENCIES
88
ITEM 14.
MATERIAL MODIFICATIONS TO THE RIGHTS OF SECURITY HOLDERS AND USE OF PROCEEDS
88
ITEM 15.
CONTROLS AND PROCEDURES
88
ITEM 16.
[RESERVED]
89
ITEM 16A.
AUDIT COMMITTEE FINANCIAL EXPERT
89
ITEM 16B.
CODE OF ETHICS
89
ITEM 16C.
PRINCIPAL ACCOUNTANT FEES AND SERVICES
89
ITEM 16D.
EXEMPTIONS FROM THE LISTING STANDARDS FOR AUDIT COMMITTEES
90
ITEM 16E.
PURCHASES OF EQUITY SECURITIES BY THE ISSUER AND AFFILIATED PURCHASERS
90
ITEM 16F
CHANGE IN REGISTRANT'S CERTIFYING ACCOUNTANT
90
ITEM 16G.
CORPORATE GOVERNANCE
90
ITEM 16H.
MINE SAFETY DISCLOSURES
91
ITEM 16I.
DISCLOSURE REGARDING FOREIGN JURISDICTIONS THAT PREVENT INSPECTIONS
91
PART III
ITEM 17.
FINANCIAL STATEMENTS
92
ITEM 18.
FINANCIAL STATEMENTS
92
ITEM 19.
EXHIBITS
95
SIGNATURES
98
1
Preparation of Financial Information
maintained in South African Rand. Our financial statements included in our corporate filings are prepared in accordance with International
Financial Reporting Standards (IFRS), as issued by the International Accounting Standards Board (IASB).
All financial information in this Annual Report, except as otherwise noted is prepared in accordance with IFRS as issued by the IASB.
herein are to United States Dollars and references to “rand” or “R” are to South African rands. Solely for your convenience, this Annual Report
contains translations of certain rand amounts into dollars at specified rates. These rand amounts do not represent actual dollar amounts, nor
could they necessarily have been converted into dollars at the rates indicated. Unless otherwise indicated, rand amounts have been translated
into dollars at the rate of R16.27 per $1.00, the year end exchange rate on June 30, 2022.
sustaining costs per kilogram” and “all-in costs per kilogram” which have been determined using industry guidelines promulgated by the
World Gold Council, and which we use to determine costs associated with producing gold, cash generating capacities of the mines and to
monitor performance of our mining operations. An investor should not consider these items in isolation or as alternatives to, operating costs,
cash generated from operating activities, profit/(loss) for the year or any other measure of financial performance presented in accordance
with IFRS or as an indicator of our performance. While the World Gold Council has provided definitions for the calculation of these
measures, the calculation of cash operating costs per kilogram, all-in sustaining costs per kilogram and all-in costs per kilogram may vary
significantly among gold mining companies, and these definitions by themselves do not necessarily provide a basis for comparison with
other gold mining companies. See Glossary of Terms and Explanations and Item 5A. Operating Results – “Cash operating costs, all-in
sustaining costs and all-in costs” and “Reconciliation of cash operating costs per kilogram, all-in sustaining costs per kilogram, all-in costs
per kilogram”.
DRDGOLD Limited
Group” refer to the Company and its subsidiaries as appropriate in the context.
Special Note Regarding Forward-Looking Statements
Act of 1934, regarding expected future events, circumstances, trends and expected future financial performance and information relating to us
that are based on the beliefs of our management, as well as assumptions made by and information currently available to our management. Some
of these forward-looking statements include phrases such as “anticipates,” “believes,” “could,” “estimates,” “expects,” “intends,” “may,”
“should,” or “will continue,” or similar expressions or the negatives thereof or other variations on these expressions, or similar terminology, or
discussions of strategy, plans or intentions, including statements in connection with, or relating to, among other things:
●
our reserve calculations and underlying assumptions;
●
the trend information discussed in Item 5D.- Trend Information, including target gold production and cash operating costs;
●
life of mine and potential increase in life of mine;
●
statements made in or with respect to the Technical Report Summaries (“
TRS
” or “
TRSs
”) including statements with respect to
Mineral Reserves and Resources and assumptions, gold prices, projected revenue and cash flows and capital expenditures and
other forward looking statements in the TRSs;
●
estimated future throughput capacity and production;
●
expected trends in our gold production as well as the demand for and the price of gold;
●
our anticipated labor, electricity, water, crude oil and steel costs;
●
our expectation that existing cash will be sufficient to fund our operations in the next 12 months including our anticipated
commitments;
●
estimated production costs, cash operating costs per ounce, all-in sustaining costs per ounce and all-in costs per ounce;
●
expectations on future gold price, supply and pricing trends, including long term trends, expected impact of the global environment
on gold prices;
●
expected gold production and cash operating costs expected in fiscal year 2023;
●
statements with respect to agreements with unions;
●
our prospects in litigation and disputes;
●
statements with respect to the legal review for increasing the deposition capacity of the Brakpan/Withok Tailings Storage Facility
(“
TSF
”) and the Regional Tailings Storage Facility (“
RTSF
”), and expected potential increase in capacity and life of mine and
statements with respect to our flotation fine-grind (“
FFG
”) program;
●
expected deposition capacity from improvements in our dams and new dam construction; and
●
expected effective gold mining tax rate.
factors could cause our actual results, performance or achievements to be materially different from any future results, performance or
achievements that may be expressed or implied by such forward-looking statements, including, among others:
2
●
the global impact of the COVID-19 pandemic and potential new variants, including in South Africa;
●
the global impact of Ukraine conflict and global inflation;
●
adverse changes or uncertainties in general economic conditions in South Africa;
●
regulatory developments adverse to us or difficulties in maintaining necessary licenses or other governmental approvals;
●
future performance relating to the FWGR Phase 2 assets and the reclamation sites on the east of Ergo’s plant;
●
challenges in replenishing mineral reserves;
●
changes in our competitive position;
●
changes in, or that affect, our business strategy;
●
that assumptions underlying our Mineral Reserves and Mineral Resources as set forth in this report and our TRSs prove to be
incorrect;
●
our ability to achieve anticipated efficiencies and other cost savings in connection with past and future acquisitions;
●
the success of our business strategy, development activities and other initiatives;
●
adverse changes in our gold production as well as the demand for and the price of gold;
●
changes in technical and economic assumptions underlying our Mineral Reserve estimates;
●
any major disruption in production at our key facilities;
●
adverse changes in foreign exchange rates;
●
adverse environmental or environmental regulatory changes;
●
adverse changes in ore grades and recoveries, and to the quality or quantity of reserves;
●
unforeseen technical production issues, industrial accidents and theft;
●
anticipated or unanticipated capital expenditure on property, plant and equipment;
●
the impact of HIV/AIDS, tuberculosis and the spread of other contagious diseases; and
●
various other factors, including those set forth in Item 3D. Risk Factors.
results, causing these results to differ materially from those expressed in any forward-looking statements. These factors are not necessarily all of
the important factors that could cause our results to differ materially from those expressed in any forward-looking statements. Other unknown or
unpredictable factors could also have material adverse effects on future results.
do not undertake any obligation to update publicly or release any revisions to these forward-looking statements to reflect events or circumstances
after the date of this Annual Report or to reflect the occurrence of unanticipated events.
Special Note Regarding Links to External, or Third-party Websites
Any links to external, or third-party websites, are provided solely for convenience. We take no responsibility whatsoever for any third-
party information contained in such third-party websites, and we specifically disclaim adoption or incorporation by reference of such information
into this report and no websites are incorporated by reference into this report.
3
Imperial units of measure and metric equivalents
Metric
Imperial
Imperial
Metric
1 metric tonne
1.10229 short tons
1 short ton
0.9072 metric tonnes
1 kilogram
2.20458 pounds
1 pound
0.4536 kilograms
1 gram
0.03215 troy ounces
1 troy ounce
31.10353 grams
1 kilometer
0.62150 miles
1 mile
1.609 kilometers
1 meter
3.28084 feet
1 foot
0.3048 meters
1 liter
0.26420 gallons
1 gallon
3.785 liters
1 hectare
2.47097 acres
1 acre
0.4047 hectares
1 centimeter
0.39370 inches
1 inch
2.54 centimeters
1 gram/tonne
0.0292 ounces/ton
1 ounce/ton
34.28 grams/tonnes
0 degree Celsius
32 degrees Fahrenheit
0 degrees Fahrenheit
- 18 degrees Celsius
4
Glossary of Terms and Explanations
The table below sets forth a glossary of terms used in this Annual Report:
Adjusted EBITDA
Adjusted EBITDA means earnings before interest, tax, depreciation, amortisation, share-based payment
(benefit)/expense, change in estimate of environmental rehabilitation recognised in profit or loss, gain/(loss) on
disposal of property, plant and equipment, gain/(loss) on financial instruments, IFRS 16 lease payments,
exploration expenses and transaction costs, and retrenchment costs. This is a non-IFRS financial measure and
should not be considered a substitute measure of net income reported by us in accordance with IFRS.
Administration expenses and
other costs excluding non-
recurring items
Administration expenses and other costs excluding loss on disposal of property, plant and equipment and
transaction costs.
All-in sustaining costs per
kilogram
All-in sustaining costs is a measure on which guidance is provided by the World Gold Council and includes
cash operating costs of production, plus movement in gold in process on a sales basis, corporate administration
expenses and other (costs)/income, the accretion of rehabilitation costs and sustaining capital expenditure. Costs
other than those listed above are excluded. All-in sustaining costs per kilogram are calculated by dividing total
all-in sustaining costs by kilograms of gold produced. This is a non‑IFRS financial measure and should not be
considered a substitute measure of costs and expenses reported by us in accordance with IFRS.
All-in costs per kilogram
All-in costs is a measure on which guidance is provided by the World Gold Council and includes all-in sustaining
costs, retrenchment costs, care and maintenance costs, ongoing rehabilitation expenditure, growth capital
expenditure and capital recoupments. Costs other than those listed above are excluded. All-in costs per kilogram
are calculated by dividing total all-in costs by kilograms of gold produced. This is a non‑IFRS financial measure
and should not be considered a substitute measure of costs and expenses reported by us in accordance with IFRS.
Assaying
The chemical testing process of rock samples to determine mineral content.
Brakpan/Withok final life design
The Brakpan/Withok Tailings Storage Facility final life design is the engineering design that ultimately brings
the tailings storage facility to its finality in terms of extent, operation, rehabilitation and management. The
implemented final design would result in alignments with the Global Industry Standard on Tailings Management
(“
GISTM
”) and regulatory bodies, increase deposition capacity, improve operation/management and bring
about the sustainable closure of the facility.
$/oz
US dollar per ounce.
Called gold content
The theoretical gold content of material processed.
Care and maintenance
Costs to ensure that the Ore Reserves are open, serviceable and legally compliant after active mining activity at
a shaft has ceased.
Cash operating costs of
production
Cash operating costs of production are operating costs less ongoing rehabilitation expenses, care and
maintenance costs and net other operating costs/(income). This is a non‑IFRS financial measure and should not
be considered a substitute measure of costs and expenses reported by us in accordance with IFRS.
Cash operating costs per kilogram
Cash operating costs are operating costs incurred directly in the production of gold and include labor costs,
contractor and other related costs, inventory costs and electricity costs. Cash operating costs per kilogram are
calculated by dividing cash operating costs by kilograms of gold produced. This is a non‑IFRS financial measure
and should not be considered a substitute measure of costs and expenses reported by us in accordance with IFRS.
Cut‑off grade
The grade (i.e., the concentration of metal or mineral in rock) that distinguishes material deemed to have no
economic value from material deemed to have economic value.
CIL Circuit
Carbon-in-leach circuit.
Definitive Feasibility Study
("
DFS
")
A definitive engineering estimate of all costs, revenues, equipment requirements and production at a -5% to
+10% level of accuracy. The study is used to define the economic viability of a project and to support the search
for project financing.
Depletion
The decrease in the quantity of ore in a deposit or property resulting from extraction or production.
Deposition
Deposition is the geological process by which material is added to a landform or land mass. Fluids such as wind
and water, as well as sediment flowing via gravity, transport previously eroded sediment, which, at the loss of
enough kinetic energy in the fluid, is deposited, building up layers of sediment. Deposition occurs when the
forces responsible for sediment transportation are no longer sufficient to overcome the forces of particle weight
and friction, creating a resistance to motion.
Dilution
Waste or material below the cut-off grade that contaminates the ore during the course of mining operations and
thereby reduces the average grade mined.
Doré
Unrefined gold and silver bullion bars consisting of approximately 90% precious metals which will be further
refined to almost pure metal.
Footwall
The underlying side of a stope or ore body.
Grade
The amount of gold contained within auriferous material generally expressed in ounces per ton or grams per
tonne of ore.
Growth capital expenditure
Capital additions that are not sustaining capital expenditure. This is a non‑IFRS financial measure and should
not be considered a substitute measure of costs and expenses reported by us in accordance with IFRS.
g/t
Grams per tonne.
5
Indicated Mineral Resources
That part of a Mineral Resource for which quantity and grade or quality are estimated on the basis of adequate
geological evidence and sampling. The level of geological certainty associated with an indicated Mineral
Resource is sufficient to allow a qualified person to apply modifying factors in sufficient detail to support mine
planning and evaluation of the economic viability of the deposit. Because an indicated Mineral Resource has a
lower level of confidence than the level of confidence of a measured Mineral Resource, an indicated Mineral
Resource may only be converted to a probable Mineral Reserve.
Inferred Mineral Resources
That part of a Mineral Resource for which quantity and grade or quality are estimated on the basis of limited
geological evidence and sampling. The level of geological uncertainty associated with an inferred Mineral
Resource is too high to apply relevant technical and economic factors likely to influence the prospects of
economic extraction in a manner useful for evaluation of economic viability. Because an inferred Mineral
Resource has the lowest level of geological confidence of all Mineral Resources, which prevents the application
of the modifying factors in a manner useful for evaluation of economic viability, an inferred Mineral Resource
may not be considered when assessing the economic viability of a mining project and may not be converted to
a Mineral Reserve.
Measured Mineral Resources
That part of a Mineral Resource for which quantity and grade or quality are estimated on the basis of conclusive
geological evidence and sampling. The level of geological certainty associated with a measured Mineral
Resource is sufficient to allow a qualified person to apply modifying factors, in sufficient detail to support
detailed mine planning and final evaluation of the economic viability of the deposit. Because a measured Mineral
Resource has a higher level of confidence than the level of confidence of either an indicated Mineral Resource
or an inferred Mineral Resource, a measured Mineral Resource may be converted to a proven Mineral Reserve
or to a probable Mineral Reserve.
Metallurgical plant
A processing plant (mill) erected to treat ore and extract the contained gold.
Mineral Reserves
An estimate of tonnage and grade or quality of indicated and measured Mineral Resources that, in the opinion
of the qualified person, can be the basis of an economically viable project. More specifically, the economically
mineable part of a measured or indicated Mineral Resource, which includes diluting materials and allowances
for losses that may occur when the material is mined or extracted.
Mineral Resources
A concentration or occurrence of material of economic interest in or on the Earth's crust in such form, grade or
quality, and quantity that there are reasonable prospects for economic extraction. A Mineral Resource is a
reasonable estimate of mineralization, taking into account relevant factors such as cut-off grade, likely mining
dimensions, location or continuity, that, with the assumed and justifiable technical and economic conditions, is
likely to, in whole or in part, become economically extractable. It is not merely an inventory of all mineralization
drilled or sampled.
Mine call factor
The gold content recovered expressed as a percentage of the called gold content.
Modifying factors
The factors that a qualified person must apply to indicated and measured Mineral Resources and then evaluate
in order to establish the economic viability of Mineral Reserves. A qualified person must apply and evaluate
modifying factors to convert measured and indicated Mineral Resources to proven and probable Mineral
Reserves. These factors include, but are not restricted to: Mining; processing; metallurgical; infrastructure;
economic; marketing; legal; environmental compliance; plans, negotiations, or agreements with local
individuals or groups; and governmental factors. The number, type and specific characteristics of the modifying
factors applied will necessarily be a function of and depend upon the mineral, mine, property, or project
Mt
Million tons.
Ore
A mixture of valuable and worthless materials from which the extraction of at least one mineral is technically
and economically viable.
Other operating costs / (income)
Expenses incurred, and income generated in the course of operating activities, which are not directly attributable
to production activities.
Operating costs
Operating costs are cost of sales less depreciation, change in estimate of rehabilitation provision, movement in
gold in process and finished inventory – gold bullion, ongoing rehabilitation expenditure, care and maintenance,
other operating income and retrenchment costs.
oz/t
Ounces per ton.
Prefeasibility study ("
PFS
")
A comprehensive study of a range of options for the technical and economic viability of a mineral project that
has advanced to a stage where a preferred mining method, in the case of underground mining, or the pit
configuration, in the case of an open pit, is established and an effective method of mineral processing is
determined. It includes a financial analysis based on reasonable assumptions on the modifying factors and the
evaluation of any other relevant factors which are sufficient for a competent person, acting reasonably, to
determine if all or part of the Mineral Resource may be converted to a Mineral Reserve at the time of reporting.
A prefeasibility study is at a lower confidence level than a feasibility study.
Proven Mineral Reserves
The economically mineable part of a measured Mineral Resource and can only result from conversion of a
measured Mineral Resource and can only result from conversion of a measured Mineral Resource.
Probable Mineral Reserves
The economically mineable part of an indicated and in some cases, a measured Mineral Resource.
Qualified Person
An individual who is a mineral industry professional with at least 5 years of relevant experience in the type of
mineralization and type of deposit under consideration and in the specific type of activity that person is
undertaking on behalf of the registrant, and an eligible member or licensee in a good standing of a recognized
professional organization at the time the technical report is prepared.
Refining
The final purification process of a metal or mineral.
6
Rehabilitation
The process of restoring mined land to a condition approximating its original state.
Reserves
That part of a mineral deposit which could be economically and legally extracted or produced at the time of the
reserve determination.
Sediment
The deposition of solid fragmental material that originated from weathering of rocks and was transported from
a source to a site of deposition.
Slimes
The tailings discharged from a processing plant after the valuable minerals have been recovered.
Sustaining capital expenditure
Sustaining capital expenditure are those capital additions that are necessary to maintain current gold production.
This is a non‑IFRS financial measure and should not be considered a substitute measure of costs and expenses
reported by us in accordance with IFRS.
T’000
Tonnes in thousands.
Tailings
Finely ground rock from which valuable minerals have been extracted by milling, or any waste rock, slimes or
residue derived from any mining operation or processing of any minerals.
Tailings dam
A dam created from waste material of processed ore after the economically recoverable gold has been extracted.
Tonnage/Tonne
Quantities where the metric tonne is an appropriate unit of measure. Typically used to measure reserves of
gold‑bearing material in‑situ or quantities of ore and waste material mined, transported or milled.
Tpm
Tonne per month.
Yield
The amount of recovered gold from production generally expressed in ounces or grams per ton or tonne of ore.
7
PART I
ITEM 1. IDENTITY OF DIRECTORS, SENIOR MANAGEMENT AND ADVISERS
Not applicable.
ITEM 2. OFFER STATISTICS AND EXPECTED TIMETABLE
Not applicable.
ITEM 3. KEY INFORMATION
3A. [Reserved]
8
3B. CAPITALIZATION AND INDEBTEDNESS
Not applicable.
3C. REASONS FOR THE OFFER AND USE OF PROCEEDS
Not applicable.
3D. RISK FACTORS
operational processes, while others relate to our business environment. It is important to understand the nature of these risks and the impact they
may have on our business, financial condition and operating results. Some of these risks are summarized below and have been organized into the
following categories:
●
Risks related to our business and operations;
●
Risks related to the gold mining industry;
●
Risks related to doing business in South Africa;
●
Risks related to climate change;
●
Risks related to government regulation; and
●
Risks related to ownership in our ordinary shares or American Depositary Shares (ADSs).
Risks related to our business and operations
Changes in the market price for gold and exchange rate fluctuations, both of which have fluctuated widely in the past, affect the
profitability of our operations and the cash flows generated by those operations.
Our results are significantly impacted by the price of gold and the USD-Rand exchange rate. Any sustained decline in the market price
of gold from the current levels would adversely affect us, and any sustained decline in the price of gold below the cost of production could
result in the closure of some or all of our operations which would result in significant costs and expenditure, such as, incurring retrenchment
costs earlier than expected which could lead to a decline in profits, or losses, as well as impairment losses. In addition, as most of our production
costs are in rands, while gold is sold in dollars and then converted to rands, our results of operation and financial condition have been and
could be in the future materially affected by an appreciation in the value of the rand. Accordingly, any sustained decline in the dollar price of
gold and/or the strengthening of the South African rand against the dollar would negatively and adversely affect our business, operating results
and financial condition.
In the wake-of the COVID-19 pandemic and measures taken to address the outbreak, there has been a global trend of investors turning
to gold and gold stocks as a safe haven asset, as has been the case in previous times of global economic crisis. This has led to a surge in the average
gold price during fiscal 2020 and fiscal 2021. Although the impact of the COVID-19 pandemic has diminished and the gold prices have marginally
decreased, the average gold price for fiscal 2022 remained high due to continued economic uncertainty as the global economies attempt to recover
from all the after effects of COVID19 and deal with, the conflict in Ukraine and rapidly rising inflation. In addition, we are impacted by movements
in the exchange rate of the rand against the dollar as described below.
weakened by 14% compared to June 30, 2021. The closing price of the rand against the dollar at June 30, 2021 strengthened by 18% compared to
June 30, 2020. At September 30, 2022, the rand traded at R18.15 = $1.00 (based on closing rates), a 12% weakening of the rand against the Dollar
from June 30, 2022 as the dollar strengthened as a result of quantitative tightening and the raising of interest rates by the US Federal Reserve. The
rand/dollar exchange rate was volatile throughout the fiscal year 2022 mainly as a result of global, emerging market and South Africa economic
uncertainty including uncertainties resulting from the global economic slowdown sentiment, rapidly rising global inflation, geopolitical tensions
in Ukraine, perceived political and economic instability, structurally weak economic growth of the South African economy exacerbated by
increasing loadshedding by power utility Eskom Holdings SOC Limited (“
Eskom
”) as it battles with supply.
rand was to appreciate against the dollar or the gold price were to decrease for a continued time, our operations could experience a reduction in
cash flow and profitability, and this would adversely affect our business, operating results and financial condition.
rate movements of the rand. Up to April 11, 2022 we sold gold at spot prices based on the afternoon London Bullion Market fixing price on the
day when Rand Refinery, acting as an agent for the sale of all gold produced by the Group, delivers the Gold to the buyer. Our foreign currency
was usually sold at the spot price in the market on the date of trade. Subsequent to April 11, 2022 gold is sold at a dollar gold price and spot
exchange rate specified in a contract with the South African bullion banks to deliver the gold at a specified settlement date. If the dollar gold price
should fall and/or the rand should strengthen against the dollar, this would adversely affect us, and we may experience losses, and if these changes
result in revenue below our cost of production and remain at such levels for any sustained period, we may be forced to curtail or suspend some or
all our operations.
A failure to acquire new Mineral Reserves could negatively affect our future cash flows, results of operations and financial
condition.
9
New or ongoing exploration programs may be delayed or may not result in new mineral producing operations that will sustain or
increase our Mineral Reserves. A failure to acquire new Mineral Reserves in sufficient quantities and quality to maintain or grow the current
level and quality of our reserves will negatively affect our future cash flow, results of operations and financial condition. In addition, if we are
unable to identify Mineral Reserves that have reasonable prospects for economic extraction while maintaining sufficient controls on production
and other costs, this will have a material effect on the future viability of our operations.
our business, operating results and financial condition.
We may be unable to make desirable acquisitions or to integrate successfully any businesses we acquire, including the development
of Phase 2 of the FWGR assets acquired from Sibanye-Stillwater
.
current business or products or that might otherwise offer us growth opportunities. Our ability to complete such transactions may be hindered by
a number of factors, including identifying acquisition targets, obtaining necessary financing and potential difficulties in obtaining government
approvals. Any acquisitions we make, could fail to achieve our financial or strategic objectives or disrupt our ongoing business which could
adversely impact our results of operations.
organization. We cannot be certain that we will be able to achieve the benefits we expect from a particular acquisition or investment. Acquisitions
may also strain our managerial and operational resources, as the challenge of managing new operations may divert our management from day-to-
day operations of our existing business. Furthermore, we may have difficulty integrating employees, business systems, and technology. The
controls, processes and procedures of acquired businesses may also not adequately ensure compliance with laws and regulations and we may fail
to identify compliance issues or liabilities. Our business, financial condition and results of operations may be materially and adversely affected if
we fail to coordinate our resources effectively to manage both our existing operations and any businesses we acquire. Acquisitions can also result
in unforeseen liabilities.
transaction, we may need to forgo the prospect of entering into other transactions that could help us achieve our financial or strategic objectives.
Limited deposition capacity
Our operations are based on ultra-volume and almost nano-gold extraction. The volume of reclaimed material delivered has one of the
most profound impacts on the gold output of our metallurgical plants. The large volumes of material that are processed at our operations are
deposited on tailings facilities which have a finite capacity. Alternative facilities will be required to ensure adequate deposition capacity for the
current life of mine and for the future. Key projects to increase such a deposit capacity include the development of the regional tailings storage
facility as part of Phase 2 FWGR project or identifying interim alternate deposition facilities as well as obtaining regulatory approvals for the
Brakpan/Withok TSF final design at Ergo. However, their products may not be successful or sufficient to maintain or increase deposit capacity
.
design implementation to enable mining on the east of the Ergo plant, are subject to schedule delays and cost overruns, and we may face
constraints in financing our existing projects or new business opportunities, which could render our projects unviable or less profitable than
planned.
capital expenditure and allocate considerable management resources in utilizing our existing experience and know-how.
implementation of the Brakpan/Withok TSF final life design are subject to the risk of delays, regulatory approvals and cost overruns which are
inherent in any large construction project including,
inter alia
:
• shortages or unforeseen increases in the cost of equipment, labor and raw materials;
• unforeseen design and engineering problems;
• changes in construction plans that may require new or amended planning permissions;
• unforeseen construction problems;
• unforeseen delays commissioning sections of the project;
• inadequate phasing of activities;
• labor disputes;
• inadequate workforce planning or productivity of workforce;
• inadequate management practices;
• natural disasters and adverse weather conditions;
• national work stoppages as a result of infectious deceases and pandemics;
• failure or delay of third-party service providers; and
• changes to regulations, such as environmental regulations.
10
rd
be obtained for the submitted amended design. It is therefore anticipated that the construction of the Regional Storage Facility, related to Phase 2,
will commence in fiscal year 2031. As the Driefontein 4 TSF is expected to reach full capacity during fiscal year 2025, whereafter the depositional
rate would have to decrease materially. Plans are in place to redirect material to Sibanye Gold’s Leeudoorn TSF until the Regional Storage Tailings
Facility is ready for commissioning expected in fiscal year 2031.
the Solar
Plant
”). The Solar Plant definitive feasibility study was completed during fiscal year 2022 and is currently under development. A significant capital
investment is needed to complete the project. It is estimated that benefit from the project in reduced electricity costs and reduced carbon footprint
will start to materialize from April 2023 onwards.
design is expected to be crucial in the increase of the life of mine of Ergo as it will accommodate material in toward the east of the Ergo plant.
rates, interest rates, inflation rates and discount rates, prove to be incorrect or need to be significantly revised, this may adversely affect the
profitability or even the viability of our projects. The uncertainty and volatility in the gold market makes it more difficult to accurately evaluate
the project economics and increases the risk that the assumptions underlying our assessment of the viability of the project may prove incorrect.
particularly material to DRDGOLD, significant cost overruns or adverse changes in assumptions affecting the viability of these projects could have
a material adverse effect on our business, cash flows, financial condition and prospects.
depending on the timing and cost of development of our existing projects and any further projects we may pursue. As a result, new sources of
capital may be needed to meet the funding requirements of these projects and to fund ongoing business activities. Our ability to raise and service
significant new sources of capital will be a function of,
inter alia
, macroeconomic conditions, rising cost of debt, our credit rating, our gearing and
other risk metrics, the condition of the financial markets, future gold prices, the prospects for our industry, our operational performance and
operating cash flow and debt position.
new business opportunities, invest in existing and new projects, fund our ongoing business activities and pay dividends, could be constrained, any
of which could have a material adverse effect on our business, operating results cash flows and financial condition.
recovered grades and costs. Management is estimating a significant capital investment in major projects in the next few years. If we are unable to
meet our cash requirements out of cash flows generated from our operations, we would need to fund our cash requirements from financing sources
and any such financing may not be permitted under the terms of our financing arrangements or may not be possible on attractive terms or at all due
to rising interest rates, or may not be available on acceptable terms, or at all. If we do not generate sufficient cash flows or have access to adequate
financing, our ability to respond to changing business and economic conditions, make future acquisitions, react to adverse operating results, meet
our debt service obligations and fund required capital expenditures or meet our working capital requirements may be adversely affected.
Company.
stations and the Brakpan/Withok TSF are linked through pipeline infrastructure. The Ergo plant is currently our major processing plant. FWGR’s
reclamation site, DP2 processing plant, pump stations and the Driefontein 4 Tailings Storage Facility are linked through pipeline infrastructure.
operational down time due to planned or unplanned maintenance and load shedding or power dips, destruction of infrastructure, spillages, higher
than expected operating costs, or lower than expected production as a result of decreases in extraction efficiencies due to imbalances in the
metallurgical process as well as inconsistent volume throughput or other factors.
smelting and recovery of gold from gold loaded carbon produced at FWGR as well as the use of various rights, permits and licenses held by
Sibanye Gold pursuant to which FWGR operates, pending the transfer to FWGR of those that are transferable. Any disruption in the supply of, or
our ability to use and access the Sibanye-Stillwater mining infrastructure, related services and rights, permits and licenses, could have an adverse
impact on our operations.
adverse effect on our business, operating results and financial condition.
11
and come into contact with naturally occurring underground water or decant into surrounding underground mining areas and could ultimately also
rise to surface. Progressive flooding of these abandoned underground mining areas and surrounding underground mining areas could eventually
cause the discharge of polluted water to the surface and to local water sources.
face claims relating to environmental damage. Any such claims may have a material adverse effect on our business, operating results and financial
condition.
An increase in production costs could have an adverse effect on our results of operations.
inter alia
:
• rising global and national inflation;
• labor stability, productivity and increases in labor costs;
• increases in electricity and water prices;
• increases in crude oil and steel prices;
• changes in regulation;
• unforeseen changes in ore grades and recoveries;
• unexpected changes in the quality or quantity of reserves;
• technical production issues;
• availability and cost of smelting and refining arrangements;
• environmental and industrial accidents;
• gold theft;
• shortages or availability of materials used in production;
• environmental factors; and
• pollution.
Our production costs consist mainly of materials including reagents and steel, labor, electricity, specialized service providers, machine
hire, security, water, fuels, lubricants and other oil and petroleum-based products. Production costs have in the past, and could in the future, increase
at rates in excess of our annual inflation rate and impact our results of operation and can result in the restructuring of these operations at substantial
cost.
DRDGOLD have now come to an end. A three-year wage agreement was reached with organized labor at FWGR in November 2021 and wage
negotiations are currently under way at the ERGO operations after the previous extended agreement came to an end on June 30, 2022. A new wage
agreement was concluded after June 30, 2022.
reduce costs, such as reducing our reliance on Eskom’s grid through self-generation of power, for example through the Solar Power project at
Ergo, reducing our labor force, a reduction of the corporate overhead, negotiating lower price increases for consumables and cost controls may not
be successful or sufficient to offset the increases affecting our operations and could adversely affect our business, operating results and financial
condition.
operations
operations, but has manifested as a risk in terms of social stability as well as economic activity and growth both in South Africa and globally. The
national state of disaster imposed by the South African Government ended on April 4, 2022, which reduced the overall risk related to the pandemic.
We continue to monitor the risk related to the COVID-19 pandemic and have measures in place to react in the case that the COVID-19 pandemic
worsens.
impact of the COVID-19 pandemic. Dollar gold prices may decrease and the rand/dollar exchange rate may strengthen as the global impact of the
COVID-19 pandemic is alleviated.
The global economic environment, geopolitical tensions as well as inflationary pressures worldwide have highlighted the
interdependencies of supply chains. The risk of dependency on key suppliers requires ongoing focus and proactive management. The unavailability
of critical material such as reagents and critical equipment may affect production and operating costs resulting in loss of revenue. Delays in supplies,
freight costs and higher than inflationary increases for capital equipment are crucial elements for new projects.
Our operations are subject to extensive environmental regulations which could impose significant costs and liabilities.
12
state, provincial and local laws, which regulate air and water quality, hazardous waste management and environmental rehabilitation and
reclamation. Our mining and related activities have the potential to impact the environment, including land, habitat, streams and environment
near the mining sites. Failure to comply with environmental laws or delays in obtaining, or failures to obtain government permits and approvals
may adversely impact our operations. In addition, the regulatory environment in which we operate could change in ways that could substantially
increase costs of compliance, resulting in a material adverse effect on our profitability.
estimated our aggregate group Provision for Environmental Rehabilitation at a net present value of R517.7 million which is included in our
statement of financial position as at June 30, 2022 (Refer to Item 18. ‘‘Financial Statements - Note 11 – Provision for environmental rehabilitation”).
However, the ultimate amount of rehabilitation costs may in the future exceed the current estimates due to factors beyond our control, such as
changing legislation, higher than expected cost increases, or unidentified rehabilitation costs. We used to fund these environmental rehabilitation
costs by making contributions over the life of the mine to environmental trust funds or funds held in insurance instruments established for our
operations. During fiscal year 2022 we changed the method of provision to funds held in insurance products. If any of our operations are
prematurely closed, the rehabilitation funds may be insufficient to meet all the rehabilitation obligations of those operations. The closure of mining
operations, without sufficient financial provision for the funding of rehabilitation liabilities, or unacceptable damage to the environment, including
pollution or environmental degradation, may expose us and our directors to prosecution, litigation and potentially significant liabilities.
environmental liabilities.
Our tailings facilities are exposed to numerous risks and events, the occurrence of which may result in the failure, breach or damage of
such a facility. These may include sabotage, failure by our employees to adhere to the codes of practice and natural disasters such as excessive
rainfall and seismic events, any of which could force us to stop or limit operations. This is further impacted and expected to intensify with the
effects of climate change. In addition, the dams could overflow or a side wall could collapse and the health and safety of our employees and
communities living around these dams could be jeopardized. In the event of damage to our tailings facilities, our operations will be adversely
affected and this in turn could have a material adverse effect on our business, operating results and financial condition.
Due to the nature of our business, our operations face extensive health and safety risks and regulation of those risks.
Gold mining is exposed to numerous risks and events, the occurrence of which may result in the death of, or personal injury, to
employees. According to section 54 of the Mine, Health and Safety Act of 1996, if an inspector believes that any occurrence, practice or condition
at a mine endangers or may endanger the health or safety of any person at the mine, the inspector may give any instruction necessary to protect the
health or safety of persons at the mine. These instructions could include the suspension of operations at the whole or part of the mine. Health and
safety incidents could lead to mine operations being halted and that will increase our unit production costs, which could have a material adverse
effect on our business, operating results and financial condition.
insure or are not insured, including those in respect of past mining activities. Our existing property, business interruption and other insurance
contains certain exclusions and limitations on coverage. The insured value for property and loss of profits due to business interruption is R14.7
billion, with a total loss limit of R1 billion for Ergo and R650 million for FWGR for the 2023 fiscal year. Business interruption is only covered
from the time the loss occurs and is subject to time and amount deductibles that vary between categories. To cover legal liability to third parties
for damage, injury, illness or death a total of R1 billion insurance cover is in place for the 2023 fiscal year, subject to certain exclusions and
limitations on coverage.
related accidents, for which coverage is not available. If we are required to meet the costs of claims, which exceed our insurance coverage, this
could have a material adverse effect on our business, operating results and financial condition.
If we are unable to attract and retain key personnel our business may be harmed.
including the positions of Chief Executive Officer and Chief Financial Officer. In addition, we compete with mining and other companies on a
global basis to attract and retain key human resources at all levels with appropriate technical skills and operating and managerial experience
necessary to operate the business. Factors critical to retaining our present staff and attracting additional highly qualified personnel include our
ability to provide these individuals with competitive compensation arrangements, and other benefits. If we are not successful in retaining or
attracting highly qualified individuals in key management positions, our business may be harmed. We do not maintain “key man” life insurance
policies on any members of our executive team. The loss of any of our key personnel could delay the execution of our business plans, which may
result in decreased production, increased costs and decreased profitability.
We are subject to operational risks associated with our flotation and fine-grind (FFG) project.
13
additional revenues earned from additional gold extracted from the most recently integrated reclamation sites compared to the cost incurred to
operate the FFG circuit. The remaining components of the FFG continue to operate. Testing on the newly integrated material has suggested that
some of these halted components will only operate in subsequent years once the related reclamation sites have been brought online in accordance
with the current life of mine plan for ERGO. These halted components are classified as idle assets until they are brought back into operation as
described. The success of the FFG is directly dependent on the material type and material mix processed through it. Therefore, the halted
components will remain idle pending the continuation and conclusion of various test work regarding the material type and material mix of future
reclamation sites. Firm decisions have also not yet been made by the executive committee and the Board of Directors on the future of the FFG. We
remain subject to operations risks relating to the FFG project.
A disruption in our information technology systems, including incidents related to cyber security, could adversely affect our
business operations.
We rely on the accuracy, availability and security of our information technology systems. Despite the measures that we have
implemented, including those related to cyber security, our systems could be breached or damaged by computer viruses and systems attacks, natural
or man-made incidents, disasters or unauthorized physical or electronic access.
(including our proprietary technology), unauthorized access to, or disclosure of, personnel or supplier information, corruption of our data or of our
systems, reputational damage or litigation. We may also be required to incur significant cost to protect against or repair the damage caused by these
disruptions or security breaches in the future, including, for example, rebuilding internal systems, implementing additional threat protection
measures, defending against litigation, responding to regulatory inquiries or actions, paying damages, or taking other remedial steps with respect
to third parties.
preventative measures and we remain subject to additional known or unknown threats. In some instances, we may be unaware of an incident or its
magnitude and effects. We may be susceptible to new and emerging risks, including cyber-attacks and phishing, in the evolving landscape of
cybersecurity threats. Given the increasing sophistication and evolving nature of these threats, DRDGOLD cannot rule out the possibility of them
occurring in the future. An extended failure of critical system components, caused by accidental, or malicious actions, including those resulting
from a cyber security attack, could result in a significant environmental incident, commercial loss or interruption to operations.
our information technology systems. Information technology system disruptions, if not appropriately addressed or mitigated, could have a material
adverse effect on our operations.
Risks related to the gold mining industry
Historically, the gold price has fluctuated widely and is affected by numerous industry factors over which we have no control including:
• a significant amount of above-ground gold in the world that is used for trading by investors;
• the physical supply of gold from world-wide production and scrap sales, and the purchase, sale or divestment by central banks of their gold
holdings;
• the demand for gold for investment purposes, industrial and commercial use, and in the manufacturing of jewelry;
• speculative trading activities in gold;
• the overall level of forward sales by other gold producers;
• the overall level and cost of production of other gold producers;
• international or regional political and economic events or trends;
• the strength of the dollar (the currency in which gold prices generally are quoted) and of other currencies;
• financial market expectations regarding the rate of inflation;
• interest rates;
• gold hedging and de-hedging by gold producers; and
• actual or expected gold sales by central banks and the International Monetary Fund.
During fiscal year 2022 the gold price reached a high of U$2,070 per ounce and a low of U$1,684. We benefited from a sustained high
gold price due to slow global economic recovery, economic uncertainty and geopolitical tensions.
sustained high gold price for fiscal 2022 after the highs experienced in fiscal 2021. The rand/dollar exchange rate remained volatile throughout
fiscal 2022 mainly as a result of economic uncertainty and perceived political instability, increase of interest rates by the US Federal Reserve as
they attempt to reduce inflation, global market slowdown sentiment, Ukraine conflict, tensions between the USA and China, low economic growth
and increased load shedding from Eskom as it struggles to keep up with demand., and a continually distressed Eskom. Further volatility in the
Rand was fueled by Moody’s upgrading of South Africa’s sovereign credit rating to stable after the rating was downgraded to sub-investment
grade in fiscal 2021.
14
profitability may be negatively impacted by a decline in the gold price as we incur losses when revenue from gold sales drops below the cost of
production for an extended period.
unproductive.
quantify the extent of the gold reserve. Many gold exploration programs, including some of ours, do not result in the discovery of mineralization
and any mineralization discovered may not be of sufficient quantity or quality to be mined profitably. If we discover a viable deposit, it usually
takes several years from the initial phases of exploration until production is possible. During this time, the economic feasibility of production
may change.
to commence or continue mining. These estimates generally rely on scientific and economic assumptions, which in some instances may not be
correct, and could result in the expenditure of substantial amounts of money on a deposit before it can be determined with any degree of
accuracy whether the deposit contains economically recoverable mineralization. Uncertainties as to the metallurgical recovery of any gold
discovered may not warrant mining based on available technology.
and results of our continued exploration and development programs. Our business focuses mainly on the extraction of gold from tailings, which
is a volume driven exercise. Only significant deposits within proximity of services and infrastructure that contain adequate gold content to
justify the significant capital investment associated with plant, reclamation and deposition infrastructure are suitable for exploitation in terms
of our model. There is a limited supply of these deposits which may inhibit exploration and developments, especially in a declining gold price
environment.
Reserves in sufficient quantities to justify commercial operations in any of our operations. The costs incurred on exploration activities that do
not identify commercially exploitable reserves of gold are not likely to be recovered and therefore are likely to be impaired.
There is inherent uncertainty in Mineral Reserves and Mineral Resources estimates.
of the dates stated and are reported in accordance with the requirements of the SEC’s Regulation S-K (Subpart 1300). These estimates may not
reflect actual Mineral Reserves and Mineral Resources or future production.
reserve estimates may have to be adjusted and mining plans may have to be altered in a way that might ultimately cause our reserve estimates to
decline. Moreover, if the rand price of gold declines, or stabilizes at a price that is lower than recent levels, or those assumed in our mining plans,
or if our labor, water, steel, electricity and other production costs increase or recovery rates decrease, it may become uneconomical to recover
Mineral Reserves and Mineral Resources, particularly those containing relatively lower grades of mineralization. Under these circumstances, we
would be required to re-evaluate our Mineral Reserves and Mineral Resources. Short-term operating factors relating to the ability to reclaim our
Mineral Reserves, at the required rate, such as an interruption or reduction in the supply of electricity, limited deposition capacity or a shortage of
water may have the effect that we are unable to achieve critical mass, which may render the recovery of Mineral Reserve, or parts of the Mineral
Reserve no longer feasible, which could negatively affect production rate and costs and decrease our profitability during any given period. Estimates
of Mineral Reserves and Mineral Resources are based on drilling results and because unforeseen conditions may occur in these mine dumps that
may not have been identified by the drilling results, the actual results may vary from the initial estimates. These factors have in the past and could
in the future result in reductions in our Mineral Reserves and Mineral Resources estimates and as a result, our production, which could in turn
adversely impact the total value of our mining asset base and our business, operating results and financial condition.
Gold mining is susceptible to numerous events that could have an adverse impact on a gold mining business.
injury to employees, the loss of mining and reclamation equipment, damage to or destruction of mineral properties or production facilities,
monetary losses, delays in production, environmental damage, loss of the license to mine and potential legal claims. The risks and events
associated with the business of gold mining include:
●
environmental hazards and pollution, including dust generation, toxic chemicals, discharge of metals, pollutants, radioactive materials
and other hazardous material into the air and water;
●
flooding, landslides, sinkhole formation, ground subsidence, ground and surface water pollution and waterway contamination;
●
a decrease in labor productivity due to labor disruptions, work stoppages, disease, slowdowns or labor strikes;
●
unexpected decline of ore grade;
●
metallurgical conditions or lower than expected gold recovery;
●
failure of unproven or evolving technologies;
●
mechanical failure or breakdowns and ageing infrastructure;
●
energy and electrical power supply interruptions;
●
availability of water;
15
●
injuries to employees or fatalities due to falls from heights and accidents relating to mobile machinery or electrocution or other causes;
●
activities of illegal or artisanal miners;
●
material and equipment availability;
●
legal and regulatory restrictions and changes to such restrictions;
●
social or community disputes or interventions;
●
accidents caused from the collapse of tailings dams;
●
pipeline failures and spillages;
●
safety-related stoppages; and
●
corruption, fraud and theft including gold bullion theft.
The occurrence of any of these hazards could delay production, result in losses, or increase production costs or decrease earnings and
may result in significant legal claims and adversely impact our business results of operations and financial condition.
Risks related to doing business in South Africa
to South Africa could have a significant effect on our production and profitability. Large parts of the South African population are unemployed
and do not have access to adequate education, health care, housing and other services, including water and electricity. Government policies aimed
at alleviating and redressing the disadvantages suffered by most citizens under previous governments may increase our costs and reduce our
profitability. In recent years, South Africa has experienced high levels of crime. These problems may impede fixed inward investment into South
Africa and increase emigration of skilled workers and as a result, we may have difficulties retaining qualified employees.
protests and conflict, in our surrounding communities already created from a growing frustration of society at large on slow reformative action
being taken by all spheres of the South African government, specifically, in combating unemployment particularly in the youth of the country.
This frustration was a contributing factor that led to social unrest, people committing crimes, vandalising property, and damaging infrastructure
during July 2021. A prolonged economic downturn could result in an extended period of high unemployment, further exacerbating anti-mining
sentiments in South Africa. Furthermore, the rise of ESG factors, such as electricity usage, social unrest, social license to operate, climate change,
water usage and environmental stewardship, in investment decisions may result in divestment in the mining sector.
Inflation can adversely affect us.
world are currently facing inflation challenges. As of June 30, 2022, the annual Consumer Price Inflation Index (“
CPI
”), stood at 7.4% compared
to 4.9% in June 2021 and 2.2% in June 2020. Annual CPI was 7.5% as at September 30, 2022. Inflation in South Africa generally results in an
increase in our rand operational costs. Higher and sustained inflation in the future, with a consequent increase in operational costs could have a
material adverse effect on our results of operations and our financial condition and could result in operations being discontinued or reduced or
rationalized, which could reduce our profitability.
adverse effect on the results of our operations and our financial condition.
We may be subject to claims relating to occupational health diseases and we are currently subject to legal action described below.
In January 2013, DRDGOLD, East Rand Proprietary Mines Limited (“
DRDGOLD Respondents
”) and 23 other mining companies
(“
Other Respondents
”) (collectively referred to as "
Respondents
") were served with a court application issued in the High Court of South Africa
for a class certification on behalf of former mineworkers and dependents of deceased mineworkers (“
Applicants
”). In the application the
Applicants allege that the Respondents conducted underground mining operations in a negligent and complicit manner causing the former
mineworkers to contract occupational lung diseases. The Applicants have as yet not quantified the amounts which they are demanding from the
Respondents in damages.
On May 3, 2018, former mineworkers and dependents of deceased mineworkers (“
Applicants
”) and Anglo American South Africa
Limited, AngloGold Ashanti Limited, Sibanye Gold Limited trading as Sibanye-Stillwater, Harmony Gold Mining Company Limited, Gold Fields
Limited, African Rainbow Minerals Limited and certain of their affiliates (“
Settling Companies
”) settled the class certification application in
which the Applicants in each sought to certify class actions against gold mining houses cited therein on behalf of mineworkers who had worked
for any of the particular respondents and who suffer from any occupational lung disease, including silicosis or tuberculosis.
The DRDGOLD Respondents, are not a party to the settlement between the Applicants and Settling Companies. The dispute, insofar as
the class certification application and appeal thereof is concerned, still stands and has not terminated in light of the settlement agreement (refer to
Item 18. “Financial Statements - Note 26 – Contingencies”).
An adverse judgment in the claim described above or any other claim could have an adverse impact on us.
16
plants or high-grade gold bearing material. These incidents were very well organised and in all the incidents the thieves were armed. In some of
the incidents employees of companies were also held hostage until the targeted material was obtained. In the 2019 incident, a security officer was
fatally injured.
business, financial results or condition.
of copper cables and pipelines. Our operations experience high incidents of copper cable theft and pipelines despite the implementation of enhanced
security measures which have increased our security spend. At times, the incidences have resulted in serious injuries of our security personnel. In
addition to the general risk to employees’ lives in an area where theft occurs, we may suffer production losses and incur additional costs as a result
of power interruptions caused by cable theft and theft of bolts used for the pipeline.
Power stoppages or shortages or increases in the cost of power could negatively affect our results and financial condition.
Our mining operations are dependent on electrical power supplied by Eskom, South Africa’s state-owned utility company. As a result
of insufficient generating capacity, owing to poor maintenance and lagging capital infrastructure investment, South Africa has faced significant
disruptions in electricity supply in the past and Eskom has warned that the country could continue to face disruptions in electrical power supply in
the foreseeable future. Loadshedding has intensified over the past year.
The security of future power supply as well as the cost thereof remains a risk and may have major implications for our operations, which
may result in significant production losses. The country’s current reserve capacity may be insufficient and the risk of electricity stoppages is
expected to continue for the foreseeable future. Supply interruptions because of this as well as an aging and poorly maintained distribution grid
may pose a significant risk to the operations.
and 20% when the grid is under pressure, but Eskom maintains uninterrupted power supply to the operations.
NERSA
”) for a 32% increase in tariffs for 2023, a request that
has been met by strong push from business and society. These increases have had an adverse effect on our production costs and similar or higher
future increases could have a material adverse effect on our operating results and financial condition.
independent grid operator and open competition for energy generation at lower cost to the consumer. While full state ownership will be maintained,
the unbundling is expected to result in the separation of Eskom’s generation, transmission and distribution functions into separate entities, which
may require legislative and/or policy reform. The unbundling is expected to be completed by December 2022 for the generation and distribution
functions. Poor reliability of the supply of electricity and instability in prices through the unbundling process is expected to continue. Eskom’s coal
fired power plants have not performed well for a number of years, with national rotational power cuts (load shedding) having been implemented
intermittently through the last number of fiscal years. Should we experience further power tariff increases, our business operating results and
financial condition may be adversely impacted.
risks in the development of this plant as such plant may not be completed within expected timeframe or budget and may not reduce our
dependence on Eskom as expected.
Ergo is currently disputing the electricity tariff charged by Ekurhuleni Metropolitan Municipality (refer to Item 18. “Financial
Statements - Note 24 – Payments made under protest”).
Risks related to climate change
Extreme weather
As a result of climate change, our operations are exposed to severe weather events that has in the past and could interrupt production.
Major property, infrastructure and/or environmental damage as well as loss of human life could be caused by extreme weather events. Extreme
weather conditions such as droughts, extreme rainfall and high wind volumes are on the increase. Specifically, we have experienced an increase in
intensity of events, such as thunderstorms on the Highveld, where our operations are situated. It is believed that the long-term upward trend in
global temperature is directly correlated with the increase in global severe weather events both in terms of magnitude and frequency.
17
water restrictions remain in place as at September 30, 2022. Severe thunderstorms and high winds, especially during the summer rainy season,
may also cause damage to operation infrastructure that may in turn cause an interruption in the production of gold. Such incidents and other
weather events may damage the facility and may result in water shortages which can impact our operations and cause the interruption of deposition
and gold production until the facility is repaired or alternative deposition is brought online.
Scarcity of water may negatively affect our operations.
South Africa is a relatively dry area and predictions are that dry conditions will escalate. South Africa faces water shortages, which may
lead to the revision of water usage strategies by several sectors in the South African economy, including electricity generation and municipalities.
This may result in rationing or increased water costs. Such changes would adversely impact our surface retreatment operations, which use water
to transport the slimes or sand from reclaimed areas to the processing plant and to the tailings facilities. In addition, as our gold plants and piping
infrastructure were designed to carry certain minimum throughputs, any reductions in the volumes of available water may require us to adjust
production at these operations.
DRDGOLD invested R22 million in the construction of a filtration plant at the Rondebult Waste Water Works (operated by the East
Rand Water Care Company) to treat sewage water to reduce the use of potable water. This water is used both to reclaim and carry production
materials and also, ultimately, to irrigate rehabilitation vegetation at a significantly lower cost than that of potable water. The plant was
commissioned in early fiscal year 2016 and has design capacity to provide Ergo with 10 Mega Litres (“
Ml
”) a day from the Rondebult sewage
treatment facility. However, due to the deterioration of the local government authorities’ infrastructure, the expected quantity of sewerage is not
reaching the treatment facility and as a result Ergo is still not able to extract the full design capacity of 10 Ml of water a day. It is not certain if and
when the flow of sewerage will reach expected levels.
These measures may not be sufficient to alleviate the water scarcity issues we face.
Risks related to government regulation
administrative bodies. These involve directives in respect of health and safety, the mining and exploration of minerals and managing the impact of
mining operations on the environment. A variety of permits and authorities are required to mine lawfully, and the government enforces its
regulations through the various government departments. Lack of communication between government and regulators as well as ineffective
regulators remains an issue that may increase the cost of compliance and obtaining permits. The formulation or implementation of government
policies may be discretionary and unpredictable on certain issues, including changes in conditions for the issuance of licenses insofar as social
and labor plans are concerned, transformation of the workplace, laws relating to mineral rights, ownership of mining assets and the rights to
prospect and mine, additional taxes on the mining industry and in extreme cases, nationalization. A change in regulatory or government policies
could adversely affect our business.
operations.
(Administration), No.29 of 2008 govern royalty rates for gold mining in South Africa. These acts provide for the payment of a royalty, calculated
through a royalty rate formula (using rates of between 0.5% and 5.0%) applied against gross revenue per year, payable half yearly with a third and
final payment thereafter. The royalty is tax deductible and the cost after tax amounts to a rate of between 0.33% and 3.3% at the prevailing marginal
tax rates applicable to the taxed entity. The royalty is payable on old unconverted mining rights and new converted mining rights. Based on a legal
opinion the Company obtained, mine dumps created before the enactment of the Mineral and Petroleum Resources Development Act
(“
MPRDA
”) fall outside the ambit of this royalty and consequently the Company does not pay any royalty on any dumps created prior to the
MPRDA. Introduction of further revenue based royalties or any adverse future tax reforms could have an adverse effect on our business, operating
results and financial condition.
Failure to comply with the requirements of the Broad Based Socio-Economic Empowerment Charter 2018 could have an adverse
effect on our business, operating results and financial condition of our operations.
regarding the “once empowered always empowered” principle. This principle refers to whether a mining company, after the exit of a Black partner
that held a stake in the company consequent to a result of a Black Economic Empowerment (“
BEE
”) transaction, continues to be BEE compliant.
The judgment was appealed by the DMRE. The DMRE in August 2020, withdrew their notice to appeal to the Supreme Court of Appeal in respect
of the judgment issued in April 2018 by the Pretoria High Court.
Mining
Charter 2018
”) was published in Government Gazette No. 41934 of Government Notice No. 639 on September 27, 2018 superseding and
replacing all previous charters, including the Reviewed Broad-Based Black Economic Empowerment Charter for the South African Mining and
Minerals Industry, 2016 (“
Mining Charter III
”).
18
inter alia
, an enduring 30% BEE interest in respect of new mining rights. It also has extensive provisions
in respect of Historically Disadvantaged Persons (“
HDP
”) representation at board and management, as well provisions relating to local
procurement of goods and services. The procurement target of the total spend on services from South African companies has been pegged at 80%
(up from 70% in Mining Charter III) and 60% of the aggregate spend thereof must be apportioned to BEE entrepreneurs.
setting aside of certain provisions in Mining Charter 2018.
as a prerequisite to the continuation of the lawsuit, as they have a direct and substantial interest in the outcome of the litigation.
instrument of policy. This ruling affirmed that the Minister of Mineral Resources and Energy (“
MRE Minister
”) was not entitled to make law
through the Mining Charter 2018 to require 30% HDP ownership for the renewal of existing mining rights. The MRE Minister confirmed that they
will not appeal the ruling.
2018 were to remain in its current form, there is no assurance that the goods, services and supplies in South Africa would be sufficient to allow us
to meet the targets. More specifically, DRDGOLD may not be able to meet the requirement that 80% of total mining goods and services
procurement spend be on South African-manufactured goods due to an insufficient number of suppliers in South Africa with heavy equipment.
DRDGOLD may be required to increase participation by HDP in senior positions and allocate additional resources for the development of the
mine community, human resources, sustainability, procurement and enterprise. DRDGOLD may also be required to make further adjustment to
the ownership structure of its South African mining assets, including increasing the ownership of HDP, in order to meet the Mining Charter 2018
requirements. Any such additional measures could have a material adverse effect on our business, operating results and/or financial condition.
sufficient succession plans in place, this could have a material adverse effect on our business (including resulting in the imposition of fines and
having a negative effect on production levels), operating results and financial position. In relation to this, the mining industry, including
DRDGOLD, continues to experience a global shortage of qualified senior management and technically skilled employees. DRDGOLD may be
unable to hire or retain appropriate senior management, technically skilled employees or other management personnel, or may have to pay higher
levels of remuneration than it currently intends in order to do so.
existing mining rights, the successful renewal of its existing mining rights, the granting of applications for new mining rights or that the terms
of renewals of its mining rights would not be significantly less favourable than the terms of its current mining rights. Any further adjustment
to the ownership structure of DRDGOLD’s South African mining assets in order to meet the abovementioned requirements could have a
material adverse effect on the value of DRDGOLD’s securities
Empowerment Charter.
Government policies in South Africa may adversely impact our operations and profits related to financial provisioning for
rehabilitation.
impact on the Group's estimated financial provisions for environmental remediation and management due to the proposed inclusion of historic and
old mine dumps in the definition of “residue stockpiles” as well as the extension of the liability for rehabilitation beyond the issuance of a closure
certificate and the requirement to maintain financial provision for closed sites within a period of 20 years after a site is closed. The MPRDA
Amendment Bill was withdrawn in August 2018 by the MRE Minister, citing, amongst other things, the adequacy of the current MPRDA to deal
with all regulatory matter pertaining to the mining and petroleum industries.
FPR
”) were published on November 20, 2015, under the National Environmental
Management Act, 107 of 1998 (“
NEMA
”) and became effective from the date of publication thereof. Proposed amendments to the FPRs were
published for public comment GNR 1228 GG 41236 of November 10, 2017 (“
Draft Regulations
”), which seek to address some challenges relating
to the implementation thereof. Under these FRPs to be implemented by the DMRE, existing environmental rehabilitation trust funds may only be
used for post closure activities and may no longer be utilised for their intended purpose of concurrent and final rehabilitation and closure.
Proposed Amendments
”) were published subsequently. The latest Proposed
Amendments were published in July 2022 which,
inter alia
, extends the compliance with these regulations to three months following the fiscal
year end June 30, 2023.
certain circumstances for the withdrawal against financial provision (which is currently not contemplated in the FPR). It is therefore uncertain
whether these provisions relating to withdrawal will remain in their current form, or at all.
Rehabilitation.
19
The implementation of Carbon Tax effective from June 1, 2019 may have a direct or indirect material adverse effect on our
business, operating results and financial condition.
and will be implemented across phases. The first phase will run from June 1, 2019 to December 31, 2022 and is applicable to scope 1 emitters.
The First phase did not have a material financial impact on the Group. The second phase will be implemented from January 1, 2023 to December
31, 2030. During the first phase, tax-free emission allowances ranging from 60 per cent to 95 per cent are available to emitters in this first phase.
This includes a basic tax-free allowance of 60 per cent for all activities, a 10 per cent process and fugitive emissions allowance, a maximum 10 per
cent allowance for companies that use carbon offsets to reduce their tax liability, a performance allowance of up to 5 per cent for companies that
reduce the emissions intensity of their activities, a 5 per cent carbon budget allowance for complying with the reporting requirements and a
maximum 10 per cent allowance for trade exposed sectors. The South African government indicated that a review of the impact of the carbon tax
will be conducted before the second phase of the South African Carbon Tax Act is implemented.
The draft explanatory memorandum of the Taxation Laws Amendment Bill proposes that amendment to section 5(2) of the Carbon
Tax Act to provide for the carbon tax rate adjustment by US$1, US$2 and US$3/ t CO2e for 2023, 2024 and 2025 tax period ending on 31
December using the average exchange rate as defined in the Income Tax Act. The rate will thereafter increase gradually to US$20t CO2e in
2026 and at least to US$30/t CO2e in 2030. Currently under phase 1 an amount of R120/t CO2e is levied. Although the decarbonization of
electricity as an energy supply must nevertheless be prioritized by both the country and industries at large to de-carbonize the economy, the
increased proposed rates denominated to US Dollar is expected to have an adverse impact on business.
The carbon tax has not had an impact on the price of electricity. However, should Eskom be required to pass on the cost of the tax from its emissions
to its customers, electricity tariffs may rise significantly. This may also affect the electricity prices charged to our suppliers who may pass on the
tax to us increasing the price of goods and services we consume in our operation.
implementation of the Carbon Tax may have a material direct and/or indirect adverse effect on our business, operating results and financial
condition if the tax-free emission allowances are significantly reduced or the scope of implementation of the CTA is significantly increased. In
addition, the potential increases in costs resulting from suppliers passing through their Carbon Tax exposure to the Company may have a direct or
indirect material adverse effect on our business, operating results and financial condition.
operating results and financial condition of our operations.
mines regarding the deduction of certain capital expenditure and the carry over to subsequent years. After the restructuring of the surface operations,
effective July 1, 2012, Ergo is treated as one taxpaying operation pursuant to the relevant ring-fencing legislation. It is expected that FWGR will
also be treated as one taxpaying operation pursuant to the relevant ring-fencing legislation. In the event that we are unsuccessful in confirming our
position or should the South African Revenue Service have a different interpretation of section 36 of the ITA, it could have an adverse effect on
our business, operating results and financial condition.
could have an adverse effect on the business, operating results and financial condition of our operations.
expenditure allowances applicable to taxpayers conducting mining operations to only those taxpayers that hold “
a mining right as defined in section
1 of the Mineral and Petroleum Resources Development Act in respect of the mine where those mining operations are carried on
”. In addition, in
relation to section 36 of the ITA, the National Treasury has proposed an amendment to the heading in order to limit the application of the provisions
in respect of the calculation of the redemption allowance and balance of unredeemed capital expenditure, to certain mining operations. The
proposed amendment will come into operation on March 31, 2023 and apply in respect of years of assessment ending on or after that date.
required to hold a mining right in terms of the MPRDA. The proposed requirement by the ITA to require a miner to hold a mining right in terms
of the MPRDA will preclude DRDGOLD from claiming accelerated capital expenditure allowances in terms of sections 15 and 36 of the ITA.
material adverse effect on our cash flows, operations, capital investment decisions and financial condition.
operating results and financial condition of our operations.
SARS
”) assesses capital expenditure when it is redeemed against taxable mining income rather
than when it is incurred. A different interpretation by SARS could have an adverse effect on our business, operating results and financial condition.
new South African labor laws.
20
our Ergo operations provided full-time employment for 763 employees while our main service providers deployed an additional 1,677 employees
to our operations, of whom approximately 85% are members of trade unions or employee associations.
2022, our FWGR operations provided full-time employment for 152 employees while our main service providers deployed an additional 339
employees to our operations, of whom approximately 82% are members of trade unions or employee associations. We have entered into various
agreements regulating wages and working conditions at our mines. Unreasonable wage demands could increase production costs to levels where
our operations are no longer profitable. This could lead to accelerated mine closures and labor disruptions. We are also susceptible to strikes by
workers from time to time, which result in disruptions to our mining operations.
for mandatory compensation in the event of termination of employment for operational reasons and that impose large monetary penalties for non-
compliance with the administrative and reporting requirements of affirmative action policies could result in significant costs to us. In addition,
future South African legislation and regulations relating to labor may further increase our costs or alter our relationship with our employees. Labor
cost increases could have an adverse effect on our business, operating results and financial condition.
Labor unrest could affect production.
bars are smelted at Sibanye’s Driefontein plant. This resulted in Ergo having to smelt FWGR gold on their behalf. Such events at our operations
or at our reclamation sites has in the past and could in future have an adverse effect on our business, operating results and financial condition.
4 TSF. Any labor unrest or other significant issue at this third party service provider may impact the operation of this facility.
Strike action and intimidation at mining operations adjacent to our FWGR mining operations could have an adverse effect on our
business, operating results and financial condition.
South African law provides for exchange control regulations, which restrict the export of capital from South Africa, the Republic of
Namibia, and the Kingdoms of Lesotho and Eswatini, known collectively as the Common Monetary Area (the “
CMA
”). The Exchange Control
Department of the South African Reserve Bank, or SARB, is responsible for the administration of exchange control regulations. In particular,
South African companies:
●
are generally not permitted to export capital from South Africa or to hold foreign currency without the approval of the SARB;
●
are generally required to repatriate, to South Africa, profits of foreign operations; and
●
are limited in their ability to utilize profits of one foreign business to finance operations of a different foreign business.
restrictions on their ability to deploy capital outside of the CMA and it is difficult to predict whether such relaxation of controls will continue
in the future. As a result, DRDGOLD’s ability to raise and deploy capital outside the CMA is restricted. These restrictions could hinder
DRDGOLD’s financial and strategic flexibility, particularly its ability to fund acquisitions, capital expenditures and exploration projects
outside South Africa. For further information see Item 10D. Exchange Controls.
We could be adversely affected by violations of the U.S. Foreign Corrupt Practices Act and similar anti-bribery laws outside of
the United States.
and their intermediaries from making improper payments to government officials or other persons for the purpose of obtaining or retaining business.
This includes aggressive investigations and enforcement proceedings by both the U.S. Department of Justice and the SEC, increased enforcement
activity by non- U.S. regulators, and increases in criminal and civil proceedings brought against companies and individuals. Our policies mandate
compliance with the FCPA and other applicable anti-bribery laws. Our internal control policies and procedures may not protect us from reckless
or criminal acts committed by our employees, the employees of any of our businesses, or third party intermediaries. In the event that we believe or
have reason to believe that our employees or agents have or may have violated applicable anti-corruption laws, including the FCPA, we would
investigate or have outside counsel investigate the relevant facts and circumstances, which can be expensive and require significant time and
attention from senior management. Violations of these laws may result in criminal or civil sanctions, inability to do business with existing or future
business partners (either as a result of express prohibitions or to avoid the appearance of impropriety), injunctions against future conduct, profit
disgorgements, disqualifications from directly or indirectly engaging in certain types of businesses, the loss of business permits, reputational harm
or other restrictions which could disrupt our business and have a material adverse effect on our business, financial condition, results of operations
or liquidity.
21
the due diligence we perform in connection with an acquisition may not be sufficient to enable us fully to assess an acquired company’s historic
compliance with applicable regulations. Furthermore, as we make acquisitions such as the acquisition of FWGR, our post-acquisition integration
efforts may not be adequate to ensure our system of internal controls and procedures are fully adopted and adhered to by acquired entities, resulting
in increased risks of non-compliance with applicable anti-bribery laws.
Risks related to ownership of our ordinary shares or ADSs
actions based on securities laws of jurisdictions other than South Africa against us or against members of our board.
Our Company, certain members of our board of directors and executive officers are residents of South Africa. All our assets are
located outside the United States and a major portion with respect to the assets of members of our board of directors and executive officers are
either wholly or substantially located outside the United States. As a result, it may not be possible for you to effect service of legal process,
within the United States or elsewhere including in South Africa, upon most of our directors or officers, including matters arising under United
States federal securities laws or applicable United States state securities laws.
Moreover, it may not be possible for you to enforce against us or the members of our board of directors and executive officers’
judgments obtained in courts outside South Africa, including the United States, based on the civil liability provisions of the securities laws of
those countries, including those of the United States. A foreign judgment is not directly enforceable in South Africa, but constitutes a cause of
action which will be enforced by South African courts provided that:
●
the court which pronounced the judgment had jurisdiction to entertain the case according to the principles recognized by South African
law with reference to the jurisdiction of foreign courts;
●
the judgment is final and conclusive (that is, it cannot be altered by the court which pronounced it);
●
the judgment has not lapsed;
●
the recognition and enforcement of the judgment by South African courts would not be contrary to public policy, including observance
of the rules of natural justice which require that no award is enforceable unless the defendant was duly served with documents initiating
proceedings, that he was given a fair opportunity to be heard and that he enjoyed the right to be legally represented in a free and fair trial
before an impartial tribunal;
●
the judgment was not obtained by fraudulent means;
●
the judgment does not involve the enforcement of a penal or revenue law; and
●
the enforcement of the judgment is not otherwise precluded by the provisions of the Protection of Business Act, 1978 (as amended), of
South Africa.
is awarded. Although the award of punitive damages is generally unknown to the South African legal system that does not mean that such awards
are necessarily contrary to public policy. Whether a judgment was contrary to public policy depends on the facts of each case. Exorbitant,
unconscionable, or excessive awards will generally be contrary to public policy. South African courts cannot enter into the merits of a foreign
judgment and cannot act as a court of appeal or review over the foreign court. South African courts will usually implement their own procedural
laws and, where an action based on an international contract is brought before a South African court, the capacity of the parties to the contract will
usually be determined in accordance with South African law.
plaintiff who is not resident in South Africa may be required to provide security for costs in the event of proceedings being initiated in South
Africa. Furthermore, the Rules of the High Court of South Africa require that documents executed outside South Africa must be authenticated for
use in South African courts. It may not be possible therefore for an investor to seek to impose liability on us in a South African court arising
from a violation of United States federal securities laws.
Dividend withholding tax will reduce the amount of dividends received by beneficial owners.
On April 1, 2012, the South African Government replaced Secondary Tax on Companies (then 10%) with a 15% withholding tax on
dividends and other distributions payable to shareholders. The dividend withholding tax rate was increased to 20%, effective from February 22,
2017. The withholding tax reduces the amount of dividends or other distributions received by our shareholders. Any further increases in such tax
will further reduce net dividends received by our shareholders.
Your rights as a shareholder are governed by South African law, which differs in material respects from the rights of shareholders
under the laws of other jurisdictions.
Our Company is a public limited liability company incorporated under the laws of the Republic of South Africa. The rights of holders
of our ordinary shares, and therefore many of the rights of our ADS holders, are governed by our memorandum of incorporation and by South
African law. These rights differ in material respects from the rights of shareholders in companies incorporated elsewhere, such as in the United
States. In particular, South African law significantly limits the circumstances under which shareholders of South African companies may
institute litigation on behalf of a company.
Control by principal shareholders could adversely affect our other shareholders.
22
Sibanye-Stillwater beneficially owns 50.1% of our outstanding ordinary shares and voting power and has the ability to control, our
board of directors. Sibanye-Stillwater will continue to have control over our affairs for the foreseeable future, including with respect to the
election of directors, the consummation of significant corporate transactions, such as an amendment of our constitution, a merger or other sale
of our company or our assets, and all matters requiring shareholder approval. In certain circumstances, Sibanye-Stillwater’s interests as a
principal shareholder may conflict with the interests of our other shareholders and Sibanye-Stillwater’s ability to exercise control, or exert
significant influence, over us may have the effect of causing, delaying, or preventing changes or transactions that our other shareholders may
or may not deem to be in their best interests. In addition, any sale or expectation of sale of some or all the shares held by Sibanye-Stillwater
could have an adverse impact on our share price.
Sales of large volumes of our ordinary shares or ADSs or the perception that these sales may occur, could adversely affect the
prevailing market price of such securities.
The market price of our ordinary shares or ADSs could fall if substantial amounts of ordinary shares or ADSs are sold by our
stockholders, or there is the perception in the marketplace that such sales could occur. Current holders of our ordinary shares or ADSs may
decide to sell them at any time. Sales of our ordinary shares or ADSs, if substantial, or the perception that any such substantial sales may occur,
could exert downward pressure on the prevailing market prices for our ordinary shares or ADSs, causing their market prices to decline. Trading
activity of hedge funds and the ability to borrow script in the marketplace will increase trading volumes and may place our share price under
pressure.
ITEM 4. INFORMATION ON THE COMPANY
4A. HISTORY AND DEVELOPMENT OF THE COMPANY
Introduction
including exploration, extraction, processing and smelting.
On December 3, 2004, the company changed its name from Durban Roodepoort Deep Limited to DRDGOLD Limited. Our operations focus on
South Africa's Witwatersrand Basin, which has been a gold producing region for over 120 years.
JSE
”), and the New York Stock Exchange.
Building 17, Ground Floor, Weltevreden Park, 1709, South Africa. The postal address is P.O. Box 390, Maraisburg, 1700, South Africa. Our
telephone number is (+27 11) 470-2600 and our facsimile number is (+27 86) 524-3061. We are registered under the South African Companies
Act 71, 2008 under registration number 1895/000926/06. For our ADSs, the Bank of New York Mellon, at 101 Barclay Street, New York, NY
10286, United States, has been appointed as agent.
The SEC maintains an internet site that contains reports, proxy and information statements and other information regarding issuers that
file electronically with the SEC, which can be found at http://www.sec.gov. Our internet address is http://www.drdgold.com. The information
contained on our website is not incorporated by reference and does not form part of this annual report.
Our operations primarily consist of Ergo and FWGR. Our Ergo operations include the historic Crown operations (which were
restructured into Ergo during fiscal year 2012 and have substantially been rehabilitated as at the end of fiscal year 2018). East Rand Proprietary
Mines Limited's (“
ERPM
”) underground mining infrastructure was under care and maintenance up to this reporting date at which date the
decommissioning and rehabilitation of the last remining underground mining infrastructure was completed.
Ergo
Gold Recoveries Proprietary Limited (“
Crown
”), ERPM Cason Dump operation and the Ergo Gold business units. On July 1, 2012, Ergo
acquired the mining assets and certain liabilities of Crown and all the surface assets and liabilities of ERPM as part of the restructuring of our
surface operations.
projects may be obtained through specific financing arrangements if required.
Brakpan/Withok TSF final life design
in terms of extent, operation, rehabilitation and management. The implemented final design would result in alignments with the Global Industry
23
Standard on Tailings Management (“
GISTM
”) and regulatory bodies, increase deposition capacity, improve operation/management and bring
about the sustainable closure of the facility.
A legal review of the existing authorizations was undertaken for the final life design of the Brakpan/Withok TSF. The results indicated
that most of the current authorizations are sufficient. An updated application was submitted to the Department of Water Affairs and Sanitation
(“
DWAS
”) for which we are awaiting approval. Final designs for the final stage of the Brakpan/Withok TSF are being reviewed, in anticipation
of the DWAS approval. The Ergo life of mine has been increased to 19 years and the Daggafontein TSF classified as a Mineral Reserve.
For further information on other capital investments, divestures, capital expenditure and capital commitments, see Item 4D. Property,
Plant and Equipment, and Item 5B. Liquidity and Capital Resources.
FWGR
Kloof 1, Venterspost North and South, Libanon, Driefontein 4, Driefontein 2 plant, Driefontein 3 plant, WRTRP pilot plant, and the land
owned by Sibanye-Stillwater that was earmarked for the future development of a central processing plant, regional tailings storage facility and
return water dam (together, the “
WRTRP Assets
”) associated with Sibanye-Stillwater’s WRTRP, subsequently renamed FWGR. This
acquisition represented a significant increase in our assets, which impacted our results in fiscal 2019, 2020 and 2021. In connection with the
acquisition, we issued to Sibanye-Stillwater new shares equal to 38.05% of outstanding shares and granted Sibanye-Stillwater an option to
acquire up to a total of 50.1% of our shares within a period of 2 years from the effective date of the acquisition at a 10% discount to the prevailing
market value. On January 8, 2020, Sibanye-Stillwater exercised the option and on January 22, 2020 subscribed for 168,158,944 DRDGOLD
shares at an aggregate subscription price of R1,086 million, (R6.46 per DRDGOLD share).
The assets acquired are to be developed in two phases – Phase 1 and Phase 2.
FWGR Phase 1
Phase 1 involves the reclamation of the Driefontein 5 dump through a reconfigured Driefontein 2 plant and deposition onto the
Driefontein 4 tailings storage facility. The Driefontein 4 tailings storage facility was an upstream day-wall dam with a capacity of approximately
200,000 tonnes per month. In order to increase the deposition capacity to 500 000 tonnes per month, the conversion of this dam to cyclone
deposition commenced in fiscal year 2019. The conversion has been completed and this allows a deposition capacity of 500,000 tonnes per month
until at least the end of calendar year 2025.
Although the Phase 1 upgrade of the Driefontein 2 Plant was essentially complete by the end of fiscal year 2019, a decision was made
to bypass the mill so that further improvements to the mill liner configuration could be made. These modifications were successfully completed,
and the mill was recommissioned in September 2019. A further upgrade to convert the mill to closed circuit from the open circuit to improve the
grind of the material and yield more gold was completed in fiscal year 2021. A new thickener was commissioned in November 2021. The
conversion yielded better grind of material with a concomitant improvement in leaching conditions and gold recovery, lower maintenance costs
and increased water storage capacity in the current thickeners.
The material being reclaimed by FWGR contains high levels of copper which incurs penalty refining charges of between 1% and 5%
during final refining by Rand Refinery depending on the copper content of the bullion delivered. FWGR has been allocated 98% of its gold
production with 2% lost to these penalty refining charges due to the high levels of copper in the bullion delivered. To reduce these penalty refining
charges, FWGR constructed and commissioned a copper elution plant at a cost of approximately R12 million during fiscal year 2021. On average,
the plant resulted in an additional 1.2kg of gold per month which would otherwise have been lost due to penalty refining charges for the copper in
its bullion.
FWGR Phase 2 expansion
The Phase 2 project is a key project for us intended to extend potential resources in the West Rand.
Phase 2 initially included the construction of a new Central Processing Plant (“
CPP
”) with a capacity of between 1.2 to 2.4 million
tonnes per month and the equipping of the required reclamation sites and pipeline infrastructure to supply the relevant resources to the CPP.
The capital spent on final design work on the CPP, with the design work is also applicable to the potential expansion of DP2 from to 1.2 Mt as
an alternative to CPP is currently being considered.
Phase 2 also includes the construction of a new Regional Tailings Storage Facility (“
RTSF
”), that we believe is necessary in order to
develop our FWGR as envisaged by our management, the new RTSF is expected to be capable of processing 3 million tonnes per month with
a maximum capacity of approximately 800 million tonnes. Delays in obtaining regulatory approval have affected the previously reported
expected dates of the construction. The Sibanye-Stillwater Leeudoorn tailings storage facility was evaluated as a viable interim alternative to
the RTSF whilst regulatory approvals are obtained.
The Definitive Feasibility Study (“
DFS
”) for Phase 2 was completed in the 3rd quarter of fiscal year 2021 and that the project was found to be
economically viable in a number of scenarios.
24
We engaged an external consultant, Sound Mining (consultants to the mining industry specializing in surface and underground operations) to
perform an independent review of the available information and studies that have been performed regarding the Phase 2 expansion project.
These included:
●
DFS performed by DRA Global (“
DRA
”) (An engineering consulting company) regarding the construction of the CPP and related
pumping and pipeline infrastructure;
●
Detail design of a new Reginal Storage Facility (“
RTSF
”) performed by Beric Robinson (engineer of record) and related capital
costing performed by DRA;
●
Reviews of the explorations data base, Mineral Resource and Reserve estimates of FWGR assets and other future potential assets
such as battery metals, uranium and other gold West Rand metal resources;
●
Legal tenure, permitting, environmental and compliance status; and
●
Economic analysis of the projects.
Based on currently available information, the Company believes that there are no material technical or geo-metallurgical risks that
could significantly impact the production forecasts.
Risks associated with the Phase 2 project include obtaining regulatory approval of the amended design of the RTSF, which was
submitted to the DWA S. Delays in obtaining such regulatory approval may have an adverse impact on the project timeline and capital cost
estimate. We engaged the services of an external expert to assist us with engaging with the DWAS and these discussions are currently ongoing.
Presentations were conducted to provide the regulator with the technical and scientific reasons for the changes to the design of the RTSF. It is
anticipated that construction of the RTSF will commence in first half fiscal year 2027. The plant construction is anticipated to commence 6-9
months later.
Financing for significant growth projects may be obtained through specific financing arrangements if required. Capital expenditure
for FWGR Phase 1 was financed through our RCF (Refer to Item 18. “Financial Statements - Note 20 – Capital Management). Significant
financing is required for the Phase 2 expansion which is expected to be financed through a combination of cash resources, operational cash
flows and facilities as may be determined. Capital expenditure for other projects is mainly financed through operational cash flows and cash
resources.
We have commenced final design work on the CPP, with the design work also being applicable to the potential expansion of DP2.
FWGR has appointed DRA Global to perform the relevant function.
For further information on other capital investments, divestures, capital expenditure and capital commitments, see Item 4D. Property,
Plant and Equipment, and Item 5B. Liquidity and Capital Resources.
ERPM
2009. Underground mining at ERPM was halted in October 2008. On July 1, 2012, ERPM sold its surface mining assets and its 65% interest in
ErgoGold to Ergo in exchange for shares in Ergo as part of the restructuring of our surface operations.
Orotree
”).
The disposal of the underground mining and prospecting rights were concluded in the second half of the financial year ended June 30, 2019.
Orotree did not exercise an option to purchase the underground mining infrastructure.
the Far East Vertical Shaft.
Crown
operation in March 2017 and since then substantially rehabilitated.
4B. BUSINESS OVERVIEW
processing and smelting. Our surface tailings retreatment operations, including the requisite infrastructure and metallurgical processing plants,
are located in South Africa. Our operating footprint is unique in that it involves some of the largest concentration of gold tailings deposits in
the world, situated within the city boundaries of Johannesburg and its suburbs and the far west rand of the province of Gauteng.
Rand (far west of Johannesburg) businesses. The East Rand operations are run by Ergo and the West Rand operations by FWGR. A detailed
overview of the operations is provided under Item 4D. Property, Plant and Equipment and in the Technical Report Summary attached as exhibits
in this annual report.
25
DRDGOLD’s long-term goal to extract as much gold from its assets as possible, sustainable and economically viable. To a large
extent this depends on how effectively it continues to manage its capitals. DRDGOLD uses sustainable development to direct its strategic
thinking. We seek sustainable benefits in respect to financial, manufactured, natural, social and human capitals, each of which is essential to
our operations.
value-added increases in as many of the others as possible. We therefore seek to achieve an enduring and harmonious alignment between them,
and we pursue these criteria in the feasibility analysis of each investment. We intend to explore opportunities made possible by technology, which
could entail further investment in research and development (“
R&D
”) to improve gold recoveries even further over the long term.
Africa.
Description of Our Mining Business
Surface tailings retreatment
earlier underground gold mining activities. This is done by reprocessing sand dumps and slimes dams. Sand dumps are the result of the less efficient
stamp-milling process employed in earlier times. They consist of coarse-grained particles which generally contain higher quantities of gold. Sand
dumps are reclaimed mechanically using front end loaders that load sand onto conveyor belts. The sand is fed onto a screen where water is added
to wash the sand into a sump, from where it is pumped to the plant. Most sand dumps have already been retreated using more efficient milling
methods. Lower grade slimes dams were the product of the “tube and ball mill” recovery process. The economic viability of processing this material
has improved due to improved treatment methods such as the treatment of large volumes of this material. The material from the slimes dams is
broken down using monitor guns that spray jets of high pressure water at the target area. The resulting slurry is then pumped to a treatment plant
for processing.
Exploration
and at undeveloped sites. Once a potential site has been identified, exploration is extended and intensified in order to enable clearer definition of
the site and the portions with the potential to be mined. Geological techniques are constantly refined to improve the economic viability of
exploration and exploitation.
Our Metallurgical Plants and Processes
Gold Market
for gold is primarily for manufacturing purposes, and gold is traded on a world-wide basis. Refined gold has a variety of uses, including jewelry,
electronics, dentistry, decorations, medals and official coins. In addition, central banks, financial institutions and private individuals buy, sell and
hold gold bullion as an investment and as a store of value.
The use of gold as a store of value and the large quantities of gold held for this purpose in relation to annual mine production have meant
that historically the potential total supply of gold has been far greater than demand. Thus, while current supply and demand play some part in
determining the price of gold, this does not occur to the same extent as in the case of other commodities. Instead, the gold price has from time to
time been significantly affected by macro-economic factors such as expectations of inflation, interest rates, exchange rates, changes in reserve
policy by central banks and global or regional political and economic crises. In times of inflation and currency devaluation or economic uncertainty
gold is often seen as a safe haven, leading to increased purchases of gold and support for its price.
In the wake of the COVID-19 pandemic and measures taken to address the outbreak, there has been a global trend of investors turning
to gold and gold stocks as a safe haven asset, as has been the case in previous times of global economic crisis. This has led to a surge in the average
gold price during fiscal year 2020 and fiscal year 2021. Although the impact of the COVID-19 pandemic has reduced and gold prices have
marginally decreased, the average gold price for fiscal year 2022 remained high due to continued economic uncertainty as the global economies
attempt to recover from all the after effects of COVID-19, and deal with the conflict in Ukraine and rapidly rising inflation. In addition, we were
impacted by movements in the exchange rate of the rand against the dollar during described below.
We generally take full exposure to the US dollar spot price of gold and rand/dollar exchange rate. The higher the gold price, the higher
our profit margin and
vice versa,
subject to exchange rate fluctuations.
The average gold spot price decreased by 1% from $1,850 per ounce to $1,834 per ounce during fiscal year 2022 after having increased
by 18% from $1,562 per ounce to $1,850 per ounce during the fiscal year 2021 and having increased by 24% from $1,263 per ounce to $1,562
per ounce during the fiscal year 2020. As a result, the average gold price received by us in Rands for fiscal year 2022 decreased by 3% to R894,409
per kg compared to the previous year at R917,996 per kg and for fiscal year 2021 increased by 19% to R917,996 per kg compared to the previous
26
year at R768,675 per kg. The decrease in the gold price received contributed to a 3% decrease in our total revenue for fiscal year 2022 amounting
to R5,118.5 million (2021: R5,269.0 million and 2020: R4,185.0 million). All our revenue is generated from our operations in South Africa.
volatility and the oversupply of foreign currency, will continue to make gold attractive to investors. The supply of gold has shrunk in recent years
and is likely to shrink even more due to the significantly reduced capital expenditure and development occurring in the sector. We believe that
this, coupled with global economic uncertainty, is likely to provide support to the gold price in the long term.
with a refining agreement entered into in October 2001 and updated in July 2018. The sales price was fixed at the London afternoon fixed dollar
price on the day the gold was delivered to the buyer. Before November 2020, the dollar proceeds sold were remitted to us within two days at which
date the dollars were sold. Since November 2020 up to April 11, 2022, the dollars are also sold on the day the gold is delivered to the buyer. After
April 11, 2022, gold is sold directly to South African Bullion banks after being refined to the required purity by Rand Refinery. The Group
recognizes revenue from the sale of gold at a point in time when the gold is delivered to the South African Bullion bank on an agreed upon date,
gold price and exchange rate. The gold bars which we produce consist of approximately 85% gold, 7-8% silver and the remaining balance comprises
copper and other common elements. The gold bars are sent to Rand Refinery for assaying and final refining where the gold is purified to 99.9%
and cast into troy ounce bars of varying weights. In exchange for this service, we pay Rand Refinery a variable refining fee and administration fees
and up to April 11, 2022, a fixed marketing charge. We own 11.3% (fiscal year 2021 and 2020: 11.3%) of Rand Refinery.
Governmental regulations and their effects on our business
Common Law Mineral Rights and Statutory Mining Rights
in South Africa could be acquired through the common law or by statute. With effect from May 1, 2004, all minerals have been placed under the
custodianship of the South African government under the provisions of the MPRDA and old order proprietary rights were required to be converted
to new order rights of use within certain prescribed periods, as dealt with in more detail below. Mine dumps created before the MPRDA became
law fall outside the MPRDA and do not require a mining license to be processed nor do they require the extensive rehabilitation and closure
guarantees that are a feature of the MPRDA. Many of the activities to re-process a mine dump do fall under the provisions of the National
Environmental Management Act though, which requires at it most basic the compilation and submission of an Environmental Impact Assessment.
Conversion and renewal of Rights under the Mineral and Petroleum Resources Development Act, 2002
rights existed at the time of the enactment of the MPRDA. In respect of used old order mining rights, the DMRE is obliged to convert the rights if
the applicant complies with certain statutory criteria. These include the submission of a mining works program, demonstrable technical and
financial capability to give effect to the program, provision for environmental management and rehabilitation, and compliance with certain black
economic empowerment criteria and a social and labor plan. These applications had to be submitted within five years after the promulgation of the
MPRDA on May 1, 2004. Similar procedures apply where we hold prospecting rights and a prospecting permit and conduct prospecting operations.
Under the MPRDA mining rights are not perpetual, but endure for a fixed period, namely a maximum period of thirty years, after which they may
be renewed for a further period of thirty years. Prospecting rights are limited to five years, with one further period of renewal of three years.
Applications for conversion of our old order rights were submitted to the DMRE within the requisite time periods. As at June 30, 2022 and
September 30, 2022 respectively, all of our Ergo operation’s old order mining rights have been converted into new order rights under the terms of
the MPRDA and applications to renew the converted the new order mining rights have been lodged timeously.
The Broad Based Socio-Economic Empowerment Charter
MRE Minister within six months of commencement of the MPRDA beginning May 1, 2004 and was subsequently amended in September 2010.
It is used an instrument to achieve mutually symbiotic sustainable growth and broad based and meaningful transformation of the mining and
mineral industry.
The Mining Charter sets certain goals on equity participation (amount of equity participation and time frames) by historically
disadvantaged South Africans of South African mining assets. It recommends that these are achieved by, among other methods, disposal of
assets by mining companies to historically disadvantaged persons on a willing seller, willing buyer basis at fair market value. The goals set by
the Mining Charter require each mining company to achieve 15 percent ownership by historically disadvantaged South Africans of its South
African mining assets within five years and 26 percent ownership by May 1, 2014. It also sets out guidelines and goals in respect of employment
equity at management level with a view to achieving 40 percent participation by historically disadvantaged persons in management and ten
percent participation by women in the mining industry, each within five years from May 1, 2004. Compliance with these objectives is measured
on the weighted average “scorecard” approach in accordance with a scorecard which was first published around August 2010. In April 2018,
judgment was handed down by the North Gauteng High Court in Pretoria against a provision in the 2010 Mining Charter regarding the “once
empowered always empowered” principle.” This principle refers to whether a mining company, after the exit of a Black partner that held a stake
in the company consequent to a result of a BEE transaction, continues to be BEE compliant. The judgment was appealed by the DMRE. The
DMRE in August 2020, withdrew their notice to appeal to the Supreme Court of Appeal in respect of the judgment issued in April 2018 by the
Pretoria High Court.
27
places significant emphasis on the compliance therewith. The Mining Charter and scorecard have a decisive effect on administrative action taken
under the MPRDA.
the industry to reflect the country’s population demographics, to empower and enable them to meaningfully participate in and sustain the
growth of the economy, thereby advancing equal opportunity and equitable income distribution, we have achieved our commitment to ownership
compliance with the MPRDA through our historic black economic empowerment structures which have subsequently unwound.
bodies. These involve directives with respect to health and safety, mining and exploration of minerals, and managing the impact of mining
operations on the environment. A change in regulatory or government policies could adversely affect our business.
Industry, 2017 (“
2017 Mining Charter
”) was published in the Government Gazette No. 40923 of Government Notice.581. The publication of the
charter was met with widespread criticism and on June 26, 2017 the Minerals Council of South Africa (previously Chamber of Mines of South
Africa), and applied to the High Court of South Africa, Gauteng division for an urgent interdict to prevent the charter from implementation.
Key provisions included:
•
50% Black ownership for new prospecting rights;
•
30% Black ownership for mining rights (up to 11% offset for local beneficiation)
EBITDA
”)
is paid to communities and employees as a trickle dividend from the sixth year of a mining right until dividends are declared or at any point in a
12-month period where dividends are not declared
which includes all stakeholders. The Minerals Council of South Africa subsequently postponed its application in the High Court in respect of the
2017 Mining Charter.
Mining
Charter 2018
”) was published in Government Gazette No. 41934 of Government Notice No. 639 on September 27, 2018 superseding and
replacing all previous charters, including Mining Charter III.
of HDP representation at board and management, as well provisions relating to local procurement of goods and services. The procurement target
of the total spend on services from South African companies has been set at 80% (up from 70% in Mining Charter III) and 60% of the aggregate
spend thereof must be apportioned to BEE entrepreneurs.
• the conditional acceptance of the continued consequences of previous compliance of the BEE ownership threshold of 26% in respect of
existing mining rights;
• of the 30% HDP ownership component, qualifying employees and communities are each to hold a 5% carried interest (as opposed to a
free carry interest as per Mining Charter III) the cost of which may be recovered by the mining right holder from the development of the
asset. the community interest in turn may be offset by way of an equity equivalent;
• removal of the so-called 1% of EBITDA trickle dividend provided for in the 2017 Mining Charter; and
• the removal of provisions requiring community and employee representation at board level.
• that the continuing consequences of HDP ownership are not recognized for transfers of mining rights; and
• that a top up of HDP ownership back to 30% is required for the renewal of existing rights.
aside of certain provisions in Mining Charter 2018.
BEE entrepreneurs as a prerequisite to the continuation of the lawsuit, as they have a direct and substantial interest in the outcome of the litigation.
instrument of policy. This ruling affirmed that the MRE Minister was not entitled to make law through the Mining Charter 2018 to require 30%
HDP ownership for the renewal of existing mining rights.
Africa.
28
Mine Health and Safety Regulation
The principal object of the Mine Health and Safety Act is to improve health and safety at South African mines and, to this end, imposes various
duties on us at our mines and grants the authorities broad powers to, among other things, close unsafe mines and order corrective action relating to
health and safety matters. In the event of any future accidents at any of our mines, regulatory authorities could take steps which could increase
our costs and/or reduce our production capacity. The Act was amended in 2009 and the amendments to the Act dealt with
inter alia
of production and increase punitive measures including increased financial fines and legal liability of mine management. Some of the more
important provisions in the 2009 amendment bill are the insertion of section 50(7A) that obliges an inspector to impose a prohibition on the
further functioning of a site where a person’s death, serious injury or illness to a person or a health threatening occurrence has occurred; a new
section 86A(1) creating a new offence for any person who contravenes or fails to comply with the provisions of the Mine Health and Safety
Act thereby causing a person’s death or serious injury or illness to a person. Subsection (3) further provides that (a) the “fact that the person
issued instructions prohibiting the performance or an omission is not in itself sufficient proof that all reasonable steps were taken to prevent
the performance or omission”; and that (b) “the defense of ignorance or mistake by any person accused cannot be permitted”; or that (c) “the
defense that the death of a person, injury, illness or endangerment was caused by the performance or an omission of any individual within the
employ of the employer may not be admitted”; section 86A(2) creating an offence of vicarious liability for the employer where a Chief
Executive Officer, manager, agent or employee of the employer committed an offence and the employer either connived at or permitted the
performance or an omission by the Chief Executive Officer, manager, agent or employee concerned; or did not take all reasonable steps to
prevent the performance or an omission. The maximum fines were also increased. Any owner convicted in terms of section 86 or 86A may be
sentenced to “withdrawal or suspension of the permit” or to a fine of R3 million or a period of imprisonment not exceeding five years or to
both such fine and imprisonment, while the maximum fine for other offences and for administrative fines have all been increased, with the
highest being R1 million.
required to contribute to a fund specifically created for the purpose of compensating employees or their dependents for disability or death arising
in the course of their work. Employees who are incapacitated in the course of their work have no claim for compensation directly from the employer
and must claim compensation from the COID Act fund. Employees are entitled to compensation without having to prove that the injury or disease
was caused by negligence on the part of the employer, although if negligence is involved, increased compensation may be payable by this fund.
The COID Act relieves employers of the prospect of costly damages but does not relieve employers from liability for negligent acts caused to third
parties outside the scope of employment. In fiscal year 2022, we contributed approximately R5.9 million under the COID Act (2021: R4.3 million
and 2020: R3.7 million) to a multi-employer industry fund administered by Rand Mutual Assurance Limited.
fund pays compensation to employees of mines performing “risk work,” usually in circumstances where the employee is exposed to dust, gases,
vapors, chemical substances or other working conditions which are potentially harmful, or if the employee contracts a “compensatable disease,”
which includes pneumoconiosis, tuberculosis, or a permanent obstruction of the airways. No employee is entitled to benefits under the Occupational
Diseases Act for any disease for which compensation has been received or is still to be received under the COID Act. These payment requirements
are based on a combination of the employee costs and claims made during the fiscal year.
risks for radiation exposure of workers at those operations and the public to radiation in the nearby vicinity. We monitor our uranium and radon
emissions for compliance with all local laws and regulations pertaining to uranium and radon management and under the current legislative
exposure limits prescribed for workers and the public, under the Nuclear Energy Act, 1999 (as amended) and Regulations from the National
Nuclear Regulator.
Environmental Regulation
Managing the impact of mining on the environment is extensively regulated by statute in South Africa. Recent statutory enactments set
compliance standards both generally, in the case of the National Environmental Management Act, and in respect of specific areas of environment
impact, as in the case of the Air Quality Act 2004, the National Water Act (managing effluent), and the Nuclear Regulator Act 1999. Liability for
environmental damage is also extended to impose personal liability on managers and directors of mining corporations that are found to have
violated applicable laws.
The impact on the environment by mining operations is extensively regulated by the MPRDA. The MPRDA has onerous provisions for
personal liability of directors of companies whose mining operations have an unacceptable impact on the environment.
Mining companies are also required to demonstrate both the technical and financial ability to sustain an ongoing environmental
management program, or EMP, and achieve ultimate rehabilitation, the particulars of which are to be incorporated in an EMP. This program is
required to be submitted and approved by the DMRE as a prerequisite for the issue of a new order mining right. Various funding mechanisms are
in place, including trust funds, guarantees and concurrent rehabilitation budgets, to fund the rehabilitation liability.
The MPRDA imposes specific, ongoing environmental monitoring and financial reporting obligations on the holders of mining rights.
Additionally, key environmental issues have been prioritized and are being addressed through active management input and support as well as
progress measured in terms of activity schedules and timescales determined for each activity.

29
mining operations cease. This can be done through the use of rehabilitation trusts or through financial guarantees issued to the DMRE. During
fiscal year 2022, a change in method was decided upon as providing for environmental rehabilitation from funding in a specific rehabilitation trust
to financial guarantees which is an allowed method in terms of the National Environmental Management Act. The financial guarantees are issued
through approved insurance products from Guardrisk Insurance Company Limited (“
GICL
”). All the required approvals for the change in method
and transfer of the rehabilitation trust funds were obtained from the DMRE and a thorough consideration of tax and legal impacts were completed
prior to the funds being transferred to GICL directly from the rehabilitation trust where the funds were previously held. As of June 30, 2022, we
held a total of R589.8 million (2021: R87.5 million) in funds held in insurance instruments after the transfer, of R579.5 million from the
rehabilitation trusts was completed. As at June 30, 2022 guarantees amounting to R614.0 million (2021: R430.1 million) were issued to the DMRE.
As of June 30, 2022, subsequent to the transfer to GICL, the balance in the rehabilitation trust was R nil (2021: R564.7 million).
30, 2021.
FPR
”) were promulgated on November 20, 2015 under the National Environmental
Management Act, 107 of 1998 (“
NEMA
”) by the Department of Forestry, Fisheries and the Environment (“
DFFE
”). Under the FPRs to be
implemented by the DMRE, existing environmental rehabilitation trust funds, of which DRDGOLD has R0.0 million, may be used only for post
closure activities and may no longer be utilized for their intended purpose of concurrent and final rehabilitation on closure. As a result, new methods
for provisions will have to be made for these activities.
Proposed Amendments
”) were published subsequently. The latest Proposed
Amendments were published in August 2021 which,
inter alia
, extends the compliance with these regulations to three months following the fiscal
year end June 30, 2022.
certain circumstances for the withdrawal against financial provision (which is currently not contemplated in the FPR). It is therefore uncertain
whether these provisions relating to withdrawal will remain in their current form, or at all.
which according to the definitions listed in the Proposed Amendments is an “independent person”. Regulation 10 of the Proposed Amendments
further requires the annual review and re-assessment of financial provision by an independent specialist, which in terms of Regulation 11 of the
Proposed Amendments must also be audited by an independent auditor. The Proposed Amendments do not require that the annual review and re-
assessment of financial provision be audited by a financial auditor.
4C. ORGANIZATIONAL STRUCTURE
The following chart shows our principal subsidiaries as of June 30, 2022 and as of September 30, 2022 respectively. All of our
subsidiaries are incorporated in South Africa. Our voting interest in each of our subsidiaries are equal to our ownership interests. We hold the
majority of our subsidiaries directly or indirectly as indicated below. Refer to Exhibit 8.1 for a list of our significant subsidiaries.
30
4D. PROPERTY, PLANT AND EQUIPMENT
Description of Significant Subsidiaries' Properties and Mining Operations
Mineral Reserves and Mineral Resources summary disclosures
adopted amendments to modernize the property disclosure requirements for mining registrants, and related guidance. The amendments consolidate
the SEC’s mining property disclosure requirements by relocating them to a new subpart of Regulation S-K 1300 (Subpart 1300) (“
S-K 1300
”).
These amendments closely align disclosure requirements to current industry and global regulatory practices and standards as embodied by the
Committee for Reserves International Reporting Standards (“
CRIRSCO
”). The amendments were effective for the first fiscal year beginning on
or after January 1, 2021. We have therefore adopted the new amendments in this Annual Report and going forward. The new rules require a
registrant to obtain a dated and Technical Report Summary or Summaries (“
TRSs
”) from the qualified person or persons, which identifies and
summarizes the information reviewed and conclusions reached by each qualified person about the registrant’s Mineral Resources and Mineral
Reserves determined to be on each material property. Key changes in the amendments include the following:
●
The reporting of Mineral Resources and not only Mineral Reserves. This is therefore the first time that we report on Mineral Resources
and no comparatives are provided
●
Statement of Mineral Resources exclusive of Mineral Reserves
●
Removal of the requirement to use a three-year historical gold price to use in determining Mineral Reserves, but rather that of a reasonable
and justifiable gold price
●
Application of modifying factors in indicated or measured Mineral Resources in order to convert them to Mineral Reserves
and in the TRSs included as exhibits in this report are current as at June 30, 2022, the period covered by each of the respective reports. Such
assumptions rely on various factors that may change after the reporting period, including as a result of operational reviews which the Company
undertakes from time to time and when necessary. The TRSs which are filed as exhibits to this report in accordance with Item 601(86) and Item
1300 of Regulation S-K have been prepared by the Qualified Persons named therein'.
Code for the Reporting of Exploration Results, Mineral Resources and Mineral Reserves, or SAMREC Code. South Africa is a member of
CRIRSCO.
The following information is detailed for material properties of the Companies in Item 4D:
●
History of operations
●
Overview of operations
●
Properties and location
●
Geology
●
Mining method
●
Mineral Processing and Recovery Methods
●
Infrastructure
●
Exploration
●
Environmental and Closure Aspects
●
Water usage and reduction in use of potable water
●
Water pollution
●
Environmental rehabilitation closure providing and funding
●
Legal aspects and permitting
●
Production
●
Capital Expenditure
●
Mineral Reserves and Mineral Resources Estimation
History of operations
Overview of operations
across central and east Johannesburg, within the Gauteng Province and FWGR in Carletonville on the far West Rand of the Gauteng Province. In
order to improve synergies, effect cost savings and establish a simpler group structure, DRDGOLD restructured the Group’s surface operations
(Crown, ERPM’s Cason Dump surface operation and ErgoGold) into Ergo with effect from July 1, 2012. On July 31, 2018, DRDGOLD acquired
WRTRP Assets, which are surface gold processing assets and tailing storage facilities associated with Sibanye-Stillwater’s WRTRP, and
subsequently renamed it FWGR.
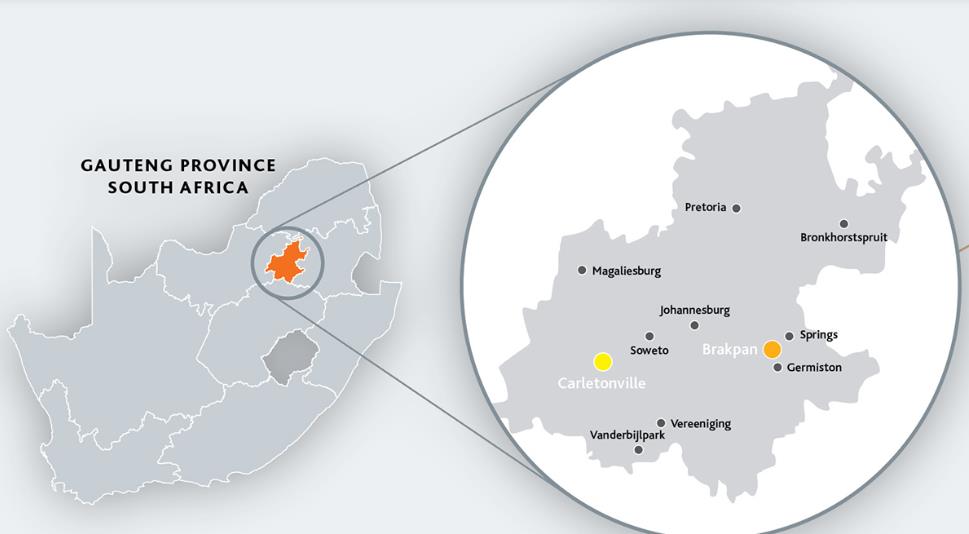
31
assets to OroTree Limited (“OroTree”) which included the disposal of ERPM’s underground mining and prospecting rights. Underground mining
infrastructure was not sold. ERPM’s underground gold mining infrastructure is under care and maintenance.
to our operations bringing the total number of in-house and outsourced employees to 2,440 at June 30, 2022 (at June 30, 2021: 2,266
;
at June 30,
2020: 2,155
)
. At June 30, 2022, FWGR employed 152 full-time employees. In addition, specialist service providers deployed a further 339
employees to our operations bringing the total number of in-house and outsourced employees to 491.
Below is geographical representation of the location on Ergo and FWGR within South Africa:
Properties and location
Gauteng on land owned by Ergo. Access to the Ergo plant is via the Ergo Road on the N17 Johannesburg-Springs motorway.
into a single surface retreatment operation in Ergo, these mining rights were transferred to Ergo in March 2014.The Crown Mines plant and sites
were closed down in March 2017 and rehabilitated.
miles (5 kilometers) south-east of the Johannesburg central business district in the province of Gauteng. Access is via the Heidelberg Road on the
M2 Johannesburg-Germiston motorway. The City Deep plant continues to operate as a pump/milling station feeding the metallurgical plants.
operate as a metallurgical plant.
As of June 30, 2022 and September 30, 2022, no material encumbrances exist on Ergo's property.
As of June 30, 2022, the net book value of Ergo’s mining assets was R1,707.0 million (2021: R 1,427.8 million).
32
Below is a geographical representation of the location of individual material properties of Ergo:
Below is a geographical representation of the location of individual material properties of FWGR:
DP2
”), Driefontein 3 plant (“
DP3
”), Driefontein 4 TSF
which is a current active tailings deposition facility, pilot plant, which is a moveable LogiProc pilot plant established
to test the processes,
techniques and assumptions made in the definitive level design of the full scale retreatment of dumps.
FWGR currently own six tailings storage
facilities on the West Rand between Roodepoort and Carletonville, approximately 70km South West of Johannesburg (Figure A).
operations (Available TSFs). These are Driefontein 1, and 2, Kloof 2 and Leeudoorn. Numerous other TSFs are potentially available in the
area for future reclamation. FWGR also owns land on which the Central Processing Plant (“
CPP”
) and RTSF and the return water dam were
originally planned to be built.
As of June 30, 2022, and September 30, 2022, no material encumbrances exist on FWGR's property.
Surface reclamation operations including the treatment of sand from ERPM’s Cason Dump, was conducted through the Knights
metallurgical plant, tailings deposition facilities and associated facilities until ERPM’s surface mining assets were transferred to Ergo as part
of the restructuring which took place on July 1, 2012.
As of June 30, 2022, and September 30, 2022, no encumbrances exist on ERPM's property.
At June 30, 2022, the net book value of ERPM’s mining assets was zero (2021: zero).
33
Geology
tailings
”) of the mining and metallurgical process recovery of gold and uranium
ores of the gold bearing late Archaean (2.7Ga to 3.2Ga) Witwatersrand sedimentary basin. The Witwatersrand Basin is the largest gold bearing
metallogenic province globally and is unconformably overlain by units of the Ventersdorp Supergroup (~2.7Ga), the Transvaal Supergroup
(~2.6Ga), and the Karoo Supergroup (~280Ma).
constituents of the Witwatersrand Basin: quartz (70%-80%), mica (10%), chlorite and chloritoid (9%-18%) and pyrite (1%-2%). Gold, uranium,
zirconium and chromium may be minor constituents averaging <100ppm each. Deposits possess characteristics, determined by the geometry,
material source and processing plants in which the original ores were processed.
Mining method
is slime.
No selective mining takes place on a dump with the entire TSF being processed. This is due to the following:
●
No place exists on mining sites to dump below cut-off grade material;
●
The mining method is not conducive to selective mining; and
●
The operation is also a rehabilitation exercise, and all mineralized material must be removed from the site, and it is, therefore,
economically beneficial to process all material, even low-grade material.
transportation as a slurry to processing plants. The hydro-mining removes the tailings material from the top of a TSF to the natural ground
level in 15m layers. Hydraulic mining provides slurry feedstock to the plants continuously. Ergo also uses mechanical front end loaders to load
slimes/sand material. Material is re-pulped with water and pumped to the plants.
Mineral Processing and Recovery Methods
CIL
”) metallurgical processes to recover gold from slurry.
The surface sources have generally undergone a complex depositional history resulting in grade variations associated with
improvements in plant recovery over the period the material was deposited. At Ergo, our two gold producing metallurgical plants, Ergo and
Knights have an installed capacity to treat approximately 25 million tons of material per year based on 92% availability and are fully
operational. All of the plants have undergone various modifications during recent years resulting in significant changes to the processing circuits.
The City Deep plant continues to operate as a pump/milling station feeding the metallurgical plants. At FWGR, DP2 has a installed capacity to
treat approximately 7.2 million tons of material per year.
The re-pulped slime is pumped to the plant and the reclaimed material is treated using screens, cyclones, ball mills and Carbon-in-Leach, or
CIL, technology to extract the gold.
Set forth below is a description of each of our plants in operation:
acquired for a consideration of R42.8 million in 2007. The remaining five CIL tanks were refurbished during fiscal year 2015 to increase
capacity to treat up to 25.2Mt per year.
milling in closed circuit with hydrocyclones, thickening, oxygen preconditioning, CIL, elution, electro-winning and smelting to doré.
The Knights plant, although historically part of the Crown operation, is located further east and considerably closer to the
Brakpan/Withok TSF. Due to the location of the Knights plant it deposits waste on the Brakpan/Withok TSF. The Knights plant has an
installed capacity to treat an estimated 3.6Mt per year.
and tertiary cycloning in closed circuit milling, thickening, oxygen preconditioning, CIL, elution and zinc precipitation followed by
calcining and smelting to doré. Retreatment continued at the City Deep Plant until the plant was decommissioned in August 2013 to
operate as a milling and pump station and is currently pumping material to the Ergo Plant for the final extraction of gold.
Driefontein 2 Plant:
the milling and cyclone circuit to ensure the production of a finer grind for gold liberation.
Infrastructure
34
from the hydro-mining sites at the TSFs to the plants and tailings pipelines from the plants to the respective depositional facilities. High
pressure water pipelines are necessary to supply the mining operations while separate low-pressure water pipes are needed for returning water
to the plants from return water dams at the various TSFs. These have all been adequately designed and included in the LoM planning.
implementation of the final design of the Brakpan/Withok TSF to receive an additional 800Mt in order to deliver into its life of mine. FWGR
requires the RTSF to ensure adequate storage facilities for the long-term deposition of all tailings arising from FWGR operations. It will be
built on Transvaal Supergroup lithology (Figure D), to mitigate any risk of dolomite related sink holes. The design and cost estimate caters for
a storage capacity of 800Mt and a potential disposal rate of up to 3.0Mtpm.
stage of the TSF are being reviewed. The permitting for the RTSF has been approved based on the initial design with a geomembrane barrier
and FWGR are pursuing approval for the more recent scavenger well design. FWGR have reached an in-principle agreement with Sibanye
Gold to co-deposit tailings on the Leeudoorn TSF. This will allow FWGR to increase production to 750ktpm for an interim period while also
mitigating against the risk of an interruption to the planned production in the event that the approval sought for the RTSF is delayed.
with Eskom. Ergo operations receive power from several substations and mining sites are supplied power via several separate feeds. Currently,
the Ergo plant demands peaks at 18MVa and the Brakpan/Withok Tailings Storage facility at 8MVa. Ergo operates 24-7-365 and the plant
receives power at 6.6KV via Eskom’s 88KV Vlakfontein distribution. At FWGR, power is currently supplied from Eskom’s 132kV and 44kV
grid to various Sibanye owned gold mines in the vicinity of FWGR’s operations. The power requirement of FWGR remains within the current
surplus capacity of the Driefontein and Kloof mining complexes.
Exploration
material in the determination of its Mineral Resources and Mineral Reserves. These exploration programmes comprise:
●
surveying to determine physical dimensions and volumes;
●
auger or reverse circulation drilling programs to permit sampling for gold content and mapping of the gold distribution;
●
metallurgical and flow sheet development test work; and
●
tailings toxicity tests and specific gravity determination.
Environmental and Closure Aspects
In accordance with South African mining legislation, all mining companies are required to rehabilitate the land on which they work to a
determined standard for alternative use. DRDGOLD’s business involves the reclamation of previously discarded material deposited, in many cases,
by other companies, most of which are no longer in business. As a result we deal with legacy environmental issues.
Before we embark on new mining projects, we undertake an environmental authorization process which is performed by external
consulting specialists that conduct detailed specialist studies, an environmental impact assessment and environmental management programme
(“EMP”) for the management of these projects. These reports are discussed and reviewed by our stakeholders through an open public participation
process. Through this process, we are able to identify, address and minimize the effects of our activities on the environment and identify and
mitigate the potential impacts our activities may have on surrounding communities and the receiving environment. Our environmental management
systems and policies have been designed in compliance with South Africa’s National Environmental Management Act 107 of 1998 and associated
regulations. Internal and external environmental audits are performed annually and recorded in a database to ensure compliance. Our EMP
encompasses all the activities of our operations and assesses the environmental impacts of mining at reclamation sites, plants and tailings storage
facilities. It also outlines the closure process, including financial provisions.
At Ergo, environmental management and compliance is further assisted by the in–house developed electronic monitoring system
(Compliance Management Tool) that incorporates all existing Environmental Impact Assessments (“
EIA
s”), EMPs, Mining Right Conversions,
Performance Assessments and Social and Labor Plans (“
SLP
s”) associated with each mining right. At Ergo the monitoring system incorporates
existing EMPs and water use licenses. The existing and most recent studies are used to supplement the management components with regards to
the mining right boundaries and its required compliance parameters. The individual management items are integrated to provide a holistic overview
of the state of each of the mining right areas. Spatial data pertaining to the mining right boundaries is stored onto a central database and is utilized
to create a live map which illustrates the mining right area and various environmental monitoring systems.
The Group actively manages and monitors the consumption of natural resources (including potable water and energy) at monthly and
weekly meetings. This entails the analysis of trends to identify excess use and discuss various focus areas to ensure responsible natural resource
usage. The major environmental risks are associated with dust from various reclamation sites, and effective management of relocated process
material on certain tailings dams. At Ergo, Municipal infrastructure as well as commercial and residential developments have encroached towards
the Ergo operation.
The impact of nuisance dust fallout on the surrounding environment and community is addressed through a comprehensive monitoring
network including appropriate community involvement. The monitoring reports are sent to regulators, municipalities, and interested and affected
35
parties. For a residential zoned monitoring bucket, an exceedance is defined as above the dust limit of 600mg/m
2
/day. For a non-residential zoned
monitoring bucket, an exceedance is defined as above the dust limit of 1200mg/m
2
/day.
Mitigation measures include environmentally friendly dust suppressants applied to high impact areas, active wetting of access roads by
water bowsers, and a network of high velocity sprayers on our active TSFs. In the long-term, dust suppression and water pollution is managed
through a program of progressive vegetation of the tailings followed by the application of lime, to reduce the natural acidic conditions, and fertilizer
to assist in the growth of vegetation planted on the tailings dam.
Water usage and reduction in use of potable water
plant in 2017 to give it the ability to deliver water to all corners of the operation and return it through a fully integrated closed system. Between
60%- 70% of all process water make up at Ergo is drawn from the Brakpan/Withok TSF to various reclamation sites by way of return water
columns. Another 15%-20% water is drawn from lakes and dams in the region in terms of the requisite extraction licenses. A further 6%-11%
of process water top up needs are from treated underground acid mine drainage (“
AMD
”) drawn from Trans-Caledon Tunnel Authority
(“
TCTA
”). DRDGOLD has the right to use up to 30 Ml of AMD water per day. Less than 1% of water is drawn from a wastewater treatment
facility. Potable water is used only where the sensitivity of equipment requires it and for certain early stages of irrigation to settle in newly
established vegetation on TSFs. At FWGR, all water harvested from Driefontein 4 TSF is used. This amounts to approximately 54% of process
water requirements. The balance is made up from underground mine dewatering. Water use licenses are available for the pumping of water
from underground workings at Kloof 10 shaft and Driefontein 10 shaft, and the consumption planned from these shafts will not exceed the
pumping rates approved in the respective WULs. Potable water consumption is limited to drinking and change houses and flocculant make up
for usage in the plant.
Water pollution
return water dams may, depending on their location, pollute surrounding streams and wetlands. Ergo and FWGR have an ongoing monitoring
program to ensure that its water balances (in its reticulation system, on its tailings and its return water dams) are maintained at levels that are
sensitive to the capacity of return water dams. Any water discharge is contained through paddocks on reclaimed sites, storm water run-off and
water systems that pump rain or excess water into the system. Another possible source water discharge is attributed mainly to compromised or
aging pipes that may cause leaks. An external expert continuously monitors pipelines to timeously identify water leaks to minimize water
seepages. A comprehensive maintenance plan is in place for replace compromised pipelines.
ERPM acid mine drainage
underground section. Studies on the estimates of the probable rate of rise of water have been inconsistent, with certain theories suggesting that the
underground water might reach a natural subterranean equilibrium, whilst other theories maintain that the water could decant or surface.
contaminated. TCTA completed the construction of the neutralisation plant for the Central Basin and commenced treatment during July 2014. As
part of the heads of agreement signed in December 2012 between EMO, Ergo, ERPM and TCTA, sludge emanating from this plant is co-disposed
onto the Brakpan/Withok TSF together with processed material from the Ergo plant. Partially treated water is then discharged by TCTA into the
Elsburg Spruit. This agreement includes the granting of access to the underground water basin through one of ERPM shafts and the rental of a site
onto which it constructed its neutralisation plant. In exchange, Ergo and its associate companies including ERPM have a set-off against any future
directives to make any contribution toward costs or capital of up to R250 million. Through this agreement, Ergo also secured the right to purchase
up to 30 ML of partially treated AMD, a day, from TCTA at cost, in order to reduce Ergo’s reliance on potable water for mining and processing
purposes.
Refer Item 18. ‘‘Financial Statements - Note 26.2 Contingent liability for environmental rehabilitation” for disclosures on potential pollution
impact on ground water through seepage
Environmental rehabilitation closure providing and funding
While the ultimate amount of rehabilitation costs to be incurred is uncertain, we have estimated that the total cost for Ergo, in current
monetary terms as at June 30, 2022 is approximately R414.4 million. As at June 30, 2022, a total of R132.8 million (2021: R62.7 million) is held
in insurance instruments in the Guardrisk Cell Captive, as security for financial guarantees issued for rehabilitation costs. As at June 30, 2022, after
the change in method for providing for rehabilitation and subsequently the rehabilitation funds were transferred to the Guardrisk Cell Captive, a
total of R0.0 million (2021: R127.2 million) is held in the Ergo Rehabilitation Trust Fund, previously called the Crown Rehabilitation Trust Fund,
which is an irrevocable trust, managed by specific responsible people who we nominated and who are appointed as trustees by the Master of the
High Court of South Africa.
We have estimated that the total cost for FWGR, in current monetary terms as at June 30, 2022 is approximately R93.9 million (June
30, 2021: R116.4 million). As at June 30, 2022, a total of R444.1 million (2021: R0.0 million) is held in insurance instruments in the Guardrisk
Cell Captive, as security for financial guarantees issued for rehabilitation costs. As at June 30, 2022, after the change in method for providing for
rehabilitation and subsequently the rehabilitation funds were transferred to the Guardrisk Cell Captive, a total of R0.0 million (2021: R425.1
36
million) is held in the Ergo Rehabilitation Trust Fund.
R9.3 million (2021: R8.6 million). A total of R0.0 million (2021: R12.4 million) is held in the Ergo Rehabilitation Trust Fund for the benefit of
ERPM and R51.6 million (2021: R24.8 million) is held in insurance instruments and is available for the settlement of these rehabilitation costs.
Legal aspects and permitting
Mining Rights and Prospecting Rights held are listed under the Ergo Mining Proprietary Limited subsidiary. DRDGOLD has numerous
Surface, Mining and Prospecting Rights and ownership of the surface rights and mine dumps vests in various legal entities. Ergo is one of only a
few surface operators that holds Mining Rights under the MPRDA over a large portion of its reserves. The provisions of the MPRDA, and the
definition of ‘mineral’ had inadvertently created a gap in the Act placing the ‘minerals’ in certain TSFs beyond the regulatory reach of the MPRDA
and limiting its competency to issue rights upon application. However, in terms of the transitional arrangements of the MPRDA, which were
peremptory upon the DMRE in the event that the petitioner met the conditions for conversion from ‘old order’ to ‘new order’, Ergo was able to
convert its old order rights, thus extending its “license to mine” into the dispensation introduced by the MPRDA. Ergo has also submitted
applications to renew all its Mining and Prospecting Rights with the DMRE. The current Mining and Prospecting Rights have expired (with the
exception of 7L4 TSF) but remain in force until such time that the renewal applications have been granted or refused by the DMRE. Water use
licenses are applied for as and when required to remain compliant with relevant legislation. Ergo complies with all the conditions for renewal and
has no reason to believe that the submitted renewals would not be granted. Ergo is in constant communication with the DMRE and is submitting
the required information as per their requests to finalize these renewal applications.
The Mineral Resources and Mineral Reserves held by FWGR were acquired from Sibanye Gold Limited, a subsidiary of Sibanye-
Stillwater Limited, in a transaction in which common law ownership was established over the various TSFs containing the said Mineral Resources
and Mineral Reserves, and control was established by Sibanye-Stillwater over DRDGOLD. FWGR conducts its activities
inter alia
with Environmental Approvals (“
EAs
”) and the provisions of the Mine Health and Safety regulations. A Use and Access Agreement with Sibanye
Gold articulates the various rights, permits and licenses held by Sibanye Gold in terms of which FWGR operates, pending the transfer to FWGR
of those that are transferable.
FWGR entered into a smelting agreement with Sibanye-Stillwater to smelt and recover gold from gold loaded carbon produced at
the DP2 plant, and deliver the gold to Rand Refinery. In exchange for this service, Sibanye-Stillwater receives a fee based on the smelting
costs plus 10% of the smelting costs. Rand Refinery performs the final refinement of all gold produced. Up to April 11, 2022, FWGR also
engaged its fellow subsidiary, Ergo Mining Proprietary Limited, to act as its agent and representative and to enter into a refining services
arrangement with Rand Refinery for the sale, marketing and export of the refined gold of the Company. After April 11, 2022, FWGR continued
to engage Ergo Mining Proprietary Limited, to act as its agent and representative to sell gold directly to the South African Bullion banks. This
agreement is expected to be in place until FWGR obtains its own precious metals beneficiation license and its own depository account with
Rand Refinery.
DRDGOLD and its subsidiaries own the rights to some of the properties where the Mineral Resources are located. In other cases,
agreements are in place with the landowners to mine the dump material and rehabilitate the land for other uses. The details of the related surface
rights are not material for the purpose of this report. The necessary agreements are in place for all properties in the LoM plan.
Impediments on rights to mine
Grootvlei Complex
Ergo has submitted a renewal application of its prospecting rights over Grootvlei dumps 6L16, 6L17 and 6L17A to the DMRE. During
the 2022 financial year, an external party raised a conflicting claim of common law ownership of 6L16, 6L17 and 6L17A TSFs. Although the
claim was based on common law ownership and no attempt has been made to set aside the prospecting rights over the TSFs, the Grootvlei TSFs
have been excluded from the Mineral Reserves statement and the Life-of-Mine (LoM) plan but included in the Mineral Resources statement.
Marievale Complex
Ergo acquired the 7L5, 7L6 and 7L7 TSFs in terms of a written notarial executed deed of sale during 2019 and took possession of the
TSFs on 8 April 2019. It has since also obtained the requisite National Environmental Management Act, 1998 (Act No. 107 of 1998) (NEMA)
regulatory approvals to retreat the said TSFs. During the 2022 financial year, the owner of the land on which 7L5, 7L6 and 7L7 are situated, an
estimated 36,524t out of the total 54,114t comprising the Marievale cluster, notified Ergo that in its view, the said TSFs had acceded to the land
and that it had become the owner of the TSFs. Ergo disputes the claim of legal title and the matter is to be referred to arbitration.
All ownership requirements were met when the TSFs were purchased by Ergo and therefore the TSFs are still included in the Mineral
Reserves. Whilst Ergo has received confident legal advice on the merits of its claim, in the event that the arbitration goes against Ergo, its Mineral
Reserves will reduce by 35.52Mt (0.35Moz at 0.29g/t). Inasmuch as it then enters into a commercial arrangement with the land-owner, the financial
benefit of this portion of the Marievale cluster will be reduced by whatever benefit is agreed to in favor of the land-owner.
Ergo has a submitted renewal application to the DMRE for the prospecting rights it holds over 7L4 TSF. The entity (who holds common
law ownership rights over the land on which the TSF is the TSF itself) has agreed to relinquish ownership in favor of Ergo, provided
��
situated andthat Ergo undertakes to:
●
make a notional amount payment;
37
●
suitably remove the TSF; and
●
rehabilitate the land.
A draft contract stipulating the terms of such agreement is awaiting final signature.
Below is a graphical representation of the permits and licenses held within the Group:
Production
Ergo
throughput that decreased from 23.0Mt to 22.1Mt as a result of increased rainfall experienced in fiscal year 2022 in comparison to previous years.
The impact of this decrease was offset by the increase in the average yield from 0.186g/t in fiscal year 2021 to 0.188g/t in fiscal year 2022.
fiscal year 2022 mainly due to the above inflationary increases in the costs of key consumables, diesel, steel and cyanide.
38
The following table details certain production and financial results of Ergo for the past two fiscal years.
2022
2021
Production (imperial)
Ore milled ('000 tons)
22,111
22,952
Recovered grade (oz/ton)
0.006
0.006
Gold produced (ounces)
133,618
137,059
Results of Operations
3,704.9
3,943.0
3,141.8
2,871.0
1
3,009.8
2,666.5
1
718,676
629,585
826,891
704,503
848,683
717,755
1 Cash operating cost, cash operating costs per kilogram, all-in sustaining costs per kilogram and all-in costs per kilogram are financial measures of performance that we use to determine cash generating capacities of the
mines and to monitor performance of our mining operations. These are all non-IFRS measures. For a reconciliation of these measures to the nearest IFRS measure see Item 5A.: “Operating Results - Reconciliation of
cash cost per kilogram, all-in sustaining costs per kilogram and all-in costs per kilogram.”
FWGR
throughput decreased from 6.2Mt in fiscal year 2021 to 6.1Mt in fiscal 2022, this was offset by an increase average yield form 0.237g/t in fiscal
year 2021 to 0.257g/t in fiscal year 2022.
mainly due to an above inflationary increases in the costs of key consumables, diesel, steel and cyanide.
The following table details certain production and financial results of FWGR for the past two fiscal years.
2022
2021
Production (imperial)
Ore milled ('000 tons)
6,078
6,159
Recovered grade (oz/ton)
0.008
0.008
Gold produced (ounces)
50,284
46,940
Results of Operations
1,413.6
1,326.0
592.1
517.2
1
454.0
406.2
1
291,302
276,174
396,762
377,210
422,540
400,829
1 Cash operating cost, cash operating costs per kilogram, all-in sustaining costs per kilogram and all-in costs per kilogram are financial measures of performance that we use to determine cash generating capacities of the
mines and to monitor performance of our mining operations. These are all non IFRS measures. For a reconciliation of these measures to the nearest IFRS measure see Item 5A.: “Operating Results - Reconciliation of
cash cost per kilogram, all-in sustaining costs per kilogram and all-in costs per kilogram.”
Licenses to Operate
All the licenses, permits, permissions, management plans and reports, as well as amendments, variations or
modifications thereof from time to time necessary for Sibanye-Stillwater to operate the WRTRP Assets lawfully.
Access Rights
The grant of access to DRDGOLD of the:
·
·
pumping and supplying, at the cost of WRTRP, the required quantities of water, as licensed, for the WRTRP
Assets;
·
existing and proposed pipeline routes; servitudes; wayleaves and surface right permits; and
·
Capital Expenditure
Ergo
39
Prospects—Capital expenditure".
existing cash resources. Sustaining capital expenditure is financed from cash generated from operations and existing cash resources. For a summary
of capital expenditure, see Item 5A. Operating Results.
resources in the area east of the of the Ergo Plant and further extend the life of mine of Ergo.
the Eskom grid and reduce its carbon footprint. A large percentage of the planned capital expenditure in fiscal year 2023 will be applied to complete
the first phase of the project. The project is expected to be completed in FY2024.
FWGR
2 project. The available information was independently reviewed by an external consultant, Sound Mining Solution (Pty)Ltd. The project
includes the construction of a new CPP with a capacity of between 1.2 Mtpm to 2.4 Mtpm and the equipping of the required reclamation sites
and pipeline infrastructure to supply the relevant resources to the CPP. Phase 2 also includes the construction of a new RTSF capable of
accepting up to 3 Mtpm to a capacity of approximately 800Mt. The definitive feasibility study was concluded in the fiscal 2021 year and is
subject to obtaining regulatory approvals on the amended design of the RTSF. During the current year, management considered alternative
plans should the RTSF be delayed further, based on information at hand. The Sibanye-Stillwater Leeudoorn tailings storage facility was
evaluated as a viable interim alternative to the RTSF whilst regulatory approvals are obtained. Furthermore, the expansion of DP2 to a 1.2Mt
processing capacity per month has been planned.
and existing cash resources. Sustaining capital expenditure is financed from cash generated from operations and existing cash resources.
Mineral Reserves and Mineral Resources Estimation
Mineral Resources
Mineral Resources are estimates that contain inherent risk and uncertainties and depend upon geological interpretations and data
statistics drawn from drilling and sampling programmes, which may prove to be unreliable. For detailed description of risks associated with
the Company’s material properties, refer to Item 3D: Risk Factors.
Mineral Resources consist of sand dumps, slimes dams and silted ‘vlei’ areas and dams. Before dumps are included as Mineral
Resources, they are evaluated by drilling and an initial assessment is completed by the Qualified Person.
With respect to the Mineral Resources and Mineral Reserves, drilling takes place on a predetermined grid to ascertain the average grade (grade
model), moisture, expected extraction factors and ultimate financial viability before mining begins. Sampling is done subject quality control
and assurance as prescribed.
Estimation methods vary depending on data distribution and statistics. A block model is generated and used to evaluate the potential
for inclusion into a mine plan. The applied Mineral Resource classification is a function of the confidence of the entire process from surveying,
drilling, sampling, assaying, geological understanding and/or geostatistical relationships. Mineral Resources is reported
in situ
.
Both Mineral Resources and Mineral Reserves are determined by the average grade of a TSF which must be above or equal to a plant
feed cut-off grade. A cut-off is also determined per complex or cluster. A TSF may report an average gold grade below a cut-off, but when
included in a complex, the total complex could be above the cut-off. The assumptions on a Mineral Resource cut-off include working costs,
the average plant recovery, the expected residue grade, the required yield based on working cost and gold price, and are presented below:
Ergo
FWGR
Cut-off assumptions
Gold price (R)
914 294
914 294
Working cost (R/tonne)
90.86
85.23
Plant recovery (%)
40.87
53.55
Mine call factor (%)
100
100
Cut-off grade (g/t)
0.24
0.15
The Mineral Resource estimates for all the TSFs and a sand dump are declared as follows:
●
The point of reference is in-situ. The TSFs or sand dumps themselves are the reference points;
●
No geological or other losses were applied as all material is accessible and there are no geological structures;
●
Mineral Resource Estimates are stated as both inclusive and exclusive of Mineral Reserves as defined in S-K 1300; and
40
●
Mineral Resources are 100% attributable to DRDGOLD.
Mineral Reserves
The Mineral Reserves were prepared in accordance with the requirements of S-K 1300, and the economic viability thereof performed
at a minimum prefeasibility study level. Modifying factors like dilution or mining losses bare not applied for the Mineral Reserve estimation
because the TSFs are re-mined and re-processed in their entirety. All other modifying factors are reflected in the mine design and all of the
associated technical aspects that informed the capital and operating cost estimates. Mineral Reserve is reported as delivered to the processing
plants.
As material is removed for retreatment, the Mineral Resources and Mineral Reserves for each operation are adjusted accordingly.
Continuous checks of modifying factors and ongoing surveys are conducted to monitor the rate of depletion and the accuracy of factors used
in conversion.
Mineral Reserves changed in the past two fiscal years as follows:
●
Mineral Reserves increased from 5.35 million ounces at June 30, 2021, to 6.04 million ounces at June 30, 2022, mainly
because of Ergo’s Daggafontein TSF being reclassified to a Mineral Reserve which was in part offset through ongoing
mining activities. This is despite the Grootvlei dumps being classified from a Mineral Reserve. Ergo also classified a
number of its dumps from a Probable Mineral Reserve to a Proven Mineral Reserve, notably the Rooikraal TSF,
0.47Moz(56.76Mt@0.26g/t). Grootvlei Complex has been excluded from the life of mine and has been classified from a
Mineral Reserve to a Mineral Resource due to land claims.
●
Mineral Reserves decreased from 5.73 million ounces at June 30, 2020, to 5.35 million ounces at June 30, 2021, mainly
because of depletion through ongoing mining activities.
The life-of-mine for Ergo based on Proven and Probable Mineral Reserves S-K 1300 as at June 30, 2022, was 19 years (June 30,
2021: 13 years).
The life of mine for FWGR based on Proven and Probable Mineral Reserves under S-K 1300 as at June 30, 2022 was 20 years (June 30,
2021: 18 years).
The year on year Mineral Reserve reconciliation is shown below:
Tonnes
(Mt)
Grade Au
(g/t)
Au Ounces
(Moz)
Mineral Reserves as at June 30, 2021
518.10
0.32
5.35
Depletion of Mineral Reserves – Ergo
(20.48)
0.33
(0.22)
Survey adjustments - Ergo
(2.94)
0.20
(0.01)
Addition of Daggafontein TSF - Ergo
192.79
0.24
1.49
Addition of Various dumps - Ergo
6.72
0.24
0.06
Exclusion of Grootvlei Dumps – 6L16, 6L17 and 6L17A -Ergo
(66.04)
0.26
(0.55)
Depletion of Mineral Reserves – FWGR
(5.77)
0.45
(0.08)
Mineral Reserves at June 30, 2022
622.37
0.30
6.04
The figures contained in the table are rounded, which may result in minor computational discrepancies which are not deemed
to be significant. Depletion based on block model surveys
Gold Price Assumptions
for economic extraction. Assumptions in the economic assessment includes a gold price. The Company has estimated gold price based on
consensus forecasts obtained from various sources which provided a range as of June 30, 2022. The lowest range of these forecasts was selected
to take into account the volatility experienced in the current global economic conditions. As of June 30, 2021, the three-year average gold price
was used in accordance with Industry Guide 7 for the estimation of Mineral Reserves.
41
Year ended June 30, 2022
Gold price
Rand gold price per kilogram
914,294
Dollar gold price per ounce
1,823
ZAR/USD rate
15.60
Year ended June 30, 2021
Three-year average
gold price
Rand gold price per kilogram
756,355
Dollar gold price per ounce
1,559
Ore Reserves (million ounces)
5.35
Qualified Persons:
Qualified Persons as defined in S-K 1300. The Qualified Persons are not employed by the Company. The Company has evaluated the
qualification and experience of the Qualified Persons and is satisfied that they meet the requirements in accordance with the SAMREC Code
and S-K 1300. DRDGOLD obtained written consents from the Qualified Persons prior to publication of this report. The Qualified Person
responsible for the compilation and reporting of Ergo’s Mineral Resources is Mr Mpfariseni Mudau and for FWGR is Ms Diana van Buren.
The Qualified Person responsible for the compilation and reporting of Ergo’s Mineral Reserves is Professor Steven Rupprecht and for FWGR
is Mr Vaughn Duke .
Qualified Persons
Title
Address
Qualifications
Relevant years
Experience
Mpfariseni Mudau
Pr.Sci.Nat
400305/12
Director of The RVN
Group Proprietary
Limited
Willowbrook
Villas 21, Van
Hoof St,
Roodepoort, 1724
BSc (Hons) –
Geology, MSc
(Mining
Engineering)
16
Professor Steven Rupprecht
FSAIMM 701013
Associate Principal
Mining Engineer of
the RVN Group
Willowbrook
Villas 21, Van
Hoof St,
Roodepoort, 1724
BSc. Mining
Engineering PhD.
Mechanical
Engineering
35
Diana van Buren
Pr.Sci.Nat. 400107/14
Partner of Sound
Mining Solution
Proprietary Limited
Sound Mining
House, 2A Fifth
Avenue, Rivonia,
2128
BSc (Hons) –
Geology
16
Vaughn Duke
Pr.Eng 940314 FSAIMM 37179
Partner of Sound
Mining Solution
Proprietary Limited
Sound Mining
House, 2A Fifth
Avenue, Rivonia,
2128
BSc Mining
Engineering
(Hons), MBA
37
Mineral Reserves and Mineral Resources internal control disclosure
DRDGOLD’s prescribed internal control procedures. The control procedures include standard operating procedure, supervision of drilling by
experienced geologists, technical site visits by Qualified Persons, chain of custody and management approvals. Reputable commercial
laboratories perform the assaying of samples for gold. These laboratories have quality assurance and quality control measures in place that
satisfy Qualified Persons and also meet DRDGOLD’s requirements. The results are also submitted to the directors at Ergo and FWGR to
ensure that due process has been followed and to identify any anomalies. Verification of estimates is a routine part of the plant feed sampling
programme. Plant feed grades are compared to the expected grades from the Mineral Resource and Mineral Reserves and updated monthly.
Surveys are undertaken monthly, and a reconciliation is reported annually. Any adjustments for shortfall or overruns are made in the Mineral
Resource and Mineral Reserve statement for the following year. Gains or losses are largely related to volume adjustments on survey although
adjustment may be made for other reasons such as unexpected deleterious materials in the dump. The estimation of Mineral Reserves is an
outcome of life of mine and budget planning which runs annually, whereby capital costs, operating costs and other assumptions are interrogated
and approved at an executive committee level.
��
42
DRDGOLD's summary Mineral Resources (Including Mineral Reserves) as of June 30, 2022 are set forth in the tables below.
Mineral Resources (including Mineral Reserves)
Measured Resources
Indicated Resources
Inferred Resources
Total
(g/tonne)
(tonnes)
(g/tonne)
(tonnes)
(g/tonne)
(tonnes)
(g/tonne)
(tonnes)
Ergo
266.25
0.31
2.64
82.24
568.21
0.25
4.55
141.40
21.32
0.24
0.16
5.12
855.78
0.27
7.35
228.76
FWGR
229.37
0.33
2.46
76.39
-
-
-
-
-
-
-
-
229.37
0.33
2.46
76.39
Total
495.62
0.32
5.10
158.63
568.21
0.25
4.55
141.40
21.32
0.24
0.16
5.12
1,085.15
0.28
9.81
305.15
DRDGOLD's summary Mineral Resources (Exclusive of Mineral Reserves) as of June 30, 2022 are set forth in the tables below.
Mineral Resources (Exclusive of Mineral Reserves)
Measured Resources
Indicated Resources
Inferred Resources
Total
(g/tonne)
(tonnes)
(g/tonne)
(tonnes)
(g/tonne)
(tonnes)
(g/tonne)
(tonnes)
Ergo
66.04
0.26
0.55
17.17
375.41
0.25
3.02
93.85
21.32
0.24
0.16
5.12
462.77
0.25
3.73
116.14
FWGR
-
-
-
-
-
-
-
-
-
-
-
-
-
-
-
-
Total
66.04
0.26
0.55
17.17
375.41
0.25
3.02
93.85
21.32
0.24
0.16
5.12
462.77
0.25
3.73
116.14
1
Mineral Resources when stated exclusive of Mineral Reserves amount to zero for FWGR, because all of the Mineral Resources will be exploited and converted to Mineral Reserves
DRDGOLD's summary Mineral Reserves as of June 30, 2022 are set forth in the tables below.
Mineral Reserves
Proved Reserves
Probable Reserves
Total Reserves
(g/tonne)
(tonnes)
(g/tonne)
(tonnes)
(g/tonne)
(tonnes)
Ergo
200.21
0.33
2.09
65.02
192.79
0.24
1.49
46.27
393.00
0.28
3.58
111.29
FWGR
216.49
0.33
2.32
72.15
12.88
0.33
0.14
4.24
229.37
0.33
2.46
76.39
Total
416.70
0.33
4.41
137.17
205.67
0.25
1.63
50.51
622.37
0.30
6.04
187.68
The figures contained in the tables are rounded, which may result in minor computational discrepancies which are not deemed to be significant.
43
ITEM 4A. UNRESOLVED STAFF COMMENTS
None.
ITEM 5. OPERATING AND FINANCIAL REVIEW AND PROSPECTS
This section should be read in conjunction with, our audited financial statements and the other financial information contained
elsewhere in this Annual Report. Our financial statements have been prepared in accordance with International Financial Reporting Standards
(“
IFRS
”) as issued by the International Accounting Standards Board (“
IASB
”). Our discussion contains forward looking information based
on current expectations that involve risks and uncertainties, such as our plans, objectives and intentions. Our actual results may differ from
those indicated in such forward looking statements.
Comparison of financial performance for the fiscal year ended June 30, 2021 with fiscal year ended June 30, 2020
This comparison analysis can be found in Item 5A of the Company’s annual report on Form 20-F for the fiscal year ended June 30,
2021.
44
5A. OPERATING RESULTS
Business overview
We are a South African gold mining company engaged in surface gold tailings retreatment, including exploration, extraction,
processing and smelting. All our surface tailings retreatment operations, including the requisite infrastructure and metallurgical processing
plants, are located in South Africa.
The success of DRDGOLD’s long-term goal to extract as much gold from its assets as possible and is economically viable depends,
to a large extent, on how effectively it continues to manage its resources.
DRDGOLD’s strategic thinking is informed by principles of sustainable development. Our goal is to optimally exploit our entire
resource over the long term, thereby seeking sustainable benefits in respect to the following capitals, each of which is essential to our operation
– financial, manufactured, natural, human and social capital.
We also aim to align and overlap the interests of each of these capitals in such a manner that an investment in any one translates into
value-add in as many of the others as possible. We therefore seek to achieve an enduring and harmonious alignment between them, and we
pursue these criteria in the feasibility analysis of each investment.
, the following:
●
gold production decreased by 3kg to 5,720kg together with a decrease in gold sold by 20kg to 5,714kg. The decrease in production
reflected a 3% decrease in throughput to 28,189,000t, offsetting the 3% increase in average yield to 0.203g/t;
●
the average rand gold price received decreased by 3%; and
●
above inflationary increases in the cost of key consumables, diesel, steel and cyanide.
Key drivers of our operating results and principal factors affecting our operating results
●
the price of gold, which fluctuates both in terms of dollars and rands;
●
our production tonnages and gold content thereof, impacting on the amount of gold we produce at our operations;
●
our cost of producing gold, including the effects of mining efficiencies;
●
general economic factors, such as exchange rate fluctuations and inflation, and factors affecting mining operations in South Africa;
and
●
government policies that could materially impact our operations.
Gold price
Our revenues are derived primarily from the sale of gold produced at our surface tailings retreatment operations. As a result, our
operating results are directly related to the price of gold, which can fluctuate widely and is affected by numerous factors beyond our control,
including industrial and jewelry demand, expectations with respect to the rate of inflation, the strength of the U.S. dollar (the currency in which
the price of gold is generally quoted) and of other currencies, interest rates, actual or expected gold sales by central banks, forward sales by
producers, global or regional political or economic events, and production and cost levels in major gold-producing regions such as South
Africa. In addition, the price of gold is often subject to rapid short-term changes because of speculative activities. In response to the COVID-
19 pandemic and measures taken to deal with the outbreak, investors globally, as they have in so many previous times of crisis, turned to gold and
gold stocks as a safe haven asset, leading to a surge in the average gold price during fiscal year 2021 and the continued economic uncertainty along
with the slow economic recovery, consequences of the Ukraine conflict resulted in sustained high (although marginally lower) gold prices for fiscal
year 2022.
The demand for and supply of gold affects gold prices, but not necessarily in the same manner that supply and demand affect the
prices of other commodities. The supply of gold consists of a combination of new production from mining and existing stocks of bullion and
fabricated gold held by governments, public and private financial institutions, industrial organizations and private individuals.
The following table indicates data relating to the dollar gold spot prices for the 2022 and 2021 fiscal years:
2022 fiscal year
2021 fiscal year
Change
$ per ounce
$ per ounce
%
Closing gold spot price on June 30,
1,807
1,770
2
Lowest gold spot price during the fiscal year
1,684
1,676
-
Highest gold spot price during the fiscal year
2,070
2,072
-
Average gold spot price for the fiscal year
1,834
1,850
(1)
All our operations and gold production are based in South Africa, and as a result, the impact of movements in relevant exchange
rates is significant to our operating results. The average gold price in rand (based on average spot prices for the year) increased by 16% from
R24,466 per ounce in 2020 to R28,490 per ounce in 2021, and decreased by 2% to R27,896 per ounce in 2022.
An increase/(decrease) of 20% in the US dollar gold price throughout fiscal year 2022 would have increased/(decreased) revenue by
approximately R1,023.7 million (2021: R1,053.8 million).
45
An increase/(decrease) of 20% in the Rand to US dollar exchange rate throughout fiscal year 2022 would have increased/(decreased)
revenue by approximately R1,023.7 million (2021: R1,053.8 million).
Gold production
0.203g/t) from 183,999 ounces in fiscal year 2021 (produced from 29.1 million tonnes milled at an average yield of 0.197g/t). This was mainly
due to Ergo’s gold production which decreased to 133,618.0 ounces in fiscal year 2022 (produced from 22.1 million tonnes milled at an average
yield of 0.188g/t) from 137,059.0 ounces in fiscal year 2021 (produced from 23.0 million tonnes milled at an average yield of 0.186g/t). The
decrease was a result of a decrease in tonnes milled due to increased rainfall as well as lower grade material being mined.
In fiscal year 2021, gold production increased to 183,999 ounces (produced from 29.1 million tonnes milled at an average yield of
0.197g/t) from 174,385 ounces in fiscal year 2020 (produced from 26.3 million tonnes milled at an average yield of 0.206g/t). This was mainly
due to the first full year of gold production of FWGR resulting in production of 46,940 ounces (produced from 6.2 million tonnes milled at an
average yield of 0.237g/t), mitigating the impact of Ergo’s gold production which increased to 137,059.0 ounces in fiscal year 2021 (produced
from 23.0 million tonnes milled at an average yield of 0.186g/t) from 128,249.0 ounces in fiscal year 2020 (produced from 20.2 million tonnes
milled at an average yield of 0.197g/t). The increase was a consequence of stable production during fiscal 2021 compared to fiscal 2020 when
production suffered from the impact of the Lockdown, subsequent cautious ramp-up and interruptions in power supply from Eskom and the City
of Ekurhuleni.
Cash operating costs
(CODM) and is used to monitor performance – refer to Item 18. ‘‘Financial Statements - Note 23 – Operating Segments”. For a reconciliation
of this measure see Item 5A.: “Reconciliation of cash cost per kilogram, all-in sustaining costs per kilogram and all-in costs per kilogram”.
production of gold. Consumables, water and electricity, labor, specialized service providers and other costs are the largest components of cash
operating costs. A breakdown of cash operating costs into these costs is described in Item 5A.: “Comparison of financial performance for the
fiscal year ended June 30, 2022 with fiscal year ended June 30, 2021”.
General economic factors
We are exposed to a number of factors, which could affect our profitability, such as exchange rate fluctuations, inflation and other
risks relating to South Africa. In conducting mining operations, we are subject to the inherent risks and uncertainties of the industry, and the
wasting nature of the assets.
Effect of exchange rate fluctuations
For the fiscal years 2022 and 2021, all of our revenues were generated from South African operations, all of our operating costs were
denominated in rand and we derived all of our revenues in dollars before being translated to rands. As the price of gold is denominated in
dollars which is then translated into rands, the appreciation of the dollar against the rand increases our profitability, whereas the depreciation
of the dollar against the rand reduces our profitability.
In fiscal year 2022 the average Rand gold price received decreased by 3% compared to fiscal year 2021, this was a result of the
combined impact of the average Dollar gold price which decreased by 1% and the average exchange rate of the rand against the dollar that
strengthened by 1%.
In line with our long-term strategy of being an unhedged gold producer, we generally do not enter into forward gold sales contracts
to reduce our exposure to market fluctuations in the Dollar gold price or the exchange rate movements. If revenue from gold sales falls for a
substantial period below our cost of production at our operations, we could determine that it is not economically feasible to continue commercial
production at any or all of our plants or to continue the development of some or all of our projects. However, during periods when medium-
term debt is incurred to fund growth projects and hence introduce liquidity risk to the Group, we may mitigate this liquidity risk by entering
into hedging instruments to achieve price protection (refer Item 11. Quantitative and Qualitative Disclosures About Market Risk – General).
Effect of inflation and exchange rates
In the past, our operations have been materially adversely affected by inflation. If there is a significant increase in inflation in South
Africa, our costs will increase and if such a cost increase is not offset by an increase in the rand price of gold, this will negatively affect our
operating results.
The movements in the rand/dollar exchange rate, based upon average rates during the periods presented, and the local annual inflation
rate for the periods presented, as measured by the South African Consumer Price Index, or CPI, are set out in the table below:
46
Fiscal year ended
Year ended June 30,
2022
2021
2020
(%)
(%)
(%)
The average rand/dollar exchange rate (strengthened)/weakened by:
(1)
(2)
10
CPI (inflation rate)
7.4
4.9
2.2
Government policies that could materially impact operations
bodies. One of the key findings of the Frasers Institute weighing on South Africa’s investment appeal, is lack of regulatory certainty. Although
the industry’s successfully challenge of Mining Charter III in the High Court, that set aside certain provisions of the charter on the basis that it was
purported legislation (as opposed to policy) provided some certainty to the industry, turnaround in obtaining permits and regulatory approvals
remains slow, delaying the execution of key capital projects. The increasing prominence of ESG is also resetting the standard on transparency and
sustainability and society generally is far more environmentally and socially aware, applying increasing pressure through providers of capital and
the regulator to enforce compliance.
Production stoppages due to the impact of the COVID-19 pandemic on current operations
lockdown in South African (“
Lockdown
”). Operations gradually recommenced through April and May 2020. Subsequent lockdowns in fiscal
2021 did not resulting in any similar stoppages in production and during fiscal 2022 the national state of disaster implemented by the National
Government came to an end. (Refer to Item 4D. ‘‘Property, plant and production – Ergo Production and FWGR production”).
Key financial and operating indicators
The table below presents the key performance measurement data for the past two fiscal years: The financial results for the fiscal
years below are stated in accordance with IFRS as issued by the IASB. The table includes the key performance measures for our business and
its profitability, which are revenue, gold production, gold prices, operating costs, cash operating costs per kilogram, all-in sustaining costs per
kilogram and all-in costs per kilogram, capital expenditure (additions to property, plant and equipment) and Ore Reserves.
Financial and operating data
Year ended June 30,
2022
2021
Revenue (R'm)
5,118.5
5,269.0
Gold production (ounces)
183,902
183,999
Gold production (kilograms)
5,720
5,723
Gold sold (ounces)
183,709
184,352
Gold sold (kilograms)
5,714
5,734
Average spot gold price (R/kilogram)
896,877
915,972
Average gold price received (R/kilogram)
894,409
917,996
Cost of sales (R'm)
3,741.5
3,388.2
Operating costs (R'm)
3,506.5
3,122.5
Cash operating costs (R'm)
3,463.8
3,072.7
Cash operating costs (R/kilogram)
600,875
540,338
All-in sustaining costs (R/kilogram)
721,684
626,247
All-in costs (R/kilogram)
746,255
643,338
Additions to property, plant and equipment (R'm)
598.4
395.7
(1) Cash operating costs, cash operating costs per kilogram, all-in sustaining costs, all-in sustaining costs per kilogram and all-in costs
and all-in costs per kilogram are non-IFRS financial measures of performance that we use to monitor performance. A reconciliation of
these measures to the nearest IFRS measure is included in Item 5A.: “Operating Results - Reconciliation of cash cost per kilogram, all-in
sustaining costs per kilogram and all-in costs per kilogram.”
Revenue
Revenue decreased by 3% to R5,118.5 million in fiscal year 2022 from R5,269.0 million in fiscal year 2021 mainly due to the average
rand gold price received that decreased by 3% to R894,409 per kilogram and the 20kg decrease in gold sold from 5,734 kilograms in fiscal 2021
to 5,714 kilograms in fiscal 2022.
discussion regarding the gold price received and sales volumes.
47
Capital expenditure
During fiscal year 2022 capital expenditure increased by R202.7 million to R598.4 million from R395.7 million in fiscal year 2021.
Ergo’s capital expenditure during fiscal year 2022 increased by R173.3 million to R424.2 million from R250.9 million in fiscal year
2021. This was mainly due to upgrading of the 4A8 pump station & power supply amounting to R45.0 million, infrastructure development for
Marievale and Rooikraal dumps amounting to R204.5 million, various expenditure on the Brakpan/Withok TSF including decanting and slurry
lines amounting to R53.0 million and solar project plant related costs amounting to R59.1 million.
FWGR’s capital expenditure during fiscal year 2022 increased by R16.5 million to R159.8 million from R143.3 million in fiscal year
2021. This was mainly due to the completion of the construction of an additional thickener to all full closed circuit milling amounting to R47.7
million, final designs for the CPP, with the design work also being applicable to the potential expansion of DP2 amounting to R64.1 million
and the ongoing improvement of Driefontein 4 Tailings Storage Facility amounting to R6.3 million.
During fiscal year 2021, capital expenditure was R395.7 million primarily consisting of expenditure incurred on sustaining capital
expenditure on the reclamation site, the Brakpan/Withok TSF, the Brakpan plant, the commencement of the construction for the additional
thickener and the installation of the copper elution circuit.
Critical accounting policies
judgements that affect the application of the Group's accounting policies and reported amounts of assets and liabilities, income and expenses. By
their nature, judgements are subject to an inherent degree of uncertainty. Accounting assumptions, estimates and judgements are reviewed on an
ongoing basis. Revisions to reported amounts are recognized in the period in which the revision is made and in any future periods affected. Actual
results may differ from these estimates.
Management has discussed the development and selection of each of these critical accounting policies with the Board of Directors and
the Audit Committee, both of which have approved and reviewed the disclosure of these policies. This discussion and analysis should be read in
conjunction with the consolidated financial statements and related notes included in Item 18. “Financial Statements”.
Critical accounting policies that require significant judgment
consolidated financial statements and could potentially impact our financial results and future financial performance:
●
Payments made under protest: Judgement regarding the outcome of the matter, and
●
Contingencies: Judgement regarding the outcome of the respective matters
Payments made under protest
Electricity Tariff Dispute (refer Item 18. ‘‘Financial Statements - Note 24 Payments made under protest”) requires the exercise of significant
judgement.
and complexities and are subject to interpretation.
Contingencies
future events. Litigation and other judicial proceedings inherently entail complex legal issues that are subject to uncertainties and complexities and
are subject to interpretation.
Critical accounting policies that require significant assumptions and estimates
in the preparation of our consolidated financial statements, and are therefore considered DRDGOLD’s critical accounting estimates which could
potentially impact our financial results and future financial performance:
●
Depreciation: Estimation of the life-of-mine
●
Provision for environmental rehabilitation: Estimation of future environmental rehabilitation costs
●
Income tax: Estimation of the deferred tax rate
●
Payments made under protest: Estimation of the carrying value and recoverability
●
Other investments: Estimation of the fair value of financial assets
48
Depreciation: Estimation of life-of-mine
calculated using the units of production method which is based on the life-of-mine of each site. The life-of-mine is primarily based on proved
and probable mineral reserves. It reflects the estimated quantities of economically recoverable gold that can be recovered from reclamation
sites based on the estimated gold price. Changes in the life-of-mine will impact depreciation on a prospective basis. The life-of-mine is prepared
using a methodology that takes account of current information to assess the economically recoverable gold from specific reclamation sites and
includes the consideration of historical experience.
Provision for environmental rehabilitation: Estimation of future environmental rehabilitation costs
the obligation based on current prices. The unwinding of the obligation is included in profit or loss. Estimated future costs of environmental
rehabilitation are reviewed regularly and adjusted as appropriate. Changes in estimates are capitalized or reversed against the related asset but taken
to profit or loss if there is no related asset left. Gains or losses from the expected disposal of assets are not taken into account when determining
the provision.
in accordance with regulatory requirements, the life-of-mine plan and the planned method of rehabilitation which is influenced by developments
in trends and technology.
Income tax: Estimation of the deferred tax rate
reporting purposes and the amounts used for tax purposes. The deferred tax liability is calculated by applying a forecast weighted average tax rate
that is based on a prescribed formula. The calculation of the forecast weighted average tax rate requires the use of assumptions and estimates and
are inherently uncertain and could change materially over time. These assumptions and estimates include the expected future profitability and
timing of the reversal of the temporary differences. Due to the forecast weighted average tax rate being based on a prescribed formula that increases
the effective tax rate with an increase in forecast future profitability, and vice versa, the tax rate can vary significantly year on year and can move
contrary to current period financial performance.
Payments made under protest: Estimation of the carrying value and recoverability
uncertain and can change materially over time and includes the discount rate and discount period.
ultimate settlement terms (refer Item 18. ‘‘Financial Statements - Note 24 Payments made under protest”), the discount rate applied and the
assessment of recoverability.
Recognition and measurement
protest”) and that are payments made under protest is initially measured at a discounted amount and any difference between the face value of
payments made under protest and the discounted amount on initial recognition is recognised in profit or loss as a finance expense. Subsequent to
initial recognition, the Payments made under protest is measured using the effective interest method to unwind the discounted amount to the
original face value less any write downs for recovery. Unwinding of the carrying value and changes in the discount period are recognised in the
statement of profit or loss.
evidence that the full amount is no longer expected to be recovered. The Group considers the reasonable and supportable information related to
the creditworthiness of Ekurhuleni Metropolitan Municipality and events surrounding the outcome of the Main Application (refer Item 18.
‘‘Financial Statements - Note 24 Payments made under protest”). Any write down is recognised in the statement of profit or loss.
materially over time. It includes several assumptions that are based on both observable and unobservable inputs. Assumptions applied in the
estimation of the fair value of the investment in Rand Refinery include the following:
49
Amounts in R million
Observable/unobservable
input
Unit
2022
2021
Rand Refinery operations
Average gold price
Observable input
R/kg
Average silver price
Observable input
R/kg
Average South African CPI
Observable input
%
4.4
4.4
South African long-term government bond rate
Observable input
%
10.26
9.5
Terminal growth rate
Unobservable input
%
4.4
4.4
Weighted average cost of capital
Unobservable input
%
15.9
15.1
Investment in Prestige Bullion
Discount period
Unobservable input
Year
s
11
12
Cost of equity
Unobservable input
%
14.2
16.5
respectively. The latest budgeted cash flow forecasts provided by Rand Refinery as at June 30, 2022 was used, and therefore classified as an
unobservable input into the models.
New standards, amendments to standards and interpretations
relevant standards, amendments to standards and interpretations that may be applicable to the business of the Group and may have an impact on
future consolidated financial statements.
Comparison of financial performance for the fiscal year ended June 30, 2022 with fiscal year ended June 30, 2021
Gold revenue
The following table illustrates the year-on-year change in gold revenue for fiscal year 2022 in comparison to fiscal year 2021:
R million
Total
Impact of change in amount
of gold sold
Impact of
change in
gold price
Net change
Total
gold revenue
gold revenue
2021
2022
Ergo
3,939.9
(135.1)
(104.7)
(239.8)
3,700.1
FWGR
1,323.9
116.1
(29.4)
86.7
1,410.6
Consolidated
5,263.8
(19.0)
(134.1)
(153.1)
5,110.7
Gold revenue decreased by R153.10 million, or 3%, to R5,110.7 million during fiscal year 2022. This was mainly due to the average
rand gold price received which decreased by 3% to R894,409 per kilogram and a marginal decrease in gold sold from 184 350 ounces to 183 709
ounces.
Cost of sales
of R267.6 million, a positive movement in gold in process of R30.4 million and a positive movement in the change in estimate of environmental
rehabilitation of R2.2 million. These are discussed as follows:
Operating costs
increase is mainly due to general higher inflation in fiscal year 2022 as well as above inflation increase in the costs of key consumables, diesel,
steel and cyanide.
50
Depreciation
Depreciation charges were R267.6 million for fiscal year 2022 compared to R252.5 million for fiscal year 2021. Depreciation charges
increased as a result of increased capital expenditure over the last two fiscal years.
Change in estimate of environmental rehabilitation
As of June 30, 2022, we estimate our total environmental rehabilitation provision, being the discounted estimate of future costs, to
be R517.7 million as compared to R570.8 million at June 30, 2021. A change in estimate of environmental rehabilitation of R2.2 million was
recognized due to changes in the estimated timing of the vegetation of non-viable reclamation sites and dormant infrastructure. In addition, a
R67.2 million decrease in the provision due to the increase in the Ergo life of mine.
A total of R589.8 million (2021: R87.5 million) is invested in funds held in insurance instruments to secure financial guarantees
provided to the DMRE through an insurance cell captive company, the Guardrisk Cell Captive. The increase is attributable to the transfer from
the environmental trust funds to the Guardrisk Cell Captive along with growth of R10.4 million on these funds during fiscal year 2022. As at
June 30, 2022, guarantees amounting to R614.0 million were in issue to the DMRE (2021: R430.1 million). Any shortfall between the invested
funds and the estimated provisions is expected to be financed by contributions to the Guardrisk Cell Captive from time to time as required over
the remaining production life of the respective mining operations and, at the time of mine closure, the proceeds on the disposal of remaining
assets and gold from plant clean-up. The transfer of the funds from the environmental trust fund to the Guardrisk Cell Captive was completed
after the required approvals for the change in method and transfer of the environmental trust funds were obtained from the DMR and a thorough
consideration of tax and legal impacts was performed.
As a result, a total of R0.0 million remained in our various environmental trust funds as at the end of fiscal year 2022, as compared to
R564.7 million at the end of fiscal year 2021. Up to the time of the transfer, R 14.8 million of interest was received on these funds during fiscal
year 2022.
Movements in gold in process
Movement in gold in process in fiscal year 2022 amounted to R30.4 million mainly due to an increase in the lock up of gold in
process at the plants and finished inventories - Gold Bullion.
Administration expenses and general costs
Administration expenses and general costs increased by R97.2 million from R64 million in fiscal year 2021 to R161.2 million in
fiscal year 2022. Administration expenses and general costs in fiscal year 2021 included a share-based payments benefit of R44.3 million. The
share-based payment benefit in 2021 was mainly due to the remeasurement of the cash-settled share-based payment liability at a seven-day
volume weighted average price (VWAP) of the DRDGOLD share from R25.14 at June 30, 2020 to R18.62 at November 5, 2020. This liability
was fully settled on November 5, 2020. In addition, transaction and exploration costs increased from R3.1 million in fiscal year 2021 to R15.2
million in fiscal year 2022 as well as an increase in other administration expenses and other costs of R13.1 million related to short term incentives
and information technology.
Finance income
Finance income increased from R216.2 million in fiscal year 2021 to R225.8 million in fiscal year 2022, mainly due to an increase
in interest income earned of R3.9 from higher cash and cash equivalents balances during the year and an unrealized foreign exchange gain of
R7.0 million in fiscal year 2022 compared to an unrealized foreign exchange loss in 2021 which was recognized in finance expense.
Finance expense
Finance expenses increased from R69.5 million in fiscal year 2021 to R74.8 million in fiscal year 2022, mainly attributable to
discount on the initial payment made under protest of R21.1 million compared to R7.4 million in fiscal year 2021. This increase was in part
offset by the unrealized foreign exchange loss of nil in fiscal year 2022 compared to R8.4 million in fiscal year 2021.
Income tax
Income tax amounted to a charge of R334.3 million for fiscal year 2022 (2021: charge of R523.7 million) and consists of a current
tax charge of R261.5 million (2021: charge of R423.7 million) and deferred tax charge of R72.7 million (2021: deferred tax charge of R100
million).
The current tax decreased to R261.5 million in fiscal year 2022 from R423.7 million in fiscal year 2021 mostly due to a decrease in
the taxable mining income of both Ergo and FWGR resulting mainly from a decrease in profits as well as increased capital expenditure for
which full capital redemption under section 36 of the Income Tax Act was applied.
The forecast weighted average deferred tax rate for both Ergo and FWGR decreased in fiscal year 2022 to 22% and 29% respectively
from 25% and 30% respectively in fiscal year 2021. The decrease is due to a change in the gold mining tax formula and the updated life of
mine plan. Refer to Item 10E.: Taxation – “Income Tax and Withholding Tax on Dividends” for a detailed explanation on changes in taxation
laws and regulations.
51
Non-IFRS Measures
Set forth below is a discussion of non -IFRS measures presented in this report, including a reconciliation of such measures from the
nearest measure under IFRS, as well as an explanation as to why we believe that presentation of such information provides useful information
to investors and additional purposes, if any, for which we use such measures.
Adjusted earnings before interest, tax, depreciation and amortization (“Adjusted EBITDA”)
Set forth below is a presentation of our Adjusted EBITDA, which is a non-IFRS measure, including the items included in this measure
and a reconciliation from profit for the year. Our calculation of Adjusted EBITDA is based on the calculation of this measure as included in
our RCF agreement and may not be comparable to similarly titled measures of other companies. Adjusted EBITDA is not a measure of
performance under IFRS and should be considered in addition to, and not as a substitute for, other measures of financial performance and
liquidity. We consider Adjusted EBITDA for the purpose of evaluating compliance with the covenants imposed by the Company’s borrowing
agreements entered into during fiscal year 2019. The Group considers the presentation of Adjusted EBITDA provides useful information to
investors to enable investors to assess compliance with our historic covenants in the RCF agreement.
Year ended, June 30
Reconciliation of adjusted EBITDA
2022
2021
Profit for the year
1,123.8
1,439.9
Income tax
334.3
523.7
Profit before tax
1,458.1
1,963.6
Finance expense
74.8
69.5
Finance income
(225.8)
(216.2)
Results from operating activities
1,307.1
1,816.9
Depreciation
267.6
252.5
Share based payment (benefit)/expense
18.4
(28.3)
Change in estimate of environmental rehabilitation recognised in profit or loss
(2.2)
(12.4)
Gain on disposal of property, plant and equipment
(6.6)
(0.1)
IFRS 16 Lease payments
1
(23.8)
(15.8)
Exploration expenses and transaction costs
15.2
3.1
Adjusted earnings before interest, tax depreciation and amortisation ("Adjusted EBITDA")
1,575.7
2,015.9
1
The amended RCF includes IFRS 16 lease payments in the calculation of the adjusted EBITDA.
2
See Glossary of Terms for definitions.
Cash operating costs, cash operating costs per kilogram, all-in sustaining costs and all-in costs per kilogram
Cash operating costs, cash operating costs per kilogram, all-in sustaining costs per kilogram and all-in costs per kilogram are non-
IFRS financial measures that should not be considered by investors in isolation or as alternatives to cost of sales, net profit/(loss) attributable
to equity owners of the parent, profit/(loss) before tax and other items or any other measure of financial performance presented in accordance
with IFRS or as an indicator of our performance. While the World Gold Council has provided guidance for the calculation of cash operating
costs, cash operating costs per kilogram, all-in sustaining costs and all-in costs per kilogram, such measurements may vary significantly among
gold mining companies, and these definitions by themselves do not necessarily provide a basis for comparison with other gold mining
companies. However, we believe that these measures are useful indicators to investors and our management of an individual mine's
performance and of the performance of our operations as a whole as they provide:
●
an indication of a mine’s profitability and efficiency;
●
the trend in costs;
●
a measure of margin per kilogram, by comparison of the cash operating costs per kilogram to the price of gold; and
●
a benchmark of performance to allow for comparison against other mines and mining companies.
52
For fiscal year 2022, consolidated cash operating costs per kilogram increased by 11% to R600,875 per kilogram from R540,338 per
kilogram in fiscal year 2021. Consolidated all-in sustaining costs per kilogram increased by 15% to R721,684 per kilogram in fiscal year 2022
from R626,247 per kilogram in fiscal year 2021. Consolidated all-in costs per kilogram increased by 16% to R746,255 per kilogram of gold
in fiscal 2022 from R643,338 per kilogram of gold in fiscal year 2021.
The increase in consolidated cash operating costs per kilogram, all-in sustaining costs per kilogram and all-in costs per kilogram was
mainly due to an increased in cash operating costs, which is due to higher inflation of 7.4% in fiscal 2022 in comparison to 4.9% fiscal 2021
and above inflationary increases in the costs of key consumables, diesel, steel and cyanide.
The increase in sustaining capital expenditure during fiscal year 2022 contributed to the increase in all-in sustaining costs per
kilogram. The increase in growth capital expenditure incurred during fiscal year 2022 similarly contributed to the increase in all-in costs per
kilogram.
Reconciliation of cash operating costs, cash operating costs per kilogram, all-in sustaining costs, all-in
sustaining costs per kilogram, all-in costs and all-in costs per kilogram
R millions
2022
2021
Cost of sales
3,741.5
3,388.2
Depreciation
(267.6)
(252.5)
Change in estimate of environmental rehabilitation
2.2
12.4
Movement in gold in process
30.4
(25.6)
Operating costs
3,506.5
3,122.5
Ongoing rehabilitation expenditure
(31.6)
(48.3)
Care and maintenance costs
(5.9)
(3.9)
Other operating income/(costs)
(5.2)
2.4
Cash operating costs
3,463.8
3,072.7
Movement in gold in process
(30.4)
25.6
Administration expenses and other costs excluding non-recurring items
146.0
109.7
Other operating income/(costs)
5.1
(2.4)
Change in estimate of environmental rehabilitation
(2.2)
(12.4)
Unwinding of rehabilitation provision
45.0
44.7
Sustaining capital expenditure
496.4
353.0
All-in sustaining costs
1
4,123.7
3,590.9
Care and maintenance costs
5.9
3.9
Ongoing rehabilitation expenditure
31.6
48.3
Exploration expenses and transaction costs
15.2
3.1
Growth capital expenditure
87.7
42.7
All-in costs
4,264.1
3,688.9
Gold produced (kilograms)
5,720
5,723
Cash operating costs per kilogram (R per kilogram)
600,875
540,338
All-in sustaining costs per kilogram (R per kilogram)
721,684
626,247
All-in costs per kilogram (R per kilogram)
746,255
643,338
Reconciliation of sustaining capital expenditure and growth capital expenditure
Additions - property, plant and equipment owned
584.1
395.7
Less
Growth capital expenditure
87.7
42.7
Sustaining capital expenditure
496.4
353.0
1
See Glossary of Terms for definitions.
53
Cash operating costs
2021
.
R million
Cash operating
costs
Impact of change in
throughput
Impact of change in
costs
Net change
Cash operating
costs
2021
2022
Ergo
2,666.5
(97.7)
441.0
343.3
3,009.8
FWGR
406.2
(5.3)
53.1
47.8
454.0
Total
3,072.7
(103.0)
494.1
391.1
3,463.8
Cash operating costs in fiscal year 2022 increased by R391.1 million to R3,463.8 million compared to cash operating costs of
R3,072.70 million in fiscal year 2021.The increase is due to higher inflation of 7.4% in fiscal year 2022 in comparison to 4.9% fiscal year 2021
and above inflationary increases in the costs of key consumables, diesel, steel and cyanide.
below respectively:
Ergo
FWGR
Years ended
Year ended
Costs
2022
2021
Costs
2022
2021
Consumables
29%
28%
Consumables
32%
33%
Labor
18%
19%
Labor
21%
20%
Electricity and water
18%
18%
Specialized service providers
9%
9%
Specialized service providers
16%
16%
Electricity and water
19%
12%
Machine hire
4%
4%
Machine hire
2%
2%
Security expenses
4%
4%
Security expenses
5%
5%
Other costs
11%
11%
Other costs
12%
19%
5B. LIQUIDITY AND CAPITAL RESOURCES
Cash flows from operating activities
600,875 per kilogram and an 3% decrease in the average rand gold price received to R894,409 per kilogram. Net movement in working capital
(changes in trade and other receivables, consumable stores and stockpiles and trade and other payables) amounted to a cash inflow of R78.1 million
in fiscal year 2022.
Cash flows from investing activities
Net cash utilized by investing activities amounted to R626.2 million in fiscal year 2022 compared to R446.6 million in fiscal year 2021.
In fiscal year 2022, net cash utilized by investing activities consisted mainly of R584.1 million in additions to property, plant and
equipment, R28.9 million investment in other funds and R25.4 million spent on environmental rehabilitation payments. These outflows were
reduced by R12.2 million proceeds on the disposal of property, plant and equipment.
In fiscal year 2021, net cash utilized by investing activities consisted mainly of R395.7 million in additions to property, plant and
equipment and R51.0 million spent on environmental rehabilitation payments. These outflows were reduced by R0.1 million proceeds on the
disposal of property, plant and equipment.
Cash flows from financing activities
Net cash outflow from financing activities was R533.0 million in fiscal year 2022 compared to net cash outflows of R653.5 million in
fiscal year 2021.
54
During fiscal year 2022, the net cash outflow consisted mostly of dividends paid on ordinary shares amounting to R513.3 million.
During fiscal year 2021, the net cash outflow consisted mostly of dividends paid on ordinary shares amounting to R640.9 million.
Cash and cash equivalents
2021. Substantially all of our cash and cash equivalents balances were denominated in South African rand. Cash and cash equivalent denominated
in foreign currency amounted to USD3.4 million at June 30, 2022 compared to USD3.4 million at the end of fiscal year 2021.
at the end of fiscal year 2021.
Borrowings and funding
At June 30, 2022 our external sources of capital included our RCF. At September 30, 2022, we had no external sources of capital.
In September 2020, the RCF was amended. The amendments include a reduction in the size of the facility from R300 million to R200
million as well as removing any commitment towards the performance guarantee issued to Ekurhuleni Metropolitan Municipality. No amounts
were drawn under this facility as of June 30, 2022 or up to the expiry date of September 14, 2022. The RCF has not been renewed as funding
requirements for capital projects is currently being evaluated.
Anticipated funding requirements and sources
resources, net cash generated from operations and long term finance options for long term capital projects will be sufficient to meet the anticipated
commitments of our existing operations for fiscal year 2023. As a result of the sustained high rand gold price, at September 30, 2022 the Group
has a cash and cash equivalents balance of R2,245.1 million. Liquidity has been enhanced by the continued high rand gold price levels.
5C. RESEARCH AND DEVELOPMENT, PATENTS AND LICENSES, ETC.
DRDGOLD has a dedicated team that looks at ways and means of improving recoveries. While the team remains active with an ongoing
focus on improving extraction efficiencies, the projects undertaken during the year ended June 30, 2022 were focused on optimizing the existing
facilities rather than implementing new technologies to improve extraction efficiencies. We have no registered patents or licenses.
5D. TREND INFORMATION
Any sustained decline in the market price of gold from the current elevated gold price levels would adversely affect us, and any
decline in the price of gold below the cost of production could result in the closure of some or all of our operations which would result in
significant costs and expenditure, such as, incurring retrenchment costs earlier than expected which could lead to a decline in profits, or losses.
In addition, as most of our production costs are in rands, while gold is sold in dollars and then converted to rands, our results of operation and
financial condition have been and could be in the future materially affected by an appreciation in the value of the rand. Accordingly, any
sustained decline in the dollar price of gold and/or the strengthening of the South African rand against the dollar would negatively and adversely
affect our business, operating results and financial condition.
unit cost of approximately R685,000 per kilogram and expect a capital investment of approximately R1 400 million.
Reconciliation of budgeted cost of sales to budgeted cash operating costs (R’million)
Cost of sales
3 954.8
Reconciling items
1
(318.1)
Cash operating costs
3 636.7
1
Includes expected depreciation of R274.4 million, ongoing environmental expenses of R37.1 million and care and maintenance expenses of R6.6 million
2
See glossary of terms for definition
Rounding of figures may result in computational discrepancies
Our ability to meet the full year’s production target could be impacted in a number of ways, including stoppages in production due to outbreaks of
infections if the COVID-19 virus mutates and spreads in our workforce and interruptions to our supply chain. It could also be impacted by lower
grades, failure to achieve the throughput targets set at Ergo and FWGR, power interruptions and other risks (refer Item 3D. Risk Factors—Risks
related to our business and operations and “–Forward Looking Statements”). We are also subject to cost pressures in the event of above inflation
increases in labor, key consumables, diesel, steel and cyanide. Unforeseen changes in ore grades and recoveries, unexpected changes in the quality
55
or quantity of reserves and resource, technical production issues, environmental and industrial accidents, gold theft, environmental factors and
pollution could adversely impact the production, sales and cash operating costs for fiscal year 2023 and cause us to fail to meet our targets for the
year.
trends in the US Dollar gold price as well as exchange rates impacting our business.
Operating results for the quarter ended September 30, 2022
56
Quarter ended
Quarter ended
Sep 30, 2022
Jun 30, 2022
% change
Production
Gold produced
kg
1,453
1,443
1%
oz
46,715
46,393
1%
Gold sold
kg
1,442
1,446
0%
oz
46,362
46,490
0%
Ore milled
Metric (000't)
7,157
7,064
1%
Yield
Metric (g/t)
0.203
0.204
0%
Reconciliation of adjusted EBITDA
(R'million)
Profit for the period
253.4
399.3
Income tax
116.5
71.2
Profit before tax
369.9
470.5
Finance expense
17.3
29.1
Finance income
(54.8)
(79.4)
Results from operating activities
332.4
420.2
Depreciation
55.0
64.1
Share based payment expense
3.9
4.6
Change in estimate of environmental
rehabilitation recognised in profit or loss
-
(2.2)
Gain on disposal of property, plant and
equipment
-
(6.6)
IFRS 16 Lease payments
1
(5.9)
(8.2)
Exploration expenses and transaction costs
1.0
5.4
Adjusted EBITDA
1,2*
386.4
477.3
1
The amended RCF includes IFRS 16 lease
payments in the calculation of the adjusted
EBITDA
2
See Glossary of Terms for definitions.
* The adjusted EBITDA may not be comparable to similarly titled measures of other companies. Adjusted EBITDA is not a measure of performance under IFRS and should be
considered in addition to, and not as substitute for other measures of financial performance and liquidity
Reconciliation of cash operating costs, cash operating costs per kilogram, all-in sustaining costs, all-in sustaining
costs per kilogram, all-in costs and all-in costs per kilogram
(R'millions)
Cost of sales
1,007.6
1,003.7
Depreciation
(55.0)
(64.1)
Change in estimate of environmental
rehabilitation
-
2.2
Movement in gold in process
4.4
4.0
Operating costs
957.0
945.8
Ongoing rehabilitation expenditure
(6.2)
(4.4)
Care and maintenance costs
(0.8)
(0.9)
Other operating income/(costs)
4.1
(2.7)
Cash operating costs
954.1
937.8
Movement in gold in process
(4.4)
(4.0)
Administration expenses and other costs
excluding non-recurring items
26.8
8.4
Other operating (income)/Costs
(4.1)
2.7
Change in estimate of environmental
rehabilitation
-
(2.2)
Unwinding of rehabilitation provision
13.2
8.4
Sustaining capital expenditure
101.2
314.8
All-in sustaining costs
1
1,086.8
1,265.9
Care and maintenance costs
0.8
0.9
Ongoing rehabilitation expenditure
6.2
4.4
Exploration expenses and transaction costs
0.9
5.4
57
Growth capital expenditure
53.6
(16.8)
All-in costs
1,148.3
1,259.8
Quarter ended
Quarter ended
September 30,
2021
June 30, 2021
% change
Price and costs
Average gold price received
R per kg
945,983
937,509
-
US$ per oz
1,727
1,871
-8%
Cash operating costs
R/t
133
133
-
US$/t
8
9
-11%
Cash operating costs
R per kg
658,530
645,782
2%
US$ per oz
1,202
1,289
-7%
All-in sustaining costs **
R per kg
755,201
875,450
-14%
US$ per oz
11,378
1,747
551%
All-in cost **
R per kg
796,255
871,162
-9%
US$ per oz
1,453
1,739
-16%
Capital expenditure
Sustaining
Rm
101.2
314.8
-68%
US$m
5.9
20.2
-71%
Non-sustaining/growth
Rm
53.6
(16.8)
-419%
US$m
3.1
(1.1)
-382%
Average R/US$ exchange rate
17.04
15.58
9%
Reconciliation of sustaining capital
expenditure
Additions - property, plant and equipment
owned
154.8
298.0
Less
101.2
314.8
Sustaining capital expenditure
53.6
(16.8)
1
See Glossary of Terms for definitions.
Rounding of figures may result in computational discrepancies
**
All-in cost definitions based on the guidance note on non-GAAP Metrics issued by the World Gold Council on 27 June 2013
.
throughput despite yield being 0.001g/t lower at 0.203g/t. Gold sold decreased by 4kg to 1,442kg.
quarter to R658,530/kg. The cash operating costs per tonne of material remained stable from the previous quarter
at R133/t.
respectively, decreasing quarter on quarter mainly due to a decrease in sustaining capital expenditure in
comparison to the previous quarter.
claim of R84.7 million recognised in the previous quarter.
2022: R2,525.6 million) after paying the final cash dividend of R342.5 million for the year ended June 30, 2022.
expenditure programme for the year ending June 30, 2023.
position to, in the absence of unforeseen events, consider declaring an interim cash dividend in or around
February 2023.
58
5E. Critical Accounting Estimates
For more information on environmental rehabilitation obligations Note 2 - “Use of accounting assumptions, estimates and
judgements” under Item 18. “Financial Statements".
ITEM 6. DIRECTORS, SENIOR MANAGEMENT AND EMPLOYEES
6A. DIRECTORS AND SENIOR MANAGEMENT
Directors and Executive Officers
nine directors.
board of directors, on a rotating basis, are subject to re-election at each annual general shareholders’ meeting. Additionally, all directors are subject
to election at the first annual general meeting following their appointment. Retiring directors normally make themselves available for re-election.
2021. Mr Timothy Cumming, a non-executive director of the Company, replaced Mr Campbell as chairman of the Board and the Nominations
Committee with effect on December 1, 2021, after shareholder approval was obtained at the Annual General Meeting held on November 29, 2021.
In order to ensure good corporate governance in accordance with the recommendations of the King IV Report on Corporate Governance for South
Africa 2016, Mr Edmund Jeneker will remain as the lead independent director of the Company.
effective August 19, 2021.
Item 4A. Information on the Company – Introduction for the company’s address.
Executive Directors
Daniël (Niel) Johannes Pretorius (55) (BProc, LLB, LLM)
Chief Executive Officer;
• Member: Risk Committee
Niël Pretorius has two decades of experience in the mining industry. He was appointed Chief Executive Officer designate of DRDGOLD
on August 21, 2008 and Chief Executive Officer on January 1, 2009. Having joined the company on May 1, 2003 as legal advisor, he was promoted
to Group Legal Counsel on September 1, 2004 and General Manager: Corporate Services on April 1, 2005. Niël was appointed Chief Executive
Officer of Ergo Mining Operations Proprietary Limited (formerly DRDGOLD SA) on July 1, 2006 and became Managing Director thereof on
April 1, 2008. Niël also serves as an elected Council Member with the Minerals Council of South Africa.
Chief Financial Officer.
• Member: Social and Ethics Committee
industry, the majority obtained in the mining industry in Africa. As part of gaining that experience, Riaan provided assurance and advisory services,
including support and training on IFRS to clients and teams across the African continent. He has spent seven years at KPMG as an audit partner,
performing,
inter alia
, audits of listed companies in the mining industry, including SEC registrants. Riaan has also gained experience as an IFRS
technical partner and represented the South African Institute of Chartered Accountants on the International Accounting Standards Board’s project
on extractive activities from 2003 to 2010. Riaan has served on committees that compile/update the South African codes for reporting and valuation
of mineral reserves and resources. Riaan is a member of the Social & Ethics Committee of DRDGOLD.
Non-Executive Directors
Non-executive Chairman
• Chairman: Board and Nominations Committee
• Member: Risk Committee; and Remuneration Committee
member of the Risk Committee, Remuneration Committee, and appointed Chairman of the Nominations Committee on December 1, 2021. He is
also an independent non-executive director of Sibanye-Stillwater Limited and Nedgroup Investments Limited and serves as non-executive
Chairman of Riscura Holdings Limited. His career spans mining, financial services and consulting. He is the founder of Scatterlinks Proprietary
Limited, a South African-based company providing leadership development and advisory services to senior business executives. Tim started out
59
as an engineer at the Anglo American Corporation of South Africa Limited working on a number of gold and diamond mines including involvement
in the geo-technical design of the Ergo tailings dam. Thereafter he held senior roles in financial services including General Manager at Allan Gray
Limited, Head of Investment Research at HSBC Securities (SA), CEO of Old Mutual Asset Managers and MD of various divisions within the Old
Mutual Group. Other involvements include Chairmanship of the Mandela Rhodes Foundation’s Investment Committee and the Woodside
Endowment Trust and membership of the Greenpop advisory board (a social enterprise committed to restoring ecosystems and sustainable
development).
Edmund Abel Jeneker (60) (Chartered Director (SA), B Hons, IEDP, M.Inst.D., SAIPA)
Lead Independent Non-executive Director
• Chairman: Social and Ethics Committee
• Member: Remuneration Committee; and Nominations Committee
Edmund Jeneker was appointed Non-executive Director in November 2007 and Lead Independent Non-executive Director in August
2017. He has more than 31 years’ experience as an executive in banking, business strategy, advisory and management at Grant Thornton South
Africa Proprietary Limited, Swiss Re Corporate Solutions Advisors South Africa Proprietary Limited, the World Bank Competitiveness Fund
and Deloitte South Africa. More recently, he completed almost 15 years at Absa Bank and Barclays Africa Group, where he was Managing
Executive and served as director on the boards of several subsidiaries in the Barclays Africa Group. Edmund is active in community social
upliftment and served as a member of the Provincial Development Commission of the Western Cape Provincial Government. He currently
serves on the Advisory Board of the Institute of Directors Southern Africa, investment committee of BADISA and The Cape Philharmonic
Orchestra. He is a Chartered Director (South Africa). Edmund chairs the Social & Ethics Committee and is a member of the Remuneration
Committee and the Nominations Committee of DRDGOLD.
Johan Andries Holtzhausen (76) (BSc (Geology and Chemistry), BCompt (Hons), CA(SA))
Independent Non-executive Director
• Chairman: Audit Committee
• Member: Remuneration Committee; and Nominations Committee
University of South Africa. He has been a Chartered Accountant (South Africa) since 1975. He was appointed independent Non-executive
Director in on April 25, 2014. He has more than 43 years’ experience in the accounting profession, having served as a senior partner at KPMG
Services Proprietary Limited, and held the highest Generally Accepted Accounting Principles (United States), Generally Accepted Auditing
Standards and Sarbanes-Oxley Act accreditation required to service clients listed on stock exchanges in the United States. His clients included
major corporations listed in South Africa, Canada, the United Kingdom, Australia and the United States. He also chairs the Audit and Risk
Committee of Tshipi é Ntle Manganese Mining Proprietary Limited. He is a Non-executive Director of Caledonia Mining Corporation Plc, a
Canadian corporation listed in the United States and the United Kingdom. Johan chairs the Audit Committee and is a member of the
Remuneration Committee and the Nominations Committee of DRDGOLD.
Independent Non-executive Director
• Chairman: Remuneration Committee
• Member: Audit Committee; Remuneration Committee; and Risk Committee
the CFA (AIMR) qualification. Mr. Nel has 20 years of mining finance and mining executive and operational management experience. He was
appointed to the Aquarius Platinum Board in April 2012 and became CEO of the Group in November 2012, a position he held until Aquarius
Platinum was acquired by Sibanye- Stillwater in April 2016. From April 2016 to January 2017 he was the CEO of the Platinum division of
Sibanye Stillwater. He is currently a Non-executive director of Mimosa Investments which owns the Mimosa platinum mine in Zimbabwe and
Tongaat Hulett
. Jean chairs the Remuneration Committee and is a member of the Audit Committee and the Risk Committee of DRDGOLD.
Independent Non-executive Director
• Member: Social and Ethics Committee, Nominations Committee; and Remuneration Committee
the KaNgwane homeland, before becoming a legal advisor for the Eastern Cape Development Corporation. She has held directorships on
company boards including Gijima, EOH Mthombo Proprietary Limited, AllPay Eastern Cape Proprietary Limited, a subsidiary of ABSA
Limited, and the Ryk Neethling Foundation. She currently holds the position of CEO of Vitom Technologies Proprietary Limited and Vitom
Brands Communication Proprietary Limited. Toko is a member of the Remuneration Committee, Nominations Committee, and the Social &
Ethics Committee of DRDGOLD.
Kuby Prudence Lebina (41) (BCom; Higher Diploma (Accounting), Certificate in Business Leadership, CA (SA))
Independent Non-executive Director
• Chairman: Risk Committee
• Member: Audit Committee; and Nominations Committee
December 2005 after serving her articles at PricewaterhouseCoopers Incorporated. A member of the South African Institute of Chartered
60
Accountants, with extensive experience in corporate finance, financial management, investor relations and the mining industry. She was
previously CEO of GAIA Infrastructure Capital Limited. Prudence is currently CEO of TriAlpha Investment Management Proprietary Limited,
a specialist fixed income investment house, and is also an independent non-executive director of Growthpoint Properties Limited and Telkom
SA SOC Limited. Prudence chairs the Risk Committee and is a member of the Nominations Committee and the Audit Committee of
DRDGOLD.
Independent Non-executive Director
• Member: Audit Committee; Risk Committee; and Social and Ethics Committee
with 11 years´ post articles experience primarily within the mining space. She started her career as a trainee accountant at KPMG South Africa and
held various positions within the De Beers Group over a period of 11 years. She also served as a trustee on the boards of both the De Beers Benefit
Society Medical Aid and De Beers Pension Fund from 2014 to 2018. Charmel is the founder and chief executive officer of F Twelve and is also a
non-executive director at Acorn Agri & Food Limited and at ATKV. Charmel is a member of the Risk Committee, Audit Committee and Social
& Ethics Committee of DRDGOLD.
Senior Management and Prescribed Officers
Chief Operating Officer
retreatment business and extracting maximum value from existing resources. In July 2014, he was appointed Operations Director: Ergo Mining
Operations Proprietary Limited.
Chief Information and Technology Officer
Top 8 Visionary CIOs by the institute of IT Professionals in South Africa (IITPSA) and International Data Corporation CIO of the Year in 2019,
he has 10 years’ experience in leadership and strategy. He has worked previously in the mining sector for Anglo American Platinum and Tronox .
Managing Director: Ergo
Henry Gouws has more than 30 years’ experience in the mining industry. He graduated from Technikon Witwatersrand and obtained a
National Diploma in Extraction Metallurgy in 1990 and a National Higher Diploma in Extraction Metallurgy in 1991. He completed a Management
Development Program in 2003 through Unisa School of Business Leadership and an Executive Development Programme in 2012 through the
University of Stellenbosch Business School. He was appointed Operations Manager of Crown in January 2006 and General Manager in July 2006.
He was appointed to his current position in October 1, 2011.
Mark Burrell (60) (BCom Accounting, MDP)
Financial Director: Ergo
Mark Burrell holds a B.Comm Accounting degree, has completed a Management Development Programme (MDP) and has more than
20 years’ experience in the mining sector. He joined DRDGOLD in 2004 on a consulting basis and later that year, was appointed as Financial
Manager of the Blyvooruitzicht operation. He was appointed as Financial Director of Ergo in January 2012. Mark serves as a director on the Board
of Rand Refinery Proprietary Limited.
Managing Director: FWGR
year engineering student. Kevin graduated from the University of the Witwatersrand at the end of 1989 obtaining his BSc (Mechanical Engineering)
and his government certificate of Competency (mines) during 1993. Kevin was appointed as junior engineer in December 1989, section engineer
- March 1994 and engineer in September 1994. He was appointed engineering manager 2003, general manager – technical services 2004 and
managing director Chizimgold 2010. On 01 October 2013 he was appointed as technical director at Ergo where he was responsible for the
environmental, health and safety, mineral resources and engineering portfolios. On 1 August 2018, Kevin was appointed Managing Director of
FWGR.
Financial Director: FWGR
FWGR in August 2018. Before joining DRDGOLD, she spent 11 years in the professional services industry at KPMG, performing,
inter alia
,
audits of listed companies in the mining industry, including SEC registrants.
61
Company Secretary
experience in all aspects of commercial law, having spent several years in both litigation and commercial practice as an admitted attorney and four
years as corporate legal counsel. She has dealt extensively with broad-based black economic empowerment structures, employee ownership
schemes, enterprise development and share incentive schemes involving complex company restructuring for both multi-nationals and large local
entities. She has extensive knowledge on the new Companies Act and has particular interests in company secretarial and corporate governance
matters.
There are no family relationships between any of our non-executive directors, executive directors or members of the group executive
and senior management. There are no arrangements or understandings between any of our directors or executive officers and any other person by
which any of our directors or executive officers has been so elected or appointed. Furthermore, none of the non-executive directors, executive
directors, group executive and senior management members or other key management personnel are elected or appointed under any undertaking
by, arrangement or understanding with any major shareholder, customer, supplier or otherwise.
62
6B. COMPENSATION
Our MOI provide that the directors' fees should be determined from time to time in a general meeting or by a quorum of Non-Executive
Directors. The total amount of directors' remuneration paid and or accrued for the year ended June 30, 2022 was R42.0 million. During fiscal year
2021, an independent consultant compiled a benchmarking analysis report against an appropriate comparator group of companies consisting of
JSE listed companies on fees paid non-executive directors. The report was presented to the Remuneration Committee on August 18, 2021. These
changes were made to the base fee and committee fees and were approved by the shareholders at the annual general meeting on November 30,
2022.
●
Base fee as Non-Executive Chairman of R1,457,944 per annum up to December 1, 2021 and R1,500,000 thereafter;
●
Base fee as Lead Independent Non-Executive Director of R672,247 per annum up to December 1, 2021 and R850,000 thereafter;
●
Base fee as Non-Executive Directors of R647,975 per annum up to December 1, 2021 and R430,000 thereafter;
●
Annual fee for the Audit Committee Chairman of R32,399 (excluding fee received as a committee member) up to December 1, 2021
and R180,000 (including fee received as a committee member) thereafter;
●
Annual fee for an Audit Committee member of R32,399 up to December 1, 2021 and R120,000 thereafter;
●
Annual fee for the Risk Committee Chairman of R140,000 (excluding fee received as a committee member) from December 1, 2021,
onwards.
●
Annual fee for a Risk Committee member of R100,000 from December 1, 2021, onwards.
●
Annual fee for the Chairman of Remuneration Committee R24 299 (excluding fee received as a committee member) up to December 1,
2021 and R100,000 thereafter;
●
Annual fee for a member of the Remuneration Committee of R24 299 each up to December 1, 2021 and R100,000 thereafter;
●
Annual fee for Chairman of the Social and Ethics Committee of R100,000 (excluding fee received as a committee member) up to
December 1, 2021 and R140,000 thereafter;
●
Annual fee for a member of the Social and Ethics Committee of R24,299 each up to December 1, 2021 and R90,000 thereafter;
●
Daily fee of R24,299 up to December 1, 2021 and thereafter the director will be remunerated if determined appropriate for additional
services provided;
●
Hourly rate of R3,240 up to December 1, 2021 and thereafter the director will be remunerated if determined appropriate for additional
services provided;
●
Half-day fee for participating by telephone in special board meetings of R12,150 up to December 1, 2021 and thereafter the director will
be remunerated if determined appropriate for additional services provided; and
●
The Chairman of the board, Lead Independent Non-Executive Director and other Non-Executive Directors do not receive committee
fees.
The following table sets forth the compensation for our directors and prescribed officers for the year ended June 30, 2022.
The disclosure detailed in this table is consistent with the disclosure requirements of the Companies Act, 2008 (Act 71 of 2008)
and the JSE Listings Requirements.
Directors / Prescribed Officer
Total
remuneration
recognised
during the year
Short-Term
Incentives
recognised
related to this
cycle
Long-term
Incentives
settled during
this cycle
Total
remuneration
related to this
cycle
R'000
R'000
R'000
R'000
Executive directors
D J Pretorius
7,647
7,273
7,495
22,415
A J Davel
4,708
4,460
3,628
12,796
12,355
11,733
11,123
35,211
Non-executive directors
T J Cumming
1,267
-
-
1,267
G C Campbell
659
-
-
659
E A Jeneker
884
-
-
884
J Holtzhausen
808
-
-
808
T B V N Mnyango
772
-
-
772
J J Nel
844
-
-
844
K P Lebina
817
-
-
817
C D Flemming
778
-
-
778
6,829
-
-
6,829
Prescribed officers (1)
W J Schoeman
4,464
4,460
3,628
12,552
63
E Beukes
1,432
1,274
535
3,241
5,896
5,734
4,163
15,793
Total
25,080
17,467
15,286
57,833
(1)
Regulations 2008, to be disclosed with that of directors of the company. A person is a prescribed officer if they have general executive authority over the
company, general responsibility for the financial management or management of legal affairs, general managerial authority over the operations of the company
or directly or indirectly exercise or significantly influence the exercise of control over the general management and administration of the whole or a significant
portion of the business and activities of the company.
Also see Item 6E. Share Ownership for details of share options held by directors.
Compensation of key management
Refer to Item 18. ‘‘Financial Statements – Note 19.3 – Related party transactions’’ for the total compensation paid to key management
(including executive and non-executive directors as well as prescribed officers).
The Group applies a pool-based Short-Term Incentive scheme, based on modified free cash flow, because it drives a strong teamwork
culture with all participants working primarily towards a single goal, maximising free cash flow which is an easy measure to understand.
Salient features of the short-term incentive scheme are as follows:
• Participants include the executive directors, prescribed officers and senior management.
• The pool is calculated as 15% of the adjusted Free Cash Flow with 90% of the pool accruing to employees achieving a satisfactory
performance rating;
• 10% of the pool is available for allocation at the discretion of the remuneration committee as recommended by the executive
committee which provides the ability to recognise exceptional discretionary effort;
• A production modifier that can modify the pool upwards as well as downwards based on gold produced measured against budget;
• A safety and a fatality modifier, both supporting the Company’s strong commitment to its strategy of a renewed focus on employee
safety, development, values and wellbeing; and
• The individual performance moderator model has been expanded to include employee performance ratings between 2 and 3 to
participants in the STI scheme on a broader sliding scale set out below:
Individual performance rating
Individual performance modifier
< 2 (100%)
2 to 2.24 (80%)
2.25 to 2.49 (60%)
2.5 to 2.74 (40%)
2.75 to 2.99 (20%)
>= 3 0%
Performance measures
The STI is funded out of a pool created from the Adjusted Free Cash Flow (“
Adjusted
FCF
”) generated by DRDGOLD in the
financial year:
• Adjusted FCF is defined for the performance measure as cash generated from operations, less capital expenditure (“
Capex
”), and
tax. In the budgeting process, if the Group believes that any Capex, Investment or other item/s should be excluded or amortised or treated in
any different way for determining Adjusted FCF at the end of the year, they may make representations to the Remuneration Committee on the
treatment of such item/s for the purposes of calculating Adjusted FCF for purposes of the STI pool. Remco has absolute discretion in approving
the treatment of such items;
• The STI Pool is modified as per the Tables below;
Modifiers of the incentive pool
To drive strategic initiatives, the short-term incentive pool is modified by up to 20% for isolated non-achievements of targets and up
to 50% for systemic or repetitive non-compliance. The modifiers are approved by the Remuneration Committee. These strategic initiatives and
their measures are assessed at the beginning of each financial year to ensure that current strategies are driven in that year. These strategic
modifiers and their weightings are communicated to participants at the beginning of each financial year to ensure understanding and
compliance.
The Group performance measures set out by the Remuneration Committee and the weightings for FY2022 are as follows:
Strategic Initiatives Modifiers
Environmental: 4%
Safety: 4%
Social development: 4%
Labour development: 4%
Transformation: 4%
64
Fatality Modifier
• Up to 25% per fatality, depending on the degree of culpability of the company, as assessed by the Remuneration Committee.
• If the fatality/ies is/are as a result of a breakdown in or disregard for a safety culture, the STI Pool can be modified by up to 100%
at the Remuneration Committee’s discretion.
Production Modifier
The calculated STI Pool may be modified, upwards or downwards, based upon gold (kg) produced measured against budget, as
follows:
Gold (Kg) Produced: STI
% of Budget
Pool Adjustment
< 93% -10%
93% to < 97% -5%
97% to < 103% 0%
103% to < 107% +5%
≥ 107% +10%
Distribution of the Incentive pool
The STI pool, after any moderation, will be distributed as follows:
• 90% formulaically, pro-rata to each individual’s “% of STI Pool” taking
inter alia
• All-inclusive package of the individual for the financial year;
• Market-related STI quanta applicable to the Category;
• The level of accountability and responsibility of the role of the individual.
• 10% on a discretionary basis allocated by the Executive Committee after recommendations from line management. The
Remuneration Committee will approve any allocations from the 10% discretionary pool to Executive Committee members.
Distributions are moderated for individual performance as follows:
Individual Performance Rating
Modifier %
< 2 -100%
2 to < 2.25 -80%
2.25 to < 2.5 -60%
2.5 to < 2.75 -40%
2.75 to < 3 -20%
≥ 3 0%
In order to be able to reward exceptional individual performance appropriately, the formulaic plus discretionary allocations may
exceed this amount, but these instances, if any, would be subject to the Executive Committee’s and ultimately the Remuneration Committee’s
approval.
Further considerations for the CEO and CFO
For the CEO and CFO (“executive directors”) the formulaically calculated STI amounts will be reviewed by the Remuneration
Committee, who has absolute discretion to further modify the STI amounts, upwards or downwards:
• If compelling, exceptional and objective circumstances warrant such application of discretion; and
• To ensure that the STI amounts awarded are balanced and equitable.
Executive Directors’ STI amounts may be settled in a combination of cash and DRDGOLD shares (deferred bonus shares), with
Remco having discretion to make up to 40% of the award in deferred bonus shares.
Deferred Bonus Shares will vest / be released to the Executive Directors as follows:
• 50% after 9 months;
• 50% after 18 months.
The following provisions apply to the deferred bonus shares:
• The Executive Director needs to be in active service and not under notice of resignation on the vesting dates in order to be eligible
to receive the deferred bonus shares and any dividends accrued thereon; and
• The deferred bonus shares carry voting and dividend rights; however, the dividends will accrue and will only be paid out upon the
vesting / release of the shares to which the dividends relate.
Service Agreements
Service contracts negotiated with each executive and non-executive director incorporate their terms and conditions of employment
and are approved by our Remuneration Committee.
65
The Company’s current executive directors, Mr. D.J. Pretorius and Mr. A.J. Davel, entered into agreements of employment with us,
on January 1, 2009 and January 1, 2015, respectively. These agreements regulated the employment relationship with Messrs. D.J. Pretorius
and A.J. Davel during the year ended June 30, 2022.
On July 1, 2022 Mr. D.J. Pretorius entered into a new agreement of employment for a period of 3 years and thereafter it continues
indefinitely until terminated by either party on not less than three months’ written notice. Under the employment agreement effective up to
June 30, 2025 Mr. D.J. Pretorius receives from us a guaranteed remuneration package of R7.6 million per annum. Mr. D.J. Pretorius was
eligible under his employment agreement, for an incentive bonus of up to 100% of his annual remuneration package in respect of one bonus
cycle per annum over the duration of his appointment, on the condition that DRDGOLD achieves certain key performance indicators. In
addition, he is eligible to participate in the equity-settled long-term incentive scheme (awarded 332,497 conditional shares in October 2020,
549,986 conditional shares in October 2021 and 799,595 conditional shares in October 2022).
Mr. A.J. Davel entered into a new employment agreement effective from July 1, 2022 for a period of 3 years and thereafter it
continues indefinitely until terminated by either party on not less than three months’ prior written notice. Mr. A.J. Davel receives from us a
guaranteed remuneration package of R4.7 million per annum. Mr. A.J. Davel is eligible under his employment agreement, for a short term
incentive of up to 100% of his annual remuneration package in respect of one bonus cycle per annum over the duration of his appointment, on
the condition that DRDGOLD achieves certain key performance indicators. In addition, he is eligible to participate in the equity-settled long-
term incentive scheme (awarded 160,919 conditional shares in October 2020, 292,796 conditional shares in October 2021 and 425,680
conditional shares in October 202)
agreement which runs for a fixed period until April 25, 2024. Mrs. TVBN Mnyango has a service agreement which runs until March 31, 2023.
Mr. J Nel entered into a service agreement which runs for a fixed period until March 31, 2022, and Ms. K.P Lebina entered into a service agreement
which runs until May 02, 2023. Mr. T J Cumming and Ms C D Flemming entered into a service agreement which runs for a fixed period until July
31, 2022. After expiration of the initial two-year periods, the agreements continue indefinitely until terminated by either party on not less than three
months’ prior written notice.
The Company does not administer any pension, retirement or other similar scheme in which the directors receive a benefit.
in the case of our executive officers, except where terminated as a result of certain action on the part of the director, upon the director reaching a
certain age, or by the director upon the occurrence of a change of control. A termination of a director's employment upon the occurrence of a
change of control is referred to as an “eligible termination.” Upon an eligible termination, the director is entitled to receive a payment equal to at
least one year's salary or fees, but not more than three years' salary for Executive Directors or two years’ fees for Non-Executive Directors,
depending on the period of time that the director has been employed.
6C. BOARD PRACTICES
Board of Directors
As at June 30, 2022 and as at September 30, 2022, the board of directors comprises two Executive Directors (Mr. D.J. Pretorius and
Mr. A.J. Davel), and seven Non-Executive Directors (Messrs. T.J. Cumming, J.J. Nel, E.A. Jeneker, J.A. Holtzhausen and Mmes. K.P. Lebina,
T.V.B.N. Mnyango, C.D. Flemming). The Non-Executive Directors are independent under the New York Stock Exchange, or NYSE,
requirements (as affirmatively determined by the Board of Directors) and the South African King IV Report except Mr. T Cumming who also
serves as an independent non-executive director of Sibanye-Stillwater Limited, DRDGOLD’s controlling shareholder.
In accordance with the King IV Report on corporate governance, as encompassed in the JSE Listings Requirements, and in
accordance with the United Kingdom Combined Code, the responsibilities of Chairman and Chief Executive Officer are separate. Mr. T.J.
Cumming is the Non-Executive Chairman, Mr. D.J. Pretorius is the Chief Executive Officer and Mr. A.J Davel is the Chief Financial Officer.
The board has established a Nominations Committee, and it is our policy for details of a prospective candidate to be distributed to all directors
for formal consideration at a full meeting of the board. A prospective candidate would be invited to attend a meeting and be interviewed before
any decision is taken. In compliance with the NYSE rules a majority of independent directors will select or recommend director nominees.
The board’s main roles are to create value for shareholders, to provide leadership of the Company, to approve the Company’s strategic
objectives and to ensure that the necessary financial and other resources are made available to management to enable them to meet those
objectives. The board retains full and effective control over the Company, meeting on a quarterly basis with additional ad hoc meetings being
arranged when necessary, to review strategy and planning and operational and financial performance. The board further authorizes acquisitions
and disposals, major capital expenditure, stakeholder communication and other material matters reserved for its consideration and decision
under its terms of reference. The board also approves the annual budgets for the various operational units.
The board is responsible for monitoring the activities of executive management within the company and ensuring that decisions on
material matters are referred to the board. The board approves all the terms of reference for the various subcommittees of the board, including
special committees tasked to deal with specific issues. Only the executive directors are involved with the day-to-day management of the
Company.
To assist new directors, an induction program has been established by the Company, which includes background materials, meetings
with senior management, presentations by the Company’s advisors and site visits. The directors are assessed annually, both individually and
66
as a board, as part of an evaluation process, which is driven by an independent consultant. In addition, the Nominations Committees formally
evaluate the executive directors on an annual basis, based on objective criteria.
All directors, in accordance with the Company’s MOI, are subject to retirement by rotation and re-election by shareholders. In
addition, all directors are subject to election by shareholders at the first annual general meeting following their appointment by directors. The
appointment of new directors is approved by the board as a whole. The names of the directors submitted for re-election are accompanied by
sufficient biographical details in the notice of the forthcoming annual general meeting to enable shareholders to make an informed decision in
respect of their re-election.
All directors have access to the advice and services of the Company Secretary, who is responsible to the board for ensuring
compliance with procedures and regulations of a statutory nature. Directors are entitled to seek independent professional advice concerning
the affairs of the Company at the Company’s expense, should they believe that course of action would be in the best interest of the Company.
Board meetings are held quarterly in South Africa and occasionally abroad. The structure and timing of the Company’s board
meetings, which are scheduled over two days, allows adequate time for the Non-Executive Directors to interact without the presence of the
Executive Directors. The board meetings include the meeting of the Audit Committee, Risk Committee, Remuneration Committee &
Nominations Committee as well as the Social & Ethics Committee which act as subcommittees to the board. Each subcommittee is chaired by
one of the Independent Non-Executive Directors, each of whom provides a formal report back to the board. Each subcommittee meets for
approximately half a day. Certain senior personnel of the Company attend the subcommittee meetings as invitees.
The board sets the standards and values of the Company and much of this has been embodied in the Company’s Code of Conduct,
which is available on our website at www.drdgold.com. The Code of Conduct applies to all directors, officers and employees, including the
principal executive, financial and accounting officers, in accordance with Section 406 of the US Sarbanes-Oxley Act of 2002, the related US
securities laws and the NYSE rules. The Code contains provisions for employees to report violations of Company policy or any applicable
law, rule or regulation, including US securities laws.
A description of the significant ways in which our corporate governance practices differ from practices followed by U.S. companies
listed on the NYSE can be found in Item 16G. Corporate Governance.
Directors' Terms of Service
at June 30, 2022:
Director
Title
Year first
appointed
Term of
current office
Unexpired
term of
current office
D.J. Pretorius
Chief Executive Officer
2008
3 years
0 months
A.J. Davel
Chief Financial Officer
2015
3 years
0 months
T.J. Cumming
Non-Executive Director
2020
2 years
1 month
E.A. Jeneker
Non-Executive Director
2007
2 years
16 months
J. Holtzhausen
Non-Executive Director
2014
2 years
22 months
T.V.B.N. Mnyango
Non-Executive Director
2016
2 years
7 months
J.J Nel
Non-Executive Director
2018
2 years
7 months
K.P Lebina
Non-Executive Director
2019
2 years
10 months
C.D. Flemming
Non-Executive Director
2020
2 years
1 month
* Renewal of the term of office was deferred to the October 2022 board meeting at which the contracts of D.J. Pretorius and A.J. Davel were extended to June 30, 2025.
Executive Committee
E. Beukes.
The Executive Committee meets bi-weekly basis to review current operations, develop strategy and policy proposals for consideration
by the board of directors. Members of the Executive Committee, who are unable to attend the meetings in person, are able to participate via
teleconference facilities, to allow participation in the discussion and conclusions reached. The subsidiary companies’ executives are permanent
participants on the Executive Committee.
Board Committees
67
The board has established a number of standing committees to enable it to properly discharge its duties and responsibilities and to
effectively fulfill its decision-making process. Each committee acts within written terms of reference which have been approved by the board
and under which specific functions of the board are delegated. The terms of reference for all committees can be obtained by application to
the Company Secretary at the Company’s registered office. Each committee has defined purposes, membership requirements, duties and
reporting procedures. Minutes of the meetings of these committees are circulated to the members of the committees and made available to
the board. Remuneration of Non-Executive Directors for their services on the committees concerned is determined by the board. The
committees are subject to annual evaluation by the board with respect to their performance and effectiveness. The following information
reflects the composition and activities of these committees.
The Board constituted an Investment Committee who had their first meeting on October 6, 2022 to consider prospective projects,
acquisitions and disposals in line with DRDGOLD's strategy and to ensure that adequate due diligence procedures are followed. The
Investment Committee also conducts other investment-related functions as delegated to it by the Board from time to time, as governance
oversight increases as the DRDGOLD Group continues to grow. Members of this committee include J J Nel (Chairman), J A Holtzhausen, K
P Lebina, E A Jeneker and T J Cumming. The CEO, CFO and COO are invitees.
Committees of the Board of Directors
Nominations Committee
As at June 30, 2022 the Nominations Committee consisted of T J Cumming (Chairman), E A Jeneker, J A Holtzhausen, T V B N
Mnyango and K P Lebina.
The Nominations Committee meets on an
ad hoc
who are independent according to the definition set out in the NYSE Rules, except for T Cumming. It is chaired by the board chairman who
is a non-executive director (“
NED
”).
The primary role of the committee is to execute the following functions:
●
ensure the establishment of a formal process for the appointment of directors;
●
ensure that inexperienced directors are developed through a mentorship programme;
●
ensure that directors receive regular briefings on changes in risks, laws and the appropriate contribution;
●
drive an annual process to evaluate the board, board committees and individual directors;
●
ensure that succession plans for the board, chief executive officer and senior management appointments are developed and
implemented.
The key responsibilities of the Nominations Committee include the following:
●
make recommendations to the board on the appointment of new directors;
●
make recommendations on the composition of the board and the balance between executive and non-executive directors appointed
to the board;
●
review board structure, size and composition on a regular basis;
●
make recommendations on directors eligible to retire by rotation; and
●
apply the principles of good corporate governance and best practice in respect of nominations matters.
Remuneration Committee
As at June 30, 2022 the Remuneration Committee consisted of J.J. Nel (Chairman), E.A. Jeneker, J.A. Holtzhausen, T.V.B.N.
Mnyango and T.J. Cumming.
The Remuneration Committee meets on a quarterly basis. All members of this committee are independent non-executive directors
who are independent according to the definition set out in the NYSE Rules, except for T.J. Cumming. It is chaired by an independent non-
executive director.
The committee has a mandate to offer competitive packages that will attract and retain executives of the highest caliber and
encourage and reward superior performance. Industry surveys are provided for comparative purposes, and to assist the committee in the
formulation of remuneration policies that are market related.
Audit Committee
As at June 30, 2022 the Audit Committee consisted of J.A. Holtzhausen (Chairman), J.J. Nel, K.P. Lebina and C.D. Flemming.
All members of the Audit Committee are independent according to the definition set out in the NYSE Rules. The committee’s
charter deals with all the aspects relating to its functioning.
●
appointment and oversight of external auditors, audit process and financial reporting;
●
oversight of internal audit;
●
overseeing the integrated reporting and assurance model;
68
The Audit Committee meets each quarter with the external auditors, the company’s manager: risk and internal audit, and the CFO.
The committee reviews the audit plans of the internal auditors to ascertain the extent to which the scope of the audits can be relied upon to
detect weaknesses in internal controls. It also reviews the annual and interim financial statements prior to their approval by the board.
The committee is responsible for making recommendations to appoint, reappoint or remove the external auditors, and the
designated external audit partner as well as determining their remuneration and terms of engagement. In accordance with its policy, the
committee preapproves all audit and non-audit services provided by the external auditors. KPMG Inc. was reappointed by shareholders at the
last AGM on November 30, 2021 to perform DRDGOLD’s external audit function, such appointment was made by the shareholders in
accordance with the laws of South Africa and upon recommendation from the board following the Audit Committee recommendations. To
comply with section 10(1)(a) of the Auditing Profession Act, 26 of 2005, the Independent Regulatory Board for Auditors (“
IRBA
”)
published the rule on Mandatory Audit Firm Rotation (“
MAFR
”) for auditors of all public interest entities, as defined in section 290.25 to
290.26 of the amended IRBA Code of Professional Conduct for Registered Auditors. An audit firm, including a network firm as defined in
the IRBA Code of Professional Conduct for Registered Auditors, shall not serve as the appointed auditor of a public interest entity for more
than 10 consecutive financial years. Thereafter, the audit firm will only be eligible for reappointment as the auditor after the expiry of at least
five financial years. The requirement is effective for financial years commencing on or after 1 April 2023. KPMG Inc. has been the
appointed auditors since 2003 and the Company has decided to early adopt the MAFR rule and appoint new auditors – BDO South Africa
Inc. for the 30 June 2023 financial year, subject to the shareholder approval at the next AGM on November 29, 2022.
The internal audit function is performed in-house, with the assistance of Pro-Optima Audit Services Proprietary Limited. Internal
audits are performed at all DRDGOLD operating units and are aimed at reviewing, evaluating and improving the effectiveness of risk
management, internal controls and corporate governance processes.
Significant deficiencies, material weaknesses, instances of non-compliance and exposure to high risk and development needs are
brought to the attention of operational management for resolution and reported to the Audit Committee. The committee members have access
to all the records of the internal audit team.
DRDGOLD’s internal and external auditors have unrestricted access to the chairman of the Audit Committee and, where
necessary, to the chairman of the board and the CEO. All significant findings arising from audit procedures are brought to the attention of the
committee and, if necessary, to the board.
Section 404(a) of the Sarbanes-Oxley Act of 2002 stipulates that management is required to assess the effectiveness of the internal
controls surrounding the financial reporting process. The results of this assessment are reported in the form of a management attestation
report that is filed with the SEC as part of the Form 20-F. Additionally, DRDGOLD’s external auditors are required to express an opinion on
the effectiveness of internal controls over financial reporting, which is also contained in the Company’s Form 20-F.
Risk Committee
As at June 30, 2022 the Risk Committee consisted of K.P. Lebina (Chairwoman), D.J. Pretorius, J.J. Nel, C.D. Flemming and T.J.
Cumming.
Roles and responsibilities:
●
Oversee the development and annual review of a policy and plan for risk management to recommend for approval to the Board
●
Ensure that risk management assessments are performed on a continuous basis
●
Ensure that reporting on risk management is complete, timely, accurate and accessible
●
Oversee that the risk management plan is widely disseminated throughout the company and integrated in the day-to-day activities
of the company
●
Ensure that frameworks and methodologies are implemented to increase the possibility of anticipating unpredictable risks
●
Ensure that management considers and implements appropriate risk responses
●
Ensure co-ordination with the audit committee who will be responsible for the risk management process as far as internal controls,
financial reporting and IT risks are concerned.
All members of the Risk Committee are independent according to the definition set out in the NYSE Rules, except for T.J.
Cumming. It is chaired by an independent NED.
An important aspect of risk management is the transfer of risk to third parties to protect the company from disaster. DRDGOLD’s
major assets and potential business interruption and liability claims are therefore covered by the group insurance policy, which encompasses
all the operations. Most of these policies are held through insurance companies operating in the United Kingdom, Europe and South Africa.
The various risk-management initiatives undertaken within the group as well as the strategy to reduce costs without compromising cover
have been successful and resulted in substantial insurance cost savings for the Group.
Social and Ethics Committee
As at June 30, 2022, the Social and Ethics Committee consisted of E.A. Jeneker (Chairman), A.J. Davel, TVBN Mnyango and
C.D. Flemming
69
of which are to facilitate transformation and sustainable development by,
inter alia,
promoting transformation within the Company and
economic empowerment of previously disadvantaged communities particularly within the areas where the Company conducts business;
striving towards achieving the goal of equality as the South African Constitution and other legislation require within the context of the
demographics of the country at all levels of the Company and its subsidiaries; and conducting business in a manner which is conducive to
internationally acceptable environmental and sustainability standards.
The following terms of reference were approved by the board to enable the committee to function effectively. These are to be
responsible for and make recommendations to the board with respect to the following matters:
●
monitor the Company’s activities regarding the 10 principles set out in the United Nations Global Compact Principles and the
OECD recommendations regarding Corruption, the Employment Equity Act and the Broad Based Black Economic Empowerment
Act;
●
maintaining records of sponsorship, donations and charitable giving;
●
reviewing matters relating to the environment, health and public safety, including the impact of the company’s activities and of its
products or services;
●
reviewing matters relating to labor and employment
●
reviewing and recommending the company’s code of ethics;
●
reviewing and recommending any corporate citizenship policies;
●
reviewing significant cases of employee conflicts of interests, misconduct or fraud, or any other unethical activity by employees or
the Company
6D. EMPLOYEES
Employees
directly employed by us and our subsidiary companies. Of the 943 employees directly employed by us and our subsidiary companies, 34
employees are on a fixed term employment contract.
directly employed by us and our subsidiary companies. Of the 953 employees directly employed by us and our subsidiary companies, 42
employees are on a fixed term employment contract.
directly employed by us and our subsidiary companies. Of the 958 employees directly employed by us and our subsidiary companies, 34
employees are on a fixed term employment contract.
who are directly employed by us and our subsidiary companies. Of the 923 employees directly employed by us and our subsidiary companies, 36
employees are on a fixed term employment contract.
Labor Relations
employee associations. South Africa's labor relations environment remains a platform for social reform. The National Union of Mineworkers,
(“
NUM
”), one of the main South African mining industry unions, is influential in the tripartite alliance between the ruling African National
Congress, the Congress of South African Trade Unions, (“
COSATU
”), and the South African Communist Party as it is the biggest affiliate of
COSATU. The relationship between management and labor unions remains cordial. The organized labor coordinating forum meets regularly to
discuss matters pertinent to both parties.
was concluded at Ergo subsequent to fiscal year 2022.
level. We aim to recruit in line with our transformational objectives. The composition of the Board of Directors specifically, changed
significantly over the past two fiscal years and is more diverse and reflective of transformation and South Africa’s demographics.
70
Safety statistics
our fiscal 2022 overall safety statistics for our operations:
(Per million man hours)
Ergo
FWGR
Consolidated
Year ended June 30,
Year ended June 30,
Year ended June 30,
2022
2021
2022
2021
2022
2021
Lost time injury frequency rate (LTIFR)
1
2.14
0.78
-
0.97
1.84
0.80
Reportable incidence frequency rate (RIFR)
1
0.76
0.47
-
-
0.66
0.40
Fatalities
-
-
-
-
-
-
1 Calculated as follows: actual number of instances divided by the total number of man hours worked multiplied by one million.
6E. SHARE OWNERSHIP
one percent of the Company’s issued ordinary share capital. For details of share ownership of directors and prescribed officers see Item 7A. Major
Shareholders.
As of June 30, 2022, directors and prescribed officers do not hold any options to purchase ordinary shares.
potentially become aware of material price sensitive information, such as information relating to an acquisition, bi-annual results etc., which
is not in the public domain. When these persons have access to this information an embargo is placed on share trading for those individuals
concerned. The embargo need not involve the entire Company in the case of an acquisition and may only apply to the board of directors,
executive committee, and the financial and new business teams, but in the case of interim and year-end results the closed-period is group-wide.
DRDGOLD Phantom Share Scheme (Amended November 2015) – Cash Settled Long-Term Incentive Scheme
Salient terms of the DRDGOLD Phantom Share Scheme are disclosed in Item 18. ‘‘Financial Statements - Note 19. Cash Settled
Long-Term Incentive Scheme’’
On November 4, 2015, the committee approved an allocation of 20,527,978 phantom shares which is driven by share price
performance and individual performance and is based on phantom share allocations. The vesting of any shares allocated was staggered over a
five-year period commencing in the third year after the allocation is granted in line with King IV Report recommendations. The objectives of
the revised scheme are to drive the longer-term strategies of DRDGOLD, to align participants’ interests with shareholders’ interest, to
incentivise and motivate participants, to attract and retain scarce human resources and to reward superior performance by the Company and
participants. The revised cash settled long-term incentive scheme was fully settled on November 5, 2020 and replaced by the equity-settled
long term incentive scheme described below.
Equity-Settled Long-Term Incentive Scheme
On December 2, 2019 shareholders approved an Equity-Settled Long-Term Incentive Scheme (“
Scheme
”) for purposes of
replacing the current Cash-Settled Long-Term Incentive Scheme. The Cash-Settled Long-Term incentive scheme has a finite life and
comes to an end with the vesting of the last phantom shares during fiscal year 2021. Certain key features of the Scheme are:
Equity settled
The Scheme will be equity-settled. Equity-settlement will be implemented by way of market acquisition of DRDGOLD ordinary shares
or through the issue of authorised but unissued shares or treasury shares.
Participants
Persons eligible to participate in the Scheme will be permanent employees (which, for the avoidance of doubt, includes an executive
director, but excludes a non-executive director) of the Company and its subsidiaries, in Category 19 and above (“
Participants
”).
Award of Conditional Shares
Pursuant to the Scheme, the Company’s Remuneration Committee will resolve, on an annual basis, to award “Conditional Shares”
(“
Award
”) which are comprised of:
●
“Performance Shares” which are subject to conditions, as set out in the rules of the Scheme and performance conditions; and
●
“Retention Shares” which are subject to conditions, as set out in the rules of the Scheme.
Participants are not required to pay for Awards or Shares Settled in terms of vested Awards.
Annual awards of Conditional Shares will be made, in two forms:
●
80% of the Award will be comprised of Performance Shares
●
20% of the Award will be comprised of Retention Shares
71
The target award value will be referenced to market-related award quanta, and will be adjusted based upon individual performance as
follows:
Individual Rating
% of Target Value Awarded
< 2.75
0%
2.75 to < 3.00
50%
3.0 to < 3.75
100%
3.75 to < 4.5
133.33%
4.5 to < 5.0
166.67%
5.0
200%
Dividend and Voting Rights
The Conditional Share Awards carry no dividend or voting rights, until Settled, and therefore any transfer and other rights associated
with the Conditional Shares will only vest following settlement.
Vesting of the Conditional Shares
The first grant was made on December 2, 2019 and will vest in two tranches, 50% on the 2nd anniversary and the remaining 50% on the
3rd anniversary of the grant date respectively, provided the employee is still within the employment of the Group until the respective
vesting dates.
Retention shares:
100% of the retention shares will vest if the employee remains in the employ of the Company at vesting date and individual performance
criteria are met.
Performance shares:
Total shareholder’s return (“
TSR
”) measured against a hurdle rate of 15% referencing DRDGOLD’s Weighted Average Cost of Capital
“WACC”:
• 50% of the performance shares are linked to this condition; and
• all of these performance shares will vest if DRDGOLD’s TSR exceeds the hurdle rate over the vesting period
TSR measured against a peer group of 3 peers (Sibanye-Stillwater, Harmony Limited and Pan-African Resources Limited):
• 50% of the performance shares are linked to this condition; and
• The number of performance shares which vest is based on DRDGOLD’s actual TSR performance in relation to percentiles of peer
group’s performance as follows
Percentile of Peers
% of Conditional Shares Vesting
< 25th percentile
0%
25th to < 50th percentile
25%
50th to < 75th percentile
75%
≥ 75th percentile
100%
Awarded Conditional Shares which do not Vest to the Participant, as a result of forfeiture or which lapse, revert back to the Scheme.
Share Limits
Overall Company Limit
The aggregate number of Shares at any one time which may be awarded for Settlements under the Scheme shall not exceed 34,500,000
(thirty four million, five hundred thousand) Shares (representing approximately 4.95% of the total issued share capital of the Company at
the date of this Notice).
Individual Limit
Subject to certain dilution adjustments, the aggregate number of Shares at any one time which may be awarded under the Scheme to any
one Participant shall not exceed 14,500,000 Shares.
72
ITEM 7. MAJOR SHAREHOLDERS AND RELATED PARTY TRANSACTIONS
7A. MAJOR SHAREHOLDERS
As of September 30, 2022, our issued capital consisted of:
●
864,588,711 ordinary shares of no par value; and
●
5,000,000 cumulative preference shares.
foreign government, other than the controlling interest held by Sibanye-Stillwater.
acquisition of the WRTRP Assets. On January 8, 2020, Sibanye-Stillwater exercised the option granted to it to subscribe for such number of new
ordinary shares in the share capital of DRDGOLD for cash resulting in Sibanye-Stillwater holding in aggregate 50.1% of all DRDGOLD shares
in issue (including treasury shares). Sibanye-Stillwater subscribed for 168,158,944 Subscription Shares at an aggregate subscription price of R1,086
million, on January 22, 2020. The Subscription Shares were allotted and issued at a price of R6.46 per share, being a 10% discount to the 30-day
volume weighted average traded price.
Other than the above there are no arrangements, the operation of which may at a subsequent date result in a change in control of us.
●
there were 10,468 record holders of our ordinary shares in South Africa, who held 559,688,990 or approximately 64.7% of our
ordinary shares;
●
there was one record holder of our cumulative preference shares in South Africa, who held 5,000,000 ordinary shares or 100% of
our cumulative preference shares;
●
there were 36 US record holders of our ordinary shares, who held approximately 33,974,859 ordinary shares or approximately 3.9%
of our ordinary shares excluding those shares held as part of our ADR program; and
●
there were 664 registered holders of our ADRs in the United States, who held approximately 215,869,190 shares (21,586,919 ADRs)
or approximately 25.0% of our ordinary shares.
●
each of our directors and prescribed officers; and
●
any person whom the directors are aware of as at September 30, 2022 who is interested directly or indirectly in 1% or more of our
ordinary shares. There was significant change in the percentage ownership of the major shareholders over the preceding three years.
During fiscal year 2020 Sibanye-Stillwater exercised the option granted to it to subscribe for such number of new ordinary shares in
the share capital of DRDGOLD for cash resulting in Sibanye-Stillwater holding in aggregate 50.1% of all Shares in issue (including
treasury shares). Sibanye-Stillwater subscribed for 168,158,944 ordinary shares.
Shares Beneficially owned
Holder
Number
Percent of outstanding
ordinary shares
Directors/prescribed officers
D.J. Pretorius
804,816
*
A.J. Davel
338,438
*
Other
Sibanye-Stillwater
433,158,944
50.10%
The Bank of New York Mellon
227,196,436
26.28%
Government Employees Pension Fund
30,101,431
3.48%
Allan Gray Proprietary Limited
15,638,811
1.81%
BNYMSANV RE BNYMLBGC RE 586388
12,562,291
1.45%
CLEARSTREAM BANKING S.A LUXEMBOURG
10,763,378
1.24%
STATE STREET BANK AND TRUST
10,052,483
1.16%
* Indicates share ownership of less than 1% of our outstanding ordinary shares.
No ordinary shareholder has voting rights which differ from the voting rights of any other ordinary shareholder.
73
Cumulative Preference Shares
registered address is Suite 25, Katherine & West Building, Corner of Katherine and West Streets, Sandown, Sandton, 2196.
months. The terms of issue of the cumulative preference shares are that they carry the right, in priority to the Company's ordinary shares, to receive
a dividend equal to 3% of the gross future revenue generated by the exploitation or the disposal of the Argonaut mineral rights acquired from
Randgold in September 1997. Additionally, holders of cumulative preference shares may vote on resolutions which adversely affect their interests
and on the disposal of all, or substantially all, of our assets or mineral rights. There is currently no active trading market for our cumulative
preference shares. Holders of cumulative preference shares will only obtain their potential voting rights once the Argonaut Project becomes an
operational gold mine, and dividends accrue to them. The prospecting rights have since expired and the Argonaut Project terminated. The
development of the project is not expected to materialise and therefore no dividend is expected to be paid.
7B. RELATED PARTY TRANSACTIONS
Transactions with related parties are disclosed in Item 18. ‘‘Financial Statements - Note 5.1 – Cost of sales’’
Remuneration paid to key management is disclosed in Item 18. ‘‘Financial Statements - Note 19.3 – Key management personnel
remuneration’’
7C. INTERESTS OF EXPERTS AND COUNSEL
Not applicable.
ITEM 8. FINANCIAL INFORMATION
8A. CONSOLIDATED STATEMENTS AND OTHER FINANCIAL INFORMATION
1.
Please refer to Item 18. Financial Statements.
2.
Please refer to Item 18. Financial Statements.
3.
Please refer to Item 18. Financial Statements.
4.
The last year of audited financial statements is not older than 15 months.
5.
Not applicable.
6.
Not applicable.
7.
Please refer to Item 4D. Property, plant and equipment—Ongoing Legal Proceedings.
8.
Please refer to Item 10B. Memorandum and articles of association.
8B. SIGNIFICANT CHANGES
Significant changes that have occurred since June 30, 2022, the date of the last audited financial statements included in this Annual
Report, are discussed in the relevant notes to the financial statements under Item 18. Financial Statements.
74
ITEM 9. THE OFFER AND LISTING
9A. OFFER AND LISTING DETAILS
The principal trading market for our equity securities is the JSE (symbol: DRD) and our ADSs that trade on the New York Stock
Exchange (symbol: DRD). The ADRs are issued by The Bank of New York Mellon, as depositary. Each ADR represents one ADS and each ADS
represents ten of our ordinary shares. Until July 23, 2007, each ADS represented one of our ordinary shares.
The cumulative preference shares are not traded on any exchange.
nor have there been any trading suspensions with respect to our ADRs on the New York Stock Exchange since our listing on that market.
9B. PLAN OF DISTRIBUTION
Not applicable.
9C. MARKETS
Nature of Trading Markets
.
9D. SELLING SHAREHOLDERS
Not applicable.
9E. DILUTION
Not applicable.
9F. EXPENSES OF THE ISSUE
ITEM 10. ADDITIONAL INFORMATION
10A. SHARE CAPITAL
Not applicable.
10B. MEMORANDUM AND ARTICLES OF ASSOCIATION
As of June 30, 2022, we had authorized for issuance 1,500,000,000 ordinary shares of no par value (as of September 30, 2022:
1,500,000,000), and 5,000,000 cumulative preference shares of R0.10 par value (as of September 30, 2022: 5,000,000). On this date, we had issued
864,588,711 ordinary shares (as of September 30, 2022: 864,588,711) and 5,000,000 cumulative preference shares (as of September 30, 2022:
5,000,000).
Africa and the JSE Listings Requirements, all as in effect on June 30, 2022 and September 30, 2022. The summary does not purport to be complete
and is subject to and qualified in its entirety by reference to the full text of the MOI, the Companies Act, and the JSE Listings Requirements.
of Incorporation, the main object and business of our company is mining and exploration for gold and other minerals.
Borrowing Powers
repayment of any such sums, or any other sum, as they think fit, whether by the creation and issue of securities, mortgage or charge upon all or
any of the property or assets of the company. The directors shall procure that the aggregate principal amount at any one time outstanding in respect
of monies so borrowed or raised by the company and all the subsidiaries for the time being of the company shall not exceed the aggregate amount
at that time authorized to be borrowed or secured by the company or the subsidiaries for the time being of the company (as the case may be).
Share Ownership Requirements
75
Voting by Directors
him is present. Any director so authorized shall, in addition to his own vote, have a vote for each director by whom he is authorized.
may be called at any meeting of directors.
in respect of a matter to be considered at a meeting of the board he or she must disclose the interest and its nature, any material information relating
to the matter and thereafter leave the meeting immediately after making the disclosure. Such director must not take part in consideration of the
matter. He is not to be regarded as being present for the purpose of determining whether a resolution has sufficient support to be adopted.
effect on 1 April 2017 for companies with financial years commencing thereafter. The application regime for King IV is "apply and explain",
requiring companies to substantially and meaningfully strive towards good corporate governance. King IV is principles and outcomes based: a
departure from mere compliance-based mindset. King IV recognises that sound governance outcomes, exemplified by integrity, competence,
responsibility, accountability, fairness and transparency, are the cardinal pillars of good corporate citizenship. The JSE Limited has since made the
adoption and application of King IV mandatory for all listed companies.
AGM of the Company. In terms of section 65(11)(h) of the Companies Act, 2008 read with sections 66(8) and 66(9) thereof, remuneration may
only be paid to directors for their services as directors in accordance with a special resolution approved by the shareholders within the previous 2
(two) years. A special resolution was passed at the 2021 AGM on November 30, 2021 to change the structure of the NED remuneration.
care and skill in discharging their responsibilities. These common law duties have now been codified by the Companies Act.
Age Restrictions
Election of Directors
(“elected director (s)”) and no appointment of a director by way of a written circulated shareholders resolution in terms of section 60 of the
Companies Act shall be competent.
usually make themselves available for re-election. An amendment to the MOI which also subjects executive directors to re-election by rotation
was approved by shareholders at the 2014 annual general meeting.
General Meetings
at general meetings, we shall issue a notice to shareholders convening a general meeting for a date not less than 15 days from the date of the notice.
Directors may convene general meetings at any time.
15 days advance written notice of that meeting. For any other general meeting of our shareholders, 15 days advance written notice is required.
the time selected for the meeting, such meeting shall be postponed for one week. However the chairman has the discretion to extend the fifteen
minutes for a reasonable period on certain grounds. The necessary quorum is three members present with sufficient voting powers in person or by
proxy to exercise in aggregate 25% of the voting rights.
Voting Rights
and on a poll have one vote for every share held. The holders of our cumulative preference shares are not entitled to vote at a general meeting
unless any preference dividend is in arrears for more than six months at the date on which the notice convening the general meeting is posted to
the shareholders. Additionally, holders of cumulative preference shares may vote on resolutions which adversely affect their interests and on
resolutions regarding the disposal of all or substantially all of our assets or mineral rights. When entitled to vote, holders of our cumulative
preference shares are entitled to one vote per person on a show of hands and that portion of the total votes which the aggregate amount of the
nominal value of the shares held by the relevant shareholder bears to the aggregate amount of the nominal value of all shares issued by us.
76
Dividends
shareholders in proportion to the number of shares they each hold. No dividend shall be declared except out of our profits. Dividends may be
declared either free or subject to the deduction of income tax or duty in respect of which we may be charged. Holders of ordinary shares are entitled
to receive dividends as and when declared by the directors.
Ownership Limitations
or securities convertible into our ordinary shares.
Winding-up
applied to repay to the shareholders the amount paid up on our issued capital and thereafter the balance shall be distributed to the shareholders in
proportion to their respective shareholdings. On a winding up, our cumulative preference shares rank, in regard to all arrears of preference
dividends, prior to the holders of ordinary shares. As of June 30, 2022 and September 30, 2022, no such dividends have been declared. Except for
the preference dividend and as described in this Item our cumulative preference shares are not entitled to any other participation in the distribution
of our surplus assets on winding-up.
Reduction of Capital
limitation, any stated capital, capital redemption reserve fund and share premium account by making distributions and buying back our shares.
Amendment of the
MOI
MOI by increasing or decreasing the number of authorized shares, classifying or reclassifying shares, or determining the terms of shares in a class.
A special resolution is passed when the shareholders holding at least 25% of the total votes of all the members entitled to vote are present or
represented by proxy at a meeting and, if the resolution was passed on a show of hands, at least 75% of those shareholders voted in favor of the
resolution and, if a poll was demanded, at least 75% of the total votes to which those shareholders are entitled were cast in favor of the resolution.
An amendment to the MOI to increase the number of authorized shares was approved by shareholders at the 2018 general meeting on March 28,
2018.
Consent of the Holders of Cumulative Preference Shares
ranking, regarding rights to dividends or on winding up, in priority to or equal with our cumulative preference shares, or dispose of all or part of
the Argonaut mineral rights without the consent in writing of the registered holders of our cumulative preference shares or the prior sanction of a
resolution passed at a separate class meeting of the holders of our cumulative preference shares.
Distributions
and other consents required by law from time to time. We may, for example, in a general meeting, upon recommendation of our directors, resolve
that any surplus funds representing capital profits arising from the sale of any capital assets and not required for the payment of any fixed
preferential dividend, be distributed among our ordinary shareholders. However, no such profit shall be distributed unless we have sufficient other
assets to satisfy our liabilities and to cover our paid up share capital. We also need to consider the solvency and liquidity requirements stated in the
Companies Act of South Africa.
Directors’ power to vote compensation to themselves
The Companies Act requires that remuneration to non-executive directors may be paid only in accordance with a special resolution approved by
shareholders within the previous two years.
Time limit for dividend entitlement
claimed by such shareholder/s, subject to the Prescription Act, 1969 as amended or any other law which governs the law of prescription.
Staggered director elections & cumulative voting
77
At each annual general meeting of the Company one-third of the directors shall retire and be eligible for re-election. No provision is
made for cumulative voting.
Sinking fund provisions and liability to further capital calls
shareholders to liability to further capital calls.
Provision that would delay/prevent change of control
terms thereof. They must prove that upon implementation of the amalgamation or merger each will satisfy the solvency and liquidity test.
Companies involved in disposals, amalgamations or mergers, or schemes of arrangement must obtain a compliance certificate from the Takeover
Regulation Panel, pass special resolutions and in some instances they must obtain an independent expert report.
10C. MATERIAL CONTRACTS
Not applicable.
78
10D. EXCHANGE CONTROLS
The following is a summary of the material South African exchange control measures, which has been derived from publicly available
documents. The following summary is not a comprehensive description of all the exchange control regulations. The discussion in this section is
based on the current law and positions of the South African Government. Changes in the law may alter the exchange control provisions that apply,
possibly on a retroactive basis.
Introduction
control matters in South Africa are regulated by the South African exchange control regulations, or the Regulations. The Regulations form part of
the general monetary policy of South Africa. The Regulations are issued under Section 9 of the Currency and Exchanges Act, 1933 (as amended).
In terms of the Regulations, the control over South African capital and revenue reserves, as well as the accruals and spending thereof, is vested in
the Treasury (Ministry of Finance), or the Treasury.
Bank, or SARB, which is responsible for the day to day administration and functioning of exchange controls. SARB has a wide discretion. Certain
banks authorized by the Treasury to co-administer certain of the exchange controls, are authorized by the Treasury to deal in foreign exchange.
Such dealings in foreign exchange by authorized dealers are undertaken in accordance with the provisions and requirements of the exchange control
rulings, or Rulings, and contain certain administrative measures, as well as conditions and limits applicable to transactions in foreign exchange,
which may be undertaken by authorized dealers. Non-residents have been granted general approval, in terms of the Rulings, to deal in South
African assets, to invest and disinvest in South Africa.
and the Kingdoms of Lesotho and Swaziland. Transactions between residents of the Common Monetary Area are not subject to these exchange
control regulations.
application of monetary policy, detrimental effects on inward foreign investment and administrative costs associated therewith. The South African
Finance Minister has indicated that all remaining exchange controls are likely to be dismantled as soon as circumstances permit. Since 1998, there
has been a gradual relaxation of exchange controls. The gradual approach to the abolition of exchange controls adopted by the Government of
South Africa is designed to allow the economy to adjust more smoothly to the removal of controls that have been in place for a considerable period
of time. The stated objective of the authorities is equality of treatment between residents and non-residents with respect to inflows and outflows of
capital. The focus of regulation, subsequent to the abolition of exchange controls, is expected to favor the positive aspects of prudential financial
supervision.
permitted to maintain foreign bank accounts without SARB approval and, without the approval of SARB, are generally not permitted to export
capital from South Africa or hold foreign currency. In addition, South African companies are required to obtain the approval of the SARB prior to
raising foreign funding on the strength of their South African statements of financial position, which would permit recourse to South Africa in the
event of defaults. Where 75% or more of a South African company's capital, voting power, power of control or earnings is directly or indirectly
controlled by non-residents, such a corporation is designated an “affected person” by the SARB, and certain restrictions are placed on its ability to
obtain local financial assistance. We are not, and have never been, designated an “affected person” by the SARB.
South African companies are generally required to repatriate to South Africa profits of foreign operations and are limited in their ability to utilize
profits of one foreign business to finance operations of a different foreign business. South African companies establishing subsidiaries, branches,
offices or joint ventures abroad are generally required to submit financial statements on these operations as well as progress reports to the SARB
on an annual basis. As a result, a South African company's ability to raise and deploy capital outside the Common Monetary Area is restricted.
stage. Some of the more salient changes to the South African exchange control provisions over the past few years have been as follows:
●
corporations wishing to invest in countries outside the Common Monetary Area, in addition to what is set out below, apply for permission
to enter into corporate asset/share swap and share placement transactions to acquire foreign investments. The latter mechanism entails
the placement of the locally quoted corporation's shares with long-term overseas holders who, in payment for the shares, provide the
foreign currency abroad which the corporation then uses to acquire the target investment;
●
corporations wishing to establish new overseas ventures are permitted to transfer offshore up to R500 million to finance approved
investments abroad and up to R500 million to finance approved new investments in African countries on an annual bases. Approval
from the SARB is required in advance for investments in excess of R500 million. On application to the SARB, corporations are also
allowed to use part of their local cash holdings to finance up to 10% of approved new foreign investments where the cost of these
investments exceeds the current limits;
●
as a general rule, the SARB requires that more than 10% of equity of the acquired off-shore venture is acquired within a predetermined
period of time, as a prerequisite to allowing the expatriation of funds. If these requirements are not met, the SARB may instruct that the
equity be disposed of. In our experience the SARB has taken a commercial view on this, and has on occasion extended the period of
time for compliance; and
79
●
remittance of directors' fees payable to persons permanently resident outside the Common Monetary Area may be approved by
authorized dealers, in terms of the Rulings.
African residents in respect of fixed and ascertained foreign exchange commitments covering the movement of goods.
The balance of the emigrant's funds will be blocked and held under the control of an authorized dealer. These blocked funds may only be invested
in:
●
blocked current, savings, interest bearing deposit accounts in the books of an authorized dealer in the banking sector;
●
securities quoted on the JSE and financial instruments listed on the Bond Exchange of South Africa which are deposited with an
authorized dealer and not released except temporarily for switching purposes, without the approval of the SARB. Authorized dealers
must at all times be able to demonstrate that listed or quoted securities or financial instruments which are dematerialized or immobilized
in a central securities depository are being held subject to the control of the authorized dealer concerned; or
●
mutual funds.
capital gains or out of income earned prior to emigration remain subject to the blocking procedure. It is not possible to predict when existing
exchange controls will be abolished or whether they will be continued or modified by the South African Government in the future.
Sale of Shares
Monetary Area between non-residents of the Common Monetary Area. In addition, the proceeds from the sale of ordinary shares on the JSE on
behalf of shareholders who are not residents of the Common Monetary Area are freely remittable to such shareholders. Share certificates held by
non-residents will be endorsed with the words “non-resident,” unless dematerialized.
Dividends
payable in respect of the shares underlying the ADRs, subject to the terms of the deposit agreement entered on August 12, 1996, and as amended
and restated, between the Company and The Bank of New York, as the depository. Subject to exceptions provided in the deposit agreement, cash
dividends paid in rand will be converted by the depositary to dollars and paid by the depositary to holders of ADRs, net of conversion expenses of
the depositary, in accordance with the deposit agreement. The depositary will charge holders of ADRs, to the extent applicable, taxes and other
governmental charges and specified fees and other expenses.
Voting rights
our ordinary shares.
80
10E. TAXATION
Material South African Income Tax Consequences
to the consequences to any particular purchaser of our securities is made hereby. Prospective purchasers are urged to consult their tax advisers with
respect to their particular circumstances and the effect of South African or other tax laws to which they may be subject.
pay tax in South Africa except in the following circumstances:
Income Tax and Withholding Tax on Dividends
Africa. Interest earned by a non-resident on a debt instrument issued by a South African company will be regarded as being derived from a South
African source but will be regarded as exempt from taxation in terms of Section 10(1)(i) of the South African Income Tax Act, 1962 (as amended),
or the Income Tax Act. This exemption applies to so much of any interest and dividends (which are not otherwise exempt) received from a South
African source not exceeding (a) R34,500 if the taxpayer is 65 years of age or older or (b) R23,800 if the taxpayer is younger than 65 years of age
at the end of the relevant tax year.
Section 64F of the amendments to the Income Tax Act as set out in Part VIII in Chapter II of the Income Tax Act sets out beneficial
owners who are exempt from the dividend tax which includes resident companies receiving a dividend after the effective date, being April 1, 2012.
The Convention between the United States of America and the Republic of South Africa for the Avoidance of Double Taxation and the Prevention
of Fiscal Evasion with Respect to Taxes on Income and Capital Gains, or the Tax Treaty, would limit the rate of this tax with respect to dividends
paid on ordinary shares or ADRs to a U.S. resident (within the meaning of the Tax Treaty) to 5% of the gross amount of the dividends if such U.S.
resident is a company which holds directly at least 10% of our voting stock and 20% of the gross amount of the dividends in all other cases.
The above provisions shall not apply if the beneficial owner of the dividends is resident in the United States, carries on business in South
Africa through a permanent establishment situated in South Africa, or performs in South Africa independent personal services from a fixed base
situated in South Africa, and the dividends are attributable to such permanent establishment or fixed base.
for both fiscal periods. The gold mining tax formula for determining the South African gold mining tax rate for fiscal years ended 2022 and
2021 is: Y = 34 – 170/X. Where Y is the percentage rate of tax payable and X is the ratio of taxable income, net of any qualifying capital
expenditure that bears to mining income derived, expressed as a percentage. The tax rate for non-mining taxable income is 28% for both fiscal
years 2022 and 2021.
On February 23, 2022, the Minister of Finance announced that the corporate income tax (“
CIT
”) rate will be lowered from 28% to
27% for companies with years of assessment commencing on or after April 1, 2022. The mining operations of the Group accounts for income
tax using the gold mining tax formula as opposed to the CIT rate. The gold mining tax formula was changed to Y = 33 - 165/X for years of
assessment commencing on or after April 1, 2022. It was further announced that the lowering of the CIT rate will be implemented alongside
additional amendments to broaden the CIT base by limiting interest deductions and assessed losses. Section 23M which limits the deduction
of interest payable to certain parties who are not subject to tax was significantly widened. A maximum of R1 million or 80% of assessed
losses (whichever is greater) is permitted to be set-off against taxable income.
“
hybrid debt instrument
” is deemed to be a dividend
in specie
income tax, as opposed to interest which is taxable. The terms of some of our intercompany loans cause the affected loans to be deemed as
“
hybrid debt instruments
” and the interest thereof to be deemed to be an exempt dividend
in specie
. This characterization of the affected loans
as a “
hybrid debt instrument
” was not impacted by subsequent amendments to Section 8F of the Income Tax Act that became effective in fiscal
year 2017.
81
U.S. Federal Income Tax Considerations
disposition of ordinary shares or ADRs. Unless otherwise indicated, this discussion addresses only U.S. Holders who hold ordinary shares or ADRs
as capital assets (generally, property held for investment) for U.S. federal income tax purposes. This discussion is based upon the provisions of the
U.S. Internal Revenue Code of 1986, as amended (the “Code”), Treasury regulations promulgated thereunder, judicial decisions, published rulings
of the Internal Revenue Service (the “IRS”), administrative pronouncements and other relevant authorities, all as in effect on the date hereof and
all of which are subject to differing interpretations and change, possibly on a retroactive basis. There can be no assurance that the IRS would not
assert, or that a court would not sustain, a position contrary to any of the considerations discussed herein.
Medicare tax on certain net investment income, or any state, local or non-U.S. tax considerations, relating to the ownership or disposition of
ordinary shares or ADRs, nor does it address all aspects of U.S. federal income taxation that may be relevant to U.S. Holders in light of their
particular circumstances or that may be relevant to certain types of U.S. Holders subject to special treatment under U.S. federal income tax law
(such as dealers in securities or currencies, partnerships or other pass-through entities, banks and other financial institutions, traders in securities
that elect mark-to-market treatment, insurance companies, tax-exempt organizations (including private foundations), certain expatriates or former
long-term residents of the United States, persons holding ordinary shares or ADRs as part of a “hedge,” “conversion transaction,” “synthetic
security,” “straddle,” “constructive sale” or other integrated investment, persons who acquired the ordinary shares or ADRs upon the exercise of
employee stock options or otherwise as compensation, persons whose functional currency is not the U.S. dollar, or persons that actually or
constructively own ten percent or more of the voting power or value of our shares).
82
For purposes of this discussion, a “U.S. Holder” is a beneficial owner of ordinary shares or ADRs that is, for U.S. federal income tax purposes:
●
a citizen or individual resident of the United States;
●
a corporation (or any entity treated as a corporation for U.S. federal income tax purposes) created or organized under the laws of the
United States, any state thereof or the District of Columbia;
●
an estate the income of which is subject to U.S. federal income tax without regard to its source; or
●
a trust (i) if a court within the United States is able to exercise primary supervision over the administration of the trust and one or more
U.S. persons have the authority to control all substantial decisions of the trust, or (ii) if the trust has made a valid election to be treated
as a U.S. person.
or ADRs, the U.S. federal income tax treatment of a partner in the partnership will generally depend on the status of the partner and the activities
of the partnership. Partnerships holding any ordinary shares or ADRs and their partners should consult their tax advisors regarding an investment
in ordinary shares or ADRs.
applicable to the ownership and disposition of ordinary shares or ADRs in light of their particular circumstances as well as any considerations to
them arising under the tax laws of any foreign, state or local taxing jurisdiction.
Distributions
ADRs. Exchanges of ordinary shares for ADRs and ADRs for ordinary shares will generally not be subject to U.S. federal income tax.
received by a U.S. Holder on ordinary shares or ADRs (including any amounts withheld in respect of South African withholding taxes) will
generally be subject to tax to the extent paid out of our current or accumulated earnings and profits, as determined under U.S. federal income tax
principles, and will be includible in the gross income of a U.S. Holder on the day actually or constructively received. For U.S. federal income tax
purposes, the gross amount of any distributions received by a U.S. Holder will generally equal the dollar value of the sum of the South African
rand payments made (including any amounts withheld in respect of South African withholding taxes), determined at the “spot rate” on the date the
dividend distribution is includable in such U.S. Holder's income, regardless of whether the payment is in fact converted into dollars. Generally,
any gain or loss resulting from currency exchange fluctuations during the period from the date a U.S. Holder includes the dividend payment in
income to the date such holder converts the payment into dollars will be treated as ordinary income or loss.
be applied against and reduce the U.S. Holder's basis in the ordinary shares or ADRs. To the extent that distributions exceed the U.S. Holder's tax
basis in the ordinary shares or ADRs, as applicable, the excess generally will be treated as capital gain, subject to the discussion below under the
heading “Passive Foreign Investment Company”. We do not intend to calculate our earnings or profits for U.S. federal income tax purposes. U.S.
Holders should therefore assume that any distributions on our ordinary shares or ADRs will constitute dividend income.
to “qualified dividend income,” provided that certain conditions are satisfied, including that (1) the ordinary shares or ADSs are readily tradable
on an established securities market in the United States, or we are eligible for the benefits of a qualifying income tax treaty, (2) we are neither a
PFIC nor treated as such with respect to a U.S. Holder (as discussed below) for the taxable year in which the dividend is paid and the preceding
taxable year, and (3) certain holding period requirements are met. Dividend income derived with respect to the ordinary shares or ADRs will not
be eligible for the dividends received deduction generally allowed to a U.S. corporation. U.S. Holders should consult their tax advisors regarding
the U.S. federal income tax rate that will be applicable to their receipt of any dividends paid with respect to the ordinary shares and ADRs.
from foreign sources and will generally constitute passive category income. Subject to certain conditions and limitations, a U.S. Holder eligible
for the benefits of an applicable income tax treaty may be eligible to claim a foreign tax credit in respect of any South African income taxes paid
or withheld with respect to dividends on ordinary shares or ADSs to the extent such taxes are nonrefundable under the treaty. Alternatively, a U.S.
Holder may elect to deduct such taxes in computing its taxable income for U.S. federal income tax purposes. A U.S. Holder’s election to deduct
foreign taxes instead of claiming foreign tax credits applies to all creditable foreign income taxes paid or accrued in the relevant taxable year. The
rules regarding foreign tax credits and the deductibility of foreign taxes are complex. All U.S. Holders should consult their tax advisors regarding
the availability of foreign tax credits and the deductibility of foreign taxes in light of their particular circumstances.
83
Passive Foreign Investment Company
income tax purposes for any taxable year if either (i) 75% or more of our gross income for such year, including our pro rata share of the gross
income of any company in which we are considered to own 25% or more of the shares by value, consists of certain types of “passive income” or
(ii) 50% or more of the value of our assets (determined on the basis of a quarterly average) during such year, including our pro rata share of the
assets of any company in which we are considered to own 25% or more of the shares by value, is attributable to assets that produce or are held for
the production of passive income. Passive income generally includes dividends, interest, royalties, rents, annuities, net gains from the sale or
exchange of property producing such income and net foreign currency gains. Passive assets are those which give rise to passive income and include
assets held for investment, as well as cash, assets readily convertible into cash, and (subject to certain exceptions) working capital. Our company’s
goodwill and other unbooked intangibles are taken into account and may be classified as active or passive depending on the income such assets
generate or are held to generate.
special rules with respect to any (i) gain recognized upon the disposition of the ordinary shares or ADRs and (ii) receipt of an excess distribution
(generally, any distributions to a U.S. Holder during a taxable year that is greater than 125% of the average amount of distributions received by
such U.S. Holder during the three preceding taxable years in respect of the ordinary shares or ADRs or, if shorter, such U.S. Holder's holding
period for the ordinary shares or ADRs). Under these rules:
●
the gain or excess distribution will be allocated ratably over a U.S. Holder's holding period for the ordinary shares or ADRs, as applicable;
●
amounts allocated to the taxable year of the excess distribution or of the sale or other disposition and to any taxable years in the U.S.
Holder’s holding period prior to the first taxable year in which we are classified as a PFIC (each, a “pre-PFIC year”), will be taxed as
ordinary income;
●
amounts allocated to each prior year (other than the current taxable year or a pre-PFIC year) will be taxed at the highest tax rate in effect
applicable to the U.S. Holder for that year; and
●
such amounts will be increased by an additional tax equal to interest on the resulting tax deemed deferred with respect to such years
(other than the current taxable year or a pre-PFIC year).
period, if we cease to be a PFIC, the U.S. Holder may avoid PFIC classification for subsequent years if such holder elects to recognize gain based
on the unrealized appreciation in the ordinary shares or ADRs through the close of the tax year in which we cease to be a PFIC.
Secretary of Treasury may require.
and interest charge described above by making a mark-to-market election. Pursuant to this election, the U.S. Holder would include in ordinary
income or loss for each taxable year an amount equal to the difference between, as of the close of the taxable year, the fair market value of the
ordinary shares or ADRs and the U.S. Holder's adjusted tax basis in such ordinary shares or ADRs. Losses would be allowed only to the extent of
net mark-to-market gain previously included by the U.S. Holder under the election for prior taxable years. If a U.S. Holder makes a mark-to-market
election, then, in any taxable year for which we are classified as a PFIC, tax rules that apply to distributions by corporations that are not PFICs
would apply to distributions by us (except that the lower applicable capital gains rate for qualified dividend income would not apply). If a U.S.
Holder makes a valid mark-to-market election and we subsequently cease to be classified as a PFIC, the U.S. Holder will not be required to take
into account the mark-to-market income or loss described above during any period that we are not classified as a PFIC. In addition, because, as a
technical matter, a mark-to-market election cannot be made for any lower-tier PFICs that we may own, a U.S. Holder may continue to be subject
to the PFIC rules with respect to such U.S. Holder’s indirect interest in any investments held by us that are treated as an equity interest in a PFIC
for U.S. federal income tax purposes. U.S. Holders should consult their tax advisors with respect to the application and effect of making the mark-
to-market election for their ordinary shares or ADRs.
interest charge described above will not apply if such holder makes an election to treat us as a “qualified electing fund” in the first taxable year in
which such holder owns the ordinary shares or ADRs and if we comply with certain reporting requirements. However, we do not intend to provide
the information necessary for U.S. Holders to make qualified electing fund elections.
taxable year or foreseeable future taxable years, however, because our PFIC status is a factual determination made annually that will depend, in
part, upon the composition of our income and assets. The value of our assets for purposes of the asset test, including the value of our goodwill and
unbooked intangibles, may be determined in part by reference to the market price of our ordinary shares or ADRs from time to time (which may
be volatile). Because we will generally take into account our current market capitalization in estimating the value of our goodwill and other
unbooked intangibles, our PFIC status for the current taxable year and foreseeable future taxable years may be affected by our market capitalization.
84
The rules relating to PFICs are complex. U.S. Holders should consult their tax advisors regarding the application of the PFIC rules to
their investments in our ordinary shares or ADRs.
Disposition of Ordinary Shares or ADRs
amount equal to the difference between the U.S. dollar value of the amount realized on the disposition and such holder's adjusted tax basis in the
ordinary shares or ADRs. Subject to the discussion above under the heading “Passive Foreign Investment Company”, such gain or loss will
generally be long-term capital gain or loss a if the U.S. Holder’s holding period in the ordinary shares or ADRs exceeds one year. Long-term
capital gains of individuals and certain other non-corporate U.S. Holders are generally eligible for a reduced rate of taxation. The deductibility of
capital losses is subject to limitations. Gain or loss recognized by a U.S. Holder on the taxable disposition of ordinary shares or ADRs will generally
be treated as U.S. source gain or loss for U.S. foreign tax credit purposes.
85
amount realized will be based on the spot rate as determined on the settlement date of such exchange. A U.S. Holder who receives payment in rand
and converts rand into U.S. dollars at a conversion rate other than the rate in effect on the settlement date may have a foreign currency exchange
gain or loss that would be treated as ordinary income or loss.
ordinary shares or ADRs, provided that the election is applied consistently from year to year. Such election may not be changed without the consent
of the IRS. In the event that an accrual basis U.S. Holder does not elect to be treated as a cash basis taxpayer, such U.S. Holder may have a foreign
currency gain or loss for U.S. federal income tax purposes because of the differences between the U.S. dollar value of the currency received
prevailing on the trade date and the settlement date. Any such currency gain or loss will be treated as ordinary income or loss and would be in
addition to gain or loss, if any, recognized by such U.S. Holder on the disposition of such ordinary shares or ADRs.
Information with respect to Foreign Financial Assets
shares or ADRs, subject to certain exceptions (including an exception for assets held in accounts maintained by certain financial institutions,
although the account itself may be reportable if held at a non-U.S. financial institution). U.S. Holders should consult their tax advisers regarding
the effect, if any, of this reporting requirement on their acquisition, ownership and disposition of ordinary shares or ADRs. U.S. Holders should
consult their tax advisors regarding application of the information reporting and backup withholding rules.
10F. DIVIDENDS AND PAYING AGENTS
Not applicable.
10G. STATEMENT BY EXPERTS
Not applicable.
10H. DOCUMENTS ON DISPLAY
DRDGOLD files annual reports on Form 20-F and reports on Form 6-K with the SEC. You may access this information at the SEC’s
home page (http://www.sec.gov). Copies of the documents referred to herein may be inspected at DRDGOLD Limited’s offices by contacting
DRDGOLD Limited, P.O. Box 390, Maraisburg, Johannesburg, South Africa 1700. Attn: Company Secretary. Tel No. +27-11-470-2600.
10I. SUBSIDIARY INFORMATION
Not applicable.
ITEM 11. QUANTITATIVE AND QUALITATIVE DISCLOSURES ABOUT MARKET RISK
General
risks. Refer to Item 18. ‘‘Financial Statements - Note 27 - Financial instruments’’ of the consolidated financial statements for a qualitative and
quantitative discussion of our exposure to these market risks.
Our long-term strategy is to remain unhedged and to keep borrowings to a minimum. During fiscal 2022 we do not hold or issue
derivative financial instruments for speculative purposes, nor did we hedge forward gold sales.
However, in instances where we need to incur
medium-term borrowings to finance growth projects that introduce some liquidity risk to the Group, we may mitigate this liquidity risk by entering
into an arrangement to provide price protection against a possible decrease in the Rand gold price while borrowings are in place. For example in
fiscal 2019 we entered into a hedging instrument in the form of a collar in respect of 50,000 ounces of gold that expired at the end of May 2019.
Commodity price risk
dividends and undertake capital expenditures, and the market price of our ordinary shares or ADSs. Historically, rand gold prices have fluctuated
widely and are affected by numerous industry factors over which we have no control. The aggregate effect of these factors on the rand gold price
is impossible for us to predict. The rand price of gold may not remain at a level allowing us to economically exploit our reserves.
to finance growth projects that introduce some liquidity risk to the Group, we may mitigate this liquidity risk by entering into an arrangement to
provide price protection against a possible decrease in the Rand gold price while borrowings are in place.
86
Concentration of credit risk
Credit risk is the risk of financial loss to us if a customer or counterparty to a financial instrument fails to meet its contractual obligations,
and arises principally from our trade and other receivables from customers
.
rehabilitation and other funds in the statement of financial position), mandating the Guardrisk Cell Captive to diversify the funds across a number
of major financial institutions, as well as investing funds in low-risk, interest-bearing cash and cash equivalents.
exposure to credit risk on other receivables by dealing with a number of counterparties, ensuring that these counterparties are of good credit
standing and transacting on a secured or cash basis where considered required. Receivables are regularly monitored and assessed for recoverability.
Foreign currency risk
��
Our reportinginto rands. No hedges were entered into during fiscal 2022. We are thus exposed to fluctuations in the US dollar/rand exchange rate. Foreign
exchange fluctuations affect the cash flow that we will realize from our operations as gold is sold in US dollars, while production costs are incurred
primarily in rands. Our results are positively affected when the US dollar strengthens against the rand and adversely affected when the US dollar
weakens against the rand. Our cash and cash equivalent balances are mostly held in South African rands.
Liquidity risk - Long-term debt
Set out below is an analysis of our debt as at June 30, 2022 consisting of capital and interest related to lease liabilities. All of
our long-term debt is denominated in South African rand.
Interest rate
Total
6.4% - 10.3%
R'm
Repayment period
2023
22.4
2024
15.7
2025
8.4
2026
7.6
2027
3.4
2028
2.1
Total
59.6
Based on our fiscal year 2022 financial results, a hypothetical 100 basis points (increase)/decrease in interest rate activity would
(increase)/decrease our interest expense by R0.5 million.
ITEM 12. DESCRIPTION OF SECURITIES OTHER THAN EQUITY SECURITIES
12A. DEBT SECURITIES
Not applicable
.
12B. WARRANTS AND RIGHTS
Not applicable.
12C. OTHER SECURITIES
Not applicable.
87
12D. AMERICAN DEPOSITARY SHARES
Depositary Fees and Charges
York Stock Exchange, or NYSE under the symbol “DRD” (until December 29, 2011 our ADSs were traded on the Nasdaq Capital Market under
the symbol “DROOY”). The ADSs are evidenced by American Depository Receipts, or ADRs, issued by The Bank of New York Mellon, as
Depository under the Amended and Restated Deposit Agreement dated as of August 12, 1996, as amended and restated as of October 2, 1996, as
further amended and restated as of August 6, 1998, as further amended and restated July 23, 2007, among DRDGOLD Limited, The Bank of New
York Mellon and owners and beneficial owners of ADRs from time to time. ADR holders may have to pay the following service fees to the
Depositary:
Service
Fees (USD)
Issuance of ADSs, including issuances resulting from a distribution of
ordinary shares or rights
$5.00 (or less) per 100 ADSs (or portion thereof)
1
Cancellation of ADSs for the purpose of withdrawal, including if the Deposit
Agreement terminates
$5.00 (or less) per 100 ADSs (or portion thereof)
1
Distribution of cash dividends or other cash distributions
2 cents (or less) per ADS (or portion thereof)
Distribution of securities distributed to holders of deposited securities which
are distributed by the Depositary to ADS registered holders
$5.00 (or less) per 100 ADSs (or portion thereof)
[1]
Depositary or delivering the ADSs to the Depositary for cancellation. The brokers in turn charge these transaction fees to their clients.
In addition, ADR holders are responsible for certain fees and expenses incurred by the Depositary on their behalf including
of ordinary shares generally on the share register and applicable to transfers of ordinary shares to the name of the Depositary or its
nominee or the Custodian or its nominee on the making of deposits or withdrawals, (3) such cable, telex and facsimile transmission
expenses as are expressly provided in the Deposit Agreement, and (4) such expenses as are incurred by the Depositary in the conversion
of foreign currency to U.S. Dollars.
The Depositary collects its fees for delivery and surrender of ADSs directly from investors depositing or surrendering ADSs for the
purpose of withdrawal or from intermediaries acting for them. The Depositary, collects fees for making distributions to investors by deducting
those fees from the amounts distributed or by selling a portion of distributable property to pay the fees. The Depositary may collect its annual fee
for depositary services by deductions from cash distributions or by directly billing investors or by charging the book-entry system accounts of
participants acting for them. The Depositary may generally refuse to provide fee-attracting services until its fees for those services are paid.
Depositary Payments
The Bank of New York Mellon, as Depositary, has agreed to reimburse DRDGOLD an annual amount of $75,000 mainly consisting of
accumulated contributions towards the Company’s investor relations activities (including investor meetings, conferences and fees of investor
relations service vendors). After the deduction of other fees, the annual reimbursement for the year ended June 30, 2022 amounts to approximately
$11,721 (June 30, 2021: $51,944, June 30, 2020: $16,237). DRDGOLD is also entitled to a 25% share of the dividend fees which amounts to
approximately $93,565for the year ended June 30, 2022 (June 30, 2021: $65,551, June 30, 2020: $nil).
88
PART II
ITEM 13. DEFAULTS, DIVIDEND ARREARAGES AND DELINQUENCIES
There have been no material defaults in the payment of principal, interest, a sinking or purchase fund installment, or any other material
defaults with respect to any indebtedness of ours.
ITEM 14. MATERIAL MODIFICATIONS TO THE RIGHTS OF SECURITY HOLDERS AND USE OF PROCEEDS
None
ITEM 15. CONTROLS AND PROCEDURES
15A. Disclosure Controls and Procedures
As of June 30, 2022, our management, with the participation of our Chief Executive Officer and Chief Financial Officer have
evaluated the effectiveness of our disclosure controls and procedures (as this term is defined in Rules 13a-15(e) and 15d-15(e) of the Exchange
Act). Our management, including the Chief Executive Officer and Chief Financial Officer, concluded that our disclosure controls and
procedures were effective as of June 30, 2022.
Our disclosure controls and procedures are designed to provide reasonable assurance that information required to be disclosed by us
in the reports that we file or submit under the Securities Exchange Act of 1934 is recorded, processed, summarized and reported, within the
time periods specified in the applicable rules and forms and that such information required to be disclosed by us in the reports we file or submit
under the Securities Exchange Act of 1934 is accumulated and communicated to our management, including our Chief Executive Officer and
Chief Financial Officer, as appropriate to allow timely decisions regarding required disclosures.
There are inherent limitations in the effectiveness of any system of disclosure controls and procedures. These limitations include the
possibility of human error and the circumvention or overriding of the controls and procedures. Accordingly, any such system can only provide
reasonable assurance of achieving the desired control objectives.
15B. Management’s Annual Report on Internal Control Over Financial Reporting
Our management is responsible for establishing and maintaining adequate internal control over financial reporting. Internal control
over financial reporting is defined in Rule 13a-15(f) or 15d-15(f) promulgated under the Securities Exchange Act of 1934 as a process designed
by, or under the supervision of, our Chief Executive Officer and Chief Financial Officer and effected by our board, management and other
personnel to provide reasonable assurance regarding the reliability of financial reporting and the preparation of financial statements for external
purposes in accordance with IFRS. Under Section 404(a) of the Sarbanes Oxley Act of 2002, management is required to assess our internal
controls surrounding the financial reporting process as at the end of each fiscal year. Based on that assessment, management is to determine
whether or not our internal controls over financial reporting are effective.
Internal control over financial reporting includes those policies and procedures that:
●
pertain to the maintenance of records that in reasonable detail accurately and fairly reflect the transactions and dispositions of
our assets;
●
provide reasonable assurance that transactions are recorded as necessary to permit preparation of financial statements in
accordance with IFRS, and that our receipts and expenditures are being made only in accordance with authorizations of our
management and board; and
●
provide reasonable assurance regarding prevention or timely detection of unauthorized acquisition, use or disposition of our
assets that could have a material effect on our financial statements.
Because of its inherent limitations, internal control over financial reporting may not prevent or detect misstatements. Instead, it must
be noted that even those systems that management deems to be effective can only provide reasonable assurance with respect to the preparation
and presentation of our financial statements. Also, projections of any evaluation of effectiveness to future periods are subject to the risk that
controls may become inadequate because of changes in conditions, or the degree of compliance with the policies and procedures.
Our management assessed the effectiveness of our internal control over financial reporting as of June 30, 2022. In making this
assessment, our management used the criteria set forth by the
Internal Control -Integrated Framework (2013)
issued by the Committee of
Sponsoring Organizations of the Treadway Commission (COSO). Based on our assessment and those criteria, our management concluded that
as of June 30, 2022 our internal control over financial reporting was effective.
15C. Attestation Report of the independent registered public accounting firm
The effectiveness of internal control over financial reporting as of June 30, 2022 was audited by KPMG Inc., independent registered
public accounting firm, as stated in their report on page F-1 of this Form 20-F.
15D. Changes in Internal Control Over Financial Reporting
During the year ended June 30, 2022, there have not been any changes in our internal control over financial reporting that have
materially affected, or are reasonably likely to materially affect, our internal control over financial reporting.
89
ITEM 16. [RESERVED]
ITEM 16A. AUDIT COMMITTEE FINANCIAL EXPERT
Mr. J.A. Holtzhausen, Chairman of the Audit Committee, has been determined by our board to be an audit committee financial expert
within the meaning of the Sarbanes-Oxley Act, in accordance with the Rules of the New York Stock Exchange, or NYSE, and rules promulgated
by the SEC and independent both under the New York Stock Exchange Rules and the South African Johannesburg Stock Exchange Rules. The
board is satisfied that the skills, experience and attributes of the members of the Audit Committee are sufficient to enable those members to
discharge the responsibilities of the Audit Committee.
ITEM 16B. CODE OF ETHICS
We have adopted a Code of Conduct that applies to all senior executives including our Non-Executive Chairman, the Chief Executive
Officer, Chief Financial Officer, Chief Operating Officer and the Financial Directors and Managing Directors at our mining operations as well
as all other employees. The Code of Conduct can be accessed on the Company’s website at the following web address:
www.drdgold.com/about-us/governance.
ITEM 16C. PRINCIPAL ACCOUNTANT FEES AND SERVICES
KPMG Inc. has served as our independently registered public accountant for the fiscal years ended June 30, 2022, 2021 and 2020, for
which audited financial statements appear in this Annual Report. The Annual General Meeting elects the auditors annually.
year 2022 and 2021:
Audit Fees
Audit fees billed for the annual audit services engagement, which are those services that the external auditor reasonably can provide,
include the company audit; statutory audits; comfort letters and consents; attest services; and assistance with and review of documents filed with
the SEC.
Auditors' remuneration
Year ended June 30,
2022
2021
R m
R m
Audit fees
8.6
9.1
All other fees
0.4
0.7
Total
9.0
9.8
All Other Fees
●
R0.2 million with respect to limited assurance provided by KPMG on specified items contained in our Integrated Report for fiscal
year 2021; and
●
R0.2 million with respect to limited assurance provided by KPMG on specified items contained in our Integrated Report for fiscal
year 2022;
●
R0.5 million with respect to limited assurance provided by KPMG on specified items contained in our Integrated Report for fiscal
year 2020; and
●
R0.2 million with respect to limited assurance provided by KPMG on specified items contained in our Integrated Report for fiscal
year 2021
as well as the remuneration and terms of engagement of the external auditors. The committee pre-approves, and has pre-approved, all non-
audit services provided by the external auditors. The Audit Committee considered all of the fees mentioned above and determined that such fees
are compatible with maintaining KPMG Inc.’s independence.
90
ITEM 16D. EXEMPTIONS FROM THE LISTING STANDARDS FOR AUDIT COMMITTEES
Not applicable.
ITEM 16E. PURCHASES OF EQUITY SECURITIES BY THE ISSUER AND AFFILIATED PURCHASERS
ITEM 16F. CHANGE IN REGISTRANT'S CERTIFYING ACCOUNTANT
To comply with section 10(1)(a) of the Auditing Profession Act, 26 of 2005, the Independent Regulatory Board for Auditors (“
IRBA
”)
published the rule on Mandatory Audit Firm Rotation (“
MAFR
”) for auditors of all public interest entities, as defined in section 290.25 to 290.26
of the amended IRBA Code of Professional Conduct for Registered Auditors. An audit firm, including a network firm as defined in the IRBA
Code of Professional Conduct for Registered Auditors, shall not serve as the appointed auditor of a public interest entity for more than 10
consecutive financial years. Thereafter, the audit firm will only be eligible for reappointment as the auditor after the expiry of at least five financial
years. The requirement is effective for financial years commencing on or after 1 April 2023. On October 20, 2022, BDO South Africa Inc. was
appointed by DRDGOLD’s Board of Directors as the Company’s independent principal accountants for the fiscal year ending June 30, 2023
(subject to shareholder approval), after a formal tender process to appoint a new independent registered public accounting firm.
KPMG
”) will resign as independent principal accountants of the group upon completion of their audit of the Company’s
consolidated financial statements as of and for the year ended June 30, 2022 and the effectiveness of internal control over financial reporting as of
June 30, 2022, and the issuance of their report thereon.
not contain any adverse opinion or disclaimer of opinion, nor were they qualified or modified as to uncertainty, audit scope, or accounting
principles. The audit reports of KPMG on the effectiveness of internal control over financial reporting as of June 30, 2022 and 2021 did not contain
any adverse opinion or disclaimer of opinion, nor were they qualified or modified as to uncertainty, audit scope, or accounting principles. In
connection with the audits of the Company’s financial statements for each of the two fiscal years ended June 30, 2022, there were (i) no
disagreements with KPMG, as that term is used in Item 16F(a)(1)(iv) of Form 20-F over any matters of accounting principles or practices, financial
statement disclosure, or auditing scope or procedures, which, if not resolved to the satisfaction of KPMG, would have caused KPMG to make
reference to the matter in their report and (ii) there were no “reportable events” as defined in Item 16F(a)(1)(v) of Form 20-F.
to the SEC stating whether or not KPMG agrees with the above statements. A copy of such letter, dated October 28, 2022 is filed as an exhibit to
this annual report on Form 20-F, see “Item 19: Exhibits – 16.1"Letter from KPMG Inc. to the Securities and Exchange Commission regarding a
change in registrant's certifying accountant”.
ITEM 16G. CORPORATE GOVERNANCE
As a foreign private issuer with shares listed on the NYSE, we are subject to corporate governance requirements imposed by NYSE.
Under section 303A.11 of the NYSE Listing Standards, a foreign private issuer such as us may follow its home country corporate governance
practices in lieu of certain of the NYSE Listing Standards on corporate governance. DRDGOLD's home country corporate governance practices
are regulated by the Listing Requirements of the JSE
(the "
JSE Listing Requirements
").
We are also exempt from certain NYSE corporate
governance requirements as a "controlled company". The following paragraphs summarize the significant ways in which DRDGOLD's home
country corporate governance standards and its corporate governance practices differ from those followed by domestic companies under the NYSE
Listing Standards.
Shareholder meeting quorum requirements
●
Section 310.00 of the NYSE Listing Standards provides that the quorum required for any meeting of holders of common stock should
be sufficiently high to insure a representative vote. Consistent with the practice of companies incorporated in South Africa, our
Memorandum of Incorporation requires a quorum of three members present with sufficient voting powers in person or by proxy to
exercise in aggregate 25% of the voting rights and we have elected to follow our home country rule.
●
The NYSE Listing Standards require that the non-management directors of US-listed companies meet at regularly scheduled executive
sessions without management. The JSE Listings Requirements do not require such meetings of listed company non-executive directors.
The board has unrestricted access to all company information, records, documents and property. Directors may, if necessary, take
independent professional advice at the Company’s expense and non-executive directors have access to management and may meet
separately with management, without the attendance of executive directors.
●
The NYSE Listing Standards require U.S. listed companies to have a nominating/corporate governance committee composed entirely
of independent directors. The JSE Listing Requirements also require the appointment of such a committee, and stipulate that all members
of this committee must be non-executive directors, the majority of whom must be independent. DRDGOLD has a Nominations
Committee which currently comprises five non-executive directors, all of whom are independent under the NYSE Listing Standards and
the JSE Listing Requirements, except for T.J. Cumming. The Nominations Committee is chaired by the Chairman of DRDGOLD.
91
●
The NYSE Listing Standards require U.S. listed companies to have a compensation committee composed entirely of independent
directors. The JSE Listing Requirements merely require the appointment of such a committee but not that its members be independent.
DRDGOLD has appointed a Remuneration Committee, currently comprising five board members, all of whom are independent under
both the JSE Listing Requirements and the NYSE Listing Standards, except for T.J. Cumming.
ITEM 16H. MINE SAFETY DISCLOSURES
Not applicable.
ITEM 16I.
DISCLOSURE REGARDING FOREIGN JURISDICTIONS THAT PREVENT INSPECTIONS
Not applicable.
92
PART III
ITEM 17. FINANCIAL STATEMENTS
Not applicable.
ITEM 18 FINANCIAL STATEMENTS
The following annual financial statements and related auditor’s report are filed as part of this Annual
Report
Page
Report of the Independent Registered Public Accounting Firm - KPMG
Firm ID
1025
F‑1
Consolidated statement of profit or loss and other comprehensive income for the years ended June 30, 2022,
2021 and 2020
F-4
Consolidated statement of financial position at June 30, 2022 and 2021
F‑5
Consolidated statement of changes in equity for the years ended June 30, 2022, 2021 and 2020
F‑6
Consolidated statement of cash flows for the years ended June 30, 2022, 2021 and 2020
F‑7
Notes to the consolidated financial statements
F‑8 to F‑44
Note
About these consolidated financial statements
1
Use of accounting assumptions, estimates and judgements
2
New standards, amendments to standards and interpretations
3
Performance
Revenue
4
Results from operating activities
5
Cost of sales
5.1
Other income
5.2
Administration expenses and other costs
5.3
Finance income
6
Finance expense
7
Earnings per share
8
Resource assets and related liabilities
Property, plant and equipment
9
Right of use assets and leases
10
Provision for environmental rehabilitation
11
Investment in rehabilitation and other funds
12
Working capital
Cash and cash equivalents
13
Cash generated by operations
14
Trade and other receivables
15
Trade and other payables
16
Inventories
17
Tax
Income tax
18
Income tax expense
18.1
Deferred tax
18.2
Employee matters
Employee benefits
19
Cash-settled tong-term incentive scheme
19.1
Equity settled tong-term incentive scheme
19.2
Transactions with key management personnel
19.3
Capital and equity
Capital management
20
Equity
21
Disclosure items
Interest in subsidiaries
22
Operating segments
23
Payments made under protest
24
Other investments
25
Contingencies
26
Financial instruments
27
Related parties
28
Subsequent events
29
F-1
Report of Independent Registered Public Accounting Firm
To the Shareholders and Board of Directors
DRDGOLD Limited:
Opinions on the Consolidated Financial Statements and Internal Control Over Financial Reporting
We have audited the accompanying consolidated statements of financial position of DRDGOLD Limited and subsidiaries (the Company) as of June
30, 2022 and 2021, the related consolidated statements of profit or loss and other comprehensive income, changes in equity, and cash flows for each
of the years in the three-year period ended June 30, 2022, and the related notes (collectively, the consolidated financial statements). We also have
audited the Company’s internal control over financial reporting as of June 30, 2022, based on criteria established in Internal Control – Integrated
Framework (2013) issued by the Committee of Sponsoring Organizations of the Treadway Commission.
In our opinion, the consolidated financial statements referred to above present fairly, in all material respects, the financial position of the Company as
of June 30, 2022 and 2021, and the results of its operations and its cash flows for each of the years in the three-year period ended June 30, 2022, in
conformity with International Financial Reporting Standards as issued by the International Accounting Standards Board. Also in our opinion, the
Company maintained, in all material respects, effective internal control over financial reporting as of June 30, 2022 based on criteria established in
Internal Control – Integrated Framework (2013) issued by the Committee of Sponsoring Organizations of the Treadway Commission.
Basis for Opinions
The Company’s management is responsible for these consolidated financial statements, for maintaining effective internal control over financial
reporting, and for its assessment of the effectiveness of internal control over financial reporting, included in the accompanying Management’s Annual
Report on Internal Control Over Financial Reporting. Our responsibility is to express an opinion on the Company’s consolidated financial statements
and an opinion on the Company’s internal control over financial reporting based on our audits. We are a public accounting firm registered with the
Public Company Accounting Oversight Board (United States) (PCAOB) and are required to be independent with respect to the Company in accordance
with the U.S. federal securities laws and the applicable rules and regulations of the Securities and Exchange Commission and the PCAOB.
We conducted our audits in accordance with the standards of the PCAOB. Those standards require that we plan and perform the audits to obtain
reasonable assurance about whether the consolidated financial statements are free of material misstatement, whether due to error or fraud, and whether
effective internal control over financial reporting was maintained in all material respects.
Our audits of the consolidated financial statements included performing procedures to assess the risks of material misstatement of the consolidated
financial statements, whether due to error or fraud, and performing procedures that respond to those risks. Such procedures included examining, on a
test basis, evidence regarding the amounts and disclosures in the consolidated financial statements. Our audits also included evaluating the accounting
principles used and significant estimates made by management, as well as evaluating the overall presentation of the consolidated financial statements.
Our audit of internal control over financial reporting included obtaining an understanding of internal control over financial reporting, assessing the risk
that a material weakness exists, and testing and evaluating the design and operating effectiveness of internal control based on the assessed risk. Our
audits also included performing such other procedures as we considered necessary in the circumstances. We believe that our audits provide a reasonable
basis for our opinions.
Definition and Limitations of Internal Control Over Financial Reporting
A company’s internal control over financial reporting is a process designed to provide reasonable assurance regarding the reliability of financial
reporting and the preparation of financial statements for external purposes in accordance with generally accepted accounting principles. A company’s
internal control over financial reporting includes those policies and procedures that (1) pertain to the maintenance of records that, in reasonable detail,
accurately and fairly reflect the transactions and dispositions of the assets of the company; (2) provide reasonable assurance that transactions are
recorded as necessary to permit preparation of financial statements in accordance with generally accepted accounting principles, and that receipts and
expenditures of the company are being made only in accordance with authorizations of management and directors of the company; and (3) provide
reasonable assurance regarding prevention or timely detection of unauthorized acquisition, use, or disposition of the company’s assets that could have
a material effect on the financial statements.
Because of its inherent limitations, internal control over financial reporting may not prevent or detect misstatements. Also, projections of any evaluation
of effectiveness to future periods are subject to the risk that controls may become inadequate because of changes in conditions, or that the degree of
compliance with the policies or procedures may deteriorate.
Critical Audit Matters
The critical audit matters communicated below are matters arising from the current period audit of the consolidated financial statements that were
communicated or required to be communicated to the audit committee and that: (1) relate to accounts or disclosures that are material to the consolidated
financial statements and (2) involved our especially challenging, subjective, or complex judgments. The communication of critical audit matters does
not alter in any way our opinion on the consolidated financial statements, taken as a whole, and we are not, by communicating the critical audit matters
below, providing separate opinions on the critical audit matters or on the accounts or disclosures to which they relate.
Evaluation of the provision for environmental rehabilitation
As discussed in note 11 to the consolidated financial statements, the Company has recorded a provision for environmental rehabilitation of R 517.7
million as of June 30, 2022. The Company’s estimates of undiscounted environmental rehabilitation costs used in calculating the provision are
F-2
determined with the assistance of an independent expert and are based on the Company’s environmental management plans which are developed in
accordance with current regulatory requirements, the Company’s life-of-mine (“LOM”) plan (discussed in note 9 to the consolidated financial
statements) and the planned method and timing of rehabilitation.
We identified the evaluation of the provision for environmental rehabilitation as a critical audit matter. Subjective auditor judgment and specialized
skills and knowledge were required to evaluate the Company’s LOM plan, specifically the estimated quantities of economically recoverable gold and
the estimated rand gold price, that impact the planned method of rehabilitation.
The following are the primary procedures we performed to address this critical audit matter:
●
We evaluated the design and tested the operating effectiveness of certain internal controls relating to the Company’s process to determine the
environmental rehabilitation provision. This included controls related to the determination of the Company’s LOM plan, specifically related to
the estimated quantities of economically recoverable gold, and the estimated rand gold price which impact the planned method of rehabilitation;
●
We involved environmental rehabilitation professionals with specialized skills and knowledge, who assisted in evaluating the results of the
Company’s undiscounted estimated environmental costs detailed in the independent environmental expert’s reports. This was performed by:
-
evaluating the objectivity, knowledge, skills and ability of the Company’s independent expert by comparing their professional qualifications,
experience and affiliations against industry norms and obtained an understanding of their scope of work; and
-
evaluating the undiscounted estimated environmental costs for a selection of sites by performing site inspections and challenging the planned
method of rehabilitation that was determined for each selected site. This was performed by comparing the planned method of rehabilitation
to the approved LOM plan, confirming that it is compliant with the environmental management plans as approved by the Department of
Mineral Resources and Energy, where applicable, aligned with current industry practices and regulatory requirements.
●
We evaluated the objectivity, knowledge, skills and ability of the Company’s independent mineral resources experts, that reviewed management’s
mineral reserves and resources estimates, by comparing their professional qualification, experience and affiliation against industry norms;
●
We evaluated the mineral resources experts’ reports by vouching a selection of the reported reclamation sites to environmental approvals or
mining rights and evaluated the methodology and certain key assumptions used to measure the quantities of economically recoverable gold
against industry norms;
●
We evaluated the reasonableness of the total estimated quantities of economically recoverable gold as indicated in the LOM plan by agreeing a
selection of period-to-period movements to the current period actual recovered gold and increments or adjustments to the data in the mineral
resources expert’s report as well as assessing these movements considering our knowledge of the Company’s business and the industry; and
●
We involved valuation professionals with specialized skills and knowledge, who assisted in evaluating the estimated rand gold price by
comparing it to an independently developed range of rand gold prices based on analyst reports.
Evaluation of deferred tax liabilities related to the Ergo and FWGR operations
As discussed in Note 18 to the consolidated financial statements, the Company has recorded a deferred tax liability of R452 million as of June 30,
2022, a portion of which related to the Ergo and FWGR operations. The deferred tax liabilities related to the Ergo and FWGR operations are calculated
by applying a forecast weighted average tax rate to the temporary differences. The calculation of the forecast weighted average tax rate requires the
use of assumptions and estimates, including the Company’s life-of-mine (“
LOM
”) plan (as discussed in note 9 to the consolidated financial statements)
that is applied to calculate the expected future profitability.
We identified the valuation of deferred tax liabilities related to the Ergo and FWGR operations as a critical audit matter. Subjective auditor judgment
and specialized skills and knowledge were required to evaluate the expected future profitability, that is based on the LOM plan, which includes certain
key assumptions about the estimated quantities of economically recoverable gold and the estimated rand gold price.
The following are the primary procedures we performed to address this critical audit matter:
●
We evaluated the design and tested operating effectiveness of certain internal controls relating to the Company’s process to develop the
assumptions and estimates used in calculating the forecast weighted average tax rate. This included controls related to the determination of the
Company’s LOM plan, specifically related to the estimated rand gold price and estimated quantities of economically recoverable gold that are
applied in determining the expected future profitability;
●
We evaluated the objectivity, knowledge, skills and ability of the Company’s independent mineral resources experts, who reviewed
management’s mineral reserves and resources estimates, by comparing their professional qualifications, experience and affiliations against
industry norms;
●
We evaluated the mineral resources experts’ reports by vouching a selection of the reported reclamation sites to environmental approvals or
mining rights and evaluated the methodology and certain key assumptions used to measure the quantities of economically recoverable gold
against industry norms;
●
We evaluated the reasonableness of the total estimated quantities of economically recoverable gold as indicated in the LOM plan by agreeing a
selection of period-to-period movements to the current period actual recovered gold and increments or adjustments to the data in the expert’s
report, as well as assessing these movements considering our knowledge of the Company’s business and the industry;
●
We involved valuation professionals with specialized skills and knowledge, who assisted in evaluating the estimated rand gold price by
comparing it to an independently developed range of rand gold prices based on analyst reports;
F-3
●
We evaluated the Company’s ability to accurately forecast its expected future profitability by comparing the historical projections of the rand
gold price and estimated quantities of economically recoverable gold to actual results; and
●
We performed sensitivity analyses to assess the impact that changes in the estimated rand gold price and estimated quantities of economically
recoverable gold could have had on the expected future profitability and resultant calculated forecast weighted average tax rate.
Valuation of the investment in Rand Refinery Proprietary Limited
As discussed in Note 25 to the consolidated financial statements, the Company has an unlisted equity investment in Rand Refinery Proprietary Limited
(“
RR
”) that is valued at R 136.1 million as of June 30, 2022. The fair value of the RR investment includes the valuation of the refining operations
(excluding Prestige Bullion) using a free cash flow (“
FCF
”) model and the valuation of RR’s investment in Prestige Bullion (Prestige) using a finite
life dividend discount (“
DD
”) model.
We identified the valuation of the investment in RR as a critical audit matter. Subjective auditor judgment and specialized skills and knowledge were
required to evaluate certain key inputs used in the FCF and DD models, specifically the forecasted average gold and silver prices and the discount
rates, including the weighted average cost of capital of RR and cost of equity for Prestige (“
CoE
”), as well as the marketability and minority discounts,
applied in the calculation of the total fair value for RR.
The following are the primary procedures we performed to address this critical audit matter:
●
We evaluated the design and tested the operating effectiveness of certain internal controls related to the Company’s process to determine the fair
value of the investment in RR. This included controls related to the determination of the forecasted average gold and silver prices, discount rates,
and the marketability and minority discounts;
●
We involved valuation professionals with specialized skills and knowledge, who assisted in:
-
evaluating the forecasted average gold and silver prices used in the FCF and DD models by comparing them to independent analysts’ reports;
-
evaluating the discount rates used by management in the FCF and DD valuation models as well as the marketability and minority discounts
by comparing them against discount rate ranges and marketability and minority discounts that we independently developed using publicly
available macroeconomic indicators and market data for comparable entities;
-
developing an independent range of fair values, using the independently developed discount rates and the forecasted average gold and silver
prices, and compared our range of fair values to the Company’s calculated fair value for the investment in RR; and
-
performing sensitivity analyses to assess the impact on the calculated fair value of changes to the certain key inputs used in the FCF and DD
models.
/s/
KPMG Inc.
We have served as the Company’s auditor since 2003.
Johannesburg, Republic of South Africa
October 28, 2022
CONSOLIDATED STATEMENT OF PROFIT OR LOSS
AND OTHER COMPREHENSIVE INCOME
for the year ended June 30, 2022
F-4
Amounts in R million
Note
2022
2021
2020
Revenue
4
5,118.5
5,269.0
4,185.0
Cost of sales
5.1
(3,741.5)
(3,388.2)
(2,937.9)
Gross profit from operating activities
1,377.0
1,880.8
1,247.1
Other income
5.2
91.3
0.1
0.7
Administration expenses and other costs
5.3
(161.2)
(64.0)
(309.9)
Results from operating activities
1,307.1
1,816.9
937.9
Finance income
6
225.8
216.2
109.8
Finance expense
7
(74.8)
(69.5)
(68.8)
Profit before tax
1,458.1
1,963.6
978.9
Income tax
18.1
(334.3)
(523.7)
(343.9)
Profit for the year
1,123.8
1,439.9
635.0
Other comprehensive income
Items that will not be reclassified to profit or loss, net of tax
Net fair value adjustment on equity investments at fair value through other
comprehensive income
(9.1)
(34.4)
190.6
Fair value adjustment on equity investments at fair value through other
comprehensive income
25
(15.7)
(28.2)
191.8
Deferred tax thereon
18.2
6.6
(6.2)
(1.2)
Total other comprehensive income for the year
(9.1)
(34.4)
190.6
Total comprehensive income for the year
1,114.7
1,405.5
825.6
Earnings per share
Basic earnings per share (SA cents per share)
8
131.2
168.4
82.5
Diluted basic earnings per share (SA cents per share)
8
130.6
167.2
81.0
The accompanying notes are an integral part of these consolidated financial statements.
CONSOLIDATED STATEMENT OF FINANCIAL POSITION
at June 30, 2022
F-5
Amounts in R million
Note
2022
2021
ASSETS
Non-current assets
4,001.2
3,675.3
Property, plant and equipment
9
3,084.1
2,809.7
Investments in rehabilitation and other funds
1
12
710.8
652.2
Payments made under protest
24
40.4
40.5
Other investments
25
151.4
167.1
Deferred tax asset
18.2
14.5
5.8
Current assets
3,077.0
2,672.7
Inventories
17
389.3
340.0
Current tax receivable
12.6
8.6
Trade and other receivables
15
149.5
144.1
Cash and cash equivalents
13
2,525.6
2,180.0
TOTAL ASSETS
7,078.2
6,348.0
EQUITY AND LIABILITIES
Equity
5,439.9
4,820.4
Stated share capital
21.1
6,173.3
6,157.9
Retained earnings
(733.4)
(1,337.5)
Non-current liabilities
1,012.8
996.1
Provision for environmental rehabilitation
11
517.7
570.8
Deferred tax liability
18.2
451.9
377.1
Liability for post-retirement medical benefits
10.4
10.3
Lease liabilities
10.2
32.8
37.9
Current liabilities
625.5
531.5
Trade and other payables
16
598.4
509.8
Current portion of lease liabilities
10.2
19.5
16.9
Current tax liability
7.6
4.8
TOTAL LIABILITIES
1,638.3
1,527.6
TOTAL EQUITY AND LIABILITIES
7,078.2
6,348.0
1
Description of the financial statement caption has changed as it now includes funds other than rehabilitation. See note 12 for more
detail.
The accompanying notes are an integral part of these consolidated financial statements.
CONSOLIDATED STATEMENT OF CHANGES IN EQUITY
for the year ended June 30, 2022
F-6
Stated
share
Other
Retained
Total
Amounts in R million
Note
capital
reserves
earnings
equity
Balance at June 30, 2019
5,072.8
453.6
(2,837.8)
2,688.6
Total comprehensive income
Profit for the year
635.0
635.0
Other comprehensive income
190.6
190.6
Total comprehensive income
-
-
825.6
825.6
Transactions with the owners of the parent
Contributions and distributions
Issue of ordinary shares
1,085.6
1,085.6
Expenses incurred on issue of ordinary shares
(0.5)
(0.5)
Reallocation of the equity instruments on exercise of the
Sibanye-Stillwater option
(453.6)
453.6
-
Dividend on ordinary shares
21.2
(565.1)
(565.1)
Equity settled share-based payment
19.2
6.0
6.0
Total contributions and distributions
1,085.1
(453.6)
(105.5)
526.0
Balance at June 30, 2020
6,157.9
-
(2,117.7)
4,040.2
Total comprehensive income
Profit for the year
1,439.9
1,439.9
Other comprehensive income
(34.4)
(34.4)
Total comprehensive income
-
-
1,405.5
1,405.5
Transactions with the owners of the parent
Contributions and distributions
Dividend on ordinary shares
21.2
(641.3)
(641.3)
Equity settled share-based payment
19.2
16.0
16.0
Total contributions and distributions
-
-
(625.3)
(625.3)
Balance at June 30, 2021
6,157.9
-
(1,337.5)
4,820.4
Total comprehensive income
Profit for the year
1,123.8
1,123.8
Other comprehensive income
(9.1)
(9.1)
Total comprehensive income
-
-
1,114.7
1,114.7
Transactions with the owners of the parent
Contributions and distributions
Dividend on ordinary shares
21.2
(513.6)
(513.6)
Treasury shares disposed of for the vesting of the equity-settled
share-based payment
21.1, 19.2
15.4
(15.4)
-
Equity settled share-based payment
19.2
18.4
18.4
Total contributions and distributions
15.4
-
(510.6)
(495.2)
Balance at June 30, 2022
21.1
6,173.3
-
(733.4)
5,439.9
The accompanying notes are an integral part of these consolidated financial statements.
CONSOLIDATED STATEMENT OF CASH FLOWS
for the year ended June 30, 2022
F-7
Amounts in R million
Note
2022
2021
2020
CASH FLOWS FROM OPERATING ACTIVITIES
Cash generated from operations
14
1,585.6
1,851.0
1,309.6
Finance income received
111.1
105.9
63.8
Dividends received
71.5
76.1
4.3
Finance expenses paid
(7.7)
(7.5)
(8.7)
Income tax paid
(262.7)
(452.1)
(240.1)
Net cash inflow from operating activities
1,497.8
1,573.4
1,128.9
CASH FLOWS FROM INVESTING ACTIVITIES
Acquisition of property, plant and equipment
(584.1)
(395.7)
(181.1)
Environmental rehabilitation payments to reduce decommissioning liabilities
11
(25.4)
(51.0)
(22.1)
Proceeds on disposal of property, plant and equipment
12.2
0.1
0.7
Investment in other funds
12
(28.9)
-
-
Net cash outflow from investing activities
(626.2)
(446.6)
(202.5)
CASH FLOWS FROM FINANCING ACTIVITIES
Proceeds from the issue of ordinary shares
21.1
-
-
1,085.6
Share issue expenses
-
-
(0.5)
Dividends paid on ordinary shares
(513.3)
(640.9)
(564.5)
Initial fees incurred on facility
-
(1.0)
-
Repayment of lease liabilities
10.2
(19.7)
(11.6)
(11.4)
Net cash (outflow)/inflow from financing activities
(533.0)
(653.5)
509.2
NET INCREASE IN CASH AND CASH EQUIVALENTS
338.6
473.3
1,435.6
Impact of fluctuations in exchange rate on cash held in foreign currencies
7.0
(8.4)
-
Cash and cash equivalents at the beginning of the year
2,180.0
1,715.1
279.5
CASH AND CASH EQUIVALENTS AT THE END OF THE YEAR
13
2,525.6
2,180.0
1,715.1
The accompanying notes are an integral part of these consolidated financial statements.
NOTES TO THE CONSOLIDATED FINANCIAL STATEMENTS
for the year ended June 30, 2022
F-8
1 ABOUT THESE CONSOLIDATED FINANCIAL STATEMENTS
Reporting entity
The DRDGOLD Group is primarily involved in the retreatment of surface gold. The consolidated financial statements comprise
DRDGOLD Limited (the “
Company
”) and its subsidiaries who are all wholly owned subsidiaries and solely operate in South Africa
(collectively the “
Group
” and individually “
Group Companies
”). The Company is domiciled in South Africa with a registration
number of 1895/000926/06. The registered address of the Company is Constantia Office Park, Cnr 14th Avenue and Hendrik
Potgieter Road, Cycad House, Building 17, Ground Floor, Weltevreden Park, 1709.
The DRDGOLD Group is
50.1
% held by Sibanye Gold Limited, which in turn is a wholly owned subsidiary of
Sibanye Stillwater
Limited
Sibanye-Stillwater
”).
Basis of accounting
The consolidated financial statements have been prepared in accordance with International Financial Reporting Standards
(“
IFRS
”) and its interpretations issued by the International Accounting Standards Board (“
IASB
”). The consolidated financial
statements were approved by the board for issuance on October 28, 2022.
Functional and presentation currency
The functional and presentation currency of DRDGOLD and its subsidiaries is South African rand (“
Rand
”). The amounts in these
consolidated financial statements are rounded to the nearest million unless stated otherwise. Significant exchange rates during
the year are set out in the table below:
South African rand / US dollar
2022
2021
2020
Spot rate at year end
16.27
14.27
17.32
Average prevailing rate for the financial year
15.21
15.40
15.66
Basis of measurement
The consolidated financial statements are prepared on the historical cost basis, unless otherwise stated.
Basis of consolidation
Subsidiaries
Subsidiaries are entities controlled by the Group. The Group controls an entity when it is exposed to, or has rights to, variable
returns from its involvement with the entity and has the ability to affect those returns through its power over the entity. The financial
statements of subsidiaries are included in the consolidated financial statements from the date that control commences until the
date that control ceases.
Loss of control
When the Group loses control over a subsidiary, it derecognises the assets and liabilities of the subsidiary, and any related NCI
and other components of equity. Any resulting gain or loss is recognized in profit or loss. Any interest retained in the former
subsidiary is measured at fair value when control is lost.
Transactions eliminated on consolidation
Intra-group balances, transactions and any unrealised gains and losses or income and expenses arising from intra-group
transactions, are eliminated in preparing the consolidated financial statements.
2 USE OF ACCOUNTING ASSUMPTIONS, ESTIMATES AND JUDGEMENTS
The preparation of the consolidated financial statements requires management to make accounting assumptions, estimates and
judgements that affect the application of the Group's accounting policies and reported amounts of assets and liabilities, income
and expenses.
Accounting assumptions, estimates and judgements are reviewed on an ongoing basis. Revisions to reported amounts are
recognised in the period in which the revision is made and in any future periods affected. Actual results may differ from these
estimates.
Information about assumptions and estimates in applying accounting policies that have the most significant effect on the amounts
recognised in the consolidated financial statements are included in the notes:
NOTE 9 PROPERTY, PLANT AND EQUIPMENT
NOTE 11 PROVISION FOR ENVIRONMENTAL REHABILITATION
NOTE 18 INCOME TAX
NOTE 24 PAYMENTS MADE UNDER PROTEST
NOTE 25 OTHER INVESTMENTS
Information about significant judgements in applying accounting policies that have the most significant effect on the amounts
recognised in the consolidated financial statements are included in the notes:
NOTE 24 PAYMENTS MADE UNDER PROTEST
NOTE 25 OTHER INVESTMENTS
NOTE 26 CONTINGENCIES
NOTES TO THE CONSOLIDATED FINANCIAL STATEMENTS
continued
for the year ended June 30, 2022
F-9
3 NEW STANDARDS, AMENDMENTS TO STANDARDS AND INTERPRETATIONS
New standards, amendments to standards and interpretations effective for the year ended June 30, 2022
During the financial year, there were no new and revised accounting standards, amendments to standards and new interpretation
adopted by the Group.
New standards, amendments to standards and interpretations not yet effective
At the date of authorisation of these consolidated financial statements, the following relevant standards, amendments to standards
and interpretations that may be applicable to the business of the Group were in issue but not yet effective and may therefore have
an impact on future consolidated financial statements. These new standards, amendments to standards and interpretations will
be adopted at their effective dates.
Annual Improvements to IFRS Standards 2018-2020 (Effective July 1, 2022)
As part of its process to make non-urgent but necessary amendments to IFRS
Standards, the International Accounting Standards
Board (“
IASB
”) has issued the
Annual Improvements to IFRS Standards 2018–2020.
These are not expected to have a significant
impact on the Group.
Property, Plant and Equipment: Proceeds before Intended Use (Amendments to IAS 16) (Effective July 1, 2022)
The IASB has amended IAS 16
Property, Plant and Equipment
to provide guidance on the accounting for such sale proceeds and
the related production costs.
Under the amendments, proceeds from selling items before the related item of property, plant and equipment (“
PPE
”) is available
for use should be recognised in profit or loss, together with the costs of producing those items. IAS 2
Inventories
in identifying and measuring these production costs.
The amendments apply retrospectively, but only to items of property, plant and equipment made available for use on or after the
beginning of the earliest period presented in the financial statements in which the amendments are adopted. The amendment is
not expected to have a significant impact on the Group.
Definition of Accounting Estimate (Amendments to IAS 8) (Effective July 1, 2023)
The amendments introduce a new definition for accounting estimates: clarifying that they are monetary amounts in the financial
statements that are subject to measurement uncertainty.
The amendments also clarify the relationship between accounting policies and accounting estimates by specifying that a company
develops an accounting estimate to achieve the objective set out by an accounting policy. The amendment is not expected to
have a significant impact on the Group.
Deferred Tax related to Assets and Liabilities Arising from a single transaction – Amendments to IAS 12
Income Taxes
(Effective July 1, 2023)
IAS 12
Income taxes
decommissioning provisions. The amendments narrow the scope of the initial recognition exemption so that it does not apply to
transactions that give rise to equal and offsetting temporary differences. As a result, companies will need to recognize a deferred
tax asset and a deferred tax liability for temporary differences arising on initial recognition of a lease and a decommissioning
provision. The amendment is not expected to have a significant impact on the Group.
Classification of liabilities as current or non-current (Amendments to IAS 1
Presentation of Financial Statements
)
(Effective July 1, 2023)
To
promote consistency in application and clarify the requirements on determining if a liability is current or non-current, the IASB
has amended IAS 1 as follows:
Right to defer settlement must have substance
Under existing IAS 1 requirements, companies classify a liability as current when they do not have an
unconditional right
settlement of the liability for at least twelve months after the end of the reporting period.
As part of its amendments, the IASB has removed the requirement for a right to be unconditional and instead, now requires that
a right to defer settlement must have substance and exist at the end of the reporting period.
Classification of debt may change
A company classifies a liability as non-current if it has a right to defer settlement for at least twelve months after the reporting
period. The IASB has now clarified that a right to defer exists only if the company complies with conditions specified in the loan
agreement at the end of the reporting period, even if the lender does not test compliance until a later date. The amendment is not
expected to have a significant impact on the Group.
NOTES TO THE CONSOLIDATED FINANCIAL STATEMENTS
continued
for the year ended June 30, 2022
F-10
3 NEW STANDARDS, AMENDMENTS TO STANDARDS AND INTERPRETATIONS
continued
New standards, amendments to standards and interpretations not yet effective
(continued)
Disclosure of Accounting Policy (Amendments to IAS 1 and IFRS Practice Statement 2) (Effective July 1, 2023)
The Board has recently issued amendments to IAS 1
Presentation of Financial Statements
Statement 2
Making Materiality Judgements
The key amendments to IAS 1 include:
●
●
as such need not be disclosed; and
●
to a company’s financial statements.
The amendments are applied prospectively.
Management has commenced an evaluation to assess the impact the amendment will have on the Group from a disclosure
perspective. More detail will be disclosed in future financial statements.
4 REVENUE
ACCOUNTING POLICIES
Revenue comprises the sale of gold bullion and silver bullion (produced as a by-product).
Up to April 11, 2022 revenue is measured based on the consideration specified in a contract with the customer, which is based
on the London Bullion Market fixing price on the date when the Group transfers control over the goods to the customer. The Group
recognises revenue at a point in time when Rand Refinery Proprietary Limited (“
Rand Refinery
”), acting as an agent for the sale
of all gold produced by the Group, delivers the Gold to the buyer and the sales price is fixed, as evidenced by the certificate of
sale. It is at this point that the revenue can be measured reliably and the recovery of the consideration is probable. Rand Refinery
is contractually obliged to make payment to the Group within two business days after the sale of the gold and silver and therefore
no significant financing component exists.
Subsequent to April 11, 2022 revenue is measured based on the consideration specified in a contract with the customer, being
South African bullion banks. The consideration is based on the gold price derived on the gold market on the day a contract is
entered into with the customer. The Group recognises revenue at a point in time when the Group transfers the gold bullion and
silver bullion to the bullion bank and the sale price is fixed, as evidenced by deal confirmations.
It is at this point that the customer obtains control of the gold bullion or silver bullion, which is the settlement date specified in the
contract. At this point that the revenue can be measured reliably and the recovery of the consideration is probable. The customer
is contract ually obliged to make payment to the Group on the same day that the Group settles the contract and therefore no
significant financing component exists.
Amounts in R million
2022
2021
2020
Gold revenue
5,110.7
5,263.8
4,179.3
Silver revenue
7.8
5.2
5.7
Total revenue
5,118.5
5,269.0
4,185.0
A disaggregation of revenue by operating segment is presented in note 23 OPERATING SEGMENTS.
MARKET RISK
Commodity price sensitivity
The Group's profitability and the cash flows are significantly affected by changes in the market price of gold which is sold in US
Dollars. The Group did not enter into any hedging arrangements during the year.
A change of
20
% in the average US Dollar gold price received during the financial year would have increased/(decreased) equity
and profit/(loss) by the amounts shown below. This analysis assumes that all other variables remain constant and specifically
excludes the impact on income tax.
Amounts in R million
2022
2021
2020
20
% increase in the US Dollar gold price
1,023.7
1,053.8
837.0
20
% decrease in the US Dollar gold price
(1,023.7)
(1,053.8)
(837.0)
��
NOTES TO THE CONSOLIDATED FINANCIAL STATEMENTS
continued
for the year ended June 30, 2022
F-11
4 REVENUE
continued
Exchange rate sensitivity
The Group's profitability and the cash flows are significantly affected by changes in the Rand to the US Dollar exchange rate. The
Group did not enter into any hedging arrangements during the year.
A change of
20
% in the average Rand to US Dollar exchange rate received during the financial year would have
increased/(decreased) equity and profit/(loss) by the amounts shown below. This analysis assumes that all other variables remain
constant and specifically excludes the impact on income tax.
Amounts in R million
2022
2021
2020
20
% increase in the Rand to US Dollar exchange rate
1,023.7
1,053.8
837.0
20
% decrease in the Rand to US Dollar exchange rate
(1,023.7)
(1,053.8)
(837.0)
5 RESULTS FROM OPERATING ACTIVITIES
5.1 COST OF SALES
Amounts in R million
Note
2022
2021
2020
Cost of sales
(3,741.5)
(3,388.2)
(2,937.9)
Operating costs (a)
(3,506.5)
(3,122.5)
(2,692.1)
Movement in gold in process and finished inventories - Gold Bullion
30.4
(25.6)
3.1
Depreciation
9
(267.6)
(252.5)
(270.8)
Change in estimate of environmental rehabilitation
11
2.2
12.4
21.9
(a) The most significant components of operating costs include:
Consumable stores
(1,014.9)
(880.2)
(801.0)
Labour including short term incentives
(649.6)
(598.4)
(573.0)
Electricity
(547.3)
(488.2)
(420.9)
Specialist service providers
(610.2)
(510.7)
(447.5)
Machine hire
(139.0)
(127.4)
(95.2)
Security expenses
(133.0)
(122.8)
(87.8)
Water
(54.2)
(57.1)
(47.0)
RELATED PARTY TRANSACTIONS
FWGR entered into an agreement with Sibanye-Stillwater effective July 31, 2018 for the pumping and supply of water and
electricity to the FWGR operations for which FWGR is invoiced based on metered usage of water and electricity.
FWGR also entered into a smelting agreement with Sibanye-Stillwater effective July 31, 2018 to smelt and recover gold from gold
loaded carbon produced at FWGR, and deliver the gold to Rand Refinery. As consideration for this service, Sibanye-Stillwater
receives a fee based on the smelting costs plus
10
% of the smelting costs.
Rand Refinery, up to April 10, 2022, performed the final refinement and marketing of all gold and silver produced by the Group.
As consideration for this service, Rand Refinery receives a variable refining fee plus fixed marketing and administration fees. From
April 11, 2022, Rand Refinery only performs the final refinement and administration of the gold bars delivered. As a result of this,
the marketing fee was no longer incurred by the Group. Rand Refinery is a related party to the Group through Sibanye-Stillwater’s
shareholding in Rand Refinery.
All transactions and outstanding balances with related parties are to be settled in cash within 30 days of the invoice date. None
of the balances are secured. No expense has been recognised in the current year as a credit loss allowance in respect of amounts
charged to related parties.
Amounts in R million
2022
2021
2020
Services rendered by related parties and included in operating costs:
Supply of water and electricity
1
79.2
68.1
50.0
Gold smelting and related charges
1
19.1
21.1
19.8
Other charges
1
0.3
0.7
1.6
Charges to Sibanye-Stillwater
2
-
-
(0.2)
Gold refining and related charges
3
6.9
6.8
4.9
105.5
96.7
76.1
1
2
3
NOTES TO THE CONSOLIDATED FINANCIAL STATEMENTS
continued
for the year ended June 30, 2022
F-12
5 RESULTS FROM OPERATING ACTIVITIES
continued
5.2 OTHER INCOME
ACCOUNTING POLICIES
Other income is recognised where it is probable that the economic benefits associated with a transaction will flow to the Group
and it can be reliably measured.
Other income is generally income earned from transactions outside the course of the Group’s ordinary activities and may include
COVID-19 and other insurance payouts, gains on disposal of property, plant and equipment and gains on financial instruments at
fair value through profit or loss.
Amounts in R million
2022
2021
2020
Gain on disposal of property, plant and equipment
6.6
0.1
0.7
Insurance claim (a)
84.7
-
-
91.3
0.1
0.7
(a) Insurance claim
During the 2020 financial year, a complex insurance claim process was
initiated for business interruption caused by the regulatory lockdowns
pursuant to the COVID-19 pandemic. Of the R
84.7
income in profit and loss during the year, R
53.0
June 30, 2022. R
31.7
84.7
-
-
5.3 ADMINISTRATION EXPENSES AND OTHER COSTS
Amounts in R million
Note
2022
2021
2020
Included in administration expenses and other costs are the following:
Share based payment (expenses)/benefit
(18.4)
28.3
(224.1)
Cash settled Long-Term Incentive ("
CLTI
") scheme
19.1
-
44.3
(218.1)
Equity settled Long-Term Incentive ("
ELTI
") scheme
19.2
(18.4)
(16.0)
(6.0)
Exploration expenses and transaction costs
1
(15.2)
(3.1)
(1.4)
Other costs and administration expenses
2
(52.8)
(39.7)
(28.3)
1 Includes exploration expenses of R8.2 million paid to Sibanye-Stillwater for FY 2022.
2
Other costs and administration expenses are made of short-term incentives and information technology costs.
6 FINANCE INCOME
ACCOUNTING POLICY
Finance income includes interest received, growth in cash and cash equivalents in environmental rehabilitation trust funds, growth
in investment in Guardrisk, growth in the reimbursive right for environmental rehabilitation guarantees, dividends received and the
unwinding of the Payments made under protest and foreign exchange gains.
Amounts in R million
Note
2022
2021
2020
Interest on financial assets measured at amortised cost
13
111.8
108.7
63.1
Growth in cash and cash equivalents in environmental rehabilitation trust
funds
12
14.8
22.5
33.3
Growth in reimbursive right for environmental rehabilitation guarantees
12
1.8
3.7
5.2
Growth in investment in Guardrisk
12
13.1
-
-
Dividends received
25
71.5
76.1
4.3
Unwinding of Payments made under protest
24
5.8
4.8
3.9
Unrealised foreign exchange gain
7.0
-
-
Other finance income
-
0.4
-
225.8
216.2
109.8
NOTES TO THE CONSOLIDATED FINANCIAL STATEMENTS
continued
for the year ended June 30, 2022
F-13
7 FINANCE EXPENSE
ACCOUNTING POLICY
Finance expenses comprise interest payable on financial instruments measured at amortised cost calculated using the effective
interest method, unwinding of the provision for environmental rehabilitation, interest on lease liabilities, the discount recognised on
Payments made under protest and foreign exchange losses.
Amounts in R million
Note
2022
2021
2020
Interest on financial liabilities measured at amortised cost
(2.6)
(2.3)
(2.0)
Unwinding of provision for environmental rehabilitation
11
(45.0)
(44.7)
(52.0)
Discount recognised on Payments made under protest
24
(21.1)
(7.4)
(7.1)
Interest on lease liabilities
10.2
(4.2)
(4.5)
(5.1)
Unrealised foreign exchange loss
-
(8.4)
-
Other finance expenses
(1.9)
(2.2)
(2.6)
(74.8)
(69.5)
(68.8)
8 EARNINGS PER SHARE
Amounts in R million
2022
2021
2020
The calculations of basic and diluted earnings per ordinary share
are based on the following:
Profit for the year
1,123.8
1,439.9
635.0
Reconciliation of weighted average number of ordinary shares to
diluted weighted average number of ordinary shares
2022
2021
2020
Weighted average number of ordinary shares in issue adjusted for
treasury shares
856,760,797
855,113,791
769,941,874
Effect of Sibanye-Stillwater Option
-
-
9,464,684
Effect of equity-settled share-based payment
4,203,336
5,935,215
4,283,001
Diluted weighted average number of ordinary shares
860,964,133
861,049,006
783,689,559
SA cents per share
2022
2021
2020
Basic earnings per share
131.2
168.4
82.5
Diluted basic earnings per share
130.6
167.2
81.0
NOTES TO THE CONSOLIDATED FINANCIAL STATEMENTS
continued
for the year ended June 30, 2022
F-14
9 PROPERTY, PLANT AND EQUIPMENT
SIGNIFICANT ACCOUNTING ASSUMPTIONS AND ESTIMATES
Mineral reserves and resources estimates
The Group is required to determine and report mineral reserves and resources in accordance with the South African Code for the
Reporting of Exploration Results, Mineral Resources and Mineral Reserves (“
SAMREC Code
”). In order to calculate mineral
reserves and resources, estimates and assumptions are required about a range of geological, technical and economic factors,
including but not limited to quantities, grades, production techniques, recovery rates, production costs, transport costs, commodity
demand, commodity prices and exchange rates. Estimating the quantity and/or grade of mineral reserves and resources requires
the size, shape and depth of reclamation sites to be determined by analysing geological data such as the logging and assaying
of drill samples. This process may require complex and difficult geological judgements and calculations to interpret the data.
Because the assumptions used to estimate mineral reserves and resources change from period to period and because additional
geological data is generated during the course of operations, estimates of mineral reserves and resources may change from
period to period. Mineral reserves and resources estimates prepared by management are reviewed by independent mineral
reserves and resources experts.
Changes in reported mineral reserves and resources may affect the Group’s life-of-mine plan, financial results and financial
position in a number of ways including the following:
• asset carrying values may be affected due to changes in estimated future cash flows;
• depreciation charged to profit or loss may change where such charges are determined by the units-of-production method, or
where the useful lives of assets change;
• decommissioning, site restoration and environmental provisions may change where changes in estimated mineral reserves and
resources affect expectations about the timing or cost of these activities; and
• the carrying value of deferred tax assets and liabilities may change due to changes in estimates of the likely recovery of the tax
benefits and charges.
Depreciation
The calculation of the units-of-production rate of depreciation could be affected if actual production in the future varies significantly
from current forecast production. This would generally arise when there are significant changes in any of the factors or
assumptions used in estimating mineral reserves and resources. These factors could include:
• changes in mineral reserves and resources;
• the grade of mineral reserves and resources may vary from time to time;
• differences between actual commodity prices and commodity price assumptions;
• unforeseen operational issues at mine sites including planned extraction efficiencies; and
• changes in capital, operating, mining processing and reclamation costs, discount rates and foreign exchange rates.
NOTES TO THE CONSOLIDATED FINANCIAL STATEMENTS
continued
for the year ended June 30, 2022
F-15
9 PROPERTY, PLANT AND EQUIPMENT
continued
ACCOUNTING POLICIES
Recognition and measurement
Property, plant and equipment comprise mine plant facilities and equipment, mine property and development (including mineral
rights) and exploration assets. These assets (excluding exploration assets) are initially measured at cost, whereafter they are
measured at cost less accumulated depreciation and accumulated impairment losses. Exploration assets are initially measured
at cost, whereafter they are measured at cost less accumulated impairment losses.
Cost includes expenditure that is directly attributable to the acquisition or construction of the asset, borrowing costs capitalised,
as well as the costs of dismantling and removing an asset and restoring the site on which it is located. Subsequent costs are
included in the asset’s carrying amount or recognised as a separate asset, as appropriate, only when it is probable that future
economic benefits associated with the item will flow to the Group and the cost of the item can be measured reliably. Exploration
and evaluation costs are capitalised as exploration assets on a project-by-project basis, pending determination of the technical
feasibility and commercial viability of the project.
Exploration assets consists of costs of acquiring rights, activities associated with converting a mineral resource to a mineral
reserve - the process thereof includes drilling, sampling and other processes necessary to evaluate the technical feasibility and
commercial viability of a mineral resource to prove whether a mineral reserve exists. Exploration assets also include geological,
geochemical and geophysical studies associated with prospective projects and tangible assets which comprise property, plant
and equipment used for exploratory activities. Costs are capitalised to the extent that they are a directly attributable exploration
expenditure and classified as a separate class of assets on a project by project basis. Once a mineral reserve is determined or
the project ready for development, the asset attributable to the mineral reserve or project is assessed for impairment and then
reclassified to the appropriate class of assets. Depreciation commences when the assets are available for use.
Exploration and
evaluation expenses prior to acquiring rights to explore is recognised in profit or loss.
Depreciation
Depreciation of mine plant facilities and equipment, as well as mining property and development (including mineral rights) are
calculated using the units of production method which is based on the life-of-mine of each site. The life-of-mine is primarily based
on proved and probable mineral reserves. It reflects the estimated quantities of economically recoverable gold that can be
recovered from reclamation sites based on the estimated gold price. Changes in the life-of-mine will impact depreciation on a
prospective basis. The life-of-mine is prepared using a methodology that takes account of current information to assess the
economically recoverable gold from specific reclamation sites and includes the consideration of historical experience.
The depreciation method, estimated useful lives and residual values are reassessed annually and adjusted if appropriate. The
current estimated useful lives are based on the life-of-mine of each site, currently between
two
three
; 2020:
four
) and
19
years (2021:
13
; 2020:
13
) years for Ergo mining assets and between
two
three
; 2020:
four
) and
20
18
; 2020:
20
) years for FWGR mining assets.
Impairment
The carrying amounts of property, plant and equipment are reviewed at each reporting date to determine whether there is any
indication of impairment, or whenever events or changes in circumstances indicate that the carrying amount may not be
recoverable. If any such indication exists, the asset’s recoverable amount is estimated. For the purposes of assessing impairment,
assets are grouped at the lowest levels for which there are separately identifiable cash flows (“
CGUs
”). The key assets of a
surface retreatment operation which constitutes a CGU are a reclamation site, a metallurgical plant and a tailings storage facility.
These key assets operate interdependently to produce gold. The Ergo and FWGR operations each have separately managed
and monitored reclamation sites, metallurgical plants and tailings storage facilities and are therefore separate CGUs.
The recoverable amount of an asset or CGU is the greater of its value in use and its fair value less costs to sell. The estimated
future cash flows are discounted to their present value using a pre-tax discount rate that reflects current market assessments of
the time value of money and the risks specific to the asset. An impairment loss is recognised in profit or loss if the carrying amount
of an asset or CGU exceeds its recoverable amount.
NOTES TO THE CONSOLIDATED FINANCIAL STATEMENTS
continued
for the year ended June 30, 2022
F-16
9 PROPERTY, PLANT AND EQUIPMENT
continued
Amounts in R million
Note
Mine plant
facilities and
equipment
Mine
property and
development
Exploration
assets
Total
June 30, 2022
Cost
2,733.9
2,419.6
14.2
5,167.7
Balance at the beginning of the year
2,604.3
2,154.0
110.5
4,868.8
Additions - property, plant and equipment owned
291.4
301.2
5.8
598.4
Additions - right-of-use assets
10.1
6.0
9.9
-
15.9
Lease modifications
10.1
-
1.2
-
1.2
Lease derecognitions
10.1
(1.6)
-
-
(1.6)
Disposals and scrapping
(185.3)
(61.6)
(0.9)
(247.8)
Change in estimate of decommissioning asset
11
(46.3)
(20.9)
-
(67.2)
Transfers between classes of property, plant and
equipment
65.4
35.8
(101.2)
-
Accumulated depreciation and impairment
(1,017.0)
(1,056.9)
(9.7)
(2,083.6)
Balance at the beginning of the year
(1,074.0)
(975.4)
(9.7)
(2,059.1)
Depreciation
5.1
(125.1)
(142.5)
-
(267.6)
Lease derecognitions
1.6
-
-
1.6
Disposals and scrapping
180.5
61.0
-
241.5
Carrying value at end of the year
1,716.9
1,362.7
4.5
3,084.1
Comprising:
Property, plant and equipment owned
1,698.7
1,333.2
4.5
3,036.4
Right-of-use assets
10.1
18.2
29.5
-
47.7
Carrying value at end of the year
1,716.9
1,362.7
4.5
3,084.1
June 30, 2021
Cost
2,604.3
2,154.0
110.5
4,868.8
Balance at the beginning of the year
2,203.5
2,147.0
266.3
4,616.8
Additions - property, plant and equipment owned
237.7
113.3
44.7
395.7
Additions - right-of-use assets
10.1
16.7
-
-
16.7
Lease modifications
10.1
-
2.3
-
2.3
Lease derecognitions
10.1
(1.0)
-
-
(1.0)
Disposals and scrapping
(54.7)
(133.4)
-
(188.1)
Change in estimate of decommissioning asset
11
14.9
14.2
(2.7)
26.4
Transfers between classes of property, plant and
equipment
187.2
10.6
(197.8)
-
Accumulated depreciation and impairment
(1,074.0)
(975.4)
(9.7)
(2,059.1)
Balance at the beginning of the year
(1,017.5)
(968.5)
(9.7)
(1,995.7)
Depreciation
5.1
(112.2)
(140.3)
-
(252.5)
Lease derecognitions
1.0
-
-
1.0
Disposals and scrapping
54.7
133.4
-
188.1
Carrying value at end of the year
1,530.3
1,178.6
100.8
2,809.7
Comprising:
Property, plant and equipment owned
1,509.7
1,150.1
100.8
2,760.6
Right-of-use assets
10.1
20.6
28.5
-
49.1
Carrying value at end of the year
1,530.3
1,178.6
100.8
2,809.7
CONTRACTUAL COMMITMENTS
Contractual commitments not provided for in the consolidated financial statements at June 30, 2022 amounted to R
235.9
(2021: R
65.5
Capital expenditure related to material growth projects are financed on a project-by-project basis which may include bank facilities
and existing cash resources. Sustaining capital expenditure is financed from cash generated from operations and existing cash
resources.
NOTES TO THE CONSOLIDATED FINANCIAL STATEMENTS
continued
for the year ended June 30, 2022
F-17
10 RIGHT OF USE ASSETS AND LEASES
ACCOUNTING JUDGEMENTS
At inception of a contract, the Group assesses whether a contract is, or contains, a lease. A contract is, or contains a lease if the
contract conveys the right to control the use of an identified asset for a period of time in exchange for consideration. The contract
must also be enforceable.
To
assess whether a contract conveys the right to control the use of an identified asset, requires
judgement particularly on contracts with service contractors, which may contain embedded leases.
The Group assesses whether:
• the contract involves the use of an identified asset;
• the Group has the right to obtain substantially all the economic benefits from use of the asset throughout the period of use; and
• the Group has the right to direct the use of the asset.
At inception or on reassessment of a contract that contains a lease component, the Group allocates the consideration in the
contract to each lease component on the basis of their relevant stand-alone prices. However, for the lease of land and buildings
in which it is a lessee, the Group has elected not to separate non-lease components and account for the lease and non-lease
component as a single lease component.
Some property leases contain options to renew under the contract. Judgement is applied in whether the renewable option periods
must be included in the lease term i.e. it is reasonably certain that the options to renew will be exercised. In applying judgement,
the Group also considers whether the lease term is commensurate with estimated future mine plans requirements and
environmental rehabilitation obligations associated with the property post reclamation.
ACCOUNTING POLICIES
Right of use asset
The right of use asset is initially measured at cost, which comprises the initial amount of the lease liability and is adjusted by any
lease payments made at or before the commencement date, plus any initial direct costs incurred and an estimate of costs to
dismantle and remove the underlying asset or to restore the underlying asset or the site on which it is located, less any lease
incentives received. The Group recognises a right of use asset and lease liability at the lease commencement date.
The right of use asset is subsequently depreciated using the straight-line method from the commencement date to the earlier of
the end of the useful life of the right of use asset or the end of the lease term. The right of use asset carrying value is allocated to
the CGU it belongs to and the CGU is reviewed at each reporting date to determine whether there is any indication of impairment.
The carrying value is reduced by impairment losses, if any, and adjusted for certain remeasurements of the lease liability.
Lease liability
The lease liability is initially measured at the present value of the outstanding lease payments at commencement date over the
lease term, discounted using the interest rate implicit in the lease or if that rate is undeterminable, the Group’s incremental
borrowing rate. The lease term includes the non-cancellable period for which the lessee has the right to use an underlying asset
including optional periods when the Group is reasonably certain to exercise an option to extend a lease.
Lease payments comprise fixed payments, variable lease payments that depend on an index or rate, initially measured using the
index or rate as at the commencement date, and the exercise price under a purchase option that the Group is reasonably certain
to exercise.
The lease liability is measured using the effective interest rate method. The Group re-measures the lease liability when the lease
contract is modified and this does not give rise to modification accounting, when the lease term has been changed or when the
lease payments have changed as a result of a change in an index or rate or a change in the assessment of a purchase option.
Upon remeasurement, a corresponding adjustment is made to the carrying amount of the right of use asset or is recorded in profit
or loss if the carrying amount of the right of use asset has been reduced to zero.
Right of use assets are presented in “property, plant and equipment” and lease liabilities are separately disclosed in the statement
of financial position.
Short term leases and leases of low value assets
The Group has elected not to recognise right of use assets and lease liabilities for short-term leases of machinery and equipment
that have a lease term of 12 months or less and leases of low value assets which include IT equipment, security equipment and
administration equipment.
10.1 RIGHT OF USE ASSETS
Included in property, plant and equipment are the following leased assets:
Amounts in R million
Note
Mine plant
facilities and
equipment
Mine property
and
development
Total
June 30, 2022
Cost
31.2
58.4
89.6
Opening balance
26.8
47.3
74.1
Additions
6.0
9.9
15.9
Lease modifications
-
1.2
1.2
Lease derecognitions
(1.6)
-
(1.6)
NOTES TO THE CONSOLIDATED FINANCIAL STATEMENTS
continued
for the year ended June 30, 2022
F-18
Accumulated depreciation
(13.0)
(28.9)
(41.9)
Opening balance
(6.2)
(18.8)
(25.0)
Depreciation
(8.4)
(10.1)
(18.5)
Lease derecognitions
1.6
-
1.6
Carrying value
18.2
29.5
47.7
June 30, 2021
Cost
26.8
47.3
74.1
Opening balance
11.1
45.0
56.1
Additions
16.7
-
16.7
Lease modifications
-
2.3
2.3
Lease derecognitions
(1.0)
-
(1.0)
Accumulated depreciation
(6.2)
(18.8)
(25.0)
Opening balance
(2.9)
(8.3)
(11.2)
Depreciation
(4.3)
(10.5)
(14.8)
Lease derecognitions
1.0
-
1.0
Carrying value
20.6
28.5
49.1
10.2 LEASE LIABILITIES
Amounts in R million
Note
2022
2021
Reconciliation of the lease liabilities balance:
Balance at the beginning of the year
54.8
47.1
New leases
9
15.9
16.7
Lease modifications
9
1.2
2.3
Interest charge on lease liabilities
7
4.2
4.5
Repayment of lease liabilities
(19.7)
(11.6)
Interest repaid
(4.1)
(4.2)
Balance at the end of the year
52.3
54.8
Current portion of lease liabilities
(19.5)
(16.9)
Non-current lease liabilities
32.8
37.9
Maturity analysis of undiscounted contractual cash flows:
Less than a year
22.4
20.5
One to five years
35.1
42.0
More than 5 years
2.1
1.3
Total undiscounted lease liabilities at the end of the year
59.6
63.8
Lease payments not recognised as a liability but expensed during the year:
Short-term leases
(2.5)
(1.4)
Leases of low value assets
(8.6)
(7.7)
Cash flows included in cash generated from operating activities
(11.1)
(9.1)
NOTES TO THE CONSOLIDATED FINANCIAL STATEMENTS
continued
for the year ended June 30, 2022
F-19
11 PROVISION FOR ENVIRONMENTAL REHABILITATION
SIGNIFICANT ACCOUNTING ASSUMPTIONS AND ESTIMATES
Estimates of future environmental rehabilitation costs are determined with the assistance of an independent expert and are based
on the Group’s environmental management plans which are developed in accordance with regulatory requirements, the life-of-
mine plan (as discussed in note 9) which influences the estimated timing of environmental rehabilitation cash outflows and the
planned method of rehabilitation which in turn is influenced by developments in trends and technology.
An average nominal discount rate ranging between
10.2
% and
10.3
% (2021: between
8.9
% and
9.0
%), average inflation rate of
5.5
% (2021:
5.2
%) and the discount periods as per the expected life-of-mine were used in the calculation of the estimated net
present value of the rehabilitation liability.
ACCOUNTING POLICIES
The net present value of the estimated rehabilitation cost as at reporting date is provided for in full. These estimates are reviewed
annually and are discounted using a pre-tax risk-free rate that is adjusted to reflect the current market assessments of the time
value of money and the risks specific to the obligation.
Annual changes in the provision consist of financing expenses relating to the change in the present value of the provision and
inflationary increases in the provision, as well as changes in estimates.
The present value of dismantling and removing the asset created (decommissioning liabilities) are capitalised to property, plant
and equipment against an increase in the rehabilitation provision. If a decrease in the liability exceeds the carrying amount of the
asset, the excess is recognised in profit or loss. If the asset value is increased and there is an indication that the revised carrying
value is not recoverable, an impairment test is performed in accordance with the accounting policy dealing with impairments of
property, plant and equipment. Over time, the liability is increased to reflect an interest element, and the capitalised cost is
depreciated over the life of the related asset. Cash costs incurred to rehabilitate these disturbances are charged to the provision
and are presented as investing activities in the statement of cash flows.
The present value of environmental rehabilitation costs relating to the production of inventories and sites without related assets
(restoration liabilities) as well as changes therein are expensed as incurred and presented as operating costs within cost of sales.
Cash costs incurred to rehabilitate these disturbances are presented as operating activities in the statement of cash flows. The
cost of ongoing rehabilitation is recognised in profit or loss as incurred.
Amounts in R million
Note
2022
2021
Opening balance
570.8
568.9
Unwinding of provision
7
45.0
44.7
Change in estimate of environmental rehabilitation recognised in profit or loss
5.1
(2.2)
(12.4)
Change in estimate of environmental rehabilitation recognised to decommissioning asset (a)
9
(67.2)
26.4
Environmental rehabilitation payments (b)
(28.7)
(56.8)
To reduce decommissioning liabilities
(25.4)
(51.0)
To reduce restoration liabilities
14
(3.3)
(5.8)
Closing balance
517.7
570.8
Environmental rehabilitation payments to reduce the liability
(28.7)
(56.8)
Ongoing rehabilitation expenditure
23
(31.6)
(48.3)
Total cash spent on environmental rehabilitation
(60.3)
(105.1)
1
not represent a reduction of the above liability and are expensed as operating costs
(a)
Change in estimate of environmental rehabilitation recognised to decommissioning asset
During the current year, updates were made to the Ergo life of mine, resulting in the inclusion of the Daggafontein TSF as a
Mineral Reserve on a planned basis increasing the life of mine. During the current year, updates were also made to the FWGR
life of mine, changing the expected timing of environmental rehabilitation cash outflows.
(b) Environmental rehabilitation payments
38ha of the Brakpan/Withok TSF, 3ha of the Daggafontein TSF and 17ha of the Driefontein 4 TSF were vegetated during the
year.
GROSS COST TO REHABILITATE
The Group estimates that, based on the life of mine plan and current environmental and regulatory requirements, the total
undiscounted rehabilitation cost is approximately R
815.1
742.2
NOTES TO THE CONSOLIDATED FINANCIAL STATEMENTS
continued
for the year ended June 30, 2022
F-20
12 INVESTMENTS IN REHABILITATION AND OTHER FUNDS
ACCOUNTING POLICIES
Cash and cash equivalents in environmental rehabilitation trusts
Cash and cash equivalents included in environmental rehabilitation trusts comprise low-risk, interest-bearing cash and cash
equivalents and are non-derivative financial assets categorised as financial assets measured at amortised cost.
Cash and cash equivalents are initially measured at fair value. Subsequent to initial recognition, cash and cash equivalents are
measured at amortised cost, which is equivalent to their fair value.
The cash and cash equivalents in environmental rehabilitation trusts are for the sole use of material future environmental
rehabilitation payments and are therefore included in non-current assets.
Reimbursive right for environmental rehabilitation guarantees
(“old environmental rehabilitation policy”)
Funds held in the cell captive that secure the environmental rehabilitation guarantees issued are recognised as a right to receive
a reimbursement and are measured at the lower of the amount of the consolidated environmental rehabilitation liability recognised
and the consolidated fair value of the fund assets.
Changes in the carrying value of the fund assets, other than those resulting from contributions and payments, are recognised in
finance income.
The funds held in the cell captive under the old environmental rehabilitation policy are for the sole use of material future
environmental rehabilitation payments and are therefore included in non-current assets.
Investments in Guardrisk Cell Captive
Funds invested in the Guardrisk Cell Captive, held within Guardrisk Insurance Company Limited (“
GICL
”) or “
Guardrisk
” are non-
derivative financial assets categorised as financial assets measured at fair value through profit and loss as the funds are invested
by Guardrisk in liquid money market funds. These assets are initially measured at fair value and subsequent changes in fair value
are recognised in profit or loss as they arise and included in finance income. The investments in GICL are for the sole use of
environmental financial guarantees, Directors’ and Officers’ insurance and other insurance requirements.
The investment in the Guardrisk Cell Captive is for the sole use as determined in the insurance policies and are therefore included
in non-current assets.
Investment in Guardrisk Cell Captive – Funding of environmental rehabilitation activities
(refer note 11)
During the current year the Group made a decision to change its method of providing for environmental rehabilitation from funding
in a specific rehabilitation trust to financial guarantees which is an allowed method in terms of the National Environmental
Management Act. A new ring-fenced policy related to the funds was concluded. In this regard, the rehabilitation trust directly
transferred a total amount of R
579.5
financial guarantees. The new ring-fenced policy has replaced the old environmental rehabilitation policy which lapsed during the
year. The funds are ring-fenced for the sole objective of future rehabilitation during and at the end of the relevant life of mine. All
the required approvals for the change in method and transfer of the rehabilitation trust funds were obtained from the Department
of Mineral Resources and Energy (“
DMRE
”) and a thorough consideration of tax and legal impacts were completed prior to the
funds being transferred to GICL.
Environmental rehabilitation payments to reduce the environmental rehabilitation obligations and ongoing rehabilitation
expenditure are mostly funded by cash generated from operations.
GICL has guarantees in issue amounting to R
614.0
430.1
to the environmental obligations. The funds for environmental rehabilitation in the cell captive serve as collateral for these
guarantees.
Investment in Guardrisk Cell Captive – Directors’ and Officers’ insurance
During the current year premiums were paid into the Guardrisk Cell Captive for the creation of self-insurance for the Group’s
Directors and Officers.
Investment in Guardrisk Cell Captive – Other funds
These are existing funds within the cell captive which were previously part of the old environmental rehabilitation policy held for
purposes of obtaining environmental rehabilitation guarantees. The policy came to an end during the financial year, but the funds
remained within the cell captive for future insurance applications.
NOTES TO THE CONSOLIDATED FINANCIAL STATEMENTS
continued
for the year ended June 30, 2022
F-21
12 INVESTMENTS IN REHABILITATION AND OTHER FUNDS
continued
Amounts in R million
Note
2022
2021
Cash and cash equivalents in environmental rehabilitation trust funds
-
564.7
564.7
542.2
(579.5)
-
6
14.8
22.5
Reimbursive right for environmental rehabilitation guarantees
-
87.5
87.5
83.8
(89.3)
-
6
1.8
3.7
Investment in Guardrisk Cell Captive (a)
710.8
-
-
-
668.8
-
28.9
-
6
13.1
-
Investments in rehabilitation and other funds
710.8
652.2
(a) Investment in Guardrisk Cell Captive
The investment in the cell captive is allocated as follows:
710.8
-
589.8
-
29.5
-
91.5
-
CREDIT RISK
The Group is exposed to credit risk on the total carrying value of the investments held in the environmental rehabilitation trust
funds and the Guardrisk Cell Captive.
The Group manages its exposure to credit risk by mandating the Guardrisk Cell Captive to diversify the funds across a number of
major financial institutions, as well as investing funds in low-risk, interest-bearing cash and cash equivalents.
MARKET RISK
Interest rate risk
A change of 100 basis points (bp) in interest rates at the reporting date would have increased/(decreased) equity and profit/(loss)
by the amounts shown below. This analysis assumes that all other variables, in particular the balance of the funds, remain
constant. The analysis excludes income tax.
Amounts in R million
2022
2021
100
bp increase
7.1
5.6
100
bp (decrease)
(7.1)
(5.6)
FAIR VALUE OF FINANCIAL INSTRUMENTS
The fair value of investment in Guardrisk Cell Captive approximate their carrying value due to the short-term maturities of the
underlying funds invested by Guardrisk
.
NOTES TO THE CONSOLIDATED FINANCIAL STATEMENTS
continued
for the year ended June 30, 2022
F-22
13 CASH AND CASH EQUIVALENTS
ACCOUNTING POLICIES
Cash and cash equivalents are short-term, highly liquid investments that are readily convertible to cash without significant risk of
changes in value and comprise cash on hand, demand deposits, and highly liquid investments which are readily convertible to
known amounts of cash.
Cash and cash equivalents are non-derivative financial assets categorised as financial assets measured at amortised cost. Cash
and cash equivalents are initially measured at fair value. Subsequent to initial recognition, cash and cash equivalents are
measured at amortised cost, which is equivalent to their fair value.
Amounts in R million
Note
2022
2021
Cash on hand
113.2
100.5
Access deposits and income funds
2,401.7
2,069.2
Restricted cash
10.7
10.3
2,525.6
2,180.0
Interest earned on cash and cash equivalents
6
111.8
108.7
1
These consist of access deposit notes and conservatively managed income funds that are diversified across the major financial institutions in
South Africa.
At reporting date all of these instruments had same day or next day liquidity and effective annualised yields of between
5.38
% and
6.38
%
2
This consists of cash held on call as collateral for guarantees issued by the Standard Bank of South Africa Limited on behalf of the Group for
environmental rehabilitation amounting to R
5.2
5.1
CREDIT RISK
The Group is exposed to credit risk on the total carrying value of its cash and cash equivalents. The Group manages its exposure
to credit risk by investing cash and cash equivalents across several major financial institutions, considering the credit ratings of
the respective financial institutions, funds and underlying instruments.
Impairment on cash and cash equivalents, if any, are measured on a 12-month expected loss basis and reflects the short
maturities of the exposures. The Group considers that its cash and cash equivalents have low credit risk based on the external
credit ratings of the counterparties.
MARKET RISK
Interest rate risk
A change of
100
shown below. This analysis is performed on the average balance of cash and cash equivalents for the year and assumes that all
other variables remain constant. The analysis excludes income tax
.
Amounts in R million
2022
2021
100
bp increase
23.5
19.5
100
bp (decrease)
(23.5)
(19.5)
Foreign denominated cash is held in a foreign currency bank account accruing negligible interest and is usually converted to
South African Rand on the day of receipt. Foreign cash is therefore not exposed to significant interest rate risk.
Foreign currency risk
US Dollars received on settlement of the trade receivables are exposed to fluctuations in the US Dollar/South African Rand
exchange rate until it is converted to South African Rands.
US Dollars not converted to South African Rands at reporting date are as follows
:
Figures in USD million
2022
2021
Foreign denominated cash at 30 June
3.4
3.4
A
10
% strengthening of the Rand against the US Dollar at 30 June would have increased/(decreased) equity and profit/(loss) by
the amounts shown below. This analysis assumes that all other variables remain constant.
Amounts in R million
2022
2021
Strengthening of the Rand against the US Dollar
(5.5)
(4.9)
Weakening of the Rand against the US Dollar
5.5
4.9
FAIR VALUE OF FINANCIAL INSTRUMENTS
The fair value of cash and cash equivalents approximates their carrying value due to their short-term maturities.
NOTES TO THE CONSOLIDATED FINANCIAL STATEMENTS
continued
for the year ended June 30, 2022
F-23
14 CASH GENERATED FROM OPERATIONS
Amounts in R million
Note
2022
2021
2020
Profit for the year
1,123.8
1,439.9
635.0
Adjusted for
Income tax
18.1
334.3
523.7
343.9
Depreciation
9
267.6
252.5
270.8
Movement in gold in process and finished inventories - Gold Bullion
5.1
(30.4)
25.6
(3.1)
Change in estimate of environmental rehabilitation
11
(2.2)
(12.4)
(21.9)
Environmental rehabilitation payments to reduce the restoration liabilities
11
(3.3)
(5.8)
(8.1)
Share-based payment expense/(benefit)
5.3
18.4
(28.3)
224.1
Gain on disposal of property, plant and equipment
5.2
(6.6)
(0.1)
(0.7)
Insurance claim receivable
5.2
(31.7)
-
-
Finance income
6
(225.8)
(216.2)
(109.8)
Finance expense
7
74.8
69.5
68.8
Other non-cash items
3.8
(2.5)
2.6
Operating cash flows before other changes
1,522.7
2,045.9
1,401.6
Changes in
62.9
(194.9)
(92.0)
Trade and other receivables
25.7
6.9
(79.0)
Consumable stores and stockpiles
(18.9)
(44.7)
(26.4)
Payments made under protest
24
(15.2)
(8.1)
(10.6)
Trade and other payables
71.3
(149.0)
24.0
Cash generated from operations
1,585.6
1,851.0
1,309.6
Includes settlement of cash-settled long-term incentives for 2021: R
183.3
41.5
15 TRADE AND OTHER RECEIVABLES
ACCOUNTING POLICIES
Recognition and measurement
Trade and other receivables, excluding Value Added Tax and prepayments, are non-derivative financial assets categorised as
financial assets at amortised cost.
These assets are initially measured at fair value plus directly attributable transaction costs. Subsequent to initial recognition, they
are measured at amortised cost using the effective interest method less any expected credit losses using the Group’s business
model for managing its financial assets.
The Group derecognises a financial asset when the contractual rights to the cash flows from the asset expire, or it transfers the
rights to receive the contractual cash flows in a transaction in which substantially all of the risks and rewards of ownership of the
financial asset are transferred, or it neither transfers nor retains substantially all of the risks and rewards of ownership and does
not retain control over the transferred asset. Any interest in such derecognised financial assets that is created or retained by the
Group is recognised as a separate asset or liability.
Impairment
The Group recognises loss allowances for trade and other receivables at an amount equal to expected credit losses (“
ECLs
”).
The Group uses the simplified ECL approach. When determining whether the credit risk of a financial asset has increased since
initial recognition and when estimating ECLs, the Group considers reasonable and supportable information that is relevant and
available without undue cost or effort. This includes both quantitative and qualitative information and analysis, based on informed
credit assessments and including forward-looking information. The maximum period considered when estimating ECLs is the
maximum contractual period over which the Group is exposed to credit risk.
ECLs are a probability weighted estimate of credit losses. Credit losses are measured as the present value of all cash shortfalls
(i.e. the difference between the cash flows due to the entity in accordance with the contract and the cash flows that the Group
expects to receive). The Group assesses whether the financial asset is credit impaired at each reporting date. A financial asset is
credit impaired when one or more events that have a detrimental impact on the estimated future cash flows of the financial asset
have occurred, including but not limited to financial difficulty or default of payment. The Group will write off a financial asset when
there is no reasonable expectation of recovering it after considering whether all means to recovery the asset have been exhausted,
or the counterparty has been liquidated and the Group has assessed that no recovery is possible.
Any impairment losses are recognised in the statement of profit or loss.
Trade receivables relate to gold sold to the bullion banks. Settlement is usually received on the gold sold date. Previously trade
receivables related to gold sold on the bullion market by Rand Refinery in its capacity as an agent for the Group. Settlement was
usually received
two working days
NOTES TO THE CONSOLIDATED FINANCIAL STATEMENTS
continued
for the year ended June 30, 2022
F-24
15 TRADE AND OTHER RECEIVABLES
Amounts in R million
2022
2021
Trade receivables
-
56.5
Value Added Tax
75.1
50.2
Other receivables
57.4
21.2
Prepayments
19.2
17.4
Allowance for impairment
(2.2)
(1.2)
149.5
144.1
1 Other receivables includes the outstanding COVID-19 insurance claim amount of R
31.7
subsequent to year end.
CREDIT RISK
The Group is exposed to credit risk on the total carrying value of its trade receivables and other receivables excluding Value
Added Tax and prepayments.
The Group manages its exposure to credit risk on trade receivables by selling gold on a cash on delivery basis. The Group
manages its exposure to credit risk on other receivables by establishing a maximum payment period of
30
that counterparties are of good credit standing and transacting on a secured or cash basis where considered necessary. The
majority of other receivables, excluding the COVID-19 insurance claim, comprises balances with counterparties who have been
transacting with the Group for over
5 years
Receivables are regularly monitored and assessed for recoverability.
The balances of counterparties who have been assessed as being credit impaired at reporting date are as follows:
2022
2021
Amounts in R million
Non-credit
impaired
Credit
impaired
Non-credit
impaired
Credit
impaired
Trade receivables
-
-
56.5
-
Other receivables
55.2
2.2
20.0
1.2
55.2
2.2
76.5
1.2
Loss allowance
-
(2.2)
-
(1.2)
Movement in the allowance for impairment in respect of trade and other receivables during the year was as follows:
Amounts in R million
2022
2021
Balance at the beginning of the year
(1.2)
(2.6)
Credit loss allowance/impairments recognised included in operating costs
(1.1)
(0.2)
Credit loss allowance/impairments reversed included in operating costs
0.1
1.3
Credit loss allowance written off against related receivable
-
0.3
Balance at the end of the year
(2.2)
(1.2)
MARKET RISK
Interest rate risk
Trade and other receivables do not earn interest and are therefore not subject to interest rate risk.
Foreign currency risk
Gold is sold at spot rates and is denominated in US Dollars. Gold sales are therefore exposed to fluctuations in the US Dollar/South
African Rand exchange rate. All foreign currency transactions entered into during the year ended June 30, 2022 were at spot
rates and no foreign exchange rate hedges are entered into. From April 11, 2022, The USD to be received from bullion sales are
sold on the same date as the respective bullion sale to settle in ZAR to the Group. Prior to April 11, 2022, Rand Refinery, acting
as an agent for the Group, sold the USD received from bullion sales on the same date as the respective bullion sale. As a result,
trade receivables are not exposed to fluctuations in the US Dollar/South African Rand exchange rate.
FAIR VALUE OF FINANCIAL INSTRUMENTS
The fair value of trade and other receivables approximate their carrying value due to their short-term maturities.
NOTES TO THE CONSOLIDATED FINANCIAL STATEMENTS
continued
for the year ended June 30, 2022
F-25
16 TRADE AND OTHER PAYABLES
ACCOUNTING POLICIES
Trade and other payables, excluding Value Added Tax, payroll accruals, accrued leave pay and provision for performance based
incentives, are non-derivative financial liabilities categorised as financial liabilities measured at amortised cost.
These liabilities are initially measured at fair value plus directly attributable transaction costs. Subsequent to initial recognition,
they are measured at amortised cost using the effective interest method. The Group derecognises a financial liability when its
contractual rights are discharged, or cancelled or expire.
Short-term employee benefits are expensed as the related service is provided. A liability is recognised for the amount expected
to be paid if the Group has a present legal or constructive obligation to pay this amount as a result of past service provided by the
employee and the obligation can be estimated reliably.
Amounts in R million
Note
2022
2021
Trade payables and accruals
429.1
352.9
Value Added Tax
0.2
4.5
Accrued leave pay
55.7
53.2
Accrual for short term performance based incentives
87.5
74.2
Payroll accruals
25.9
25.0
598.4
509.8
Interest relating to trade payables and accruals included in profit or loss
(1.8)
(1.8)
RELATED PARTY BALANCES
Trade payables and accruals include the following amounts payable to related parties:
Sibanye-Stillwater
25.8
12.0
Rand Refinery
-
0.6
LIQUIDITY RISK
Trade payables and accruals are all expected to be settled within 12 months from reporting date.
FAIR VALUE OF FINANCIAL INSTRUMENTS
The fair value of trade payables and accruals approximate their carrying value due to their short-term maturities.
17 INVENTORIES
ACCOUNTING POLICIES
Gold in process is stated at the lower of cost and net realisable value. Costs are assigned to gold in process on a weighted
average cost basis. Costs comprise all costs incurred to the stage immediately prior to smelting, including costs of extraction and
processing as they are reliably measurable at that point. Gold bullion is stated at the lower of cost and net realisable value. Selling
and general administration costs are excluded from inventory valuation.
Consumable stores are stated at cost less allowances for obsolescence. Cost of consumable stores and stockpile material is
based on the weighted average cost principle and includes expenditure incurred in acquiring inventories and bringing them to
their existing location and condition.
Net realisable value is the estimated selling price in the ordinary course of business, less the estimated cost of completion and
selling expenses.
Amounts in R million
2022
2021
Consumable stores
197.5
177.6
Ore stockpile
51.9
52.9
Gold in process
75.1
59.6
Finished inventories - Gold Bullion
64.8
49.9
Total inventories
389.3
340.0
Inventory carried at net realisable value includes:
Gold in process
8.5
-
Finished inventories - Gold Bullion
7.9
-
Write down to net realisable value included in movement in gold in process and finished
stock
(2.7)
-
NOTES TO THE CONSOLIDATED FINANCIAL STATEMENTS
continued
for the year ended June 30, 2022
F-26
18 INCOME TAX
SIGNIFICANT ACCOUNTING ASSUMPTIONS AND ESTIMATES
Management periodically evaluates positions taken where tax regulations are subject to interpretation. This includes the treatment
of both Ergo and FWGR as single mining operations respectively, pursuant to the relevant ring-fencing legislation.
The deferred tax liability is calculated by applying a forecast weighted average tax rate that is based on a prescribed formula. The
calculation of the forecast weighted average tax rate requires the use of assumptions and estimates and are inherently uncertain
and could change materially over time. These assumptions and estimates include expected future profitability and timing of the
reversal of the temporary differences. Due to the forecast weighted average tax rate being based on a prescribed formula that
increases the effective tax rate with an increase in forecast future profitability, and vice versa, the tax rate can vary significantly year
on year and can move contrary to current period financial performance.
A
100
approximately R
18.7
14.2
10.3
The assessment of the probability that future taxable profits will be available against which the tax losses and unredeemed capital
expenditure can be utilised requires the use of assumptions and estimates and are inherently uncertain and could change materially
over time.
Capital expenditure is assessed by the South African Revenue Service (“
SARS
”) when it is redeemed against taxable mining income
rather than when it is incurred. A different interpretation by SARS regarding the deductibility of these capital allowances may
therefore become evident subsequent to the year of assessment when the capital expenditure is incurred.
ACCOUNTING POLICIES
Income tax expense comprises current and deferred tax. Each company is taxed as a separate entity and tax is not set-off between
the companies.
Current tax
Current tax comprises the expected tax payable or receivable on the taxable income or loss for the year and any adjustment on tax
payable or receivable in respect of the previous year. Amounts are recognised in profit or loss except to the extent that it relates to
items recognised directly in equity or OCI. The current tax charge is calculated on the basis of the tax laws enacted or substantively
enacted at the reporting date.
Deferred tax
Deferred tax is recognised in respect of temporary differences between the carrying amounts and the tax bases of assets and
liabilities. Deferred tax is not recognised on the initial recognition of assets or liabilities in a transaction that is not a business
combination and that affects neither accounting nor taxable profit.
Deferred tax assets relating to unutilised tax losses and unutilised capital allowances are recognised to the extent that it is probable
that future taxable profits will be available against which the unutilised tax losses and unutilised capital allowances can be utilised.
The recoverability of these assets is reviewed at each reporting date and adjusted if recovery is no longer probable.
Deferred tax related to gold mining income is measured at a forecast weighted average tax rate that is expected to be applied to
temporary differences when they reverse, using tax rates enacted or substantively enacted at the reporting date. The calculation of
the forecast weighted average tax rate requires the use of assumptions and estimates, including the Group’s life-of-mine plan (as
discussed in note 9 to the consolidated financial statements) that is applied to calculate the expected future profitability.
Current tax on gold mining income for the periods presented was determined based on a formula: Y = 34 - 170/X where Y is the
percentage rate of tax payable and X is the ratio of taxable income, net of any qualifying capital expenditure that bears to gold
mining income derived, expressed as a percentage. Non-mining income, which consists primarily of interest accrued, is taxed at a
standard rate of
28
% for the periods presented.
All mining capital expenditure is deducted in the year it is incurred to the extent that it does not result in an assessed loss. Capital
expenditure not deducted from mining income is carried forward as unutilised capital allowances to be deducted from future mining
income.
Amendment in the corporate income tax rate and mining tax rate formula and broadening the tax base
On February 23, 2022 the Minister of Finance announced in his budget speech that the corporate income tax (“
CIT
”) rate will be
lowered from
28
% to
27
% for companies with years of assessment commencing on or after April 1, 2022. The mining operations of
the Group accounts for income tax using the gold mining tax formula as opposed to the CIT rate. The gold mining tax formula was
changed to Y = 33 - 165/X for years of assessment commencing on or after April 1, 2022. It was further announced that the lowering
of the CIT rate will be implemented alongside additional amendments to broaden the CIT base by limiting interest deductions and
assessed losses. Section 23M which limits the deduction of interest payable to certain parties who are not subject to tax was
significantly widened. A maximum of R
1
80
% of assessed losses (whichever is greater) is permitted to be set-off against
taxable income.
The deferred tax assets and liabilities for the Group have been calculated taking into account the above changes as they are
effective for the financial year and year of assessment commencing July 1, 2022.
Deferred tax is recognised using the gold mining tax formula to calculate a forecast weighted average tax rate considering the
expected timing of the reversal of temporary differences. The formula is calculated as: Y = 33 – 165/X where Y is the percentage
rate of tax payable and X is the ratio of taxable income, net of any qualifying capital expenditure that bears to mining income derived,
expressed as a percentage.
NOTES TO THE CONSOLIDATED FINANCIAL STATEMENTS
continued
for the year ended June 30, 2022
F-27
18 INCOME TAX
continued
Amendment in the corporate income tax rate and mining tax rate formula and broadening the tax base
continued
Due to the forecast weighted average tax rate being based on the expected future profitability, the tax rate can vary significantly
year-on-year and can move contrary to current year financial performance.
The forecast weighted average deferred tax rate of Ergo has decreased from
25
% to
22
% as a result of the change in the gold
mining tax formula and increase in the life of mine and increases in operating costs. The forecast weighted average deferred tax
rate of FWGR has decreased from
30
% to
29
% as a result of the change in the gold mining tax formula.
18.1 INCOME TAX EXPENSE
Amounts in R million
2022
2021
2020
Current tax
(261.6)
(423.7)
(263.2)
Mining tax
(250.2)
(423.7)
(263.2)
Non-Mining, company and capital gains tax
(11.4)
-
-
Deferred tax
(72.7)
(100.0)
(80.7)
Deferred tax charge - Mining tax
(119.9)
(104.0)
(59.1)
Deferred tax charge - Non-mining, company and capital gains tax
1.6
(19.1)
(2.1)
Deferred tax rate adjustment
45.6
-
(20.7)
Recognition of previously unrecognised tax losses
0.4
7.8
-
(Derecognition of previously recognised)/Recognition of previously unrecognised
tax losses of a capital nature
-
(1.2)
1.2
(Derecognition of previously recognised)/Recognition of previously unrecognised
deductible temporary differences
(0.4)
16.5
-
(334.3)
(523.7)
(343.9)
Tax reconciliation
Major items causing the Group's income tax expense to differ from the statutory rate
were:
Tax on net profit before tax at the South African corporate tax rate of
28
%
(408.3)
(549.9)
(274.1)
Rate adjustment to reflect the actual realised company tax rates applying the
gold mining formula
36.4
3.7
(0.9)
Deferred tax rate adjustment (a)
45.6
-
(20.7)
Depreciation of property, plant and equipment exempt from deferred tax on
initial recognition (b)
(22.2)
(21.2)
(21.4)
Non-deductible expenditure (c)
(7.3)
(6.2)
(7.9)
Exempt income and other non-taxable income (d)
19.0
22.8
2.4
(Derecognition of previously recognised)/Recognition of previously unrecognised
deductible temporary differences
(0.4)
16.5
-
(Derecognition of previously recognised)Recognition of previously unrecognised
tax losses of a capital nature
-
(1.2)
1.2
Utilisation of tax losses for which deferred tax assets were previously
unrecognised
0.4
7.8
-
Current year tax losses for which no deferred tax was recognised
(1.4)
(0.1)
(23.5)
Other items
3.6
3.3
0.4
Tax incentives
0.3
0.8
0.6
Income tax
(334.3)
(523.7)
(343.9)
(a) Deferred tax rate adjustment
Ergo’s forecast weighted average deferred tax rate decreased to
22
% (2021: remained unchanged at
25
%; 2020: increased from
22
% to
25
% due to an increase in forecast taxable income of Ergo).
FWGR’s forecast weighted average deferred tax rate decreased to
29
% (2021 and 2020: remained unchanged at
30
%).
(b) Depreciation of property, plant and equipment exempt from deferred tax on initial recognition
Depreciation of R
72.1
68.7
73.2
that was exempt from deferred tax on initial recognition in terms of IAS 12
Income Taxes
.
(c) Non-deductible expenditure
The most significant non-deductible expenditure incurred by the Group during the year includes:
●
R
21.1
7.4
7.1
●
17.8
17.0
2.7
million); and
●
5.8
as it is exempt from income tax (2021: R
nil
; 2020: R
14.6
NOTES TO THE CONSOLIDATED FINANCIAL STATEMENTS
continued
for the year ended June 30, 2022
F-28
18 INCOME TAX
continued
18.1 INCOME TAX EXPENSE
continued
(d) Exempt income and other non-taxable income
The most significant exempt income earned by the Group during the year includes:
●
71.5
76.1
4.3
●
5.8
4.8
4.0
●
nil
exempt from income tax (2021: R
1.0
operating cost that is not deductible as it is exempt from income tax) – refer to (c) non-deductible expenditure.
18.2 DEFERRED TAX
Amounts in R million
2022
2021
Included in the statement of financial position as follows:
Deferred tax assets
14.5
5.8
Deferred tax liabilities
(451.9)
(377.1)
Net deferred tax liabilities
(437.4)
(371.3)
Reconciliation of the deferred tax balance:
Balance at the beginning of the year
(371.3)
(265.1)
Recognised in profit or loss
(72.7)
(100.0)
Recognised in other comprehensive income
6.6
(6.2)
Balance at the end of the year
(437.4)
(371.3)
The detailed components of the net deferred tax liabilities which result from the differences between the amounts of assets and
liabilities recognised for financial reporting and tax purposes are:
Amounts in R million
2022
2021
Deferred tax liabilities
Property, plant and equipment (excluding unredeemed capital allowances)
(537.6)
(494.4)
Environmental rehabilitation obligation funds
(63.3)
(60.2)
Other investments
(0.9)
(7.4)
Gross deferred tax liabilities
(601.8)
(562.0)
Deferred tax assets
Environmental rehabilitation obligation
105.6
124.5
Other provisions
49.3
46.7
Other temporary differences
4.6
14.3
Estimated tax losses
4.1
4.1
Estimated unredeemed capital allowances
0.8
1.1
Gross deferred tax assets
164.4
190.7
Net deferred tax liabilities
(437.4)
(371.3)
1
Deferred tax assets have not been recognised in respect of the following:
Amounts in R million
2022
2021
Estimated tax losses
18.1
16.7
Estimated tax losses - Capital nature
313.6
325.2
Unredeemed capital expenditure
252.0
253.3
Deferred tax assets for tax losses, unredeemed capital expenditure and capital losses have not been recognised where future
taxable profits against which these can be utilised are not anticipated. These do not have an expiry date. A maximum of R
1
or
80
NOTES TO THE CONSOLIDATED FINANCIAL STATEMENTS
continued
for the year ended June 30, 2022
F-29
19 EMPLOYEE BENEFITS
ACCOUNTING POLICIES
Cash settled share-based payments (“outgoing long-term incentive” or “CLTI”)
Cash settled share-based payments are measured at fair value and remeasured at each reporting date to reflect the potential
outflow of cash resources to settle the liability, with a corresponding adjustment in profit or loss. Vesting assumptions for non-
market conditions are reviewed at each reporting date to ensure they reflect current expectations.
Equity settled share-based payments (“new long-term incentive” or “ELTI”)
The grant date fair value of equity settled share-based payment arrangements is recognised as an expense, with a corresponding
increase in equity, over the vesting period of the awards. The expense is adjusted to reflect the number of awards for which the
related service and non-market performance conditions are expected to be met, such that the amount ultimately recognised is
based on the number of awards that meet the related service and non-market performance conditions at vesting date.
19.1 CASH SETTLED LONG-TERM INCENTIVE SCHEME (“outgoing LTI scheme” or “CLTI scheme”)
Terms of the November 2015 grant made under the DRDGOLD Group's outgoing LTI scheme are:
• The scheme has a finite term of
5 years
• The phantom shares are issued at an exercise price of Rnil and will vest in 3 tranches:
20
%,
30
% and
50
% on the 3
rd,
th
5
th
• The phantom shares will be settled at the 7 day volume weighted average price ("
VWAP
") of the DRDGOLD share.
The last tranche of the November 2015 grant vested and was fully settled on November 5, 2020. The outgoing LTI scheme is
replaced by a new equity settled long-term incentive scheme (refer note 19.2).
Amounts in R million
Note
2022
2021
Movements in the total liability for long-term incentive scheme is as follows:
Opening balance
-
227.6
Share-based payment (benefit)/expense - CLTI scheme
5.3
-
(44.3)
Vested and paid
-
(183.3)
Liability for CLTI scheme at the end of the year
-
-
Reconciliation of outstanding phantom shares
2022
2021
Weighted
Weighted
average
average
Shares
price
Shares
price
Number
R per share
Number
R per share
Opening balance
-
9,845,638
Vested and paid
-
-
(9,845,638)
18.62
Closing balance
-
-
NOTES TO THE CONSOLIDATED FINANCIAL STATEMENTS
continued
for the year ended June 30, 2022
F-30
19 EMPLOYEE BENEFITS
continued
19.2 EQUITY SETTLED LONG-TERM INCENTIVE SCHEME (“new LTI scheme” or “ELTI scheme”)
Amounts in R million
2022
2021
2020
Share-based payment expense - ELTI scheme
18.4
16.0
6.0
On December 2, 2019, the shareholders approved a new equity settled long-term incentive scheme to replace the cash settled
long-term incentive scheme established in November 2015. Under the new LTI scheme, qualifying employees are awarded
conditional shares on an annual basis, comprising performance shares (
80
% of the total conditional shares awarded) and retention
shares (
20
% of the total conditional shares awarded). Conditional shares will vest
3 years
the form of DRDGOLD shares at a zero-exercise price.
The key conditions of the grants made under the ELTI scheme are:
Retention shares:
100
% of the retention shares will vest if the employee remains in the active employ of the Company at vesting date, is not under
notice period and individual performance criteria are met.
Performance shares:
Total shareholder’s return (TSR) measured against a hurdle rate of
15
% referencing DRDGOLD’s Weighted Average Cost of
Capital (“
WACC
”):
•
50
% of the performance shares are linked to this condition; and
• all of these performance shares will vest if DRDGOLD’s TSR exceeds the hurdle rate over the vesting period
TSR measured against a peer group of 3 peers (Sibanye-Stillwater, Harmony Gold Mining Company Limited and Pan-African
Resources Limited):
•
50
% of the performance shares are linked to this condition; and
• The number of performance shares which vest is based on DRDGOLD’s actual TSR performance in relation to percentiles of
peer group’s performance as follows:
Percentile of peers
% of performance shares
vesting
< 25th percentile
-
%
25th to < 50th percentile
25
%
50th to < 75th percentile
75
%
≥ 75th percentile
100
%
Reconciliation of the number of conditional shares
2022
2021
Shares
Number
Weighted
average price
R per share
Shares
Number
Weighted
average price
R per share
Opening balance
7,840,620
5,860,760
Granted
October 22, 2020
-
1,979,860
October 20, 2021
3,508,232
-
Vested
(2,862,654)
14.02
-
-
Forfeited
(892,528)
-
Closing balance
7,593,670
7,840,620
Vesting on
7,593,670
7,840,620
December 2, 2021
-
2,930,380
December 2, 2022
2,715,604
2,930,380
October 22, 2023
1,666,778
1,979,860
October 20, 2024
3,211,288
-
Fair value
The weighted average fair value of the performance and retention shares at grant date were determined using the Monte Carlo
simulation pricing model applying the following key inputs:
Grant date
October 20, 2021
October 22, 2020
December 2, 2019
Vesting date
October 20, 2024
October 22, 2023
December 2, 2022
Weighted average fair value of 80% performance shares
7.34
10.49
4.12
Weighted average fair value of 20% retention shares
12.32
18.67
5.49
Expected term (years)
3
3
3
Grant date share price of a DRDGOLD share
13.55
19.43
6.15
Expected dividend yield
3.15
%
1.33
%
3.81
%
Expected volatility
60.20
%
63.07
%
53.80
%
Expected risk free rate
5.78
%
3.82
%
6.80
%
1
conditions
NOTES TO THE CONSOLIDATED FINANCIAL STATEMENTS
continued
for the year ended June 30, 2022
F-31
2
term of the options
NOTES TO THE CONSOLIDATED FINANCIAL STATEMENTS
continued
for the year ended June 30, 2022
F-32
19.3 TRANSACTIONS WITH KEY MANAGEMENT PERSONNEL
Interests in contracts
None of the directors, officers or major shareholders of DRDGOLD or, to the knowledge of DRDGOLD’s management, their
families, had any interest, direct or indirect, in any transaction entered into during the year ended June 30, 2022 or the preceding
financial years, or in any proposed transaction which has affected or will materially affect DRDGOLD or its subsidiaries other than
disclosed in these financial statements. None of the directors or officers of DRDGOLD or any associate of such director or officer
is currently or has been at any time during the past financial year materially indebted to DRDGOLD.
Key management personnel remuneration
Amounts in R million
Note
2022
2021
2020
- Board fees paid
7.8
7.6
6.2
- Salaries paid
82.5
75.5
67.3
- Short term incentives relating to this cycle
84.1
73.8
63.6
- Market value of long-term incentives vested and transferred
19.2
40.1
-
-
- Long term incentives paid during the cycle
19.1
-
183.3
41.5
214.5
340.2
178.6
20 CAPITAL MANAGEMENT
The primary objective of the Group's capital management policy is to ensure that adequate capital is available to meet the
requirements of the Group from time to time, including capital expenditure. The Group considers the appropriate capital
management strategy for specific growth projects as and when required. Lease liabilities are not considered to be debt.
Liquidity management
At June 30, 2022 and June 30, 2021 the Group’s facilities included an undrawn Revolving Credit Facility (“
RCF
”) which was
initially secured to finance the development of Phase 1 of FWGR as well as the general working capital requirements of the
Group. In December 2018, R
125
note 24).
In September 2020, the initial R
300
200
years with a final repayment date of
September 14, 2022
.
The initial and amended RCF permits a consolidated debt ratio (net debt to adjusted EBITDA) of no more than
2:1
consolidated interest coverage ratio (net interest to adjusted EBITDA) of no less than
4:1
basis respectively. Management monitors the covenant ratio levels to ensure compliance with the covenants, as well as maintain
sufficient facilities to ensure satisfactory liquidity for the Group. The covenant ratios were not breached as at or during the year
ended June 30, 2022 or June 30, 2021.
The amendment included the reduction of the initial interest rate margin of
3.25
% to
2.75
%. A pledge and cession of DRDGOLD’s
shares in and shareholder claims against Ergo Mining Proprietary Limited and Far West Gold Recoveries Proprietary limited
remains in place as security for the RCF.
The amended RCF does not include any commitment towards the guarantee to
Ekurhuleni Local Municipality.
No amounts were drawn under this facility as at June 30, 2022. Pursuant to the Group having started to evaluate its funding
structure for its expanded budgeted capital expenditure programme in future years, a decision was made to not renew the RCF.
NOTES TO THE CONSOLIDATED FINANCIAL STATEMENTS
continued
for the year ended June 30, 2022
F-33
21 EQUITY
ACCOUNTING POLICIES
Stated share capital
Ordinary shares and the cumulative preference shares are classified as equity. Incremental costs directly attributable to the issue
of ordinary shares are recognised as a deduction from equity, net of any tax effect.
Repurchase and reissue of share capital (treasury shares)
When shares recognised as equity are repurchased, the amount of the consideration paid, which includes directly attributable
costs is recognised as a deduction from equity. Repurchased shares are classified as treasury shares and are presented as a
deduction from stated share capital.
Dividends
Dividends are recognised as a liability on the date on which they are declared which is the date when the shareholders’ right to
the dividends vests.
21.1 STATED SHARE CAPITAL
All ordinary shares rank equally regarding the Company’s residual assets. Holders of ordinary shares are entitled to dividends as
declared from time to time and are entitled to one vote per share at general meetings of the Company. All rights attached to the
Company’s shares held by the Group are suspended until those shares are reissued.
Preference shareholders participate only to the extent of the face value of the shares. Holders of preference shares do not have
the right to participate in any additional dividends declared for ordinary shareholders. These shares do not have voting rights.
Amounts in R million
2022
2021
2020
Authorised share capital
1,500,000,000
, (2021 and 2020:
1,500,000,000
) ordinary shares of
no
5,000,000
5,000,000
) cumulative preference shares of
10
0.5
0.5
0.5
Issued share capital
864,588,711
864,588,711
) ordinary shares of
no
6,208.4
6,208.4
6,208.4
6,612,266
9,474,920
) treasury shares held within the Group (a)
(35.6)
(51.0)
(51.0)
5,000,000
5,000,000
) cumulative preference shares of 10 cents each
0.5
0.5
0.5
6,173.3
6,157.9
6,157.9
RELATED PARTY RELATIONSHIPS AND TRANSACTIONS
(a) Treasury shares
Shares in DRDGOLD Limited are held in treasury by Ergo Mining Operations Proprietary Limited ("
EMO
").
No
acquired in the market during the year ended June 30, 2022, the year ended June 30, 2021 or the year ended June 30, 2020 .
During the year ended June 30, 2022
2,862,654
nil
cashflow to the Group. R
15.4
payment, was transferred to retained earnings.
21.2 DIVIDENDS
Amounts in R million
2022
2021
2020
Dividends paid during the year net of treasury shares:
Final dividend declared relating to prior year:
40
35
per share; 2020:
20
342.0
299.3
137.5
First interim dividend:
20
40
25
cents per share)
171.6
342.0
213.8
Second interim dividend nil SA cents per share (2021: nil SA cents per share; 2020:
25
SA cents per share)
-
-
213.8
Total
513.6
641.3
565.1
After June 30, 2022, a dividend of
40
342.0
a final dividend for the year ended June 30, 2022. The dividend has not been provided as at June 30, 2022 and does not have
any tax impact on the Group.
NOTES TO THE CONSOLIDATED FINANCIAL STATEMENTS
continued
for the year ended June 30, 2022
F-34
22 INTEREST IN SUBSIDIARIES
ACCOUNTING POLICIES
Significant subsidiaries of the Group are those subsidiaries with the most significant contribution to the Group's profit or loss or
assets.
Ergo Mining Proprietary Limited (“
Ergo
”) and Far West Gold Recoveries Proprietary Limited (“
FWGR
”) are the only significant
subsidiaries of the Group. They are both wholly owned subsidiaries and are incorporated in South Africa, are primarily involved in
the retreatment of surface gold and all their operations are based in South Africa.
23 OPERATING SEGMENTS
ACCOUNTING POLICIES
Operating segments are reported in a manner consistent with internal reports that the Group’s chief operating decision maker
(“
CODM
”) reviews regularly in allocating resources and assessing performance of operating segments. The CODM has been
identified as the Group’s Executive Committee. The Group has one material revenue stream, the sale of gold. To identify operating
segments, management reviewed various factors, including operational structure and mining infrastructure. It was determined that
an operating segment consists of a single or multiple metallurgical plants and reclamation sites that, together with its tailings
storage facility, is capable of operating independently.
When assessing profitability, the CODM considers,
inter alia,
the revenue and cash operating costs of each segment. The net of
these amounts is the segment operating profit or loss. Therefore, segment operating profit has been disclosed as the primary
measure of profit or loss. The CODM also considers the additions to property, plant and equipment.
Ergo
business district as well as the East and Central Rand goldfields. The operation comprises three plants. The Ergo and Knights
plants continue to operate as metallurgical plants. The City Deep plant continues to operate as a pump/milling station feeding the
metallurgical plants.
FWGR
the reconfiguration of the Driefontein 2 plant and relevant infrastructure to process tailings from the Driefontein 5 slimes dam and
deposit residues on the Driefontein 4 Tailings Storage Facility, was commissioned on April 1, 2019.
Corporate office and other reconciling items
"Other reconciling items"
) represent the items to
reconcile to consolidated financial statements. This does not represent a separate segment as it does not generate mining
revenue.
Note condensed during the current year. Changes also affected on comparatives.
NOTES TO THE CONSOLIDATED FINANCIAL STATEMENTS
continued
for the year ended June 30, 2022
F-35
23
OPERATING SEGMENTS
Other
2022
reconciling
Amounts in R million
Ergo
FWGR
items
Revenue (External)
3,704.9
1,413.6
-
5,118.5
Cash operating costs
(3,009.8)
(454.0)
-
(3,463.8)
Movement in gold in process and finished inventories - Gold Bullion
35.2
(4.8)
-
30.4
Segment operating profit
730.3
954.8
-
1,685.1
Additions to property, plant and equipment
(436.2)
(162.2)
-
(598.4)
Reconciliation of segment operating profit to profit after tax
Segment operating profit
730.3
954.8
-
1,685.1
Depreciation
(134.5)
(131.6)
(1.5)
(267.6)
Change in estimate of environmental rehabilitation recognised in
profit or loss
2.3
-
(0.1)
2.2
Ongoing rehabilitation expenditure
(30.1)
(1.5)
-
(31.6)
Care and maintenance
-
-
(5.9)
(5.9)
Other operating costs
(4.9)
(0.2)
(0.1)
(5.2)
Other income
70.1
21.2
-
91.3
Administration expenses and other costs
(7.7)
(13.8)
(139.7)
(161.2)
Finance income
22.4
19.0
184.4
225.8
Finance expense
(58.8)
(10.8)
(5.2)
(74.8)
Current tax
(12.9)
(237.3)
(11.4)
(261.6)
Deferred tax
(45.3)
(29.6)
2.2
(72.7)
Profit after tax
530.9
570.2
22.7
1,123.8
Reconciliation of cost of sales to cash operating costs
Cost of sales
(3,141.8)
(592.1)
(7.6)
(3,741.5)
Depreciation
134.5
131.6
1.5
267.6
Change in estimate of environmental rehabilitation recognised in
profit or loss
(2.3)
-
0.1
(2.2)
Movement in gold in process and finished inventories - Gold Bullion
(35.2)
4.8
-
(30.4)
Ongoing rehabilitation expenditure
30.1
1.5
-
31.6
Care and maintenance
-
-
5.9
5.9
Other operating costs
4.9
0.2
0.1
5.2
Cash operating costs
(3,009.8)
(454.0)
-
(3,463.8)
NOTES TO THE CONSOLIDATED FINANCIAL STATEMENTS
continued
for the year ended June 30, 2022
F-36
23
OPERATING SEGMENTS
Other
2021
reconciling
Amounts in R million
Ergo
FWGR
items
Revenue (External)
3,943.0
1,326.0
-
5,269.0
Cash operating costs
(2,666.5)
(406.2)
-
(3,072.7)
Movement in gold in process and finished inventories - Gold Bullion
(31.9)
6.3
-
(25.6)
Segment operating profit
1,244.6
926.1
-
2,170.7
Additions to property, plant and equipment
(250.9)
(143.3)
(1.5)
(395.7)
Reconciliation of segment operating profit to profit after tax
Segment operating profit
1,244.6
926.1
-
2,170.7
Depreciation
(135.6)
(115.6)
(1.3)
(252.5)
Change in estimate of environmental rehabilitation recognised in
profit or loss
7.2
-
5.2
12.4
Ongoing rehabilitation expenditure
(46.6)
(1.7)
-
(48.3)
Care and maintenance
-
-
(3.9)
(3.9)
Other operating expenses
2.4
-
-
2.4
Other income
0.1
-
-
0.1
Administration expenses and other costs
15.0
1.8
(80.8)
(64.0)
Finance income
21.0
17.2
178.0
216.2
Finance expense
(45.8)
(9.8)
(13.9)
(69.5)
Current tax
(196.1)
(227.6)
-
(423.7)
Deferred tax
(66.6)
(37.4)
4.0
(100.0)
Profit after tax
799.6
553.0
87.3
1,439.9
Reconciliation of cost of sales to cash operating costs
Cost of sales
(2,871.0)
(517.2)
-
(3,388.2)
Depreciation
135.6
115.6
1.3
252.5
Change in estimate of environmental rehabilitation recognised in
profit or loss
(7.2)
-
(5.2)
(12.4)
Movement in gold in process and finished inventories - Gold Bullion
31.9
(6.3)
-
25.6
Ongoing rehabilitation expenditure
46.6
1.7
-
48.3
Care and maintenance
-
-
3.9
3.9
Other operating income
(2.4)
-
-
(2.4)
Cash operating costs
(2,666.5)
(406.2)
-
(3,072.7)
NOTES TO THE CONSOLIDATED FINANCIAL STATEMENTS
continued
for the year ended June 30, 2022
F-37
23
OPERATING SEGMENTS
Other
2020
reconciling
Amounts in R million
Ergo
FWGR
items
Revenue (External)
3,064.3
1,120.7
-
4,185.0
Cash operating costs
(2,274.0)
(352.0)
-
(2,626.0)
Movement in gold in process and finished inventories - Gold Bullion
1.8
1.3
-
3.1
Segment operating profit
792.1
770.0
-
1,562.1
Additions to property, plant and equipment
(114.4)
(68.0)
(0.3)
(182.7)
Reconciliation of segment operating profit to profit after tax
Segment operating profit
792.1
770.0
-
1,562.1
Depreciation
(150.4)
(119.6)
(0.8)
(270.8)
Change in estimate of environmental rehabilitation recognised in
profit or loss
19.1
2.1
0.7
21.9
Ongoing rehabilitation expenditure
(22.3)
(2.0)
-
(24.3)
Care and maintenance
-
-
(11.1)
(11.1)
Other operating expenses
(27.6)
(3.1)
-
(30.7)
Other income
0.7
-
-
0.7
Administration expenses and other costs
(131.6)
(20.7)
(157.6)
(309.9)
Finance income
28.9
28.1
52.8
109.8
Finance expense
(48.8)
(14.3)
(5.7)
(68.8)
Current tax
(145.8)
(117.4)
-
(263.2)
Deferred tax
6.6
(86.5)
(0.8)
(80.7)
Profit after tax
320.9
436.6
(122.5)
635.0
Reconciliation of cost of sales to cash operating costs
Cost of sales
(2,453.4)
(473.3)
(11.2)
(2,937.9)
Depreciation
150.4
119.6
0.8
270.8
Change in estimate of environmental rehabilitation recognised in
profit or loss
(19.1)
(2.1)
(0.7)
(21.9)
Movement in gold in process and finished inventories - Gold Bullion
(1.8)
(1.3)
-
(3.1)
Ongoing rehabilitation expenditure
22.3
2.0
-
24.3
Care and maintenance
-
-
11.1
11.1
Other operating costs
27.6
3.1
-
30.7
Cash operating costs
(2,274.0)
(352.0)
-
(2,626.0)
NOTES TO THE CONSOLIDATED FINANCIAL STATEMENTS
continued
for the year ended June 30, 2022
F-38
24 PAYMENTS MADE UNDER PROTEST
SIGNIFICANT ACCOUNTING JUDGEMENTS
Payments made under protest
The determination of whether the payments made under protest give rise to an asset or a contingent asset or neither, required
the use of significant judgement. The definition of an asset in the conceptual framework was applied as well as the considerations
in the outcome of the IFRS Interpretations Committee (“
IFRIC
”) agenda decision – Deposits relating to taxes other than income
tax (IAS 37
Provisions, Contingent Liabilities and Contingent Assets
) (“
IFRIC Agenda Decision
”) published in January 2019. The
IFRIC Agenda Decision has a similar fact pattern to that of the payments made under protest. With the consideration of the facts
and circumstances surrounding the payments made under protest in applying the definition of an asset and the IFRIC Agenda
Decision, management considered the following:
• payments were made under protest and without prejudice or admission of liability. Such payments were not made as a
settlement of debt or recognition of expenditure;
• the Group therefore retains a right to recover the payments from the City of Ekurhuleni Metropolitan Municipality
(“
Municipality
”) if the Group is successful in the Main Application (as defined below);
• if the Group is not successful in the Main Application, the payments will be used to settle the resultant liability to the Municipality;
and
• these two possible outcomes (i.e. success in the Main Application or not) therefore, will lead to economic benefits to the Group.
Therefore, the right to recover the payments made under protest is not a contingent asset because it meets the definition and
recognition criteria of an asset. No specific guidance exists in developing an accounting policy for such asset. Therefore,
management applied judgement in developing an accounting policy that would lead to information that is relevant to the users of
these financial statements and information that can be relied upon.
Contingent liabilities
The assessment of whether an obligating event results in a liability or a contingent liability requires the exercise of significant
judgement of the outcome of future events that are not wholly within the control of the Group.
Litigation and other judicial proceedings inherently entail complex legal issues that are subject to uncertainties and complexities
and are subject to interpretation.
SIGNIFICANT ACCOUNTING ASSUMPTIONS AND ESTIMATES
The discounted amount of the payments made under protest is determined using assumptions about the future that are inherently
uncertain and can change materially over time and includes the discount rate and discount period.
These assumptions about the future include estimating the timing of concluding on the Main Application, i.e. the discount period,
the ultimate settlement terms, the discount rate applied and the assessment of recoverability.
ACCOUNTING POLICIES
Payments made under protest
Recognition and measurement
The payment made under protest asset that arises from the Municipality Electricity Tariff Dispute is initially measured at a
discounted amount, and any difference between the face value of payments made under protest and the discounted amount on
initial recognition is recognised in profit or loss as a finance expense. Subsequent to initial recognition, the payments made under
protest is measured using the effective interest method to unwind the discounted amount to the original face value less any write
downs for recovery. Unwinding of the carrying value and changes in the discount period are recognised in finance income.
Assessment of recoverability
The discounted amount of the payments under protest is assessed at each reporting date to determine whether there is any
objective evidence that the full amount is no longer expected to be recovered. The Group considers the reasonable and
supportable information related to the creditworthiness of the Municipality and events surrounding the outcome of the Main
Application. Any write down is recognised in finance expense.
Contingent liabilities
A contingent liability is a possible obligation arising from past events and whose existence will be confirmed only by occurrence
or non-occurrence of one or more uncertain future events not wholly within the control of the Group. A contingent liability may also
be a present obligation arising from past events but is not recognised on the basis that an outflow of economic resources to settle
the obligation is not viewed as probable, or the amount of the obligation cannot be reliably measured. When the Group has a
present obligation, an outflow of economic resources is assessed as probable and the Group can reliably measure the obligation,
a provision is recognised.
NOTES TO THE CONSOLIDATED FINANCIAL STATEMENTS
continued
for the year ended June 30, 2022
F-39
24 PAYMENTS MADE UNDER PROTEST
continued
Amounts in R million
Note
2022
2021
Balance at the beginning of the year
40.5
35.0
Payments made under protest
15.2
8.1
Discount on initial payment made under protest and change in estimate
7
(21.1)
(7.4)
Unwinding
6
5.8
4.8
Balance at the end of the year
40.4
40.5
Ekurhuleni Metropolitan Municipality ("Municipality") Electricity Tariff Dispute
There are primarily 3 (three) legal proceedings for which relief has been sought in the appropriate legal fora and all of which fall
within the jurisdiction of the High Court of South Africa, Gauteng Local Division, Johannesburg. These comprise an application
brought by Ergo and actions brought under two summonses by the Municipality.
In order to operate the Ergo Plant and conduct its business operations, Ergo requires a reliable and steady feed of electricity
which it draws from the Ergo Central Substation.
Over the past several years the Municipality has charged Ergo for such electricity, at the Megaflex tariff at which ESKOM Holdings
SOC Limited (“
ESKOM
”) charges its large power users plus an additional surcharge, as it still does; and Ergo paid therefor.
Pursuant to its own investigations, and after having sought legal advice on the matter, Ergo determined that only ESKOM may
legitimately charge it for the electricity so drawn and consumed at the Ergo Plant, specifically from the Ergo Central Substation.
Despite this, ESKOM refused to either accept payment from Ergo in respect of such electricity consumption or to conclude a
consumer agreement with it.
In December 2014, Ergo instituted legal proceedings by way of an application (“
Main Application
”) against the Municipality and
ESKOM as well as the National Energy Regulator of South Africa (“
NERSA
”), the Minister of Energy, the Minister of Co-operative
Governance & Traditional Affairs and the South African Local Government Association, the latter 4 (four) respondents against
whom Ergo does not seek any relief.
Ergo seeks the undermentioned relief:
●
●
electricity to Ergo at the Ergo Plant;
●
at the Ergo Plant;
●
●
tariff.
The Municipality has since issued two summonses (“
Summonses
”) for the recovery of arrears it alleges it is owed amounting to
R
74.0
31.6
In the interest of the proper administration of justice, the Main Application was postponed by agreement between the parties and
a case manager was appointed to determine a collaborative process to facilitate the effective and efficient court scheduling and
coordination of both the Main Application and the Summonses.
In order to secure uninterrupted supply of electricity, Ergo has made payment and continues to pay for consumption at the
amended and lower “J-Tariff”, albeit under protest and without prejudice and/or admission of liability. Whilst still deemed to be
disproportionate, the J-Tarif is significantly lower than the previously imposed “D-Tariff”. The Group recognised an asset for these
payments that are made “under protest”.
Ergo has also brought an application for the consolidation of both the Main Application and the actions brought under the
Summonses, which is still ongoing.
The Group supported by the external legal team is confident that there is a high probability that Ergo will be successful in the Main
Application and defending the Summonses. Therefore, there is no present obligation as a result of a past event to pay the amounts
claimed by the Municipality
The balance at the end of the year was based on the following assumptions:
●
11.80
% (2021:
11.68
%) representing the Municipality maximum cost of borrowing on bank loans as disclosed in
their June 30, 2021 annual report; and
●
June 30, 2027
June 30, 2024
) representing management’s best estimate of the date of conclusion of
the Main Application and is supported by external legal counsel. The discount period has increased due to delays in obtaining
hearing dates due to back log cases at the court which began during the COVID-19 pandemic.
NOTES TO THE CONSOLIDATED FINANCIAL STATEMENTS
continued
for the year ended June 30, 2022
F-40
25 OTHER INVESTMENTS
ACCOUNTING JUDGEMENTS
The Group has one (1) director representative on the Rand Refinery board. Therefore, judgement had to be applied to ascertain
whether significant influence exists, and if the investment should be accounted for as an associate under IAS 28
Investments in
Associates and Joint Ventures
. The director representation is not considered significant influence, as it does not constitute
meaningful representation. It represents
11.11
% of the entire board and is proportional to the
11.3
% shareholding that the Group
has.
SIGNIFICANT ACCOUNTING ASSUMPTIONS AND ESTIMATES
The fair value of the listed equity instrument is determined based on quoted prices on an active market. Equity instruments which
are not listed on an active market are measured using other applicable valuation techniques depending on the extent to which the
technique maximises the use of relevant observable inputs and minimizes the use of unobservable inputs. Where discounted
cash flows are used, the estimated cash flows are based on management’s best estimate based on readily available information
at measurement date. The discounted cash flows contain assumptions about the future that are inherently uncertain and can
change materially over time.
ACCOUNTING POLICIES
On initial recognition of an equity investment that is not held for trading, the Group may make an irrevocable election to present
subsequent changes in the investment’s fair value in other comprehensive income. This election is made on an investment-by-
investment basis.
These assets are initially recognised at fair value plus any directly attributable transaction costs. Subsequent to initial recognition
they are measured at fair value and changes therein are recognised in other comprehensive income (“
OCI
”), and are never
reclassified to profit or loss, with dividends recognised in profit or loss unless the dividend clearly represents a recovery of part of
the cost of the investment.
The Group’s listed and unlisted investments in equity securities are classified as equity instruments at fair value through OCI.
Amounts in R million
Shares
held
% held
2022
2021
Listed investments (Fair value hierarchy Level 1):
West Wits Mining Limited ("
WWM
")
47,812,500
2.4%
10.7
43.5
Total listed investments
10.7
43.5
Unlisted investments (Fair value hierarchy Level 3):
Rand Refinery Proprietary Limited ("
Rand Refinery
")
44,438
11.3%
136.1
119.3
Rand Mutual Assurance Company Limited B Share Business Fund ("
RMA
")
12,659
2
1.3%
4.4
4.1
Guardrisk Insurance Company Limited (Cell Captive A170)
20
3
100.0%
3
0.1
0.1
Chamber of Mines Building Company Proprietary Limited
42,292
4.5%
0.1
0.1
Total unlisted investments
140.7
123.6
Balance at the end of the year
151.4
167.1
Fair value adjustment on equity instruments at fair value through OCI
(15.7)
(28.2)
WWM
(32.8)
31.5
Rand Refinery
16.8
(59.1)
RMA
0.3
(0.6)
Dividends received on equity instruments at fair value through OCI
(71.5)
(76.1)
Rand Refinery
(70.1)
(72.3)
RMA
(1.4)
(3.8)
1
The number and percentage shares held remained unchanged for the prior year with the exception of WWM that issued new shares thereby
diluting DRDGOLD's effective shareholding from
3.5
% to
2.4
%
2
The "B Share Business Fund" shares relate to all the businesses of the RMA Group that do not relate to the Compensation for Occupational
Injuries and Diseases Act
3
The shares held entitles the holder to
100
% of the residual net equity of Cell Captive A 170
MARKET RISK
Other market price risk
Equity price risk arises from changes in quoted market prices of listed investments as well as changes in the fair value of unlisted
investments due to changes in the underlying net asset values.
FAIR VALUE OF FINANCIAL INSTRUMENTS
Listed investments
The fair values of listed investments are determined by reference to published price quotations from recognised securities
exchanges and constitute level 1 instruments in the fair value hierarchy.
Unlisted investments
The fair values of unlisted investments are determined through valuation techniques that include inputs that are not based on
observable market data and constitute level 3 instruments in the fair value hierarchy.
NOTES TO THE CONSOLIDATED FINANCIAL STATEMENTS
continued
for the year ended June 30, 2022
F-41
25 OTHER INVESTMENTS
continued
25.1 RAND REFINERY
Amounts in R million
2022
2021
Balance at the beginning of the year
119.3
178.4
Fair value adjustment on equity investments at fair value through other comprehensive income
16.8
(59.1)
Balance at the end of the year
136.1
119.3
In accordance with IFRS 13
Fair Value Measurement
, the income approach has been established to be the most appropriate
basis to estimate the fair value of the investment in Rand Refinery. This method relies on the future budgeted cash flows as
estimated by Rand Refinery. Management used a model developed by an external expert to perform the valuation.
Rand Refinery’s refining operations (excluding Prestige Bullion) were valued using the Free Cash Flow model, whereby an
enterprise value using a Gordon Growth formula for the terminal value was estimated. The forecasted dividend income to be
received from Prestige Bullion was valued using a finite-life dividend discount model as Rand Refinery’s shareholding will be
reduced to nil in 2032 per agreement with the South African Mint (partner in Prestige Bullion). These valuations revealed that the
fair value of the investment in Rand Refinery consist mainly of Rand Refinery’s cash on hand and the forecasted dividend income
to be received from Prestige Bullion.
The fair value of Rand Refinery increased as a result of an increase in cash on hand. The enterprise value of the refining operations
of Rand Refinery decreased because of an increase in budgeted operating costs. The value of the forecasted dividends for
Prestige Bullion decreased as a result of a decrease in the discount period due to the model being finite.
The fair value measurement uses significant unobservable inputs and relates to a fair value hierarchy level 3 financial instrument.
Marketability and minority discounts (both unobservable inputs) of
16.5
% and
17.0
% (2021:
16.5
% and
17.0
%), respectively, were
applied. The latest budgeted cash flow forecasts provided by Rand Refinery as at June 30, 2022 was used, and therefore classified
as an unobservable input into the models. Other key observable/unobservable inputs into the model include:
Amounts in R million
Observable/unobservable input
Unit
2022
2021
Rand Refinery operations
Forecast average gold price
Observable input
R/kg
880,207
847,317
Forecast average silver price
Observable input
R/kg
11,209
11,751
Average South African CPI
Observable input
%
4.4
4.4
South African long-term government bond rate
Observable input
%
10.26
9.5
Terminal growth rate
Unobservable input
%
4.4
4.4
Weighted average cost of capital
Unobservable input
%
15.9
15.1
Investment in Prestige Bullion
Discount period
Unobservable input
years
11
12
Cost of equity
Unobservable input
%
14.2
16.5
Sensitivity analysis
The fair value measurement is most sensitive to the Rand denominated gold price and operating costs. The higher the gold price,
the higher the fair value of the Rand Refinery investment. The higher the operating costs, the lower the fair value of Rand Refinery.
The fair value measurement is also sensitive to the discount rate and minority and marketability discounts applied. The below
table indicates the extent of sensitivity of the Rand Refinery equity value to the inputs:
Input
Change in OCI, net of tax
Amounts in R million
% Increase
% Decrease
% Increase
% Decrease
Rand Refinery operations
Rand US Dollar exchange rate
Observable inputs
1
(1)
3.3
(3.3)
Commodity prices (Gold and silver)
Observable inputs
1
(1)
2.8
(2.8)
Operating costs
Unobservable inputs
1
(1)
(2.6)
2.6
Weighted average cost of capital
Unobservable inputs
1
(1)
(0.1)
0.1
Minority discount
Unobservable inputs
1
(1)
(1.2)
1.2
Marketability discount
Unobservable inputs
1
(1)
(1.2)
1.2
Investment in Prestige Bullion
Cost of equity
Unobservable inputs
1
(1)
(1.0)
1.0
Prestige Bullion dividend forecast
Unobservable inputs
1
(1)
0.3
(0.3)
NOTES TO THE CONSOLIDATED FINANCIAL STATEMENTS
continued
for the year ended June 30, 2022
F-42
26 CONTINGENCIES
SIGNIFICANT ACCOUNTING JUDGEMENTS
The assessment of whether an obligating event results in a liability or a contingent liability requires the exercise of significant
judgement of the outcome of future events that are not wholly within the control of the Group. Litigation and other judicial
proceedings inherently entail complex legal issues that are subject to uncertainties and complexities and are subject to
interpretation.
ACCOUNTING POLICIES
Contingent liabilities
A contingent liability is a possible obligation arising from past events and whose existence will be confirmed only by occurrence
or non-occurrence of one or more uncertain future events not wholly within the control of the Group. A contingent liability may
also be a present obligation arising from past events but is not recognised on the basis that an outflow of economic resources to
settle the obligation is not viewed as probable, or the amount of the obligation cannot be reliably measured. When the Group has
a present obligation, an outflow of economic resources is assessed as probable and the Group can reliably measure the
obligation, a provision is recognised.
Contingent assets
Contingent assets are possible assets whose existence will be confirmed by the occurrence or non-occurrence of uncertain future
events that are not wholly within the control of the entity. Contingent assets are not recognised, but they are disclosed when it is
more likely than not that an inflow of benefits will occur. However, when the inflow of benefits is virtually certain an asset is
recognised in the statement of financial position, because that asset is no longer considered to be contingent.
26.1 CONTINGENT LIABILITY FOR OCCUPATIONAL LUNG DISEASES
On May 3, 2018, former mineworkers and dependents of deceased mineworkers (“Applicants”) and Anglo American South
Africa Limited, AngloGold Ashanti Limited, Sibanye Gold Limited, Harmony Gold Mining Company Limited, Gold Fields Limited,
African Rainbow Minerals Limited and certain of their affiliates (“Settling Companies”) settled the class certification application
in which the Applicants in each sought to certify class actions against gold mining houses cited therein on behalf of mineworkers
who had worked for any of the particular respondents and who suffer from any occupational lung disease, including silicosis or
tuberculosis. The fund managing the compensation for the Applicants has started disbursing funds to the claim beneficiaries.
The DRDGOLD Respondents, DRDGOLD Limited and East Rand Proprietary Mines Limited, are not a party to the settlement
between the Applicants and Settling Companies and the settlement agreement is not binding on the DRDGOLD Respondents.
The dispute, insofar as the class certification application and appeal thereof is concerned, still stands and has not terminated in
light of the settlement agreement.
In terms of the class action, the DRDGOLD respondents has lodged an appeal against certain aspects of the class action, inter
alia the extension of the remedy entertained in the class action, and the inclusion of tuberculosis as a basis for liability. The
Appeal record has been finalised and the allocation of a date for the hearing of the Appeal is November 11, 2022.
DRDGOLD maintains the view that it is too early to consider settlement of the matter, mainly for the following reasons:
• the Applicants have as yet not issued and served a summons (claim) in the matter;
• there is no indication of the number of potential claimants that may join the class action against the DRDGOLD Respondents;
• many principles upon which legal responsibility is founded, are required to be substantially developed by the trial court (and
possibly subsequent courts of appeal) to establish liability on the bases alleged by the Applicants.
In light of the above there is inadequate information to determine if a sufficient legal and factual basis exists to establish liability,
and to quantify such potential liability.
26.2 CONTINGENT LIABILITY FOR ENVIRONMENTAL REHABILITATION
Mine residue deposits may have a potential pollution impact on ground water through seepage. The Group has taken certain
preventative actions as well as remedial actions in an attempt to minimise the Group’s exposure and environmental
contamination.
The flooding of the western and central basins has the potential to cause pollution due to Acid Mine Drainage (“AMD”)
contaminating the ground water. The government has appointed Trans-Caledon Tunnel Authority (“TCTA”) to construct a partial
treatment plant to prevent the ground water being contaminated. TCTA completed the construction of the neutralisation plant
for the Central Basin and commenced treatment during July 2014. As part of the heads of agreement signed in December 2012
between EMO, Ergo, ERPM and TCTA, sludge emanating from this plant since August 2014 has been co-disposed onto the
Brakpan/Withok Tailings Storage facility. Partially treated water has been discharged by TCTA into the Elsburg Spruit.
This agreement includes the granting of access to the underground water basin through one of ERPM’s shafts and the rental of
a site onto which it constructed its neutralisation plant. In exchange, Ergo and its associate companies including ERPM have a
setoff against any future directives to make any contribution toward costs or capital of up to R250 million. Through this
agreement, Ergo also secured the right to purchase up to 30 Ml of partially treated AMD from TCTA at cost, to reduce Ergo’s
reliance on potable water for mining and processing purposes.
NOTES TO THE CONSOLIDATED FINANCIAL STATEMENTS
continued
for the year ended June 30, 2022
F-43
26 CONTINGENCIES
continued
26.2 CONTINGENT LIABILITY FOR ENVIRONMENTAL REHABILITATION
continued
While the heads of agreement should not be seen as an unqualified endorsement of the state’s AMD solution, and do not affect
our right to either challenge future directives or to implement our own initiatives should it become necessary, it is an encouraging
development.
In view of the limitation of current information for the accurate estimation of a potential liability, no reliable estimate can be made
for the possible obligation.
During the current year, a report was produced regarding the extent of ground water seepage from the Brakpan/Withok tailings
storage facility by an expert. The report suggests that scavenger boreholes be constructed around the dam to deal with the
seepage. The majority of the scavenger boreholes have been constructed and are currently operational and the results are being
monitored. Management is currently investigating a sustainable solution to deal with the seepage post the closure of the mine and
therefore no reliable estimate can be made for the post closure liability.
26.3 CONTINGENCIES REGARDING EKURHULENI METROPOLITAN MUNICIPALITY ELECTRICITY TARIFF
DISPUTE
Refer note 24 PAYMENTS MADE UNDER PROTEST for a full description of the matter.
Contingent liability
The Municipality has issued two summonses for the recovery of arrears it alleges it is owed amounting to R
74.0
31.6
million, respectively. The group supported by the external legal team is confident that there is a high probability that Ergo will be
successful in defending the Summonses. Therefore, there is no present obligation as a result of a past event to pay the amounts
claimed by the Municipality.
Contingent asset
Ergo instituted a counterclaim against the Municipality for the recovery of the surcharges which were erroneously paid to the
Municipality in the bona fide belief that they were due and payable prior to the Main Application of approximately R
43
surcharges were expensed for accounting purposes).
27 FINANCIAL INSTRUMENTS
CLASSIFICATION AND MEASUREMENT OF FINANCIAL ASSETS
Financial assets are not reclassified subsequent to their initial recognition unless the Group changes its business model for
managing financial assets, in which case all affected financial assets are reclassified on the first day of the first reporting period
following the change in business model.
A financial asset shall be measured at amortised cost if both the following conditions are met:
●
flows; and
●
interest on the principal amount outstanding.
An investment is measured at fair value through other comprehensive income if it meets both of the following conditions and is
not designated as at fair value through profit or loss:
●
and
●
amount outstanding.
NOTES TO THE CONSOLIDATED FINANCIAL STATEMENTS
continued
for the year ended June 30, 2022
F-44
27 FINANCIAL INSTRUMENTS
continued
FINANCIAL RISK MANAGEMENT FRAMEWORK
Overview
The Group has exposure to credit risk, liquidity risks, as well as other market risks from its use of financial instruments. This note
presents information about the Group’s exposure to each of the above risks, the Group’s objectives and policies and processes
for measuring and managing risk. The Group’s management of capital is disclosed in note 20. This note must be read with the
quantitative disclosures included throughout these consolidated financial statements.
The board of directors (“
Board
”) has overall responsibility for the establishment and oversight of the Group’s risk management
framework. The Risk Committee (“
RC
”) which is responsible for developing and monitoring the Group’s risk management policies.
The committee reports regularly to the Board on its activities.
The Group’s risk management policies are established to identify and analyse the risks faced by the Group, to set appropriate risk
limits and controls, and to monitor risks and adherence to limits. Risk management policies and systems are reviewed regularly
to reflect changes to market conditions and the Group’s activities. The Group, through its training and management standards
and procedures, aims to develop a disciplined and constructive control environment in which all employees understand their roles
and obligations.
The RC oversees how management monitors compliance with the Group’s risk management policies and procedures, and reviews
the adequacy of the risk management framework in relation to the risks faced by the Group. The RC is assisted in its oversight
role by the internal audit function. The internal audit function undertakes both regular and ad hoc reviews of risk management
controls and procedures, the results of which are reported to the RC.
CREDIT RISK
Credit risk is the risk of financial loss to the Group if a customer or counterparty to a financial instrument fails to meet its contractual
obligations, and arises principally from the Group’s trade and other receivables.
The Group’s financial instruments do not represent a concentration of credit risk due to the exposure to credit risk being managed
as disclosed in the following notes:
NOTE 12 INVESTMENTS IN REHABILITATION AND OTHER FUNDS
NOTE 13 CASH AND CASH EQUIVALENTS
NOTE 15 TRADE AND OTHER RECEIVABLES
Market risk is the risk that changes in market prices, such as commodity prices, foreign exchange rates, interest rates and equity
prices will affect the consolidated profit or loss or the value of its financial instruments. The objective of market risk management
is to manage and control market risk exposures within acceptable parameters, while optimising returns.
Additional disclosures are included in the following note:
NOTE 4 REVENUE
Other market risk
Additional disclosures are included in the following note:
NOTE 25 OTHER INVESTMENTS
Fluctuations in interest rates impact on the value of short-term cash investments and financing activities, giving rise to interest
rate risk. In the ordinary course of business, the Group receives cash from its operations and is obliged to fund working capital
and capital expenditure requirements. This cash is managed to ensure surplus funds are invested in a manner to achieve
maximum returns while minimising risks. Lower interest rates result in lower returns on investments and deposits and also may
have the effect of making it less expensive to borrow funds. Conversely, higher interest rates result in higher interest payments
on loans and overdrafts.
Foreign currency risk
The Group enters into transactions denominated in foreign currencies, such as gold sales denominated in US dollar, in the ordinary
course of business The Group holds cash denominated in a foreign currency. This exposes the Group to fluctuations in foreign
currency exchange rates.
NOTES TO THE CONSOLIDATED FINANCIAL STATEMENTS
continued
for the year ended June 30, 2022
F-45
27 FINANCIAL INSTRUMENTS
continued
Liquidity risk is the risk that the Group will not be able to meet its financial obligations as they fall due. The Group’s approach to
managing liquidity is to ensure, as far as possible, that it will always have sufficient liquidity to meet its liabilities when due, under
both normal and stressed conditions, without incurring unacceptable losses or risking damage to the Group’s reputation.
The Group ensures that it has sufficient cash on demand to meet expected operational expenses, including the servicing of
financial obligations; this excludes the potential impact of extreme circumstances that cannot reasonably be predicted, such as
natural disasters.
28 RELATED PARTIES
Disclosures are included in the following notes:
NOTE 5.1 COST OF SALES
NOTE 5.3 ADMINISTRATION EXPENSES AND OTHER COSTS
NOTE 16 TRADE AND OTHER PAYABLES
NOTE 19.3 TRANSACTIONS WITH KEY MANAGEMENT PERSONNEL
NOTE 21 EQUITY
NOTE 22 INTEREST IN SUBSIDIARIES
29 SUBSEQUENT EVENTS
There were no significant subsequent events between the year-end reporting date of June 30, 2022 and the date of issue of these
financial statements other than described below and included in the preceding notes to the consolidated financial statements.
Declaration of dividend
On August 24 2022, the Board declared a final dividend for the year ended June 30, 2022 of
40
amounting to R
342.0
Receipt of COVID-19 insurance claim
During September and October, 2022, a total amount of R
31.7
Conditional shares granted
On 19 October 2022,
4,922,751
term incentive scheme. These are expected to vest on 19 October 2025. The number of conditional shares granted includes those
granted to directors and prescribed officers as follows:
Number of conditional
shares awarded
Executive directors
D J Pretorius
799,595
A J Davel
425,680
Prescribed officers
W J Schoeman
425,680
E Beukes
57,100
95
ITEM 19. EXHIBITS
1.1
(1)
Memorandum of Association of DRDGOLD Limited.
1.2
(6)
Articles of Association of DRDGOLD Limited, as amended on November 8, 2002.
1.3
(1)
Excerpts of relevant provisions of the South African Companies Act.
1.5
(9)
Memorandum of Incorporation, as amended on November 30, 2012.
2.1
(1)
Excerpts of relevant provisions of the Johannesburg Stock Exchange Listings Requirements.
2.2
(4)
Indenture between DRDGOLD Limited, as Issuer, and The Bank of New York Mellon, as Trustee, dated November
12, 2002.
4.1
(2)
Deposit Agreement among DRDGOLD Limited, The Bank of New York Mellon as Depositary, and owners and
holders of American Depositary Receipts, dated as of August 12, 1996, as amended and restated as of October 2, 1996,
as further amended and restated as of August 6, 1998, as further amended and restated July 23, 2007.
4.2
(3)
Form of Non-Executive Employment Agreement.
4.3
(3)
Form of Executive Employment Agreement.
4.4
(4)
Agreement between DRDGOLD Limited and Rand Refinery Limited, dated October 12, 2001.
4.5
(12)
Local Mine Bullion Refining Agreement between DRDGOLD Limited and Rand Refinery Limited, dated June 27,
2018.
4.9
(8)
Sale of Shares and Claims Agreement entered into by Village Main Reef Limited (“Village”), DRDGOLD Limited
(“DRDGOLD”) (“Seller”), Business Venture Investments No 1557 Proprietary Limited (“Purchaser”) and
Blyvooruitzicht Gold Mining Company Limited (“Blyvoor”) dated February 11, 2012.
4.10
(9)
Heads of Agreement entered into by Trans -Caledon Tunnel Authority (“TCTA’), Ergo Mining Operations
Proprietary Limited (“EMO”), East Rand Proprietary Mines Limited (“ERPM”) and Crown Gold Recoveries
Proprietary Limited (“CGR”) (collectively CGR, EMO and ERPM are called “the Ergo Group”) dated November
28, 2012.
4.13(11)
Settlement Agreement between DRDGOLD Limited ("DRDGOLD") and VMR Gold Investments 02 Proprietary
Limited ("VMR Gold") dated May 28, 2015.
8.1(13)
10.1(12)
DRD Exchange Agreement entered into by DRDGOLD Limited (“DRDGOLD”) and Sibanye Gold Limited
10.2(12)
Sibanye-Stillwater Exchange Agreement entered into by Sibanye Gold Limited and K2017449061 (South Africa)
Proprietary Limited (to be renamed WRTRP Proprietary Limited) and including DRDGOLD Limited
(“DRDGOLD”)
10.3(12)
DRD Guarantee issued by DRDGOLD Limited (“DRDGOLD”) to and in favor of Sibanye Gold Limited.
95
ITEM 19. EXHIBITS
10.5
(12)
Closing and Amending Agreement, dated 20 July 2018, among Sibanye Gold Limited, WRTRP Proprietary Limited
and DRDGOLD Limited; each of the following annexures are incorporated by reference to Sibanye-Stillwater's
Schedule 13-D, Exhibit 99.5 filed with the Securities and Exchange Commission on July 31, 2018
Annexure A — Approval of Financial Surveillance Department of SARB;
Annexure B — JSE Approval of DRD Circular;
Annexure C — TRP Approval of DRD Circular;
Annexure D — Approval in Terms of Competition Act;
Annexure E — Press Announcement Confirming Approval of DRD Shareholders;
Annexure F — Environmental Authorisations and Waste Management Licences;
Annexure G — Confirmation of VAT Registration of Issuing Party;
Annexure H — Lender’s Consent in Terms of the Rand Revolving Credit Facility; and
Annexure I — Employees of the Business as at the Delivery Date of the Closing and Amending Agreement.
10.6
(12)
Revolving Credit Facility.
10.8
(13)
10.9
(14)
12.1
(15)
12.2
(15)
13.1
(15)
13.2
(15)
16.1
(15)
96.1
(15)
96.2
(15)
101.INS
(15)
XBRL Instance Document
101.SCH
(15)
XBRL Taxonomy Extension Schema Document
101.CAL
(15)
XBRL Taxonomy Extension Calculation Linkbase Document
101.DEF
(15)
XBRL Taxonomy Extension Definition Linkbase Document
101.LAB
(15)
XBRL Taxonomy Extension Label Linkbase Document
101.PRE
(15)
XBRL Taxonomy Extension Presentation Linkbase Document
___________
97
ITEM 19. EXHIBITS
(1)
(2)
333-140850
) on Form F-6.
(3)
(4)
(5)
(6)
(7)
(8)
(9)
(10)
(11)
(12)
(13)
(14)
(15)
98
SIGNATURES
authorized the undersigned to sign this annual report on its behalf.
DRDGOLD LIMITED
By:
/s/ D.J. Pretorius
D.J. Pretorius
Chief Executive Officer
By:
/s/ A.J. Davel
A.J. Davel
Chief Financial Officer
Date: October 28, 2022