
HARMONY GOLD MINING COMPANY LIMITED
Randfontein Office Park Cnr Main Reef Road and Ward Avenue, Randfontein 1759 | PO Box 2, Randfontein, 1760 Johannesburg South Africa | T +27 11 411 2000 F +27 11 411 Wwww.harmony.co.za | NYSE trading symbol HMY JSE trading symbol HAR |
UNITED STATES SECURITIES
AND EXCHANGE COMMISSION
DIVISION OF CORPORATION FINANCE
100 F STREET, NE
WASHINGTON, D.C.
20549
11 May 2011
| FOR ATTENTION: | MARK WOJCIECHOWSKI AND JOHN CANNARELLA | |
| STAFF ACCOUNTANTS | ||
| RE: | Harmony Gold Mining Company Limited | |
| Form 20-F for Fiscal Year Ended June 30, 2010 | ||
| Filed October 25, 2010 | ||
| File No. 1-31545 | ||
Dear Sirs:
Reference is made to the Staff’s comment letter dated April 1, 2011 in respect of the Harmony Gold Mining Company Limited (the “Company”) Form 20-F for the year ended June 30, 2010. Set forth below in detail is the response to the Staff’s comment, which follows the text of the comment in the Staff letter:
Form 20-F for Fiscal Year Ended June 30, 2010
Operating and Financial Review and Prospects, page 88
Critical Accounting Policies and Estimates, page 88
Carrying Value of Goodwill, page 89
| 1. | We note you consider the testing of goodwill for impairment to be a critical accounting policy. We further note your disclosure that the recoverable amount is the higher of an asset’s fair value less cost to sell and value in use. With respect to impairment testing of goodwill allocated to Phakisa, address the following points, which we would regard as consistent with the guidance in Item 303(a)(3)(ii) of Regulations S-K: |
| a) | Clarify if the recoverable amount relates to fair value less costs to sell or value in use; |
| b) | Tell us the percentage by which the recoverable amount of your Phakisa cash generating unit exceeded the carrying value as of the date of your most recent test; |
| c) | Include a description of the methods and key assumptions used and how the key assumptions were determined; |
| Directors: | PT Motsepe* (Chairman), GP Briggs (Chief Executive), HO Meyer (Financial Director), HE Mashego (Executive Director), F Abbott* JA Chissano*#, FFT De Buck*, Dr CM Diarra*##, KV Dicks*, Dr DS Lushaba*, CE Markus*, MJ Motloba*, M Msimang*, D Noko*, CML Savage*, AJ Wilkens* | |
| *Non-Executive;#Mozambican; *##US/Mali Citizen | ||
| Secretary: | iThemba Governance and Statutory Solutions (Pty) Ltd | |
| Registration Number: 1950/038232/06 | ||
| d) | To the extent possible, include specific details about the degree of uncertainty associated with key assumptions used to measure the recoverable amount of your Phakisa cash generating unit; |
| e) | Include a description of potential events and changes in circumstances that could reasonably be expected to negatively affect the key assumptions used to measure the recoverable amount of your Phakisa cash generating unit; and |
| f) | Provide any additional information that you believe would offer greater precision about the amount and likelihood of potential impairment. |
If you conclude and disclose that there is no significant risk of failing the goodwill impairment test for your Phakisa cash generating unit, we would not regard disclosure of the information outlined in the various points above to be necessary.
Response: The Company acknowledges the Staff’s comment regarding the testing of goodwill allocated to Phakisa and has addressed each point below:
| a) | On a supplemental basis, the Company wishes to advise the Staff that the recoverable amount of the Phakisa cash generating unit relates to the fair value less costs to sell (“FVLCTS”). FVLCTS is generally used as a basis for estimating the recoverable amount of the Company’s long-lived assets and Cash Generating Units (“CGUs”) due to the restrictions IAS 36Impairment of Assets (“IAS 36”) impose around future capital expenditures and future cost savings under a value in use (“VIU”) method. By their nature, mining operations are capital intensive and almost always ‘developing’ in nature. |
| b) | On a supplemental basis, the Company wishes to advise the Staff that the recoverable amount of the Phakisa CGU exceeded the carrying value as of the date of its most recent impairment test, being June 30, 2011, by 35%. |
| c) | On a supplemental basis, the Company wishes to advise the Staff that the discounted cash flow method for each CGU (operating shaft, along with allocated common assets) is generally used in the determination of FVLCTS of such cash generating unit. The key assumptions determining the FVLCTS of the mining assets are the quantities of recoverable minerals, the expected gold price (considering current and historical prices, price trends and related factors), exchange rates, production levels and the cash costs of production. These assumptions are consistent with the annual life-of-mine plans. The term “recoverable minerals” refers to the estimated amount of gold that will be obtained from reserves and resources and all related exploration stage mineral interests (except for other mine-related exploration potential and greenfields exploration potential) after taking into account losses during ore processing and treatment. Estimates of recoverable minerals from such related exploration stage mineral interests are risk adjusted based on the Company’s relative confidence in such materials. In determining the gold price to be used, the Company assesses the long-term views of several reputable institutions on the gold price and based on this, derive the gold price. Exchange rates are determined in a similar manner using market participant assumptions. The life-of-mine plans are based on the proved and probable reserves as included in the Reserve Declaration, which are determined in terms of SAMREC, JORC and Industry Guide 7, as well as resources where the Company has high confidence in the ore-body and economical recovery of gold, based on historic and similar geological experience. Future cash flows are discounted to their present value using a post tax discount rate that reflect current market assessments of the time value of money and risk specific to the asset. The specific assumptions are disclosed in (d) below. |
| d) | Points (d), (e) and (f) are considered collectively in that they relate to the degree of uncertainty pertaining to the assumptions and precision thereof. During the year under review, the Company calculated the recoverable amounts (generally FVLCTS) based on the updated life of mine plans, a gold price of R275 000 per kilogram (US$1 050 per ounce) and a post-tax real discount rate, which ranges between 5.92% and 10.72% depending on the asset . Cash flows used in the impairment calculations were based on life-of-mine plans which exceeded five years for the majority of the mines. Factors affecting the estimates include: |
| • | changes to proved and probable ore reserves; |
| • | economical recovery of resources; |
| • | the grade of the ore reserves may vary significantly from time to time; |
| • | review of strategy; |
| • | differences between actual commodity prices and commodity price assumptions; |
| • | unforeseen operational issues at the mines; and |
| • | changes in capital, operating mining, processing and reclamation costs. |
The relevant disclosure on this issue can be found in the following items:
Item 5. “Operating and Financial Review and Prospects – Critical Accounting Policies and Estimates – Impairment of Property, Plant and Equipment, - Carrying Value of Goodwill.”
Item 18: “Financial Statements”, Accounting policies - Note 2.8 “Impairment of non-financial assets”, Critical accounting estimates and judgements - Note 3.1“Impairment of mining assets”, - Note 3.8 “Impairment of goodwill’, - Note 3.11 “Gold reserves and resources”.
The Company does not believe any additional information would offer greater precision about the amount and likelihood of potential impairment of the Phakisa cash generating unit.
Since there is no significant risk of failing the goodwill impairment test for the Phakisa cash generating unit at 30 June 2010, the Company will monitor the adequacy of its disclosures around impairment in future filings based on the risk of failing the goodwill impairment test at the end of each reporting period. If there continues to be no significant risk of failing the goodwill impairment test at the end of the reporting period, the Company will modify its future filings to disclose that no such significant risk exists.
Cost Control, page 95
| 2. | Your disclosure here, and within your risk factor discussion on page eight, explains that you expect your cash cost to decrease, and in some cases to decrease significantly. Given the significant increase in cash costs per ounce experienced from fiscal 2009 to 2010, the existing trend of increasing cash cost per ounce over the prior five years, and your expectation of an approximately 25% increase in electricity tariffs in South Africa, please modify to disclose the specific reasons you expect cash costs and cash cost per ounce to decrease. In doing so, please tell us if you have achieved such expectations during fiscal 2011. |
Response: The Company acknowledges the Staff’s comment regarding the expected decrease in cash costs and cash costs per ounce. On a supplemental basis, the Company wishes to advise the Staff that the expectedlonger-term decrease in cash costs per ounce is primarily as a result of the completion of the major development projects, being Doornkop, Kusasalethu, Phakisa and Hidden Valley. As these operations ramp up to full production in the next three or so years, the volumes mined will increase and reduce the unit cost per ounce. Another factor will be the higher grade that will be mined at these operations in comparison with the existing operations, which will increase the number of ounces produced, again reducing the unit cost per ounce. Management expects a reduction in overall real cash costs as a result of the closure of loss making shafts such as Merriespruit 1 & 3 shafts. This will however be offset by the increased production cost from the development projects. Management will continue with thorough review of costs at all operations and ensure that costs are properly managed and within budget.
However, it should be noted that there are risks beyond our control such as safety stoppages, which would result in production being negatively affected while certain costs would still be incurred. This could result in our costs not decreasing as expected. This is discussed in more detail in Item 3. “Key Information. Risk Factors.Given the nature of mining and the type of gold mines we operate, we face a material risk of liability, delays and increased cash costs of production from environmental and industrial accidents and pollution and the nature of our mining operations presents safety and security risks.”
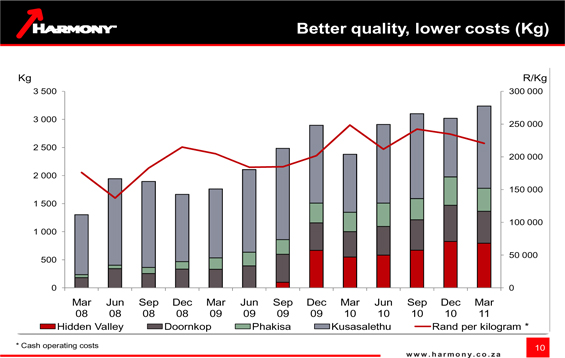
In fiscal 2011, it is expected that cost costs in Rand terms will increase as the development projects continue with their ramp-up to full production. As such cash cost per ounce may not decrease for fiscal
2011, but management expects the cost per ounce to decrease in the future. The Company will disclose the factors discussed above in future filings. It can be noted that the unit cost of our development projects (see the graph below, from our most recent results presentation, and available from our website) has stabilised over the last three quarters in nominal terms and therefore, by implication, in real terms, have already shown a decline over the last three quarters.
Conops, page 95
| 3. | Given the decision to discontinue Conops at the Evander 8 shaft in June 2010, please modify to disclose the expected impact of this decision on your operating costs and production. |
Response: The Company acknowledges the Staff’s comment regarding the expected impact of the discontinuance of Conops at Evander 8 shaft in June 2010 on operating costs and production. On a supplemental basis, the Company wishes to advise the Staff that only the decline production section of Evander 8 was using the continuous operations model to operate. As such, the expected impact on production is expected to be insignificant as the production was constrained by ventilation issues, which resulted in lower than expected production. This resulted in the decision to stop Conops as the benefit of the production did not outweigh the cost of running the shaft for the extended periods, as well as the effect of limited time for maintenance work on the shaft. The personnel from this area were redeployed to other areas where positions needed to be filled as a result of natural attrition. The impact on the operating cost as a result of discontinuation of Conops is expected to result in a decrease as the variable costs for the additional production will no longer be incurred. The Company will disclose the expected impact of this decision in future filings.
Electricity in South Africa, page 95
Cost, page 96
| 4. | We note your disclosure that “Electricity price projections based on the approved tariffs and extrapolations indicate that electricity costs could be as high as 25% of the total cost of production within the next five years.” Please expand this disclosure to explain what percentage of total costs is currently made up of electricity costs, and also provide the dollar amount of current electricity costs, and the expected dollar increase in electricity costs over the next five years. |
Response: The Company acknowledges the Staff’s comment regarding the disclosure to explain what percentage of total costs currently made up of electricity costs. On a supplemental basis, the Company wishes to advise the Staff that 13% of total costs of production is currently made up of electricity costs, the dollar amount of electricity costs for the year ended June 30, 2010 was $147 million and the expected dollar increase in electricity costs over the next five years is expected to be $381 million. This is determined by an average 25% increase in cost for the five years and the increase also takes into account the increased production as the development projects ramp up to and operate at full production capacity. The dollar amount was determined using an exchange rate of $1/R7.00. The Company will disclose the expected impact of electricity costs in future filings.
Results of Operations, page 96
Years Ended June 30, 2010 and 2009, page 96
Production Costs (cash costs), page 97
| 5. | We note you attribute the increase in cash cost per ounce in 2010 to two or more sources. For example, you state that “The increase in cash cost expressed in U.S. dollars per ounce in fiscal 2010 was attributable primarily to the appreciation of the South African Rand against the U.S. dollar, as well as an increase in operating cost and the decrease in ounces produced when compared to fiscal 2009. Annual increases in labor cost as well as inflationary pressures on our consumable stores and energy costs were the main contributors towards a higher operating cost.” When you attribute changes in significant items to more than one factor or element, please ensure you quantify the amount of the change that was contributed by each of these factors. See Section III.D of SEC Release 33-6835 for further guidance. |
Response: The Company acknowledges the Staff’s comment regarding the disclosure of sources resulting in the increase in cash cost per ounce in 2010. On a supplemental basis, the Company wishes to advise the Staff that the increase in cash cost expressed in U.S. dollars per ounce in fiscal 2010 was primarily attributable to the appreciation of the South African Rand against the U.S dollar of 16%, as well as an increase in operating costs of 9% in Rand terms and a decrease in ounces produced of 6% when compared to fiscal 2009. Annual increases in labor costs of 7.5% as well as inflationary pressures on our consumable stores and energy costs, resulting in an increase in costs of 18% and 44%, respectively were the main contributors towards a higher operating cost. The Company will revise its future filings to quantify the amount of changes attributable to each factor when discussing fluctuations in operating costs.
| 6. | Please expand your discussion to provide guidance on whether or not the results of operations are indicative of expected results. The objective should be to provide information about the quality and potential variability of earnings and cash flow, so readers can ascertain the likelihood that past performance is indicative of future performance. See section III of SEC Release 33-8350 for further guidance. |
Response: The Company acknowledges the Staff’s comment regarding whether the results of operations are indicative of expected results. On a supplemental basis, the Company wishes to disclose that where possible, the Company believes it has sought to include its expectations of future performance in its discussion in the Form 20-F. However, as there are a number of factors that influence the future earnings and cash flow of the Company and which are out of the Company’s control, for example market factors such as future gold price and exchange rates, and industry factors such as hazards associated with underground and surface mining, the extent to which the Company is able to provide significant guidance on whether the current results are indicative of the future results is somewhat limited. Accordingly, in order to make the readers aware of material factors, the Company has prioritized many of the risk factors discussed in the beginning of that section to focus on external factors that may affect its expected results.
Notes to the Consolidated Financial Statements, page F-8
Note 3 Critical Accounting Estimates and Judgements, page F-23
Note 3.1 Impairment of Mining Assets, page F-23
| 7. | We note from the disclosure that your recoverable amount was determined using a post-tax real discount rate ranging from 5.92% to 10.72%. Given the guidance provided in IAS 36 paragraph 55 that the discount rate shall be a pre-tax rate, please explain to us the specific reasons you believe use of a post-tax discount rate is appropriate, and in compliance with the accounting guidance provided in IAS 36. |
Response: The Company acknowledges the Staff’s comment regarding the use of a pre-tax rate in determining the recoverable amount of mining assets. On a supplemental basis the Company wishes to disclose that the recoverable amount in question relates to FVLCTS (consistent with the response to comment 1(a) above). In determining a FVLCTS discount rate, the Company has determined a cost of capital in line with the majority of the industry participants, being a post-tax rate, as the discounted cash flow uses assumptions that a market participant would take into account. The Company further notes that applying after-tax discount rates to after-tax cash flows would give a similar result as would be obtained by applying pre-tax discount rates to pre-tax cash flows.
Engineering Comments
Reserves page 28
| 8. | We note you state you apply a cut-off grade to define that portion of a measured and indicated mineral resource that can be converted to a proven and probable reserve. With a view toward disclosure, please tell us the cut-off grade for each of your operations in which you claim a proven or probable reserve. In your response, please include the operating costs used in your cut-off grade calculation. |
Response: The Company acknowledges the Staff’s comment and on a supplementary basis, provides the following table detailing the cut-off grade (metric) and operating costs used in determining the proven and probable reserves for each operation:.
OPERATIONS | Underground operations | Surface and massive mining | ||||||||||||||
GOLD | Cut off grade (cmg/t) | Cut off cost (R/Tonne) | Cut off grade (g/t) | Cut off cost (R/Tonne) | ||||||||||||
SA Underground | ||||||||||||||||
Bambanani | 1 438 | 1 283 | — | — | ||||||||||||
Joel | 702 | 844 | — | — | ||||||||||||
Masimong 5 | 931 | 912 | — | — | ||||||||||||
Phakisa | 572 | 850 | — | — | ||||||||||||
Target | — | — | 5.00 | 993 | ||||||||||||
Tshepong | 836 | 989 | — | — | ||||||||||||
Virginia | 951 | 829 | — | — | ||||||||||||
Doornkop | 619 | 758 | — | — | ||||||||||||
Kusasalethu | 869 | 1 054 | — | — | ||||||||||||
Evander | 1 267 | 1 171 | — | — | ||||||||||||
Evander(below infrastructure) | 638 | 504 | — | — | ||||||||||||
Rand Uranium | 736 | 1 117 | — | — | ||||||||||||
SA Surface | ||||||||||||||||
Kalgold | — | — | 0.700 | 173 | ||||||||||||
Free State Surface | — | — | 0.161 | 21 | ||||||||||||
Evander surface | — | — | 0.196 | 24 | ||||||||||||
Rand Uranium Surface | — | — | 0.328 | 91 | ||||||||||||
| Cut off % Cu | Cut off Cost (Au$/Tonne) | Cut off Grade (g/t) | Cut off Cost (Au$/Tonne) | |||||||||||||
Papua New Guinea | ||||||||||||||||
Hidden Valley | — | — | 0.800 | 20.4 | ||||||||||||
Hamata | — | — | 0.700 | 20.4 | ||||||||||||
Golpu | 0.3 | % | 22.0 | — | — | |||||||||||
SILVER | Cut off Grade (g/t) | Cut off Cost (Au$/Tonne) | ||||||||||||||
Papua New Guinea | ||||||||||||||||
Hidden Valley | — | — | 0.800 | 20.4 | ||||||||||||
COPPER | Cut off % Cu | Cut off Cost (Au$/Tonne) | ||||||||||||||
Papua New Guinea | ||||||||||||||||
Golpu | 0.3 | % | 22.0 | — | — | |||||||||||
MOLYBDENUM | Cut off % Cu | Cut off Cost (Au$/Tonne) | ||||||||||||||
Papua New Guinea | ||||||||||||||||
Golpu | 0.3 | % | 22.0 | — | — | |||||||||||
Notes on Cut off:
1) Surface and massive mining are stated in g/t (g/t is grams of metal per tonne of ore).
2) All SA underground operations are stated in cmg/t (cmg/t is the Reef Channel width multiplied by the g/t which indicates the Gold content within the Reef Channel).
Notes on Cut Off Cost:
Cut off cost refers to the cost in ZAR/Tonne or Au$/Tonne to mine and process a tonne of ore.
Notes on Copper:
Cut off is stated in % Cu
Notes on Golpu:
Cut off is based on 0.3% Copper : Molybdenum and Gold mined as by-products.
| 9. | Please forward to our engineer, as supplemental information and not as part of your filing, the technical documentation pertaining to your Evander and Evander (below infrastructure) operation which establishes the legal, technical, and economic feasibility of the mineralization which you have designated as reserves, pursuant to paragraph (c) of Industry Guide 7. Please provide this information on a CD, formatted as Adobe PDF files. Please also provide the name and phone number for a technical person whom our engineer may call, if he has technical questions about your reserves. |
Response: The Company acknowledges the Staff’s comment and has forwarded the requested information to John Coleman, the Mining Engineer. The name and phone number of the technical person as requested is Jaco Boshoff, who can be reached on +27 11 411 2013.
The Company acknowledges that it is responsible for the adequacy and accuracy of the disclosure in the filings it makes with the Commission. It understands that Staff comments or changes to disclosure in response to Staff comments do not foreclose the Commission from taking any action with respect to the filing and that the Company may not assert Staff comments as a defense in any proceeding initiated by the Commission or any person under the federal securities laws of the United States.
| Yours faithfully |
| /s/ H Meyer |
| H Meyer |
| Chief Financial Officer |