HARMONY GOLD MINING COMPANY LIMITED
Randfontein Office Park Cnr Main Reef Road and Ward Avenue, Randfontein 1759 | PO Box 2, Randfontein, 1760 Johannesburg South Africa | T +27 11 411 2000 F +27 11 411 Wwww.harmony.co.za | NYSE and NASDAQ trading symbol HMY JSE trading symbol HAR |
UNITED STATES SECURITIES
AND EXCHANGE COMMISSION
DIVISION OF CORPORATION FINANCE
100 F STREET, NE
WASHINGTON, D.C.
20549
| FOR ATTENTION: | TIA L. JENKINS | |
| SENIOR ASSISTANT CHIEF ACCOUNTANT | ||
| CC: | SUYING LI | |
| BRIAN BHANDARI | ||
| RE: | Harmony Gold Mining Company Limited | |
| Form 20-F for Fiscal Year Ended June 30, 2012 | ||
| Filed October 29, 2012 | ||
| Comment Letter dated February 27, 2013 | ||
April 5, 2013
Dear Sirs,
Reference is made to the Staff’s comment letter dated February 27, 2013 in respect of the Harmony Gold Mining Company Limited (the “Company”) Form 20-F for the year ended June 30, 2012. Set forth below in detail is the response to the Staff’s comment, which follows the text of the comment in the Staff letter:
Form 20-F for Fiscal Year Ended June 30, 2012
Item 4. Information on the Company, page 19
Harmony’s Mining Operations, page 31
| 1. | We note several mines (e.g. Bambanani, Target operation, etc.) produced ounces of gold prior to the mine being in the production stage. We also note that revenue received from such pre-production was credited to capital expenditures each period. Please confirm in future filings you will revise your disclosure to quantify the dollar impact of such proceeds to your capital expenditures. Please provide us with draft disclosure of your planned changes. |
| Directors: | PT Motsepe* (Chairman), MJ Motloba* (Deputy Chairman), GP Briggs (Chief Executive), F Abbott (Financial Director), HE Mashego (Executive Director), JA Chissano*#, FFT De Buck*, KV Dicks*, Dr DS Lushaba*, CE Markus*, M Msimang*, J Wetton*, AJ Wilkens* | |
| *Non-Executive;#Mozambican | ||
| Secretary: | Riana Bisschoff | |
| Registration Number: | 1950/038232/06 | |
Response: The Company acknowledges the Staff’s comment regarding crediting pre-production revenue to capital expenditure and will revise the disclosure in future filings to quantify the dollar impact of these transactions on our capital expenditure where relevant. The Company proposes to disclose the impact as follows:
During fiscal 2012, 1,157 (2011: 2,894) ounces were produced by Steyn 2 prior to it being considered to be in production. The revenue amounting to US$1.9 million (2011: US$3.9 million) has been credited against capital expenditure as the shaft was not considered to be in commercial production yet. The cost of these ounces has not been included in the cash cost per ounce amount. The calculation of grade also excludes these ounces.
Item 5. Operating and Financial Review and Prospects, page 82
Results of Operations, page 90
b) Depreciation and amortization, page 92
| 2. | We note that your depreciation and amortization expenses increased $17 million in fiscal year 2012 when your proven and probable reserves increased from 41.6 million ounces in 2011 to 52.9 million ounces in 2012 and your gold production decreased from 1.195 million ounces in 2011 to 1.165 million ounces in 2012. Please provide us with, and confirm to us that you will include in future filings, a detailed explanation for the increase in your depreciation and amortization expenses between the periods. |
Response: The Company acknowledges the Staff’s comment on the increase in expenditure for depreciation and amortization. The Company confirms that it will include a detailed explanation for the increase in depreciation and amortization expense in future filings.
The depreciation expense is calculated per operating mine and is based on each operating mine’s reserves, production and carrying value. Therefore the depreciation rate and expense is different for each operating mine. As the newly developed mines build up in production, their production replaces the production from older mines. The carrying values of these newly developed mines are substantially higher than those of the older mines, resulting in a higher depreciation expense.
The proven and probable reserves that were used in the calculation of depreciation and amortization expense for fiscal year 2012 were based on the reserve declaration as at June 30, 2011, being 41.6 million ounces. The Company updates its estimates of proven and probable reserves at the end of each financial year. As set out in note 3.11 to our consolidated financial statements, such changes in reserves have a prospective effect on the depreciation and are applied from the beginning of the new financial year.
During fiscal 2012, depreciation increased by 9% as a result of the build-up at the newly developed mines:
| a) | Increase of US$3.9 million due to Steyn 2 coming into commercial production which was previously under construction. At Target 3, depreciation increased by US$1.9 million due to the fact that it was in production for the full fiscal 2012 and only in production for the last three months of fiscal 2011. |
| b) | Increases of tons mined at Doornkop, Phakisa and Target 1 as part of their production build-up resulted in increases of US$10.8 million, US$3.5 million and US$2.9 million. |
These increases were partially offset by decreases at certain operations resulting from lower production year on year.
2
Item 18. Consolidated Financial Statements
Notes to the Consolidated Financial Statements, page F-8
2 Accounting policies, page F-8 /
2.5 (vi) Depreciation and amortization of mining assets, page F-12
| 3. | Your accounting policy indicates that, in some instances, you include mineral resources other than the proven and probable reserves in the unit-of-production calculation for determining the depreciation and amortization of your mining assets, when management has high level of confidence that such further resources will be converted into reserves. To enhance our understanding of your accounting policy, please: |
| • | Tell us the percentage and amount of measured, indicated and inferred resources that you include in the portion of mineralization expected to be classified as reserves, and tell us whether there have been any changes to your policy; and |
| • | Provide us with your history of converting resources into proven and probable reserves. |
| • | Tell us the number of years of historical data that you have used to estimate your projected rates of converting resources to proven and probable reserves. |
| • | Explain to us whether or not and why historical trends are indicative of future conversion rates. |
| • | If you have a consistent track record of converting resources to proven and probable reserves, please explain the reasons for your success, given that the information you have about resources is significantly less than the information and supporting technical data that you have about proven and probable reserves. |
| • | Tell us the extent to which resources are currently accessible and the extent to which additional capital improvements are required to convert and gain access to resources. |
Response: The Company acknowledges the Staff’s comment on the depreciation and amortization and has addressed the matter below:
The preparation of consolidated financial statements in compliance with International Financial Reporting Standards as issued by the International Accounting Standards Board requires management to assess the useful life of each of its operations separately based on the characteristics of each deposit and select the reserve/resource base that best reflects the useful life of the operation. On a supplemental basis, and consistent with its accounting policy disclosures in note 2.5(vi), the Company wishes to advise the Staff that as a starting point, it generally considers the use of proven and probable reserves for the calculation of depreciation and amortisation expense to be the best estimate of the life of the respective mining operation. Therefore, for most of the Company’s operations, we use proven and probable reserves only, excluding all inferred resources as well as any indicated and measured resources that have not yet been deemed economically recoverable.
However, at certain of the Company’s operations, proven and probable reserves alone may not provide a realistic indication of the useful life of the mine and related assets. In these instances, management may be confident that certain inferred resources will eventually be converted into reserves, and are approaching economic decisions affecting the mine on this basis, but has not yet done the necessary development and geological drill work to improve the confidence to the required levels to designate them formally as reserves. As discussed further below, there has been a consistent trend of converting resources included in the life-of-mine plans into reserves in these instances. During the periods presented in the Company’s Form 20-F for the fiscal year ended June 30, 2012, this occurred mainly in the cases of the Doornkop South Reef and Masimong 5 shaft, where management, in addition to proven and probable reserves, also included certain, but not all, of the inferred resources associated with these properties as the best estimate of the pattern in which the asset’s future economic benefits are expected to be consumed by the entity, as required by paragraph 60 of IAS 16,Property, Plant and Equipment. If only proven and probable reserves had been included in calculating the depreciation expense for these two operations, based on the trend of production, Doornkop South Reef would have been fully depreciated in approximately six years and Masimong in nine years. However, both these operations currently have longer estimated lives of 16 and 13 years, respectively. A steady conversion of resources included in
3
life-of-mine plans to reserves can be seen in the reconciliation of proven and probable reserves for the three fiscal years ended June 30, 2012 (table below). Therefore it is considered appropriate that certain of the resources should be included in calculating the depreciation expense, so as to better reflect the utilisation of the assets as the economic benefit is consumed. This avoided a significant acceleration of depreciation expense early on in the life of these operations (in Doornkop South Reef’s case, while building up to full production), with smaller charges later on.
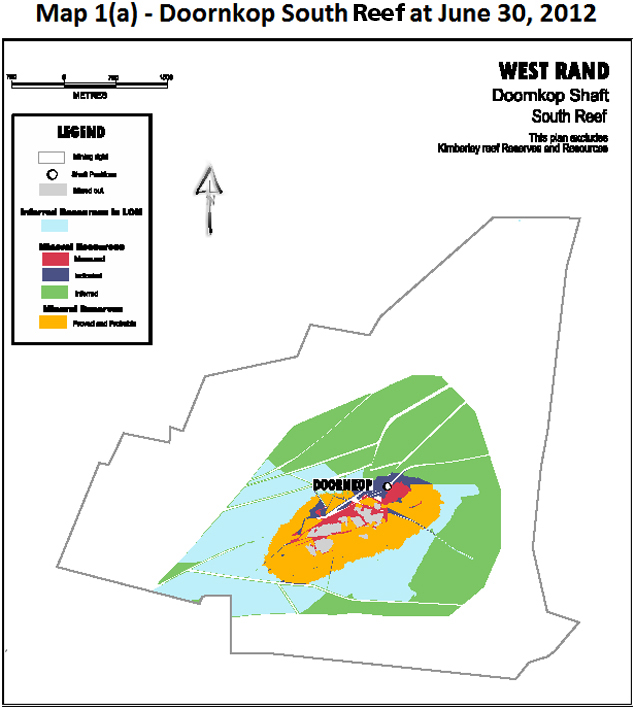
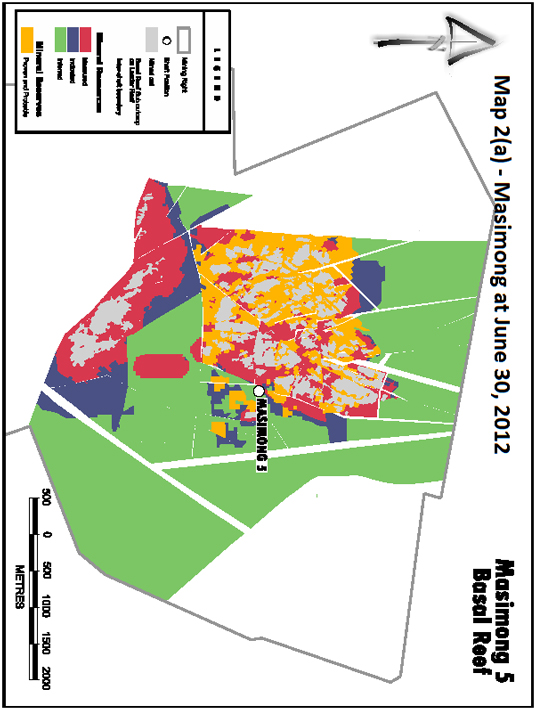
At the Company’s Doornkop South Reef and Masimong operations, management only includes the proven and probable reserves and the inferred resources that have been included in the life-of-mine plan. To be included in the life-of-mine plan, resources need to be above the cut-off grade set by management, which means that the resource can be economically mined and is therefore commercially viable. This consistent systematic method for inclusion in the life-of-mine plan takes management’s view of the gold price, exchange rates as well as cost inflation into account. The Board of Directors and management approach economic decisions affecting these operations based on the life-of-mine plans that include such resources. Capital expenditure necessary to access these resources has also been included in the cash flow projections for the life-of-mine plan and have been taken into account when determining the pattern of depreciation charge for these operations. In declaring the resource, management would have had to obtain a specified level of confidence of the existence of the resource through drilling as required by the South African Code for Reporting Exploration Results, Mineral Resources and Mineral Reserves (“SAMREC”). The surface drilling spread (surface boreholes) and underground advance drilling for Doornkop and Masimong have indicated that the inferred resources included in the life-of-mine plan exist and can be economically mined with a high level of confidence in the orebodies. The surface boreholes have been used to determine the existence of the orebodies as well as the location of major geological structures and the mineralogy of the orebodies. This can be seen in the maps below, which indicate the various levels of reserves and resources as at June 30, 2012 (Map 1(a) and Map 2(a)). However, since further drilling and underground development necessary to convert the resources to reserves has not been done yet, they remain in the resource category. Geological drilling can only be done as and when the underground infrastructure is advanced.
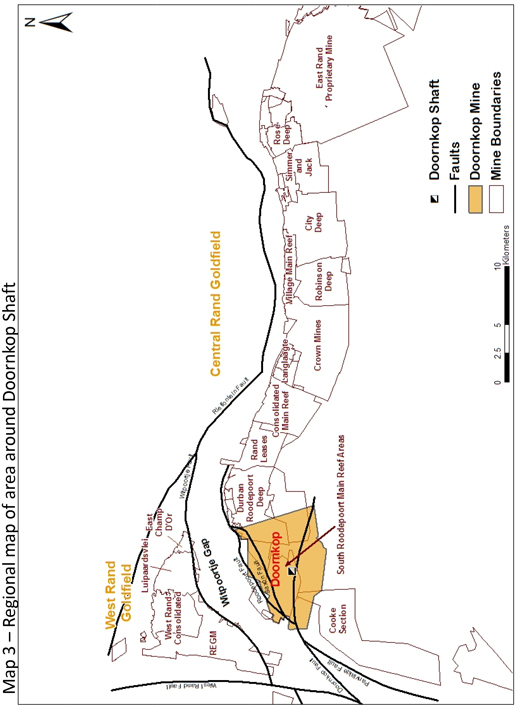
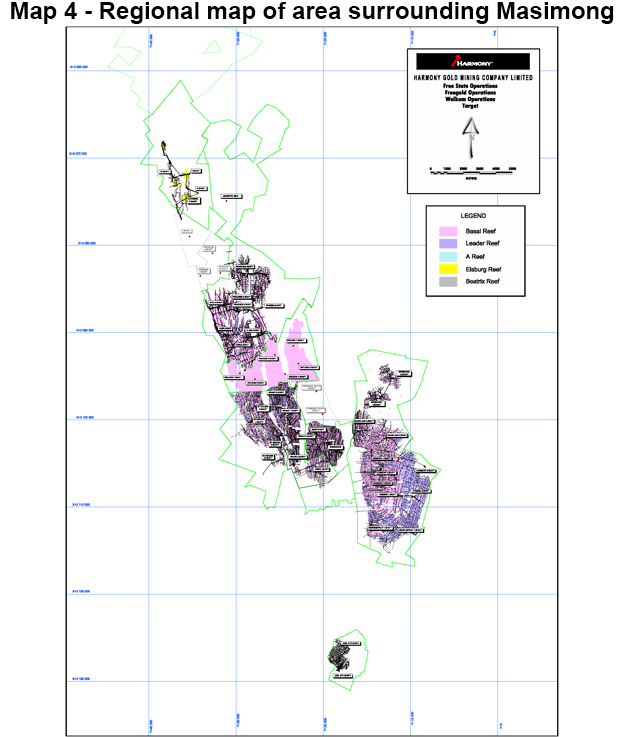
Additional confidence in existence and commercial viability is obtained from the fact that the orebodies surrounding these operations have already been mined over many years in the past. We mine continuations of the same reefs that these operations exploited. See Map 3 and Map 4 below for the regional maps of the areas surrounding these operations. At Masimong and Doornkop South Reef, the geological setting of the orebodies are such that there is an even distribution of the mineralized content, and reliance can be placed on the comparable results of the surrounding mines. As these results are already known, simulations of the expected formations can be done with a reasonable degree of accuracy. Although this information will not allow a conversion from resource to reserve, it does provide management with valuable information and increases the level of confidence in existence and grade expectation.
4
In determining the resources to be used in calculating the depreciation expense, management does not rely on estimates of the projected rates of converting resources to proven and probable reserves, but uses the resources that have been included in the life-of-mine plan. The resources that are included in the life-of-mine plan include only those measured and indicated resources that can be economically extracted (that is, proven and probable reserves) as well as certain of the inferred resources that management has sufficient confidence in, and which can also be economically extracted. As the life-of-mine plan and the associated reserves and resources are revised annually, the amount of resources included in the depreciation calculation also changes annually. The relevant statistics for these shafts for the past four years are as follows:
Doornkop South Reef
| As at June 30, | ||||||||||||||||||
| 2012 | 2011 | 2010 | 2009 | |||||||||||||||
| A | Years (life-of-mine plan) | 16 | 14 | 16 | 15 | |||||||||||||
| B | Reserves (Tonnes million) | 4.9 | 3.2 | 2.1 | 1.3 | |||||||||||||
| C | Resources (Tonnes million) | 26.4 | 23.1 | 22.9 | 24.4 | |||||||||||||
| D | • Total inferred resources (Tonnes million) | 21.2 | 19.2 | 20.0 | 22.5 | |||||||||||||
| E | v Inferred resources included in life-of-mine plan (Tonnes million) | 13.0 | 13.2 | 13.7 | 14.4 | |||||||||||||
| F | Reserves and resources used in depreciation calculation for the following fiscal year (Tonnes million) [B+E] | 17.9 | 16.4 | 15.8 | 15.7 | |||||||||||||
| G | Percentage reserves to resources (%) [B/C] | 19 | 14 | 9 | 5 | |||||||||||||
| H | Production (Tonnes million mined) | 0.435 | 0.082 | 0.205 | 0.092 | |||||||||||||
Masimong
| As at June 30, | ||||||||||||||||||
| 2012 | 2011 | 2010 | 2009 | |||||||||||||||
| A | Years (life-of-mine plan) | 13 | 12 | 13 | 12 | |||||||||||||
| B | Reserves (Tonnes million) | 6.9 | 6.6 | 7.3 | 5.9 | |||||||||||||
| C | Resources (Tonnes million) | 113.3 | 90.0 | 96.8 | 129.2 | |||||||||||||
| D | • Total inferred resources (Tonnes million) | 91.6 | 74.2 | 79.7 | 100.3 | |||||||||||||
| E | v Inferred resources included in life-of-mine plan (Tonnes million) | 4.5 | 4.6 | 4.4 | 5.5 | |||||||||||||
| F | Reserves and resources used in depreciation calculation for the following fiscal year (Tonnes million) [B+E] | 11.4 | 11.2 | 11.7 | 11.4 | |||||||||||||
| G | Percentage reserves to resources (%) [B/C] | 6 | 7 | 8 | 5 | |||||||||||||
| H | Production (Tonnes million mined) | 0.544 | 0.625 | 0.567 | 0.525 | |||||||||||||
A reconciliation of reserves for the last three fiscal years is provided below. The reconciliation shows a consistent track record of conversion of resources to proven and probable reserves, over and above the consumption through production.
5
Reconciliation of proven and probable reserves for the three fiscal years ended June 30, 2012
Figures are in tonnes (‘000) | Doornkop South Reef | Masimong | ||||||
Opening balance of proven and probable reserves – July 1, 2009 | 1 292 | 5 862 | ||||||
Consumed – 2010 to 2012 | (722 | ) | (1 736 | ) | ||||
Converted from resources | 4 341 | 2 732 | ||||||
Closing balance of proven and probable reserves – June 30, 2012 | 4 911 | 6 858 | ||||||
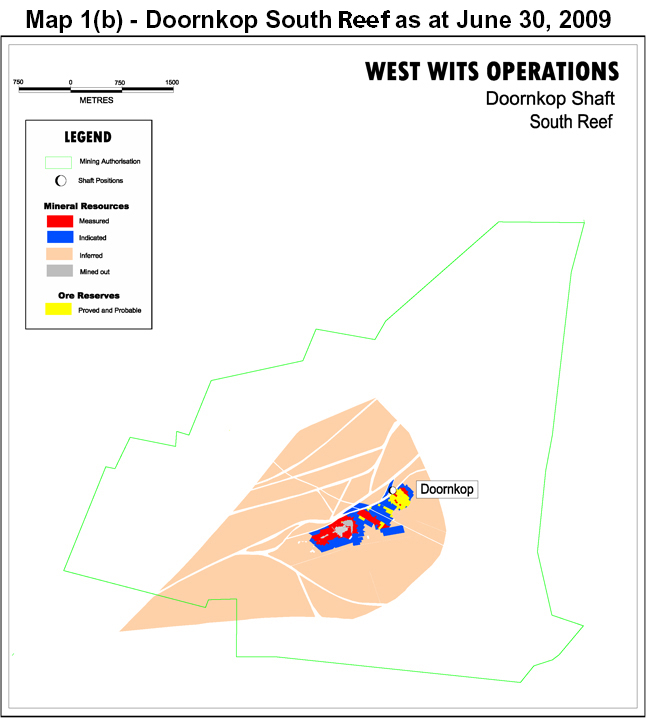
The success of converting resources to reserves (including inferred resources included in the life-of-mine plans, in particular) at these operations can also be seen when comparing the geological information as at June 30, 2012 (Map 1(a) and Map 2(a)) to that as at June 30, 2009 (Map 1(b) and Map 2(b)). During the periods presented, there has been a steady conversion of the inferred resources included in the life-of-mine plan into reserves. In addition, there have been no instances during the periods presented where subsequent drilling or underground development indicated instances of inappropriate inclusion of inferred resources in such life-of-mine plans. As such, management is confident that the inclusion of the resources included in the life-of-mine plan in calculating the depreciation charge is a better reflection of the pattern of consumption of the future economic benefits of these assets than would be achieved by excluding them.
| 4. | Please explain to us why and how you determined that your estimates of resources, such as inferred mineral resources, used to calculate your units of production depreciation are reliable, as contemplated by paragraph 4.41 of the Conceptual Framework for Financial Reporting issued by the International Accounting Standards Board. |
Response: The Company acknowledges the Staff’s comment and the need to make reasonable estimates of the useful lives of its assets in determining depreciation and amortization expense. The Company believes that the inclusion of resources in the instances described in the Company’s response to the Staff’s comment 3 above does not undermine their reliability as contemplated by paragraph 4.41 of the Conceptual Framework for Financial Reporting issued by the International Accounting Standards Board. This is due to management having sufficient knowledge of, and confidence in, the respective orebodies as discussed above in our response to the Staff’s comment 3. The reliability of management’s estimates is supported by the steady conversion of inferred resources included in the life-of-mine plans to reserves. In addition, there have been no instances during the periods presented where subsequent drilling or underground development indicated instances of inappropriate inclusion of inferred resources in such life-of-mine plans. For purposes of reporting the Company’s proven and probable reserves in its Annual Report on Form 20-F, such resources will only be included in reserves once the drilling necessary to convert to such resources to reserves has been completed.
| 5. | To better understand the effect of resources on your depletion expense, please provide us with the amount of depletion expense for each period presented if (i) only proven and probable reserves is included in the depreciable base (i.e., excluding all measured and indicated and all inferred mineral resources from the depreciable base) and only proven and probable reserves plus the portion of measured and indicated resources expected to be converted to mineral reserves (i.e., excluding all inferred mineral resources from the depreciable base). |
6
Response: The depletion expense for each of the periods presented would have been the following had we only included (i) only proven and probable reserves is included in the depreciable base (i.e., excluding all measured and indicated and all inferred mineral resources from the depreciable base) and (ii) only proven and probable reserves plus the portion of measured and indicated resources expected to be converted to mineral reserves (i.e., excluding all inferred mineral resources from the depreciable base):
Figures in US$ millions
Year | Depreciation and amortization expense as reported in Annual Report on Form 20F | Depreciation and amortization expense based on proven and probable reserves only (note 1) | Depreciation and amortization expense based on only proven and probable reserves plus measured and indicated resources expected to be converted to reserves (note 1) | |||||||||
2012 | 247 | 273 | 273 | |||||||||
2011 | 230 | 239 | 239 | |||||||||
2010 | 166 | 215 | 215 | |||||||||
Note 1: Proven and probable reserves are a subset of measured and indicated resources, that is, the measured and indicated resources that can be economically extracted are classified as proven and probable reserves. Inferred resources are not classified as reserves due to the level of geoscientific knowledge and confidence. Further conversion of measured and indicated resources would require changes in assumptions such as the increase in gold price and a lower cut-off grade in order to ensure they can be mined economically, before they can be included in the life-of-mine plan. Therefore, no measured and indicated resources that have not yet been classified as reserves are included in the life-of-mine plans. As such, there is no difference currently between the two calculations as requested by the Staff.
The Company acknowledges that it is responsible for the adequacy and accuracy of the disclosure in the filings it makes with the Commission. It understands that staff comments or changes to disclosure in response to staff comments do not foreclose the Commission from taking any action with respect to the filing and that the Company may not assert staff comments as a defense in any proceeding initiated by the Commission or any person under the federal securities laws of the United States.
Yours faithfully
F Abbott
Financial Director
7