UNITED STATES
SECURITIES AND EXCHANGE COMMISSION
Washington, D.C. 20549
Form 6K
REPORT OF FOREIGN PRIVATE ISSUER
PURSUANT TO RULE 13a16 OR 15d16 UNDER THE
SECURITIES EXCHANGE ACT OF 1934
For November 9, 2020
Harmony Gold Mining Company Limited
Randfontein Office Park
Corner Main Reef Road and Ward Avenue Randfontein, 1759
South Africa
(Address of principal executive offices)
*-
(Indicate by check mark whether the registrant files or will file annual reports under cover of Form 20 F or Form 40F.)
Form 20F ☒ Form 40F ☐
(Indicate by check mark whether the registrant by furnishing the information contained in this form is also thereby furnishing
the information to the Commission pursuant to Rule 12g32(b) under the Securities Exchange Act of 1934.)
Yes ☐ No ☒
Harmony Gold Mining Company Limited
Incorporated in the Republic of South Africa
Registration number: 1950/038232/06
JSE share code: HAR NYSE share code: HMY
ISIN: ZAE000015228
(“Harmony” or “Company”)
OPERATIONAL UPDATE FOR THE THREE MONTHS ENDED 30 SEPTEMBER 2020
STRONG OPERATIONAL PERFORMANCE BOOSTS PRODUCTION PROFIT, INCREASES OPERATING FREE CASH FLOW MARGIN
TOTAL GOLD PRODUCTION INCREASED BY 38%
FREE OPERATING CASH FLOW MARGIN INCREASED BY 20%
NET DEBT TO EBITDA REDUCED FROM 0.8X TO 0.5X NORMALISED#
#Net debt to EBITDA ratio normalised to exclude the capital raise.
Johannesburg. Monday, 9 November 2020. Harmony Gold Mining Company Limited ("Harmony" or "the Company") is pleased to report a strong operational performance in the first quarter of financial year 2021 ("FY21").
"A solid operational performance, further aided by the gold price, has significantly strengthened our balance sheet, allowing us to achieve an operating free cash flow margin of 20%. We are in the process of integrating our newly acquired assets in line with our growth strategy and believe that we will be able to unlock further value through increased ounces and various surface and service synergies", said Peter Steenkamp, chief executive officer of Harmony.
OPERATING RESULTS
Quarter September 2020 | Quarter June 2020 | Quarter-on- quarter variance % | Quarter September 2019 | Comparative quarter-on- quarter* variance % | ||
| Gold produced | kg | 9 758 | 7 049 | 38 | 11 231 | (13) |
| oz | 313 725 | 226 632 | 38 | 361 085 | (13) | |
| Underground grade | g/t | 5.31 | 5.72 | (7) | 5.26 | 1 |
| Gold price received | R/kg | 922 398 | 875 341 | 5 | 683 572 | 35 |
| US$/oz | 1 698 | 1 518 | 12 | 1 449 | 17 | |
| Cash operating costs | R/kg | 627 830 | 699 829 | 10 | 484 216 | (30) |
| US$/oz | 1 156 | 1 213 | 5 | 1 026 | (13) | |
| All-in sustaining costs | R/kg | 728 465 | 783 336 | 7 | 589 597 | (24) |
| US$/oz | 1 341 | 1 358 | 1 | 1 250 | (7) | |
| Production profit | R million | 2 782 | 1 251 | 122 | 2 384 | 17 |
| US$ million | 165 | 70 | 136 | 162 | 2 | |
| Exchange rate | R/US$ | 16.90 | 17.94 | (6) | 14.68 | 15 |
*September 2020 quarter and September 2019 quarter comparison.
Quarter-on-quarter operating results tables have been included on pages 4 to 5 (R/metric) and 6 to 7 (US$/imperial).
This operational update is the responsibility of the directors and has not been reviewed or audited by the Company’s auditors. Detailed financial and operational results are provided on a six-monthly basis at the end of December and June.
SAFETY
The Company continues to be vigilant in its management and response to the COVID-19 pandemic at all of its operations and to adhere to the strict protocols put in place.
Regrettably, three Harmony employees died in work-related incidents during the September 2020 quarter. Harmony has adopted global best practice safety standards, developed and implemented a four-layered risk management based approach, introduced modernised safety systems and intensified its focus on leadership development and training to address behaviour.
OPERATIONAL PERFORMANCE
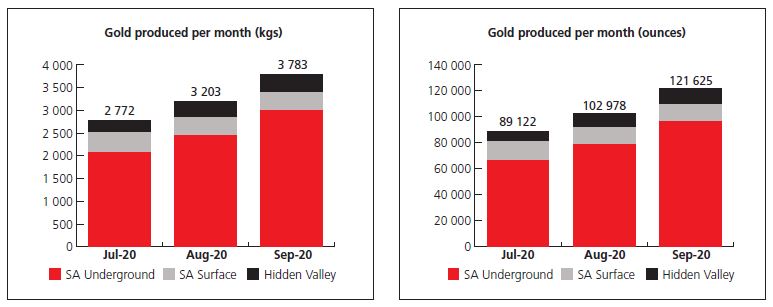
Quarter-on-quarter, production increased by 38% from 7 049kg (226 632oz) to 9 758kg (313 725oz), with a 64% increase in gold production at the South African underground operations from 4 578kg (147 187oz) in the June 2020 quarter to 7 528kg (242 029oz) at the end of September 2020. This is mainly as a result of all underground operations resuming work at 100% of capacity after the COVID-19 lockdown restrictions were lifted.
During the COVID-19 lockdown, Harmony mined higher grade panels, which impacted the quarter-on-quarter performance of the South African underground operations and resulted in a 7.2% decrease quarter-on-quarter. The September 2020 quarter reflects a return to a more normalised grade of 5.31g/t, which is more or less in line with the underground recovered grade achieved in the comparable period in September 2019.
Gold production at Hidden Valley decreased by 19% quarter-on-quarter to 983kg (31 604oz) from 1 212kg (38 967oz). Production was impacted by a planned major shut down of the processing plant as well as a result of lower mined grade as the mine transitioned between various stages of the open pit. The key focus in FY21 will be to safely mine the current cutback to produce between 172 300 to 177 700 ounces, while starting the next planned pushback of the main Hidden Valley pit.
Operational excellence boosts production
All-in sustaining costs ("AISC") were 7% lower at R728 465/kg (US$1 341/oz) compared to R783 336/kg (US$1 358/oz) in the previous quarter, due to higher production.
Harmony's operating free cash flow almost tripled quarter-on-quarter to R1.8 billion, compared to R603 million in the previous quarter, due to higher production and a 5.4% increase in the R/kg price of R922 398/kg (US$1 698/oz, 12% higher) quarter-on- quarter. The Company's operating free cash flow margin doubled in the same period, from 10% to 20%.
BALANCE SHEET AND LIQUIDITY
Stronger production cash flows enabled us to reduce our net debt to EBITDA ratio from normalised 0.8x in June 2020 to 0.5x by quarter end. Before normalising for the equity placement, the ratio stood at 0.2x at 30 June 2020. Net debt at 30 September 2020 was at R3.25 billion (US$194 million) after paying for the newly acquired assets.
In June 2020, Harmony raised US$200 million (R3 466 million) by way of a share placement to fund the US$200 million cash portion of the consideration price relating to the acquisition of the Mponeng mine and Mine Waste Solutions. The cash from the placement, combined with the cash generated by the operations, resulted in net debt of R1 361 million (US$79 million) as at the end of June 2020. The inclusion of the newly acquired assets will increase our future EBITDA meaningfully.
With current favourable market prices and current levels of production prevailing, we expect to be in a net cash position by the end of March 2021.
INTEGRATION OF MPONENG MINE, MINE WASTE SOLUTIONS AND RELATED ASSETS
Harmony assumed full ownership of Mponeng mine, Mine Waste Solutions and related assets on 1 October 2020. Integration of these assets is currently under way. We expect cash flows to be boosted, as we unlock value through potential synergies with existing surface and service infrastructure, as well as adding quality replacement ounces to the Company's reserves and resources.
Harmony will provide an update to its current market guidance of producing between 1.26Moz and 1.3Moz at an all-in sustaining cost of R690 000/kg to R710 000/kg at the Company's half year results in February 2021.
WAFI-GOLPU ("THE PROJECT")
Harmony, together with its Wafi-Golpu Joint Venture partner Newcrest Mining Limited, looks forward to re-engaging with the State of Papua New Guinea (PNG) and progressing discussions on the Special Mining Lease for the Wafi-Golpu Project.
With regard to the permitting of the Project under the Environment Act of 2000, we are awaiting a decision by the Minister for Environment, Conservation and Climate Change regarding the assessment of the Environment Impact Statement for the Project. Harmony considers Deep Sea Tailings Placement to be the safest and most environmentally and socially responsible tailings management solution for the Project for the duration of its operations and beyond mine closure, which conclusion is supported by industry leading scientific studies and extensive data gathered by over four years of oceanographic investigations.
We continue to engage with all stakeholders concerned to ensure that we agree on the safest and most environmentally and socially responsible tailings management solution for Wafi-Golpu.
HEDGING
Harmony completed additional hedging to cover the newly acquired ounces at prices in excess of R1 million per kilogram, increasing the average forward Rand gold price on the hedge book from R743 000/kg in the previous quarter, to R846 000/kg in the September 2020 quarter. Our commodity price and exchange rate hedging derivative strategy and programme is implemented for a limited portion of production and foreign exchange. The programme is intended to reduce Harmony's exposure to a strengthening rand/US dollar exchange rate and lower commodity prices. These programmes are topped up as and when opportunities arise to lock-in attractive margins for the business.
Harmony's hedge position as at 30 September 2020:
| FY2021 | FY2022 | FY2023 | TOTAL | ||||||||
| Q2 | Q3 | Q4 | Q1 | Q2 | Q3 | Q4 | Q1 | ||||
| Rand gold | |||||||||||
| Forward contracts koz | 95 | 94 | 80 | 73 | 64 | 52 | 42 | 23 | 523 | ||
| R’000/kg | 712 | 724 | 772 | 847 | 921 | 1 021 | 1 077 | 1 117 | 846 | ||
| Dollar gold | |||||||||||
| Forward contracts koz | 12 | 12 | 12 | 12 | 12 | 11 | 10 | 3 | 84 | ||
| US$/oz | 1 442 | 1 489 | 1 521 | 1 561 | 1 606 | 1 723 | 1 802 | 1 921 | 1 597 | ||
Total gold koz | 107 | 106 | 92 | 85 | 76 | 63 | 52 | 26 | 607 | ||
Currency hedges Rand dollar | |||||||||||
| Zero cost collars $m | 115 | 99 | 65 | 47 | 42 | 27 | — | — | 394 | ||
| Floor R/$ | 15.40 | 15.44 | 15.91 | 16.32 | 16.93 | 17.99 | — | — | 15.94 | ||
| Cap R/$ | 16.58 | 16.62 | 17.28 | 17.90 | 18.54 | 19.65 | — | — | 17.28 | ||
| Forward contracts $m | 44 | 35 | 12 | 9 | 9 | 8 | — | — | 118 | ||
| R/$ | 15.82 | 16.13 | 16.93 | 18.18 | 18.41 | 18.71 | — | — | 16.68 | ||
Total rand dollar $m | 159 | 134 | 77 | 56 | 51 | 35 | — | — | 512 | ||
| Dollar silver | |||||||||||
Zero cost collars $m | 375 | 375 | 375 | 365 | 335 | 315 | 285 | 125 | 2 550 | ||
| Floor R/$ | 18.07 | 18.29 | 18.42 | 18.61 | 19.52 | 20.05 | 20.32 | 22.69 | 19.16 | ||
| Cap R/$ | 19.60 | 19.84 | 20.02 | 20.26 | 21.35 | 22.05 | 22.49 | 24.89 | 20.91 | ||
HARMONY’S ANNUAL REPORTS
Harmony’s suite of annual reports, including its annual report filed on a Form 20F with the United States’ Securities and Exchange Commission for the financial year ended 30 June 2020 are available on the website (www.harmony.co.za/invest).
OPERATING RESULTS - QUARTER-ON-QUARTER (RAND/METRIC)
| Three months ended | SOUTH AFRICA | Hidden Valley | TOTAL HARMONY | |||||||||||||||||
| UNDERGROUND PRODUCTION | SURFACE PRODUCTION | TOTAL SOUTH AFRICA | ||||||||||||||||||
| Tshepong Operations | Moab Khotsong | Bambanani | Joel | Doornkop | Target 1 | Kusasalethu | Masimong | Unisel | TOTAL UNDER- GROUND | Phoenix | Central plant reclamation | Dumps | Kalgold | TOTAL SURFACE | ||||||
| Ore milled | - t'000 | Sep-20 | 344 | 213 | 58 | 84 | 224 | 139 | 195 | 114 | 46 | 1 417 | 1 547 | 1 008 | 1 196 | 381 | 4 132 | 5 549 | 843 | 6 392 |
| Jun-20 | 206 | 102 | 29 | 43 | 120 | 98 | 118 | 58 | 27 | 801 | 1 516 | 1 015 | 1 530 | 366 | 4 427 | 5 228 | 970 | 6 198 | ||
| Yield | - g/tonne | Sep-20 | 4.64 | 8.29 | 8.95 | 3.86 | 4.39 | 4.22 | 5.65 | 3.91 | 4.48 | 5.31 | 0.132 | 0.140 | 0.477 | 0.87 | 0.30 | 1.58 | 1.17 | 1.53 |
| Jun-20 | 5.40 | 9.27 | 10.52 | 4.79 | 4.66 | 4.64 | 5.21 | 4.28 | 4.85 | 5.72 | 0.132 | 0.143 | 0.448 | 0.63 | 0.28 | 1.12 | 1.25 | 1.14 | ||
| Gold produced | - kg | Sep-20 | 1 595 | 1 766 | 519 | 324 | 984 | 587 | 1 101 | 446 | 206 | 7 528 | 204 | 141 | 570 | 332 | 1 247 | 8 775 | 983 | 9 758 |
| Jun-20 | 1 113 | 946 | 305 | 206 | 559 | 455 | 615 | 248 | 131 | 4 578 | 200 | 145 | 685 | 229 | 1 259 | 5 837 | 1 212 | 7 049 | ||
| Gold sold | - kg | Sep-20 | 1 552 | 1 704 | 505 | 315 | 931 | 595 | 1 051 | 434 | 200 | 7 287 | 203 | 141 | 547 | 325 | 1 216 | 8 503 | 1 058 | 9 561 |
| Jun-20 | 1 131 | 924 | 310 | 210 | 546 | 424 | 584 | 252 | 133 | 4 514 | 195 | 142 | 689 | 221 | 1 247 | 5 761 | 1 151 | 6 912 | ||
| Gold price received | - R/kg | Sep-20 | 927 352 | 929 144 | 928 943 | 928 479 | 924 352 | 929 661 | 918 190 | 812 129 | 927 125 | 919 545 | 847 729 | 927 191 | 924 612 | 929 911 | 913 493 | 918 680 | 952 278 | 922 398 |
| Jun-20 | 895 500 | 895 026 | 893 358 | 891 343 | 895 081 | 720 118 | 881 589 | 797 992 | 738 165 | 866 659 | 813 344 | 880 141 | 881 032 | 880 222 | 870 202 | 867 426 | 914 960 | 875 341 | ||
| Gold revenue | (R'000) | Sep-20 | 1 439 251 | 1 583 261 | 469 116 | 292 471 | 860 572 | 553 148 | 965 018 | 352 464 | 185 425 | 6 700 726 | 172 089 | 130 734 | 505 763 | 302 221 | 1 110 807 | 7 811 533 | 1 007 510 | 8 819 043 |
| Jun-20 | 1 012 810 | 827 004 | 276 941 | 187 182 | 488 714 | 305 330 | 514 848 | 201 094 | 98 176 | 3 912 099 | 158 602 | 124 980 | 607 031 | 194 529 | 1 085 142 | 4 997 241 | 1 053 119 | 6 050 360 | ||
| Cash operating cost (net of by- product credits) | (R'000) | Sep-20 | 1 281 309 | 978 613 | 303 233 | 284 065 | 532 743 | 428 045 | 793 095 | 344 372 | 141 391 | 5 086 866 | 101 192 | 73 058 | 257 932 | 210 766 | 642 948 | 5 729 814 | 396 552 | 6 126 366 |
| Jun-20 | 936 967 | 752 960 | 215 193 | 220 335 | 380 464 | 349 770 | 553 599 | 256 223 | 110 082 | 3 775 593 | 88 753 | 60 733 | 307 464 | 129 234 | 586 184 | 4 361 777 | 571 319 | 4 933 096 | ||
| Inventory movement | (R'000) | Sep-20 | (31 430) | (12 932) | (11 837) | (6 947) | (29 305) | (695) | (33 343) | (10 568) | (4 411) | (141 468) | (1 659) | (658) | (9 517) | (6 495) | (18 329) | (159 797) | 70 799 | (88 998) |
| Jun-20 | 6 884 | (33 782) | 3 317 | 1 598 | (8 084) | (20 813) | (29 014) | 5 204 | 2 261 | (72 429) | (2 162) | (929) | 2 224 | (3 561) | (4 428) | (76 857) | (56 456) | (133 313) | ||
| Operating costs | (R'000) | Sep-20 | 1 249 879 | 965 681 | 291 396 | 277 118 | 503 438 | 427 350 | 759 752 | 333 804 | 136 980 | 4 945 398 | 99 533 | 72 400 | 248 415 | 204 271 | 624 619 | 5 570 017 | 467 351 | 6 037 368 |
| Jun-20 | 943 851 | 719 178 | 218 510 | 221 933 | 372 380 | 328 957 | 524 585 | 261 427 | 112 343 | 3 703 164 | 86 591 | 59 804 | 309 688 | 125 673 | 581 756 | 4 284 920 | 514 863 | 4 799 783 | ||
| Production profit | (R'000) | Sep-20 | 189 372 | 617 580 | 177 720 | 15 353 | 357 134 | 125 798 | 205 266 | 18 660 | 48 445 | 1 755 328 | 72 556 | 58 334 | 257 348 | 97 950 | 486 188 | 2 241 516 | 540 159 | 2 781 675 |
| Jun-20 | 68 959 | 107 826 | 58 431 | (34 751) | 116 334 | (23 627) | (9 737) | (60 333) | (14 167) | 208 935 | 72 011 | 65 176 | 297 343 | 68 856 | 503 386 | 712 321 | 538 256 | 1 250 577 | ||
| Capital expenditure | (R'000) | Sep-20 | 167 516 | 112 948 | 13 302 | 34 295 | 84 165 | 83 606 | 28 823 | 2 779 | 0 | 527 434 | 0 | 2 978 | 5 170 | 29 297 | 37 445 | 564 879 | 228 187 | 793 066 |
| Jun-20 | 87 194 | 41 222 | 7 869 | 16 193 | 43 845 | 64 208 | 17 482 | 3 393 | 1 416 | 282 822 | 3 673 | 6 603 | 401 | 52 575 | 63 252 | 346 074 | 114 141 | 460 215 | ||
| Cash operating costs | - R/kg | Sep-20 | 803 329 | 554 141 | 584 264 | 876 744 | 541 405 | 729 208 | 720 341 | 772 135 | 686 364 | 675 726 | 496 039 | 518 142 | 452 512 | 634 837 | 515 596 | 652 970 | 403 410 | 627 830 |
| Jun-20 | 841 839 | 795 941 | 705 551 | 1 069 587 | 680 615 | 768 725 | 900 161 | 1 033 157 | 840 321 | 824 725 | 443 765 | 418 848 | 448 853 | 564 341 | 465 595 | 747 263 | 471 385 | 699 829 | ||
| Cash operating costs | - R/tonne | Sep-20 | 3 725 | 4 594 | 5 228 | 3 382 | 2 378 | 3 079 | 4 067 | 3 021 | 3 074 | 3 590 | 65 | 72 | 216 | 553 | 156 | 1 033 | 470 | 958 |
| Jun-20 | 4 548 | 7 382 | 7 420 | 5 124 | 3 171 | 3 569 | 4 692 | 4 418 | 4 077 | 4 714 | 59 | 60 | 201 | 353 | 132 | 834 | 589 | 796 | ||
Cash operating cost and Capital | - R/kg | Sep-20 | 908 354 | 618 098 | 609 894 | 982 593 | 626 939 | 871 637 | 746 520 | 778 365 | 686 364 | 745 789 | 496 039 | 539 262 | 461 582 | 723 081 | 545 624 | 717 344 | 635 543 | 709 104 |
| Jun-20 | 920 181 | 839 516 | 731 351 | 1 148 194 | 759 050 | 909 842 | 928 587 | 1 046 839 | 851 130 | 886 504 | 462 130 | 464 386 | 449 438 | 793 926 | 515 835 | 806 553 | 565 561 | 765 117 | ||
| All-in sustaining cost | - R/kg | Sep-20 | 928 984 | 639 717 | 628 283 | 1 013 547 | 603 082 | 842 757 | 771 949 | 812 287 | 719 524 | 760 131 | 490 310 | 534 596 | 463 592 | 742 288 | 550 773 | 729 854 | 717 309 | 728 465 |
| Jun-20 | 926 827 | 843 486 | 754 418 | 1 167 919 | 728 268 | 948 751 | 959 197 | 1 100 184 | 898 648 | 900 221 | 467 077 | 459 484 | 450 057 | 847 586 | 524 244 | 818 924 | 605 280 | 783 336 | ||
| Operating free cash flow margin¹ | % | Sep-20 | (1%) | 31% | 33% | (9%) | 28% | 8% | 15% | 2% | 24% | 16% | 41% | 42% | 48% | 21% | 39% | 19% | 28% | 20% |
| Jun-20 | (1%) | 4% | 19% | (26%) | 13% | (36%) | (11%) | (29%) | (14%) | (4%) | 42% | 46% | 49% | 7% | 40% | 6% | 30% | 10% | ||
¹Excludes run of mine costs for Kalgold (Sep-20:R0.644m, Jun-20:R0.222m) and Hidden Valley (Sep-20:-R95.73m, Jun-20:-R54.45m).
OPERATING RESULTS - QUARTER ON QUARTER (US$/IMPERIAL)
| Three months ended | SOUTH AFRICA | Hidden Valley | TOTAL HARMONY | |||||||||||||||||
| UNDERGROUND PRODUCTION | SURFACE PRODUCTION | TOTAL SOUTH AFRICA | ||||||||||||||||||
| Tshepong Operations | Moab Khotsong | Bambanani | Joel | Doornkop | Target 1 | Kusasalethu | Masimong | Unisel | TOTAL UNDER- GROUND | Phoenix | Central plant reclamation | Dumps | Kalgold | TOTAL SURFACE | ||||||
| Ore milled | - t'000 | Sep-20 | 379 | 235 | 64 | 93 | 247 | 153 | 215 | 126 | 51 | 1 563 | 1 706 | 1 112 | 1 319 | 420 | 4 557 | 6 120 | 930 | 7 050 |
| Jun-20 | 227 | 112 | 32 | 47 | 132 | 108 | 130 | 64 | 30 | 882 | 1 672 | 1 119 | 1 687 | 404 | 4 882 | 5 764 | 1 070 | 6 834 | ||
| Yield | - oz/ton | Sep-20 | 0.135 | 0.242 | 0.261 | 0.112 | 0.128 | 0.123 | 0.165 | 0.114 | 0.130 | 0.155 | 0.004 | 0.004 | 0.014 | 0.025 | 0.009 | 0.046 | 0.034 | 0.045 |
| Jun-20 | 0.158 | 0.272 | 0.306 | 0.141 | 0.136 | 0.135 | 0.152 | 0.125 | 0.140 | 0.167 | 0.004 | 0.004 | 0.013 | 0.018 | 0.008 | 0.033 | 0.036 | 0.033 | ||
| Gold produced | - oz | Sep-20 | 51 280 | 56 778 | 16 686 | 10 417 | 31 636 | 18 872 | 35 398 | 14 339 | 6 623 | 242 029 | 6 559 | 4 533 | 18 326 | 10 674 | 40 092 | 282 121 | 31 604 | 313 725 |
| Jun-20 | 35 784 | 30 415 | 9 806 | 6 623 | 17 972 | 14 629 | 19 773 | 7 973 | 4 212 | 147 187 | 6 430 | 4 662 | 22 023 | 7 363 | 40 478 | 187 665 | 38 967 | 226 632 | ||
| Gold sold | - oz | Sep-20 | 49 898 | 54 785 | 16 236 | 10 127 | 29 932 | 19 130 | 33 790 | 13 953 | 6 430 | 234 281 | 6 527 | 4 533 | 17 586 | 10 449 | 39 095 | 273 376 | 34 015 | 307 391 |
| Jun-20 | 36 362 | 29 707 | 9 967 | 6 752 | 17 554 | 13 632 | 18 776 | 8 102 | 4 276 | 145 128 | 6 269 | 4 565 | 22 152 | 7 105 | 40 091 | 185 219 | 37 005 | 222 224 | ||
| Gold price received | - $/oz | Sep-20 | 1 707 | 1 710 | 1 710 | 1 709 | 1 701 | 1 711 | 1 690 | 1 495 | 1 707 | 1 693 | 1 560 | 1 707 | 1 702 | 1 712 | 1 681 | 1 691 | 1 753 | 1 698 |
| Jun-20 | 1 553 | 1 552 | 1 549 | 1 545 | 1 552 | 1 249 | 1 529 | 1 384 | 1 280 | 1 503 | 1 410 | 1 526 | 1 528 | 1 526 | 1 509 | 1 504 | 1 586 | 1 518 | ||
| Gold revenue | ($'000) | Sep-20 | 85 172 | 93 694 | 27 761 | 17 308 | 50 927 | 32 734 | 57 108 | 20 858 | 10 973 | 396 535 | 10 184 | 7 737 | 29 930 | 17 885 | 65 736 | 462 271 | 59 622 | 521 893 |
| Jun-20 | 56 458 | 46 101 | 15 438 | 10 434 | 27 243 | 17 020 | 28 700 | 11 210 | 5 473 | 218 077 | 8 841 | 6 967 | 33 839 | 10 844 | 60 491 | 278 568 | 58 705 | 337 273 | ||
| Cash operating cost (net of by- product credits) | ($'000) | Sep-20 | 75 825 | 57 913 | 17 944 | 16 811 | 31 527 | 25 331 | 46 934 | 20 379 | 8 367 | 301 031 | 5 988 | 4 323 | 15 264 | 12 472 | 38 047 | 339 078 | 23 468 | 362 546 |
| Jun-20 | 52 231 | 41 974 | 11 996 | 12 282 | 21 209 | 19 497 | 30 860 | 14 283 | 6 136 | 210 468 | 4 947 | 3 385 | 17 139 | 7 204 | 32 675 | 243 143 | 31 849 | 274 992 | ||
| Inventory movement | ($'000) | Sep-20 | (1 860) | (765) | (700) | (411) | (1 734) | (41) | (1 973) | (625) | (261) | (8 370) | (98) | (39) | (563) | (384) | (1 084) | (9 454) | 4 190 | (5 264) |
| Jun-20 | 384 | (1 883) | 185 | 89 | (451) | (1 160) | (1 617) | 290 | 126 | (4 037) | (121) | (52) | 124 | (199) | (248) | (4 285) | (3 147) | (7 432) | ||
| Operating costs | ($'000) | Sep-20 | 73 965 | 57 148 | 17 244 | 16 400 | 29 793 | 25 290 | 44 961 | 19 754 | 8 106 | 292 661 | 5 890 | 4 284 | 14 701 | 12 088 | 36 963 | 329 624 | 27 658 | 357 282 |
| Jun-20 | 52 615 | 40 091 | 12 181 | 12 371 | 20 758 | 18 337 | 29 243 | 14 573 | 6 262 | 206 431 | 4 826 | 3 333 | 17 263 | 7 005 | 32 427 | 238 858 | 28 702 | 267 560 | ||
| Production profit | ($'000) | Sep-20 | 11 207 | 36 546 | 10 517 | 908 | 21 134 | 7 444 | 12 147 | 1 104 | 2 867 | 103 874 | 4 294 | 3 453 | 15 229 | 5 797 | 28 773 | 132 647 | 31 964 | 164 611 |
| Jun-20 | 3 843 | 6 010 | 3 257 | (1 937) | 6 485 | (1 317) | (543) | (3 363) | (789) | 11 646 | 4 015 | 3 634 | 16 576 | 3 839 | 28 064 | 39 710 | 30 003 | 69 713 | ||
| Capital expenditure | ($'000) | Sep-20 | 9 913 | 6 685 | 788 | 2 030 | 4 982 | 4 948 | 1 706 | 164 | 0 | 31 216 | 0 | 176 | 306 | 1 734 | 2 216 | 33 432 | 13 503 | 46 935 |
| Jun-20 | 4 861 | 2 299 | 439 | 902 | 2 444 | 3 580 | 975 | 190 | 79 | 15 769 | 205 | 368 | 22 | 2 930 | 3 525 | 19 294 | 6 363 | 25 657 | ||
| Cash operating cost | - $/oz | Sep-20 | 1 479 | 1 020 | 1 075 | 1 614 | 997 | 1 342 | 1 326 | 1 421 | 1 263 | 1 244 | 913 | 954 | 833 | 1 168 | 949 | 1 202 | 743 | 1 156 |
| Jun-20 | 1 460 | 1 380 | 1 223 | 1 854 | 1 180 | 1 333 | 1 561 | 1 791 | 1 457 | 1 430 | 769 | 726 | 778 | 978 | 807 | 1 296 | 817 | 1 213 | ||
| Cash operating costs | - $/t | Sep-20 | 200 | 246 | 280 | 181 | 128 | 166 | 218 | 162 | 164 | 193 | 4 | 4 | 12 | 30 | 8 | 55 | 25 | 51 |
| Jun-20 | 230 | 375 | 375 | 261 | 161 | 181 | 237 | 223 | 205 | 239 | 3 | 3 | 10 | 18 | 7 | 42 | 30 | 40 | ||
Cash operating cost and Capital | - $/oz | Sep-20 | 1 672 | 1 138 | 1 123 | 1 809 | 1 154 | 1 604 | 1 374 | 1 433 | 1 263 | 1 373 | 913 | 992 | 850 | 1 331 | 1 004 | 1 320 | 1 170 | 1 305 |
| Jun-20 | 1 595 | 1 456 | 1 268 | 1 991 | 1 316 | 1 577 | 1 610 | 1 815 | 1 476 | 1 537 | 801 | 805 | 779 | 1 376 | 894 | 1 398 | 981 | 1 327 | ||
| All-in sustaining cost | - $/oz | Sep-20 | 1 710 | 1 177 | 1 156 | 1 866 | 1 110 | 1 551 | 1 421 | 1 495 | 1 324 | 1 399 | 902 | 984 | 853 | 1 366 | 1 014 | 1 343 | 1 321 | 1 341 |
| Jun-20 | 1 607 | 1 462 | 1 308 | 2 025 | 1 263 | 1 645 | 1 663 | 1 908 | 1 558 | 1 561 | 810 | 797 | 780 | 1 470 | 909 | 1 420 | 1 046 | 1 358 | ||
| Operating free cash flow margin¹ | % | Sep-20 | (1%) | 31% | 33% | (9%) | 28% | 8% | 15% | 2% | 24% | 16% | 41% | 42% | 48% | 21% | 39% | 19% | 28% | 20% |
| Jun-20 | (1%) | 4% | 19% | (26%) | 13% | (36%) | (11%) | (29%) | (14%) | (4%) | 42% | 46% | 49% | 7% | 40% | 6% | 30% | 10% | ||
¹Excludes run of mine costs for Kalgold (Sep-20:US$0.038m, Jun-20:US$0.012m) and Hidden Valley (Sep-20:-US$5.665m, Jun-20:-US$3.035m).
DIRECTORATE AND ADMINISTRATION
HARMONY GOLD MINING COMPANY LIMITED
Harmony Gold Mining Company Limited
was incorporated and registered as a public
company in South Africa on 25 August 1950
Registration number: 1950/038232/06
CORPORATE OFFICE
Randfontein Office Park
PO Box 2
Randfontein, 1760
South Africa
Corner Main Reef Road and Ward Avenue
Randfontein, 1759
South Africa
Telephone: +27 11 411 2000
Website: www.harmony.co.za
DIRECTORS
Dr PT Motsepe* (chairman)
JM Motloba* (deputy chairperson)
M Msimang*^ (lead independent director)
PW Steenkamp** (chief executive officer)
BP Lekubo** (financial director)
HE Mashego** (executive director)
JA Chissano*#^
FFT De Buck*^
Dr DS Lushaba*^
HG Motau*^
KT Nondumo*^
VP Pillay*^
GR Sibiya*^
JL Wetton*^
AJ Wilkens*
* Non-executive
** Executive
^ Independent
# Mozambican
INVESTOR RELATIONS
E-mail: HarmonyIR@harmony.co.za
Telephone:
+27 11 411 2314 or
+27 82 759 1775
Website: www.harmony.co.za
GROUP COMPANY SECRETARY
Shela Mohatla
Randfontein Office Park
Corner Main Reef Road and Ward Avenue
Randfontein, 1759
South Africa
(PO Box 2, Randfontein, 1760, South Africa)
E-mail: companysecretariat@harmony.co.za
TRANSFER SECRETARIES
JSE Investor Services (Pty) Limited
(Registration number 2000/007239/07)
13th Floor, Rennie House,
Ameshoff Street, Braamfontein
PO Box 4844
Johannesburg, 2000
South Africa
Telephone: +27 861 546 572
E-mail: info@linkmarketservices.co.za
Fax: +27 86 674 4381
ADR* DEPOSITARY
Deutsche Bank Trust Company Americas
c/o American Stock Transfer and Trust Company
Operations Centre, 6201 15th Avenue, Brooklyn,
NY 11219, United States
E-mail queries: db@astfinancial.com
Toll free (within the US): +1-886-249-2593
Int: +1 718 921 8137
Fax: +1 718 921 8334
*ADR: American Depositary Receipts
SPONSOR
JP Morgan Equities South Africa (Pty) Limited
1 Fricker Road, corner Hurlingham Road,
Illovo, Johannesburg, 2196
Private Bag X9936, Sandton, 2146
Telephone: +27 11 507 0300
Fax: +27 11 507 0503
TRADING SYMBOLS
JSE Limited: HAR
New York Stock Exchange, Inc.: HMY
ISIN: ZAE 000015228
FORWARD LOOKING STATEMENTS
This report contains forward-looking statements within the meaning of the safe harbour provided by
Section 21E of the Exchange Act and Section 27A of the Securities Act of 1933, as amended (the "Securities
Act"), with respect to our financial condition, results of operations, business strategies, operating efficiencies,
competitive positions, growth opportunities for existing services, plans and objectives of management, markets
for stock and other matters.
These forward-looking statements, including, among others, those relating to our future business prospects,
revenues, and the potential benefit of acquisitions (including statements regarding growth and cost savings)
wherever they may occur in this report and the exhibits to this report, are necessarily estimates reflecting the
best judgement of our senior management and involve a number of risks and uncertainties that could cause
actual results to differ materially from those suggested by the forward-looking statements. As a consequence,
these forward-looking statements should be considered in light of various important factors, including those
set forth in this report. Important factors that could cause actual results to differ materially from estimates or
projections contained in the forward-looking statements include, without limitation:
- Overall economic and business conditions in South Africa, Papua New Guinea, Australia and elsewhere
(including as a result of the coronavirus disease ("Covid-19") pandemic)
- Estimates of future earnings, and the sensitivity of earnings to gold and other metals prices
- Estimates of future gold and other metals production and sales
- Estimates of future cash costs
- Estimates of future cash flows, and the sensitivity of cash flows to gold and other metals prices
- Estimates of provision for silicosis settlement and the spread of other contagious diseases, such as Covid-19
- Estimates of future tax liabilities under the Carbon Tax Act (South Africa)
- Statements regarding future debt repayments
- Estimates of future capital expenditures
- The success of our business strategy, exploration and development activities and other initiatives
- Future financial position, plans, strategies, objectives, capital expenditures, projected costs and anticipated
cost savings and financing plans
- Estimates of reserves statements regarding future exploration results and the replacement of reserves
- The ability to achieve anticipated efficiencies and other cost savings in connection with past and future
acquisitions, as well as at existing operations
- Fluctuations in the market price of gold
- The occurrence of hazards associated with underground and surface gold mining
- The occurrence of labour disruptions related to industrial action or health and safety incidents
- Power cost increases as well as power stoppages, fluctuations and usage constraints
- Supply chain shortages and increases in the prices of production imports and the availability, terms and
deployment of capital
- Our ability to hire and retain senior management, sufficiently technically-skilled employees, as well as our
ability to achieve sufficient representation of historically disadvantaged persons in management positions
- Our ability to comply with requirements that we operate in a sustainable manner and provide benefits to
affected communities
- Potential liabilities related to occupational health diseases
- Changes in government regulation and the political environment, particularly tax and royalties, mining
rights, health, safety, environmental regulation and business ownership including any interpretation thereof;
court decisions affecting the mining industry, including, without limitation, regarding the interpretation of
mining rights
- Our ability to protect our information technology and communication systems and the personal data
we retain
- Risks related to the failure of internal controls
- The outcome of pending or future litigation or regulatory proceedings
- Fluctuations in exchange rates and currency devaluations and other macroeconomic monetary policies
- The adequacy of the Group's insurance coverage
- Any further downgrade of South Africa's credit rating
- Socio-economic or political instability in South Africa, Papua New Guinea and other countries in which
we operate
For a more detailed discussion of such risks and other factors (such as availability of credit or other sources
of financing), see the Company's latest Integrated Report and Form 20-F which is on file with the Securities
and Exchange Commission, as well as the Company's other Securities and Exchange Commission filings.
The Company undertakes no obligation to update publicly or release any revisions to these forward-looking
statements to reflect events or circumstances after the date of this report or to reflect the occurrence of
unanticipated events, except as required by law. The foregoing factors and others described under "Risk
Factors" should not be construed as exhaustive. The forward-looking financial information has not been
reviewed and reported on by the Company's auditors.
Johannesburg
9 November 2020
SIGNATURES
Pursuant to the requirements of the Securities Exchange Act of 1934, the registrant has duly caused this report to be signed on
its behalf by the undersigned, thereunto duly authorized.
| Harmony Gold Mining Company Limited | |||||
| Date: November 9, 2020 | By: /s/ Boipelo Lekubo | ||||
| Name: Boipelo Lekubo | |||||
| Title: Financial Director | |||||