UNITED STATES
SECURITIES AND EXCHANGE COMMISSION
Washington, D.C. 20549
_________________________
FORM 10-K
________________________
| x | ANNUAL REPORT PURSUANT TO SECTION 13 or 15(d) OF THE SECURITIES EXCHANGE ACT OF 1934 |
For the fiscal year ended December 29, 2006
OR
| o | TRANSITION REPORT PURSUANT TO SECTION 13 or 15(d) OF THE SECURITIES EXCHANGE ACT OF 1934 |
For the Transition Period from _____ to _____
Commission file number 1-7567
_________________________
URS CORPORATION
(Exact name of registrant as specified in its charter)
Delaware | | 94-1381538 |
| (State or other jurisdiction of incorporation) | | (I.R.S. Employer Identification No.) |
| | | |
600 Montgomery Street, 26th Floor | | |
San Francisco, California | | 94111-2728 |
| (Address of principal executive offices) | | (Zip Code) |
(415) 774-2700
(Registrant’s telephone number, including area code)
Securities registered pursuant to Section 12(b) of the Act:
Title of each class: | | Name of each exchange on which registered: |
| | | |
| Common Shares, par value $.01 per share | | New York Stock Exchange |
| | | |
Securities registered pursuant to Section 12(g) of the Act:
None
Indicate by check mark if the registrant is a well-known seasoned issuer, as defined in Rule 405 of the Securities Act. Yes xNo o
Indicate by check mark if the registrant is not required to file reports pursuant to Section 13 or 15(d) of the Act. Yes o No x
Indicate by check mark whether the registrant (1) has filed all reports required to be filed by Section 13 or 15(d) of the Securities Exchange Act of 1934 during the preceding 12 months (or for such shorter period that the registrant was required to file such reports), and (2) has been subject to such filing requirements for the past 90 days. Yes xNo o
Indicate by check mark if disclosure of delinquent filers pursuant to Item 405 of Regulation S-K is not contained herein, and will not be contained, to the best of registrant’s knowledge, in definitive proxy or information statements incorporated by reference in Part III of this Form 10-K or any amendment to this Form 10-K. x
Indicate by check mark whether the registrant is a large accelerated filer, an accelerated filer, or a non-accelerated filer. See definition of “accelerated filer and large accelerated filer” in Rule 12b-2 of the Exchange Act.
Large accelerated filer xAccelerated filer o Non-Accelerated filer o
Indicate by check mark whether the registrant is a shell company (as defined in Rule 12b-2 of the Act). Yes oNo x
The aggregate market value of the common stock of the registrant held by non-affiliates on February 19, 2007 and June 30, 2006 (the last business day of the registrant’s most recently completed second fiscal quarter) was $2,277.9 million and $2,147.9 million, respectively, based upon the closing sales price of the registrant’s common stock on such date as reported in the consolidated transaction reporting system. On February 19, 2007, and June 30, 2006, there were 52,504,697 shares and 51,872,502 shares of the registrant’s common stock outstanding, respectively.
Documents Incorporated by Reference
Part III incorporates information by reference from the registrant’s definitive proxy statement for the Annual Meeting of Stockholders to be held on May 24, 2007.
Table of ContentsURS CORPORATION AND SUBSIDIARIES
This Annual Report on Form 10-K contains forward-looking statements within the meaning of the Private Securities Litigation Reform Act of 1995. These forward-looking statements may be identified by words such as “anticipate,” “believe,” “estimate,” “expect,” “intend,” “may,” “plan,” “predict,” “will,” and similar terms used in reference to our future revenue, service and business trends; future accounting policies and actuarial estimates; future stock-based compensation expenses; future retirement plan expenses; future legal proceedings and accruals; future insurance coverage; future guarantees and debt service; future capital resources; future effectiveness of our disclosure and internal controls over financial reporting and future economic and industry conditions. We believe that our expectations are reasonable and are based on reasonable assumptions. However, such forward-looking statements by their nature involve risks and uncertainties. We caution that a variety of factors, including but not limited to the following, could cause our business and financial results to differ materially from those expressed or implied in our forward-looking statements: an economic downturn; changes in our book of business; our compliance with government contract procurement regulations; our ability to procure government contracts; our reliance on government appropriations; the ability of the government to unilaterally terminate our contracts; our ability to make accurate estimates and control costs; our and our partners’ ability to bid on, win, perform and renew contracts and projects; environmental issues and liabilities; liabilities for pending and future litigation; the impact of changes in laws and regulations; a decline in defense spending; industry competition; our ability to attract and retain key individuals; employee, agent or partner misconduct; risks associated with changes in equity-based compensation requirements; our leveraged position and ability to service our debt; risks associated with international operations; business activities in high security risk countries; third party software risks; terrorist and natural disaster risks; our relationships with our labor unions; our ability to protect our intellectual property rights; anti-takeover risks and other factors discussed more fully in Management’s Discussion and Analysis of Financial Condition and Results of Operations beginning on page 28, Risk Factors beginning on page 14 , as well as in other reports subsequently filed from time to time with the United States Securities and Exchange Commission. We assume no obligation to revise or update any forward-looking statements.
| | PART I | |
| | | |
| Business | 3 |
| Risk Factors | 14 |
| Unresolved Staff Comments | 23 |
| Properties | 23 |
| Legal Proceedings | 23 |
| Item 4. | Submission of Matters to a Vote of Security Holders | 24 |
| Item 4A. | Executive Officers of the Registrant | 24 |
| | | |
| | PART II | |
| | | |
| Market for Registrant’s Common Equity, Related Stockholder Matters and Issuer Purchases of Equity Securities | 25 |
| Selected Financial Data | 26 |
| Management’s Discussion and Analysis of Financial Condition and Results of Operations | 28 |
| Quantitative and Qualitative Disclosures about Market Risk | 52 |
| Consolidated Financial Statements and Supplementary Data | 54 |
| | |
| | December 29, 2006 and December 30, 2005 | 56 |
| | | |
| | Years ended December 29, 2006, December 30, 2005, two months ended December 31, 2004, and year ended October 31, 2004 | 57 |
| | | |
| | Year ended December 29, 2006, year ended December 30, 2005, two months ended December 31, 2004, and year ended October 31, 2004 | 58 |
| | | |
| | Year ended December 29, 2006, year ended December 30, 2005, two months ended December 31, 2004, and year ended October 31, 2004 | 59 |
| | | 61 |
| Changes in and Disagreements With Accountants on Accounting and Financial Disclosure | 116 |
| Controls and Procedures | 116 |
| Other Information | 117 |
| | | |
| | PART III | |
| | | |
| Directors and Executive Officers and Corporate Governance | 117 |
| Executive Compensation | 117 |
| Security Ownership of Certain Beneficial Owners and Management and Related Stockholder Matters | 118 |
| Certain Relationships and Related Transactions, and Director Independence | 118 |
| Principal Accounting Fees and Services | 118 |
| | |
| | PART IV | |
| | | |
| Exhibits, Financial Statement Schedules | 118 |
Summary
We are one of the largest engineering design services firms worldwide and a major U.S. federal government contractor for systems engineering and technical assistance and operations and maintenance services. Our business focuses primarily on providing fee-based professional and technical services in the engineering and construction services and defense markets, although we perform some limited construction work. We operate through two divisions: the URS Division and the EG&G Division. Our URS Division provides a comprehensive range of professional planning and design, program management, construction management, and operations and maintenance services to various government agencies and departments in the United States and internationally, as well as to private industry clients. Our EG&G Division provides planning, systems engineering and technical assistance, operations and maintenance, and program management services to various U.S. federal government agencies, primarily the Departments of Defense and Homeland Security. For information on our business by segment and geographic regions, please refer to Note 7, “Segment and Related Information” to our “Consolidated Financial Statements and Supplementary Data,” which is included under Item 8 of this report.
Clients, Services and Markets
We market our services to federal government agencies, state and local government agencies, private industry, and international clients through our extensive network of approximately 370 offices and contract-specific job sites across the U.S. and in more than 20 foreign countries.
We focus our expertise on eight key markets: transportation, environmental, facilities, industrial infrastructure and process, water/wastewater, homeland security, defense systems, and installations and logistics.
The following table summarizes our revenues, representative services and representative markets by client type for our fiscal year ended December 29, 2006.
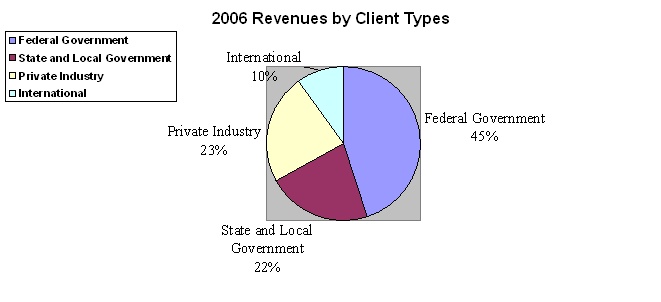
Client Types | % of Revenues | Representative Services | Representative Markets |
| Federal Government | | · Operations and Maintenance · Systems Engineering and Technical Assistance · Planning and Design · Program Management · Construction Management | · Facilities · Environmental · Homeland Security · Defense Systems · Installations and Logistics · Transportation |
| State and Local Government | | · Planning and Design · Program Management · Construction Management · Operations and Maintenance | · Transportation · Facilities · Homeland Security · Environmental · Water/Wastewater |
| Private Industry | 23% | · Planning and Design · Program Management · Construction Management · Operations and Maintenance | · Environmental · Industrial Infrastructure and Process · Facilities · Water/Wastewater |
| International | | · Planning and Design · Program Management · Construction Management · Operations and Maintenance | · Transportation · Facilities · Environmental · Water/Wastewater · Homeland Security · Defense Systems |
Clients
We provide our services to a broad range of domestic and international clients, including agencies of the U.S. federal government, state and local government agencies and private industry clients located both in the U.S. and abroad. The following table summarizes the primary client types serviced by our URS and EG&G Divisions for the fiscal year ended December 29, 2006.
Client Types | URS Division | EG&G Division |
| Federal Government | ü | ü |
| State and Local Government | ü | — |
| Private Industry | ü | — |
| International | ü | — |
| ü | a primary client type for the division. |
| — | not a primary client type for the division. |
U.S. Federal Government. We are a major government contractor for planning and design, systems engineering and technical assistance, operations and maintenance services, program management, and construction management, providing services to the Departments of Defense, Homeland Security, Justice, Energy and Treasury, the Environmental Protection Agency, NASA, the United States Postal Service and the General Services Administration. Following a steady decline in uniformed and civilian personnel levels throughout the 1990s, the Department of Defense (“DOD”) has used contractors for large, multi-service government outsourcing contracts in support of military operations. Our revenues from U.S. federal government agencies exclude revenues arising from federal grants or matching funds allocated to and passed through state and local government agencies. We serve U.S. federal government clients through both our URS and EG&G Divisions.
State and Local Government. Our state and local government agency clients include various local municipalities, community planning boards, state and municipal departments of transportation and public works, transit authorities, water and wastewater authorities, environmental protection agencies, school boards and authorities, judiciary agencies, public hospitals, ports and harbors, and airport authorities. In the United States, substantially all spending for infrastructure - transportation facilities, public buildings and water/wastewater systems - is coordinated through these agencies. Our state and local government revenues include those originating from federal grants or matching funds provided to state and local government agencies. Our state and local government clients are primarily served by the URS Division.
Private Industry. Most of our private industry clients are Fortune 500 companies, many with international operations, from a broad range of industries, including chemical, pharmaceutical, oil and gas, power, manufacturing, mining and pipelines. Over the past several years, many of these companies have reduced the number of service providers they use, selecting larger, multi-service contractors with international operations in order to control overhead costs. Our private industry clients are served primarily through the URS Division.
International. The focus of our international business is to provide a range of services to our multinational private industry clients and foreign governmental agencies in the Americas (outside the U.S.), Europe and Asia Pacific. Although both the URS and EG&G Divisions work outside of the United States, our international client base is served primarily by the URS Division.
Services
We provide professional planning and design, systems engineering and technical assistance, program management, construction management, and operations and maintenance services to the U.S. federal, state, and local government agencies, as well as private industry and international clients. These services are delivered through a network of offices and contract-specific job sites. Although we are typically the prime contractor, in some cases, we provide services as a subcontractor or through joint ventures or partnership agreements with other service providers. The following table summarizes the services provided by our URS and EG&G Divisions for the fiscal year ended December 29, 2006.
Services | URS Division | EG&G Division |
| Planning and Design | ü | ü |
| Systems Engineering and Technical Assistance | — | ü |
| Construction Management | ü | — |
| Program Management | ü | ü |
| Operations and Maintenance | ü | ü |
| ü | the division provides the listed service. |
| — | | the division does not provide the listed service. |
Planning and Design. The planning process is typically used to develop a blueprint or overall scheme for a project. Based on the project requirements identified during the planning process, detailed plans are developed, which may include material specifications, construction cost estimates and schedules. Our planning and design services include the following:
| · | transportation planning; |
| · | technical and economic feasibility studies; |
| · | environmental impact assessments; |
| · | permitting, to ensure compliance with applicable regulations; |
| · | the analysis of alternative designs; and |
| · | the development of conceptual and final design documents. |
We provide planning and design services for the construction of new transportation projects and for the renovation and expansion of existing transportation infrastructure, including bridges, highways, roads, airports, mass transit systems and railroads, and ports and harbors. We also plan and design many types of facilities, such as schools, courthouses, hospitals, corporate offices and retail outlets, as well as water supply and conveyance systems and wastewater treatment plants. Our planning and design capabilities support homeland defense and global threat reduction programs; hazardous waste clean-up activities at military bases; and environmental assessment, due diligence and permitting at commercial and industrial facilities. We also provide design support to military clients for major research and development projects.
Systems Engineering and Technical Assistance. We provide a broad range of systems engineering and technical assistance to all branches of the U.S. military for the design and development of new weapons systems and the modernization of aging weapons systems. We have the expertise to support a wide range of platforms including aircraft and helicopters, tracked and wheeled vehicles, ships and submarines, shelters and ground support equipment. Representative systems engineering and technical assistance services include:
| · | defining operational requirements and developing specifications for new weapons systems; |
| · | reviewing hardware and software design data; and |
| · | developing engineering documentation for these systems. |
We support a number of activities including technology insertion, system modification, installation of new systems/equipment, design of critical data packages, and configuration management.
Construction Management. We serve as the client’s representative and monitor the progress, cost and quality of construction projects in process. As construction managers, we typically oversee and coordinate the activities of construction contractors, providing a variety of services, including:
| · | cost and schedule management; |
| · | contract administration; |
| · | quality control and quality assurance; and |
| · | claims and dispute resolution. |
We provide construction management services for transportation, facilities, environmental and water/wastewater projects.
Program Management. We provide the technical and administrative services required to manage, coordinate and integrate the multiple and concurrent assignments that comprise a large program - from concept through completion. For large military programs, which typically involve naval, ground, vessel and airborne platforms, our program management services include logistics planning, acquisition management, risk management of weapons systems, safety management and subcontractor management. We also provide program management services for large capital improvement programs, which include planning, coordination, schedule and cost control, and design, construction, and commissioning oversight.
Operations and Maintenance. We provide operations and maintenance services in support of large military and other non-military installations and operations. Our services include:
| · | management of military base logistics, including overseeing the operation of government warehousing and distribution centers, as well as government property and asset management; |
| · | maintenance, modification, overhaul and life service extension services for military vehicles, vessels and aircraft; |
| · | operation and maintenance of chemical agent disposal systems; |
| · | comprehensive military flight training services; and |
| · | support of high security systems. |
Markets
We focus our expertise on eight key markets: transportation, environmental, industrial infrastructure and process, facilities, water/wastewater, homeland security, installations and logistics and defense systems. Our domestic and international network of offices allows us to perform business development and sales activities on a localized basis. In addition, for large-scale projects and multinational clients, we coordinate national and international marketing efforts on a company-wide basis. The following table summarizes the markets served by our URS and EG&G Divisions, as separate reporting segments, for our fiscal year ended December 29, 2006.
Markets | URS Division | EG&G Division |
| Transportation | ü | — |
| Environmental | ü | — |
| Industrial Infrastructure and Process | ü | — |
| Facilities | ü | — |
| Water/Wastewater | ü | — |
| Homeland Security | ü | ü |
| Installations and Logistics | ü | ü |
| Defense Systems | — | ü |
| ü | the division serves this market. |
| — | the division does not serve this market. |
Transportation
We provide a full range of planning and design, program management and construction management services for surface transportation, air transportation, rail transportation, and ports and harbors projects as described below.
Surface Transportation. We provide services for all types of surface transportation systems and networks, including highways, bridges, tunnels and interchanges and toll road facilities. Our expertise also includes the planning and design, and operations and maintenance of intelligent transportation systems, such as traffic management centers. Historically, we have emphasized the design of new transportation systems, but in recent years, we also have focused on the rehabilitation and expansion of existing systems.
Air Transportation. We provide comprehensive services for the development of new airports and the modernization and expansion of existing facilities, including airport terminals; hangars and air cargo buildings; air traffic control towers; runways and taxiways; and related airport infrastructure such as roadways, parking garages and people movers. We also specialize in baggage, communications and aircraft fueling systems. We have completed projects at both general aviation and large-hub international airports throughout the world. In the growing area of airport security, we assist airport authorities and owners, and airline carriers in all aspects of security-related projects. For example, we provide a full range of planning and design, program management, construction management, and operations and maintenance services for airport security systems, including baggage screening and perimeter access control systems.
Rail Transportation. We provide services to freight and passenger railroads and urban mass transit agencies. We have planned, designed and managed the construction of commuter rail systems, freight rail systems, heavy and light rail transit systems, and high-speed rail systems. Our specialized expertise in transportation structures, including terminals, stations, parking facilities, bridges, tunnels and power, signals and communications systems, complements these capabilities.
Ports and Harbors. We provide comprehensive services to waterfront property ownerships, ports and harbors authorities, port tenants, waterfront cities and counties, construction contractors and the DOD for the planning, design and construction management of container terminals, liquid and dry bulk terminals, storage facilities, piers, wharves, seawalls and slope protection, recreational marinas and small craft harbors. We also provide environmental and geotechnical services for waterfront projects, as well as specialized services in port security and Tsunami modeling.
Environmental
We provide a variety of engineering and environmental services related to protecting, preserving and restoring our air, water and soil quality for U.S. federal government, state and local government agencies, and commercial and industrial clients in the private sector. Our services include environmental impact assessments, permitting and regulatory compliance, environmental management and pollution control, waste management, remediation design, program management, construction management, demolition and environmental clean-up. We provide air quality monitoring and modeling, and design air emissions control systems. We also provide comprehensive services related to the identification, characterization and remediation of hazardous waste sites.
Industrial Infrastructure and Process
We provide planning and engineering design services for new industrial infrastructure and process facilities, as well as the expansion and upgrade of existing facilities. We provide services to clients in the oil and gas, power, chemical/pharmaceutical, manufacturing, pipeline and mining sectors. Our work in the oil and gas and pipeline sectors involves refineries, gas processing facilities, gas and liquid pipelines and gas storage facilities. In the chemical/pharmaceutical market, we provide services for petrochemical, specialty chemical and polymer facilities. Our work for the manufacturing sector involves pulp and paper, food and light manufacturing facilities. We also provide infrastructure design services for mining facilities.
Facilities
We provide planning, architectural and engineering design, program management, construction management for new facilities and the rehabilitation and expansion of existing facilities. Our work involves a broad range of building types, including education, judicial, correctional, health care, retail, sports, recreational, industrial, research and office facilities. We also provide historic preservation, adaptive reuse and seismic upgrade services.
Water/Wastewater
We provide services for the planning, design and construction of all types of water/wastewater treatment facilities and systems. Services are provided for new and expanded water supply, storage, distribution and treatment systems, municipal wastewater treatment and sewer systems, levees, and watershed, storm water management, flood control systems, and coastal restoration. We also provide design and seismic retrofit of earth, rock fill and concrete dams, as well as the design of reservoirs and impoundments.
Homeland Security
We provide a variety of services to the Department of Homeland Security (“DHS”), DOD, and other federal departments and state and local government agencies in support of homeland security activities. This work includes conducting threat assessments of public facilities, planning and conducting emergency preparedness exercises, and designing force protection systems and security systems.
In addition, our related global threat reduction services focus on the elimination and dismantlement of nuclear, chemical and biological weapons of mass destruction (“WMDs”). Our services include operating and maintaining chemical agent disposal facilities and providing advisory services for dismantling and eliminating WMDs. We also develop emergency response strategies and conduct first responder training for the military and other federal state and local government agencies.
Installations and Logistics
We assist the U.S. federal government by providing services to support the operations of complex government and military installations and the management of logistics activities for government supply and distribution networks.
Installations Management. We provide comprehensive services for the operation and maintenance of complex government installations, including military bases and test ranges. Our services vary from managing basic base operations to the design, installation and maintenance of complex equipment for testing new weapons.
Logistics. We provide a number of DOD agencies and defense prime contractors with turn-key logistics support services focused on developing and managing integrated supply and distribution networks. We oversee warehousing, packaging, delivery, and traffic management for the distribution of government equipment and materials. We also manage depot equipment maintenance, safety, security and contracting.
Defense Systems
We provide a variety of services to the U.S. federal government in support of military activities. These services include Defense Systems & Services, Field Services and Flight Services & Training.
Defense Systems & Services. We provide a variety of weapons system design and modernization services to DOD weapons systems management offices, laboratories, technical centers, support centers, and maintenance activities. Our services include acquisition support for new defense systems, engineering and technical assistance for the modernization of existing systems, and maintenance planning to help extend their service life.
Field Services. We maintain, modify and overhaul aircraft, ground vehicles, such as Humvees, tanks, and armored personnel carriers, and associated support equipment for the U.S. Army, U.S. Air Force, U.S. Navy and U.S. Coast Guard. We provide these services for military operations both in the U.S. and abroad.
Flight Services & Training. We provide a variety of services to the U.S. Army, U.S. Air Force, and U.S. Coast Guard to support undergraduate and graduate-level training for pilots of military fixed wing and rotary wing aircraft. We also assist with the acquisition of military parts for these aircraft.
Major Customer
Our largest client type is the U.S. federal government (45% of our total fiscal 2006 revenues) and our largest customer is the U.S. Army. During 2006, we had multiple contracts with the U.S. Army, which collectively contributed more than 10% of our consolidated revenues, as summarized in the following table, for the years ended December 29, 2006 and December 30, 2005, the two months ended December 31, 2004, and year ended October 31, 2004. However, we are not dependent on any single contract on an ongoing basis, and we believe that the loss of any contract would not have a material adverse effect on our business.
| | | URS Division | | EG&G Division | | Total | | % of Our Consolidated Revenues | |
| | | (In millions, except for percentages) | |
Year ended December 29, 2006 | | | | | | | | | |
| The U.S. Army (1) | | $ | 107.8 | | $ | 735.2 | | $ | 843.0 | | | 20 | % |
| | | | | | | | | | | | | | |
Year ended December 30, 2005 | | | | | | | | | | | | | |
| The U.S. Army (1) | | $ | 109.2 | | $ | 682.2 | | $ | 791.4 | | | 20 | % |
| | | | | | | | | | | | | | |
Two months ended December 31, 2004 | | | | | | | | | | | | | |
| The U.S. Army (1) | | $ | 17.1 | | $ | 91.2 | | $ | 108.3 | | | 19 | % |
| | | | | | | | | | | | | | |
Year ended October 31, 2004 | | | | | | | | | | | | | |
| The U.S. Army (1) | | $ | 96.0 | | $ | 490.7 | | $ | 586.7 | | | 17 | % |
| | | | | | | | | | | | | | |
| (1) | The U.S. Army includes U.S. Army Corps of Engineers. |
Competition
Our industry is highly fragmented and intensely competitive. Our competitors are numerous, ranging from small private firms to multi-billion dollar companies. The technical and professional aspects of our services generally do not require large upfront capital expenditures and therefore provide limited barriers against new competitors. Some of our competitors have achieved greater market penetration in some of the markets in which we compete and have substantially more financial resources and/or financial flexibility than we do. To our knowledge, no individual company currently dominates any significant portion of our markets. Competition in our industry is based on quality of performance, reputation, expertise, price, technology, customer relationships, range of service offerings, and domestic and international office networks.
We believe that we are well positioned to compete in our markets because of our solid reputation, our long-term client relationships, our extensive network of offices and our broad range of services. We are one of the largest engineering design services firms worldwide and a major U.S. federal government contractor for systems engineering and technical assistance, operations and maintenance, and program management services. We provide a comprehensive portfolio of services ranging from engineering planning and design to operations and maintenance. In addition, as a result of our national and international network of approximately 370 offices and contract-specific job sites, we can offer our governmental and private clients localized knowledge and expertise that is backed by the support of our worldwide professional staff.
The competitive environments in which each business segment operates are described below:
URS Division. The URS Division's business segment is highly competitive and characterized by competition primarily based on performance, reputation, expertise, price, technology, customer relationships, range of service offerings, and domestic and international office networks. Our competitors are numerous, ranging from small private firms to multi-billion dollar companies. The primary competitors of our URS Division include AECOM Technology Corporation, CH2M HILL Companies, Ltd., Earth Tech Inc. (a subsidiary of Tyco International, Ltd.), Fluor Corporation, Jacobs Engineering Group Inc., Parsons Brinckerhoff Inc., the Shaw Group, Inc., Tetra Tech, Inc. and Washington Group International, Inc. The URS Division’s contract mix is weighted more towards providing professional engineering and operations and maintenance services via cost-plus, time-and-materials and negotiated fixed-price contracts, which are generally lower risk than lump-sum, low-bid fixed-price contracts and, our portfolio is comprised of a larger number of generally smaller contracts.
EG&G Division. The EG&G Division's business segment is highly competitive and characterized by competition primarily based on quality of performance, reputation, expertise, price, technology, customer relationships and range of service offerings. Our competitors are numerous, ranging from small private firms to multi-billion dollar companies. The primary competitors of our EG&G Division include DynCorp International LLC, General Dynamics Corporation, KBR, L-3 Communications Corporation, Raytheon Corporation, and Science Application International Corporation (SAIC).
Backlog, Designations, Option Years and Indefinite Delivery Contracts
We determine the value of all contract awards that may potentially be recognized as revenues over the life of the contracts. We categorize the value of our book of business into backlog, designations, option years and indefinite delivery contracts, or “IDCs,” based on the nature of the award and its current status. As of December 29, 2006 and December 30, 2005, our total book of business was $12.4 billion and $11.5 billion, respectively. A discussion and breakdown of our book of business are included below.
Backlog. Our contract backlog consists of the amount billable at a particular point in time for future services under signed contracts, including task orders that are actually issued and funded under IDCs. Our consolidated contract backlog was $4,637.2 million and $3,837.7 million at December 29, 2006 and December 30, 2005, respectively.
Designations. Our clients often designate us as the recipient of future contracts. These “designations” are projects that clients have awarded to us, but for which we do not yet have signed contracts. As of December 29, 2006 and December 30, 2005, the estimated value of our consolidated designations was $1,580.4 million and $1,476.2 million, respectively.
Option Years. A significant portion of the EG&G Division’s contracts are multi-year contracts with a base period, plus option years. The base periods of these contracts can vary from one to five years. The option years are exercised at the option of our clients without requiring us to go through an additional competitive bidding process and would only be canceled through a termination for default or if a client decides to end the project (a termination for convenience). As of December 29, 2006 and December 30, 2005, the estimated value of the option years on our contracts was $1,010.0 million and $1,092.2 million, respectively.
Indefinite Delivery Contracts. Indefinite delivery contracts are signed contracts under which we perform work only when the client issues specific task orders. Generally, the terms of these contracts exceed one year and often include a maximum term and potential value. IDCs generally range from one to twenty years in length. When such task orders are signed and funded, we transfer their value into backlog. As of December 29, 2006 and December 30, 2005, the estimated remaining value of our consolidated IDCs was $5,177.7 million and $5,064.7 million, respectively.
While the value of our book of business is a predictor of future revenues, we have no assurance, nor can we provide assurance that we will ultimately realize the maximum potential values for backlog, designations, option years or IDCs. Based on our historical experience, our backlog has the highest likelihood of being converted into revenues because it is based upon signed and executable contracts with our clients. Although there is a high probability that our designations will eventually convert into revenues, they are not as certain as backlog because our clients have not yet signed a contract with us. Due to the nature of option years, which are exercisable at the option of our clients, the likelihood of their conversion into revenues is lower than that of backlog, but higher than that of designations because we have a signed contract with the client and do not need to go through a competitive bidding process to obtain the option on the contract. Because we do not perform work under IDCs until specific task orders are issued, the value of our IDCs are not as likely to convert into revenues as other categories of our book of business.
Acquisitions
We have historically made strategic acquisitions in order to diversify our client base, increase the range of services we offer and expand the markets we serve. In September 2006, we acquired Cash & Associates, a small civil and structural engineering firm that specializes in the planning and design and program management of ports and harbors projects. The acquisition of Cash & Associates enhances our capabilities in the ports and harbors market, which we expect will experience significant growth over the next 10 years, due to increased maritime trade and the need for additional infrastructure and security.
History
We were originally incorporated in California on May 1, 1957 under the former name of Broadview Research Corporation. On May 18, 1976, we re-incorporated in Delaware. On March 28, 1974, we changed our name to URS Corporation. Since then, we have implemented several name changes as a result of mergers and acquisitions. On February 21, 1990, we changed our name back to URS Corporation.
Regulations
We provide services for contracts that are subject to government oversight, including environmental laws and regulations, general government procurement laws and regulations, and other government regulations and requirements. For more information on risks associated with our government regulations, please refer to Item 1A, “Risk Factors,” of this report.
Environmental. A portion of our business involves the planning, design, program management, and construction management and operation and maintenance of pollution control facilities, as well as the assessment, design and management of remediation activities at hazardous waste or Superfund sites and military bases. In addition, we have contracts with U.S. governmental entities to destroy hazardous materials, including chemical agents and weapons stockpiles. These activities may require us to manage, handle, remove, treat, transport and dispose of toxic or hazardous substances.
Some environmental laws including the Resource Conservation and Recovery Act of 1976, as amended, (“RCRA”), and the Comprehensive Environmental Response Compensation and Liability Act of 1980, as amended, (“CERCLA”), as well as other governmental laws can impose liability for the entire cost of the clean-up of contaminated facilities or sites upon present and former owners and operators as well as generators, transporters and persons arranging for the treatment or disposal of such substances. While we strive to handle hazardous and toxic substances with care and in accordance with safe methods, the possibility of accidents, leaks, spills and the events of force majeure always exist. Humans exposed to these materials, including workers or subcontractors engaged in the transportation and disposal of hazardous materials, and persons in affected areas may be injured or become ill, resulting in lawsuits that expose us to liability and may result in substantial damage awards against us. Liabilities for contamination or human exposure to hazardous or toxic materials or a failure to comply with applicable regulations could result in substantial costs to us, including clean-up costs, fines and civil or criminal sanctions, third party claims for property damage or personal injury, or cessation of remediation activities.
Some of our business operations are covered by Public Law 85-804, which provides for government indemnification against claims and damages arising out of unusually hazardous or nuclear activities performed at the request of the government. Should public policies and laws be changed, however, government indemnification may not be available in the case of any future claims or liabilities relating to hazardous activities that we undertake to perform.
Government Procurement. The services we provide to the U.S. federal government are subject to the Federal Acquisition Regulation (“FAR”), the Truth in Negotiations Act (“TINA”), the Cost Accounting Standards (“CAS”), the Service Contract Act (“SCA”), DOD security regulations and other rules and regulations applicable to government contracts. These laws and regulations affect how we transact business with our government clients and in some instances, impose added costs to our business operations. A violation of specific laws and regulations could lead to fines, contract termination or suspension of future contracts. Our government clients can also terminate or modify any of their contracts with us at their convenience, and many of our government contracts are subject to renewal or extension annually.
Other regulations and requirements. We provide services to the U.S. DOD and other defense-related entities that often require specialized professional qualifications and security clearances. Our international business is also subject to the Foreign Corrupt Practices Act, as well as various export control, anti-boycott, and embargo laws. In addition, as engineering design services professionals, we are subject to a variety of local, state and foreign licensing and permit requirements.
Sales and Marketing
Our URS Division performs business development and sales activities primarily through our network of local offices around the world. For large, market-specific projects requiring diverse technical capabilities, we utilize the companywide resources of specific disciplines. This often involves coordinating marketing efforts on a regional, national or global level. Our EG&G Division performs business development and sales activities primarily through its management groups, which address specific markets, such as homeland security and defense systems. In addition, our EG&G Division coordinates national marketing efforts on large projects and for multi-division or multi-market scope efforts. Over the past year, the URS Division and the EG&G Division have jointly pursued several federal defense and homeland security projects, and have been successful in marketing EG&G’s technical capabilities to URS’ established state and local government clients.
Seasonality
We experience seasonal trends in our business in connection with federal holidays, such as Memorial Day, Independence Day, Thanksgiving, Christmas and New Year’s Day. Our revenues are typically lower during these times of the year because many of our clients’ employees as well as our own employees do not work during these holidays, resulting in fewer billable hours worked on projects and thus lesser revenues recognized. In addition to holidays, our business also is affected by seasonal bad weather conditions that occasionally cause some of our offices to close temporarily.
Raw Materials
As a professional services company, our business is not heavily dependent on raw materials. Risks associated with the procurement of raw materials for our construction services projects are generally passed through to our clients. We do not foresee the lack of availability of raw materials as a factor that could have a material adverse effect on our business in the near term.
Insurance
Our insurance policy includes primary and excess limits totaling $125.0 million per loss and $125.0 million in the aggregate for general liability, professional errors and omissions liability and contractor’s pollution liability insurance (in addition to other policies for some specific projects). The general liability policy includes a self-insured claim retention of $4.0 million (or $10.0 million in some circumstances). The professional errors and omissions liability and contractor’s pollution liability insurance policies each include a self-insured claim retention amount of $10.0 million each. Parties may seek damages that substantially exceed our insurance coverage.
Excess insurance policies above our primary policy limits provide for coverages on a “claims made” basis, covering only claims actually made and reported during the policy period currently in effect. Thus, if we do not continue to maintain these policies, we will have no coverage for claims made after the termination date, even for claims based on events that occurred during the term of coverage. While we intend to maintain these policies, we may be unable to maintain existing coverage levels. We have maintained insurance without lapse for many years with limits in excess of losses sustained.
Employees
As of January 31, 2007, we had approximately 26,000 full-time employees and 3,300 temporary or part-time workers. The URS Division and the EG&G Division employed approximately 17,000 and 12,300 persons (including temporary and part-time workers), respectively. At various times, we have employed up to several thousand workers on a temporary or part-time basis to meet our contractual obligations. Approximately 2,300 of our employees are covered by collective bargaining agreements. These agreements are subject to amendment on various dates ranging from March 2007 to July 2010.
Available Information
Our annual reports on Form 10-K, quarterly reports on Form 10-Q, current reports on Form 8-K and amendments to those reports filed or furnished pursuant to Section 13(a) or 15(d) of the Securities Exchange Act of 1934, as amended, are available free of charge on our web site at www.urscorp.com. These reports, and any amendments to these reports, are made available on our web site as soon as reasonably practicable after we electronically file or furnish the reports with the Securities and Exchange Commission (“SEC”). You may read and copy any materials filed with the SEC at the SEC’s Public Reference Room at 100 F Street, N.E., Washington, D.C. 20549. Please call the SEC at 1-800-SEC-0330 for further information about the public reference room. The SEC also maintains a web site (www.sec.gov) containing reports, proxy, and other information that we filed with the SEC. In addition, our Corporate Governance Guidelines, the charters for our Audit, Board Affairs and Compensation Committees, and our Code of Business Conduct and Ethics are available on our web site at www.urscorp.com under the “Corporate Governance” section. Any waivers or amendments to our Code of Business Conduct and Ethics will be posted on our web site. A printed copy of this information is also available without charge by sending a written request to: Corporate Secretary, URS Corporation, 600 Montgomery Street, 26th Floor, San Francisco, CA 94111-2728.
In addition to the other information included or incorporated by reference in this Form 10-K, the following risk factors could affect our financial condition and results of operations and should be read in conjunction with Management’s Discussion and Analysis of Financial Condition and Results of Operations beginning on page 28 and the consolidated financial statements and related notes beginning on page 56 .
Demand for our services is cyclical and vulnerable to economic downturns. If the economy weakens, then our revenues, net income and financial condition may deteriorate.
Demand for our services in our infrastructure and defense markets is cyclical and vulnerable to sudden economic downturns, which may result in clients delaying, curtailing or canceling proposed and existing projects. For example, there was a decrease in our URS Division revenues of $77.9 million, or 3.4%, in fiscal year 2002 compared to fiscal year 2001 as a result of the general economic decline. Our clients may demand better pricing terms and their ability to pay our invoices may be affected by a weakening economy. Our government clients may face budget deficits that prohibit them from funding proposed and existing projects. Our business traditionally lags the overall recovery in the economy; therefore, our business may not recover immediately when the economy improves. If the economy weakens, then our revenues, net income and overall financial condition may deteriorate.
We may not realize the full amount of revenues reflected in our book of business, which could harm our operations and significantly reduce our future revenues.
We account for all contract awards that may eventually be recognized as revenues as our “book of business,” which includes backlog, designations, option years and IDCs. Our backlog consists of the amount billable at a particular point in time, including task orders issued under IDCs. As of December 29, 2006, our backlog was approximately $4.6 billion. Our designations consist of projects that clients have awarded us, but for which we do not yet have signed contracts. Our option year contracts are multi-year contracts with base periods, plus option years that are exercisable by our clients without the need for us to go through another competitive bidding process. Our IDCs are signed contracts under which we perform work only when our clients issue specific task orders. Our book of business estimates may not result in actual revenues in any particular period because clients may modify or terminate projects and contracts and may decide not to exercise contract options or issue task orders. If we do not realize a substantial amount of our book of business, our operations could be harmed and our future revenues could be significantly reduced.
As a government contractor, we are subject to a number of procurement laws, regulations and government audits; a violation of any such laws and regulations could result in sanctions, contract termination, forfeiture of profit, harm to our reputation or loss of our status as an eligible government contractor.
We must comply with and are affected by federal, state, local and foreign laws and regulations relating to the formation, administration and performance of government contracts. For example, we must comply with the FAR, the TINA, the CAS, the SCA and the DOD security regulations, as well as many other laws and regulations. These laws and regulations affect how we transact business with our clients and in some instances, impose additional costs on our business operations. Even though we take precautions to prevent and deter fraud, misconduct and non-compliance, we face the risk that our employees or outside partners may engage in misconduct, fraud or other improper activities. Government agencies, such as the U.S. Defense Contract Audit Agency (“DCAA”), routinely audit and investigate government contractors. These government agencies review and audit a government contractor’s performance under its contracts and cost structure, and compliance with applicable laws, regulations and standards. In addition, during the course of its audits, the DCAA may question our incurred project costs, and if the DCAA believes we have accounted for such costs in a manner inconsistent with the requirements for the FAR or CAS, the DCAA auditor may recommend to our U.S. government corporate administrative contracting officer to disallow such costs. Historically, we have not experienced significant disallowed costs as a result of government audits. However, we can provide no assurance that the DCAA or other government audits will not result in material disallowances for incurred costs in the future. Government contract violations could result in the imposition of civil and criminal penalties or sanctions, contract termination, forfeiture of profit, and/or suspension of payment, any of which could make us lose our status as an eligible government contractor. We could also suffer serious harm to our reputation.
Because we depend on federal, state and local governments for a significant portion of our revenue, our inability to win or renew government contracts during regulated procurement processes could harm our operations and significantly reduce or eliminate our profits.
Revenues from federal government contracts and state and local government contracts represented approximately 45% and 22%, respectively, of our total revenues for the year ended December 29, 2006. Government contracts are awarded through a regulated procurement process. The federal government has increasingly relied upon multi-year contracts with pre-established terms and conditions, such as IDCs, that generally require those contractors who have previously been awarded the IDC to engage in an additional competitive bidding process before a task order is issued. The increased competition, in turn, may require us to make sustained efforts to reduce costs in order to realize revenues and profits under government contracts. If we are not successful in reducing the amount of costs we incur, our profitability on government contracts will be negatively impacted. Moreover, even if we are qualified to work on a government contract, we may not be awarded the contract because of existing government policies designed to protect small businesses and underrepresented minority contractors. Our inability to win or renew government contracts during regulated procurement processes could harm our operations and significantly reduce or eliminate our profits. Each year some government contracts may be dependent on the legislative appropriations process. If legislative appropriations are not made in subsequent years of a multiple-year government contract, then we may not realize all of our potential revenues and profits from that contract.
Each year the funding for some of our government contracts may be dependent on the legislative appropriations process. For example, the passage of the SAFETEA-LU highway and transit bill in August of 2005 has provided additional funding for state transportation projects in which we provide services. Legislatures may appropriate funds for a given project on a year-by-year basis, even though the project may take more than one year to perform. As a result, at the beginning of a project, the related contract may only be partially funded, and additional funding is committed only as appropriations are made in each subsequent year. These appropriations, and the timing of payment of appropriated amounts, may be influenced by, among other things, the state of the economy, competing political priorities, curtailments in the use of government contracting firms, rise in raw material costs, delays associated with a lack of a sufficient number of government staff to oversee contracts, budget constraints, the timing and amount of tax receipts and the overall level of government expenditures. If appropriations are not made in subsequent years of a multiple-year contract, we may not realize all of our potential revenues and profits from that contract.
Our government contracts may give the government the right to modify, delay, curtail or terminate our contracts at their convenience at any time prior to their completion and, if we do not replace these contracts, then we may suffer a decline in revenues.
Government projects in which we participate as a contractor or subcontractor may extend for several years. Generally, government contracts include the right for the government to modify, delay, curtail or terminate contracts and subcontracts at their convenience any time prior to their completion. Any decision by a government client to modify, delay, curtail or terminate our contracts at their convenience may result in a decline in revenues.
If we are unable to accurately estimate and control our contract costs, then we may incur losses on our contracts, which could decrease our operating margins and significantly reduce or eliminate our profits.
It is important for us to control our contract costs so that we can maintain positive operating margins. We generally enter into three principal types of contracts with our clients: cost-plus, fixed-price and time-and-materials. Under cost-plus contracts, which may be subject to contract ceiling amounts, we are reimbursed for allowable costs and fees, which may be fixed or performance-based. If our costs exceed the contract ceiling or are not allowable under the provisions of the contract or any applicable regulations, we may not be reimbursed for all of the costs we incur. Under fixed-price contracts, we receive a fixed price regardless of what our actual costs will be. Consequently, we realize a profit on fixed-price contracts only if we control our costs and prevent cost over-runs on the contracts. Under time-and-materials contracts, we are paid for labor at negotiated hourly billing rates and for other expenses. Profitability on our contracts is driven by billable headcount and our ability to manage costs. Under each type of contract, if we are unable to control costs, we may incur losses on our contracts, which could decrease our operating margins and significantly reduce or eliminate our profits.
Our actual results could differ from the estimates and assumptions that we use to prepare our financial statements, which may significantly reduce or eliminate our profits.
To prepare financial statements in conformity with generally accepted accounting principles, management is required to make estimates and assumptions as of the date of the financial statements, which affect the reported values of assets and liabilities and revenues and expenses and disclosures of contingent assets and liabilities. Areas requiring significant estimates by our management include:
| · | the application of the “percentage-of-completion” method of accounting, and revenue recognition on contracts, change orders, and contract claims; |
| · | provisions for uncollectible receivables and customer claims and recoveries of costs from subcontractors, vendors and others; |
| · | provisions for income taxes and related valuation allowances; |
| · | value of goodwill and recoverability of other intangible assets; |
| · | valuation of assets acquired and liabilities assumed in connection with business combinations; |
| · | valuation of defined benefit pension plans and other employee benefit plans; |
| · | valuation of stock-based compensation expense; and |
| · | accruals for estimated liabilities, including litigation and insurance reserves. |
Our actual results could differ from those estimates, which may significantly reduce or eliminate our profits.
Our use of the “percentage-of-completion” method of accounting could result in a reduction or a reversal of previously recorded revenues and profits.
A substantial portion of our revenues and profits are measured and recognized using the “percentage-of-completion” method of accounting, which is discussed in Note 1, “Accounting Policies,” to our “Consolidated Financial Statements and Supplementary Data” included under Item 8 of this report. Our use of this accounting method results in recognition of revenues and profits ratably over the life of a contract, based generally on the proportion of costs incurred to date to total costs expected to be incurred for the entire project. The effects of revisions to revenues and estimated costs are recorded when the amounts are known or can be reasonably estimated. Such revisions could occur in any period and their effects could be material. Although we have historically made reasonably reliable estimates of the progress towards completion of long-term engineering, program management, construction management or construction contracts in process, the uncertainties inherent in the estimating process make it possible for actual costs to vary materially from estimates, including reductions or reversals of previously recorded revenues and profits.
If our goodwill or intangible assets become impaired, then our profits may be significantly reduced or eliminated.
Because we have grown through acquisitions, goodwill and other intangible assets represent a substantial portion of our assets. Goodwill and other net purchased intangible assets were $993.0 million as of December 29, 2006. If any of our goodwill or intangible assets were to become impaired, we would be required to write off the impaired amount, which may significantly reduce or eliminate our profits.
Our failure to successfully bid on new contracts and renew existing contracts with private and public sector clients could adversely reduce or eliminate our profitability.
Our business depends on our ability to successfully bid on new contracts and renew existing contracts with private and public sector clients. Contract proposals and negotiations are complex and frequently involve a lengthy bidding and selection process, which are affected by a number of factors, such as market conditions, financing arrangements and required governmental approvals. For example, a client may require us to provide a bond or letter of credit to protect the client should we fail to perform under the terms of the contract. If negative market conditions arise, or if we fail to secure adequate financial arrangements or the required governmental approval, we may not be able to pursue particular projects, which could adversely reduce or eliminate our profitability.
If we fail to timely complete, miss a required performance standard or otherwise fail to adequately perform on a project, then we may incur a loss on that project, which may reduce or eliminate our overall profitability.
We may commit to a client that we will complete a project by a scheduled date. We may also commit that a project, when completed, will achieve specified performance standards. If the project is not completed by the scheduled date or fails to meet required performance standards, we may either incur significant additional costs or be held responsible for the costs incurred by the client to rectify damages due to late completion or failure to achieve the required performance standards. The uncertainty of the timing of a project can present difficulties in planning the amount of personnel needed for the project. If the project is delayed or canceled, we may bear the cost of an underutilized workforce that was dedicated to fulfilling the project. In addition, performance of projects can be affected by a number of factors beyond our control, including unavoidable delays from weather conditions, unavailability of vendor materials, changes in the project scope of services requested by clients or labor disruptions. In some cases, should we fail to meet required performance standards, we may also be subject to agreed-upon financial damages, which are determined by the contract. To the extent that these events occur, the total costs of the project could exceed our estimates and we could experience reduced profits or, in some cases, incur a loss on a project, which may reduce or eliminate our overall profitability.
If our partners fail to perform their contractual obligations on a project, we could be exposed to liability, loss of reputation or reduced or eliminated profits.
We sometimes enter into subcontracts, joint ventures and other contractual arrangements with outside partners to jointly bid on and execute a particular project. The success of these joint projects depends upon, among other things, the satisfactory performance of the contractual obligations of our partners. If any of our partners fails to satisfactorily perform its contractual obligations, we may be required to make additional expenditures and provide additional services to complete the project. If we are unable to adequately address our partner’s performance issues, then our client could terminate the joint project, exposing us to liability, loss of reputation or reduced or eliminated profits.
We may be subject to substantial liabilities under environmental laws and regulations.
A portion of our environmental business involves the planning, design, program management, construction management and operation and maintenance of pollution control facilities, hazardous waste or Superfund sites and military bases. In addition, we have contracts with U.S. governmental entities to destroy hazardous materials, including chemical agents and weapons stockpiles. These activities may require us to manage, handle, remove, treat, transport and dispose of toxic or hazardous substances. We must comply with a number of governmental laws that strictly regulate the handling, removal, treatment, transportation and disposal of toxic and hazardous substances. Under the CERCLA and comparable state laws, we may be required to investigate and remediate regulated hazardous materials. CERCLA and comparable state laws typically impose strict, joint and several liabilities without regard to whether a company knew of or caused the release of hazardous substances. The liability for the entire cost of clean up can be imposed upon any responsible party. Other principal federal environmental, health and safety laws affecting us include, but are not limited to, the RCRA, the National Environmental Policy Act, the Clean Air Act, the Clean Air Interstate Rule, the Clean Air Mercury Rule, the Occupational Safety and Health Act, the Toxic Substances Control Act and the Superfund Amendments and Reauthorization Act. Our business operations may also be subject to similar state and international laws relating to environmental protection. Liabilities related to environmental contamination or human exposure to hazardous substances, or a failure to comply with applicable regulations could result in substantial costs to us, including clean-up costs, fines and civil or criminal sanctions, third party claims for property damage or personal injury or cessation of remediation activities. Our continuing work in the areas governed by these laws and regulations exposes us to the risk of substantial liability; however, we are currently not subject to any material claims under environmental laws and regulations.
Our liability for damages due to legal proceedings may adversely affect us and result in a significant loss.
In performing our services, we may be exposed to legal proceedings in connection with cost overruns, personal injury claims, property damage, labor shortages or disputes, weather problems and unforeseen engineering, architectural, environmental and geological problems. In some actions, parties may seek damages that exceed our insurance coverage. Currently, we have limits of $125.0 million per loss and $125.0 million in the aggregate for general liability, professional errors and omissions liability and contractor’s pollution liability insurance (in addition to other policies for some specific projects). The general liability policy includes a self-insured claim retention of $4.0 million (or $10.0 million in some circumstances). The professional errors and omissions liability and contractor’s pollution liability insurance policies include a self-insured claim retention amount of $10.0 million each. Our services may require us to make judgments and recommendations about environmental, structural, geotechnical and other physical conditions at project sites. If our performance, judgments and recommendations are later found to be incomplete or incorrect, then we may be liable for the resulting damages. Various legal proceedings are pending against us in connection with the performance of our professional services and other actions by us. Although the outcome of our legal proceedings cannot be predicted with certainty and no assurance can be provided as to a favorable outcome, based on our previous experience in these matters, we do not believe that any of our legal proceedings, individually or collectively, are likely to exceed established loss accruals or our various professional errors and omissions, project-specific and other insurance policies. However, the resolution of outstanding claims is subject to inherent uncertainty and it is reasonably possible that any resolution could have an adverse effect on us. If we sustain damages that exceed our insurance coverage or for which we are not insured, our results of operations and financial condition could be harmed.
Changes in environmental laws, regulations and programs could reduce demand for our environmental services, which could in turn negatively impact our revenues.
Our environmental services business is driven by federal, state, local and foreign laws, regulations and programs related to pollution and environmental protection. For example, passage of the Clean Air Interstate and Clean Air Mercury environmental rules has increased our emissions control business. On the other hand, a relaxation or repeal of these laws and regulations, or changes in governmental policies regarding the funding, implementation or enforcement of these programs, could result in a decline in demand for environmental services, which could in turn negatively impact our revenues.
A decline in U.S. defense spending or a change in budgetary priorities could harm our operations and significantly reduce our future revenues.
Revenues under contracts with the DOD and other defense-related clients represented approximately 36% of our total revenues for the fiscal year ended December 29, 2006. While spending authorization for defense-related programs has increased significantly in recent years due to greater homeland security and foreign military commitments, as well as the trend to outsource federal government jobs to the private sector, these spending levels may not be sustainable. For example, the DOD budget declined in the late 1980s and the early 1990s, resulting in DOD program delays and cancellations. Future levels of expenditures and authorizations for these programs may decrease, remain constant or shift to programs in areas where we do not currently provide services. As a result, a general decline in U.S. defense spending or a change in budgetary priorities could harm our operations and significantly reduce our future revenues.
Our overall market share will decline if we are unable to compete successfully in our industry.
Our industry is highly fragmented and intensely competitive. According to the publication Engineering News-Record, based on information voluntarily reported by 500 design firms, the top ten engineering design firms only accounted for approximately 32% of the total design firm revenues in 2005. Our competitors are numerous, ranging from small private firms to multi-billion dollar companies. In addition, the technical and professional aspects of our services generally do not require large upfront capital expenditures and provide limited barriers against new competitors.
Some of our competitors have achieved greater market penetration in some of the markets in which we compete and have substantially more financial resources and/or financial flexibility than we do. As a result of the number of competitors in the industry, our clients may select one of our competitors on a project due to competitive pricing or a specific skill set. If we are unable to maintain our competitiveness, our market share will decline. These competitive forces could have a material adverse effect on our business, financial condition and results of operations by reducing our relative share in the markets we serve.
Our failure to attract and retain key employees could impair our ability to provide services to our clients and otherwise conduct our business effectively.
As a professional and technical services company, we are labor intensive and therefore, our ability to attract, retain and expand our senior management and our professional and technical staff is an important factor in determining our future success. From time to time, it may be difficult to attract and retain qualified individuals with the expertise and in the timeframe demanded by our clients. For example, some of our government contracts may require us to employ only individuals who have particular government security clearance levels. In addition, we rely heavily upon the expertise and leadership of our senior management. The failure to attract and retain key individuals could impair our ability to provide services to our clients and conduct our business effectively.
Employee, agent, or partner misconduct or our failure to comply with laws or regulations could weaken our ability to win contracts with government clients, which could result in decreasing revenues.
As a federal, state and local government contractor, misconduct, fraud, non-compliance with applicable laws and regulations, or other improper activities by one of our employees, agents, or partners could have a significant negative impact on our business and reputation. Such misconduct could include the failure to comply with government procurement regulations, regulations regarding the protection of classified information, laws regarding the pricing of labor and other costs in government contracts, regulations on lobbying or similar activities, environmental laws and any other applicable laws or regulations. For example, we regularly provide services that may be highly sensitive or that relate to critical national security matters; if a security breach were to occur, our ability to procure future government contracts could be severely limited. Other examples of potential misconduct include time card fraud and violations of the Anti-Kickback Act. The precautions we take to prevent and detect these activities may not be effective, and we could face unknown risks or losses. Our failure to comply with applicable laws or regulations or acts of misconduct could subject us to fines and penalties, loss of security clearance and suspension or debarment from contracting, which could weaken our ability to win future contract with government clients.
Recent changes in accounting for equity-related compensation have impacted our financial statements and could negatively impact our ability to attract and retain key employees.
We adopted Statement of Financial Accounting Standards No. 123 (revised 2004), “Share-Based Payment,” (“SFAS 123(R)”) on December 31, 2005. At that time, we evaluated our current stock-based compensation plans and employee stock purchase plans. In order to minimize the volatility of our stock-based compensation expense, we are currently issuing restricted stock awards and units to selected employees rather than granting stock options. We also revised our employee stock purchase plan from a 15% discount on our stock price at the beginning or the end of the six-month offering period, whichever is lower, to a 5% discount on our stock price at the end of the six-month offering period. These changes to our equity-related compensation may negatively impact our ability to attract and retain key employees.
Our indebtedness could limit our ability to finance future operations or engage in other business activities.
As of December 29, 2006, we had $168.6 million of total outstanding indebtedness and $61.3 million in letters of credit outstanding against our revolving line of credit. This level of indebtedness could negatively affect us because it may impair our ability to borrow in the future and make us more vulnerable in an economic downturn. Our current credit facility contains customary financial, affirmative and negative covenants for a company with a similar financial position to ours. As of December 29, 2006, we were in compliance with all the convenants of our credit facility.
Because we are a holding company, we may not be able to service our debt if our subsidiaries do not make sufficient distributions to us.
We have no direct operations and no significant assets other than investments in the stock of our subsidiaries. Because we conduct our business operations through our operating subsidiaries, we depend on those entities for payments and dividends to generate the funds necessary to meet our financial obligations. Legal restrictions, including local regulations and contractual obligations associated with secured loans, such as equipment financings, could restrict our subsidiaries’ ability to pay dividends or make loans or other distributions to us. The earnings from, or other available assets of, these operating subsidiaries may not be sufficient to make distributions to enable us to pay interest on our debt obligations when due or to pay the principal of such debt at maturity. As of December 29, 2006, our debt service obligations, comprised of principal and interest (excluding capital leases), during the next twelve months will be approximately $17.0 million. Based on the current outstanding indebtedness of $114.0 million under our current credit facility, if market rates were to average 1% higher during that same twelve-month period, our net of tax interest expense would increase by approximately $0.7 million.
Our international operations are subject to a number of risks that could harm our operations and significantly reduce our future revenues.
As a multinational company, we have operations in over 20 countries and we derived 10% of our revenues from international operations for both fiscal years ended December 29, 2006 and December 30, 2005. International business is subject to a variety of risks, including:
| · | lack of developed legal systems to enforce contractual rights; |
| · | greater risk of uncollectible accounts and longer collection cycles; |
| · | logistical and communication challenges; |
| · | potentially adverse changes in laws and regulatory practices, including export license requirements, trade barriers, tariffs and tax laws; |
| · | changes in labor conditions; |
| · | exposure to liability under the Foreign Corrupt Practices Act and export control and anti-boycott laws; and |
| · | general economic and political conditions in foreign markets. |
These and other risks associated with international operations could harm our overall operations and significantly reduce our future revenues. In addition, services billed through foreign subsidiaries are attributed to the international category of our business, regardless of where the services are performed and conversely, services billed through domestic operating subsidiaries are attributed to a domestic category of clients, regardless of where the services are performed. As a result, our international risk exposure may be more or less than the percentage of revenues attributed to our international operations.
Our business activities may require our employees to travel to and work in high security risk countries, which may result in employee death or injury, repatriation costs or other unforeseen costs.
As a multinational company, our employees often travel to and work in high security risk countries around the world that are undergoing political, social and economic upheavals resulting in war, civil unrest, criminal activity or acts of terrorism. For example, we have employees working in high security risk countries located in the Middle East and Southwest Asia. As a result, we may be subject to costs related to employee death or injury, repatriation or other unforeseen circumstances.
We rely on third party software to run our critical accounting, project management, and financial information systems, and as a result, any sudden loss, disruption or unexpected costs to maintain such systems could significantly increase our operational expense as well as disrupt the management of our business operations.
We rely on third party software to run our critical accounting, project management and financial information systems. For example, we relied on one software vendor’s products to process approximately 63% of our total revenues as of December 29, 2006. We also depend on our third party software vendors to provide long-term software maintenance support for our information systems. Software vendors may decide to discontinue further development, integration or long-term software maintenance support for our information systems, in which case we may need to abandon one or more of our current information systems and migrate some or all of our accounting, project management and financial information to other systems, thus increasing our operational expense as well as disrupting the management of our business operations.
Force majeure events, including natural disasters and terrorists’ actions have negatively impacted and could further negatively impact the economies in which we operate, which may affect our financial condition, results of operations or cash flows.
Force majeure events, including natural disasters, such as Hurricane Katrina that affected the Gulf Coast in August 2005 and terrorist attacks, such as those that occurred in New York and Washington, D.C. on September 11, 2001, could negatively impact the economies in which we operate. For example, Hurricane Katrina caused several of our Gulf Coast offices to close, interrupted a number of active client projects and forced the relocation of our employees in that region from their homes. In addition, during the September 11, 2001 terrorist attacks, several of our offices were shut down due to terrorist attack warnings.
We typically remain obligated to perform our services after a terrorist action or natural disaster unless the contract contains a force majeure clause relieving us of our contractual obligations in such an extraordinary event. If we are not able to react quickly to force majeure, our operations may be affected significantly, which would have a negative impact on our financial condition, results of operations or cash flows.
Negotiations with labor unions and possible work actions could divert management attention and disrupt operations. In addition, new collective bargaining agreements or amendments to agreements could increase our labor costs and operating expenses.
As of December 29, 2006, approximately 8% of our employees were covered by collective bargaining agreements. The outcome of any future negotiations relating to union representation or collective bargaining agreements may not be favorable to us. We may reach agreements in collective bargaining that increase our operating expenses and lower our net income as a result of higher wages or benefits expenses. In addition, negotiations with unions could divert management attention and disrupt operations, which may adversely affect our results of operations. If we are unable to negotiate acceptable collective bargaining agreements, we may have to address the threat of union-initiated work actions, including strikes. Depending on the nature of the threat or the type and duration of any work action, these actions could disrupt our operations and adversely affect our operating results.
We have only a limited ability to protect our intellectual property rights, which are important to our success. Our failure to protect our intellectual property rights could adversely affect our competitive position.
Our success depends, in part, upon our ability to protect our proprietary information and other intellectual property. We rely principally on trade secrets to protect much of our intellectual property where we do not believe that patent or copyright protection is appropriate or obtainable. However, trade secrets are difficult to protect. Although our employees are subject to confidentiality obligations, this protection may be inadequate to deter or prevent misappropriation of our confidential information. In addition, we may be unable to detect unauthorized use of our intellectual property or otherwise take appropriate steps to enforce our rights. Failure to obtain or maintain trade secret protection would adversely affect our competitive business position. In addition, if we are unable to prevent third parties from infringing or misappropriating our trademarks or other proprietary information, our competitive position could be adversely affected.
Delaware law and our charter documents may impede or discourage a merger, takeover or other business combination even if the business combination would have been in the best interests of our current stockholders.
We are a Delaware corporation and the anti-takeover provisions of Delaware law impose various impediments to the ability of a third party to acquire control of us, even if a change in control would be beneficial to our existing stockholders. In addition, our board of directors has the power, without stockholder approval, to designate the terms of one or more series of preferred stock and issue shares of preferred stock, which could be used defensively if a takeover is threatened. Our incorporation under Delaware law, the ability of our board of directors to create and issue a new series of preferred stock and provisions in our certificate of incorporation and by-laws could impede a merger, takeover or other business combination involving us or discourage a potential acquirer from making a tender offer for our common stock, even if the business combination would have been in the best interests of our current stockholders.
None.
As of December 29, 2006, we had approximately 393 facility leases in locations throughout the world. The lease terms range from a minimum of three months to a maximum of 27 years with options for renewal, expansions, contraction and termination, sublease rights and allowances for improvements. Our significant lease agreements expire at various dates through the year 2022. We believe that our current facilities are sufficient for the operation of our business and that suitable additional space in various local markets is available to accommodate any needs that may arise.
Various legal proceedings are pending against us and some of our subsidiaries alleging, among other things, breach of contract or tort in connection with the performance of professional services, the outcome of which cannot be predicted with certainty. See Note 8, “Commitments and Contingencies” to our “Consolidated Financial Statements and Supplementary Data” included under Item 8 of this report for a discussion of our most significant legal proceedings. Parties may seek damages that substantially exceed our insurance coverage.
Currently, we have limits of $125.0 million per loss and $125.0 million in the aggregate for general liability, professional errors and omissions liability and contractor’s pollution liability insurance (in addition to other policies for some specific projects). The general liability policy includes a self-insured claim retention of $4.0 million (or $10.0 million in some circumstances). The professional errors and omissions liability and contractor’s pollution liability insurance policies each include a self-insured claim retention amount of $10.0 million each. Parties may seek damages that substantially exceed our insurance coverage.
Excess insurance policies above our primary limits provide for coverages on a “claims made” basis, covering only claims actually made and reported during the policy period currently in effect. Thus, if we do not continue to maintain these policies, we will have no coverage for claims made after the termination date, even for claims based on events that occurred during the term of coverage. While we intend to maintain these policies, we may be unable to maintain existing coverage levels. We have maintained insurance without lapse for many years with limits in excess of losses sustained.
Although the outcome of our legal proceedings cannot be predicted with certainty and no assurances can be provided, based on our previous experience in such matters, we do not believe that any of the legal proceedings described in Note 8, “Commitments and Contingencies” to our “Consolidated Financial Statements and Supplementary Data” included under Item 8 of this report individually or collectively, are likely to materially exceed established loss accruals or our various professional errors and omissions, project-specific and potentially other insurance policies. However, the resolution of outstanding claims and litigation is subject to inherent uncertainty and it is reasonably possible that such resolution could differ materially from amounts provided and have an adverse effect on us.
ITEM 4. SUBMISSION OF MATTERS TO A VOTE OF SECURITY HOLDERS
None.
ITEM 4A. EXECUTIVE OFFICERS OF THE REGISTRANT
Name | Position Held | Age |
| Martin M. Koffel | Chief Executive Officer, President and Director from May 1989; Chairman of the Board from June 1989. | 67 |
| Thomas W. Bishop | Vice President, Strategy since July 2003; Senior Vice President, Construction Services since March 2002; Director of Operations for the Construction Services Division from 1999 to 2002. | 60 |
| Reed N. Brimhall | Chief Accounting Officer since May 2005; Vice President and Controller since May 2003; Senior Vice President and Controller of Washington Group International, Inc. (“WGI”) from 1999 to 2003. | 53 |
| H. Thomas Hicks | Vice President and Chief Financial Officer since March 2006; Vice President since September 2005; Managing Director of Investment Banking, Merrill Lynch from September 1997 to September 2005. | 56 |
| Gary V. Jandegian | President of the URS Division and Vice President of the Company since July 2003; Senior Vice President of URS Greiner Woodward-Clyde, Inc. (“URSGWC”) from 1998 to July 2003. | 54 |
| Susan B. Kilgannon | Vice President, Communications since October 1999. | 48 |
| Joseph Masters | Secretary since March 2006; Vice President and General Counsel since July 1995. | 50 |
| Randall A. Wotring | President of the EG&G Division and Vice President of the Company since November 2004; Vice President and General Manager of Engineering and Technology Services (“ETS”) of the EG&G Division from August 2002 to November 2004; Vice President and General Manager of ETS of EG&G Technical Services, Inc. from 1998 to August 2002. | 50 |
PART II
| MARKET FOR REGISTRANT’S COMMON EQUITY, RELATED STOCKHOLDER MATTERS, AND ISSUER PURCHASES OF EQUITY SECURITIES |
Market information
Our common stock is listed on the New York Stock Exchange (“NYSE”) under the symbol “URS.” At February 19, 2007, we had approximately 3,611 stockholders of record. The following table sets forth the high and low closing sale prices of our common stock for the periods indicated.
| | 2006 | 2005 |
Sale Price per Share | Low | High | Low | High |
| First Quarter | $38.26 | $44.75 | $27.21 | $31.53 |
| Second Quarter | $37.78 | $48.87 | $28.15 | $37.73 |
| Third Quarter | $36.79 | $41.99 | $36.45 | $40.39 |
| Fourth Quarter | $38.14 | $44.25 | $37.06 | $43.29 |
We have not paid cash dividends since 1986, and at the present time, we do not anticipate paying dividends on our outstanding common stock in the near future. In addition, we are precluded from paying dividends on our outstanding common stock pursuant to our credit facility with our lender. Please refer to Note 5, “Current and Long-Term Debt” and Note 9, “Stockholders’ Equity” to our “Consolidated Financial Statements and Supplementary Data” included under Item 8 of this report.
Stock-Based Compensation Plans
Information regarding our stock-based compensation awards outstanding and available for future grants as of December 29, 2006 is presented in Note 9, “Stockholders’ Equity” to our “Consolidated Financial Statements and Supplementary Data” included under Item 8 of this report.
Stock Purchases
The following table sets forth all purchases made by us or any “affiliated purchaser” as defined in Rule 10b-18(a)(3) of the Securities Exchange Act of 1934, as amended, of our common stock shares during the fourth quarter of 2006. No purchases were made pursuant to a publicly announced repurchase plan or program.
Period | | (a) Total Number of Shares Purchased (1) | | (b) Average Price Paid per Share | | (c) Total Number of Shares Purchased as Part of Publicly Announced Plans or Programs | | (d) Maximum Number (or Approximate Dollar Value) of Shares that May Yet be Purchased Under the Plans or Programs | |
| | | (in thousands, except average price paid per share) | |
| September 30, 2006 - October 27, 2006 | | | 24 | | $ | 38.14 | | | — | | | — | |
| October 28, 2006 - November 24, 2006 | | | 7 | | $ | 43.09 | | | — | | | — | |
| November 25, 2006 - December 29, 2006 | | | — | | $ | — | | | — | | | — | |
| Total | | | 31 | | | | | | — | | | — | |
| (1) | Our 1991 Stock Incentive Plan and 1999 Equity Incentive Plan (collectively, the “Stock Incentive Plans”) allow our employees to surrender shares of our common stock as payment toward the exercise cost and tax withholding obligations associated with the exercise of stock options or the vesting of restricted or deferred stock. |
The following selected financial data for the years ended December 29, 2006 and December 30, 2005, the two months ended December 31, 2004(1), the two months ended December 31, 2003 (unaudited), and the fiscal years ended October 31, 2004, 2003, and 2002 is derived from our audited consolidated financial statements and reflects our August 2002 acquisition of EG&G, which was accounted for under the purchase method of accounting. You should read the selected financial data presented below in conjunction with the information contained in Item 7, “Management’s Discussion and Analysis of Financial Condition and Results of Operations,” and our consolidated financial statements and the notes thereto contained in Item 8, “Consolidated Financial Statements and Supplementary Data,” of this report.
SELECTED FINANCIAL DATA
(In thousands, except per share data)
| | | Year Ended December 29, | | Year Ended December 30, | | Two Months Ended December 31, | | Years Ended October 31, | |
| | | 2006 | | 2005 (1) | | 2004 (1) | | 2003 (1) (Unaudited) | | 2004 | | 2003 | | 2002 | |
Income Statement Data: | | | | | | | | | | | | | | | |
| | | | | | | | | | | | | | | | |
| Revenues | | $ | 4,240,150 | | $ | 3,917,565 | | $ | 566,997 | | $ | 489,665 | | $ | 3,381,963 | | $ | 3,186,714 | | $ | 2,427,827 | |
| Direct operating expenses | | | 2,737,828 | | | 2,555,538 | | | 369,527 | | | 314,485 | | | 2,140,890 | | | 2,005,339 | | | 1,489,386 | |
| Gross profit | | | 1,502,322 | | | 1,362,027 | | | 197,470 | | | 175,180 | | | 1,241,073 | | | 1,181,375 | | | 938,441 | |
| Indirect, general and administrative expenses (2,4) | | | 1,283,533 | | | 1,187,605 | | | 188,400 | | | 153,609 | | | 1,079,088 | | | 999,977 | | | 790,099 | |
| Operating income | | | 218,789 | | | 174,422 | | | 9,070 | | | 21,571 | | | 161,985 | | | 181,398 | | | 148,342 | |
| Interest expense | | | 19,740 | | | 31,587 | | | 6,787 | | | 12,493 | | | 60,741 | | | 84,564 | | | 57,231 | |
| Income before income taxes and minority interest | | | 199,049 | | | 142,835 | | | 2,283 | | | 9,078 | | | 101,244 | | | 96,834 | | | 91,111 | |
| Income tax expense | | | 84,793 | | | 60,360 | | | 1,120 | | | 3,630 | | | 39,540 | | | 38,730 | | | 35,940 | |
| Minority interest in income of consolidated subsidiaries, net of tax | | | 1,244 | | | — | | | — | | | — | | | — | | | — | | | — | |
| Net income | | | 113,012 | | | 82,475 | | | 1,163 | | | 5,448 | | | 61,704 | | | 58,104 | | | 55,171 | |
| Preferred stock dividend | | | — | | | — | | | — | | | — | | | — | | | — | | | 5,939 | |
| Net income after preferred stock dividend | | | 113,012 | | | 82,475 | | | 1,163 | | | 5,448 | | | 61,704 | | | 58,104 | | | 49,232 | |
Less: net income allocated to convertible participating preferred stockholders under the two-class method | | | — | | | — | | | — | | | — | | | — | | | 894 | | | 907 | |
| Net income available for common stockholders | | $ | 113,012 | | $ | 82,475 | | $ | 1,163 | | $ | 5,448 | | $ | 61,704 | | $ | 57,210 | | $ | 48,325 | |
| | | | | | | | | | | | | | | | | | | | | | | |
| Earnings per share: | | | | | | | | | | | | | | | | | | | | | | |
| Basic | | $ | 2.23 | | $ | 1.76 | | $ | .03 | | $ | .16 | | $ | 1.58 | | $ | 1.78 | | $ | 2.18 | |
| Diluted | | $ | 2.19 | | $ | 1.72 | | $ | .03 | | $ | .16 | | $ | 1.53 | | $ | 1.76 | | $ | 2.03 | |
| | | | | | | | | | | | | | | | | | | | | | | |
Balance Sheet Data (As of the end of period): | | | | | | | | | | | | | | | | | | | | | | |
| Total assets | | $ | 2,581,029 | | $ | 2,469,448 | | $ | 2,307,748 | | $ | 2,219,319 | | $ | 2,275,045 | | $ | 2,193,723 | | $ | 2,251,905 | |
| Total long-term debt | | $ | 149,494 | | $ | 297,913 | | $ | 508,584 | | $ | 801,460 | | $ | 502,118 | | $ | 788,708 | | $ | 925,265 | |
| Preferred stock | | $ | — | | $ | — | | $ | — | | $ | — | | $ | — | | $ | — | | $ | 46,733 | |
| Stockholders’ equity (3) | | $ | 1,506,687 | | $ | 1,344,504 | | $ | 1,082,121 | | $ | 771,941 | | $ | 1,067,224 | | $ | 765,073 | | $ | 633,852 | |
| | | | | | | | | | | | | | | | | | | | | | | |
| (1) | Effective January 1, 2005, we adopted a 52/53 week fiscal year ending on the Friday closest to December 31st, with interim quarters ending on the Fridays closest to March 31st, June 30th, and September 30th. We filed a transition report on Form 10-Q with the SEC for the two months ended December 31, 2004. Our 2005 fiscal year began on January 1, 2005 and ended on December 30, 2005. |
| (2) | Indirect, general and administrative expenses for the 2006 fiscal year included stock-based compensation expense of $6.6 million recorded in accordance with Statement of Fianncial Accounting Standards No, 123(R), “Share-Based Payment” (“SFAS 123(R)”). There was no stock-based compensation expense related to employee stock options and employee stock purchases under Statement of Financial Accounting Standards No. 123, “Accounting for Stock-Based Compensation” (“SFAS 123”), prior to fiscal year 2006 because we did not adopt the recognition provisions of SFAS 123. See further discussion in Note 9, “Stockholders’ Equity” to our “Consolidated Financial Statements” included under Item 8 of this report. |
| (3) | Stockholders’ equity for fiscal year 2006 included the incremental effect of applying and the effects of adopting Statement of Financial Accounting Standards No. 158, “Employers’ Accounting for Defined Benefit Pension and Other Postretirement Plans — an amendment of FASB Statements No. 87, 88, 106 and 132(R)” (“SFAS 158”). During fiscal year 2006, we adopted SFAS 158 and recognized additional pension liabilities of approximately $4.4 million. We also reduced our stockholders’ equity by approximately $4.4 million on an after-tax basis. See further discussion in Note 10, “Employee Retirement and Post-Retirement Medical Plans” to our “Consolidated Financial Statements and Supplementary Data” included under Item 8 of this report. |
| (4) | Indirect, general and administrative expenses included charges of $0.2 million, $33.1 million and $28.2 million for costs incurred to extinguish our debt during the years ended December 29, 2006, December 30, 2005, and October 31, 2004, respectively. |
| MANAGEMENT’S DISCUSSION AND ANALYSIS OF FINANCIAL CONDITION AND RESULTS OF OPERATIONS |
The following discussion contains, in addition to historical information, forward-looking statements that involve risks and uncertainties. Our actual results could differ materially from those described here. You should read this section in conjunction with Item 1A, “Risk Factors,” of this report beginning on page 14 and the consolidated financial statements and notes thereto contained in Item 8, “Consolidated Financial Statements and Supplementary Data,” of this report.
Fiscal Year Change
Effective January 1, 2005, we adopted a 52/53 week fiscal year ending on the Friday closest to December 31st, with interim quarters ending on the Fridays closest to March 31st, June 30th and September 30th. We filed a transition report on Form 10-Q with the SEC for the two months ended December 31, 2004. Our 2006 fiscal year began on December 31, 2005 and ended on December 29, 2006.
Overview
Business Summary
We are one of the world’s largest engineering design services firms and a major federal government contractor for systems engineering and technical assistance, and operations and maintenance services. Our business focuses primarily on providing fee-based professional and technical services in the engineering and defense markets, although we perform some construction work. As a result, we are labor and not capital intensive. We derive income from our ability to generate revenues and collect cash from our clients through the billing of our employees’ time and our ability to manage our costs. We operate our business through two segments: the URS Division and the EG&G Division.
Our revenues are dependent upon our ability to attract qualified and productive employees, identify business opportunities, allocate our labor resources to profitable markets, secure new contracts, renew existing client agreements and provide outstanding services. Moreover, as a professional services company, the quality of the work generated by our employees is integral to our revenue generation.
Our costs are driven primarily by the compensation we pay to our employees, including fringe benefits, the cost of hiring subcontractors and other project-related expenses, and administrative, marketing, sales, bid and proposal, rental and other overhead costs.
Fiscal Year 2006 Revenues
Consolidated revenues for the year ended December 29, 2006 increased 8.2% over the consolidated revenues for the year ended December 30, 2005.
Because our business continues to grow and change, during the fiscal year ended December 29, 2006, we implemented a new process and refined our definitions for identifying contract revenues by client type. For our discussion and analysis of the year ended December 29, 2006 compared with the year ended December 30, 2005, we have reallocated the revenue identified with each market sector for the year ended December 30, 2005 on the basis of the new system adopted in 2006 to provide comparability with the allocation for the year ended December 29, 2006. However, for our discussion of the results of operations of the year ended December 30, 2005 compared with the year ended October 31, 2004, revenue by client type has not been reallocated, but is stated on a consistent basis for both periods presented.
Revenues from our federal government clients for the year ended December 29, 2006 increased approximately 7% compared with the year ended December 30, 2005. The increase reflects continued growth in demand for the services we provide to the Department of Defense (“DOD”) and the Department of Homeland Security (“DHS”), as a result of additional spending on engineering and technical services and operations and maintenance activities related to sustained U.S. military operations in the Middle East, and on security preparedness activities in the U.S. In addition, we experienced an increase in environmental and facilities projects, primarily under large bundled contracts for the DOD. We also began to see contract awards under the DOD’s Base Realignment and Closure (BRAC) program.
Revenues from our state and local government clients for the year ended December 29, 2006 increased approximately 7% compared with the year ended December 30, 2005. During 2006, many states experienced increases in tax receipts and, as a result, increased their general fund budgets.
The improved economic and fiscal situation contributed to increases in capital funding at the state and local government level for infrastructure projects, including transportation programs. The passage of the TEA-21 successor highway and transit bill, SAFETEA-LU, in August 2005 also had a positive effect on revenues from our state and local government clients. SAFETEA-LU provides $287 billion in federal matching funds for state transportation projects. In addition, during recent elections, voters in several states have passed bond initiatives and tax increases to fund infrastructure projects, including improvements to educational, flood control and transportation facilities.
Our revenues from domestic private sector clients for the year ended December 29, 2006 increased approximately 13% compared with the year ended December 30, 2005. Favorable economic conditions and high energy and commodity prices, led to increased capital spending by many of our domestic private sector clients. In addition, we benefited from our strategic shift towards building longer-term relationships with multinational corporations by migrating from stand-alone consulting contracts to longer-term Master Service Agreements (“MSAs”). As a result, we have leveraged our scale and diverse service offerings to more effectively compete for the new work funded by increased capital spending. In addition, we continued to increase revenues in the power emissions control business. This business is being driven by new environmental regulations, such as the Clean Air Interstate Rule and the Clean Air Mercury Rule, issued by the U.S. Environmental Protection Agency during 2005.
Revenues from our international clients for the year ended December 29, 2006 increased approximately 7% compared with the year ended December 30, 2005, largely the result of growth in the work we performed under MSAs for multinational corporations outside the U.S., particularly from our clients in the oil and gas industry. The impact of foreign currency fluctuations on our revenues for the 2006 fiscal year was immaterial. In Asia-Pacific, we benefited from strong economic growth, which has lead to increased funding for infrastructure projects, including transportation and water/wastewater projects. In addition, the increased global demand for mineral resources resulted in additional projects for the mining industry. In Europe, more stringent environmental regulations and new investments in infrastructure projects resulted in increased revenues. The growth in our international business reflects the successful implementation of our strategy to diversify beyond environmental services into the facilities and infrastructure markets internationally.
Cash Flows and Debt
During the year ended December 29, 2006, we generated $165.0 million in net cash from operations. (See “Consolidated Statements of Cash Flows” to our “Consolidated Financial Statements” included under Item 8 of this report.) While net income increased during the year ended December 29, 2006 compared with the same period in 2005, cash flows from operations decreased by $35.4 million due primarily to the timing of payments on accounts payable, a decrease in accrued expenses and an increase in deferred income tax asset, offset by increases in collections of accounts receivable.
Our ratio of debt to total capitalization (total debt divided by the sum of debt and total stockholder’s equity) improved from 19% at December 30, 2005 to 10% at December 29, 2006. The improvement in our debt to total capitalization ratio reflects our continued focus on de-leveraging our balance sheet.
We believe that our expectations regarding our business trends are reasonable and are based on reasonable assumptions. However, such forward-looking statements, by their nature, involve risks and uncertainties. You should read this discussion of business trends in conjunction with Item 1A, “Risk Factors,” of this report beginning on page 14.
Federal Government
Revenues from our federal government clients increased during 2006, and we expect revenue growth from our federal government clients to continue in fiscal year 2007, based on secured funding by the DOD and the DHS. The President has requested $93.4 billion supplemental funding to sustain military operations in the Middle East through the end of fiscal 2007. The request includes $37.2 billion for Operations and Maintenance activities and $735 million for Research, Development, Test and Evaluation - two of the largest service offerings by our EG&G Division. In addition, Congress approved a 7% increase in the DHS budget for 2007, which includes $4.3 billion for port security programs and $3.4 billion for emergency preparedness and prevention. These two items fund a large portion of our homeland security work.
We also view the latest round of the BRAC activities, which are designed to realign and consolidate U.S. military infrastructure worldwide, as a multi-year opportunity for our federal business. In February 2007, Congress approved $2.5 billion to fund BRAC projects in fiscal 2007 and the President’s 2008 DOD budget request includes $8.2 billion in BRAC funding, which is more than three times the 2007 funding level. Many of the bases targeted for realignment and closure will require environmental, planning and design services before they can be closed or redeveloped. Accordingly, the BRAC program may result in additional federal government opportunities for our URS Division, though it may have both positive and negative impacts on our EG&G Division.
We also anticipate that federal government infrastructure, facilities and environmental projects at military sites will increase under new and existing DOD contracts. Due to the size of our federal contracting business, we may see increased federal government opportunities for our URS and EG&G Divisions as a result of the increasing use of large “bundled” contracts issued by the DOD, which typically require the provision of a full range of services at multiple sites throughout the world.
State and Local Government
General fund spending by state government clients grew in fiscal 2006, and we expect this trend to continue in fiscal year 2007. Given the growing need to rebuild and modernize aging infrastructure and increasing tax receipts at the state level, we expect increased spending on infrastructure programs for which we provide services. We also expect the $287 billion highway and transit funding bill, SAFETEA-LU, to continue to provide stable funding for current and new transportation projects through 2009. In addition, we anticipate increased infrastructure spending as a result of bond issues, totaling approximately $68 billion, which were approved in November in 19 states to fund highway, public building and school improvement projects.
The increased spending on infrastructure programs, while beneficial to our business, is presenting us with some challenges. Rising raw material costs are leading to higher construction bids and depleting funds more quickly than state and municipal funding agencies had anticipated. As a result, we are seeing delays in the start-up of some planning and design assignments, as these agencies secure additional funding. We are also experiencing the effects of staffing shortages at some state and municipal agencies. After years of employee attrition, some agencies do not have sufficient personnel to manage multiple large programs concurrently.
Domestic Private Industry
We expect revenues from our domestic private industry clients to increase during the 2007 fiscal year compared to fiscal year 2006. The domestic private industry market has shown strong growth, particularly in the oil and gas, power and mining sectors. Many of our private industry clients are increasing capital expenditures as capacity utilization has grown to meet strong demand. We also expect the sustained profitability of our energy sector clients to continue to drive capital investment.
In addition, we anticipate continued growth in the power emissions control business, resulting from the requirements to cut sulfur dioxide and mercury emissions mandated by the Clean Air Interstate and Clean Air Mercury rules. We also expect to continue to benefit from our growing number of MSA contracts with multinational corporations, which have reduced the number of stand-alone consulting assignments we perform and are enabling us to win new work resulting from increased capital spending.
International
The increase in MSAs in our domestic private sector business has benefited and strengthened revenues from our international private sector clients. Notwithstanding the impact of foreign currency exchange rates, we expect revenues from our international clients to continue to increase in fiscal year 2007. In Europe, we expect to see increasing demand of our facilities design services for the United Kingdom Ministry of Defense and for the U.S. DOD at military installations overseas. In addition, we continue to see favorable market trends in Europe, including more stringent environmental regulations from the European Union and new investment in infrastructure projects—both leading to increased demand for the services we provide. In the Asia-Pacific region, we expect strong economic growth to increase opportunities in the infrastructure market. In addition, we anticipate that the increased global demand for mineral resources will provide additional opportunities in the mining sector.
Stock-based Compensation Expense
We adopted SFAS 123(R) on December 31, 2005, the beginning of our 2006 fiscal year, using the modified prospective transition method. Accordingly, results of prior periods have not been restated to reflect and do not include the impact of SFAS 123(R). Upon adoption of SFAS 123(R), we recorded stock-based compensation expense for all stock-based compensation awards granted prior to, but not yet recognized as of December 31, 2005, based on the fair value at the grant date in accordance with the original provisions of SFAS 123. In addition, we recorded compensation expense for the share-based payment awards granted between December 31, 2005 and December 29, 2006, based on the grant-date fair value estimated in accordance with the provisions of SFAS 123(R).
In light of the impact associated with the adoption of SFAS 123(R), since its adoption, we have issued only restricted stock awards and units, rather than stock options, to selected employees in order to minimize the volatility of our stock-based compensation expense.
Stock option awards expire ten years from the date of grant. Stock options, restricted stock awards, and restricted stock units vest over service periods that range from three to four years. Our Employee Stock Purchase Plan (“ESPP”) qualifies as a non-compensatory plan under SFAS 123(R). As a result of adopting SFAS 123(R) in 2006, our fiscal 2006 net income and diluted earnings per share were reduced by $3.8 million and $0.07, respectively.
Other
Our federal government and state and local government clients have been increasing their use of design-build delivery mechanisms, where we are the designer, but generally team up with a construction contractor in order to obtain the design-build contract. Design-build delivery mechanisms provide high margins, but also involve greater financial risk than traditional design-bid-build programs, where we contract directly with our clients.
We are experiencing an increase in the use of lump-sum fixed price contracts by our clients, which often include higher margins, but also present more financial risk than cost-plus and time-and-materials contracting mechanisms.
Some state and local government projects have been delayed due to the rising raw material costs and a shortage of government staff to implement new projects.
Results of Operations
| | | Year Ended December 29, 2006 | | Year Ended December 30, 2005 | | Increase (Decrease) | | Percentage Increase (Decrease) | |
| | | (In millions, except percentages and per share amounts) | |
| Revenues | | $ | 4,240.1 | | $ | 3,917.6 | | $ | 322.5 | | | 8.2 | % |
| Direct operating expenses | | | 2,737.8 | | | 2,555.6 | | | 182.2 | | | 7.1 | % |
Gross profit | | | 1,502.3 | | | 1,362.0 | | | 140.3 | | | 10.3 | % |
| Indirect, general and administrative expenses | | | 1,283.5 | | | 1,187.6 | | | 95.9 | | | 8.1 | % |
Operating income | | | 218.8 | | | 174.4 | | | 44.4 | | | 25.5 | % |
| Interest expense | | | 19.8 | | | 31.6 | | | (11.8 | ) | | (37.3 | %) |
| Income before income taxes and minority interest | | | 199.0 | | | 142.8 | | | 56.2 | | | 39.4 | % |
| Income tax expense | | | 84.8 | | | 60.3 | | | 24.5 | | | 40.6 | % |
| Minority interest in income of consolidated subsidiaries, net of tax | | | 1.2 | | | — | | | 1.2 | | | 100.0 | % |
| Net income | | $ | 113.0 | | $ | 82.5 | | $ | 30.5 | | | 37.0 | % |
| | | | | | | | | | | | | | |
| Diluted earnings per share | | $ | 2.19 | | $ | 1.72 | | $ | 0.47 | | | 27.3 | % |
The Year Ended December 29, 2006 Compared with the Year Ended December 30, 2005
Our consolidated revenues for the year ended December 29, 2006 increased by 8.2% compared with the year ended December 30, 2005. The increase was due primarily to a higher volume of work performed in each of our client categories during the year ended December 29, 2006, compared with the year ended December 30, 2005.
The following table presents our consolidated revenues by client type for the years ended December 29, 2006 and December 30, 2005.
| | | Year Ended December 29, 2006 | | Year Ended December 30, 2005 | | Increase | | Percentage Increase | |
| | | (In millions, except percentages) | |
Revenues | | | | | | | | | | | | | |
Federal government clients | | $ | 1,952 | | $ | 1,824 | | $ | 128 | | | 7 | % |
State and local government clients | | | 914 | | | 854 | | | 60 | | | 7 | % |
Domestic private industry clients | | | 970 | | | 862 | | | 108 | | | 13 | % |
International clients | | | 404 | | | 378 | | | 26 | | | 7 | % |
| Total revenues, net of eliminations | | $ | 4,240 | | $ | 3,918 | | $ | 322 | | | 8 | % |
Revenues from our federal government clients for the year ended December 29, 2006 increased by 7% compared with the year ended December 30, 2005. The increase reflects continued growth in demand for the services we provide to the DOD and the DHS, as a result of additional spending on engineering and technical services and operations and maintenance activities related to sustained U.S. military operations in the Middle East and on security preparedness activities in the U.S. We also experienced an increase in facilities and environmental projects, primarily under large bundled contracts for DOD agencies. In addition, we benefited from new work associated with the BRAC activities to realign and consolidate U.S. military installations worldwide.
The majority of our work in the state and local government, domestic private industry and the international sectors is derived from our URS Division. Further discussion of the factors and activities that drove changes in operations on a segment basis for the year ended December 29, 2006 can be found beginning on page 35.
Our consolidated direct operating expenses for the year ended December 29, 2006, which consist of direct labor, subcontractor costs and other direct expenses, increased by 7.1% compared with the year ended December 30, 2005. Because our revenues are primarily service-based, the factors that caused revenue growth also drove a corresponding increase in our direct operating expenses.
Our consolidated gross profit for the year ended December 29, 2006 increased by 10.3% compared with the year ended December 30, 2005, primarily due to the increase in our revenue volume described previously and to a lesser extent, pricing and award fee increases.
Our consolidated indirect, general and administrative (“IG&A”) expenses for the year ended December 29, 2006 increased by 8.1% compared with the year ended December 30, 2005. The increase was due to the following items:
| · | an increase of $90.8 million in employee-related expenses due to both changes in headcount and an increase in cost per employee, including stock compensation cost of $18.4 million; |
| · | an increase of $20.2 million in indirect labor, primarily as a result of an increase in employee headcount; |
| · | an increase of $8.7 million in consulting service expense; |
| · | an increase of $7.8 million in rent expense, $7.1 million in insurance expense, and $5.9 million in sales and business development expense; offset by |
| · | a $5.9 million decrease in legal expense, primarily as a result of a $7.0 million payment related to the Banque Saudi Fransi claim which was recognized during fiscal year 2005; |
| · | a $6.5 million decrease in other administrative expense; and |
| · | a $33.1 million in loss on extinguishment of debt recognized in fiscal year 2005 without a comparative charge in 2006. |
Our consolidated interest expense for the year ended December 29, 2006 decreased due to lower debt balances.
Our effective income tax rates for the year ended December 29, 2006 increased to 42.6% from 42.3% for the year ended December 30, 2005. (See further discussion Note 4, “Income Taxes” to our “Consolidated Financial Statements and Supplementary Data” included under Item 8 of this report.)
Our consolidated operating income, net income and earnings per share increased as a result of the factors previously described.
Reporting Segments
The Year Ended December 29, 2006 Compared with the Year Ended December 30, 2005
| | | Revenues | | Direct Operating Expenses | | Gross Profit | | Indirect, General and Administrative | | Operating Income (Loss) | |
| | | (In millions, except percentages) | |
Year ended December 29, 2006 | | | | | | | | | | | | |
| URS Division | | $ | 2,804.7 | | $ | 1,707.8 | | $ | 1,096.9 | | $ | 905.2 | | $ | 191.7 | |
EG&G Division | | | 1,450.9 | | | 1,044.5 | | | 406.4 | | | 335.0 | | | 71.4 | |
| Eliminations | | | (15.5 | ) | | (14.5 | ) | | (1.0 | ) | | — | | | (1.0 | ) |
| | | | 4,240.1 | | | 2,737.8 | | | 1,502.3 | | | 1,240.2 | | | 262.1 | |
| Corporate | | | — | | | — | | | — | | | 43.3 | | | (43.3 | ) |
| Total | | $ | 4,240.1 | | $ | 2,737.8 | | $ | 1,502.3 | | $ | 1,283.5 | | $ | 218.8 | |
| | | | | | | | | | | | | | | | | |
Year ended December 30, 2005 | | | | | | | | | | | | |
URS Division | | $ | 2,556.7 | | $ | 1,561.9 | | $ | 994.8 | | $ | 800.6 | | $ | 194.2 | |
EG&G Division | | | 1,369.0 | | | 1,001.3 | | | 367.7 | | | 304.3 | | | 63.4 | |
| Eliminations | | | (8.1 | ) | | (7.6 | ) | | (0.5 | ) | | — | | | (0.5 | ) |
| | | | 3,917.6 | | | 2,555.6 | | | 1,362.0 | | | 1,104.9 | | | 257.1 | |
| Corporate | | | — | | | — | | | — | | | 82.7 | | | (82.7 | ) |
| Total | | $ | 3,917.6 | | $ | 2,555.6 | | $ | 1,362.0 | | $ | 1,187.6 | | $ | 174.4 | |
| | | | | | | | | | | | | | | | | |
| | | | | | | | | | | | | | | | | |
Increase (decrease) for the year ended December 29, 2006 vs. the year ended December 30, 2005 | | | | | | | | | | | | |
| URS Division | | $ | 248.0 | | $ | 145.9 | | $ | 102.1 | | $ | 104.6 | | $ | (2.5 | ) |
EG&G Division | | | 81.9 | | | 43.2 | | | 38.7 | | | 30.7 | | | 8.0 | |
| Eliminations | | | (7.4 | ) | | (6.9 | ) | | (0.5 | ) | | — | | | (0.5 | ) |
| | | | 322.5 | | | 182.2 | | | 140.3 | | | 135.3 | | | 5.0 | |
| Corporate | | | — | | | — | | | — | | | (39.4 | ) | | 39.4 | |
| Total | | $ | 322.5 | | $ | 182.2 | | $ | 140.3 | | $ | 95.9 | | $ | 44.4 | |
| | | | | | | | | | | | | | | | | |
Percentage increase (decrease) for the year ended December 29, 2006 vs. the year ended December 30, 2005 | | | | | | | | | | | | |
| URS Division | | | 9.7 | % | | 9.3 | % | | 10.3 | % | | 13.1 | % | | (1.3 | %) |
| EG&G Division | | | 6.0 | % | | 4.3 | % | | 10.5 | % | | 10.1 | % | | 12.6 | % |
| Eliminations | | | 91.4 | % | | 90.8 | % | | 100.0 | % | | — | | | 100.0 | % |
| Corporate | | | — | | | — | | | — | | | (47.6 | %) | | (47.6 | %) |
| Total | | | 8.2 | % | | 7.1 | % | | 10.3 | % | | 8.1 | % | | 25.5 | % |
The URS Division’s revenues for the year ended December 29, 2006 increased 9.7% compared with the year ended December 30, 2005. The increase in revenues was due to the various factors discussed below in each of our client markets.
The following table presents the URS Division’s revenues by client type for the years ended December 29, 2006 and December 30, 2005.
| | | Year Ended December 29, 2006 | | Year Ended December 30, 2005 | | Increase (Decrease) | | Percentage Increase (Decrease) | |
| | | (In millions, except percentages) | |
| | | | | | | | | | |
Revenues | | | | | | | | | | | | | |
Federal government clients | | $ | 501 | | $ | 455 | | $ | 46 | | | 10 | % |
State and local government clients | | | 914 | | | 854 | | | 60 | | | 7 | % |
Domestic private industry clients | | | 970 | | | 862 | | | 108 | | | 13 | % |
International clients | | | 404 | | | 378 | | | 26 | | | 7 | % |
| Total revenues, net of eliminations | | $ | 2,789 | | $ | 2,549 | | $ | 240 | | | 9 | % |
Revenues from the URS Division’s federal government clients for the year ended December 29, 2006 increased by approximately 10% compared with the year ended December 30, 2005. This increase was largely driven by steady growth in infrastructure, environmental and facilities projects under existing and new contract awards with the DOD, including new assignments in support of the BRAC program. Revenues from homeland security projects also contributed to this growth, as we continued to provide a range of engineering services to the DHS in support of security preparedness and disaster response initiatives.
In addition, a portion of this increase was associated with disaster recovery services provided to U.S. federal government agencies in the Gulf Coast region, particularly in the first quarter of fiscal 2006 in the aftermath of the destructive 2005 Atlantic hurricane season. We also benefited from our success in leveraging the combined scale of expertise of both our URS and EG&G Divisions to win large, bundled indefinite delivery contracts with the DOD.
Revenues from our state and local government clients for the year ended December 29, 2006 increased by approximately 7% compared with the year ended December 30, 2005. In 2006, we experienced favorable market conditions in this sector of our business as state and local economies continued to improve, reducing the pressure to limit spending on infrastructure projects. During 2006, many states experienced increased tax receipts and, as a result of improved fiscal conditions, increased their spending on transportation and facilities projects.
In addition, the passage of SAFETEA-LU, the $287 billion federal highway and transit funding bill during 2005 continues to have a positive impact on our state and local government revenues. Furthermore, we have begun to win new work associated with the recent approval of major bond initiatives in 19 states totaling approximately $68 billion to fund highway, public building and school improvement projects. In coastal states, we also are benefiting from increased funding to support flood and storm protection initiatives following the devastating hurricane season of 2005.
For the year ended December 29, 2006, revenues from our domestic private industry clients increased 13% compared with the year ended December 30, 2005. This strong growth reflects our transition to high growth markets within the private sector, our growth in longer-term MSAs with Fortune 500 companies and favorable economic market conditions, including relatively high energy and commodity prices. A major portion of our revenue growth from domestic private sector clients was due to growth in the emissions control portion of our work in the power sector. This work has been driven by new environmental regulations, such as the Clean Air Interstate Rule and the Clean Air Mercury Rule, which accelerate mandates to reduce sulfur dioxide and mercury emissions.
We also benefited from the increased number of client relationships managed under MSAs, which now account for more than 75% of our worldwide private sector business. These longer-term relationships have enabled us to migrate from stand-alone consulting contracts, reducing the marketing expenses associated with pursuing these assignments while improving our labor utilization levels. In addition, revenues from our oil and gas clients also grew due to higher gasoline prices, which increased oil and gas company profits, leading to additional investment in gas infrastructure projects.
Revenues from our international clients for the year ended December 29, 2006 increased by 7% compared with the year ended December 30, 2005, largely the result of growth in the work we perform under MSAs for multinational corporations outside the U.S., particularly from our clients in the oil and gas industry. The impact of foreign currency fluctuations on our revenues for the fiscal year ended December 29, 2006 was immaterial. In Asia-Pacific, we benefited from strong economic growth, which has lead to increased funding for infrastructure projects, including transportation and water/wastewater projects. In addition, the increased global demand for mineral resources resulted in additional projects for the mining industry. In Europe, more stringent environmental directives from the European Union and new investment in infrastructure projects resulted in increased revenues.
The URS Division’s direct operating expenses for the year ended December 29, 2006 increased by 9.3% compared with the year ended December 30, 2005. The factors that caused revenue growth also drove an increase in our direct operating expenses. Direct operating expenses increased at a higher percentage than revenues as a result of increases in subcontractor costs and other direct operating costs.
The URS Division’s gross profit for the year ended December 29, 2006 increased by 10.3% compared with the year ended December 30, 2005, primarily due to the increase in revenue volume described previously and to a lesser extent, pricing increases. Our gross profit margin percentage increased to 39.1% for the year ended December 29, 2006 from 38.9% for the year ended December 30, 2005.
The URS Division’s IG&A expenses for the year ended December 29, 2006 increased by 13.1% compared with the year ended December 30, 2005. The increase was due to the following items:
| · | an increase of $67.2 million in employee-related expenses due to both an increase in headcount and an increase in cost per employee, including stock compensation cost; |
| · | an increase of $17.1 million in indirect labor, primarily as a result of an increase in employee headcount, salary cost increases and recruiting and retention costs; and |
| · | increases of $5.7 million in rent expense, $4.3 million in sales and business development expense, $4.6 million in insurance expense, and $4.3 million in consulting service expense. |
EG&G Division
The EG&G Division’s revenues for the year ended December 29, 2006 increased by 6% compared with the year ended December 30, 2005. The increase was driven by the high level of military activity in the Middle East, resulting in a higher volume of operations and maintenance work and greater demand for modification work for military vehicles and weapons. We also experienced growth in demand for specialized systems engineering and technical assistance services that we provide for the development, testing and evaluation of weapons systems. In addition, revenues generated from activities in the homeland security and logistics management markets increased during the 2006 fiscal year.
The EG&G Division’s direct operating expenses for the year ended December 29, 2006 increased by 4.3% compared with the year ended December 30, 2005. Higher revenues drove an increase in our direct operating expenses.
The EG&G Division’s gross profit for the year ended December 29, 2006 increased by 10.5% compared with the year ended December 30, 2005. The increase in gross profit was primarily due to higher revenues from existing defense technical services and military equipment maintenance contracts. Our gross profit margin percentage increased to 28.0% for the year ended December 29, 2006 from 26.9% for the year ended December 30, 2005 as a result of larger award and incentive fees earned on operations and maintenance contracts.
The EG&G Division’s IG&A expenses for the year ended December 29, 2006 increased by 10.1% compared with the year ended December 30, 2005. The increase was primarily due to higher business volume. The EG&G Division's indirect expenses are generally variable in nature and, as such, any increase in business volume tends to result in higher indirect expenses. Approximately $21.7 million of the increase was due to indirect labor and employee-related expenses resulting from both changes in headcount and an increase in cost per employee, including stock-based compensation cost. Indirect expenses as a percentage of revenues increased to 23.1%, for the year ended December 29, 2006 from 22.2% for the year ended December 30, 2005, primarily as a result of stock-based compensation cost recognized under SFAS 123(R).
Consolidated
| | | Year Ended December 30, 2005 | | Year Ended October 31, 2004 | | Increase (Decrease) | | Percentage Increase (Decrease) | |
| | | (In millions, except percentages and per share amounts) | |
| Revenues | | $ | 3,917.6 | | $ | 3,382.0 | | $ | 535.6 | | | 15.8 | % |
| Direct operating expenses | | | 2,555.6 | | | 2,140.9 | | | 414.7 | | | 19.4 | % |
Gross profit | | | 1,362.0 | | | 1,241.1 | | | 120.9 | | | 9.7 | % |
| Indirect, general and administrative expenses | | | 1,187.6 | | | 1,079.1 | | | 108.5 | | | 10.1 | % |
Operating income | | | 174.4 | | | 162.0 | | | 12.4 | | | 7.7 | % |
| Interest expense | | | 31.6 | | | 60.7 | | | (29.1 | ) | | (47.9 | %) |
| Income before income taxes | | | 142.8 | | | 101.3 | | | 41.5 | | | 41.0 | % |
| Income tax expense | | | 60.3 | | | 39.6 | | | 20.7 | | | 52.3 | % |
| Net income | | $ | 82.5 | | $ | 61.7 | | $ | 20.8 | | | 33.7 | % |
| | | | | | | | | | | | | | |
| Diluted earnings per share | | $ | 1.72 | | $ | 1.53 | | $ | .19 | | | 12.4 | % |
The Year Ended December 30, 2005 Compared with the Year Ended October 31, 2004
Our consolidated revenues for the year ended December 30, 2005 increased by 15.8% compared with the year ended October 31, 2004. The increase was due to the higher volume of work performed in each of our client categories during the year ended December 30, 2005, compared with the year ended October 31, 2004.
The following table presents our consolidated revenues by client type for the years ended December 30, 2005 and October 31, 2004.
| | | Year Ended December 30, 2005 | | Year Ended October 31, 2004 | | Increase | | Percentage Increase | |
| | | (In millions, except percentages) | |
Revenues | | | | | | | | | | | | | |
Federal government clients | | $ | 1,888 | | $ | 1,619 | | $ | 269 | | | 17 | % |
State and local government clients | | | 888 | | | 686 | | | 202 | | | 29 | % |
Domestic private industry clients | | | 764 | | | 762 | | | 2 | | | — | % |
International clients | | | 378 | | | 315 | | | 63 | | | 20 | % |
| Total revenues, net of eliminations | | $ | 3,918 | | $ | 3,382 | | $ | 536 | | | 16 | % |
Revenues from our federal government clients for the year ended December 30, 2005 increased by 17% compared with the year ended October 31, 2004. The increase reflects continued growth in operations and maintenance work for the U.S. military associated with the continued high level of activities in the Middle East, and systems engineering and technical assistance services for the development, testing and evaluation of weapons systems. The volume of task orders issued under IDCs for the federal government continued to increase, particularly for facilities and environmental projects and emergency preparedness exercises.
The majority of our work in the state and local government, the domestic private industry and the international sectors is derived from our URS Division. Further discussion of the factors and activities that drove changes in operations on a segment basis for the year ended December 30, 2005 can be found beginning on page 40.
Our consolidated direct operating expenses for the year ended December 30, 2005, which consist of direct labor, subcontractor costs and other direct expenses, increased by 19.4% compared with the year ended October 31, 2004. The factors that caused revenue growth also drove a corresponding increase in our direct operating expenses. Volume increases in work on existing contracts with lower profit margins and an increase in the amount of subcontractor and other direct costs caused direct operating expenses to increase at a faster rate than revenues.
Our consolidated gross profit for the year ended December 30, 2005 increased by 9.7% compared with the year ended October 31, 2004, due to the increase in our revenue volume described previously. Our gross margin percentage, however, fell from 36.7% to 34.8%. The decrease in gross profit margin percentage was caused by a change in revenue mix between the two periods, with a higher volume of revenue during the year ended December 30, 2005 coming from contracts with profit margins that were lower than our 2004 portfolio of contracts, and an increase in revenues from subcontractor and other direct costs, which generate lower profit margins than revenues earned on our direct labor.
Our consolidated indirect, general and administrative (“IG&A”) expenses for the year ended December 30, 2005 increased by 10.1% compared with the year ended October 31, 2004. This increase was due to the following items:
| · | an increase of $61.1 million in employee-related expenses due to both an increase in headcount and an increase in costs per employee; |
| · | an increase of $14.8 million in indirect labor, primarily as a result of our higher employee headcount; |
| · | an increase of $5.0 million in loss on extinguishment of debt from $28.2 million for the year ended October 31, 2004 to $33.1 million for the year ended December 30, 2005; |
| · | an increase of $12.0 million in legal expenses and claims, which included approximately $7.0 million for the Banque Saudi Fransi claim; and |
| · | increases of $10.1 million in travel expense, $8.3 million in sales and business development expense, $4.9 million in consulting cost, and $4.2 million in rental expense. |
Indirect expenses as a percentage of revenues decreased to 30.3% for the year ended December 30, 2005 from 31.9% for the year ended October 31, 2004 due to an increase in labor hours chargeable to revenue-generating activities.
Our consolidated interest expense for the year ended December 30, 2005 decreased due to lower debt balances.
Our effective income tax rates for the year ended December 30, 2005 increased to 42.3% from 39.1% for the year ended October 31, 2004, due to fourth quarter accounting adjustments related to historical purchase accounting recorded in the fourth quarter of 2005, offset by hurricane-related tax credits and adjustments to our income tax reserves. (See further discussion Note 4, “Income Taxes” to our “Consolidated Financial Statements and Supplementary Data” included under Item 8 of our Annual Report on Form 10-K for the fiscal year ended December 30, 2005.)
Our consolidated operating income, net income and earnings per share increased as a result of the factors previously described.
Reporting Segments
The Year Ended December 30, 2005 Compared with the Year Ended October 31, 2004
| | | Revenues | | Direct Operating Expenses | | Gross Profit | | Indirect, General and Administrative | | Operating Income (Loss) | |
| | | (In millions, except percentages) | |
Year ended December 30, 2005 | | | | | | | | | |
| URS Division | | $ | 2,556.7 | | $ | 1,561.9 | | $ | 994.8 | | $ | 800.6 | | $ | 194.2 | |
EG&G Division | | | 1,369.0 | | | 1,001.3 | | | 367.7 | | | 304.3 | | | 63.4 | |
| Eliminations | | | (8.1 | ) | | (7.6 | ) | | (0.5 | ) | | — | | | (0.5 | ) |
| | | | 3,917.6 | | | 2,555.6 | | | 1,362.0 | | | 1,104.9 | | | 257.1 | |
| Corporate | | | — | | | — | | | — | | | 82.7 | | | (82.7 | ) |
| Total | | $ | 3,917.6 | | $ | 2,555.6 | | $ | 1,362.0 | | $ | 1,187.6 | | $ | 174.4 | |
| | | | | | | | | | | | | | | | | |
Year ended October 31, 2004 | | | | | | | | | | | | |
URS Division | | $ | 2,255.2 | | $ | 1,326.6 | | $ | 928.6 | | $ | 760.4 | | $ | 168.2 | |
EG&G Division | | | 1,129.8 | | | 817.3 | | | 312.5 | | | 257.6 | | | 54.9 | |
| Eliminations | | | (3.0 | ) | | (3.0 | ) | | — | | | — | | | — | |
| | | | 3,382.0 | | | 2,140.9 | | | 1,241.1 | | | 1,018.0 | | | 223.1 | |
| Corporate | | | — | | | — | | | — | | | 61.1 | | | (61.1 | ) |
| Total | | $ | 3,382.0 | | $ | 2,140.9 | | $ | 1,241.1 | | $ | 1,079.1 | | $ | 162.0 | |
| | | | | | | | | | | | | | | | | |
| | | | | | | | | | | | | | | | | |
Increase (decrease) for the year ended December 30, 2005 vs. the year ended October 31, 2004 | | | | | | | | | | | | |
| URS Division | | $ | 301.5 | | $ | 235.3 | | $ | 66.2 | | $ | 40.2 | | $ | 26.0 | |
EG&G Division | | | 239.2 | | | 184.0 | | | 55.2 | | | 46.7 | | | 8.5 | |
| Eliminations | | | (5.1 | ) | | (4.6 | ) | | (0.5 | ) | | — | | | (0.5 | ) |
| | | | 535.6 | | | 414.7 | | | 120.9 | | | 86.9 | | | 34.0 | |
| Corporate | | | — | | | — | | | — | | | 21.6 | | | (21.6 | ) |
| Total | | $ | 535.6 | | $ | 414.7 | | $ | 120.9 | | $ | 108.5 | | $ | 12.4 | |
| | | | | | | | | | | | | | | | | |
Percentage increase (decrease) for the year ended December 30, 2005 vs. the year ended October 31, 2004 | | | | | | | | | | | | |
| URS Division | | | 13.4 | % | | 17.7 | % | | 7.1 | % | | 5.3 | % | | 15.5 | % |
| EG&G Division | | | 21.2 | % | | 22.5 | % | | 17.7 | % | | 18.1 | % | | 15.5 | % |
| Eliminations | | | 170.0 | % | | 153.3 | % | | 100.0 | % | | — | | | 100.0 | % |
| Corporate | | | — | | | — | | | — | | | 35.4 | % | | 35.4 | % |
| Total | | | 15.8 | % | | 19.4 | % | | 9.7 | % | | 10.1 | % | | 7.7 | % |
The URS Division’s revenues for the year ended December 30, 2005 increased 13% compared with the year ended October 31, 2004. The increase in revenues was due to the various factors discussed below in each of our client markets.
The following table presents the URS Division’s revenues by client type for the years ended December 30, 2005 and October 31, 2004.
| | | Year Ended December 30, 2005 | | Year Ended October 31, 2004 | | Increase | | Percentage Increase | |
| | | (In millions, except percentages) | |
| | | | | | | | | | |
Revenues | | | | | | | | | | | | | |
Federal government clients | | $ | 519 | | $ | 489 | | $ | 30 | | | 6 | % |
State and local government clients | | | 888 | | | 686 | | | 202 | | | 29 | % |
Domestic private industry clients | | | 764 | | | 762 | | | 2 | | | — | % |
International clients | | | 378 | | | 315 | | | 63 | | | 20 | % |
| Total revenues, net of eliminations | | $ | 2,549 | | $ | 2,252 | | $ | 297 | | | 13 | % |
Revenues from the URS Division’s federal government clients for the year ended December 30, 2005 increased by approximately 6% compared with the year ended October 31, 2004. In part, this increase was related to our work supporting federal clients such as FEMA, which is now part of the DHS, the Army Corps of Engineers and the U.S. Postal Service, in disaster recovery efforts following Hurricanes Katrina, Rita, and Wilma. The increase was also driven by additional environmental and facilities projects under existing contracts with the DOD. Revenues from homeland security projects also contributed to this growth, as we continue to provide a range of engineering services to the DHS.
Revenues from our state and local government clients for the year ended December 30, 2005 increased by approximately 29% compared with the year ended October 31, 2004. The increase reflected an improvement in the states’ economies and general funds, fueled by increased state tax revenues. Generally, states have recovered from the recent recession, and began to increase spending on programs for which we provide services, such as surface transportation. We also continued to experience revenue increases from school facilities and water/wastewater projects. In addition, the recent passage of SAFETEA-LU had a positive impact on revenues from our state and local government clients.
Revenues from our domestic private industry clients for the year ended December 30, 2005 were flat compared with the year ended October 31, 2004. Spending among many of our private sector clients remained constrained. However, we experienced revenue growth in the emissions control portion of our power sector business as we shifted our resources into rapidly emerging areas of the environmental market driven by new environmental regulations, such as the Clean Air Interstate Rule and the Clean Air Mercury Rule, which were issued by the U.S. Environmental Protection Agency during 2005. We also shifted our focus towards building longer-term relationships with multinational corporations by migrating from stand-alone consulting contracts to longer-term MSAs in order to leverage our scale and diverse our service offerings.
We also successfully increased the number of client relationships managed under MSAs, as the number of stand-alone consulting assignments continued to decline. Revenues from our oil and gas clients also grew due to higher gasoline prices, which increased oil and gas company revenues, leading to additional investment in gas infrastructure projects.
Revenues from our international clients for the year ended December 30, 2005 increased by 20% compared with the year ended October 31, 2004. Approximately 3% of this increase was due to foreign currency exchange fluctuations. The remainder of the increase was due to our continuing efforts to diversify beyond environmental work into the facilities and infrastructure markets. The Asia-Pacific region benefited from strong economic growth, leading to increased funding for facilities and infrastructure programs, including transportation and water/wastewater projects.
In addition, the increased global demand for mineral resources has resulted in additional projects for the mining industry. In Europe, we continued to benefit from more stringent environmental directives from the European Union, leading to increased work in environmental impact statements (including sustainability issues), water/wastewater projects, and carbon emissions control projects.
The URS Division’s direct operating expenses for the year ended December 30, 2005 increased by 18% compared with the year ended October 31, 2004. The factors that caused revenue growth also drove an increase in our direct operating expenses. Direct operating expenses increased at a higher percentage than revenues as a result of increases in subcontractor costs and other direct expenses.
The URS Division’s gross profit for the year ended December 30, 2005 increased by 7% compared with the year ended October 31, 2004, primarily due to the increase in revenue volume described previously and to a lesser extent, pricing increases. Our gross profit margin percentage decreased to 38.9% for the year ended December 30, 2005 from 41.2% for the year ended October 31, 2004. Our gross profit margin percentage decreased primarily because our subcontractor costs and other direct costs, which generally bear lower profit margins than our direct labor costs, accounted for a higher percentage of our total direct operating expenses during the year ended December 30, 2005 (59.1%), compared with the year ended October 31, 2004 (54.0%).
The URS Division’s IG&A expenses for the year ended December 30, 2005 increased by 5% compared with the year ended October 31, 2004. This increase was due to an additional $28.1 million in employee-related expenses due to both an increase in headcount and an increase in costs per employee. The remainder of the increase was due to a $6.7 million increase in indirect labor, a $7.5 million increase in sales and business development expenses, a $3.7 million increase in rental expense, and a $4.1 million increase in travel expense. These increases were offset by a $5.2 million decrease in bad debt expense and a $3.1 million decrease in depreciation and amortization expense.
EG&G Division
The EG&G Division’s revenues for the year ended December 30, 2005 increased by 21% compared with the year ended October 31, 2004. This increase was driven by the high level of military activity in the Middle East, resulting in a higher volume of operations and maintenance work and greater demand for modification work for military vehicles and weapons systems. We experienced growth in demand for specialized systems engineering and technical assistance services that we provide for the development, testing and evaluation of weapons systems. In addition, revenues generated from activities in the homeland security and logistics management markets increased during the 2006 fiscal year.
The EG&G Division’s direct operating expenses for the year ended December 30, 2005 increased by 23% compared with the year ended October 31, 2004. Higher revenues drove an increase in our direct operating expenses. In addition, a greater volume of work on existing contracts with lower profit margins caused direct operating expenses to increase faster than revenues.
The EG&G Division’s gross profit for the year ended December 30, 2005 increased by 18% compared with the year ended October 31, 2004. The increase in gross profit was primarily due to higher revenues from existing defense technical services and military equipment maintenance contracts. However, our gross profit margin percentage decreased to 26.9% for the year ended December 30, 2005 from 27.7% for the year ended October 31, 2004 because a significant portion of the revenue increase was generated by operations and maintenance and field-based services, which generally carry lower margins than most other services provided by the EG&G Division.
The EG&G Division’s IG&A expenses for the year ended December 30, 2005 increased by 18% compared with the year ended October 31, 2004. The increase was primarily due to a higher business volume. The EG&G Division's indirect expenses are generally variable in nature and, as such, any increase in business volume tends to result in higher indirect expenses. Of the total increase, approximately $35.8 million was due to increases in indirect labor and employee-related expenses, both resulting from an increase in headcount and an increase in costs per employee. Indirect expenses as a percentage of revenues decreased to 22.2% for the year ended December 30, 2005 from 22.8% for the year ended October 31, 2004.
We had a transition period for the two months ended December 31, 2004 as a result of changing our fiscal year ended October 31, 2004 to fiscal year ended December 31, 2004. As the transition period only contained two months of our results, it is not indicative of our annual results. For a detailed discussion of the transition period, please read our annual report on Form 10-K filed with the SEC for the year ended December 30, 2005.
| | | Year Ended December 29, | | Year Ended December 30, | | Two Months Ended December 31, | | Year Ended October 31, | |
| | | 2006 | | 2005 | | 2004 | | 2004 | |
| | | | | | | | | | |
| Cash flows from operating activities | | $ | 165.0 | | $ | 200.4 | | $ | 15.0 | | $ | 95.5 | |
| Cash flows from investing activities | | | (34.3 | ) | | (22.1 | ) | | (1.6 | ) | | (19.0 | ) |
| Cash flows from financing activities | | | (142.7 | ) | | (184.8 | ) | | 25.3 | | | (43.5 | ) |
| Proceeds from sale of common stock and exercise of stock options | | | 24.0 | | | 38.9 | | | 5.2 | | | 26.6 | |
| Proceeds from common stock offering, net of related expenses | | | — | | | 130.3 | | | — | | | 204.3 | |
Our primary sources of liquidity were cash flows from operations, borrowings under our credit lines during the fiscal years ended December 29, 2006, and cash flows from operations, borrowings under our credit lines and proceedes from a public common stock offering during the fiscal year ended December 30, 2005. Our primary uses of cash have been to fund our working capital and capital expenditures, and to service and retire our debt. We believe that we have sufficient cash flows to fund our operating and capital expenditure requirements, as well as service our debt, for the next 12 months and beyond. If we experience a significant change in our business such as the consummation of a significant acquisition, we would likely need to acquire additional sources of financing. We believe that we would be able to obtain adequate sources of funding to address significant changes in our business at reasonable rates and terms, as necessary, based on our past experience with business acquisitions.
Cash and cash equivalents include all highly liquid investments with maturities of 90 days or less at the date of purchase. At December 29, 2006 and December 30, 2005, we had book overdrafts for some of our disbursement accounts. These overdrafts represented transactions that had not cleared the bank accounts at the end of the reporting period. We transferred cash on an as-needed basis to fund these items as they cleared the bank in subsequent periods.
At December 29, 2006 and December 30, 2005, cash and cash equivalents included $38.7 million and $43.5 million held by our consolidated joint ventures.
We are dependent on the cash flows generated by our subsidiaries and, consequently, on their ability to collect on their respective accounts receivable. Substantially all of our cash flows are generated by our subsidiaries. As a result, the funds necessary to meet our debt service obligations are provided in large part by distributions or advances from our subsidiaries. The financial condition and operational requirements of our subsidiaries may limit our ability to obtain cash from them.
Billings and collections on accounts receivable can impact our operating cash flows. Management places significant emphasis on collection efforts, has assessed the allowance accounts for receivables as of December 29, 2006 and has deemed them to be adequate; however, future economic conditions may adversely impact some of our clients’ ability to pay our bills or the timeliness of their payments. Consequently, it may also impact our ability to consistently collect cash from them to meet our operating needs.
In the ordinary course of our business, we may realize various loss contingencies, including, but not limited to the pending legal proceedings, identified in Note 8, “Commitments and Contingencies,” which may adversely affect our liquidity and capital resources.
Operating Activities
The decrease in cash flows from operating activities for the year ended December 29, 2006 compared with the year ended December 30, 2005 was primarily due to a decrease in Accounts Payable and Subcontractors Payable as a result of the timing of payments, a decrease in Accrued Expenses and an increase in Deferred Income Tax Asset, offset by Accounts Receivables and Accrued Earnings in Excess of Billings on Contracts in Process, resulting from the timing of collections.
The increase in cash flow from operating activities for the year ended December 30, 2005 compared with the year ended October 31, 2004 was primarily due to increases in Accounts Receivables and Accrued Earnings in Excess of Billings on Contracts in Process, resulting from the timing of collections, and a decrease in deferred income tax liabilities, offset by non-cash debt extinguishment costs and an increase in Accounts Payable and Subcontractors Payable, resulting from the timing of payments.
Investing Activities
As a professional services organization, we are not capital intensive. Our capital expenditures have historically been primarily for various information systems to accommodate our growth. Capital expenditures, excluding purchases financed through capital leases, during the years ended December 29, 2006, December 30, 2005, and October 31, 2004 were $29.3 million, $23.0 million, and $19.0 million, respectively. For the two months ended December 31, 2004, capital expenditures, excluding purchases financed through capital leases, were $1.6 million.
Financing Activities
Cash flows used for financing activities of $142.7 million during the year ended December 29, 2006 consisted primarily of the following activities:
| · | Payment of $156.0 million of the term loan under our credit facility; |
| · | Payment of $2.8 million of our 11½% senior notes (“11½% Notes”); |
| · | Net borrowings of $1.4 million under our lines of credit and short-term notes; |
| · | Payments of $13.0 million in capital lease obligations; |
| · | Change in book overdrafts of $1.8 million; |
| · | Excess tax benefits from stock-based compensation of $6.0 million; and |
| · | Proceeds from the sale of common stock from our ESPP and exercise of stock options of $24.0 million. |
Cash flows used for financing activities of $184.8 million during the year ended December 30, 2005 consisted primarily of the following activities:
| · | Payment of $353.8 million of the term loans under the old credit facility; |
| · | Issuance of $350.0 million of new term loan, $80.0 million of which was paid during the year; |
| · | Net payment of $18.0 million under the line of credit; |
| · | Payments of $31.6 million in capital lease obligation, notes payable (net of borrowings), our 12¼% senior subordinated notes (“12¼% notes”) and our 6½% convertible subordinated debentures (“6½% debentures”); |
| · | Change in book overdrafts of $69.3 million; |
| · | Proceeds from the sale of common stock from the employee stock purchase plan and exercise of stock options of $38.9 million; and |
| · | Net proceeds generated from our public common stock offering of $130.3 million, which was used to pay $127.2 million of our 11½% notes and $18.8 million of tender premiums and expenses. |
On June 8, 2005, we sold an aggregate of 4,000,393 shares of our common stock through a public offering. The offering price of our common stock was $34.50 per share and the total offering proceeds to us were $130.3 million, net of underwriting discounts and commissions and other offering-related expenses of $7.8 million.
We used the net proceeds from this common stock offering and cash available on hand to pay $127.2 million of our 11½% notes and $18.8 million of tender premiums and expenses. In addition, we retired $353.8 million of the term loans outstanding under the old credit facility during the second quarter of fiscal year 2005, and entered into a credit facility of $350.0 million on June 28, 2005. As a result of the debt retirement and terms of the credit facility, our interest expense has been reduced substantially compared to prior years. As a result of this debt retirement, we recognized a pre-tax charge of $33.1 million, which consisted of tender/call premiums and expenses of $19.4 million and the write-off of $13.7 million in unamortized financing fees, issuance costs and debt discounts. In addition, during the first quarter of fiscal year 2005, we retired the remaining $10.0 million in outstanding balance of our 12¼% notes. We also retired the entire outstanding balance of $1.8 million of our 6½% debentures on August 15, 2005.
Cash flows used for financing activities of $43.5 million during the year ended October 31, 2004 consisted primarily of the following activities:
| · | Net borrowings under the line of credit of $5.3 million; |
| · | Net payment of $4.0 million of the term loans under the old credit facility with $2.9 million payments of financing fees; |
| · | Payment of $23.1 million in capital lease obligation, notes payable (net of borrowings), and our 85/8% senior subordinated debentures; |
| · | Payment of $19.7 million in tender and call premiums on our 12¼% notes and our 11½% notes; |
| · | Change in book overdrafts of $30.0 million; |
| · | Proceeds from the sale of common stock from the employee stock purchase plan and exercise of stock options of $26.6 million; and |
| · | Net proceeds generated from our public common stock offering of $204.3 million, which was used to fund a majority of the payments of $190.0 million on our 12¼% notes and $70.0 million on our 11½% notes. |
During fiscal year 2004, we sold an aggregate of 8.1 million shares of our common stock through an underwritten public offering. The offering price of our common stock was $26.50 per share, and we received total offering proceeds of $204.3 million, net of $10.5 million in underwriting discounts and commissions and other offering-related expenses.
We used the net proceeds from this common stock offering plus the borrowings under our credit facility and cash available on hand to redeem $70.0 million of our 11½% notes and $190.0 million of our 12¼% notes. As a result of these redemptions, we recognized a pre-tax charge of $28.2 million during our fiscal year 2004, consisting of the write-off of $8.5 million in unamortized financing fees, debt issuance costs and debt discounts, and payments of $19.7 million for call premiums.
The table below contains information about our contractual obligations and commercial commitments followed by narrative descriptions as of December 29, 2006:
| | | | | Payments and Commitments Due by Period | |
| | | | | Less Than | | | | | | After 5 | |
Contractual Obligations | | Total | | 1 Year | | 1-3 Years | | 4-5 Years | | Years | |
| | | (In thousands) | |
As of December 29, 2006: | | | | | | | | | | | | | | | | |
| Credit Facility: | | | | | | | | | | | | | | | | |
| Term loan | | $ | 114,000 | | $ | — | | $ | 22,800 | | $ | 91,200 | | $ | — | |
| Capital lease obligations | | | 46,688 | | | 12,769 | | | 22,335 | | | 10,939 | | | 645 | |
| Notes payable, foreign credit lines and other indebtedness (1) | | | 7,974 | | | 6,364 | | | 871 | | | 627 | | | 112 | |
| Total debt | | | 168,662 | | | 19,133 | | | 46,006 | | | 102,766 | | | 757 | |
| Pension funding requirements (2) | | | 126,881 | | | 14,293 | | | 32,690 | | | 20,155 | | | 59,743 | |
| Purchase obligations (3) | | | 6,735 | | | 3,617 | | | 3,118 | | | — | | | — | |
| Interest (4) | | | 33,140 | | | 10,634 | | | 16,574 | | | 5,904 | | | 28 | |
| Asset retirement obligations | | | 4,303 | | | 182 | | | 564 | | | 1,148 | | | 2,409 | |
| Operating lease obligations (5) | | | 444,538 | | | 95,589 | | | 157,389 | | | 106,393 | | | 85,167 | |
| Total contractual obligations | | $ | 784,259 | | $ | 143,448 | | $ | 256,341 | | $ | 236,366 | | $ | 148,104 | |
| | | | | | | | | | | | | | | | | |
(1) Amounts shown exclude remaining original issue discounts of $49 thousand for notes payable.
(2) These pension funding requirements for the EG&G pension plans, the Dames & Moore Final Salary Pension Fund in the United Kingdom, the Radian International, L.L.C. Supplemental Executive Retirement Plan and Salary Continuation Agreement, and the supplemental executive retirement plan (“SERP”) with our CEO are based on actuarially determined estimates and management assumptions. We are obligated to fund approximately $11.5 million into a rabbi trust for our CEO’s SERP upon receiving a 15-day notice, his death or the termination of his employment for any reason.
(3) Purchase obligations consist primarily of software maintenance contracts.
(4) Interest for the next five years, which excludes non-cash interest, is determined based on the current outstanding balance of our debt and payment schedule at the estimated interest rate as of December 29, 2006.
(5) These operating leases are predominantly office and equipment leases.
Off-balance Sheet Arrangements. The following is a list of our off-balance sheet arrangements:
| · | As of December 29, 2006, we had a total outstanding balance of $61.3 million in standby letters of credit under our credit facility. Letters of credit are used primarily to support insurance programs, bonding arrangements, and real estate leases. We are required to reimburse the issuers of letters of credit for any payments they make under the outstanding letters of credit. Our credit facility covers the issuance of our standby letters of credit and is critical for our normal operations. If we default on the credit facility, our ability to issue or renew standby letters of credit would impair our ability to maintain normal operations. |
| · | We have guaranteed the credit facility of one of our joint ventures, in the event of a default by the joint venture. This joint venture was formed in the ordinary course of business to perform a contract for the federal government. The term of the guarantee is equal to the remaining term of the underlying credit facility, which will expire on September 30, 2007. The amount of the guarantee was $9.5 million at December 29, 2006. |
| · | During the year, we replaced letters of credit used to collateralize the credit facility of our UK operating subsidiary and bank guarantee lines of our European subsidiaries with a guarantee. As of December 29, 2006, the amount of the guarantee was $9.7 million. |
| · | From time to time, we have provided guarantees related to our services or work. If our services under a guaranteed project are later determined to have resulted in a material defect or other material deficiency, then we may be responsible for monetary damages or other legal remedies. When sufficient information about claims on guaranteed projects is available and monetary damages or other costs or losses are determined to be probable, we recognize such guarantee losses. Currently, we have no guarantee claims for which losses have been recognized. |
| · | We have an agreement to indemnify one of our joint venture lenders up to $25.0 million for any potential losses, damages, and liabilities associated with lawsuits in relation to general and administrative services we provide to the joint venture. Currently, we have no indemnified claims. |
Credit Facility. Our senior credit facility (“Credit Facility”) consists of a 6-year term loan of $350.0 million and a 5-year revolving line of credit of $300.0 million, against which up to $200.0 million is available for issuance of letters of credit. As of December 29, 2006, we had $114.0 million outstanding under the term loan, $61.3 million outstanding in letters of credit and no amount outstanding under the revolving line of credit.
Our Revolving Line of Credit is used to fund daily operating cash needs and to support our standby letters of credit. During the ordinary course of business, the use of our Revolving Line of Credit is a function of collection and disbursement activities. Our daily cash needs generally follow a predictable pattern that parallels our payroll cycles, which dictate, as necessary, our short term borrowing requirements.
Principal amounts under the term loan will become due and payable on a quarterly basis: 15% of the principal will be payable in four equal quarterly payments beginning in the third quarter of 2008, 20% of the principal will be due during the next four quarters, and 65% will be due in the final four quarters ending on June 28, 2011. Our Revolving Line of Credit expires and is payable in full on June 28, 2010. At our option, we may repay the loans under our Credit Facility without premium or penalty.
All loans outstanding under our Credit Facility bear interest at either LIBOR or the bank’s base rate plus an applicable margin, at our option. The applicable margin will change based upon our credit rating as reported by Moody’s Investor Services (“Moody’s”) and Standard & Poor’s. The LIBOR margin will range from 0.625% to 1.75% and the base rate margin will range from 0.0% to 0.75%. As of December 29, 2006 and December 30, 2005, the LIBOR margin was 1.00% for both the term loan and the Revolving Line of Credit. As of December 29, 2006 and December 30, 2005, the interest rates on our term loan were 6.36% and 5.53%, respectively.
A substantial number of our domestic subsidiaries are guarantors of the Credit Facility on a joint and several basis. Initially, the obligations are collateralized by our guarantors’ capital stock. The collateralized obligations will be eliminated if we reach an investment grade credit rating of “Baa3” from Moody’s and “BBB-” from Standard & Poor’s; while our credit ratings have been upgraded since the inception of our Credit Facility, we have not yet achieved the investment grades necessary to eliminate the capital stock collaterization. If our credit rating were to fall to or below “Ba2” from Moody’s or “BB” from Standard & Poor’s, we would be required to provide a secured interest in substantially all of our existing and subsequently acquired personal and real property, in addition to the collateralized guarantors’ capital stock. Although the capital stock of the non-guarantor subsidiaries are not required to be pledged as collateral, the terms of the Credit Facility restrict the non-guarantors’ assets, with some exceptions, from being used as a pledge for future liens (a “negative pledge”). Moody’s upgraded our credit rating from “Ba2” to “Ba1” on June 20, 2005. On July 26, 2005, Standard & Poor’s upgraded our credit rating from “BB” to “BB+.” As of December 29, 2006, our Moody's and Standard and Poor's credit ratings were "Ba1" and BB+, respectively.
Our Credit Facility contains financial covenants. We are required to maintain: (a) a maximum ratio of total funded debt to total capital of 40% or less and (b) a minimum interest coverage ratio of not less than 3.0:1. The interest coverage ratio is calculated by dividing consolidated Earnings Before Interest, Taxes, Depreciation and Amortization (“EBITDA”), as defined in our Credit Facility agreement, by consolidated cash interest expense.
The Credit Facility also contains customary events of default and customary affirmative and negative covenants, some of which are dependent upon our credit ratings and include, but are not limited to, limitations on mergers, consolidations, acquisitions, asset sales, restrictions against dividend payments, stock redemptions or repurchases, transactions with stockholders and affiliates, liens, capital leases, negative pledges, sale-leaseback transactions, indebtedness, contingent obligations and investments.
As of December 29, 2006, we were in compliance with all the covenants of the Credit Facility.
Revolving Line of Credit. Our revolving line of credit information is summarized as follows:
| | | Year Ended December 29, 2006 | | Year Ended December 30, 2005 | | Two Months Ended December 31, 2004 | | Year Ended October 31, 2004 | |
| | | (in millions, except percentages) | |
| Effective average interest rates paid on the revolving line of credit | | | 7.6 | % | | 6.3 | % | | 5.9 | % | | 5.7 | % |
| Average daily revolving line of credit balances | | $ | 0.4 | | $ | 2.4 | | $ | 1.6 | | $ | 22.7 | |
| Maximum amounts outstanding at any one point | | $ | 21.8 | | $ | 22.8 | | $ | 18.0 | | $ | 74.6 | |
11½% Senior Notes. On September 15, 2006, we redeemed and retired the outstanding amount of $2.8 million of our 11½% Notes. As of December 30, 2005, we had $2.8 million of 11½% Notes outstanding.
Notes Payable, Foreign Credit Lines and other indebtedness. As of December 29, 2006 and December 30, 2005, we had outstanding amounts of $7.9 million and $9.6 million, respectively, in notes payable and foreign lines of credit. Notes payable primarily include notes used to finance the purchase of office equipment, computer equipment and furniture. The weighted average interest rates of the notes were approximately 6.1% and 5.6% as of December 29, 2006 and December 30, 2005, respectively.
We maintain foreign lines of credit, which are collateralized by the assets of our foreign subsidiaries and letters of credit. As of December 29, 2006, we had $13.8 million in lines of credit available under these facilities, with $4.6 million outstanding. As of December 30, 2005, we had $10.0 million in lines of credit available under these facilities, with no amounts outstanding. The interest rates were 6.2% and 6.6% as of December 29, 2006 and December 30, 2005, respectively.
Capital Leases. As of December 29, 2006 and December 30, 2005, we had $46.7 million and $36.2 million in obligations under our capital leases, respectively, consisting primarily of leases for office equipment, computer equipment and furniture.
Operating Leases. As of December 29, 2006 and December 30, 2005, we had approximately $444.5 million and $415.8 million, respectively, in obligations under our operating leases, consisting primarily of real estate leases.
Other Activities
Derivative Financial Instruments. We are exposed to risk of changes in interest rates as a result of borrowings under our Credit Facility. During fiscal year 2006 and 2005, we did not enter into any interest rate derivatives due to our assessment of the costs/benefits of interest rate hedging. However, we may enter into derivative financial instruments in the future depending on changes in interest rates.
Income Taxes
As of December 29, 2006, for federal income tax purposes, we had available a domestic net operating loss (“NOL”) of $2.5 million. Utilization of the NOL is limited pursuant to Section 1503 of the Internal Revenue Code and will be utilized against the income of our insurance company subsidiary. This NOL will be carried forward and will expire in fiscal year 2022. We also have $15.9 million of foreign NOLs available. Of this amount, $1.2 million will expire at various dates between 2007 and 2021, while the remaining $14.7 million will carry forward indefintely. These foreign NOLs are available only to offset income earned in foreign jurisdictions. Further, we have $11.8 million of state and local NOLs available. Of this amount, $4.6 million will expire in 2007, while the remaining $7.2 million will expire at various dates between 2008 and 2022.
Valuation allowances for deferred tax assets are established when necessary to reduce deferred tax assets to the amount expected to be realized. Based on expected future operating results, we believe that realization of deferred tax assets in excess of the valuation allowance is more likely than not.
As of December 29, 2006, undistributed earnings of our foreign operations totaling $16.0 million were considered to be indefinitely reinvested outside of our home tax jurisdiction. No deferred tax liability has been recognized for the remittance of such earnings to the U.S. pursuant to Accounting Principles Board Opinion No. 23, "Accounting for Income Taxes - Special Areas," since it is our intention to utilize those earnings in the foreign operations. The determination of the amount of deferred taxes on these earnings is not practicable since the computation would depend on a number of factors that cannot be known unless a decision to repatriate the earnings is made.
See further discussion at Note 4, “Income Taxes” to our “Consolidated Financial Statements and Supplementary Data” included under Item 8 of this report.
Critical Accounting Policies and Estimates
The preparation of our financial statements in conformity with accounting principles generally accepted in the United States requires us to make estimates, judgments and assumptions that affect the reported amounts of assets and liabilities at the date of the financial statements, the reported amounts of revenues and expenses during the reporting period, and the related disclosures of contingent assets and liabilities at the date of financial statements, which are included in Item 8 of this report. Application of these accounting policies involves the exercise of judgment and the use of assumptions as to future uncertainties based on information available to us as of the date of the financial statements. Consequently, our actual results could differ from our estimates. See Note 1, “Accounting Policies” to our “Consolidated Financial Statements and Supplementary Data” included under Item 8 of this report.
Significant accounting policies that we believe are important to understanding our results of operations and financial positions are discussed below. Information regarding our other accounting policies is included under Item 8, “Consolidated Financial Statements and Supplementary Data,” of this report.
Revenue Recognition
Our revenues arise primarily from the professional and technical services performed by our employees or by the subcontractors we engage to perform on our behalf under contracts we enter into with our clients. The revenues we recognize, therefore, are derived from our ability to charge our clients for those services under our contracts. A more detailed discussion of our revenue recognition on contract types is included in Note 1, “Accounting Policies” to our “Consolidated Financial Statements and Supplementary Data” included under Item 8 of this report.
We enter into three major types of contracts: “cost-plus contracts,” “fixed-price contracts” and “time-and-materials contracts.” Within each of the major contract types are variations on the basic contract mechanism. Fixed-price contracts generally present us with the highest level of financial and performance risk, but often also provide the highest potential financial returns. Cost-plus contracts present us with lower risk, but generally provide lower returns and often include more onerous terms and conditions. Time-and-materials contracts generally represent the time spent by our professional staff at stated or negotiated billing rates.
We account for our professional planning, design and various other types of engineering projects, including systems engineering, program management and construction management contracts on the “percentage-of-completion” method, wherein revenue is recognized as project progress occurs. Service-related contracts, including operations and maintenance services and a variety of technical assistance services, are accounted for over the period of performance, in proportion to the costs of performance, evenly over the period or over units of production. If our estimate of costs at completion on any contract indicates that a loss will be incurred, we charge the entire estimated loss to operations in the period the loss becomes evident.
The use of the percentage-of-completion revenue recognition method requires us to make estimates and exercise judgment regarding the project’s expected revenues, costs and the extent of progress towards completion. We have a history of making reasonably dependable estimates of the extent of progress towards completion, contract revenue and contract completion costs on our long-term engineering and construction contracts. However, due to uncertainties inherent in the estimation process, it is possible that our completion costs may vary from our estimates.
Most of our percentage-of-completion projects follow the “cost-to-cost” method of determining the percentage of completion. Under the cost-to-cost method, we make periodic estimates of our progress towards project completion by analyzing costs incurred to date, plus an estimate of the amount of costs that we expect to incur until the completion of the project. Revenue is then calculated on a cumulative basis (project-to-date) as the total contract value multiplied by the current percentage of completion. The revenue for the current period is calculated as cumulative revenues less project revenues already recognized. The process of estimating costs on engineering and construction projects combines professional engineering, cost estimating, pricing and accounting skills. The recognition of revenues and profit is dependent upon the accuracy of a variety of estimates, including engineering progress, materials quantities, achievement of milestones and other incentives, penalty provisions, labor productivity and cost estimates. Such estimates are based on various judgments we make with respect to those factors and are difficult to accurately determine until the project is significantly underway.
For some contracts, using the cost-to-cost method in estimating the percentage of completion may overstate the progress on the project. For projects where the cost-to-cost method does not appropriately reflect the progress on the projects, we use alternative methods such as actual labor hours, for measuring progress on the project and recognize revenue accordingly. For instance, in a project where a large amount of permanent materials are purchased, including the costs of these materials in calculating the percentage of completion may overstate the actual progress on the project. For these types of projects, actual labor hours spent on the project may be a more appropriate measure of the progress on the project.
Once contract performance is underway, we may experience changes in conditions, client requirements, specifications, designs, materials and expectations regarding the period of performance. Such changes may be initiated by us or by our clients. The majority of such changes presents little or no financial risk to us. Generally, a “change order” will be negotiated between our client and ourselves to reflect how the change is to be resolved and who is responsible for the financial impact of the change. Occasionally, however, disagreements can arise regarding changes, their nature, measurement, timing and other characteristics that impact costs and, therefore, revenues. When a change becomes a point of dispute between our client and us, we then consider it as a claim.
Costs related to change orders and claims are recognized when they are incurred. Change orders are included in total estimated contract revenue when it is probable that the change order will result in a bona fide addition to contract value and can be reliably estimated. Claims are included in total estimated contract revenues, only to the extent that contract costs related to the claims have been incurred and when it is probable that the claim will result in a bona fide addition to contract value which can be reliably estimated. No profit is recognized on claims until final settlement occurs. This can lead to a situation where costs are recognized in one period and revenues are recognized in a subsequent period when a client agreement is obtained or claims resolution occurs.
We have contracts with the U.S. government that contain provisions requiring compliance with the FAR, and the CAS. These regulations are generally applicable to all of our federal government contracts and are partially or fully incorporated in many local and state agency contracts. They limit the recovery of certain specified indirect costs on contracts subject to the FAR. Cost-plus contracts covered by the FAR provide for upward or downward adjustments if actual recoverable costs differ from the estimate billed under forward pricing arrangements. Most of our federal government contracts are subject to termination at the convenience of the client. Contracts typically provide for reimbursement of costs incurred and payment of fees earned through the date of such termination.