STEWARDSHIP FINANCIAL CORPORATION AND SUBSIDIARY
STOCK PERFORMANCE GRAPH
The following graph compares the cumulative total return on a hypothetical $100 investment made on December 31, 2001 in: (a) Stewardship Financial Corporation’s common stock; (b) Nasdaq Composite Index; and (c) Peer index. The Peer index consists of ten banks located in New Jersey and Pennsylvania with total asset size and operating performance comparable with the Corporation. The peer group consists of 1st Constitution Bancorp, Boardwalk Bancorp, Inc., Central Jersey Bancorp, Codorus Valley Bancorp, Inc., Community Bank of Bergen County, Mid Pen Bancorp, Somerset Hills Bancorp, Sterling Bank, Sussex Bancorp, and Unity Bancorp, Inc. The information provided is not necessarily indicative of the Corporation’s future performance.
| | | | | | Period Ending | | | | | |
Index | | 12/31/01 | | 12/31/02 | | 12/31/03 | | 12/31/04 | | 12/31/05 | | 12/31/06 | |
| Stewardship Financial Corporation | | $ | 100.00 | | $ | 104.14 | | $ | 199.11 | | $ | 197.86 | | $ | 194.82 | | $ | 191.22 | |
| Nasdaq Composite Index | | | 100.00 | | | 68.80 | | | 103.64 | | | 113.07 | | | 115.43 | | | 127.36 | |
| Peer Index | | | 100.00 | | | 113.54 | | | 170.37 | | | 207.19 | | | 212.37 | | | 214.56 | |
STEWARDSHIP FINANCIAL CORPORATION AND SUBSIDIARY
CONSOLIDATED FINANCIAL SUMMARY OF SELECTED FINANCIAL DATA
| | | December 31, | |
| | | 2006 | | 2005 | | 2004 | | 2003 | | 2002 | |
| | | (Dollars in thousands, except per share amounts) | |
Earnings Summary: | | | | | | | | | | | |
| | | | | | | | | | | | |
| Net interest income | | $ | 19,084 | | $ | 18,211 | | $ | 16,367 | | $ | 14,324 | | $ | 12,507 | |
| Provision for loan losses | | | (264 | ) | | (600 | ) | | (540 | ) | | (425 | ) | | (160 | ) |
| Net interest income after provision for loan losses | | | 18,820 | | | 17,611 | | | 15,827 | | | 13,899 | | | 12,347 | |
| Noninterest income | | | 4,189 | | | 3,240 | | | 2,726 | | | 2,894 | | | 2,250 | |
| Noninterest expense | | | 15,629 | | | 13,867 | | | 12,501 | | | 11,394 | | | 9,847 | |
| Income before income tax expense | | | 7,380 | | | 6,984 | | | 6,052 | | | 5,399 | | | 4,750 | |
| Income tax expense | | | 2,627 | | | 2,504 | | | 2,204 | | | 1,908 | | | 1,634 | |
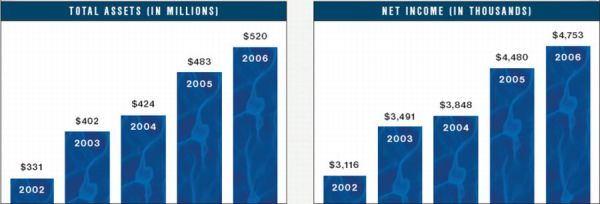
| Net income | | $ | 4,753 | | $ | 4,480 | | $ | 3,848 | | $ | 3,491 | | $ | 3,116 | |
| | | | | | | | | | | | | | | | | |
Common Share Data: (1) | | | | | | | | | | | | | | | | |
| | | | | | | | | | | | | | | | | |
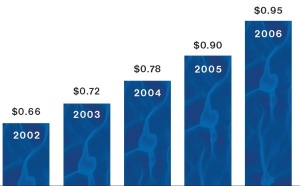
| Basic net income | | $ | 0.95 | | $ | 0.90 | | $ | 0.78 | | $ | 0.72 | | $ | 0.66 | |
| Diluted net income | | | 0.94 | | | 0.89 | | | 0.77 | | | 0.71 | | | 0.65 | |
| Cash dividends declared | | | 0.30 | | | 0.25 | | | 0.21 | | | 0.17 | | | 0.14 | |
| Book value at year end | | | 7.43 | | | 6.70 | | | 6.16 | | | 5.56 | | | 4.96 | |
| Average shares outstanding, net of treasury stock | | | 5,021 | | | 4,991 | | | 4,911 | | | 4,847 | | | 4,749 | |
| Shares outstanding at year end | | | 5,018 | | | 4,986 | | | 4,948 | | | 4,886 | | | 4,802 | |
| Dividend payout ratio | | | 32.19 | % | | 27.79 | % | | 26.46 | % | | 23.37 | % | | 21.41 | % |
| | | | | | | | | | | | | | | | | |
Selected Consolidated Ratios: | | | | | | | | | | | | | | | | |
| | | | | | | | | | | | | | | | | |
| Return on average assets | | | 0.96 | % | | 1.00 | % | | 0.95 | % | | 0.97 | % | | 1.03 | % |
| Return on average stockholders' equity | | | 13.41 | % | | 13.86 | % | | 13.48 | % | | 13.68 | % | | 14.01 | % |
| Average stockholders' equity as a percentage of average total assets | | | 7.19 | % | | 7.20 | % | | 7.06 | % | | 7.12 | % | | 7.36 | % |
| Tier-l capital leverage (2) | | | 8.85 | % | | 8.71 | % | | 9.08 | % | | 8.89 | % | | 7.02 | % |
| Tier-l risk based capital (3) | | | 11.25 | % | | 11.16 | % | | 12.48 | % | | 12.93 | % | | 10.53 | % |
| Total risk based capital (3) | | | 12.28 | % | | 12.21 | % | | 13.57 | % | | 14.03 | % | | 11.74 | % |
| Allowance for loan loss to total loans | | | 1.11 | % | | 1.11 | % | | 1.11 | % | | 1.10 | % | | 1.24 | % |
| Nonperforming loans to total loans | | | 0.41 | % | | 0.15 | % | | 0.48 | % | | 0.42 | % | | 0.62 | % |
| | | | | | | | | | | | | | | | | |
Selected Year-end Balances: | | | | | | | | | | | | | | | | |
| | | | | | | | | | | | | | | | | |
| Total assets | | $ | 519,749 | | $ | 482,727 | | $ | 424,306 | | $ | 401,768 | | $ | 331,087 | |
| Total loans, net of allowance for loan loss | | | 365,443 | | | 341,976 | | | 292,909 | | | 258,776 | | | 213,579 | |
| Total deposits | | | 434,223 | | | 403,466 | | | 356,730 | | | 341,335 | | | 302,304 | |
| Stockholders' equity | | | 37,306 | | | 33,384 | | | 30,460 | | | 27,149 | | | 23,817 | |
| (1) | All share and per share amounts have been restated to reflect a 5% stock dividend paid November 2002, 2003, 2004, 2005 and 2006, respectively, a 3 for 2 stock split that occurred July 2003 and a 4 for 3 stock split that occurred July 2005. |
| (2) | As a percentage of average quarterly assets. |
| (3) | As a percentage of total risk-weighted assets. |
Management’s Discussion and Analysis of Financial Condition and Results of Operations
This section provides an analysis of the Stewardship Financial Corporation’s (the “Corporation”) consolidated financial condition and results of operations for the years ended December 31, 2006, 2005 and 2004. The analysis should be read in conjunction with the related audited consolidated financial statements and the accompanying notes presented elsewhere herein.
This annual report contains certain “forward looking statements” within the meaning of the Private Securities Litigation Reform Act of 1995, and may be identified by the use of such words as “believe,” “expect,” “anticipate,” “should,” “plan,” “estimate,” and “potential.” Examples of forward looking statements include, but are not limited to, estimates with respect to the financial condition, results of operations and business of the Corporation that are subject to various factors which could cause actual results to differ materially from these estimates. These factors include: changes in general, economic and market conditions, legislative and regulatory conditions, or the development of an interest rate environment that adversely affects the Corporation’s interest rate spread or other income anticipated from operations and investments. As used in this annual report, “we” and “us” and “our” refer to Stewardship Financial Corporation and its consolidated subsidiary, Atlantic Stewardship Bank, depending on the context.
Introduction
The Corporation, organized in January 1995, as a business corporation under the laws of the State of New Jersey, was established by the Board of Directors of Atlantic Stewardship Bank (the “Bank”) to become a holding company for the Bank. The shareholders of the Bank approved the holding company formation at the annual meeting in 1996. After obtaining approval and submitting appropriate applications, the Corporation, on November 22, 1996, acquired all of the shares of the Bank in exchange for its own shares, on a share per share basis. The Bank, and its subsidiaries, Stewardship Investment Corporation and Stewardship Realty Corporation LLC, are wholly-owned subsidiaries of the Corporation. The Corporation also formed a second subsidiary in 2003, Stewardship Statutory Trust I (the "Trust”). The Trust was formed to issue Trust Preferred Securities to enhance the capital position of the Corporation. The Trust is not consolidated with the Corporation’s financial statements due to the adoption of Financial Accounting Standards Board (FASB) Interpretation No. 46 (revised December 2003) “Consolidation of Variable Interest Entities” (“FIN 46R”).
The Corporation conducts a general commercial and retail banking business encompassing a wide range of traditional deposit and lending functions along with the other customary banking services. Stewardship Investment Corporation is a wholly-owned nonbank subsidiary of the Bank, whose primary business is to own and manage the Bank’s investment portfolio. Stewardship Realty Corporation, a subsidiary of the Bank was formed in September 2005 to purchase a property located at 612 Godwin Avenue, Midland Park, Bergen County, New Jersey. The property, located next to the main office of the Corporation, will be used for future office space for the administrative area of the Bank. The Corporation earns income and generates cash primarily through the deposit gathering activities of the branch network. These deposits are then utilized to fund the Corporation’s lending and investing activities.
The Corporation is affected by the overall economic conditions in northern New Jersey, the interest rate and yield curve environment, and the overall national economy. These factors are relevant because they will affect our ability to attract specific deposit products, our ability to invest in loan and investment products, and our ability to earn acceptable profits without incurring increased risks.
When evaluating the financial condition and operating performance of the organization, management reviews historical trends, peer comparisons, asset and deposit concentrations, interest margin analysis, adequacy of loan loss reserve and loan quality performance, adequacy of capital under current positions as well as to support future expansion, adequacy of liquidity, and overall quality of earnings performance.
The Corporation has developed a strong deposit base with good franchise value. Several challenges are to continue to grow the existing branch levels, explore new branch opportunities, provide adequate technology enhancements to achieve efficiencies, provide strong products, and provide the highest level of customer service.
During 2006, the Corporation opened its tenth branch location at 2 Changebridge Road, Montville, Morris County, New Jersey. This is a full service facility offering safe deposits, a two lane drive-up and an ATM drive-up facility. This represents a new market area for the Corporation where our products and services have been well accepted.
The Corporation also worked during the second half of 2006 to build its eleventh branch location at 378 Franklin Avenue, Wyckoff, Bergen County, New Jersey. This branch opened in March 2007, with its grand opening scheduled in April and is expected to be a convenient location to service existing as well as new customers. It will also be a full service facility offering safe deposits, a two lane drive-up and an ATM drive-up facility.
Early in January 2007, the Corporation signed a lease for its twelfth branch to be located in Westwood, Bergen County, New Jersey and, pending all appropriate approvals, plans to provide services to a new market area beginning in the third quarter of 2007. The branch network built by the Corporation covers a strong market area designed to attract a diversified customer base that has and will continue to utilize our strong base of loan and deposit products.
During the fourth quarter of 2006, Management completed two transactions that positioned the Corporation to improve future profitability and asset yields. The Corporation successfully completed a sale of its $3.4 million credit card portfolio to Elan Financial Services (“Elan”). Elan, a national provider of credit card services, purchased the portfolio and will continue to service and offer credit card products in the name of Atlantic Stewardship Bank. The proceeds from the sale were reinvested in other lending opportunities. The Corporation will realize, in addition to the premium paid on the portfolio, future income from Elan based on new card production and customer activity.
Management also completed the sale of $17.3 million available for sale securities that were yielding less than 5%. The proceeds realized from the sale were used to purchase higher yielding securities and to fund loan growth. Management anticipates that this transaction will improve portfolio yields and reduce exposure to future interest rate risk.
Recent Accounting Pronouncements
A discussion of recent pronouncements and their effect on the Corporation’s financial statements can be found in Note 20 of the financial statements.
Critical Accounting Policies And Estimates
“Management’s Discussion and Analysis of Financial Condition and Results of Operation,” is based upon the Corporation’s consolidated financial statements, which have been prepared in accordance with accounting principles generally accepted in the United States of America. The preparation of these financial statements requires the Corporation to make estimates and judgments that affect the reported amounts of assets, liabilities, revenues and expenses. Note 1 to the Corporation’s Audited Consolidated Financial Statements for the year ended December 31, 2006 contains a summary of the Corporation’s significant accounting policies. Management believes the Corporation’s policy with respect to the methodology for the determination of the allowance for loan losses involves a higher degree of complexity and requires management to make difficult and subjective judgments, which often require assumptions or estimates about highly uncertain matters. Changes in these judgments, assumptions or estimates could materially impact results of operations. This critical policy and its application are periodically reviewed with the Audit Committee and the Board of Directors.
The allowance for loan losses is based upon management’s evaluation of the adequacy of the allowance, including an assessment of known and inherent risks in the portfolio, giving consideration to the size and composition of the loan portfolio, actual loan loss experience, level of delinquencies, detailed analysis of individual loans for which full collectibility may not be assured, the existence and estimated net realizable value of any underlying collateral and guarantees securing the loans, and current economic and market conditions. Although management uses the best information available, the level of the allowance for loan losses remains an estimate, which is subject to significant judgment and short-term change. Various regulatory agencies, as an integral part of their examination process, periodically review the Corporation’s allowance for loan losses. Such agencies may require the Corporation to make additional provisions for loan losses based upon information available to them at the time of their examination. Furthermore, the majority of the Corporation’s loans are secured by real estate in the State of New Jersey. Accordingly, the collectibility of a substantial portion of the carrying value of the Corporation’s loan portfolio is susceptible to changes in local market conditions and may be adversely affected should real estate values decline or the northern New Jersey area experience an adverse economic shock. Future adjustments to the allowance for loan losses may be necessary due to economic, operating, regulatory and other conditions beyond the Corporation’s control.
Earnings Summary
The Corporation reported net income of $4.75 million, or $0.95 basic earnings per share, for the year ended December 31, 2006, an increase of $273,000, or 6.1%, above the $4.48 million recorded for 2005. Earnings for 2005 had increased $632,000, or 16.4%, over the 2004 earnings of $3.85 million. Earnings have increased in both years as a result of increases in net interest income and noninterest income, offset by increases in noninterest expense.
The Federal Reserve began a period of measured increases in interest rates in June 2004 that continued through June 2006. For 2004, the targeted federal funds rate began at 1.00% and increased 0.25% at each Federal Open Market Committee meeting in 2004 and 2005 and paused at the June 2006 meeting at 5.25%. Short-term interest rates increased as a result of the increases by the Federal Reserve, while market driven longer term interest rates remained mostly unchanged at historically low levels creating an inverted yield curve. The level of interest rates, inverted yield curve and competitive loan and deposit environment created pressure on net interest margins. The Corporation’s net interest income increased $873,000. An increase in the average loan volume partially offset by the rising costs of deposits and borrowings contributed to this increase.
The return on average assets decreased in 2006 to 0.96% from 1.00% in 2005. The return on average equity decreased to 13.41% in 2006 from 13.86% in 2005.
Results of Operations
Net Interest Income
The Corporation’s principal source of revenue is the net interest income derived from the Bank, which represents the difference between the interest earned on assets and interest paid on funds acquired to support those assets. Net interest income is affected by the balances and mix of interest-earning assets and interest-bearing liabilities, changes in their corresponding yields and costs, and by the volume of interest-earning assets funded by noninterest-bearing deposits. The Corporation’s principal interest-earning assets are loans made to businesses and individuals, investment securities, and federal funds sold.
In 2006, net interest income, on a tax equivalent basis, increased to $19.35 million from $18.48 million in 2005, an increase of $872,000, or 4.7%. This was caused by an increase of $3.6 million, or 3.6%, in net average interest-earning assets (average interest-earning assets less average interest-bearing liabilities).
Interest income, on a tax equivalent basis, increased $5.1 million, or 20.3%, during 2006 to $30.27 million from $25.17 million earned during 2005. The increase was due to an increase in the average volume of interest-earning assets and an increase in yields on interest-earning assets. Average interest-earning assets increased $40.4 million in 2006, or 9.5%, over the 2005 amount with average loans attributing to $44.2 million of the increase due primarily to the Corporation’s competitiveness within the marketplace. Yields on interest earning assets increased 59 basis points from 5.93% in 2005 to 6.52% in 2006.
Interest expense increased $4.2 million, or 63.2%, during 2006 to $10.92 million. The increase was due to an increase in average interest-bearing liabilities of $36.8 million, or 11.3%, to $361.50 million during 2006. Yields on interest-bearing liabilities increased to 3.02% during 2006 from 2.06% during 2005. The competitive interest rate environment created a challenging deposit market. With the rise in short-term interest rates, customers have become very interest rate sensitive, demanding higher interest rates on short-term investments. The Corporation experienced a shift from interest-bearing demand and savings deposits into certificate of deposits. In order to supplement funding needs, the Corporation utilized the brokered certificate of deposit market. As of December 31, 2006, the Corporation had $19.67 million brokered certificates with average yields of 5.37% and average maturities of 0.64 years. The Corporation also encouraged depositors by enhancing our Kids Savings product and introducing our Business Freedom Checking Account. The Corporation anticipates that new branches and products will provide future core deposit growth for the Corporation.
In 2005, net interest income, on a tax equivalent basis, increased to $18.48 million from $16.66 million in 2004, an increase of $1.8 million, or 10.9%. Interest income, on a tax equivalent basis, increased $3.7 million, or 17.4%, during 2005 to $25.17 million from $21.45 million earned in 2004 and yields increased 34 basis points to 5.93% for 2006. The increase was due to an increase in the average volume of interest-earning assets and an increase in yields on interest-earning assets. Average interest-earning assets increased $40.8 million in 2005, or 10.6%, over the 2004 amount. Interest expense increased $1.9 million, or 39.8%, during 2005. The increase was due to an increase in average interest-bearing liabilities and an increase in yields on interest-bearing liabilities. Average noninterest-bearing demand deposits increased $7.5 million, or 9.3% to $88.86 million during 2005 and yields increased 42 basis points to 2.06% for 2006.
The following table reflects the components of the Corporation’s net interest income for the years ended December 31, 2006, 2005 and 2004 including, (1) average assets, liabilities, and stockholders’ equity, (2) interest income earned on interest-earning assets and interest expense paid on interest-bearing liabilities, (3) average yields earned on interest-earning assets and average rates paid on interest-bearing liabilities, and (4) net yield on interest-earning assets. Nontaxable income from investment securities is presented on a tax-equivalent basis assuming a statutory tax rate of 34% for the years presented. This was accomplished by adjusting this income upward to make it equivalent to the level of taxable income required to earn the same amount after taxes.
| | | 2006 | | 2005 | | 2004 | |
| | | Average Balance | | Interest Income/ Expense | | Average Rates Earned Paid | | Average Balance | | Interest Income/ Expense | | Average Rates Earned / Paid | | Average Balance | | Interest Income/ Expense | | Average Rates Earned/ Paid | |
| | | (Dollars in thousands) | |
Assets | | | | | | | | | | | | | | | | | | | |
| Interest-earning assets: | | | | | | | | | | | | | | | | | | | |
| Loans (1) | | $ | 359,806 | | $ | 25,619 | | | 7.12 | % | $ | 315,605 | | $ | 20,927 | | | 6.63 | % | $ | 275,334 | | $ | 17,346 | | | 6.30 | % |
| Taxable investment securities (1) | | | 85,322 | | | 3,732 | | | 4.37 | | | 81,332 | | | 3,130 | | | 3.85 | | | 84,641 | | | 3,103 | | | 3.67 | |
| Tax-exempt investment securities (1) (2) | | | 18,702 | | | 868 | | | 4.64 | | | 18,998 | | | 852 | | | 4.48 | | | 20,134 | | | 952 | | | 4.73 | |
| Other interest-earning assets | | | 741 | | | 51 | | | 6.88 | | | 8,200 | | | 262 | | | 3.20 | | | 3,270 | | | 46 | | | 1.41 | |
| Total interest-earning assets | | | 464,571 | | | 30,270 | | | 6.52 | | | 424,135 | | | 25,171 | | | 5.93 | | | 383,379 | | | 21,447 | | | 5.59 | |
| Non-interest-earning assets: | | | | | | | | | | | | | | | | | | | | | | | | | | | | |
| Allowance for loan losses | | | (4,020 | ) | | | | | | | | (3,600 | ) | | | | | | | | (3,086 | ) | | | | | | |
| Other assets | | | 32,862 | | | | | | | | | 28,442 | | | | | | | | | 24,139 | | | | | | | |
| Total assets | | $ | 493,413 | | | | | | | | $ | 448,977 | | | | | | | | $ | 404,432 | | | | | | | |
Liabilities and Stockholders' Equity | | | | | | | | | | | | | | | | | | | | | | | | | | | | |
| Interest-bearing liabilities: | | | | | | | | | | | | | | | | | | | | | | | | | | | | |
| Interest-bearing demand deposits | | $ | 116,405 | | $ | 2,064 | | | 1.77 | % | $ | 133,968 | | $ | 1,531 | | | 1.14 | % | $ | 122,426 | | $ | 810 | | | 0.66 | % |
| Savings deposits | | | 41,682 | | | 256 | | | 0.61 | | | 48,300 | | | 286 | | | 0.59 | | | 49,390 | | | 344 | | | 0.70 | |
| Time deposits | | | 160,816 | | | 6,560 | | | 4.08 | | | 114,763 | | | 3,673 | | | 3.20 | | | 91,163 | | | 2,450 | | | 2.69 | |
| Repurchase agreements | | | 7,461 | | | 331 | | | 4.44 | | | 3,371 | | | 98 | | | 2.91 | | | 2,832 | | | 37 | | | 1.31 | |
| FHLB borrowings | | | 27,923 | | | 1,218 | | | 4.36 | | | 17,054 | | | 614 | | | 3.60 | | | 19,138 | | | 657 | | | 3.43 | |
| Subordinated debenture | | | 7,217 | | | 487 | | | 6.75 | | | 7,217 | | | 487 | | | 6.75 | | | 7,217 | | | 487 | | | 6.75 | |
| Total interest-bearing liabilities | | | 361,504 | | | 10,916 | | | 3.02 | | | 324,673 | | | 6,689 | | | 2.06 | | | 292,166 | | | 4,785 | | | 1.64 | |
| Noninterest-bearing liabilities: | | | | | | | | | | | | | | | | | | | | | | | | | | | | |
| Demand deposits | | | 92,217 | | | | | | | | | 88,863 | | | | | | | | | 81,321 | | | | | | | |
| Other liabilities | | | 4,234 | | | | | | | | | 3,120 | | | | | | | | | 2,398 | | | | | | | |
| Stockholders' equity | | | 35,458 | | | | | | | | | 32,321 | | | | | | | | | 28,547 | | | | | | | |
| Total liabilities and stockholders' equity | | $ | 493,413 | | | | | | | | $ | 448,977 | | | | | | | | $ | 404,432 | | | | | | | |
| | | | | | | | | | | | | | | | | | | | | | | | | | | | | |
| Net interest income (taxable equivalent basis) | | | | | | 19,354 | | | | | | | | | 18,482 | | | | | | | | | 16,662 | | | | |
| Tax equivalent adjustment | | | | | | (270 | ) | | | | | | | | (271 | ) | | | | | | | | (295 | ) | | | |
| Net interest income | | | | | $ | 19,084 | | | | | | | | $ | 18,211 | | | | | | | | $ | 16,367 | | | | |
| | | | | | | | | | | | | | | | | | | | | | | | | | | | | |
| Net interest spread (taxable equivalent basis) | | | | | | | | | 3.50 | % | | | | | | | | 3.87 | % | | | | | | | | 3.95 | % |
| | | | | | | | | | | | | | | | | | | | | | | | | | | | | |
| Net yield on interest-earning assets (taxable equivalent basis) (3) | | | | | | | | | 4.17 | % | | | | | | | | 4.36 | % | | | | | | | | 4.35 | % |
| (1) | For purpose of these calculations, nonaccruing loans are included in the average balance. Fees are included in loan interest. Loans and total interest-earning assets are net of unearned income. Securities are included at amortized cost. |
| (2) | The tax equivalent adjustments are based on a marginal tax rate of 34%. |
| (3) | Net interest income (taxable equivalent basis) divided by average interest-earning assets. |
The following table analyzes net interest income in terms of changes in the volume of interest-earning assets and interest-bearing liabilities and changes in yields earned and rates paid on such assets and liabilities on a tax equivalent basis. The table reflects the extent to which changes in the Corporation’s interest income and interest expense are attributable to changes in volume (changes in volume multiplied by prior year rate) and changes in rate (changes in rate multiplied by prior year volume). Changes attributable to the combined impact of volume and rate have been allocated proportionately to changes due to volume and changes due to rate.
| | | 2006 Versus 2005 | | 2005 Versus 2004 | |
| | | (In thousands) | |
| | | Increase (Decrease) Due to Change in | | | | Increase (Decrease) Due to Change in | | | |
| | | Volume | | Rate | | Net | | Volume | | Rate | | Net | |
| | | | | | | | | | | | | | |
| Interest income: | | | | | | | | | | | | | |
| | | | | | | | | | | | | | |
| Loans. | | $ | 3,073 | | $ | 1,619 | | $ | 4,692 | | $ | 2,635 | | $ | 946 | | $ | 3,581 | |
| Taxable investment securities | | | 159 | | | 443 | | | 602 | | | (230 | ) | | 257 | | | 27 | |
| Tax-exempt investment securities | | | (13 | ) | | 29 | | | 16 | | | (52 | ) | | (48 | ) | | (100 | ) |
| Other interest-earning assets | | | (360 | ) | | 149 | | | (211 | ) | | 117 | | | 99 | | | 216 | |
| | | | | | | | | | | | | | | | | | | | |
| Total interest-earning assets. | | | 2,859 | | | 2,240 | | | 5,099 | | | 2,470 | | | 1,254 | | | 3,724 | |
| | | | | | | | | | | | | | | | | | | | |
| Interest expense: | | | | | | | | | | | | | | | | | | | |
| | | | | | | | | | | | | | | | | | | | |
| Interest-bearing demand deposits | | $ | (222 | ) | $ | 755 | | $ | 533 | | $ | 83 | | $ | 638 | | $ | 721 | |
| Savings deposits | | | (40 | ) | | 10 | | | (30 | ) | | (7 | ) | | (51 | ) | | (58 | ) |
| Time deposits | | | 1,714 | | | 1,173 | | | 2,887 | | | 704 | | | 519 | | | 1,223 | |
| Repurchase agreements | | | 163 | | | 70 | | | 233 | | | 8 | | | 53 | | | 61 | |
| FHLB borrowings | | | 453 | | | 151 | | | 604 | | | (74 | ) | | 31 | | | (43 | ) |
| | | | | | | | | | | | | | | | | | | | |
| Total interest-bearing liabilities | | | 2,068 | | | 2,159 | | | 4,227 | | | 714 | | | 1,190 | | | 1,904 | |
| | | | | | | | | | | | | | | | | | | | |
| Net change in net interest income. | | $ | 791 | | $ | 81 | | $ | 872 | | $ | 1,756 | | $ | 64 | | $ | 1,820 | |
Provision for Loan Losses
The Corporation maintains an allowance for loan losses considered by management to be adequate to cover the inherent risk of loss associated with its loan portfolio. On an ongoing basis, management analyzes the adequacy of this allowance by considering the nature and volume of the Corporation’s loan activity, financial condition of the borrower, fair market value of underlying collateral, and changes in general market conditions. Additions to the allowance for loan losses are charged to operations in the appropriate period. Actual loan losses, net of recoveries, serve to reduce the allowance. The appropriate level of the allowance for loan losses is based on estimates, and ultimate losses may vary from current estimates.
The loan loss provision totaled $264,000 in 2006 representing a 56.0% decrease from the 2005 provision of $600,000. The 2005 provision increased 11.1% from the 2004 provision of $540,000. The loan loss provision for 2006 contained an $86,000 reversal of loan loss due to the sale of the credit card portfolio. The provision expense for each year is a reflection of loan growth, loan mix, net chargeoffs, and the overall level of nonperforming loans.
Noninterest Income
Noninterest income consists of all income other than interest income and is principally derived from service charges on deposits, gain on sales of mortgage loans, income derived from bank owned life insurance, fees on safe deposit boxes, credit card merchant income and income derived from debit cards and ATM usage.
Noninterest income increased $949,000, or 29.3%, to $4.19 million during the year ended December 31, 2006, when compared with $3.24 million during the comparable 2005 period. The increase in noninterest income resulted primarily from the gain on the sale of the credit card portfolio of $746,000, an increase of $214,000 in fees and service charges primarily caused by the implementation of an overdraft protection program for personal customers, an increase of $102,000 representing the full year effect of purchasing bank owned life insurance in 2005 and an increase of $323,000 in merchant processing, partially offset by the loss on the sale of available for sale securities of $435,000. The sale of the credit card portfolio was completed during the fourth quarter of 2006, pursuant to which management sold $3.4 million credit card loans to Elan. Under the agreement, Elan
purchased the portfolio for a 19% premium and agreed to honor the existing award program offered to customers. Under the terms of the agreement, cards will still be offered in the name of Atlantic Stewardship Bank. The Corporation will share in future income as new cards are issued and as cardholders complete transactions. Management’s analysis revealed that proceeds could be reinvested and resources reallocated to other more profitable lending products and customers could retain strong credit card products and services.
The investment restructuring completed during the fourth quarter of 2006 resulted in the sale of $17.3 million available for sale securities yielding less than 5% with a loss of $435,000. Proceeds were reinvested in higher yielding investments and loans that should improve earning asset yields and decrease future interest rate risk.
Noninterest income increased by $514,000, or 18.9%, to $3.24 million during the year ended December 31, 2005, when compared with $2.73 million during the 2004 period. The increase resulted from an increase of $104,000 in gains on sales of mortgage loans due to an increase in the volume of loans originated for sale. In April 2005, the Corporation purchased $8.0 million in bank owned life insurance on key management personnel. The increase in the cash surrender value of the insurance policies was recognized in income for 2005 in the amount of $210,000. Income from merchant card processing increased by $135,000 in 2005 compared with the year ended 2004 due to an increase in the number of customers using this service.
Noninterest Expense
Although management is committed to containing noninterest expense, the continued growth of the Corporation has caused noninterest expense to increase by $1.8 million or 12.7%, to $15.63 million for the year ended December 31, 2006, compared to $13.87 million for the same period in 2005. Salaries and employee benefits, the major component of noninterest expense, increased $712,000, or 11.7%. The increase was due primarily to staffing increases in lending, new business development, and the new Montville branch and for general merit and performance increases. Occupancy and equipment expenses increased $467,000 primarily due to the expenses relating to the new Montville and Wyckoff branches. Data processing expenses increased $122,000 due to continued growth of deposit and loan processing and merchant processing expenses increased $309,000 due to the growth in the merchant business.
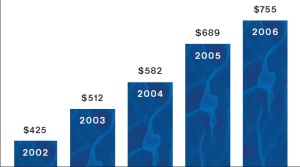
In accordance with its By-laws to tithe ten percent (10%) of its pre-tax profits to various charities, the Corporation had charitable contributions totaling $755,000 for the year ended December 31, 2006, an increase of $66,000, or 9.6%, over the same period in 2005.
Noninterest expense increased $1.4 million, or 10.9%, to $13.87 million for the year ended December 31, 2005, compared to $12.50 million for the same period in 2004. Increases in salaries and employee benefits totaling $441,000, or 7.8%, were primarily a result of general merit and performance increases and increases in benefit related expenses. Data processing expenses increased $134,000, or 13.2%, due to increases in our deposit and lending base and advertising increased $137,000 to support product offerings and the 20th anniversary celebration. Merchant expense increased $101,000 due to increased merchant business and donation expense increased $107,000 due to the increase in pretax earnings. Miscellaneous expenses increased $346,000, or 19.0%, as a result of increases in consulting expense and the general growth of the Corporation. During 2005, the Corporation hired an outside consulting firm to work with management in the documentation of internal controls. This has helped in moving the Corporation towards compliance with Sarbanes Oxley Act Section 404 which requires management to assess and document the adequacy of internal controls. Management anticipates that the consulting firm will continue their work in 2007.
Income Taxes
Income tax expense totaled $2.63 million for the year ended December 31, 2006, for an effective tax rate of 35.6%, compared to $2.50 million, for an effective tax rate of 35.9% for the year ended December 31, 2005, and $2.20 million, for an effective tax rate of 36.4% for the year ended December 31, 2004. The decrease in the effective tax rate can be attributed primarily to the tax deferred income derived from bank owned life insurance.
Financial Condition
Total assets at December 31, 2006 were $519.75 million, an increase of $37.0 million, or 7.7%, over the $482.73 million at December 31, 2005. This increase in assets reflects, among other things, a $23.5 million increase in net loans held for portfolio, and an $8.6 million increase in securities available for sale.
Loan Portfolio
The Corporation’s loan portfolio at December 31, 2006, net of allowance for loan losses, totaled $365.44 million, an increase of $23.5 million, or 6.9%, over the $341.98 million at December 31, 2005. Commercial real estate mortgage loans consisting of $177.41 million, or 47.9% of the total portfolio, comprised the largest portion of the loan portfolio. This represented an increase of $14.1 million from $163.31 million, or 47.2% of the total loan portfolio at December 31, 2005. Commercial loans increased $7.6 million to $72.61 million, representing 19.6% of the total loan portfolio. Consumer installment loans increased $849,000, despite the sale of $3.4 million of credit cards. Residential real estate mortgages increased $1.4 million. The Corporation continued its policy of selling the majority of its residential real estate loans in the secondary market. All of these loans have been sold with servicing released.
The Corporation’s lending activities are concentrated in loans secured by real estate located in northern New Jersey and therefore collectibility of the loan portfolio is susceptible to changes in real estate market conditions in the northern New Jersey market. The Corporation has not made loans to borrowers outside the United States.
At December 31, 2006, there were no concentrations of loans exceeding 10% of total loans outstanding. Loan concentrations are considered to exist when there are amounts loaned to a multiple number of borrowers engaged in similar activities which would cause them to be similarly impacted by economic or other related conditions.
The following table sets forth the classification of the Corporation’s loans by major category at the end of the last five years:
| | | December 31, | |
| | | 2006 | | 2005 | | 2004 | | 2003 | | 2002 | |
| | | (In thousands) | |
| | | | | | | | | | | | |
| Real estate mortgage: | | | | | | | | | | | |
| Residential | | $ | 47,020 | | $ | 45,604 | | $ | 41,569 | | $ | 44,835 | | $ | 39,705 | |
| Commercial | | | 177,411 | | | 163,309 | | | 130,762 | | | 109,708 | | | 88,593 | |
| | | | | | | | | | | | | | | | | |
| Commercial loans | | | 72,606 | | | 65,011 | | | 55,252 | | | 48,950 | | | 38,228 | |
| | | | | | | | | | | | | | | | | |
| Consumer loans: | | | | | | | | | | | | | | | | |
| Installment (1). | | | 52,389 | | | 51,540 | | | 47,218 | | | 41,067 | | | 37,293 | |
| Home equity. | | | 20,010 | | | 20,271 | | | 21,484 | | | 17,181 | | | 12,471 | |
| Other | | | 560 | | | 506 | | | 260 | | | 238 | | | 241 | |
| | | | | | | | | | | | | | | | | |
| Total gross loans | | | 369,996 | | | 346,241 | | | 296,545 | | | 261,979 | | | 216,531 | |
| Less: Allowance for loan losses | | | 4,101 | | | 3,847 | | | 3,299 | | | 2,888 | | | 2,689 | |
| Deferred loan fees | | | 452 | | | 418 | | | 337 | | | 315 | | | 263 | |
| Net loans | | $ | 365,443 | | $ | 341,976 | | $ | 292,909 | | $ | 258,776 | | $ | 216,579 | |
| (1) | Includes automobile, home improvement, second mortgages and unsecured loans. Credit card loans are also included for all years prior to December 31, 2006. |
The following table sets forth certain categories of gross loans as of December 31, 2006 by contractual maturity. Borrowers may have the right to prepay obligations with or without prepayment penalties. This might cause actual maturities to differ from the contractual maturities summarized below.
| | | Within 1 Year | | After 1 Year But Within 5 Years | | After 5 Years | | Total | |
| | | (In thousands) | |
| | | | | | | | | | |
| Real estate mortgage | | $ | 38,616 | | $ | 15,240 | | $ | 170,575 | | $ | 224,431 | |
| Commercial | | | 33,429 | | | 32,251 | | | 6,926 | | | 72,606 | |
| Consumer | | | 1,143 | | | 8,697 | | | 63,119 | | | 72,959 | |
| Total gross loans | | $ | 73,188 | | $ | 56,188 | | $ | 240,620 | | $ | 369,996 | |
The following table sets forth the dollar amount of all gross loans due one year or more after December 31, 2006, which have predetermined interest rates or floating or adjustable interest rates:
| | | Predetermined Rates | | Floating or Adjustable Rates | | Total | |
| | | (In thousands) | |
| | | | | | | | |
| Real estate mortgage | | $ | 63,679 | | $ | 122,136 | | $ | 185,815 | |
| Commercial | | | 22,184 | | | 16,993 | | | 39,177 | |
| Consumer | | | 51,680 | | | 20,136 | | | 71,816 | |
| | | $ | 137,543 | | $ | 159,265 | | $ | 296,808 | |
Asset Quality
The Corporation’s principal earning asset is its loan portfolio. Inherent in the lending function is the risk of deterioration in a borrower’s ability to repay loans under existing loan agreements. Management realizes that because of this risk, reserves are maintained to absorb loan losses. In determining the adequacy of the allowance for loan losses, management of the Corporation considers the risks inherent in its loan portfolio and changes in the nature and volume of its loan activities, along with general economic and real estate market conditions. Although management attempts to establish a reserve sufficient to offset probable incurred losses in the portfolio, changes in economic conditions, regulatory policies and borrower’s performance could require future changes to the allowance.
The Corporation utilizes a two tier approach by (1) identifying problem loans and allocating specific loss allowances on such loans and (2) establishing a general valuation allowance on the remainder of its loan portfolio. The Corporation maintains a loan review system that allows for a periodic review of its loan portfolio and the early identification of potential problem loans. Such a system takes into consideration, among other things, delinquency status, size of loans, type of collateral and financial condition of the borrowers. Allocations of specific loan loss allowances are established for identified loans based on a review of such information and/or appraisals of underlying collateral. General loan loss allowances are based upon a combination of factors including, but not limited to, actual loss experience, composition of loan portfolio, current economic conditions and management’s judgment.
The Corporation’s accounting policies are set forth in Note 1 to the audited financial statements. The application of some of these policies require significant management judgment and the utilization of estimates. Actual results could differ from these judgments and estimates resulting in a significant impact on the financial statements. A critical accounting policy for the Corporation is the policy utilized in determining the adequacy of the allowance for loan losses. Although management uses the best information available, the level of the allowance for loan losses remains an estimate which is subject to significant judgment and short-term change. Various regulatory agencies, as an integral part of their examination process, periodically review the Corporation’s allowance for loan losses. Such agencies may require the Corporation to make additional provisions for loan losses based upon information available to them at the time of their examination. Furthermore, the majority of the Corporation’s loans are secured by real estate in the state of New Jersey. Accordingly, the collectibility of a substantial portion of the carrying value of the Corporation’s loan portfolio is susceptible to changes in the local market conditions and may be adversely affected should real estate values decline or the northern New Jersey area experience an adverse economic shock. Future adjustments to the allowance may be necessary due to economic, operating, regulatory, and other conditions beyond the Corporation’s control. The allowance for loan losses represents 1.11% of total loans, or 2.7 times non-performing loans at December 31, 2006, compared with 1.11% of total loans or 7.3 times non-performing loans at December 31, 2005. In management’s opinion, the allowance for loan losses totaling $4.1 million is adequate to cover losses inherent in the portfolio at December 31, 2006.
Nonperforming Assets
Nonperforming assets include nonaccrual loans, restructured loans, loans past due 90 days or more and accruing, and other real estate owned. There were no other real estate owned assets for the periods presented. The Corporation’s loans are generally placed in a nonaccrual status when they become past due in excess of 90 days as to payment of principal and interest. Interest previously accrued on these loans and not yet paid is charged against income during the current period. Interest earned thereafter is only included in income to the extent that it is received in cash. Loans past due 90 days or more and accruing represent those loans which are sufficiently collateralized and management believes all interest and principal owed will be collected. Restructured loans are loans that have been renegotiated to permit a borrower, who has incurred adverse financial circumstances, to continue to perform. Management can reduce the contractual interest rates to below market rates or make significant concessions to the terms of the loan in order for the borrower to continue to make payments.
The following table sets forth certain information regarding the Corporation’s nonperforming assets as of December 31 of each of the preceding five years:
| | | December 31, | |
| | | 2006 | | 2005 | | 2004 | | 2003 | | 2002 | |
| | | (Dollars in thousands) | |
| | | | | | | | | | | | |
| Nonaccrual loans: (1) | | | | | | | | | | | |
| Commercial real estate | | $ | 123 | | $ | 122 | | $ | 56 | | $ | 83 | | $ | 80 | |
| Commercial | | | 167 | | | 258 | | | 159 | | | 163 | | | 326 | |
| Consumer | | | 154 | | | 92 | | | 47 | | | 11 | | | 89 | |
| Total nonaccrual loans | | | 444 | | | 472 | | | 262 | | | 257 | | | 495 | |
| | | | | | | | | | | | | | | | | |
| Loans past due ninety days or more and accruing: (2) | | | | | | | | | | | | | | | | |
| Construction | | | 840 | | | - | | | 940 | | | - | | | - | |
| Commercial | | | 241 | | | - | | | - | | | 314 | | | - | |
| Consumer | | | 9 | | | 55 | | | 7 | | | 6 | | | 4 | |
| Total loans past due ninety days or more and accruing. | | | 1,090 | | | 55 | | | 947 | | | 320 | | | 4 | |
| | | | | | | | | | | | | | | | | |
| Restructured loans: | | | | | | | | | | | | | | | | |
| Commercial | | | - | | | - | | | - | | | 269 | | | 451 | |
| Consumer | | | - | | | - | | | 215 | | | 244 | | | 397 | |
| Total restructured loans | | | - | | | - | | | 215 | | | 513 | | | 848 | |
| Total nonperforming loans | | $ | 1,534 | | $ | 527 | | $ | 1,424 | | $ | 1,090 | | $ | 1,347 | |
| | | | | | | | | | | | | | | | | |
| Nonaccrual loans to total gross loans | | | 0.12 | % | | 0.14 | % | | 0.09 | % | | 0.10 | % | | 0.23 | % |
| Nonperforming loans to total gross loans | | | 0.41 | % | | 0.15 | % | | 0.48 | % | | 0.42 | % | | 0.62 | % |
| Nonperforming loans to total assets | | | 0.30 | % | | 0.11 | % | | 0.34 | % | | 0.27 | % | | 0.41 | % |
| Allowance for loan losses to nonperforming loans | | | 267.34 | % | | 729.98 | % | | 231.67 | % | | 264.95 | % | | 199.63 | % |
___________________________________________
| (1) | There were no restructured loans classified as nonaccrual for the year ended December 31, 2006. Restructured loans classified in the nonaccrual category totaled $152,000, $162,000, $174,000 and $329,000 for 2005, 2004, 2003 and 2002, respectively. |
| (2) | There were no restructured loans classified in the past due ninety days or more and accruing for the years ended 2006, 2005, 2004 and 2002. In 2003, restructured loans totaling $150,000 were classified in the past due ninety days or more and accruing category. |
The construction loan balance of $840,000 shown as past due ninety days or more and accruing at December 31, 2006 represented one loan which was fully satisfied in February 2007.
There were no loans, other than those included in the above table, where the Corporation was aware of any credit conditions of any borrowers that would indicate a strong possibility of the borrowers not complying with the present terms and conditions of repayment and which may result in such loans being included as nonaccrual, past due or restructured at a future date.
The following table sets forth, for each of the preceding five years, the historical relationships among the amount of loans outstanding, the allowance for loan losses, the provision for loan losses, the amount of loans charged off and the amount of loan recoveries:
| | | 2006 | | 2005 | | 2004 | | 2003 | | 2002 | |
| | | (Dollars in thousands) | |
| | | | | | | | | | | | |
| Balance at beginning of period | | $ | 3,847 | | $ | 3,299 | | $ | 2,888 | | $ | 2,689 | | $ | 2,602 | |
| Loans charged off: | | | | | | | | | | | | | | | | |
| Commercial | | | 7 | | | - | | | 49 | | | 173 | | | 65 | |
| Consumer | | | 33 | | | 57 | | | 92 | | | 56 | | | 25 | |
| Total loans charged off | | | 40 | | | 57 | | | 141 | | | 229 | | | 90 | |
| | | | | | | | | | | | | | | | | |
| Recoveries of loans previously charged off: | | | | | | | | | | | | | | | | |
| Commercial | | | 23 | | | - | | | 3 | | | 1 | | | 9 | |
| Consumer | | | 7 | | | 5 | | | 9 | | | 2 | | | 8 | |
| Total recoveries of loans previously charged off | | | 30 | | | 5 | | | 12 | | | 3 | | | 17 | |
| | | | | | | | | | | | | | | | | |
| Net loans charged off | | | 10 | | | 52 | | | 129 | | | 226 | | | 73 | |
| | | | | | | | | | | | | | | | | |
| Provisions charged to operations | | | 264 | | | 600 | | | 540 | | | 425 | | | 160 | |
| | | | | | | | | | | | | | | | | |
| Balance at end of period | | $ | 4,101 | | $ | 3,847 | | $ | 3,299 | | $ | 2,888 | | $ | 2,689 | |
| | | | | | | | | | | | | | | | | |
| Net charge offs during the period to average loans outstanding during the period | | | 0.00 | % | | 0.02 | % | | 0.05 | % | | 0.10 | % | | 0.04 | % |
| | | | | | | | | | | | | | | | | |
| Balance of allowance for loan losses at the end of year to gross year end loans | | | 1.11 | % | | 1.11 | % | | 1.11 | % | | 1.10 | % | | 1.24 | % |
The following table sets forth the allocation of the allowance for loan losses, for each of the preceding five years, as indicated by loan categories:
| | | 2006 | | 2005 | | 2004 | | 2003 | | 2002 | |
| | | Amount | | Percent to Total (1) | | Amount | | Percent to Total (1) | | Amount | | Percent to Total (1) | | Amount | | Percent to Total (1) | | Amount | | Percent to Total (1) | |
| | | (Dollars in thousands) | |
| | | | | | | | | | | | | | | | | | | | | | |
| Real estate - residential | | $ | 298 | | | 12.7 | % | $ | 320 | | | 13.2 | % | $ | 297 | | | 14.0 | % | $ | 306 | | | 17.1 | % | $ | 289 | | | 18.3 | % |
| Real estate - commercial | | | 1,705 | | | 48.0 | % | | 1,562 | | | 47.1 | % | | 1,272 | | | 44.1 | % | | 1,038 | | | 41.9 | % | | 911 | | | 40.9 | % |
| Commercial | | | 1,407 | | | 19.6 | % | | 1,192 | | | 18.8 | % | | 979 | | | 18.6 | % | | 910 | | | 18.7 | % | | 906 | | | 17.7 | % |
| Consumer | | | 691 | | | 19.7 | % | | 773 | | | 20.9 | % | | 751 | | | 23.3 | % | | 634 | | | 22.3 | % | | 583 | | | 23.1 | % |
| Total allowance for loan losses | | $ | 4,101 | | | 100.0 | % | $ | 3,847 | | | 100.0 | % | $ | 3,299 | | | 100.0 | % | $ | 2,888 | | | 100.0 | % | $ | 2,689 | | | 100.0 | % |
| (1) | Represents percentage of loan balance in category to total gross loans. |
Investment Portfolio
The Corporation maintains an investment portfolio to enhance its yields and to provide a secondary source of liquidity. The portfolio is comprised of U.S. Treasury securities, U.S. government and agency obligations, mortgage-backed securities, and state and political subdivision obligations and has been classified as held to maturity or available for sale. Investments in debt securities that the Corporation has the positive intent and the ability to hold to maturity are classified as held to maturity securities and reported at amortized cost. All other securities are classified as available for sale securities and reported at fair value, with unrecognized holding gains or losses reported in a separate component of stockholders’ equity. Securities in the available for sale category may be held for indefinite periods of time and include securities that management intends to use as part of its Asset/Liability strategy or that may be sold in response to changes in interest rates, changes in prepayment risks, the need to provide liquidity, the need to increase regulatory capital or similar factors. Securities available for sale increased to $72.75 million at December 31, 2006, from $64.17 million at December 31, 2005, an increase of $8.6 million, or 13.4%. Securities held to maturity increased $1.4 million, or 3.6%, to $39.16 million at December 31, 2006 from $37.80 million at December 31, 2005.
During the fourth quarter of 2006, the Corporation completed an investment restructuring consisting of the sale of $17.3 million available for sale securities with yields of less than 5.0%. Proceeds from the sale were used to purchase higher yielding investments and to fund loan growth.
The following table sets forth the classification of the Corporation’s investment securities by major category at the end of the last three years:
| | | December 31, | |
| | | 2006 | | 2005 | | 2004 | |
| | | Carrying Value | | Percent | | Carrying Value | | Percent | | Carrying Value | | Percent | |
| | | (Dollars in thousands) | |
| | | | | | | | | | | | | | |
| Securities available for sale: | | | | | | | | | | | | | |
| | | | | | | | | | | | | | |
| U.S. Treasury | | $ | — | | | 0.0 | % | $ | 496 | | | 0.8 | % | $ | 495 | | | 0.9 | % |
| U.S. government-sponsored agencies | | | 32,117 | | | 44.2 | % | | 32,478 | | | 50.6 | % | | 23,344 | | | 41.3 | % |
| Obligations of state and political subdivisions | | | 1,823 | | | 2.5 | % | | 2,031 | | | 3.2 | % | | 1,915 | | | 3.4 | % |
| Mortgage-backed securities | | | 37,707 | | | 51.8 | % | | 28,110 | | | 43.8 | % | | 29,730 | | | 52.6 | % |
| Community Reinvestment Act Fund | | | 1,099 | | | 1.5 | % | | 1,051 | | | 1.6 | % | | 1,030 | | | 1.8 | % |
| | | | | | | | | | | | | | | | | | | | |
| Total | | $ | 72,746 | | | 100.0 | % | $ | 64,166 | | | 100.0 | % | $ | 56,514 | | | 100.0 | % |
| | | | | | | | | | | | | | | | | | | | |
| Securities held to maturity: | | | | | | | | | | | | | | | | | | | |
| | | | | | | | | | | | | | | | | | | | |
| U.S. Treasury | | $ | 502 | | | 1.3 | % | $ | 1,004 | | | 2.7 | % | $ | 1,007 | | | 2.5 | % |
| U.S. government- sponsored agencies | | | 10,776 | | | 27.5 | % | | 12,113 | | | 32.0 | % | | 8,655 | | | 21.6 | % |
| Obligations of state and political subdivisions | | | 20,516 | | | 52.4 | % | | 15,747 | | | 41.7 | % | | 17,688 | | | 44.1 | % |
| Mortgage-backed securities | | | 7,369 | | | 18.8 | % | | 8,937 | | | 23.6 | % | | 12,761 | | | 31.8 | % |
| Total | | $ | 39,163 | | | 100.0 | % | $ | 37,801 | | | 100.0 | % | $ | 40,111 | | | 100.0 | % |
The following table sets forth the maturity distribution and weighted average yields (calculated on the basis of stated yields to maturity, considering applicable premium or discount) of the Corporation’s securities available for sale as of December 31, 2006. Issuers may have the right to call or prepay obligations with or without call or prepayment penalties. This might cause actual maturities to differ from contractual maturities.
| | | | | After 1 Year | | After 5 Years | | | | | |
| | | Within | | Through | | Through | | After | | | |
| | | 1 Year | | 5 Years | | 10 Years | | 10 Years | | Total | |
| | | (Dollars in thousands) | |
| | | | | | | | | | | | |
| U.S. government sponsored agencies : | | | | | | | | | | | |
| Carrying value | | $ | 4,180 | | $ | 11,375 | | $ | 8,384 | | $ | 8,178 | | $ | 32,117 | |
| Yield | | | 2.70 | % | | 4.83 | % | | 5.78 | % | | 5.89 | % | | 5.07 | % |
| Obligations of state and political subdivisions : | | | | | | | | | | | | | | | | |
| Carrying value | | | — | | | 1,331 | | | 143 | | | 349 | | | 1,823 | |
| Yield | | | — | | | 3.07 | % | | 3.75 | % | | 3.88 | % | | 3.28 | % |
| | | | | | | | | | | | | | | | | |
| Mortgage-backed securities : | | | | | | | | | | | | | | | | |
| Carrying value | | | 4 | | | 2,190 | | | 6,376 | | | 29,137 | | | 37,707 | |
| Yield | | | 8.00 | % | | 3.79 | % | | 4.41 | % | | 5.26 | % | | 5.03 | % |
| | | | | | | | | | | | | | | | | |
| Community Reinvestment Act Fund: | | | | | | | | | | | | | | | | |
| Carrying value | | | 1,099 | | | — | | | — | | | — | | | 1,099 | |
| Yield | | | 3.75 | % | | — | | | — | | | — | | | 3.75 | % |
| Total carrying value | | $ | 5,283 | | $ | 14,896 | | $ | 14,903 | | $ | 37,664 | | $ | 72,746 | |
| Weighted average yield | | | 2.92 | % | | 4.52 | % | | 5.17 | % | | 5.38 | % | | 4.99 | % |
The following table sets forth the maturity distribution and weighted average yields (calculated on the basis of stated yields to maturity, considering applicable premium or discount) of the Corporation’s securities held to maturity as of December 31, 2006. Issuers may have the right to call or prepay obligations with or without call or prepayment penalties. This might cause actual maturities to differ from contractual maturities.
| | | | | After 1 Year | | After 5 Years | | | | | |
| | | Within | | Through | | Through | | After | | | |
| | | 1 Year | | 5 Years | | 10 Years | | 10 Years | | Total | |
| | | (Dollars in thousands) | |
| | | | | | | | | | | | |
| U.S. Treasury : | | | | | | | | | | | |
| Carrying value | | $ | — | | $ | 502 | | $ | — | | $ | — | | $ | 502 | |
| Yield | | | — | | | 4.57 | % | | — | | | — | | | 4.57 | % |
| | | | | | | | | | | | | | | | | |
| U.S. government-sponsored agencies : | | | | | | | | | | | | | | | | |
| Carrying value. | | | 1,455 | | | 5,091 | | | 2,748 | | | 1,482 | | | 10,776 | |
| Yield | | | 2.90 | % | | 4.67 | % | | 5.91 | % | | 5.83 | % | | 4.91 | % |
| | | | | | | | | | | | | | | | | |
| Obligations of state and political subdivisions : | | | | | | | | | | | | | | | | |
| Carrying value | | | 4,596 | | | 4,475 | | | 6,499 | | | 4,946 | | | 20,516 | |
| Yield | | | 3.18 | % | | 2.99 | % | | 3.76 | % | | 3.82 | % | | 3.48 | % |
| | | | | | | | | | | | | | | | | |
| Mortgage-backed securities : | | | | | | | | | | | | | | | | |
| Carrying value | | | 20 | | | 698 | | | 1,725 | | | 4,926 | | | 7,369 | |
| Yield | | | 5.34 | % | | 4.38 | % | | 5.19 | % | | 5.20 | % | | 5.12 | % |
| | | | | | | | | | | | | | | | | |
| Total carrying value | | $ | 6,071 | | $ | 10,766 | | $ | 10,972 | | $ | 11,354 | | $ | 39,163 | |
| | | | | | | | | | | | | | | | | |
| Weighted average yield | | | 3.12 | % | | 3.95 | % | | 4.52 | % | | 4.68 | % | | 4.19 | % |
Deposits
Corporation deposits at December 31, 2006 totaled $434.22 million, an increase of $30.8 million, or 7.6%, over the comparable period of 2005, when deposits totaled $403.47 million. The Corporation relied on its existing market area and current competitive products and services to provide growth during 2006. The economic and interest rate environment made it difficult to attract core deposits. In addition, the Corporation utilized the brokered certificate of deposit market with $19.67 million included in the time deposit balances as of December 31, 2006.
The following table sets forth the classification of the Corporation’s deposits by major category as of December 31 of each of the three preceding years:
| | | December 31, | |
| | | 2006 | | 2005 | | 2004 | |
| | | Amount | | Percent | | Amount | | Percent | | Amount | | Percent | |
| | | (Dollars in thousands) | |
| Noninterest-bearing demand | | $ | 92,105 | | | 21.2 | % | $ | 94,331 | | | 23.4 | % | $ | 90,635 | | | 25.4 | % |
| Interest-bearing demand | | | 120,899 | | | 27.8 | % | | 122,867 | | | 30.5 | % | | 124,161 | | | 34.8 | % |
| Saving deposits | | | 37,324 | | | 8.6 | % | | 45,779 | | | 11.3 | % | | 49,967 | | | 14.0 | % |
| Certificates of deposit | | | 183,895 | | | 42.4 | % | | 140,489 | | | 34.8 | % | | 91,967 | | | 25.8 | % |
| Total | | $ | 434,223 | | | 100.0 | % | $ | 403,466 | | | 100.0 | % | $ | 356,730 | | | 100.0 | % |
As of December 31, 2006, the aggregate amount of outstanding time deposits issued in amounts of $100,000 or more, broken down by time remaining to maturity, was as follows (In thousands):
| Three months or less | | $ | 14,402 | |
| Four months through six months | | | 11,536 | |
| Seven months through twelve months | | | 29,021 | |
| Over twelve months | | | 14,943 | |
| Total | | $ | 69,902 | |
Market Risk
Market risk is the risk of loss from adverse changes in market prices and rates. The Corporation’s market risk arises primarily from interest rate risk inherent in its lending and deposit taking activities. Management actively monitors and manages its interest rate risk exposure.
The Corporation’s profitability is affected by fluctuations in interest rates. A sudden and substantial increase or decrease in interest rates may adversely impact the Corporation’s earnings to the extent that the interest rates borne by assets and liabilities do not change at the same speed, to the same extent, or on the same basis. The Corporation monitors the impact of changes in interest rates on its net interest income using several tools. One measure of the Corporation’s exposure to differential changes in interest rates between assets and liabilities is shown in the Corporation’s Maturity and Repricing Analysis under the Interest Rate Sensitivity caption below.
The Corporation’s primary objective in managing interest rate risk is to minimize the adverse impact of changes in interest rates on the Corporation’s net interest income and capital, while maintaining the asset-liability structure to obtain the maximum yield- cost spread on that structure. The Corporation relies primarily on its asset-liability structure to control interest rate risk.
The Corporation continually evaluates interest rate risk management opportunities, including the use of derivative financial instruments. Management believes that hedging instruments currently available are not cost effective, and therefore, has focused its efforts on increasing the Corporation’s yield-cost spread through retail growth opportunities.
The following table shows the Corporation’s financial instruments that are sensitive to changes in interest rates, categorized by expected maturity, and the instruments’ fair values at December 31, 2006. Market rate sensitive instruments are generally defined as on and off balance sheet derivatives and other financial instruments. Expected maturities are contractual maturities adjusted for projected payments of principal. The actual maturities of these instruments could vary substantially if future prepayments differ from the projections. For non-maturity deposit liabilities, in accordance with standard industry practice, “decay factors” were used to estimate deposit runoff.
| | | Average Interest Rate | | 2007 | | 2008 | | 2009 | | 2010 | | 2011 | | Thereafter | | Balance | | Fair Value | |
| | | (Dollars in thousands) | |
Interest-Sensitive Assets: | | | | | | | | | | | | | | | | | | | |
| Interest-bearing due from banks. | | | 4.92 | % | $ | 836 | | $ | — | | $ | — | | $ | — | | $ | — | | $ | — | | $ | 836 | | $ | 836 | |
| Loans: | | | | | | | | | | | | | | | | | | | | | | | | | | | | |
| Real estate mortgage | | | 6.82 | % | | 49,339 | | | 11,982 | | | 10,115 | | | 8,656 | | | 8,982 | | | 135,357 | | | 224,431 | | | 223,165 | |
| Commercial | | | 8.42 | % | | 39,263 | | | 12,091 | | | 8,297 | | | 4,951 | | | 4,194 | | | 3,810 | | | 72,606 | | | 72,507 | |
| Consumer | | | 6.68 | % | | 7,462 | | | 6,443 | | | 6,311 | | | 6,525 | | | 6,055 | | | 40,163 | | | 72,959 | | | 70,924 | |
| Mortgage loans held for sale | | | 6.12 | % | | 2,155 | | | — | | | — | | | — | | | — | | | — | | | 2,155 | | | 2,155 | |
| Investment securities (1) | | | 4.63 | % | | 41,458 | | | 15,606 | | | 12,368 | | | 7,570 | | | 8,647 | | | 28,159 | | | 113,808 | | | 113,526 | |
| | | | 6.52 | % | | 140,513 | | | 46,122 | | | 37,091 | | | 27,702 | | | 27,878 | | | 207,489 | | | 486,795 | | | 483,113 | |
| | | | | | | | | | | | | | | | | | | | | | | | | | | | | |
Interest-Sensitive Liabilities: | | | | | | | | | | | | | | | | | | | | | | | | | | | | |
| Savings | | | 0.74 | % | | 3,969 | | | 2,739 | | | 2,315 | | | 1,998 | | | 1,747 | | | 24,556 | | | 37,324 | | | 37,324 | |
| Interest-bearing | | | 2.09 | % | | 12,945 | | | 8,639 | | | 7,040 | | | 5,817 | | | 4,887 | | | 81,571 | | | 120,899 | | | 120,899 | |
| Time deposits | | | 4.47 | % | | 142,138 | | | 25,129 | | | 6,490 | | | 9,202 | | | 780 | | | 156 | | | 183,895 | | | 183,987 | |
| Securites sold under agreement to repurchase | | | 5.28 | % | | 9,023 | | | — | | | — | | | — | | | — | | | — | | | 9,023 | | | 9,023 | |
| FHLB borrowings | | | 4.53 | % | | 15,054 | | | 675 | | | 698 | | | 721 | | | 744 | | | 10,000 | | | 27,892 | | | 26,655 | |
| Subordinated debentures | | | 6.75 | % | | — | | | — | | | — | | | — | | | — | | | 7,217 | | | 7,217 | | | 7,436 | |
| | | | 3.43 | % | | 183,129 | | | 37,182 | | | 16,543 | | | 17,738 | | | 8,158 | | | 123,500 | | | 386,250 | | | 385,324 | |
| | | | | | | | | | | | | | | | | | | | | | | | | | | | | |
Net Interest-Sensitive Assets (Liabilities) | | | | | $ | (42,616 | ) | $ | 8,940 | | $ | 20,548 | | $ | 9,964 | | $ | 19,720 | | $ | 83,989 | | $ | 100,545 | | $ | 97,789 | |
| (1) | Includes securities held to maturity, securities available for sale and FHLB-NY stock. |
Interest Rate Sensitivity
Interest rate movements and deregulation of interest rates have made managing the Corporation’s interest rate sensitivity increasingly important. The Corporation attempts to maintain stable net interest margins by generally matching the volume of assets and liabilities maturing, or subject to repricing, by adjusting interest rates to market conditions, and by developing new products. One method of measuring the Corporation’s exposure to changes in interest rates is the maturity and repricing gap analysis. The difference between the volume of assets and liabilities that reprice in a given period is the interest sensitivity gap. A “positive” gap results when more assets than liabilities mature or are repricing in a given time frame. Conversely, a “negative” gap results when there are more liabilities than assets maturing or repricing in a given period of time. The smaller the gap, the less the effect of the market volatility on net interest income. During a period of rising interest rates, an institution with a negative gap position would not be in as favorable a position, as compared to an institution with a positive gap, to invest in higher yielding assets. This may result in yields on its assets increasing at a slower rate than the increase in its costs of interest-bearing liabilities than if it had a positive gap. During a period of falling interest rates, an institution with a negative gap would experience a repricing of its assets at a slower rate than its interest-bearing liabilities, which consequently may result in its net interest income growing at a faster rate than an institution with a positive gap position.
The following tables sets forth estimated maturity/repricing structure of the Corporation’s interest-earning assets and interest- bearing liabilities as of December 31, 2006. The amounts of assets or liabilities shown which reprice or mature during a particular period were determined in accordance with the contractual terms of each asset or liability and adjusted for prepayment assumptions where applicable. The table does not necessarily indicate the impact of general interest rate movements on the Corporation’s net interest income because the repricing of certain categories of assets and liabilities, for example, prepayments of loans and withdrawal of deposits, is beyond the Corporation’s control. As a result, certain assets and liabilities indicated as repricing within a period may in fact reprice at different times and at different rate levels.
| | | Three Months or Less | | More than Three Months Through One Year | | After One Year | | Noninterest Sensitive | | Total | |
| | | (Dollars in thousands) | |
| | | | | | | | | | | | |
Assets: | | | | | | | | | | | |
| Loans: | | | | | | | | | | | |
| Real estate mortgage | | $ | 17,064 | | $ | 39,850 | | $ | 167,517 | | $ | — | | $ | 224,431 | |
| Commercial | | | 11,931 | | | 28,279 | | | 32,396 | | | — | | | 72,606 | |
| Consumer | | | 21,334 | | | 5,097 | | | 46,528 | | | — | | | 72,959 | |
| Mortgage loans held for sale | | | 2,155 | | | — | | | — | | | — | | | 2,155 | |
| Investment securities (1) | | | 21,703 | | | 22,442 | | | 69,663 | | | — | | | 113,808 | |
| Other assets | | | 836 | | | — | | | — | | | 32,954 | | | 33,790 | |
| Total assets | | $ | 75,023 | | $ | 95,668 | | $ | 316,104 | | $ | 32,954 | | $ | 519,749 | |
| | | | | | | | | | | | | | | | | |
Source of funds: | | | | | | | | | | | | | | | | |
| Savings | | $ | — | | $ | 37,324 | | $ | — | | $ | — | | $ | 37,324 | |
| Interest-bearing | | | 120,899 | | | — | | | — | | | | | | 120,899 | |
| Certificates of deposit | | | 32,747 | | | 109,604 | | | 41,544 | | | — | | | 183,895 | |
| Repurchase agreements | | | 8,277 | | | 746 | | | — | | | — | | | 9,023 | |
| Borrowings | | | 14,561 | | | 492 | | | 12,839 | | | — | | | 27,892 | |
| Subordinated debenture | | | — | | | — | | | 7,217 | | | — | | | 7,217 | |
| Other liabilities | | | — | | | — | | | — | | | 96,193 | | | 96,193 | |
| Stockholders’ equity | | | — | | | — | | | — | | | 37,306 | | | 37,306 | |
| Total source of funds | | $ | 176,484 | | $ | 148,166 | | $ | 61,600 | | $ | 133,499 | | $ | 519,749 | |
| Interest rate sensitivity gap | | $ | (101,461 | ) | $ | (52,498 | ) | $ | 254,504 | | $ | (100,545 | ) | | | |
| Cumulative interest rate sensitivity gap | | $ | (101,461 | ) | $ | (153,959 | ) | $ | 100,545 | | $ | — | | | | |
| Ratio of GAP to total assets | | | -19.5 | % | | -10.1 | % | | 49.0 | % | | -19.4 | % | | | |
| Ratio of cumulative GAP assets to total assets | | | - 19.5 | % | | -29.6 | % | | 19.4 | % | | — | | | | |
______________________________________
| (1) | Includes securities held to maturity, securities available for sale and FHLB-NY stock. |
The Corporation also uses a simulation model to analyze the sensitivity of net interest income to movements in interest rates. The simulation model projects net interest income, net income, net interest margin, and capital to asset ratios based on various interest rate scenarios over a twelve month period. The model is based on the actual maturity and repricing characteristics of all rate sensitive assets and liabilities. Management incorporates into the model certain assumptions regarding prepayments of certain assets and liabilities. The model assumes an immediate rate shock to interest rates without management’s ability to proactively change the mix of assets or liabilities. According to the reports generated for year end 2006, an immediate interest rate increase of 200 basis points resulted in a decrease in net interest income of 12.1%, or $2.5 million, while an immediate interest rate decrease of 200 basis points resulted in an increase in net interest income of 2.9% or $614,000. Management has a goal to maintain a percentage change of no more than 15% given a 200 basis point change in interest rates. Management cannot provide any assurance about the actual effect of changes in interest rates on the Corporation’s net interest income. Assumptions have been built into the model for prepayments for assets and decay rates for nonmaturity deposits such as savings and interest bearing demand.
Liquidity
The Corporation’s primary sources of funds are deposits, amortization and prepayments of loans and mortgage-backed securities, maturities of investment securities and funds provided by operations. While scheduled loan and mortgage-backed securities amortization and maturities of investment securities are a relatively predictable source of funds, deposit flow and prepayments on loan and mortgage-backed securities are greatly influenced by market interest rates, economic conditions, and competition.
The Corporation’s liquidity, represented by cash and cash equivalents, is a product of its operating, investing and financing activities. These activities are summarized below:
| | | Years Ended December 31, | |
| | | 2006 | | 2005 | | 2004 | |
| | | (In thousands) | |
| | | | | | | | |
| Cash and cash equivalents - beginning | | $ | 14,028 | | $ | 24,792 | | $ | 19,138 | |
| Operating activities: | | | | | | | | | | |
| Net income | | | 4,753 | | | 4,480 | | | 3,848 | |
| Adjustments to reconcile net income to net cash provided by operating activities | | | (70 | ) | | (921 | ) | | 2,010 | |
| Net cash provided by operating activities | | | 4,683 | | | 3,559 | | | 5,858 | |
| Net cash used in investing activities | | | (34,261 | ) | | (68,436 | ) | | (19,182 | ) |
| Net cash provided by financing activities | | | 31,247 | | | 54,113 | | | 18,978 | |
| Net increase (decrease) in cash and cash equivalents | | | 1,669 | | | (10,764 | ) | | 5,654 | |
| Cash and cash equivalents - ending | | $ | 15,697 | | $ | 14,028 | | $ | 24,792 | |
Cash was generated by operating activities in each of the above periods. The primary source of cash from operating activities during each period was net income.
Liquidity management is both a daily and long-term function of business management. Excess liquidity is generally invested in short-term investments, such as federal funds sold.
The Corporation enters into commitments to extend credit, such as letters of credit, which are not reflected in the consolidated financial statements.
The Corporation has various contractual obligations that may require future cash payments. The following table summarizes the Corporation’s contractual obligations at December 31, 2006 and the effect of such obligations is expected to have on our liquidity and cash flows in future periods
| | | Total | | Less than 1 Year | | 1-3 Years | | 4-5 Years | | After 5 Years | |
| | | (In thousands) | |
| | | | | | | | | | | | |
| Contractual obligations | | | | | | | | | | | |
| Operating lease obligations | | $ | 5,058 | | $ | 545 | | $ | 1,099 | | $ | 997 | | $ | 2,417 | |
| Total contracted cost obligations | | $ | 5,058 | | $ | 545 | | $ | 1,099 | | $ | 997 | | $ | 2,417 | |
| | | | | | | | | | | | | | | | | |
| Other long-term liabilities/long-term debt | | | | | | | | | | | | | | | | |
| Time deposits | | $ | 183,895 | | $ | 142,351 | | $ | 31,587 | | $ | 9,957 | | $ | - | |
| Federal Home Loan Bank advances | | | 27,892 | | | 14,400 | | | 3,492 | | | - | | | 10,000 | |
| Subordinated debentures | | | 7,217 | | | - | | | - | | | - | | | 7,217 | |
| Total other long-term liabilities/long-term debt | | $ | 219,004 | | $ | 156,751 | | $ | 35,079 | | $ | 9,957 | | $ | 17,217 | |
| | | | | | | | | | | | | | | | | |
| Other commitments - off balance sheet | | | | | | | | | | | | | | | | |
| Letter of credit | | $ | 3,126 | | $ | 2,248 | | $ | 861 | | $ | 17 | | $ | - | |
| | | | | | | | | | | | | | | | | |
| Other commitments - off balance sheet | | | 11,459 | | | 11,459 | | | - | | | - | | | - | |
| Unused lines of credit | | | 83,387 | | | 83,387 | | | - | | | - | | | - | |
| Total off balance sheet arrangements and contractual obligations | | $ | 97,972 | | $ | 97,094 | | $ | 861 | | $ | 17 | | $ | - | |
For further information, see Note 16 of Notes to Consolidated Financial Statements.
Management believes that a significant portion of the time deposits will remain with the Corporation. In addition, management does not believe that all of the unused lines of credit will be exercised. The Corporation anticipates that it will have sufficient funds available to meet its current contractual commitments. Should the Corporation need temporary funding, the Corporation has an overnight line of credit with the FHLB-NY for a maximum of $47.1 million.
Capital
Banks and bank holding companies are subject to regulatory capital requirements administered by federal banking agencies. Capital adequacy guidelines and, additionally for banks, prompt corrective action regulations, involve quantitative measures of assets, liabilities, and certain off-balance-sheet items calculated under regulatory accounting practices. Capital amounts and classifications are also subject to qualitative judgments by regulators. Failure to meet capital requirements can initiate regulatory action. Regulations of the Board of Governors of the Federal Reserve System (“FRB”) require bank holding companies to maintain minimum levels of regulatory capital. Under the regulations in effect at December 31, 2006, the Corporation was required to maintain (i) a minimum leverage ratio of Tier 1 capital to total adjusted assets of 4.0% and (ii) minimum ratios of Tier 1 and total capital to risk-weighted assets of 4.0% and 8.0%, respectively. The Bank must comply with substantially similar capital regulations promulgated by the FDIC. The following table summarizes the capital ratios for the Corporation and the Bank at December 31, 2006.
| | | Required | | Actual | | Excess | |
| Risk-based capital: | | | | | | | |
| Tier 1 | | | | | | | |
| Corporation | | | 4.00 | % | | 11.25 | % | | 7.25 | % |
| Bank | | | 4.00 | % | | 10.01 | % | | 6.01 | % |
| Total | | | | | | | | | | |
| Corporation | | | 8.00 | % | | 12.28 | % | | 4.28 | % |
| Bank | | | 8.00 | % | | 11.04 | % | | 3.04 | % |
| Leverage ratio* | | | | | | | | | | |
| Corporation | | | 4.00 | % | | 8.85 | % | | 4.85 | % |
| Bank | | | 4.00 | % | | 7.91 | % | | 3.91 | % |
| * | The minimum leverage ratio set by the FRB and the FDIC is 3.00%. Institutions which are not “top-rated” will be expected to maintain a ratio of approximately 100 to 200 basis points above this ratio. |
REPORT OF INDEPENDENT REGISTERED PUBLIC ACCOUNTING FIRM
Board of Directors and Shareholders
Stewardship Financial Corporation
Midland Park, New Jersey:
We have audited the accompanying consolidated statement of financial condition of Stewardship Financial Corporation as of December 31, 2006 and the related consolidated statement of income, changes in stockholders' equity, and cash flows for the year then ended. These financial statements are the responsibility of the Corporation’s management. Our responsibility is to express an opinion on these financial statements based on our audit.
We conducted our audit in accordance with the standards of the Public Company Accounting Oversight Board (United States). Those standards require that we plan and perform the audit to obtain reasonable assurance about whether the financial statements are free of material misstatement. An audit includes examining, on a test basis, evidence supporting the amounts and disclosures in the financial statements. An audit also includes assessing the accounting principles used and significant estimates made by management, as well as evaluating the overall financial statement presentation. We believe that our audit provides a reasonable basis for our opinion.
In our opinion, the financial statements referred to above present fairly, in all material respects, the financial position of Stewardship Financial Corporation as of December 31, 2006 and the results of its operations and its cash flows for the year then ended in conformity with U.S. generally accepted accounting principles.
/s/ Crowe Chizek and Company LLC
Crowe Chizek and Company LLC
Livingston, New Jersey
March 28, 2007

Report of Independent Registered Public Accounting Firm
The Board of Directors and Stockholders
Stewardship Financial Corporation:
We have audited the accompanying consolidated statement of financial condition of Stewardship Financial Corporation and subsidiary (the Company) as of December 31, 2005, and the related consolidated statements of income, changes in stockholders’ equity, and cash flows for each of the years in the two-year period ended December 31, 2005. These consolidated financial statements are the responsibility of the Company’s management. Our responsibility is to express an opinion on these consolidated financial statements based on our audits.
We conducted our audits in accordance with the standards of the Public Company Accounting Oversight Board (United States). Those standards require that we plan and perform the audit to obtain reasonable assurance about whether the financial statements are free of material misstatement. An audit includes examining, on a test basis, evidence supporting the amounts and disclosures in the financial statements. An audit also includes assessing the accounting principles used and significant estimates made by management, as well as evaluating the overall financial statement presentation. We believe that our audits provide a reasonable basis for our opinion.
In our opinion, the consolidated financial statements referred to above present fairly, in all material respects, the financial position of Stewardship Financial Corporation and subsidiary as of December 31, 2005, and the results of their operations and their cash flows for each of the years in the two-year period ended December 31, 2005, in conformity with U.S. generally accepted accounting principles.
/s/ KPMG LLP
March 29, 2006
Stewardship Financial Corporation and Subsidiary
Consolidated Statements of Financial Condition
| | | December 31, | |
| | | 2006 | | 2005 | |
Assets | | | | | |
| Cash and due from banks | | $ | 14,861,000 | | $ | 13,158,000 | |
| Other interest-earning assets | | | 836,000 | | | 870,000 | |
| Cash and cash equivalents | | | 15,697,000 | | | 14,028,000 | |
| Securities available for sale | | | 72,746,000 | | | 64,166,000 | |
| Securities held to maturity, estimated fair value of $38,881,000 (2006) and $37,459,000 (2005) | | | 39,163,000 | | | 37,801,000 | |
| FHLB-NY stock, at cost | | | 1,899,000 | | | 1,939,000 | |
| Loans, net of allowance for loan losses of $4,101,000 (2006) and $3,847,000 (2005) | | | 365,443,000 | | | 341,976,000 | |
| Mortgage loans held for sale | | | 2,155,000 | | | 2,041,000 | |
| Premises and equipment, net | | | 7,098,000 | | | 6,464,000 | |
| Accrued interest receivable | | | 2,912,000 | | | 2,432,000 | |
| Intangible assets | | | 102,000 | | | 140,000 | |
| Bank owned life insurance | | | 8,522,000 | | | 8,210,000 | |
| Other assets | | | 4,012,000 | | | 3,530,000 | |
| Total assets | | $ | 519,749,000 | | $ | 482,727,000 | |
| | | | | | | | |
Liabilities and Stockholders' equity | | | | | | | |
| | | | | | | | |
Liabilities | | | | | | | |
| Deposits: | | | | | | | |
| Noninterest-bearing | | $ | 92,105,000 | | $ | 94,331,000 | |
| Interest-bearing | | | 342,118,000 | | | 309,135,000 | |
| Total deposits | | | 434,223,000 | | | 403,466,000 | |
| Other borrowings | | | 27,892,000 | | | 30,486,000 | |
| Subordinated debentures | | | 7,217,000 | | | 7,217,000 | |
| Securities sold under agreements to repurchase | | | 9,023,000 | | | 4,731,000 | |
| Accrued interest payable | | | 1,721,000 | | | 1,145,000 | |
| Accrued expenses and other liabilities | | | 2,367,000 | | | 2,298,000 | |
| Total liabilities | | | 482,443,000 | | | 449,343,000 | |
| Commitments and contingencies | | | — | | | — | |
Stockholders' equity | | | | | | | |
| Common stock, no par value, 10,000,000 shares authorized, 5,017,919 and 4,787,889 shares issued and outstanding at December 31, 2006 and 2005, respectively | | | 31,148,000 | | | 28,211,000 | |
| Treasury stock, 39,581 outstanding at December 31, 2005 | | | — | | | (556,000 | ) |
| Retained earnings | | | 6,750,000 | | | 6,647,000 | |
| Accumulated other comprehensive loss, net | | | (592,000 | ) | | (918,000 | ) |
| Total Stockholders' equity | | | 37,306,000 | | | 33,384,000 | |
| Total liabilities and Stockholders' equity | | $ | 519,749,000 | | $ | 482,727,000 | |
See accompanying notes to consolidated financial statements.
Stewardship Financial Corporation and Subsidiary
Consolidated Statements of Income
| | | Years Ended December 31, | |
| | | 2006 | | 2005 | | 2004 | |
Interest income: | | | | | | | |
| Loans | | $ | 25,619,000 | | $ | 20,927,000 | | $ | 17,346,000 | |
| Securities held to maturity: | | | | | | | | | | |
| Taxable | | | 879,000 | | | 849,000 | | | 983,000 | |
| Nontaxable | | | 562,000 | | | 546,000 | | | 622,000 | |
| Securities available for sale: | | | | | | | | | | |
| Taxable | | | 2,746,000 | | | 2,207,000 | | | 2,092,000 | |
| Nontaxable | | | 36,000 | | | 35,000 | | | 35,000 | |
| FHLB dividends | | | 107,000 | | | 74,000 | | | 28,000 | |
| Other interest-earning assets | | | 51,000 | | | 262,000 | | | 46,000 | |
| Total interest income | | | 30,000,000 | | | 24,900,000 | | | 21,152,000 | |
Interest expense: | | | | | | | | | | |
| Deposits | | | 8,880,000 | | | 5,490,000 | | | 3,604,000 | |
| Borrowed money | | | 2,036,000 | | | 1,199,000 | | | 1,181,000 | |
| Total interest expense | | | 10,916,000 | | | 6,689,000 | | | 4,785,000 | |
| Net interest income before provision for loan losses | | | 19,084,000 | | | 18,211,000 | | | 16,367,000 | |
| Provision for loan losses | | | 264,000 | | | 600,000 | | | 540,000 | |
| Net interest income after provision for loan losses | | | 18,820,000 | | | 17,611,000 | | | 15,827,000 | |
Noninterest income: | | | | | | | | | | |
| Fees and service charges | | | 1,660,000 | | | 1,446,000 | | | 1,413,000 | |
| Bank owned life insurance | | | 312,000 | | | 210,000 | | | - | |
| Loss on calls and sales of securities, net | | | (435,000 | ) | | - | | | (3,000 | ) |
| Gain on sales of mortgage loans | | | 235,000 | | | 239,000 | | | 135,000 | |
| Gain on sale of credit card loans | | | 746,000 | | | - | | | - | |
| Merchant processing | | | 1,237,000 | | | 914,000 | | | 779,000 | |
| Miscellaneous | | | 434,000 | | | 431,000 | | | 402,000 | |
| Total noninterest income | | | 4,189,000 | | | 3,240,000 | | | 2,726,000 | |
Noninterest expense: | | | | | | | | | | |
| Salaries and employee benefits | | | 6,792,000 | | | 6,080,000 | | | 5,639,000 | |
| Occupancy, net | | | 1,312,000 | | | 1,010,000 | | | 969,000 | |
| Equipment | | | 893,000 | | | 728,000 | | | 736,000 | |
| Data processing | | | 1,272,000 | | | 1,150,000 | | | 1,016,000 | |
| Advertising | | | 383,000 | | | 422,000 | | | 285,000 | |
| FDIC insurance premium | | | 51,000 | | | 49,000 | | | 49,000 | |
| Amortization of intangible assets | | | 38,000 | | | 39,000 | | | 41,000 | |
| Charitable contributions | | | 755,000 | | | 689,000 | | | 582,000 | |
| Stationery and supplies | | | 338,000 | | | 263,000 | | | 239,000 | |
| Merchant processing | | | 1,122,000 | | | 813,000 | | | 712,000 | |
| Bank-card related services | | | 483,000 | | | 454,000 | | | 409,000 | |
| Miscellaneous | | | 2,190,000 | | | 2,170,000 | | | 1,824,000 | |
| Total noninterest expenses | | | 15,629,000 | | | 13,867,000 | | | 12,501,000 | |
| Income before income tax expense | | | 7,380,000 | | | 6,984,000 | | | 6,052,000 | |
| Income tax expense | | | 2,627,000 | | | 2,504,000 | | | 2,204,000 | |
| Net income | | $ | 4,753,000 | | $ | 4,480,000 | | $ | 3,848,000 | |
| Basic earnings per share | | $ | 0.95 | | $ | 0.90 | | $ | 0.78 | |
| Diluted earnings per share | | $ | 0.94 | | $ | 0.89 | | $ | 0.77 | |
| Cash dividends per share | | $ | 0.30 | | $ | 0.25 | | $ | 0.21 | |
| Weighted average number of common shares outstanding | | | 5,020,939 | | | 4,990,916 | | | 4,911,401 | |
| Weighted average number of diluted common shares outstanding | | | 5,067,743 | | | 5,049,681 | | | 4,982,345 | |
See accompanying notes to consolidated financial statements.
Stewardship Financial Corporation and Subsidiary
Consolidated Statements of Changes in Stockholders’ Equity
| | | Years Ended December 31, 2006, 2005, and 2004 | |
| | | | | | | | | | | | | Accumulated | | | |
| | | | | | | | | | | | | Other | | | |
| | | | | | | | | | | | | Comprehensive | | | |
| | | Common Stock | | Retained | | Treasury Stock | | Income/(Loss), | | | |
| | | Shares | | Amount | | Earnings | | Shares | | Amount | | Net | | Total | |
| Balance — January 1, 2004 | | | 4,298,894 | | $ | 19,552,000 | | $ | 7,593,000 | | | — | | $ | | | $ | 4,000 | | $ | 27,149,000 | |
| Cash dividends paid ($0.21 per share) | | | — | | | — | | | (1,016,000 | ) | | — | | | — | | | — | | | (1,016,000 | ) |
| 5% Stock dividend | | | 155,502 | | | 3,577,000 | | | (3,679,000 | ) | | 4,339 | | | 100,000 | | | — | | | (2,000 | ) |
| Common stock issued under stock plans | | | 14,892 | | | 322,000 | | | — | | | 15,661 | | | 354,000 | | | — | | | 676,000 | |
| Stock options exercised | | | 30,356 | | | 292,000 | | | — | | | — | | | — | | | — | | | 292,000 | |
| Tax benefit on stock options exercised | | | — | | | 150,000 | | | — | | | — | | | — | | | — | | | 150,000 | |
| Repurchase common stock | | | — | | | — | | | — | | | (20,000 | ) | | ( 454,000 | ) | | — | | | (454,000 | ) |
| Comprehensive income: | | | | | | | | | | | | | | | | | | | | | | |
| Net income for the year ended December 31, 2004 | | | — | | | — | | | 3,848,000 | | | — | | | — | | | — | | | 3,848,000 | |
| Unrealized holding losses on securities available sale arising during the period (net tax benefit of $110,000) | | | — | | | — | | | — | | | — | | | — | | | (181,000 | ) | | (181,000 | ) |
| Reclassification adjustment for losses in net income (net tax benefit of $1,000) | | | — | | | — | | | — | | | — | | | — | | | (2,000 | ) | | (2,000 | ) |
| Total comprehensive income | | | | | | | | | | | | | | | | | | | | | 3,665,000 | |
| Balance — December 31, 2004 | | | 4,499,644 | | $ | 23,893,000 | | $ | 6,746,000 | | | — | | $ | | | $ | (179,000 | ) | $ | 30,460,000 | |
| Cash dividends paid ($0.25 per share) | | | — | | | | | | (1,244,000 | ) | | — | | | — | | | — | | | (1,244,000 | ) |
| 5% Stock dividend | | | 227,275 | | | 3,334,000 | | | (3,335,000 | ) | | | | | | | | | | | (1,000 | ) |
| Common stock issued under stock plans | | | 45,280 | | | 771,000 | | | | | | 379 | | | 5,000 | | | — | | | 776,000 | |
| Stock options exercised | | | 15,690 | | | 143,000 | | | — | | | — | | | — | | | — | | | 143,000 | |
| Tax benefit on stock options exercised | | | — | | | 70,000 | | | — | | | — | | | — | | | — | | | 70,000 | |
| Repurchase common stock | | | — | | | — | | | — | | | (39,960 | ) | | (561,000 | ) | | — | | | (561,000 | ) |
| Comprehensive income: | | | | | | | | | | | | | | | | | | | | | | |
| Net income for the year ended December 31, 2005 | | | — | | | — | | | 4,480,000 | | | — | | | — | | | — | | | 4,480,000 | |
| Unrealized holding losses on securities available for sale arising during the period (net tax benefit of $462,000) | | | — | | | — | | | — | | | — | | | — | | | (739,000 | ) | | (739,000 | ) |
| Total comprehensive income | | | | | | | | | | | | | | | | | | | | | 3,741,000 | |
| Balance — December 31, 2005 | | | 4,787,889 | | $ | 28,211,000 | | $ | 6,647,000 | | | (39,581 | ) | $ | (556,000 | ) | $ | (918,000 | ) | $ | 33,384,000 | |
| Cash dividends paid ($0.30 per share) | | | — | | | — | | | (1,529,000 | ) | | — | | | — | | | — | | | (1,529,000 | ) |
| Common stock issued under dividend reinvestment plan | | | — | | | (3,000 | ) | | — | | | 29,773 | | | 415,000 | | | — | | | 412,000 | |
| Payment of discount on dividend reinvestment plan | | | — | | | (19,000 | ) | | — | | | — | | | — | | | — | | | (19,000 | ) |
| 5% Stock dividend | | | 194,294 | | | 2,501,000 | | | (3,121,000 | ) | | 45,684 | | | 619,000 | | | — | | | (1,000 | ) |
| Common stock issued under stock plans | | | — | | | — | | | — | | | 4,865 | | | 69,000 | | | — | | | 69,000 | |
| Stock option compensation expense | | | | | | 51,000 | | | — | | | — | | | — | | | — | | | 51,000 | |
| Stock options exercised | | | 35,736 | | | 233,000 | | | — | | | (9,000 | ) | | (132,000 | ) | | — | | | 101,000 | |
| Tax benefit on stock options exercised | | | — | | | 174,000 | | | — | | | — | | | — | | | — | | | 174,000 | |
| Repurchase common stock | | | — | | | — | | | — | | | (31,741 | ) | | (415,000 | ) | | — | | | (415,000 | ) |
| Comprehensive income: | | | | | | | | | | | | | | | | | | | | | | |
| Net income for the year ended December 31, 2006 | | | — | | | — | | | 4,753,000 | | | — | | | — | | | — | | | 4,753,000 | |
| Unrealized holding gains on securities available for sale arising during the period (net of taxes of $351,000) | | | — | | | — | | | — | | | — | | | — | | | 605,000 | | | 605,000 | |
| Reclassification adjustment for losses in net income (net tax benefit of $156,000) | | | — | | | — | | | — | | | — | | | — | | | (279,000 | ) | | (279,000 | ) |
| Total comprehensive income | | | | | | | | | | | | | | | | | | | | | 5,079,000 | |
| Balance — December 31, 2006 | | | 5,017,919 | | $ | 31,148,000 | | $ | 6,750,000 | | | — | | $ | | | $ | (592,000 | ) | $ | 37,306,000 | |
See accompanying notes to consolidated financial statements.
Stewardship Financial Corporation and Subsidiary
Consolidated Statements of Cash Flows
| | | Years Ended December 31, | |
| | | 2006 | | 2005 | | 2004 | |
Cash flows from operating activities: | | | | | | | |
| Net income | | $ | 4,753,000 | | $ | 4,480,000 | | $ | 3,848,000 | |
| Adjustments to reconcile net income to net cash provided by operating activities: | | | | | | | | | | |
| Depreciation and amortization of premises and equipment | | | 712,000 | | | 577,000 | | | 622,000 | |
| Amortization of premiums and accretion of discounts, net | | | 244,000 | | | 428,000 | | | 593,000 | |
| Accretion of deferred loan fees | | | (130,000 | ) | | (127,000 | ) | | (142,000 | ) |
| Provision for loan losses | | | 264,000 | | | 600,000 | | | 540,000 | |
| Originations of mortgage loans held for sale | | | (23,462,000 | ) | | (27,897,000 | ) | | (12,032,000 | ) |
| Proceeds from sale of mortgage loans | | | 23,583,000 | | | 26,323,000 | | | 12,515,000 | |
| Gain on sale of loans | | | (235,000 | ) | | (239,000 | ) | | (135,000 | ) |
| Loss on sale of securities available for sale | | | 435,000 | | | — | | | 3,000 | |
| Loss on writeoff of fixed asset | | | — | | | — | | | 63,000 | |
| Gain on sale of credit card portfolio | | | (746,000 | ) | | — | | | — | |
| Deferred income tax benefit | | | (115,000 | ) | | (343,000 | ) | | (254,000 | ) |
| Amortization of intangible assets | | | 38,000 | | | 39,000 | | | 41,000 | |
| Increase in accrued interest receivable | | | (480,000 | ) | | (510,000 | ) | | (59,000 | ) |
| Increase (decrease) in accrued interest payable | | | 576,000 | | | 422,000 | | | (46,000 | ) |
| Increase in bank owned life insurance | | | (312,000 | ) | | (210,000 | ) | | — | |
| Nonqualified stock option expense | | | 51,000 | | | — | | | — | |
| (Increase) decrease in other assets | | | (562,000 | ) | | (131,000 | ) | | 360,000 | |
| Increase (decrease) in other liabilities | | | 69,000 | | | 147,000 | | | (59,000 | ) |
| Net cash provided by operating activities | | | 4,683,000 | | | 3,559,000 | | | 5,858,000 | |
Cash flows from investing activities: | | | | | | | | | | |
| Purchase of securities available for sale | | | (37,817,000 | ) | | (17,175,000 | ) | | (13,689,000 | ) |
| Proceeds from maturities and principal repayments on securities available for sale | | | 12,373,000 | | | 7,637,000 | | | 8,699,000 | |
| Proceeds from sales and calls on securities available for sale | | | 16,867,000 | | | 500,000 | | | 9,211,000 | |
| Purchase of securities held to maturity | | | (16,250,000 | ) | | (6,060,000 | ) | | (3,273,000 | ) |
| Proceeds from maturities and principal repayments on securities held to maturity | | | 13,777,000 | | | 8,107,000 | | | 9,968,000 | |
| Proceeds from calls of securities held to maturity | | | 950,000 | | | - | | | 5,235,000 | |
| Redemption (purchase) of FHLB— NY stock | | | 40,000 | | | (296,000 | ) | | (321,000 | ) |
| Net increase in loans | | | (27,051,000 | ) | | (49,540,000 | ) | | (34,531,000 | ) |
| Proceeds from sale of credit card portfolio | | | 4,196,000 | | | — | | | — | |
| Purchase of bank owned life insurance | | | — | | | (8,000,000 | ) | | — | |
| Additions to premises and equipment | | | (1,346,000 | ) | | (3,609,000 | ) | | (481,000 | ) |
| Net cash used in investing activities | | | (34,261,000 | ) | | (68,436,000 | ) | | (19,182,000 | ) |
Cash flows from financing activities: | | | | | | | | | | |
| Net (decrease) increase in noninterest - bearing deposits | | | (2,226,000 | ) | | 3,683,000 | | | 9,396,000 | |
| Net increase in interest - bearing deposits | | | 32,983,000 | | | 43,527,000 | | | 5,984,000 | |
| Net (increase) decrease in securities sold under agreement to repurchase | | | 4,292,000 | | | 1,361,000 | | | (177,000 | ) |
| Net (decrease) increase in short term borrowings | | | (1,000,000 | ) | | 7,900,000 | | | 5,500,000 | |
| Payments on long term borrowings | | | (1,594,000 | ) | | (1,543,000 | ) | | (1,371,000 | ) |
| Cash dividends paid on common stock | | | (1,118,000 | ) | | (535,000 | ) | | (410,000 | ) |
| Payment of discount on dividend reinvestment plan | | | (19,000 | ) | | — | | | — | |
| Purchase of treasury stock | | | (415,000 | ) | | (561,000 | ) | | (454,000 | ) |
| Exercise of stock options | | | 101,000 | | | 143,000 | | | 292,000 | |
| Tax benefit of stock options | | | 174,000 | | | 70,000 | | | 150,000 | |
| Issuance of common stock | | | 69,000 | | | 68,000 | | | 68,000 | |
| Net cash provided by financing activities | | | 31,247,000 | | | 54,113,000 | | | 18,978,000 | |
| Net increase (decrease) in cash and cash equivalents | | | 1,669,000 | | | (10,764,000 | ) | | 5,654,000 | |
| Cash and cash equivalents - beginning | | | 14,028,000 | | | 24,792,000 | | | 19,138,000 | |
| Cash and cash equivalents - ending | | $ | 15,697,000 | | $ | 14,028,000 | | $ | 24,792,000 | |
Supplemental disclosures of cash flow information: | | | | | | | | | | |
| Cash paid during the year for interest | | | 10,341,000 | | | 6,209,000 | | | 4,831,000 | |
| Cash paid during the year for income taxes | | | 2,799,000 | | | 2,620,000 | | | 2,260,000 | |
| Noncash financing activities - issuance of common stock under dividend reinvestment plan | | | 412,000 | | | 710,000 | | | 608,000 | |
See accompanying notes to consolidated financial statements.
Stewardship Financial Corporation and Subsidiary
Notes to Consolidated Financial Statements
Note 1. SIGNIFICANT ACCOUNTING POLICIES
Nature of Operations and Principles of Consolidation
The consolidated financial statements include the accounts of Stewardship Financial Corporation and its wholly owned subsidiary, Atlantic Stewardship Bank, (‘the Bank”), together referred to as “the Corporation”. Atlantic Stewardship Bank includes its wholly owned subsidiaries, Stewardship Investment Corporation and Stewardship Realty LLC. All significant intercompany accounts and transactions have been eliminated in the consolidated financial statements. Certain prior period amounts have been reclassified to conform to the current presentation.
The Corporation provides financial services through its offices in Bergen, Passaic, and Morris Counties, New Jersey. Its primary products are checking, savings, and term certificate accounts, and its primary lending products are commercial, residential mortgage and installment loans. Substantially all loans are secured by specific items of collateral including business assets, consumer assets, and commercial and residential real estate. Commercial loans are expected to be repaid from cash flow generated from the operations of businesses. There are no significant concentrations of loans to any one industry or customer. The Corporation’s lending activities are concentrated in loans secured by real estate located in northern New Jersey and therefore collectibility of the loan portfolio is susceptible to changes in real estate market conditions in the northern New Jersey market. The Corporation has not made loans to borrowers outside the United States.
Basis of consolidated financial statements presentation
The consolidated financial statements of the Corporation have been prepared in conformity with U.S. generally accepted accounting principles. In preparing the financial statements, management is required to make estimates and assumptions that affect the amounts reported in the financial statements and the disclosures provided. Actual results could differ significantly from those estimates. The allowance for loan losses and fair values of financial instruments are particularly subject to change.
Cash and cash equivalents
Cash and cash equivalents include cash and deposits with other financial institutions under 90 days, interest-bearing deposits in other banks under 90 days and federal funds sold. Generally, federal funds are sold for one-day periods. Net cash flows are reported for customer loan and deposit transactions and federal funds purchased and repurchase agreements.
Securities available for sale and held to maturity
The Corporation classifies its securities as securities held to maturity or securities available for sale. Investments in debt securities that the Corporation has the positive intent and ability to hold to maturity are classified as securities held to maturity and are carried at cost, adjusted for amortization of premium and accretion of discount, which are recognized as adjustments to income, on a level yield basis. All other securities are classified as securities available for sale. Securities available for sale may be sold prior to maturity in response to changes in interest rates or prepayment risk, for asset/liability management purposes, or other similar factors. These securities are carried at fair value with unrealized holding gains or losses reported in a separate component of stockholders’ equity, net of the related tax effects. Interest income includes amortization of purchase premium or discount. Realized gains or losses on sales of securities are based upon the specific identification method.
Declines in the fair value of securities below their cost that are other than temporary are reflected as realized losses. In estimating other-than-temporary losses, management considers the length of time and extent that fair value has been less than cost, the financial condition and near term prospects of the issuer, and the Corporation’s ability and intent to hold the security for a period sufficient to allow for any anticipated recovery in fair value.
Federal Home Loan Bank (FHLB) stock
The Bank is a member of the FHLB system. Members are required to own a certain amount of stock based on the level of borrowings and other factors. FHLB stock is carried at cost, classified as a restricted security, and periodically evaluated for impairment based on the ultimate recovery of par value. Cash dividends are reported as income.
Mortgage loans held for sale
Mortgage loans held for sale are reported at the lower of cost or market on an aggregate basis. Mortgage loans held for sale are carried net of deferred fees, which are recognized as income at the time the loans are sold to permanent investors. Gains or losses on the sale of mortgage loans held for sale are recognized at the settlement date and are determined by the difference between the net proceeds and the amortized cost. All loans are sold with servicing rights released to the buyer.
Loans
Loans that management has the intent and ability to hold for the foreseeable future or until maturity or payoff are reported at the principal amount outstanding, net of unearned interest, deferred loan fees and costs and an allowance for loan losses. Interest income is accrued on the unpaid principal balance. Loan origination fees, net of certain direct origination costs are deferred and recognized in interest income using the level-yield method without anticipating prepayments.
Loans are considered nonperforming when contractual principal and interest has not been paid for more than 90 days. The accrual of interest income is discontinued on a loan when certain factors indicate reasonable doubt as to the collectibility of principal and interest. At the time a loan is placed on nonaccrual status, previously accrued and uncollected interest is reversed against interest income in the current period. Interest received on such loans is accounted for on the cash-basis or cost-recovery method until qualifying for return to accrual. Loans are returned to an accrual status when all the principal and interest amounts contractually due are brought current and future payments are reasonably assured.
Allowance for loan losses
The allowance for loan losses is a valuation allowance for probable incurred credit losses. Loan losses are charged against the allowance when management believes the uncollectibility of a loan balance is confirmed. Subsequent recoveries, if any, are credited to the allowance. Management estimates the allowance balance required using past loan loss experience, the nature and volume of the portfolio, information about specific borrower situations and estimated collateral values, economic factors and other factors. Allocations of the allowance may be made for specific loans, but the entire allowance is available for any loan that, in management’s judgment, should be charged off.
The allowance consists of specific and general components. The specific component relates to loans that are individually classified as impaired or loans otherwise classified as substandard or doubtful. The general component covers non-classified loans and is based on historical loss experience adjusted for current factors.
A loan is considered impaired when, based on current information and events, it is probable that the Corporation will be unable to collect the scheduled payments of principal or interest when due according to the contractual terms of the loan agreement. Factors considered by management in determining impairment include payment status, collateral value, and the probability of collecting scheduled principal and interest payments when due. Loans that experience insignificant payment delays and payment shortfalls generally are not classified as impaired. Management determines the significance of payment delays and payment shortfalls on a case-by-case basis, taking into consideration all of the circumstances surrounding the loan and the borrower, including the length of the delay, the reasons for the delay, the borrower’s prior payment record, and the amount of the shortfall in relation to the principal and interest owed. Impairment is measured on a loan by loan basis by either the present value of expected future cash flows discounted at the loan’s effective interest rate, the loans obtainable market price, or the fair value of the collateral if the loan is collateral dependent. Large groups of smaller balance homogeneous loans, such as consumer and residential real estate loans are collectively evaluated for impairment and accordingly, they are not separately identified for impairment disclosures.
Premises and equipment
Land is stated at cost. Buildings and improvements and furniture, fixtures and equipment are stated at cost, less accumulated depreciation computed on the straight-line method over the estimated lives of each type of asset. Estimated useful lives are three to forty years for buildings and improvements and three to twenty-five years for furniture, fixtures and equipment. Leasehold improvements are stated at cost less accumulated amortization computed on the straight-line method over the shorter of the term of the lease or useful life. Significant renewals and improvements are capitalized. Maintenance and repairs are charged to operations as incurred.
Other real estate owned
Other real estate owned (OREO) consists of foreclosed property and is carried at the lower of cost or fair value less estimated selling costs. When a property is acquired, the excess of the carrying amount over fair value, if any, is charged to the allowance for loan losses. Subsequent adjustments to the carrying value are recorded in an allowance for OREO and charged to OREO expense. As of December 31, 2006 and 2005, the Corporation had no OREO.
Intangible assets
Gross intangible assets totaled $750,000 with accumulated amortization of $648,000 and $610,000 at December 31, 2006 and 2005, respectively. Intangible assets are comprised of other intangible assets and core deposit intangibles. Other intangible assets represent the excess of the fair value of liabilities assumed over the fair value of tangible assets acquired through a branch acquisition, completed in 1995, which did not qualify as a business combination. Other intangible assets amounted to $102,000 and $134,000 at December 31, 2006 and December 31, 2005, respectively, and are amortized on a straight-line method over a period of fifteen years.
The core deposit intangible represents the intangible value of depositor relationships resulting from deposit liabilities assumed in the same acquisition. The core deposit intangible amounted to $6,000 at December 31, 2005, and is amortized on an accelerated basis over a period of twelve years. The intangible was fully amortized at December 31, 2006.
Bank owned life insurance
The Corporation has purchased life insurance policies on certain key officers. Bank owned life insurance is recorded at its cash surrender value which is the amount that can be realized.
Treasury Stock
Repurchases of common stock are recorded as treasury stock at cost. Treasury stock is reissued using the first in first out method. Treasury stock may be reissued for exercise of stock options, dividend reinvestment plans, stock dividends or other stock issuances. The difference between the cost and the market value at the time the treasury stock is reissued is shown as an adjustment to common stock.
Dividend Reinvestment Plan
The Corporation offers shareholders the opportunity to participate in a dividend reinvestment plan. Plan participants may reinvest cash dividends to purchase new shares of stock at 95% of the market value, based on the most recent trades. Previously, the Corporation purchased treasury stock or issued authorized but unissued shares to fund the dividend reinvestment plan and issued stock to the plan participants in place of cash dividends. Effective May 16, 2006, the Corporation changed the policy to purchase shares for the dividend reinvestment participants on the open market through an approved broker. The Corporation uses the cash dividends due the plan participants to purchase shares from the broker. The Corporation reimburses the broker for the 5% discount when the purchase of the Corporation’s stock is completed.
Stock-based compensation
Effective January 1, 2006, the Corporation adopted Statement of Financial Accounting Standards No. 123(R), “Share Based Payment” (SFAS No. 123(R)), using the modified prospective transition method. Accordingly, the Corporation has recorded stock-based compensation cost using the fair value method starting in 2006. For 2006, adopting this standard resulted in a reduction of income before taxes of $51,000 and a reduction in net income of $31,000. Due to the relatively small amount of compensation expense, basic and diluted earnings per share, cash flow from operations and cash flow from financing activities were not significantly impacted.
Prior to January 1, 2006, stock compensation expense under stock options was reported using the intrinsic value method; therefore, no stock-based compensation cost is reflected in net income for the years ending December 31, 2005 and 2004, as all options granted had an exercise price equal to or greater than the market price of the underlying common stock at date of grant.
The following table illustrates the effect on net income and earnings per share if expense was measured using the fair value recognition provisions of FASB Statement No. 123, “Accounting for Stock-Based Compensation”, for the years ending December 31.
| | | 2005 | | 2004 | |
| | | | | | |
Net Income: | | | | | |
| Net income as reported | | $ | 4,480,000 | | $ | 3,848,000 | |
| Stock-based compensation included in net income, net of related tax effects | | | 19,000 | | | 22,000 | |
| Total stock-based compensation expense determined under fair value based method for all awards, net of related tax effects | | | (100,000 | ) | | (88,000 | ) |
| Pro forma net income | | $ | 4,399,000 | | $ | 3,782,000 | |
Earnings per share:
| | | 2005 | | 2004 | |
Net Income: | | | | | |
| | | | | | |
| As reported basic earnings per share | | $ | 0.90 | | $ | 0.78 | |
| As reported diluted earnings per share | | | 0.89 | | | 0.77 | |
| Pro forma basic earnings per share | | | 0.89 | | | 0.77 | |
| Pro forma diluted earnings per share. | | | 0.87 | | | 0.76 | |
Income taxes
Income tax expense is the total of the current year income tax due or refundable and the change in deferred tax assets and liabilities. Deferred tax assets and liabilities are the expected future tax amounts for the temporary differences between carrying amounts and tax bases of assets and liabilities, computed using enacted tax rates. A valuation allowance, if needed, reduces deferred tax assets to the amount expected to be realized.
Other comprehensive income
Comprehensive income consists of net income and other comprehensive income. Other comprehensive income includes unrealized gains and losses on securities available for sale which are also recognized as separate components of equity.
Earnings per share
Basic earnings per share is calculated by dividing net income by the average daily number of common shares outstanding during the period. Common stock equivalents are not included in the calculation.
Diluted earnings per share is computed similar to that of the basic earnings per share except that the denominator is increased to include the number of additional common shares that would have been outstanding if all potential dilutive common shares were issued.
All share and per share amounts have been restated to reflect a 5% stock dividend paid November, 2004, 2005 and 2006 and a 4 for 3 stock split issued in July 2005.
Loss contingencies
Loss contingencies, including claims and legal actions arising in the ordinary course of business, are recorded as liabilities when the likelihood of loss is probable and an amount or range of loss can be reasonably estimated. Management does not believe there are such matters that will have a material effect on the financial statements.
Dividend restriction
Banking regulations require maintaining certain capital levels and may limit the dividends paid by the bank to the holding company or by the holding company to shareholders.
Fair value of financial instruments
Fair values of financial instruments are estimated using relevant market information and other assumptions, as more fully disclosed in a separate note. Fair value estimates involve uncertainties and matters of significant judgment regarding interest rates, credit risk, prepayments, and other factors, especially in the absence of broad markets for particular items. Changes in assumptions or in market conditions could significantly affect the estimates.
Note 2. RESTRICTIONS ON CASH AND DUE FROM BANKS
Cash reserves are required to be maintained on deposit with the Federal Reserve Bank based on deposits. In March 2005, the Corporation deployed a deposit reclassification software system that allowed the Corporation to minimize the balances needed to be held at the Federal Reserve Bank to maintain required reserve balances. The average amount of the reserves on deposit for the years ended December 31, 2006 and 2005 was approximately $300,000 and $2.2 million, respectively.
Note 3. SECURITIES AVAILABLE FOR SALE
The fair value of available for sale securities and the related gross unrealized gains and losses recognized in accumulated other comprehensive income were as follows:
| | | December 31, 2006 | |
| | | Fair | | Gross Unrealized | |
| | | Value | | Gains | | Losses | |
| U.S. government-sponsored agencies: | | | | | | | |
| Within one year | | $ | 4,180,000 | | $ | | | $ | 20,000 | |
| After one year through five years | | | 11,375,000 | | | 1,000 | | | 138,000 | |
| After five years through ten years | | | 8,384,000 | | | 27,000 | | | 35,000 | |
| After ten years | | | 8,178,000 | | | — | | | 154,000 | |
| | | | 32,117,000 | | | 28,000 | | | 347,000 | |
| Obligations of state and political subdivisions: | | | | | | | | | | |
| After one year through five years | | | 1,331,000 | | | — | | | 25,000 | |
| After five years through ten years | | | 143,000 | | | — | | | — | |
| After ten years | | | 349,000 | | | — | | | 5,000 | |
| | | | 1,823,000 | | | — | | | 30,000 | |
| Mortgage - backed securities: | | | | | | | | | | |
| Within one year | | | 4,000 | | | — | | | — | |
| After one year through five years | | | 2,190,000 | | | — | | | 75,000 | |
| After five years through ten years | | | 6,376,000 | | | 5,000 | | | 154,000 | |
| After ten years | | | 29,137,000 | | | 35,000 | | | 412,000 | |
| | | | 37,707,000 | | | 40,000 | | | 641,000 | |
| Community Reinvestment Act Fund: | | | | | | | | | | |
| Within one year | | | 1,099,000 | | | — | | | 21,000 | |
| | | $ | 72,746,000 | | $ | 68,000 | | $ | 1,039,000 | |
| | | December 31, 2005 | |
| | | Fair | | Gross Unrealized | |
| | | Value | | Gains | | Losses | |
| U.S. Treasury: | | | | | | | |
| Within one year | | $ | 496,000 | | $ | | | $ | 5,000 | |
| U.S. government - sponsored agencies: | | | | | | | | | | |
| Within one year | | | 5,043,000 | | | — | | | 75,000 | |
| After one year through five years | | | 26,456,000 | | | — | | | 567,000 | |
| After five years through ten years | | | 979,000 | | | — | | | 20,000 | |
| | | | 32,478,000 | | | — | | | 662,000 | |
| Obligations of state and political subdivisions: | | | | | | | | | | |
| Within one year | | | 694,000 | | | — | | | 2,000 | |
| After one year through five years | | | 1,032,000 | | | — | | | 30,000 | |
| After five years through ten years | | | 305,000 | | | — | | | 5,000 | |
| | | | 2,031,000 | | | — | | | 37,000 | |
| Mortgage - backed securities: | | | | | | | | | | |
| After one year through five years | | | 1,933,000 | | | — | | | 77,000 | |
| After five years through ten years | | | 7,138,000 | | | 4,000 | | | 233,000 | |
| After ten years | | | 19,039,000 | | | 4,000 | | | 467,000 | |
| | | | 28,110,000 | | | 8,000 | | | 777,000 | |
| Community Reinvestment Act Fund: | | | | | | | | | | |
| Within one year | | | 1,051,000 | | | — | | | 20,000 | |
| | | $ | 64,166,000 | | $ | 8,000 | | $ | 1,501,000 | |
Issuers may have the right to call or prepay obligations with or without call or prepayment penalties. This might cause actual maturities to differ from the contractual maturities summarized above.
Mortgage—backed securities are comprised primarily of government agencies such as the Government National Mortgage Association ("GNMA") and government sponsored agencies such as the Federal National Mortgage Association ("FNMA"), the Federal Home Loan Banks ("FHLB") and the Federal Home Loan Mortgage Corporation ("FHLMC"). At year end 2006 and 2005, there were no holdings of securities of any one issuer other than the U.S. government and its agencies in an amount greater than 10% of stockholders' equity.
The following tables summarize the fair value and unrealized losses of those investment securities which reported an unrealized loss at December 31, 2006 and 2005, and if the unrealized loss position was continuous for the twelve months prior to December 31, 2006 and 2005.
| | | Less than 12 Months | | 12 Months or Longer | | Total | |
| | | | | Unrealized | | | | Unrealized | | | | Unrealized | |
2006 | | Fair Value | | Losses | | Fair Value | | Losses | | Fair Value | | Losses | |
| | | | | | | | | | | | | | |
| U.S. government sponsored agencies | | $ | 16,551,000 | | $ | (181,000 | ) | $ | 11,980,000 | | $ | (166,000 | ) | $ | 28,531,000 | | $ | (347,000 | ) |
| Obligations of state and political subdivisions | | | 492,000 | | | (5,000 | ) | | 1,071,000 | | | (25,000 | ) | | 1,563,000 | | | (30,000 | ) |
| Mortgage-backed securities | | | 7,433,000 | | | (59,000 | ) | | 20,546,000 | | | (582,000 | ) | | 27,979,000 | | | (641,000 | ) |
| Community Reinvestment Act Fund | | | — | | | — | | | 1,099,000 | | | (21,000 | ) | | 1,099,000 | | | (21,000 | ) |
| Total temporarily impaired securities | | $ | 24,476,000 | | $ | (245,000 | ) | $ | 34,696,000 | | $ | (794,000 | ) | $ | 59,172,000 | | $ | (1,039,000 | ) |
| | | Less than 12 Months | | 12 Months or Longer | | Tota1 | |
| | | | | Unrealized | | | | Unrealized | | | | Unrealized | |
2005 | | Fair Value | | Losses | | Fair Value | | Losses | | Fair Value | | Losses | |
| U.S. Treasury | | $ | | | $ | | | $ | 496,000 | | $ | (5,000 | ) | $ | 496,000 | | $ | (5,000 | ) |
| U.S. government sponsored agencies | | | 16,095,000 | | | (267,000 | ) | | 16,383,000 | | | (395,000 | ) | | 32,478,000 | | | (662,000 | ) |
| Obligations of state and political subdivisions | | | 304,000 | | | (5,000 | ) | | 1,727,000 | | | (32,000 | ) | | 2,031,000 | | | (37,000 | ) |
| Mortgage-backed securities | | | 19,432,000 | | | (428,000 | ) | | 8,280,000 | | | (349,000 | ) | | 27,712,000 | | | (777,000 | ) |
| Community Reinvestment Act Fund | | | 1,051,000 | | | (20,000 | ) | | — | | | — | | | 1,051,000 | | | (20,000 | ) |
| Total temporarily impaired securities | | $ | 36,882,000 | | $ | (720,000 | ) | $ | 26,886,000 | | $ | (781,000 | ) | $ | 63,768,000 | | $ | (1,501,000 | ) |
The unrealized losses are primarily due to the changes in interest rates. These securities have not been considered other than temporarily impaired as scheduled principal and interest payments have been made and management anticipates collecting the entire principal balance as scheduled. Management believes the price variation is temporary in nature and has the ability and intent to hold these securities to maturity or for a sufficient amount of time to recover the recorded principal.
Cash proceeds realized from sales and calls of securities available for sale for the years ended December 31, 2006, 2005 and 2004 were $16,867,000, $500,000 and $9,211,000, respectively. There were no gross gains and no losses realized on sales or calls during the year ended December 31, 2005. Gross gains totaling $4,000 and gross losses totaling $9,000 were realized on sales and calls of securities during the year ended December 31, 2004.
See Note 9 to financial statements regarding securities pledged as collateral for securities sold under agreements to repurchase.
Note 4. SECURITIES HELD TO MATURITY
The following is a summary of the contractual maturities and related unrecognized gains and losses of securities held to maturity:
| | | December 31, 2006 | |
| | | Carrying | | Gross Unrecognized | | | |
| | | Amount | | Gains | | Losses | | Fair Value | |
| U.S. Treasury: | | | | | | | | | |
| After one year through five years | | $ | 502,000 | | $ | | | $ | 2,000 | | $ | 500,000 | |
| | | | 502,000 | | | — | | | 2,000 | | | 500,000 | |
| U.S. government sponsored agencies: | | | | | | | | | | | | | |
| Within one year | | | 1,455,000 | | | — | | | 22,000 | | | 1,433,000 | |
| After one year through five years | | | 5,091,000 | | | 3,000 | | | 56,000 | | | 5,038,000 | |
| After five years through ten years | | | 2,748,000 | | | 5,000 | | | 5,000 | | | 2,748,000 | |
| After ten years | | | 1,482,000 | | | — | | | 26,000 | | | 1,456,000 | |
| | | | 10,776,000 | | | 8,000 | | | 109,000 | | | 10,675,000 | |
| Obligations of state and political subdivisions: | | | | | | | | | | | | | |
| Within one year | | | 4,596,000 | | | 2,000 | | | 14,000 | | | 4,584,000 | |
| After one year through five years | | | 4,475,000 | | | 1,000 | | | 73,000 | | | 4,403,000 | |
| After five years through ten years | | | 6,499,000 | | | 32,000 | | | 25,000 | | | 6,506,000 | |
| After ten years | | | 4,946,000 | | | 18,000 | | | 42,000 | | | 4,922,000 | |
| | | | 20,516,000 | | | 53,000 | | | 154,000 | | | 20,415,000 | |
| Mortgage-backed securities: | | | | | | | | | | | | | |
| Within one year | | | 20,000 | | | — | | | — | | | 20,000 | |
| After one but within five years | | | 698,000 | | | — | | | 13,000 | | | 685,000 | |
| After five years through ten years | | | 1,725,000 | | | 10,000 | | | 17,000 | | | 1,718,000 | |
| After ten years | | | 4,926,000 | | | 22,000 | | | 80,000 | | | 4,868,000 | |
| | | | 7,369,000 | | | 32,000 | | | 110,000 | | | 7,291,000 | |
| | | $ | 39,163,000 | | $ | 93,000 | | $ | 375,000 | | $ | 38,881,000 | |
| | | December 31, 2005 | |
| | | Carrying | | Gross Unrecognized | | | |
| | | Amount | | Gains | | Losses | | Fair Value | |
| U.S. Treasury: | | | | | | | | | |
| Within one year | | $ | 502,000 | | $ | | | $ | 1,000 | | $ | 501,000 | |
| After one year through five years | | | 502,000 | | | 2,000 | | | — | | | 504,000 | |
| | | | 1,004,000 | | | 2,000 | | | 1,000 | | | 1,005,000 | |
| U.S. government sponsored agencies: | | | | | | | | | | | | | |
| Within one year | | | 5,211,000 | | | 1,000 | | | 70,000 | | | 5,142,000 | |
| After one year through five years | | | 5,902,000 | | | — | | | 98,000 | | | 5,804,000 | |
| After five years through ten years | | | 1,000,000 | | | — | | | 12,000 | | | 988,000 | |
| | | | 12,113,000 | | | 1,000 | | | 180,000 | | | 11,934,000 | |
| Obligations of state and political subdivisions: | | | | | | | | | | | | | |
| Within one year | | | 6,078,000 | | | 7,000 | | | 12,000 | | | 6,073,000 | |
| After one year through five years | | | 8,439,000 | | | 20,000 | | | 90,000 | | | 8,369,000 | |
| After five years through ten years | | | 903,000 | | | — | | | 18,000 | | | 885,000 | |
| After ten years | | | 327,000 | | | — | | | 8,000 | | | 319,000 | |
| | | | 15,747,000 | | | 27,000 | | | 128,000 | | | 15,646,000 | |
| Mortgage-backed securities: | | | | | | | | | | | | | |
| After one year through five years | | | 917,000 | | | — | | | 22,000 | | | 895,000 | |
| After five years through ten years | | | 1,720,000 | | | 17,000 | | | 23,000 | | | 1,714,000 | |
| After ten years | | | 6,300,000 | | | 43,000 | | | 78,000 | | | 6,265,000 | |
| | | | 8,937,000 | | | 60,000 | | | 123,000 | | | 8,874,000 | |
| | | $ | 37,801,000 | | $ | 90,000 | | $ | 432,000 | | $ | 37,459,000 | |
Issuers may have the right to call or prepay obligations with or without call or prepayment penalties. This might cause actual maturities to differ from the contractual maturities summarized above.
Mortgage-backed securities are comprised primarily of government agencies such as GNMA and government sponsored agencies such as FNMA, FHLB and FHLMC. At year end 2006 and 2005, there were no holdings of securities of any one issuer other than the U.S. government and its agencies in an amount greater than 10% of stockholders' equity.
The following tables summarize the fair value and unrealized losses of those investment securities which reported an unrealized loss at December 31, 2006 and 2005, and if the unrealized loss position was continuous for the twelve months prior to December 31, 2006 and 2005.
| | | Less than 12 Months | | 12 Months or Longer | | Total | |
| | | | | Unrealized | | | | Unrealized | | | | Unrealized | |
2006 | | Fair Value | | Losses | | Fair Value | | Losses | | Fair Value | | Losses | |
| U.S. Treasury | | $ | 500,000 | | $ | (2,000 | ) | $ | | | $ | | | $ | 500,000 | | $ | (2,000 | ) |
| U.S. government sponsored agencies | | | 2,950,000 | | | (31,000 | ) | | 6,069,000 | | | (78,000 | ) | | 9,019,000 | | | (109,000 | ) |
| Obligations of state and political subdivisions | | | 6,238,000 | | | (62,000 | ) | | 6,083,000 | | | (92,000 | ) | | 12,321,000 | | | (154,000 | ) |
| Mortgage-backed securities | | | 973,000 | | | (9,000 | ) | | 3,956,000 | | | (101,000 | ) | | 4,929,000 | | | (110,000 | ) |
| Total temporarily impaired securities | | $ | 10,661,000 | | $ | (104,000 | ) | $ | 16,108,000 | | $ | (271,000 | ) | $ | 26,769,000 | | $ | (375,000 | ) |
| | | Less than 12 Months | | 12 Months or Longer | | Total | |
| | | | | Unrealized | | | | Unrealized | | | | Unrealized | |
2005 | | Fair Value | | Losses | | Fair Value | | Losses | | Fair Value | | Losses | |
| U.S. Treasury | | $ | 501,000 | | $ | (1,000 | ) | $ | — | | $ | — | | $ | 501,000 | | $ | (1,000 | ) |
| U.S. government sponsored agencies | | | 5,380,000 | | | (62,000 | ) | | 6,051,000 | | | (118,000 | ) | | 11,431,000 | | | (180,000 | ) |
| Obligations of state and political subdivisions | | | 7,379,000 | | | (88,000 | ) | | 2,280,000 | | | (40,000 | ) | | 9,659,000 | | | (128,000 | ) |
| Mortgage-backed securities | | | 2,902,000 | | | (47,000 | ) | | 2,515,000 | | | (76,000 | ) | | 5,417,000 | | | (123,000 | ) |
| Total temporarily impaired securities | | $ | 16,162,000 | | $ | (198,000 | ) | $ | 10,846,000 | | $ | (234,000 | ) | $ | 27,008,000 | | $ | (432,000 | ) |
The unrealized losses are primarily due to the changes in interest rates. These securities have not been considered other than temporarily impaired as scheduled principal and interest payments have been made and management anticipates collecting the entire principal balance as scheduled. Management believes the price variation is temporary in nature and has the ability and intent to hold these securities to maturity.
Cash proceeds realized from calls of securities held to maturity for the year ended December 31, 2006 were $950,000. There were no cash proceeds realized on calls for the year ended December 31, 2005. Cash proceeds realized from calls of securities held to maturity for the year ended December 31, 2004 were $5,235,000.
There were no gains or losses realized on calls for the years ended December 31, 2006 and 2005. Gross gains totaling $2,000 and no losses were realized from calls for the year ended December 31, 2004. The carrying value of securities pledged to secure treasury tax and loan deposits and public deposits for the three years ended December 31, 2006, 2005 and 2004 were $1,002,000, $1,002,000 and $1,003,000, respectively. See also Note 9 to financial statements regarding securities pledged as collateral for securities sold under agreements to repurchase.
Note 5. LOANS
The loan portfolio consisted of the following:
| | | December 31, | |
| | | 2006 | | 2005 | |
| Mortgage: | | | | | |
| Residential | | $ | 47,020,000 | | $ | 45,604,000 | |
| Commercial | | | 177,411,000 | | | 163,309,000 | |
| Commercial | | | 72,606,000 | | | 65,011,000 | |
| Equity | | | 20,010,000 | | | 20,271,000 | |
| Installment | | | 52,389,000 | | | 51,540,000 | |
| Other | | | 560,000 | | | 506,000 | |
| Total gross loans | | | 369,996,000 | | | 346,241,000 | |
| Less: Deferred loan fees, net of costs | | | 452,000 | | | 418,000 | |
| Allowance for loan losses | | | 4,101,000 | | | 3,847,000 | |
| | | | 4,553,000 | | | 4,265,000 | |
| Loans, net | | $ | 365,443,000 | | $ | 341,976,000 | |
At December 31, 2006, 2005 and 2004, loans participated by the Corporation to other organizations totaled approximately $13,704,000, $6,017,000 and $5,730,000, respectively.
Included in the installment loan category for December 31, 2005 was the Corporation’s credit card portfolio. During the fourth quarter of 2006, the Corporation sold its $3.4 million portfolio to Elan Financial Services (“Elan”). Elan will continue to offer credit card service under the name of Atlantic Stewardship Bank. As part of the sale agreement, the Corporation will continue to service the portfolio until March 16, 2007. At December 31, 2006, the credit cards serviced for Elan totaled $3.8 million.
Activity in the allowance for loan losses is summarized as follows::
| | | December 31. | |
| | | 2006 | | 2005 | | 2004 | |
| Balance, beginning | | $ | 3,847,000 | | $ | 3,299,000 | | $ | 2,888,000 | |
| Provision charged to operations | | | 264,000 | | | 600,000 | | | 540,000 | |
| Recoveries of loans charged off | | | 30,000 | | | 5,000 | | | 12,000 | |
| Loans charged off | | | (40,000 | ) | | (57,000 | ) | | (141,000 | ) |
| Balance, ending | | $ | 4,101,000 | | $ | 3,847,000 | | $ | 3,299,000 | |
The Corporation has entered into lending transactions in the ordinary course of business with directors, executive officers and principal stockholders of the Corporation and their affiliates. At December 31, 2006 and 2005, these loans aggregated approximately $1,617,000 and $1,684,000, respectively. During the year ended December 31, 2006, new loans totaling $258,000 were granted and repayments totaled approximately $325,000. The loans, at December 31, 2006, were current as to principal and interest payments.
Note 6. NONPERFORMING LOANS
Nonperforming loans include the following:
| | | December 31, | |
| | | 2006 | | 2005 | |
| Nonaccrual loans | | $ | 444,000 | | $ | 472,000 | |
| Loans past due ninety days or more and accruing | | | 1,090,000 | | | 55,000 | |
| Total nonperforming loans | | $ | 1,534,000 | | $ | 527,000 | |
There were no restructured loans classified as nonaccrual for the year ended December 31, 2006. Restructured loans classified as nonaccrual for the year ended December 31, 2005 were $152,000.
The following information is presented for loans classified as nonaccrual and restructured:
| | | Year ended December 31, | |
| | | 2006 | | 2005 | | 2004 | |
| Income that would have been recorded under contractual terms | | $ | 37,000 | | $ | 44,000 | | $ | 47,000 | |
| Less interest income received | | | 14,000 | | | 6,000 | | | 20,000 | |
| Lost income on nonperforming loans during the year | | $ | 23,000 | | $ | 38,000 | | $ | 27,000 | |
Impaired loans consisted of the following:
| | | December 31, | |
| | | 2006 | | 2005 | | 2004 | |
| Impaired Loans | | | | | | | |
| With related allowance for loan loss | | $ | 223,000 | | $ | 152,000 | | $ | 477,000 | |
| Without related allowance for loan loss | | $ | 221,000 | | $ | 320,000 | | | 947,000 | |
| Total impaired loans | | $ | 444,000 | | $ | 472,000 | | $ | 1,424,000 | |
| Related allowance for possible credit losses | | $ | 110,000 | | $ | 29,000 | | $ | 44,000 | |
| Average investment in impaired loans | | $ | 455,000 | | $ | 430,000 | | $ | 1,431,000 | |
| Interest recognized on impaired loans | | $ | 14,000 | | $ | 6,000 | | $ | 71,000 | |
Note 7. PREMISES AND EQUIPMENT, NET
| | | December 31, | |
| | | 2006 | | 2005 | |
| Land | | $ | 2,999,000 | | $ | 2,999,000 | |
| Buildings and improvements | | | 2,758,000 | | | 2,698,000 | |
| Leasehold improvements | | | 1,771,000 | | | 972,000 | |
| Furniture, fixtures and equipment | | | 3,798,000 | | | 3,509,000 | |
| | | | 11,326,000 | | | 10,178,000 | |
| Less accumulated depreciation and amortization | | | 4,228,000 | | | 3,714,000 | |
| Total premises & equipment, net | | $ | 7,098,000 | | $ | 6,464,000 | |
Amounts charged to net occupancy expense for depreciation and amortization of banking premises and equipment amounted to $712,000, $577,000 and $622,000 in 2006, 2005 and 2004, respectively.
Note 8. DEPOSITS
| | | December 31, 2006 | | December 31, 2005 | |
| | | Weighted | | | | Weighted | | | |
| | | Average | | | | Average | | | |
| | | Rate | | Amount | | Rate | | Amount | |
| Noninterest-bearing demand | | | 0 | % | $ | 92,105,000 | | | 0 | % | $ | 94,331,000 | |
| | | | | | | | | | | | | | |
| NOW accounts | | | 1.59 | % | | 64,493,000 | | | 1.29 | % | | 71,986,000 | |
| Money market accounts | | | 2.67 | % | | 56,406,000 | | | 1.07 | % | | 50,881,000 | |
| Total interest-bearing demand | | | 2.09 | % | | 120,899,000 | | | 1.20 | % | | 122,867,000 | |
| | | | | | | | | | | | | | |
| Statement savings and clubs | | | 0.77 | % | | 33,546,000 | | | 0.59 | % | | 41,395,000 | |
| Business savings | | | 0.51 | % | | 3,778,000 | | | 0.51 | % | | 4,384,000 | |
| Total savings | | | 0.74 | % | | 37,324,000 | | | 0.58 | % | | 45,779,000 | |
| | | | | | | | | | | | | | |
| IRA investment and variable rate savings | | | 4.31 | % | | 23,012,000 | | | 3.62 | % | | 21,145,000 | |
| Brokered certificates | | | 5.37 | % | | 19,671,000 | | | 0 | % | | — | |
| Money market certificates | | | 4.36 | % | | 141,212,000 | | | 3.61 | % | | 119,344,000 | |
| Total certificates of deposit | | | 4.46 | % | | 183,895,000 | | | 3.61 | % | | 140,489,000 | |
| | | | | | | | | | | | | | |
| Total interest-bearing deposits | | | 3.22 | % | | 342,118,000 | | | 2.20 | % | | 309,135,000 | |
| | | | | | | | | | | | | | |
| Total deposits | | | 2.54 | % | $ | 434,223,000 | | | 1.69 | % | $ | 403,466,000 | |
Certificates of deposit with balances of $100,000 or more at December 31, 2006 and 2005, totaled approximately $69,902,000 and $62,343,000, respectively. Interest on certificates of deposit with balances of $100,000 or more totaled $2,718,000, $1,562,000, and $798,000 for the years ended December 31, 2006, 2005 and 2004, respectively.
The scheduled maturities of certificates of deposit were as follows:
| | | December 31, 2006 | |
| 2007 | | $ | 142,351,000 | |
| 2008 | | | 25,112,000 | |
| 2009 | | | 6,475,000 | |
| 2010 | | | 9,188,000 | |
| 2011 | | | 769,000 | |
| | | $ | 183,895,000 | |
Note 9. OTHER BORROWINGS
Federal Home Loan Bank of New York Advances
During the years 2006 and 2005, the maximum amount of FHLB-NY advances outstanding at any month end was $40.4 million and $30.5 million, respectively. The average amount of advances outstanding during the year ended December 31, 2006 and 2005 was $27.9 million and $17.1 million, respectively. As of December 31, 2006, all FHLB-NY advances had fixed rates. The advances are scheduled for repayment as follows:
December 31, 2006 December 31, 2005
| | | December 31, 2006 | | December 31, 2005 | |
| | | | | Weighted | | | | Weighted | |
| | | | | Average | | | | Average | |
Advances Maturing | | Amount | | Rate | | Amount | | Rate | |
| 2006 | | $ | - | | | - | | $ | 15,400,000 | | | 4.34 | % |
| 2007 | | | 14,400,000 | | | 5.33 | % | | — | | | — | |
| 2008 | | | 3,492,000 | | | 3.26 | % | | 5,086,000 | | | 3.26 | % |
| Thereafter | | | 10,000,000 | | | 3.82 | % | | 10,000,000 | | | 3.82 | % |
| | | $ | 27,892,000 | | | 4.53 | % | $ | 30,486,000 | | | 3.99 | % |
Advances totaling $10.0 million are convertible by the FHLB -NY quarterly thereafter into any FHLB-NY advance at current market rate. This conversion feature is only available if the three month LIBOR resets at or above 7.50%.
Advances from the FHLB-NY were secured by a blanket assignment of the Corporation's unpledged, qualifying mortgage loans, mortgage-backed securities and investment securities. Such loans and securities remain under the control of the Corporation.
The Corporation had an available overnight line of credit with the FHLB-NY for a maximum of $47.1 million at December 31, 2006.
Securities Sold Under Agreement to Repurchase
At December 31, 2006 and 2005, securities sold under agreements to repurchase were collateralized by U.S. Treasury and agency securities having a carrying value of approximately $24,531,000 and $10,089,000, respectively. These securities were maintained in a separate safekeeping account within the Corporation's control.
| | | December 31, | |
| | | 2006 | | 2005 | |
| Balance | | $ | 9,023,000 | | $ | 4,731,000 | |
| Weighted average interest rate | | | 4.70 | % | | 3.48 | % |
| Weighted average length of maturity | | | 42 days | | | 69 days | |
| Maximum amount outstanding at any month end during the year | | $ | 9,757,000 | | $ | 5,422,000 | |
| Average amount outstanding during the year | | $ | 7,461,000 | | $ | 3,371,000 | |
| Average interest rate during the year | | | 4.43 | % | | 2.91 | % |
Note 10. SUBORDINATED DEBENTURES
On September 17, 2003, Stewardship Statutory Trust I (the “Trust”), a statutory business trust, and a wholly owned subsidiary of Stewardship Financial Corporation, issued $7,000,000 Fixed/Floating Rate Capital Securities (“Capital Securities”), the proceeds from which the Trust used to purchase from the Corporation $7,217,000 of Fixed/Floating Rate Junior Subordinated Deferrable Interest Debentures (“Debentures”) maturing on September 17, 2033. The Trust is obligated to distribute all proceeds of a redemption whether voluntary or upon maturity, to holders of the Capital Securities. Stewardship Financial Corporation’s obligation with respect to the Capital Securities, and the subordinated debentures, when taken together, provide a full and unconditional guarantee on a subordinated basis by Stewardship Financial Corporation of the Trust’s obligations to pay amounts when due on the Capital Securities.
The Capital Securities and the Debentures both bear a fixed interest rate of 6.75% until September 17, 2008 and thereafter shall float quarterly at a rate of 3-Month LIBOR plus 2.95%.
FASB Interpretation No. 46, “Consolidation of Variable Interest Entities” was issued in January 2003 and was reissued as FASB Interpretation No. 46 (revised December 2003) (“FIN 46R”). FIN 46 and FIN 46R provide guidance on the identification of entities controlled through means other than voting rights and specify how the Corporation should evaluate its interest in a variable interest entity for purposes of determining whether to consolidate that entity. If a variable interest entity does not effectively disperse risk among the parties involved, it must be consolidated by its primary beneficiary.
The Corporation adopted FIN 46R on December 31, 2003, deconsolidating its investment in Stewardship Statutory Trust I, the subsidiary trust formed in connection with the issuance of subordinated debentures (trust preferred securities). In July 2003, the Board of Governors of the Federal Reserve System instructed bank holding companies to continue to include trust preferred securities in their Tier I capital for regulatory purposes until notice is given to the contrary. There can be no assurance that the Federal Reserve System will continue to allow bank holding companies to include trust preferred securities in Tier I capital for regulatory purposes. As of December 31, 2006, assuming the Corporation was not allowed to include the $7,000,000 in trust preferred securities issued by Stewardship Statutory Trust I in Tier I capital, the Corporation would remain “well capitalized”.
Note 11. REGULATORY CAPITAL REQUIREMENTS
Banks and bank holding companies are subject to regulatory capital requirements administered by federal banking agencies. Capital adequacy guidelines and, additionally for banks, prompt corrective action regulations, involve quantitative measures of assets, liabilities, and certain off-balance-sheet items calculated under regulatory accounting practices. Capital amounts and classifications are also subject to qualitative judgments by regulators. Failure to meet capital requirements can initiate regulatory action. Regulations of the Board of Governors of the Federal Reserve System (“FRB”) require bank holding companies to maintain minimum levels of regulatory capital. Under the regulations in effect at December 31, 2006, the Corporation was required to maintain (i) a minimum leverage ratio of Tier 1 capital to total adjusted assets of 4.0% and (ii) minimum ratios of Tier 1 and total capital to risk-weighted assets of 4.0% and 8.0%, respectively. The Bank must comply with substantially similar capital regulations promulgated by the FDIC.
Prompt corrective action regulations provide five classifications: well capitalized, adequately capitalized, undercapitalized, significantly undercapitalized, and critically undercapitalized, although these terms are not used to represent overall financial condition. If adequately categorized, regulatory approval is required to accept brokered deposits. If undercapitalized, capital distributions are limited, as is asset growth and expansion, and capital restoration plans are required.
At year end 2006 and 2005, the most recent regulatory notifications categorized the Bank as well capitalized under the regulatory framework for prompt corrective action. There are no conditions or events since that notification that management believes changed the institution’s category.
Management believes that, as of December 31, 2006, the Bank and the Corporation have met all capital adequacy requirements to which they are subject. The following is a summary of the Corporation’s and the Bank’s actual capital amounts and ratios as of December 31, 2006 and 2005, compared to the minimum capital adequacy requirements and the requirements for classification as a well capitalized institution under the prompt corrective action regulations:
| | | | | | | | | | | To Be Well Capitalized | |
| | | | | | | Required for Capital | | Under Prompt Corrective | |
| | | Actual | | Adequacy Purposes | | Action Regulations | |
| | | Amount | | Ratio | | Amount | | Ratio | | Amount | | Ratio | |
December 31, 2006 | | | | | | | | | | | | | |
| Leverage (Tier 1) capital | | | | | | | | | | | | | |
| Consolidated | | | 44,783,000 | | | 8.85 | % | | 20,252,000 | | | 4.00 | % | | N/A | | | N/A | |
| Bank | | | 39,765,000 | | | 7.91 | % | | 20,096,000 | | | 4.00 | % | | 25,120,000 | | | 5.00 | % |
| Risk-based capital: | | | | | | | | | | | | | | | | | | | |
| Tier 1 | | | | | | | | | | | | | | | | | | | |
| Consolidated | | | 44,783,000 | | | 11.25 | % | | 15,930,000 | | | 4.00 | % | | N/A | | | N/A | |
| Bank | | | 39,765,000 | | | 10.01 | % | | 15,890,000 | | | 4.00 | % | | 23,836,000 | | | 6.00 | % |
| Total | | | | | | | | | | | | | | | | | | | |
| Consolidated | | | 48,884,000 | | | 12.28 | % | | 31,859,000 | | | 8.00 | % | | N/A | | | N/A | |
| Bank | | | 43,866,000 | | | 11.04 | % | | 31,781,000 | | | 8.00 | % | | 39,726,000 | | | 10.00 | % |
December 31, 2005 | | | | | | | | | | | | | | | | | | | |
| Leverage (Tier 1) capital | | | | | | | | | | | | | | | | | | | |
| Consolidated | | | 41,143,000 | | | 8.71 | % | | 18,899,000 | | | 4.00 | % | | N/A | | | N/A | |
| Bank | | | 36,226,000 | | | 7.75 | % | | 18,707,000 | | | 4.00 | % | | 23,384,000 | | | 5.00 | % |
| Risk-based capital: | | | | | | | | | | | | | | | | | | | |
| Tier 1 | | | | | | | | | | | | | | | | | | | |
| Consolidated | | | 41,143,000 | | | 11.16 | % | | 14,741,000 | | | 4.00 | % | | N/A | | | N/A | |
| Bank | | | 36,226,000 | | | 9.86 | % | | 14,697,000 | | | 4.00 | % | | 22,046,000 | | | 6.00 | % |
| Total | | | | | | | | | | | | | | | | | | | |
| Consolidated | | | 44,990,000 | | | 12.21 | % | | 29,482,000 | | | 8.00 | % | | N/A | | | N/A | |
| Bank | | | 40,072,000 | | | 10.91 | % | | 29,394,000 | | | 8.00 | % | | 36,743,000 | | | 10.00 | % |
Note 12. BENEFIT PLANS
The Corporation has a noncontributory profit sharing plan covering all eligible employees. Contributions are determined by the Corporation’s Board of Directors on an annual basis. Total profit sharing plan expense for the years ended December 31, 2006, 2005 and 2004 amounted to approximately $394,000, $395,000, and $327,000, respectively.
The Corporation also has a 401(k) plan which covers all eligible employees. Participants may elect to contribute up to 15% of their salaries, not to exceed the applicable limitations as per the Internal Revenue Code. The Corporation, on an annual basis, may elect to match 50% of the participant’s first 5% contribution. Total 401(k) expense for the years ended December 31, 2006, 2005 and 2004 amounted to approximately $67,000, $65,000, and $59,000, respectively.
During 1996, the Corporation adopted an Employee Stock Purchase Plan which allows all eligible employees to authorize a specific payroll deduction from his or her base compensation. Total stock purchases amounted to 3,077, 2,503 and 2,211 shares during 2006, 2005 and 2004, respectively.
Note 13. STOCK-BASED COMPENSATION
At December 31, 2006, the Corporation had four types of stock award programs referred to as the Employee Stock Bonus Plan, the Director Stock Plan, an Employee Stock Option Plan and Stock Option Plans for Non-Employee Directors.
The Employee Stock Bonus Plan is intended to provide incentives which will retain highly competent key management employees of the Corporation by providing them with a bonus in the form of shares of the common stock of the Corporation. Compensation expense is based on the fair value of shares awarded on the date of the grant. The Corporation has not granted shares during 2006, 2005 and 2004 under this plan.
The Director Stock Plan permits members of the Board of Directors of the Bank to receive any monthly Board of Directors’ fees in shares of the Corporation’s common stock, rather than in cash. Compensation expense is based on the fair value of shares awarded on the date of the grant. The Corporation issued 2,026, 2,343 and 2,371 shares during 2006, 2005 and 2004, respectively through reissued treasury shares or through authorized, unissued shares. Beginning in June 2006, 3,017 additional shares were purchased for Directors in the open market.
The Employee Stock Option Plan provides for options to purchase shares of Common Stock to be issued to key employees of the Corporation at the discretion of the Stock Option Committee. The committee has the authority to determine the terms and conditions of the options granted, the exercise price thereof, and whether the options are incentive or non-statutory options. The Employee Stock Option Plan has reserved 209,429 shares of common stock for issuance. The options were issued with an exercise price which represented market price of the stock at the date of grant. Options are exercisable, subject to a vesting schedule, with the first vesting starting one year from the date of the grant and expire between five and ten years from the date of grant. There were no options granted during 2006, 2005, or 2004. In December 2005, the Compensation Committee of the Board approved an acceleration of the vesting of all options granted on July 15, 2003 to full vesting. A summary of the status of the qualified stock options as of December 31, 2006, 2005 and 2004 and changes during the years then ended on those dates is presented on the following page:
| | | 2006 | | | | 2005 | | | | 2004 | | | |
| | | | | Weighted | | | | Weighted | | | | Weighted | |
| | | | | Average | | | | Average | | | | Average | |
| | | | Exercise | | | | Exercise | | | | Exercise | |
| | Shares | | Price | | Shares | | Price | | Shares | | Price | |
| Outstanding at beginning of year | | | 75,989 | | $ | 6.03 | | | 78,423 | | $ | 6.11 | | | 84,197 | | $ | 6.21 | |
| Exercised | | | — | | | — | | | (1,622 | ) | | 6.21 | | | ( 3,973 | ) | | 6.64 | |
| Forfeited | | | ( 567 | ) | | 13.61 | | | ( 810 | ) | | 12.96 | | | (1,801 | ) | | 9.55 | |
| Outstanding at end of year | | | 75,422 | | $ | 5.98 | | | 75,989 | | $ | 6.03 | | | 78,423 | | $ | 6.11 | |
| Intrinsic value at year end | | $ | 518,000 | | | | | $ | 591,000 | | | | | $ | 619,000 | | | | |
| Options exercisable at year end | | | 75,422 | | | | | | 75,989 | | | | | | 65,681 | | | | |
| Intrinsic value of options exercisable | | $ | 518,000 | | | | | $ | 591,000 | | | | | $ | 619,000 | | | | |
| Weighted average remaining contractual terms (years) | | | 1.96 | | | | | | 2.99 | | | | | | 4.05 | | | | |
| Intrinsic value of options exercised | | $ | - | | | | | $ | 12,000 | | | | | $ | 34,000 | | | | |
| Cash received from options exercised | | $ | - | | | | | $ | 10,000 | | | | | $ | 26,000 | | | | |
The following table summarizes information about the qualified employee stock options outstanding at December 31, 2006:
| | | Options Outstanding | |
| | | Number Outstanding at 12/31/06 | | Weighted Avg. Remaining Contractual Life | | Weighted Average Exercise Price | | Number Exercisable 12/31/06 | |
| Range of Exercise Prices: | | | | | | | | | |
| $ 3- 5 | | | 45,521 | | | 0.50 | | $ | 4.06 | | | 45,521 | |
| $ 5- 8 | | | 18,799 | | | 2.78 | | | 6.52 | | | 18,799 | |
| $8-11 | | | — | | | — | | | — | | | — | |
| $11-14 | | | 11,102 | | | 6.54 | | | 12.96 | | | 11,102 | |
| $3-14 | | | 75,422 | | | 1.96 | | $ | 5.98 | | | 75,422 | |
The 2001 Stock Option Plan for Non-Employee Directors provided for options to purchase shares of common stock to be issued to Directors of the Corporation. The plan reserved 160,811 shares of common stock for issuance. The plan allows for the exercise of options to be paid for in cash or with shares already owned. During 2006, 9,000 shares were used to satisfy the exercise of options.
On May 9, 2006 the shareholders approved the 2006 Stock Option Plan for Non-Employee Directors. The Plan provides for options to purchase shares of common stock to be issued to Non-Employee Directors of the Corporation. The Plan reserved 63,000 shares of common stock for issuance, 20% of such options are exercisable each year for five years. Options expire on the earlier of the sixth anniversary of the date of the grant or May 15, 2012. Options were granted on June 30, 2006 to all Non- Employee Directors.
A summary of the status of the nonqualified stock options as of December 31, 2006, 2005, and 2004 and changes during the years then ended on those dates is presented below:
| | | 2006 | | 2005 | | 2004 | |
| | | Shares | | Weighted-Average Exercise Price | | Shares | | Weighted Average-Exercise Price | | Shares | | Weighted Average-Exercise Price | |
| Outstanding at beginning of year | | | 45,568 | | $ | 7.12 | | | 69,690 | | $ | 6.98 | | | 112,571 | | $ | 6.69 | |
| Granted | | | 52,500 | | | 12.86 | | | 5,360 | | | 13.97 | | | — | | | — | |
| Exercised | | | (37,523 | ) | | 6.20 | | | (21,441 | ) | | 6.20 | | | (42,881 | ) | | 6.20 | |
| Forfeited | | | (2,685 | ) | | 6.20 | | | (8,041 | ) | | 12.96 | | | — | | | — | |
| Outstanding at end of year | | | 57,860 | | $ | 12.96 | | | 45,568 | | $ | 7.12 | | | 69,690 | | $ | 6.98 | |
| Intrinsic value at end of year | | $ | 17,000 | | | | | $ | 305,000 | | | | | $ | 489,000 | | | | |
| Options exercisable at year end | | | 5,360 | | | | | | 18,766 | | | | | | 13,403 | | | | |
| Weighted average fair value of options granted during the year | | $ | 4.55 | | | | | $ | 4.29 | | | | | $ | - | | | | |
| Intrinsic value of options exercisable | | $ | - | | | | | $ | 143,000 | | | | | $ | 105,000 | | | | |
| Weighted average remaining contractual terms (years) | | | 5.23 | | | | | | 0.87 | | | | | | 1.62 | | | | |
| Cash received from options exercised | | $ | 101,000 | | | | | $ | 133,000 | | | | | $ | 266,000 | | | | |
| Tax benefit realized from options exercised | | $ | 174,000 | | | | | $ | 70,000 | | | | | $ | 150,000 | | | | |
The fair value of the options granted for the 2006 Stock Option Plan for Non-Employee Directors was estimated on the date of the grant using the Black -Scholes option pricing model with the following assumptions used:
| Dividend Yield | | | 2.25 | % |
| Expected Volatility | | | 36.72 | % |
| Risk-Free Interest Rate | | | 5.21 | % |
| Expected Life | | | 6 years | |
| Fair Value at Grant Date | | | $4.55 | |
The following table summarizes information about the nonqualified Non-Employee Director stock options outstanding at December 31, 2006:
| | | Options Outstanding | |
| | | Number Outstanding at 12/31/06 | | Weighted Avg. Remaining Contractual Life | | Weighted Average Exercise Price | | Number Exercisable 12/31/06 | |
| Range of Exercise Prices: | | | | | | | | | |
| | | | | | | | | | |
| $11-15 | | | 52,500 | | | 5.38 | | $ | 12.86 | | | — | |
| $13-15 | | | 5,360 | | | 3.80 | | | 13.97 | | | 5,360 | |
| $11-15 | | | 57,860 | | | 5.23 | | $ | 12.96 | | | 5,360 | |
On January 1, 2006, the Corporation adopted Statement of Financial Accounting Standards No. 123 (revised 2004) “Share-Based Payment” (“SFAS No. 123(R)”) under the applied modified prospective method. With limited exceptions, SFAS No. 123(R) requires public companies to measure the cost of employee services received in exchange for an award of equity instruments based on the grant date fair value of the award and to recognized such cost over the period during which an employee is required to provide service in exchange for the award (usually the vesting period). Unrecognized compensation expense totaled $212,000 and will be recognized over the next 4.4 years.
Note 14: EARNINGS PER SHARE
The following reconciles the income available to common shareholders (numerator) and the weighted average common stock outstanding (denominator) for both basic and diluted earnings per share for 2006, 2005 and 2004:
| | | 2006 | | 2005 | | 2004 | |
| Net income | | $ | 4,753,000 | | $ | 4,480,000 | | $ | 3,848,000 | |
| Weighted average common shares outstanding - basic | | | 5,020,939 | | | 4,990,916 | | | 4,911,401 | |
| Effect of dilative securities - stock options | | | 46,804 | | | 58,765 | | | 70,944 | |
| Weighted average common shares outstanding - diluted | | | 5,067,743 | | | 5,049,681 | | | 4,982,345 | |
| Basic earnings per share | | $ | 0.95 | | $ | 0.90 | | $ | 0.78 | |
| Diluted earnings per share | | $ | 0.94 | | $ | 0.89 | | $ | 0.77 | |
Stock options for 31,826 shares of common stock were not considered in computing diluted earnings per share for 2006 because they were antidilutive. There were no stock options considered antidilutive for 2005 and 2004.
Note 15. INCOME TAXES
The components of income taxes (benefit) are summarized as follows:
| | | Year ended December 31, | |
| | | 2006 | | 2005 | | 2004 | |
| Current tax expense: | | | | | | | |
| Federal | | $ | 4,753,000 | | $ | 2,218,000 | | $ | 1,877,000 | |
| State | | | 650,000 | | | 630,000 | | | 581,000 | |
| | | | 2,742,000 | | | 2,848,000 | | | 2,458,000 | |
| Deferred tax benefit: | | | | | | | | | | |
| Federal | | | (80,000 | ) | | (293,000 | ) | | (216,000 | ) |
| State | | | (35,000 | ) | | (51,000 | ) | | (38,000 | ) |
| | | | (115,000 | ) | | (344,000 | ) | | (254,000 | ) |
| | | $ | 2,627,000 | | $ | 2,504,000 | | $ | 2,204,000 | |
The following table presents a reconciliation between the reported income taxes and the income taxes which would be computed by applying the normal federal income tax rate (34%) to income before income taxes:
| | | Year ended December 31, | |
| | | 2006 | | 2005 | | 2004 | |
| | | | | | | | |
| Federal income tax | | $ | 2,509,000 | | $ | 2,375,000 | | $ | 2,058,000 | |
| Add (deduct) effect of: | | | | | | | | | | |
| State income taxes, net of federal income tax effect | | | 406,000 | | | 382,000 | | | 359,000 | |
| Nontaxable interest income | | | (246,000 | ) | | (252,000 | ) | | (215,000 | ) |
| Life insurance | | | (109,000 | ) | | (74,000 | ) | | — | |
| Nondeductible expenses | | | 73,000 | | | 76,000 | | | — | |
| Change in valuation reserve - federal | | | 17,000 | | | — | | | — | |
| Other items, net | | | (23,000 | ) | | (3,000 | ) | | 2,000 | |
| Effective federal income taxes | | $ | 2,627,000 | | $ | 2,504,000 | | $ | 2,204,000 | |
The tax effects of existing temporary differences that give rise to significant portions of the deferred tax assets and deferred tax liabilities are as follows:
| | | December 31, | |
| | | 2006 | | 2005 | |
| Deferred tax assets: | | | | | |
| Allowance for loan losses | | $ | 1,638,000 | | $ | 1,536,000 | |
| Accrued reserves | | | 122,000 | | | 149,000 | |
| Core deposit intangible amortization | | | 10,000 | | | 15,000 | |
| Stock compensation | | | 20,000 | | | — | |
| Nonaccrual loan interest | | | 12,000 | | | 37,000 | |
| Depreciation | | | 203,000 | | | 153,000 | |
| Contribution carry forward | | | 34,000 | | | 14,000 | |
| State capital loss carry forward | | | 7,000 | | | — | |
| Unrealized losses on securities available for sale | | | 381,000 | | | 576,000 | |
| Other | | | 1,000 | | | 1,000 | |
| | | $ | 2,428,000 | | $ | 2,481,000 | |
| Valuation reserve | | | (41,000 | ) | | (14,000 | ) |
| Net deferred tax assets | | $ | 2,387,000 | | $ | 2,467,000 | |
Note 16. COMMITMENTS AND CONTINGENCIES
The Corporation is a party to financial instruments with off-balance sheet risk in the normal course of business to meet the financing needs of its customers. These financial instruments include commitments to extend credit and standby letters of credit. Those instruments involve, to varying degrees, elements of credit and interest rate risk in excess of the amount recognized in the consolidated financial statements. The contract or notional amounts of those instruments reflect the extent of involvement the Corporation has in particular classes of financial instruments.
The Corporation's exposure to credit loss in the event of nonperformance by the other party to the financial instrument for commitments to extend credit and standby letters of credit is represented by the contractual notional amount of those instruments. The Corporation uses the same credit policies in making commitments and conditional obligations as it does for on-balance sheet instruments.
At December 31, 2006, the Corporation had mortgage commitments to extend credit aggregating approximately $2.5 million at fixed rates averaging 6.02%. Of these loan commitments, $1.9 million will be sold to investors upon closing. Commercial, construction, and home equity loan commitments of approximately $3.7 million were extended with variable rates currently averaging 7.39% and $5.3 million were extended at fixed rates averaging 7.47%. All commitments were due to expire within approximately 120 days.
Additionally, at December 31, 2006, the Corporation was committed for approximately $83.4 million of unused lines of credit, consisting of $27.1 million relating to a home equity line of credit program and an unsecured line of credit program (cash reserve), and $56.3 million relating to commercial and construction lines of credit. Amounts drawn on the unused lines of credit are predominantly assessed interest at rates which fluctuate with the base rate.
Commitments under standby and commercial letters of credit aggregated approximately $3.1 million at December 31, 2006, of which $2.2 million expires within one year. Should any letter of credit be drawn on, the interest rate charged on the resulting note would fluctuate with the Corporation's base rate. Commitments to extend credit are agreements to lend to a customer as long as there is no violation of any condition established in the contract. Commitments generally have fixed expiration dates or other termination clauses and may require payment of a fee. Since many of the commitments may expire without being drawn upon, the total commitment amounts do not necessarily represent future cash requirements. The Corporation evaluates each customer's creditworthiness on a case-by-case basis. The amount of collateral obtained, if deemed necessary by the Corporation upon extension of credit, is based on management's credit evaluation of the counter-party. Collateral held varies, but may include accounts receivable, inventory, property, plant and equipment, and income-producing commercial properties.
Standby and commercial letters of credit are conditional commitments issued by the Corporation to guarantee payment or performance of a customer to a third party. Those guarantees are primarily issued to support public and private borrowing arrangements, including commercial paper, bond financing and similar transactions. The credit risk involved in issuing letters of credit is essentially the same as that involved in extending loan facilities to customers. The Corporation obtains collateral supporting those commitments for which collateral is deemed necessary.
As discussed in Footnote 5, the Corporation sold its credit card portfolio to Elan during the fourth quarter of 2006. As part of the agreement, the Corporation may be required to repurchase certain accounts identified at closing should those accounts be deemed uncollectible by Elan within one year from the closing date. The Corporation has estimated this obligation to be approximately $120,000 and has accordingly reserved this amount.
Rentals under long-term operating lease for branch offices amounted to approximately $642,000 and $460,000 during the years ended December 31, 2006 and 2005, respectively. At December 31, 2006, the minimum rental commitments on the noncancellable leases with an initial term of one year and expiring thereafter is as follows:
Year Ending December 31 | | Minimum Rent | |
| 2007 | | $ | 545,000 | |
| 2008 | | | 575,000 | |
| 2009 | | | 524,000 | |
| 2010 | | | 505,000 | |
| 2011 | | | 492,000 | |
| Thereafter | | | 2,417,000 | |
| | | $ | 5,058,000 | |
The Corporation is also subject to litigation which arises primarily in the ordinary course of business In the opinion of management the ultimate disposition of such litigation should not have a material adverse effect on the financial position of the Corporation.
Note 17. DIVIDEND LIMITATION
The Corporation's ability to pay cash dividends is based on its ability to receive cash from its bank subsidiary. Banking regulations limit the amount of dividends that may be paid without prior approval of regulatory agencies. Under these regulations, the amount of dividends that may be paid in any calendar year is limited to the current year’s profits, combined with the retained net profits of the proceeding two years. At December 31, 2006, this restriction did not result in any effective limitation in the manner in which the Bank is currently operating.
Note 18. FAIR VALUE OF FINANCIAL INSTRUMENTS
Statement of Financial Accounting Standards No. 107 (SFAS No. 107) Disclosures About Fair Value of Financial Instruments, requires that the Corporation disclose the estimated fair value of its financial instruments whether or not recognized in the consolidated balance sheet. Fair value estimates, methods and assumptions are set forth below for the Corporation's financial instruments.
| | | December 31, | |
| | | 2006 | | 2005 | |
| | | Carrying Amount | | Estimated Fair Value | | Carrying Amount | | Estimated Fair Value | |
| | | (Dollars in thousands) | |
| Financial assets: | | | | | | | | | |
| Cash and cash equivalents | | $ | 15,697 | | $ | 15,697 | | $ | 14,028 | | $ | 14,028 | |
| Securities available for sale | | | 72,746 | | | 72,746 | | | 64,166 | | | 64,166 | |
| Securities held to maturity | | | 39,163 | | | 38,881 | | | 37,801 | | | 37,459 | |
| FHLB-NY stock | | | 1,899 | | | 1,899 | | | 1,939 | | | 1,939 | |
| Net loans | | | 365,443 | | | 362,043 | | | 341,976 | | | 341,156 | |
| Mortgage loans held for sale | | | 2,155 | | | 2,183 | | | 2,041 | | | 2,041 | |
| Accrued interest receivable | | | 2,912 | | | 2,912 | | | 2,432 | | | 2,432 | |
| | | | | | | | | | | | | | |
| Financial liabilities: | | | | | | | | | | | | | |
| Deposits | | | 434,223 | | | 434,223 | | | 403,466 | | | 403,731 | |
| Securities sold under agreements to repurchase | | | 9,023 | | | 9,023 | | | 4,731 | | | 4,731 | |
| Other borrowings | | | 27,892 | | | 26,655 | | | 30,486 | | | 29,644 | |
| Subordinated debenture | | | 7,217 | | | 7,436 | | | 7,217 | | | 7,731 | |
| Accrued interest payable | | | 1,721 | | | 1,721 | | | 1,145 | | | 1,145 | |
The following methods and assumptions were used to estimate the fair value of each class of financial instruments:
Cash and cash equivalents
The carrying amount approximates fair value.
Securities available for sale
All securities available for sale are actively traded and have been valued using quoted market prices.
Securities held to maturity
All securities held to maturity are actively traded and have been valued using quoted market prices.
FHLB-NY stock
The carrying amount approximates fair value.
Net loans
Fair values are estimated for portfolios of loan with similar financial characteristics. Loans are segregated by type such as residential and commercial mortgages, commercial and other installment. The fair value of loans is estimated by discounting cash flows using estimated market discount rates which reflect the credit and interest rate risk inherent in the loans.
Mortgage loans held for sale
Loans in this category have been committed for sale to investors at the current carrying amount.
Accrued interest receivable
The carrying amount approximates fair value
Deposits
The fair value of deposits, with no stated maturity, such as noninterest-bearing demand deposits, savings, NOW and money market accounts, is equal to the amount payable on demand as of December 31, 2006 and 2005, respectively. The fair value of the certificates of deposit is based on the discounted value of cash flows. The discount rate is estimated using market discount rates which reflect interest rate risk inherent in the certificates of deposit.
Securities sold under agreements to repurchase
The carrying value approximates fair value due to the relatively short time before maturity.
Accrued interest payable
The carrying valve approximates fair value.
Commitments to extend credit
The fair value of commitments is estimated using the fees currently charged to enter into similar agreements, taking into account the remaining terms of the agreements and the present credit worthiness of the counter parties, and at December 31, 2006 and 2005 were not material.
Limitations
The preceding fair value estimates were made at December 31, 2006 and 2005, based on pertinent market data and relevant information on the financial instruments. These estimates do not include any premium or discount that could result from an offer to sell at one time the Corporation's entire holdings of a particular financial instrument or category thereof. Since no market exists for a substantial portion of the Corporation's financial instruments, fair value estimates were necessarily based on judgments with respect to future expected loss experience, current economic conditions, risk assessments of various financial instruments, and other factors. Given the subjective nature of these estimates, the uncertainties surrounding them and the matters of significant judgment that must be applied, these fair value estimates cannot be calculated with precision. Modifications in such assumptions could meaningfully alter these estimates.
Since these fair value approximations were made solely for on and off balance sheet financial instruments at December 31, 2006 and 2005, no attempt was made to estimate the value of anticipated future business. Furthermore, certain tax implications related to the realization of unrealized gains and losses could have a substantial impact on these fair value estimates and have not been incorporated into the estimates.
Note 19. PARENT COMPANY ONLY
The Corporation was formed in January, 1995 to operate its subsidiary, Atlantic Stewardship Bank. The earnings of the bank are recognized by the Corporation using the equity method of accounting. Accordingly, the bank dividends paid reduce the Corporation's investment in the subsidiary. In 2003, the Corporation formed its second subsidiary, Stewardship Statutory Trust, to offer trust preferred securities. The following information should be read in conjunction with the other notes to the consolidated financial statements. Condensed financial statements of the Corporation at December 31, 2006 and 2005 and for the years ended December 31, 2006, 2005 and 2004 are presented below:
Condensed Statements of Financial Condition | | Years ended December 31, | |
| | | 2006 | | 2005 | |
Assets | | | | | |
| Cash and due from banks | | $ | 306,000 | | $ | 286,000 | |
| Securities available for sale | | | 4,470,000 | | | 4,387,000 | |
| Investment in subsidiary | | | 39,307,000 | | | 35,537,000 | |
| Accrued interest receivable | | | 40,000 | | | 45,000 | |
| Other assets | | | 441,000 | | | 421,000 | |
| Total assets | | $ | 44,564,000 | | $ | 40,676,000 | |
Liabilities and Stockholders' equity | | | | | | | |
| Subordinated debenture | | $ | 7,217,000 | | $ | 7,217,000 | |
| Other liabilities | | | 41,000 | | | 75,000 | |
| Stockholders' equity | | | 37,306,000 | | | 33,384,000 | |
| Total liabilities and Stockholders' equity | | $ | 44,564,000 | | $ | 40,676,000 | |
Condensed Statements of Income | | Years ended December 31, | |
| | | 2006 | | 2005 | | 2004 | |
| Interest income - securities available for sale | | $ | 177,000 | | $ | 174,000 | | $ | 160,000 | |
| Interest income - securities held to maturity | | | - | | | - | | | 4,000 | |
| Dividend income | | | 1,853,000 | | | 1,386,000 | | | 325,000 | |
| Loss on sale of available for sale securities | | | (90,000 | ) | | — | | | — | |
| Other income | | | 15,000 | | | 14,000 | | | 11,000 | |
| Total income | | | 1,955,000 | | | 1,574,000 | | | 500,000 | |
| Interest expense | | | 487,000 | | | 487,000 | | | 487,000 | |
| Other expenses | | | 173,000 | | | 127,000 | | | 145,000 | |
| Total expenses | | | 660,000 | | | 614,000 | | | 632,000 | |
| Income before income tax expense (benefit) | | | 1,295,000 | | | 960,000 | | | (132,000 | ) |
| Tax benefit | | | (190,000 | ) | | (145,000 | ) | | (155,000 | ) |
| Income before equity in undistributed earnings of subsidiary | | | 1,485,000 | | | 1,105,000 | | | 23,000 | |
| Equity in undistributed earnings of subsidiary | | | 3,268,000 | | | 3,375,000 | | | 3,825,000 | |
| Net income | | $ | 4,753,000 | | $ | 4,480,000 | | $ | 3,848,000 | |
Condensed Statements of Cash Flows | | Years ended December 31, | |
| | | 2006 | | 2005 | | 2004 | |
| Cash flows from operating activities: | | | | | | | |
| Net income | | $ | 4,753,000 | | $ | 4,480,000 | | $ | 3,848,000 | |
| Adjustments to reconcile net income to net cash provided by operating activities: | | | | | | | | | | |
| Equity in undistributed earnings of subsidiary | | | (3,268,000 | ) | | (3,375,000 | ) | | (3,825,000 | ) |
| Loss on sale of securities available for sale | | | 90,000 | | | — | | | 4,000 | |
| Accretion of discounts | | | (2,000 | ) | | (2,000 | ) | | (1,000 | ) |
| Decrease (increase) in accrued interest receivable | | | 5,000 | | | — | | | (1,000 | ) |
| Increase in other assets | | | (47,000 | ) | | (11,000 | ) | | (55,000 | ) |
| Increase in other liabilities | | | (33,000 | ) | | 30,000 | | | 1,000 | |
| Net cash provided by used in operating activities | | | 1,498,000 | | | 1,122,000 | | | (29,000 | ) |
| | | | | | | | | | | |
| Cash flows from investing activities: | | | | | | | | | | |
| Proceeds from calls on securities held to maturity | | | — | | | — | | | 1,000,000 | |
| Purchase of securities available for sale | | | (3,500,000 | ) | | — | | | (1,991,000 | ) |
| Proceeds from sales and calls on securities available for sale | | | 3,404,000 | | | — | | | 1,296,000 | |
| Net cash provided by investing activities | | | (96,000 | ) | | — | | | 305,000 | |
| | | | | | | | | | | |
| Cash flows from financing activities: | | | | | | | | | | |
| Cash dividends paid on common stock | | | (1,118,000 | ) | | (535,000 | ) | | (410,000 | ) |
| Payment of discount on dividend reinvestment plan | | | (19,000 | ) | | — | | | — | |
| Exercise of stock options | | | 101,000 | | | 143,000 | | | 292,000 | |
| Purchase of treasury stock | | | (415,000 | ) | | (561,000 | ) | | (454,000 | ) |
| Issuance of common stock | | | 69,000 | | | 68,000 | | | 68,000 | |
| Net cash (used in) provided by investing activities | | | (1,382,000 | ) | | (885,000 | ) | | (504,000 | ) |
| | | | | | | | | | | |
| Net increase (decrease) in cash and cash equivalents | | | 20,000 | | | 237,000 | | | (228,000 | ) |
| Cash and cash equivalents - beginning | | | 286,000 | | | 49,000 | | | 277,000 | |
| Cash and cash equivalents - ending | | $ | 306,000 | | $ | 286,000 | | $ | 49,000 | |
| | | | | | | | | | | |
| Supplemental disclosures of cash flow information: | | | | | | | | | | |
| Noncash financing activities - issuance of common stock under dividend reinvestment plan | | | 412,000 | | | 710,000 | | | 608,000 | |
NOTE 20. RECENT ACCOUNTING PRONOUNCEMENTS
FASB Statement of Financial Accounting Standard No. 158 “Employers’ Accounting for Defined Benefit Pension and Other Postretirement Plans - an amendment of FASB Statements No. 87, 88, 106 and 132(R)”
In September 2006, the Financial Accounting Standards Board (FASB) issued Statement of Financial Accounting Standard No. 158, “Employers’ Accounting for Defined Benefit Pension and Other Postretirement Plans - an amendment of FASB Statements No. 87, 88, 106 and 132(R)” (SFAS No. 158). This Statement requires an employer to recognize the overfunded or underfunded status of a defined benefit postretirement plan (other than a multiemployer plan) as an asset or liability in its balance sheet, beginning with year end 2006, and to recognize changes in the funded status in the year in which the changes occur through comprehensive income beginning in 2007. Additionally, defined benefit plan assets and obligations are to be measured as of the date of the employer’s fiscal year-end, starting in 2008. SFAS No. 158 has not had and is not expected to have a material impact on our financial statements as the Corporation does not currently offer a defined benefit plan for its employees.
Securities and Exchange Commission Staff Accounting Bulletin No. 108, “Considering the Effects of Prior Year Misstatements when Quantifying Misstatements in Current Year Financial Statements”
In September 2006, the Securities and Exchange Commission (SEC) released Staff Accounting Bulletin No. 108, “Considering the Effects of Prior Year Misstatements when Quantifying Misstatements in Current Year Financial Statements” (SAB 108), which is effective for fiscal years ending on or after November 15, 2006. SAB 108 provides guidance on how the effects of prior-year uncorrected financial statement misstatements should be considered in quantifying a current year misstatement. SAB 108 requires public companies to quantify misstatements using both an income statement (rollover) and balance sheet (iron curtain) approach and evaluate whether either approach results in a misstatement that, when all relevant quantitative and qualitative factors are considered, is material. If prior year errors that had been previously considered immaterial now are considered material based on either approach, no restatement is required so long as management properly applied its previous approach and all relevant facts and circumstances were considered. Adjustments considered immaterial in prior years under the method previously used, but now considered material under the dual approach required by SAB 108, are to be recorded upon initial adoption of SAB 108. The amount so recorded is shown as a cumulative effect adjustment is recorded in opening retained earnings as of January 1, 2006. The adoption of SAB 108 had no effect on the Corporation’s financial statements for the year ending December 31, 2006.
FASB Statement of Financial Accounting Standard No. 155, “Accounting for Certain Hybrid Financial Instruments-an amendment to FASB Statements No. 133 and 140”
In February 2006, the Financial Accounting Standards Board (FASB) issued Statement of Financial Accounting Standard No. 155, “Accounting for Certain Hybrid Financial Instruments-an amendment to FASB Statements No. 133 and 140” (SFAS No. 155). This Statement permits fair value re-measurement for any hybrid financial instruments, clarifies which instruments are subject to the requirements of Statement No. 133, and establishes a requirement to evaluate interests in securitized financial assets and other items. The new standard is effective for financial assets acquired or issued after the beginning of the entity's first fiscal year that begins after September 15, 2006. The adoption of this statement has not had a material impact on the Corporation’s consolidated financial position or results of operations.
FASB Statement of Financial Accounting Standard No. 156, “Accounting for Servicing of Financial Assets-an amendment of FASB Statement No. 140”
In March 2006, the FASB issued Statement No. 156, “Accounting for Servicing of Financial Assets-an amendment of FASB Statement No. 140”. This Statement provides the following: 1) revised guidance on when a servicing asset and servicing liability should be recognized; 2) requires all separately recognized servicing assets and servicing liabilities to be initially measured at fair value, if practicable; 3) permits an entity to elect to measure servicing assets and servicing liabilities at fair value each reporting date and report changes in fair value in earnings in the period in which the changes occur; 4) upon initial adoption, permits a onetime reclassification of available-for-sale securities to trading securities for securities which are identified as offsetting the entity's exposure to changes in the fair value of servicing assets or liabilities that a servicer elects to subsequently measure at fair value; and 5) requires separate presentation of servicing assets and servicing liabilities subsequently measured at fair value in the statement of financial position and additional footnote disclosures. This standard is effective as of the beginning of an entity's first fiscal year that begins after September 15, 2006 with the effects of initial adoption being reported as a cumulative-effect adjustment to retained earnings. The adoption of this statement has not had a material impact on the Corporation’s consolidated financial position or results of operations.
FASB Statement of Financial Accounting Standard No. 157, “Fair Value Measurements” ”
In September 2006, the FASB issued Statement of Financial Accounting Standard No. 157,” Fair Value Measurements”. This Statement defines fair value, establishes a framework for measuring fair value and expands disclosures about fair value measurements. This Statement establishes a fair value hierarchy about the assumptions used to measure fair value and clarifies assumptions about risk and the effect of a restriction on the sale or use of an asset. The standard is effective for fiscal years beginning after November 15, 2007. The Corporation has not completed its evaluation of the impact of the adoption of this standard.
FASB Interpretation No. 48, “Accounting for Uncertainty in Income Taxes - an interpretation of FASB Statement No. 109”
In July 2006, the FASB issued FASB Interpretation No. 48, “Accounting for Uncertainty in Income Taxes - an interpretation of FASB Statement No. 109” (FIN 48), which prescribes a recognition threshold and measurement attribute for a tax position taken or expected to be taken in a tax return. FIN 48 also provides guidance on derecognition, classification, interest and penalties, accounting in interim periods, disclosure and transition. FIN 48 is effective for fiscal years beginning after December 15, 2006. The Corporation has not completed its evaluation of the impact of adopting this standard.
FASB Emerging Issues Task Force Issue No. 06-4, “Accounting for Deferred Compensation and Postretirement Benefit Aspects of Endorsement Split-Dollar Life Insurance Arrangements”
In September 2006, the FASB Emerging Issues Task Force finalized Issue No. 06-4, “Accounting for Deferred Compensation and Postretirement Benefit Aspects of Endorsement Split-Dollar Life Insurance Arrangements”. This issue requires that a liability be recorded during the service period when a split-dollar life insurance agreement continues after participants’ employment or retirement. The required accrued liability will be based on either the post-employment benefit cost for the continuing life insurance or based on the future death benefit depending on the contractual terms of the underlying agreement. This issue is effective for fiscal years beginning after December 15, 2007. The Corporation has determined that adoption of EITF 06-4 will not have a material impact on the financial statements.
FASB Emerging Issues Task Force Issue No. 06-5, “Accounting for Purchases of life Insurance - Determining the Amount That Could Be Realized in Accordance with FASB Technical Bulletin No. 85-4 (Accounting for Purchases of Life Insurance)”
In September 2006, the FASB Emerging Issues Task Force finalized Issue No. 06-5, “Accounting for Purchases of Life Insurance -Determining the Amount That Could Be Realized in Accordance with FASB Technical Bulletin No. 85-4 (Accounting for Purchases of Life Insurance)”. This issue requires that a policyholder consider contractual terms of a life insurance policy in determining the amount that could be realized under the insurance contract. It also requires that if the contract provides for a greater surrender value if all individual policies in a group are surrendered at the same time, that the surrender value be determined based on the assumption that policies will be surrendered on an individual basis. Lastly, the issue discusses whether the cash surrender value should be discounted when the policyholder is contractually limited in its ability to surrender a policy. This issue is effective for fiscal years beginning after December 15, 2006. The Corporation does not believe the adoption of this issue will have a material impact on the financial statements.
Note 21. QUARTERLY FINANCIAL DATA (Unaudited)
The following table contains quarterly financial data for the years ended December 31, 2006 and 2005 (Dollars in thousands).
| | | First Quarter | | Second Quarter | | Third Quarter | | Fourth Quarter | | Total | |
Year ended December 31, 2006: | | | | | | | | | | | |
| Interest income | | $ | 6,984 | | $ | 7,334 | | $ | 7,793 | | $ | 7,889 | | $ | 30,000 | |
| Interest expense | | | 2,307 | | | 2,572 | | | 2,928 | | | 3,109 | | | 10,916 | |
| Net interest income before provision for loan losses | | | 4,677 | | | 4,762 | | | 4,865 | | | 4,780 | | | 19,084 | |
| Provision for loan losses | | | 50 | | | 110 | | | 90 | | | 14 | | | 264 | |
| Net interest income after provision for loan losses | | | 4,627 | | | 4,652 | | | 4,775 | | | 4,766 | | | 18,820 | |
| Noninterest income | | | 870 | | | 1,032 | | | 983 | | | 1,304 | | | 4,189 | |
| Noninterest expense | | | 3,778 | | | 3,863 | | | 3,868 | | | 4,120 | | | 15,629 | |
| Net income before income tax expense | | | 1,719 | | | 1,821 | | | 1,890 | | | 1,950 | | | 7,380 | |
| Federal and state income tax expense | | | 610 | | | 654 | | | 665 | | | 698 | | | 2,627 | |
| Net income | | $ | 1,109 | | $ | 1,167 | | $ | 1,225 | | $ | 1,252 | | $ | 4,753 | |
| Basic earnings per share | | $ | 0.22 | | $ | 0.23 | | $ | 0.25 | | $ | 0.25 | | $ | 0.95 | |
| Diluted earnings per share | | $ | 0.22 | | $ | 0.23 | | $ | 0.24 | | $ | 0.25 | | $ | 0.94 | |
| | | First Quarter | | Second Quarter | | Third Quarter | | Fourth Quarter | | Total | |
Year ended December 31, 2005: | | | | | | | | | | | |
| Interest income | | $ | 5,689 | | $ | 6,026 | | $ | 6,461 | | $ | 6,724 | | $ | 24,900 | |
| Interest expense | | | 1,287 | | | 1,547 | | | 1,847 | | | 2,008 | | | 6,689 | |
| Net interest income before provision for loan losses | | | 4,402 | | | 4,479 | | | 4,614 | | | 4,716 | | | 18,211 | |
| Provision for loan losses | | | 150 | | | 150 | | | 150 | | | 150 | | | 600 | |
| Net interest income after provision for loan losses | | | 4,252 | | | 4,329 | | | 4,464 | | | 4,566 | | | 17,611 | |
| Noninterest income | | | 649 | | | 896 | | | 854 | | | 841 | | | 3,240 | |
| Noninterest expense | | | 3,315 | | | 3,451 | | | 3,552 | | | 3,549 | | | 13,867 | |
| Net income before income tax expense | | | 1,586 | | | 1,774 | | | 1,766 | | | 1,858 | | | 6,984 | |
| Federal and state income tax expense | | | 582 | | | 635 | | | 607 | | | 680 | | | 2,504 | |
| Net income | | $ | 1,004 | | $ | 1,139 | | $ | 1,159 | | $ | 1,178 | | $ | 4,480 | |
| Basic earnings per share | | $ | 0.20 | | $ | 0.23 | | $ | 0.23 | | $ | 0.24 | | $ | 0.90 | |
| Diluted earnings per share | | $ | 0.20 | | $ | 0.23 | | $ | 0.23 | | $ | 0.23 | | $ | 0.89 | |