Exhibit 13

1
 | FINANCIAL HIGHLIGHTS |
| 2007 | 2006 | % CHANGE | ||||||||||
| FOR THE YEAR ENDED DECEMBER 31 | (Dollars in thousands, except per share amounts) | |||||||||||
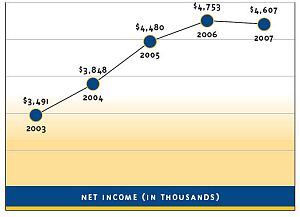
| Net income | $ | 4,607 | $ | 4,753 | -3.1 | % | ||||||
| Average shares outstanding | 5,294 | 5,272 | 0.4 | % | ||||||||
| Per common share | ||||||||||||
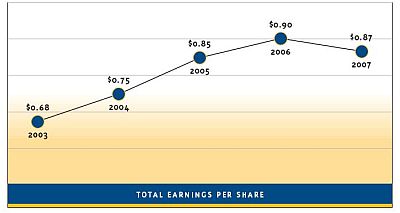
| Basic net income | 0.87 | 0.90 | -3.3 | % | ||||||||
| Diluted net income | 0.87 | 0.89 | -2.2 | % | ||||||||
| Cash dividends declared | 0.34 | 0.29 | 17.2 | % | ||||||||
| Book value at year end | 7.74 | 7.08 | 9.3 | % | ||||||||
| BALANCE SHEET DATA AT DECEMBER 31 | ||||||||||||
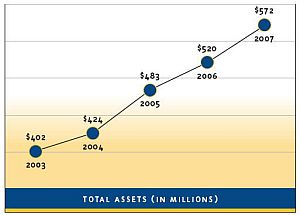
| Total assets | 571,905 | 519,749 | 10.0 | % | ||||||||
| Total gross loans | 420,147 | 369,544 | 13.7 | % | ||||||||
| Allowance for loan losses | 4,457 | 4,101 | 8.7 | % | ||||||||
| Total deposits | 472,299 | 434,223 | 8.8 | % | ||||||||
| Stockholders’ equity | 41,090 | 37,306 | 10.1 | % | ||||||||
| CONSOLIDATED RATIOS | ||||||||||||
| Return on average assets | 0.86 | % | 0.96 | % | -10.4 | % | ||||||
| Return on average equity | 11.76 | % | 13.41 | % | -12.3 | % | ||||||
| Tier 1 capital to average assets (leverage) | 8.56 | % | 8.85 | % | -3.3 | % | ||||||
| Tier 1 capital to risk-adjusted assets | 10.76 | % | 11.25 | % | -4.4 | % | ||||||
| Total capital to risk-adjusted assets | 11.77 | % | 12.28 | % | -4.2 | % | ||||||
All share data has been restated to include the effects of 5% stock dividends issued November, 2006 and November, 2007.
 |  |
| 2 0 0 7 A N N U A L R E P O R T – N E W H O R I Z O N S |
2
| | BOARD OF DIRECTORS |
STEWARDSHIP FINANCIAL CORPORATION AND ATLANTIC STEWARDSHIP BANK
| William C. Hanse, Esq., Chairman | John L. Steen | Abe Van Wingerden, Vice Chairman |
| Partner, Hanse & Hanse | President, Steen Sales, Inc. | President, Abe Van Wingerden Co., Inc. |
| President, Dutch Valley Throwing Co., Inc. | T/A Van Wingerden Farm s | |
| Harold Dyer | ||
| Retired | Robert J. Turner, Secretary | Michael A. Westra, CPA |
| Retired | General Manager, Wayne Tile Company | |
| Margo Lane | William J. Vander Eems | Howard R. Yeaton, CPA |
| Sales and Market Coordinator, | President, William Vander Eems, Inc. | Managing Principal, |
| PBI-Dansensor America, Inc. | Financial Consulting Strategies | |
| Paul Van Ostenbridge | ||
| Arie Leegwater | President and Chief Executive Officer, | |
| Retired | Stewardship Financial Corporation and | |
| Atlantic Stewardship Bank |

Standing left to right: Michael A. Westra, CPA; William J. Vander Eems; John L. Steen; Howard R. Yeaton, CPA; Abe Van Wingerden; Arie Leegwater; Margo Lane. Seated left to right: Paul Van Ostenbridge; William C. Hanse, Esq.; Harold Dyer; Robert J. Turner.
| S T E W A R D S H I P F I N A N C I A L C O R P O R A T I O N A N D S U B S I D I A R Y |
3
| | SFC JOINS THE NASDAQ |
STEWARDSHIP FINANCIAL CORPORATION BEGINS TRADING ON NASDAQ CAPITAL MARKET
On March 28, 2007, Stewardship Financial Corporation embarked upon a new horizon of another kind when its common stock began trading on the NASDAQ Capital Market under the symbol SSFN. We are delighted to reach this milestone in our history and believe that the NASDAQ Capital Market will provide more recognition and visibility for Stewardship Financial Corporation within the investment community. We look forward to increasing liquidity in our stock and thus enhancing value for our shareholders. |  | ||
 | Later in the year, on August 20, 2007, Paul Van Ostenbridge, Chief Executive Officer of Stewardship Financial Corporation presided over the NASDAQ Closing Bell Ceremony. To mark the occasion, the Stewardship Financial Corp-oration Board of Directors and members of the Atlantic Steward-ship Bank management team as well as several of the Bank’s found-ing fathers attended the ceremony which was broadcast live from the NASDAQ Marketsite in New York’s Times Square. | Paul Van Ostenbridge, CEO, Stewardship Financial Corporation and Atlantic Stewardship Bank, (center), rings the NASDAQ Closing Bell. | |
“We are deeply touched to receive your generous donation both for the gift itself but even more by the spirit behind it. Philanthropy is always more than welcome, but this displays a nobility of spirit that is unique. Thank you so very much. On behalf of ourselves, but even more on behalf of the many who will benefit from your generosity, thank you very much indeed.” Ralph Spencer, Executive Director Community Blood Services Foundation, Oradell, NJ | |||
| | NEW BUSINESS DEVELOPMENT BOARDS |
| BERGEN BOARD | James D. Vaughan III, Esq. | PASSAIC BOARD | SPECIAL APPRECIATION |
| Janyce Bandstra | David Visbeen | Vince Brosnan | We extend a heartfelt thank you to our friends and associates who successfully completed their terms as members of the Bank’s New Business Development Boards: Ruth Knyfd, Edward Nieuwenhuis, Jr., MD, and Benard W. Thomas, Jr. We greatly appreciate all of their efforts in promoting the Bank within the community and look forward to their continued support. |
| Richard Barclay | MORRIS BOARD | Ernest P. DeMarco, CPA | |
| Mark Borst Richard J. | Andreas Comodromos, | Shanti Jost | |
| Brady, Esq. Douglas | CPA Antonia Daughtry | Ruth Kuder | |
| Bushoven, CPA | David De Vries | Wayne R. Kuiken | |
| William R. Cook | Robert E. Fazekas | William A. Monaghan III, Esq. | |
| Paul D. Heerema | Gregory A. Golden | Mark D. Reitsma, CFP. | |
| Bartel Leegwater | Brian W. Hanse, Esq., CPA | Darryl Siss, Esq | |
| Paul Ruitenberg | Garrett A. Hoogerhyde, CPA | Clifford Vander May | |
| John Scoccola | Vernon Kuiken | Steve Van Der Stad | |
| Roger Steiginga | Edward Ramirez | Charles Verhoog | |
| Allen Stiles | Anita Van Wingerden | Ralph Wiegers |
| 2 0 0 7 A N N U A L R E P O R T – N E W H O R I Z O N S |
4
| | MESSAGE TO THE SHAREHOLDERS |
DEAR SHAREHOLDERS AND FRIENDS
As we reflect upon 2007, it was a year of New Horizons for Stewardship Financial Corporation and the Atlantic Stewardship Bank. The Corporation embarked upon many new endeavors, the most notable of which was its entry into the NASDAQ Capital Market. In early March of 2007, Stewardship Financial Corporation was approved to list its common stock shares on the NASDAQ Capital Market and on March 28, 2007 the stock began trading under the symbol SSFN. Listing on NASDAQ has pro-vided Stewardship Financial Corporation and the Atlantic Stewardship Bank more recognition and visibility in the investment community. As a result, Stewardship Financial Corporation was invited to preside over the NASDAQ Closing Bell Ceremony on August 20, 2007. The ceremony was broadcast live from the NASDAQ Marketsite in New York’s Times Square.
New Horizons were also realized as the Bank’s branch network expanded into three new locations, each providing a unique opportu-nity. In April, we opened our eleventh branch at 378 Franklin Avenue in Wyckoff, NJ. The branch, a new structure, built from the ground up, compliments the local architecture. We were well received by Wyckoff residents, attracting over $13 million in deposits as of Decem-ber 31, 2007. In September, the Bank ventured into a totally new ter-ritory, when we opened our twelfth branch in the town of Westwood. Located at the busy intersection of Kinderkamack Road and Jefferson Avenue, this branch gives us the chance to acquaint Westwood and the surrounding communities with the ASB brand of customer serv-ice. In December, we made our long awaited entry into North Hale-don, opening our thirteenth branch at 33 Sicomac Road. This location will bridge the gap between our Midland Park and Wayne locations allowing us to conveniently serve new, as well as, existing North Hale-don customers. Each new branch is full service offering drive-up bank-ing, an ATM, safe deposit boxes, a coin counting machine and a night drop.

Pictured from left to right: Edward Nieuwenhuis, Jr., MD, Atlantic Stewardship Bank Business Development Board Member; Raymond Santhouse, Midland Park Branch Manager; Jayne Press, Eastern Christian Children’s Retreat Executive Director; Darryl Siss, Esq., Eastern Christian Children’s Retreat Board Member.
Investments for the future will bring the Bank to the next level. We have strengthened our Business Development Team with seasoned professionals to assist us in penetrating the commercial market as well as cultivating business in new territories on the horizon.
In 2007, we introduced several new products and services each designed to fill a specific banking need. Our Genesis Account created especially for churches and 501 (c) (3) non-profit organizations reinforces our mission to serve as well as to tithe or give back to the community. When an organization invests its funds in the Genesis Account, it not only earns a competitive rate of return, it also helps build the pool of funds available to be tithed.
On the lending side, the Bank introduced the Quick Write Line of Credit. Designed especially for small business owners, the Quick Write Line of Credit features smaller loan amounts than our traditional Write Line of Credit, an attractive introductory rate, a three-year term and quick turn around time. For northern New Jersey homeowners look-ing for a readily available source of funds, we introduced a Fixed Rate Home Equity Line of Credit loan. The product offers the security of a fixed rate and the flexibility of a credit line. Features such as interest only payments for the first five years, no application fee, and inter-est charged only on the amount borrowed make this loan attractive.
Our new core computer system allowed us to reach yet another new horizon, real time processing. This provides real time access to account information, both online and through telephone banking. Transac-tions processed at the teller line or an ATM are posted to customer’s accounts as soon as they are made and reflected immediately online and through telephone banking.
| S T E W A R D S H I P F I N A N C I A L C O R P O R A T I O N A N D S U B S I D I A R Y |
5
2007 was a tumultuous year for the financial services industry as a whole. With the falling interest rate environment as well as other challenges continuing to place pressure on interest rate margins many financial institu-tions struggled to realize a profit. Steward-ship Financial Corporation and its subsidiary Atlantic Stewardship Bank is pleased to report that despite an initial impact on earnings we were still able to post a strong return on assets (ROA). The Return on Average Assets was 0.86% and the Return on Average Equity was 11.76% for the year ending December 31, 2007. Earnings per diluted share for the year-ended 2007 was $0.87.

Pictured from left to right: Amanda Bialy, Ridgewood Branch Manager; Monica Roers, YWCA Director; Diane Ingrassia, Hawthorne Branch Manager.
Stewardship Financial Corporation’s total assets reached $571.9 million at December 31, 2007, compared to $519.7 million at December 31, 2006, for growth of 10.0%. Total loans increased $50.6 million, or 13.7% from $369.5 million at December 31, 2006 to $420.1 million at December 31, 2007. Total deposits were $472.3 million at December 31, 2007, compared to $434.2 million a year ago, for an increase of 8.8%. Total stockhold-ers’ equity increased 10.1% to $41.1 million at December 31, 2007, compared to $37.3 million a year ago
“Your gift to Bethany Christian Services sustains many vital ministries, such as our Pregnancy Counseling Services, which: §Provide free counseling to men and women experiencing an unplanned pregnancy. §Give expectant parents information about all of their options, including the pro-life option of adoption. §Assist birthparents before, during and after the placement of their children into loving adoptive homes. On behalf of the thousands of individuals and families who have benefited from our Pregnancy Counseling Services, we thank you for your commitment to unborn children.” Nancy Dykstra-Powers Branch Director Bethany Christian Services Fair Lawn, NJ |
We continue to experience strong growth in our commercial and commercial real estate lending markets and are pleased to report that the Corporation is not involved in the sub prime mortgage market. Asset quality remains strong and the increases in the loan loss reserve directly correlate to the increase in loans. The management team recognizes that 2008 will also be challenging for community banks. The 2007 investment in business sales and service associates will enhance the Corporation’s earnings in the upcoming year and we are confident the new branches will positively impact earnings in future years.
In 2007, the Atlantic Stewardship Bank’s Tithing Program continued to expand its horizons giving $705,000 to more than 400 deserving organizations. Since the program’s inception, $5,735,000 in donations have been shared with local food banks as well as Chris-tian missions, schools, and health care facil-ities. The Bank recognizes the importance of local civic and non-profit organizations by supporting them with donations as well.
In closing we wish to thank our growing base of customers, for it is your funds on deposit at the end of the day that contribute to our ability to tithe and enable us to continue to give back to the community. Our success is made possible by the hard work and dedica-tion of all Bank associates, at every level of the organization. We are grateful to our shareholders for their loyal support of the Bank and its mission. Finally, we are most thankful to our Lord, Jesus Christ, who continues to guide us.
/s/ William C. Hanse, Esq. | /s/ Paul Van Ostenbridge |
| William C. Hanse, Esq. | Paul Van Ostenbridge |
| Chairman of the Board of Directors | President and Chief Executive Officer |
| 2 0 0 7 A N N U A L R E P O R T – N E W H O R I Z O N S |
6
| SHAREHOLDER INFORMATION |
The Annual Shareholders’ Meeting for the Stewardship Financial Corporation will be held at the Christian Health Care Center, 301 Sicomac Avenue, Wyckoff, New Jersey, on Tuesday, May 13, 2008, at 7:00 PM (please use the Mountain Avenue entrance). The Corporation had 994 Shareholders of Record on December 31, 2007.
Registrar and Transfer Company, 10 Commerce Drive, Cranford, NJ 07016, is the transfer agent for Stewardship Financial Corporation common stock. We invite you to contact them at 800-368-5948 should you wish to transfer stock or to join the Dividend Reinvestment Plan.
DIVIDEND REINVESTMENT PLAN
A total of 756 Shareholders currently par-ticipate in the Corporation’s Shareholder Div-idend Reinvestment Plan, representing 1,850,000 or 34.8% of all shares outstanding. Plan participants reinvest cash dividends to purchase new shares of stock at 95% of the market value, based on the most recent trades. Shareholders interested in joining the Dividend Reinvestment Plan may request a Plan Membership Form from the Registrar and Transfer Company.
ANNUAL REPORT
Stewardship Financial Corporation will pro-vide a copy of the Annual Report on Form 10K, free of charge to any shareholder upon written request, including the financial statements and schedules which have been filed with the Securities and Exchange Commission. Requests should be addressed to Stewardship Financial Corporation, Attn: Corporate Services, 630 Godwin Avenue, Midland Park, NJ 07432-1405.
CORPORATE GOVERNANCE
The Board of Directors’ Audit, Nominating and Compensation Committee Charters; as well as the Code of Ethical Conduct for Senior Financial Managers, are available for viewing at www.asbnow.com. Visit the “Home” page and refer to “Investor Relations” section. The above-mentioned information is also avail-able in print to shareholders requesting the same in writing.
“It is a pleasure to thank you for your recent contribution to our school. We appreciate your continued generosity and commitment to Calvary Christian Academy. Your interest and support of Christian education is to be commended. May God bless you with eternal rewards for blessing our school and making a difference in the lives of our student body. It is a privilege and an honor to do business with a company of such high character and Godly principles. Thanks again!” Thomas T. McGann, M.Ed. Principal Calvary Christian Academy Wayne, NJ |
RECENT HISTORY OF DIVIDENDS PAID
The Board of Directors of the Stewardship Financial Corporation is pleased to pay, on February 1, 2008, a quarterly dividend to Shareholders of Record on January 15, 2008, in the amount of $0.09. Future dividends are expected to be paid on May 1, August 1, and November 1, subject to Board approval.
| November 15, 2007 | 5% stock dividend | |||
| November 1, 2007 | $ | 0.09 | ||
| August 1, 2007 | $ | 0.09 | ||
| May 1, 2007 | $ | 0.08 | ||
| February 1, 2007 | $ | 0.08 | ||
| November 15, 2006 | 5% stock dividend | |||
| November 1, 2006 | $ | 0.08 | ||
| August 1, 2006 | $ | 0.07 | ||
| May 1, 2006 | $ | 0.07 | ||
| February 1, 2006 | $ | 0.07 | ||
| S T E W A R D S H I P F I N A N C I A L C O R P O R A T I O N A N D S U B S I D I A R Y |
7
| OUR 2007 TITHING PROGRAM |
EACH ONE SHOULD USE WHATEVER GIFT HE HAS RECEIVED TO SERVE OTHERS, FAITHFULLY ADMINISTERING GOD’S GRACE IN ITS VARIOUS FORMS.
1 PETER 4:10
What makes Atlantic Stewardship Bank unique is the fact that every year the Bank gives away 10% of its pre-tax earnings. The Bank was founded on the Biblical Old Testament tenet of tithing or giving back one tenth to God. Each year, Atlantic Stewardship Bank tithes, or shares ten percent of its pre-tax earnings with Christian and local non-profit organizations selected by the Board of Directors. The original founders of the Bank were so deeply committed to this concept, that the Tithing Program defines our mission and is part of our corporate-by-laws. In 2007, the Bank’s tithe was $705,000 enabling it to share with over 400 recipients. Since the program’s inception, Atlantic Stewardship Bank has distributed $5,735,000 in total tithe donations. We thank God for His continued blessings which allow us to reach new horizons each year, and for our ever-growing loyal customer base. |  |
Pictured from left to right: Richard Densel, Midland Park Assistant Branch Manager; Douglas Prol, Trinity Christian School Principal; Judi Rothwell, Montville Branch Manager. | |
“On behalf of everyone at the Center for Food Action, we want to express our appreciation for your generous donation which will enable the staff and volunteers at our pantries in Englewood, Mahwah, Hackensack, Elmwood Park, Carlstadt, Palisades Park, Ringwood and Fairview to continue to offer a helping hand to those whose lives are in crisis. Residents from 65 towns in Bergen County, 21 towns in Passaic County and several towns in Morris County turned to CFA, and thanks to the generosity of donors like you, we were able to help. Your support will help fill many needs; thank you again.” Patricia Espy Executive Director Center for Food Action Englewood, NJ |  |
| Pictured from left to right: Donald Klingen, Hawthorne Christian Academy Principal; Margo Lane, Atlantic Stewardship Bank Director; Paul Vernarchik, Student; Laura Ibach, Student; John Ubu, Student; Paul Van Ostenbridge, CEO, Atlantic Stewardship Bank. |
| 2 0 0 7 A N N U A L R E P O R T – N E W H O R I Z O N S |
8
WE ARE PLEASED TO HAVE ASSISTED THE FOLLOWING ORGANIZATIONS WITH OUR 2007 TITHE DISTRIBUTION
*Africa Inland Mission *American Christian School *The Back to God Hour *Baptist Haiti Mission *Bergen County Society *Bessie Green Community *Bethany Christian Services of New Jersey *Blessed Sacrament School *Calvary Christian Academy *Calvin College *Calvin Theological Seminary *Care-A-Lot Christian Nursery School *Cary Christian Center *Cathedral Choir *Catholic Charities *Christian Health Care Center *Christian Reformed World Relief Committee *Christian Schools International *CUMAC *Dawn Treader Christian School *Don Bosco Prep High School *Eastern Christian Children’s Retreat *Eastern Christian School Association *Elim Christian Services *Eva’s Village *Faith Ministries of White Lake, NY *Father’s Cupboard *Fellowship Homes *Fig Orchard *First Choice Women’s Resource Centers *Florence Christian Home *Friendship Ministries *Gideons International Lakeland Camp *Gideons International Passaic Valley Camp *Gideons International Paterson Camp *Gideons International Ramapo Camp *Good Shepherd Mission *Goshen Christian School *Grace Counseling Ministries *Habitat for Humanity of Bergen County *Harvest Outreach Ministries *Hawthorne Christian Academy *Hawthorne Ecumenical Council – Crop Walk *Hawthorne Ecumenical Social Service Fund – Food Pantry *Holland Christian Home *Hope Haven | *Northside Community Christian Reformed Church – Day Camp *Oasis Haven for Women and Children *Operation Double Harvest – Haiti *Paterson Habitat For Humanity *Preakness Baptist Church Group Workcamp *Prison Fellowship Ministries *Prison Fellowship Ministries – Angel Tree Program *Puritan Reformed Theological Seminary *Ridgewood YMCA *Ringwood Christian School *Ron Hutchcraft Ministries *St. Anthony’s School *St. Augustine Presbyterian Church – Multi Service Center *St. Elizabeth’s Interparochial School *St. Joseph’s Regional Medical Center *St. Joseph’s Wayne Hospital *St. Luke Community Development Center *St. Paul’s Community Development Corp. *St. Philip’s Camp Youth Development Program and Coffee Pot Ministry *St. Pius X School *The Salvation Army – Paterson Branch *Siena Village at Wayne *Sonshine Christian Academy *Star of Hope Ministries, Inc. *Strategic Prayer Command *Sussex Christian School *Teen Challenge of NJ *Touch The World Ministries *Trinity Christian School *United Paterson Development Corporation – After School Literacy and Safe Space Programs *Unity Christian Reformed Church After School Program *Veritas Christian Academy *Waldwick Seventh Day Adventist School *Wayne Interfaith Network *Western Theological Seminary *Westminster Theological Seminary *World For Christ Crusade *Wyckoff Christian Pre-School *Wyckoff Family YMCA *Wyckoff Reformed Church Food Pantry *YWCA of Bergen County *Zion Community Development Corporation | |
“Thank you for again including us in your Tithing Program. We are truly grateful to have such generous and faithful friends as we do in Atlantic Stewardship Bank. We always look forward to furthering our mission of putting Christian principles into practice through programs that build healthy spirit, mind and body for all. We are proud to build strong kids, strong families and strong communities and are truly blessed with a wonderful staff and members. Thank you again for your support.” Richard J. Clayton Chief Executive Officer Ridgewood YMCA Ridgewood, NJ | ||
*Hope House *International Networx *King’s Kids Pre-school and Daycare *Kuyper College *Lancaster Bible College *Life Givers Network *Lighthouse Pregnancy Resource Center *Little Sisters of the Poor and St. Joseph’s Home for the Elderly *Lord’s Day Alliance of NJ *The Luke Society *Madison Avenue Baptist Academy *Madison Avenue Crossroads Community Ministries *Mary Help of Christians Academy *Mid Atlantic Ministries *Mississippi Christian Family Services *Mt. Hope Camp *Mustard Seed School *Netherlands Reformed Christian School *New City Kids *New Hope Community Development Center *New Hope Community Ministries *New Jersey Family Policy Council *Northeast Community Transformation *North Jersey Home Schoolers Association |
| S T E W A R D S H I P F I N A N C I A L C O R P O R A T I O N A N D S U B S I D I A R Y |
9
ADDITIONALLY, THE BANK HAS PROVIDED SUPPORT THROUGHOUT 2007 TO THE FOLLOWING ORGANIZATIONS
Allendale/Waldwick PBA Local #217 American Labor Museum American Legion Auxiliary American Red Cross Bergen-Hudson Chapter American Special Children’s Pilgrimage Group *Armenian Presbyterian Church Golf Outing Avon Walk for Breast Cancer Bergen County Housing Coalition Bergen County Summer Campership Fund Bergen County United Way – Warm Homes Program Bergen County Wildcats Special Olympics Program Bergen Highlands Rotary Club Bergen Philharmonic Orchestra *Bethlehem Lutheran Church Upward Christian Basketball League Boonton Food Pantry Boys & Girls Club of Hawthorne Boys & Girls Club of Northwest NJ Boys & Girls Club of Paterson Boy Scouts of America Northern NJ Council Boy Scout Troup #93 of Hawthorne Camp Hope of Hackensack Candigas Women’s Choir Center for Food Action Childhood Cancer Society Children’s Aid & Family Services Chilton Memorial Hospital *Christian Overcomers Cody’s Foundation Community Blood Services Foundation Community Housing in Partnership (CHIP) Community Meals *Concerts of Prayer – Greater New York Co-Operative Nursery School of Ridgewood Creative Living Counseling Center Cystic Fibrosis Foundation | DACKKs Group for Supportive Housing Daikona Fund of the Greek Orthodox Metropolis of NJ Danny Affilitto Memorial Scholarship Fund Deborah Hospital Foundation *Dedication Evangelism *Department for Persons with Disabilities C.A.R.E. *DePaul Catholic High School Drug Awareness Council (DAC) of Montville *Emergency Food Coalition of Passaic County *Emmanuel Baptist Church – Women of Emmanuel Emmanuel Cancer Foundation *Faith Chapel Reformed Church Youth Ministry Forum School Foundation for Free Enterprise Foundation for the Handicapped Friends of the Hermitage Friends of the Louis Bay 2nd Library Friends of the Midland Park Library Frost Valley YMCA Garfield UNICO Gift of Life – Abbott & Caserta Realtor Golf Outing Gift of Life – Rotary Clubs in District 7490 Girl Scout Council of Bergen County Glen Rock Central Business District Commission *Goodwill Rescue Mission *Grace United Methodist ChurchNursery School Hawthorne Baseball/Softball Association Hawthorne Board of Health – Food Pantry Haledon Borough – Haledon Centennial Hawthorne Caballeros Hawthorne Chamber of Commerce Hawthorne Community Library Foundation | Hawthorne Cubs Football Association Hawthorne Domestic Violence Response Team Hawthorne Education Foundation Hawthorne Fall Baseball Hawthorne Fire Department *Hawthorne Gospel Church – Ecuador Mission Trip Hawthorne High School Hawthorne High School PTO Hawthorne High School – Share Hawthorne Knights of Columbus Hawthorne Lions Club Hawthorne PBA Local #200 Hawthorne Rotary Club Hawthorne Soccer Association Hawthorne Special Recreation Hawthorne – Thomas Jefferson School PTO Hawthorne VFW District #1 Hawthorne Volunteer Ambulance Corps Hawthorne – Washington School PTO Healing the Children Midlantic *Hispanic Multi-Purpose Service Center Hoboken International Film Festival *Holy Spirit School *Home Bound Ministries Hope for the Warriors for Corporal Visnu Gonzalez Hudson Milestones *Interchurch Softball League Jamboree Scholarship Fund Jerry Speziale Community Outreach Foundation Jewish Family & Children’s Service of Wayne Juvenile Diabetes Research Foundation Leukemia & Lymphoma Society The Love Fund of Midland Park The Love Fund of Wyckoff Mahwah Youth Sports Boosters Marge and Debra Shortway Foundation Memorial Day Nursery | Memorial Sloan-Kettering Cancer Center Michael Coppola Fundraiser Midland Park Ambulance Corps Midland Park Baseball Association Midland Park Chamber of Commerce Midland Park High School Midland Park Junior Football andCheerleading Association Midland Park Lions Club Midland Park PBA Midland Park Public Education Foundation Midland Park Volunteer Fire Company Mike Geltrude Foundation Mohawk Athletic Club of Hawthorne Molly Foundation for Juvenile Diabetes Montclair State University Montville Baseball/Softball Association Montville Chamber of Commerce Montville Educational Foundation Montville Kiwanis Club Montville Township First Aid Squad Montville Township Fourth of July Committee Montville Township High School Ice Hockey Montville Township High School Parent Teacher Council Montville Township Library Foundation Montville Township Literacy Foundation Montville Township PBA Montville Township Social Services Montville Volunteer Ambulance Corps *Mount Bethel Baptist Church – MLK, Jr. Day New Bridge Services New Jersey Citizen Action New Jersey Citizen Action Education Fund |
| 2 0 0 7 A N N U A L R E P O R T – N E W H O R I Z O N S |
10
New Jersey Community Development Corporation New Jersey State Fireman’s Association of Paterson New Jersey State Organization of Cystic Fibrosis North Jersey Chorus *North Jersey Home Schoolers Association Choral Program North Stars Association for Competitive Gymnastics Operation Smile Order of the Lamp Scholarship Fund *Our Lady of Consolation Church Youth Ministry *Our Lady of the Valley School Paramus Association for Competitive Gymnastics Partners in Pride *Partners Worldwide Passaic County Bar Association Passaic County Council on Alcohol and Drug Abuse Passaic County Historical Society Passaic Valley Fraternal Order of Police Lodge #181 *Paterson Assembly of God – Walk for Health Awareness *Paterson Gospel Church – Girls Way Out Program Paterson Rotary *Paterson YMCA Pequannock Street Fair Pequannock Township First Aid and Rescue Squad Pequannock Township Food Pantry Pequannock Township High School Marching Band Pequannock Township Little League Pequannock Township PBA Local #172 Pequannock Township Public Library Pequannock Township Regional Chamber of Commerce Pequannock Township Volunteer Fire Department Engine Co. #1 Pequannock Township Volunteer Fire Department Engine Co. #2 | Pequannock UNICO Project Heartbeat Project Lovematch *Project Timothy Prospect Park Volunteer Fire Department Push to Walk Ramapo-Bergen Animal Refuge, Inc. Ramapo Boosters Association Ramapo High School Ridgewood Baseball and Softball Association Ridgewood Biddy Basketball Ridgewood Boys Lacrosse Association Ridgewood Downtown for the Holidays Ridgewood Education Foundation Ridgewood Emergency Services Ridgewood Fire Department Association Ridgewood Fourth of July Committee Ridgewood High School Band Association Ridgewood High School Football Scholarship Committee Ridgewood PBA Local #20 Ridgewood Rotary Clubs Ridgewood Singers Ridgewood Softball Ridgewood Woman’s Club Robert P. Giaimo Memorial Fund Rodland Memorial Scholarship Fund Roy A Freitag Memorial Post 1049 Royal Family Kids Camp Ruth Estrin Goldberg Memorial *St. Joseph Church – One Heart for Haiti *St. Leon Armenian Church Youth Programs *St. Luke Parish – Operation Chillout *St. Nicholas Church Outreach Programs *St. Spyridon Church Restoration Program Share Housing Association for Ridgewood and Environs (SHARE) | Shomrei Torah – Wayne Congregation Shrine Circus Social Service Association of Ridgewood and Vicinity Somerville-Hawes Dads’ Night Sons of the American Legion Post Special Projects for Underprivileged and Disabled Suburban Woman’s Club of Pompton Plains Summit Speech School Team Luke Temple Israel Tomorrow’s Children’s Fund Torpedoes Soccer Club Towaco – Cedar Hill School – Home and School Association Towaco Civic Association Tri County Chamber of Commerce – Wayne *Turning Point UFC Bergen Bike Tour *United Methodist Church Mission Programs – Wayne Valley Hospital Veritans Camp Waldwick Baseball Association Waldwick Boy Scout Troop #99 Waldwick Community Alliance Waldwick Fire Department Waldwick High School Waldwick High School Booster Club Waldwick High School Music Parents Association Waldwick – Julia A. Traphagen School PSO Waldwick Lions Club Waldwick PBA Waldwick Public Library Waldwick Recreation Trust Fund Waldwick Soccer Association Waldwick Volunteer Ambulance Corps Wayne Adult Community Center Wayne – Albert Payson Terhune School PTO Wayne – Community Volunteer Fire Company #1 | Wayne Counseling and Family Services Wayne Day Wayne Elks Lodge #2181 Wayne Hills High School Wayne Hills High School Band Boosters Wayne Hockey Club Wayne – James Fallon Elementary School PTO Wayne – Lafayette Elementary School PTO Wayne Lions Club Wayne Little League Wayne Little League – NJ District 2 Wayne Police Athletic League Wayne PBA Local 136 Wayne – Pompton Falls Volunteer Fire Department #3 Wayne – Preakness Volunteer Fire Company #4 Wayne Public Library Wayne Rotary Club Wayne – Schuyler Colfax Middle School PTO Wayne Township Memorial First Aid Squad Wayne Township Parks and Recreation Department Wayne Valley High School PTO West Bergen Mental Healthcare Westwood Cares Westwood Home for the Holidays Westwood Volunteer Ambulance Corps William Paterson University Wyckoff – Calvin Coolidge School PTO Wyckoff Education Foundation Wyckoff Fire Department Wyckoff Fire Department Ladies Auxiliary Wyckoff-Midland Park Rotary Club Wyckoff Volunteer Ambulance Corps YM-YWHA of North Jersey Youth Consultation Service *Zion Lutheran School Zonta Club of Northern Valley * Denotes Christian Charity |
| S T E W A R D S H I P F I N A N C I A L C O R P O R A T I O N A N D S U B S I D I A R Y |
11
| | 2007 TITHING PROGRAM RECIPIENTS |
The Atlantic Stewardship Bank is pleased to feature two outstanding organizations that serve the Bank’s local communities. It is an honor for us to help support their work.
OASIS: A HAVEN FOR WOMEN AND CHILDREN
PATERSON, NJ – WWW.OASISNJ.ORG

Oasis is a nonprofit organization dedicated to assisting impoverished families who strive to achieve economic independence by providing educational programs to equip mothers and their children with the skills they need to become self-sufficient. Oasis provides “a hand up, not a hand out” by offering Adult Education classes for women and Educational Pro-grams in an After School Program for at-risk youth in the Paterson community, completely free of charge. All pro-grams are designed to help these families succeed in the work-place and in the public education system. Support services, including food, clothing, and preschool care, are provided enabling their adult woman students to focus on their education. It is Oasis’s goal to eradicate intergenerational poverty by assisting the poorest most vulnerable members of our community, the women and children.


Standing: Tyler Boucher, Blanca Boucher and Pastor Jeffrey Boucher. Seated: Zachary Boucher and Erin Perna.
TOUCH THE WORLD MINISTRIES
ALLENDALE, NJ – WWW.TOUCHTHEWORLD.ORG
Founded in 1990, Touch the World Ministries, purpose was, and continues to be, to give young people the opportunity to experience God. In direct response to parents who were concerned about the static faith of their children, founder, CEO and pastor, Jeff Boucher set out with a team of teens to the Six Nations Indian Reserve in Ontario, Canada. Their mission was simple; to build two cabins to house Native American children suffering from difficult circumstances. The team achieved their construction goal in 17 days, but also managed to accomplish much more. The greater goal was to give the team members an experience with God and the results were farther reaching than initial expectations. Every teen returned from that trip with a new relationship with God. Immediately following the team’s return from that first trip, more than 30 adults volunteered their service after seeing the internal changes in the returned team members. Thus Touch the World Ministries was born.
God continued to bless TTW in the years that followed, with the organization growing rapidly; hiring on its first full time employee in 1993. From then on, Touch the World began to take shape and turn into the organization that it is today.
Today, Touch the World has full time staff members in Japan, Uganda, Cuba, Scotland, and the USA. The heartbeat of TTW is still missions and discipleship, but in recent years has expanded to include Parent Ministries, a full service café, a skateboarding park and much more. All Touch the World endeavors seek to bring people, particularly young people, into a closer relationship with God our Creator and Savior
| 2 0 0 7 A N N U A L R E P O R T – N E W H O R I Z O N S |
12
| CUSTOMER CORNER |
The Atlantic Stewardship Bank is known throughout northern New Jersey not only for its unique tithing program, but also for delivering exceptional customer service. We realize that happy, satisfied cus-tomers allow the Bank to continue to grow and fulfill its mission. Each year we take this opportunity to feature a few of our loyal customers.

“We bank at Atlantic Stewardship Bank because of their faithful support of local charitable, civic, and religious organizations. During the last 20 years, they have donated more than $5,000,000 – 10% of their profits – to help over 400 neighborhood organizations continue their community outreach. As owners of the Vander Plaat Funeral Home of Wyckoff, a family business founded in 1805, we applaud and appreciate their commitment to the community.”
Bill and Linda Brock
Vander Plaat Funeral Home
Wyckoff, NJ

“Our family has a three-generation history with Atlantic Stewardship Bank. I worked in the Midland Park branch of ASB for 3-1/2 years before my sons, George and Sam, were born and I came to know and respect them for their generosity and fairness. Their customers regard them in the same way as their employees do.
Ever since the Bank was formed in 1985, my father-in-law, Luis Rojas and my husband George, have been faithful friends and supporters. Our accounting and mortgage services company, Prospect Park Financial Services, does all of its business banking with ASB. The bank is like a family to us, where you can feel at home and have a relation-ship that benefits all of your personal and business needs. In an ever-changing world, it is good to know that the stability and strength of Atlantic Stewardship Bank will be supporting the future goals of the Rojas family.”
Anita Rojas
North Haledon, NJ
| S T E W A R D S H I P F I N A N C I A L C O R P O R A T I O N A N D S U B S I D I A R Y |
13
| BRANCH NETWORK EXPANDS |
During 2007, Atlantic Stewardship Bank opened three new branch offices, each featuring an ATM, coin counting machine, safe deposit boxes, night drop, and the ASBean Coffee Counter.
WYCKOFF
378 Franklin Avenue, Wyckoff, NJ 07481
Opened in April of 2007, the Wyckoff office was built to serve the needs of our existing Wyckoff customer base as well as to attract new customers. The residents of Wyckoff are quite impressed with our building and our products and services as demonstrated by the steady growth of deposits.
WESTWOOD
200 Kinderkamack Road, Westwood, NJ 07675
Opened in September of 2007, the Westwood office was totally renovated inside and out. Located at a busy intersection on the main thoroughfare, we have high hopes for our entry into this new market.
NORTH HALEDON
33 Sicomac Road, North Haledon, NJ 07508
Opened in December of 2007, the North Haledon office bridges the gap between our Midland Park and Wayne offices. This office allows us to more conveniently serve our existing North Haledon customer base while attracting new customers. We look forward to our Grand Opening Celebration planned for the Spring of 2008.
“I would like to take this opportunity to thank Atlantic Stewardship Bank for their recent donation to the Forum School. This contribution will be used to expand the programs we offer to our special children. Such thoughtfulness is greatly appreciated. I would also like to thank you for your exceptional help with all of our banking needs. It is always a pleasure to deal with you and the Waldwick office.” Steven Krapes, Ed.D., Director, The Forum School, Waldwick, NJ |

Atlantic Stewardship Bank’s Wyckoff office.
| 2 0 0 7 A N N U A L R E P O R T – N E W H O R I Z O N S |
14
| OFFICERS |
STEWARDSHIP FINANCIAL CORPORATION OFFICERS William C. Hanse, Esq. Chairman of the Board of Directors Abe Van Wingerden Vice Chairman of the Board of Directors Paul Van Ostenbridge President and Chief Executive Officer Robert J. Turner Secretary Julie E. Holland Senior Vice President and Treasurer Timothy G. Madden Senior Vice President Angela P. Turi Vice President Mary Beth Steiginga Assistant Secretary | ATLANTIC STEWARDSHIP BANK OFFICERS Paul Van Ostenbridge President and Chief Executive Officer Julie E. Holland Senior Vice President and Treasurer Timothy G. Madden Senior Vice President Robert C. Vliet Senior Vice President M. Bernard Joustra Vice President Rene Miranda Vice President Douglas Olsen Vice President Cynthia A. Perrotta Vice President Richard D. Powers Vice President Raymond J. Santhouse Vice President | Gail K. Tilstra Vice President Angela P. Turi Vice President David J. Van Lenten Vice President Alma M. Baxter Assistant Vice President Karen Bulley Assistant Vice President Janet Decker Assistant Vice President Richard Densel Assistant Vice President Diane Ingrassia Assistant Vice President John S. Krantz Assistant Vice President Nicholas Latora Assistant Vice President Thomas A. Maselli Assistant Vice President James O’Brien Assistant Vice President Louise Rohner Assistant Vice President | Amanda Bialy Assistant Secretary Yanet Cordero de Marti Assistant Secretary Richard P. Cuneo Assistant Secretary Ellie King Assistant Secretary Grace Lobbregt Assistant Secretary Michael Mangine Assistant Secretary Kelly Nienhouse Assistant Secretary Kristine Rasile Assistant Secretary Judi Rothwell Assistant Secretary Mary Beth Steiginga Assistant Secretary Tonni von Schaumburg Assistant Secretary Barbara S. Vincent Assistant Secretary Peggy Weber Assistant Secretary Virginia M. Lowe Compliance Officer John Lindemulder Administrative Assistant Larry Marra Administrative Assistant Amy Miller Administrative Assistant Jean M. Schaver Administrative Assistant William J. Tussi Administrative Assistant Joan Van Houten Administrative Assistant Kenneth C. Wehinger Administrative Assistant |
 | |||
| S T E W A R D S H I P F I N A N C I A L C O R P O R A T I O N A N D S U B S I D I A R Y |
15
| STEWARDSHIP FINANCIAL CORPORATION |
Prior to the establishment of the Stewardship Financial Corporation holding company, the stock was originally issued in the name of Atlantic Stewardship Bank. The initial offering required a minimum purchase of 200 shares at the price of $10 per share.
The Corporation declared its first cash dividend in 1990 and cash dividends have been paid annually. To assist interested shareholders in purchasing additional shares of stock, The Board of Directors introduced a Dividend Reinvestment Plan in 1994.
We are pleased to report the original investment of $2,000 was worth $31,163 as of year-end 2007 when the assumption was made that the shareholder took advantage of the Dividend Reinvestment Plan; stock splits as well as stock dividends. The twenty-two year return to the original investor is 13.55%.

Pictured from left to right: William C. Hanse, Esq., Chairman of the Board of Directors; Jacob and Milvi Vander Eems; and Paul Van Ostenbridge, CEO, Atlantic Stewardship Bank, attend the Wyckoff Branch evening reception.
“Thank you for your donation to the Emergency Food Coalition of Passaic County. For every four dollars that you gave we were able to purchase enough grocery meals to feed each needy person who came to us for a week. Most of our clients are families and many are working poor barely able to afford their rent. Thank you for your thoughtfulness and your support. From the staff and members of the EFC, I wish you the very best in 2008.” William P. Long Coordinator Emergency Food Coalition of Passaic County Paterson, NJ |
CORPORATE ATTORNEYS
Stewardship Financial Corporation
McCarter & English, LLP Attorneys at Law 4 Gateway Center Newark, NJ 07102 973-622-4444
Atlantic Stewardship Bank
Hanse & Hanse 2035 E. Hamburg Turnpike Wayne, NJ 07040 973-831-8700
STEWARDSHIP FINANCIAL CORPORATION
We are proud to advise the following brokers make a market in Stewardship Financial Corporation stock:
Keefe, Bruyette & Woods
787 Seventh Avenue, 4th Floor New York, NY 10019 212-887-7777
Sandler O’Neill & Partners, L.P.
919 Third Avenue, 6th Floor New York, NY 10022 800-635-6851
Stifel, Nicolaus & Company, Inc.
18 Columbia Turnpike Florham Park, NJ 07932 800-793-7226
TRANSFER AGENT REGISTRAR AND DIVIDEND REIMBURSEMENT AGENT
To report a change of name or address, or a lost stock certificate or dividend check, contact:
Registrar and Transfer Company
10 Commerce Drive Cranford, NJ 07016 800-368-5948 www.rtco.com
Shareholder Relations Stewardship Financial Corporation Corporate Division 201-444-7100 www.asbnow.com
| 2 0 0 7 A N N U A L R E P O R T – N E W H O R I Z O N S |
16
| BRANCH LOCATIONS AND STAFF |
HEADQUARTERS – MIDLAND PARK
630 Godwin Avenue
Raymond J. Santhouse
Branch Manager, Vice President & Regional Manager
Richard Densel
Assistant Branch Manager & Assistant Vice President
HAWTHORNE
1111 Goffle Road
George Kotevski
Branch Operations Manager
HAWTHORNE
386 Lafayette Avenue
Diane Ingrassia
Branch Manager, Assistant Vice President & Regional Manager
Grace Lobbregt
Assistant Branch Manager & Assistant Secretary

Tom Maselli, Wyckoff Branch Manager, presents prizes to the winners of the Wyckoff Branch Grand Opening Coloring Contest.
MONTVILLE
2 Changebridge Road
Judi Rothwell
Branch Manager & Assistant Secretary
NORTH HALEDON
33 Sicomac Road
Thomas A. Maselli
Branch Manager & Assistant Vice President
Linda Martin
Branch Operations Manager
PEQUANNOCK
249 Newark-Pompton Turnpike
Louise Rohner
Branch Manager & Assistant Vice President
Kristine Rasile
Assistant Branch Manager & Assistant Secretary
��
“On behalf of all the staff here at Wyckoff Christian Preschool and Kindergarten, we want to thank you for the very generous gift that has been given to us from your Tithing Program. Our preschool offers programs for children from 2-1/2 to 6 years old. Your very generous gift will be used to purchase additional computer equipment for the classrooms.” Rose Barrett Administrative Director Wyckoff Christian Preschool & Kindergarten Wyckoff, NJ |
RIDGEWOOD
190 Franklin Avenue
Amanda Bialy
Branch Manager & Assistant Secretary
Catherine Bobadilla
Assistant Branch Manager
WALDWICK
64 Franklin Turnpike
Kelly Nienhouse
Branch Manager & Assistant Secretary
Michelle Albert
Assistant Branch Manager
WAYNE
400 Hamburg Turnpike
Douglas Olsen
Branch Manager, Vice President & Regional Manager
Amy Miller
Assistant Branch Manager & Administrative Assistant
WAYNE HILLS
87 Berdan Avenue
John Lindemulder
Branch Manager & Administrative Assistant
WAYNE VALLEY
311 Valley Road
Richard P. Cuneo
Branch Manager & Assistant Secretary
WESTWOOD
200 Kinderkamack Road
Barbara S. Vincent
Branch Manager & Assistant Secretary
WYCKOFF
378 Franklin Avenue
Thomas A. Maselli
Branch Manager & Assistant Vice President
Joan Van Houten
Assistant Branch Manager & Administrative Assistant
| S T E W A R D S H I P F I N A N C I A L C O R P O R A T I O N A N D S U B S I D I A R Y |
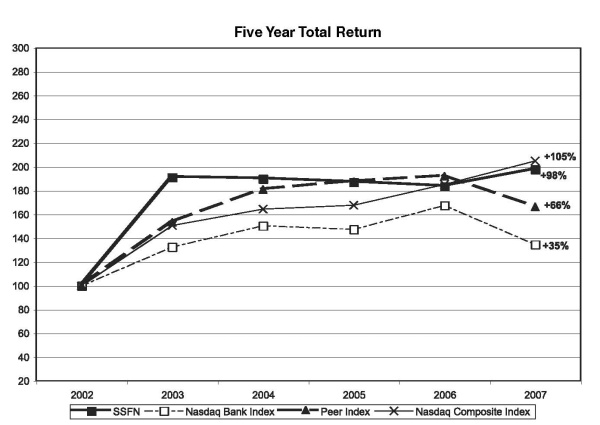
STEWARDSHIP FINANCIAL CORPORATION AND SUBSIDIARYSTOCK PERFORMANCE GRAPH
The following graph compares the cumulative total return on a hypothetical $100 investment made on December 31, 2002 in: (a) Stewardship Financial Corporation’s common stock; (b) Nasdaq Bank Index; (c) Peer index; and Nasdaq Composite Index. The Peer index consists of ten banks located in New Jersey and Pennsylvania with total asset size and operating performance comparable with the Corporation. The peer group consists of 1st Constitution Bancorp, BCB Bancorp, Inc., Central Jersey Bancorp, Codorus Valley Bancorp, Inc., Community Bank of Bergen County, Mid Pen Bancorp, Somerset Hills Bancorp, Sterling Bank, Sussex Bancorp, and Unity Bancorp, Inc. The information provided is not necessarily indicative of the Corporation’s future performance.
| Period Ending | ||||||||||||||||||||||||
| Index | 12/31/02 | 12/31/03 | 12/31/04 | 12/31/05 | 12/31/06 | 12/31/07 | ||||||||||||||||||
| Stewardship Financial Corporation | $ | 100.00 | $ | 191.19 | $ | 189.99 | $ | 187.07 | $ | 183.62 | $ | 197.78 | ||||||||||||
| Nasdaq Bank Index | 100.00 | 132.59 | 150.40 | 147.42 | 167.54 | 134.67 | ||||||||||||||||||
| Peer Index | 100.00 | 153.27 | 180.80 | 187.37 | 192.03 | 166.18 | ||||||||||||||||||
| Nasdaq Composite Index | 100.00 | 150.64 | 164.35 | 167.78 | 185.12 | 204.80 | ||||||||||||||||||
A-1
STEWARDSHIP FINANCIAL CORPORATION AND SUBSIDIARYCONSOLIDATED FINANCIAL SUMMARY OF SELECTED FINANCIAL DATA
The following table presents selected financial data as of and for the years ended December 31, 2003, 2004, 2005, 2006 and 2007. The selected financial data is derived from our audited consolidated financial statements appearing elsewhere in this report.
| December 31, | ||||||||||||||||||||
| 2007 | 2006 | 2005 | 2004 | 2003 | ||||||||||||||||
| (Dollars in thousands, except per share amounts) | ||||||||||||||||||||
| Earnings Summary: | ||||||||||||||||||||
| Net interest income | $ | 19,430 | $ | 19,084 | $ | 18,211 | $ | 16,367 | $ | 14,324 | ||||||||||
| Provision for loan losses | (530 | ) | (264 | ) | (600 | ) | (540 | ) | (425 | ) | ||||||||||
| Net interest income after provision for loan losses | 18,900 | 18,820 | 17,611 | 15,827 | 13,899 | |||||||||||||||
| Noninterest income | 4,414 | 4,189 | 3,240 | 2,726 | 2,894 | |||||||||||||||
| Noninterest expense | 16,629 | 15,629 | 13,867 | 12,501 | 11,394 | |||||||||||||||
| Income before income tax expense | 6,685 | 7,380 | 6,984 | 6,052 | 5,399 | |||||||||||||||
| Income tax expense | 2,078 | 2,627 | 2,504 | 2,204 | 1,908 | |||||||||||||||
| Net income | $ | 4,607 | $ | 4,753 | $ | 4,480 | $ | 3,848 | $ | 3,491 | ||||||||||
| Common Share Data: (1) | ||||||||||||||||||||
| Basic net income | $ | 0.87 | $ | 0.90 | $ | 0.85 | $ | 0.75 | $ | 0.68 | ||||||||||
| Diluted net income | 0.87 | 0.89 | 0.85 | 0.74 | 0.68 | |||||||||||||||
| Cash dividends declared. | 0.34 | 0.29 | 0.24 | 0.20 | 0.16 | |||||||||||||||
| Book value at year end | 7.74 | 7.08 | 6.38 | 5.86 | 5.29 | |||||||||||||||
| Average shares outstanding, net of treasury stock | 5,294 | 5,272 | 5,240 | 5,157 | 5,090 | |||||||||||||||
| Shares outstanding at year end | 5,307 | 5,269 | 5,235 | 5,195 | 5,130 | |||||||||||||||
| Dividend payout ratio | 39.35 | % | 32.19 | % | 27.79 | % | 26.46 | % | 23.37 | % | ||||||||||
| Selected Consolidated Ratios: | ||||||||||||||||||||
| Return on average assets | 0.86 | % | 0.96 | % | 1.00 | % | 0.95 | % | 0.97 | % | ||||||||||
| Return on average stockholders’ equity | 11.76 | % | 13.41 | % | 13.86 | % | 13.48 | % | 13.68 | % | ||||||||||
| Average stockholders’ equity as a percentage of average total assets. | 7.34 | % | 7.19 | % | 7.20 | % | 7.06 | % | 7.12 | % | ||||||||||
| Tier-I capital leverage (2) | 8.56 | % | 8.85 | % | 8.71 | % | 9.08 | % | 8.89 | % | ||||||||||
| Tier-I risk based capital (3) | 10.76 | % | 11.25 | % | 11.16 | % | 12.48 | % | 12.93 | % | ||||||||||
| Total risk based capital (3) | 11.77 | % | 12.28 | % | 12.21 | % | 13.57 | % | 14.03 | % | ||||||||||
| Allowance for loan loss to total loans | 1.06 | % | 1.11 | % | 1.11 | % | 1.11 | % | 1.10 | % | ||||||||||
| Nonperforming loans to total loans | 0.11 | % | 0.41 | % | 0.15 | % | 0.48 | % | 0.42 | % | ||||||||||
| Selected Year-end Balances: | ||||||||||||||||||||
| Total assets | $ | 571,905 | $ | 519,749 | $ | 482,727 | $ | 424,306 | $ | 401,768 | ||||||||||
| Total loans, net of allowance for loan loss | 415,690 | 365,443 | 341,976 | 292,909 | 258,776 | |||||||||||||||
| Total deposits | 472,299 | 434,223 | 403,466 | 356,730 | 341,335 | |||||||||||||||
| Stockholders’ equity | 41,090 | 37,306 | 33,384 | 30,460 | 27,149 | |||||||||||||||
| (1) | All share and per share amounts have been restated to reflect a 5% stock dividend paid November 2003, 2004, 2005 2006 and 2007, a 3 for 2 stock split that occurred July 2003 and a 4 for 3 stock split that occurred July 2005. |
| (2) | As a percentage of average quarterly assets. |
| (3) | As a percentage of total risk-weighted assets. |
A-2
Management’s Discussion and Analysis of Financial Condition and Results of Operations
This section provides an analysis of the Stewardship Financial Corporation’s (the “Corporation”) consolidated financial condition and results of operations for the years ended December 31, 2007 and 2006. The analysis should be read in conjunction with the related audited consolidated financial statements and the accompanying notes presented elsewhere herein.
This annual report contains certain “forward looking statements” within the meaning of the Private Securities Litigation Reform Act of 1995, and may be identified by the use of such words as “believe,” “expect,” “anticipate,” “should,” “plan,” “estimate,” and “potential.” Examples of forward looking statements include, but are not limited to, estimates with respect to the financial condition, results of operations and business of the Corporation that are subject to various factors which could cause actual results to differ materially from these estimates. These factors include: changes in general, economic and market conditions, legislative and regulatory conditions, or the development of an interest rate environment that adversely affects the Corporation’s interest rate spread or other income anticipated from operations and investments. As used in this annual report, “we” and “us” and “our” refer to Stewardship Financial Corporation and its consolidated subsidiary, Atlantic Stewardship Bank, depending on the context.
Introduction
The Corporation, organized in January 1995, as a business corporation under the laws of the State of New Jersey, was established by the Board of Directors of Atlantic Stewardship Bank (the “Bank”) to become a holding company for the Bank. The shareholders of the Bank approved the holding company formation at the annual meeting in 1996. After obtaining approval and submitting appropriate applications, the Corporation, on November 22, 1996, acquired all of the shares of the Bank in exchange for its own shares, on a share per share basis. The Bank, and its subsidiaries, Stewardship Investment Corporation and Stewardship Realty Corporation LLC, are wholly-owned subsidiaries of the Corporation. The Corporation also formed a second subsidiary in 2003, Stewardship Statutory Trust I (the "Trust”). The Trust was formed to issue Trust Preferred Securities to enhance the capital position of the Corporation. The Trust is not consolidated with the Corporation’s financial statements due to the adoption of Financial Accounting Standards Board (FASB) Interpretation No. 46 (revised December 2003) “Consolidation of Variable Interest Entities” (“FIN 46R”).
The Corporation conducts a general commercial and retail banking business encompassing a wide range of traditional deposit and lending functions along with the other customary banking services. Stewardship Investment Corporation is a wholly-owned nonbank subsidiary of the Bank, whose primary business is to own and manage a portion of the Bank’s investment portfolio. Stewardship Realty Corporation, a subsidiary of the Bank was formed in September 2005 to purchase a property located at 612 Godwin Avenue, Midland Park, Bergen County, New Jersey. The property, located next to the main office of the Corporation, will be used for future office space for the administrative area of the bank. The Corporation earns income and generates cash primarily through the deposit gathering activities of the branch network. These deposits are then utilized to fund the Corporation’s lending and investing activities.
The Corporation is affected by the overall economic conditions in northern New Jersey, the interest rate and yield curve environment, and overall national economy. These factors are relevant because they will affect our ability to attract specific deposit products, our ability to invest in loan and investment products, and our ability to earn acceptable profits without incurring increased risks.
When evaluating the financial condition and operating performance of the organization, management reviews historical trends, peer comparisons, asset and deposit concentrations, interest margin analysis, adequacy of loan loss reserve and loan quality performance, adequacy of capital under current positions as well as to support future expansion, adequacy of liquidity, and overall quality of earnings performance.
The Corporation has developed a strong deposit base with good franchise value. Challenges facing the organization are to continue to grow the existing branch levels, provide adequate technology enhancements to achieve efficiencies, offer a competitive product line, and provide the highest level of customer service.
During 2007, the Corporation began to develop the infrastructure needed to allow the entity to continue to build franchise value, expand its customer base, offer appropriate products and services to its existing and future customer base and enhance the overall presence of the Corporation to the markets. In March 2007 the Corporation moved its stock from trading on the bulletin board of NASDAQ to the NASDAQ Capital Market. This should provide improved visibility to the stock, better pricing to market and overall liquidity in the stock trading. This was an important milestone for the stockholders of the Corporation.
In March 2007 the Corporation opened its eleventh branch location at 378 Franklin Avenue, Wyckoff, Bergen County, New Jersey. This branch is a convenient location to service existing as well as new customers. It operates as a full service facility offering safe deposits, a two lane drive-up and an ATM drive-up facility.
A-3
In September 2007 the Corporation successfully opened its twelfth branch in Westwood, Bergen County, New Jersey. This represents a new market for the Corporation, located in the eastern part of Bergen County. Westwood is a strong local community with a diversified mix of small business and retail markets. Management believes that with appropriate marketing efforts, the Corporation can provide the products and services to penetrate the existing banking competition and become a significant player in the community banking market in that area. In addition, the Corporation successfully negotiated a lease in the town of North Haledon, Passaic County and opened its thirteenth branch in December 2007. This branch is located between the Midland Park and Wayne area branches and will service existing customers as well as attract a new customer base.
Management believes that each of these branching opportunities will help contribute to a strong branch network. Although new branches such as these and Montville, opened in 2006, are in their infancy and do not adequately contribute to the profitability of the organization, management believes that these branches provide strong opportunities to help contribute to the future success of the organization. The branch network being established provides for strong coverage in both existing and new markets in strong towns in the three counties in which we operate. As the branches mature, they will provide a strong diverse customer base to provide for both consumer and business customers. In addition to the branch network, management increased the staffing in the commercial lending and new business development departments. The investment in these areas should provide benefits in the future in providing for new deposit and lending relationships.
The Corporation achieved all of these milestones while operating in an extremely challenging market. Competition in the northern New Jersey market continues to be intense and the challenges of operating most of the year in a flat interest rate market made it very difficult to attract deposits at appropriate interest rate levels. The declining of short term rates during the latter part of the year steepened the yield curve but came as a result of the decline in economic performance. The financial industry has had to face many difficulties surrounding the subprime mortgage market and a slow down in the real estate market. Although the area in which the bank operates has been somewhat shielded by the economic downturn, management continues to find it challenging to attract low cost core deposits and remains cautiously optimistic regarding the lending opportunities. The Corporation has not been involved in the subprime lending area and should not be negatively impacted in this area.
Considering these factors, the Corporation continued to perform well when compared with peer group performance. The Corporation will concentrate its efforts on growing and maturing its existing branch network and should see the benefits of its investment in the lending and new business infrastructure during 2008.
During the second quarter of 2007, the Corporation received a life insurance payout on the death of an officer of the Corporation and recorded other income totaling $459,000.
During the fourth quarter of 2006, Management completed two transactions that positioned the Corporation to improve future profitability and asset yields. The Corporation successfully completed a sale of its $3.4 million credit card portfolio to Elan Financial Services (“Elan”). Elan, a national provider of credit card services, purchased the portfolio and will continue to service and offer credit card products in the name of Atlantic Stewardship Bank. The proceeds from the sale were reinvested in other lending opportunities. The Corporation will realize, in addition to the premium paid on the portfolio, future income from Elan based on new card production and customer activity.
Management also completed the sale of $17.3 million available for sale securities that were yielding less than 5%. The proceeds realized from the sale were used to purchase higher yielding securities and to fund loan growth. Management anticipates that this transaction helped improve portfolio yields and reduced exposure to future interest rate risk.
Recent Accounting Pronouncements
A discussion of recent pronouncements and their effect on the Corporation’s financial statements can be found in Note 20 of the financial statements.
Critical Accounting Policies And Estimates
“Management’s Discussion and Analysis of Financial Condition and Results of Operation,” is based upon the Corporation’s consolidated financial statements, which have been prepared in accordance with accounting principles generally accepted in the United States of America. The preparation of these financial statements requires the Corporation to make estimates and judgments that affect the reported amounts of assets, liabilities, revenues and expenses. Note 1 to the Corporation’s Audited Consolidated Financial Statements for the year ended December 31, 2007 contains a summary of the Corporation’s significant accounting policies. Management believes the Corporation’s policy with respect to the methodology for the determination of the allowance for loan losses involves a higher degree of complexity and requires management to make difficult and subjective judgments, which often require assumptions or estimates about highly uncertain matters. Changes in these judgments, assumptions or estimates could materially impact results of operations. This critical policy and its application are periodically reviewed with the Audit Committee and the Board of Directors.
A-4
The allowance for loan losses is based upon management’s evaluation of the adequacy of the allowance, including an assessment of known and inherent risks in the portfolio, giving consideration to the size and composition of the loan portfolio, actual loan loss experience, level of delinquencies, detailed analysis of individual loans for which full collectibility may not be assured, the existence and estimated net realizable value of any underlying collateral and guarantees securing the loans, and current economic and market conditions. Although management uses the best information available, the level of the allowance for loan losses remains an estimate, which is subject to significant judgment and short-term change. Various regulatory agencies, as an integral part of their examination process, periodically review the Corporation’s allowance for loan losses. Such agencies may require the Corporation to make additional provisions for loan losses based upon information available to them at the time of their examination. Furthermore, the majority of the Corporation’s loans are secured by real estate in the State of New Jersey. Accordingly, the collectibility of a substantial portion of the carrying value of the Corporation’s loan portfolio is susceptible to changes in local market conditions and may be adversely affected should real estate values decline or the northern New Jersey area experience an adverse economic shock. Future adjustments to the allowance for loan losses may be necessary due to economic, operating, regulatory and other conditions beyond the Corporation’s control.
Earnings Summary
The Corporation reported net income of $4.6 million, or $0.87 basic earnings per share, for the year ended December 31, 2007, a decrease of $146,000, or 3.1%, below the $4.8 million recorded for 2006. Earnings decreased as a result of increases in noninterest expense and provision for loan losses, partially offset by increases of net interest income and noninterest income.
The Corporation has been operating in a volatile interest rate environment for the last three years. The targeted federal funds rate, a strong indicator of short term interest rates began 2005 at 2.25%. The rate was increased 25 basis points each time the Federal Open Market Committee (FOMC) met in 2005 ending the year at 4.25%. Rate increases continued in 2006, reaching a high of 5.25% in June 2006. The FOMC then held short term rates steady until September 2007 and then began injecting liquidity into the markets, thereby decreasing interest rates for the rest of the year. Targeted federal funds rate ended the year at 4.25%. The impact of the actions of the FOMC along with economic and inflation indicators had the Corporation operating in an inverted to flat yield curve from January 2006 through the summer of 2007. The yield curve has steepened during the last five months of 2007 being impacted by the decline in short term interest rates.
During this time period, the competition to attract deposit balances has been intense, with customers opting out of low or no interest bearing core deposits into higher yielding certificates of deposits. Financial institutions looking to grow their balance sheets and fund loan activity have been aggressive in offering above market rates to attract new money to their organizations. This has put tremendous pressure on the net interest margins at community banks and has negatively impacted banks’ abilities to grow core deposits and earnings.
The return on average assets decreased in 2007 to 0.86% from 0.96% in 2006. The return on average equity decreased to 11.76% in 2007 from 13.41% in 2006.
Results of Operations
Net Interest Income
The Corporation’s principal source of revenue is the net interest income derived from the Bank, which represents the difference between the interest earned on assets and interest paid on funds acquired to support those assets. Net interest income is affected by the balances and mix of interest-earning assets and interest-bearing liabilities, changes in their corresponding yields and costs, and by the volume of interest-earning assets funded by noninterest-bearing deposits. The Corporation’s principal interest-earning assets are loans made to businesses and individuals and investment securities.
In 2007, net interest income, on a tax equivalent basis, increased to $19.8 million from $19.4 million in 2006, an increase of $449,000, or 2.3%. This was caused by an increase of $7.5 million, or 7.2%, in net average interest-earning assets (average interest-earning assets less average interest-bearing liabilities).
Interest income, on a tax equivalent basis, increased $3.4 million, or 11.3%, during 2007 to $33.7 million from $30.3 million earned during 2006. The increase was due to an increase in the average volume of interest-earning assets and an increase in yields on interest-earning assets. Average interest-earning assets increased $39.1 million in 2007, or 8.4%, over the 2006 amount with average loans attributing to $26.1 million of the increase due primarily to the Corporation’s competitiveness within the marketplace. Yields on interest earning assets increased 17 basis points from 6.52% in 2006 to 6.69% in 2007.
A-5
Interest expense increased $3.0 million, or 27.2%, during 2007 to $13.9 million. The increase was due to an increase in average interest-bearing liabilities of $31.6 million, or 8.8%, to $393.2 million during 2007. Yields on interest-bearing liabilities increased to 3.5% during 2007 from 3.02% during 2006. Average noninterest-bearing deposits increased $4.4 million, or 4.8%, to $96.7 million. The Corporation operated in an extremely challenging interest rate environment with customers demanding higher yielding deposit products. The Corporation continued to experience a shift from low cost demand and savings to higher yielding money market accounts and certificates of deposit. The Corporation supplemented its branch deposit network with a mix of brokered certificates of deposit, wholesale repurchase agreements and Federal Home Loan Bank borrowings. These alternative funding sources are helping to lower cost of funds and provide for better managing of interest rate risk. The Corporation was successful in opening three new branches to extend and strengthen its branch network. It also has developed a new Genesis Account which is a tiered interest bearing demand account targeted toward churches and nonprofit organizations. The Corporation underwent a core processing conversion during the fourth quarter which sets the foundation for additional products and services to be offered in the future. The online banking product for the organization moved from a batch processing to a real time processing which provides more consistent and current account information to our customers. Additional new products and services will begin to be offered in 2008 which will hopefully be successful in attracting new core deposit business and consumer customers to the organization.
The following table reflects the components of the Corporation’s net interest income for the years ended December 31, 2007 and 2006 including, (1) average assets, liabilities, and stockholders’ equity, (2) interest income earned on interest-earning assets and interest expense paid on interest-bearing liabilities, (3) average yields earned on interest-earning assets and average rates paid on interest-bearing liabilities, and (4) net yield on interest-earning assets. Nontaxable income from investment securities is presented on a tax-equivalent basis assuming a statutory tax rate of 34% for the years presented. This was accomplished by adjusting this income upward to make it equivalent to the level of taxable income required to earn the same amount after taxes.
A-6
| 2007 | 2006 | |||||||||||||||||||||||
| Average | Average | |||||||||||||||||||||||
| Interest | Rates | Interest | Rates | |||||||||||||||||||||
| Average | Income/ | Earned/ | Average | Income/ | Earned/ | |||||||||||||||||||
| Balance | Expense | Paid | Balance | Expense | Paid | |||||||||||||||||||
| (Dollars in thousands) | ||||||||||||||||||||||||
| Assets | ||||||||||||||||||||||||
| Interest-earning assets: | ||||||||||||||||||||||||
| Loans (1) | $ | 385,954 | $ | 27,517 | 7.13 | % | $ | 359,806 | $ | 25,619 | 7.12 | % | ||||||||||||
| Taxable investment securities (1) | 93,732 | 4,921 | 5.25 | 85,322 | 3,732 | 4.37 | ||||||||||||||||||
| Tax-exempt investment securities (1) (2) | 23,372 | 1,200 | 5.13 | 18,702 | 868 | 4.64 | ||||||||||||||||||
| Other interest-earning assets | 631 | 45 | 7.13 | 741 | 51 | 6.88 | ||||||||||||||||||
| Total interest-earning assets | 503,689 | 33,683 | 6.69 | 464,571 | 30,270 | 6.52 | ||||||||||||||||||
| Non-interest-earning assets: | ||||||||||||||||||||||||
| Allowance for loan losses | (4,184 | ) | (4,020 | ) | ||||||||||||||||||||
| Other assets. | 34,084 | 32,862 | ||||||||||||||||||||||
| Total assets | $ | 533,589 | $ | 493,413 | ||||||||||||||||||||
| Liabilities and Stockholders' Equity | ||||||||||||||||||||||||
| Interest-bearing liabilities: | ||||||||||||||||||||||||
| Interest-bearing demand deposits. | $ | 134,219 | $ | 3,432 | 2.56 | % | $ | 116,405 | $ | 2,064 | 1.77 | % | ||||||||||||
| Savings deposits. | 37,171 | 282 | 0.76 | 41,682 | 256 | 0.61 | ||||||||||||||||||
| Time deposits. | 181,973 | 8,297 | 4.56 | 160,816 | 6,560 | 4.08 | ||||||||||||||||||
| Repurchase agreements. | 12,192 | 505 | 4.14 | 7,461 | 331 | 4.44 | ||||||||||||||||||
| FHLB borrowings | 20,379 | 877 | 4.30 | 27,923 | 1,218 | 4.36 | ||||||||||||||||||
| Subordinated debenture | 7,217 | 487 | 6.75 | 7,217 | 487 | 6.75 | ||||||||||||||||||
| Total interest-bearing liabilities | 393,151 | 13,880 | 3.53 | 361,504 | 10,916 | 3.02 | ||||||||||||||||||
| Noninterest-bearing liabilities: | ||||||||||||||||||||||||
| Demand deposits | 96,659 | 92,217 | ||||||||||||||||||||||
| Other liabilities | 4,624 | 4,234 | ||||||||||||||||||||||
| Stockholders' equity | 39,155 | 35,458 | ||||||||||||||||||||||
| Total liabilities and stockholders' equity | $ | 533,589 | $ | 493,413 | ||||||||||||||||||||
| Net interest income (taxable equivalent basis) | 19,803 | 19,354 | ||||||||||||||||||||||
| Tax equivalent adjustment | (373 | ) | (270 | ) | ||||||||||||||||||||
| Net interest income | $ | 19,430 | $ | 19,084 | ||||||||||||||||||||
| Net interest spread (taxable equivalent basis) | 3.16 | % | 3.50 | % | ||||||||||||||||||||
| Net yield on interest-earning assets (taxable equivalent basis) (3) | 3.93 | % | 4.17 | % | ||||||||||||||||||||
_______________________
| (1) | For purpose of these calculations, nonaccruing loans are included in the average balance. Fees are included in loan interest. Loans and total interest-earning assets are net of unearned income. Securities are included at amortized cost. |
| (2) | The tax equivalent adjustments are based on a marginal tax rate of 34%. |
| (3) | Net interest income (taxable equivalent basis) divided by average interest-earning assets. |
A-7
The following table analyzes net interest income in terms of changes in the volume of interest-earning assets and interest-bearing liabilities and changes in yields earned and rates paid on such assets and liabilities on a tax equivalent basis. The table reflects the extent to which changes in the Corporation’s interest income and interest expense are attributable to changes in volume (changes in volume multiplied by prior year rate) and changes in rate (changes in rate multiplied by prior year volume). Changes attributable to the combined impact of volume and rate have been allocated proportionately to changes due to volume and changes due to rate.
| 2007 Versus 2006 | ||||||||||||
| (In thousands) | ||||||||||||
| Increase (Decrease) | ||||||||||||
| Due to Change in | ||||||||||||
| Volume | Rate | Net | ||||||||||
| Interest income: | ||||||||||||
| Loans | $ | 1,864 | $ | 34 | $ | 1,898 | ||||||
| Taxable investment securities | 392 | 797 | 1,189 | |||||||||
| Tax-exempt investment securities | 233 | 99 | 332 | |||||||||
| Other interest-earning assets | (8 | ) | 2 | (6 | ) | |||||||
| Total interest-earning assets | 2,481 | 932 | 3,413 | |||||||||
| Interest expense: | ||||||||||||
| Interest-bearing demand deposits | $ | 352 | $ | 1,016 | $ | 1,368 | ||||||
| Savings deposits | (30 | ) | 56 | 26 | ||||||||
| Time deposits | 917 | 820 | 1,737 | |||||||||
| Repurchase agreements | 197 | (23 | ) | 174 | ||||||||
| FHLB borrowings | (325 | ) | (16 | ) | (341 | ) | ||||||
| Total interest-bearing liabilities | 1,111 | 1,853 | 2,964 | |||||||||
| Net change in net interest income | $ | 1,370 | $ | (921 | ) | $ | 449 | |||||
Provision for Loan Losses
The Corporation maintains an allowance for loan losses considered by management to be adequate to cover the inherent risk of loss associated with its loan portfolio. On an ongoing basis, management analyzes the adequacy of this allowance by considering the nature and volume of the Corporation’s loan activity, financial condition of the borrower, fair market value of underlying collateral, and changes in general market conditions. Additions to the allowance for loan losses are charged to operations in the appropriate period. Actual loan losses, net of recoveries, serve to reduce the allowance. The appropriate level of the allowance for loan losses is based on estimates, and ultimate losses may vary from current estimates.
The loan loss provision totaled $530,000 for the year ended December 31, 2007, bringing the allowance for loan loss to $4.5 million, or 1.06% of total loans. This compared to a loan loss provision of $264,000 for the year ended December 31, 2006 and an allowance for loan loss of $4.1 million, or 1.11% of total loans. The loan loss provision for the year ended 2007 was impacted by several significant factors. Gross loans increased $50.5 million in 2007, from $370.0 million at December 31, 2006 to $420.6 million at December 31, 2007. $24.6 million of the growth in 2007 occurred during the fourth quarter, with a majority of the noted growth in the categories of commercial real estate and commercial loans. This loan growth was a significant factor in establishing the appropriate level of allowance and the loan loss provision for the year. In addition to the overall growth noted, the Corporation considered the types of loans associated with the growth, as well as the overall seasoning of the new loans to determine the appropriate risk that was inherent in the portfolio.
Although net chargeoffs increased during the year ended December 31, 2007, the Corporation has historically experienced very low chargeoffs, and total net chargeoffs for 2007 represented just 0.05% of total loans.
Total nonperforming loans totaled $481,000, the lowest level over the past five years, representing only 0.11% of total loans. One measure which the Corporation uses to determine the adequacy of the allowance for loan losses is the coverage ratio, which calculates the allowance for loan losses as a percent of nonperforming loans. The coverage ratio as of December 31, 2007 was 926.6% compared to 267.3% as of December 31, 2006.
A-8
In addition to these factors, the Corporation evaluated the economic conditions and overall real estate climate in the primary business markets in which it operates in when considering the overall risk of the lending portfolio. Although it is clear that there has been a deterioration in the economy and real estate market on a national level, the local market where the Corporation operates has not been impacted as significantly.
Noninterest Income
Noninterest income consists of all income other than interest income and is principally derived from service charges on deposits, gain on sales of mortgage loans, income derived from bank owned life insurance, fees on safe deposit boxes, credit card merchant income and income derived from debit cards and ATM usage.
Noninterest income increased $225,000, or 5.4%, to $4.41 million during the year ended December 31, 2007, when compared with $4.2 million during the comparable 2006 period. Income of $459,000 was recorded as a result of a death benefit insurance payment received in the quarter ended June 30, 2007. Income derived from the merchant credit card processing program increased $219,000, or 17.7%, due to an expanding merchant base. The Corporation has marketed its merchant services to its existing business customers as well as new prospective customers. Businesses are analyzed prior to being offered the merchant services to ensure the Corporation is maintaining the appropriate amount of risk with in the servicing product. Gain on sales of mortgage loans increased $83,000, or 35.3% due to an increased volume of loans originated and sold. Fees and service charge income declined $104,000, or 6.3%, as consumers and small business shifted to free or low balance maintenance checking products and a decline in the fees received through the overdraft checking program. Miscellaneous income declined $135,000, or 31.1% due primarily to the loss of other income from the credit card portfolio of $146,000 due to its sale. Noninterest income for 2006 contained earnings from the gain on the sale of the credit card portfolio of $746,000. The sale of the credit card portfolio was completed during the fourth quarter of 2006, pursuant to which management sold $3.4 million credit card loans to Elan. Under the agreement, Elan purchased the portfolio for a 19% premium and agreed to honor the existing award program offered to customers. Under the terms of the agreement, cards are still offered in the name of Atlantic Stewardship Bank. The Corporation shares in income as new cards are issued and as cardholders complete transactions. An investment restructuring, completed during the fourth quarter of 2006, resulted in the sale of $17.3 million available for sale securities yielding less than 5% with a loss of $435,000. Proceeds were reinvested in higher yielding investments and loans that helped improve earning asset yields and decrease interest rate risk.
Noninterest Expense
Although management is committed to containing noninterest expense, the continued growth of the Corporation has caused noninterest expense to increase by $1.0 million or 6.4%, to $16.6 million for the year ended December 31, 2007, compared to $15.6 million for the same period in 2006. Salaries and employee benefits, the major component of noninterest expense, increased $561,000 or 8.3%. The increase was due primarily to staffing increases in lending, new business development, and the new Wyckoff, Westwood and North Haledon branches and for general merit and performance increases. Occupancy and equipment expenses increased $292,000 primarily due to the expenses relating to the three new branches. Advertising expense increased $142,000 due primarily to the need to advertise in our new markets and promote the new branches being opened and merchant processing expenses increased $184,000 due to the growth in the merchant business.
In accordance with its By-laws to tithe ten percent (10%) of its pre-tax profits to various charities, the Corporation had charitable contributions totaling $705,000 for the year ended December 31, 2007, a decrease of $50,000, or 6.6%, over the same period in 2006.
Income Taxes
Income tax expense totaled $2.1 million for the year ended December 31, 2007, for an effective tax rate of 31.1%, compared to $2.63 million, for an effective tax rate of 35.6% for the year ended December 31, 2006. The effective tax rate has decreased in 2007 due to the effect of the nontaxable death benefit proceeds being recorded. The decrease in the effective tax rate during 2006 can be attributed primarily to the tax deferred income derived from bank owned life insurance.
Financial Condition
Total assets at December 31, 2007 were $571.9 million, an increase of $52.2 million, or 10.0%, over the $519.7 million at December 31, 2006. This increase in assets reflects, among other things, a $50.2 million increase in net loans held for portfolio.
A-9
Loan Portfolio
The Corporation’s loan portfolio at December 31, 2007, net of allowance for loan losses, totaled $415.7 million, an increase of $50.2 million, or 13.7%, over the $365.4 million at December 31, 2006. Commercial real estate mortgage loans consisting of $209.1 million, or 49.7% of the total portfolio, comprised the largest portion of the loan portfolio. This represented an increase of $31.7 million from $177.4 million, or 47.9% of the total loan portfolio at December 31, 2006. Commercial loans increased $17.2 million to $89.8 million, representing 21.3% of the total loan portfolio. Consumer installment loans increased $4.4 million and residential real estate mortgages decreased $2.3 million. The Corporation continued its policy of selling the majority of its residential real estate loans in the secondary market. All of these loans have been sold with servicing released.
The Corporation’s lending activities are concentrated in loans secured by real estate located in northern New Jersey and therefore collectibility of the loan portfolio is susceptible to changes in real estate market conditions in the northern New Jersey market. The Corporation has not made loans to borrowers outside the United States.
At December 31, 2007, there were no concentrations of loans exceeding 10% of total loans outstanding. Loan concentrations are considered to exist when there are amounts loaned to a multiple number of borrowers engaged in similar activities which would cause them to be similarly impacted by economic or other related conditions.
The following table sets forth the classification of the Corporation’s loans by major category at the end of the last five years:
| December 31, | ||||||||||||||||||||
| 2007 | 2006 | 2005 | 2004 | 2003 | ||||||||||||||||
| (In thousands) | ||||||||||||||||||||
| Real estate mortgage: | ||||||||||||||||||||
| Residential | $ | 44,719 | $ | 47,020 | $ | 45,604 | $ | 41,569 | $ | 44,835 | ||||||||||
| Commercial | 209,082 | 177,411 | 163,309 | 130,762 | 109,708 | |||||||||||||||
| Commercial loans | 89,845 | 72,606 | 65,011 | 55,252 | 48,950 | |||||||||||||||
| Consumer loans: | ||||||||||||||||||||
| Installment (1) | 56,796 | 52,389 | 51,540 | 47,218 | 41,067 | |||||||||||||||
| Home equity | 19,723 | 20,010 | 20,271 | 21,484 | 17,181 | |||||||||||||||
| Other | 424 | 560 | 506 | 260 | 238 | |||||||||||||||
| Total gross loans | 420,589 | 369,996 | 346,241 | 296,545 | 261,979 | |||||||||||||||
| Less: Allowance for loan losses | 4,457 | 4,101 | 3,847 | 3,299 | 2,888 | |||||||||||||||
| Deferred loan fees | 442 | 452 | 418 | 337 | 315 | |||||||||||||||
| Net loans | $ | 415,690 | $ | 365,443 | $ | 341,976 | $ | 292,909 | $ | 258,776 | ||||||||||
| (1) | Includes automobile, home improvement, second mortgages and unsecured loans. Credit card loans are also included for all years prior to December 31, 2006. |
The following table sets forth certain categories of gross loans as of December 31, 2007 by contractual maturity. Borrowers may have the right to prepay obligations with or without prepayment penalties. This might cause actual maturities to differ from the contractual maturities summarized below.
| After 1 Year | ||||||||||||||||
| Within | But Within | After | ||||||||||||||
| 1 Year | 5 Years | 5 Years | Total | |||||||||||||
| (In thousands) | ||||||||||||||||
| Real estate mortgage | $ | 32,877 | $ | 12,445 | $ | 208,479 | $ | 253,801 | ||||||||
| Commercial | 37,654 | 41,710 | 10,481 | 89,845 | ||||||||||||
| Consumer | 2,362 | 8,595 | 65,986 | 76,943 | ||||||||||||
| Total gross loans | $ | 72,893 | $ | 62,750 | $ | 284,946 | $ | 420,589 | ||||||||
A-10
The following table sets forth the dollar amount of all gross loans due one year or more after December 31, 2007, which have predetermined interest rates or floating or adjustable interest rates:
| Floating or | ||||||||||||
| Predetermined | Adjustable | |||||||||||
| Rates | Rates | Total | ||||||||||
| (In thousands) | ||||||||||||
| Real estate mortgage | $ | 58,140 | $ | 162,784 | $ | 220,924 | ||||||
| Commercial | 31,470 | 20,721 | 52,191 | |||||||||
| Consumer | 65,919 | 8,662 | 74,581 | |||||||||
| $ | 155,529 | $ | 192,167 | $ | 347,696 | |||||||
Asset Quality
The Corporation’s principal earning asset is its loan portfolio. Inherent in the lending function is the risk of deterioration in a borrower’s ability to repay loans under existing loan agreements. Management realizes that because of this risk, reserves are maintained to absorb loan losses. In determining the adequacy of the allowance for loan losses, management of the Corporation considers the risks inherent in its loan portfolio and changes in the nature and volume of its loan activities, along with general economic and real estate market conditions. Although management attempts to establish a reserve sufficient to offset probable incurred losses in the portfolio, changes in economic conditions, regulatory policies and borrower’s performance could require future changes to the allowance.
The Corporation utilizes a two tier approach by (1) identifying problem loans and allocating specific loss allowances on such loans and (2) establishing a general valuation allowance on the remainder of its loan portfolio. The Corporation maintains a loan review system that allows for a periodic review of its loan portfolio and the early identification of potential problem loans. Such a system takes into consideration, among other things, delinquency status, size of loans, type of collateral and financial condition of the borrowers. Allocations of specific loan loss allowances are established for identified loans based on a review of such information and/or appraisals of underlying collateral. General loan loss allowances are based upon a combination of factors including, but not limited to, actual loss experience, composition of loan portfolio, current economic conditions and management’s judgment.
The Corporation’s accounting policies are set forth in Note 1 to the audited financial statements. The application of some of these policies requires significant management judgment and the utilization of estimates. Actual results could differ from these judgments and estimates resulting in a significant impact on the financial statements. A critical accounting policy for the Corporation is the policy utilized in determining the adequacy of the allowance for loan losses. Although management uses the best information available, the level of the allowance for loan losses remains an estimate which is subject to significant judgment and short-term change. Various regulatory agencies, as an integral part of their examination process, periodically review the Corporation’s allowance for loan losses. Such agencies may require the Corporation to make additional provisions for loan losses based upon information available to them at the time of their examination. Furthermore, the majority of the Corporation’s loans are secured by real estate in the State of New Jersey. Accordingly, the collectibility of a substantial portion of the carrying value of the Corporation’s loan portfolio is susceptible to changes in the local market conditions and may be adversely affected should real estate values decline or the northern New Jersey area experience an adverse economic shock. Future adjustments to the allowance may be necessary due to economic, operating, regulatory, and other conditions beyond the Corporation’s control. The allowance for loan losses represents 1.06% of total loans, or 9.3 times non-performing loans at December 31, 2007, compared with 1.11% of total loans or 2.7 times non-performing loans at December 31, 2006. In management’s opinion, the allowance for loan losses totaling $4.5 million is adequate to cover losses inherent in the portfolio at December 31, 2007.
Nonperforming Assets
Nonperforming assets include nonaccrual loans, restructured loans, loans past due 90 days or more and accruing, and other real estate owned. There was no other real estate owned assets for the periods presented. The Corporation’s loans are generally placed in a nonaccrual status when they become past due in excess of 90 days as to payment of principal and interest. Interest previously accrued on these loans and not yet paid is charged against income during the current period. Interest earned thereafter is only included in income to the extent that it is received in cash. Loans past due 90 days or more and accruing represent those loans which are sufficiently collateralized and management believes all interest and principal owed will be collected. Restructured loans are loans that have been renegotiated to permit a borrower, who has incurred adverse financial circumstances, to continue to perform. Management can reduce the contractual interest rates to below market rates or make significant concessions to the terms of the loan in order for the borrower to continue to make payments.
A-11
The following table sets forth certain information regarding the Corporation’s nonperforming assets as of December 31 of each of the preceding five years:
| December 31, | ||||||||||||||||||||
| 2007 | 2006 | 2005 | 2004 | 2003 | ||||||||||||||||
| (Dollars in thousands) | ||||||||||||||||||||
| Nonaccrual loans: (1) | ||||||||||||||||||||
| Commercial real estate | $ | 73 | $ | 123 | $ | 122 | $ | 56 | $ | 83 | ||||||||||
| Commercial | 307 | 167 | 258 | 159 | 163 | |||||||||||||||
| Consumer | 75 | 154 | 92 | 47 | 11 | |||||||||||||||
| Total nonaccrual loans | 455 | 444 | 472 | 262 | 257 | |||||||||||||||
| Loans past due ninety days or more and accruing: (2) | ||||||||||||||||||||
| Commercial real estate | — | 840 | — | 940 | — | |||||||||||||||
| Commercial | 25 | 241 | — | — | 314 | |||||||||||||||
| Consumer | 1 | 9 | 55 | 7 | 6 | |||||||||||||||
| Total loans past due ninety days or more and accruing | 26 | 1,090 | 55 | 947 | 320 | |||||||||||||||
| Restructured loans: | ||||||||||||||||||||
| Commercial | — | — | — | — | 269 | |||||||||||||||
| Consumer | — | — | — | 215 | 244 | |||||||||||||||
| Total restructured loans | — | — | — | 215 | 513 | |||||||||||||||
| Total nonperforming loans | $ | 481 | $ | 1,534 | $ | 527 | $ | 1,424 | $ | 1,090 | ||||||||||
| Nonaccrual loans to total gross loans | 0.11 | % | 0.12 | % | 0.14 | % | 0.09 | % | 0.10 | % | ||||||||||
| Nonperforming loans to total gross loans | 0.11 | % | 0.41 | % | 0.15 | % | 0.48 | % | 0.42 | % | ||||||||||
| Nonperforming loans to total assets | 0.08 | % | 0.30 | % | 0.11 | % | 0.34 | % | 0.27 | % | ||||||||||
| Allowance for loan losses to nonperforming loans | 926.61 | % | 267.34 | % | 729.98 | % | 231.67 | % | 264.95 | % | ||||||||||
______________
| (1) | Restructured loans classified in the nonaccrual category totaled $73,000 for the year ended December 31, 2007. There were no restructured loans classified as nonaccrual for the year ended December 31, 2006. Restructured loans classified in the nonaccrual category totaled $152,000, $162,000 and $174,000 for 2005, 2004 and 2003, respectively. |
| (2) | There were no restructured loans classified in the past due ninety days or more and accruing for the years ended 2007, 2006, 2005 and 2004. In 2003, restructured loans totaling $150,000 were classified in the past due ninety days or more and accruing category. |
There were no loans, other than those included in the above table, where the Corporation was aware of any credit conditions of any borrowers that would indicate a strong possibility of the borrowers not complying with the present terms and conditions of repayment and which may result in such loans being included as nonaccrual, past due or restructured at a future date.
A-12
The following table sets forth, for each of the preceding five years, the historical relationships among the amount of loans outstanding, the allowance for loan losses, the provision for loan losses, the amount of loans charged off and the amount of loan recoveries:
| 2006 | 2005 | 2004 | 2003 | 2007 | ||||||||||||||||
| (Dollars in thousands) | ||||||||||||||||||||
| Balance at beginning of period | $ | 4,101 | $ | 3,847 | $ | 3,299 | $ | 2,888 | $ | 2,689 | ||||||||||
| Loans charged off: | ||||||||||||||||||||
| Commercial | 82 | 7 | — | 49 | 173 | |||||||||||||||
| Consumer | 103 | 33 | 57 | 92 | 56 | |||||||||||||||
| Total loans charged off | 185 | 40 | 57 | 141 | 229 | |||||||||||||||
| Recoveries of loans previously charged off: | ||||||||||||||||||||
| Commercial | — | 23 | — | 3 | 1 | |||||||||||||||
| Consumer | 11 | 7 | 5 | 9 | 2 | |||||||||||||||
| Total recoveries of loans previously charged off | 11 | 30 | 5 | 12 | 3 | |||||||||||||||
| Net loans charged off | 174 | 10 | 52 | 129 | 226 | |||||||||||||||
| Provisions charged to operations | 530 | 264 | 600 | 540 | 425 | |||||||||||||||
| Balance at end of period | $ | 4,457 | $ | 4,101 | $ | 3,847 | $ | 3,299 | $ | 2,888 | ||||||||||
| Net charge offs during the period to average loans outstanding during the period | 1.06 | % | 1.11 | % | 1.11 | % | 1.11 | % | 1.10 | % | ||||||||||
| Balance of allowance for loan losses at the end of year to gross year end loans | 0.05 | % | 0.00 | % | 0.02 | % | 0.05 | % | 0.10 | % | ||||||||||
The following table sets forth the allocation of the allowance for loan losses, for each of the preceding five years, as indicated by loan categories:
| 2007 | 2006 | 2005 | 2004 | 2003 | |||||||||||||||||||||||||||||||||||||
| Amount | Percent to Total (1) | Amount | Percent to Total (1) | Amount | Percent to Total (1) | Amount | Percent to Total (1) | Amount | Percent to Total (1) | ||||||||||||||||||||||||||||||||
| (Dollars in thousands) | |||||||||||||||||||||||||||||||||||||||||
| Real estate - residential | $ | 256 | 10.6 | % | $ | 298 | 12.7 | % | $ | 320 | 13.2 | % | $ | 297 | 14.0 | % | $ | 306 | 17.1 | % | |||||||||||||||||||||
| Real estate - commercial | 1,900 | 49.7 | % | 1,705 | 48.0 | % | 1,562 | 47.1 | % | 1,272 | 44.1 | % | 1,038 | 41.9 | % | ||||||||||||||||||||||||||
| Commercial | 1,640 | 21.4 | % | 1,407 | 19.6 | % | 1,192 | 18.8 | % | 979 | 18.6 | % | 910 | 18.7 | % | ||||||||||||||||||||||||||
| Consumer | 661 | 18.3 | % | 691 | 19.7 | % | 773 | 20.9 | % | 751 | 23.3 | % | 634 | 22.3 | % | ||||||||||||||||||||||||||
| Total allowance for loan losses | $ | 4,457 | 100.0 | % | $ | 4,101 | 100.0 | % | $ | 3,847 | 100.0 | % | $ | 3,299 | 100.0 | % | $ | 2,888 | 100.0 | % | |||||||||||||||||||||
| (1) | Represents percentage of loan balance in category to total gross loans. |
Investment Portfolio
The Corporation maintains an investment portfolio to enhance its yields and to provide a secondary source of liquidity. The portfolio is comprised of U.S. Treasury securities, U.S. government and agency obligations, mortgage-backed securities, state and political subdivision obligations and other equity investments, and has been classified as held to maturity or available for sale. Investments in debt securities that the Corporation has the positive intent and the ability to hold to maturity are classified as held to maturity securities and reported at amortized cost. All other securities are classified as available for sale securities and reported at fair value, with unrecognized holding gains or losses reported in a separate component of stockholders’ equity. Securities in the available for sale category may be held for indefinite periods of time and include securities that management intends to use as part of its Asset/Liability strategy or that may be sold in response to changes in interest rates, changes in prepayment risks, the need to provide liquidity, the need to increase regulatory capital or similar factors. Securities available for sale increased to $77.0 million at December 31, 2007, from $72.7 million at December 31, 2006, an increase of $4.2 million, or 5.8%. Securities held to maturity increased $2.0 million, or 5.2%, to $41.2 million at December 31, 2007 from $39.2 million at December 31, 2006.
A-13
The following table sets forth the classification of the Corporation’s investment securities by major category at the end of the last three years:
| December 31, | ||||||||||||||||||||||||
| 2007 | 2006 | 2005 | ||||||||||||||||||||||
| Carrying | Carrying | Carrying | ||||||||||||||||||||||
| Value | Percent | Value | Percent | Value | Percent | |||||||||||||||||||
| (Dollars in thousands) | ||||||||||||||||||||||||
| Securities available for sale: | ||||||||||||||||||||||||
| U.S. Treasury | $ | — | — | $ | — | — | $ | 496 | 0.8 | % | ||||||||||||||
| U.S. government-sponsored agencies | 35,693 | 46.4 | % | 32,117 | 44.2 | % | 32,478 | 50.6 | % | |||||||||||||||
| Obligations of state and political subdivisions | 2,903 | 3.8 | % | 1,823 | 2.5 | % | 2,031 | 3.2 | % | |||||||||||||||
| Mortgage-backed securities | 37,131 | 48.2 | % | 37,707 | 51.8 | % | 28,110 | 43.8 | % | |||||||||||||||
| Other equity investments | 1,230 | 1.6 | % | 1,099 | 1.5 | % | 1,051 | 1.6 | % | |||||||||||||||
| Total | $ | 76,957 | 100.0 | % | $ | 72,746 | 100.0 | % | $ | 64,166 | ||||||||||||||
| Securities held to maturity: | ||||||||||||||||||||||||
| U.S. Treasury | $ | 501 | 1.2 | % | $ | 502 | 1.3 | % | $ | 1,004 | 2.7 | % | ||||||||||||
| U.S. government-sponsored agencies | 12,331 | 29.9 | % | 10,776 | 27.5 | % | 12,113 | 32.0 | % | |||||||||||||||
| Obligations of state and political subdivisions | 22,569 | 54.8 | % | 20,516 | 52.4 | % | 15,747 | 41.7 | % | |||||||||||||||
| Mortgage-backed securities | 5,788 | 14.1 | % | 7,369 | 18.8 | % | 8,937 | 23.6 | % | |||||||||||||||
| Total | $ | 41,189 | 100.0 | % | $ | 39,163 | 100.0 | % | $ | 37,801 | 100.0 | % | ||||||||||||
The following table sets forth the maturity distribution and weighted average yields (calculated on the basis of stated yields to maturity, considering applicable premium or discount) of the Corporation’s securities available for sale as of December 31, 2007. Issuers may have the right to call or prepay obligations with or without call or prepayment penalties. This might cause actual maturities to differ from contractual maturities.
| After 1 Year | After 5 Years | |||||||||||||||||||
| Within | Through | Through | After | |||||||||||||||||
| 1 Year | 5 Years | 10 Years | 10 Years | Total | ||||||||||||||||
| (Dollars in thousands) | ||||||||||||||||||||
| U.S. government-sponsored agencies: | ||||||||||||||||||||
| Carrying value | $ | 497 | $ | 7,323 | $ | 13,923 | $ | 13,950 | $ | 35,693 | ||||||||||
| Yield | 3.21 | % | 4.61 | % | 5.78 | % | 5.97 | % | 5.58 | % | ||||||||||
| Obligations of state and political subdivisions: | ||||||||||||||||||||
| Carrying value | 326 | 1,016 | 326 | 1,235 | 2,903 | |||||||||||||||
| Yield | 2.20 | % | 3.36 | % | 3.64 | % | 3.97 | % | 3.52 | % | ||||||||||
| Mortgage-backed securities: | ||||||||||||||||||||
| Carrying value | 17 | 2,340 | 5,047 | 29,727 | 37,131 | |||||||||||||||
| Yield | 5.08 | % | 3.96 | % | 4.50 | % | 5.33 | % | 5.13 | % | ||||||||||
| Other equity investments: | ||||||||||||||||||||
| Carrying value | 1,230 | — | — | — | 1,230 | |||||||||||||||
| Yield | 3.68 | % | — | — | — | 3.68 | % | |||||||||||||
| Total carrying value | $ | 2,070 | $ | 10,679 | $ | 19,296 | $ | 44,912 | $ | 76,957 | ||||||||||
| Weighted average yield | 3.35 | % | 4.35 | % | 5.41 | % | 5.49 | % | 5.25 | % | ||||||||||
A-14
The following table sets forth the maturity distribution and weighted average yields (calculated on the basis of stated yields to maturity, considering applicable premium or discount) of the Corporation’s securities held to maturity as of December 31, 2007. Issuers may have the right to call or prepay obligations with or without call or prepayment penalties. This might cause actual maturities to differ from contractual maturities.
| After 1 Year | After 5 Years | |||||||||||||||||||
| Within | Through | Through | After | |||||||||||||||||
| 1 Year | 5 Years | 10 Years | 10 Years | Total | ||||||||||||||||
| (Dollars in thousands) | ||||||||||||||||||||
| U.S. Treasury : | ||||||||||||||||||||
| Carrying value | $ | 501 | $ | — | $ | — | $ | — | $ | 501 | ||||||||||
| Yield | 4.57 | % | — | — | — | 4.57 | % | |||||||||||||
| U.S. government-sponsored agencies : | ||||||||||||||||||||
| Carrying value | 1,453 | 2,644 | 2,261 | 5,973 | 12,331 | |||||||||||||||
| Yield | 4.17 | % | 5.02 | % | 5.62 | % | 5.72 | % | 5.37 | % | ||||||||||
| Obligations of state and political subdivisions : | ||||||||||||||||||||
| Carrying value | 1,652 | 2,924 | 10,749 | 7,244 | 22,569 | |||||||||||||||
| Yield | 2.91 | % | 3.01 | % | 3.78 | % | 3.88 | % | 3.65 | % | ||||||||||
| Mortgage-backed securities : | ||||||||||||||||||||
| Carrying value | 50 | 600 | 2,464 | 2,674 | 5,788 | |||||||||||||||
| Yield | 5.51 | % | 4.38 | % | 4.99 | % | 5.64 | % | 5.23 | % | ||||||||||
| Total carrying value | $ | 3,656 | $ | 6,168 | $ | 15,474 | $ | 15,891 | $ | 41,189 | ||||||||||
| Weighted average yield | 3.67 | % | 4.00 | % | 4.24 | % | 4.87 | % | 4.40 | % | ||||||||||
Deposits
Corporation deposits at December 31, 2007 totaled $472.3 million, an increase of $38.1 million, or 8.8%, over the comparable period of 2006, when deposits totaled $434.2 million. The Corporation relied on its expanding branch network and current competitive products and services to provide growth during 2007. The economic and interest rate environment made it difficult to attract core deposits. During 2006, the Corporation began utilizing the brokered certificate of deposit market, with $15.4 million and $19.7 million included in the time deposit balances as of December 31, 2007 and 2006, respectively.
The following table sets forth the classification of the Corporation’s deposits by major category as of December 31 of each of the three preceding years:
| December 31, | ||||||||||||||||||||||||
| 2007 | 2006 | 2005 | ||||||||||||||||||||||
| Amount | Percent | Amount | Percent | Amount | Percent | |||||||||||||||||||
| (Dollars in thousands) | ||||||||||||||||||||||||
| Noninterest-bearing demand | $ | 101,993 | 21.6 | % | $ | 92,105 | 21.2 | % | $ | 94,331 | 23.4 | % | ||||||||||||
| Interest-bearing demand | 153,713 | 32.6 | % | 120,899 | 27.8 | % | 122,867 | 30.5 | % | |||||||||||||||
| Saving deposits | 37,010 | 7.8 | % | 37,324 | 8.6 | % | 45,779 | 11.3 | % | |||||||||||||||
| Certificates of deposit | 179,583 | 38.0 | % | 183,895 | 42.4 | % | 140,489 | 34.8 | % | |||||||||||||||
| Total. | $ | 472,299 | 100.0 | % | $ | 434,223 | 100.0 | % | $ | 403,466 | 100.0 | % | ||||||||||||
As of December 31, 2007, the aggregate amount of outstanding time deposits issued in amounts of $100,000 or more, broken down by time remaining to maturity, was as follows (In thousands):
| Three months or less | $ | 18,311 | ||
| Four months through six months | 7,702 | |||
| Seven months through twelve months | 27,230 | |||
| Over twelve months | 17,879 | |||
| Total | $ | 71,122 |
A-15
Interest Rate Sensitivity
Interest rate movements and deregulation of interest rates have made managing the Corporation’s interest rate sensitivity increasingly important. The Corporation attempts to maintain stable net interest margins by generally matching the volume of assets and liabilities maturing, or subject to repricing, by adjusting interest rates to market conditions, and by developing new products. One method of measuring the Corporation’s exposure to changes in interest rates is the maturity and repricing gap analysis. The difference between the volume of assets and liabilities that reprice in a given period is the interest sensitivity gap. A “positive” gap results when more assets than liabilities mature or are repricing in a given time frame. Conversely, a “negative” gap results when there are more liabilities than assets maturing or repricing in a given period of time. The smaller the gap, the less the effect of the market volatility on net interest income. During a period of rising interest rates, an institution with a negative gap position would not be in as favorable a position, as compared to an institution with a positive gap, to invest in higher yielding assets. This may result in yields on its assets increasing at a slower rate than the increase in its costs of interest-bearing liabilities than if it had a positive gap. During a period of falling interest rates, an institution with a negative gap would experience a repricing of its assets at a slower rate than its interest-bearing liabilities, which consequently may result in its net interest income growing at a faster rate than an institution with a positive gap position.
The following table sets forth estimated maturity/repricing structure of the Corporation’s interest-earning assets and interest-bearing liabilities as of December 31, 2007. The amounts of assets or liabilities shown which reprice or mature during a particular period were determined in accordance with the contractual terms of each asset or liability and adjusted for prepayment assumptions where applicable. The table does not necessarily indicate the impact of general interest rate movements on the Corporation’s net interest income because the repricing of certain categories of assets and liabilities, for example, prepayments of loans and withdrawal of deposits, is beyond the Corporation’s control. As a result, certain assets and liabilities indicated as repricing within a period may in fact reprice at different times and at different rate levels.
| Three Months or Less | More than Three Months Through One Year | After One Year | Noninterest Sensitive | Total | ||||||||||||||||
| (Dollars in thousands) | ||||||||||||||||||||
| Assets: | ||||||||||||||||||||
| Loans: | ||||||||||||||||||||
| Real estate mortgage | $ | 37,312 | $ | 32,400 | $ | 184,089 | $ | — | $ | 253,801 | ||||||||||
| Commercial | 50,263 | 7,774 | 31,808 | — | 89,845 | |||||||||||||||
| Consumer | 20,984 | 4,590 | 51,369 | — | 76,943 | |||||||||||||||
| Mortgage loans held for sale | 1,284 | — | — | — | 1,284 | |||||||||||||||
| Investment securities (1) | 16,791 | 21,408 | 81,930 | — | 120,129 | |||||||||||||||
| Federal funds sold | — | — | — | — | — | |||||||||||||||
| Other assets | 143 | — | — | 29,760 | 29,903 | |||||||||||||||
| Total assets | $ | 126,777 | $ | 66,172 | $ | 349,196 | $ | 29,760 | $ | 571,905 | ||||||||||
| Source of funds: | ||||||||||||||||||||
| Savings | $ | 37,010 | $ | — | $ | — | $ | — | $ | 37,010 | ||||||||||
| Interest-bearing | 153,713 | — | — | — | 153,713 | |||||||||||||||
| Certificates of deposit | 45,881 | 86,117 | 47,585 | — | 179,583 | |||||||||||||||
| Repurchase agreements | 16,499 | 784 | — | — | 17,283 | |||||||||||||||
| Borrowings | 16,892 | 277 | 11,476 | — | 28,645 | |||||||||||||||
| Subordinated debenture | — | — | 7,217 | — | 7,217 | |||||||||||||||
| Other liabilities | — | — | — | 107,364 | 107,364 | |||||||||||||||
| Stockholders’ equity | — | — | — | 41,090 | 41,090 | |||||||||||||||
| Total source of funds | $ | 269,995 | $ | 87,178 | $ | 66,278 | $ | 148,454 | $ | 571,905 | ||||||||||
| Interest rate sensitivity gap | $ | (143,218 | ) | $ | (21,006 | ) | $ | 282,918 | $ | (118,694 | ) | |||||||||
| Cumulative interest rate sensitivity gap | $ | (143,218 | ) | $ | (164,224 | ) | $ | 118,694 | $ | — | ||||||||||
| Ratio of GAP to total assets | -25.0 | % | -3.7 | % | 49.5 | % | -20.8 | % | ||||||||||||
| Ratio of cumulative GAP assets to total assets | -18.6 | % | -28.7 | % | 20.8 | % | — | |||||||||||||
________________
(1) Includes securities held to maturity, securities available for sale and FHLB-NY stock.
A-16
The Corporation also uses a simulation model to analyze the sensitivity of net interest income to movements in interest rates. The simulation model projects net interest income, net income, net interest margin, and capital to asset ratios based on various interest rate scenarios over a twelve- month period. The model is based on the actual maturity and repricing characteristics of all rate sensitive assets and liabilities. Management incorporates into the model certain assumptions regarding prepayments of certain assets and liabilities. The model assumes an immediate rate shock to interest rates without management’s ability to proactively change the mix of assets or liabilities. According to the reports generated for year end 2007, an immediate interest rate increase of 200 basis points resulted in a decrease in net interest income of 11.5%, or $2.7 million, while an immediate interest rate decrease of 200 basis points resulted in an increase in net interest income of 3.0% or $712,000. Management has a goal to maintain a percentage change of no more than 17.5% given a 200 basis point change in interest rates. Management cannot provide any assurance about the actual effect of changes in interest rates on the Corporation’s net interest income. Assumptions have been built into the model for prepayments for assets and decay rates for nonmaturity deposits such as savings and interest bearing demand.
Liquidity
The Corporation’s primary sources of funds are deposits, amortization and prepayments of loans and mortgage-backed securities, maturities of investment securities and funds provided by operations. While scheduled loan and mortgage-backed securities amortization and maturities of investment securities are a relatively predictable source of funds, deposit flow and prepayments on loan and mortgage-backed securities are greatly influenced by market interest rates, economic conditions, and competition.
The Corporation’s liquidity, represented by cash and cash equivalents, is a product of its operating, investing and financing activities. These activities are summarized below:
| Years Ended December 31, | ||||||||
| 2007 | 2006 | |||||||
| (In thousands) | ||||||||
| Cash and cash equivalents - beginning | $ | 15,697 | $ | 14,028 | ||||
| Operating activities: | ||||||||
| Net income | 4,607 | 4,753 | ||||||
| Adjustments to reconcile net income to net cash provided by operating activities | 1,573 | (70 | ) | |||||
| Net cash provided by operating activities | 6,180 | 4,683 | ||||||
| Net cash used in investing activities | (55,293 | ) | (34,261 | ) | ||||
| Net cash provided by financing activities | 45,348 | 31,247 | ||||||
| Net (decrease) increase in cash and cash equivalents | (3,765 | ) | 1,669 | |||||
| Cash and cash equivalents - ending | $ | 11,932 | $ | 15,697 | ||||
Cash was generated by operating activities in each of the above periods. The primary source of cash from operating activities during each period was net income.
Liquidity management is both a daily and long-term function of business management. Excess liquidity is generally invested in short-term investments, such as federal funds sold.
The Corporation enters into commitments to extend credit, such as letters of credit, which are not reflected in the consolidated financial statements.
A-17
The Corporation has various contractual obligations that may require future cash payments. The following table summarizes the Corporation’s contractual obligations at December 31, 2007 and the effect of such obligations is expected to have on our liquidity
and cash flows in future periods.
| Less than | 1-3 | 4-5 | After 5 | |||||||||||||||||
| Total | 1 Year | Years | Years | Years | ||||||||||||||||
| (In thousands) | ||||||||||||||||||||
| Contractual obligations | ||||||||||||||||||||
| Operating lease obligations | $ | 7,662 | $ | 829 | $ | 1,533 | $ | 1,467 | $ | 3,833 | ||||||||||
| Total contracted cost obligations | $ | 7,662 | $ | 829 | $ | 1,533 | $ | 1,467 | $ | 3,833 | ||||||||||
| Other long-term liabilities/long-term debt | ||||||||||||||||||||
| Time deposits | $ | 179,583 | $ | 131,998 | $ | 39,816 | $ | 7,769 | $ | — | ||||||||||
| Federal Home Loan Bank advances | 28,645 | 18,645 | — | — | 10,000 | |||||||||||||||
| Subordinated debentures | 7,217 | — | — | — | 7,217 | |||||||||||||||
| Total other long-term liabilities/long-term debt | $ | 215,445 | $ | 150,643 | $ | 39,816 | $ | 7,769 | $ | 17,217 | ||||||||||
| Other commitments - off balance sheet | ||||||||||||||||||||
| Letter of credit | $ | 3,707 | $ | 3,630 | $ | 77 | $ | — | $ | — | ||||||||||
| Other commitments - off balance sheet | 15,636 | 15,636 | — | — | — | |||||||||||||||
| Unused lines of credit | 81,682 | 81,682 | — | — | — | |||||||||||||||
| Total off balance sheet arrangements and contractual obligations | $ | 101,025 | $ | 100,948 | $ | 77 | $ | — | $ | — | ||||||||||
____________
For further information, see Note 16 of Notes to Consolidated Financial Statements.
Management believes that a significant portion of the time deposits will remain with the Corporation. In addition, management does not believe that all of the unused lines of credit will be exercised. The Corporation anticipates that it will have sufficient funds available to meet its current contractual commitments. Should the Corporation need temporary funding, the Corporation has an overnight line of credit with the FHLB-NY for a maximum of $51.7 million.
Capital
Banks and bank holding companies are subject to regulatory capital requirements administered by federal banking agencies. Capital adequacy guidelines and, additionally for banks, prompt corrective action regulations, involve quantitative measures of assets, liabilities, and certain off-balance-sheet items calculated under regulatory accounting practices. Capital amounts and classifications are also subject to qualitative judgments by regulators. Failure to meet capital requirements can initiate regulatory action. Regulations of the Board of Governors of the Federal Reserve System (“FRB”) require bank holding companies to maintain minimum levels of regulatory capital. Under the regulations in effect at December 31, 2007, the Corporation was required to maintain (i) a minimum leverage ratio of Tier 1 capital to total adjusted assets of 4.0% and (ii) minimum ratios of Tier 1 and total capital to risk-weighted assets of 4.0% and 8.0%, respectively. The Bank must comply with substantially similar capital regulations promulgated by the FDIC. The following table summarizes the capital ratios for the Corporation and the Bank at December 31, 2007.
| Required | Actual | Excess | ||||||||||
| Risk-based capital: | ||||||||||||
| Tier 1 | ||||||||||||
| Corporation | 4.00 | % | 10.76 | % | 6.76 | % | ||||||
| Bank | 4.00 | % | 9.57 | % | 5.57 | % | ||||||
| Total | ||||||||||||
| Corporation | 8.00 | % | 11.77 | % | 3.77 | % | ||||||
| Bank | 8.00 | % | 10.58 | % | 2.58 | % | ||||||
Leverage ratio* | ||||||||||||
| Corporation | 4.00 | % | 8.56 | % | 4.56 | % | ||||||
| Bank | 4.00 | % | 7.66 | % | 3.66 | % | ||||||
_______________
| * | The minimum leverage ratio set by the FRB and the FDIC is 3.00%. Institutions which are not “top-rated” will be expected to maintain a ratio of approximately 100 to 200 basis points above this ratio. |
A-18
Crowe™
Crowe Chizek and Company LLC
Member Horwath International
REPORT OF INDEPENDENT REGISTERED PUBLIC ACCOUNTING FIRM
Board of Directors and Shareholders Stewardship Financial Corporation Midland Park, New Jersey:
We have audited the accompanying consolidated statements of financial condition of Stewardship Financial Corporation as of December 31, 2007 and 2006 and the related consolidated statements of income, changes in stockholders' equity, and cash flows for the years then ended. These financial statements are the responsibility of the Corporation’s management. Our responsibility is to express an opinion on these financial statements based on our audits.
We conducted our audits in accordance with the standards of the Public Company Accounting Oversight Board (United States). Those standards require that we plan and perform the audit to obtain reasonable assurance about whether the financial statements are free of material misstatement. The Company is not required to have, nor were we engaged to perform, an audit of its internal control over financial reporting. Our audit included consideration of internal control over financial reporting as a basis for designing audit procedures that are appropriate in the circumstances, but not for the purpose of expressing an opinion on the effectiveness of the Company's internal control over financial reporting. Accordingly, we express no such opinion. An audit includes examining, on a test basis, evidence supporting the amounts and disclosures in the financial statements. An audit also includes assessing the accounting principles used and significant estimates made by management, as well as evaluating the overall financial statement presentation. We believe that our audits provide a reasonable basis for our opinion.
In our opinion, the financial statements referred to above present fairly, in all material respects, the financial position of Stewardship Financial Corporation as of December 31, 2007 and 2006 and the results of its operations and its cash flows for the years then ended in conformity with U.S. generally accepted accounting principles.
| /s/ Crowe Chizek and Company LLC | |
| Crowe Chizek and Company LLC |
Livingston, New Jersey
March 28, 2008
A-19
Stewardship Financial Corporation and Subsidiary
Consolidated Statements of Financial Condition
| December 31, | ||||||||
| 2007 | 2006 | |||||||
| Assets | ||||||||
| Cash and due from banks | $ | 11,789,000 | $ | 14,861,000 | ||||
| Other interest-earning assets | 143,000 | 836,000 | ||||||
| Cash and cash equivalents | 11,932,000 | 15,697,000 | ||||||
| Securities available for sale | 76,957,000 | 72,746,000 | ||||||
| Securities held to maturity, estimated fair value of $41,508,000 (2007) and $38,881,000 (2006) | 41,189,000 | 39,163,000 | ||||||
| FHLB-NY stock, at cost | 1,983,000 | 1,899,000 | ||||||
| Loans, net of allowance for loan losses of $4,457,000 (2007) and $4,101,000 (2006) | 415,690,000 | 365,443,000 | ||||||
| Mortgage loans held for sale | 1,284,000 | 2,155,000 | ||||||
| Premises and equipment, net | 7,950,000 | 7,098,000 | ||||||
| Accrued interest receivable | 3,112,000 | 2,912,000 | ||||||
| Intangible assets | 70,000 | 102,000 | ||||||
| Bank owned life insurance | 8,273,000 | 8,522,000 | ||||||
| Other assets | 3,465,000 | 4,012,000 | ||||||
| Total assets | $ | 571,905,000 | $ | 519,749,000 | ||||
| Liabilities and Stockholders’ equity | ||||||||
| Liabilities | ||||||||
| Deposits: | ||||||||
| Noninterest-bearing | $ | 101,993,000 | $ | 92,105,000 | ||||
| Interest-bearing | 370,306,000 | 342,118,000 | ||||||
| Total deposits | 472,299,000 | 434,223,000 | ||||||
| Other borrowings | 28,645,000 | 27,892,000 | ||||||
| Subordinated debentures | 7,217,000 | 7,217,000 | ||||||
| Securities sold under agreements to repurchase | 17,283,000 | 9,023,000 | ||||||
| Accrued interest payable | 2,080,000 | 1,721,000 | ||||||
| Accrued expenses and other liabilities | 3,291,000 | 2,367,000 | ||||||
| Total liabilities | 530,815,000 | 482,443,000 | ||||||
| Commitments and contingencies | — | — | ||||||
| Stockholders' equity | ||||||||
| Common stock, no par value, 10,000,000 shares authorized, 5,306,828 and 5,017,919 shares issued and outstanding at December 31, 2007 and 2006, respectively | 34,871,000 | 31,148,000 | ||||||
| Retained earnings | 5,943,000 | 6,750,000 | ||||||
| Accumulated other comprehensive income (loss), net | 276,000 | (592,000 | ) | |||||
| Total Stockholders' equity | 41,090,000 | 37,306,000 | ||||||
| Total liabilities and Stockholders' equity | $ | 571,905,000 | $ | 519,749,000 | ||||
See accompanying notes to consolidated financial statements.
A-20
Stewardship Financial Corporation and Subsidiary
Consolidated Statements of Income
| Years Ended December 31, | ||||||||
| 2007 | 2006 | |||||||
| Interest income: | ||||||||
| Loans | $ | 27,517,000 | $ | 25,619,000 | ||||
| Securities held to maturity: | ||||||||
| Taxable | 927,000 | 879,000 | ||||||
| Nontaxable | 757,000 | 562,000 | ||||||
| Securities available for sale: | ||||||||
| Taxable | 3,877,000 | 2,746,000 | ||||||
| Nontaxable | 70,000 | 36,000 | ||||||
| FHLB dividends | 117,000 | 107,000 | ||||||
| Other interest-earning assets | 45,000 | 51,000 | ||||||
| Total interest income | 33,310,000 | 30,000,000 | ||||||
| Interest expense: | ||||||||
| Deposits . | 12,011,000 | 8,880,000 | ||||||
| Borrowed money | 1,869,000 | 2,036,000 | ||||||
| Total interest expense | 13,880,000 | 10,916,000 | ||||||
| Net interest income before provision for loan losses | 19,430,000 | 19,084,000 | ||||||
| Provision for loan losses | 530,000 | 264,000 | ||||||
| Net interest income after provision for loan losses | 18,900,000 | 18,820,000 | ||||||
| Noninterest income: | ||||||||
| Fees and service charges | 1,556,000 | 1,660,000 | ||||||
| Bank owned life insurance | 322,000 | 312,000 | ||||||
| Gain on life insurance proceeds | 459,000 | — | ||||||
| Gain (loss) on calls and sales of securities, net | 4,000 | (435,000 | ) | |||||
| Gain on sales of mortgage loans | 318,000 | 235,000 | ||||||
| Gain on sale of credit card loans | — | 746,000 | ||||||
| Merchant processing | 1,456,000 | 1,237,000 | ||||||
| Miscellaneous | 299,000 | 434,000 | ||||||
| Total noninterest income | 4,414,000 | 4,189,000 | ||||||
| Noninterest expense: | ||||||||
| Salaries and employee benefits | 7,353,000 | 6,792,000 | ||||||
| Occupancy, net | 1,525,000 | 1,312,000 | ||||||
| Equipment | 972,000 | 893,000 | ||||||
| Data processing | 1,221,000 | 1,272,000 | ||||||
| Advertising | 525,000 | 383,000 | ||||||
| FDIC insurance premium | 121,000 | 51,000 | ||||||
| Amortization of intangible assets | 32,000 | 38,000 | ||||||
| Charitable contributions | 705,000 | 755,000 | ||||||
| Stationery and supplies | 368,000 | 338,000 | ||||||
| Merchant processing | 1,306,000 | 1,122,000 | ||||||
| Bank-card related services | 348,000 | 483,000 | ||||||
| Other real estate expense | 43,000 | — | ||||||
| Miscellaneous | 2,110,000 | 2,190,000 | ||||||
| Total noninterest expenses | 16,629,000 | 15,629,000 | ||||||
| Income before income tax expense | 6,685,000 | 7,380,000 | ||||||
| Income tax expense | 2,078,000 | 2,627,000 | ||||||
| Net income | $ | 4,607,000 | $ | 4,753,000 | ||||
| Basic earnings per share | $ | 0.87 | $ | 0.90 | ||||
| Diluted earnings per share | $ | 0.87 | $ | 0.89 | ||||
| Cash dividends per share | $ | 0.34 | $ | 0.29 | ||||
| Weighted average number of common shares outstanding | 5,293,507 | 5,271,986 | ||||||
| Weighted average number of diluted common shares outstanding | 5,321,479 | 5,321,130 | ||||||
See accompanying notes to consolidated financial statements.
A-21
Stewardship Financial Corporation and Subsidiary
Consolidated Statements of Changes in Stockholders’ Equity
| Years Ended December 31, 2007 and 2006 | ||||||||||||||||||||||||||||
| Accumulated | ||||||||||||||||||||||||||||
| Other | ||||||||||||||||||||||||||||
| Comprehensive | ||||||||||||||||||||||||||||
| Common Stock | Retained | Treasury Stock | Income (Loss), | |||||||||||||||||||||||||
| Shares | Amount | Earnings | Shares | Amount | Net | Total | ||||||||||||||||||||||
| Balance – January 1, 2006 . | 4,787,889 | $ | 28,211,000 | $ | 6,647,000 | (39,581 | ) | $ | (556,000 | ) | $ | (918,000 | ) | $ | 33,384,000 | |||||||||||||
| Cash dividends paid ($0.29 per share) | — | — | (1,529,000 | ) | — | — | — | (1,529,000 | ) | |||||||||||||||||||
| Common stock issued under dividend reinvestment plan | — | (3,000 | ) | — | 29,773 | 415,000 | — | 412,000 | ||||||||||||||||||||
| Payment of discount on dividend reinvestment plan | — | (19,000 | ) | — | — | — | — | (19,000 | ) | |||||||||||||||||||
| 5% Stock dividend | 194,294 | 2,501,000 | (3,121,000 | ) | 45,684 | 619,000 | — | (1,000 | ) | |||||||||||||||||||
| Common stock issued under stock plans | — | — | — | 4,865 | 69,000 | — | 69,000 | |||||||||||||||||||||
| Stock option compensation expense | — | 51,000 | — | — | — | — | 51,000 | |||||||||||||||||||||
| Stock options exercised | 35,736 | 233,000 | — | (9,000 | ) | (132,000 | ) | — | 101,000 | |||||||||||||||||||
| Tax benefit on stock options exercised | — | 174,000 | — | — | — | — | 174,000 | |||||||||||||||||||||
| Repurchase common stock | — | — | — | (31,741 | ) | (415,000 | ) | — | (415,000 | ) | ||||||||||||||||||
| Comprehensive income: | ||||||||||||||||||||||||||||
| Net income | — | — | 4,753,000 | — | — | — | 4,753,000 | |||||||||||||||||||||
| Unrealized holding gains on securities available for sale arising during the period (net of taxes of $351,000) | — | — | — | — | — | 605,000 | 605,000 | |||||||||||||||||||||
| Reclassification adjustment for losses in net income (net of tax benefit of $156,000) | — | — | — | — | — | (279,000 | ) | (279,000 | ) | |||||||||||||||||||
| Total comprehensive income | 5,079,000 | |||||||||||||||||||||||||||
| Balance – December 31, 2006 | 5,017,919 | $ | 31,148,000 | $ | 6,750,000 | — | $ | — | $ | (592,000 | ) | $ | 37,306,000 | |||||||||||||||
| Cash dividends paid ($0.34 per share) | — | — | (1,813,000 | ) | — | — | — | (1,813,000 | ) | |||||||||||||||||||
| Payment of discount on dividend reinvestment plan | — | (43,000 | ) | — | — | — | — | (43,000 | ) | |||||||||||||||||||
| 5% Stock dividend | 244,690 | 3,491,000 | (3,601,000 | ) | 7,839 | 107,000 | — | (3,000 | ) | |||||||||||||||||||
| Common stock issued under stock plans | 1,810 | 22,000 | 1,463 | 20,000 | — | 42,000 | ||||||||||||||||||||||
| Stock option compensation expense | — | 50,000 | — | 50,000 | ||||||||||||||||||||||||
| Stock options exercised | 42,409 | 200,000 | — | (9,302 | ) | (127,000 | ) | — | 73,000 | |||||||||||||||||||
| Tax benefit on stock options exercised | — | 3,000 | — | — | — | — | 3,000 | |||||||||||||||||||||
| Comprehensive income: | ||||||||||||||||||||||||||||
| Net income | — | — | 4,607,000 | — | — | — | 4,607,000 | |||||||||||||||||||||
| Unrealized holding gains on securities available for sale arising during the period (net of taxes of $549,000) | — | — | — | — | — | 865,000 | 865,000 | |||||||||||||||||||||
| Reclassification adjustment for gains in net income (net of taxes of $1,000) | — | — | — | — | — | 3,000 | 3,000 | |||||||||||||||||||||
| Total comprehensive income | 5,475,000 | |||||||||||||||||||||||||||
| Balance – December 31, 2007 | 5,306,828 | $ | 34,871,000 | $ | 5,943,000 | — | $ | — | $ | 276,000 | $ | 41,090,000 | ||||||||||||||||
See accompanying notes to consolidated financial statements.
A-22
Stewardship Financial Corporation and Subsidiary
Consolidated Statements of Cash Flows
| Years Ended December 31, | ||||||||
| 2007 | 2006 | |||||||
| Cash flows from operating activities: | ||||||||
| Net income | $ | 4,607,000 | $ | 4,753,000 | ||||
| Adjustments to reconcile net income to net cash provided by operating activities: | ||||||||
| Depreciation and amortization of premises and equipment | 787,000 | 712,000 | ||||||
| Amortization of premiums and accretion of discounts, net | 126,000 | 244,000 | ||||||
| Accretion of deferred loan fees | (120,000 | ) | (130,000 | ) | ||||
| Provision for loan losses | 530,000 | 264,000 | ||||||
| Valuation reserve on other real estate owned | 32,000 | — | ||||||
| Originations of mortgage loans held for sale | (30,570,000 | ) | (23,462,000 | ) | ||||
| Proceeds from sale of mortgage loans | 31,759,000 | 23,583,000 | ||||||
| Gain on sale of loans | (318,000 | ) | (235,000 | ) | ||||
| Loss on sale of securities available for sale | . — | 435,000 | ||||||
| Gain on calls of securities | (4,000 | ) | — | |||||
| Gain on sale of credit card portfolio | . — | (746,000 | ) | |||||
| Deferred income tax benefit | (161,000 | ) | (115,000 | ) | ||||
| Amortization of intangible assets | 32,000 | 38,000 | ||||||
| Increase in accrued interest receivable | (200,000 | ) | (480,000 | ) | ||||
| Increase in accrued interest payable | 359,000 | 576,000 | ||||||
| Increase in bank owned life insurance | (322,000 | ) | (312,000 | ) | ||||
| Gain on life insurance proceeds | (459,000 | ) | — | |||||
| Nonqualified stock option expense | 50,000 | 51,000 | ||||||
| Decrease (increase) in other assets | 158,000 | (562,000 | ) | |||||
| (Decrease) increase in other liabilities | (106,000 | ) | 69,000 | |||||
| Net cash provided by operating activities | 6,180,000 | 4,683,000 | ||||||
| Cash flows from investing activities: | ||||||||
| Purchase of securities available for sale | (20,532,000 | ) | (37,817,000 | ) | ||||
Proceeds from maturities and principal repayments on securities available for sale | 10,107,000 | 12,373,000 | ||||||
Proceeds from sales and calls on securities available for sale | 8,634,000 | 16,867,000 | ||||||
| Purchase of securities held to maturity | (12,365,000 | ) | (16,250,000 | ) | ||||
| Proceeds from maturities and principal repayments on securities held to maturity | 7,591,000 | 13,777,000 | ||||||
| Proceeds from calls of securities held to maturity | 2,653,000 | 950,000 | ||||||
| (Purchase) redemption of FHLB—NY stock | (84,000 | ) | 40,000 | |||||
| Net increase in loans | (50,717,000 | ) | (27,051,000 | ) | ||||
| Additional investment in other real estate owned | (324,000 | ) | — | |||||
| Sale of other real estate owned | 353,000 | — | ||||||
| Proceeds from sale of credit card portfolio | — | 4,196,000 | ||||||
| Life insurance proceeds | . 1,030,000 | — | ||||||
| Additions to premises and equipment | (1,639,000 | ) | (1,346,000 | ) | ||||
| Net cash used in investing activities | (55,293,000 | ) | (34,261,000 | ) | ||||
| Cash flows from financing activities: | ||||||||
| Net increase (decrease) in noninterest – bearing deposits | 9,888,000 | (2,226,000 | ) | |||||
| Net increase in interest – bearing deposits | 28,188,000 | 32,983,000 | ||||||
| Net increase in securities sold under agreements to repurchase | 8,260,000 | 4,292,000 | ||||||
| Net increase (decrease) in short term borrowings | 2,400,000 | (1,000,000 | ) | |||||
| Payments on long term borrowings | (1,647,000 | ) | (1,594,000 | ) | ||||
| Cash dividends paid on common stock | (1,816,000 | ) | (1,118,000 | ) | ||||
| Payment of discount on dividend reinvestment plan | (43,000 | ) | (19,000 | ) | ||||
| Purchase of treasury stock | — | (415,000 | ) | |||||
| Exercise of stock options | 73,000 | 101,000 | ||||||
| Tax benefit of stock plans | 3,000 | 174,000 | ||||||
| Issuance of common stock | 42,000 | 69,000 | ||||||
| Net cash provided by financing activities | 45,348,000 | 31,247,000 | ||||||
| Net (decrease) increase in cash and cash equivalents | (3,765,000 | ) | 1,669,000 | |||||
| Cash and cash equivalents – beginning | 15,697,000 | 14,028,000 | ||||||
| Cash and cash equivalents – ending | $ | 11,932,000 | $ | 15,697,000 | ||||
| Supplemental disclosures of cash flow information: | ||||||||
| Cash paid during the year for interest | 13,521,000 | 10,341,000 | ||||||
| Cash paid during the year for income taxes | 2,499,000 | 2,799,000 | ||||||
| Noncash investing activities – security purchases due brokers | 1,027,000 | — | ||||||
| –transfer of loan to ORE | 61,000 | — | ||||||
| Noncash financing activities – issuance of common stock under dividend reinvestment plan | — | 412,000 | ||||||
See accompanying notes to consolidated financial statements.
A-23
Stewardship Financial Corporation and Subsidiary Notes to Consolidated Financial Statements
Note 1. SIGNIFICANT ACCOUNTING POLICIES
Nature of operations and principles of consolidation
The consolidated financial statements include the accounts of Stewardship Financial Corporation and its wholly owned subsidiary, Atlantic Stewardship Bank, (‘the Bank”), together referred to as “the Corporation”. Atlantic Stewardship Bank includes its wholly owned subsidiaries, Stewardship Investment Corporation and Stewardship Realty LLC. All significant intercompany transactions and balances are eliminated in the consolidated financial statements. Certain prior period amounts have been reclassified to conform to the current presentation.
The Corporation provides financial services through its offices in Bergen, Passaic, and Morris Counties, New Jersey. Its primary products are checking, savings, and term certificate accounts, and its primary lending products are commercial, residential mortgage and installment loans. Substantially all loans are secured by specific items of collateral including business assets, consumer assets, and commercial and residential real estate. Commercial loans are expected to be repaid from cash flow generated from the operations of businesses. There are no significant concentrations of loans to any one industry or customer. However, the customers’ ability to repay their loans is dependent on the real estate and general economic conditions in the area. The Corporation’s lending activities are concentrated in loans secured by real estate located in northern New Jersey and therefore collectibility of the loan portfolio is susceptible to changes in real estate market conditions in the northern New Jersey market. The Corporation has not made loans to borrowers outside the United States.
Basis of consolidated financial statements presentation
The consolidated financial statements of the Corporation have been prepared in conformity with U.S. generally accepted accounting principles. In preparing the financial statements, management is required to make estimates and assumptions, based on available information, that affect the amounts reported in the financial statements and the disclosures provided. Actual results could differ significantly from those estimates. The allowance for loan losses and fair values of financial instruments are particularly subject to change.
Cash flows
Cash and cash equivalents include cash and deposits with other financial institutions under 90 days, interest-bearing deposits in other banks under 90 days and federal funds sold. Generally, federal funds are sold for one-day periods. Net cash flows are reported for customer loan and deposit transactions, and federal funds purchased and repurchase agreements.
Securities available for sale and held to maturity
The Corporation classifies its securities as held to maturity or available for sale. Investments in debt securities that the Corporation has the positive intent and ability to hold to maturity are classified as held to maturity and are carried at amortized cost. All other securities are classified as available for sale. Securities available for sale may be sold prior to maturity in response to changes in interest rates or prepayment risk, for asset/liability management purposes, or other similar factors. These securities are carried at fair value with unrealized holding gains or losses reported in a separate component of stockholders’ equity, net of the related tax effects.
Interest income includes amortization of purchase premium or discount. Premiums and discounts on securities are amortized on the level-yield method without anticipating prepayments except for mortgage-backed securities where prepayments are anticipated. Gains and losses on sales are recorded on the trade date and determined using the specific identification method.
Declines in the fair value of securities below their cost that are other than temporary are reflected as realized losses. In estimating other-than-temporary losses, management considers the length of time and extent that fair value has been less than cost, the financial condition and near term prospects of the issuer, and the Corporation’s ability and intent to hold the security for a period sufficient to allow for any anticipated recovery in fair value.
A-24
Federal Home Loan Bank (FHLB) stock
The Bank is a member of the FHLB system. Members are required to own a certain amount of stock based on the level of borrowings and other factors. FHLB stock is carried at cost, classified as a restricted security, and periodically evaluated for impairment based on the ultimate recovery of par value. Cash dividends are reported as income.
Mortgage loans held for sale
Mortgage loans originated and intended for sale in the secondary market are carried at the lower of cost or market on an aggregate basis. Mortgage loans held for sale are carried net of deferred fees, which are recognized as income at the time the loans are sold to permanent investors. Gains or losses on the sale of mortgage loans held for sale are recognized at the settlement date and are determined by the difference between the net proceeds and the amortized cost. All loans are sold with servicing rights released to the buyer.
Loans
Loans that management has the intent and ability to hold for the foreseeable future or until maturity or payoff are reported at the principal amount outstanding, net of unearned interest, deferred loan fees and costs and an allowance for loan losses. Interest income is accrued on the unpaid principal balance. Loan origination fees, net of certain direct origination costs, are deferred and recognized in interest income using the level-yield method without anticipating prepayments.
Interest income on loans is discontinued at the time the loan is 90 days delinquent unless the loan is well-secured and in process of collection. Past due status is based on the contractual terms of the loan. In all cases, loans are placed on nonaccrual or are charged-off at an earlier date if collection of principal or interest is considered doubtful.
All interest accrued but not received for loans placed on nonaccrual is reversed against interest income. Interest received on such loans is accounted for on the cash-basis or cost-recovery method, until qualifying for return to accrual. Loans are returned to an accrual status when all the principal and interest amounts contractually due are brought current and future payments are reasonably assured.
Allowance for loan losses
The allowance for loan losses is a valuation allowance for probable incurred credit losses. Loan losses are charged against the allowance when management believes the uncollectibility of a loan balance is confirmed. Subsequent recoveries, if any, are credited to the allowance. Management estimates the allowance balance required using past loan loss experience, the nature and volume of the portfolio, information about specific borrower situations and estimated collateral values, economic conditions and other factors. Allocations of the allowance may be made for specific loans, but the entire allowance is available for any loan that, in management’s judgment, should be charged off.
The allowance consists of specific and general components. The specific component relates to loans that are individually classified as impaired or loans otherwise classified as substandard or doubtful. The general component covers non-classified loans and is based on historical loss experience adjusted for current factors.
A loan is considered impaired when, based on current information and events, it is probable that the Corporation will be unable to collect the scheduled payments of principal or interest when due according to the contractual terms of the loan agreement. Factors considered by management in determining impairment include payment status, collateral value, and the probability of collecting scheduled principal and interest payments when due. Loans that experience insignificant payment delays and payment shortfalls generally are not classified as impaired. Management determines the significance of payment delays and payment shortfalls on a case-by-case basis, taking into consideration all of the circumstances surrounding the loan and the borrower, including the length of the delay, the reasons for the delay, the borrower’s prior payment record, and the amount of the shortfall in relation to the principal and interest owed. Impairment is measured on a loan by loan basis by either the present value of expected future cash flows discounted at the loan’s effective interest rate, the loans obtainable market price, or the fair value of the collateral if the loan is collateral dependent. Large groups of smaller balance homogeneous loans, such as consumer and residential real estate loans are collectively evaluated for impairment and accordingly, they are not separately identified for impairment disclosures.
A-25
Premises and equipment
Land is stated at cost. Buildings and improvements and furniture, fixtures and equipment are stated at cost, less accumulated depreciation computed on the straight-line method over the estimated lives of each type of asset. Estimated useful lives are three to forty years for buildings and improvements and three to twenty-five years for furniture, fixtures and equipment. Leasehold improvements are stated at cost less accumulated amortization computed on the straight-line method over the shorter of the term of the lease or useful life.
Other real estate owned
Other real estate owned (OREO) consists of foreclosed property and is carried at the lower of cost or fair value less estimated selling costs. When a property is acquired, the excess of the carrying amount over fair value, if any, is charged to the allowance for loan losses. Subsequent adjustments to the carrying value are recorded in an allowance for OREO and charged to OREO expense. As of December 31, 2007 and 2006, the Corporation had no OREO.
Intangible assets
Gross intangible assets totaled $750,000 with accumulated amortization of $680,000 and $648,000 at December 31, 2007 and 2006, respectively. Intangible assets are comprised of other intangible assets and core deposit intangibles. Other intangible assets represent the excess of the fair value of liabilities assumed over the fair value of tangible assets acquired through a branch acquisition, completed in 1995, which did not qualify as a business combination. Other intangible assets amounted to $70,000 and $102,000 at December 31, 2007 and 2006, respectively, and are amortized on a straight-line method over a period of fifteen years.
The core deposit intangible represented the intangible value of depositor relationships resulting from deposit liabilities assumed in the same acquisition and was amortized on an accelerated basis over a period of twelve years. The intangible was fully amortized at December 31, 2006.
Long-Term Assets
Premises and equipment, core deposit and other intangible assets, and other long-term assets are reviewed for impairment when events indicate their carrying amount may not be recovered from future undiscounted cash flows. If impaired, the assets are recorded at fair value.
Bank owned life insurance
The Corporation has purchased life insurance policies on certain key officers. Upon adoption of EITF Issue No. 06-5, which is discussed further below, Bank owned life insurance is recorded at the amount that can be realized under the insurance contract at the balance sheet date, which is the cash surrender value adjusted for other charges or other amounts due that are probable at settlement. Prior to the adoption of EITF Issue No. 06-5, the Corporation recorded owned life insurance at its cash surrender value.
In September 2006, the FASB Emerging Issues Task Force finalized Issue No. 06-5, “Accounting for Purchases of Life Insurance – Determining the Amount That Could Be Realized in Accordance with FASB Technical Bulletin 85-4 (Accounting for Purchases of Life Insurance)” (EITF Issue No. 06-5). EITF Issue No. 06-5 requires that a policyholder consider contractual terms of a life insurance policy in determining the amount that could be realized under the insurance contract. It also requires that if the contract provides for a greater surrender value if all individual policies in a group are surrendered at the same time, that the surrender value be determined based on the assumption that policies will be surrendered on an individual basis. Lastly, EITF Issue No. 06-5 requires disclosure when there are contractual restrictions on the Corporation’s ability to surrender a policy. The adoption of EITF Issue No. 06-5 on January 1, 2007 had no impact on the Corporation’s financial condition or results of operation.
Treasury Stock
Repurchases of common stock are recorded as treasury stock at cost. Treasury stock is reissued using the first in first out method. Treasury stock may be reissued for exercise of stock options, dividend reinvestment plans, stock dividends or other stock issuances. The difference between the cost and the market value at the time the treasury stock is reissued is shown as an adjustment to common stock.
Dividend Reinvestment Plan
The Corporation offers shareholders the opportunity to participate in a dividend reinvestment plan. Plan participants may reinvest cash dividends to purchase new shares of stock at 95% of the market value, based on the most recent trades. Previously, the Corporation purchased treasury stock or issued authorized but un-issued shares to fund the dividend reinvestment plan and issued stock to the plan participants in place of cash dividends. Effective May 16, 2006, the Corporation changed the policy to purchase shares for the dividend reinvestment participants on the open market through an approved broker. The Corporation uses the cash
A-26
dividends due the plan participants to purchase shares from the broker. The Corporation reimburses the broker for the 5% discount when the purchase of the Corporation’s stock is completed.
Stock-based compensation
Effective January 1, 2006, the Corporation adopted Statement of Financial Accounting Standards No. 123(R), “Share Based Payment” (SFAS No. 123(R)), using the modified prospective transition method. Accordingly, the Corporation has recorded stock-based compensation cost using the fair value method starting in 2006.
Income taxes
Income tax expense is the total of the current year income tax due or refundable and the change in deferred tax assets and liabilities. Deferred tax assets and liabilities are the expected future tax amounts for the temporary differences between carrying amounts and tax bases of assets and liabilities, computed using enacted tax rates. A valuation allowance, if needed, reduces deferred tax assets to the amount expected to be realized.
The Corporation adopted FASB Interpretation 48, “Accounting for Uncertainty in Income Taxes” (FIN 48), as of January 1, 2007. A tax position is recognized as a benefit only if it is “more likely than not” that the tax position would be sustained in a tax examination, with a tax examination being presumed to occur. The amount recognized is the largest amount of tax benefit that is greater than 50% likely of being realized on examination. For tax positions not meeting the “more likely than not” test, no tax benefit is recorded. The adoption had no affect on the Corporation’s financial statements.
The Corporation recognizes interest and/or penalties related to income tax matters in income tax expense.
Other comprehensive income
Comprehensive income consists of net income and other comprehensive income. Other comprehensive income includes unrealized gains and losses on securities available for sale, net of tax which are also recognized as separate components of equity.
Earnings per share
Basic earnings per share is calculated by dividing net income by the average daily number of common shares outstanding during the period. Common stock equivalents are not included in the calculation.
Diluted earnings per share is computed similar to that of the basic earnings per share except that the denominator is increased to include the number of additional common shares that would have been outstanding if all potential dilutive common shares were issued.
All share and per share amounts have been restated to reflect a 5% stock dividend paid November, 2006 and 2007.
Loss contingencies
Loss contingencies, including claims and legal actions arising in the ordinary course of business, are recorded as liabilities when the likelihood of loss is probable and an amount or range of loss can be reasonably estimated. Management does not believe there are such matters that will have a material effect on the financial statements.
Dividend restriction
Banking regulations require maintaining certain capital levels and may limit the dividends paid by the bank to the holding company or by the holding company to shareholders.
Fair value of financial instruments
Fair values of financial instruments are estimated using relevant market information and other assumptions, as more fully disclosed in a separate note. Fair value estimates involve uncertainties and matters of significant judgment regarding interest rates, credit risk, prepayments, and other factors, especially in the absence of broad markets for particular items. Changes in assumptions or in market conditions could significantly affect the estimates.
Note 2. RESTRICTIONS ON CASH AND DUE FROM BANKS
Cash reserves are required to be maintained on deposit with the Federal Reserve Bank based on deposits. The average amounts of the reserves on deposit for the years ended December 31, 2007 and 2006 were approximately $300,000.
A-27
Note 3. SECURITIES AVAILABLE FOR SALE
The fair value of available for sale securities and the related gross unrealized gains and losses recognized in accumulated other
comprehensive income were as follows:
| December 31, 2007 | ||||||||||||
| Fair | Gross Unrealized | |||||||||||
| Value | Gains | Losses | ||||||||||
| U.S. government-sponsored agencies: | ||||||||||||
| Within one year. | $ | 497,000 | $ | — | $ | 3,000 | ||||||
| After one year through five years | 7,323,000 | 47,000 | 1,000 | |||||||||
| After five years through ten years | 13,923,000 | 265,000 | — | |||||||||
| After ten years | 13,950,000 | 183,000 | — | |||||||||
| 35,693,000 | 495,000 | 4,000 | ||||||||||
| Obligations of state and political subdivisions: | ||||||||||||
| Within one year. | 326,000 | — | 1,000 | |||||||||
| After one year through five years | 1,016,000 | — | 4,000 | |||||||||
| After five years through ten years | 326,000 | 2,000 | 1,000 | |||||||||
| After ten years | 1,235,000 | — | 23,000 | |||||||||
| 2,903,000 | 2,000 | 29,000 | ||||||||||
| Mortgage-backed securities: | ||||||||||||
| Within one year | 17,000 | — | — | |||||||||
| After one year through five years | 2,340,000 | 3,000 | 28,000 | |||||||||
| After five years through ten years | 5,047,000 | 32,000 | 21,000 | |||||||||
| After ten years | 29,727,000 | 170,000 | 156,000 | |||||||||
| 37,131,000 | 205,000 | 205,000 | ||||||||||
| Total debt securities | 75,727,000 | |||||||||||
| 702,000 | 238,000 | |||||||||||
| Other equity investments | 1,230,000 | — | 17,000 | |||||||||
| $ | 76,957,000 | $ | 702,000 | $ | 255,000 | |||||||
| December 31, 2006 | ||||||||||||
| Fair | Gross Unrealized | |||||||||||
| Value | Gains | Losses | ||||||||||
| U.S. government-sponsored agencies | ||||||||||||
| Within one year. | $ | 4,180,000 | $ | — | $ | 20,000 | ||||||
| After one year through five years | 11,375,000 | 1,000 | 138,000 | |||||||||
| After five years through ten years | 8,384,000 | 27,000 | 35,000 | |||||||||
| After ten years | 8,178,000 | — | 154,000 | |||||||||
| 32,117,000 | 28,000 | 347,000 | ||||||||||
| Obligations of state and political subdivisions: | ||||||||||||
| After one year through five years | 1,331,000 | — | 25,000 | |||||||||
| After five years through ten years | 143,000 | — | — | |||||||||
| After ten years | 349,000 | — | 5,000 | |||||||||
| 1,823,000 | — | 30,000 | ||||||||||
| Mortgage-backed securities: | ||||||||||||
| Within one year | 4,000 | — | — | |||||||||
| After one year through five years | 2,190,000 | — | 75,000 | |||||||||
| After five years through ten years | 6,376,000 | 5,000 | 154,000 | |||||||||
| After ten years | 29,137,000 | 35,000 | 412,000 | |||||||||
| 37,707,000 | 40,000 | 641,000 | ||||||||||
| Total debt securities | 71,647,000 | 68,000 | 1,018,000 | |||||||||
| Other equity investments | 1,099,000 | — | 21,000 | |||||||||
| $ | 72,746,000 | $ | 68,000 | $ | 1,039,000 | |||||||
A-28
Issuers may have the right to call or prepay obligations with or without call or prepayment penalties. This might cause actual maturities to differ from the contractual maturities summarized above.
Mortgage-backed securities are comprised primarily of government agencies such as the Government National Mortgage Association ("GNMA") and government sponsored agencies such as the Federal National Mortgage Association ("FNMA"), the Federal Home Loan Banks ("FHLB") and the Federal Home Loan Mortgage Corporation ("FHLMC"). At year end 2007 and 2006, there were no holdings of securities of any one issuer other than the U.S. government and its agencies in an amount greater than 10% of stockholders' equity.
The following tables summarize the fair value and unrealized losses of those investment securities which reported an unrealized loss at December 31, 2007 and 2006, and if the unrealized loss position was continuous for the twelve months prior to December 31, 2007 and 2006.
| Less than 12 Months | 12 Months or Longer | Total | ||||||||||||||||||||||
| Unrealized | Unrealized | Unrealized | ||||||||||||||||||||||
| 2007 | Fair Value | Losses | Fair Value | Losses | Fair Value | Losses | ||||||||||||||||||
| U.S. government sponsored agencies | $ | — | $ | — | $ | 1,995,000 | $ | (4,000 | ) | $ | 1,995,000 | $ | (4,000 | ) | ||||||||||
| Obligations of state and political subdivisions | 1,067,000 | (20,000 | ) | 1,278,000 | (9,000 | ) | 2,345,000 | (29,000 | ) | |||||||||||||||
| Mortgage-backed securities | 3,632,000 | (8,000 | ) | 14,413,000 | (197,000 | ) | 18,045,000 | (205,000 | ) | |||||||||||||||
| Other eauity investments | 71,000 | (4,000 | ) | 1,159,000 | (13,000 | ) | 1,230,000 | (17,000 | ) | |||||||||||||||
| Total temporarily impaired securities | $ | 4,770,000 | $ | (32,000 | ) | $ | 18,845,000 | $ | (223,000 | ) | $ | 23,615,000 | $ | (255,000 | ) | |||||||||
| Less than 12 Months | 12 Months or Longer | Total | ||||||||||||||||||||||
| 2006 | Fair Value | Unrealized Losses | Fair Value | Unrealized Losses | Fair Value | Unrealized Losses | ||||||||||||||||||
| U.S. government sponsored agencies | $ | 16,551,000 | $ | (181,000 | ) | $ | 11,980,000 | $ | (166,000 | ) | $ | 28,531,000 | $ | (347,000 | ) | |||||||||
| Obligations of state and political subdivisions | 492,000 | (5,000 | ) | 1,071,000 | (25,000 | ) | 1,563,000 | (30,000 | ) | |||||||||||||||
| Mortgage-backed securities | 7,433,000 | (59,000 | ) | 20,546,000 | (582,000 | ) | 27,979,000 | (641,000 | ) | |||||||||||||||
| Other eauity investments | — | — | 1,099,000 | (21,000 | ) | 1,099,000 | (21,000 | ) | ||||||||||||||||
| Total temporarily impaired securities | $ | 24,476,000 | $ | (245,000 | ) | $ | 34,696,000 | $ | (794,000 | ) | $ | 59,172,000 | $ | (1,039,000 | ) | |||||||||
The unrealized losses are primarily due to the changes in interest rates. These securities have not been considered other than temporarily impaired as scheduled principal and interest payments have been made and management anticipates collecting the entire principal balance as scheduled. Management believes the price variation is temporary in nature and has the ability and intent to hold these securities to maturity or for a sufficient amount of time to recover the recorded principal.
Cash proceeds realized from sales and calls of securities available for sale for the years ended December 31, 2007 and 2006 were $8,634,000 and $16,867,000, respectively. There were gross gains totaling $2,000 and no gross losses realized on sales or calls during the year ended December 31, 2007. The tax provision related to these realized gains was negligible. There were no gross gains and gross losses totaling $435,000 were realized on sales or calls during the year ended December 31, 2006. The tax benefit related to these realized losses was $156,000.
See Note 9 to financial statements regarding securities pledged as collateral for securities sold under agreements to repurchase.
A-29
Note 4. SECURITIES HELD TO MATURITY
The following is a summary of the contractual maturities and related unrecognized gains and losses of securities held to maturity:
| December 31, 2007 | ||||||||||||||||
| Carrying | Gross Unrecognized | |||||||||||||||
| Amount | Gains | Losses | Fair Value | |||||||||||||
| U.S. Treasury: | ||||||||||||||||
| After one year through five years | $ | 501,000 | $ | 5,000 | $ | — | $ | 506,000 | ||||||||
| 501,000 | 5,000 | — | 506,000 | |||||||||||||
| U.S. government sponsored agencies: | ||||||||||||||||
| Within one year. | 1,453,000 | — | 1,000 | 1,452,000 | ||||||||||||
| After one year through five years | 2,644,000 | 21,000 | — | 2,665,000 | ||||||||||||
| After five years through ten years | 2,261,000 | 30,000 | — | 2,291,000 | ||||||||||||
| After ten years | 5,973,000 | 84,000 | — | 6,057,000 | ||||||||||||
| 12,331,000 | 135,000 | 1,000 | 12,465,000 | |||||||||||||
| Obligations of state and political subdivisions: | ||||||||||||||||
| Within one year. | 1,652,000 | 1,000 | 4,000 | 1,649,000 | ||||||||||||
| After one year through five years | 2,924,000 | 2,000 | 14,000 | 2,912,000 | ||||||||||||
| After five years through ten years | 10,749,000 | 161,000 | 2,000 | 10,908,000 | ||||||||||||
| After ten years | 7,244,000 | 40,000 | 20,000 | 7,264,000 | ||||||||||||
| 22,569,000 | 204,000 | 40,000 | 22,733,000 | |||||||||||||
| Mortgage-backed securities: | ||||||||||||||||
| Within one year. | 50,000 | — | — | 50,000 | ||||||||||||
| After one but within five years | 600,000 | 1,000 | 3,000 | 598,000 | ||||||||||||
| After five years through ten years | 2,464,000 | 18,000 | 13,000 | 2,469,000 | ||||||||||||
| After ten years | 2,674,000 | 29,000 | 16,000 | 2,687,000 | ||||||||||||
| 5,788,000 | 48,000 | 32,000 | 5,804,000 | |||||||||||||
| $ | 41,189,000 | $ | 392,000 | $ | 73,000 | $ | 41,508,000 | |||||||||
| December 31, 2006 | ||||||||||||||||
| Carrying | Gross Unrecognized | |||||||||||||||
| Amount | Gains | Losses | Fair Value | |||||||||||||
| U.S. Treasury: | ||||||||||||||||
| After one year through five years | $ | 502,000 | $ | — | $ | 2,000 | $ | 500,000 | ||||||||
| 502,000 | — | 2,000 | 500,000 | |||||||||||||
| U.S. government sponsored agencies: | ||||||||||||||||
| Within one year | 1,455,000 | — | 22,000 | 1,433,000 | ||||||||||||
| After one year through five years | 5,091,000 | 3,000 | 56,000 | 5,038,000 | ||||||||||||
| After five years through ten years | 2,748,000 | 5,000 | 5,000 | 2,748,000 | ||||||||||||
| After ten years | 1,482,000 | — | 26,000 | 1,456,000 | ||||||||||||
| 10,776,000 | 8,000 | 109,000 | 10,675,000 | |||||||||||||
| Obligations of state and political subdivisions: | ||||||||||||||||
| Within one year | 4,596,000 | 2,000 | 14,000 | 4,584,000 | ||||||||||||
| After one year through five years | 4,475,000 | 1,000 | 73,000 | 4,403,000 | ||||||||||||
| After five years through ten years | 6,499,000 | 32,000 | 25,000 | 6,506,000 | ||||||||||||
| After ten years | 4,946,000 | 18,000 | 42,000 | 4,922,000 | ||||||||||||
| 20,516,000 | 53,000 | 154,000 | 20,415,000 | |||||||||||||
| Mortgage-backed securities: | ||||||||||||||||
| Within one year | 20,000 | — | — | 20,000 | ||||||||||||
| After one but within five years | 698,000 | — | 13,000 | 685,000 | ||||||||||||
| After five years through ten years | 1,725,000 | 10,000 | 17,000 | 1,718,000 | ||||||||||||
| After ten years | 4,926,000 | 22,000 | 80,000 | 4,868,000 | ||||||||||||
| 7,369,000 | 32,000 | 110,000 | 7,291,000 | |||||||||||||
| $ | 39,163,000 | $ | 93,000 | $ | 375,000 | $ | 38,881,000 | |||||||||
Issuers may have the right to call or prepay obligations with or without call or prepayment penalties. This might cause actual maturities to differ from the contractual maturities summarized above.
Mortgage-backed securities are comprised primarily of government agencies such as GNMA and government sponsored agencies such as FNMA, FHLB and FHLMC. At year end 2007 and 2006, there were no holdings of securities of any one issuer other than
A-30
the U.S. government and its agencies in an amount greater than 10% of stockholders' equity.
The following tables summarize the fair value and unrecognized losses of those investment securities which reported an unrecognized loss at December 31, 2007 and 2006, and if the unrecognized loss position was continuous for the twelve months prior to December 31, 2007 and 2006.
| Less than 12 Months | 12 Months or Longer | Total | ||||||||||||||||||||||
| Unrecognized | Unrecognized | Unrecognized | ||||||||||||||||||||||
| 2007 | Fair Value | Losses | Fair Value | Losses | Fair Value | Losses | ||||||||||||||||||
| U.S. Treasury | $ | — | $ | — | $ | — | $ | — | $ | — | $ | — | ||||||||||||
| U.S. government sponsored agencies | — | — | 1,452,000 | (1,000 | ) | 1,452,000 | (1,000 | ) | ||||||||||||||||
| Obligations of state and political subdivisions | 614,000 | (3,000 | ) | 7,056,000 | (37,000 | ) | 7,670,000 | (40,000 | ) | |||||||||||||||
| Mortgage-backed securities | — | — | 3,128,000 | (32,000 | ) | 3,128,000 | (32,000 | ) | ||||||||||||||||
| Total temporarily impaired securities | $ | 614,000 | $ | (3,000 | ) | $ | 11,636,000 | $ | (70,000 | ) | $ | 12,250,000 | $ | (73,000 | ) | |||||||||
| Less than 12 Months | 12 Months or Longer | Total | ||||||||||||||||||||||
| Unrecognized | Unrecognized | Unrecognized | ||||||||||||||||||||||
| 2006 | Fair Value | Losses | Fair Value | Losses | Fair Value | Losses | ||||||||||||||||||
| U.S. Treasury | $ | 500,000 | $ | (2,000 | ) | $ | — | $ | — | $ | 500,000 | $ | (2,000 | ) | ||||||||||
| U.S. government sponsored agencies | 2,950,000 | (31,000 | ) | 6,069,000 | (78,000 | ) | 9,019,000 | (109,000 | ) | |||||||||||||||
| Obligations of state and political subdivisions | 6,238,000 | (62,000 | ) | 6,083,000 | (92,000 | ) | 12,321,000 | (154,000 | ) | |||||||||||||||
| Mortgage-backed securities | 973,000 | (9,000 | ) | 3,956,000 | (101,000 | ) | 4,929,000 | (110,000 | ) | |||||||||||||||
| Total temporarily impaired securities | $ | 10,661,000 | $ | (104,000 | ) | $ | 16,108,000 | $ | (271,000 | ) | $ | 26,769,000 | $ | (375,000 | ) | |||||||||
The unrecogized losses are primarily due to the changes in interest rates. These securities have not been considered other than temporarily impaired as scheduled principal and interest payments have been made and management anticipates collecting the entire principal balance as scheduled. Management believes the price variation is temporary in nature and has the ability and intent to hold these securities to maturity.
Cash proceeds realized from calls of securities held to maturity for the year ended December 31, 2007 were $2,653,000. Cash proceeds realized froms calls of securities held to maturity for the year ended December 31, 2006 were $950,000. Gross gains totaling $2,000 and no losses were realized from calls for the year ended December 31, 2007. The tax provision related to these realized gains was negligible. There were no gains or losses realized on calls for the year ended December 31, 2006.
The carrying value of securities pledged to secure treasury tax and loan deposits and public deposits for the two years ended December 31, 2007 and 2006 were $1,001,000 and $1,002,000, respectively. See also Note 9 to financial statements regarding securities pledged as collateral for securities sold under agreements to repurchase.
A-31
Note 5. LOANS
The loan portfolio consisted of the following:
| December 31, | ||||||||
| 2007 | 2006 | |||||||
| Mortgage: | ||||||||
| Residential | $ | 44,719,000 | $ | 47,020,000 | ||||
| Commercial | 209,082,000 | 177,411,000 | ||||||
| Commercial | 89,845,000 | 72,606,000 | ||||||
| Equity | 19,723,000 | 20,010,000 | ||||||
| Installment | 56,796,000 | 52,389,000 | ||||||
| Other. | 424,000 | 560,000 | ||||||
| Total gross loans | 420,589,000 | 369,996,000 | ||||||
| Less: Deferred loan fees, net of costs | 442,000 | 452,000 | ||||||
| Allowance for loan losses | 4,457,000 | 4,101,000 | ||||||
| 4,899,000 | 4,553,000 | |||||||
| Loans, net | $ | 415,690,000 | $ | 365,443,000 | ||||
At December 31, 2007 and 2006, loans participated by the Corporation to other organizations totaled approximately $10,397,000 and $13,704,000, respectively.
Activity in the allowance for loan losses is summarized as follows:
| December 31, | ||||||||
| 2007 | 2006 | |||||||
| Balance, beginning | $ | 4,101,000 | $ | 3,847,000 | ||||
| Provision charged to operations | 530,000 | 264,000 | ||||||
| Recoveries of loans charged off | 11,000 | 30,000 | ||||||
| Loans charged off | (185,000 | ) | (40,000 | ) | ||||
| Balance, ending | $ | 4,457,000 | $ | 4,101,000 | ||||
The Corporation has entered into lending transactions in the ordinary course of business with directors, executive officers and principal stockholders of the Corporation and their affiliates. At December 31, 2007 and 2006, these loans aggregated approximately $2,346,000 and $1,617,000, respectively. During the year ended December 31, 2007, new loans totaling $1,320,000 were granted and repayments totaled approximately $591,000. The loans, at December 31, 2007, were current as to principal and interest payments.
Note 6. NONPERFORMING LOANS
Nonperforming loans include the following:
| December 31, | ||||||||
| 2007 | 2006 | |||||||
| Nonaccrual loans | $ | 455,000 | $ | 444,000 | ||||
| Loans past due ninety days or more and accruing | 26,000 | 1,090,000 | ||||||
| Total nonperforming loans | $ | 481,000 | $ | 1,534,000 | ||||
Restructured loans classified as nonaccrual for the year ended December 31, 2007 were $72,000. There were no restructured loans classified as nonaccrual for the year ended December 31, 2007.
A-32
The following information is presented for loans classified as nonaccrual and restructured:
| Year ended December 31, | ||||||||
| 2007 | 2006 | |||||||
| Income that would have been recorded under contractual terms | $ | 40,000 | $ | 37,000 | ||||
| Less interest income received | 10,000 | 14,000 | ||||||
| Lost income on nonperforming loans during the year | $ | 30,000 | $ | 23,000 | ||||
Impaired loans consisted of the following:
| December 31, | ||||||||
| 2007 | 2006 | |||||||
| Impaired Loans | ||||||||
| With related allowance for loan loss | $ | 222,000 | $ | 223,000 | ||||
| Without related allowance for loan loss | 233,000 | 221,000 | ||||||
| Total impaired loans | $ | 455,000 | $ | 444,000 | ||||
| Related allowance for possible credit losses | $ | 39,000 | $ | 110,000 | ||||
| Average investment in impaired loans | $ | 344,000 | $ | 241,000 | ||||
| Interest recognized on impaired loans | $ | — | $ | — | ||||
Note 7. PREMISES AND EQUIPMENT, NET
| December 31, | ||||||||
| 2007 | 2006 | |||||||
| Land | $ | 2,999,000 | $ | 2,999,000 | ||||
| Buildings and improvements | 2,802,000 | 2,758,000 | ||||||
| Leasehold improvements | 2,159,000 | 1,771,000 | ||||||
| Furniture, fixtures and equipment | 4,581,000 | 3,798,000 | ||||||
| 12,541,000 | 11,326,000 | |||||||
| Less accumulated depreciation and amortization | 4,591,000 | 4,228,000 | ||||||
| Total premises & equipment, net | $ | 7,950,000 | $ | 7,098,000 | ||||
Amounts charged to net occupancy expense for depreciation and amortization of banking premises and equipment amounted to $787,000 and $712,000 in 2007 and 2006, respectively.
A-33
Note 8. DEPOSITS
| December 31, 2007 | December 31, 2006 | |||||||||||||||
| Weighted | Weighted | |||||||||||||||
| Average | Average | |||||||||||||||
| Rate | Amount | Rate | Amount | |||||||||||||
| Noninterest-bearing demand | 0 | % | $ | 101,993,000 | 0 | % | $ | 92,105,000 | ||||||||
| NOW accounts | 1.75 | % | 67,044,000 | 1.59 | % | 64,493,000 | ||||||||||
| Money market accounts | 3.17 | % | 86,669,000 | 2.67 | % | 56,406,000 | ||||||||||
| Total interest-bearing demand | 2.55 | % | 153,713,000 | 2.09 | % | 120,899,000 | ||||||||||
| 000 | ||||||||||||||||
| Statement savings and clubs | 0.80 | % | 33,524,000 | 0.77 | % | 33,546,000 | ||||||||||
| Business savings | 0.50 | % | 3,486,000 | 0.51 | % | 3,778,000 | ||||||||||
| Total savings | 0.77 | % | 37,010,000 | 0.74 | % | 37,324,000 | ||||||||||
| IRA investment and variable rate savings | 4.56 | % | 26,499,000 | 4.31 | % | 23,012,000 | ||||||||||
| Brokered certificates | 5.19 | % | 15,415,000 | 5.37 | % | 19,671,000 | ||||||||||
| Money market certificates | 4.47 | % | 137,669,000 | 4.36 | % | 141,212,000 | ||||||||||
| Total certificates of deposit | 4.55 | % | 179,583,000 | 4.46 | % | 183,895,000 | ||||||||||
| Total interest-bearing deposits | 3.34 | % | 370,306,000 | 3.22 | % | 342,118,000 | ||||||||||
| Total deposits | 2.62 | % | $ | 472,299,000 | 2.54 | % | $ | 434,223,000 | ||||||||
Certificates of deposit with balances of $100,000 or more at December 31, 2007 and 2006, totaled approximately $71,122,000 and $69,902,000, respectively.
The scheduled maturities of certificates of deposit were as follows:
| December 31, | ||||
| 2007 | ||||
| 2008 | $ | 131,998,000 | ||
| 2009 | 26,570,000 | |||
| 2010 | 13,246,000 | |||
| 2011 | 4,470,000 | |||
| 2012 | 3,299,000 | |||
| $ | 179,583,000 | |||
Note 9. OTHER BORROWINGS
Federal Home Loan Bank of New York Advances
During the years 2007 and 2006, the maximum amount of FHLB-NY advances outstanding at any month end was $32.0 million and $40.4 million, respectively. The average amount of advances outstanding during the year ended December 31, 2007 and 2006 was $20.4 million and $27.9 million, respectively. As of December 31, 2007, all FHLB-NY advances had fixed rates. The advances are scheduled for repayment as follows:
| December 31, 2007 | December 31, 2006 | |||||||||||||||
| Weighted | Weighted | |||||||||||||||
| Average | Average | |||||||||||||||
| Advances Maturing | Amount | Rate | Amount | Rate | ||||||||||||
| 2007 | $ | — | 0.00 | % | $ | 14,400,000 | 5.33 | % | ||||||||
| 2008 | 18,645,000 | 3.58 | % | 3,492,000 | 3.26 | % | ||||||||||
| 2009 | — | 0.00 | % | — | 0.00 | % | ||||||||||
| Thereafter | 10,000,000 | 3.82 | % | 10,000,000 | 3.82 | % | ||||||||||
| $ | 28,645,000 | 3.66 | % | $ | 27,892,000 | 4.53 | % | |||||||||
A-34
Advances totaling $10.0 million are convertible by the FHLB -NY quarterly into any FHLB-NY advance at current market rate. This conversion feature is only available if the three month LIBOR resets at or above 7.50%.
Advances from the FHLB-NY were secured by a blanket assignment of the Corporation's unpledged, qualifying mortgage loans, mortgage-backed securities and investment securities. Such loans remain under the control of the Corporation. Securities are maintained in safekeeping with the FHLB-NY.
The Corporation had an available overnight line of credit with the FHLB-NY for a maximum of $51.7 million at December 31, 2007.
Securities Sold Under Agreement to Repurchase
At December 31, 2007 and 2006, securities sold under agreements to repurchase were collateralized by U.S. Treasury and agency securities having a carrying value of approximately $20,208,000 and $24,531,000, respectively. In September 2007, the Corporation entered into a wholesale repurchase agreeement with a broker to borrow $14.0 million with a maturity of 7 years. The borrowing bears a fixed interest rate of 3.25% for one year and then converts to a floating rate at 9.00% minus 3-month LIBOR measured on a quarterly basis with a 5.15% cap and a 0.0% floor. This repurchase agreement was collateralized by agency securities maintained in safekeeping by the broker. The remaining balances at December 31, 2007 as well as balances at December 31, 2006 were securities sold to Bank customers at fixed rates with maturities varying from one day to one year. These securities were maintained in a separate safekeeping account within the Corporation's control.
| December 31, | ||||||||
| 2007 | 2006 | |||||||
| Balance | $ | 17,283,000 | $ | 9,023,000 | ||||
| Weighted average interest rate | 3.56 | % | 4.70 | % | ||||
| Weighted average length of maturity | 5.7 years | 42 days | ||||||
| Maximum amount outstanding at any month end | ||||||||
| during the year | $ | 17,283,000 | $ | 9,757,000 | ||||
| Average amount outstanding during the year | $ | 12,192,000 | $ | 7,461,000 | ||||
| Average interest rate during the year | 4.13 | % | 4.43 | % | ||||
Note 10. SUBORDINATED DEBENTURES
On September 17, 2003, Stewardship Statutory Trust I (the “Trust”), a statutory business trust, and a wholly owned subsidiary of Stewardship Financial Corporation, issued $7,000,000 Fixed/Floating Rate Capital Securities (“Capital Securities”), the proceeds from which the Trust used to purchase from the Corporation, $7,217,000 of Fixed/Floating Rate Junior Subordinated Deferrable Interest Debentures (“Debentures”) maturing September 17, 2033. The Trust is obligated to distribute all proceeds of a redemption whether voluntary or upon maturity, to holders of the Capital Securities. Stewardship Financial Corporation’s obligation with respect to the Capital Securities, and the subordinated debentures, when taken together, provide a full and unconditional guarantee on a subordinated basis by Stewardship Financial Corporation of the Trust’s obligations to pay amounts when due on the Capital Securities.
The Capital Securities and the Debentures both bear a fixed interest rate of 6.75% until September 17, 2008 and thereafter shall float quarterly at a rate of 3-Month LIBOR plus 2.95%.
FASB Interpretation No. 46, “Consolidation of Variable Interest Entities” was issued in January 2003 and was reissued as FASB Interpretation No. 46 (revised December 2003) (“FIN 46R”). FIN 46 and FIN 46R provide guidance on the identification of entities controlled through means other than voting rights and specify how the Corporation should evaluate its interest in a variable interest entity for purposes of determining whether to consolidate that entity. If a variable interest entity does not effectively disperse risk among the parties involved, it must be consolidated by its primary beneficiary.
The Corporation adopted FIN 46R on December 31, 2003, deconsolidating its investment in Stewardship Statutory Trust I, the subsidiary trust formed in connection with the issuance of subordinated debentures (trust preferred securities). In July 2003, the Board of Governors of the Federal Reserve System instructed bank holding companies to continue to include trust preferred securities in their Tier I capital for regulatory purposes until notice is given to the contrary. There can be no assurance that the Federal Reserve System will continue to allow bank holding companies to include trust preferred securities in Tier I capital for regulatory purposes. As of December 31, 2007, assuming the Corporation was not allowed to include the $7,000,000 in trust preferred securities issued by Stewardship Statutory Trust I in Tier I capital, the Corporation would remain “well capitalized”.
A-35
Note 11. REGULATORY CAPITAL REQUIREMENTS
Banks and bank holding companies are subject to regulatory capital requirements administered by federal banking agencies. Capital adequacy guidelines and, additionally for banks, prompt corrective action regulations, involve quantitative measures of assets, liabilities, and certain off-balance-sheet items calculated under regulatory accounting practices. Capital amounts and classifications are also subject to qualitative judgments by regulators. Failure to meet capital requirements can initiate regulatory action. Regulations of the Board of Governors of the Federal Reserve System (“FRB”) require bank holding companies to maintain minimum levels of regulatory capital. Under the regulations in effect at December 31, 2007, the Corporation was required to maintain (i) a minimum leverage ratio of Tier 1 capital to total adjusted assets of 4.0% and (ii) minimum ratios of Tier 1 and total capital to risk-weighted assets of 4.0% and 8.0%, respectively. The Bank must comply with substantially similar capital regulations promulgated by the FDIC.
Prompt corrective action regulations provide five classifications: well capitalized, adequately capitalized, undercapitalized, significantly undercapitalized, and critically undercapitalized, although these terms are not used to represent overall financial condition. If adequately categorized, regulatory approval is required to accept brokered deposits. If undercapitalized, capital distributions are limited, as is asset growth and expansion, and capital restoration plans are required.
At year end 2007 and 2006, the most recent regulatory notifications categorized the Bank as well capitalized under the regulatory framework for prompt corrective action. There are no conditions or events since that notification that management believes changed the institution’s category.
Management believes that, as of December 31, 2007, the Bank and the Corporation have met all capital adequacy requirements to which they are subject. The following is a summary of the Corporation’s and the Bank’s actual capital amounts and ratios as of December 31, 2007 and 2006, compared to the minimum capital adequacy requirements and the requirements for classification as a well capitalized institution under the prompt corrective action regulations:
| To Be Well Capitalized | ||||||||||||||||||||||||
| Required for Capital | Under Prompt Corrective | |||||||||||||||||||||||
| Actual | Adequacy Purposes | Action Regulations | ||||||||||||||||||||||
| Amount | Ratio | Amount | Ratio | Amount | Ratio | |||||||||||||||||||
| December 31, 2007 | ||||||||||||||||||||||||
| Leverage (Tier 1) capital | ||||||||||||||||||||||||
| Consolidated | $ | 47,732,000 | 8.56 | % | $ | 22,295,000 | 4.00 | % | $ | N/A | N/A | |||||||||||||
| Bank | 42,313,000 | 7.66 | % | 22,104,000 | 4.00 | % | 27,630,000 | 5.00 | % | |||||||||||||||
| Risk-based capital: | ||||||||||||||||||||||||
| Tier 1 | ||||||||||||||||||||||||
| Consolidated | 47,732,000 | 10.76 | % | 17,736,000 | 4.00 | % | N/A | N/A | ||||||||||||||||
| Bank | 42,313,000 | 9.57 | % | 17,690,000 | 4.00 | % | 26,535,000 | 6.00 | % | |||||||||||||||
| Total | ||||||||||||||||||||||||
| Consolidated | 52,189,000 | 11.77 | % | 35,473,000 | 8.00 | % | N/A | N/A | ||||||||||||||||
| Bank | 46,769,000 | 10.58 | % | 35,380,000 | 8.00 | % | 44,224,000 | 10.00 | % | |||||||||||||||
| December 31, 2006 | ||||||||||||||||||||||||
| Leverage (Tier 1) capital | ||||||||||||||||||||||||
| Consolidated | $ | 44,783,000 | 8.85 | % | $ | 20,252,000 | 4.00 | % | $ | N/A | N/A | |||||||||||||
| Bank | 39,765,000 | 7.91 | % | 20,096,000 | 4.00 | % | 25,120,000 | 5.00 | % | |||||||||||||||
| Risk-based capital: | ||||||||||||||||||||||||
| Tier 1 | ||||||||||||||||||||||||
| Consolidated | 44,783,000 | 11.25 | % | 15,930,000 | 4.00 | % | N/A | N/A | ||||||||||||||||
| Bank | 39,765,000 | 10.01 | % | 15,890,000 | 4.00 | % | 23,836,000 | 6.00 | % | |||||||||||||||
| Total | ||||||||||||||||||||||||
| Consolidated | 48,884,000 | 12.28 | % | 31,859,000 | 8.00 | % | N/A | N/A | ||||||||||||||||
| Bank | 43,866,000 | 11.04 | % | 31,781,000 | 8.00 | % | 39,726,000 | 10.00 | % | |||||||||||||||
A-36
Note 12. BENEFIT PLANS
The Corporation has a noncontributory profit sharing plan covering all eligible employees. Contributions are determined by the Corporation’s Board of Directors on an annual basis. Total profit sharing plan expense for the years ended December 31, 2007 and 2006 amounted to approximately $396,000 and $394,000, respectively.
The Corporation also has a 401(k) plan which covers all eligible employees. Participants may elect to contribute up to 15% of their salaries, not to exceed the applicable limitations as per the Internal Revenue Code. The Corporation, on an annual basis, may elect to match 50% of the participant’s first 5% contribution. Total 401(k) expense for the years ended December 31, 2007 and 2006 amounted to approximately $69,000 and $67,000, respectively.
During 1996, the Corporation adopted an Employee Stock Purchase Plan which allows all eligible employees to authorize a specific payroll deduction from his or her base compensation. Total stock purchases amounted to 3,437 and 3,231 shares during 2007 and 2006, respectively.
Note 13. STOCK-BASED COMPENSATION
At December 31, 2007, the Corporation had four types of stock award programs referred to as the Employee Stock Bonus Plan, the Director Stock Plan, an Employee Stock Option Plan and Stock Option Plans for Non-Employee Directors.
The Employee Stock Bonus Plan is intended to provide incentives which will retain highly competent key management employees of the Corporation by providing them with a bonus in the form of shares of the common stock of the Corporation. Compensation expense is based on the fair value of shares awarded on the date of the grant. The Corporation has not granted shares during 2007 and 2006 under this plan.
The Director Stock Plan permits members of the Board of Directors of the Bank to receive any monthly Board of Directors’ fees in shares of the Corporation’s common stock, rather than in cash. Beginning in June, 2006, shares were purchased for Directors in the open market and resulted in purchases of 5,207 shares for 2007 and 3,168 shares for 2006. From January 1, 2006 through May 31, 2006, the Corporation provided shares in the amount of 2,131 through reissued treasury shares or through authorized, un-issued shares.
A-37
The Employee Stock Option Plan provides for options to purchase shares of Common Stock to be issued to employees of the Corporation at the discretion of the Stock Option Committee. The committee has the authority to determine the terms and conditions of the options granted, the exercise price thereof, and whether the options are incentive or non-statutory options. The Employee Stock Option Plan has reserved 219,901 shares of common stock for issuance. The options were issued with an exercise price which represented market price of the stock at the date of grant. Options are exercisable, subject to a vesting schedule, with the first vesting starting one year from the date of the grant and expire between five and ten years from the date of grant. There were no options granted during 2007, or 2006. The plan allows for the exercise of options to be paid for in cash or with shares already owned. During 2007, 9,302 shares were used to satisfy the exercise of options. A summary of the status of the qualified stock options as of December 31, 2007 and changes during the year is presented as follows:
| 2007 | ||||||||
| Weighted | ||||||||
| Average | ||||||||
| Exercise | ||||||||
| Shares | Price | |||||||
| Outstanding at beginning of year | 79,193 | $ | 5.70 | |||||
| Exercised | (41,222 | ) | 3.86 | |||||
| Forfeited | ( 1,554 | ) | 10.63 | |||||
| Outstanding at end of year | 36,417 | $ | 7.56 | |||||
| Intrinsic value at year end | $ | 207,000 | ||||||
| Options exercisable at year end | 36,417 | |||||||
| Intrinsic value of options Exercisable | $ | 207,000 | ||||||
| Weighted-average remaining contractual term (years) | 2.51 | |||||||
The intrinsic value of options exercised was $380,000 and $12,000 for the years ended December 31, 2007 and 2006, respectively. The Corporation received cash from the exercise of options in the amount of $32,000 and $10,000 for the years ended December 31, 2007 and 2006 respectively.
The following table summarizes information about the qualified employee stock options outstanding at December 31, 2007:
| Options Outstanding | |||||||||||||||||
| Number | Weighted Avg. | Weighted | Number | ||||||||||||||
| Outstanding | Remaining | Average | Exercisable | ||||||||||||||
| at 12/31/07 | Contractual Life | Exercise Price | 12/31/07 | ||||||||||||||
| Range of Exercise Prices: | |||||||||||||||||
| $3 - 5 | 7,331 | 0.14 | $ | 4.30 | 7,331 | ||||||||||||
| $5 - 8 | 18,705 | 1.76 | 6.20 | 18,705 | |||||||||||||
| $8 -11 | — | — | — | — | |||||||||||||
| $11 – 14 | 10,381 | 5.54 | 12.34 | 10,381 | |||||||||||||
| $3 -14 | 36,417 | 2.51 | $ | 7.56 | 36,417 | ||||||||||||
The 2001 Stock Option Plan for Non-Employee Directors provided for options to purchase shares of common stock to be issued to Directors of the Corporation. The plan reserved 168,852 shares of common stock for issuance. The options to be issued with an exercise price which represented market price of the stock at the date of grant. There were no options granted during 2007 or 2006. The plan allows for the exercise of options to be paid for in cash or with shares already owned. During 2006, 9,000 shares were used to satisfy the exercise options.
A-38
On May 9, 2006 the shareholders approved the 2006 Stock Option Plan for Non-Employee Directors. The Plan provides for options to purchase shares of common stock to be issued to Non-Employee Directors of the Corporation. The plan reserved 66,150 shares of common stock for issuance, 20% of such options are exercisable each year for five years. Options expire on the earlier of the sixth anniversary of the date of the grant or May 15, 2012. Options were granted on June 30, 2006 to all Non-Employee Directors. A summary of the status of the nonqualified stock options issued under the 2001 and 2006 Stock Option Plan for Non-Employee Directors as of December 31, 2007 is presented below:
| 2007 | ||||||||
| Weighted- | ||||||||
| Average | ||||||||
| Exercise | ||||||||
| Shares | Price | |||||||
| Outstanding at beginning of year | 60,753 | $ | 12.34 | |||||
| Granted | — | — | ||||||
| Exercised | ( 3,307 | ) | 12.24 | |||||
| Forfeited | — | — | ||||||
| Outstanding at end of year | 57,446 | $ | 12.35 | |||||
| Intrinsic value at end of year | $ | 52,000 | ||||||
| Options exercisable at year end | 13,346 | |||||||
| Weighted average fair value of options granted during the year | $ | — | ||||||
| Intrinsic value of options exercisable | $ | 8,000 | ||||||
| Weighted average remaining contractual terms (years) | 4.22 | |||||||
The Corporation received cash from the exercise of options in the amount of $41,000 and $101,000 for the years ended December 31, 2007 and 2006 respectively. The Corporation realized a tax benefit from the options exercised in the years ended December 31, 2007 and 2006 of $3,000 and $174,000, respectively.
The fair value of the options granted for the 2006 Stock Option Plan for Non-Employee Directors was estimated on the date of the grant using the Black -Scholes option pricing model with the following assumptions used:
| Dividend Yield | 2.25 | % | ||
| Expected Volatility | 36.72 | % | ||
| Risk-Free Interest Rate | 5.21 | % | ||
| Expected Life | 6 years | |||
| Fair Value at Grant Date | $4.33 | |||
The following table summarizes information about the nonqualified Non-Employee Director stock options outstanding at December 31, 2007:
| Options Outstanding | |||||||||||||||||
| Number Outstanding at 12/31/07 | Weighted Avg. Remaining Contractual Life | Weighted Average Exercise Price | Number Exercisable 12/31/07 | ||||||||||||||
| Range of Exercise Prices: | |||||||||||||||||
| $11 - 13 | 51,818 | 4.38 | $ | 12.24 | 7,718 | ||||||||||||
| $13 – 15 | 5,628 | 2.80 | 13.31 | 5,628 | |||||||||||||
| $11 - 15 | 57,446 | 4.22 | $ | 12.35 | 13,346 | ||||||||||||
Unrecognized compensation expense totaled $161,000 and will be recognized over the next 3.4 years.
A-39
Note 14: EARNINGS PER SHARE
The following reconciles the income available to common shareholders (numerator) and the weighted average common stock outstanding (denominator) for both basic and diluted earnings per share for 2007 and 2006:
| 2007 | 2006 | |||||||
| Net income | $ | 4,607,000 | $ | 4,753,000 | ||||
| Weighted average common shares outstanding - basic | 5,293,507 | 5,271,986 | ||||||
| Effect of dilutive securities - stock options | 27,972 | 49,144 | ||||||
Weighted average common shares outstanding - diluted | 5,321,479 | 5,321,130 | ||||||
| Basic earnings per share | $ | 0.87 | $ | 0.90 | ||||
| Diluted earnings per share | $ | 0.87 | $ | 0.89 | ||||
Stock options granting 54,038 and 33,417 shares of common stock for the years ended December 31, 2007 and 2006, respectively were not considered in computing diluted earnings per share because they were antidilutive.
Note 15. INCOME TAXES
The components of income taxes (benefit) are summarized as follows:
| Year ended December 31, | ||||||||
| 2007 | �� | 2006 | ||||||
| Current tax expense: | ||||||||
| Federal | $ | 1,717,000 | $ | 2,092,000 | ||||
| State | 522,000 | 650,000 | ||||||
| 2,239,000 | 2,742,000 | |||||||
| Deferred tax benefit: | ||||||||
| Federal | (152,000 | ) | (80,000 | ) | ||||
| State | (9,000 | ) | (35,000 | ) | ||||
| (161,000 | ) | (115,000 | ) | |||||
| $ | 2,078,000 | $ | 2,627,000 | |||||
The following table presents a reconciliation between the reported income taxes and the income taxes which would be computed by applying the normal federal income tax rate (34%) to income before income taxes:
| Year ended December 31, | ||||||||
| 2007 | 2006 | |||||||
| Federal income tax. | ||||||||
| Add (deduct) effect of: | $ | 2,273,000 | $ | 2,509,000 | ||||
| State income taxes, net of federal income tax effect | 338,000 | 406,000 | ||||||
| Nontaxable interest income | (312,000 | ) | (246,000 | ) | ||||
| Life insurance | (268,000 | ) | (109,000 | ) | ||||
| Nondeductible expenses | 71,000 | 73,000 | ||||||
| Change in valuation reserve - federal | 27,000 | 17,000 | ||||||
| Other items, net | (51,000 | ) | (23,000 | ) | ||||
| Effective federal income taxes | $ | 2,078,000 | $ | 2,627,000 | ||||
A-40
The tax effects of existing temporary differences that give rise to significant portions of the deferred tax assets and deferred tax liabilities are as follows:
| December 31, | ||||||||
| 2007 | 2006 | |||||||
| Deferred tax assets: | ||||||||
| Allowance for loan losses | $ | 1,780,000 | $ | 1,638,000 | ||||
| Accrued reserves | 75,000 | 122,000 | ||||||
| Core deposit intangible amortization | 3,000 | 10,000 | ||||||
| Stock compensation | 41,000 | 20,000 | ||||||
| Nonaccrual loan interest | 19,000 | 12,000 | ||||||
| Depreciation | 212,000 | 203,000 | ||||||
| Contribution carry forward | 87,000 | 34,000 | ||||||
| State capital loss carry forward | 111,000 | 7,000 | ||||||
| Unrealized losses on securities available for sale | — 381,000 | |||||||
| Other | — | 1,000 | ||||||
| 2,328,000 | 2,428,000 | |||||||
| Valuation reserve | (94,000 | ) | (41,000 | ) | ||||
| 2,234,000 | 2,387,000 | |||||||
| Deferred tax liabilities: | ||||||||
| Unrealized gains on securities available for sale | 171,000 | — | ||||||
| Other | 66,000 | — | ||||||
| 237,000 | — | |||||||
| Net deferred tax assets | $ | 1,997,000 | $ | 2,387,000 | ||||
There were no unrecognized tax benefits during the year or at the year ending December 31, 2007.
There were no tax interest and penalties recorded in the income statement for the year ended December 31, 2007. There were no tax interest and penalties accrued for the year ended December 31, 2007.
The Corporation and its subsidiaries are subject to U.S. federal income tax as well as income tax of the state of New Jersey. The Corporation is no longer subject to examination by taxing authorities for years before 2004.
Note 16. COMMITMENTS AND CONTINGENCIES
Loan Commitments
The Corporation is a party to financial instruments with off-balance sheet risk in the normal course of business to meet the financing needs of its customers. These financial instruments include commitments to extend credit and standby letters of credit. Those instruments involve, to varying degrees, elements of credit and interest rate risk in excess of the amount recognized in the consolidated financial statements. The contract or notional amounts of those instruments reflect the extent of involvement the Corporation has in particular classes of financial instruments.
A-41
The Corporation's exposure to credit loss in the event of nonperformance by the other party to the financial instrument for commitments to extend credit and standby letters of credit is represented by the contractual notional amount of those instruments. The Corporation uses the same credit policies in making commitments and conditional obligations as it does for on-balance sheet instruments.
At December 31, 2007, the Corporation had mortgage commitments to extend credit aggregating approximately $1.9 million at fixed rates averaging 5.86%. All these loan commitments will be sold to investors upon closing. Commercial, construction, and home equity loan commitments of approximately $12.7 million were extended with variable rates currently averaging 7.05% and $1.1 million were extended at fixed rates averaging 6.13%. All commitments were due to expire within approximately 120 days.
Additionally, at December 31, 2007, the Corporation was committed for approximately $81.7 million of unused lines of credit, consisting of $25.3 million relating to a home equity line of credit program and an unsecured line of credit program (cash reserve), and $56.4 million relating to commercial and construction lines of credit. Amounts drawn on the unused lines of credit are predominantly assessed interest at rates which fluctuate with the base rate.
Commitments under standby and commercial letters of credit aggregated approximately $3.7 million at December 31, 2007, of which $3.6 million expires within one year. Should any letter of credit be drawn on, the interest rate charged on the resulting note would fluctuate with the Corporation's base rate. Commitments to extend credit are agreements to lend to a customer as long as there is no violation of any condition established in the contract. Commitments generally have fixed expiration dates or other termination clauses and may require payment of a fee. Since many of the commitments may expire without being drawn upon, the total commitment amounts do not necessarily represent future cash requirements. The Corporation evaluates each customer's creditworthiness on a case-by-case basis. The amount of collateral obtained, if deemed necessary by the Corporation upon extension of credit, is based on management's credit evaluation of the counter-party. Collateral held varies, but may include accounts receivable, inventory, property, plant and equipment, and income-producing commercial properties.
Standby and commercial letters of credit are conditional commitments issued by the Corporation to guarantee payment or performance of a customer to a third party. Those guarantees are primarily issued to support public and private borrowing arrangements, including commercial paper, bond financing and similar transactions. The credit risk involved in issuing letters of credit is essentially the same as that involved in extending loan facilities to customers. The Corporation obtains collateral supporting those commitments for which collateral is deemed necessary.
Lease Commitments
Rentals under long-term operating lease for branch offices amounted to approximately $766,000 and $642,000 during the years ended December 31, 2007 and 2006, respectively. At December 31, 2007, the minimum rental commitments on the noncancellable leases with an initial term of one year or more and expiring thereafter is as follows:
| Year Ending | Minimum | |||
| December 31 | Rent | |||
| 2008 | $ | 829,000 | ||
| 2009 | 776,000 | |||
| 2010 | 757,000 | |||
| 2011 | 743,000 | |||
| 2012 | 724,000 | |||
| Thereafter | 3,833,000 | |||
| $ | 7,662,000 | |||
Contingencies
The Corporation is also subject to litigation which arises primarily in the ordinary course of business In the opinion of management the ultimate disposition of such litigation should not have a material adverse effect on the financial position of the Corporation.
A-42
Note 17. DIVIDEND LIMITATION
The Corporation's ability to pay cash dividends is based on its ability to receive cash from its bank subsidiary. Banking regulations limit the amount of dividends that may be paid without prior approval of regulatory agencies. Under these regulations, the amount of dividends that may be paid in any calendar year is limited to the current year’s profits, combined with the retained net profits of the proceeding two years. At December 31, 2007, this restriction did not result in any effective limitation in the manner in which the Bank is currently operating.
Note 18. FAIR VALUE OF FINANCIAL INSTRUMENTS
Fair value estimates, methods and assumptions are set forth below for the Corporation's financial instruments.
| December 31, | ||||||||||||||||
| 2007 | 2006 | |||||||||||||||
| Carrying | Estimated | Carrying | Estimated | |||||||||||||
| Amount | Fair Value | Amount | Fair Value | |||||||||||||
| (Dollars in thousands) | ||||||||||||||||
| Financial assets: | ||||||||||||||||
| Cash and cash equivalents | $ | 11,932 | $ | 11,932 | $ | 15,697 | $ | 15,697 | ||||||||
| Securities available for sale | 76,957 | 76,957 | 72,746 | 72,746 | ||||||||||||
| Securities held to maturity | 41,189 | 41,508 | 39,163 | 38,881 | ||||||||||||
| FHLB-NY stock | 1,983 | 1,983 | 1,899 | 1,899 | ||||||||||||
| Net loans | 415,690 | 415,900 | 365,443 | 362,043 | ||||||||||||
| Mortgage loans held for sale | 1,284 | 1,300 | 2,155 | 2,183 | ||||||||||||
| Accrued interest receivable | 3,112 | 3,112 | 2,912 | 2,912 | ||||||||||||
| Financial liabilities: | ||||||||||||||||
| Deposits | 472,299 | 473,981 | 434,223 | 434,223 | ||||||||||||
| Securities sold under agreements to repurchase | 17,283 | 17,283 | 9,023 | 9,023 | ||||||||||||
| Other borrowings | 28,645 | 28,585 | 27,892 | 26,655 | ||||||||||||
| Subordinated debenture | 7,217 | 7,430 | 7,217 | 7,436 | ||||||||||||
| Accrued interest payable | 2,080 | 2,080 | 1,721 | 1,721 | ||||||||||||
A-43
The following methods and assumptions were used to estimate the fair value of each class of financial instruments:
Cash and cash equivalents
The carrying amount approximates fair value.
Securities available for sale
All securities available for sale are actively traded and have been valued using quoted market prices.
Securities held to maturity
All securities held to maturity are actively traded and have been valued using quoted market prices.
FHLB-NY stock
The carrying amount approximates fair value.
Net loans
Fair values are estimated for portfolios of loan with similar financial characteristics. Loans are segregated by type such as residential and commercial mortgages, commercial and other installment. The fair value of loans is estimated by discounting cash flows using estimated market discount rates which reflect the credit and interest rate risk inherent in the loans.
Mortgage loans held for sale
Loans in this category have been committed for sale to investors at the current carrying amount.
Accrued interest receivable
The carrying amount approximates fair value.
Deposits
The fair value of deposits, with no stated maturity, such as noninterest-bearing demand deposits, savings, NOW and money market accounts, is equal to the amount payable on demand as of December 31, 2007 and 2006, respectively. The fair value of the certificates of deposit is based on the discounted value of cash flows. The discount rate is estimated using market discount rates which reflect interest rate risk inherent in the certificates of deposit.
Securities sold under agreements to repurchase
The carrying value approximates fair value due to the relatively short time before maturity.
Other borrowings
The carrying amount of the borrowings which mature in one day approximates fair value. For the borrowings with a longer maturity, the fair value is based on the discounted value of the cash flows. The discount rate is estimated using market discount rates which reflect the interest rate risk inherent in the term borrowings.
Subordinated debenture
The fair value of the subordinated debenture is based on the discounted value of the cash flows. The discounted rate is estimated using market discount rates which reflect the interest rate risk inherent in the debenture.
Accrued interest payable
The carrying valve approximates fair value.
Commitments to extend credit
The fair value of commitments is estimated using the fees currently charged to enter into similar agreements, taking into account the remaining terms of the agreements and the present credit worthiness of the counter parties, and at December 31, 2007 and 2006 were not material.
Limitations
The preceding fair value estimates were made at December 31, 2007 and 2006, based on pertinent market data and relevant information on the financial instruments. These estimates do not include any premium or discount that could result from an offer to sell at one time the Corporation's entire holdings of a particular financial instrument or category thereof. Since no market exists for a substantial portion of the Corporation's financial instruments, fair value estimates were necessarily based on judgements with respect to future expected loss experience, current economic conditions, risk assessments of various financial instruments, and other factors. Given the subjective nature of these estimates, the uncertainties surrounding them and the matters of significant judgement that must be applied, these fair value estimates cannot be calculated with precision. Modifications in such assumptions could meaningfully alter these estimates.
Since these fair value approximations were made solely for on and off balance sheet financial instruments at December 31, 2007 and 2006, no attempt was made to estimate the value of anticipated future business. Furthermore, certain tax implications related to the realization of unrealized gains and losses could have a substantial impact on these fair value estimates and have not been incorporated into the estimates.
A-44
Note 19. PARENT COMPANY ONLY
The Corporation was formed in January, 1995, to operate its subsidiary, Atlantic Stewardship Bank. The earnings of the bank are recognized by the Corporation using the equity method of accounting. Accordingly, the bank dividends paid reduce the Corporation's investment in the subsidiary. In 2003, the Corporation formed its second subsidiary, Stewardship Statutory Trust, to offer trust preferred securities. Condensed financial statements are presented below:
| Condensed Statements of Financial Condition | Years ended December 31, | |||||||
| 2007 | 2006 | |||||||
| Assets | ||||||||
| Cash and due from banks | $ | 652,000 | $ | 306,000 | ||||
| Securities available for sale | 2,574,000 | 4,470,000 | ||||||
| Securities held to maturity | 1,991,000 | — | ||||||
| Investment in subsidiary | 42,658,000 | 39,307,000 | ||||||
| Accrued interest receivable | 43,000 | 40,000 | ||||||
| Other assets | 420,000 | 441,000 | ||||||
| Total assets | $ | 48,338,000 | $ | 44,564,000 | ||||
| Liabilities and Stockholders’ equity | ||||||||
| Subordinated debentures | $ | 7,217,000 | $ | 7,217,000 | ||||
| Other liabilities | 31,000 | 41,000 | ||||||
| Stockholders' equity | 41,090,000 | 37,306,000 | ||||||
| Total liabilities and Stockholders' equity | $ | 48,338,000 | $ | 44,564,000 | ||||
| Condensed Statements of Income | Years ended December 31, | |||||||
| 2007 | 2006 | |||||||
| Interest income - securities available for sale | $ | 226,000 | $ | 177,000 | ||||
| Interest income - securities held to maturity | 13,000 | — | ||||||
| Dividend income | 2,450,000 | 1,853,000 | ||||||
| Loss on sale of available for sale securities | — | (90,000 | ) | |||||
| Other income | 15,000 | 15,000 | ||||||
| Total income | 2,704,000 | 1,955,000 | ||||||
| Interest expense | 487,000 | 487,000 | ||||||
| Other expenses | 220,000 | 173,000 | ||||||
| Total expenses | 707,000 | 660,000 | ||||||
| Income before income tax benefit | 1,997,000 | 1,295,000 | ||||||
| Tax benefit | (153,000 | ) | (190,000 | ) | ||||
| Income before equity in undistributed earnings of subsidiary | 2,150,000 | 1,485,000 | ||||||
| Equity in undistributed earnings of subsidiary | 2,457,000 | 3,268,000 | ||||||
| Net income | $ | 4,607,000 | $ | 4,753,000 | ||||
A-45
| Condensed Statements of Cash Flows | Years ended December 31, | |||||||
| 2007 | 2006 | |||||||
| Cash flows from operating activities | ||||||||
| Net income | $ | 4,607,000 | $ | 4,753,000 | ||||
| Adjustments to reconcile net income to net cash provided by operating activities: | ||||||||
| Equity in undistributed earnings of subsidiary | (2,457,000 | ) | (3,268,000 | ) | ||||
| Loss on sale of securities available for sale | — | 90,000 | ||||||
| Accretion of discounts | — | (2,000 | ) | |||||
| Decrease (increase) in accrued interest receivable | (3,000 | ) | 5,000 | |||||
| Decrease (increase) in other assets | 7,000 | (47,000 | ) | |||||
| Decrease in other liabilities | (11,000 | ) | (33,000 | ) | ||||
| Net cash provided by operating activities | 2,143,000 | 1,498,000 | ||||||
| Cash flows from investing activities: | ||||||||
| Purchase of security held to maturity | (1,991,000 | ) | — | |||||
| Purchase of securities available for sale | (1,562,000 | ) | (3,500,000 | ) | ||||
| Proceeds from sales and calls on securities available for sale | 3,500,000 | 3,404,000 | ||||||
| Net cash used in investing activities | (53,000 | ) | (96,000 | ) | ||||
| Cash flows from financing activities: | ||||||||
| Cash dividends paid on common stock | (1,816,000 | ) | (1,118,000 | ) | ||||
| Payment of discount on dividend reinvestment plan | (43,000 | ) | (19,000 | ) | ||||
| Exercise of stock options | 73,000 | 101,000 | ||||||
| Purchase of treasury stock | — | (415,000 | ) | |||||
| Issuance of common stock | 42,000 | 69,000 | ||||||
| Net cash used in investing activities | (1,744,000 | ) | (1,382,000 | ) | ||||
| Net increase in cash and cash equivalents | 346,000 | 20,000 | ||||||
| Cash and cash equivalents - beginning | 306,000 | 286,000 | ||||||
| Cash and cash equivalents - ending | $ | 652,000 | $ | 306,000 | ||||
| Supplemental disclosures of cash flow information: | ||||||||
| Noncash financing activities - issuance of common stock under dividend reinvestment plan | $ | — | $ | 412,000 | ||||
A-46
NOTE 20. RECENT ACCOUNTING PRONOUNCEMENTS
Adoption of New Accounting Standards:
FASB Statement of Financial Accounting Standard No. 155, “Accounting for Certain Hybrid Financial Instruments-an amendment to FASB Statements No. 133 and 140”
In February 2006, the Financial Accounting Standards Board (FASB) issued Statement of Financial Accounting Standard No. 155, “Accounting for Certain Hybrid Financial Instruments-an amendment to FASB Statements No. 133 and 140” (SFAS No. 155). This Statement permits fair value remeasurement for hybrid financial instruments that contain an embedded derivative that otherwise would require bifurcation. Additionally, SFAS No. 155 clarifies the accounting for beneficial interests in securitizations. Under SFAS No. 155, all beneficial interests in a securitization will require an assessment in accordance with SFAS No. 133 to determine if an embedded derivative exists within the instrument. In January 2007, the FASB issued Derivatives Implementation Group Isse B40, “Application of Paragraph 13(b) to Securitized Interests in Prepayable Financial Assets” (DIG Issue B40). DIG Issue B40 provides an exemption from the embedded derivative test of paragraph 13(b) of SFAS No. 133 for instruments that would otherwise require bifurcation if the test is solely because of a prepayment feature included within the securitized interest and prepayment is not controlled by the security holder. SFAS No. 155 and DIG Issue B40 are effective for fiscal years beginning after September 15, 2006. The adoption of SFAS No. 155 and DIG Issue B40 did not have a material impact on the Corporation’s consolidated financial position or results of operations.
FASB Interpretation No. 48, “Accounting for Uncertainty in Income Taxes – an interpretation of FASB Statement No. 109”
In July 2006, the FASB issued FASB Interpretation No. 48, “Accounting for Uncertainty in Income Taxes – an interpretation of FASB Statement No. 109” (FIN 48), which prescribes a recognition threshold and measurement attribute for a tax position taken or expected to be taken in a tax return. FIN 48 also provides guidance on derecognition, classification, interest and penalties, accounting in interim periods, disclosure and transition. FIN 48 was effective for fiscal years beginning after December 15, 2006. The adoption of this statement has not had a material impact on the Corporation’s consolidated financial position or results of operation.
Effect of Newly Issued But Not Yet Effective Accounting Standards:
FASB Statement of Financial Accounting Standard No. 157, “Fair Value Measurements”
In September 2006, the FASB issued Statement of Financial Accounting Standard No. 157,” Fair Value Measurements”. This Statement defines fair value, establishes a framework for measuring fair value and expands disclosures about fair value measurements. This Statement establishes a fair value hierarchy about the assumptions used to measure fair value and clarifies assumptions about risk and the effect of a restriction on the sale or use of an asset. The standard is effective for fiscal years beginning after November 15, 2007. The Corporation does not expect the impact of this standard to be material.
FASB Statement of Financial Accounting Standard No. 159, “The Fair Value Option for Financial Assets and Financial Liabilities”
In February 2007, the FASB issued Statement No. 159, “The Fair Value Option for Financial Assets and Financial Liabilities.” The standard provides companies with an option to report selected financial assets and liabilities at fair value and establishes presentation and disclosure requirements designed to facilitate comparisons between companies that choose different measurement attributes for similar types of assets and liabilities. The new standard is effective for the Corporation on January 1, 2008. The Corporation did not elect the fair value option for any financial assets or financial liabilities as of January 1, 2008.
FASB Emerging Issues Task Force Issue No. 06-4, “Accounting for Deferred Compensation and Postretirement Benefit Aspects of Endorsement Split-Dollar Life Insurance Arrangements”
In September 2006, the FASB Emerging Issues Task Force finalized Issue No. 06-4, “Accounting for Deferred Compensation and Postretirement Benefit Aspects of Endorsement Split-Dollar Life Insurance Arrangements”. This issue requires that a liability be recorded during the service period when a split-dollar life insurance agreement continues after participants’ employment or retirement. The required accrued liability will be based on either the post-employment benefit cost for the continuing life insurance or based on the future death benefit depending on the contractual terms of the underlying agreement. This issue is effective for fiscal years beginning after December 15, 2007. The Corporation has determined that the adoption of EITF 06-4 will not have a material impact on the financial statements.
A-47
Note 21. QUARTERLY FINANCIAL DATA (Unaudited)
The following table contains quarterly financial data for the years ended December 31, 2007 and 2006 (dollars in thousands).
| Year ended December 31, 2007: | First Quarter | Second Quarter | Third Quarter | Fourth Quarter | Total | |||||||||||||||
| Interest income | $ | 7,932 | $ | 8,117 | $ | 8,526 | $ | 8,735 | $ | 33,310 | ||||||||||
| Interest expense | 3,259 | 3,315 | 3,614 | 3,692 | 13,880 | |||||||||||||||
| Net interest income before provision for loan losses | 4,673 | 4,802 | 4,912 | 5,043 | 19,430 | |||||||||||||||
| Provision for loan losses | 10 | 180 | 90 | 250 | 530 | |||||||||||||||
| Net interest income after provision for loan losses | 4,663 | 4,622 | 4,822 | 4,793 | 18,900 | |||||||||||||||
| Noninterest income | 996 | 1,506 | 915 | 997 | 4,414 | |||||||||||||||
| Noninterest expense | 3,995 | 4,182 | 3,873 | 4,579 | 16,629 | |||||||||||||||
| Net income before income tax expense | 1,664 | 1,946 | 1,864 | 1,211 | 6,685 | |||||||||||||||
| Federal and state income tax expense | 578 | 492 | 635 | 373 | 2,078 | |||||||||||||||
| Net income | $ | 1,086 | $ | 1,454 | $ | 1,229 | $ | 838 | $ | 4,607 | ||||||||||
| Basic earnings per share | $ | 0.21 | $ | 0.27 | $ | 0.23 | $ | 0.16 | $ | 0.87 | ||||||||||
| Diluted earnings per share | $ | 0.21 | $ | 0.27 | $ | 0.23 | $ | 0.16 | $ | 0.87 | ||||||||||
| Year ended December 31, 2006: | First Quarter | Second Quarter | Third Quarter | Fourth Quarter | Total | |||||||||||||||
| Interest income | $ | 6,984 | $ | 7,334 | $ | 7,793 | $ | 7,889 | $ | 30,000 | ||||||||||
| Interest expense | 2,307 | 2,572 | 2,928 | 3,109 | 10,916 | |||||||||||||||
| Net interest income before provision for loan losses | 4,677 | 4,762 | 4,865 | 4,780 | 19,084 | |||||||||||||||
| Provision for loan losses | 50 | 110 | 90 | 14 | 264 | |||||||||||||||
| Net interest income after provision for loan losses | 4,627 | 4,652 | 4,775 | 4,766 | 18,820 | |||||||||||||||
| Noninterest income | 870 | 1,032 | 983 | 1,304 | 4,189 | |||||||||||||||
| Noninterest expense | 3,778 | 3,863 | 3,868 | 4,120 | 15,629 | |||||||||||||||
| Net income before income tax expense | 1,719 | 1,821 | 1,890 | 1,950 | 7,380 | |||||||||||||||
| Federal and state income tax expense | 610 | 654 | 665 | 698 | 2,627 | |||||||||||||||
| Net income | $ | 1,109 | $ | 1,167 | $ | 1,225 | $ | 1,252 | $ | 4,753 | ||||||||||
| Basic earnings per share | $ | 0.21 | $ | 0.22 | $ | 0.23 | $ | 0.24 | $ | 0.90 | ||||||||||
| Diluted earnings per share | $ | 0.21 | $ | 0.22 | $ | 0.23 | $ | 0.23 | $ | 0.89 | ||||||||||
A-48