Analyst Day February 28, 2017 Exhibit 99.1

Forward Looking Statements and Non-GAAP Financial Information This presentation contains forward-looking statements within the meaning of federal securities laws, which are subject to risks and uncertainties. All statements other than statements of historical facts contained in this presentation are forward-looking statements. Forward-looking statements give our current expectations and projections relating to our financial condition, results of operations, plans, objectives, future performance and business. These statements may include words such “may,” “will,” “should,” “expect,” “plan,” “anticipate,” “could,” “intend,” “target,” “project,” “contemplate,” “believe,” “estimate,” “predict,” “potential” or “continue” or other words and terms of similar meaning. These forward-looking statements are based on assumptions that we have made in light of our industry experience and on our perceptions of historical trends, current conditions, expected future developments and other factors we believe are appropriate under the circumstances. As you consider this presentation, you should understand that these statements are not guarantees of performance or results. They involve risks, uncertainties (some of which are beyond our control) and assumptions. Although we believe that these forward-looking statements are based on reasonable assumptions, you should be aware that many factors could affect our actual financial results and other events and cause them to differ materially from those anticipated in the forward-looking statements. You should read carefully the more detailed information set forth under “Risk Factors” and the other information included in our Annual Report on Form 10-K for the year ended December 31, 2016 before deciding to invest in our common stock. Because of these factors, we caution that you should not place undue reliance on any of our forward-looking statements. Further, any forward-looking statement speaks only as of the date on which it is made. New risks and uncertainties arise from time to time, and it is impossible for us to predict those events or how they may affect us. Except as required by law, we have no duty to, and do not intend to, update or revise the forward-looking statements in this presentation after the date of this presentation. This presentation refers to “Adjusted Operating Income,” “Adjusted EBITDA,” “Adjusted Earnings per Share (“EPS”)” and “Free Cash Flow.” Adjusted Operating Income, Adjusted EBITDA, Adjusted EPS, Free Cash Flow and derivations thereof are not measures of financial performance or liquidity under generally accepted accounting principles (“GAAP”) and the use of Adjusted Operating Income, Adjusted EBITDA, Adjusted EPS and Free Cash Flow is limited because they do not include certain material costs necessary to operate our business. In addition, Adjusted Operating Income, Adjusted EBITDA, Adjusted EPS and Free Cash Flow, as presented, may not be comparable to similarly titled measures of other companies. We present these non-GAAP measures as we understand investors use them as measures of our historical ability to service debt and compliance with covenants in our senior secured credit facilities. We also utilize these non-GAAP measures to make decisions about the use of resources, analyze performance and measure management’s performance with stated objectives. See www.west.com for a reconciliation of non-GAAP measures contained in this presentation.
Agenda 4 Welcome – Dave Pleiss Overview – Tom Barker Safety Services – Ron Beaumont Interactive Services – Skip Hanson Break Conferencing & Collaboration / UCaaS – Scott Etzler Healthcare Advocacy – Matt Yost Healthcare – Nancee Berger Finance – Jan Madsen Wrap Up / Q&A – Tom Barker Lunch
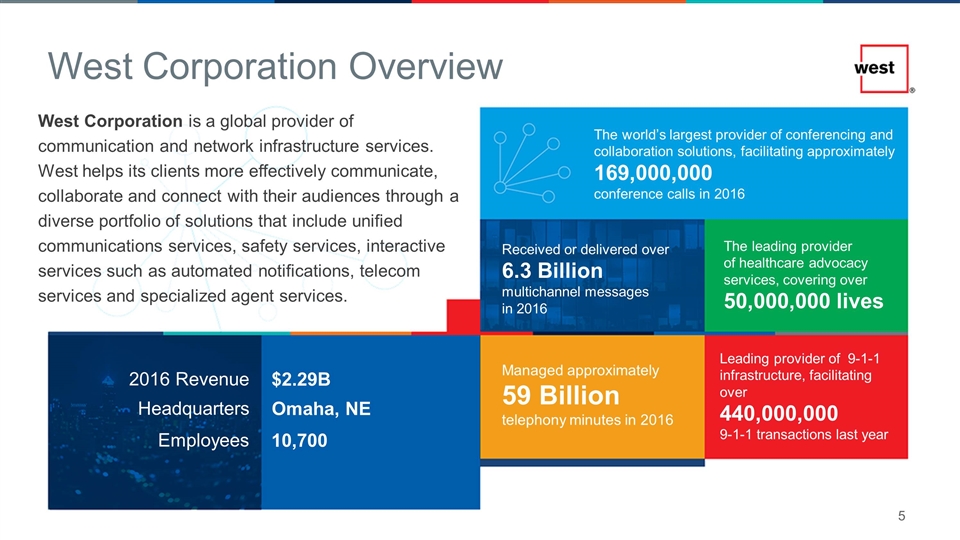
West Corporation Overview West Corporation is a global provider of communication and network infrastructure services. West helps its clients more effectively communicate, collaborate and connect with their audiences through a diverse portfolio of solutions that include unified communications services, safety services, interactive services such as automated notifications, telecom services and specialized agent services. 2016 Revenue $2.29B Headquarters Omaha, NE Employees 10,700 The world’s largest provider of conferencing and collaboration solutions, facilitating approximately 169,000,000 conference calls in 2016 Received or delivered over 6.3 Billion multichannel messages in 2016 The leading provider of healthcare advocacy services, covering over 50,000,000 lives Managed approximately 59 Billion telephony minutes in 2016 Leading provider of 9-1-1 infrastructure, facilitating over 440,000,000 9-1-1 transactions last year
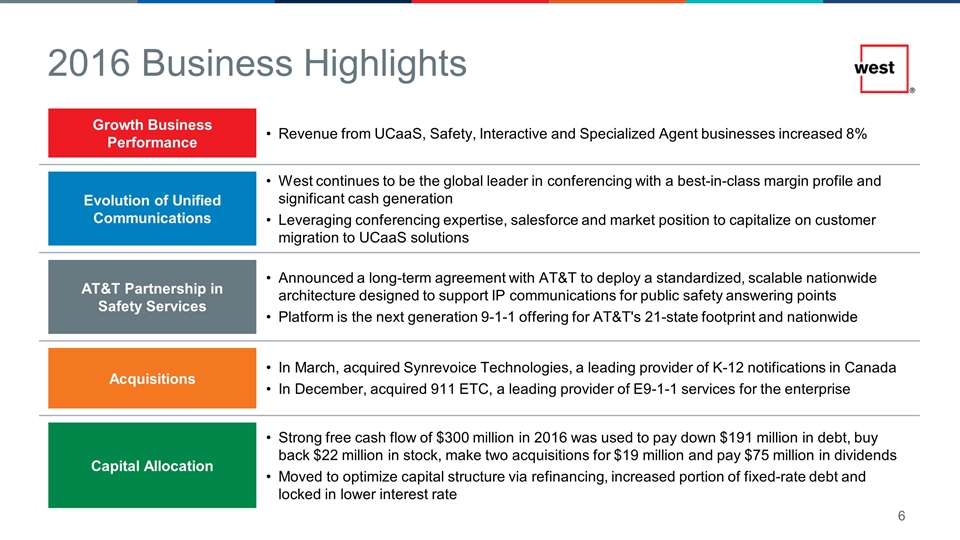
Revenue from UCaaS, Safety, Interactive and Specialized Agent businesses increased 8% Growth Business Performance Acquisitions In March, acquired Synrevoice Technologies, a leading provider of K-12 notifications in Canada In December, acquired 911 ETC, a leading provider of E9-1-1 services for the enterprise 2016 Business Highlights Capital Allocation Strong free cash flow of $300 million in 2016 was used to pay down $191 million in debt, buy back $22 million in stock, make two acquisitions for $19 million and pay $75 million in dividends Moved to optimize capital structure via refinancing, increased portion of fixed-rate debt and locked in lower interest rate Announced a long-term agreement with AT&T to deploy a standardized, scalable nationwide architecture designed to support IP communications for public safety answering points Platform is the next generation 9-1-1 offering for AT&T's 21-state footprint and nationwide AT&T Partnership in Safety Services West continues to be the global leader in conferencing with a best-in-class margin profile and significant cash generation Leveraging conferencing expertise, salesforce and market position to capitalize on customer migration to UCaaS solutions Evolution of Unified Communications

Today’s Themes Exciting Growth Opportunities Across Portfolio Strong Cash Flow Capital Allocation to Drive Shareholder Value Continued Commitment to Operational Excellence
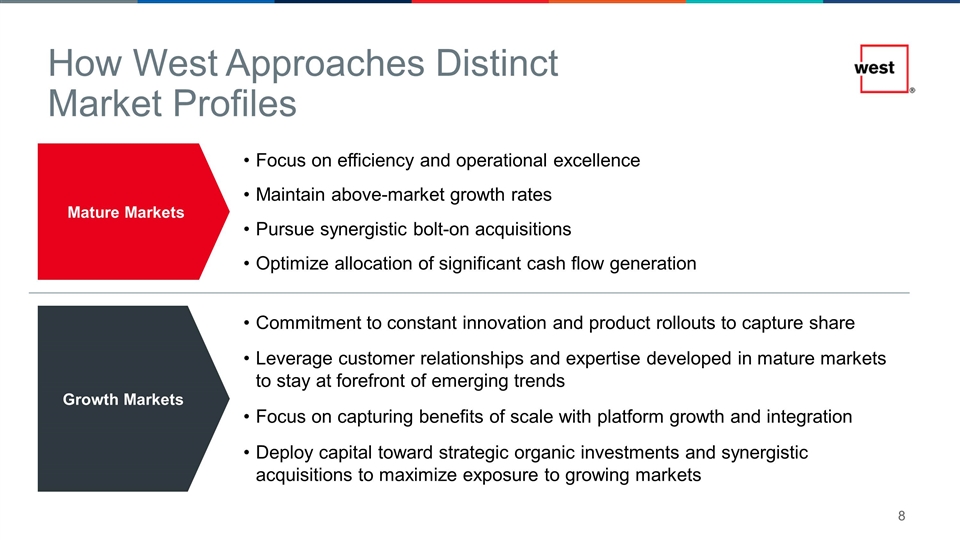
Mature Markets Growth Markets Focus on efficiency and operational excellence Maintain above-market growth rates Pursue synergistic bolt-on acquisitions Optimize allocation of significant cash flow generation Commitment to constant innovation and product rollouts to capture share Leverage customer relationships and expertise developed in mature markets to stay at forefront of emerging trends Focus on capturing benefits of scale with platform growth and integration Deploy capital toward strategic organic investments and synergistic acquisitions to maximize exposure to growing markets How West Approaches Distinct Market Profiles
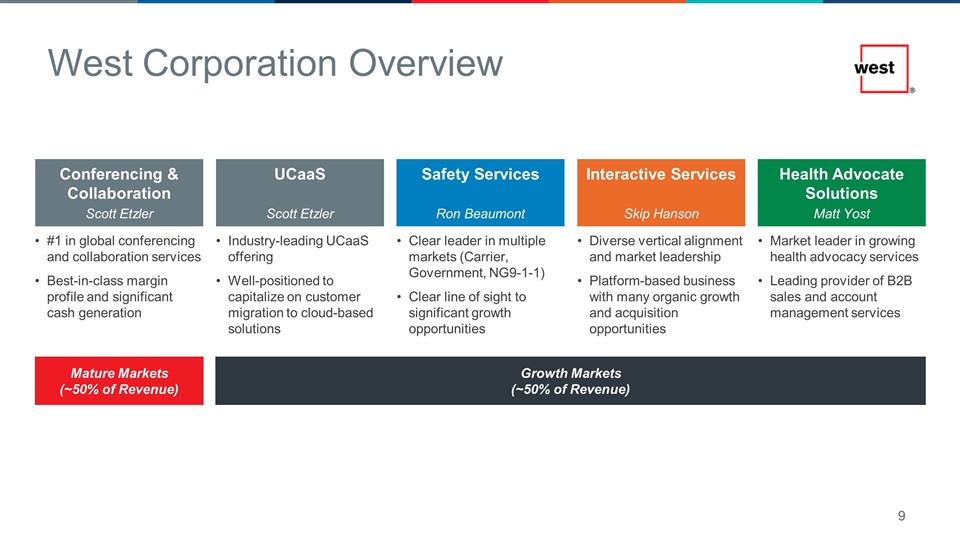
West Corporation Overview Conferencing & Collaboration Interactive Services Safety Services Health Advocate Solutions #1 in global conferencing and collaboration services Best-in-class margin profile and significant cash generation Clear leader in multiple markets (Carrier, Government, NG9-1-1) Clear line of sight to significant growth opportunities Diverse vertical alignment and market leadership Platform-based business with many organic growth and acquisition opportunities Market leader in growing health advocacy services Leading provider of B2B sales and account management services UCaaS Industry-leading UCaaS offering Well-positioned to capitalize on customer migration to cloud-based solutions Mature Markets (~50% of Revenue) Growth Markets (~50% of Revenue) Scott Etzler Scott Etzler Ron Beaumont Skip Hanson Matt Yost
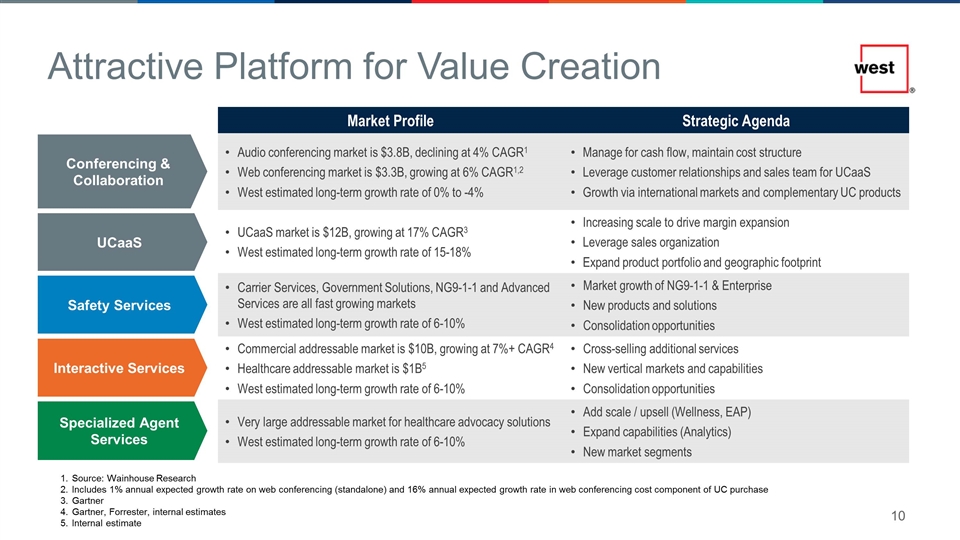
Conferencing & Collaboration UCaaS Interactive Services Safety Services Specialized Agent Services Market Profile Strategic Agenda Audio conferencing market is $3.8B, declining at 4% CAGR1 Web conferencing market is $3.3B, growing at 6% CAGR1,2 West estimated long-term growth rate of 0% to -4% Manage for cash flow, maintain cost structure Leverage customer relationships and sales team for UCaaS Growth via international markets and complementary UC products UCaaS market is $12B, growing at 17% CAGR3 West estimated long-term growth rate of 15-18% Increasing scale to drive margin expansion Leverage sales organization Expand product portfolio and geographic footprint Carrier Services, Government Solutions, NG9-1-1 and Advanced Services are all fast growing markets West estimated long-term growth rate of 6-10% Market growth of NG9-1-1 & Enterprise New products and solutions Consolidation opportunities Commercial addressable market is $10B, growing at 7%+ CAGR4 Healthcare addressable market is $1B5 West estimated long-term growth rate of 6-10% Cross-selling additional services New vertical markets and capabilities Consolidation opportunities Very large addressable market for healthcare advocacy solutions West estimated long-term growth rate of 6-10% Add scale / upsell (Wellness, EAP) Expand capabilities (Analytics) New market segments Attractive Platform for Value Creation Source: Wainhouse Research Includes 1% annual expected growth rate on web conferencing (standalone) and 16% annual expected growth rate in web conferencing cost component of UC purchase Gartner Gartner, Forrester, internal estimates Internal estimate
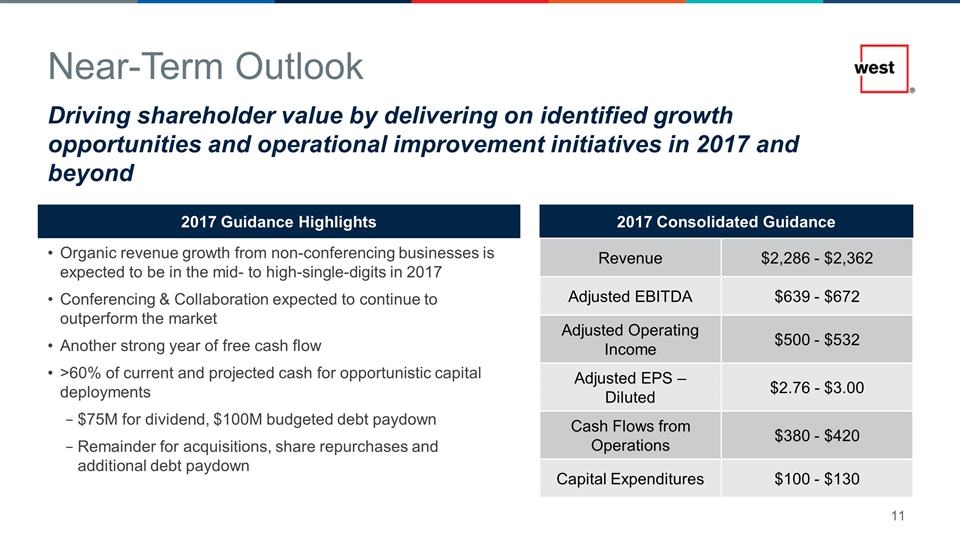
Near-Term Outlook Driving shareholder value by delivering on identified growth opportunities and operational improvement initiatives in 2017 and beyond 2017 Guidance Highlights Organic revenue growth from non-conferencing businesses is expected to be in the mid- to high-single-digits in 2017 Conferencing & Collaboration expected to continue to outperform the market Another strong year of free cash flow >60% of current and projected cash for opportunistic capital deployments $75M for dividend, $100M budgeted debt paydown Remainder for acquisitions, share repurchases and additional debt paydown 2017 Consolidated Guidance Revenue $2,286 - $2,362 Adjusted EBITDA $639 - $672 Adjusted Operating Income $500 - $532 Adjusted EPS – Diluted $2.76 - $3.00 Cash Flows from Operations $380 - $420 Capital Expenditures $100 - $130
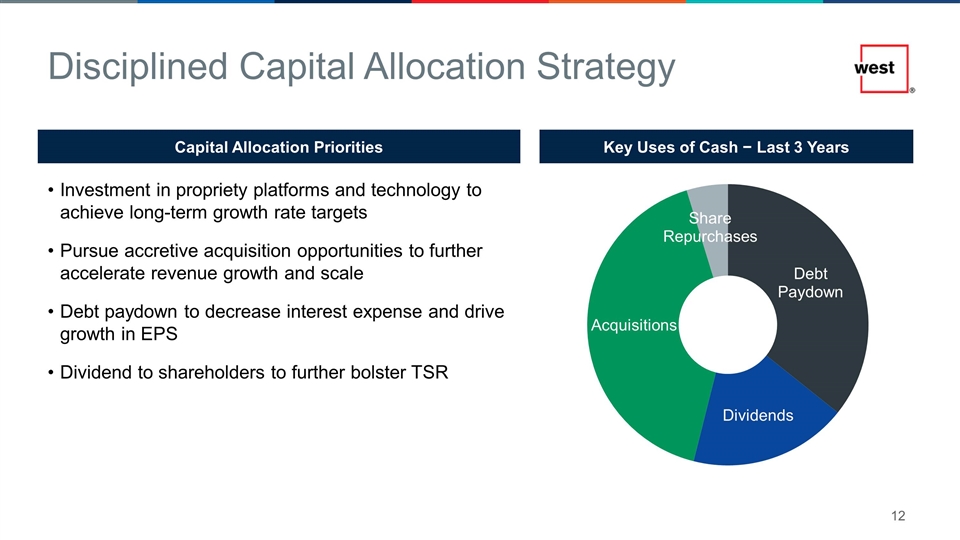
Disciplined Capital Allocation Strategy Investment in propriety platforms and technology to achieve long-term growth rate targets Pursue accretive acquisition opportunities to further accelerate revenue growth and scale Debt paydown to decrease interest expense and drive growth in EPS Dividend to shareholders to further bolster TSR Capital Allocation Priorities Key Uses of Cash − Last 3 Years

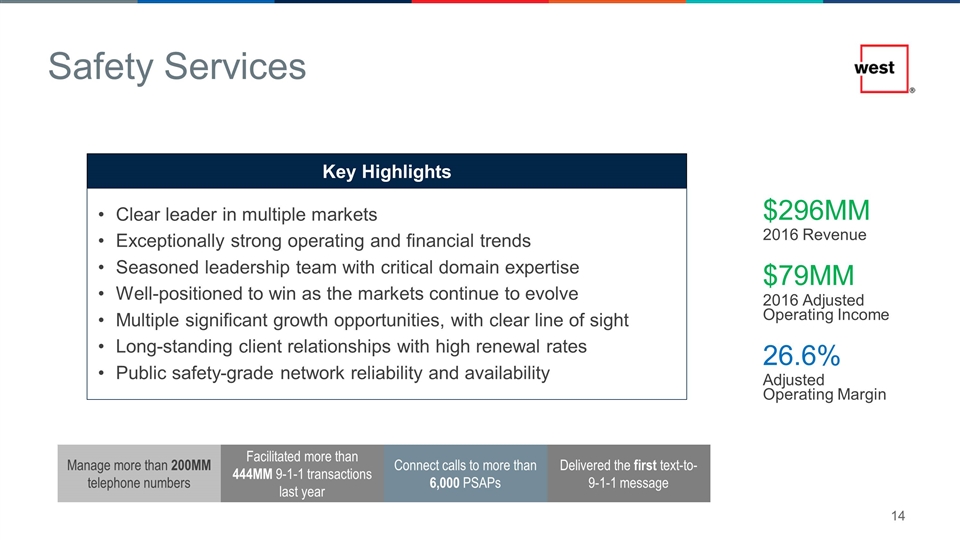
$296MM 2016 Revenue $79MM 2016 Adjusted Operating Income 26.6% Adjusted Operating Margin Manage more than 200MM telephone numbers Connect calls to more than 6,000 PSAPs Facilitated more than 444MM 9-1-1 transactions last year Delivered the first text-to-9-1-1 message Key Highlights Clear leader in multiple markets Exceptionally strong operating and financial trends Seasoned leadership team with critical domain expertise Well-positioned to win as the markets continue to evolve Multiple significant growth opportunities, with clear line of sight Long-standing client relationships with high renewal rates Public safety-grade network reliability and availability Safety Services
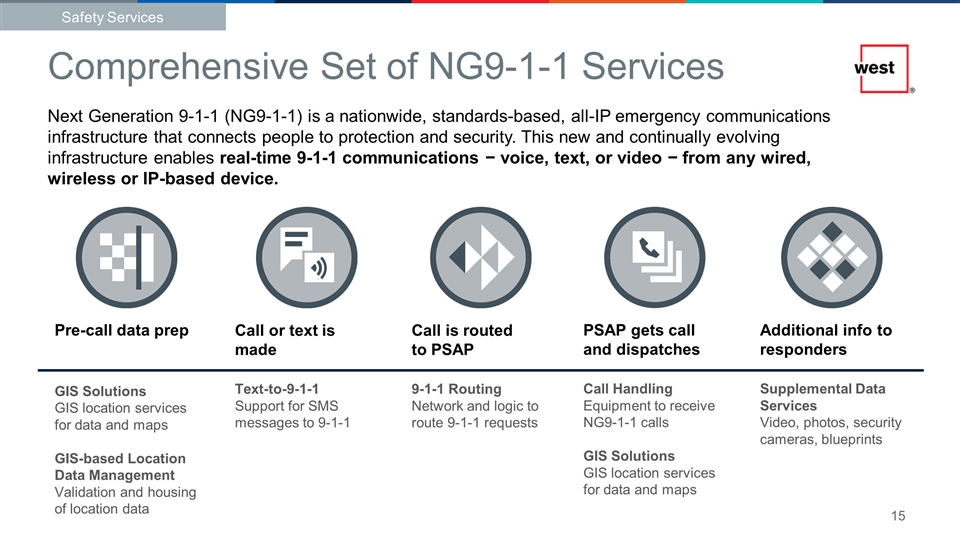
PSAP gets call and dispatches Call Handling Equipment to receive NG9-1-1 calls GIS Solutions GIS location services for data and maps Additional info to responders Supplemental Data Services Video, photos, security cameras, blueprints Call or text is made Text-to-9-1-1 Support for SMS messages to 9-1-1 Call is routed to PSAP 9-1-1 Routing Network and logic to route 9-1-1 requests Pre-call data prep GIS Solutions GIS location services for data and maps GIS-based Location Data Management Validation and housing of location data Comprehensive Set of NG9-1-1 Services Next Generation 9-1-1 (NG9-1-1) is a nationwide, standards-based, all-IP emergency communications infrastructure that connects people to protection and security. This new and continually evolving infrastructure enables real-time 9-1-1 communications − voice, text, or video − from any wired, wireless or IP-based device. Safety Services
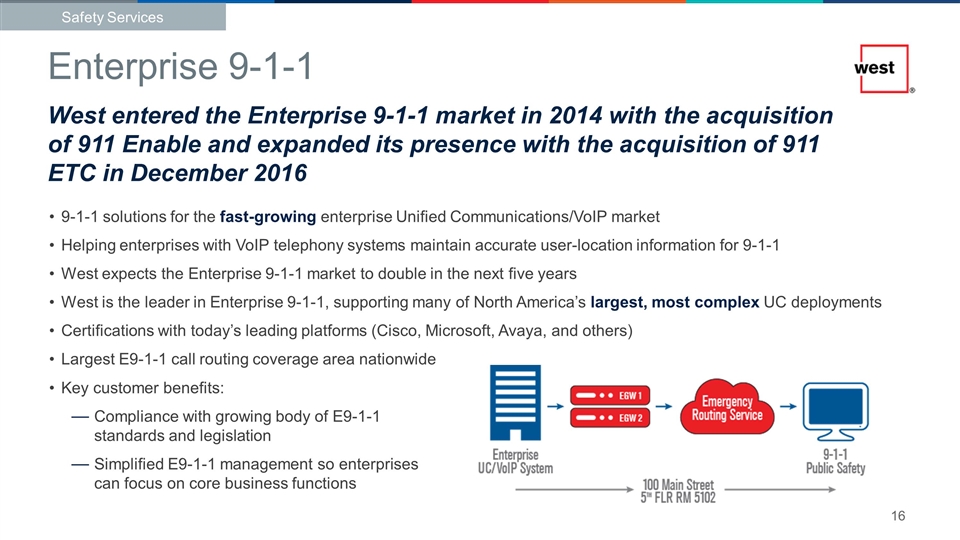
9-1-1 solutions for the fast-growing enterprise Unified Communications/VoIP market Helping enterprises with VoIP telephony systems maintain accurate user-location information for 9-1-1 West expects the Enterprise 9-1-1 market to double in the next five years West is the leader in Enterprise 9-1-1, supporting many of North America’s largest, most complex UC deployments Certifications with today’s leading platforms (Cisco, Microsoft, Avaya, and others) Largest E9-1-1 call routing coverage area nationwide Key customer benefits: Compliance with growing body of E9-1-1 standards and legislation Simplified E9-1-1 management so enterprises can focus on core business functions Enterprise 9-1-1 Safety Services West entered the Enterprise 9-1-1 market in 2014 with the acquisition of 911 Enable and expanded its presence with the acquisition of 911 ETC in December 2016
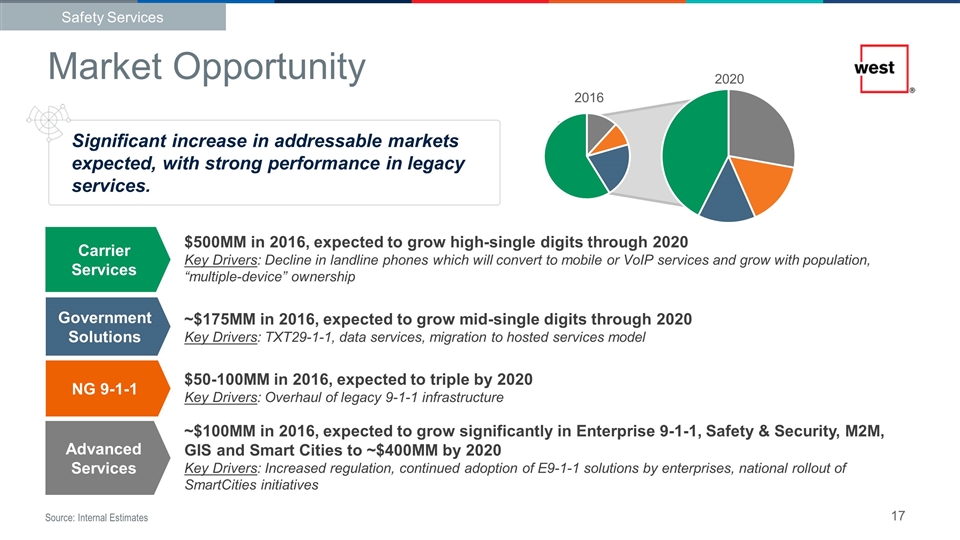
Significant increase in addressable markets expected, with strong performance in legacy services. Advanced Services NG 9-1-1 Government Solutions Carrier Services $50-100MM in 2016, expected to triple by 2020 Key Drivers: Overhaul of legacy 9-1-1 infrastructure $500MM in 2016, expected to grow high-single digits through 2020 Key Drivers: Decline in landline phones which will convert to mobile or VoIP services and grow with population, “multiple-device” ownership ~$175MM in 2016, expected to grow mid-single digits through 2020 Key Drivers: TXT29-1-1, data services, migration to hosted services model ~$100MM in 2016, expected to grow significantly in Enterprise 9-1-1, Safety & Security, M2M, GIS and Smart Cities to ~$400MM by 2020 Key Drivers: Increased regulation, continued adoption of E9-1-1 solutions by enterprises, national rollout of SmartCities initiatives Source: Internal Estimates Market Opportunity Safety Services
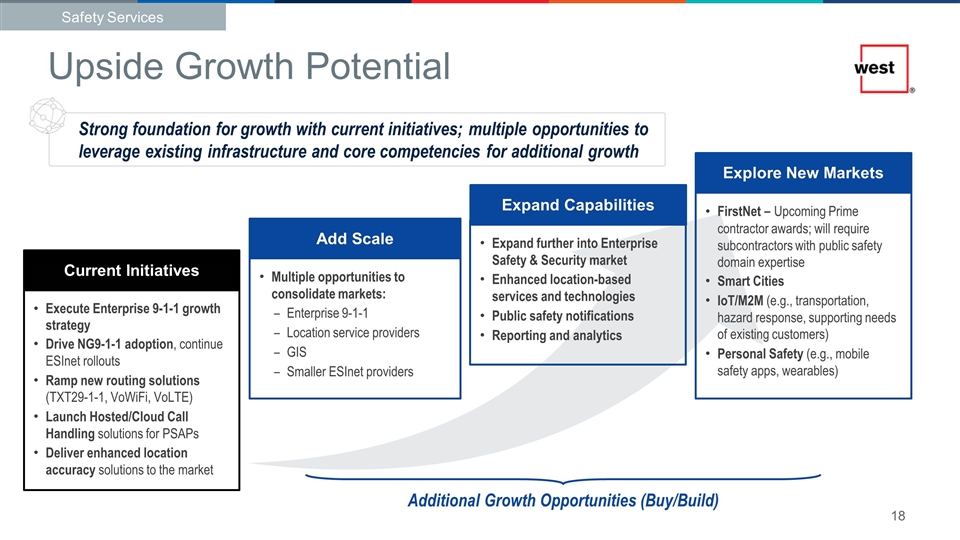
Strong foundation for growth with current initiatives; multiple opportunities to leverage existing infrastructure and core competencies for additional growth Execute Enterprise 9-1-1 growth strategy Drive NG9-1-1 adoption, continue ESInet rollouts Ramp new routing solutions (TXT29-1-1, VoWiFi, VoLTE) Launch Hosted/Cloud Call Handling solutions for PSAPs Deliver enhanced location accuracy solutions to the market Multiple opportunities to consolidate markets: Enterprise 9-1-1 Location service providers GIS Smaller ESInet providers Expand further into Enterprise Safety & Security market Enhanced location-based services and technologies Public safety notifications Reporting and analytics FirstNet − Upcoming Prime contractor awards; will require subcontractors with public safety domain expertise Smart Cities IoT/M2M (e.g., transportation, hazard response, supporting needs of existing customers) Personal Safety (e.g., mobile safety apps, wearables) Current Initiatives Add Scale Expand Capabilities Explore New Markets Additional Growth Opportunities (Buy/Build) Upside Growth Potential Safety Services

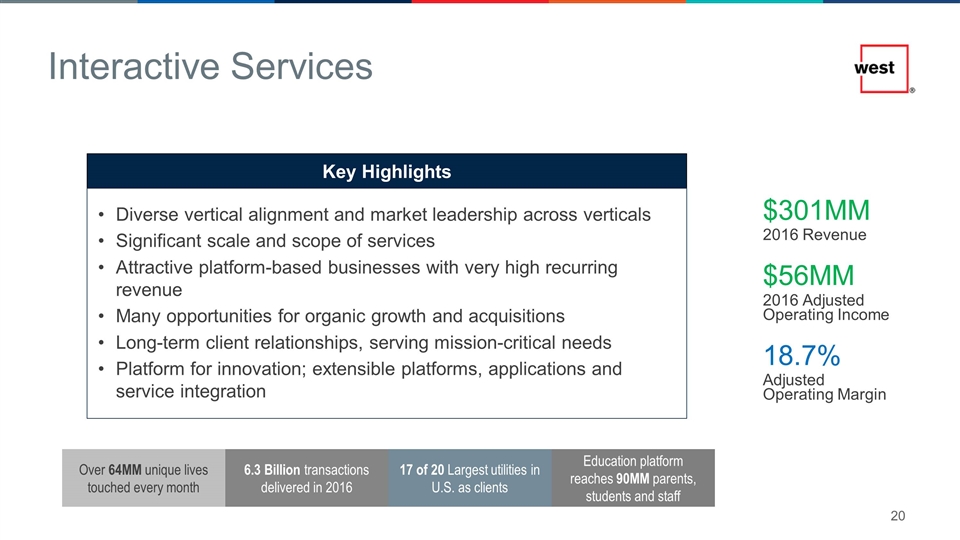
Interactive Services $301MM $56MM 18.7% Over 64MM unique lives touched every month 17 of 20 Largest utilities in U.S. as clients 6.3 Billion transactions delivered in 2016 Education platform reaches 90MM parents, students and staff Key Highlights Diverse vertical alignment and market leadership across verticals Significant scale and scope of services Attractive platform-based businesses with very high recurring revenue Many opportunities for organic growth and acquisitions Long-term client relationships, serving mission-critical needs Platform for innovation; extensible platforms, applications and service integration 2016 Revenue 2016 Adjusted Operating Income Adjusted Operating Margin
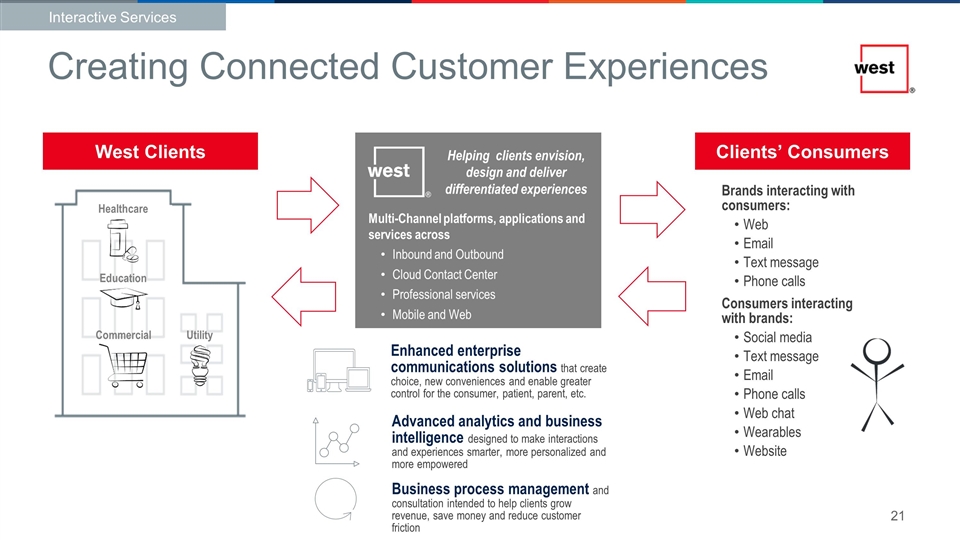
Consumers interacting with brands: Social media Text message Email Phone calls Web chat Wearables Website Helping clients envision, design and deliver differentiated experiences Multi-Channel platforms, applications and services across Inbound and Outbound Cloud Contact Center Professional services Mobile and Web West Clients Brands interacting with consumers: Web Email Text message Phone calls Clients’ Consumers Commercial Healthcare Education Utility Enhanced enterprise communications solutions that create choice, new conveniences and enable greater control for the consumer, patient, parent, etc. Advanced analytics and business intelligence designed to make interactions and experiences smarter, more personalized and more empowered Business process management and consultation intended to help clients grow revenue, save money and reduce customer friction Creating Connected Customer Experiences Interactive Services
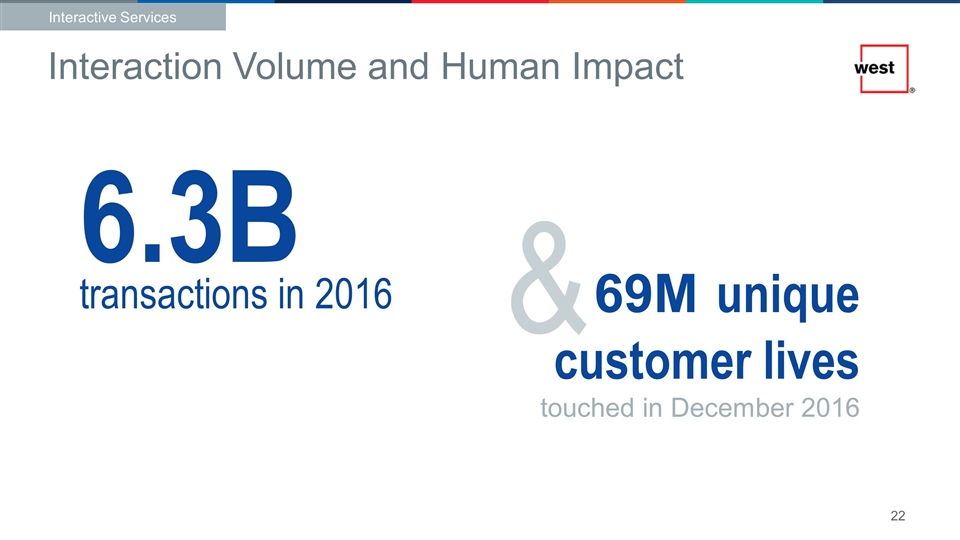
Interaction Volume and Human Impact & 6.3B 69M unique customer lives touched in December 2016 up 24% YOY transactions in 2016 Interactive Services
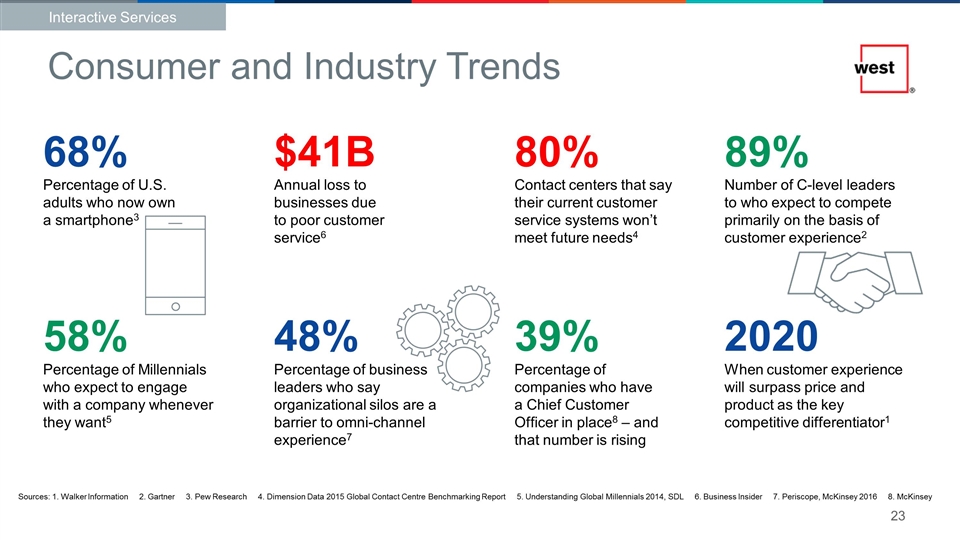
Consumer and Industry Trends Sources: 1. Walker Information 2. Gartner 3. Pew Research 4. Dimension Data 2015 Global Contact Centre Benchmarking Report 5. Understanding Global Millennials 2014, SDL 6. Business Insider 7. Periscope, McKinsey 2016 8. McKinsey 2020 When customer experience will surpass price and product as the key competitive differentiator1 89% Number of C-level leaders to who expect to compete primarily on the basis of customer experience2 68% Percentage of U.S. adults who now own a smartphone3 80% Contact centers that say their current customer service systems won’t meet future needs4 58% Percentage of Millennials who expect to engage with a company whenever they want5 $41B Annual loss to businesses due to poor customer service6 48% Percentage of business leaders who say organizational silos are a barrier to omni-channel experience7 39% Percentage of companies who have a Chief Customer Officer in place8 – and that number is rising Interactive Services
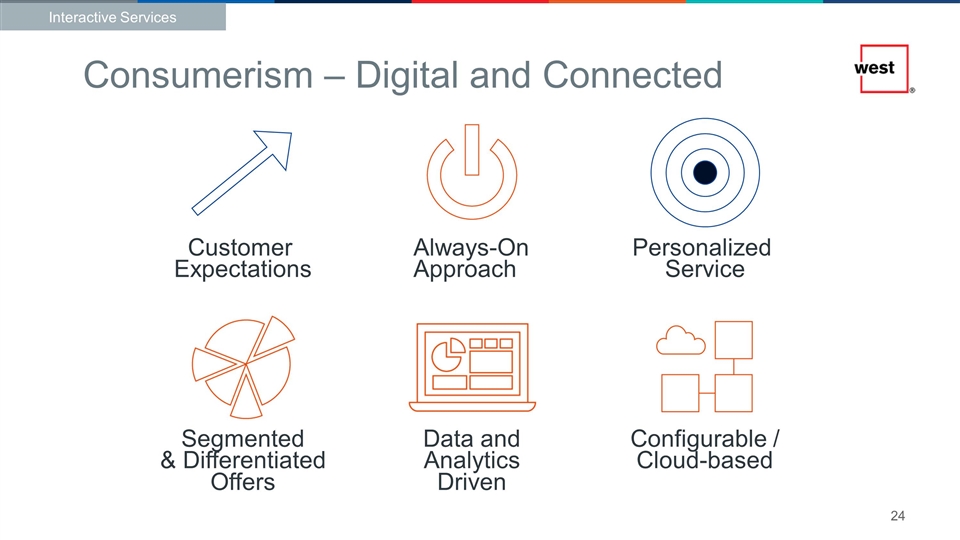
Consumerism – Digital and Connected Always-On Approach Personalized Service Segmented & Differentiated Offers Data and Analytics Driven Configurable / Cloud-based Customer Expectations Interactive Services
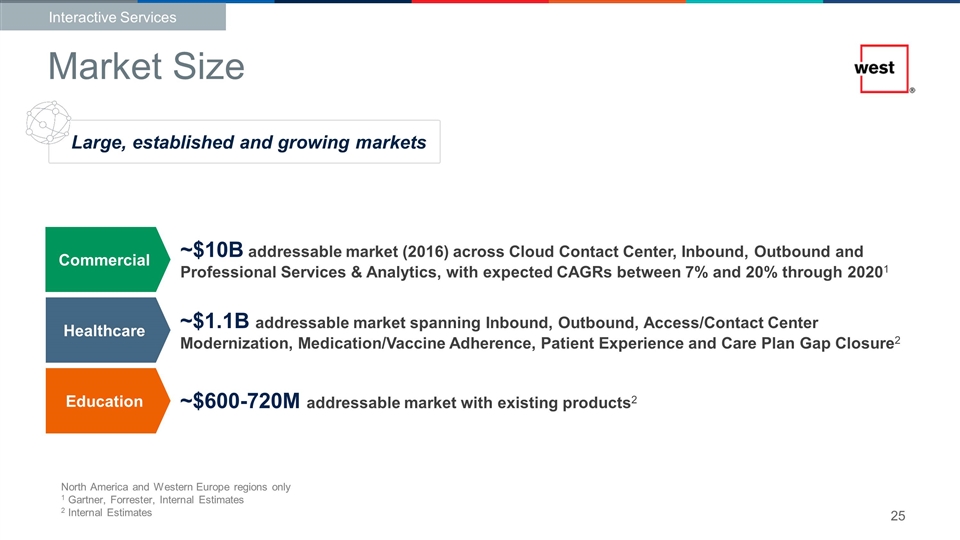
North America and Western Europe regions only 1 Gartner, Forrester, Internal Estimates 2 Internal Estimates ~$1.1B addressable market spanning Inbound, Outbound, Access/Contact Center Modernization, Medication/Vaccine Adherence, Patient Experience and Care Plan Gap Closure2 ~$600-720M addressable market with existing products2 ~$10B addressable market (2016) across Cloud Contact Center, Inbound, Outbound and Professional Services & Analytics, with expected CAGRs between 7% and 20% through 20201 Market Size Interactive Services Large, established and growing markets Education Healthcare Commercial
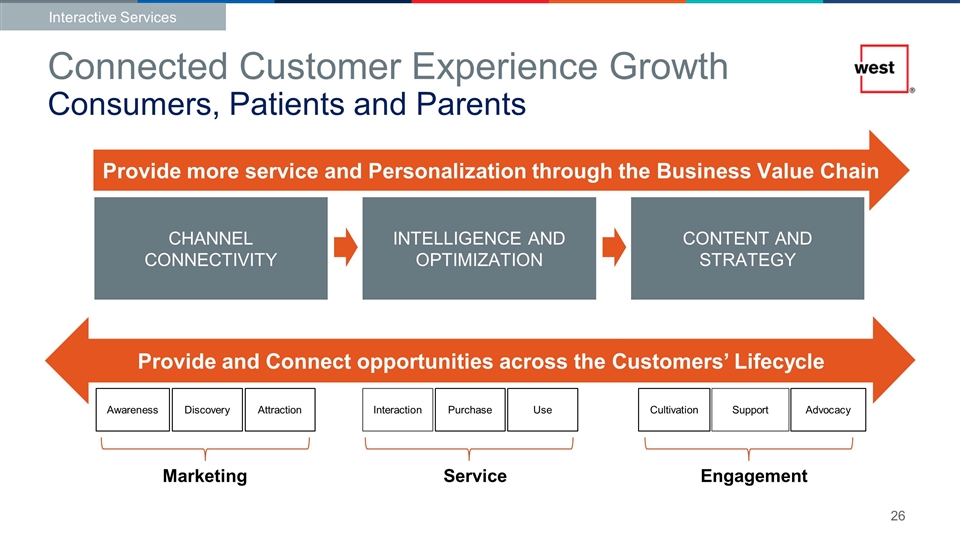
Helping clients envision, design and deliver differentiated experiences Connected Customer Experience Growth Consumers, Patients and Parents Interaction Discovery Attraction Purchase Use Cultivation Support Awareness Advocacy Marketing Service Provide and Connect opportunities across the Customers’ Lifecycle CHANNEL CONNECTIVITY INTELLIGENCE AND OPTIMIZATION CONTENT AND STRATEGY Provide more service and Personalization through the Business Value Chain Engagement Interactive Services
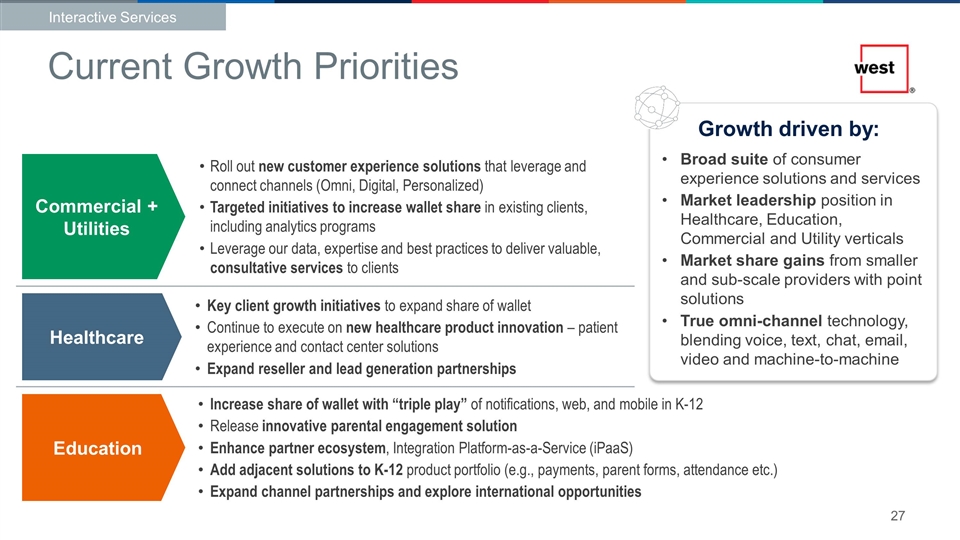
Healthcare Commercial + Utilities Growth driven by: Broad suite of consumer experience solutions and services Market leadership position in Healthcare, Education, Commercial and Utility verticals Market share gains from smaller and sub-scale providers with point solutions True omni-channel technology, blending voice, text, chat, email, video and machine-to-machine Roll out new customer experience solutions that leverage and connect channels (Omni, Digital, Personalized) Targeted initiatives to increase wallet share in existing clients, including analytics programs Leverage our data, expertise and best practices to deliver valuable, consultative services to clients Key client growth initiatives to expand share of wallet Continue to execute on new healthcare product innovation – patient experience and contact center solutions Expand reseller and lead generation partnerships Increase share of wallet with “triple play” of notifications, web, and mobile in K-12 Release innovative parental engagement solution Enhance partner ecosystem, Integration Platform-as-a-Service (iPaaS) Add adjacent solutions to K-12 product portfolio (e.g., payments, parent forms, attendance etc.) Expand channel partnerships and explore international opportunities Interactive Services Education Current Growth Priorities
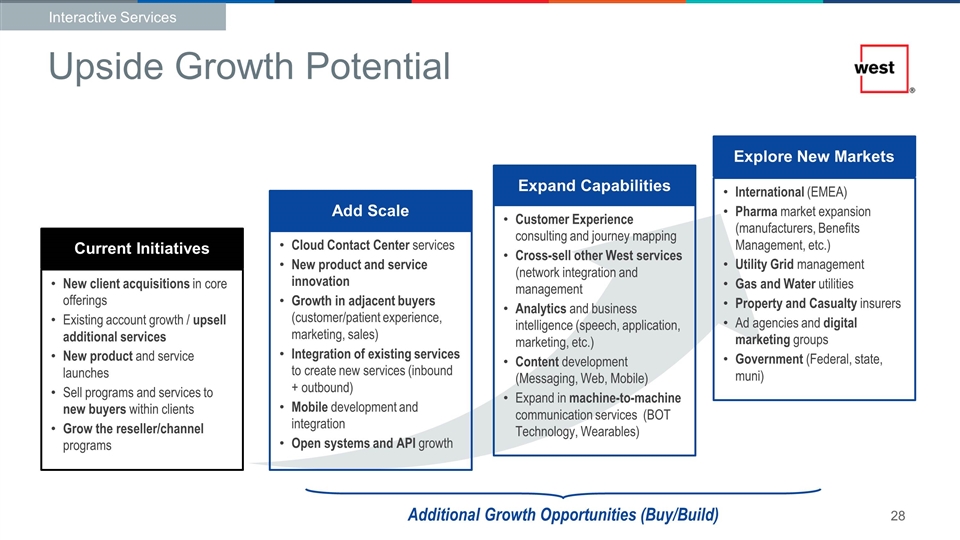
New client acquisitions in core offerings Existing account growth / upsell additional services New product and service launches Sell programs and services to new buyers within clients Grow the reseller/channel programs Cloud Contact Center services New product and service innovation Growth in adjacent buyers (customer/patient experience, marketing, sales) Integration of existing services to create new services (inbound + outbound) Mobile development and integration Open systems and API growth Customer Experience consulting and journey mapping Cross-sell other West services (network integration and management Analytics and business intelligence (speech, application, marketing, etc.) Content development (Messaging, Web, Mobile) Expand in machine-to-machine communication services (BOT Technology, Wearables) International (EMEA) Pharma market expansion (manufacturers, Benefits Management, etc.) Utility Grid management Gas and Water utilities Property and Casualty insurers Ad agencies and digital marketing groups Government (Federal, state, muni) Current Initiatives Add Scale Expand Capabilities Explore New Markets Additional Growth Opportunities (Buy/Build) Upside Growth Potential Interactive Services

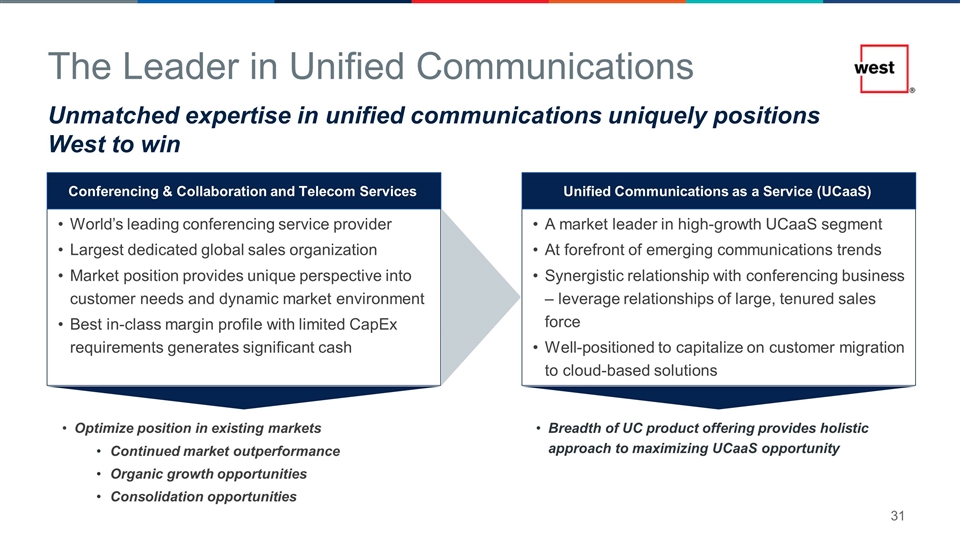
A market leader in high-growth UCaaS segment At forefront of emerging communications trends Synergistic relationship with conferencing business – leverage relationships of large, tenured sales force Well-positioned to capitalize on customer migration to cloud-based solutions World’s leading conferencing service provider Largest dedicated global sales organization Market position provides unique perspective into customer needs and dynamic market environment Best in-class margin profile with limited CapEx requirements generates significant cash Conferencing & Collaboration and Telecom Services Unified Communications as a Service (UCaaS) Optimize position in existing markets Continued market outperformance Organic growth opportunities Consolidation opportunities Breadth of UC product offering provides holistic approach to maximizing UCaaS opportunity The Leader in Unified Communications Unmatched expertise in unified communications uniquely positions West to win
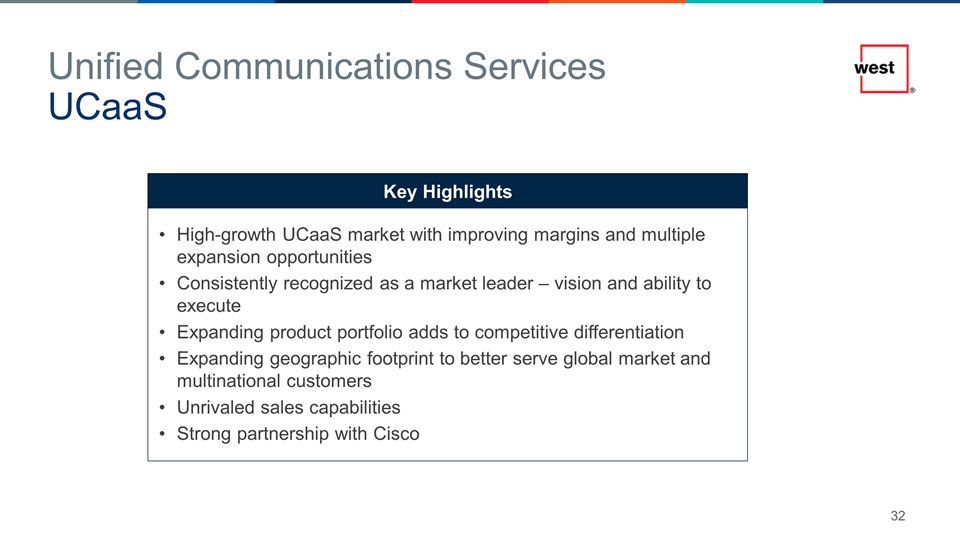
Unified Communications Services UCaaS Key Highlights High-growth UCaaS market with improving margins and multiple expansion opportunities Consistently recognized as a market leader – vision and ability to execute Expanding product portfolio adds to competitive differentiation Expanding geographic footprint to better serve global market and multinational customers Unrivaled sales capabilities Strong partnership with Cisco
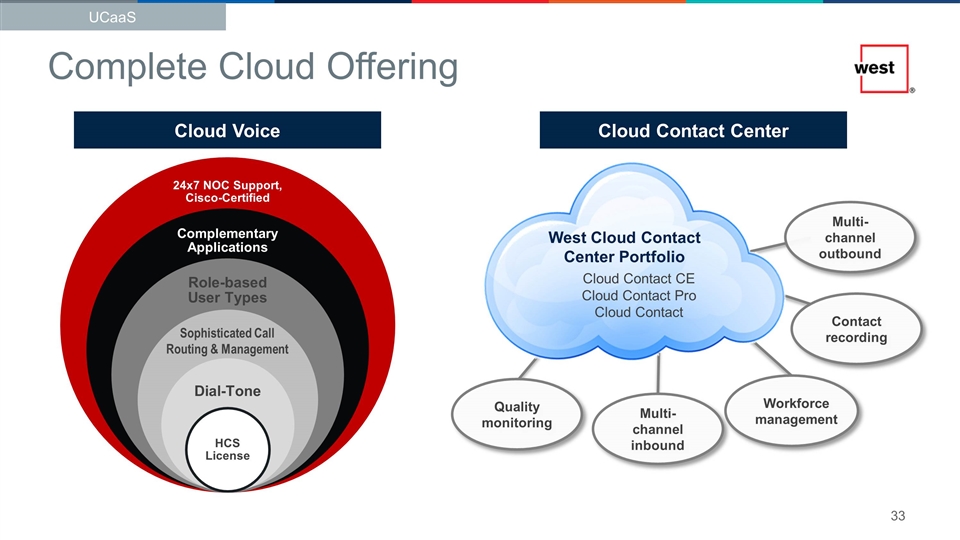
Sophisticated Call Routing & Management Complete Cloud Offering West Cloud Contact Center Portfolio Cloud Contact CE Cloud Contact Pro Cloud Contact Quality monitoring Multi-channel outbound Multi-channel inbound Contact recording Workforce management Cloud Voice Cloud Contact Center UCaaS 24x7 NOC Support, Cisco-Certified Dial-Tone HCS License Role-based User Types Complementary Applications
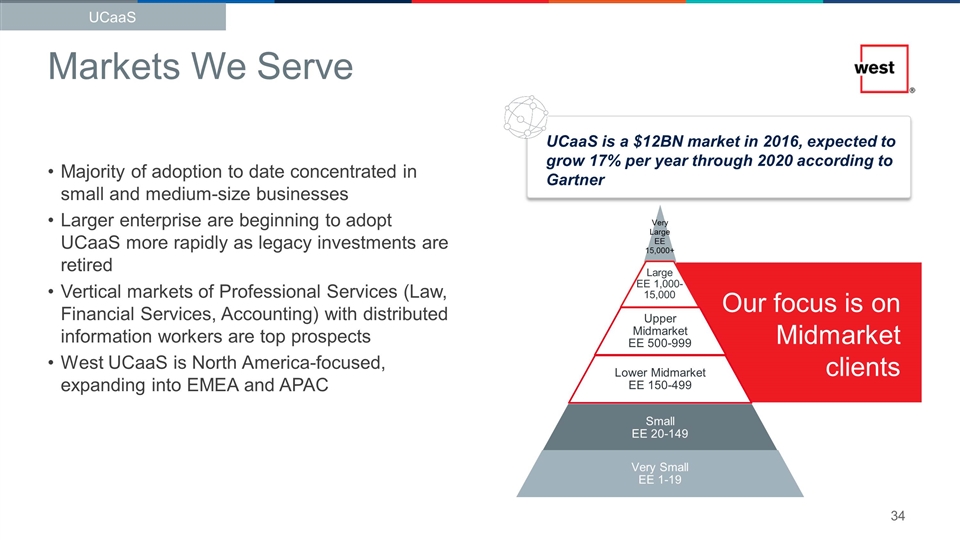
Majority of adoption to date concentrated in small and medium-size businesses Larger enterprise are beginning to adopt UCaaS more rapidly as legacy investments are retired Vertical markets of Professional Services (Law, Financial Services, Accounting) with distributed information workers are top prospects West UCaaS is North America-focused, expanding into EMEA and APAC UCaaS is a $12BN market in 2016, expected to grow 17% per year through 2020 according to Gartner Markets We Serve UCaaS Our focus is on Midmarket clients Very Large EE 15,000+ Large EE 1,000-15,000 Upper Midmarket EE 500-999 Lower Midmarket EE 150-499 Very Small EE 1-19 Small EE 20-149
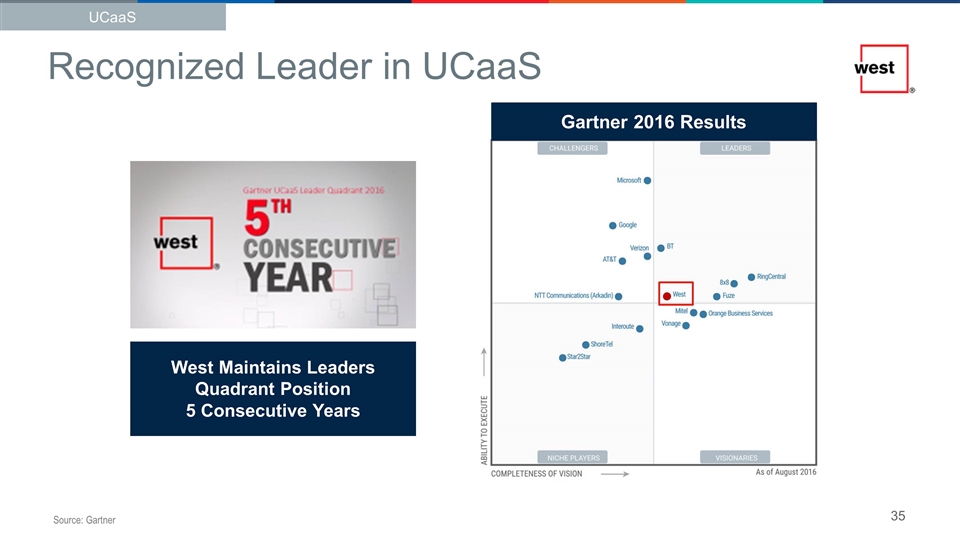
West Maintains Leaders Quadrant Position 5 Consecutive Years Source: Gartner Recognized Leader in UCaaS UCaaS Gartner 2016 Results
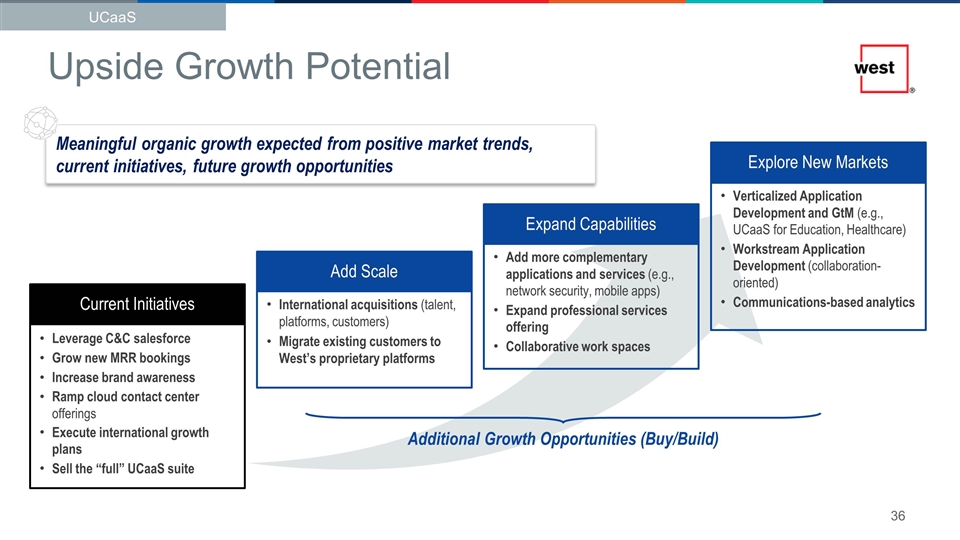
Leverage C&C salesforce Grow new MRR bookings Increase brand awareness Ramp cloud contact center offerings Execute international growth plans Sell the “full” UCaaS suite International acquisitions (talent, platforms, customers) Migrate existing customers to West’s proprietary platforms Add more complementary applications and services (e.g., network security, mobile apps) Expand professional services offering Collaborative work spaces Verticalized Application Development and GtM (e.g., UCaaS for Education, Healthcare) Workstream Application Development (collaboration-oriented) Communications-based analytics Current Initiatives Add Scale Expand Capabilities Explore New Markets Meaningful organic growth expected from positive market trends, current initiatives, future growth opportunities Additional Growth Opportunities (Buy/Build) Upside Growth Potential UCaaS
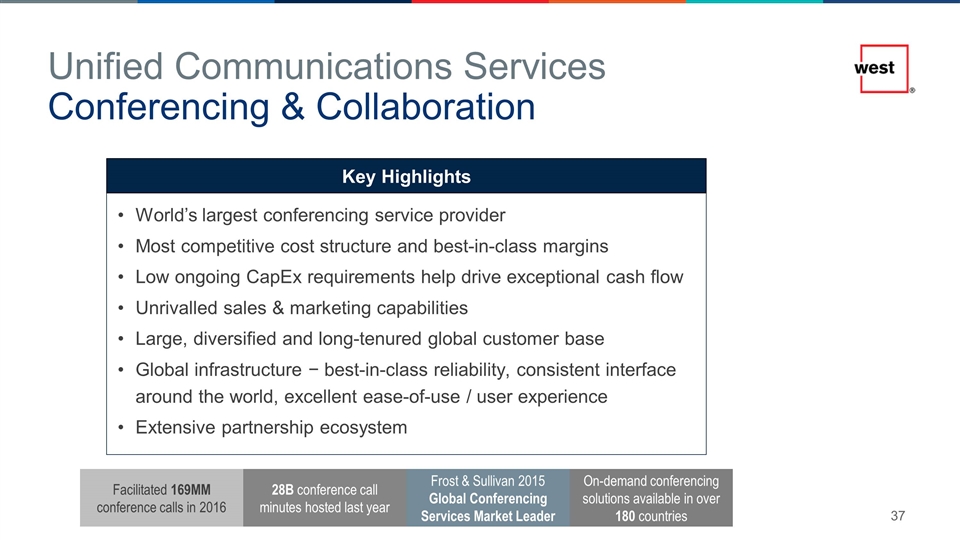
World’s largest conferencing service provider Most competitive cost structure and best-in-class margins Low ongoing CapEx requirements help drive exceptional cash flow Unrivalled sales & marketing capabilities Large, diversified and long-tenured global customer base Global infrastructure − best-in-class reliability, consistent interface around the world, excellent ease-of-use / user experience Extensive partnership ecosystem Unified Communications Services Conferencing & Collaboration Key Highlights Facilitated 169MM conference calls in 2016 Frost & Sullivan 2015 Global Conferencing Services Market Leader 28B conference call minutes hosted last year On-demand conferencing solutions available in over 180 countries
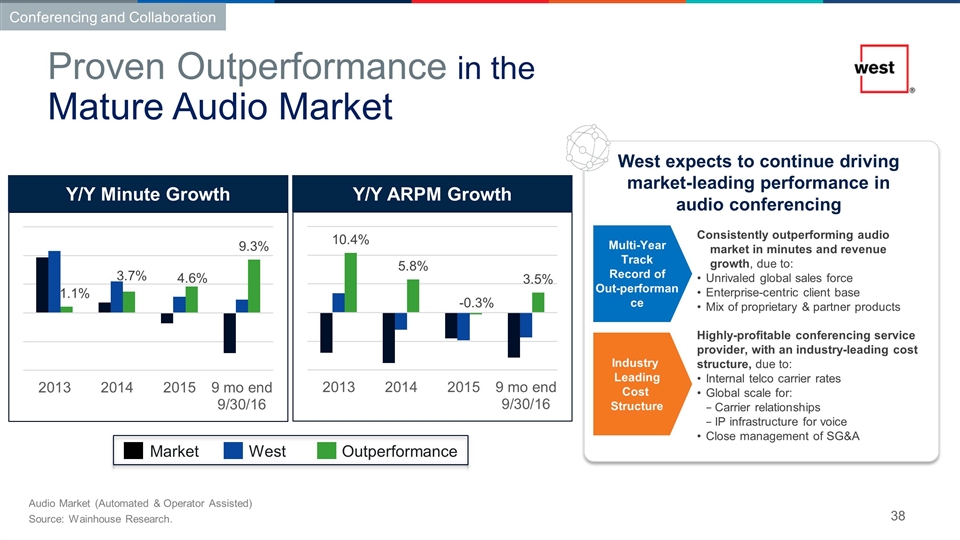
Multi-Year Track Record of Out-performance Consistently outperforming audio market in minutes and revenue growth, due to: Unrivaled global sales force Enterprise-centric client base Mix of proprietary & partner products Highly-profitable conferencing service provider, with an industry-leading cost structure, due to: Internal telco carrier rates Global scale for: Carrier relationships IP infrastructure for voice Close management of SG&A Industry Leading Cost Structure West expects to continue driving market-leading performance in audio conferencing Audio Market (Automated & Operator Assisted) Source: Wainhouse Research. Proven Outperformance in the Mature Audio Market Market West Outperformance Conferencing and Collaboration Y/Y Minute Growth Y/Y ARPM Growth
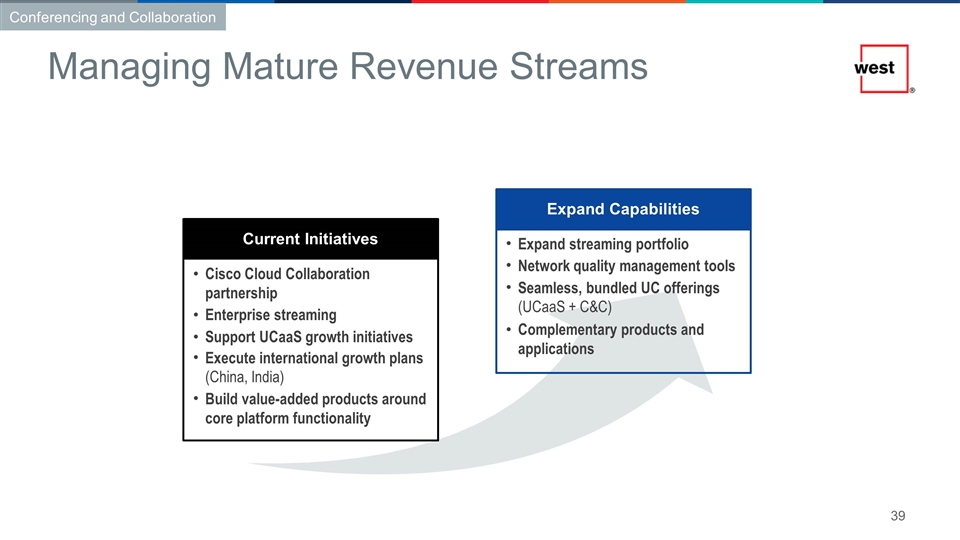
Cisco Cloud Collaboration partnership Enterprise streaming Support UCaaS growth initiatives Execute international growth plans (China, India) Build value-added products around core platform functionality Expand streaming portfolio Network quality management tools Seamless, bundled UC offerings (UCaaS + C&C) Complementary products and applications Current Initiatives Expand Capabilities Managing Mature Revenue Streams Conferencing and Collaboration

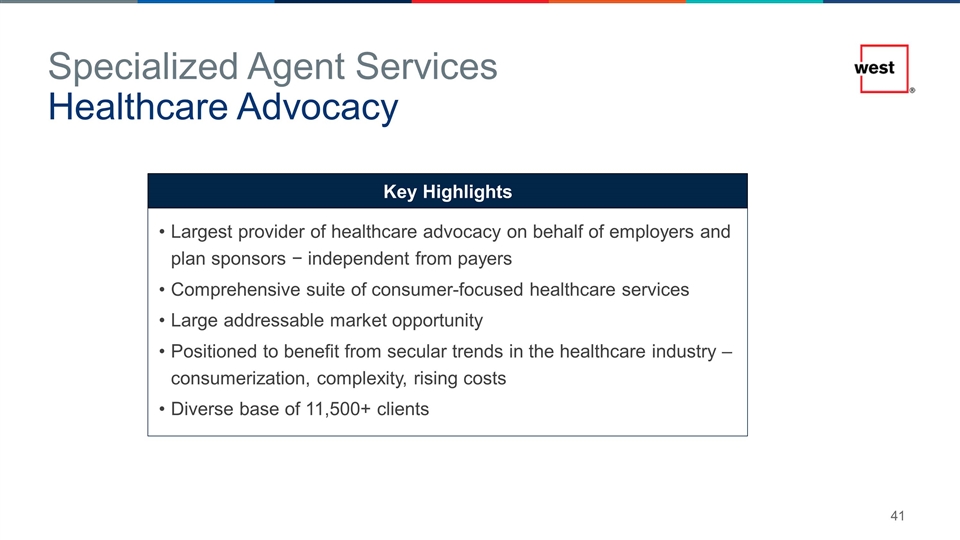
Largest provider of healthcare advocacy on behalf of employers and plan sponsors − independent from payers Comprehensive suite of consumer-focused healthcare services Large addressable market opportunity Positioned to benefit from secular trends in the healthcare industry – consumerization, complexity, rising costs Diverse base of 11,500+ clients Specialized Agent Services Healthcare Advocacy Key Highlights
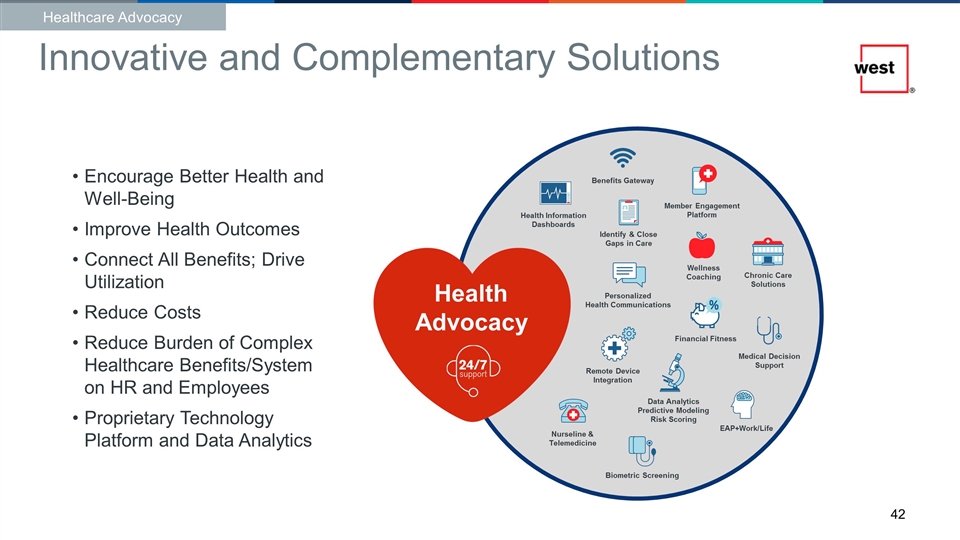
Innovative and Complementary Solutions Encourage Better Health and Well-Being Improve Health Outcomes Connect All Benefits; Drive Utilization Reduce Costs Reduce Burden of Complex Healthcare Benefits/System on HR and Employees Proprietary Technology Platform and Data Analytics Benefits Gateway Health Information Dashboards Personalized Health Communications Biometric Screening Wellness Coaching Nurseline & Telemedicine Remote Device Integration EAP+Work/Life Medical Decision Support Financial Fitness Chronic Care Solutions Data Analytics Predictive Modeling Risk Scoring Member Engagement Platform Identify & Close Gaps in Care Health Advocacy Healthcare Advocacy 42
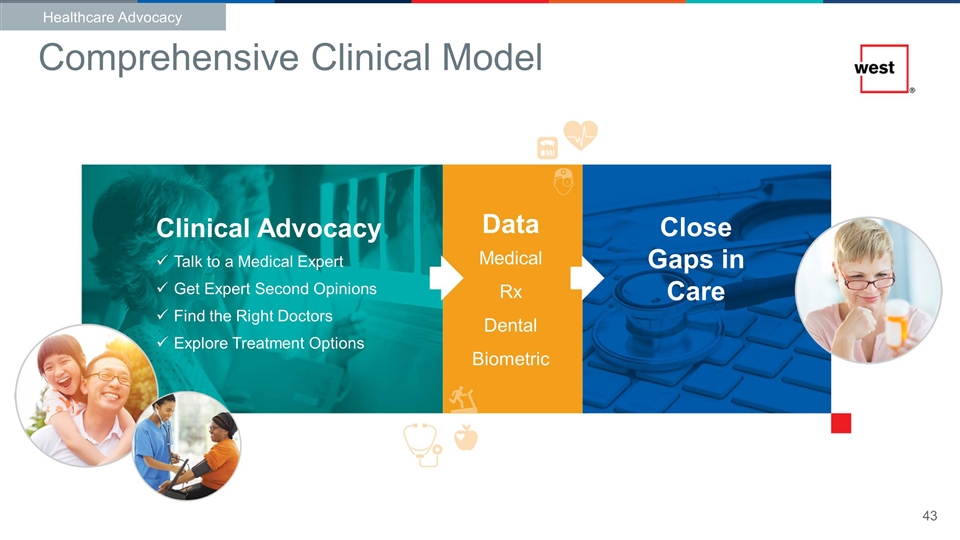
Comprehensive Clinical Model Clinical Advocacy Talk to a Medical Expert Get Expert Second Opinions Find the Right Doctors Explore Treatment Options Close Gaps in Care Data Medical Rx Dental Biometric Healthcare Advocacy
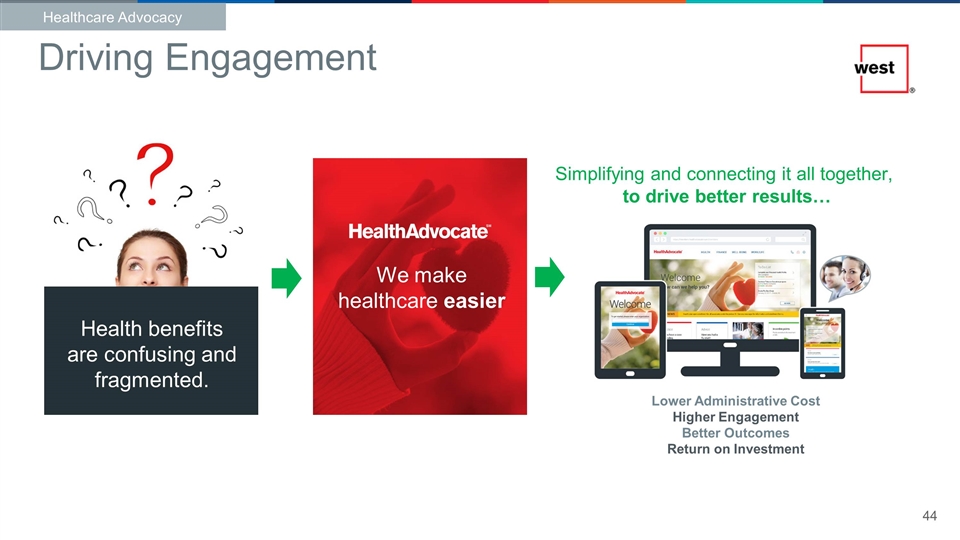
Help clients envision, design and deliver differentiated experiences for their consumer, parent, patient and member through: Driving Engagement Health benefits are confusing and fragmented. We make healthcare easier Simplifying and connecting it all together, to drive better results… Lower Administrative Cost Higher Engagement Better Outcomes Return on Investment Healthcare Advocacy
Health Advocacy/Clinical Health Advocacy Wellbeing solutions EAP Data-driven solutions/analytics Engagement services/platform Healthcare Advocacy Multiple Growth Opportunities

Healthcare
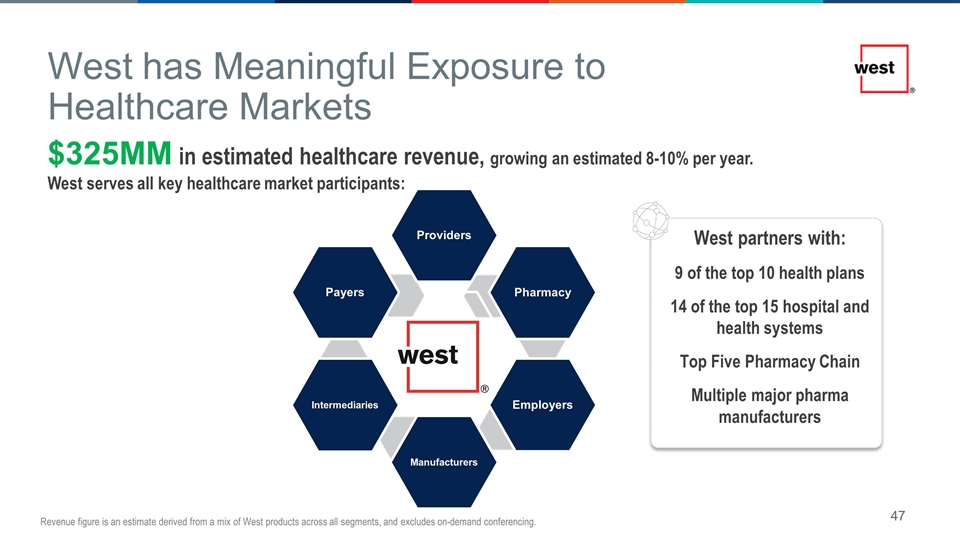
$325MM in estimated healthcare revenue, growing an estimated 8-10% per year. West serves all key healthcare market participants: Revenue figure is an estimate derived from a mix of West products across all segments, and excludes on-demand conferencing. Providers Pharmacy Employers Manufacturers Intermediaries Payers West partners with: 9 of the top 10 health plans 14 of the top 15 hospital and health systems Top Five Pharmacy Chain Multiple major pharma manufacturers West has Meaningful Exposure to Healthcare Markets
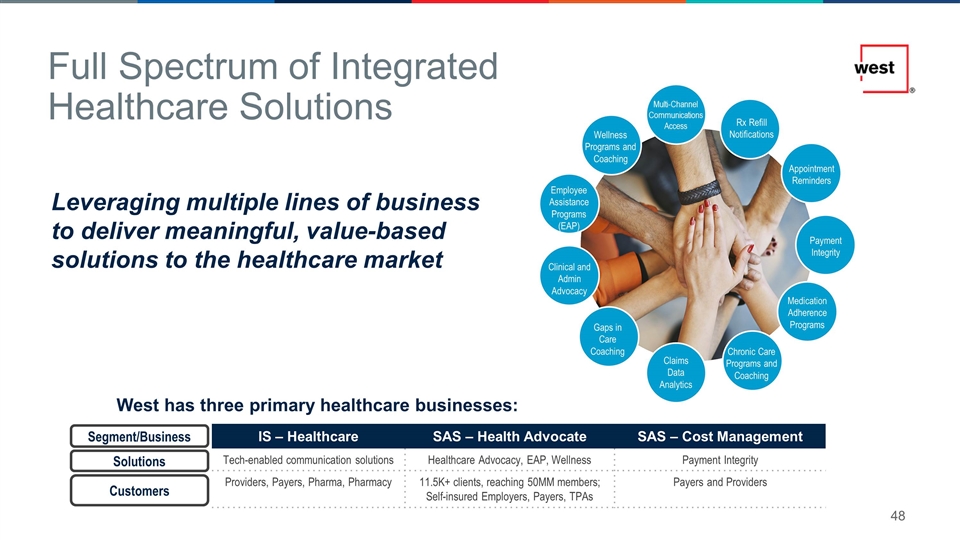
Multi-Channel Communications Access Rx Refill Notifications Appointment Reminders Payment Integrity Wellness Programs and Coaching Employee Assistance Programs (EAP) Clinical and Admin Advocacy Medication Adherence Programs Chronic Care Programs and Coaching Claims Data Analytics Gaps in Care Coaching West has three primary healthcare businesses: IS – Healthcare SAS – Health Advocate SAS – Cost Management Tech-enabled communication solutions Healthcare Advocacy, EAP, Wellness Payment Integrity Providers, Payers, Pharma, Pharmacy 11.5K+ clients, reaching 50MM members; Self-insured Employers, Payers, TPAs Payers and Providers Segment/Business Solutions Customers Full Spectrum of Integrated Healthcare Solutions Leveraging multiple lines of business to deliver meaningful, value-based solutions to the healthcare market
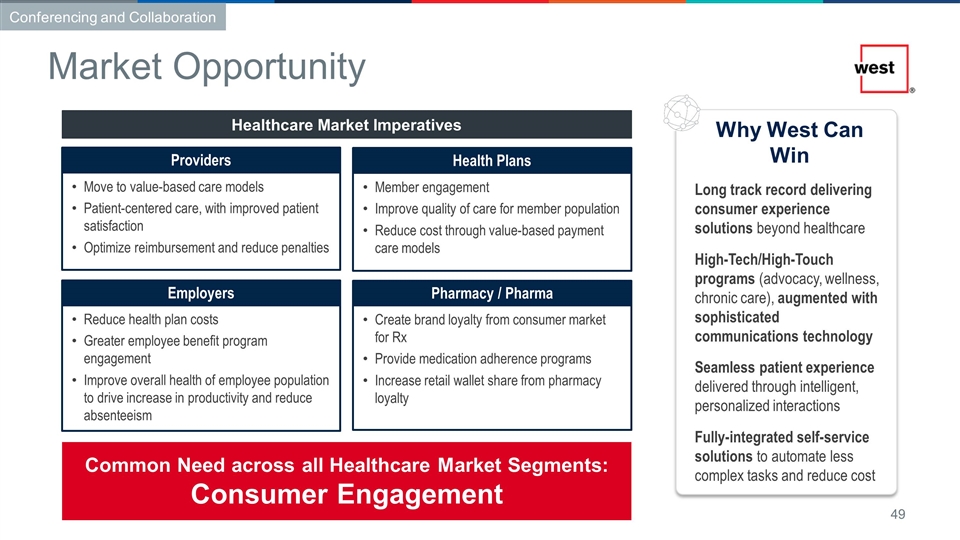
Common Need across all Healthcare Market Segments: Consumer Engagement Move to value-based care models Patient-centered care, with improved patient satisfaction Optimize reimbursement and reduce penalties Providers Reduce health plan costs Greater employee benefit program engagement Improve overall health of employee population to drive increase in productivity and reduce absenteeism Employers Member engagement Improve quality of care for member population Reduce cost through value-based payment care models Health Plans Create brand loyalty from consumer market for Rx Provide medication adherence programs Increase retail wallet share from pharmacy loyalty Pharmacy / Pharma Why West Can Win Long track record delivering consumer experience solutions beyond healthcare High-Tech/High-Touch programs (advocacy, wellness, chronic care), augmented with sophisticated communications technology Seamless patient experience delivered through intelligent, personalized interactions Fully-integrated self-service solutions to automate less complex tasks and reduce cost Healthcare Market Imperatives Market Opportunity Conferencing and Collaboration 49

Finance
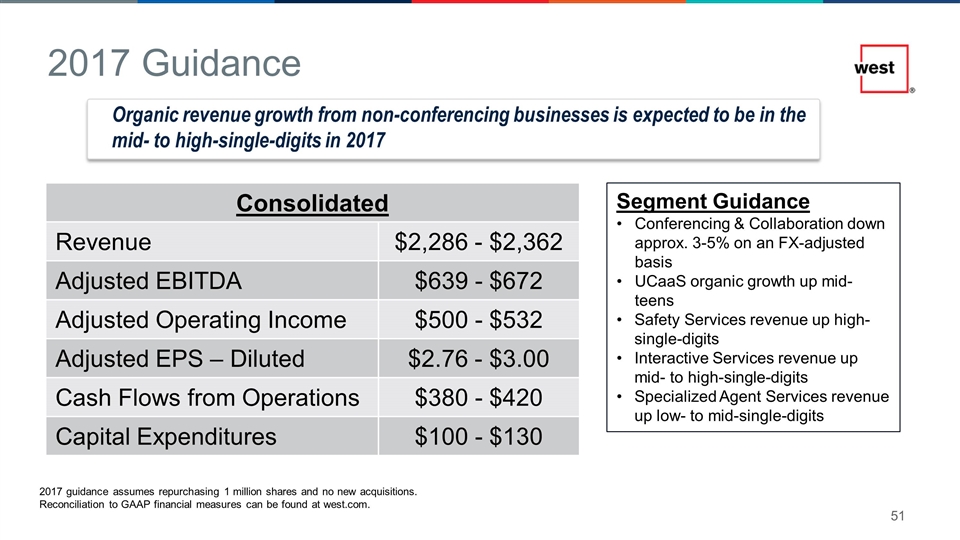
Consolidated Revenue $2,286 - $2,362 Adjusted EBITDA $639 - $672 Adjusted Operating Income $500 - $532 Adjusted EPS – Diluted $2.76 - $3.00 Cash Flows from Operations $380 - $420 Capital Expenditures $100 - $130 2017 guidance assumes repurchasing 1 million shares and no new acquisitions. Reconciliation to GAAP financial measures can be found at west.com. Segment Guidance Conferencing & Collaboration down approx. 3-5% on an FX-adjusted basis UCaaS organic growth up mid-teens Safety Services revenue up high-single-digits Interactive Services revenue up mid- to high-single-digits Specialized Agent Services revenue up low- to mid-single-digits 2017 Guidance Organic revenue growth from non-conferencing businesses is expected to be in the mid- to high-single-digits in 2017
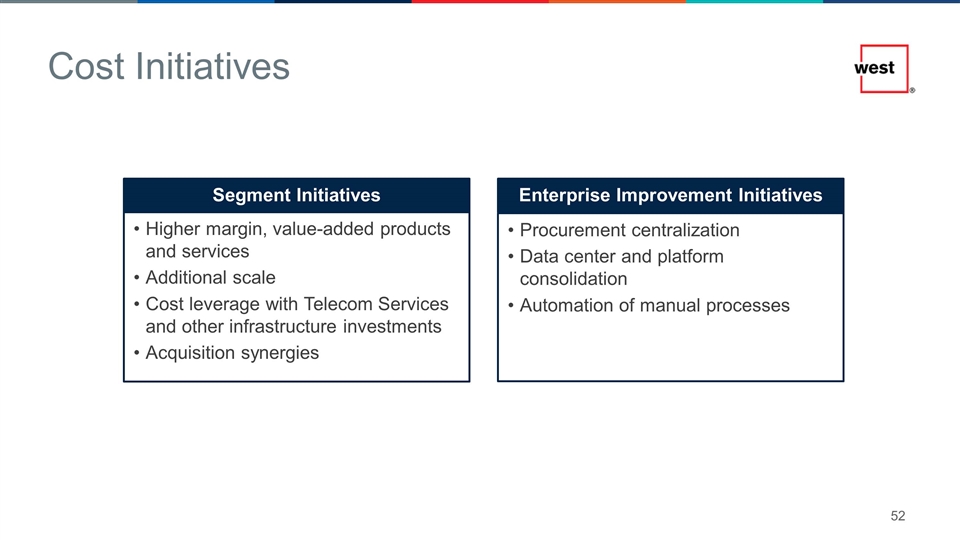
Cost Initiatives Higher margin, value-added products and services Additional scale Cost leverage with Telecom Services and other infrastructure investments Acquisition synergies Segment Initiatives Procurement centralization Data center and platform consolidation Automation of manual processes Enterprise Improvement Initiatives
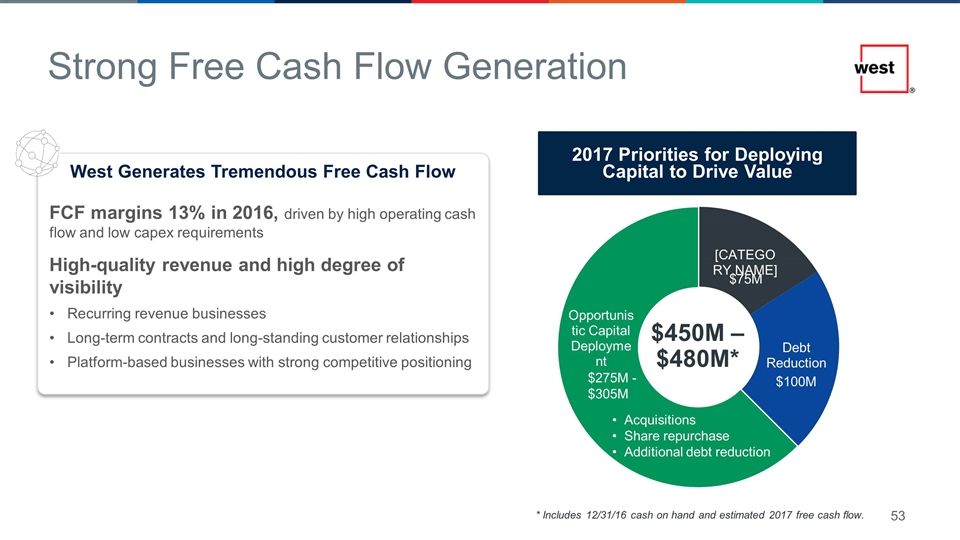
West Generates Tremendous Free Cash Flow FCF margins 13% in 2016, driven by high operating cash flow and low capex requirements High-quality revenue and high degree of visibility Recurring revenue businesses Long-term contracts and long-standing customer relationships Platform-based businesses with strong competitive positioning Strong Free Cash Flow Generation * Includes 12/31/16 cash on hand and estimated 2017 free cash flow. $75M $100M $275M - $305M 2017 Priorities for Deploying Capital to Drive Value

Q&A


