SOLEDAD MOUNTAINFEASIBILITY
STUDY
Submitted to:
GOLDEN QUEEN MINING CO. LTD.
Date:
May 2, 2011
Norwest Corporation
Suite 1830, 1066 W Hastings Street
Vancouver, British Columbia
V6E 3X2
Tel: (604) 602-8992
Fax: (604) 602-8951
Emailvancouver@norwestcorp.com
www.norwestcorp.com
Author:
SEAN ENNIS, P.ENG.

| |
| GOLDEN QUEEN MINING CO. / 08-3256 |
| SOLEDAD MOUNTAIN FEASIBILITY STUDY |
| TOC - 1 |
| |
| GOLDEN QUEEN MINING CO. / 08-3256 |
| SOLEDAD MOUNTAIN FEASIBILITY STUDY |
| TOC - 2 |
| |
| GOLDEN QUEEN MINING CO. / 08-3256 |
| SOLEDAD MOUNTAIN FEASIBILITY STUDY |
| TOC - 3 |
| |
| GOLDEN QUEEN MINING CO. / 08-3256 |
| SOLEDAD MOUNTAIN FEASIBILITY STUDY |
| TOC - 4 |
| |
| GOLDEN QUEEN MINING CO. / 08-3256 |
| SOLEDAD MOUNTAIN FEASIBILITY STUDY |
| TOC - 5 |
LIST OF TABLES
| |
| GOLDEN QUEEN MINING CO. / 08-3256 |
| SOLEDAD MOUNTAIN FEASIBILITY STUDY |
| TOC - 6 |
LIST OF FIGURES
| |
| GOLDEN QUEEN MINING CO. / 08-3256 |
| SOLEDAD MOUNTAIN FEASIBILITY STUDY |
| TOC - 7 |
| |
| GOLDEN QUEEN MINING CO. / 08-3256 |
| SOLEDAD MOUNTAIN FEASIBILITY STUDY |
| TOC - 8 |
| CERTIFICATE of AUTHENTICATION |
This report has been prepared for Golden Queen Mining Co. Ltd. This report presents the results of the updated feasibility level mine development plan prepared by Norwest Corporation. The report relies upon a geological model created by qualified independent third party consultants that was accepted by Norwest. Norwest has relied on other information prepared by third party consultants and the client where noted.
This report has been prepared and reviewed by Sean Ennis, P.Eng. on behalf of Norwest.
Norwest Corporation APEGGA permit number P – 5015.
“original signed and sealed by author”
| | May 2, 2011 |
| | |
| | Sean Ennis, P.Eng. |
| | Vice President, Mining |
| | Norwest Corporation |
| |
| GOLDEN QUEEN MINING CO. / 08-3256 |
| SOLEDAD MOUNTAIN FEASIBILITY STUDY |
| TOC - 9 |
EXECUTIVE SUMMARY
Norwest Corporation (Norwest) has completed an updated feasibility level Technical Report at the request of Golden Queen Mining Co. Ltd. (GQM) on the company’s Soledad Mountain gold-silver property in California (the Project). The feasibility report serves as a basis for a National Instrument 43-101 Technical Report submitted on March 31, 2011. GQM is listed on the Toronto Stock Exchange (TSX-GQM).
The Soledad Mountain property is located just south of the town of Mojave, California and has been subject to extensive exploration as well as previous underground mining operations during the early 1900s and the 1930s. Since control of the property was gained by GQM in 1986, exploration has been carried out periodically as well as on-going technical assessment work in support of Project development. A 43-101 Technical Report was completed by SRK Consulting (U.S.), Inc. (SRK) of Lakewood, Colorado in March 2006 (NI 43-101 Technical Report Soledad Mountain Project, Mojave, CA,. March 2006) and filed with Canadian securities regulators. This report described the geological resource base and geological model for the project and included a listing of resources classified according to NI 43-101 standards. The mineral resource classification is summarized in Table ES.1 which is taken from the SRK document.
As part of their project work, SRK completed a review of the geological model for the property which served as the basis for the calculation of the mineral resource quantities. This model was provided to Norwest by GQM for use in preparing the mining feasibility study. Norwest has accepted this model and relied upon it in the preparation of the mine plan. Excerpts from the SRK NI 43-101 report have been included in this technical report where necessary for clarity; otherwise specific references to the appropriate sections of that document are made.
| |
| GOLDEN QUEEN MINING CO. LTD. / 08-3256 |
| SOLEDAD MOUNTAIN FEASIBILITY STUDY |
| ES-1 |
TABLE ES.1
SUMMARY OF MINERAL RESOURCES TAKEN FROM SRK TECHNICAL REPORT
| |
| GOLDEN QUEEN MINING CO. LTD. / 08-3256 |
| SOLEDAD MOUNTAIN FEASIBILITY STUDY |
| ES-2 |
PROJECT DESCRIPTION
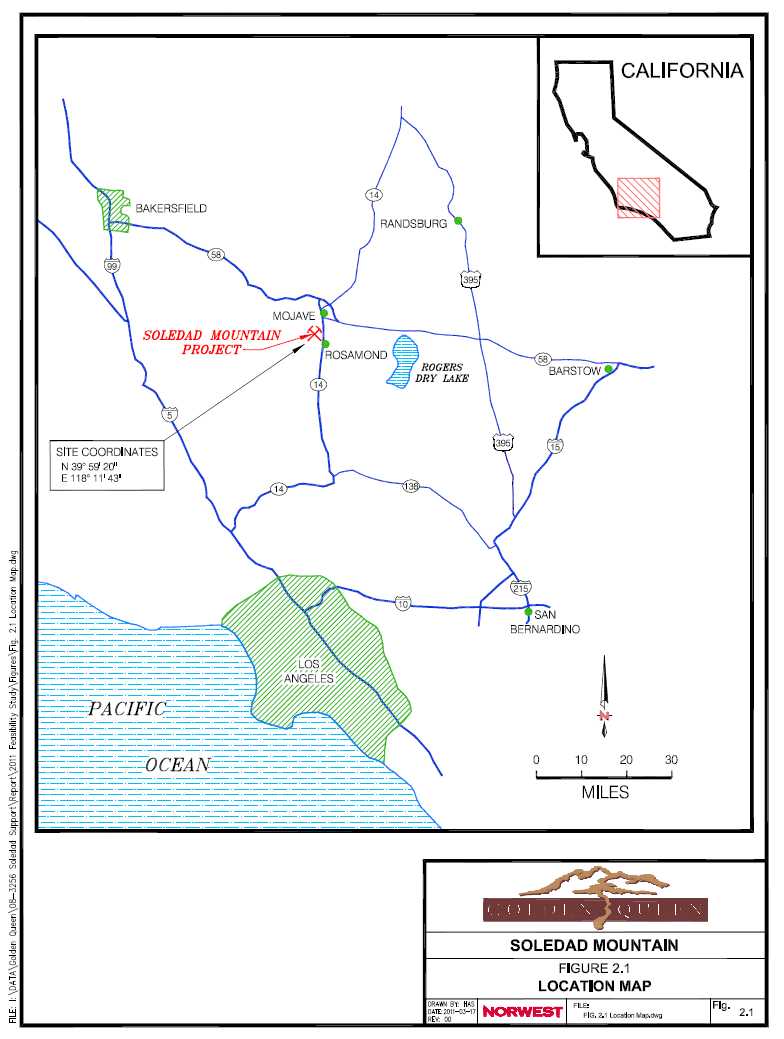
The Project is located in Kern County in southern California approximately 5 miles south of the town of Mojave. The metropolitan areas of Rosamond and Lancaster lie approximately 9 miles and 20 miles to the south respectively. Los Angeles is about 90 miles south of Mojave. The site location is shown in Figure ES-1.
Access to site is from State Route 14 and Silver Queen Road, an existing paved County road. Mojave is a railroad hub for the Burlington Northern/Santa Fe and Union Pacific/Southern Pacific railroad lines. Services such as a hospital, ambulance, fire-protection, garbage and hazardous waste disposal, schools, motels and housing, shopping, airport and recreation are available in Mojave and its surroundings. Telephone service is available on site.
The Project is within the Mojave Mining District along with the former Cactus Gold Mine, Standard Hill Mine and Tropico Mine. These former operating mines are located within a 5 mile radius of the Soledad Mountain site.
REGIONAL GEOLOGY
Soledad Mountain is located within the Mojave structural block, a triangular-shaped area bounded to the east by the northwest-trending San Andreas Fault and to the north by the northeast-trending Garlock Fault. The Mojave block is broken into an orthogonal pattern of fracture systems. These fracture zones likely developed as the result of Late Cretaceous compressional stresses that were present prior to formation of the Garlock and San Andreas Faults. Gold and silver mineralization at Soledad Mountain is hosted by northwest-trending, en-echelon faults and fracture systems. Cretaceous quartz monzonite forms the basement of stratigraphic sequences in the Mojave block. The quartz monzonite is overlain by Miocene-age, quartz latitic and rhyolitic volcanic rocks. Volcanic centres appear to have formed at intersections of the northeast and northwest-trending fracture systems.
Gold deposits in the Mojave block include Soledad Mountain, Standard Hill, Cactus and Tropico. At Soledad Mountain gold mineralization occurs in low-sulfidation style, quartz-adularia veins and stockworks that strike northwest. Gold mineralization at Standard Hill, located 1 mile northeast of Soledad, consists of north to northwest-striking quartz veins in Cretaceous quartz monzonite and Tertiary, quartz latitic volcanic rocks. At the Cactus Gold Mine, 5 miles west of Soledad, gold occurs in northwest and northeast-striking quartz veins, breccias and irregular zones of silicification in quartz latite, rhyolitic flows and rhyolitic intrusive breccias.
PROJECT LAND RIGHTS
GQM controls approximately 2,500 acres (1,000 hectares) of land in the area, consisting of private (fee land and patented lode mining claims and millsites) and federal lands (unpatented lode mining claims and millsites) administered by the Bureau of Land Management (BLM), collectively referred to as the Property. The total area required for the Project, which is surrounded by a Project boundary, is approximately 1,300 acres (500 hectares) in size. The actual area that will be disturbed by mining, waste rock disposal, the construction of the heap leach pads and the heap and the facilities will be approximately 912 acres (369 hectares) in size of which approximately 835 acres (338 hectares) will be reclaimed during and at the end of the mine life.
| |
| GOLDEN QUEEN MINING CO. LTD. / 08-3256 |
| SOLEDAD MOUNTAIN FEASIBILITY STUDY |
| ES-3 |
The Property is located west of California State Highway 14 and largely south of Silver Queen Road in Kern County, California, and covers all of Section 6 and portions of Sections 5, 7 and 8 in Township 10 North (T10N), Range 12 West (R12W), portions of Sections 1 and 12 in T10N, R13W, portions of Section 18 in T9N, R12W, and portions of Section 32 in T11N, R12W, all from the San Bernardino Baseline and Meridian. The Project facilities will be located in Section 6 of T10N, R12W. Two water production wells have been drilled in Section 32, T11N, R12W, on land controlled by GQM.
GQM holds or controls via agreement 33 patented lode mining claims, 134 unpatented lode mining claims, 1 patented millsite, 12 unpatented millsites, 1 unpatented placer claim and 867 acres of fee land. A summary of the land held or controlled by GQM is shown in Table ES-2.
TABLE ES.2
LAND STATUS
| Land Status | Acres | Hectares |
| Fee Land (Owned) | 702 | 284 |
| Unpatented Mining Claims | 266 | 108 |
| Patented Mining Claims | 353 | 143 |
| Fee Land (Purchases) | 6 | 2 |
| Fee Land (Leased) | 159 | 64 |
| Millsites | 74 | 30 |
| Total | 1,560 | 631 |
GQM holds or controls the properties under mining leases with 53 individual landholders, two groups of landholders and 2 incorporated entities. Contact information for the landholders is available on file at the GQM offices in Vancouver.
GQM believes that all the land required for the Project either has been secured under a mining lease or is held by GQM through ownership of the land in fee or via unpatented mining claims. GQM executed land purchases or entered into agreements from 1990 onwards, and is continuing to add to its land position in the area.
GQM carried out an aerial survey of the Project area in 2004 and produced a topographic map with 5 ft contour intervals in the Project area using California State Plane Zone 5 coordinates.
| |
| GOLDEN QUEEN MINING CO. LTD. / 08-3256 |
| SOLEDAD MOUNTAIN FEASIBILITY STUDY |
| ES-4 |
A formal title review was done by Gresham Savage Nolan & Tilden, a firm with extensive experience in title matters. The report was dated September 6, 1996 and was updated to April 26, 1999.
A formal title review was again done by an independent landman, Sylvia Good, in May 2004.
Further details of the property holdings are contained in the 2006 SRK Technical Report in Section 4 of that report.
MINE PLAN AND MINERAL RESERVES
The mineral resource estimates for the project are based on the values calculated by SRK in their 2006 Technical Report and are summarized in Table ES-1. Norwest utilized the geological model and resource classifications referenced in the SRK report in the preparation of the mining plan for the property.
The feasibility level mine plan was developed for an open pit mining operation feeding approximately 5 million tons per year of ore to a crushing-screening plant for placement on a heap leach pad. Gold and silver would be recovered from the leach solution on-site in the form of dorè. The pit designs for the property were based upon the results of a series of Lerchs-Grossman pit optimization analyses and the calculated reserves are summarized in Table ES.3 below. The reserve calculations allow for a mining dilution of 2.5 ft at the ore waste contact (equivalent to approximately 15%). Dilution has been assigned a zero grade. The cut-off grade for the calculated reserves is 0.015 oz/ton gold or gold equivalent.
TABLE ES.3
PROVEN AND PROBABLE MINERAL RESERVES AT SOLEDAD MOUNTAIN
| Proven and Probable Mineral Reserve Estimates |
| Mine Cut-Off Grade=0.008 gold oz/ton | Gold | Silver | Contained Metal |
Reserve
Category | t
| ton
| g/t
| oz/ton
| g/t
| oz/ton
| oz
| oz
|
| Proven | 28,301,000 | 31,196,000 | 0.823 | 0.0240 | 13.716 | 0.400 | 748,700 | 12,478,400 |
| Probable | 20,091,500 | 22,146,000 | 0.545 | 0.0159 | 11.453 | 0.334 | 352,900 | 7,381,900 |
Total &
Average |
48,392,000 |
53,342,000 |
0.708 |
0.0207 |
12.767 |
0.372 |
1,101,600 |
19,860,300 |
Note: 74,000 tons of ore, 2,000 oz of gold and 9,900 oz of silver is added into the probable category. This is from road construction within the defined resource boundary, but outside the pit limit.
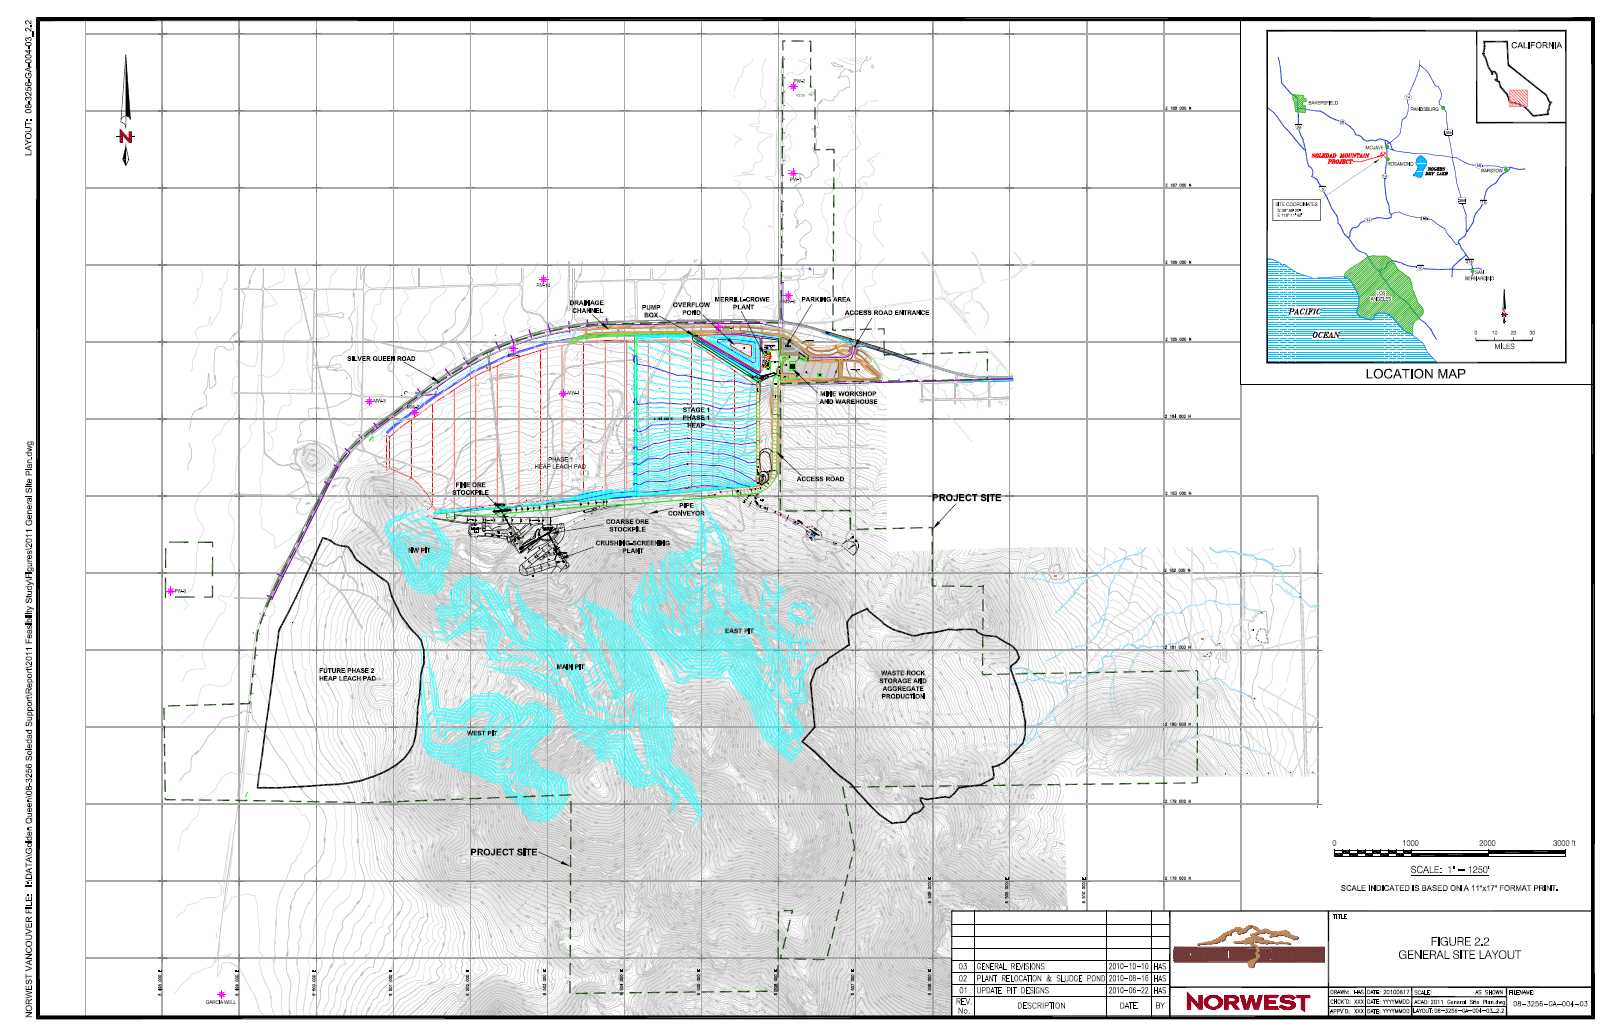
The mine plan is based on utilizing wheel loaders and 100 ton capacity haul trucks for the primary mining supported by a smaller development fleet for pioneering access roads, upper pit benches and final ore mining at the bottom of the various mining phases. The primary mining fleet is supported by additional equipment for road maintenance, dumping operations, stockpile activities and feed to the crushing-screening plant. The projected life of the heap leach operation is 12 years of mining and three years of additional leaching and rinsing Figure ES-1 provides a general site layout.
| |
| GOLDEN QUEEN MINING CO. LTD. / 08-3256 |
| SOLEDAD MOUNTAIN FEASIBILITY STUDY |
| ES-5 |
The crushing-screening plant includes a primary and secondary crusher and screen. A high pressure grinding roll (HPGR) is used as part of the crushing circuit to prepare the ore for stacking on the leach pad. The leach pad is designed to have capacity for the total mine production with placement of approximately 53 million tons of ore on the pad. Pregnant solution will be handled through a Merrill-Crowe plant which will extract the gold and silver from solution for the production of dorè. The dorè will be transported to an off-site smelter and refinery for final production of saleable gold and silver.
Average annual metal production is expected to be in the range of 75,000 oz of gold and 950,000 oz of silver on a post-smelter metal recovery basis. Total post-smelter metal production is estimated at 936,000 oz gold and 10.4 million oz silver over a period of approximately 13 years.
GQM is actively investigating the potential for developing a byproduct aggregate and construction materials business once the heap leach operation is in full production. The source of raw materials will be suitable quality waste rock specifically stockpiled for this purpose. Test work done in the 1990s confirmed the suitability of waste rock as aggregate and construction material. There is also the potential to market the rinsed leach material when mine operations cease. Based on currently projected mine plans, there may be sufficient material to allow aggregate for production for a period of up to thirty years. However, no contributions from the sale of such products will be included in the cash flow projections until long term contracts for the sales of these products are secured.
PROJECT ECONOMICS
NOTE: All costs are reported in US dollars.
The Project requires development capital of $79.7 million plus $17.4 million for major mining equipment and $8.7 million in working capital. The total initial capital required is $105.7 million. In addition, there is $25.3 million in sustaining capital required over the life of the mine which includes leach pad expansions and replacement mining equipment. The average operating cost per ton of ore crushed is $6.72/ton. Operating costs over the life of the project have been calculated at $133/oz net of silver credits at $39.63/oz silver.
Project cash flows for the base case use the current gold price of $1,437.00/oz and for a silver price of $39.63/oz (London closing, April 5th) at the start of April 2011 for the life of the project. Capital and operating costs are also not inflated. The estimated net present value (NPV) for the base case scenario was $678 million at a 8% discount rate with an internal rate of return of 84%, both calculated on a pre-tax basis.
Sensitivity analyses were carried out using alternate gold and silver price cases including the 36 month average price case with the gold price at $1061.25/oz and the silver price at $17.78/oz. This case showed an NPV of $343 million and an internal rate of return of 52%.
| |
| GOLDEN QUEEN MINING CO. LTD. / 08-3256 |
| SOLEDAD MOUNTAIN FEASIBILITY STUDY |
| ES-6 |
CAUTIONARY STATEMENT
As noted in Section 1.3, the Project has been approved by the Kern County Planning Commission and the Kern Country Planning and Community Development Department. The Commission accepted the project plan subject to a number of Conditions of Approval. A number of these conditions specifically address issues related to reclamation of the property including backfilling and restoration to approximate pre-mining topography.
The mine plan presented in this document represents best efforts by Norwest to develop a mine plan which maximizes in-pit backfill while not unduly penalizing the Project’s economic viability. The pit shells used as a basis for this feasibility were selected based on consideration of both economic and waste volume considerations with the goal of developing pit configurations which balanced ore tonnage against waste quantities.
In order for the current mine plan to meet all the conditions laid out by the County, approximately 19 million tons of waste rock must be sold as aggregate and removed from site prior to final reclamation. In addition, all the leached residues must be either permitted to remain in place or be sold as aggregate. If this quantity cannot be sold, the necessity of handling this additional volume as part of the reclamation plan will affect the overall ore tonnage that can be mined at site. While no costs or revenues associated with aggregate production using this material, have been included in the Project economic analysis, removal of these materials is an integral component of the integrated mining and backfilling plan. If these quantities of material remain onsite, it will require revision of the mining plan in order to meet the backfill requirements which could reduce the life of the heap leach operation by up to 2 – 4 years.
Norwest has worked with GQM to develop a scenario which limits the effect of this on the mine life and GQM has had promising discussions with a local aggregate contractor regarding the saleability of the waste rock and leached residues into the regional market. However, there is still a potential risk that meeting the requirements of the Conditions of Approval could affect the overall mine life.
| |
| GOLDEN QUEEN MINING CO. LTD. / 08-3256 |
| SOLEDAD MOUNTAIN FEASIBILITY STUDY |
| ES-7 |

| 1 | INTRODUCTION |
| | |
| 1.1 | TERMS OF REFERENCE |
GQM engaged Norwest Corporation (Norwest) in January 2007 to prepare a NI 43-101 compliant Technical Report to assess mineral reserves for the Project as part of an independent feasibility study based upon technical work and engineering designs completed to the end of 2007. The results of the Norwest study were disclosed in a press release on December 14, 2007. The NI 43-101 compliant Technical Report dated January 23, 2008 is available on SEDAR and on GQM’s website at www.goldenqueen.com.
Norwest has now updated the feasibility level study as per the detail provided in this report.
The geological model for the Project was developed by SRK Consulting (U.S.) Inc. and the mineral resources documented in a 43-101 Technical Report issued March 6, 2006. Norwest has used this model as a basis for pit optimization and the development of the mining plan in the feasibility study.
Detailed studies have been completed by GQM internally under the guidance of Lutz Klingmann, P.Eng., President of GQM. Norwest has incorporated the findings of many of the engineering and technical studies commissioned by GQM as these studies have been completed by qualified independent third parties. These studies are referenced in this feasibility report and a list of all references is included. Where revisions have been made to previous work they are noted (example: capital and operating cost updates).
A discussion of the applicable regulations, potential project impacts and the current status of the project regulatory review is included later in this chapter.
| 1.2 | SOURCES OF INFORMATION |
In-depth technical evaluations were carried out on the Project starting in the mid-1990’s. This work has dealt with all aspects of the Project ranging from geology and resource modeling through to mine operations, ore handling, leach pad operations, metals recovery and reclamation.
The majority of the work has been completed by independent third-party consultants and suppliers. Lutz Klingmann, P.Eng., President of GQM has been coordinating the Project development work since 2002 and has also contributed his technical expertise to the Project development process. Norwest has referenced the documents used in the relevant sections of this report and has also noted where input has been received from Mr. Klingmann.
Norwest has reviewed the reference documents used in the preparation of this feasibility study and has accepted them as providing a reasonable basis for feasibility level planning. Where revisions have been required for a specific document due to changes in the project development plan then these have been noted. In the majority of cases, revisions have been made to update capital or operating cost estimates for various project components.
| |
| GOLDEN QUEEN MINING CO. LTD. / 08-3256 |
| SOLEDAD MOUNTAIN FEASIBILITY STUDY |
| 1-1 |
| 1.3 | REGULATORY CONDITIONS AND PROJECT STATUS |
The Project is subject to federal, State and county acts and regulations governing precious metal cyanide heap leach operations.
All key submissions required for an amended set of approvals and permits for the Project have now been submitted to the responsible regulatory authorities.
| | 1.3.1 | Land Use - Conditional Use Permits |
The environmental setting of the Project was documented in a number of baseline studies completed from 1990 onwards and in the final Environmental Impact Report (the EIR) and Environmental Impact Statement (the EIS) completed in 1997. The Kern County Board of Supervisors unanimously approved two Conditional Use Permits (CUPs) for the Project in September 1997 (i.e. CUP Case No. 41, Map No. 213 and CUP Case No. 22, Map No. 214). The Bureau of Land Management subsequently issued its Record of Decision approving the Plan of Operations under NEPA in November 1997. The company completed a number of studies and did significant work on site in 2005 and 2006 to document that the environmental setting for the Project has not changed since 1997.
The State of California introduced backfilling requirements for certain types of open pit, metal mines in December 2002. The company contended that these regulations did not apply to the Project under a grandfathering provision included in the regulation. The company therefore pursued both a favorable interpretation under the regulation and subsequently an amendment of the regulation with the State Mining and Geology Board (the Board) in 2006. These efforts were supported by Kern County officials. Both approaches were rejected by the Board and the decision was duly recorded by the Board in January 2007.
Norwest prepared a life-of-mine waste rock management plan and this plan incorporates sequential and partial backfilling of mined-out phases of the open pit with rehandle of waste at the end of the mine life to meet backfill requirements. This plan was included in an Application for a revised Surface Mining Reclamation Plan, which was submitted to the Kern County Planning & Community Development Department (the Planning Department) on April 9, 2007.
The Planning Department completed its review of the Application as set out in a letter dated July 24, 2007. The Planning Department noted that changes proposed for the Project constituted new information that required evaluation of potential impacts and mitigation in a supplemental EIR (SEIR).
| |
| GOLDEN QUEEN MINING CO. LTD. / 08-3256 |
| SOLEDAD MOUNTAIN FEASIBILITY STUDY |
| 1-2 |
The draft SEIR was completed and distributed in January 2010. The Kern County Planning Commission formally considered the Project at its regularly scheduled meeting in Bakersfield on April 8. At the meeting, the Commission, consisting of a panel of three commissioners, unanimously approved the Project. All appeals that were subsequently filed against the Commission’s decision have been withdrawn and the decision made by the Planning Commission is now final. The Planning Commission certified the SEIR, adopted a Mitigation Measures Monitoring Program and Conditions of Approval for the Project which define conditions and performance standards which the mining operation must meet. Record of the certification is available at GQM’s office in Vancouver and at the offices of the Kern County Planning Department in Bakersfield.
The Bureau of Land Management confirmed that its Record of Decision approving the Plan of Operations under NEPA in November 1997 remains valid.
| | 1.3.2 | Water Quality – Report of Waste Discharge and Waste Discharge Requirements |
The Lahontan Regional Water Quality Control Board (the Regional Board) is responsible for ensuring compliance with the federal Clean Water Act and California’s Porter-Cologne Water Quality Act.
The company submitted a Report of Waste Discharge (ROWD), prepared by WZI Inc., Bakersfield, to the Regional Board in June 1997. The Regional Board adopted Board Order No. 6-98-9 on March 5, 1998 at a meeting held in Lancaster and this set the Waste Discharge Requirements for the Project.
The company and its consulting engineers prepared and submitted a revised ROWD to the Regional Board on March 8, 2007. The revised ROWD was prepared at the request of the Regional Board to document changes in the layout and design of the heap leach facility plus other changes proposed for the Project.
The Regional Board unanimously approved Waste Discharge Requirements and a Monitoring and Reporting Program for the Project at a public hearing held in South Lake Tahoe on July 14, 2010 (reference Board Order No. R6V-2010-0031). The Board Order was subsequently signed by the Executive Officer of the Board and is now in effect.
| |
| GOLDEN QUEEN MINING CO. LTD. / 08-3256 |
| SOLEDAD MOUNTAIN FEASIBILITY STUDY |
| 1-3 |
| | 1.3.3 | Air Quality – Authority to Construct and Permit to Operate |
GQM had obtained seven Authority to Construct permits dated March 16, 2002. These permits expired on March 16, 2004 and were not renewed due to changes anticipated in the Project.
A revised and updated Air Quality and Health Risk Assessment for the Project was completed and submitted to the Planning Department and the Eastern Kern Air Pollution Control District (EKAPCD) on July 21, 2009. All concerns about possible emissions were fully addressed in the SEIR. Feasible mitigation measures to reduce potential impacts from the Project to levels that are less than significant were recommended in the SEIR and included in the Mitigation Measures Monitoring Program or Conditions of Approval.
Nine (plus one subsequently) applications for Authority to Construct permits were submitted to the EKAPCD on February 11, 2011 and EKACPD is processing the Authority To Construct permits.
The Authority to Construct permits would be converted to a Permit To Operate after construction has been completed and subject to inspection by the EKAPCD.
| | 1.3.4 | Reclamation and Reclamation Financial Assurance |
GQM has provided reclamation financial assurance in the form of an Irrevocable Standby Letter Of Credit backed by a Certificate Of Deposit with Union Bank of California in the amount of US$286,653.00. This is the current estimate for reclamation of historical disturbances on the property and this is reassessed annually.
GQM prepared detailed cost estimates for ongoing reclamation and reclamation at the end of the life of the mine and these cost estimates were included in the Application for a revised Surface Mining Reclamation Plan. GQM will provide the necessary financial assurance as required by the regulatory authorities. Cost estimates for site reclamation are included in the discussion of the project economics and operating costs.
A number of additional approvals and permits will be required as project development proceeds, as detailed below:
Newly implemented security requirements make contract blasting a preferred option and a contract blasting service will be used. The contractor will be required to obtain the necessary approvals and permits.
| |
| GOLDEN QUEEN MINING CO. LTD. / 08-3256 |
| SOLEDAD MOUNTAIN FEASIBILITY STUDY |
| 1-4 |
Conditions GQM must meet both before the start of construction, during operations and after operations have ended are set out in the Mitigation Measures Monitoring Program and Conditions of Approval.
As noted in Section 1.3, the Project has been approved by the Kern County Planning Commission and the Kern Country Planning and Community Development Department. The Commission accepted the project plan subject to a number of Conditions of Approval. A number of these conditions specifically address issues related to reclamation of the property including backfilling and restoration to approximate pre-mining topography.
The mine plan presented in this document represents best efforts by Norwest to develop a mine plan which maximizes in-pit backfill while not unduly penalizing the Project’s economic viability. The pit shells used as a basis for this feasibility were selected based on consideration of both economic and waste volume considerations with the goal of developing pit configurations which balanced ore tonnage against waste quantities.
In order for the current mine plan to meet all the conditions laid out by the County, approximately 19 million tons of waste rock must be sold as aggregate and removed from site prior to final reclamation. In addition, all the leached residues must be either permitted to remain in place or be sold as aggregate. If this quantity cannot be sold, the necessity of handling this additional volume as part of the reclamation plan will affect the overall ore tonnage that can be mined at site. While no costs or revenues associated with aggregate production using this material, have been included in the Project economic analysis, removal of these materials is an integral component of the integrated mining and backfilling plan. If these quantities of material remain onsite, it will require revision of the mining plan in order to meet the backfill requirements which could reduce the life of the heap leach operation by up to 2 – 4 years.
Norwest has worked with GQM to develop a scenario which limits the effect of this on the mine life and GQM has had promising discussions with a local aggregate contractor regarding the saleability of the waste rock and leached residues into the regional market. However, there is still a potential risk that meeting the requirements of the Conditions of Approval could affect the overall mine life.
| |
| GOLDEN QUEEN MINING CO. LTD. / 08-3256 |
| SOLEDAD MOUNTAIN FEASIBILITY STUDY |
| 1-5 |
| 2 | PROJECT OVERVIEW |
| | |
| 2.1 | PROJECT DESCRIPTION |
The Project is located in Kern County in southern California as shown in Figure 2.1. A general site layout is shown in Figure 2.2 showing details of the planned site layout including infrastructure, mining areas and the Phase 1 and potential future Phase 2 heap leach pads. The Project is located approximately 5 miles south of the town of Mojave. The metropolitan areas of Rosamond and Lancaster lie approximately 9 miles and 20 miles to the south respectively. Los Angeles is about 70 miles south of Mojave.
Access to site is from State Route 14 and Silver Queen Road, an existing paved County road. Mojave is a railroad hub for the Burlington Northern/Santa Fe and Union Pacific/Southern Pacific railroad lines. Services such as a hospital, ambulance, fire-protection, garbage and hazardous waste disposal, schools, motels and housing, shopping, airport and recreation are available in Mojave and its surroundings. Telephone service is available on site.
The Project is within the Mojave Mining District along with the former Cactus Gold Mine, Standard Hill Mine and Tropico Mine. These former operating mines are located within a radius of five miles of the Soledad Mountain site.
| 2.2 | SITE PHYSIOGRAPHY AND CLIMATE |
The Soledad Mountain gold-silver deposit is hosted in a volcanic sequence of rhyolite porphyries, quartz latites and bedded pyroclastics that form a large dome-shaped feature, called Soledad Mountain, along the margins of a collapsed caldera. The deposit is located on the central-northeast flank of Soledad Mountain. The mountain has a domal form that is a reflection of an original, dome-shaped volcanic center. Elevations range from 4,180ft at the highest point of Soledad Mountain to 2,840ft at the valley floor north of the mountain.
The Mojave region is generally characterized as arid, with a wet season from December through March. Rainfall events tend to be short lived and of high intensity. Mojave experiences high summer temperatures up to 113°F. The minimum temperature may reach 20°F. Maximum wind speed is 90mph with Exposure C for design purposes. Mean recorded annual rainfall is 6.14 inches with a mean maximum month of 1.11 inches.
GQM controls approximately 2,500 acres (1,000 hectares) of land in the area, consisting of private (fee land and patented lode mining claims and millsites) and federal lands (unpatented mining claims and millsites) administered by the BLM, collectively referred to as the Property. The total area required for the Project, which is surrounded by a Project boundary, is approximately 1,300 acres (500 hectares) in size. The actual area that will be disturbed by mining, waste rock disposal, the construction of the heap leach pads and the heap and the facilities will be approximately 912 acres (369 hectares) in size of which approximately 835 acres (338 hectares) will be reclaimed during and at the end of the mine life.
| |
| GOLDEN QUEEN MINING CO. LTD. / 08-3256 |
| SOLEDAD MOUNTAIN FEASIBILITY STUDY |
| 2-1 |
The Property is located west of California State Highway 14 and largely south of Silver Queen Road in Kern County, California, and covers all of Section 6 and portions of Sections 5, 7 and 8 in Township 10 North (T10N), Range 12 West (R12W), portions of Sections 1 and 12 in T10N, R13W, portions of Section 18 in T9N, R12W, and portions of Section 32 in T11N, R12W, all from the San Bernardino Baseline and Meridian. The Project facilities will be located in Section 6 of T10N, R12W. Two water production wells have been drilled in Section 32, T11N, R12W, on land controlled by GQM. A third water production well was drilled in Section 1, T11N, R12W, on land controlled by GQM in 2008.
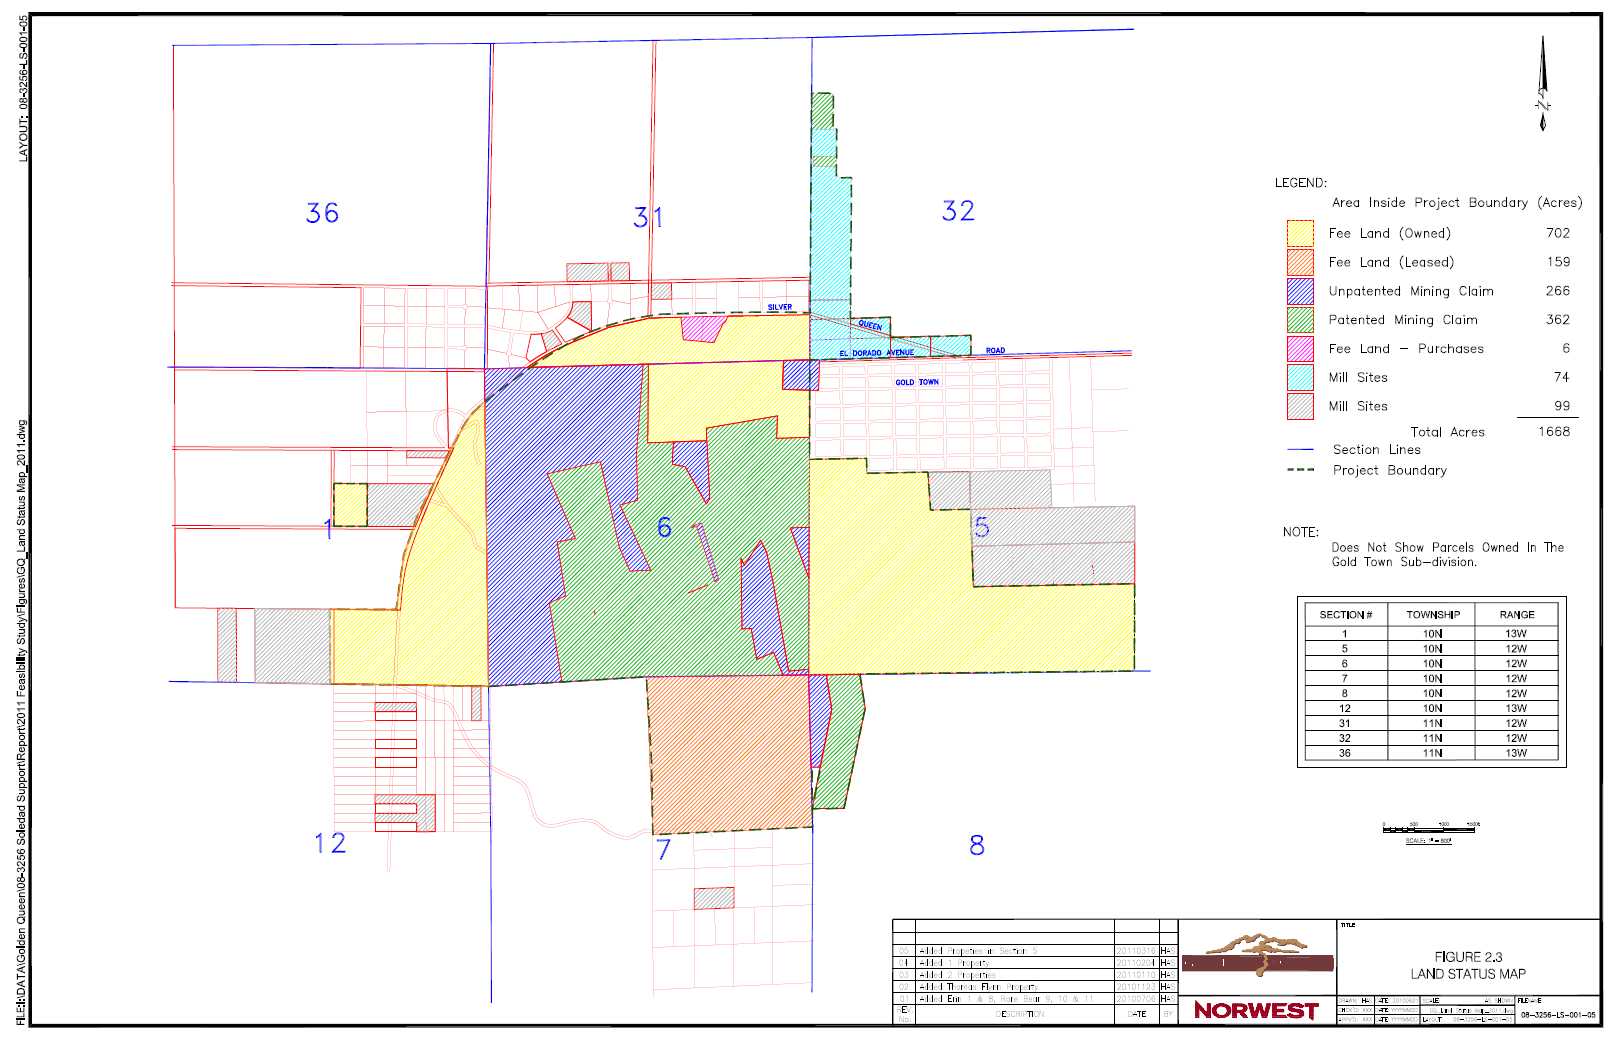
GQM holds or controls via agreement 33 patented lode mining claims, 134 unpatented lode mining claims, 1 patented millsite, 12 unpatented millsites, 1 unpatented placer claim and 867 acres of fee land. A summary of the land held by GQM as part of the current permitted project area is shown in Table 2.1. As note above, additional land is held by GQM which may be incorporated into the project area in the future if required. Figure 2.3 shows the area listed in Table 2.1 and additional land claims done by GQM from 2006 to 2011.
TABLE 2.1
LAND STATUS
| Land Status | Acres | Hectares |
| Fee Land (Owned) | 702 | 284 |
| Unpatented Mining Claims | 266 | 108 |
| Patented Mining Claims | 353 | 143 |
| Fee Land (Purchases) | 6 | 2 |
| Fee Land (Leased) | 159 | 64 |
| Millsites | 74 | 30 |
| Total | 1,560 | 631 |
GQM holds or controls the properties under mining leases with 53 individual landholders, two groups of landholders and 2 incorporated entities. Contact information for the landholders is available on file at the GQM offices in Vancouver.
GQM believes that all the land required for the Project either has been secured under a mining lease or is held by GQM through ownership of the land in fee or via unpatented mining claims and millsites. GQM executed land purchases or entered into agreements from 1990 onwards, and is continuing to add to its land position in the area.
| |
| GOLDEN QUEEN MINING CO. LTD. / 08-3256 |
| SOLEDAD MOUNTAIN FEASIBILITY STUDY |
| 2-2 |
GQM carried out an aerial survey of the Project area in 2004 and produced a topographic map with 5 ft contour intervals in the Project area using California State Plane Zone 5 coordinates.
A formal title review was done by Gresham Savage Nolan & Tilden, a firm with extensive experience in title matters. The report was dated September 6, 1996 and was updated to April 26, 1999.
A formal title review was again done by an independent landman, Sylvia Good, in May 2004.
GQM was formed in November 1985 to acquire Golden Queen Mining Co., Inc., a California corporation, which had secured, by agreement, a core group of claims on Soledad Mountain.
The reference to resources and reserves in this section are the historical terms used at the time and are not sufficiently defined to be classified by CIM categories in use today. The historical resource/reserve discussions in this section should not be relied upon. GQM is not treating them as current Mineral Resources or Mineral Reserves, and does not consider them to be NI 43-101 compliant resource estimates.
The first recorded mining activity in the Mojave Mining District occurred on March 8, 1894, when W.W. Bowers discovered gold on a promontory south of Mojave, then named Bowers' Hill and now known as Standard Hill. This soon led to the discovery of the Exposed Treasure vein on the same hill. Later that year gold was found on Tropico Hill, in the Rosamond Hills. Prospecting also started on Soledad Mountain and gold was found on the Queen Esther, Karma, Echo, Elephant and Gray Eagle properties.
The first mill was built at the Exposed Treasure Mine in 1901. This mill had 20 stamps and a cyanide plant. Construction of other mills followed rapidly - the Echo mill in 1902 with 10 stamps, the Queen Esther mill in 1903 and the Karma mill in 1904 with 20 stamps. Of these properties, the Exposed Treasure, with production equivalent to 3,260kg (105,000oz) of gold, was the largest; the Queen Esther, with production equivalent to 1,930kg (62,000oz) of gold, was second and the Karma third with production equivalent to 1,150kg (37,000oz) of gold. The last of these early mills was shut down in 1914 when the readily available ore was exhausted.
The district attracted brief attention eight years later with a find of rich ore on the Yellow Dog claim located on a small butte near Bowers' Hill, but interest soon waned as the deposit proved to be small.
The revival of the district is attributable in part to the Burton Brothers, who, as owners of the Tropico mine and mill, assisted lessors in the district by grub-staking prospectors and providing a mill for the treatment of lessees' ore. Lessees looking for a new area to work (George Holmes) found some float that led to the discovery of the Silver Queen vein system on Soledad Mountain in 1933. Claims were staked and exploration was done. The property was sold to a syndicate (Golden Queen Mining Co.) headed by Gold Fields America Development Co. (GFA) in January 1933.
| |
| GOLDEN QUEEN MINING CO. LTD. / 08-3256 |
| SOLEDAD MOUNTAIN FEASIBILITY STUDY |
| 2-3 |
GFA did extensive exploration on the property in the next few years, which resulted in a large increase in ore reserves. The Golden Queen vein was also discovered at that time. During this period of exploration on the Golden Queen vein, an area south and west of the Golden Queen vein was also explored and a large vein was discovered on the Starlight claim. The Soledad Extension vein, west of the Starlight vein was also discovered. The Lodestar Mining Co. obtained control of this area.
GFA built a 273t/day (300ton/day) mill on the property and production started in October 1935. The mill was then expanded to 364t/day (400ton/day). Ore was extracted from the Silver Queen, Golden Queen, Soledad, Queen Esther and Karma veins plus ore was custom-milled from other properties in the area. Tailings from smaller, historical mining operations were also retreated. Production continued until the mine was closed by Order L-208 of the War Production Board in 1942. Although records are incomplete, it is estimated that 1.18million t (1.3million ton) of ore was mined and milled with average grades of 9.5g/t gold (0.277oz/ton) and 223g/t silver (6.5oz/ton) . The mine did not resume production after the war although some exploration and development work was done. GFA returned the property to its former owners in 1953 and the company was dissolved.
It is estimated that a total of 7,300t (8,030 tons) of ore was mined in the Project area by lessors in the early 1950s.
The only exploration of note between 1953 and 1985 was undertaken by Rosario Exploration. The company drilled eight or nine percussion holes in the area and did some underground sampling during the mid-1970s.
| |
| GOLDEN QUEEN MINING CO. LTD. / 08-3256 |
| SOLEDAD MOUNTAIN FEASIBILITY STUDY |
| 2-4 |
Prior to the completion of the feasibility study, two evaluations of the geology of the Soledad Mountain area were carried out, the first by Mineral Resources Development, Inc. (MRDI) and the second, the NI 43-101 Technical Report, was carried out by SRK.
Soledad Mountain is located within the Mojave structural block, a triangular-shaped area bounded to the east by the northwest-trending San Andreas Fault and to the north by the northeast-trending, Garlock Fault. The Mojave block is broken into an orthogonal pattern of N50E to N60E and N40W to N50W fracture systems. These fracture zones likely developed as the result of Late Cretaceous compressional stresses that were present prior to formation of the Garlock and San Andreas Faults. Gold and silver mineralization at Soledad Mountain is hosted by northwest-trending, en-echelon faults and fracture systems. Cretaceous quartz monzonite forms the basement of stratigraphic sequences in the Mojave block. The quartz monzonite is overlain by Miocene-age, quartz latitic and rhyolitic volcanic rocks. Volcanic centers appear to have formed at intersections of the northeast and northwest-trending fracture systems. Major volcanic centers are present at Soledad Mountain, Willow Springs and Middle Buttes. These volcanic centers consist generally of initial, widespread sheet flows and pyroclastics of quartz latite, followed by restricted centers of rhyolitic flows and rhyolite porphyry intrusives. Rhyolitic flows and intrusives are elongated somewhat along northwest-trending vents and feeder zones. Gold deposits in the Mojave block include Soledad Mountain, Standard Hill, Cactus and Tropico. At Soldead Mountain gold mineralization occurs in low-sulfidation style, quartz-adularia veins and stockworks that strike northwest. Gold mineralization at Standard Hill, located 1 mile northeast of Soledad, consists of north to northwest-striking quartz veins in Cretaceous quartz monzonite and Tertiary, quartz latitic volcanic rocks. At the Cactus Gold Mine, 5 miles west of Soledad, gold occurs in northwest and northeast-striking quartz veins, breccias and irregular zones of silicification in quartz latite, rhyolitic flows and rhyolitic intrusive breccias.
| 3.2 | LOCAL GEOLOGY |
| | |
| 3.2.1 | Lithology & Stratigraphy |
McCusker (1982) mapped Soledad Mountain in detail and defined the major stratigraphic and structural features of the volcanic complex present there. GQM has retained McCusker’s nomenclature without significant modification. Volcanics at Soledad Mountain comprise coalescing intrusive-extrusive domes, flows and pyroclastics. This volcanic center presumably overlies Cretaceous quartz monzonite, such as is exposed at the adjacent Standard Hill mine, although drillholes have not penetrated basement rocks at the deposit. Age dates of 21.5 Ma to 16.9 Ma have been obtained from the volcanic rocks, suggesting that the volcanic center formed over a relatively long period from early to middle Miocene age. The lower most volcanic unit penetrated in drilling is an early Miocene quartz latite flow that strikes northwest and dips at low angles to the northeast.
| |
| GOLDEN QUEEN MINING CO. LTD. / 08-3256 |
| SOLEDAD MOUNTAIN FEASIBILITY STUDY |
| 3-1 |
|
Overlying the quartz latite is a section of middle Miocene pyroclastics, (“lower pyroclastics”), comprising a vent-proximal sequence of coarse-grained volcanic debris, breccias and tuffs. Flow-banded rhyolites intrude and overly the lower pyroclastic unit. The rhyolites appear to have flowed out along a northwest-trending, high-angle vent coinciding generally with the center of the deposit and then northeastward away from the vent. Coarse-grained, pyroclastic breccias occur locally over the flow-banded rhyolites along the axis of the vents. These pyroclastic rocks likely represent laterally discontinuous zones of vent eruptions and collapse breccias that formed after the main pulse of rhyolite extrusion. The youngest volcanic unit is a massive, quartz-eye rhyolite porphyry of middle Miocene age. This unit is present over most of the southwest portion of the property. The rhyolite porphyry forms the core of the volcanic complex, intruding and displacing previous volcanic units south of the deposit center. Emplacement of the porphyry may have been controlled by a northwest fault that now coincides with the Soledad Extension Vein. GQM has classified volcanic lithologies into four units (Figure 3.1 and Figure 3.2): Quartz latite: present over most of the northeast portion of the deposit and in the subsurface of the center of the deposit; Pyroclastics: present in the subsurface of the north-central portion of the deposit beneath flow-banded rhyolite; Flow-banded rhyolite: present at the surface in the north-central portion of the deposit and, as an intrusive, extending deep into the center of the deposit; and rhyolite porphyry: present as a massive body extending from the surface to the bottom of drilling over most of the southwest portion of the deposit.
The groundwater water table is at about 2,580 ft above mean sea level. The boundary between oxidized and unoxidized mineralization is strongly controlled by the intensity of fracturing and mimics the geometry of veins and fault structures. The depth and degree of oxidation, as logged in RC and core holes, have not been modeled, and were not available for inspection. MRDI reported that mineralization in drill cores and in underground workings suggest that mineralization is oxidized at least to the depth of the present water table.
GQM interprets the deposition of precious metals to be related to a large epithermal, multiepisodic, fault/fissure vein system. Gold mineralization occurs in low-sulfidation style, quartz adularia veins and stockworks that strike northwest. Veins formed by the process of alteration of volcanic rocks by convecting groundwaters with the deposition of quartz and sericite-rich material in fault and fracture zones (Figure 3.3) . The total sulfide content is one percent or less. Vein “zones” consist of one or more central veins surrounded by either a stockwork or parallel zones of veinlets. High grade mineralization shoots form where dilational opening and cymoid loops develop, typically where the strike or dip of the fault changes, allowing solutions to undergo cooling, degasification by fluid mixing, boiling, pH changes of hydrothermal solutions, and decompression.
| |
| GOLDEN QUEEN MINING CO. LTD. / 08-3256 |
| SOLEDAD MOUNTAIN FEASIBILITY STUDY |
| 3-2 |
The resource model used as the basis of this feasibility study was based on 59 diamond drill holes, 663 reverse circulation (RC) drill holes and extensive sampling of the existing underground workings. Figure 3.4 shows the location of the drilling and cross cuts used in this resource model.
| | 3.3.1 | Drilling Methods |
| | | |
| | 3.3.1.1 | Sample Spacing |
Nominal spacing for surface drilling is about 100 ft along strike and 125 ft perpendicular to strike of known veins within the southwest one-half of the deposit (Sections oriented N45E). The drillhole spacing perpendicular to the strike of veins in the northeast half of the deposit (Sections oriented N60E) is about 200 ft. Drillholes are spaced from 200 ft to 500 ft apart outside of known veins. Both core holes and RC holes were positioned to intersect vein systems as close as possible to the perpendicular of vein strike and dip. Generally, drillholes intersect southwest-dipping veins at angles ranging from 45° to 70° and northeast-dipping veins at angles ranging from 45° to 90°. Deep intersections of southwest-dipping veins are at angles as low as 30°.
Underground channel samples were taken where cross-cuts were driven off the main vein zones by GFA and earlier operators. All accessible cross-cuts were channel sampled where previous GFA sampling had not been carried out. GQM has not used samples collected along the strike of the veins (along drifts). The spacing of cross-cuts varies, but they are normally 50 ft apart along the Silver Queen, Golden Queen and Starlight Veins and from 100 ft to 400 ft apart on other veins. With combined drillhole and cross-cut data, samples are spaced from 50 ft to 150 ft in the most important veins. This is adequate to define the continuity of the central portion of veins and surrounding low-grade material on 100 ft sections.
| | 3.3.1.2 | Reverse-Circulation Holes |
Drilling methods are described here from information compiled by Mine Research Associates (MRA). MRDI reports check this information where it was noted on drill logs stored in GQM’s files. MRDI reports that information on contractors and drill-rigs utilized for the first 332 RC holes drilled from 1985 to 1994 was not available. Since 1994, RC holes were drilled by Hackworth Drilling Company and P.C. Exploration Company using track-mounted MPDH 1000 drill-rigs. Drill bits ranging from 4.75 in to 5.5 in in diameter were used. Samples reportedly were collected at the drill rig at 5 ft intervals. According to GQM staff, drilling was carried out with water injection to reduce dust emissions. This required use of a rotating wet splitter. A “rig duplicate” sample was collected and left at the drill site. MRDI inspected five drill sites near the 200 Level portal and found that the plastic bags in which rig duplicates were stored had decayed, ruining the sample, or that samples had been destroyed during subsequent road work. As a result, very few rig duplicates are preserved in a condition that would permit check sampling. RC samples were not weighed at the time they were collected; therefore, sample recovery could not be evaluated. MRDI reports that RC drilling, logging and sampling methods did appear to meet industry standards.
| |
| GOLDEN QUEEN MINING CO. LTD. / 08-3256 |
| SOLEDAD MOUNTAIN FEASIBILITY STUDY |
| 3-3 |
Information given here was obtained from MRA’s description contained in the M3 Feasibility Study of March, 1998. This information was checked during MRDI’s audit, where the information was available on drill logs.
Twelve surface diamond drillholes were drilled from 1985 to 1994 by several contractors. Information is not available concerning drill-rigs utilized. Since 1994, surface diamond drilling has been carried out by McFeron and Marcus Exploration, Inc., using a DMW-65 drill rig. All core is HQ (2.5 in diameter).
Underground core drilling was conducted, starting in 1994, by Boart Longyear Company using LM75 drillrigs. All core was HQ (2.5 in diameter). Core from holes drilled by GQM was inspected by MRDI in 2000 and SRK in 2005 at a storage warehouse at the mine site. Core boxes are in good condition and stored in a secure, well-organized fashion on wooden shelves. Core sampling techniques were examined by MRDI for holes DDH 97-1 and DDH 97-5. The core was either split mechanically or sawed. Three quarters of the core was collected for assaying, and one quarter was retained for reference. Core logs were reviewed for all 59 holes to check for poor recoveries through zones of mineralization. Recovery was not recorded for core holes 1-16. Only general comments regarding recovery were made for holes DDH 17-21 rather than recording actual measurements for each drill run. “100% recovery” was noted for most mineralized intervals except hole DDH 21, which experienced recoveries as low as 25% in mineralized intervals. The remainder of drill logs recorded measured recoveries for each cored interval. The number of mineralized intervals with poor core recovery is relatively small for the 43 core holes that have recovery information. MRDI reports that recovery appears to have been adequate to meet industry standards for holes 22 and onward. Records are substandard for the earliest 16 holes, however, and the impact of poor recovery in these holes cannot be assessed.
GQM has prepared a limited infill drilling program for 2011 with planned targets in the areas of the planned North-West and East pits. A total of 15 holes are proposed within the North-West open pit area with a total length of 1,500m (4,900ft). The North-West pit is the planned location of the first phase of mining. A total of 9 holes are proposed within the East pit area with a total length of 1,200m (3,900ft). The program will consist primarily of infill drilling with the objective of upgrading inferred resources to a level of assurance which will meet the criteria for classification as reserves. In addition, the drilling will test continuity of mineralization.
| |
| GOLDEN QUEEN MINING CO. LTD. / 08-3256 |
| SOLEDAD MOUNTAIN FEASIBILITY STUDY |
| 3-4 |
| | 3.3.1.4 | Historical GFA Cross-cut Sampling |
MRDI reported inspecting sample channels cut across the Golden Queen Vein by GFA in the 1930s on the 200 Level. Channels are 6 inch wide and 1 inch deep and generally at least 5 ft long. The technique of sampling employed by GFA is unknown, but it appears that a 2 in by 6 in board was used as a guide and the channel was cut with hand chisels until the board fit neatly within the channel. Channels of this size should have produced a sample weighing about 33 lbs to 35 lbs per 5 ft sample length. Samples reportedly were assayed at the mill laboratory on site. Information on sample preparation and assay method is not available.
In 1997 and 1998, GQM carried out a program of re-sampling those cross-cuts that were channel-sampled by GFA, and a program of channel sampling other cross-cuts that either had not been previously sampled or where results for previous sampling were not available in a usable form. MRDI inspected GQM sample channels across the Golden Queen, Starlight and Footwall Veins on the 200 Level. GQM staff used a pneumatic hammer to cut horizontal channels from 2 to 3 inch wide and 5 feet long. An attempt was made to closely duplicate original channels cut by GFA, but this was not always possible because markings of the original channels did not survive or were illegible. In these cases, the locations of the original channels were relocated using map linens of sample locations and underground survey markers. Rock chips were collected on a canvas sheet. Samples weighing about 32 lbs were produced from GQM channels. All channels inspected were relatively consistent in width and depth. Additional channel samples were cut by GQM in 1999 to provide additional check information. MRDI reported that underground channel sampling by GFA and GQMC met industry standards.
| | 3.3.2 | Surveying |
| | | |
| | 3.3.2.1 | Drillhole Collar Surveys |
Drillhole collar locations were surveyed relative to the historical mine grid by DeWalt Corporation of Bakersfield, California. Surveys were carried out using either a Total Station Wild TC-1610 theodolite or Trimble 4000 SSI RTK Global Positioning System.
The accuracy of collar surveys for all drillholes was checked by MRDI by plotting drillhole collar elevations on a digital topographic map, (contour interval of 10 ft), and checking drill collar elevations against the topographic elevation. A total of 26 drillholes were found to have collar elevations greater than 10 ft above or below the topographic elevation. Local systematic errors, such as groups of drillholes with errors corresponding to the same direction in error relative to the topographic elevation, were found. Discrepancies in the horizontal location of collars range from 25 ft to as much as 100 ft. One group of 14 surface RC drillholes targeting the Queen Esther Vein had a systematic error in which drill collars were located from 20 ft to 5 ft southwest of the correct topographic elevation. MRDI informed GQM staff of the survey discrepancies and GQM made corrections to the database while MRDI was on site. The collar positions of GQ-88 and GQ-525 were checked in the field and were found to be reasonable relative to the portal of the 200 Level. The collar to GQ-19 could not be found and most likely was destroyed by later road work.
| |
| GOLDEN QUEEN MINING CO. LTD. / 08-3256 |
| SOLEDAD MOUNTAIN FEASIBILITY STUDY |
| 3-5 |
Down-hole surveys were not performed for holes drilled prior to 1994. RC holes GQ-1 to GQ- 475 and core holes DDH-1 to DDH-16 were not surveyed. Diamond drillholes DDH-17 through DDH-42 and DDH 97-1 through DDH 97-10 were surveyed for dip and azimuth using a Baker Hughes/Inteq Magnetic Single Shot Survey Tool. RC holes GQ-475 through GQ-632 were surveyed for dip using a MD-Totco Special Operating Unit Deviation Tool. Inclined RC holes show a downward deviation of from 1.5° to 3° per 100ft. The lateral deviations in azimuth are unknown.
MRDI notes that the lack of down-hole surveys for more than 70% of the drillholes will contribute to errors in the predicted location of zones of mineralization. The drill paths of unsurveyed RC drillholes were adjusted by GQM to incorporate 2° of downward deviation per 100 ft of hole. MRDI reports that this correction has produced a more reasonable interpretation of the location of veins and vein zones, as confirmed by comparisons between the location of veins in RC holes, core holes and underground workings. MRDI states that the lack of down-hole surveys for RC holes should not materially affect resource estimation, given the average correction used and the fact that RC vein intercepts agree reasonably with the locations of veins as indicated by underground sampling and core drilling. Survey control for the location of drillholes and down-hole location of drill samples is adequate to support a feasibility study.
| | 3.3.2.3 | Underground Cross-cut Samples |
The positions of underground cross-cut samples were located by GQM by using historical transit surveys of underground workings. Portal elevations were corrected during surface surveying of drill sites if portal elevations on mine maps did not agree with GQM’s topographic map. The location of cross-cut samples was corrected by GQM if the elevations of those samples were tied to incorrect portal elevations. Monuments for RC drillholes GQ-525 and GQ- 88 were inspected by MRDI in the vicinity of the 200 Level adit. Monuments consist of handscribed, aluminum tags stapled to wood laths, which are set in a cement collar plug.
| | 3.3.2.4 | Topographic Database |
A new topographic database was produced in 2004. DeWalt Corporation, Bakersfield set the control points around the perimeter of the area. Foto Flight Surveys Ltd., Calgary did the aerial photography in July 2004. Triathlon scanned colour film, completed aerial triangulation, photogrammetric mapping and digital orthophotography. Project specifications are as follows:
| |
| GOLDEN QUEEN MINING CO. LTD. / 08-3256 |
| SOLEDAD MOUNTAIN FEASIBILITY STUDY |
| 3-6 |
| | • | Control points | 8 targeted and surveyed control points |
| | • | Photo scale | 1:16,000 |
| | • | Mapping scale | 1 inch = 200 ft |
| | • | Contour interval | 5 ft |
| | • | Projection | California State Plane Zone 5 |
| | • | Horizontal datum | NAD83 |
| | • | Vertical datum | NAV88 |
| | • | Units | Survey Feet |
| 3.4 | MINERALIZATION |
| | |
| 3.4.1 | Types of Mineralization |
At least 14 separate veins and related vein splits occur at Soledad Mountain. Veins generally strike N40W and dip at high angles either to the northeast or to the southwest. Mineralization consists of fine-grained pyrite, covellite, chalcocite, tetrahedrite, acanthite, native silver, pyrargyrite, polybasite, native gold and electrum within discrete quartz veins, veinlets, veinlet stockworks and irregular zones of silicification. Electrum is about 25% silver. Native gold is generally associated with siliceous gangue and occurs as particles with diameters ranging from less than 10 µm to as much as 150 µm. Gangue minerals include quartz, potassium feldspar, ferruginous kaolinitic clay, sericite, hematite, magnetite, geothite and limonite. Veins formed by the process of intense alteration of volcanic rocks and by deposition of quartz and sericite-rich material in fault and fracture zones (Figure 3.3) . The alteration is generally low in sulfur, with total sulfide content being 1% or less. Vein “zones” consist of one or more central veins surrounded by either a stockwork or parallel zones of veinlets. The effect is to have a core vein of 1 ft to 20 ft wide (with gold grades being generally greater than 0.1 oz/ton), surrounded by lower grade mineralization with widths ranging from 5 ft to 150 ft. The boundary between mineralized and non-mineralized material must be determined by assay.
Important veins (Figure 3.5), from the northeast to southwest, are the Reymert, Karma, Independent, Queen Esther, Silver Queen, Golden Queen, Starlight, Gypsy, Echo, Soledad Extension, Hope, Elephant and Bobtail. Veins northeast of the Golden Queen Vein dip from 40° to 70° northeast. Veins south of the Golden Queen Vein dip about 70° southwest. A zone of “Flat Ore” is present between the Starlight and Silver Queen Vein. Flat Ore is a complex zone of veins and stockwork mineralization that is from 100 ft to 125 ft thick and nearly horizontal. It may have been produced by post-ore faulting of higher levels of the Starlight Vein. Separate, parallel or en-echelon vein systems are present over a total strike length of 6,000 ft trending northwest and a total width of 4,500 ft. Veins and zones are from 5 ft to 150 ft thick, 325 ft to 3,000 ft long and from 300 ft to 1,000 ft deep along dip. The horizontal distance between individual veins is from 50 ft to over 400 ft.
| |
| GOLDEN QUEEN MINING CO. LTD. / 08-3256 |
| SOLEDAD MOUNTAIN FEASIBILITY STUDY |
| 3-7 |
| | 3.4.3 | Tenor & Silver to Gold Ratio |
Gold grades greater than 0.1 oz/ton appear to occur where veins exhibit multiple generations of quartz, adularia and sericite. Sheeted vein systems and stockwork veins decrease in grade laterally outward from core veins. Silver to gold ratios vary from 1:1 in shallow portions of veins in the south half of the deposit to greater than 35:1 at deeper levels (600 Level) in the north half of the deposit. A consulting geologist, working for GQM, studied spatial variations in silver to gold ratios throughout all of the vein systems (GQM internal report, April 1998). Silver to gold ratios were found to increase generally with depth from about 10:1 at the surface of the Golden Queen Vein (historical GFA 0 Level) to about 35:1 at the 600 Level in the same vein. The district average ranges from 15:1 to 18:1.
| 3.5 | MINERAL RESOURCE & MINERAL RESERVE ESTIMATES |
| | |
| | 3.5.1 | Overview |
An audit determined that deficiencies in both data and modeling approach noted by AMEC E & C Services Inc. in October 2005 had been corrected and that the recommendations made by MRDI in 2000 had been followed. Based on direct observations made by SRK during the site inspection, interviews with GQM personnel, examination of the GQM and MRDI reports, discussions with AMEC and the audit of the model and associated databases, SRK concluded:
Geologic Interpretation – The interpretation of structure and rock types is thorough and realistic.
Drilling – Core drilling and core logging meet industry standards. As reported by GQM and MRDI, RC drilling and logging appear to meet industry standards. Survey control for the location and down-hole location of drill samples appears adequate.
Drillhole spacing is adequate to define most of the veins.
Sampling Method, Approach, Preparation and Analysis – The underground channel sampling by GFA and GQM, inspected and checked by MRDI, was reported to meet industry standards. SRK finds the factors developed by MRDI to correct the historic GFA data to be reasonable. The reported assay precision is acceptable for grades greater than 0.008oz/ton Au.
| |
| GOLDEN QUEEN MINING CO. LTD. / 08-3256 |
| SOLEDAD MOUNTAIN FEASIBILITY STUDY |
| 3-8 |
Data Verification - MRDI found errors during their check of the pre-1999 assay database; however, they found the database to be acceptable. SRK and AMEC found errors during checks of the 1999 drilling but found the data to be acceptable. Assays from twins of core holes, RC holes and underground cross-cuts show a reasonable correlation among different drilling and sampling methods.
Mineral Resource Estimate – The procedures developed by GQM, with assistance from MRDI, and employed by GQM and later AMEC, to construct the resource model, are acceptable. The grade zones developed by GQM are a very significant interpretation controlling the resource estimation process. MRDI pointed out in 1999 that the 0.008oz/ton AuEq cutoff grade is somewhat arbitrary in terms of the geology of the deposit, but is related to the operating mining cutoff at the time the interpretations were started. SRK agrees with MRDI that the cutoff is acceptable if the operating cutoff is above 0.008oz/ton AuEq. If the operating cutoff drops below this level, the low-grade mineralization (outside of the low-grade zone definition boundaries) is not represented in the model. SRK also agrees that if the operating cutoff is not sufficiently above the low grade zone definition cutoff, dilution (that may occur during mining) is not represented in the model. For the purpose of global resource estimation these zones are acceptable.
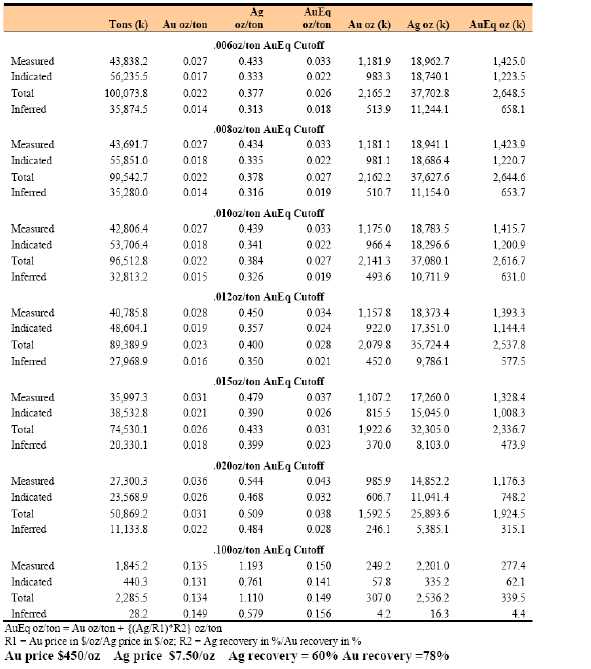
The confidence classification parameters developed by MRDI are reasonable but, as pointed out by MRDI, do not address uncertainty as to the location of the high and low grade boundaries. SRK confirms the model as acceptable for a global resource estimate. Table 3.1 shows the resources calculated from the 2006 model delivered by SRK February 3, 2006.
| |
| GOLDEN QUEEN MINING CO. LTD. / 08-3256 |
| SOLEDAD MOUNTAIN FEASIBILITY STUDY |
| 3-9 |
TABLE 3.1
STATEMENT OF MINERAL RESOURCES, FEBRUARY 3, 2006
| |
| GOLDEN QUEEN MINING CO. LTD. / 08-3256 |
| SOLEDAD MOUNTAIN FEASIBILITY STUDY |
| 3-10 |
AMEC reconstructed a resource model in late 2005 using the procedures, parameters and geologic interpretations developed from 1998 to 2000. The model dimensions are shown in Table 3.2.
TABLE 3.2
AMEC BLOCK MODEL DIMENSIONS
Direction
| Minimum
(ft) | Maximum
(ft) | Block Size
(ft) | Number of
Blocks |
| EASTING | 5,500 | 15,500 | 20 | 500 |
| NORTHING | 2,500 | 12,500 | 20 | 500 |
| ELEVATION | 2,200 | 4,200 | 20 | 100 |
| | 3.5.3 | Assay Database & Capping |
MRDI recommended a gold grade cap of 1.0 oz/ton and a silver cap of 9.0 oz/ton in December 1999. These cap grades were selected based upon MRDI’s risk-adjusted metal reduction approach, which considers the risk associated with the very high-grade assays relative to the production rate. (Section 3.6.5 describes the analysis that was performed by MRDI which evaluated grade estimation confidence intervals, or risk, for quantities of material representing three months of production.) In 2000 MRDI recommended that, given the low coefficient of variation of 10 ft composited gold grades in the high-grade zone, capping was not required. This was subsequently re-evaluated. During the 2006 composite database construction, both gold and silver were capped by AMEC at 1.0 oz/ton and 9.0 oz/ton respectively. SRK agrees the capping of both assays to be appropriate as is the adjustment of the historical GFA underground assays. Adjusted value = 0.8571 x GFA value - ..0088 oz/ton Au.
| | 3.5.4 | Geologic Modeling |
| | | |
| | 3.5.4.1 | Rock Types |
The following rock types are stored in the model:
| | 1 = Pyroclastics | 13.9 ft3/ton |
| | | |
| | 2 = Quartz Latite | 13.9 ft3/ton |
| | | |
| | 3 = Rhyolite Porphyry | 13.9 ft3/ton |
| | | |
| | 4 = Flow-banded Rhyolite | 13.8 ft3/ton |
| |
| GOLDEN QUEEN MINING CO. LTD. / 08-3256 |
| SOLEDAD MOUNTAIN FEASIBILITY STUDY |
| 3-11 |
Rock types are used to assign specific volume values for resource tonnage calculation.
| | 3.5.4.2 | Grade Zoning & Envelope Construction |
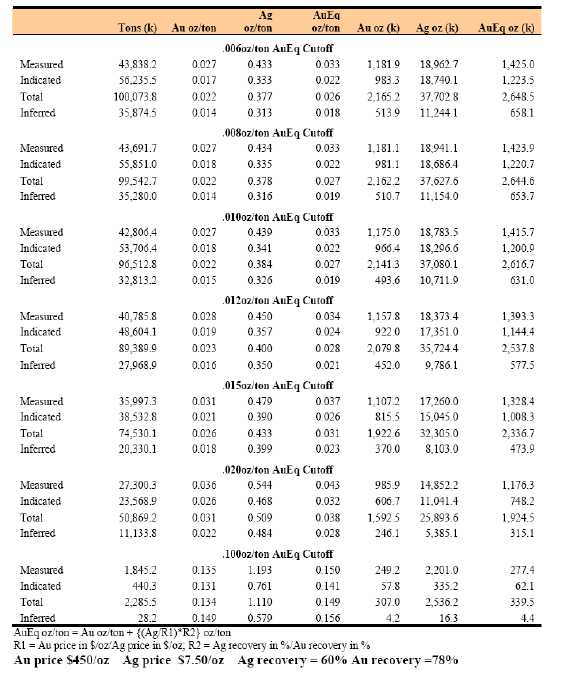
Prior to modeling the gold and silver assays were combined to form gold equivalent values and composited in 10 ft lengths down-hole.
The formula used for calculation of the gold equivalent values is as follows:
AuEq (oz/ton) = Au (oz/ton) + Ag (oz/ton) x 0.0142
Note: The 0.0142 factor above is derived from an Au price of $325/oz, Ag price of $6.00/oz, Au recovery of 78% and Ag recovery of 60%.
AuEq oz/ton = Au (oz/ton) + {(Ag/R1)*R2} (oz/ton)
| | Where: | R1 = | Au price in $/oz |
| | | | Ag price in $/oz |
| | | | |
| | | R2 = | Ag recovery in % |
| | | | Au recovery in % |
| | | | |
| | | Au price $450/oz |
| | | Ag price $7.50/oz |
| | | Ag recovery = 60% Au recovery = 78% |
These composites were used as the basis of the interpretation of high-grade and low-grade zones on cross sections. The low-and high-grade zone interpretations were completed on 100 ft to 109 ft spaced vertical sections on two different grids. The sectional interpretations were translated to 20 ft bench plans, re-drawn, digitized and used to code the block model. Zones between 0.008 oz/ton AuEq and 0.100 oz/ton Au were classified as low-grade and zones above 0.100 oz/ton Au were classified as high-grade. This cutoff range is at a level at which there is reasonable continuity, as evidenced in underground workings. The minimum “width” of the high-grade zone is 10 ft, (based upon the 10 ft composite length), which equates to a smaller true horizontal width, depending upon the drillhole angle and dip of the veins. The low-grade zone has a minimum composite-length of 20 ft, (two 10 ft composites). Blocks with centroids falling within the outline of the low-grade zone were coded as low-grade. Subsequently the high-grade outlines were used to assign the percentage of high-grade to each block. During resource calculation the percentage of high and low-grade are used with their respective interpolated grades to calculate the whole block grade. Internal waste was weight-averaged into the entire width of the mineralized zone and the grade of the zone was reduced accordingly. Waste intervals in excess of 30 ft wide were drawn as separate blocks. The grade zones developed by GQM are a very significant interpretation controlling the resource estimation process. MRDI pointed out in 1999 that the 0.008 oz/ton AuEq cutoff grade is somewhat arbitrary in terms of the geology of the deposit, but is related to the operating mining cutoff at the time the interpretations were started. Norwest agrees with MRDI that the cutoff is acceptable if the operating cutoff is above 0.008 oz/ton AuEq. For the feasibility study the undiluted operating cutoff has been set at 0.008 oz/ton, and hence, for the purpose of this feasibility study these zones are acceptable.
| |
| GOLDEN QUEEN MINING CO. LTD. / 08-3256 |
| SOLEDAD MOUNTAIN FEASIBILITY STUDY |
| 3-12 |
| | 3.5.4.3 | Structural Controls |
Grade zones were defined by a series of perimeters for high-grade, low-grade and waste. Low grade was then divided into four domains called “Szones” that are modeled separately. GQM grouped vein systems with similar strike and dips into four structural zones or Szones:
Low-grade zone strike N150W, Dip 75° SW; (Golden Queen, Starlight, Soledad, Stockworks, Hope).
Low-grade zone strike N150W, Dip 60° NE; (Queen Esther and Independent).
Low-grade zone strike N150W, Dip 60° NE; and (Silver Queen).
Low-grade zone strike N150W, Dip 75° NE. (Karma, Ajax, Black and Reymert).
Szone codes were assigned to both the model blocks and composited assays to be used to control the selection of kriging parameters during grade assignment for each block. In general SRK finds the structural zones definition to be reasonable.
| | 3.5.4.4 | Calculation of Whole Block Grades |
Outlines of underground workings were plotted on sections to calculate historical mining extraction. Where maps of workings were not available, the vein material was subtracted using the cutoff grade for 1930-1942 mining with mining dilution added. Percent of stope void from mining was assigned to the block model and used to adjust the whole block grade and volume. Where underground mining occurred it is assumed that the higher grade portion of the block would be mined first. SRK verified that the material assumed to be mined was removed from the model and that higher grade volumes were preferentially depleted.
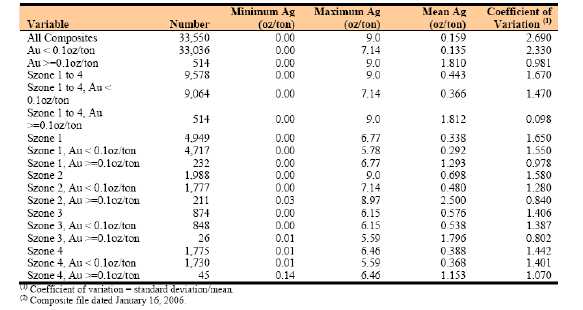
| | 3.5.4.5 | Summary Statistics on 10 ft Composites and Variography |
The following tables of summary statistics for gold and silver were produced by SRK using the composited database provided by AMEC on January 16, 2006. All adjustments to grades (capping, GFA adjustments, Billiton adjustments), were made to raw assays prior to compositing. Adjusted and unadjusted values are available in the database. SRK verified that the adjusted grades were used for composite creation and that the adjustments had been, in most cases, correctly made. Where there are discrepancies the errors were found to be on the conservative side. The use of the adjusted assays to form composites is reflected in the lower maximum values, means and coefficients of variation for both gold and silver than those reported by MRDI in May of 2000. The Szone, designated for each composite is the same as assigned in 2000.
| |
| GOLDEN QUEEN MINING CO. LTD. / 08-3256 |
| SOLEDAD MOUNTAIN FEASIBILITY STUDY |
| 3-13 |
TABLE 3.3
GOLD COMPOSITE STATISTICS AND VARIOGRAPHY
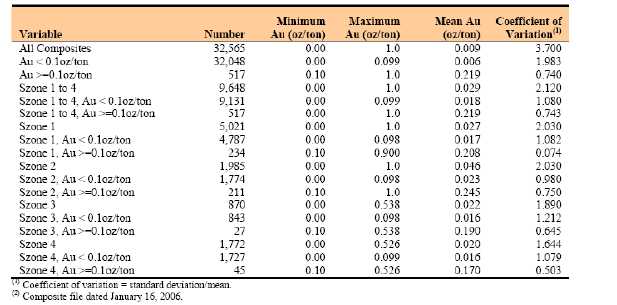
TABLE 3.4
SILVER COMPOSITE STATISTICS AND VARIOGRAPHY
| |
| GOLDEN QUEEN MINING CO. LTD. / 08-3256 |
| SOLEDAD MOUNTAIN FEASIBILITY STUDY |
| 3-14 |
|
MRDI ran statistics and correlograms in December 1999. MRDI chose to run correlograms rather than traditional variograms because correlograms are more stable and show greater continuity with skewed populations (MRDI report, Appendix B). SRK checked these against correlograms created with the 2006 composite database and found no significant differences. While it is possible to model correlograms for each of the low-grade Szones (Au less than 0.1oz/ton) it is not possible to do so for the high-grade Szones because of the limited number of composites (617). A single model was developed for all high-grade Szones. For both the low and high-grade zones interpretable directional correlograms could not be achieved. Preferential directions of continuity of grade for Szones were defined by GQM’s geologic interpretation. Histogram and lognormal probability plots on 10 ft composites for gold and silver are included in the MRDI report, Appendix C. SRK recreated lognormal probability plots with the 2006 composite database but found no significant differences. The statistics show that the interpreted zones are based on an equivalent gold grade cutoff. There is no indication of a break in the distributions that would be indicative of multiple populations. The mean silver grade in the high gold grade zone is higher than in the low gold grade zone, but there is clearly a mixing of silver populations across this gold grade boundary.
| | 3.5.4.6 | Kriging Methodology |
The grade zone interpretation is critical to the kriging estimation runs. For gold, each low-grade zone and high-grade zone is estimated separately. Composites in the low-grade part of a Szone are used to estimate low-grade Szone blocks and vice versa. The grades were estimated with a series of passes, with the initial pass using an expanded search and low number of minimum composites in order that most of the blocks within the interpreted zones be estimated, (the blocks in these initial passes will be in the Inferred Resource category). Subsequent passes overwrote many of the blocks estimated in the initial passes so the initial passes had minimal effect. A similar approach was used to estimate silver grades. Multiple silver kriging runs were done for the low-grade gold Szones. Silver grades within the high-grade gold zone were estimated using the same kriging run and the same gold grade variogram and searching parameters. The variograms run on silver composites, where the gold grade is greater than 0.1oz/ton, are highly erratic, even more so than the gold variograms. The kriging parameters used are shown in Appendix B of the SRK report. GQM used ordinary kriging for estimating block grades. Very restricted estimation methods were used in order to provide block grade distributions that were not overly smoothed. Block grade estimates based on restricted estimation plans are very inaccurate on a local basis; however, over volumes needed for feasibility planning the estimates are sufficiently accurate and precise to be valid for planning. Blast hole grade control will insure that the predicted volumes of ore at the predicted grade are recovered.
| |
| GOLDEN QUEEN MINING CO. LTD. / 08-3256 |
| SOLEDAD MOUNTAIN FEASIBILITY STUDY |
| 3-15 |
| | 3.5.5 | Resource Classification |
The statistical criterion used by MRDI for the Measured category is that three-months of ore production should be known to at least ±15% with 90% confidence. For the Indicated category, annual tons of ore produced should be known to at least ±15% with 90% confidence. A block approximating one month’s ore production, (500,000 ton per month, based upon 6 million tons per year), was estimated using ordinary kriging with different grid spacing. MRDI developed a variogram model from all 10 ft composites within the mineralized zones, (as coded from the model interpretation at that time), that was used for this analysis. MRDI reported the following criteria in the May 2000 report. MRDI found that a drill grid spacing of 100 ft gives a confidence interval of ±14% for a three month period which is appropriate for categorizing the Measured Resource. A drill grid spacing of 200 ft gives a 90% confidence interval of ± 9% on an annual basis which is appropriate for an Indicated Resource. MRDI points out that confidence limits are not the only criteria used for defining resource categories. Critical to the selection of the resource category limits is the distance for which grade continuity is seen and the distance for which geological interpretations can be made with confidence. The confidence limits stated above do not address uncertainty as to the location of the high/low-grade boundary. MRDI recommended using the following criteria for resource classification:
| | | Measured Resource: two drillholes, (or cross-cuts), within 100 ft and one of these within 70 ft of the block, (essentially a 100 ft drill grid spacing). |
| | | |
| | | Indicated Resource: two drillholes, (or cross-cuts), within 200 ft and one of these within 140 ft of the blocks, (essentially a 200 ft drill grid spacing). |
MRDI determined that these spacings are supported by the confidence limits as calculated using the current variogram models, in addition to the continuity of grade and zones as shown on plotted cross sections. In general SRK finds these confidence limits to be acceptable for resource modeling. MRDI did not recommend or propose criteria for an “Inferred Resource” in the MRDI May 2000 report. AMEC reported to SRK that the Inferred Resource criteria was two drillholes, (or crosscuts), within 300 ft.
| | 3.5.6 | AMEC Review of the Soledad Resource Estimate |
While AMEC was reconstructing the Soledad model and simultaneously reviewing it to verify that the MRDI recommendations were incorporated, SRK communicated on a number of occasions with Mr. Gordon Seibel of AMEC. AMEC provided various data files, run files and other information to assist in SRK’s evaluation of the resource model. GQM engaged AMEC in September 2005 to reconstruct the Addendum 2 Model and to ensure that all MRDI recommendations were correctly applied and incorporated. AMEC employees Edward Orbock and Gordon Seibel visited the mine site accompanied by David Rubio and retrieved the Addendum 2 Model off the mine computers. After reviewing the model, it was determined that several of the MRDI recommendations had not been implemented. Edward Orbock proceeded to incorporate the MRDI recommendations into the model using MineSight® software and Gordon Seibel then reviewed the new resource model using Datamine® to verify that the changes had been incorporated correctly. The MRDI recommendations, as defined by Section 2.2.5 in the MRDI report, and the implementation of the recommendations is described in the SRK 2006 Technical Report.
| |
| GOLDEN QUEEN MINING CO. LTD. / 08-3256 |
| SOLEDAD MOUNTAIN FEASIBILITY STUDY |
| 3-16 |
| | 3.5.7 | Norwest Review of the Soledad Resource Estimate |
Norwest reviewed and assessed the AMEC model reconstruction of the Soledad model on a number of occasions with Mr. Gordon Seibel of AMEC. Norwest evaluated various data files, run files and other information. AMEC model validation procedures were scrutinized.
The Norwest review and validation audit occurred over a period of approximately one year and involved the following:
Checks for global and local bias in the estimates based on the drill hole information.
Proper application of capping grades for both gold and silver.
Checks that a proper amount of internal dilution was included in the block grades.
Review of contact dilution and the impact of using zero grade in the diluting material.
Visual investigation of the model compared to surrounding drill hole information.
Comparison of alternative modeling procedures and the impact on any subsequent mine planning.
Norwest concluded that the model was adequate to support the mine planning and economic evaluation needed for the current feasibility study.
| |
| GOLDEN QUEEN MINING CO. LTD. / 08-3256 |
| SOLEDAD MOUNTAIN FEASIBILITY STUDY |
| 3-17 |
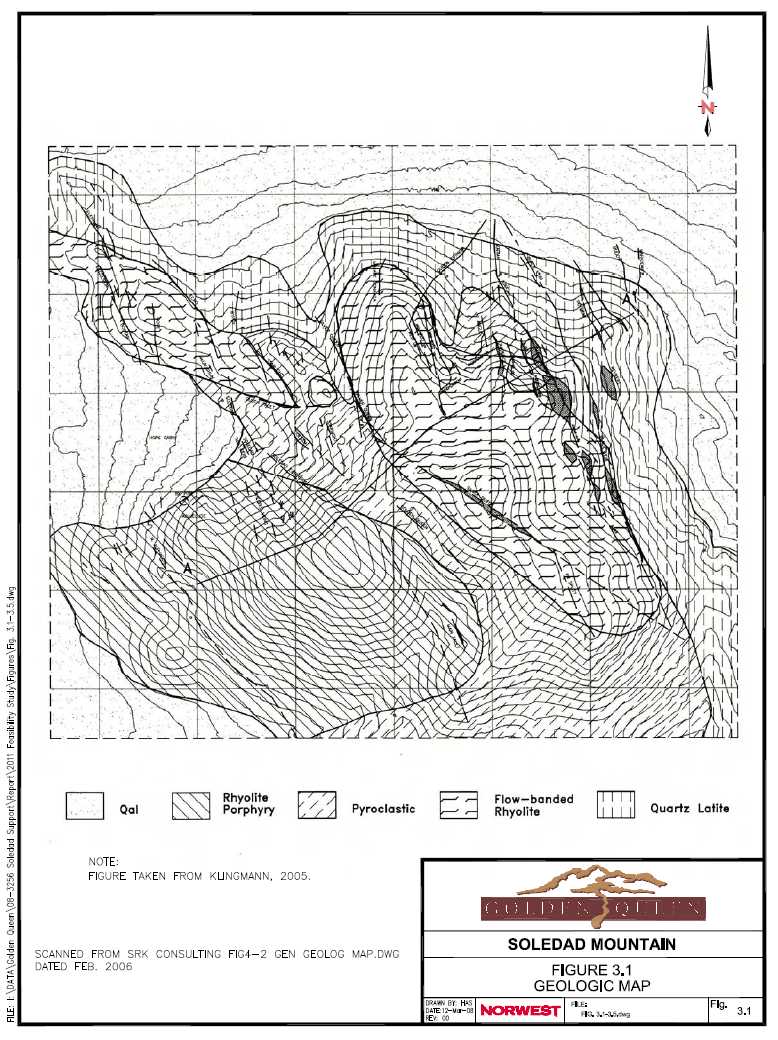
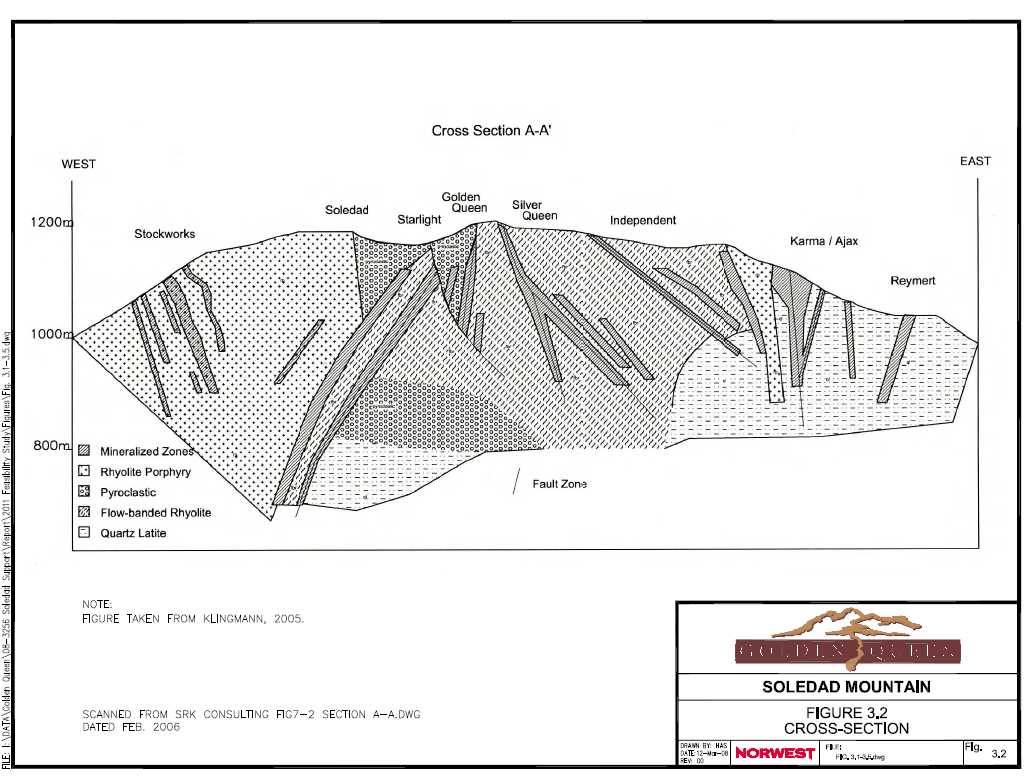
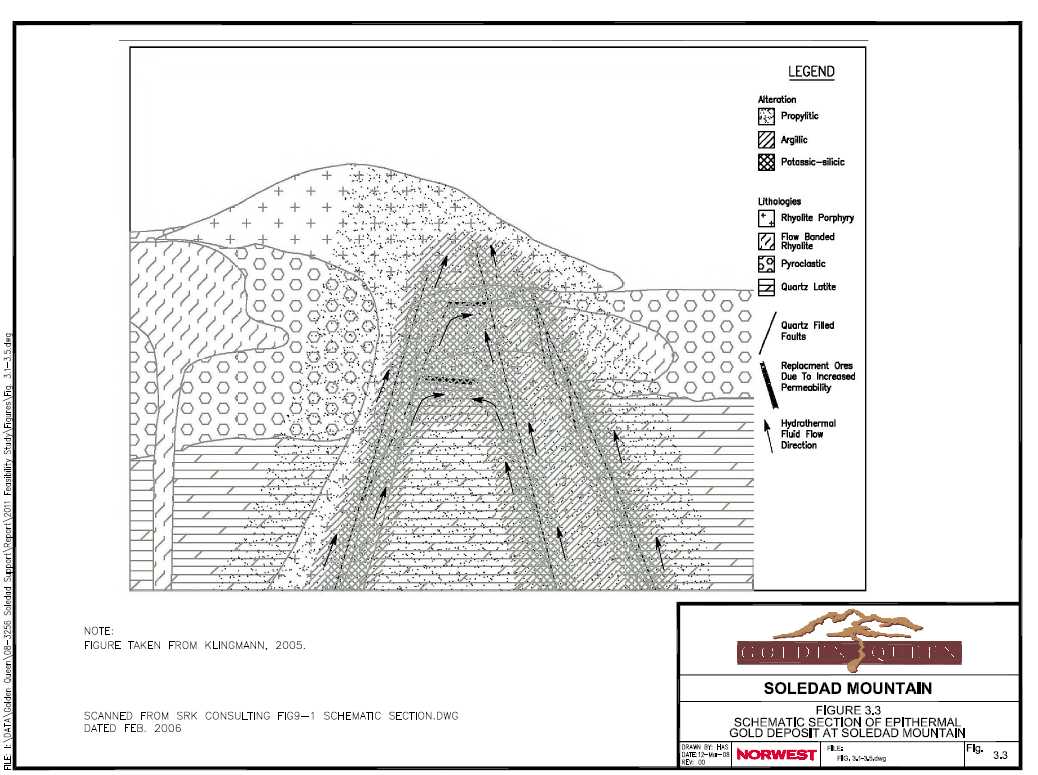
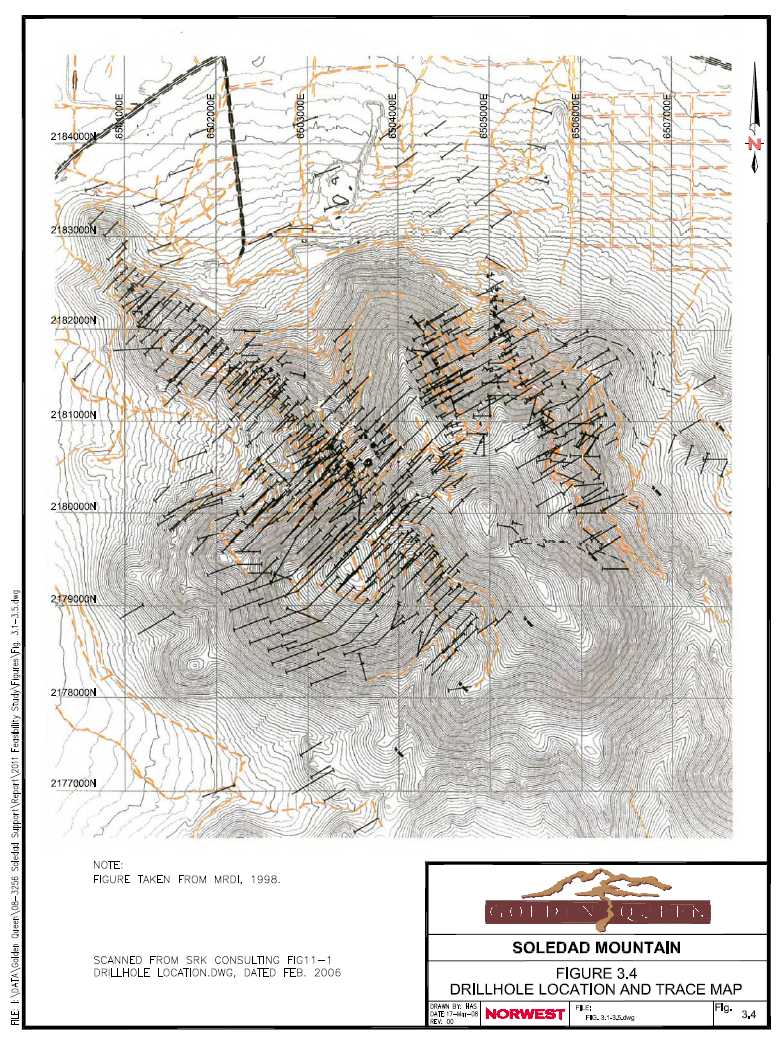
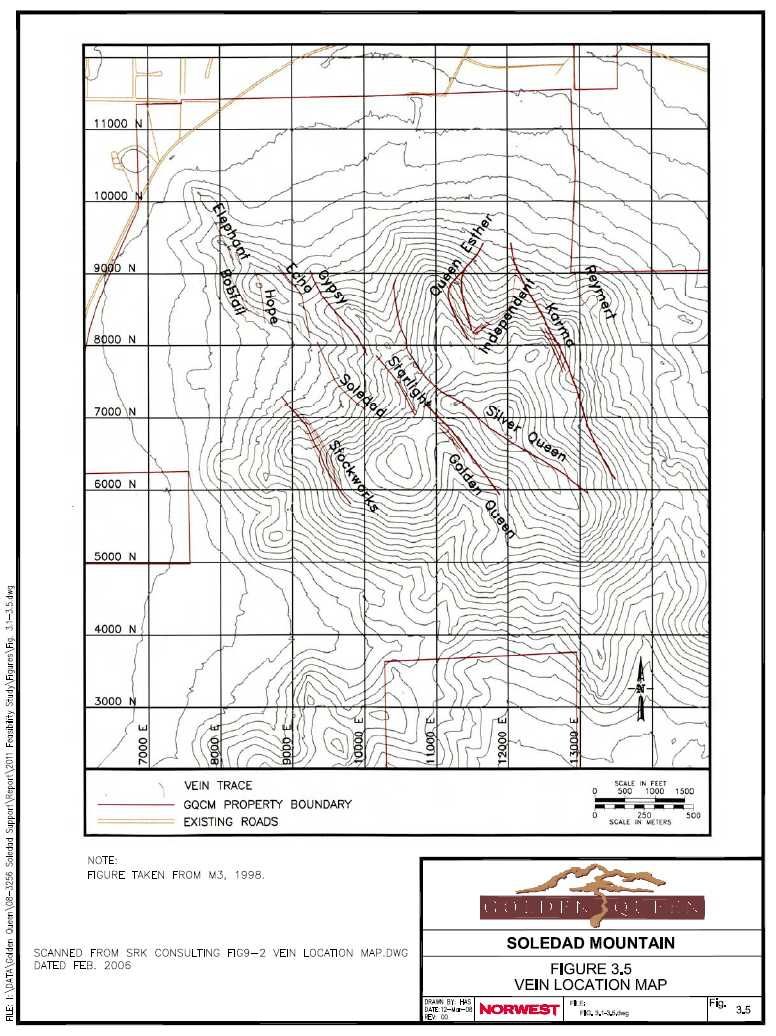
This section of the feasibility report describes the results of geotechnical stability analyses completed for pit slopes, waste dumps and heaps and presents geotechnical design criteria for pit slope, waste dump and heap and heap leach pad designs.
| 4.1 | PIT DESIGN AND EVALUATION SUMMARY |
This portion of the geotechnical section describes the pit design as it relates to slope stability and summarizes the Norwest evaluation of pit slope stability.
The Project’s final pit slope designs were completed by Norwest using design guidelines and constraints set forth in the slope stability analysis (Seegmiller, 1997). Design guidelines are provided in Section 4.4.1 Pit Slope Design Criteria.
Pit slopes were designed based upon stability analysis using rock mass properties for four main rock types found on Soledad Mountain. They are Flow-Banded Rhyolite (FBR), Rhyolite Porphyry (RPO), Pyroclastics (PYR), and Quartz Latite Porphyry (QLP). Other minor rock types, including brecciated zones can be found in some areas. For simplification purposes, with the exception of two small brecciated zones, all rocks were included in one of the four main rock groups. For the slope stability analysis, the location of contacts between rock types was defined by GQM in-house work.
Norwest carried out a site visit, identified the rock types used in the Seegmiller analysis, and found no rock types which were not consistent with the slope stability analysis.
Norwest reviewed all slope stability assessments completed to date and closely evaluated the most recent and detailed report by Seegmiller. For this assessment, Norwest examined the sources of information used, regional geology and geologic structure as they relate to slope stability, and identified rock mass characteristics determined by geotechnical investigations and laboratory tests. Norwest also reviewed hydrogeological conditions relevant to slope stability and verified slope stability assessment results. Based upon our evaluation, Norwest recommends the following operational procedures to reduce the potential for slope failures and support the pit slope design:
| |
| GOLDEN QUEEN MINING CO. LTD. / 08-3256 |
| SOLEDAD MOUNTAIN FEASIBILITY STUDY |
| 4-1 |
|
Divert surface run-off water away from the pit and do not allow it to enter the final pit slopes.
Do not undercut flow-banding. It may be necessary to consider rock-bolting in these areas.
Employ displacement monitoring and analyses, and inspect pit slopes for signs of failure.
Construct a test slope on the slope with the lowest static factor of safety and monitor it by monthly surveys and visual observations. This slope is hosted in Flow-banded Rhyolite, strikes N30W, and has a maximum height of 580 ft. A qualified geotechnical consultant should examine the site during and after construction of the test slope.
Take care to prevent and eliminate rock fall hazard zones.
Continue bench face structure mapping as mining progresses to confirm and support the stability analyses.
Complete a follow-up study during the first year of operations and review slope stability on a regular basis throughout the mine life.
Take appropriate safety and loss control measures for individuals and equipment working around pit slopes and include these policies and procedures in a safety manual.
Based upon our evaluation of Seegmiller International’s slope stability assessment of pit slopes for the Project, Norwest accepts the Seegmiller assessment as appropriate for use as a basis for feasibility level mine design. As mining proceeds, additional information (see above) is required to confirm design recommendations and to reduce the potential for slope failures.
| 4.2 | WASTE DUMP DESIGN AND EVALUATION SUMMARY |
This portion of the geotechnical section describes the waste dump design as it relates to slope stability and summarizes the evaluation of dump stability.
The most recent waste dump stability evaluation was carried out by Golder and documented in their report to GQM (May 13, 2010). Prior to this most recent work, Norwest had reviewed previous Golder dump stability reports and visited the site and identified no soft clays, adversely oriented major shear structures or other geotechnical anomalies which could contribute to waste dump foundation failure.
Waste dumps were designed using material strength parameters for foundation materials and waste rock. Strength parameters were determined by laboratory tests of rock samples for unit weight, friction angles, and cohesion. GQM suggested a waste rock internal friction angle of 37 degrees, which is in keeping with Norwest’s experience for hard rock run-of-mine waste piles.
| |
| GOLDEN QUEEN MINING CO. LTD. / 08-3256 |
| SOLEDAD MOUNTAIN FEASIBILITY STUDY |
| 4-2 |
Design constraints are provided in Section 4.4.2 Waste Dump Design Criteria.
Current waste dump stability analyses were carried out by Golder on the east waste rock dump area. Previous feasibility level stability analysis was completed by Norwest on other dump areas as detailed in the 2007 Norwest feasibility study. Although the configuration of some dumping areas has been altered, the general dump designs follow the previous criteria and are therefore judged suitable for feasibility level planning.
Based upon waste dump stability and rock rollout analysis, Norwest recommends the following operational procedures to provide for waste dump stability and minimize safety hazards:
Divert surface run-off water away from the waste dumps.
Inspect waste dumps regularly for signs of failure and employ displacement monitoring and analyses when appropriate.
Work to prevent and eliminate rock rollout hazards.
Use appropriate safety and loss control measures for individuals and equipment working around waste dumps and include these policies and procedures in the OMS manual.
Based upon our evaluation of waste dump designs completed for the Project, Norwest believes that they are appropriate for use as feasibility level mine designs. As mining proceeds, additional information may be required to confirm design recommendations and to reduce the potential for waste dump failures.
| 4.3 | HEAP LEACH PAD DESIGN AND EVALUATION SUMMARY |
This portion of the geotechnical section describes the heap leach pad design as it relates to stability issues and summarizes the Norwest evaluation of heap leach pad stability.
| | 4.3.1 | Heap Leach Pad Design |
The heap and heap leach pad design was completed by Golder using design constraints from “Heap Leach Facility, Revised Geotechnical Design Report” (Golder Associates Inc., 2010). A follow-up memorandum was issued by Golder clarifying the heap leach pad capacity (Golder Associates, April 2011) based on the revised design.
| |
| GOLDEN QUEEN MINING CO. LTD. / 08-3256 |
| SOLEDAD MOUNTAIN FEASIBILITY STUDY |
| 4-3 |
Heap leach pads will be constructed where the slopes range from 2degrees to 8 degrees on Arizo soils. The soil is a sandy loam with gravel and cobbles with depth. Much of the soil surface in the area of the Phase 1 heap leach pad consists of altered materials which include tailings from previous operations, mine waste rock, roads, facilities, buildings and miscellaneous trash. Historical mine shafts and other mine workings are present within the limits of the pad. Norwest personnel have visited the site and the proposed, heap leach pad foundation areas were inspected and no geotechnical hazards, other than those discussed and provided for in the 2005 Golder report, were identified.
The nominal leach pad capacity from the Golder revised design memorandum is 49.9 million tons based on the initial placed ore density of 1.36 t/m3 (85 pcf). The current mine plan shows an ore production of 53.3 million tons. Consolidation of the placed ore due to loading is predicted to provide the additional approximately 6% volume on the leach pad for the scheduled production. Consolidation estimates by Golder, SRK and regional data provided to GQM show that this is a reasonable estimate.
Norwest has reviewed and accepted the design recommendations in the 2010 Golder heap leach design report as suitable for feasibility level planning. If heap leach pad designs change and as mining proceeds, additional information may be required to confirm design recommendations and to reduce the potential for geotechnical failures.
| 4.4 | GEOTECHNICAL DESIGN CRITERIA |
This portion of the geotechnical section presents the geotechnical design criteria used to constrain pit slope, dump design and heap designs for the feasibility study.
| | 4.4.1 | Pit Slope Design Criteria |
Pit slope design guidelines were based upon analyses completed by Seegmiller. The pit slope design criteria are provided in Table 4.1 below.
| |
| GOLDEN QUEEN MINING CO. LTD. / 08-3256 |
| SOLEDAD MOUNTAIN FEASIBILITY STUDY |
| 4-4 |
TABLE 4.1
PIT SLOPE DESIGN CRITERIA
| Slope Characteristic | Magnitude |
| Maximum Bench Height | 60 ft |
| Minimum Catch Bench Width | 22 ft |
| Maximum Bench Face Angle | 71.6o( 3V:1H) |
| Maximum Inter-ramp Slope Angle | 55o |
| Bench Development | 3 lifts, 20 ft each |
| | 4.4.2 | Waste Dump Design Criteria |
Final dump design guidelines are based upon stability analyses carried out by Golder and Norwest. Waste dump design criteria are provided in Table 4.2 below.
TABLE 4.2
WASTE DUMP DESIGN CRITERIA
| Dump Characteristic | Magnitude |
| Maximum Slope Angle | 37o(1.3H:1:V) |
| Maximum Reclaimed Slope Angle | 27o(2H:1V) |
| Maximum Dump Slope Height | 310 |
| Maximum Foundation Grade | 15o |
| Dump Face Height | 380 |
*Maximum dump slope height is the maximum vertical distance from the dump elevation to original topography *Maximum dump face height is the maximum vertical distance from the dump crest to the toe of the dump
Additional design criteria for catch ditches and berms necessary to limit rock rollouts from waste dumps located above haul roads appear below.
Minimum berm height – 6 ft
Minimum catch ditch depth – 2 ft
Minimum catch ditch width – 6 ft
These design criteria limit rock rollouts to 2% of the total rock falls tested based on a simulation of 10,000 rockfall events.
| |
| GOLDEN QUEEN MINING CO. LTD. / 08-3256 |
| SOLEDAD MOUNTAIN FEASIBILITY STUDY |
| 4-5 |
| | 4.4.3 | Phase 1 Heap & Heap Leach Pad Design Criteria |
Phase 1 heap and heap leach pad design guidelines were based upon analyses completed by Golder. The heap and heap leach design criteria relevant to geotechnical stability are provided below:
Ore stacked in 10 m (30 ft) lifts.
Maximum ore height over liner of 60 m (200 ft).
Ore will be stacked in lifts at angle of repose with set-back benches to form overall side slopes of 2.5H:1V along the north, northwest and east slopes and 2H:1V along the south and southwest slopes.
Upstream and side stream diversion channels for surface water.
| |
| GOLDEN QUEEN MINING CO. LTD. / 08-3256 |
| SOLEDAD MOUNTAIN FEASIBILITY STUDY |
| 4-6 |
| 5 | PIT OPTIMIZATION STUDIES |
| | |
| 5.1 | PIT OPTIMIZATION STUDIES |
The 3D block model reviewed by SRK in the 2006 Technical Report was used for development and evaluation of the pit shells for the Project. This section reviews the work carried out to develop detailed pit designs starting with a discussion of the initial pit shell optimization process and the design parameters and constraints which were used. The Minesight 3D (Mintec©) software package was used for the optimization and pit design process.
| | 5.1.1 | Pit Shells - Design Parameters and Constraints |
For the purposes of this feasibility study the following material parameters have been assumed. Note that only imperial units are shown in this section as the geological model was constructed with parameters specified in imperial units.
In situ ore and waste density of 1.95 ton/yd3
Waste swell factor of 30%
Loose density of 1.5 ton/yd3
A series of pit shells was created using the pit optimization tools in MineSight© by varying parameters such as:
The range of parameters used in the 2007 optimization runs is summarized in Table 5.1.
| |
| GOLDEN QUEEN MINING CO. LTD./ 08-3256 |
| SOLEDAD MOUNTAIN FEASIBILITY STUDY |
| 5-1 |
TABLE 5.1
PIT OPTIMIZATION VARIABLES
| Parameter | Units | Low Range | Upper Range | Comments |
| Gold Price | US$/oz | $260 | $700 | $600 base case |
| Silver Price | US$/oz | $4.40 | $25 | $12 base case |
| Ore Mining + Processing Cost | $/ton | - | $3.00 | $3 as base case |
Waste Cost
| $/ton
| $2.10
| $5.10
| $4.10 base case based
on nominal backfill cost. |
| Overall Pit Slope Angle | degrees | 45 | 55 | 55 degrees base case |
| Process Cut-off Grade (Diluted) | oz/ton | 0.0064 | 0.015 | 0.0064 base case |
There are several constraints which affect the selection of a suitable pit shell as well as the mining sequence. These constraints are summarized as follows:
Sufficient ore to fill the heap leach pad.
Minimize waste volumes.
Pit limits which fell within desired development boundaries.
Pit development which did not sterilize possible expansion options to the south (Phases 6 and 7 in the Mintec study) at the end of the mine life as presently designed.
The updated pit designs developed here have been adapted from the original 2007 designs in order to enhance the opportunities for backfill placement and to develop pit phasing and access which lower the costs associated with backfill placement.
| | 5.1.2 | Floating Cone and Lerchs-Grossman Techniques |
Floating cone analysis was used to generate preliminary pit shells in order to observe the sensitivity of the pit configurations and ore tonnage to variations in the parameters listed above. Floating cone analysis was used to generate preliminary shells because its processing time is relatively short and allows for the evaluation of many shells in a reasonable amount of time. A detailed discussion of the original pit optimization process and cases evaluated is provided in the 2007 Norwest study and has not been repeated here.
The ore to waste tonnage relationships for the various pit shells that were evaluated in the 2007 study are shown in Table 5.2. This table shows the large spread in waste and ore tonnages with the smaller pit shells having ore tonnages in the 40 – 50 million ton range and the larger pits having nearly double those amount up to 80 – 90 million tons of ore. This data has been included to highlight the range in potential ore tonnage and contained metal at the site depending upon the constraints applied to the pit optimization process.
| |
| GOLDEN QUEEN MINING CO. LTD./ 08-3256 |
| SOLEDAD MOUNTAIN FEASIBILITY STUDY |
| 5-2 |
It should be noted that while process cut-off grades of less than 0.274 g/t (0.008 oz/ton) AuEq are listed in Table 5.2, any blocks within the model that have a grade less than 0.274 g/t (0.008 oz/ton) AuEq are classed as waste and have no grade assigned. Therefore the effective minimum process cut off grade is limited to 0.274 g/t (0.008 oz/ton) AuEq.
It is interesting to note that the effect of the higher waste mining cost is of course to decrease ore tonnage but it also has a stronger effect on the waste tonnage. For example, the “Base Case LG” pit shell compared to the “Higher waste cost LG” pit shell drops from approximately 88 million tons to 74 million tons (16% decrease) while the waste tonnage drops from 326 million tons to 223 million tons (32% decrease). For a Project such as Soledad Mountain which is constrained by waste rock related issues, the opportunity to significantly reduce waste tonnage with a lesser impact on ore tonnage is an important consideration in mine planning.
| |
| GOLDEN QUEEN MINING CO. LTD./ 08-3256 |
| SOLEDAD MOUNTAIN FEASIBILITY STUDY |
| 5-3 |
TABLE 5.2
FLOATING CONE OPTIMIZED PITS
|
Variable Pit Parameters |
Ore (undiluted) | Waste (no grade or dilution
losses) |
Description |
Gold
Price
$US |
Silver
Price
$US |
Gold/Silver
Ratio for gold
equivalent
| Pit
Wall
Angle
(deg) |
AuEq $
per oz
|
Mill
Cutoff
oz/ton | Waste
Mining
Cost
$/yd³ |
Ore Mining
& Process
Cost $/ton |
yd³ |
ton |
Gold Grade
(oz/ton) |
Silver
Grade
(oz/ton) |
Gold (oz) |
Silver (oz) |
yd³ |
ton |
SR
tons/tons |
AuEQ |
| Base Case w high cutoff | $600.00 | $12.00 | 78.00 | 55 | $468.00 | 0.0100 | $2.10 | $3.00 | 42,233,709 | 81,988,641 | 0.0228 | 0.389 | 1,873,443 | 31,882,636 | 152,825,279 | 297,532,410 | 3.63 | 2,282,195 |
| Base Case w higher cutoff | $600.00 | $12.00 | 78.00 | 55 | $468.00 | 0.0150 | $2.10 | $3.00 | 33,201,155 | 64,455,059 | 0.0261 | 0.435 | 1,683,380 | 28,067,266 | 146,812,844 | 285,826,924 | 4.43 | 2,043,217 |
| Base Case w shallow walls | $600.00 | $ 2.00 | 78.00 | 45 | $468.00 | 0.0064 | $2.10 | $3.00 | 41,241,858 | 80,057,708 | 0.0228 | 0.388 | 1,822,588 | 31,036,313 | 160,302,549 | 312,089,754 | 3.90 | 2,220,489 |
| Base Case w Inferred | $600.00 | $12.00 | 78.00 | 55 | $468.00 | 0.0064 | $2.10 | $3.00 | 57,104,592 | 111,162,618 | 0.021 | 0.368 | 2,335,525 | 40,936,410 | 192,239,710 | 374,267,560 | 3.37 | 2,860,351 |
| Base Case with Increased Waste Cost | $600.00 | $12.00 | 78.00 | 55 | $468.00 | 0.0064 | $4.10 | $3.00 | 25,176,064 | 48,897,789 | 0.0235 | 0.42 | 1,147,685 | 20,552,163 | 53,054,671 | 103,291,054 | 2.11 | 1,411,174 |
| Base Case with Increased Waste Cost 2 | $00.00 | $12.00 | 78.00 | 55 | $468.00 | 0.0064 | $5.10 | $3.00 | 22,284,653 | 43,284,764 | 0.0244 | 0.424 | 1,055,360 | 18,358,005 | 42,917,500 | 83,555,203 | 1.93 | 1,290,719 |
| Bottom Case | $260.00 | $4.40 | 92.18 | 55 | $202.80 | 0.0148 | $2.10 | $3.00 | 11,922,658 | 23,209,234 | 0.0319 | 0.523 | 740,051 | 12,143,377 | 25,179,897 | 49,022,227 | 2.11 | 871,784 |
| Old Base Case | $300.00 | $5.50 | 85.09 | 55 | $234.00 | 0.0128 | $2.10 | $3.00 | 15,746,867 | 30,597,514 | 0.0284 | 0.483 | 869,753 | 14,771,942 | 32,205,552 | 62,700,331 | 2.05 | 1,043,355 |
| Low Case | $400.00 | $6.00 | 104.00 | 55 | $312.00 | 0.0096 | $2.10 | $3.00 | 24,308,613 | 47,212,928 | 0.0248 | 0.428 | 1,171,442 | 20,189,170 | 57,484,842 | 111,916,063 | 2.37 | 1,365,569 |
| Conservative Case | $500.00 | $10.00 | 78.00 | 55 | $390.00 | 0.0077 | $2.10 | $3.00 | 39,257,913 | 76,207,810 | 0.0232 | 0.392 | 1,771,562 | 29,911,951 | 132,849,964 | 258,642,878 | 3.39 | 2,155,048 |
| Base Case | $600.00 | $12.00 | 78.00 | 55 | $468.00 | 0.0064 | $2.10 | $3.00 | 43,062,878 | 83,594,934 | 0.0226 | 0.384 | 1,888,289 | 32,089,461 | 154,208,469 | 300,225,315 | 3.59 | 2,299,692 |
| Current Case | $650.00 | $14.00 | 72.43 | 55 | $507.00 | 0.0059 | $2.10 | $3.00 | 43,998,098 | 85,411,700 | 0.0225 | 0.384 | 1,921,224 | 32,822,678 | 161,435,837 | 314,296,130 | 3.68 | 2,374,397 |
| High Case | $700.00 | $15.00 | 72.80 | 55 | $546.00 | 0.0055 | $2.10 | $3.00 | 44,992,628 | 87,341,695 | 0.0224 | 0.382 | 1,952,954 | 33,352,741 | 169,330,332 | 329,665,761 | 3.77 | 2,411,096 |
Note formula for gold equivalent: AuEq oz Formula = Au oz + Ag oz*0.02
| |
| GOLDEN QUEEN MINING CO. LTD./ 08-3256 |
| SOLEDAD MOUNTAIN FEASIBILITY STUDY |
| 5-4 |
| 5.2 | DETAILED PIT DESIGN PARAMETERS |
Using the selected pit shell limits, the final pit designs were created using the Pit Expansion tool in MineSight 3D following the pit slope guidelines discussed in Section 4.4.1. In addition to the geotechnical design parameters, operational parameters which were incorporated into the detailed pit design are summarized in Table 5.3.
TABLE 5.3
DETAILED MINE DESIGN PARAMETERS
| Design Parameter | Configuration | Comments |
| Haul road width – two way traffic | 80 ft | Includes berm + ditch / catch bench |
| Haul road width – one way traffic | 60 ft | Includes berm + ditch / catch bench |
| Bench height | 20 ft | Pit triple benched to 60 feet |
| Berm width | 22 ft | |
Ramp grades
| 10% maximum
| 10% used for final access ramp to pit bottom
and portion of the external access |
| Berm heights | 4 ft | Based on3/4 tire height |
| Ore and waste bank density | 1.95 ton/yd3 | |
| Waste loose density | 1.50 ton/yd3 | Based on 30% swell factor |
| Dilution | 2.5 ft at ore/waste boundary | Averages approximately 15% |
The configuration of the Soledad Mountain project presents a particular challenge in terms of pit access due to the significant changes in elevation and steep slopes. Haul road designs have been based on a maximum truck dimension equivalent to a one hundred ton capacity rear dump haul truck (Komatsu HD785 or equivalent). Ramp grades have been specified at a maximum of 10%. Roads have been designed for two way haul truck traffic except for limited cases where road width is constrained by topography or at pit bottoms.
| | 5.2.2 | Ore / Waste Parameters |
Ore and waste rock bank density values were based on test work carried out on samples of rock from the site. Waste rock density was applied based on the tonnage factor included in the block model. A swell factor of 30% was selected as being typical for blasted and mined waste rock.
| | 5.2.3 | Dilution and Ore Loss |
The capability to mine ore and waste selectively in order to control dilution and ore loss will be a critical concern for the Soledad Mountain operation. The dilution factor selected for development of the pit designs and tonnage calculations was based on a review of the ore body type as well as practical considerations related to mine operations including geological modeling, in-pit ore control and mining equipment selectivity.
| |
| GOLDEN QUEEN MINING CO. LTD./ 08-3256 |
| SOLEDAD MOUNTAIN FEASIBILITY STUDY |
| 5-5 |
|
The near vertical orientation and the narrow lateral dimensions of the ore-bearing zones perpendicular to strike will require stringent field control and monitoring practices to delineate ore and waste zones. Mining operations will need to be integrated with the geological mapping of the ore bodies to ensure a balance between ore recovery and economic mining. Norwest has selected equipment that will have the ability to provide suitable selectivity and meet production goals. Front-end loaders with a bucket capacity of approximately 15 yd3 have been selected. Based on a combination of high quality geological field control and good mining practices using equipment which provides the required level of selectivity, a dilution allowance of 2.5 ft at the ore/waste interface was deemed realistic. Although it is expected that the dilution material would have some nominal gold and silver values, the conservative assumption of zero grade for dilution material has been used. When a suitable grade model for the ore to waste transition zone is available, it could be used to re-evaluate the effect of dilution on overall run-of-mine ore grades.
The previous study assumed an ore loss of approximately 2.5% based on the mining parameters and cut-off grade evaluation used at that time. The current higher price regime for gold and silver makes lower cut-off grades economic however given until the model can be revised, there is limited practical value to using a lower cut-off grade for pit design for reasons noted previously in this section. However, Norwest felt it might be overly conservative to assign both a zero grade dilution and a mining loss to the mined ore quantities in light of the expected lower cut-off grade. Therefore, the current mined ore quantities and contained metal values used in the mine plan are based on a zero mining loss. Once an updated model with lower ore grade envelopes is available, the mining loss assumption should be revisited as part of the updated mine design.
The above factors were incorporated into the three-dimensional block model for use in the calculation of run-of-mine tonnage values using the detailed pit shells.
| | 5.2.4 | Ultimate Pit Boundaries |
The revised ultimate pit boundaries are shown in Figure 5.1 with sections provided in Figure 5.2. These boundaries are based on the detailed pit shell limits selected which met the desired goals of a low strip ratio (to limit waste quantities) and provided sufficient ore to meet the capacity of the Phase 1 heap leach pad. The shell outlines have been adjusted to reflect on mining constraints including access, geo-mining conditions, interaction between the various pit phases and property boundaries.
| |
| GOLDEN QUEEN MINING CO. LTD./ 08-3256 |
| SOLEDAD MOUNTAIN FEASIBILITY STUDY |
| 5-6 |
In general terms, the pits are constrained mostly by the space available on the Phase 1 heap leach pad, the property boundary, the cut-off grade, back fill requirements and waste dump space. If any of those constraints were changed the pit designs could change significantly.
Table 5.4 provides the final quantities within the pits designed. All of the ore within these pits is classified as proven (59%) or probable reserves (41%). A diluted process cut-off grade of 0.219 g/t (0.0064 oz/ton) AuEq was used.
| | 5.2.5 | Discussion of Cut-off Grade Calculation |
Several cut-off grade values are referenced in the description of the pit optimization and mine plan development. The cut-off grades mentioned in the report are based on the gold and silver prices used in the 2007 study as well as the cost basis developed at that time.
The relationship between these various values is explained as follows:
0.015 oz/ton AuEq: This mining cut-off grade used by Norwest for selected 2007 pit optimization runs in order to determine the sensitivity of the pit shells to a higher cut-off grade based on the 2007 metal, mining and recovery estimates.
0.008 oz/ton AuEq: This cut-off value is the undiluted process cut-off grade which was used to limit the ore zones with the current geological resource model. Norwest utilized this grade as the mining cut-off grade for the majority of the 2007 pit optimization runs including the pit shell that was selected for the base case. Norwest understands that development of a new model with a lower AuEq grade ore envelope limit is planned
0.0064 oz/ton AuEq: This cut-off value is used for the diluted process cut-off grade to account for low grade ore (at or near the 0.008 oz/ton AuEq limit) which was mined (with dilution waste at zero grade) and sent to the leach pad. This ore contained metal which can be recovered economically and therefore required accounting within the mine schedule.
| |
| GOLDEN QUEEN MINING CO. LTD./ 08-3256 |
| SOLEDAD MOUNTAIN FEASIBILITY STUDY |
| 5-7 |
TABLE 5.4
PIT QUANTITIES
| Ore | Waste |
Strip Ratio
Tons/Tons
|
Total Au
Oz
|
Total Ag Oz
|
YDS3
|
tons
|
Au
Grade(oz/t) |
Ag
Grade(oz/t) |
YDS3
|
tons
|
| NW pit | 1,272,000 | 2,467,000 | 0.0229 | 0.049 | 2,543,000 | 4,959,000 | 2.01 | 56,500 | 121,000 |
| East pit | 12,103,000 | 23,480,000 | 0.0187 | 0.444 | 17,583,000 | 34,286,000 | 1.46 | 439,100 | 10,430,000 |
| Main Pit | 9,292,000 | 18,026,000 | 0.0248 | 0.413 | 20,750,000 | 40,462,000 | 2.24 | 447,000 | 7,458,700 |
| West Pit | 4,791,000 | 9,295,000 | 0.017 | 0.198 | 9,024,000 | 17,597,000 | 1.89 | 158,000 | 1,840,400 |
Mine
totals: |
27,458,000 |
53,268,000 |
0.0207 |
0.372 |
49,900,000 |
97,304,000 |
1.83 |
1,100,600 |
19,850,400 |
Road
Cuts |
38,000 |
74,000 |
0.027 |
0.134 |
n.a. |
n.a. |
n.a. |
2,000 |
9,900 |
| Totals: | 27,496,000 | 53,342,000 | 0.0207 | 0.372 | | | | 1,102,600 | 19,860,300 |
Note: These quantities do not include road construction material outside the pit limits, some of which can be classed as ore due to its metal grades and is planned to be sent to the leach pad. Approximately 74,000 tons of road cut material will be sent to the leach pad for treatment. From the 74,000 tons of ore gained by road cuts, 2,000 oz of gold and 9,900 oz of silver is added into the probable reserves category. The road construction ore is from within the defined resource boundary, but outside the pit limits and has been tracked separately.
| |
| GOLDEN QUEEN MINING CO. LTD./ 08-3256 |
| SOLEDAD MOUNTAIN FEASIBILITY STUDY |
| 5-8 |

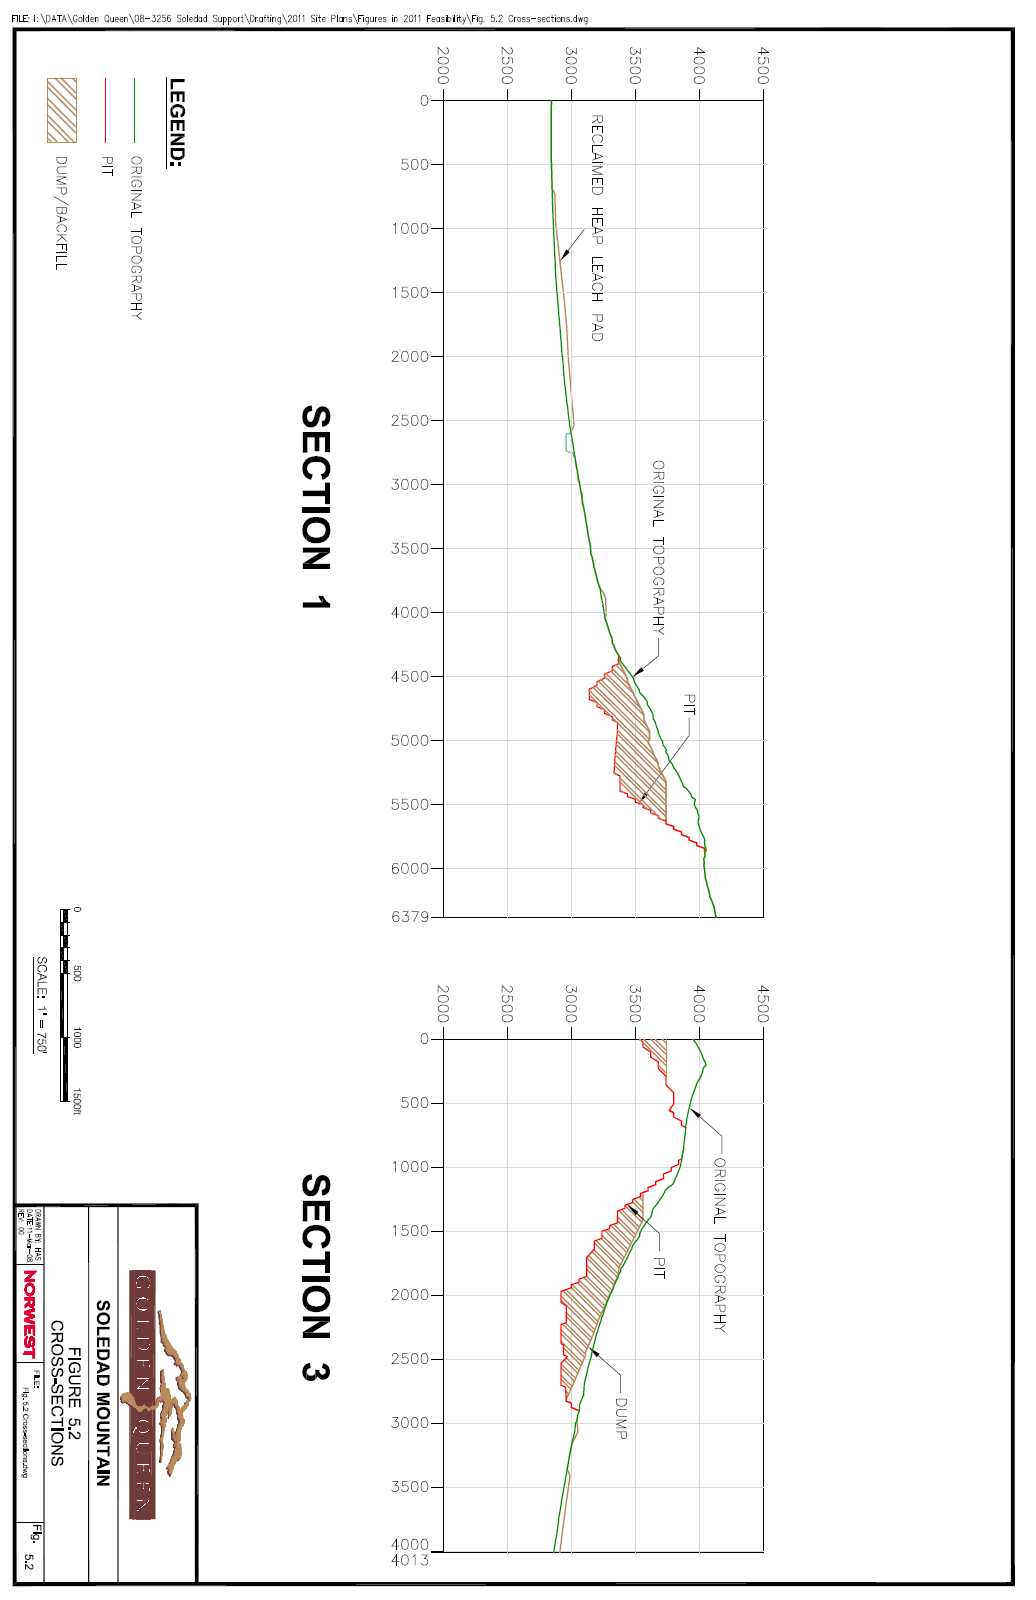
| 6 | PRODUCTION SCHEDULE |
| | |
| 6.1 | MINE SCHEDULE |
The mine production schedule developed for the Project is based on increasing ore output to full production levels at an achievable rate while also sequencing the pits to allow for external and in-pit waste placement to limit the mine’s ultimate footprint.
A summary schedule of the ore and waste release for the project life is shown in Table 6.1. Figure 6.1 shows graphically the ore and waste tonnage on an annual basis over the 12 year life of the Project.
As shown in Table 6.1 and Figure 6.1, the ore production increases from approximately 2.7 million tonnes (3.0 million tons) during the first year of production to approximately 3.6 million tonnes (4.0 million tons) in Year 2 and Year 3 and to the maximum production level of approximately 4.5 million tonnes (5.0 million tons) in Years 5 to 7. Production is maintained above 3.6 million tonnes (4.0 million tons) per year throughout the life of the heap leach operation, with the exception of the first and final years of mining.
The release of gold and silver over the Project life is shown in Table 6.1. The annual run-of-mine gold and silver production in ounces is shown with allowance for dilution. The production curves over the Project life are characterized by two peaks in gold and silver production. The first peak in gold production occurs in Year 3 with approximately 112,000 oz of gold produced. The second peak occurs in Year 7 with approximately 100,000 oz of gold produced. The peaks in silver production are offset to some degree with maximum silver production in Year 9 with approximately 1.46 million ounces produced. These peaks illustrate the effect the heterogeneous nature of the ore deposit geology has on mine production with large tonnages of ore encountered in certain specific zones of the pit rather than dispersed evenly throughout the pits. This effect is also exacerbated to some degree by the constraints on the pit sequencing as noted in the previous paragraph.
| |
| GOLDEN QUEEN MINING CO. LTD./ 08-3256 |
| SOLEDAD MOUNTAIN FEASIBILITY STUDY |
| 6-1 |
TABLE 6.1
SOLEDAD MOUNTAIN PRODUCTION QUANTITIES
| Production | Year 0 | Year 1 | Year 2 | Year 3 | Year 4 | Year 5 | Year 6 | Year 7 | Year 8 | Year 9 | Year 10 | Year 11 | Year 12 | Year 13 | Totals |
| Gold Recovered (post-smelter) (oz) | 0 | 50,300 | 69,800 | 113,000 | 109,500 | 79,300 | 79,200 | 100,300 | 81,600 | 55,000 | 68,200 | 65,100 | 54,100 | 10,800 | 936,200 |
| Silver Recovered (post-smelter) (oz) | 0 | 228,500 | 521,000 | 1,069,100 | 966,200 | 990,500 | 966,500 | 1,156,700 | 1,118,700 | 1,466,000 | 879,300 | 426,700 | 485,600 | 151,900 | 10,426,700 |
| Equivalent Gold (oz) | 0 | 54,900 | 80,200 | 134,400 | 128,800 | 99,100 | 98,500 | 123,400 | 104,000 | 84,300 | 85,800 | 73,600 | 63,800 | 13,800 | 1,144,700 |
| Ore Mined (tons) | 327,000 | 3,005,000 | 4,198,000 | 4,099,000 | 4,518,000 | 4,964,000 | 4,897,000 | 5,009,000 | 4,985,000 | 4,338,000 | 4,993,000 | 4,422,000 | 3,587,000 | 0 | 53,342,000 |
| Waste Mined (tons) | 1,454,000 | 8,761,000 | 9,940,000 | 9,706,000 | 9,574,000 | 8,856,000 | 8,185,000 | 5,178,000 | 6,475,000 | 9,618,000 | 7,710,000 | 9,470,000 | 3,995,000 | 0 | 98,922,000 |
| Strip Ratio | 4.45 | 2.92 | 2.37 | 2.37 | 2.12 | 1.78 | 1.67 | 1.03 | 1.30 | 2.22 | 1.54 | 2.14 | 1.11 | | 1.85 |
*Based on Norwest Feasibility Study Update Production Schedule Detail-Dec 10 2010 update. xls AuEq oz Formula =
Au oz + Ag oz * 0.02
TABLE 6.2
STATUS OF PITS AT YEAR END
| Year of Operation |
| Year 1 | Year 2 | Year 3 | Year 4 | Year 5 | Year 6 | Year 7 | Year 8 | Year 9 | Year 10 | Year 11 | Year 12 | Year 13 |
| NW Pit | 3180 | Finish Q3 | | | | | | | | | | | |
| Main Pit 3 | | 3780 | 3620 | Finish Q3 | | | | | | | | | |
| Main Pit 2 | | 3300 | Finish Q3 | | | | | | | | | | |
| Main Pit 1 | | | | 3800 | 3480 | 3040 | Finish Q1 | | | | | | |
| East Pit 1 | | | | | | | 3560 | 3320 | Finish Q1 | | | | |
| East Pit 2 | | | | | | | | | 3280 | 2960 | Finish Q1 | | |
| East Pit 3 | | | | | | | | | | | Finish Q4 | | |
| West Pit | | | | | | | | | | | 3500 | 3080 | Finish Q2 |
| |
| GOLDEN QUEEN MINING CO. LTD./ 08-3256 |
| SOLEDAD MOUNTAIN FEASIBILITY STUDY |
| 6-2 |
Table 6.1 shows the waste production schedule over the life of the heap leach operation. Similar to the ore production profile, annual waste mined ramps up during the first two years of production and reaches a relatively constant level between 7.3 to 8.6 million tonnes or 8.0 to 9.5 million tons over the Project life.
| | 6.1.3 | Pit Phasing and Backfilling |
The pit phasing has been developed with the intent of taking advantage of opportunities for pit backfill and to allow for access to the various pit phases. Plans detailing the mining sequence can be found in Figures 6.2 through 6.16. Table 6.2 contains the approximate bench elevations by year and the completion dates for each pit phase.
| 6.1.4 | Scheduling Considerations |
This feasibility report assumes a pre-production start date early in Year 0. There are three main types of schedule considerations; equipment, plant and access.
Equipment: Initially a development fleet is employed for the first three quarters for road construction and preparation of the North-West pit area for mining in the pre-production and construction year (or Year 0). Two primary truck and loader fleets will be acquired sequentially at the end of the pre-production year and phased in to start work in Year 1.
Plant: The crushing-screening plant and the Merrill-Crowe plant are scheduled to be commissioned toward the end of Year 0 and to be available for production at the start Year 1. During plant construction, a stockpile will be necessary for the ore released during road construction and from the upper benches in the North-West pit.
Access: The steeply dipping topography and paired nature of the Main pits provide scheduling constraints on pit development. When possible, pits are mined simultaneously to simplify access as well as providing a shorter haul to the waste rock dump. Pit backfilling is a crucial component of the access to other pits, since those backfills are often turned into roads.
Stockpile management: During periods of high ore production, throughput capacity of the crushing system is a potential bottleneck in the ore handling system. Management of ore stockpiles during these periods will be required to ensure ore mining is not constrained and the equipment fleet can tram and feed ore to the crushing system efficiently.
| |
| GOLDEN QUEEN MINING CO. LTD./ 08-3256 |
| SOLEDAD MOUNTAIN FEASIBILITY STUDY |
| 6-3 |
The production schedule (Table 6.1) is developed from the mine phasing and other parameters as described above. The schedule includes the production from the road construction.
| Year 0 | (Figure 6.2) In pre-production, the development fleet will be developing pioneer roads and initial mining in the North-West Pit. All the waste rock will be used to develop the Phase 1, Stage 1 heap leach pad, the overland conveyor route and the crushing-screening plant foundations. The extra waste rock will go towards building a fill road to the East Pit area. The crushing-screening plant is assembled during the second and third quarters and should be operational by the beginning of October. Ore that is released during the pre-construction period is to be partly used for the preload of the heap leach pad and the rest is to be stockpiled. |
| | |
| Year 1 | (Figure 6.3) The development fleet will be constructing the remaining portion of the West Pit access. This will be done in Quarter 3. During that time, the two primary fleets will be mining the North-West Pit. The waste rock from the road construction and the North-West Pit will be hauled to advance the East Pit access and to build a foundation for the aggregate plant at the East rock dump. In Quarter 4, one of the primary fleets will be mining Main Pit 1, while the other fleet will be mining in Main Pit 2. The waste rock will be backfilled into the North-West Pit. |
| | |
| Year 2 | (Figure 6.4) The two primary fleets will be mining in Main Pit 2 so it can be completed by Quarter 3. Once Main Pit 2 is completed, the two fleets will be mining in Main Pit 1 down to 3820 ft bench. The waste rock produced in Main Pit 2 will be placed in the East rock dump, and most of the waste rock from Main Pit 1 can be backfilled into Main Pit 2 as soon as it becomes available. The development fleet will be used for mining support in this year. The potential aggregate production will begin this year producing 318,000 tonnes (351,000 tons) of aggregate for 30 years. |
| | |
| Year 3 | (Figure 6.5) The development fleet is used to develop an access from Main pit to East rock dump. When the development fleet finishes constructing the access, it is moved to mine the initial benches of the Main Pit 3. The two primary fleets continue to mine down Main Pit 1 which will be completed in Quarter 4. The waste rock from Main Pit 1 goes to East rock dump. The waste rock from Main Pit 3 is backfilled into Main Pit 1 to develop a backfill access that connects top of the Main Pit to the East rock dump. |
| | |
| Year 4 | (Figure 6.6) The two primary fleets continue to mine at full capacity in Main Pit 3. About 1.1 million tonnes or 1.5 million tons of waste rock is backfilled into Main Pit 1. The rest of the waste rock is hauled to the East rock dump using the access developed in the previous year. The development fleet is used for mine support and developing the East Pit access. |
| |
| GOLDEN QUEEN MINING CO. LTD./ 08-3256 |
| SOLEDAD MOUNTAIN FEASIBILITY STUDY |
| 6-4 |
|
| Year5 | (Figure 6.7) The two primary fleets continue to mine at full capacity in Main Pit 3. The development fleet continues to construct access to the top of the East Pit. Dumping is ongoing at the East rock dump. |
| | |
| Year6 | (Figure 6.8) Main Pit 3 is completed during Quarter 1 using the development fleet due to space constraints. The two primary fleets will be mining in East Pit 1. The waste rock from East Pit 1 is backfilled into the Main Pit. |
| | |
| Year7 | (Figure 6.9) Mining continues in East Pit 1 with the two primary fleets. The waste rock is backfilled into Main Pit. The backfilled waste rock builds up the road that crosses the Main Pit and connects the West Pit access with East Pit. This road is used to shorten the waste haul when mining the West Pit. |
| | |
| Year8 | (Figure 6.10) The primary fleets finish mining in East Pit 1 during Quarter 1 of Year 9 and move to East Pit 2. The waste rock from the East pits is backfilled into the Main Pit. The backfilled material in the Main pit continues to rebuild the West Pit access that was mined out by the Main Pit. The development fleet is used as mining support in this year. |
| | |
| Year9 | (Figure 6.11) The two primary fleets continue to advance in East Pit 2 until the end of the year. The waste rock is backfilled into Main pit and establishes access connecting East Pit with the West Pit access |
| | |
| Year10 | (Figure 6.12) In this year, the primary fleets move to East Pit 3, and mining is completed in Quarter 3. The development fleet mines the first two benches in West Pit, and the primary fleets will take over as soon as East Pit is completed. The waste rock in West Pit gets backfilled into East Pit. |
| | |
| Year11 | (Figure 6.13) Both primary fleets continue to mine in West Pit, and the waste rock gets backfilled into East Pit. The development fleet is used as support. |
| | |
| Year12 | (Figure 6.14) Both primary fleets will be mining in West Pit until it is finished in Quarter 2. The waste continues to get backfilled into East pit. |
| | |
Year13-
Year31 | (Figures 6.15) The aggregate production continues until Year 31. The fines produced from the aggregate production are backfilled into the West Pit. When the aggregate production is completed, about 9.6 million tonnes or 10.6 million tons of waste rock from the East rock dump is hauled and backfilled into the East Pit and Main Pit to achieve the maximum possible backfill. About 2.7 million tonnes or 3 million tons of waste rock out of the 9.6 million tonnes or 10 million tons are placed in West pit to use as a cap for the aggregate fines. During the initial three years of this period, all the inactive backfilled dumps and roads will be resloped to 2H:1V. |
| |
| GOLDEN QUEEN MINING CO. LTD./ 08-3256 |
| SOLEDAD MOUNTAIN FEASIBILITY STUDY |
| 6-5 |
Figure 6.16 shows the site at the end of aggregate production and after all backfilling has been completed.
| |
| GOLDEN QUEEN MINING CO. LTD./ 08-3256 |
| SOLEDAD MOUNTAIN FEASIBILITY STUDY |
| 6-6 |

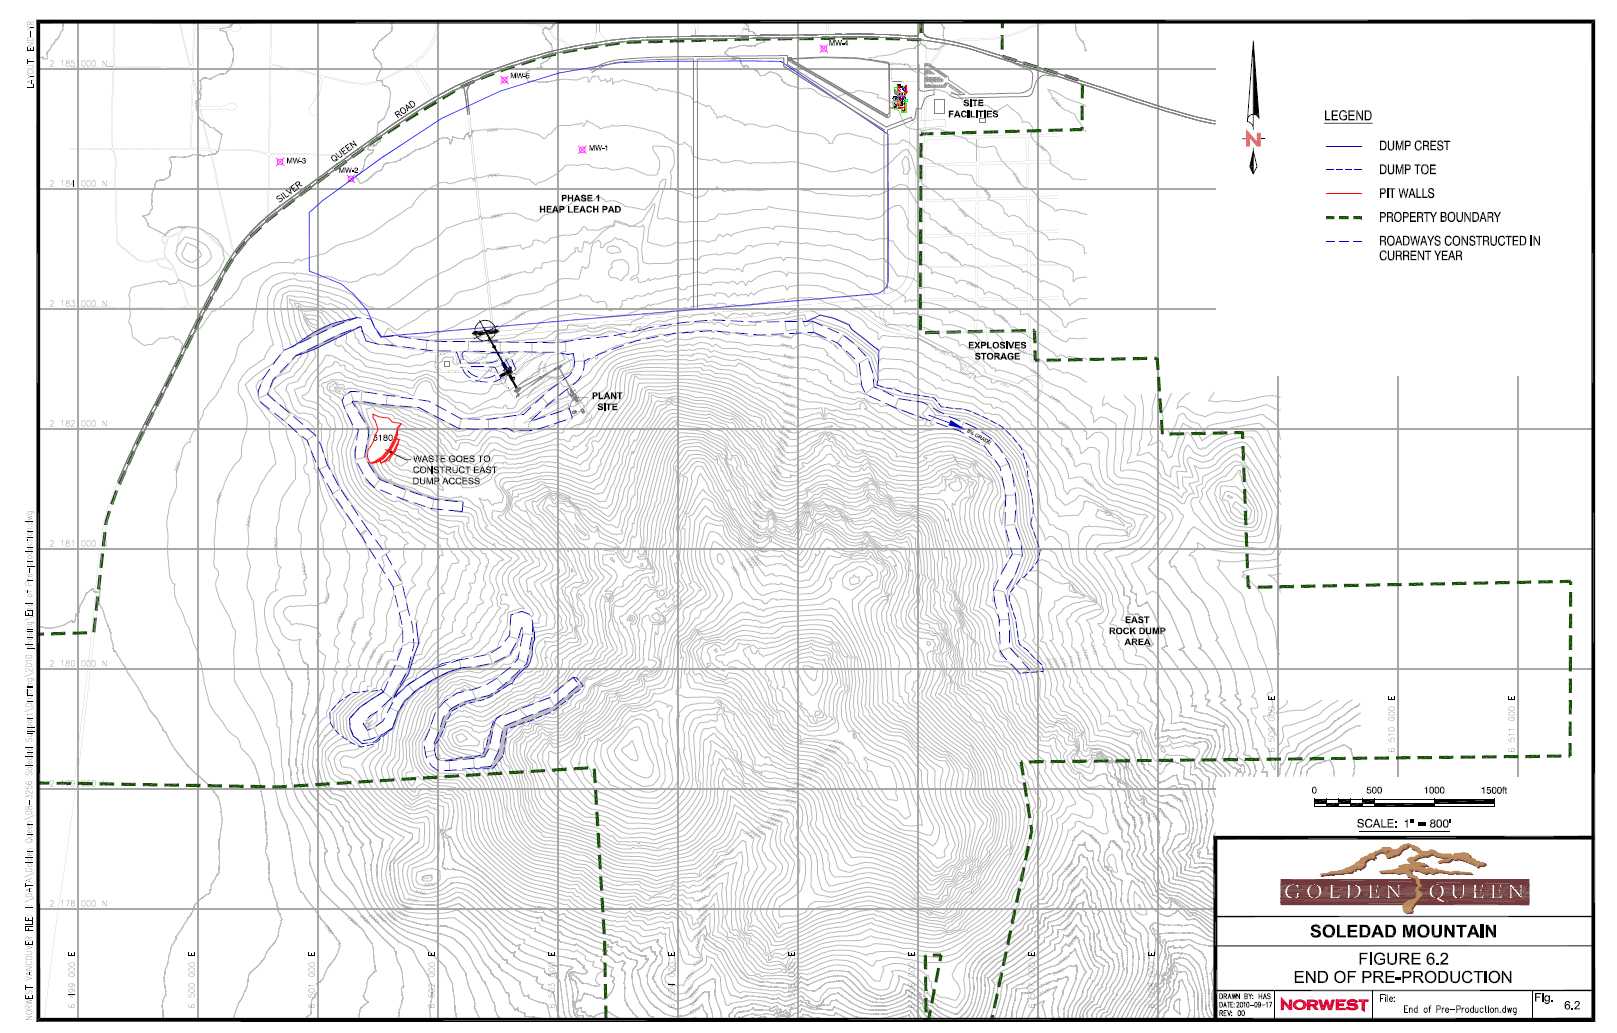
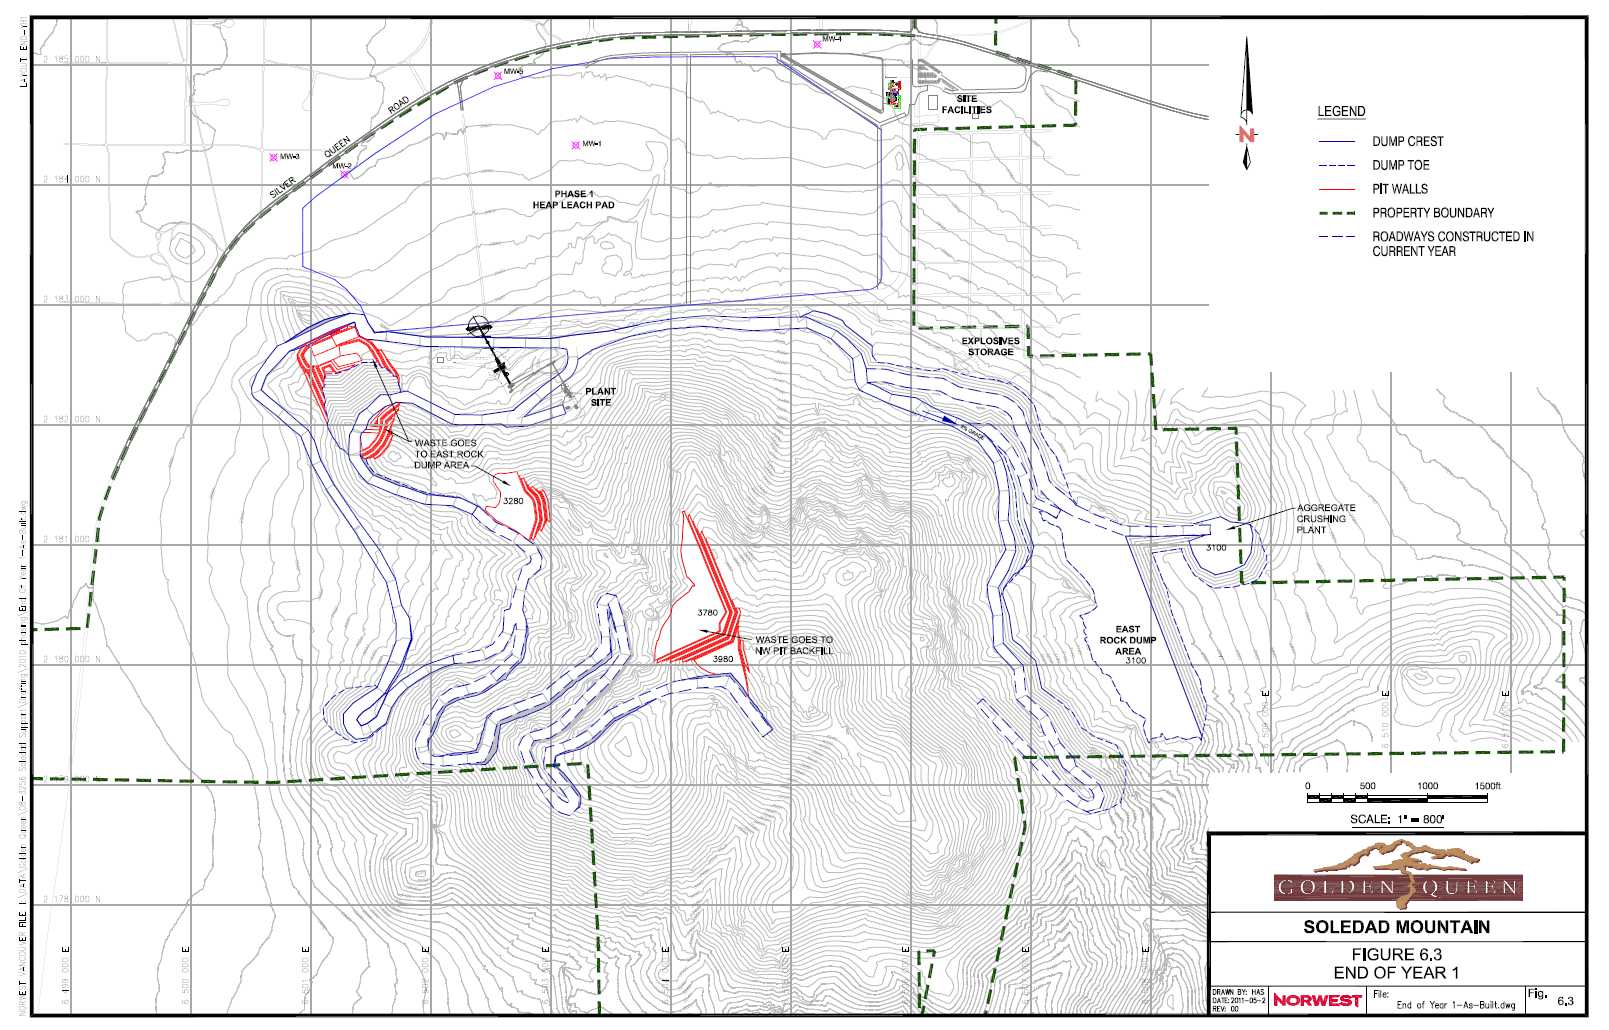
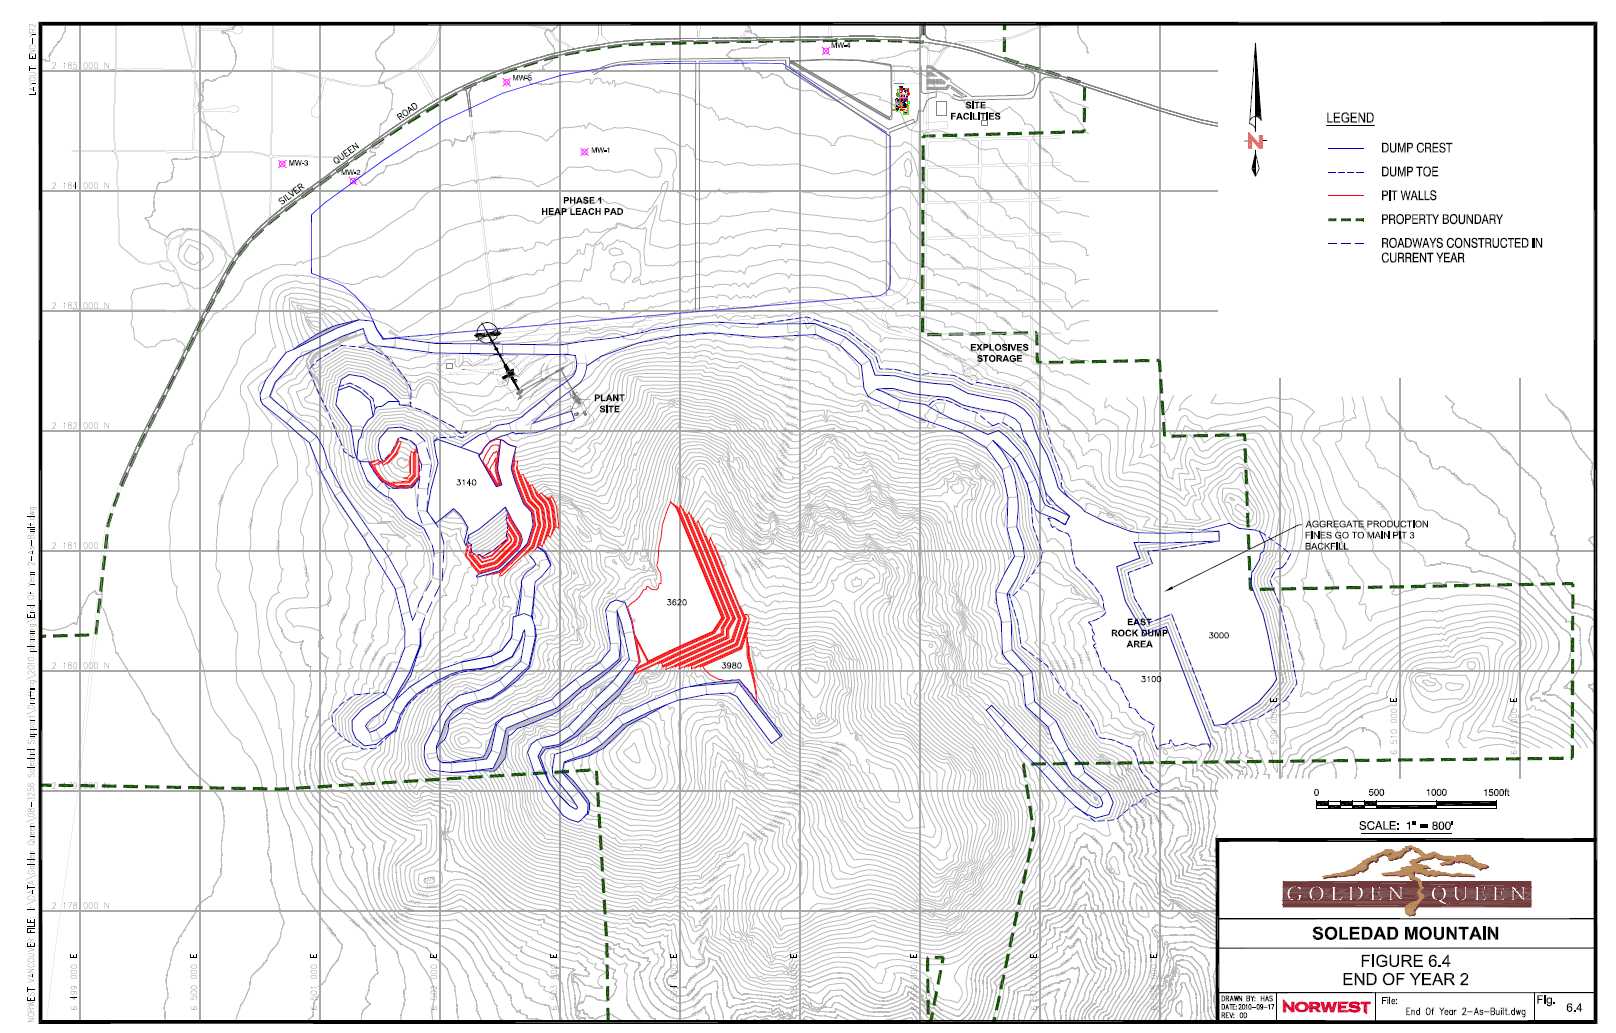
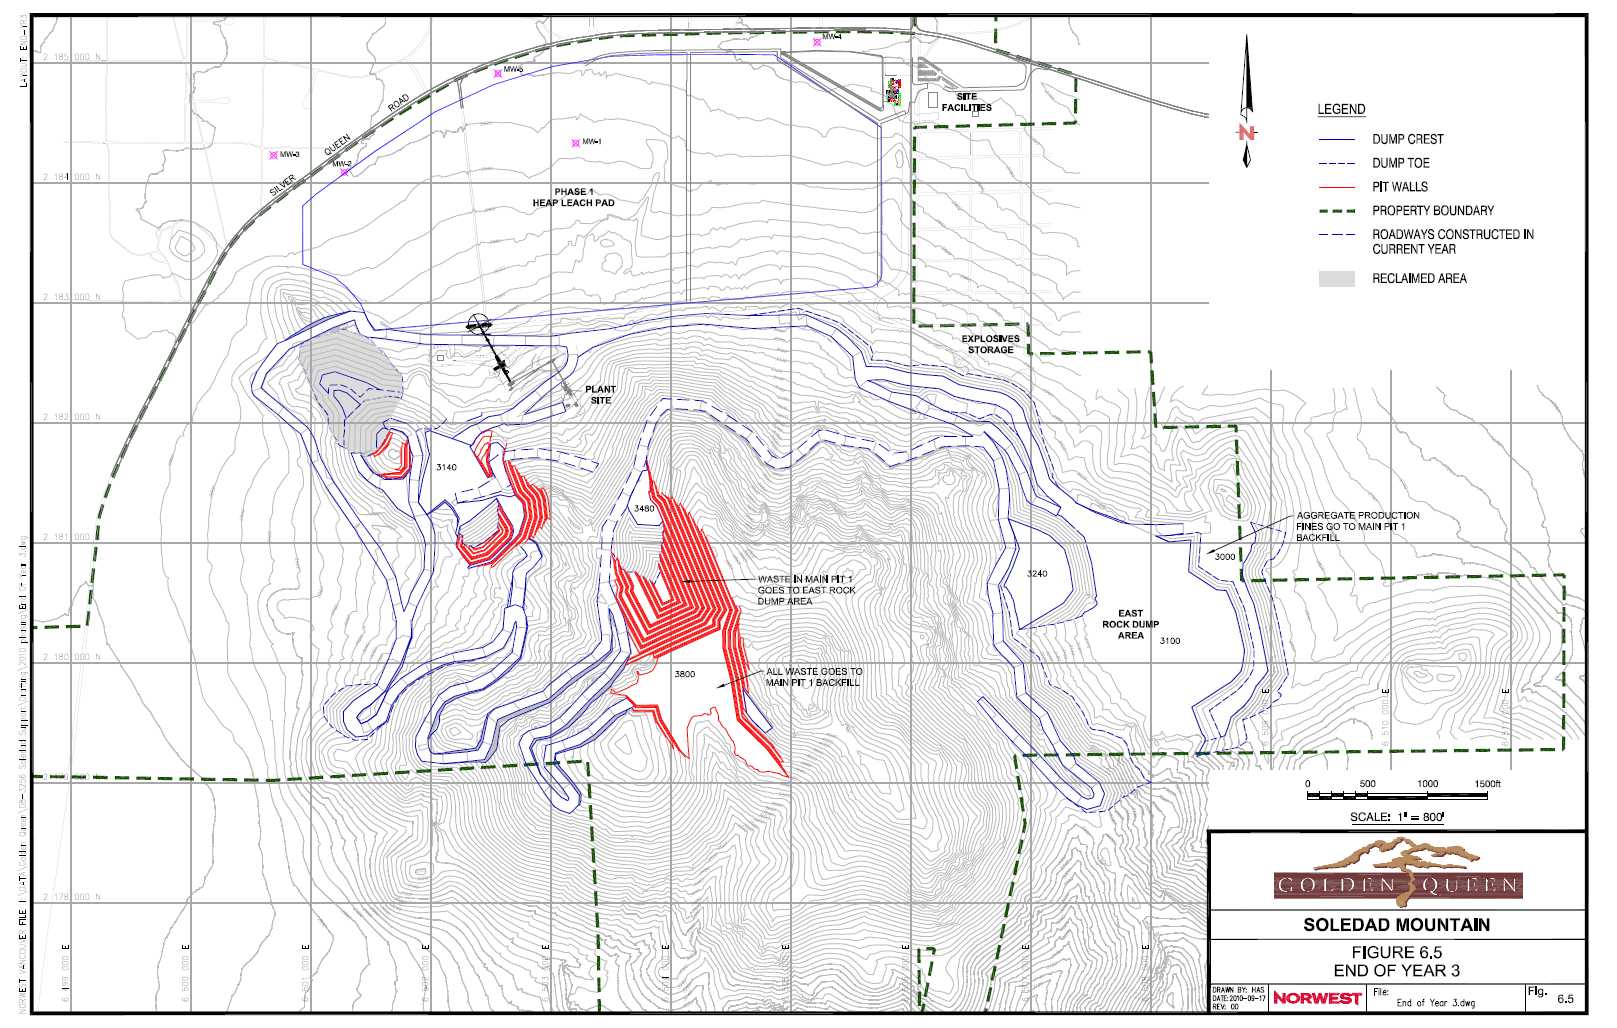
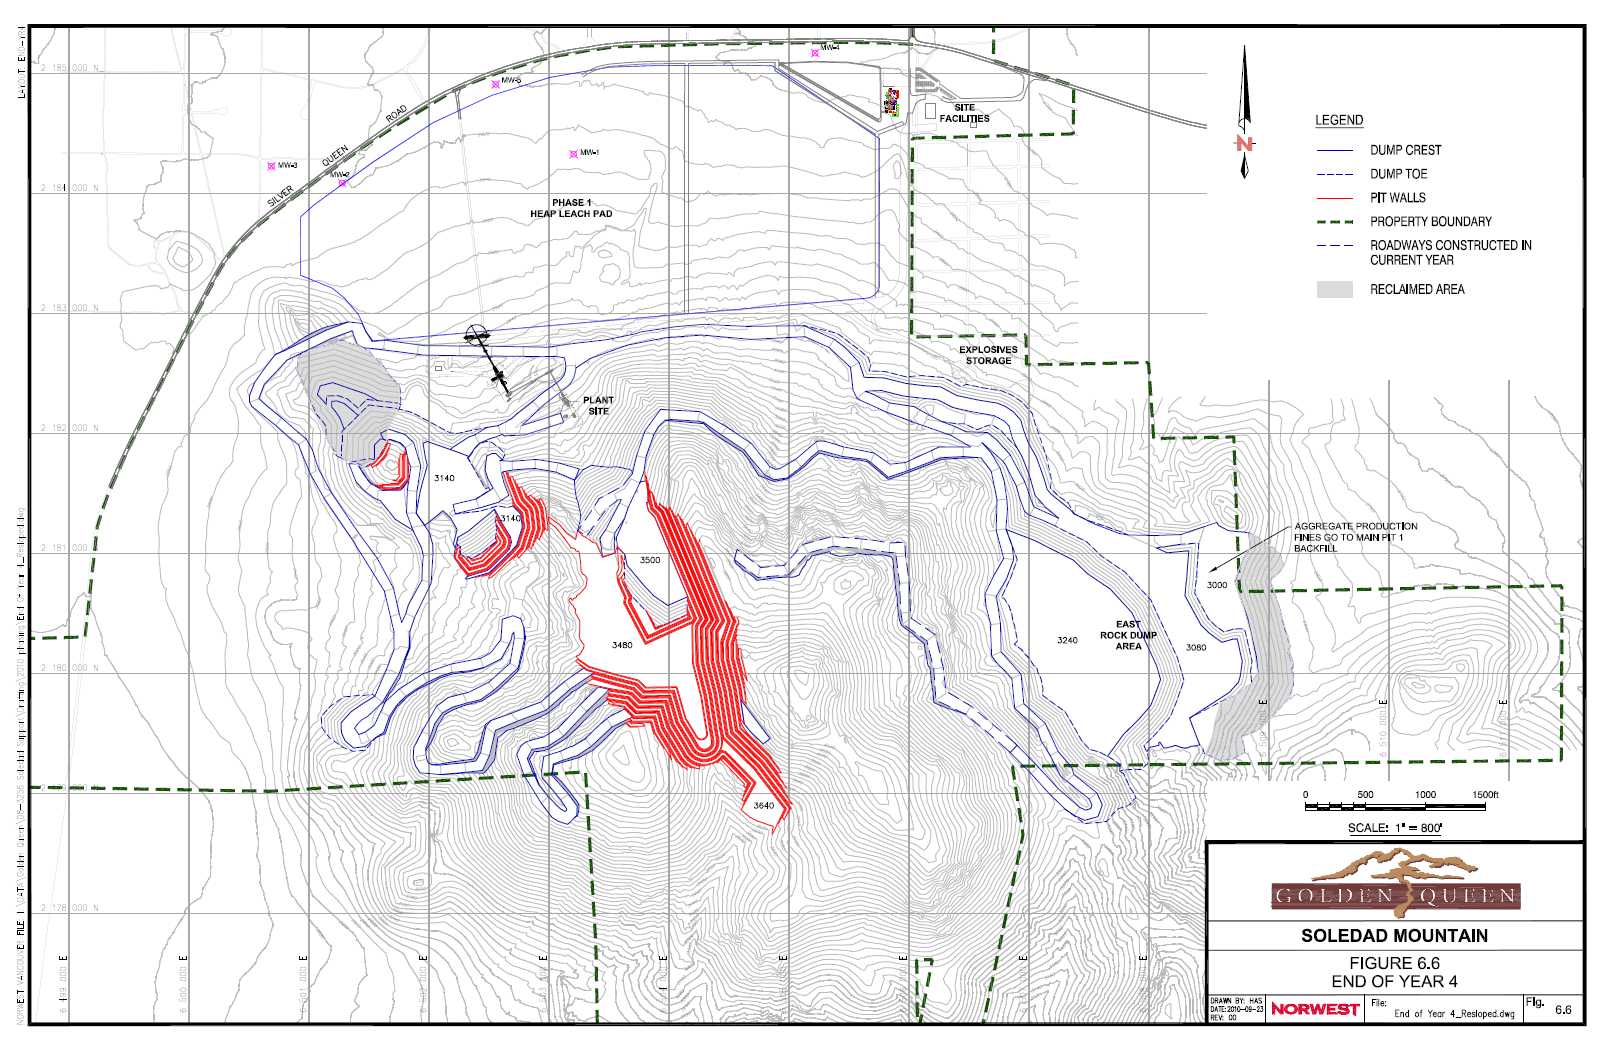
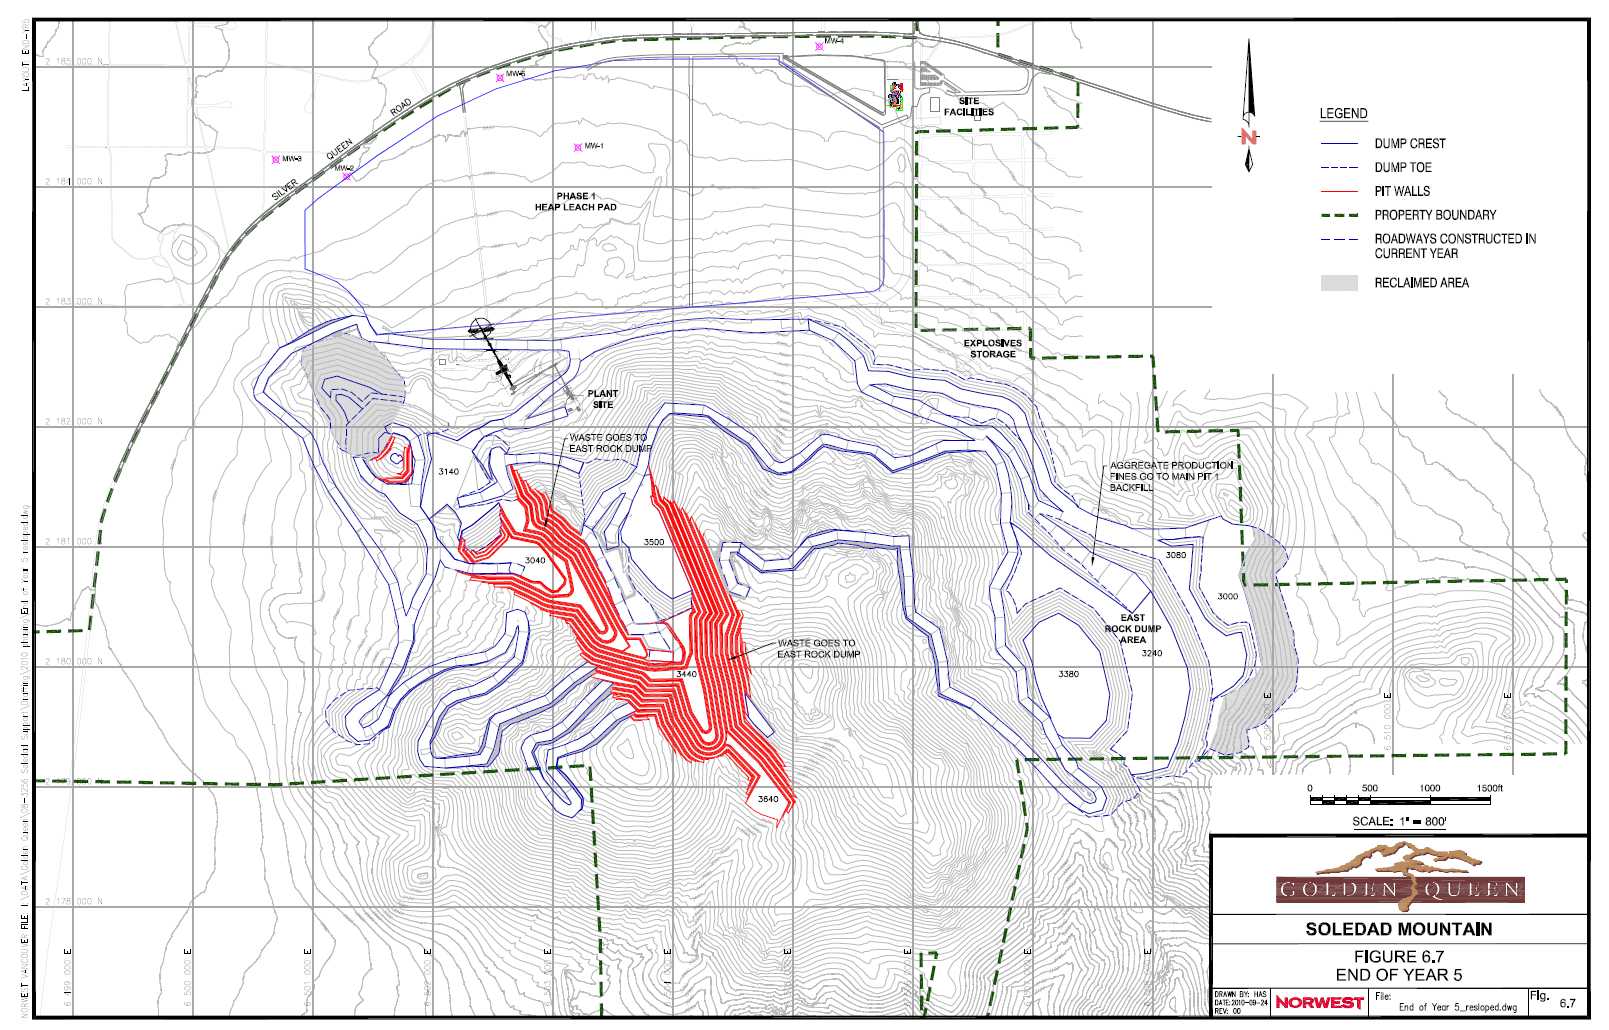
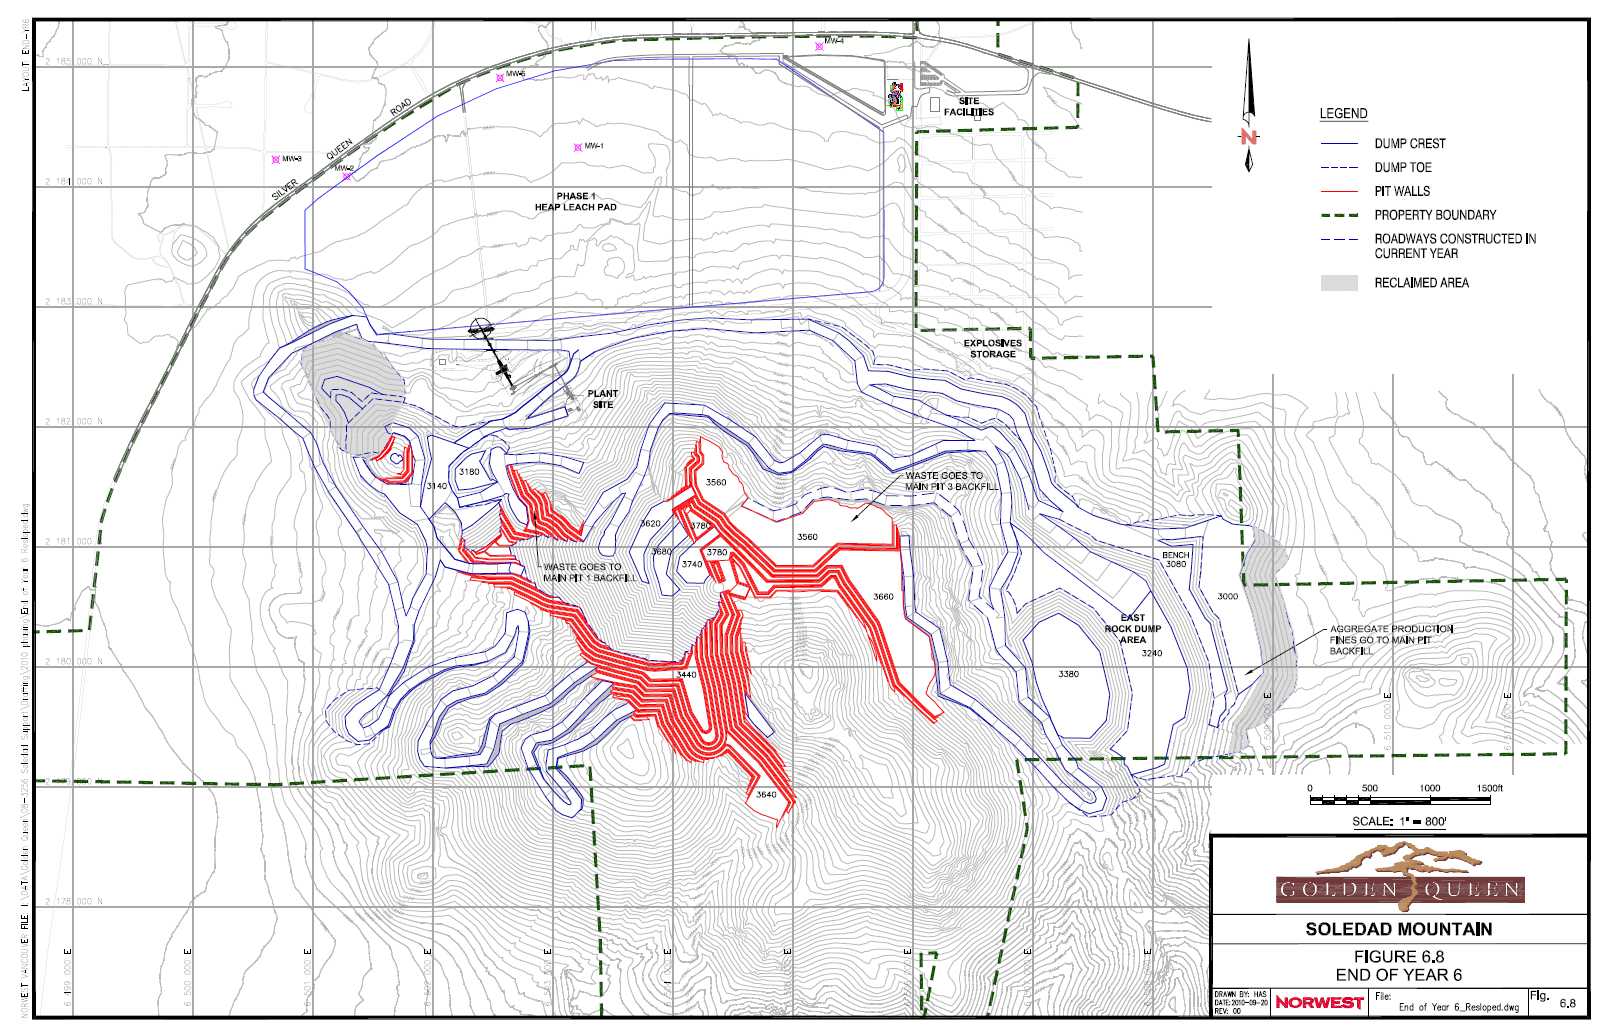
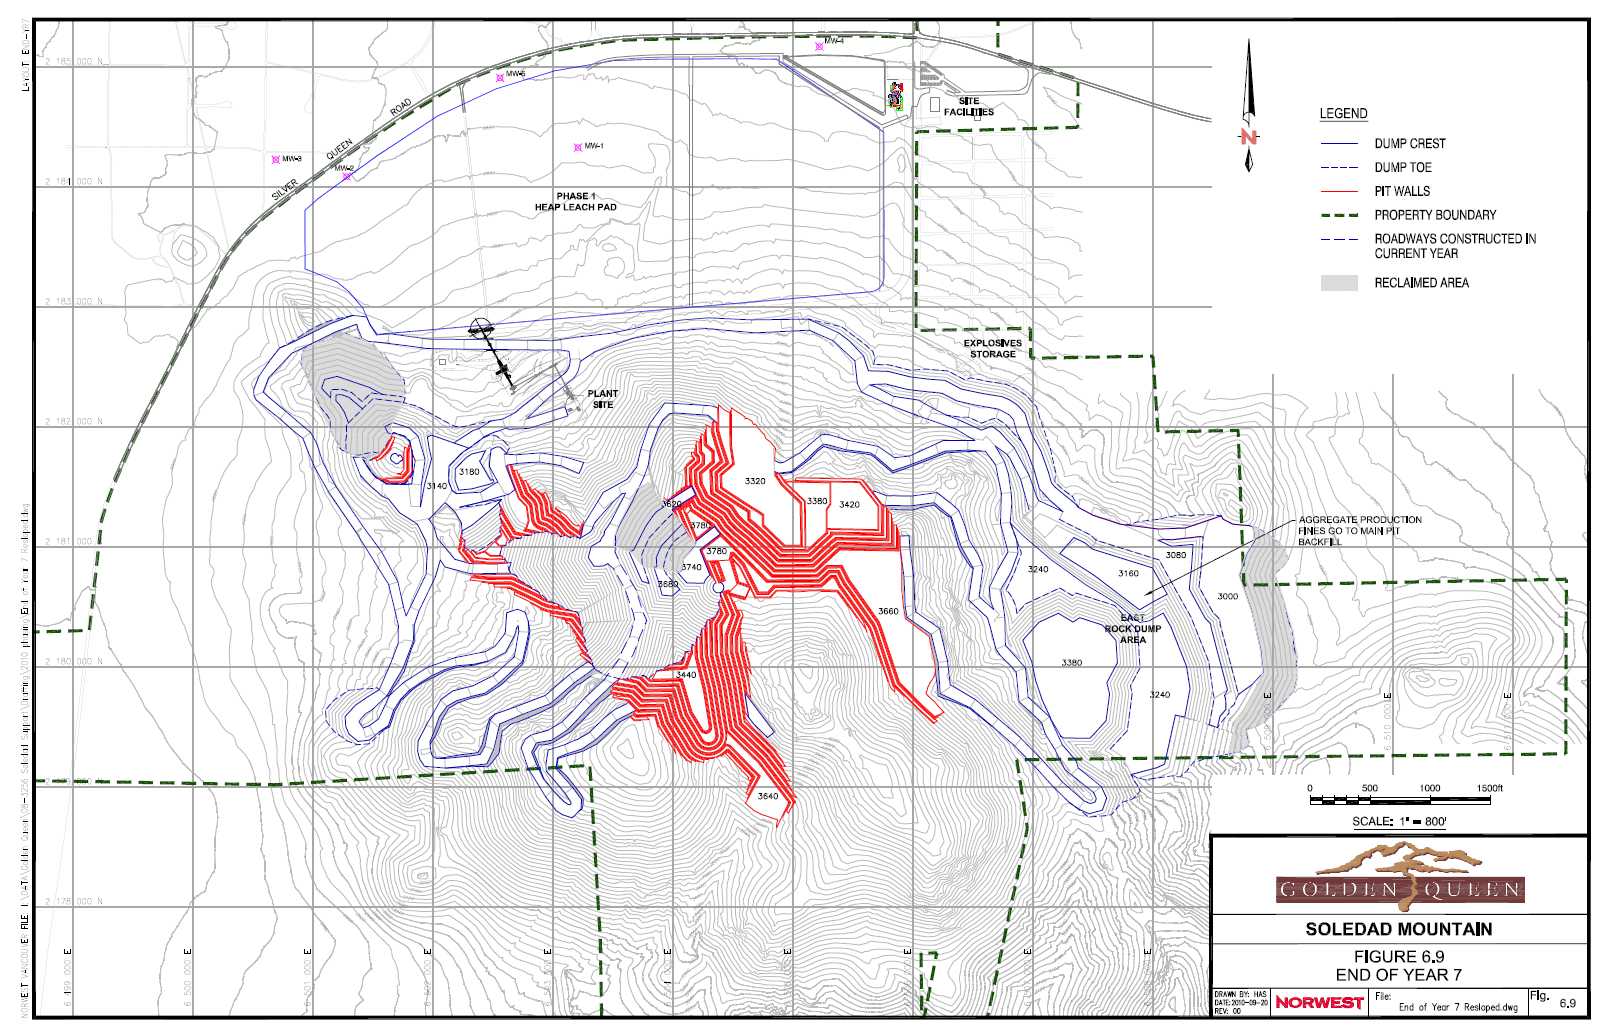
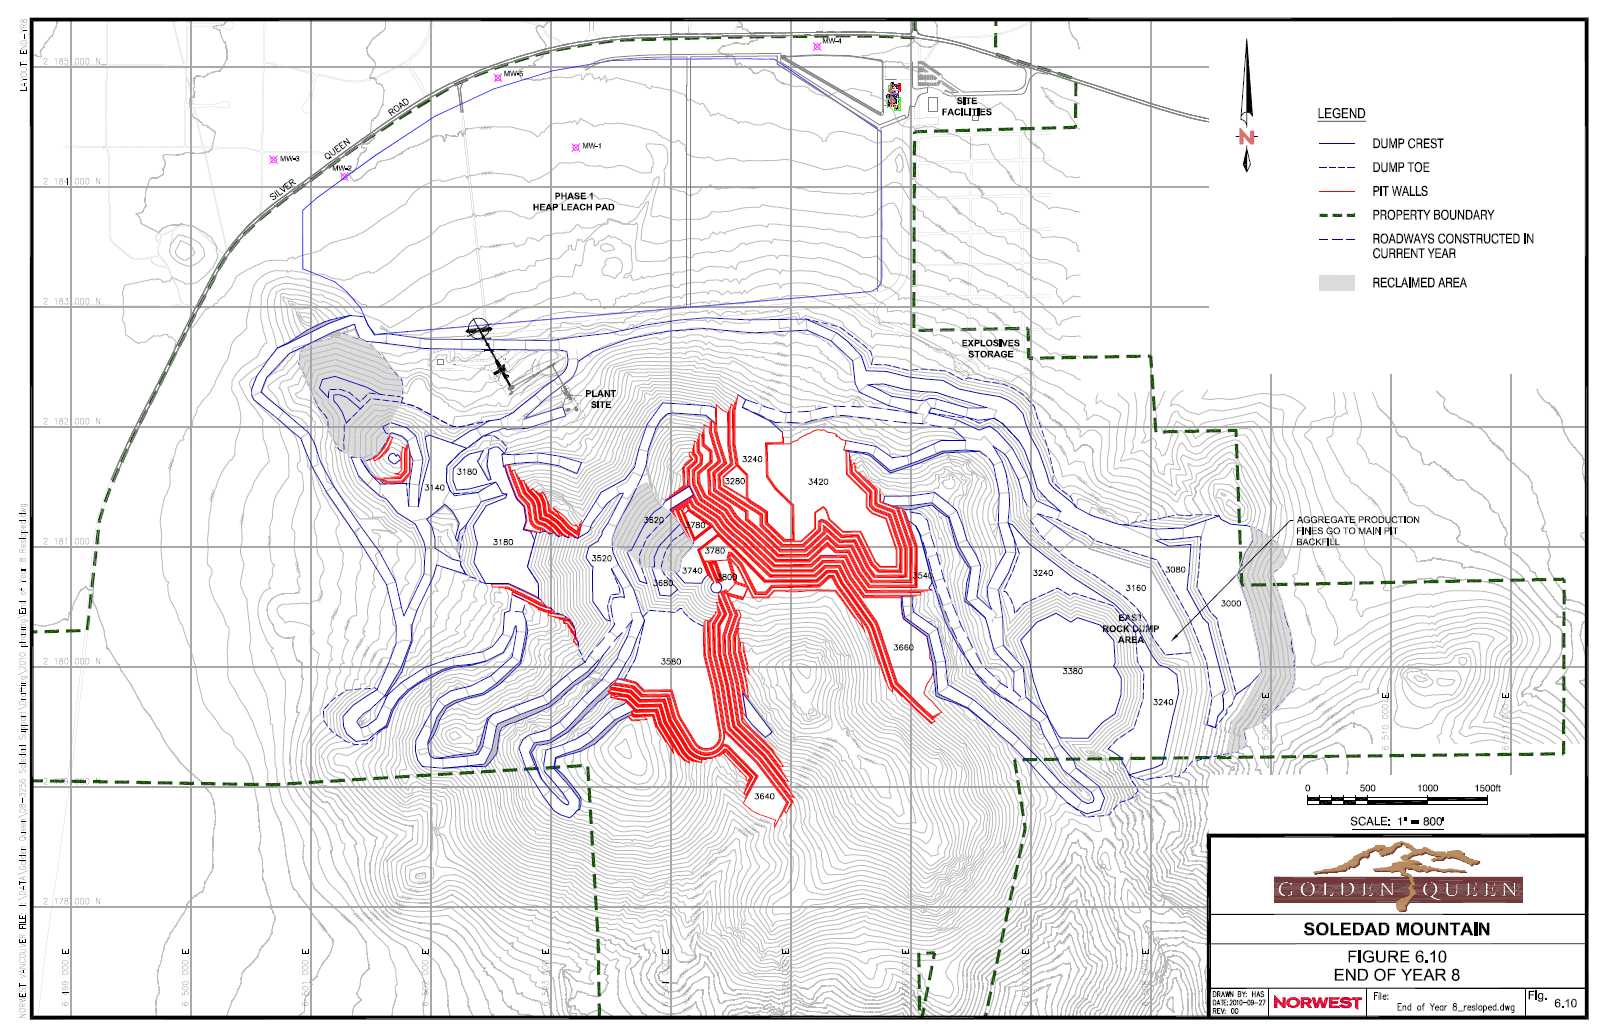
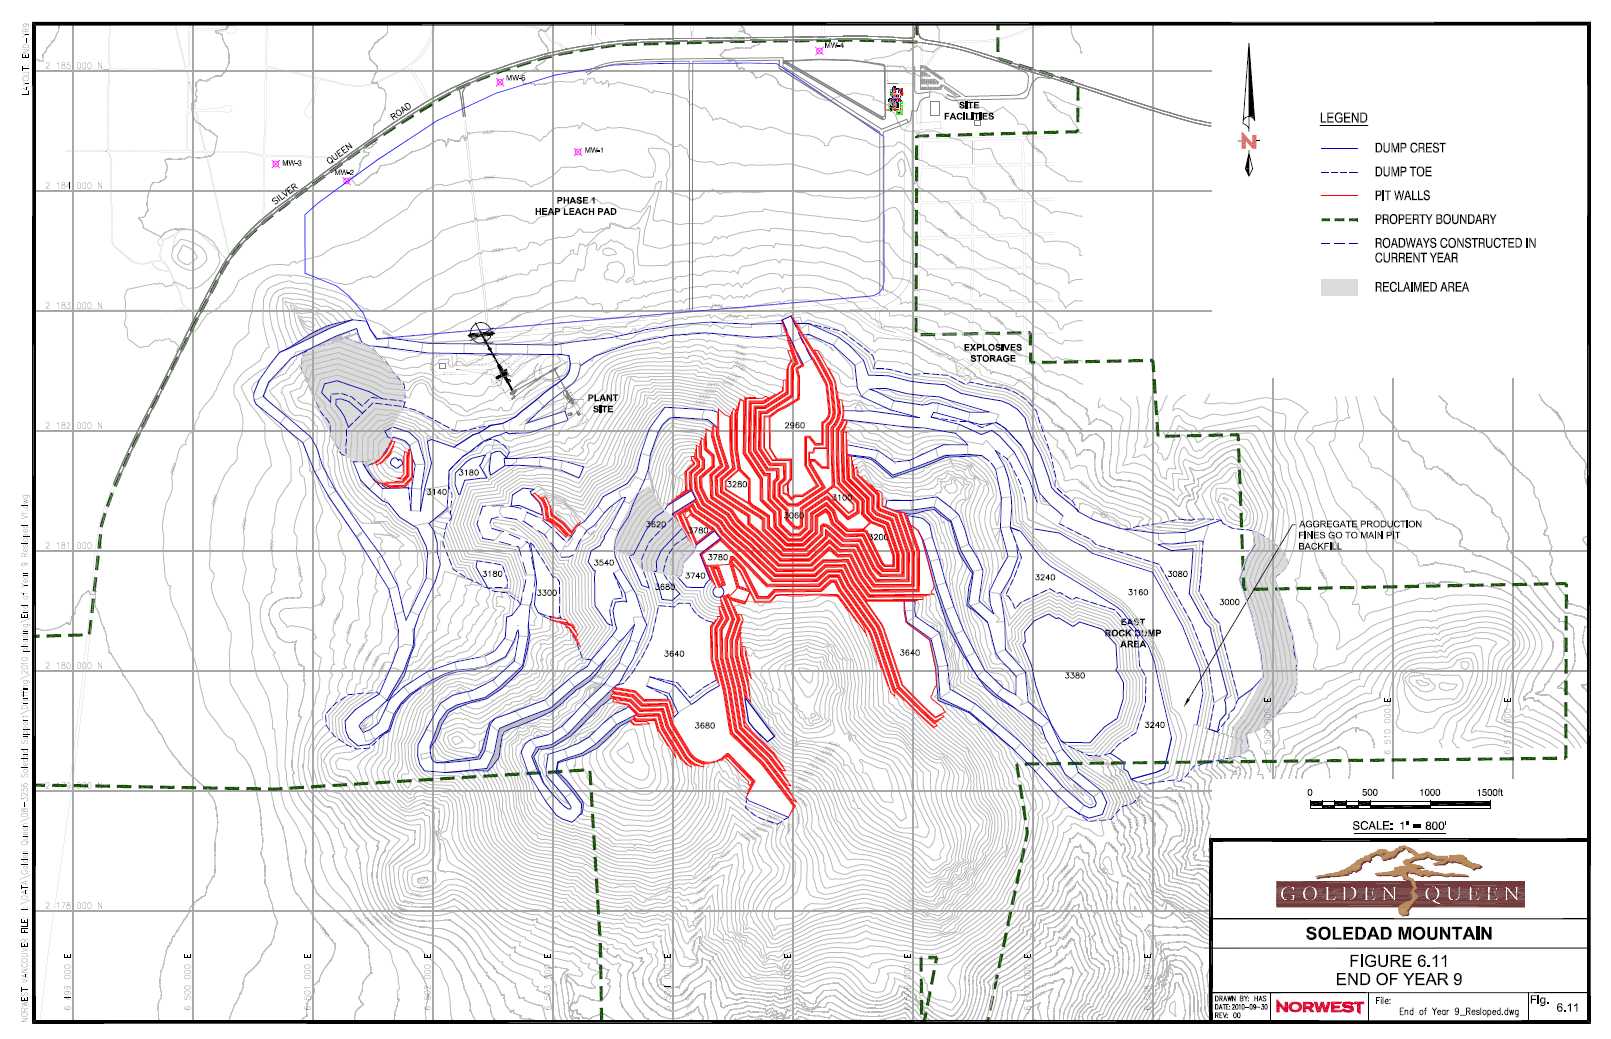
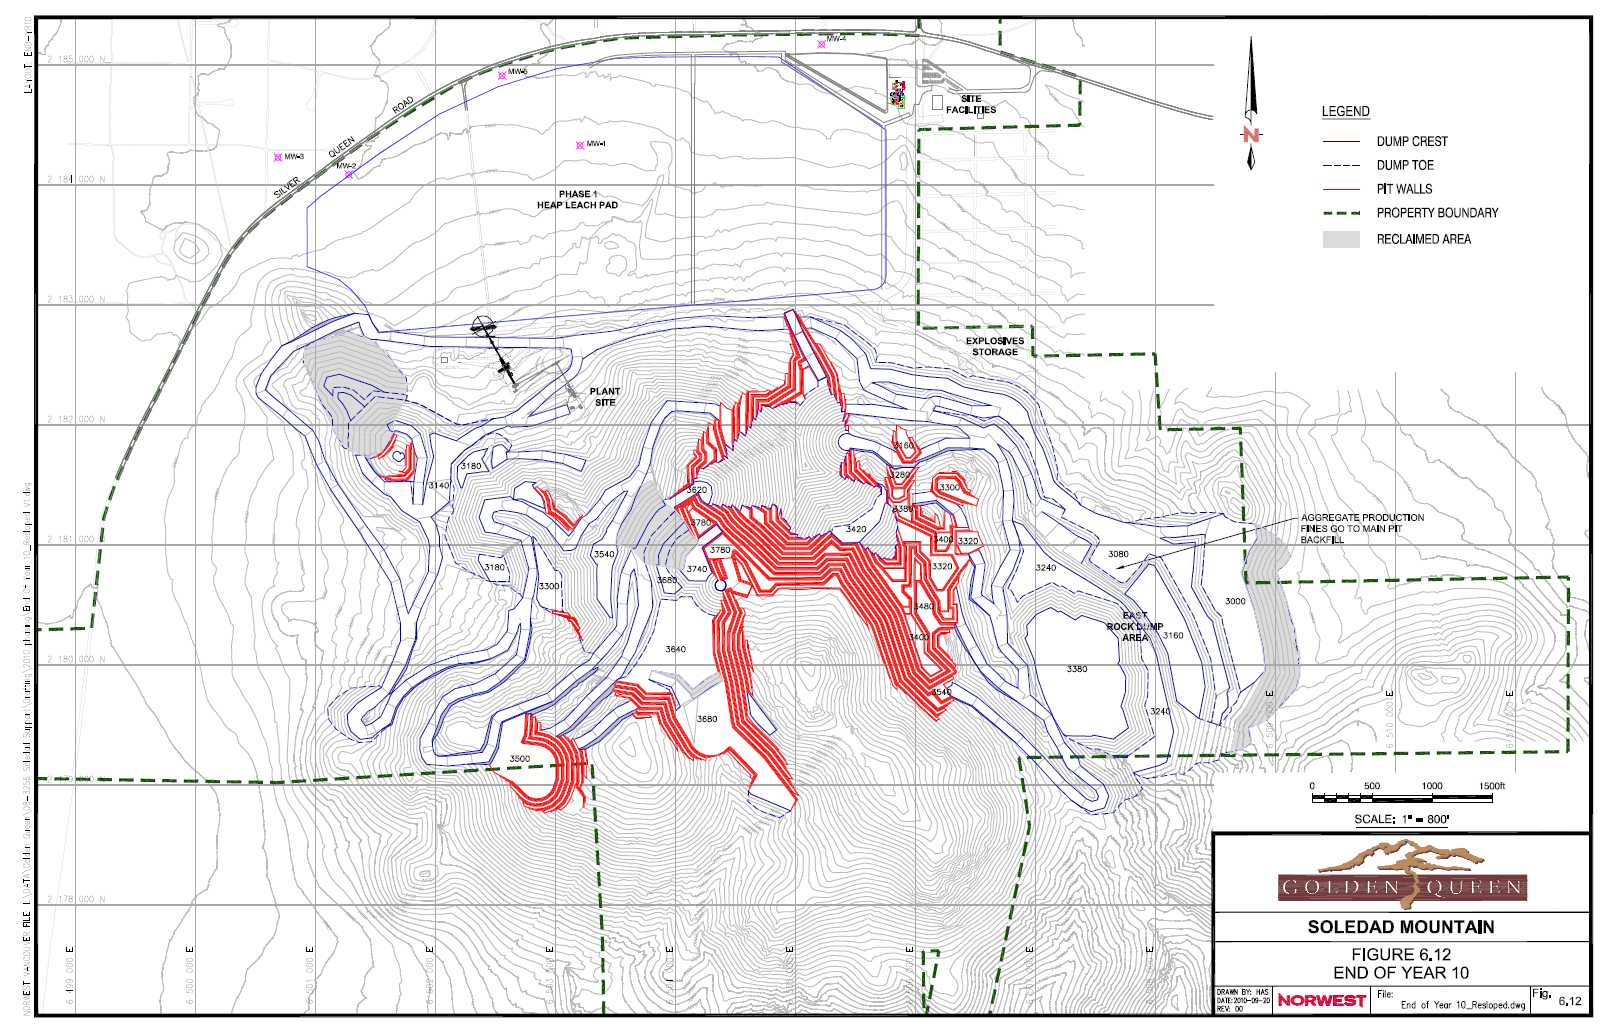
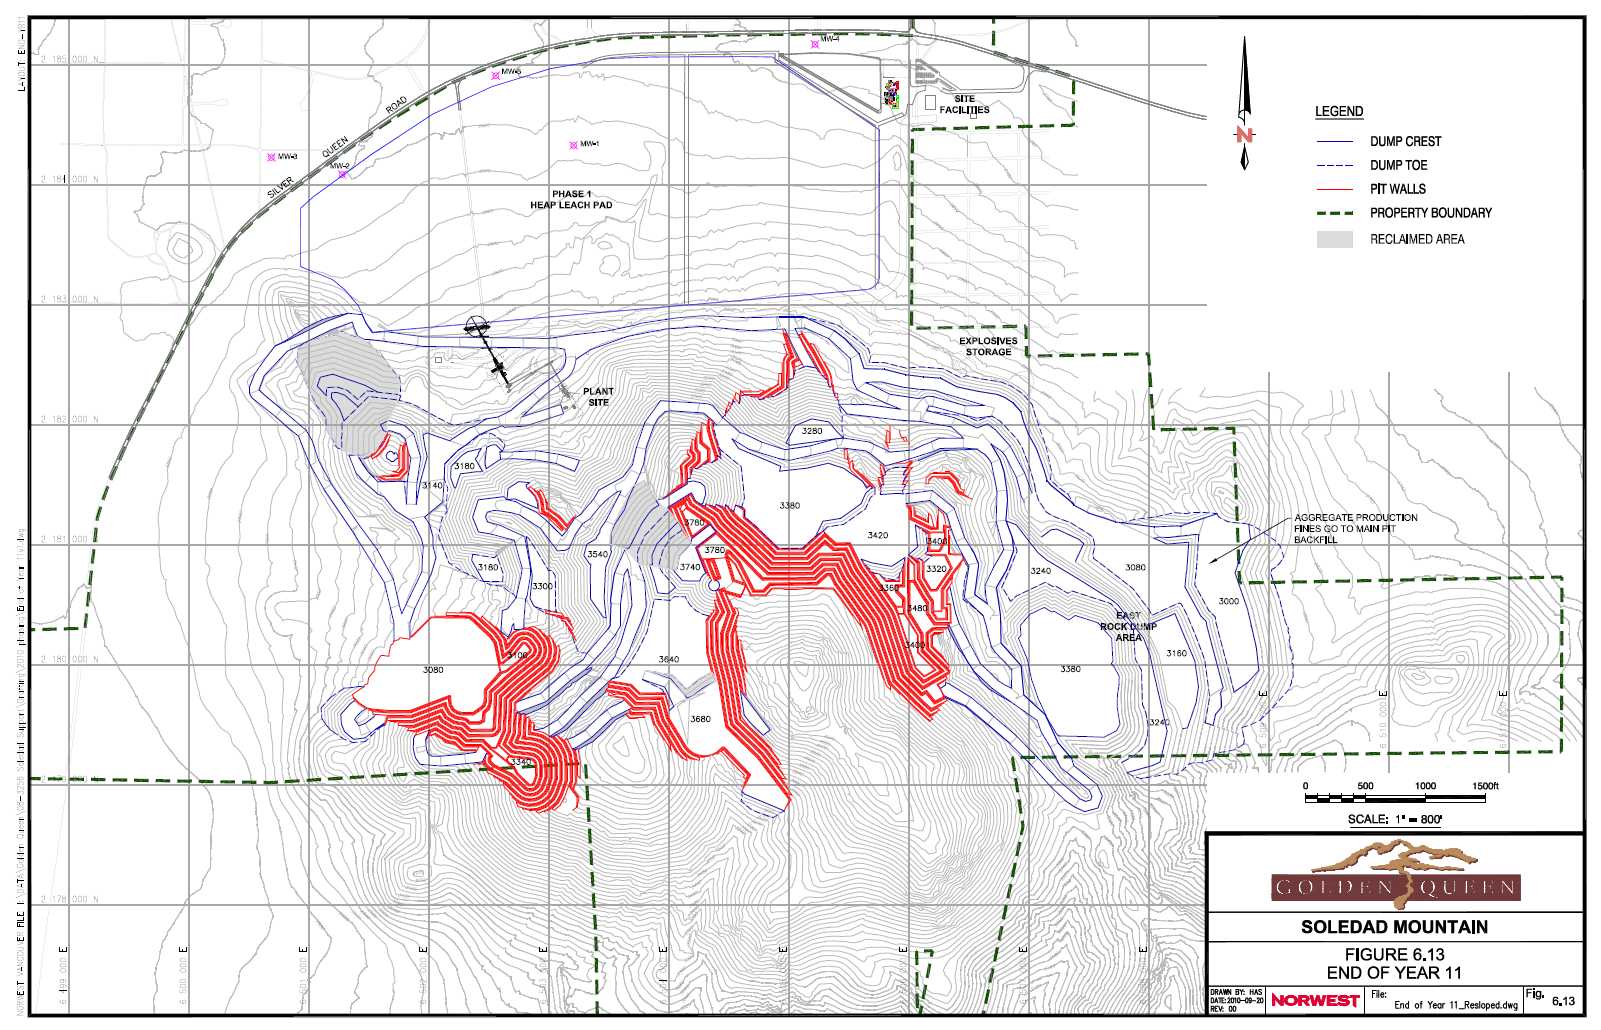
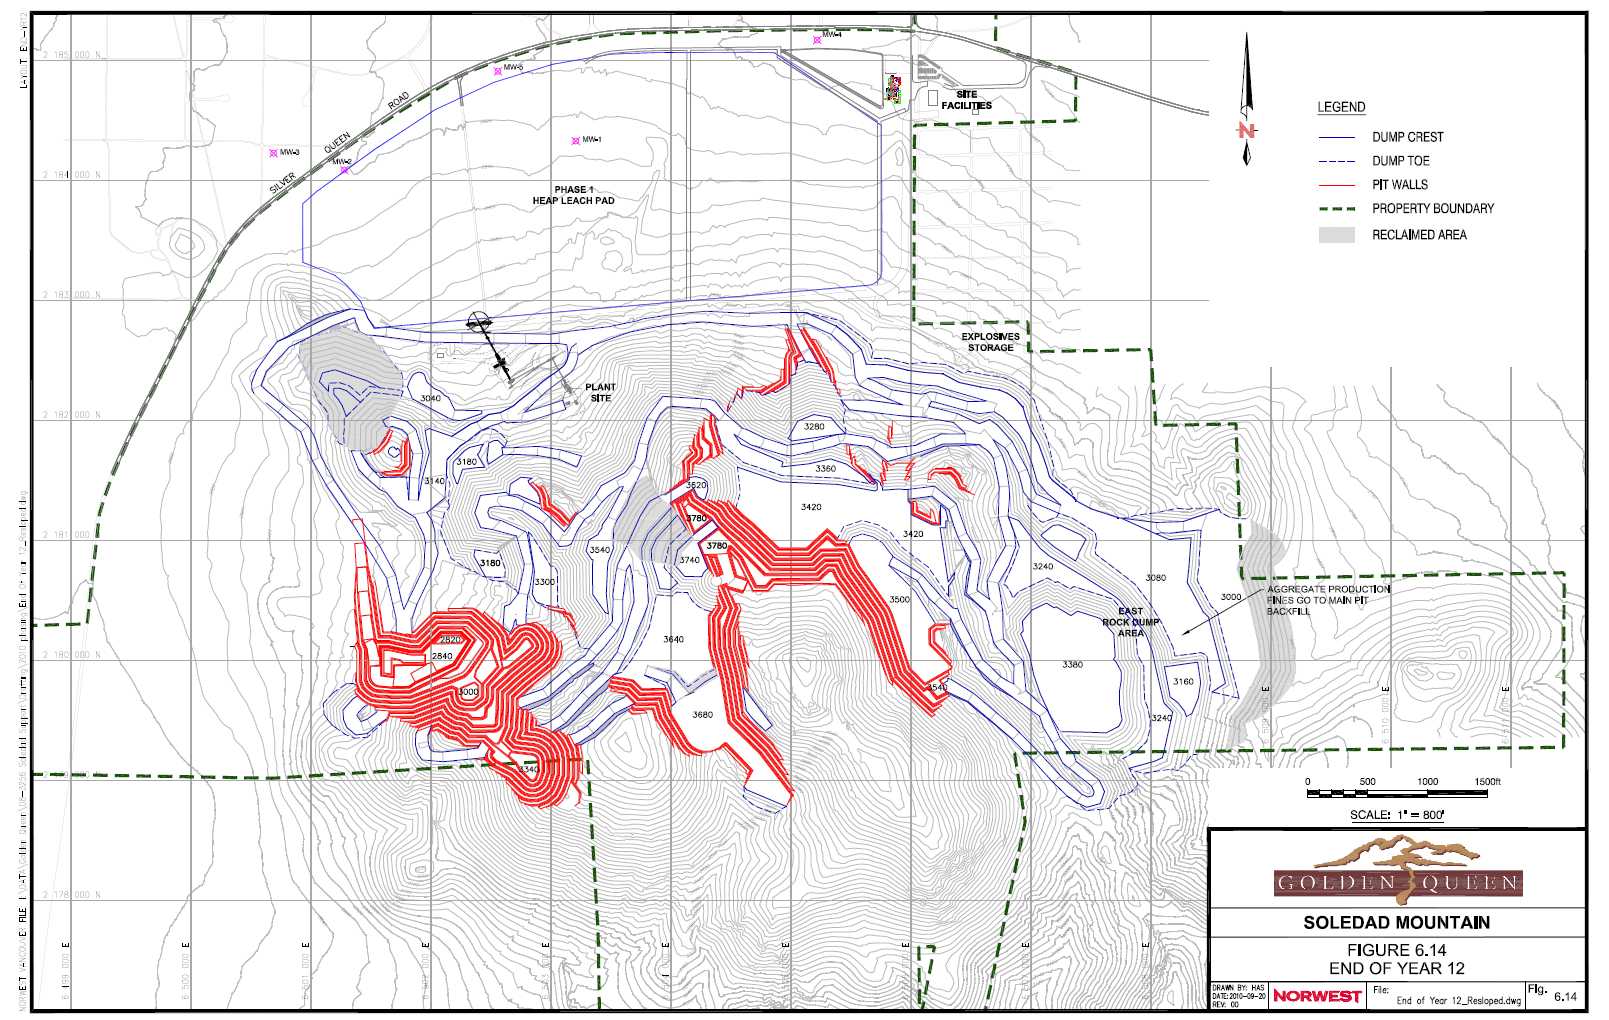
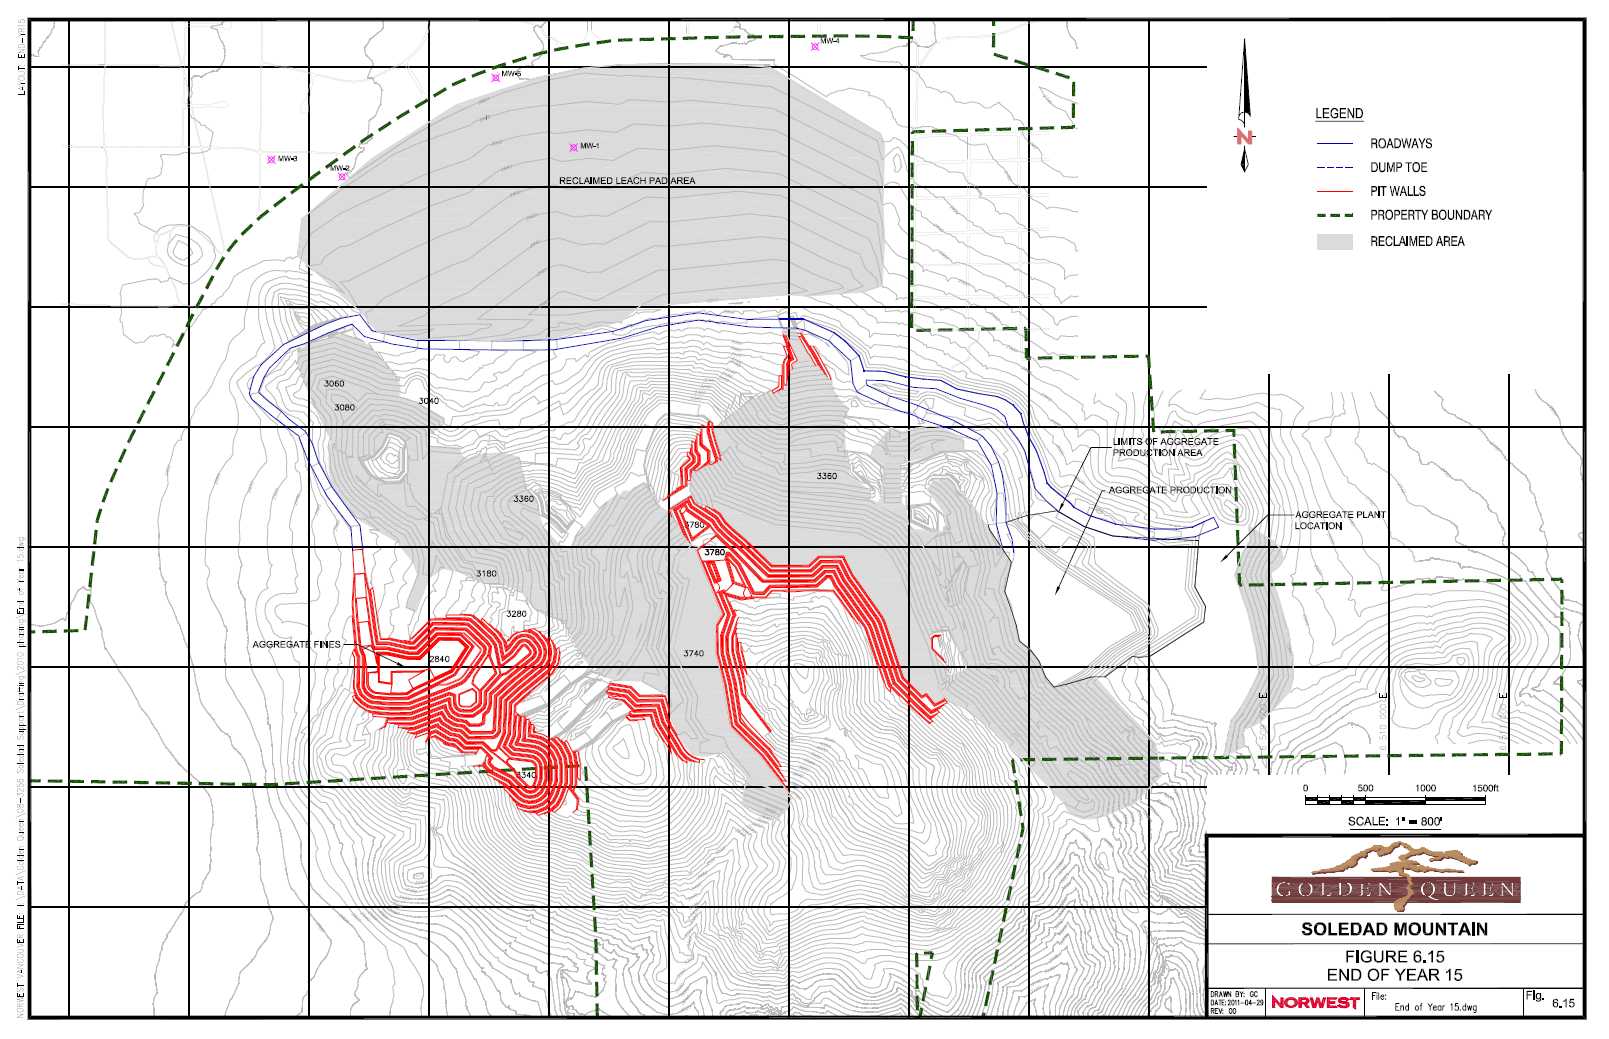
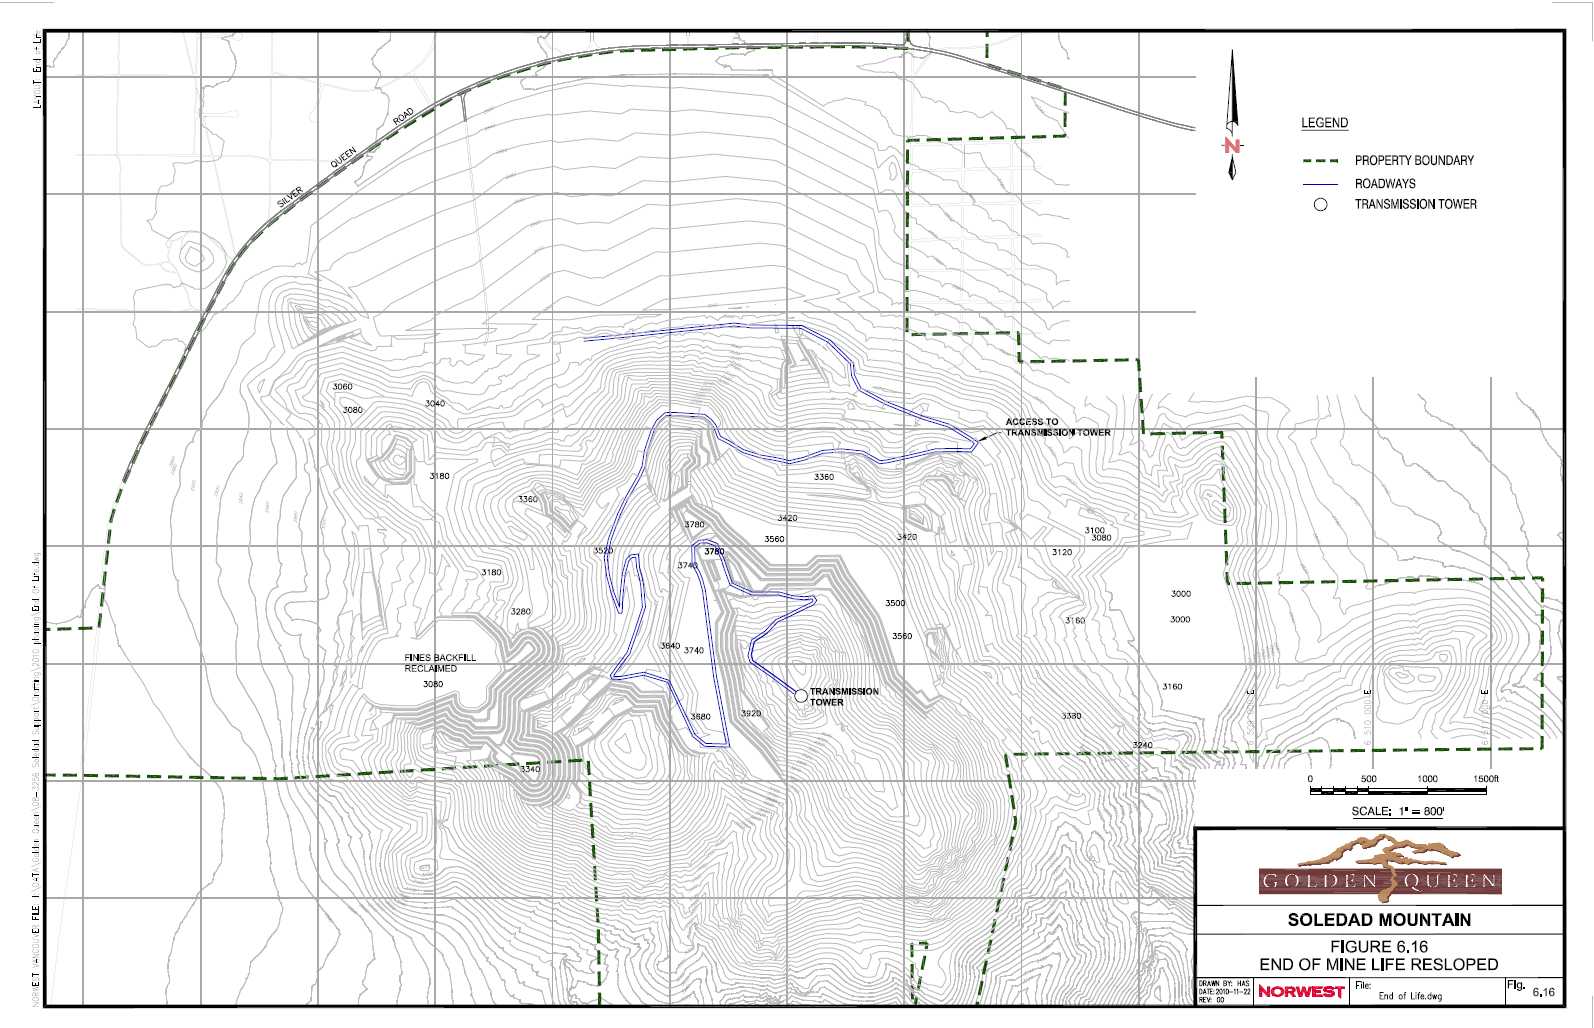
| 7 | WASTE ROCK HANDLING STRATEGY |
GQM recognizes that waste rock management will be the key issue for the Project.
A waste rock management plan has been prepared by Norwest with general design goals and constraints summarized in the bullet lists below. Locations referred to in the lists are shown on Figure 7.1.
Maximize backfill in mined-out areas of the open pits.
Minimize the footprint of the waste rock piles outside the pit limits.
Minimize the number of affected drainage basins.
Cover as much of the benched pit wall as possible as part of closing reclamation.
Attempt to create a reclaimed surface that will be similar to the original or natural ground surfaces.
Minimize visual impact of the open pits.
Segregate rock types in the East waste rock pile to preserve waste rock for future potential use as an aggregate resource.
Minimize haul distances for waste haulage to manage trucking costs.
No soil stockpile or waste rock disposal in the Joshua tree grove west of the North-West Pit.
No waste rock disposal on the southern slopes of Soledad Mountain in order to minimize the visual impact.
Place initial waste rock lifts on shallow slopes to enhance stability.
Preserve corridors for the possible pipe conveyor option.
The quantities of waste rock to be disposed by year are shown in Table 7.1. The extent of the waste rock piles at the end of the mine life is shown in Figure 7.1. The toes of the waste rock heaps, after resloping has been completed, are within the permitted boundary and also shown on Figure 7.1.
| 7.3 | EXTERNAL WASTE ROCK DISPOSAL |
Waste rock not backfilled in the mined-out open pits will be contained within the East rock dump location shown in Figure 7.1.
| |
| GOLDEN QUEEN MINING CO. LTD./ 08-3256 |
| SOLEDAD MOUNTAIN FEASIBILITY STUDY |
| 7-1 |
TABLE 7.1
WASTE ROCK PRODUCTION BY YEAR (IN 000’S)
| | Year 0 | Year 1 | Year 2 | Year 3 | Year 4 | Year 5 | Year 6 | Year 7 | Year 8 | Year 9 | Year 10 | Year 11 | Year 12 | Totals |
| Waste Mined (tons) | 1,454 | 8,761 | 9,940 | 9,706 | 9,574 | 8,856 | 8,185 | 5,178 | 6,475 | 9,618 | 7,710 | 9,470 | 3,995 | 98,922 |
| Waste Mined (BCY) | 746 | 4,493 | 5,097 | 4,977 | 4,910 | 4,542 | 4,197 | 2,655 | 3,321 | 4,932 | 3,954 | 4,856 | 2,049 | 50,729 |
| Waste Mined (LCY) | 969 | 5,841 | 6,627 | 6,471 | 6,383 | 5,904 | 5,457 | 3,452 | 4,317 | 6,412 | 5,140 | 6,313 | 2,663 | 65,948 |
External Rock Dump
Capacity Required
(LCY) |
970 |
4,315 |
2,434 |
4,591 |
5,669 |
5,904 |
0 |
338 |
260 |
311 |
286 |
0 |
0 |
25,078 |
| Backfill Dump (LCY) | 0 | 1,526 | 4,193 | 1,880 | 714 | 0 | 5,457 | 3,114 | 4,057 | 6,101 | 4,854 | 6,313 | 2,663 | 40,870 |
Backfill Dump
Location |
n/a |
North
West Pit | North
West Pit
and Main
Pit 3 |
Main
Pit 1 |
Main
Pit 1 |
n/a | All
Main
Pit | All
Main
Pit |
All Main
Pit | All
Main
Pit |
All East
Pit |
All East
Pit |
All East
Pit |
n/a |
Note: Imperial units shown as these were the parameters defined in the geological block model as noted in Section 5.0.
| |
| GOLDEN QUEEN MINING CO. LTD./ 08-3256 |
| SOLEDAD MOUNTAIN FEASIBILITY STUDY |
| 7-2 |
| | 7.3.1 | Phase 2 Heap Leach Pad |
The Phase 2 heap leach pad has been configured which could be required if economics and permitting allow for expansion of the open pits and an increase in ore tonnage mined. Although not planned for use as part of the current mine plan, this area would provide a suitable site for a pad based on preliminary design work completed by Golder.
The east rock dump is the only large external rock pile on site. Waste rock placed on this dump will be sourced from the East Pit and the dump is configured to have capacity for approximately 34 million tonnes or 37 million tons.
Construction of the dump will be carried out in a series of lifts to enhance stability and to lower the effort required for resloping at closure. The dump configuration and sequencing has also been planned to allow for the use of the more competent waste rock as an aggregate source. To this end, a pad of the weaker rock from the upper benches of the East Pit is constructed first and the more competent rock is dumped in lifts on this pad. As noted in the design constraints listed above, the footprint of the East rock dump has been configured to limit the impact on drainages as well as keep the final resloped limits of the dump within the current permitted boundary.
| 7.4 | BACKFILL WASTE ROCK DISPOSAL |
The mining plan described in Section 6 highlights the effort that has been put into backfilling open pit areas in order to limit the footprint of the Project. Backfill locations are listed in Table 7.1 by year.
The backfill configuration is constrained by the need to maintain access to the crusher from the various pit phases. The backfill schedule also considers the need to protect workers and equipment from exposure to rock rollout or potential minor slope instabilities from the dumped rock piles. Therefore the plan limits placement of material to locations which mitigate these risks.
| |
| GOLDEN QUEEN MINING CO. LTD./ 08-3256 |
| SOLEDAD MOUNTAIN FEASIBILITY STUDY |
| 7-3 |
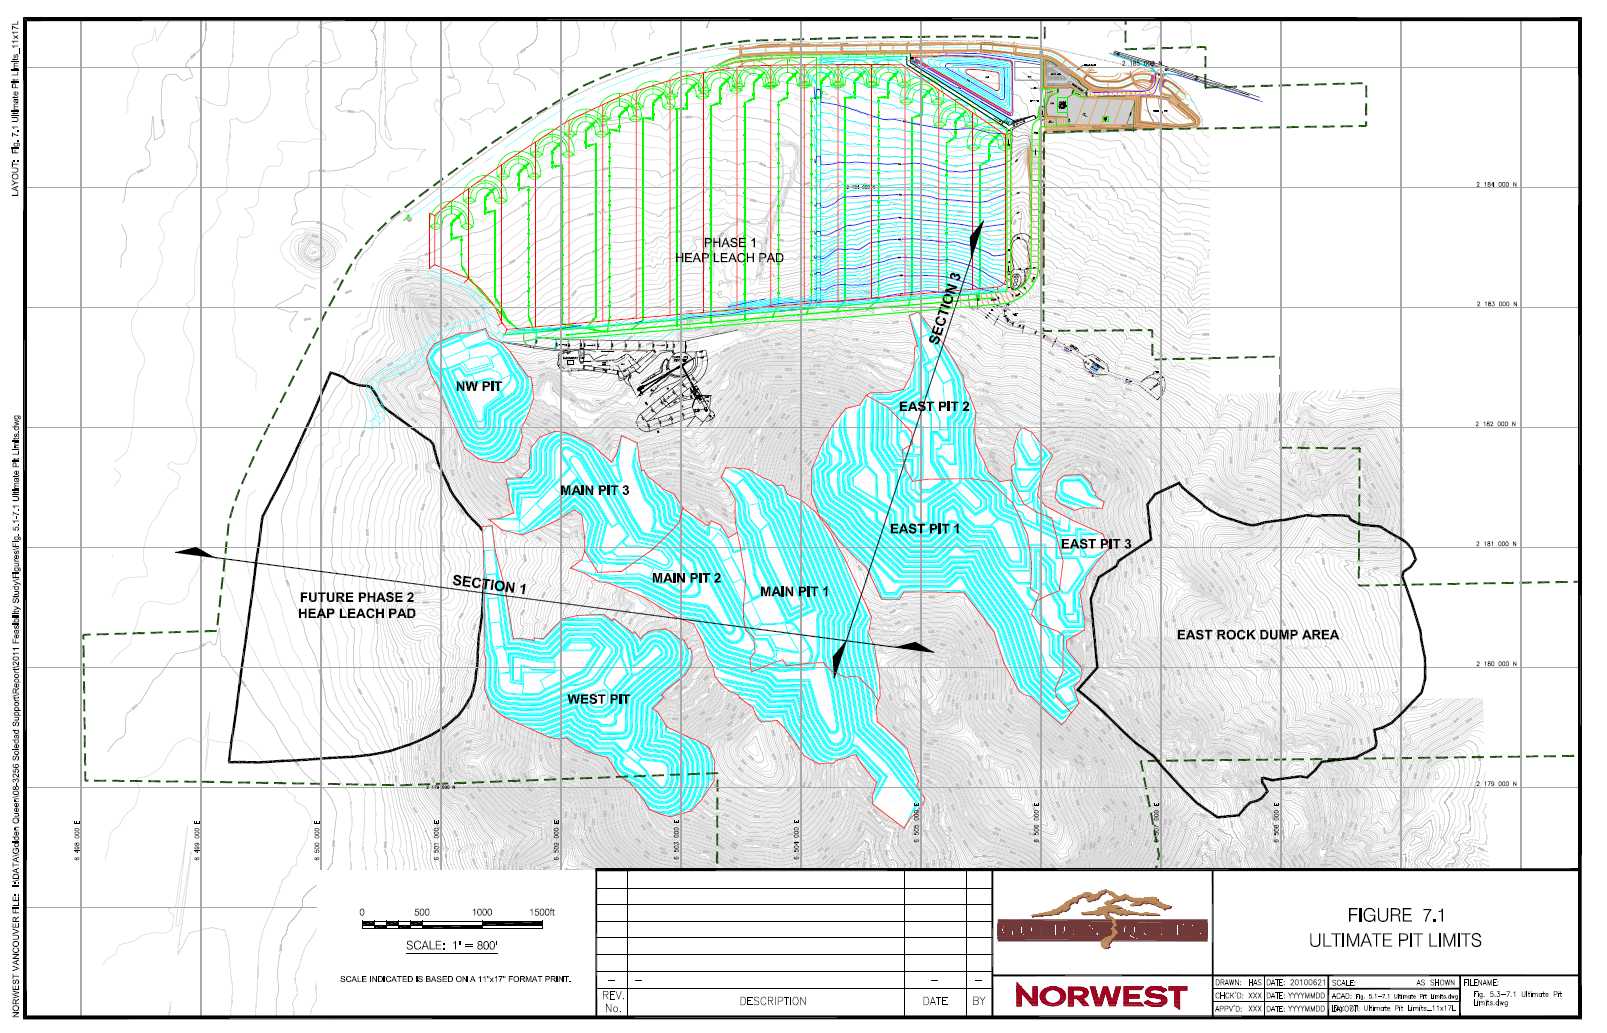
This section describes the mining equipment selected for the Project and reviews the operating parameters and assumptions which were used to estimate equipment productivities and unit requirements over the life of the open pit heap leach operation. Equipment selection was based on Norwest’s current understanding of the pit geology and configuration, required production levels and mining constraints. The current production schedule and pit phasing requires the use of two primary equipment fleets with a smaller development fleet.
The primary fleets would be responsible for the main ore and waste excavation and haulage once initial pit access and development work was completed. The smaller fleet for road building and initial bench development is required over most of the mine life as the multiple pit phases are developed.
The configuration and phasing of the pits requires that the primary loading equipment be mobile and flexible in terms of loading conditions. In addition, the equipment needs to have the capability to mine selectively in order to limit ore loss and dilution while still meeting production targets. With these considerations in mind, Norwest judged that front-end loaders (FEL) would best meet the Project requirements. A loader bucket capacity in the range of 11 cubic metres (15 cubic yards) would allow for sufficient production capacity and selectivity. Based on this selection, the primary mining fleet has been configured as follows:
Primary Mining Fleet
| | • | Loading: | Front end loader 11m3(15 yd3) capacity) (Komatsu WA 800-3 or equivalent) |
| | | | |
| | • | Haulage: | 90t (100 ton) capacity rear-dump truck (Komatsu HD785-7 or equivalent) |
| | | | |
| | • | Drilling: | 175mm (6 ¾ inch) diesel-powered (Atlas Copco DM45 or equivalent) |
A listing of the number of units required is contained in upcoming sections.
Initial mine production and development work is carried out solely by the smaller development fleet during the first nine months of the mine’s life. Once the primary fleet equipment is on site, the main role for the development fleet is the pioneering of access roads and mining of the smaller upper benches and bottoms of the pits. The equipment for this fleet was selected based on its ability to work in tight conditions with limited digging room. In addition, the trucks would be required to operate on relatively narrow roads with higher gradients during initial development. However the development schedule also requires equipment which can achieve relatively high levels of production during some periods of the Project life. Based on these requirements, it was judged that a hydraulic excavator matched with articulated rear-dump haul trucks was suitable. The small drill would also be available for site utility work such as secondary blasting. The equipment fleet chosen to meet these requirements is listed below:
| |
| GOLDEN QUEEN MINING CO. LTD./ 08-3256 |
| SOLEDAD MOUNTAIN FEASIBILITY STUDY |
| 8-1 |
Development fleet
| | • | Loading: | Hydraulic excavator (5 yd3capacity) (Komatsu PC650 or equivalent) |
| | | | |
| | • | Haulage: | Articulated rear-dump truck (40 ton capacity Komatsu HM400 or equivalent) |
| | | | |
| | • | Drilling: | 4 ½ inch dia. percussion drill (Atlas Copco Roc D9-11 drill or equivalent) |
Support equipment for the Project would be required for the following tasks:
Clean-up and support for in-pit waste and ore loading
Movement of waste on rock dumps and resloping of dumps
Maintenance of haulroads
Loading and control of ore stockpiles
Maintenance of mining equipment
Heap leach construction
The exact size and configuration would be finalized at the detailed engineering stage, however the composition of the support equipment fleet is expected to include units of the following type:
Track-type dozers (Komatsu D275 or equivalents)
Motor grader (Komatsu GD655 or equivalent)
Front end loader with tool carrier (CAT 980 w/ attachments or equivalent)
Water wagon for road dust control
Wheel dozer (WD600 or equivalent)
Various maintenance vehicles: lube truck, heavy forklifts, tow truck, flat deck truck
Hydraulic backhoe (Komatsu PC220 class)
Table 8.1 provides a more complete list of necessary support equipment.
| |
| GOLDEN QUEEN MINING CO. LTD./ 08-3256 |
| SOLEDAD MOUNTAIN FEASIBILITY STUDY |
| 8-2 |
TABLE 8.1
LIST OF SUPPORT EQUIPMENT
| Equipment | Model / Notes | Annual NOH | Allocation |
| Utility loader with forks (1) | Cat 980G II | 1,825 | Crushing & Screening |
| Excavator with bucket, thumb & rock breaker (1) | Komatsu PC220LC | 1,095 | Ore Supply |
| Rock breaker (1) | 2,127 ft-lb | 1,095 | Ore Supply |
| Carry deck, hydraulic crane (1) | Broderson IC-250-3A | 365 | Maintenance |
| Pick-up truck - 4*4 (12) | F-150 4*4 | | Various |
| Crew Cab - 4*4 (2) | F-150 Crew Cab | | Mine, Conveying & Stacking |
| Van (1) | E-150 Van | | Administration |
| Cargo van (1) | E-150 Cargo Van | | Administration |
| Maintenance truck (3) | F-350 Cab & Chassis | | Maintenance |
| Deck (3) | Deck for maintenance truck | | Maintenance |
| Welder for maintenance truck (1) | Big Blue Air Pak | 1,095 | Maintenance |
| Boom truck (1) | F-750 Truck | | Mine |
| Skid steer, vertical lift loader with bucket and forks (1) | 2,500 lb capacity | | Crushing & Screening |
| Service truck (1) | F-750 Truck | | Maintenance |
| Fuel/lube truck body for the service truck (1) | Fuel/Lube Truck Body | 2,190 | Maintenance |
| Water Wagon | | 5,280 | Mine |
| Crew bus cab and chassis (1) | F-350 Cab & Chassis | | Mine |
| Crew bus body (1) | Crew bus body | | Mine |
| Track- type dozer (1) | Cat D4G LGP | 2,100 | Solution Management |
| Rubber-tired dozer (1) | WD600-3 | 1,600-4,700 | Mine |
| Track- type dozer (2) | D275AX-5 | 3,600-5,160 | Mine |
| Heap Support vehicle (1) | Polaris 6*6 ATV | 1,460 | Solution Management |
| Forklift for moving grasshopper conveyors (Used) (1) | | 365 | Conveying & Stacking |
| Light plant (4) | Allmand Night-Lite Pro, 10.5 hp | 2,920 | Mine |
| |
| GOLDEN QUEEN MINING CO. LTD./ 08-3256 |
| SOLEDAD MOUNTAIN FEASIBILITY STUDY |
| 8-3 |
| 8.4 | PRODUCTION AND PRODUCTIVITY LEVELS |
| | |
| | 8.4.1 | Operating Parameters |
The production schedule for the Soledad Mountain mine is based on 24 hour year-round operation with shutdowns for major holidays. The feasibility study schedule includes a provision to allow for some weather delays and shutdowns. Based on these assumptions, the total annual scheduled operating days are 351 days. Using the 351 days multiplied by 24 hours schedule results in a total of 8424 scheduled hours per year.
The operational efficiency allows for all other non-maintenance delays. It is planned that the mine will operate on two twelve hour shifts per day. The operating delays which have been assumed for use in calculation of the operating efficiency are as follows:
Morning and evening shift changes with total time of 30 minutes.
Lunch and coffee breaks totalling 60 minutes.
Miscellaneous delay time of 30 minutes.
The delay time incorporates time lost due to blasting delays, waiting on equipment or instructions, and safety meetings. Based on the above time delays, the total operating time per 12 hour shift is 10 hours for an operating efficiency of 83% .
Mechanical availability and utilization values were also estimated for each major piece of equipment in order to calculate their annual net operating hours (NOH). Table 8.2 summarizes these factors and the calculated annual NOH totals by major equipment type.
| |
| GOLDEN QUEEN MINING CO. LTD./ 08-3256 |
| SOLEDAD MOUNTAIN FEASIBILITY STUDY |
| 8-4 |
TABLE 8.2
OPERATING PARAMETERS FOR MAJOR EQUIPMENT
Major Equipment
| Annual
Scheduled
Hours | Mechanical
Availability
| Operating
Efficiency
| Utilization
(%)
| Operating
Hours
|
| Primary Mining Fleet |
| Front End Loader (15 yd3) | 8424 | 88% | 83% | 95% | 5870 |
| Haultruck (100 ton) | 8424 | 92% | 83% | 100% | 6460 |
| Rotary drill (9.75 in.) | 8424 | 85% | 83% | 90% | 5370 |
| Development Fleet |
| Hydraulic Excavator (5 yd3) | 8424 | 88% | 83% | 85% | 5250 |
| Articulated Truck (40 t) | 8424 | 85% | 83% | 95% | 5670 |
| Percussion Drill (3-4 in.) | 8424 | 85% | 83% | 85% | 5070 |
| Mine Support Equipment |
| Grader - bench/roads | 8424 | 85% | 83% | 85% | 5070 |
| Water Truck | 8424 | 85% | 83% | 80% | 4770 |
| Utility Front End Loader | 8424 | 90% | 83% | 80% | 5050 |
| Leach Pad Dozer | 8424 | 85% | 83% | 85% | 5070 |
| Pit / Dump Dozer | 8424 | 85% | 83% | 85% | 5070 |
* Data for major equipment provided by manufacturer. Other parameters based on Norwest internal database.
| | 8.4.2 | Equipment Productivity |
Estimates have been prepared for equipment production and productivity based on the feasibility level mine layout and Norwest’s current understanding of planned production targets and plant capacity. Productivity levels have been evaluated based on the following mining parameters:
6m (20ft) bench heights for ore and waste loading.
24 hour production, two 12 hour shifts, 351 operating days per year.
85% or higher availability on major equipment (as shown in Table 8.2).
| | 8.4.2.1 | Loading Unit Productivity |
The loading unit productivities for the primary mine fleet loaders and the hydraulic excavator used for the development fleet were calculated using manufacturer data guided by engineering judgement and Norwest’s internal operations database. An average productivity was used for the loading equipment based on the factors shown in Table 8.3. Factors were chosen which were deemed to be representative of normal loading conditions with average operators. During initial start-up, productivity might be somewhat lower as operations personnel become familiar with the equipment and mining configuration.
| |
| GOLDEN QUEEN MINING CO. LTD./ 08-3256 |
| SOLEDAD MOUNTAIN FEASIBILITY STUDY |
| 8-5 |
TABLE 8.3
LOADING EQUIPMENT PRODUCTIVITY
| Parameter | Units | FEL (15 yd3) | Excavator (5 yd3) |
| Loading Equipment | | | |
| Bucket Capacity | Loose yd3 | 14.4 | 3.5 |
| Bucket Capacity | Tons | 21.6 | 5.25 |
| Bucket Fill Factor | % | 90% | 90% |
| Loaded bucket | Bank yd3 | 10 | 2.4 |
| Bucket Payload | Tons | 19.5 | 4.7 |
| Haulage Equipment | | Haultruck | Articulated Truck |
| Truck capacity | Loose yd3 | 65 | 25 |
| Truck maximum payload | Tons | 100 | 40 |
| No. of passes | | 5 | 8 |
| Truck loaded payload | Tons | 97.2 | 37.8 |
| Loading Cycle | | | |
| Loading unit cycle time | Minutes | 0.75 | 0.58 |
| Spot time | Minutes | 0.5 | 0.5 |
| Loading time | Minutes | 3.8 | 4.7 |
| Total cycle time | Minutes | 4.3 | 5.2 |
| Loading Cycles / NOH | Cycles/NOH | 11.6 | 9.6 |
| Fully Trucked Productivity | tons/NOH | 1,125 | 360 |
*Assumed material specific gravity 1.95 ton/yd3. Only imperial units shown in order to simplify table.
The loading equipment productivity estimates are based on the assumption that trucks are always available for loading which will not be the case under real operating conditions however with proper planning and supervision, productivity levels near these estimates should be achievable.
In order to meet the targeted production levels, the mine plan relies on having sufficient truck capacity to maintain the productivity of the loading units. The changing configuration of the mine over the project life means that haul distances for both ore and waste will vary significantly and subsequently the truck fleet requirements will also vary. There are periods in the mine’s life with the existing truck fleet will need to be supplemented with 1-2 contracted truck units. Given the size of the Primary fleet trucks is relatively common and the location of the mine, the assumption that sufficient trucks will be available on a short-term basis is deemed reasonable.
| |
| GOLDEN QUEEN MINING CO. LTD./ 08-3256 |
| SOLEDAD MOUNTAIN FEASIBILITY STUDY |
| 8-6 |
Haul cycles for ore and waste were developed on a quarterly basis for the first three years of the mine life and then on a yearly basis for the remainder of the project. Truck hours were calculated by conducting load and haul simulations utilizing vendor supplied software (TalPac). The resulting cycle times were then used in conjunction with the scheduled ore and waste volumes to determine the truck productivity values and fleet size. Speed limits of 40 km/hour (25 mph) on main haul roads, 30 km/hour (20 mph) on switchbacks and near the shovel and dumps were imposed on the haul fleet. Table 8.4 shows typical haul cycles and minimum number of trucks needed (rounded up).
TABLE 8.4
TYPICAL YEARLY CYCLE TIMES FOR CAT 777
Year
| Ore Haul Time
(min) | Waste Haul
Time (min) | Number of Trucks
Needed (90t) |
| 0 | 0 | 0 | 0 |
| 1 | 8.6 | 12.8 | 7 |
| 2 | 8.76 | 15.9 | 7 |
| 3 | 5.27 | 12.4 | 7 |
| 4 | 13.02 | 9.7 | 7 |
| 5 | 7.8 | 12.1 | 7 |
| 6 | 13.5 | 2.9 | 7 |
| 7 | 11.7 | 5.8 | 7 |
| 8 | 12.9 | 13.8 | 7 |
| 9 | 5.71 | 23.7 | 9 |
| 10 | 10.2 | 3.6 | 7 |
| 11 | 8.2 | 8.4 | 7 |
| 12 | 9.5 | 18.5 | 5 |
*Note – Year 12 does not include trucks required for backfill operations.
Due to longer haulage distances during certain periods of the mine’s life, contracting of 1-2 additional haul trucks will be required to meet production targets as shown in Table 8.4, Year 9. Contracting of the 90t (100 ton) capacity trucks is not expected to be a significant issue given the widespread use of this size of truck by civil and mining contractors.
| |
| GOLDEN QUEEN MINING CO. LTD./ 08-3256 |
| SOLEDAD MOUNTAIN FEASIBILITY STUDY |
| 8-7 |
| 8.5 | MINE EQUIPMENT SCHEDULE AND PRODUCTION ESTIMATES |
Based on these assumptions, the estimated monthly production capacity for each fleet is shown in Table 8.5 below. It should be noted that the production estimates shown represent production for each fleet and not the combined production of all fleets.
TABLE 8.5
FLEET PRODUCTION RANGES
Fleet
| # of Fleets at Full
Production | Material Moved
(ktons / year) |
| Primary Mining Fleet | 2 | 5,200 – 7,000 |
| Development Fleet | 1 | 540 - 1,500 |
These production levels represent production capacities based on the feasibility level mine plan which requires some assumption of typical conditions over the mine life. As more detailed mine planning and evaluation work is completed, and experience is gained during small mine operations, more accurate productivity estimates for specific conditions can be made. In addition, production levels will vary as mining progresses throughout the property due to a variety of factors including changing pit geometries, haul distances, production constraints and other factors.
| |
| GOLDEN QUEEN MINING CO. LTD./ 08-3256 |
| SOLEDAD MOUNTAIN FEASIBILITY STUDY |
| 8-8 |
| 9 | ORE HANDLING, CRUSHING AND SCREENING |
| | |
| 9.1 | ORE HANDLING OVERVIEW |
Ore mined from the pits will be transported to the crushing-screening plant located south of the Phase 1 heap leach pad by haul trucks. A crushing-screening plant flow sheet is shown in Figure 9.1.
Ore will be delivered directly to the primary crusher when possible; otherwise the ore will be stockpiled adjacent to the primary crusher or in temporary stockpiles within or adjacent to the pits. When ore is not being mined from the pits, a front end loader will reclaim the ore from the stockpile and feed it to the primary crusher. The average feed rate to the primary crusher is 737 t/h (811 ton/h) based upon an average design production rate of 13,270 tonnes (14,600 tons) per day.
From the primary crusher ore will be stockpiled in a coarse ore stockpile. This will allow a more steady flow to the secondary and tertiary crushing system, and the conveying and stacking system.
From the coarse ore stockpile, ore will be reclaimed by feeders and conveyed to the secondary cone crusher, then the high-pressure grinding roll (HPGR) tertiary crusher. From the crushers ore will be conveyed to a fine ore stockpile and then to the heap leach pad and placed on the pad by a stacker. Agglomeration of the ore will be achieved with plows on the grass hopper conveyors.
| 9.2 | CRUSHING AND SCREENING |
The crusher settings and screen openings may be adjusted from those given in the following paragraphs during operations and they may vary depending upon the type of ore being crushed.
| | 9.2.1 | Crushing-Screening Plant |
AMEC Americas Limited (AMEC), an engineering company with extensive experience in the design of crushing-screening plants, has completed a detailed design of the crushing-screening plant and this is shown in plan and section in Figure 9.2 (AMEC, 2011).
Allowance has been made in the design of the crushing-screening plant for two seven-day shutdowns per year to replace the HPGR tires. This therefore allows for 351 operating days per year. The mechanical availability of the HPGR is expected to be > 95 % and the operating availability of the secondary crushing-screening plant and HPGR is expected to average a minimum of 85 %. The assumed overall availability is only 82 % and this can be achieved with good maintenance practices. The number of operating hours available for the crushing-screening plant is therefore 6,880 h per year.
The primary crusher will not be operating once the coarse ore stockpile is full, e.g. when the crushing-screening plant is down for maintenance. The maximum feed rate to the primary crusher is 800 t/h (880 ton/h) as per the AMEC design. The required feed rate to the primary crusher based upon a production rate of 4,654,000 t/y (5,119,000 ton/y) and 18 hours of crushing per day for 351 d/y is 737 t/h (811 ton/h). The number of operating hours available for the primary crusher is 6,318 h/y.
| |
| GOLDEN QUEEN MINING CO. LTD./ 08-3256 |
| SOLEDAD MOUNTAIN FEASIBILITY STUDY |
| 9-1 |
Note that the size of the primary jaw crusher will be reassessed and increased in throughput capacity before the start of construction to provide greater flexibility to the ore haul. An increase in the size and capacity of the jaw crusher will only entail a nominal increase in capital costs for the crusher and will not significantly affect capital costs for the crusher system.
Two hours will be required per crushing-screening plant operating day for heap conveyor and stacker moves - estimated at 597 h/y. Major conveyor and stacker moves will be scheduled to coincide with downtime in the crushing-screening plant for maintenance. The number of operating hours available for the heap conveyors and stacker per year is therefore 6,318 hours.
The following are the key design and operating parameters:
| Available hours in a full year of production | h | 8,760 |
| Operating time for the primary crusher and coarse ore conveyors | h/y | 6,318 |
| Overall availability of the primary crusher | % | 72.1 |
| Design feed rate to the process | ton/h | 715 |
| Operating time for the crushing-screening plant | h/y | 6,880 |
| Overall availability of the crushing-screening plant | % | 81.7 |
| Operating time for the conveyors and stacker | h/y | 6,563 |
| Overall availability of the conveyors and stacker | % | 74.9 |
Note that the average ore mining rate based upon 351 days of mining per year is 12,000 t/day (13,225 tons) of ore per day or 4.22 million tonnes or 4.64 million tons of ore per year based upon the current Norwest schedule.
The design nominal annual throughput is 4,654,000 tonnes or 5,119,000 tons per year and that is the rate used for the design and quote for construction by Turn-Key Processing Solutions, LLC.
In years of higher ore production, it should be possible to increase the throughput of the plant by adjusting the plant operating parameters. Peak years with production of approximately 5 million tons of ore per year are planned in Years 7 and 8 of the current schedule.
The following are the key components of the plant:
| |
| GOLDEN QUEEN MINING CO. LTD./ 08-3256 |
| SOLEDAD MOUNTAIN FEASIBILITY STUDY |
| 9-2 |
A. Coarse Ore Stockpile
To the extent practical the crushing-screening plant has been buffered from the mining and heap conveying-stacking operations by providing stockpiles (the coarse ore stockpile and the fine ore stockpile) which provide surge capacity. The coarse ore stockpile has a live capacity of 7,500t (8,250 tons) which provides feed for a half day of plant production.
B. Coarse Ore Feeders
Ore will be fed to the primary screen by two Syntron-type vibratory feeders located in the reclaim tunnel. The number of feeders has been selected to ensure adequate live capacity in the coarse ore stockpile. Access to the feeders under the coarse ore stockpile is available from two directions for maintenance and cleanup.
C. Secondary Screen
The secondary crushing stage, which includes the primary screen and the cone crusher, has been specifically designed to prepare the feed for the HPGR. A single screen will be required and this will operate in closed circuit with the cone crusher. The screen undersize is 32 mm (1 ¼ inch) and this will be the HPGR feed.
A distributor will be required at the feed point to ensure good distribution of the feed across the width of the screen and this has been included in the design. The screen has also been specified with a dust enclosure. Consistent feed with no oversize will be the key to a long life of the HPGR tires.
D. Secondary Crusher
A single cone crusher will be required as a secondary crusher. Analysis completed by Sandvik Rock Processing (Sandvik) shows that the model CH660 cone crusher can do the duty and has therefore been selected for the Project.
E. Fine Ore Bin
The screen undersize will be conveyed to a fine ore bin with a capacity of 200t (220 tons). Ore will be drawn from the fine ore bin by a Syntron-type vibratory feeder.
F. Binder Addition
Cement will be added as a binder to the feed ahead of the HPGR. The intent is to ensure adequate mixing of the cement with the feed.
| |
| GOLDEN QUEEN MINING CO. LTD./ 08-3256 |
| SOLEDAD MOUNTAIN FEASIBILITY STUDY |
| 9-3 |
G. HPGR
The layout considerations for the HPGR were an important element in the overall layout of the plant and this was done in extensive consultation with Polysius.
The HPGR feed conveyor will have a width 1.1 times the width of the HPGR tires, and the feed will flow in line with the rolls to minimize the risk of segregation, as per recommendation by Polysius.
H. Fine Ore Stockpile
The fine ore stockpile was included in the circuit to provide flexibility in the operation of the plant. The live capacity of the fine ore stockpile must be large enough to permit the operators to move and reposition the heap conveyors and the stacker every day without interrupting the operation of the plant and especially the HPGR. The current estimate is that repositioning of the heap conveyor-stacker system will require two hours per day on average. The fine ore stockpile will have a minimum live capacity of 3,300 tons which provides capacity for approximately four hours of plant production
I. Weightometers
A weightometer will be installed ahead of the secondary screen and cone crusher to control the feed to the screen and the cone crusher and to record the total throughput. The weightometer will be installed in the conveyor tunnel.
Additionally a weightometer will also be installed ahead of the HPGR to control cement addition and water addition rates.
J. Self-cleaning Magnets
Self-cleaning magnets and metal detectors will be installed to protect the coarse ore stacker conveyor, the primary screen and the cone crusher and on the HPGR feed conveyor to protect the HPGR.
| | 9.2.2 | Description of the HPGR |
Assessments carried out by Polysius and GQM’s internal review have shown the indicated benefits of using the HPGR could include:
| |
| GOLDEN QUEEN MINING CO. LTD./ 08-3256 |
| SOLEDAD MOUNTAIN FEASIBILITY STUDY |
| 9-4 |
Stronger agglomerates due to a more favorable overall particle size distribution and this will also impact the flow rate of solutions through the heap.
Substantially lower capital costs than a four-stage, conventional crushing-screening plant.
Manageable dust control with fewer transfer points.
Lower energy consumption and thus lower operating costs.
Circuit flexibility that will readily permit future upgrades such as a finer HPGR feed size or the recycle of edge product.
The HPGR consists basically of two counter-rotating rolls – one a fixed roll and the other a ‘floating’ roll. The ‘floating’ roll is mounted on and can move freely on two slides and the grinding forces are applied by four hydraulic rams. Ore is choke-fed to the gap between the rolls and comminution takes place by inter-particle crushing in the bed of particles. The gap between the rolls is determined by the nip-in characteristics of the feed and the total grinding force applied, which in turn depends upon the pressures in the hydraulic system. Each roll is driven by an electric motor via a planetary gear reducer.
The total grinding force can range from 750 kN to 20,000 kN and pressures in the gap can range from 50 MPa (approximately 7,000 lb/in2) to 250 MPa (approximately 36,000 lb/in2). The unconfined compressive strengths of Soledad Mountain ores range from 2.2 MPa (320 lb/in2) to 118.9 MPa (17,200 lb/in2) by comparison.
Comminution in the HPGR is achieved without impact and essentially without attrition of the wear protection on the surface of the rolls.
The HPGR is an energy efficient comminution device and power consumption will be lower than power consumption projected in the 1990s.
The following are the HPGR technical specifications for the Project:
| |
| GOLDEN QUEEN MINING CO. LTD./ 08-3256 |
| SOLEDAD MOUNTAIN FEASIBILITY STUDY |
| 9-5 |
TABLE 9.1
HPGR TECHNICAL SPECIFICATIONS
| General | Units | Polysius |
| Model No. | | POLYCOM 17/12-5 |
| Diameter of rolls (D) | mm | 1,740 |
| Width of rolls (W) | mm | 1,200 |
| Aspect Ratio | W/D | 0.670 |
| Required Throughput | t/h (Dry) | 650 |
| Design Throughput | t/h (Wet) | 750 |
| Maximum Recycle | % | 13 |
| Maximum Recycle | t/h (Wet) | 100 |
| Design Specific Press Force | N/mm2 | 4.98 |
| Operating Specific Press Force | N/mm2 | 4.50 |
| Specific Throughput (Wet Basis) | ts/hm3 | 230 |
| Specific Energy Input | kW.h/t | Maximum Available 2.67 |
| Product Size | | 70% < 6mm |
| Roll Speed | rpm | 20 |
| Circumferential Speed | m/s | 1.82 |
| Feed Moisture Content | % | Range from 3% to 5% |
| Feed Size | mm | 100% - 35 |
| Drive Train | | |
| Motor Size (2 Required) | hp/kW | 1,250/933 |
| Motor Speed (Nominal) | rpm | 1,200 |
| Gear Reducer | | Planetary Gear Reducer |
| Roller Bearings | | Self-aligning Roller Bearings |
| Roller Bearing Lubrication | | Grease-lubricated Bearings |
| Tires | | |
| Wear Life of Tires | h | 5,000 |
Further details of the HPGR unit can be found in the documentation provided to GQM by Polysius (see reference section for further information).
| |
| GOLDEN QUEEN MINING CO. LTD./ 08-3256 |
| SOLEDAD MOUNTAIN FEASIBILITY STUDY |
| 9-6 |
A sampler will be fitted to the discharge end of the HPGR product conveyor. The HPGR product will be sampled on a frequent basis to provide ore grade information and the information required to monitor the performance of the HPGR:
HPGR product particle size distribution.
HPGR product moisture content.
Gold and silver head grades.
| | 9.2.4 | Construction & Commissioning Of the Crushing-Screening Plant |
A design-build concept will be considered in an effort to reduce the capital cost of the project. Note that a contractor, Turn-Key Processing Solutions, LLC, has provided a quotation for construction of the crushing-screening plant based upon the design done by AMEC.
The crushing-screening plant is a relatively simple plant and it is expected that it can be commissioned by the operators with the assistance of Turn-Key Processing Solutions, LLC, equipment suppliers and specifically Polysius. An allowance for this support has been included in the capital cost estimates.
Management will consist of 1 plant operations manager who will work 8 h/d for 5 d/week. The operating crew will consist of 2 plant operations foremen and 4 primary crusher operators, 4 crushing-screening plant operators and 4 helpers who will work a continuous shift schedule.
A shift crew of 4 heap leach operators will work a continuous shift schedule. The heap leach operator will control the operation of the stacker and conveyors on shift. The heap leach operator will be assisted on day shift by a utility loader/forklift/Hiab operator and a helper to move conveyors and pipe and drip emitters and generally manage the operation of the heap. These 2 operators per shift or a total of 4 operators will work a continuous shift schedule.
Polysius has done a detailed design of the commercial HPGR, which will have the ability to operate with a specific press force of 4.5 N/mm2 (637.5lb/inch2 )as the key operating parameter. The projected recoveries are based on an operating Specific Press Force of 4.0 N/mm2 (586.5lb/inch2) for pyroclastics and quartz latite and 4.5 N/mm2 for rhyolite. The design of the HPGR is evolving and an operating specific press force of > 5.0 N/mm2 (733.1lb/inch2) may be possible by the time the mine goes to production.
| |
| GOLDEN QUEEN MINING CO. LTD./ 08-3256 |
| SOLEDAD MOUNTAIN FEASIBILITY STUDY |
| 9-7 |
The following are comments on operating parameters:
| | 9.2.6.1 | Specific Press Force |
A detailed analysis of the recoveries obtained in HPGR-based column leach tests shows that tails and recoveries are affected by specific press force. A higher specific press force gives a finer overall particle size distribution and leads to a greater density of micro-cracks and this will directly affect tails and thus recoveries. The conclusion is that the specific press force is the determining operating parameter in an application of the HPGR as the comminution equipment.
| | 9.2.6.2 | Particle Size Distribution |
The importance of particle size distribution and the proportion of fine material in the HPGR product must be emphasized and systematic sampling and screen analysis will be required to check this. It is expected that target particle size distributions will be developed for various ore types and this will be one way of controlling the commercial operation on a day-to-day basis. A tails target for gold can also be calculated from the tails analysis and this can be set as the key check on the overall performance of the system.
The actual plant throughput will be determined by the following:
Fragmentation achieved in the open pit.
Vibrating grizzly feeder bar spacing - tapered bar spacing 150 mm to 100 mm (6 inch to 4 inch) and this will determine the proportion of feed bypassing the jaw crusher.
The closed side setting (CSS) of the primary jaw crusher – 150 mm (6inch).
The CSS of the cone crusher – 22 mm for the CH660 crusher.
The screen undersize – 100 % - 32 mm (1 ¼ inch).
The HPGR settings such as the specific press force.
The ‘Mine to Mill’ concept will be used.
The crushing-screening circuit has considerable flexibility built into it and the settings may differ for the different ore types and this will yield better results than a traditional circuit with vertical shaft impact crushers and screens to size the ore. Adjustments can be made in various settings as required based upon operating experience for optimum leach performance.
| |
| GOLDEN QUEEN MINING CO. LTD./ 08-3256 |
| SOLEDAD MOUNTAIN FEASIBILITY STUDY |
| 9-8 |
| | 9.2.6.3 | Recycle Of Edge Product |
Indications are that finer particle size distributions and thus higher recoveries can be obtained for rhyolite if, for example, a specific press force of 4.5 N/mm2 is combined with a 15 % edge product recycle. The recycle of edge product has not been included in the plant as presently designed. Allowance has however been made for an edge recycle in the layout and design of the HPGR footings.
Considerations that were made relating to the decision to not include edge product recycle in the initial crushing-screening plant include:
Simpler circuit layout and therefore lower construction and operating costs.
Less risk of particle segregation.
Less risk of stray metal in the circuit.
Reduced requirement for dust control as two transfer points can be eliminated.
The contribution an edge recycle can make to overall recoveries should however not be ignored and this will be more important at higher gold and silver prices and essentially fixed operating costs. External reviewers have also noted that the edge effect could be more pronounced in a commercial operation. It will be prudent to allow for an edge recycle in the layout and the design of the crushing-screening plant. The equipment will however not be purchased during the initial construction. The plant and the HPGR can be commissioned to gain some operating experience. Also, some very quick and early tests can be done to determine the particle size distribution produced by the commercial unit and this will give an indication of recoveries that can be expected. The decision can then be made on the edge recycle and with only limited lost benefits. A total retrofit could, on the other hand, be very expensive to develop and install.
Indications are that a 15 % edge recycle has the same effect as reducing the HPGR feed size from 100 % - 32 mm (1 ¼ inch) to 100 % - 25 mm (1 inch). Reducing the HPGR feed size may have a greater affect at the coarser particle sizes and this may be the preferred approach in a commercial operation rather than adding additional material at the finer particle sizes, as would be the case with an edge product recycle. Discussions with Sandvik show that there is adequate capacity to reduce the particle size distribution of the cone crusher discharge by changing the closed side setting.
The decision to reduce the HPGR feed size can again be deferred until a detailed analysis can be made on the basis of actual performance after the start of production.
| |
| GOLDEN QUEEN MINING CO. LTD./ 08-3256 |
| SOLEDAD MOUNTAIN FEASIBILITY STUDY |
| 9-9 |
Both options described above can however be introduced with minimal changes in the crushing-screening plant configuration. These considerations must be balanced against the need for a stable heap and acceptable solution percolation rates.
It may be necessary to add moisture to achieve a minimum moisture content of greater than 3 % to the HPGR feed to ensure that a competent autogeneous layer is formed and maintained between the studs on the rolls. A moisture content ranging from 4 % to 5 % may be optimum and 6 % to 7 % is possibly be too high based upon romcoms expressed by Polysius..
| 9.3 | LEACH PAD OPERATIONS |
| | |
| | 9.3.1 | Design of the Facilities |
GQM commissioned Golder to finalize the design of the Phase 1 heap leach pad (Golder, Dec. 2010, Apr. 2011) and to do a conceptual design of the potential Phase 2 pad. The site layout with the Phase 1 pad at full capacity is shown in Figure 9.3.
Terra Nova Technologies, Inc. (TNT), San Diego did a stacking study and designed the heap conveying and stacking system. A schematic layout of the Phase 1 heap is shown in Figure 9.4.
The Phase 1, Stage 1 heap leach pad as designed in 2006 would require that a portion of the historical tailings would be handled twice. This would create possibly unmanageable dust that must be avoided. An alternative construction sequence was therefore selected as described below and a revised design report was prepared by Golder and submitted to GQM in December 2010 to reflect this change and other changes, which had been made to the Project since 2007.
The Phase 1 heap leach pad has an area of 797,400 m2 or 8,580,000 ft2 and this has been divided into 3 stages, viz. Stage 1 (5cells), Stage 2 (6 cells) and Stage 3 (6 cells) as shown in Figure 9.4. The following is the lined area and capacity for each stage:
| | ft2 | tons | tonnes |
| Stage 1 | 2,900,000 | 13,000,000 | 11,800,000 |
| Stage 2 | 3,450,000 | 23,100,000 | 20,900,000 |
| Stage 3 | 2,230,000 | 13,900,000 | 12,600,000 |
| Total | 8,580,000 | 49,900,000 | 45,300,000 |
A specific weight of 1.36 t/m3 (85.0 lb/ft3) has been used to determine the quantities of ore on the heap. Considerably higher specific weights were determined by consolidation-percolation tests performed in a number of laboratories. It is therefore expected that approximately 48.5 million tonnes (53.3 million tons) of ore as per the current Norwest design can be crushed and stacked on the Phase 1 heap leach pad.
| |
| GOLDEN QUEEN MINING CO. LTD./ 08-3256 |
| SOLEDAD MOUNTAIN FEASIBILITY STUDY |
| 9-10 |
Phase 1, Stage 1 will be stacked 5 cells wide and a maximum of 5 lifts high for a total of approximately 8 million tonnes (9 million tons) based upon the TNT design. Note that ore mined in the first 3 years of the Norwest schedule is approximately 10.5 million tonnes (11.6 million tons).
An ultimate heap height of 60 m (200 ft nominal) has been used for the design of the heap. Individual lifts have been designed for 10 m (33 ft) nominal in height. The lifts will be benched to create on overall slope of 2.5H:1V along the north, northwest and east sides and 2H:1V on the south and southwest sides of the pad (Golder, 2010).
The layout of the heap permits stacking in rectangular panels and this will lend itself to a straightforward conveyor stacking system. The lifts will be benched to achieve the overall design slopes.
A perimeter access road is included and this is 6 m (20 ft) wide with safety berms. The road width allows for the near-pad side offset for the liner system anchor trench.
Design work was also carried out at the conceptual level for a second heap leach pad (Phase 2 pad) which would provide capacity for potential future mine expansion. The Phase 2 heap leach pad covers an area of approximately 0.37 million square meters (4 million square feet) and has a nominal capacity of 23 million tonnes (25 million tons) of ore. The current mine plan does not require construction of any of the Phase 2 pad.
Note again that a specific weight of 1.36 t/m3 (85.0 lb/ft3) has been used to determine the quantities of ore on the heap. This makes no allowance for self-compaction of ore at maximum heap height. Information on the experience at the Coeur Rochester Mine shows an increase in specific weight of greater than 20% under self-compaction at a heap height of 60 m (200 ft) for the lower lifts. Test work done by Golder on leached residues of low-grade and high-grade rhyolite samples from Soledad Mountain shows an average increase in specific weight of 13% above 85.0 lb/ft3, at 30 m (100 ft) heap height. An increase in specific weight of approximately 15 % within the central portion of the heap leach would increase the placed ore specific weight to 1.56 t/m3 (97.5 lb/ft3) which in turn would increase in the capacity of the heap to approximately 48.4 million tonnes (53.3 million tons), which would be sufficient for the life of the mine as presently defined. Based on the site specific test data and regional experience, the expectation of this level of load induced compaction is deemed reasonable.
Phase 1, Stage 1 of the heap leach pad and the overflow pond and other supporting features will be constructed in Year 0. Stage 2 will be constructed in Year 3 of production. Stage 3 will be constructed in Year 7 or Year 8 depending upon the actual ore mining rate and the overall performance of the heap. The cost of constructing Stage 1 has been included in the Project capital cost while the cost of constructing Stage 2 and Stage 3 has been included in the Sustaining Capital.
| |
| GOLDEN QUEEN MINING CO. LTD./ 08-3256 |
| SOLEDAD MOUNTAIN FEASIBILITY STUDY |
| 9-11 |
Each stage is divided into hydraulically isolated zones in order to allow for proper sequencing of construction and leaching activities.
Allowance for a future Phase 2 heap leach pad on the west side of the site has been made in the event that the mine’s life or production levels are increased. The area available on top of the Phase 1 heap is also large enough that some additional ore could be placed on the heap if stacked ore permeabilities will permit.
GQM retained AMEC to do detailed engineering for the pump box, pumps and pipeline to convey solutions from the pump box to the Merrill-Crowe plant. The agreement with AMEC was signed on August 16, 2010.
The design was done with close interaction between AMEC engineers, engineers familiar with conditions on site and GQM management. A strategy for the operation of the system is set out in a memorandum dated December 3, 2010 and this note, a set of drawings and cost estimates are available in the GQM offices in Vancouver.
The pump box has been placed below grade and the inlet of the pump box mirrors the cross-section of the solution conveyance channel. Golder has designed a liner system for the pump box to ensure full containment of solutions.
The pump box overflows to the overflow pond via a lined channel. Solutions will be returned from the overflow pond to the pump box with a sump pump.
Two pumps will initially be required to pump the pregnant solution to the Merrill-Crowe plant. Only one of the pumps will be in use at any one time and the second pump will be a backup pump. Vertical turbine pumps have been selected.
The layout for Phase 1, Stage 1 of the heap leach pad has been designed to be compact and this allows for the short length of the lined channel to route solutions to the pump box.
Golder determined the size of the overflow pond based upon the water balance for the Project –121,000 m3 (32 million gallons). This capacity is adequate to contain heap drain-down and runoff from storm events and includes 0.5 m (2 ft) of freeboard. The pond is double-lined and includes a leak detection and leakage recovery system. The layout ensures that the pond will receive all spills from processing operations and overflows from the pump box. The overflow pond is not expected to discharge; however an emergency overflow has been included on the north side of the pond.
| |
| GOLDEN QUEEN MINING CO. LTD./ 08-3256 |
| SOLEDAD MOUNTAIN FEASIBILITY STUDY |
| 9-12 |
Water can initially be stored in the pond to provide a reserve of water required for irrigating the heap during the start-up of the operation.
An allowance has been made for a diesel-powered generator to provide standby power and this will be located beside the Merrill-Crowe plant. The standby generator will power the pregnant, barren and recycle solution pumps in case of a power outage.
GQM will also purchase a diesel-powered pump to be installed at the pump box to provide a secondary backup. Diesel powered pumps are also available for rent/lease from suppliers in Bakersfield in the event of an emergency. Pumps with the capacity to handle barren and recycle solution flows can be brought to site in a matter of hours if required.
The available Phase 1 heap leach pad area has been divided into 17 cells with 5 cells in Stage 1, 6 cells in Stage 2 and 6 cells in Stage 3. Individual cells are rectangular and this layout allows for a simple and efficient stacking system. Ore will be stacked in lifts of 10 m (33 ft) in height, 80 m (262 ft) in width for a total of six lifts to the ultimate heap height allowed for in the design of 60 m (200 ft). The size of each cell and lift has been made as large as possible to limit the total number of cells and lifts and thus the cumulative activity on the heap. This is being done to limit the inevitable traffic induced compaction that will be experienced prior to leaching.
TNT has designed the conveyors and the stacker to convey up to 1,100 ton/h and retreat stacking will be performed. Details of the TNT design are contained in their report submitted to GQM (see reference section). The conveying and stacking system is a traditional fixed pad, multiple lift, portable stacking system.
Ore will be drawn from the fine ore stockpile by a Syntron-type vibratory feeder and conveyed on the overland conveyor. Ore on the overland conveyor will subsequently be dumped on the tail end of a series of portable ramp conveyors via a rubber-tired tripper. Then the ore will be conveyed to the top of the heap and dumped on the tail end of a string of standard portable conveyors, which will in turn convey the ore to the horizontal feed conveyor system, and ultimately the radial stacker. The overland conveyor will be approximately 1,100 m (3,600 ft) long and run along the south side of the Phase 1 heap leach pad.
Barren solution will be used to wet the ore at a location on the heap leach pad so as to provide containment of the cyanide solution. The belt plows will be installed on the first three grasshopper conveyors to provide a mixing (agglomeration) of the barren solution, ore and cement. Barren solution addition rate will be controlled with a valve and linked to a weightometer. The target moisture content for the wetted ore to be stacked on the heap is 8 %.
| |
| GOLDEN QUEEN MINING CO. LTD./ 08-3256 |
| SOLEDAD MOUNTAIN FEASIBILITY STUDY |
| 9-13 |
An operator will be required to operate the stacker. TNT experience shows that this will give better operating results than an automated system.
The following support equipment will be provided for work on the heap:
A Polaris 6x6 ATV - This will be used by the operators to transport tools and smaller operating supplies.
A Cat D4G LGP dozer (or equivalent) – The dozer will be used to level the surface before prior to placement of drip lines, scarifying the surface prior to stacking additional ore lifts.
A used forklift – This will be used to move the grasshopper conveyors.
No specialized belt handling equipment will be required.
| |
| GOLDEN QUEEN MINING CO. LTD./ 08-3256 |
| SOLEDAD MOUNTAIN FEASIBILITY STUDY |
| 9-14 |
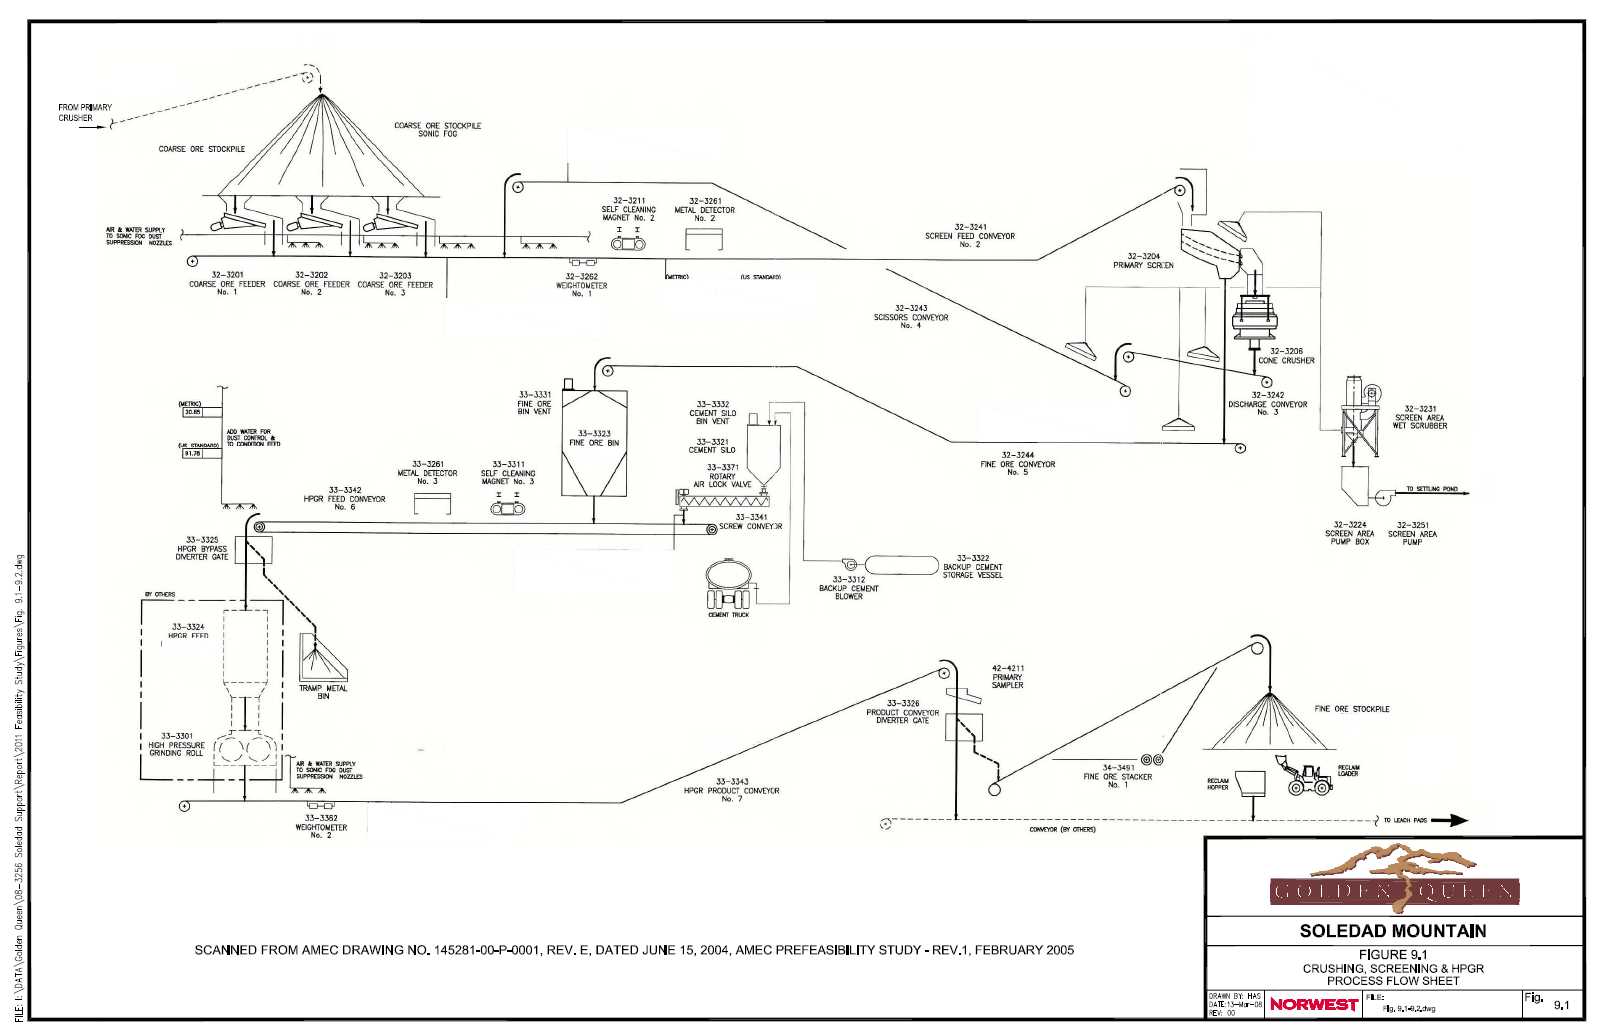

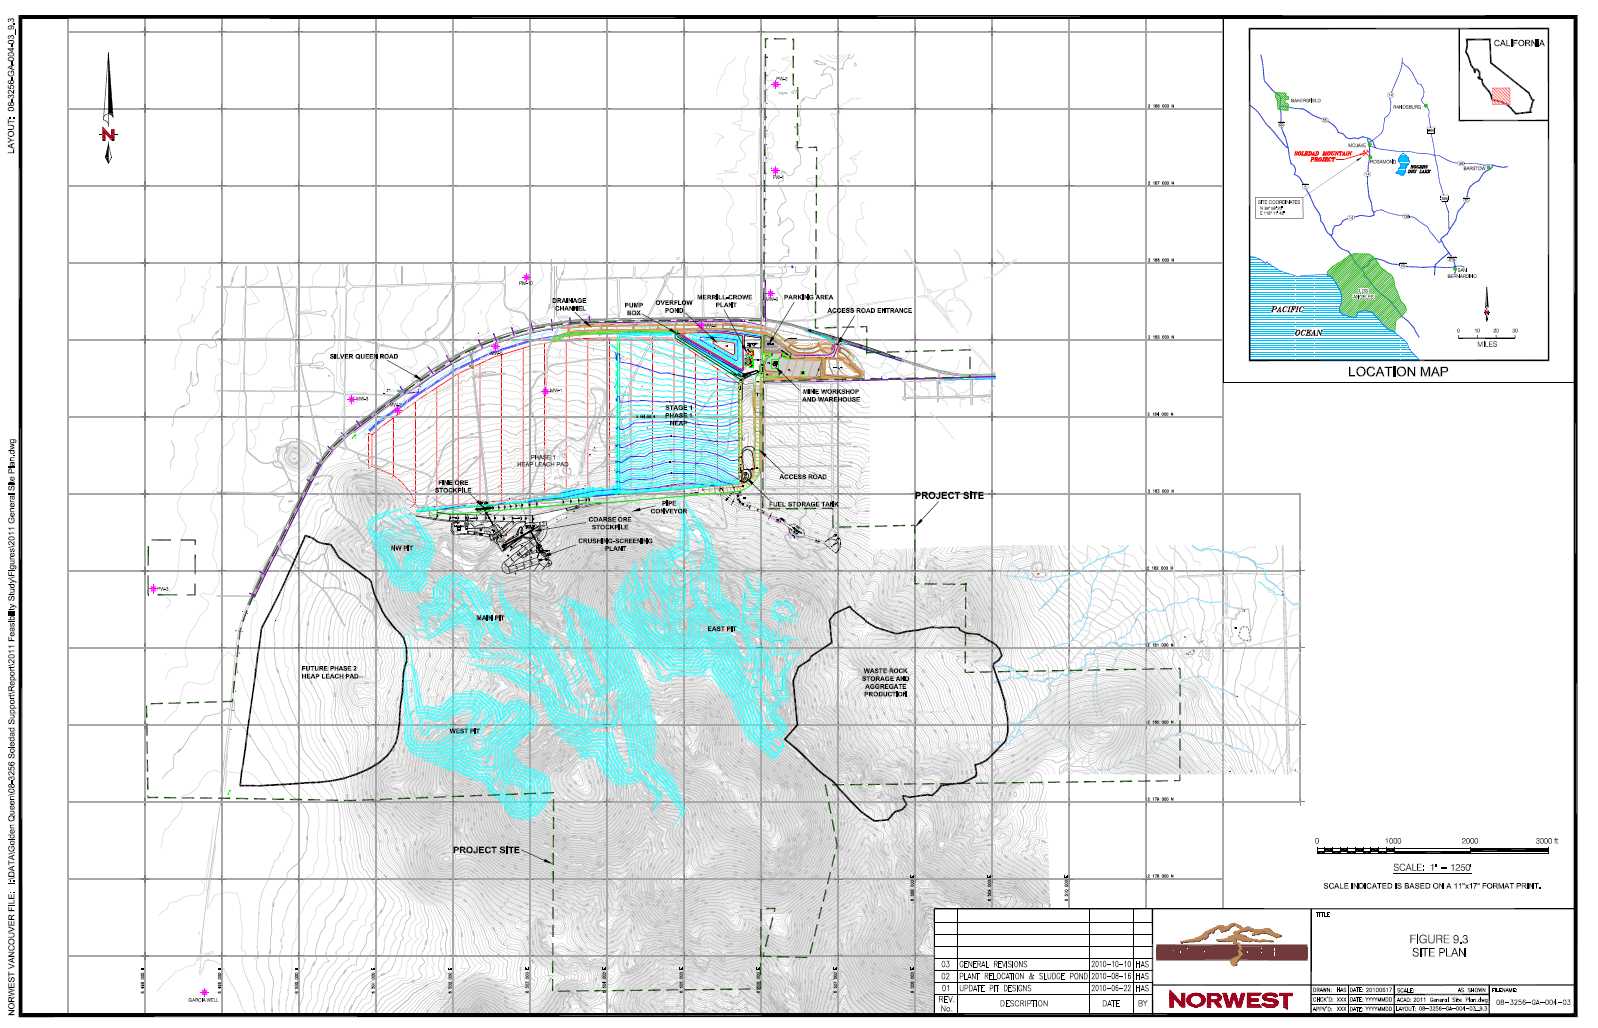
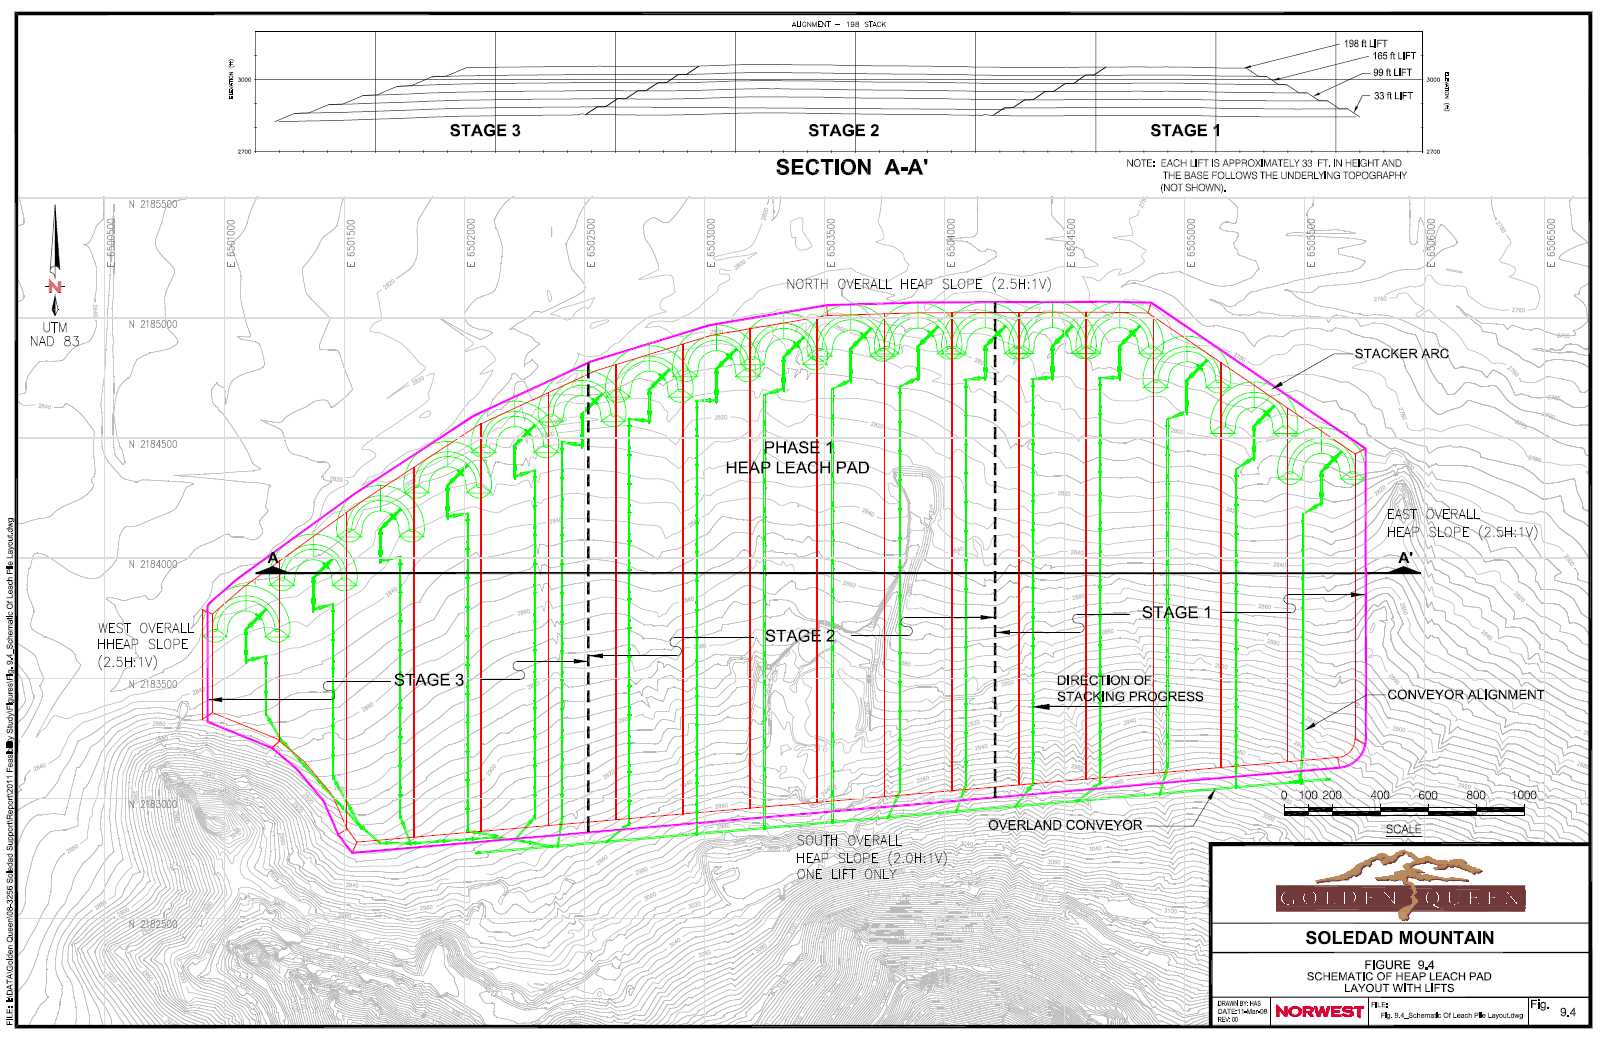
| 10 | LEACHING AND METAL RECOVERY |
| | |
| 10.1 | SOLUTION MANAGEMENT |
| | 10.1.1 | Distribution of Solutions on the Heap |
Provision has been made in the design of the system for counter-current solution flow on the heap, i.e. barren solution to secondary leach, recycle solution to primary leach and pregnant solution to the Merrill-Crowe plant. Current indications are that the counter-current solution flow will only be introduced later in the life of the mine and only if indicated by solution grades.
Primary and secondary solution application rates are 9.77L/h/m2 (0.004 gal/min/ft2) and 4.89L/h/m2 (0.002 gal/min/ft2) respectively with pregnant solution flow rate of 450m3/h (2,000 gal/min) and barren solution flow rate of 473m3/h (2,100gal/min) (after allowing for 5% evaporation makeup). The primary leach area (top) will be approximately 46,000 m2 (500,000 ft2). This area can be irrigated for 49 days on average at the design flow rates and this will be the primary leach period. The average slope area will be approximately 4,600 m2 (50,000 ft2) or 10% of the top area and slope areas will be irrigated at the secondary solution application rate.
Time for solution “breakthrough” will depend upon the number of lifts on the heap and this could range from 1 day to 10 days. It is further expected that a total of 7 days will be required to prepare the heap for a new lift and both will to some extent be determined by operating experience.
The leachate or pregnant solution and the recycle solution will be collected in a network of perforated pipes and will be directed to pipes in the lined solution conveyance channel. The solutions then flow to the two-compartment pump box and are pumped to the Merrill-Crowe plant.
The area of a commercial heap that can be irrigated with the design flow rates will be approximately 177,000 m2 (1,900,000 ft2). At any one time there will be enough solution to irrigate (actively leach) 49 days worth of primary ore (higher grade) and 102 days of secondary ore (low grade) for a total of 151 days of ore on the top lift. In addition to leaching the top lift, the leach solution that is applied to the top lift also percolates down through the underlying lifts, thus giving them more leach time. This means that the ore on the top lift, say lift #6, will receive at least 151 days of active leaching (probably more if the pregnant solution grade is high enough to warrant longer leaching) and the underlying lifts will get:
| | • | Lift #6 | at least 151 days |
| | | | |
| | • | Lift #5 | at least 302 days |
| |
| GOLDEN QUEEN MINING CO. LTD./ 08-3256 |
| SOLEDAD MOUNTAIN FEASIBILITY STUDY |
| 10-1 |
| | • | Lift #4 | at least 453 days |
| | | | |
| | • | Lift #3 | at least 604 days |
| | | | |
| | • | Lift #2 | at least 755 days |
| | | | |
| | • | Lift #1 | at least 906 days |
All of the ore will be leached long enough to obtain the gold and silver extractions that were achieved in the column leach tests, even lift number 6 if it is irrigated for 290 days (see below). The column leach extractions are based on 200 days of active column leaching. There is a rule of thumb in gold heap leaching, based on experience, which relates column leach time to commercial scale heap leach time.
| | • | First 30 column days | = 90 days commercial scale |
| | | | |
| | • | Second 30 column days | = 60 days commercial scale |
| | | | |
| | • | Remaining column days @ 1:1 (i.e. 140 days) | = 140 days commercial scale |
| | | | |
| | • | Totalling approximately 200 column days | = 290 days commercial scale |
This means that extractions based on a 200-day column test, such as those obtained from the logarithmic regression analyses, will require 290 days (say 300 days), to achieve the same extraction in commercial scale practice.
Operating experience may show that it will be advantageous to reduce both the primary and secondary solution application rates and increase the total area under irrigation to allow diffusion-controlled leaching to take place for an extended period of time. The ore in a particular lift will require as much leaching as possible before it is covered with another lift or overall recoveries may be reduced because of the channelling of flow that invariably occurs.
Frequent sampling of the various solution streams will be required to ensure that barren solution and the recycle solution are applied to the heap most effectively. Operating experience will ultimately be required to develop an effective solution management system.
| | 10.1.2 | Netafim USA Design Elements |
Drip emitters will be used to irrigate the ore on the heap. Drip emitters will be placed on new ore as quickly as possible to ensure rapid solution breakthrough.
Netafim USA (Netafim) is the key supplier of components used extensively in agriculture for irrigation. Netafim provided the design and cost estimates for the solution distribution system.
| |
| GOLDEN QUEEN MINING CO. LTD./ 08-3256 |
| SOLEDAD MOUNTAIN FEASIBILITY STUDY |
| 10-2 |
The Netafim system is suitable for irrigating large level areas and slopes. Layouts can be changed and refined and this will depend upon operating experience. The spacing of the driplines will be approximately 1 m or 36 inches apart and the recommended length of driplines is 60 m (200 ft).
The following general comments apply to the system:
An automatic filter must be used, either on each mainline or on the supply header
One header will be used to supply solution to two cells.
A 15 cm (6 inch) diameter sub-main will be used.
Drip emitters will be set out on both sides of the sub-main.
Return lines will be eliminated from the system.
An antiscalant must be used to ensure a smooth operation.
All the components except the driplines are reusable.
All components are readily available in Bakersfield.
Equipment to assemble the components can be supplied by Netafim.
Manuals for the operation/maintenance of the system are available at no charge.
A number of smaller contractors do installation work in the Bakersfield area.
A contractor will assist with the first installation of the system and to train the operators.
| | 10.1.3 | Moisture Content, Specific Weight & Slump |
The moisture content, specific weight and ‘slump’ for all tests done since 1990 are shown in Table 10.1. A comparison of moisture contents from two different test programs is illustrative in showing the difference in moisture contents between the VSI crusher and the HPGR-based approach. See also Section 10.2.2.
TABLE 10.1
MOISTURE CONTENT TEST RESULTS
| 1997-1999 VSI Crusher Tests
100 % - 8 mesh
Moisture Content % | HPGR Tests
Low- & High-Grade
Moisture Content % |
| To agglomerate the ore | 11.5 | 12.8 | 10.6 |
| To saturate the ore | 37.2 | 13.8 | 14.0 |
| Retained moisture | 21.1 | 10.7 | 11.9 |
| |
| GOLDEN QUEEN MINING CO. LTD./ 08-3256 |
| SOLEDAD MOUNTAIN FEASIBILITY STUDY |
| 10-3 |
The lower moisture contents required to saturate the ore and the lower retained moisture contents obtained in the HPGR-based test programs will have a significant and positive impact on the ability to construct a heap to an ultimate height of 60 m (200 ft).
No difficulties with solution percolation, solution channelling or fines migration were observed in any of the HPGR-based column leach tests done between 2003 and 2007.
| | 10.1.4 | Percolation Rates Under Load |
Test work was done to determine percolation rates under load (Golder, 2010). Indications are that no percolation difficulties will be encountered with six lifts of 10 m (33 ft) each and an ultimate heap height of 60 m (200 ft). This will require adequate addition of a suitable binder and proper agglomeration procedures at all times.
Additional perforated pipe can be installed between lifts if required to direct solution away from lower lifts if difficulties are experienced in the commercial scale operation. This is a decision to be made by the operators once experience has been obtained with particular ore types.
Under certain circumstances, solution application rates may also have to be reduced if ponding is observed on the heap.
| | 10.1.5 | Problems with Multiple Lifts |
It is known that solutions percolating through a heap find the easiest channels to follow (preferential flow) and that perfect wetting of all ore particles is not achievable in practice. This problem usually increases as the number of lifts increases, however this issue can be overcome to some extent by deep ripping a lift that has been leached before a new lift is stacked on top of it. Ripping the upper six feet of an exhausted lift will redistribute the flow channels. A D275 (or equivalent) dozer with a long ripper will be available for deep ripping if the need for this activity is indicated by operating experience. It is however possible that deep ripping will destroy the agglomerates and scarifying the surface may be all that is required to ensure good solution flows from lift to lift. Operational experience and test trials will help the operation to select the suitable method.
The average water use for the heap leach operation is projected to be 96.6 m3/h (425 gal/min) and this includes an allowance for evaporation losses.
| | 10.1.7 | Neutralization of the Heap |
Cyanide concentrations in the leach solutions must be reduced to the weak acid dissociable (WAD) standard of 0.2 mg/L (0.2 ppm) and a pH ranging from 6.0 to 8.5. Cyanide concentrations in the leached residue must be reduced to the WAD standard of 0.5 mg/kg (0.5 ppm). Also, contaminants in any effluent from the leached residue will not be permitted to degrade surface run-off or groundwater. The basic approach to reducing the cyanide concentrations is to allow natural processes to occur and to carry out a staged rinse with fresh water. A 90-day rinse cycle has been used successfully at other heap leach operations in the California desert environment. Hydrogen peroxide or an equivalent oxidizing agent can be used to speed up the neutralization process as required. The hydrogen peroxide can be injected into any of the solution distribution lines with a chemical feed pump. The rinse water will be applied to the heaps using drip emitters.
| |
| GOLDEN QUEEN MINING CO. LTD./ 08-3256 |
| SOLEDAD MOUNTAIN FEASIBILITY STUDY |
| 10-4 |
Solutions from each cell of the heap and from the lysimeters and leak detection monitoring points will be sampled regularly and taken to the assay laboratory on site for analysis. The samples will be analyzed for gold, silver, pH and free cyanide and the analyses will be used to control and direct the rinse solution to various parts of the heaps. Analyses may occasionally be required for other metals such as copper, selenium and chromium.
Adding fresh water to rinse the heap must be balanced by losses due to evaporation. Estimated total (mean) annual evaporation is 2,027 mm (79.8 inch) versus a mean annual rainfall of approximately 152 mm (6 inch) in the greater Mojave area. Snow making equipment (sprayer systems) has been successfully used at other heap leach operations to speed evaporation.
Experience at other heap leach operations in the California deserts shows that standards set by the California State Water Resources Control Board can be met successfully.
| 10.2 | METAL RECOVERY |
| | |
| 10.2.1 | Primary Ore Types |
The primary ore types that will be mined are rhyolite porphyry and flow-banded rhyolite, pyroclastics and quartz latite porphyry representing approximately 70%, 10% and 20% of the ore tonnage respectively. Minor quantities of siliceous vein material (0.1%) will also be mined. The rock types will be found in different areas and at various stages of the mine life. The primary rock types are of extrusive volcanic origin and are quite similar in chemical composition and are high in silica with little or no clay.
The gold and silver mineralogy for rhyolite and quartz latite are essentially the same as determined by Amtel Ltd. in a number of reports from 2003 to 2007. Rhyolite is however typically more highly silicified than quartz latite and more gold has consistently been extracted from quartz latite than from rhyolite in column leach tests.
| |
| GOLDEN QUEEN MINING CO. LTD./ 08-3256 |
| SOLEDAD MOUNTAIN FEASIBILITY STUDY |
| 10-5 |
The interpretation of the ore body composition has changed since the early 1990s and a significant portion of the pyroclastics has been reclassified as rhyolite. Behaviour of rhyolite and pyroclastics has been similar in column leach tests with gold recovery for pyroclastics typically higher by 2.5% than the gold recovery for rhyolite. The higher gold recovery for pyroclastics is explainable as pyroclastics are more porous and friable than the rhyolite. Also, the leach curves for rhyolite and pyroclastics are indistinguishable from one another.
Gold is present as native gold and electrum (gold with silver greater than approximately 20%) ranging in size from less than 10 micron to greater than 150 micron with the silver content of the electrum as high as 25%. Silver is also present principally as the mineral acanthite (Ag2S), with some native silver, pyrargyrite (Ag3SbS3) and polybasite ((Ag,Cu)16Sb2S11). Minerals of potential environmental concern include pyrite (FeS2), galena (PbS) and chalcopyrite (CuFeS2), which are present in minor amounts.
| | 10.2.2 | Process Development |
Extensive test work and process development work done on the Project ore types from 1988 to 2007 show that these ores are readily amenable to heap leaching provided the material is crushed to relatively small sizes. The test work for a total of 45 column leach tests is well documented and the test results have been used in a number of feasibility studies. Parameters such as agglomerate strength, percolation rate, cyanide consumption and cement and/or lime required for pH control were also determined in numerous tests.
An extensive characterization program using bottle roll tests on reverse circulation drill cuttings was completed by an independent consulting engineer in 1995. The deposit was divided into six areas, four rock types and three vertical zones for this program and 46 standard bottle roll tests were performed. An analysis of the results showed that there was no discernable difference in metallurgical response for a particular rock type from area to area and from strata to strata. This is of significance both in guiding sampling programs for leach test work and as it allows the use of the information provided by such leach test work to be applied to recovery analyses and to project production of gold and silver in a commercial operation with confidence for all areas that will be mined.
Tests were done on bulk samples of rhyolite, pyroclastics, quartz latite and vein material obtained from surface and old underground workings between 1997 and 1999. The material was crushed in a vertical shaft impact crusher (VSI) and screened to produce samples sized to 100% minus 8 mesh or 100% minus 2.37 mm. McClelland Laboratories, Inc. completed both bottle roll and column leach test work on these samples and the final report was dated February 25, 1999. This was considered to be the definitive test program to provide detailed information required for both the design of a four-stage crushing-screening plant and to complete a feasibility study.
| |
| GOLDEN QUEEN MINING CO. LTD./ 08-3256 |
| SOLEDAD MOUNTAIN FEASIBILITY STUDY |
| 10-6 |
The four-stage crushing-screening plant, the design of which was based upon the results of the 1997 - 1999 test programs, would be exceptionally costly to design, build and operate and a more cost-effective solution had to be found for a viable Project. An alternative flow sheet was developed with a HPGR as the key comminution device in 2002. A series of HPGR and bottle roll and column leach tests was performed between 2003 and 2007 to confirm the flow sheet and to provide design criteria for the design of the crushing-screening plant.
The test work shows that the HPGR will have distinct advantages over conventional crushing and screening in preparing particles for heap leaching in this particular application as described in sub-section 9.2.2.
The crushed ore will be agglomerated on the conveyors that will be used to transport the ore to the heap.
Column leach test data was reviewed for tests done from 2003 to 2007. Tests completed in 2006 were performed on a low-grade and a high-grade rhyolite sample to test the range of grades that is expected in the commercial operation. The test on rhyolite with a lower head grade in the 0.3 g/t (0.009 g/ton) range is especially important to give an indication of the tail grade and thus the recovery that should be used when doing cutoff grade analyses. No new column leach tests have been done on pyroclastic ore since the 1997-1999 tests.
The ‘actual’ data represents the results as of the last day of the column leach test. This data should not be used to estimate percentage extraction as gold and silver were still being extracted from the ore when the tests were ended. However, enough data had been collected by the end of the test to reliably perform a logarithmic regression analysis of the data and project what the extraction would be if the test had been continued for a total of 200 days. The regression analyses therefore put all of the column leach test results on a common 200-day basis.
The following conclusions can be drawn from an analysis of the tails obtained in the extended 1997-1999 tests for rhyolite, quartz latite and pyroclastics in which the samples were crushed with a VSI and the tails obtained in the series of HPGR-based tests done from 2003 to 2007:
| | 10.2.3.1 | Extended Leach Time |
Test results show that extended leach time is a factor in achieving low tails. The only long-term tests done were the 1997-1999 VSI tests. The tails obtained in these tests were however not as low as the tails obtained in the HPGR tests with shorter leach times.
The conclusion is that extended leach time is a factor in achieving low tails but possibly of lesser importance when the HPGR is the comminution equipment.
| |
| GOLDEN QUEEN MINING CO. LTD./ 08-3256 |
| SOLEDAD MOUNTAIN FEASIBILITY STUDY |
| 10-7 |
| | 10.2.3.2 | Particle Size Distribution |
A particle size distribution is the direct result of the crushing technology used to prepare the sample for leaching. The analysis of test results shows that it is the particle size distribution for any particular test rather than a point value such as a P80 that is key to interpreting and understanding the results of the tests. Particle size distributions were therefore plotted and analyzed for all tests performed from 2003 to 2007. In general, the VSI products are finer than the HPGR products in all size ranges, yet the tails from the HPGR tests are consistently lower than those from the VSI tests and this indicates that another factor such as micro-cracking is important to achieve low tails grades.
Understanding and monitoring of particle size distributions will be important in the commercial operation.
An analysis of test results and microphotographs show that micro-cracks are developed in ore particles in the HPGR that allow relatively more gold and silver to be extracted than in the VSI tests. The conclusion is that the formation of micro-cracks increases recovery and lowers tails.
| | 10.2.3.4 | Specific Press Force |
An analysis of the tails obtained in the HPGR-based column leach tests shows that tails and thus recoveries are affected by specific press force. A higher specific press force gives a finer overall particle size distribution and leads to a greater density of micro-cracks and this directly affects tails and thus recoveries. The conclusion is that the specific press force is the determining operating parameter.
The analysis above indicates that it is reasonable to limit the determination of recoveries to the HPGR-based column leach tests and this places the emphasis on tests performed between 2003 and 2007.
| | 10.2.4 | Tails Analysis for Gold |
The recovery analysis is based upon tails obtained in HPGR-based column leach tests.
A plot of tails versus calculated head grades for the three principal ore types is shown in Figure 10.1. The mineral reserve grades for rhyolite, quartz latite and pyroclastics and the cut-off grade that was used to delimit the low-grade resource model outlines are also shown.
Three curves that show the projected tails for the three ore types after 200 days of leaching have been drawn as best-fit curves from the data points shown in Figure 10.1. The curve for pyroclastics was drawn parallel to the curve for rhyolite with an allowance for recoveries from pyroclastics higher by 1.25% (50% of the indicated difference) than the recoveries for rhyolite. The curve for quartz latite was drawn through the data point and parallel to the curve for rhyolite.
| |
| GOLDEN QUEEN MINING CO. LTD./ 08-3256 |
| SOLEDAD MOUNTAIN FEASIBILITY STUDY |
| 10-8 |
The calculated recoveries based upon the tails analysis are shown in Table 10.2.
| | 10.2.5 | Tails Analysis For Silver |
Calculated recoveries for silver are shown in Table 10.2. A plot of tails versus calculated head grades is shown in Figure 10.2. Key information is shown with each data point. The mineral reserve grades for the three ore types are also shown. It does not appear to be feasible to draw curves that will distinguish between the three ore types so a single curve has therefore been plotted.
The calculated recoveries based upon the tails analysis are shown in Table 10.2 and are the recoveries projected for the commercial operation.
It should be noted that the proportions of ore used in this recovery calculation for both gold and silver were based on earlier pit plans and the proportions have shifted somewhat in the current mine plan. However, the change is insignificant in terms of the calculated recoveries for gold and silver, and therefore the calculations have not been adjusted from the previous work.
TABLE 10.2
RECOVERIES FOR GOLD & SILVER
Primary Rock
Types |
Proportion
% | Gold |
Gold
Recovery % | Silver
Head Grade
g/t |
Silver
Recovery % |
| Head Grade |
| g/t | oz/ton |
| Pyroclastics | 10.5 | 0.906 | 0.0265 | 85.4 | 12.79 | 52.5 |
| Quartz Latite | 21.3 | 0.831 | 0.0243 | 89.9 | 19.49 | 52.5 |
| Rhyolite | 68.1 | 0.821 | 0.0240 | 83.4 | 11.72 | 52.5 |
| Undefined | 0.1 | 0.870 | 0.0254 | Not Included | 15.75 | Not Included |
| Total & Average | 100.0 | 0.831 | 0.0243 | 85.0 | 13.49 | 52.5 |
The tails analysis confirms that the HPGR is a viable option for preparing ore particles for heap leaching for the Project.
A tails target for gold can be calculated from the recovery analysis for gold and this is a weighted average tail of 0.130 g/t (0.0038 oz/ton) for the three primary ore types after 200 days of leaching.
| |
| GOLDEN QUEEN MINING CO. LTD./ 08-3256 |
| SOLEDAD MOUNTAIN FEASIBILITY STUDY |
| 10-9 |
| 10.3 | MERRILL-CROWE CIRCUIT |
| | |
| 10.3.1 | The Merrill-Crowe Process |
Gold and silver are typically recovered by dissolution in a dilute sodium cyanide solution and then by precipitation with zinc or adsorption on activated carbon. The zinc precipitation process, referred to as the Merrill-Crowe process after its developers, is used to recover gold and silver when the silver to gold ratio is greater than 10:1. This ratio is expected to average 11:1 for the Project (range 1:1 to 17:1) and ratios greater than 30:1 were noted in recent test work. The Merrill-Crowe process is well established and the process is highly efficient.
In the Merrill-Crowe process, suspended solids and dissolved oxygen must first be removed from the pregnant solution. Clarifying filters are used to remove the suspended solids to less than 1 ppm. Zinc dust is metered into the deaerated solution and combines with the cyanide in a rapid, cementation-type reaction and gold and silver are precipitated as micron-sized particles of metallic gold and silver.
After precipitation, the dilute slurry is pumped to plate and frame filters where the gold and silver particles are removed. These filters are located in the refinery and this is where all subsequent processing takes place. Any mercury present in pregnant solution is precipitated with the gold and silver. The gold and silver precipitate is removed manually from the presses and stored in the mercury retort pans. Then the precipitate is heated in the mercury retort where water and mercury vapours are condensed and collected in the retort condensing system and the mercury trap. The dried precipitate is mixed with selected fluxes, typically silica, borax and soda ash and melted in an induction furnace. Impurities in the melt combine with the fluxes to form slag. Slag is tapped as required and poured into slag pots. Slag is cooled and crushed and occluded particles of gold and silver are recovered by gravity for further processing. The molten mix of gold and silver, i.e. the dorè, is poured into molds. Dorè is cooled, cleaned and shipped to a commercial refinery where gold and silver bullion are produced for sale.
The barren solution is pumped to the barren solution tank and is returned to the heap.
| | 10.3.2 | The Merrill-Crowe Plant |
Kappes, Cassiday & Associates (Kappes, Cassiday), an engineering company with extensive experience in process development and the design of processing plants, has completed a detailed design and prepared capital and operating cost estimates for the Merrill-Crowe plant (Soledad Mountain Project, Merrill-Crowe Plant, Engineering and Cost Estimate Study, Prepared by Kappes, Cassiday & Associates, , Project No: 456H, October 25, 2010).
It is expected that the Merrill-Crowe plant will be constructed on a turn-key basis.
| |
| GOLDEN QUEEN MINING CO. LTD./ 08-3256 |
| SOLEDAD MOUNTAIN FEASIBILITY STUDY |
| 10-10 |
The plant has been designed for a pregnant solution flow rate of 450 m3/h (2,000 gal/min).
Provision has been made in the design of the plant for containment of spills. The liner under the plant will be seamlessly connected to the overflow pond liner for containment in case of a spill.
A mercury retort has been included in the Merrill-Crowe plant as required for environmental control and also required by the Conditional Use Permits issued by Kern County. The mercury retort exhaust fumes are cooled and flow to a sulfonated carbon bed scrubber for PM10 and mercury emissions control. The melting furnace exhaust fumes flow via a collection hood and flow to a wet scrubber and then to a sulfonated carbon bed scrubber for PM10 and mercuryemissions control.
The location of the Merrill-Crowe plant within the site footprint is shown in Figure 10.3with the floor plan of the plant shown in Figure 10.4. Ready access for the bulk delivery of reagents is a key concern and this has been allowed for in the layout of the site access road to the plant.
| | 10.3.3 | Delivery Of Reagents & Use Of Reagents |
The following is a list of the reagents that will be used with indicated rates of use:
The cyanide will be delivered as a 30% aqueous solution with a pH of 12.5 in a tanker truck directly from the producer’s plant. The contained weight of sodium-cyanide (NaCN) in solution will be approximately 6,800 kg (15,000 lb) per load. The cyanide solution will be transferred to a 175 m3 (approximately 45,000 gal) storage tank on site. The producer will supply and install a complete handling and storage system and this will include telemetry for a managed inventory.
The bulk of the cyanide will be added to the barren solution to adjust the cyanide concentration. Smaller quantities of cyanide will be added to the clarified pregnant solution to aid in zinc cementation as well as to the recycled intermediate solution on the heap. Estimated consumption is 0.39 lb/ton of ore on the heap.
Zinc dust in the form of Merrillite or equivalent will be added as a dry powder to the zinc cone just downstream of the deaeration tower. Estimated consumption is 1.0 oz zinc /oz of combined gold plus silver in the pregnant solution.
Lead nitrate will be added to the leach solution only if required. If required, lead nitrate would be added to the pregnant solution tank to precipitate soluble sulfides ahead of the clarifiers and zinc precipitation or to the zinc cone to enhance the effectiveness of the zinc dust.
| |
| GOLDEN QUEEN MINING CO. LTD./ 08-3256 |
| SOLEDAD MOUNTAIN FEASIBILITY STUDY |
| 10-11 |
If needed it is estimated that the quantity of lead nitrate would be in the range of 10% to 15% of the weight of zinc used.
Carbonates and some sulfates will precipitate in pipes and pumps. Antiscalants will prevent or minimize the formation of such scale. The supplier of antiscalants will typically provide metering systems for adding the liquid antiscalant at a typical rate of 3 mg/L (3 ppm) to the various solution pump intakes.
| | 10.3.3.5 | Diatomaceous Earth |
Diatomaceous earth (DE) will be used as a precoat on filters and as body feed. DE will be delivered in 22 kg (50 lb) bags on pallets. DE will be slurried and pumped to clarifiers, the precipitation presses or the zinc cone as required.
The estimated consumption is 1,038 kg/day (2,283 lb/day) at full production only.
Normal Portland cement will be used as a binder and to provide protective alkalinity in the heaped ore. Local suppliers exist and the cement mix can be readily delivered and stored on site.
Estimated consumption is 4 kg/t (8.0 lb/ton) of ore on the heap.
| | 10.3.4 | Cyanide Consumption |
The most recent estimate of cyanide consumption of 0.185 kg/t (0.37 lb/ton) of ore was made by Herb Osborne, independent metallurgical consultant, in 2005. The data collected since the 2005 work suggests that the consumption may be slightly higher than this estimate. Test work during the past three years was examined by Paul Chamberlin. Bottle roll tests, as performed by McClelland Laboratories, give a fairly good estimate of cyanide consumption in commercial scale operations. Based on bottle roll tests during the past three years, the average consumption was 0.25 kg/t (0.50 lb/ton). The cyanide consumption in column tests is always much higher than in commercial operations, generally 3 to 4 times as high. Consumption is nearly proportional to the column leach time. Typically a 60-day column leach time is the norm. Reviewing the column tests from the past three years and reducing the consumption to that of a 60-day test indicates an average consumption of 0.195 kg/t (0.39 lb/ton).
For the feasibility study, the cyanide consumption is projected to be 0.195 kg/t (0.39 lb/ton) of ore crushed. Information provided by suppliers indicates that typical cyanide consumption in the industry ranges from 0.19 kg/t (0.38 lb/ton) to 0.20 kg/t (0.40 lb/ton) of ore on the heap.
| |
| GOLDEN QUEEN MINING CO. LTD./ 08-3256 |
| SOLEDAD MOUNTAIN FEASIBILITY STUDY |
| 10-12 |
McClelland Laboratories, Inc. indicated that the Soledad ores were clean and that there were no ‘red flags’ raised in any of the test work. Furthermore, the samples crushed in the HPGR had a lower proportion of fines than the samples crushed to 100% - 8 mesh, which will lead to lower cyanide consumption than previously estimated.
| | 10.3.5 | Carbon Columns for Closure |
The Merrill-Crowe process requires a cyanide concentration of approximately 150mg/L or 150 ppm for efficient precipitation of gold and silver and this is well above the environmental rinse limits. A set of carbon columns will therefore be required once the neutralization process starts to recover residual gold and silver, as carbon is not affected by low cyanide concentrations. Experience shows that gold will be leached until cyanide concentrations drop to approximately 1 mg/L or 1 ppm. The rate at which silver will be leached slows at cyanide concentrations of 50 mg/L or 50 ppm and stops at approximately 10 mg/L or 10 ppm. The Merrill-Crowe circuit will need to be shut down once cyanide concentration drops below 150 mg/L or 150 ppm and electro-winning cells will be brought in to recover gold and silver.
Allowance has been made for a carbon plant in Sustaining Capital in Year 12 of production.
The estimated quantity of dorè that will be produced each year is shown in Table 10.3after allowance for a silver loss of 0.5% in the refinery on site.
The average silver to gold ratio in the dorè will be 12.7:1 with a range from 11.9:1 to 15.1:1. Allowance has been made for 1.5% of minor metals in the dorè as shown in Table 10.4.
| |
| GOLDEN QUEEN MINING CO. LTD./ 08-3256 |
| SOLEDAD MOUNTAIN FEASIBILITY STUDY |
| 10-13 |
TABLE 10.3
METAL PRODUCTION OVER PROJECT LIFE
| Production | Year 1 | Year 2 | Year 3 | Year 4 | Year 5 | Year 6 | Year 7 | Year 8 | Year 9 | Year 10 | Year 11 | Year 12 | Year 13 | Totals |
Gold
Recovered
(post-
smelter) (oz) |
50,300
|
69,800
|
113,000
|
109,500
|
79,300
|
79,200
|
100,300
|
81,600
|
55,000
|
68,200
|
65,100
|
54,100
|
10,800
|
936,200
|
Silver
Recovered
(post-
smelter) (oz) |
228,500
|
521,000
|
1,069,100
|
966,200
|
990,500
|
966,500
|
1,156,700
|
1,118,700
|
1,466,000
|
879,300
|
426,700
|
485,600
|
151,900
|
10,426,700
|
*Based on Norwest Feasibility Study Update Production Schedule Detail-Dec 10 2010 update. xls
| |
| GOLDEN QUEEN MINING CO. LTD./ 08-3256 |
| SOLEDAD MOUNTAIN FEASIBILITY STUDY |
| 10-14 |
TABLE 10.4
MINOR METALS PRESENT IN DORÈ
| Element | Percentage (%) |
| CU | 0.450 |
| FE | 0.375 |
| ZN | 0.375 |
| NI | 0.150 |
| CO | 0.113 |
| PB | 0.037 |
| TOTAL | 1.500 |
The minor metals content of the dorè is based upon 33 element ICP scans of pregnant solution from column leach tests and CAM WET tests on ore samples. It is not expected that these concentrations of minor metals will interfere with zinc precipitation in the Merrill-Crowe process.
The dorè will be cleaned and prepared for shipment by the operators on site. It is expected that shipments will be made every 7 days.
Johnson Matthey Inc. (JMI) owns and operates a precious metals refinery in Salt Lake City, Utah and it is expected that the dorè will be shipped to JMI for refining. JMI has assessed the expected quality of the dorè and sees the mine as a silver producer rather than a gold producer and the dorè will be refined following the procedures for silver rather than gold.
JMI provided the following levels for minor metals in dorè at which penalties would apply as shown in Table 10.5.
TABLE 10.5
REFINERY PENALTY TRIGGERS FOR DORÈ
| Element | Percentage (%) |
| AS | 0.20 |
| BI | 0.005 |
| CD | 0.05 |
| HG | 0.01 |
| SE | 0.01 |
| TE | 0.01 |
| SN | 0.50 |
| BE | 0.00 |
| |
| GOLDEN QUEEN MINING CO. LTD./ 08-3256 |
| SOLEDAD MOUNTAIN FEASIBILITY STUDY |
| 10-15 |
JMI proposed the following provisional terms for the dorè in an email communication dated October 11, 2010:
| | • | Treatment Charge | $0.30 per ounce received |
| | | | |
| | • | Gold Return | 99.90% of the assayed gold content |
| | | | |
| | • | Silver Return | 99.75% of the assayed silver content |
| | | | |
| | • | Refining Charge | $1.00 per ounce of fine gold credited |
| | | | |
| | • | Penalties | None |
JMI will normally settle 25 working days after the dorè is received.
A knowledgeable person, based in Salt Lake City, will be retained by GQM as an on-site representative at the smelter to oversee the procedures in place for receiving the dorè and ensuring proper QA/QC. The representative will oversee the processing of each shipment of dorè and will submit a written report on each shipment.
| 10.5 | LABORATORY TESTING QA/QC |
The laboratory has been designed to cope with the planned workload including the required sample preparation and solid and solution analyses for gold and silver as well as analyses required to manage the heap leach operation (CNfree, CNwad, CNt, protective alkalinity and pH). Environmental control analyses will also be performed for low level NaCN and metals (Hg, Ag, As, Cu, Fe, Zn, Mo, Cd, Ni, Co, Cr, Mn, Pb).
Fire assays will be the key assay and the laboratory will have capacity to do 60 fire assays per day with a 70% efficiency.
Mr. Jack Stanley, Analytical Laboratory Consultants Ltd, developed the concepts. Jack Stanley and Northern Trailer Ltd., Kamloops did the detailed engineering and provided the capital and operating cost estimates for the laboratory and only new equipment prices were used. Capital and operating costs were brought current in August 2010.
The laboratory will be constructed on a turn-key basis.
The laboratory will consist of three modules 4.3m (14 ft) wide and 15.2m (50 ft) long and will include areas for sample preparation, fire assays and related wet chemistry and metallurgical test work such as bottle roll tests and column leach tests. The modules will be shipped to site with the equipment installed wherever possible to minimize construction on site. The modules will be set on concrete slabs. It will be important to anchor the modules properly to the slab because of the high winds in the area.
| |
| GOLDEN QUEEN MINING CO. LTD./ 08-3256 |
| SOLEDAD MOUNTAIN FEASIBILITY STUDY |
| 10-16 |
Extensive provision has been made for dust control. All lead waste and dust containing heavy metals will be shipped to a designated disposal site. Rock dust and rejects from sample preparation will be returned to the process. Scrubbers will be fitted to fume hoods.
The laboratory has been designed to meet all State codes. Fire alarms and a sprinkler system will be installed in certain areas of the laboratory.
The laboratory has been sized to do from 50 to 200 solid and from 10 to 50 solution samples per day depending upon requirements. The laboratory will be staffed by a chief chemist, two assayers and four sample preparation technicians. The two assayers and the four sample preparation technicians will work a continuous shift schedule. This will ensure that a sample preparation technician is on duty for 24 hours per day and seven days per week. The analytical capacity of the laboratory can be doubled by adding a second shift per day.
In addition to the test work done on site, a quality assurance and quality control program using an outside laboratory will be implemented for the following reasons:
Independent repeat analyses to gain statistical confidence in the in-house analyses.
Confirmation analyses to satisfy permit and approval requirements.
Geochemical analyses that may be in the ppb range and that cannot be performed in-house
Unexpected laboratory load due to exploration drill programs.
ICP scans of solutions to develop historical trends.
| |
| GOLDEN QUEEN MINING CO. LTD./ 08-3256 |
| SOLEDAD MOUNTAIN FEASIBILITY STUDY |
| 10-17 |
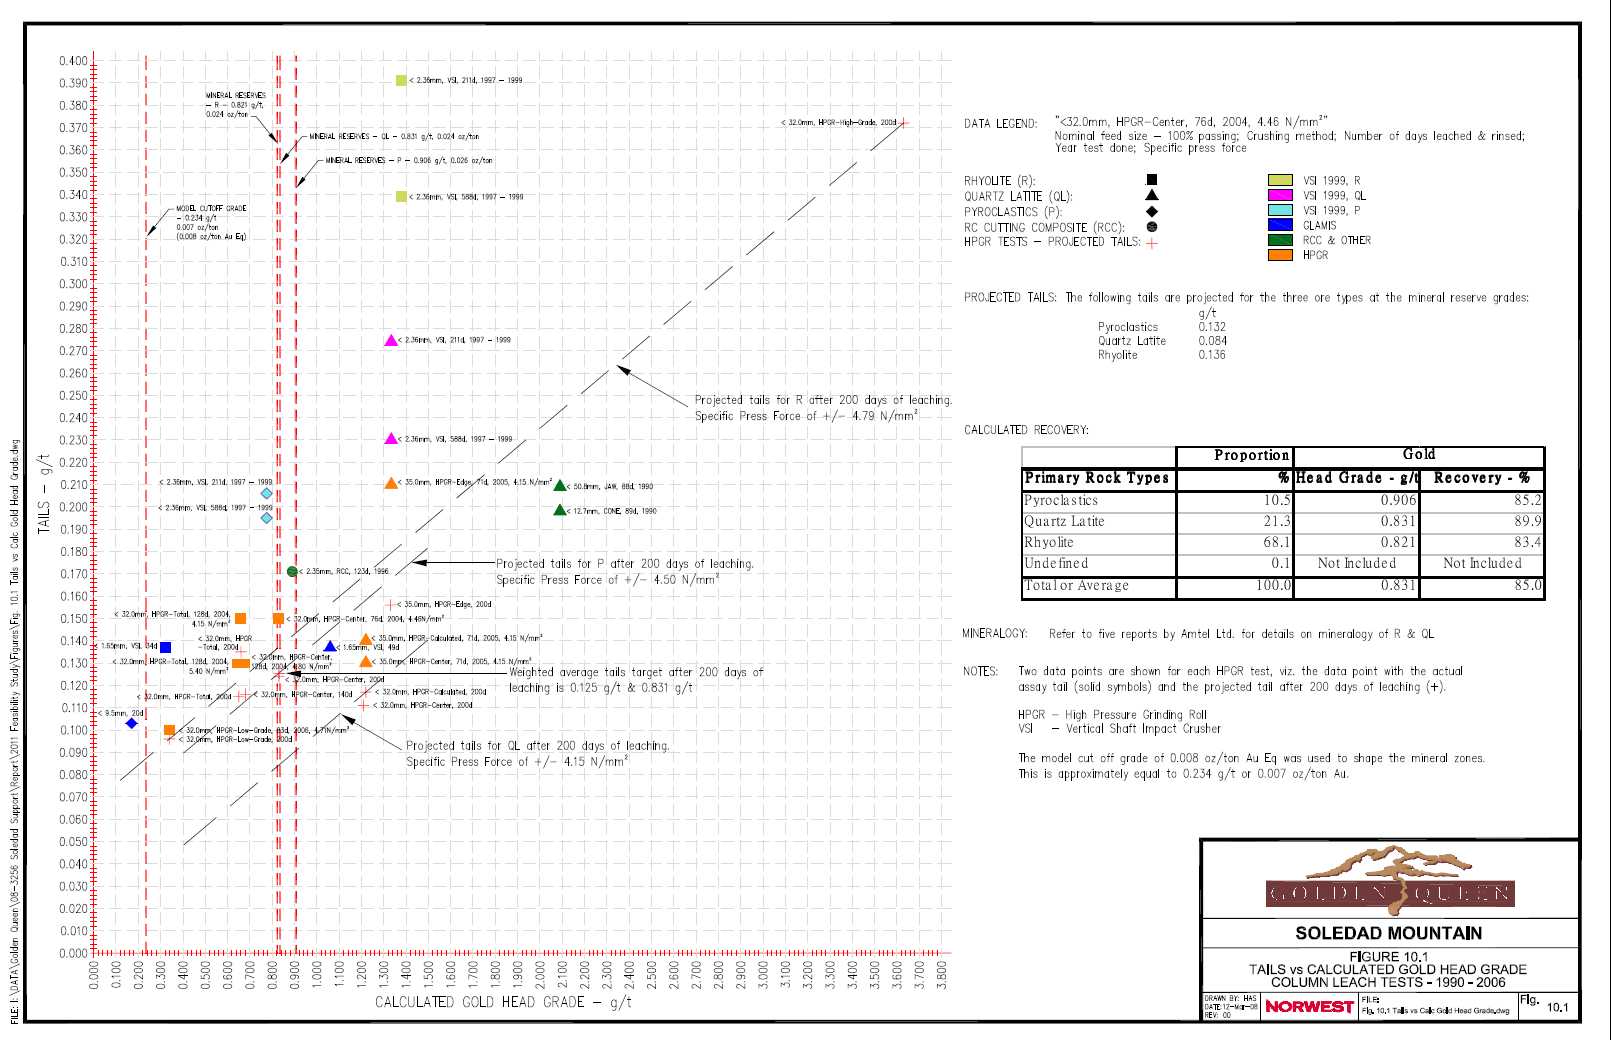
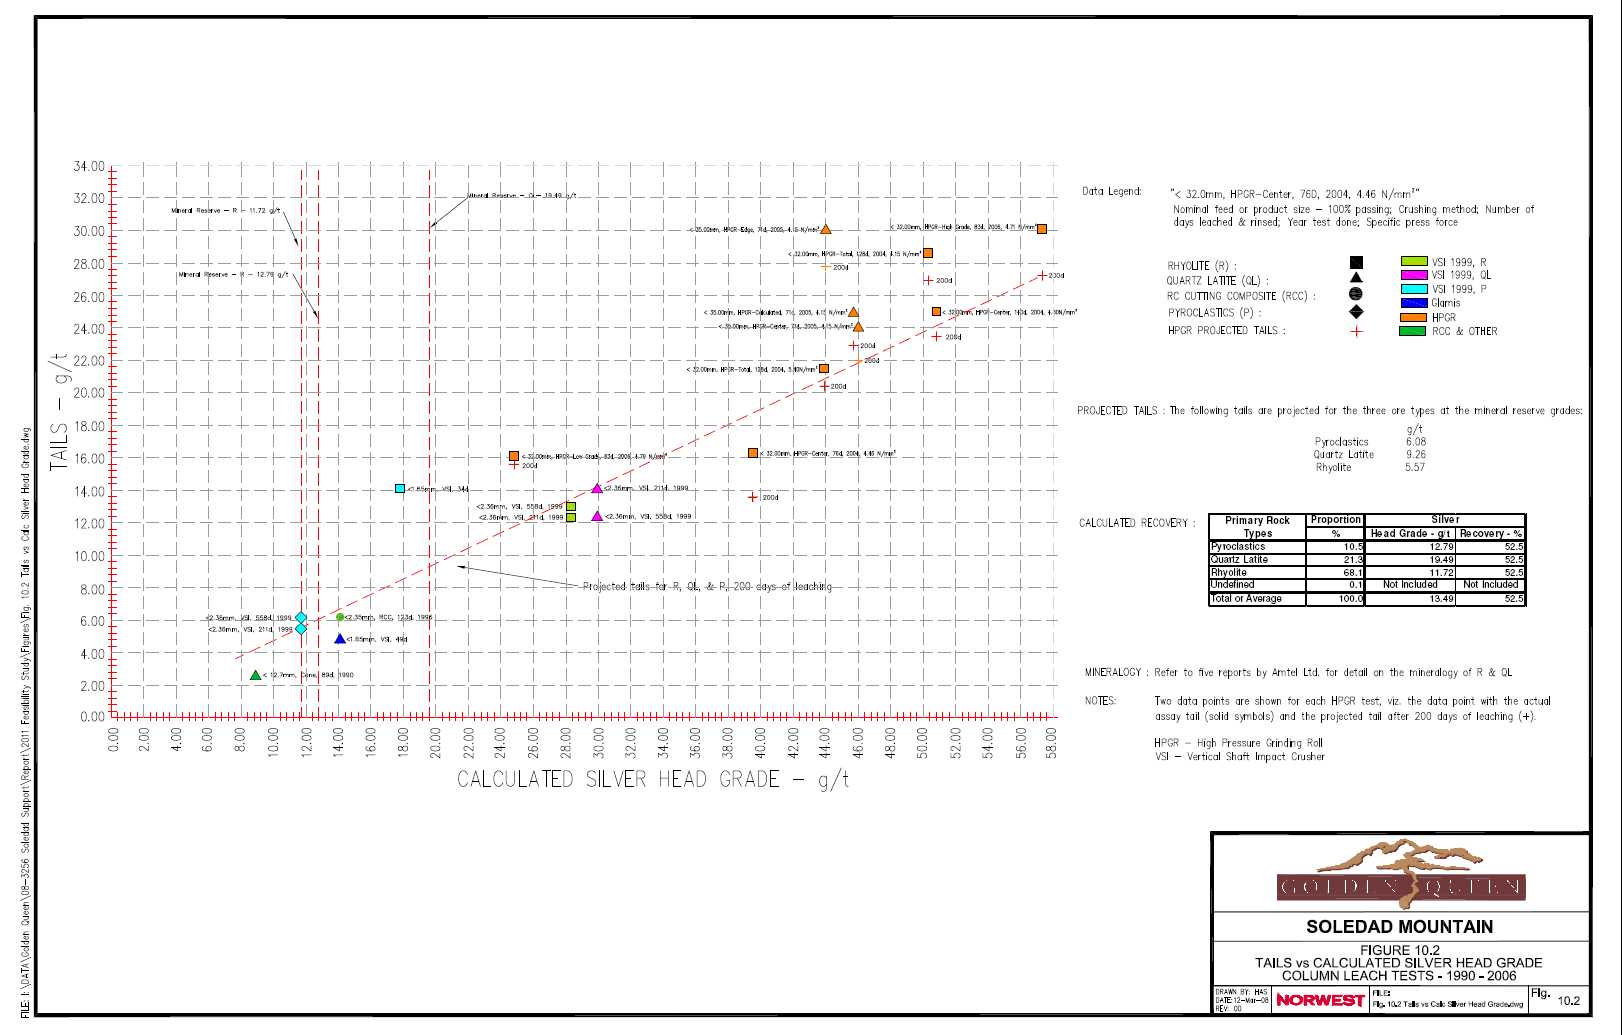
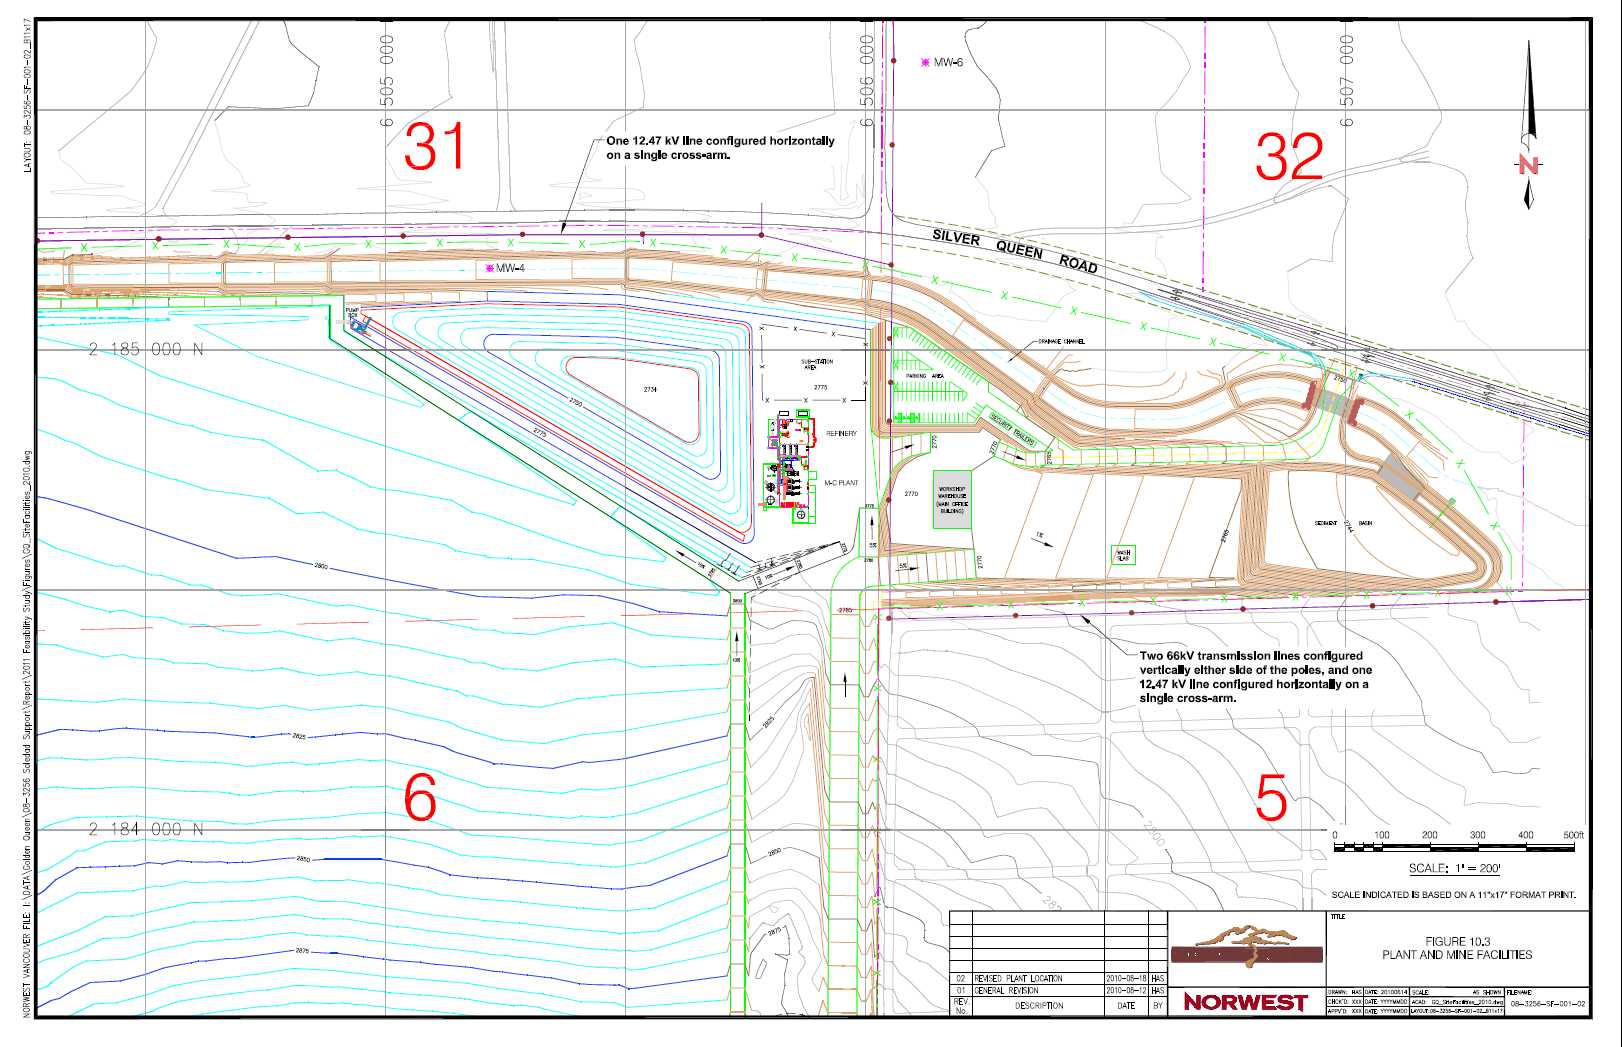

| 11 | INFRASTRUCTURE |
| | |
| 11.1 | SITE ACCESS |
Good access exists from the north via Silver Queen Road and from the south via Mojave Tropico Road. Both roads are paved and are in excellent condition. Silver Queen Road intersects State Route 14 two miles east of the site. State Route 14 is the major highway, which connects Mojave, Rosamond and Lancaster to the greater Los Angeles area.
Access to site will be from Silver Queen Road, which borders the site on the north as shown in Figure 9.3. The two existing roads, the dirt road to the old offices and the paved road to the 3025 ft level will be used for immediate access during the construction period.
A new site access road will be constructed approximately 900 m (1,000 ft) east of Gold Town Road. This will include a left-hand turning lane as a safety measure. A local civil engineering firm, T.J. Cross Engineers, Inc., Bakersfield has completed the detailed design of the intersection with Silver Queen Road. Kern County Roads Department has approved the project and GQM has obtained a quote for construction from Granite Construction Company, Palmdale. A bitumen seal will be required on the new access road as far as the security trailer as a dust control measure. A parking area for employee vehicles has been included in the design of the access road. The site will be fenced.
Good local infrastructure and the ready access to site at all times of the year will have a significant positive impact on both the capital cost to the start of production and the operating cost.
| 11.2 | OFFICE/WAREHOUSE/MAINTENANCE FACILITIES |
The location of the workshop-warehouse, equipment wash slab, fuel storage tanks and the employee parking lot are shown in Figure 9.3. A detailed layout of the area is shown in Figure 10.3.
Fielden Engineering Group, Lancaster has prepared a detailed design for the workshop-warehouse, an equipment wash slab, the septic system and leach field and a site grading plan. The designs have been approved for construction by the Kern County Building Department. Gary Little Construction, Inc. a building contractor based in Lancaster, has provided quotes for construction of the various facilities.
The workshop-warehouse will serve both the mine and the crushing-screening plant and other processing facilities. The workshop includes three service bays, which have been sized large enough to service mobile equipment such as the 11m3 (15 yd3) wheel loader, 90t (100 ton) off-highway haul trucks, the large track-type tractor and the motor grader as well as for plant maintenance. Extensive provision has been made for heating and ventilation in all areas.
A gantry crane with a capacity of 13t (15 tons) will be provided for lifting large loads (such as loader buckets and dozer blades) in and out of the welding bay.
| |
| GOLDEN QUEEN MINING CO. LTD./ 08-3256 |
| SOLEDAD MOUNTAIN FEASIBILITY STUDY |
| 11-1 |
A light vehicle service bay will share the third bay. Allowance has been made for a vehicle hoist so that light vehicles can be serviced effectively. A set of lube reels will be set between two service bays and on the wall of the light vehicle service bay. Lubricants will be dispensed from lube cubes and drums. A waste oil storage tank will be required and this tank will be set within a small containment clear of the workshop-warehouse.
The warehouse will have two floors. The upper floor will have a large open plan area which will serve as the site offices.
A firewater loop with hydrants located in key areas will be constructed as part of the overall fire protection system.
The equipment wash slab will have an area of approximately 1,860 m2 (2,000 ft2). The design includes primary and secondary settling basins and an oil-water separator. The sediments will be removed as required and disposed of in an approved location. A hot water pressure washer will be required for cleaning equipment and this has been included in the capital cost estimates.
The regional utility, Southern California Edison (SCE), will supply power. A main power line with two sets of conductors currently reaches the property boundary as shown in the Figure 9.3 and Figure 11.2. The top set of conductors carries 66 kV while the bottom set of conductors carries 12.4 kV. These are the common primary voltages in this part of the SCE territory.
GQM will install and own the utility tie-in substation to the 66kV line, which will transform the incoming voltage of 66 kV to 11.37 kV and this will be the mine distribution voltage. Overhead transmission lines will distribute power from the substation to the areas where power is required.
SCE provided a rate for power. The rate structure is complex and a mix of consumption and demand charges applies to peak, mid-peak and off-peak periods. The rate for power of $0.08/kWh was provided by Ms. Laurel Shockley, Regional Economic Development Manager, SCE on December 14, 2010 and this is the rate for power used in the feasibility study.
SCE indicates that the power factor is an absolutely critical item in SCE territory. SCE requires a minimum operating power factor of 0.95 and a load-sensitive capacitor bank will be installed to achieve this. SCE may also limit the number of starts permitted for the major motors per day which could place some constraints on plant operations during full production periods.
The detailed electrical design, capital cost estimates and power consumption estimates were prepared by AMEC. The estimated annual power consumption at maximum planned ore production levels of 4.654 million tonnes (5.119 million tons) per year and the allocation is shown in Table 11.1. Over the Project’s life, annual power consumption ranges from 20 to 28 million kilowatt-hours depending upon ore production. Power distribution on site is shown in Figure 11.2 and a single line diagram is shown in Figure 11.3.
| |
| GOLDEN QUEEN MINING CO. LTD./ 08-3256 |
| SOLEDAD MOUNTAIN FEASIBILITY STUDY |
| 11-2 |
TABLE 11.1
POWER CONSUMPTION AT FULL PRODUCTION
| | Annual Power Consumption |
| Project Area | 000’s kWh |
| Ore Supply | 1,618 |
| Crushing & Screening | 3,609 |
| HPGR | 11,247 |
| Heap Leach Conveying & Stacking | 2,822 |
| General Plant Services | 182 |
| Merrill-Crowe Plant | 5,724 |
| Laboratory | 911 |
| Solution Management and Water Supply | 1,197 |
| Workshop & Warehouse | 297 |
| Fuel Storage & General Services | 268 |
| Total | 28,313 |
An allowance has been made for a diesel-powered generator to provide standby power and this will be located beside the Merrill-Crowe plant. The standby generator will power the pregnant, barren and future recycle solution pumps in case of a power outage.
| 11.4 | WATER SUPPLY |
| | |
| 11.4.1 | Description of the Aquifer |
A water supply will be required for the Project and groundwater has been selected as the source of the required water. Golder did a detailed study of the hydrogeology of the area and issued a report dated May 2, 2007. The report was updated in 2010 by ARCADIS U.S., Inc., an independent consulting engineering firm based in Highlands Ranch, Colorado (“Soledad Mountain Project, Hydrogeology Study (Update)”, Prepared by ARCADIS U.S., Inc., July 8, 2010). Both reports are available in the GQM offices in Vancouver.
The Project is located at the southern end of the Fremont Valley groundwater basin near the center of the Gloster sub-basin. The primary aquifer in the Project area is the Quaternary alluvium which fills the basins and wide expanses of the Mojave Desert between isolated bedrock outcrops. The alluvium ranges in thickness from 0 m to 90 m (0 ft to 300 ft) on the flanks of Soledad Mountain and may be up to 213 m (700 ft) thick in the greater Mojave area. Alluvium is typically composed of silt, sand, gravel and boulders. Studies have shown that the aquifer materials have a relatively low permeability in the order of 1x10⁻⁴ cm/sec (3.9x10 -5 inches/second).
| |
| GOLDEN QUEEN MINING CO. LTD./ 08-3256 |
| SOLEDAD MOUNTAIN FEASIBILITY STUDY |
| 11-3 |
The dominant regional flow of groundwater in the basin north and east of Soledad Mountain is easterly and in the basin west and south of Soledad Mountain is southerly. Groundwater flow paths bifurcate and groundwater flows north and south around the relatively impermeable mass of Soledad Mountain. East of Soledad Mountain, groundwater flows into the California City sub-basin and further down-gradient to Koehn Lake, a dry lake, and this is the lowest point in the Fremont Valley basin with an elevation of 591 m (1,940 ft) above MSL.
Groundwater recharge is primarily from the Tehachapi and San Gabriel mountains several miles to the southwest, west and northwest of the Project area. At the mountain front, alluvial fans (termed bajadas) receive runoff from the higher mountains and act as points of recharge. As groundwater flows from west to east, faults and bedrock outcrops act as barriers to groundwater flowing through the alluvium.
There are no springs or intermittent streams in the immediate Project area. The closest stream is approximately 5 km (3 miles) to the west. Evaporation rates are high with mean annual evaporation of 2,027 mm (79.8 inch). Mean recorded annual rainfall is 156 mm (6.14 inch). Precipitation, which does not evaporate, runs off rapidly with no evidence of groundwater recharge from runoff in the immediate Project area.
Regular water level checks in six monitoring wells, three production wells, and a number of domestic water wells on site show that groundwater in the area has minimal gradient and water levels have remained virtually static for the past ten years. Information provided by the Mojave Public Utilities District indicates that water levels in wells surrounding the town of Mojave have remained relatively static for the past two decades.
Wells in the greater Mojave area have produced from several hundred to several thousand gallons per minute if drilled and completed in well-defined layers of gravel or sand in the alluvium. All wells in the immediate Project area are small-diameter, relatively shallow, domestic water wells and there is currently no known agricultural or industrial use of groundwater in the area.
| | 11.4.2 | Characterization/Monitoring Wells & Water Quality |
Three characterization/monitoring wells were drilled and equipped on site in September 1996 and groundwater monitoring has been done regularly since then. Analyses have been performed by a State-certified laboratory. The Lahontan Regional Water Quality Control Board requested that two additional characterization/monitoring wells be drilled to add to the information provided by the three existing wells and these wells were drilled and completed in the fall of 2007. The sixth characterization/monitoring well was drilled in November 2010. Well locations are shown in Figure 9.3.
| |
| GOLDEN QUEEN MINING CO. LTD./ 08-3256 |
| SOLEDAD MOUNTAIN FEASIBILITY STUDY |
| 11-4 |
Groundwater in the region is generally poor and not potable. The groundwater is typically calcium bicarbonate in character near the surrounding mountains and sodium bicarbonate or sodium sulfate in character in the central part of the Antelope Valley basin.
Based on data collected to date, the groundwater has pH values generally between 8 and 9. Arsenic concentrations are consistently above the California maximum contaminant level (MCL) of 10 µg/L with concentrations in MW-3 as high as 314 µg/L. Naturally occurring high background levels for arsenic in groundwater have been well-documented in the area. Fluoride concentrations are near the MCL of 2 mg/L.
ARCADIS U.S., Inc. did a detailed analysis of groundwater quality based upon eight quarters of sampling under a very strict protocol in 2010 (ARCADIS U.S., 2010). The report is available in the GQM offices in Vancouver.
Experience at historical operations in the area shows that the groundwater can be used in the heap leach process without pre-treatment.
Water will be required for dust control during construction and for compaction when laying the foundation of the Phase 1, Stage 1 heap leach pad. Water will be drawn from production well PW-1 and pumped to the main water storage tank.
The estimated average rate at which water will be required once the mine is in full production is 147.6 m3 (650 gal/min) with detail shown in Table 11.2.
TABLE 11.2
WATER CONSUMPTION AT FULL PRODUCTION
Project Area
| Water Consumption |
| l/min | gal/min |
| Process water | 1815 | 479 |
| Dust control (roads, stockpiles) | 409 | 108 |
| Aggregate Processing & Miscellaneous | 239 | 63 |
| Total | 2464 | 650 |
| |
| GOLDEN QUEEN MINING CO. LTD./ 08-3256 |
| SOLEDAD MOUNTAIN FEASIBILITY STUDY |
| 11-5 |
The water balance for the project was originally completed by GQM personnel and confirmed by a detailed analysis done by Golder. The Golder analysis indicates that a small portion of the water required will be made up by precipitation that will accumulate in the overflow pond although this has not been allowed for in the estimates shown in Table 11.2. Note that the Kern County Board of Supvervisors approved a water entitlement of 170 m3/h (750 gal/min) in the CUPs issued in 1997.
Bottled drinking water will be provided in all areas.
Three water production wells have been drilled on site. Production well PW-1 was drilled and capped in September 1996. The well was tested to yield 170 m3/h (750 gal/min). It was considered prudent to drill and test production well PW-2 to support the 2005 feasibility study. The well was drilled in 2005 and was developed and tested to yield from 45 m3/h (200 gal/min) to 68 m3/h (300 gal/min). A third production well, PW-3, was drilled west of Soledad Mountain to a depth of 183 m (600 ft) in October 2008. GQM has awarded a contract for the development and testing of PW-3 in March 2011 and this is just being completed.
Note that the combined capacity of the three production wells should be in excess of water requirements for the Project.
| | 11.4.5 | Design & Cost Estimates |
GQM retained AMEC to do detailed engineering for the water supply and water distribution system for the Project and this included the fire water system. The agreement with AMEC was signed on August 16, 2010.
The design was done with close interaction between AMEC engineers, engineers familiar with conditions on site and GQM management. A strategy for the operation of the system is set out in a memorandum dated November 17, 2010 and this note, a set of drawings and cost estimates are available in the GQM offices in Vancouver. Note that cost estimates were provided by contractors in Lancaster who are familiar with local conditions.
The location of the six characterization/monitoring wells and three production wells is shown in Figure 9.3.
Water will be pumped to the main water storage tank and two firewater tanks. The main water storage tank will have a capacity of 87 m3 (23,000 gal) and will be set at an elevation of 2,930 ft. The firewater tanks will have a capacity of 227 m3 (60,000 gal each) and will also be set at an elevation of 2,930 ft. A small pump station will be located beside the main water storage tank to supply the crushing-screening plant water storage tank.
| |
| GOLDEN QUEEN MINING CO. LTD./ 08-3256 |
| SOLEDAD MOUNTAIN FEASIBILITY STUDY |
| 11-6 |
| | 11.4.6 | Monitoring Programs Required by the Conditional Use Permits |
It is a condition set in the Conditional Use Permits issued by Kern County for the Project that GQM will monitor groundwater levels in the production wells on a monthly basis and compare water levels to those predicted by the groundwater drawdown model. If the actual drawdown exceeds the predicted levels for six consecutive months, GQM will supplement the water drawn from the production wells with up to 68 m3/h (300 gal/min) of water purchased from the Antelope Valley – East Kern Water Agency.
GQM is evaluating the use of recycled water for the Project with the Rosamond Community Services District. GQM has engaged a firm of consulting engineers to do a study to find a suitable route for a pipeline and to prepare capital and operating cost estimates for such a project.
| 11.5 | EXPLOSIVES STORAGE FACILITY |
| | |
| 11.5.1 Type of Explosive & Powder Factor |
The new security requirements that were introduced to combat the threat of terrorist activities in the United States make contract blasting the preferred option and a contract blaster will be used. There are several suppliers in the region capable of meeting the requirements of the project. Alpha Explosives Inc. (Alpha), a Dyno Nobel distributor based in Mojave, and Maxam North America (Maxam) based in Salt Lake City have both made full-service proposals.
Based on the available groundwater data, blastholes are expected to be dry through the life of the mine and only ANFO will be used as a blasting agent. A powder factor of 0.18 kg/t or 0.42 kg/m3(0.36 lb/ton or 0.71 lb/yd3) was used to estimate explosives consumption.
Alpha prices are effective November 1, 2010. The full-service price on the basis of one blast every second day is $0.1527/t ($0.1388/ton) of ore and waste. This assumes that Alpha provides labor for stemming blast holes and this could be done at a lower cost by the mine helpers.
Alpha provides service to a number of mines and quarries in the area and has a bulk storage facility for ammonium nitrate prill in Mojave. Alpha also receives prill by rail and this is a key consideration in dealing with a local supplier as moving freight by rail is more energy efficient than moving the same quantity of prill by truck on the highway. This is reflected in the above price.
GQM purchased 23 acres of fee land from the heirs of the Bert Wegmann estate in June 2007 and the proposed explosives storage facilities have now been located on this parcel as shown in Figure 9.3. The facilities will initially include only two magazines and an office trailer. GQM will prepare the site and provide power and water to the site.
| |
| GOLDEN QUEEN MINING CO. LTD./ 08-3256 |
| SOLEDAD MOUNTAIN FEASIBILITY STUDY |
| 11-7 |
Maxam prepared a note on security requirements in California and provided a model Security Plan that can serve as a basis for a site-specific security plan.
| |
| GOLDEN QUEEN MINING CO. LTD./ 08-3256 |
| SOLEDAD MOUNTAIN FEASIBILITY STUDY |
| 11-8 |
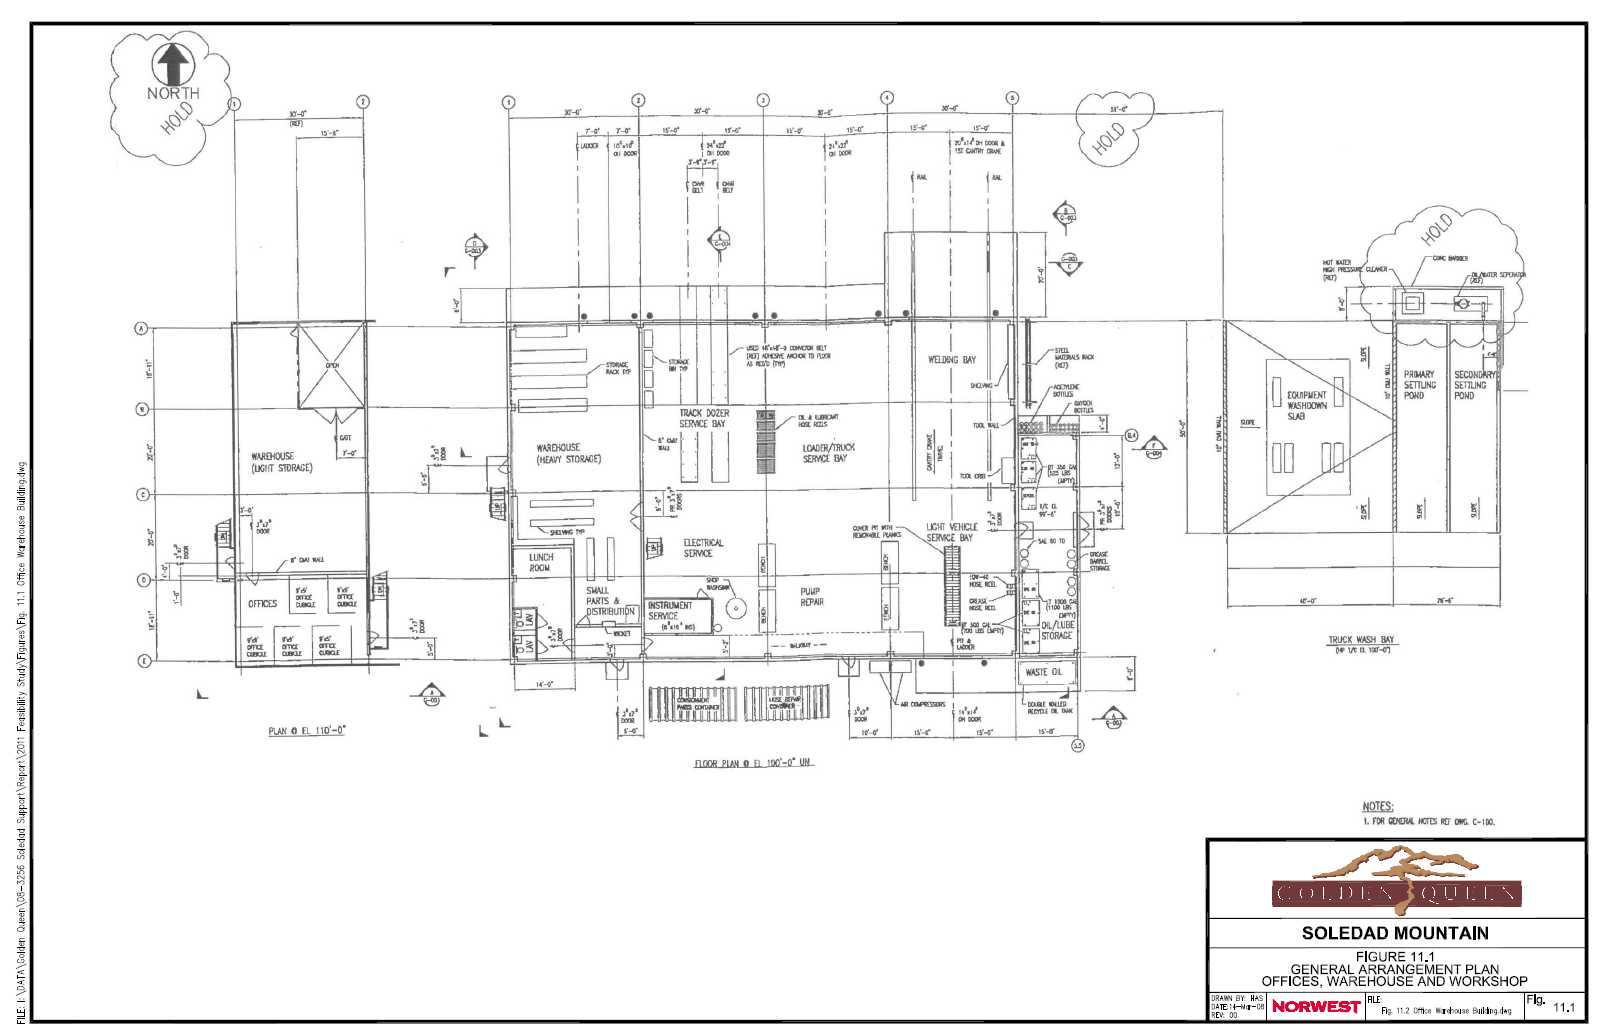
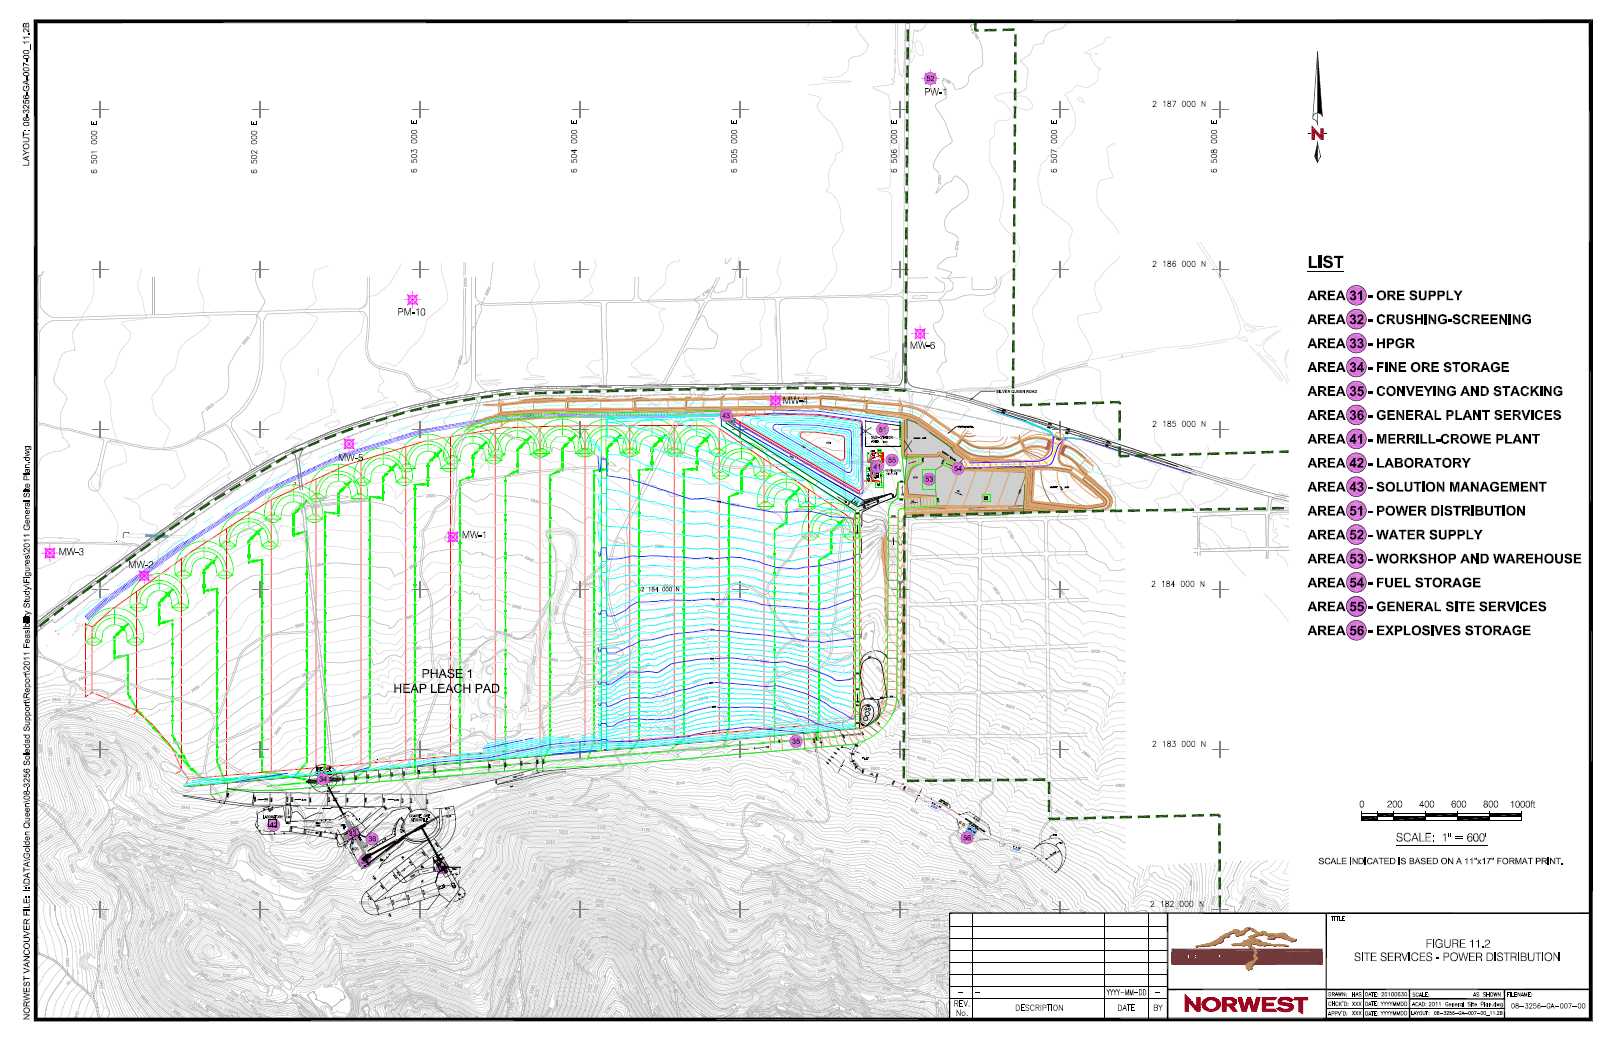
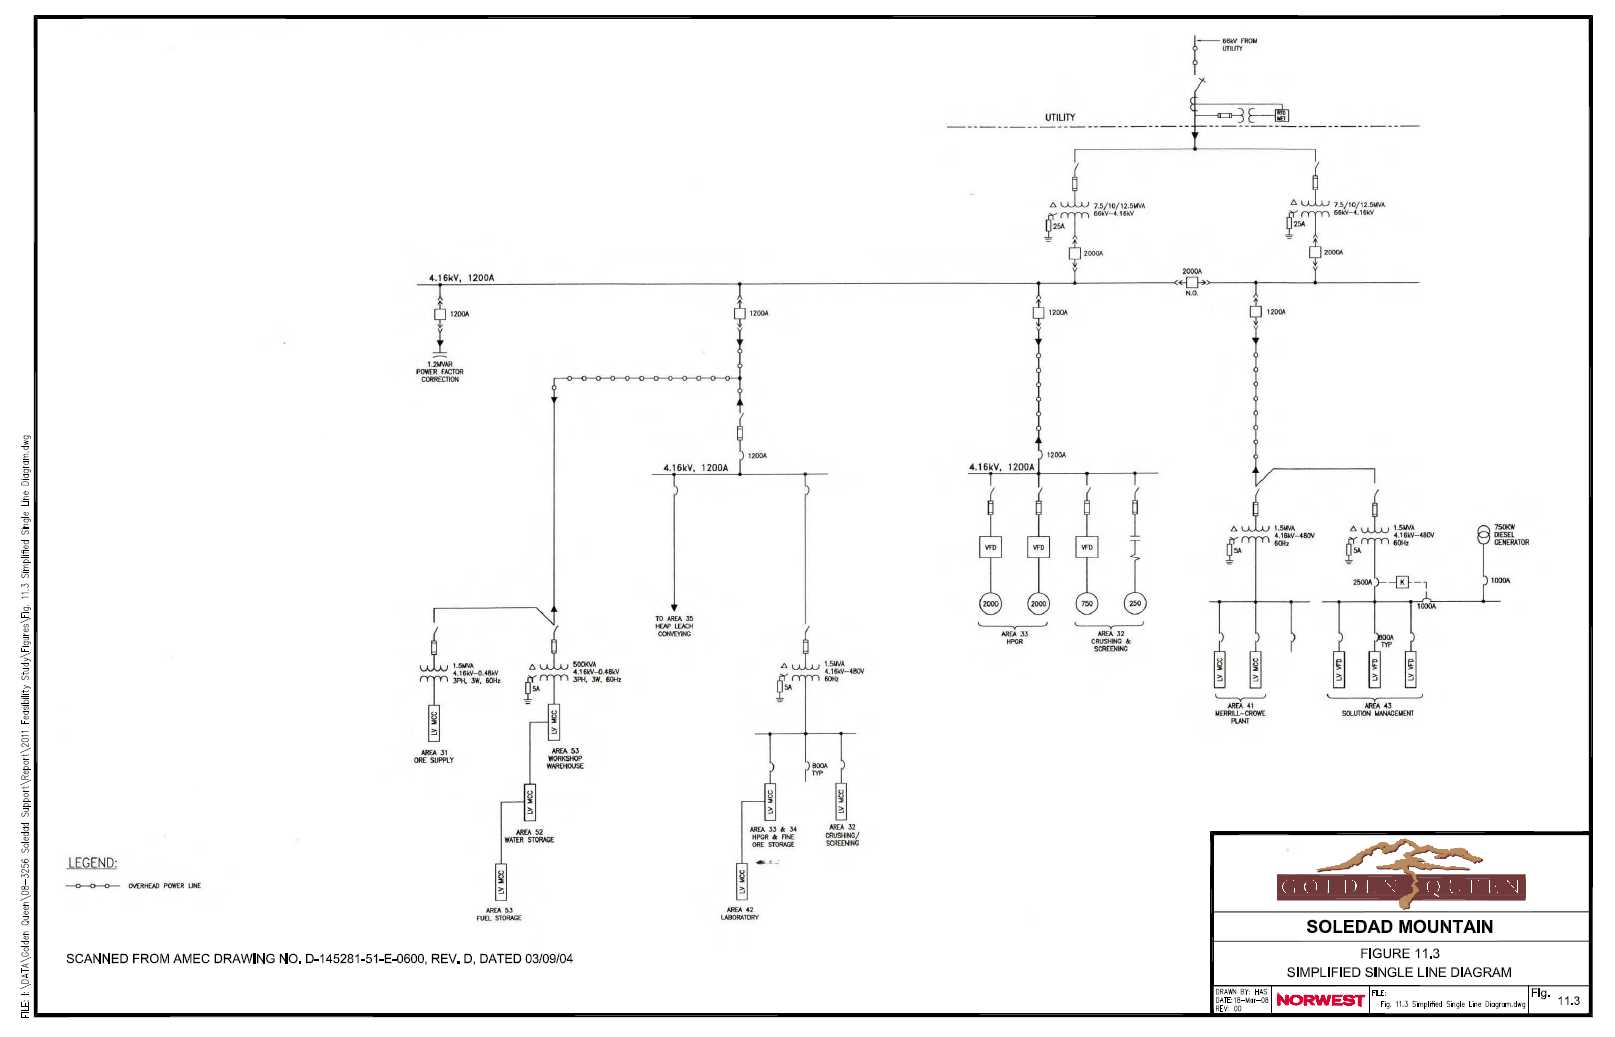
| 12 | PERSONNEL |
| | |
| 12.1 | SALARIED PERSONNEL |
GQM salaried personnel will be responsible for the management and technical aspects of the operation. Responsibilities handled by the salaried personnel cover the areas of operations, processing, environment, maintenance and accounting/payroll. During full production, the number of salaried personnel on site will typically be 32. A small number of salaried personnel will be hired in the year prior to production to assist in the construction phase of the Project.
Table 12.1 provides a breakdown of the positions and numbers required for the operation.
The shift schedule of the salary personnel is dependent upon their position. Mine operations foremen will work with the production crew they are responsible for on a 12 hour shift. The majority of the engineering staff, superintendents and administrative/clerical personnel will work an 8 hour shift.
Salary and benefits costs for salaried personnel are covered in the operating costs section.
| |
| GOLDEN QUEEN MINING CO. LTD./ 08-3256 |
| SOLEDAD MOUNTAIN FEASIBILITY STUDY |
| 12-1 |
TABLE 12.1
SALARIED PERSONNEL
| | Position | Number |
| Services |
General Management
| General Manager | 1 |
| Manager - Administration | 1 |
| Purchasing Manager | 1 |
| Human Resources Coordinator | 1 |
| Manager - Accounting & Audit | 1 |
Services
| Manager - Services & Environment | 1 |
| Mine Planning Engineer | 2 |
| Drilling/Blasting Engineer | 1 |
| Chief Geologist | 1 |
| Aggregate Quality Control Engineer | 1 |
| Geologist/Grade Control technician | 2 |
| Surveyor | 1 |
| Safety & Training | Safety & Training Engineer | 1 |
| Environmental Monitoring & Reporting | Environmental Engineer | 1 |
| Sub-Total | 16 |
| Plant |
Management
| Manager- Plant Operations | 1 |
| Process Engineer | 1 |
| Operation | Plant Operations Forman | 4 |
| Laboratory | Chief Chemist | 1 |
| Sub-Total | 7 |
| Maintenance |
Management
| Manager-Maintenance | 1 |
| Maintenance Forman | 2 |
| Maintenance Engineer/Purchasing Coordinator | 1 |
| Sub-Total | 4 |
| Mine |
| Management | Mine Manager | 1 |
| Operation | Mine Operations Forman | 4 |
| Sub-Total | 5 |
| Total Staff | 32 |
| |
| GOLDEN QUEEN MINING CO. LTD./ 08-3256 |
| SOLEDAD MOUNTAIN FEASIBILITY STUDY |
| 12-2 |
Hourly personnel will be responsible for direct mine and process operations including: ore and waste excavation and haulage, crushing and processing, maintenance, and support. It is expected that personnel will be employed directly by GQM.
GQM plans to run the operation with personnel from the local area. Currently, employment levels in the area are relatively low, therefore it is expected that sufficient numbers of personnel can be found. However, given the limited amount of mining activity in the area, training of personnel for mine operations will be required as new personnel are hired.
The schedule for the hourly personnel is based on the following assumptions:
| Base work hours per year (351 days per year) | = 2,106 hours |
| Vacation per year | = 80 hours |
| Net working hours per year | = 2,026 hours |
| Annual allowance for training, absenteeism, sickness | = 40 hours |
| Shift cycle of 4 x 12 hours / shift | = 48 hours per cycle |
The above assumptions have been used in the calculation of employee requirements on an annual basis.
Table 12.2 shows the number of hourly personnel required on an annual basis over the Project’s life. Numbers increase rapidly during the initial years of mining to a peak of 141 personnel. In order to reduce the variation in employment numbers over the Project life, the feasibility of using increased overtime to cover peak production periods should be examined.
| |
| GOLDEN QUEEN MINING CO. LTD./ 08-3256 |
| SOLEDAD MOUNTAIN FEASIBILITY STUDY |
| 12-3 |
TABLE 12.2
COMBINED SALARIED AND HOURLY PERSONNEL REQUIREMENTS
Personnel Category
| Year
0 | Year
1 | Year
2 | Year
3 | Year
4 | Year
5 | Year
6 | Year
7 | Year
8 | Year
9 | Year
10 | Year
11 | Year
12 | Year
13 |
Total Ore/Waste
Mining Operations | 29
| 56
| 57
| 55
| 55
| 57
| 50
| 41
| 49
| 63
| 49
| 54
| 41
| 0
|
Services and
Support Personnel |
3
|
8
|
8
|
8
|
8
|
8
|
8
|
8
|
8
|
8
|
8
|
8
|
8
|
2
|
| Process Plant Personnel | 3 | 27 | 33 | 33 | 33 | 33 | 30 | 30 | 33 | 33 | 33 | 33 | 33 | 9 |
| Maintenance Personnel | 10 | 24 | 35 | 37 | 37 | 37 | 37 | 31 | 31 | 37 | 37 | 37 | 27 | 2 |
| Total Hourly Personnel | 45 | 115 | 133 | 133 | 133 | 135 | 125 | 110 | 121 | 141 | 127 | 132 | 109 | 13 |
Salaried Staff &
Support Personnel |
22 |
31 |
32 |
32 |
32 |
32 |
32 |
32 |
32 |
32 |
32 |
32 |
30 |
4 |
| Total | 67 | 146 | 165 | 165 | 165 | 167 | 157 | 142 | 153 | 173 | 159 | 164 | 139 | 17 |
| |
| GOLDEN QUEEN MINING CO. LTD./ 08-3256 |
| SOLEDAD MOUNTAIN FEASIBILITY STUDY |
| 12-4 |
| 13 | CAPITAL & OPERATING COSTS |
| | |
| 13.1 | DEVELOPMENT CAPITAL COST SUMMARY |
Table 13.1 shows the estimated development capital by major areas. Total development capital including owner’s cost is $105.7 million.
TABLE 13.1
DEVELOPMENT CAPITAL SUMMARY (US$000’S)
| Cost Area | Year 0 | Year 1 | Total |
| Site Support, Permitting and Design | $598 | $0 | $598 |
| Site Preparation | $1,474 | $37 | $1,511 |
| Mine Pre-Development | $7,058 | $0 | $7,058 |
| Crushing & Screening Systems | $22,098 | $0 | $22,098 |
| Leach Pad Development | $11,058 | $0 | $11,058 |
| Merrill-Crowe + Process Systems | $6,346 | $146 | $6,492 |
| Sampling & Analysis | $1,732 | $0 | $1,732 |
| Site utilities (Water, Power) | $11,020 | $0 | $11,020 |
| Mine Equipment | $7,827 | $10,952 | $18,779 |
| Buildings and Facilities | $2,257 | $0 | $2,257 |
| General Services | $1,078 | $30 | $1,108 |
| EPCM + Commissioning | $3,598 | $286 | $3,884 |
| Spare Parts | $524 | $524 | $1,049 |
| Pre-production Overhead | $1,164 | $0 | $1,164 |
| Sub-total | $77,832 | $11,975 | $89,807 |
| Contingency | $4,829 | $2,414 | $7,243 |
| Working Capital | $0 | $8,662 | $8,662 |
| Total | $82,661 | $23,051 | $105,712 |
The capital cost shown above assumes all equipment is purchased outright by GQM. Norwest understands that GQM has been in negotiations with equipment suppliers regarding possible leasing agreements for major mining equipment. Such an agreement would reduce initial Project capital and the effects of this are discussed in Section 14.
| |
| GOLDEN QUEEN MINING CO. LTD./ 08-3256 |
| SOLEDAD MOUNTAIN FEASIBILITY STUDY |
| 13-1 |
In order to generate a +/- 10% accuracy estimate, engineering drawings were developed for all disciplines involved in the determination of the facility design. The drawings ranged from basic topographical maps of the site, process design flow sheets, P&IDs and detailed general arrangements of facilities, supplemented by detailed engineering designs as set out in more detail in sub-section 13.1.2. Equipment lists and outlines of performance specifications were also developed for major components.
Bids from suitable facilities suppliers and equipment manufacturers were solicited, with a focus on acquiring bids from those located in the region, many of whom are familiar with existing conditions and infrastructure.
Manpower, equipment and bulk material quantity costs were estimated using recent Project data and take-offs from the engineering drawings.
The following criteria were used to develop the capital and operating cost estimates:
Project location and classification– approximately 8km (5 miles) west of Mojave, California, new open pit mine development, including upgrading existing vehicular access as needed.
Power supply– power to be supplied by SCE from a 66 kV line that runs along the property boundary.
Water supply– initial water supply is from groundwater with possible supply of recycled water from the Rosamond Community Services District.
Estimated design and construction dates– detailed engineering design for construction began in 2009 to support construction beginning in the second quarter of 2011.
Current mine life / life of facilities– one year for construction, twelve years of mining with one year of additional leaching and two years of neutralizing and rinsing. The potential for aggregate production using crushed waste rock is being actively pursued and could be carried on for up to 30 years.
Facility usage level– 351 days/year, 24 hours/day (two 12-hour shifts) mining and operation of the crushing-screening plant and conveying and stacking system and 365 days/year, 24 hours/day (two 12-hour shifts) for the processing facilities such as the Merrill-Crowe plant and the assay laboratory and support facilities.
| |
| GOLDEN QUEEN MINING CO. LTD./ 08-3256 |
| SOLEDAD MOUNTAIN FEASIBILITY STUDY |
| 13-2 |
Design ore processing capacity– greater than 4.6 million tonnes or 5.1 million tons per year.
Regulatory classification– designs require approval and sign-off by a number of county and State agencies, including US Mine Safety and Health Administration (MSHA) (generally the design and operations ruling agency).
Equipment and facility sources– only new equipment is used for the capital and operating cost estimates.
Personnel pool availability– excellent manpower availability in the greater Mojave area; travel to/from Mojave and the surrounding communities during construction; no man camp required; housing will be in Mojave or the surrounding communities.
Waste rock disposal– only one waste rock dump east of the open pits and in-pit backfilling.
| | 13.1.3 | Development Capital |
Total development capital including owner’s cost is $105.7 million with detail provided in Table 13.1.
| | 13.1.3.1 | Engineering Detailed Design |
GQM retained several design companies who have completed detailed designs for final construction cost estimates.
| | 13.1.3.2 | Construction Field Coordination |
It is assumed that GQM will maintain oversight of all construction and initial mining activities with a number of contractors managing construction of the key Project components. The construction management team will consist of a combination of a GQM project manager and support personnel, the relevant design consultants, and construction specialist personnel. The start-up commissioning team will consist of GQM’s site team with support from the construction team. Key project components are set out below:
| |
| GOLDEN QUEEN MINING CO. LTD./ 08-3256 |
| SOLEDAD MOUNTAIN FEASIBILITY STUDY |
| 13-3 |
Assay laboratory
Crushing-screening plant
Overland conveyor and conveying and stacking system
Power supply and power distribution
Water supply and water storage
Merrill-Crowe plant
Construction of the Phase 1, Stage 1 heap leach pad
Specific allowances have been generalized in the indirect costs listed previously, and will include:
Commissioning spares and maintenance manuals
Initial fills and operation manual
Owner’s risk insurance
Vendor representatives
Construction equipment requirements determined by AMEC and contractors
Soils and concrete testing
| | 13.1.5 | Initial Mining Costs |
Initial waste rock and ore mining and road construction has been included in the development capital. The geology of the North-West Pit is such that waste and ore are released early in mining without the need for significant pre-stripping of waste rock. Ore mined during Year 0 will be stockpiled and then crushed and placed on the Phase 1, Stage 1 heap leach pad as the drainage layer.
Sustaining capital costs are estimated as shown in Table 13.2. The total sustaining capital for the project is approximately $24.8 million inclusive of sales taxes. The sustaining capital includes purchase of a carbon plant for short-term use during the winding down of the process circuit. The majority of cost associated with the purchase of the carbon plant are recovered in the following year when it is assumed this unit is resold and a portion of its cost recovered.
| |
| GOLDEN QUEEN MINING CO. LTD./ 08-3256 |
| SOLEDAD MOUNTAIN FEASIBILITY STUDY |
| 13-4 |
TABLE 13.2
SUSTAINING CAPITAL (US$000’S)
| Item | Units | Year 1 | Year 2 | Year 3 | Year 4 | Year 5 | Year 6 | Year 7 | Year 8 | Year 9 | Year 10 | Year 11 | Year 12 | Year 13 | Total |
| Mining Equipment |
| Atlas Copco DM45 crawler drill | $ | 779 | 0 | 0 | 0 | 0 | 0 | 0 | 917 | 0 | 0 | 0 | 0 | 0 | 1,697 |
| Komatsu WA800-3 Loader | | | | | | | | | 1,585 | 1,585 | | | | | 3,170 |
| Support Equipment Replacements |
| Pickup truck - 4*4 | $ | 0 | 0 | 0 | 99 | 124 | 99 | 0 | 74 | 74 | 50 | 0 | 0 | 0 | 521 |
| Crew cab - 4*4 | $ | 0 | 0 | 0 | 30 | 0 | 30 | 0 | 31 | 0 | 30 | 0 | 0 | 0 | 121 |
| Cargo van | $ | 0 | 0 | 0 | 0 | 25 | 0 | 0 | 0 | 0 | 0 | 0 | 0 | 0 | 25 |
| Maintenance truck | $ | 0 | 0 | 0 | 34 | 34 | 34 | 0 | 34 | 34 | 0 | 0 | 0 | 0 | 170 |
| Welder - Big Blue Air Pak - for maintenance truck | $ | 0 | 0 | 0 | 0 | 24 | 0 | 0 | 0 | 24 | 0 | 0 | 0 | 0 | 48 |
| Crew bus | $ | 0 | 0 | 0 | 29 | 0 | 0 | 0 | 29 | 0 | 0 | 0 | 0 | 0 | 57 |
| Heap support vehicle | $ | 0 | 0 | 0 | 0 | 13 | 0 | 0 | 0 | 0 | 13 | 0 | 0 | 0 | 25 |
| Light plant | $ | 0 | 0 | 12 | 12 | 0 | 12 | 12 | 0 | 12 | 12 | 0 | 0 | 0 | 69 |
| Crushing-Screening Plant |
| Capital spare parts for the cone crusher | $ | 0 | 0 | 0 | 235 | 0 | 0 | 0 | 235 | 0 | 0 | 0 | 0 | 0 | 470 |
| Capital spare parts for the HPGR | $ | 0 | 1,579 | 148 | 0 | 0 | 0 | 0 | 0 | 0 | 0 | 0 | 0 | 0 | 1,727 |
| Other Sustaining Capital |
| Solution distribution pump, pipe and fittings (Nominal) | $ | 0 | 0 | 125 | 0 | 0 | 0 | 0 | 125 | 0 | 0 | 0 | 0 | 0 | 250 |
| Mine water supply (See Water Supply & Storage) | $ | 0 | 78 | 0 | 0 | 0 | 0 | 0 | 0 | 0 | 0 | 0 | 0 | 0 | 78 |
| Construction of heap leach pad - Phase 1, Stages 2 & 3 | $ | 0 | 0 | 10,016 | 0 | 0 | 0 | 6,962 | 0 | 0 | 0 | 0 | 0 | 0 | 16,978 |
| Preparation and placing of the overliner $1.00/yd3 | $ | 0 | 0 | 256 | 0 | 0 | 0 | 165 | 0 | 0 | 0 | 0 | 0 | 0 | 421 |
| Carbon plant for closure | $ | 0 | 0 | 0 | 0 | 0 | 0 | 0 | 0 | 0 | 0 | 0 | 1,500 | -1,200 | 300 |
| Freight | $ | 15 | 45 | 15 | 15 | 8 | 8 | 15 | 0 | 8 | 8 | 0 | 15 | 0 | 150 |
| Engineering for capital projects | $ | 0 | 0 | 75 | 0 | 0 | 0 | 75 | 0 | 0 | 0 | 0 | 35 | 0 | 185 |
| QA/QC for the construction of the leach pad | $ | 0 | 0 | 150 | 0 | 0 | 0 | 150 | 0 | 0 | 0 | 0 | 0 | 0 | 300 |
| Total ex sales tax | $ | 794 | 1,703 | 10,797 | 454 | 228 | 182 | 7,379 | 3,030 | 1,736 | 111 | 0 | 1,550 | -1,200 | 26,764 |
| Sales tax on materials | $ | 64 | 136 | 23 | 36 | 18 | 14 | 27 | 145 | 12 | 9 | 0 | 0 | 0 | 486 |
| Total including sales tax excluding deposits | $ | 859 | 1,839 | 10,820 | 490 | 246 | 197 | 7,406 | 3,175 | 1,748 | 120 | 0 | 1,550 | -1,200 | 27,250 |
| |
| GOLDEN QUEEN MINING CO. LTD./ 08-3256 |
| SOLEDAD MOUNTAIN FEASIBILITY STUDY |
| 13-5 |
The estimated working capital required is $8.7 million. This is an estimate of the cash required from the initial commissioning of the facilities until positive cashflow is achieved. The estimate was based on assuming working capital equivalent to four months of operating costs would be required.
| | 13.1.8 | Contingency (Unallocated Cost) |
Allowance has been made for unallocated costs of $7.2 million (or 10% of the total estimated development capital cost excluding major mine equipment). This is judged to be a reasonable allowance in light of the detailed engineering that has been completed and accompanying cost estimates that have been obtained from vendors and contractors for the Project.
| 13.2 | OPERATING COSTS |
| | |
| 13.2.1 Estimating Method |
The operating costs are developed from zero-base budgeting using estimated labour rates, equipment productivities and supply costs (i.e. diesel fuel, explosives, reagents and a range of operating supplies).
The mine operating cost estimates in this section of the report include all mining and process related activities from the start of production up to the production of gold and silver dorè. Downstream smelting and refining charges and royalties are included as stand-alone items in the cashflow model and therefore in the economic analysis.
The operating costs are divided into a number of operating cost centres as set out below:
Mining (Drilling, Blasting, Loading, Hauling, Surface Crew, Overhauls)
Ore Supply
Crushing & Screening
Conveying & Stacking
Solution Management
Merrill-Crowe Plant
Laboratory
Maintenance
| |
| GOLDEN QUEEN MINING CO. LTD./ 08-3256 |
| SOLEDAD MOUNTAIN FEASIBILITY STUDY |
| 13-6 |
Consumable costs: budgetary quotations were acquired from vendors and suppliers. Some mining equipment costs were developed from data in “Mining Cost Service” by CostMine, InfoMine USA, Inc. and from current California supplier quotations.
All operating costs are presented in US$ (first quarter 2011). No escalation or inflation is included in any of the operating costs from first quarter 2011 onwards. Table 13.3 summarizes the average operating costs over the Project’s life (without allowances for contingency).
| |
| GOLDEN QUEEN MINING CO. LTD./ 08-3256 |
| SOLEDAD MOUNTAIN FEASIBILITY STUDY |
| 13-7 |
TABLE 13.3
OPERATING COSTS SUMMARY
| Area | Units | Year 0 | Year 1 | Year 2 | Year 3 | Year 4 | Year 5 | Year 6 | Year 7 | Year 8 | Year 9 | Year 10 | Year 11 | Year 12 | Year 13 | Total |
| Mine | $ | 0 | 11,515,000 | 12,675,000 | 15,482,000 | 13,032,000 | 12,889,000 | 13,891,000 | 9,711,000 | 10,672,000 | 15,811,000 | 11,206,000 | 12,711,000 | 7,118,000 | 87,000 | 146,800,000 |
| Ore Supply | $ | 0 | 344,000 | 441,000 | 437,000 | 454,000 | 472,000 | 469,000 | 473,000 | 472,000 | 447,000 | 473,000 | 450,000 | 280,000 | 0 | 5,212,000 |
| Crushing & Screening | $ | 0 | 1,455,000 | 1,817,000 | 1,791,000 | 1,899,000 | 2,014,000 | 1,997,000 | 2,025,000 | 2,019,000 | 1,853,000 | 2,021,000 | 1,875,000 | 1,464,000 | 0 | 22,230,000 |
| Conveying & Stacking | $ | 0 | 1,394,000 | 1,777,000 | 1,745,000 | 1,879,000 | 2,023,000 | 2,001,000 | 2,038,000 | 2,030,000 | 1,822,000 | 2,032,000 | 1,849,000 | 1,473,000 | 0 | 22,063,000 |
| Solution Management | $ | 0 | 359,000 | 391,000 | 387,000 | 403,000 | 419,000 | 417,000 | 421,000 | 420,000 | 396,000 | 420,000 | 399,000 | 357,000 | 214,000 | 5,003,000 |
| Merrill-Crowe Plant | $ | 0 | 2,157,000 | 2,934,000 | 3,249,000 | 3,383,000 | 3,598,000 | 3,550,000 | 3,734,000 | 3,688,000 | 3,569,000 | 3,537,000 | 2,975,000 | 2,594,000 | 356,000 | 39,324,000 |
| Laboratory | $ | 0 | 509,000 | 573,000 | 573,000 | 573,000 | 573,000 | 573,000 | 573,000 | 573,000 | 573,000 | 573,000 | 573,000 | 440,000 | 97,000 | 6,776,000 |
| Maintenance | $ | 0 | 2,314,000 | 2,853,000 | 2,891,000 | 2,901,000 | 2,913,000 | 2,911,000 | 2,658,000 | 2,657,000 | 2,897,000 | 2,913,000 | 2,899,000 | 1,622,000 | 234,000 | 32,663,000 |
| General Site Support | $ | 0 | 65,000 | 65,000 | 65,000 | 65,000 | 65,000 | 65,000 | 65,000 | 65,000 | 65,000 | 65,000 | 65,000 | 33,000 | 2,000 | 750,000 |
| Power | $ | 0 | 1,620,000 | 2,004,000 | 1,972,000 | 2,107,000 | 2,250,000 | 2,229,000 | 2,265,000 | 2,257,000 | 2,049,000 | 2,260,000 | 2,076,000 | 1,758,000 | 305,000 | 25,152,000 |
| Services | $ | 0 | 1,304,000 | 1,331,000 | 1,306,000 | 1,291,000 | 1,267,000 | 1,267,000 | 1,267,000 | 1,267,000 | 1,267,000 | 1,246,000 | 1,224,000 | 761,000 | 117,000 | 14,915,000 |
| Administration | $ | 0 | 1,788,000 | 1,711,000 | 1,711,000 | 1,711,000 | 1,719,000 | 1,711,000 | 1,711,000 | 1,711,000 | 1,719,000 | 1,711,000 | 1,688,000 | 1,228,000 | 570,000 | 20,689,000 |
| Diesel Fuel Contingency | $ | 0 | 510,000 | 543,000 | 534,000 | 534,000 | 548,000 | 479,000 | 380,000 | 468,000 | 536,000 | 464,000 | 531,000 | 316,000 | 0 | 5,843,000 |
| Total before Sales Taxes | $ | 0 | 25,334,000 | 29,115,000 | 32,143,000 | 30,232,000 | 30,750,000 | 31,560,000 | 27,321,000 | 28,299,000 | 33,004,000 | 28,921,000 | 29,315,000 | 19,444,000 | 1,982,000 | 347,420,000 |
Sales taxes
(Operating supplies) |
$ |
0 |
518,000 |
675,000 |
877,000 |
760,000 |
778,000 |
883,000 |
751,000 |
731,000 |
920,000 |
744,000 |
694,000 |
501,000 |
17,000 |
8,849,000 |
| Subtotal Sales Tax | $ | 0 | 933,000 | 1,163,000 | 1,173,000 | 1,019,000 | 814,000 | 897,000 | 778,000 | 908,000 | 995,000 | 816,000 | 758,000 | 535,000 | 20,000 | 10,809,000 |
| Total Operating Costs | $ | 0 | 26,267,000 | 30,278,000 | 33,316,000 | 31,251,000 | 31,564,000 | 32,457,000 | 28,099,000 | 29,207,000 | 33,999,000 | 29,737,000 | 30,073,000 | 19,979,000 | 2,002,000 | 358,229,000 |
| Ore Tons | tons | 327,000 | 3,005,000 | 4,198,000 | 4,099,000 | 4,518,000 | 4,964,000 | 4,897,000 | 5,009,000 | 4,985,000 | 4,338,000 | 4,993,000 | 4,422,000 | 3,587,000 | 0 | 53,341,000 |
| Total Operating Cost/Ton of Ore | $/ton | 0.00 | 8.74 | 7.21 | 8.13 | 6.92 | 6.36 | 6.63 | 5.61 | 5.86 | 7.84 | 5.96 | 6.80 | 5.57 | 0.00 | 6.72 |
| |
| GOLDEN QUEEN MINING CO. LTD./ 08-3256 |
| SOLEDAD MOUNTAIN FEASIBILITY STUDY |
| 13-8 |
Mine operating costs were based on hourly costs for major equipment supplemented with cost factors for mining support equipment. Mining costs were determined on an activity basis, as follows:
Direct mining: drilling, blasting, loading and hauling and
Surface crew: road watering, grading, mine helpers.
The costs are based on data from equipment vendors, in-house databases, and the 2010 edition of “Mining Cost Service” by CostMine, InfoMine USA, Inc. and quotes provided by equipment vendors. These mining costs include overhaul and maintenance parts and supplies, fuel and lube, tires and wear parts (as applicable). Table 13.5 summarizes hourly costs for major mining equipment.
TABLE 13.4
EQUIPMENT UNIT COSTS
Equipment
|
Fuel
Lubricants
$/h |
Parts
$/h
|
Labor
$/h
| Major Overhaul |
Total
Costs $/h
|
Spare
Parts $/h |
Labor
$/h |
| Crawler Drill - 6.75 inch | 56.81 | 10.50 | 8.41 | 11.00 | 13.45 | 100.17 |
| Crawler Drill - 4.50 inch | 34.67 | 13.50 | 10.82 | 9.63 | 11.77 | 80.39 |
| Front-end loader - 14.4 yd3 | 53.54 | 62.98 | 50.46 | 20.77 | 6.71 | 194.46 |
| Excavator - 4.0 yd3 | 27.30 | 22.95 | 18.39 | 4.15 | 1.50 | 74.29 |
| Haul Truck - 100 ton | 38.21 | 24.32 | 19.48 | 16.07 | 4.74 | 102.82 |
| Haul Truck - 40 ton | 21.49 | 12.50 | 10.01 | 12.12 | 1.25 | 57.37 |
| Track-type dozer - 452 hp (gross) | 33.94 | 22.13 | 17.73 | 6.86 | 4.38 | 85.04 |
| Wheel dozer - 522 hp (gross) | 33.94 | 28.35 | 22.71 | 10.03 | 2.81 | 97.84 |
| Grader - 14 ft moldboard | 13.57 | 13.50 | 10.82 | 3.26 | 1.56 | 42.71 |
| Water wagon - 8,000 gal | 22.87 | 10.00 | 8.01 | 11.64 | 2.40 | 54.92 |
| Excavator with rock breaker | 9.97 | 7.50 | 6.01 | 2.60 | 2.10 | 28.18 |
| Rock breaker | 0.37 | 2.00 | 1.60 | 1.32 | 1.08 | 6.37 |
| Heap dozer | 10.15 | 5.38 | 1.88 | 1.20 | 0.98 | 19.59 |
Note: Costs exclude sales tax on materials
| |
| GOLDEN QUEEN MINING CO. LTD./ 08-3256 |
| SOLEDAD MOUNTAIN FEASIBILITY STUDY |
| 13-9 |
In addition to the above activity costs, additional costs are included for maintenance (labour and support equipment) but excluding engineering services.
The mining operating costs vary depending upon the amount of ore and waste rock being mined and once the mine is in full production the costs range from a high of $1.55/t ($1.41/ton) of ore and waste rock mined in Year 9 to a low of $1.29/t (1.17/ton) of ore and waste rock mined in Year 2. The average mining cost is $1.38/t ($1.25/ton) of ore and waste rock mined over the life of the mine.
Mining costs range from $2.86/t ($2.60/ton) to $5.27/t ($4.79/ton) of ore crushed over the life of the mine with an average cost of $3.93/t ($3.57/ton) of ore crushed.
Note that the costs reported in sub-section 13.2.3 are based on ownership of the equipment. The effect of leasing equipment on operating costs is discussed in the following section. Cost reported in sub-section 13.2.3 include do however include all sales taxes.
| | 13.2.4 | Equipment Leasing Costs |
The base case for Project development plan calls for purchase of the major mining equipment as detailed in the capital costs shown. As noted previously, GQM has held negotiations with major equipment suppliers and has received quotes for leasing of mining equipment. An equipment supplier has made a lease-financing proposal which is the basis for the information provided in Table 13.5. This proposal allows that when equipment needs to be replaced, a new lease following similar conditions to the original lease will be taken out. The average cost of leasing the equipment, including the security deposit of 25%, interest and $1.47 million in sales tax and net of the residual value is $0.46/t ($0.41/ton) of ore crushed over the Project’s life.
The decision to purchase or lease the equipment is a choice between financing options which must be made by GQM’s management.
| |
| GOLDEN QUEEN MINING CO. LTD./ 08-3256 |
| SOLEDAD MOUNTAIN FEASIBILITY STUDY |
| 13-10 |
TABLE 13.5
LEASE FINANCING DETAIL
| Description | Item | Units | Unit Cost | $/month | Year 0 | Year 1 | Year 2 | Year 3 | Year 4 | Year 5 | Year 6 | Year 7 | Year 8 | Year 9 | Year 10 | Year 11 | Year 12 | Year 13 | Year 14 | Year 15 | Total |
| Front-end loader | 15 yd3 capacity | $ | 1,585,000 | 32,000 | 0 | 383,000 | 383,000 | 383,000 | 383,000 | 32,000 | 0 | 0 | 383,000 | 383,000 | 383,000 | 383,000 | 32,000 | 0 | 0 | 0 | 3,128,000 |
| | 15 yd3 capacity | $ | 1,585,000 | 32,000 | 0 | 383,000 | 383,000 | 383,000 | 383,000 | 32,000 | 0 | 0 | 0 | 383,000 | 383,000 | 383,000 | 383,000 | 32,000 | 0 | 0 | 3,128,000 |
| Excavator | 5 yd3 capacity | $ | 597,000 | 15,000 | 185,000 | 185,000 | 185,000 | 15,000 | 0 | 0 | 0 | 0 | 0 | 0 | 0 | 0 | 0 | 0 | 0 | 0 | 570,000 |
| Off-highway mining truck | 100 ton capacity | $ | 1,304,000 | 26,000 | 0 | 311,000 | 311,000 | 311,000 | 311,000 | 26,000 | 0 | 0 | 0 | 0 | 0 | 0 | 0 | 0 | 0 | 0 | 1,270,000 |
| | 100 ton capacity | $ | 1,304,000 | 26,000 | 0 | 311,000 | 311,000 | 311,000 | 311,000 | 26,000 | 0 | 0 | 0 | 0 | 0 | 0 | 0 | 0 | 0 | 0 | 1,270,000 |
| | 100 ton capacity | $ | 1,304,000 | 26,000 | 0 | 311,000 | 311,000 | 311,000 | 311,000 | 26,000 | 0 | 0 | 0 | 0 | 0 | 0 | 0 | 0 | 0 | 0 | 1,270,000 |
| | 100 ton capacity | $ | 1,304,000 | 26,000 | 0 | 311,000 | 311,000 | 311,000 | 311,000 | 26,000 | 0 | 0 | 0 | 0 | 0 | 0 | 0 | 0 | 0 | 0 | 1,270,000 |
| | 100 ton capacity | $ | 1,304,000 | 26,000 | 0 | 311,000 | 311,000 | 311,000 | 311,000 | 26,000 | 0 | 0 | 0 | 0 | 0 | 0 | 0 | 0 | 0 | 0 | 1,270,000 |
| | 100 ton capacity | $ | 1,304,000 | 26,000 | 0 | 311,000 | 311,000 | 311,000 | 311,000 | 26,000 | 0 | 0 | 0 | 0 | 0 | 0 | 0 | 0 | 0 | 0 | 1,270,000 |
| Off-highway articulated mining truck | 40 ton capacity | $ | 542,000 | 14,000 | 173,000 | 173,000 | 173,000 | 14,000 | 0 | 0 | 0 | 0 | 0 | 0 | 0 | 0 | 0 | 0 | 0 | 0 | 533,000 |
| Off-highway articulated mining truck | 40 ton capacity | $ | 542,000 | 14,000 | 173,000 | 173,000 | 173,000 | 14,000 | 0 | 0 | 0 | 0 | 0 | 0 | 0 | 0 | 0 | 0 | 0 | 0 | 533,000 |
| Rubber-tired dozer | 520hp gross | $ | 796,000 | 21,000 | 0 | 254,000 | 254,000 | 254,000 | 21,000 | 0 | 0 | 0 | 0 | 0 | 0 | 0 | 0 | 0 | 0 | 0 | 783,000 |
| Track-type dozer | 450hp gross | $ | 757,000 | 20,000 | 242,000 | 242,000 | 242,000 | 20,000 | 0 | 0 | 0 | 0 | 0 | 0 | 0 | 0 | 0 | 0 | 0 | 0 | 746,000 |
| | 450hp gross | $ | 757,000 | 20,000 | 0 | 242,000 | 242,000 | 242,000 | 20,000 | 0 | 0 | 0 | 0 | 0 | 0 | 0 | 0 | 0 | 0 | 0 | 746,000 |
| Grader | 200hp gross | $ | 262,000 | 7,000 | 81,000 | 81,000 | 81,000 | 7,000 | 0 | 0 | 0 | 0 | 0 | 0 | 0 | 0 | 0 | 0 | 0 | 0 | 250,000 |
| Water wagon | | $ | 510,000 | 14,000 | 173,000 | 173,000 | 173,000 | 6,000 | 0 | 0 | 0 | 0 | 0 | 0 | 0 | 0 | 0 | 0 | 0 | 0 | 525,000 |
| Excavator | Utility unit | $ | 232,000 | 6,000 | 0 | 76,000 | 76,000 | 76,000 | 23,000 | 0 | 0 | 0 | 0 | 0 | 0 | 0 | 0 | 0 | 0 | 0 | 251,000 |
| Rock breaker | | $ | 61,000 | 2,000 | 0 | 20,000 | 20,000 | 20,000 | 2,000 | 0 | 0 | 0 | 0 | 0 | 0 | 0 | 0 | 0 | 0 | 0 | 62,000 |
| Residual value | | $ | 0 | 0 | 0 | 0 | 0 | 0 | 0 | 0 | 0 | 0 | 0 | 0 | 0 | 0 | 0 | 0 | -1,564,000 | 0 | -1,564,000 |
| Total | | $ | 16,047,000 | 0 | 1,028,000 | 4,255,000 | 4,255,000 | 3,304,000 | 2,700,000 | 217,000 | 0 | 0 | 383,000 | 767,000 | 767,000 | 767,000 | 415,000 | 32,000 | -1,564,000 | 0 | 17,311,000 |
| Security deposit 25% | | $ | 0 | 0 | 4,012,000 | 0 | 0 | 0 | 0 | 0 | 0 | 396,000 | 396,000 | 0 | 0 | 0 | 0 | 0 | 0 | 0 | 4,804,000 |
| Grand Total | | $ | 0 | 0 | 5,040,000 | 4,255,000 | 4,255,000 | 3,304,000 | 2,700,000 | 217,000 | 0 | 396,000 | 779,000 | 767,000 | 767,000 | 767,000 | 415,000 | 32,000 | -1,564,000 | 0 | 22,115,000 |
Note: Security deposit of 25% is part of leasing costs for equipment.
| |
| GOLDEN QUEEN MINING CO. LTD./ 08-3256 |
| SOLEDAD MOUNTAIN FEASIBILITY STUDY |
| 13-11 |
| | 13.2.5 | Materials Handling and Processing Costs |
The materials handling and processing cost have been determined based on manpower, liners, consumables, and maintenance supplies. Details for the various materials handling and processing circuits are provided in their respective sections. Power consumption and the cost of power have been estimated by AMEC and are reported on a site-wide basis in sub-section 13.2.5.4.
The average ore crushing, screening, conveying and stacking, Merrill-Crowe plant, solution management and laboratory costs are shown in Table 13.6 for materials consumed.
| |
| GOLDEN QUEEN MINING CO. LTD./ 08-3256 |
| SOLEDAD MOUNTAIN FEASIBILITY STUDY |
| 13-12 |
TABLE 13.6
ORE CRUSHING , SCREENING , CONVEYING AND STACKING COST
| Item | Year 1 | Year 2 | Year 3 | Year 4 | Year 5 | Year 6 | Year 7 | Year 8 | Year 9 | Year 10 | Year 11 | Year 12 | Total |
| Conveying & Stacking | $1,394,000 | $1,777,000 | $1,745,000 | $1,879,000 | $2,023,000 | $2,001,000 | $2,038,000 | $2,030,000 | $1,822,000 | $2,032,000 | $1,849,000 | $1,473,000 | $22,062,000 |
| Crushing & Screening | $1,455,000 | $1,817,000 | $1,791,000 | $1,899,000 | $2,014,000 | $1,997,000 | $2,025,000 | $2,019,000 | $1,853,000 | $2,021,000 | $1,875,000 | $1,464,000 | $22,231,000 |
| Merrill-Crowe Plant | $1,651,000 | $2,428,000 | $2,742,000 | $2,877,000 | $3,091,000 | $3,044,000 | $3,228,000 | $3,182,000 | $3,063,000 | $3,030,000 | $2,469,000 | $2,088,000 | $32,893,000 |
| Solution Management | $153,000 | $185,000 | $181,000 | $197,000 | $213,000 | $210,000 | $215,000 | $214,000 | $190,000 | $214,000 | $193,000 | $151,000 | $2,316,000 |
| Laboratory | $158,000 | $169,000 | $169,000 | $169,000 | $169,000 | $169,000 | $169,000 | $169,000 | $169,000 | $169,000 | $169,000 | $158,000 | $2,006,000 |
| Total | $4,811,000 | $6,376,000 | $6,628,000 | $7,021,000 | $7,510,000 | $7,421,000 | $7,675,000 | $7,614,000 | $7,097,000 | $7,466,000 | $6,555,000 | $5,334,000 | $81,508,000 |
TABLE 13.7
LABOR COSTS
| | Year 1 | Year 2 | Year 3 | Year 4 | Year 5 | Year 6 | Year 7 | Year 8 | Year 9 | Year 10 | Year 11 | Year 12 | Year 13 | Total |
| Mine General | 480,000 | 480,000 | 480,000 | 480,000 | 480,000 | 480,000 | 480,000 | 480,000 | 480,000 | 480,000 | 480,000 | 240,000 | 0 | 5,520,000 |
| Drilling | 268,000 | 402,000 | 402,000 | 402,000 | 402,000 | 335,000 | 268,000 | 268,000 | 402,000 | 335,000 | 402,000 | 268,000 | 0 | 4,154,000 |
| Blasting | 0 | 0 | 0 | 0 | 0 | 0 | 0 | 0 | 0 | 0 | 0 | 0 | 0 | 0 |
| Loading | 508,000 | 508,000 | 508,000 | 508,000 | 508,000 | 508,000 | 363,000 | 436,000 | 508,000 | 508,000 | 508,000 | 290,000 | 0 | 5,661,000 |
| Hauling | 2,412,000 | 2,345,000 | 2,211,000 | 2,211,000 | 2,345,000 | 1,943,000 | 1,541,000 | 2,010,000 | 2,747,000 | 1,876,000 | 2,144,000 | 1,340,000 | 0 | 25,125,000 |
| Surface Crew | 501,000 | 501,000 | 501,000 | 501,000 | 501,000 | 501,000 | 501,000 | 501,000 | 501,000 | 501,000 | 501,000 | 251,000 | 0 | 5,762,000 |
| Ore Supply | 187,000 | 250,000 | 250,000 | 250,000 | 250,000 | 250,000 | 250,000 | 250,000 | 250,000 | 250,000 | 250,000 | 125,000 | 0 | 2,812,000 |
| Crushing & Screening | 549,000 | 694,000 | 694,000 | 694,000 | 694,000 | 694,000 | 694,000 | 694,000 | 694,000 | 694,000 | 694,000 | 520,000 | 0 | 8,009,000 |
| Conveying & Stacking | 312,000 | 417,000 | 417,000 | 417,000 | 417,000 | 417,000 | 417,000 | 417,000 | 417,000 | 417,000 | 417,000 | 312,000 | 0 | 4,794,000 |
| Solution Management | 206,000 | 206,000 | 206,000 | 206,000 | 206,000 | 206,000 | 206,000 | 206,000 | 206,000 | 206,000 | 206,000 | 206,000 | 206,000 | 2,678,000 |
| Merrill-Crowe Plant | 506,000 | 506,000 | 506,000 | 506,000 | 506,000 | 506,000 | 506,000 | 506,000 | 506,000 | 506,000 | 506,000 | 506,000 | 253,000 | 6,325,000 |
| Laboratory | 351,000 | 404,000 | 404,000 | 404,000 | 404,000 | 404,000 | 404,000 | 404,000 | 404,000 | 404,000 | 404,000 | 282,000 | 57,000 | 4,730,000 |
| Maintenance | 1,977,000 | 2,590,000 | 2,735,000 | 2,735,000 | 2,735,000 | 2,735,000 | 2,479,000 | 2,479,000 | 2,735,000 | 2,735,000 | 2,735,000 | 1,505,000 | 225,000 | 30,400,000 |
| Services | 1,108,000 | 1,108,000 | 1,108,000 | 1,108,000 | 1,108,000 | 1,108,000 | 1,108,000 | 1,108,000 | 1,108,000 | 1,108,000 | 1,108,000 | 701,000 | 81,000 | 12,970,000 |
| Administration | 661,000 | 661,000 | 661,000 | 661,000 | 661,000 | 661,000 | 661,000 | 661,000 | 661,000 | 661,000 | 661,000 | 472,000 | 171,000 | 7,914,000 |
| Total Labor Costs | 10,028,000 | 11,071,000 | 11,082,000 | 11,082,000 | 11,216,000 | 10,747,000 | 9,877,000 | 10,419,000 | 11,618,000 | 10,680,000 | 11,015,000 | 7,020,000 | 993,000 | 126,848,000 |
| |
| GOLDEN QUEEN MINING CO. LTD./ 08-3256 |
| SOLEDAD MOUNTAIN FEASIBILITY STUDY |
| 13-13 |
| | 13.2.5.1 | Crushing and Materials Handling |
The crushing and materials handling circuit costs include the wear parts, liners, belts and related equipment for the operation of the primary crusher, the crushing and screening plant and the conveying and stacking system. The average cost of operating the primary crusher is $0.053/t ($0.048/ton) of ore crushed. The average cost of crushing and screening the ore is $0.46/t$ 0.42/ton of ore crushed. The average cost of operating the conveying and stacking system is $0.45/t ($0.41/ton) of ore crushed. Note that the cost of cement as a binder has been included in the conveying and stacking system operating cost.
| | 13.2.5.2 | Leach Pad Operations (Solution Management) |
The leach pad operations unit cost includes consumables such as drip lines, the use of support equipment (such as the tracked dozer used for contouring the leach pile) and the operating cost of pumps for pumping solutions to the Merrill-Crowe plant. The average cost is $0.103/t ($0.094/ton) of ore crushed.
Costs related to construction of the heap leach pad are treated as capital costs.
| | 13.2.5.3 | Merrill-Crowe Plant and Assay Laboratory |
The Merrill-Crowe plant and assay laboratory require consumables and reagents during their operation. The average cost of consumables and reagents for the Merrill-Crowe plant is $0.803/t ($0.73/ton) of ore crushed. Note that reagents such as NaCN, zinc powder and antiscalant have been included in the Merrill-Crowe plant operating costs. The average cost of consumables and reagents for the assay laboratory is $0.042/t ($0.038/ton) of ore crushed. Labor costs for the laboratory are captured in the overall labor costs.
The major portion of electrical power consumed is related to the materials handling and processing facilities. During full production the typical annual power cost ranges from $1.6 to $2.3 million. The average cost of power is $0.52/t ($0.47/ton) ore of ore crushed.
| | 13.2.5.5 | Supervision and Hourly Labor |
Average costs for staff and labor are $2.62/t ($2.38/ton) of ore crushed as shown in Table 13.7 (see previous page). Average burden rates for all employees are 31.34% .
| | 13.2.6 | Soledad Mountain Closure Costs |
Reclamation and closure costs are based on the estimates included in theApplication for a revised Surface Mining and Reclamation Planprepared by GQM and submitted to the Kern County Planning and Community Development Department in April 2007 (Revised May 25, 2009). Allowance has been made for a reclamation accrual of $0.095/t ($0.0868 per ton) of ore and waste rock mined. The reclamation accrual has been charged as an operating cost in the cash flows and is accumulated in a reclamation fund. The actual expenditures will be incurred from Year 12 onwards with no further impact on cash flows.
| |
| GOLDEN QUEEN MINING CO. LTD./ 08-3256 |
| SOLEDAD MOUNTAIN FEASIBILITY STUDY |
| 13-14 |
| | 13.2.7 | Administration Costs |
Administration costs average $0.43/t ($0.39 per ton) of ore crushed and this includes the cost of staff and labor. Typical annual administration costs once the mine is in full production are shown in Table 13.8.
The State sales tax is 8.25% and has been applied to all applicable costs. Sales taxes have been explicitly broken out for materials with the exception of fuel, lubricants, blasting supplies and power where it was already included in the price. There are a number of sales taxes payable for the Project (sales taxes on consumables, sales tax on the equipment purchase and sales tax on applicable items in the sustaining capital) which are shown as a line item in the cashflow model.
| | 13.2.8.1 | Total Operating Cost Summary |
Table 13.9 provides a summary of the operating costs over the Project life including as the post-operations reclamation and closure phase.
| |
| GOLDEN QUEEN MINING CO. LTD./ 08-3256 |
| SOLEDAD MOUNTAIN FEASIBILITY STUDY |
| 13-15 |
TABLE 13.8
ADMINISTRATIVE COSTS
Manpower & Equipment
Designation |
Year 1 |
Year 2 |
Year 3 |
Year 4 |
Year 5 |
Year 6 |
Year 7 |
Year 8 |
Year 9 |
Year 10 |
Year 11 |
Year 12 |
Year 13 |
Total |
| Total employee costs | 661,000 | 661,000 | 661,000 | 661,000 | 661,000 | 661,000 | 661,000 | 661,000 | 661,000 | 661,000 | 661,000 | 472,000 | 171,000 | 7,911,463 |
| Total administrative costs | 726,000 | 649,000 | 649,000 | 649,000 | 657,000 | 649,000 | 649,000 | 649,000 | 657,000 | 649,000 | 627,000 | 355,000 | 198,000 | 7,763,127 |
| Security | 197,000 | 197,000 | 197,000 | 197,000 | 197,000 | 197,000 | 197,000 | 197,000 | 197,000 | 197,000 | 197,000 | 197,000 | 99,000 | 2,463,750 |
| Freight | 100,000 | 100,000 | 100,000 | 100,000 | 100,000 | 100,000 | 100,000 | 100,000 | 100,000 | 100,000 | 100,000 | 50,000 | 25,000 | 1,175,000 |
| Total head office charges | 204,000 | 204,000 | 204,000 | 204,000 | 204,000 | 204,000 | 204,000 | 204,000 | 204,000 | 204,000 | 204,000 | 204,000 | 102,000 | 2,550,000 |
| Grand Total | 1,788,000 | 1,711,000 | 1,711,000 | 1,711,000 | 1,719,000 | 1,711,000 | 1,711,000 | 1,711,000 | 1,719,000 | 1,711,000 | 1,688,000 | 1,228,000 | 570,000 | 20,688,340 |
TABLE 13.9
OPERATING COSTS + TAX + RECLAMATION
| Items | Year 0 | Year 1 | Year 2 | Year 3 | Year 4 | Year 5 | Year 6 | Year 7 | Year 8 | Year 9 | Year 10 | Year 11 | Year 12 | Year 13 | Total |
| Total Operating Cost Before Property Taxes | 0 | 25,985,000 | 29,950,000 | 33,181,000 | 31,160,000 | 31,700,000 | 32,614,000 | 28,245,000 | 29,202,000 | 34,090,000 | 29,839,000 | 30,169,000 | 20,065,000 | 2,018,000 | 358,218,000 |
| Property Tax | 0 | 5,390,000 | 5,930,000 | 6,081,000 | 5,544,000 | 4,880,000 | 4,531,000 | 4,141,000 | 3,330,000 | 2,628,000 | 2,092,000 | 1,439,000 | 895,000 | 307,000 | 47,187,000 |
| Reclamation & Mine Closing | 155,000 | 1,021,000 | 1,227,000 | 1,198,000 | 1,223,000 | 1,200,000 | 1,136,000 | 884,000 | 995,000 | 1,211,000 | 1,103,000 | 1,206,000 | 658,000 | 0 | 13,217,000 |
| Total | 155,000 | 32,396,000 | 37,107,000 | 40,460,000 | 37,927,000 | 37,780,000 | 38,281,000 | 33,270,000 | 33,527,000 | 37,929,000 | 33,034,000 | 32,814,000 | 21,618,000 | 2,325,000 | 418,622,000 |
Note: Reclamation and mine closing costs apply only to the heap leach operation.
| |
| GOLDEN QUEEN MINING CO. LTD./ 08-3256 |
| SOLEDAD MOUNTAIN FEASIBILITY STUDY |
| 13-16 |
| 14 | ECONOMIC ANALYSIS FOR PROJECT |
Project cash flows are presented in Table 14.1 covering years zero to fifteen which encompasses Project start-up to reclamation and mine closing. The Project cash flow base case is pre-tax in constant dollars on an all equity basis. This assumes the company provides the capital required for mine start-up. The Project requires development capital of $79.7 million plus $17.4 million for mining equipment and $8.7 million in working capital. The total initial capital required is $105.7 million. In addition, there is $25.3 million in sustaining capital required over the life of the mine which includes heap leach pad expansions and replacement mining equipment. Note that there are comments in Section 14.6.3 relating to the possibility of lease financing of the mining equipment which is being investigated by GQM.
| 14.1 | FINANCIAL ASSUMPTIONS |
Project cash flows for the base case use the price for gold of $1,457.00/oz and the price for silver of $39.63/oz , the London a.m. fix for precious metals on April 6th, 2001, for the life of the project. Capital and operating costs are not inflated.
All cash flows are pre-tax first quarter 2011, constant US$. Cash flows are discounted at various rates from zero to 9 % for the cash flow analysis.
Cash flows reflect county property taxes as an operating cost. Property taxes for industrial projects in Kern County are calculated based on 1.0% of the calculated annual remaining net present value for the Project. The net present value is calculated on net cash flow after subtracting cost to produce saleable gold and silver, operating costs, accrual for reclamation, and all capital expenditures. The discount rate used for calculation of the annual NPV is negotiated with the county. The county indicate that a discount rate in the range of 17% is reasonable. A discount rate of 17.5% has been used in the cash flow projections for the calculation of property taxes. Property taxes total $47.2 million life of mine in the base case.
The Soledad Mountain Project will produce dorè on site. It is expected that the dorè will be shipped to a refinery located in Salt Lake City, Utah. The refinery charges breakdown is as follows:
| |
| GOLDEN QUEEN MINING CO. LTD./ 08-3256 |
| SOLEDAD MOUNTAIN FEASIBILITY STUDY |
| 14-1 |
Gold refining charge = $1.00/oz fine gold
QA/QC by owner’s representative = Fixed amount ranging from $6,000 to $12,000 per year.
Royalties paid to third party landholders and the State are shown as line items in Project cash flows in Table 14.1. Additional cash flow sensitivity analysis is summarized in Appendix A.
There are multiple third party landholders and the royalty formula applied to mine production varies with each property. This leads to a complex set of royalty calculations. A standard net smelter return per ton formula has been applied to the cash flows to calculate the estimated royalty payable. The estimated royalty payable over the Project life is approximately $79.4 million in the base case.
State royalties for payable gold and silver have been applied at the following rates:
Gold royalty = $5.00/oz gold (post-smelter)
Silver royalty = $0.10/oz silver (post-smelter)
The estimated combined gold and silver royalty paid to the State over the Project’s life is $5.7 million.
| 14.6 | OTHER ITEMS |
| | |
| 14.6.1 Salvage Value |
The evaluation assumes there is a salvage value of $13.2 million realized in Year 13 for the sale of mine equipment and plant facilities which can be removed from site. The salvage value for the mine equipment has been estimated by prorating the original equipment cost by the remaining useful life of the equipment and then applying a discount factor. A significant portion of the equipment value is attributed to the sale of the two primary loaders purchased late in the Project life.
| | 14.6.2 | Reclamation and Mine Closure Allowance |
Cash payments are deducted from cash flows during years 1 to 12 for reclamation and mine closure. The charge of $0.095/t ($0.0868/ton) of ore and waste mined was accrued and assumed to have been retained at an annual interest rate of 2%. The reclamation and mine closure fund totals approximately $15 million by Year 12. These funds are drawn down starting in Year 12 and reclamation and closure of the heap leach operation is projected to be completed by Year 15.
| |
| GOLDEN QUEEN MINING CO. LTD./ 08-3256 |
| SOLEDAD MOUNTAIN FEASIBILITY STUDY |
| 14-2 |
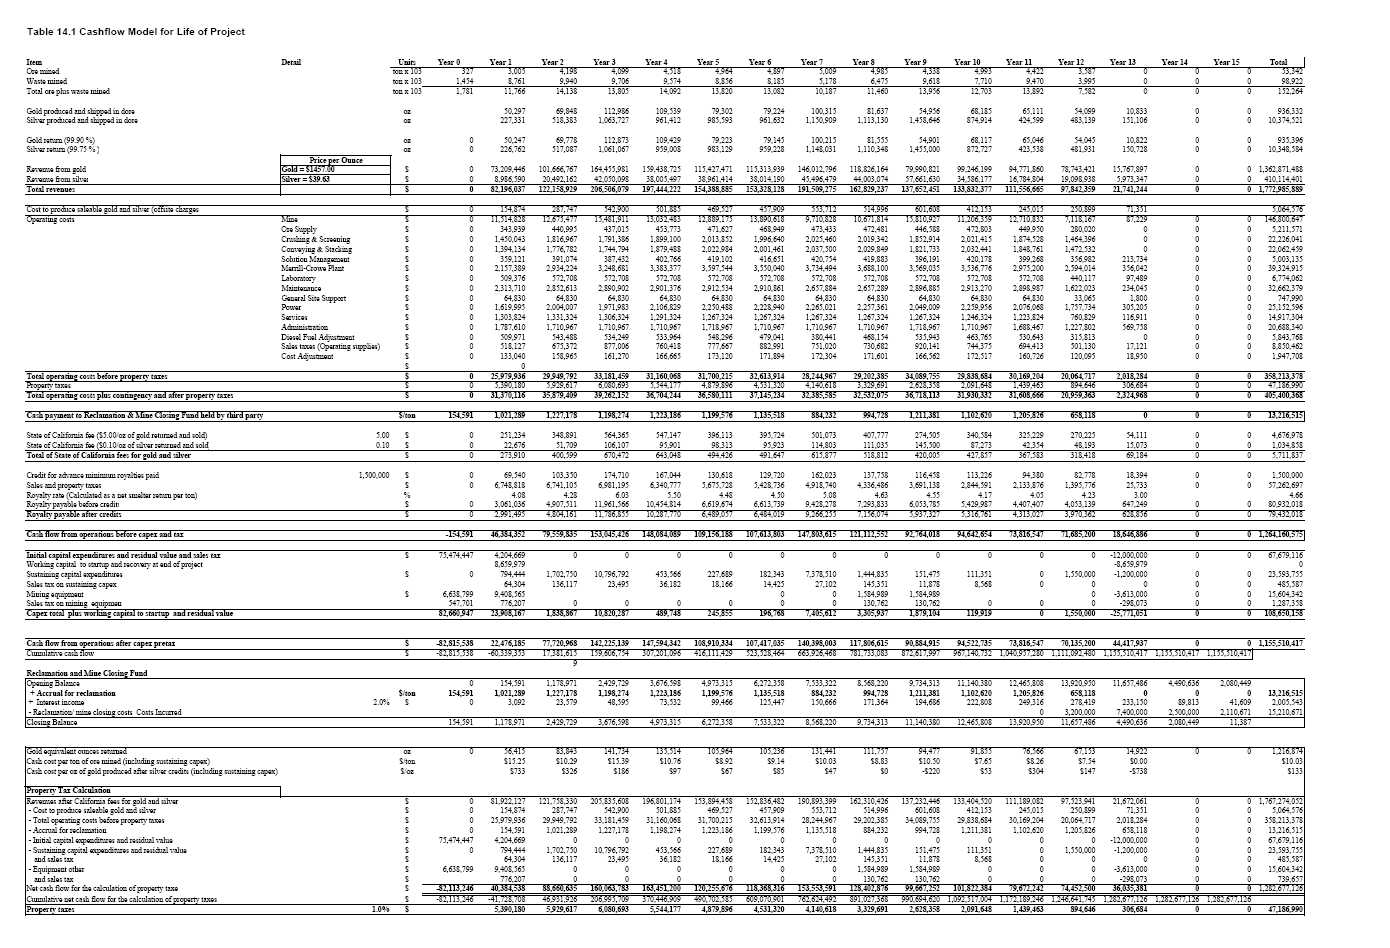
GQM has been in on-going negotiations with mining equipment suppliers as part of the Project development process. There is the potential for GQM to lease the major mining equipment as an alternative to outright purchase. A leasing cost schedule proposal for the major mining equipment from a regional equipment distributor was provided to Norwest by GQM. The value of the equipment listed in the proposal is approximately $16 million.
Leasing equipment for its mine life is a financing technique and does not change capital expenditures. Norwest understands that the viability of this option is continuing to be evaluated by GQM.
Project cash flows are shown pre-tax in constant dollars in Table 14.1. Table 14.2 shows the net present values pre-tax in constant dollars on an all equity basis using market gold and silver prices on April 6, 2011. The base case scenario using the selected 8% discount rate returns an NPV of $678 million. The internal rate of return (IRR) for the base case scenario is 83.7% .
TABLE 14.2
NET PRESENT VALUES (NPV) AT YEAR 0 PRE-TAX (BASE CASE)
| Constant dollars | Discount Rate |
| Discount Rate (%) | 0% | 5% | 8% |
| NPV Before Tax ($M) | $1,155 | $821 | $678 |
The Project generates positive cash flow in the first year of production and reaches cumulative positive cash flow approximately 22 months after the start of production. Cash flows remain positive each year thereafter through mine life.
The base case Project evaluation was completed using a gold price of $1457.00/oz and a silver price of $39.63/oz. Metal prices were held constant over the project life. Capital and operating costs are first quarter 2011 actuals and not inflated. The contribution of gold and silver to gross revenues is projected to be 77% and 23% respectively.
Sensitivity analyses were carried out using alternate gold and silver price cases including the 36 month average price case as shown in Table 14.3.
| |
| GOLDEN QUEEN MINING CO. LTD./ 08-3256 |
| SOLEDAD MOUNTAIN FEASIBILITY STUDY |
| 14-3 |
TABLE 14.3
PROJECT ECONOMICS WITH THREE YEAR AVERAGE METAL PRICES
| Constant Dollars | Values |
| Gold Price (US$/oz) | $1061.25 |
| Silver Price (US$$/oz) | $17.78 |
| NPV Before Tax 8 % DCF ($M) | $343 |
| IRR (%) | 51.6% |
| Cashflow Pre-Tax ($M) | $678 |
The sensitivity of the Project to increases in operating and capital costs were evaluated as well using current metal prices. The project NPV is relatively insensitive to increases in either of these costs as shown in Table 14.4 with the project generating NPV’s in excess of $600 million for cost increases up to 15%.
TABLE 14.4
PROJECT SENSITIVITY TO OPERATING AND CAPITAL COST VARIANCE
| Constant dollars $M | Change in Variable – Discount Rate at 8% |
| Change in Operating Costs | +5% | +10% | +15% |
| NPV Before Tax ($M) | $667 | $656 | $645 |
| Change in Capital Costs | +5% | +10% | +15% |
| NPV Before Tax ($M) | $672 | $667 | $661 |
Further evaluations for varying metal prices were also examined. Table 14.5 shows the NPV for a range of silver and gold price variances of +/-10% from the base case. The project NPV is still in excess of $550 million for a scenario where gold and silver prices both drop by 10%.
TABLE 14.5
PROJECT SENSITIVITY TO CHANGING METAL PRICES
NPV Pre-tax ($M)
Constant dollars at 8% DCF | Change in Gold Price from Base Case ($1457/oz) |
Change in
Silver Price
from Base
Case
($39.63/oz)
| %change | -10% | -5% | 0% | +5% | +10% |
| -10% | $579 | $618 | $656 | $695 | $733 |
| -5% | $590 | $629 | $667 | $705 | $744 |
| 0% | $601 | $640 | $678 | $717 | $755 |
| +5% | $612 | $651 | $690 | $728 | $766 |
| +10% | $623 | $662 | $701 | $739 | $777 |
| |
| GOLDEN QUEEN MINING CO. LTD./ 08-3256 |
| SOLEDAD MOUNTAIN FEASIBILITY STUDY |
| 14-4 |
| 15 | PROJECT RISKS AND OPPORTUNITIES |
| | |
| 15.1 | RISKS |
It will be important to implement effective grade control procedures, as otherwise dilution and/or ore losses may be higher than the estimates used in this study.
Project ore grades may be higher than currently modeled, or increases in gold price above the currently forecast level, could allow for lower grade ore to be mined economically. This could increase the size of the pits. It will be important to identify this as early as possible in the life of the mine, so that a different pit phasing can be followed to mine to the larger pit limits. Should additional ore be mined, leach pad capacity will be critical and strategies for optimizing the ore crushed and stacked on the pad or developing the Phase 2 heap leach pad may become necessary.
Heap leach operations will need to be optimized with operational experience. The leaching properties and timelines may be different on a large scale than indicated by the lab testing.
In the initial North-West Pit there exists a significant discrepancy between the Spring Model used for this feasibility study and the newer statistically based model that was completed by AMEC E&C Services, Inc. in 2007. Should the newer model be proven, a significant change in the initial pit design would be required.
Dust management may require additional efforts to control. This may include amending the surfaces of the haul roads to keep down dust. GQM has made allowance for the use of a lignin-based dust control product in discussion with GE Power & Water. The product is a binder specifically formulated to control fugitive dust from stockpiles and haul roads.
Costs for contractors, personnel, materials and equipment are volatile throughout North America. There could be significant changes in the construction costs depending upon the construction timeline for the Project.
| |
| GOLDEN QUEEN MINING CO. LTD./ 06-2880 |
| SOLEDAD MOUNTAIN FEASIBILITY STUDY |
| 15-1 |
| | 15.1.6 | Operating Cost Risk |
Costs for contractors, personnel and equipment are volatile throughout North America. There could be significant changes in the actual prices paid both before operations commence and during the Project’s operational mine life.
The Project is sensitive to changes in the price of diesel fuel as this is required for both the mining equipment and as a component of the explosives used on site. A diesel fuel contingency has been included as an operating cost item and this allows rapid adjustment of the operating cost estimates as diesel fuel prices fluctuate.
Process operating costs are based on the samples tested and the accuracy of the methods used to calculate reagent consumptions. To mitigate this risk and fully take advantage of any opportunities, an experienced and stable processing crew is required.
| | 15.1.7 | Legal/Permitting Risk |
The continued development of the property is contingent upon GQM receiving approval for the backfill plan and the accompanying “What If” scenario. This will be submitted to the Kern County Planning & Community Development Department in April 2011.
| | 15.2.1 | Geological Opportunity |
If operating costs are lower than estimated or gold and silver prices continue to stay at higher levels than assumed for the base case evaluation, cut-off grades could be lowered, increasing the size of the resource.
Within the existing pits there is a significant portion of inferred resource. Should this resource be proven in the course of operations it could add approximately fifty thousand ounces of gold and over one million ounces of silver. Note that GQM has initiated a limited infill drill program to demonstrate that inferred resources can in fact be converted to reserves with minimal additional drilling.
There are significant resources on the property that have not been included in this study due to various constraints. A large, high stripping ratio pit exists south of the Main Pit and this could add significant ounces to the Project. This ore is economic at the costs and metal values developed for this report, but has been left behind due to waste rock disposal constraints.
| |
| GOLDEN QUEEN MINING CO. LTD./ 06-2880 |
| SOLEDAD MOUNTAIN FEASIBILITY STUDY |
| 15-2 |
| | 15.2.2 | Leach Pad Opportunity |
A significant Project constraint is the limited heap leach pad capacity. Should the specific weight of the ore on the heap prove greater than estimated, additional ore could be mined and processed. Note however that GQM has received approval for the construction of two heap leach pads, the Phase 1 pad with a capacity of approximately 45.3 million tonnes (49.9 million tons unadjusted for self-weight compaction) and the Phase 2 pad with a capacity of approximately 22.7 million tonnes (25.0 million tons) for a combined capacity of approximately 68 million tonnes (74.9 million tons).
| | 15.2.3 | Processing Opportunity |
The recovery figures obtained from laboratory testing were used as recommended in the recovery estimates that were utilized for this study. There are numerous projects that have failed to achieve the recoveries anticipated from test work but there are also numerous projects that were able to achieve higher recoveries than would have been anticipated. Higher recoveries would lead to higher overall gold and silver production with the resulting benefit to Project economics.
Note specifically that the current silver recovery is estimated at only 52.5% . The tails analysis shows a possible higher silver recovery of up to 65.8% . Silver recoveries of 65.0% were projected in a number of feasibility studies done by independent consulting engineers before 2000.
| | 15.2.4 | Aggregate Production |
GQM is actively investigating the potential for developing a byproduct aggregate and construction materials business once the heap leach operation is in full production. The source of raw materials will be suitable quality waste rock specifically stockpiled for this purpose. Test work done in the 1990s confirmed the suitability of waste rock as aggregate and construction material. There is also the potential to market the rinsed leach material when mine operations cease. Based on currently projected mine plans, there may be sufficient material to allow aggregate for production for a period of up to thirty years. However, no contributions from the sale of such products will be included in the cash flow projections until long term contracts for the sales of these products are secured.
| |
| GOLDEN QUEEN MINING CO. LTD./ 06-2880 |
| SOLEDAD MOUNTAIN FEASIBILITY STUDY |
| 15-3 |
Additional Sources Reviewed for Pit Slope Stability Evaluation:
Additional Sources Reviewed for Waste Dump Stability Evaluation:
AMEC Americas Ltd. February 2005. Prefeasibility Study, Revision 1 of the Soledad Mountain Project. AMEC, Vancouver, BC.
AMEC Americas Limited. January 2011. Study and Capital Cost Estimate for the Crushing-Screening Plant, Prepared by).
ARCADIS U.S., Inc. February 26, 2010. Groundwater Quality Report.
Bamberg, S.A. June 2006. Biological And Soil Resource Evaluation for the Soledad Mountain Project”, Prepared for Golden Queen Mining Co., Inc., Original Revised April 1997, Revision and Addendum June 2006.
Bamberg, S.A. October 2006. Revegetation Plan for the Soledad Mountain Project”, Prepared for Kern County Planning Department, Submitted by Golden Queen Mining Co., Inc., Prepared by Samuel A. Bamberg, Ph.D., Reclamation Specialist, March 1997, Revised October 2006.
Canadian Securities Administrators. 2001. National Instrument 43-101 Standards of Disclosure for Mineral Projects, Form 43-101F, Technical Report, and Companion Policy 43-101CP, 47p.
Earthquake Stability Supplement, Soledad Mountain Project, Slope Stability Analysis, John F. Abel Jr.,P.E., December 11, 1995.
Geotechnical Design for the Heap Leach Facility, The Glasgow Engineering Group, Inc., 1997.
Golden Queen Mining Co. Inc., Revised February 2007. Report Of Waste Discharge For The Soledad Mountain Project”, Prepared by GQM, Mojave, California. Submitted to the California Regional Water Control Board.
Golden Queen Mining Co. Inc., September 2005. Soledad Mountain Project: Project Summary and Cashflow Projections. Golden Queen Mining Co. Inc. Vancouver, BC.
Golden Queen Mining Co., Inc. and Golder Associates, April 2007. Surface Mining Reclamation Plan Application for the Soledad Mountain Project. Submitted to the Kern County Planning Dept., Bakersfield, CA. GQM – Mojave, California. Golder Associates – Lakewood, Colorado.
Golden Queen Mining Co., Inc., Soledad Mountain Project, Heap Leach Facility, Revised Geotechnical Design Report, Golder Associates Inc., December 2006
Golder Associates Inc. December 2006. Revised Geotechnical Design Report – Heap Leach Facility, Soledad Mountain Project. Golder Associates Inc. Lakewood, Colorado.
| |
| GOLDEN QUEEN MINING CO. LTD./ 06-2880 |
| SOLEDAD MOUNTAIN FEASIBILITY STUDY |
| 16-1 |
Golder Associates Inc., February, 1998. Slope Stability Evaluation of the Proposed Waste Rock Dumps at the Golden Queen Mining Company Soledad Mountain Project. Golder Associates Inc., Lakewood, CO.
Golder Associates Inc., July 2005. Pad No. 1 – Heap Leach Facility Design. Golder Associates, Lakewood, Colorado.
Golder Associates Inc. Revised December 10, 2010. Soledad Mountain Project, Heap Leach Facility, Revised Geotechnical Design Report.
Golder Associates Inc. April 12, 2011. Soledad Mountain Heap Leach Facility, Phase 1 Volume Estimate Memorandum.
Letter to Tony Casagranda from Don A. Poulter, P.E. and the Glasgow Engineering Group, August 29, 1996.
Letter to Tony Casagranda from Don A. Poulter, P.E. and the Glasgow Engineering Group, December 5, 1996.
Letter to Tony Casagranda from John F. Abel Jr., P.E., July 24, 1996.
Phase II Evaluation, Open Pit Slope Stability Analysis, Soledad Mountain Project, Kern County, California , Ben L. Seegmiller, Seegmiller International, June 1997
Polysius Corporation, November 1989. Test Work – Golden Queen Mining Co., Inc. Letter dated November 10, 1989.
Seegmiller International, June 1997. Phase II Evaluation – Open Pit Slope Stability – Soledad Mountain Project. Salt Lake City, Utah.
Slope Stability Evaluation for the Soledad Mountain Project Mine Overburden Disposal Piles, The Glasgow Engineering Group, Inc., October 25, 1996
Slope Stability Evaluation Of The Feasibility Design Waste Rock Dumps Soledad Mountain Project, Golder Associates Inc., February 24, 1998
Soledad Mountain Project, Slope Stability Analysis, John F. Abel Jr., P.E., November 8, 1995.
SRK Consulting, March 2006. NI 43-101 Technical Report Soledad Mountain Project. SRK Consulting, Lakewood, Colorado.
Summit Valley Equipment & Engineering, Inc. May 2004. Soledad Mountain Project, Merrill-Crowe Plant, Preliminary Engineering And Cost Estimate Study. West Bountiful, Utah.
| |
| GOLDEN QUEEN MINING CO. LTD./ 06-2880 |
| SOLEDAD MOUNTAIN FEASIBILITY STUDY |
| 16-2 |
APPENDIX A
Cash Flow Sensitivity Analysis Summary
| |
| GOLDEN QUEEN MINING CO. LTD./ 06-2880 |
| SOLEDAD MOUNTAIN FEASIBILITY STUDY |
| APPENDIX A | Cash Flow Sensitivity Analysis Summary |
| price gold base case input | 1457 |
| gold price sensitivity | 0% |
| silver price base case input | 39.63 |
| silver price sensitivity | 0% |
| op cost sensitivity | 0% |
| capex cost sensitivity | 0% |
all equity basis pretax
constant dollar at yr 0 |
| IRR---> | 83.7% |
| Disc Rate | NPV US$000 |
0%
5%
7%
8%
9% | 1,155,505
820,753
722,120
678,484
638,161 |
| |
| GOLDEN QUEEN MINING CO. LTD./ 06-2880 |
| SOLEDAD MOUNTAIN FEASIBILITY STUDY |
| | |
| NPVUS$000 | Percentage increase ( decrease) in gold price: impact on NPV |
| | 1,155,505 | -10% | -5% | 0% | 5% | 8% | 10% | 15% |
| disc rates | 0% | 1,033,366 | 1,094,506 | 1,155,505 | 1,216,364 | 1,252,812 | 1,277,083 | 1,337,660 |
| | 8% | 601,165 | 639,871 | 678,484 | 717,005 | 740,074 | 755,434 | 793,770 |
| | 9% | 564,666 | 601,458 | 638,161 | 674,777 | 696,704 | 711,304 | 747,743 |
| | | | | | | | | |
| NPVUS$000 | Percentage increase ( decrease) in silver price: impact on NPV |
| | 1,155,505 | -10% | -5% | 0% | 5% | 8% | 10% | 15% |
| disc rates | 0% | 1,118,878 | 1,137,199 | 1,155,505 | 1,173,799 | 1,184,768 | 1,192,079 | 1,210,345 |
| | 8% | 656,321 | 667,407 | 678,484 | 689,554 | 696,191 | 700,615 | 711,668 |
| | 9% | 617,222 | 627,695 | 638,161 | 648,620 | 654,891 | 659,071 | 669,514 |
| NPV | US$000 | Annual percentage increase ( decrease) in op cost : impact on NPV |
| 1,155,505 | 0% | 5% | 8% | 10% | 12% | 15% | 18% |
| disc rates | 0% | 1,155,505 | 1,138,154 | 1,127,743 | 1,120,803 | 1,113,862 | 1,103,452 | 1,093,041 |
| | 8% | 678,484 | 667,334 | 660,644 | 656,184 | 651,725 | 645,035 | 638,345 |
| | 9% | 638,161 | 627,542 | 621,170 | 616,923 | 612,675 | 606,303 | 599,932 |
| |
| GOLDEN QUEEN MINING CO. LTD./ 06-2880 |
| SOLEDAD MOUNTAIN FEASIBILITY STUDY |
| WACC calculation | |
| target debt % | 30% |
| debt rate | 10.0% |
| corp tax rate (US+Cal) | 41% |
| after tax cost of debt | 5.9% |
| target equity % | 70% |
| US 10 yr long bond yield | 3.5% |
| US bond risk premium to t bills | 1.5% |
| US t bill long term implied rate | 2.0% |
| US equity risk premium to t bills | 7.0% |
| beta | 1.00 |
| cost of equity | 9.0% |
| WACC | 8.1% |
| Allied Nevada | Claude Res | Kinross | Yamana | Goldcorp | AngloAshanti | Gold Fields | Barrick | Newmont |
| 1.46 | 0.85 | 0.55 | 0.81 | 0.52 | 0.61 | 0.60 | 0.49 | 0.40 |
| |
| GOLDEN QUEEN MINING CO. LTD./ 06-2880 |
| SOLEDAD MOUNTAIN FEASIBILITY STUDY |
| NPV | US$000 | Percentage increase ( decrease) in capex : impact on NPV |
| 1,155,505 | -5% | 0% | 5% | 8% | 10% | 12% | 15% |
| disc rates | 0% | 1,160,938 | 1,155,505 | 1,150,073 | 1,146,813 | 1,144,640 | 1,142,467 | 1,139,208 |
| | 8% | 684,177 | 678,484 | 672,791 | 669,376 | 667,098 | 664,821 | 661,405 |
| | 9% | 643,856 | 638,161 | 632,467 | 629,050 | 626,772 | 624,494 | 621,077 |
| 8 % DCF | NPV US$000 | Increase ( decrease) in gold price : impact on NPV at 8 % DCF |
| | 678,484 | -10% | -5% | 0% | 5% | 8% | 10% | 15% |
| Increase | -10% | 578,899 | 617,657 | 656,321 | 694,894 | 717,993 | 733,373 | 771,761 |
| (decrease) | -5% | 590,036 | 628,768 | 667,407 | 705,954 | 729,037 | 744,408 | 782,770 |
| in silver | 0% | 601,165 | 639,871 | 678,484 | 717,005 | 740,074 | 755,434 | 793,770 |
| price: impact | 5% | 612,285 | 650,966 | 689,554 | 728,049 | 751,102 | 766,452 | 804,763 |
| On 8 % DCF | 8% | 618,954 | 657,619 | 696,191 | 734,671 | 757,715 | 773,059 | 811,354 |
| NPV | 10% | 623,398 | 662,052 | 700,615 | 739,085 | 762,122 | 777,462 | 815,747 |
| | 15% | 634,502 | 673,131 | 711,668 | 750,112 | 773,134 | 788,464 | 826,723 |
| 8 % DCF | NPV | | 3 yr av gold price |
| 3 yr average | US$000 | 1,061.25 | 1,457.00 | 1,529.85 |
| silver price | 678,484 | -27.16% | 0% | 5% |
| 17.78 | -55.13% | 343,475 | 555,885 | 594,689 |
| 39.63 | 0% | 467,608 | 678,484 | 717,005 |
| 41.61 | 5% | 478,816 | 689,554 | 728,049 |
| |
| GOLDEN QUEEN MINING CO. LTD./ 06-2880 |
| SOLEDAD MOUNTAIN FEASIBILITY STUDY |