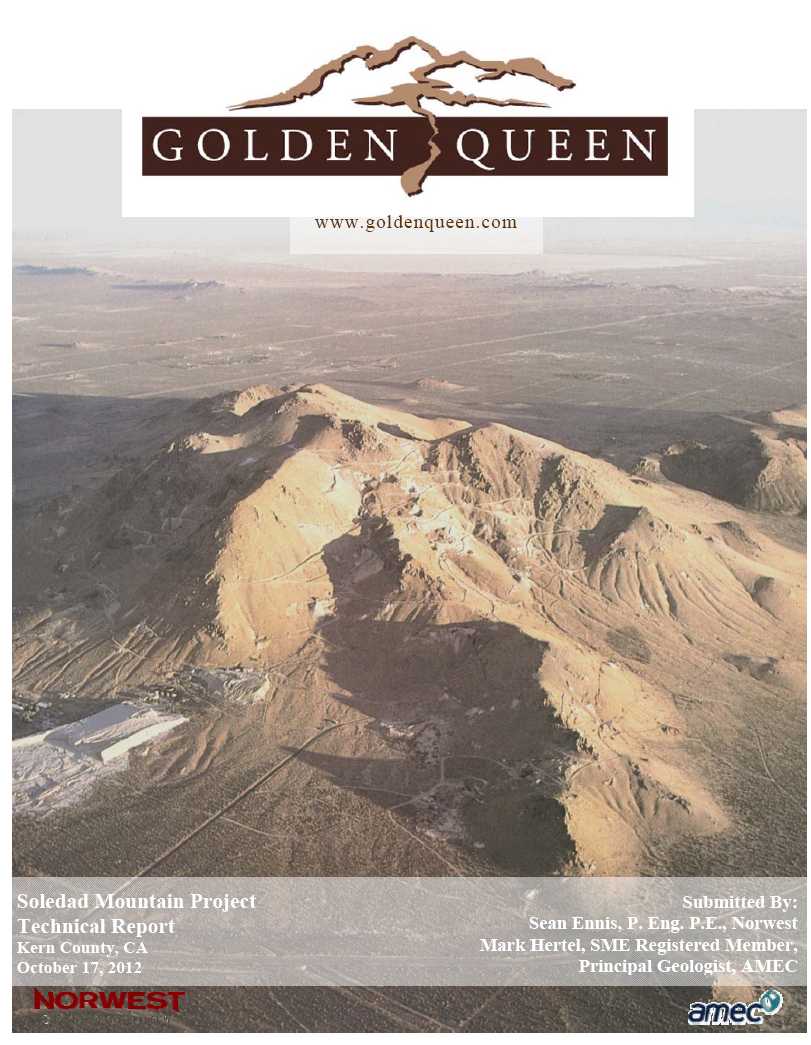
IMPORTANT NOTICE
This report was prepared as National Instrument 43-101 Technical Report for Golden Queen Mining Co., Inc. (GQM) by Norwest Corporation (Norwest) and AMEC E&C Services Inc. (AMEC).
The quality of information, conclusions, and estimates contained herein is consistent with the level of effort involved in Norwest’s and AMEC’s services, based on i) information available at the time of preparation, ii) data supplied by outside sources, and iii) the assumptions, conditions, and qualifications set forth in this report.
This report is intended for use by GQM and subject to terms and conditions of its respective contracts with AMEC and Norwest. Except for the purposes legislated under Canadian provincial and territorial securities law, any other uses of this report by any third party is at that party’s sole risk.
 | Soledad Mountain Project
Kern County, CA, USA
Technical Report |
TABLEOFCONTENTS
| October 2012 | i |  |
| Soledad Mountain Project
Kern County, CA, USA
Technical Report |
| October 2012 | ii | |
| Soledad Mountain Project
Kern County, CA, USA
Technical Report |
| October 2012 | iii | |
| Soledad Mountain Project
Kern County, CA, USA
Technical Report |
| October 2012 | iv | |
| Soledad Mountain Project
Kern County, CA, USA
Technical Report |
Note
Text that appears in italics is taken from AMEC’s resource report dated:
February 29, 2012
| October 2012 | v | |
| Soledad Mountain Project
Kern County, CA, USA
Technical Report |
LIST OFTABLES
| October 2012 | vi | |
| Soledad Mountain Project
Kern County, CA, USA
Technical Report |
LIST OFFIGURES
| October 2012 | vii | |
| Soledad Mountain Project
Kern County, CA, USA
Technical Report |
| October 2012 | viii | |
| Soledad Mountain Project
Kern County, CA, USA
Technical Report |
| 1 | SUMMARY |
| | |
| Golden Queen Mining Co., Ltd. requested Norwest Corporation (Norwest) and AMEC E&C Services Inc. (AMEC) prepare a report (the Report) with results from updated Mineral Resources and Mineral Reserves estimates based on in-fill and step-out drilling and an updated feasibility study for the Soledad Mountain Project (the Project). |
| | |
| The Report has been submitted as a NI 43-101 compliant Technical Report and this is availableon SEDAR and on the Company’s website atwww.goldenqueen.com. |
| Text shown in italicshasbeenextractedfromtheAMECresourcereportdatedFebruary 29, 2012. |
1.1 Key Outcomes
| | • | Total Proven and Probable Mineral Reserves of 66,808 ktons grading 0.0188 oz/ton Au and 0.343 oz/ton Ag. |
| | | |
| | • | Capital cost of US $119 million. |
| | | |
| | • | Operating costs of $32 million per year; $7.58 per ton leached |
| | | |
| | • | The pre-tax net present value (NPV) at 8 percent discount rate is $787 million and the internal rate of return (IRR) is 82.9 percent. |
| | | |
| | • | Payback for the Project is less than two years on an after-tax basis. |
1.2 Location, Access and Climate
The Project is located in Kern County in southern California, approximately 5 miles south of the town of Mojave. The metropolitan areas of Rosamond and Lancaster lie approximately 9 miles and 20 miles to the south respectively. Los Angeles is about 70 miles south of Mojave.
Access to site is from State Route 14 and Silver Queen Road, an existing paved County road. Silver Queen Road will be the primary access to site.
The Mojave region is generally characterized as arid, with a wet season from December through March. Rainfall events tend to be short lived and of high intensity. Mojave experiences high summer temperatures up to 113°F. The minimum temperature may reach 20°F. Maximum wind speed is 90mph with Exposure C for design purposes. Mean recorded annual rainfall is 6.14 inches with a mean maximum month of 1.11 inches.
1.3 Land Status
The land status is described in sub-section 4.2.
| October 2012 | 1-1 | |
| Soledad Mountain Project
Kern County, CA, USA
Technical Report |
GQM acquired its initial property interests in 1985. GQM purchased fee land or entered into mining lease agreements from the 1990’s onwards and is continuing to add to its land position in the area. GQM only purchases and does not lease fee land in an ongoing effort to ensure a secure land position.
The land required for the Project, which has been included within the Approved Project Boundary, has either been secured under one of the mining lease agreements referred to in subsection 1.4 below or is held by GQM through ownership of the land in fee or as patented and unpatented mining claims or millsites.
The fee land surrounding the patented and unpatented mining claims in Section 6 and Section 5 and the millsites in Section 32 is required for the construction of the ancillary facilities for the mining operation, for the construction of the heap leach pads and for construction of a pad for the storage of quality waste rock and for the aggregate production facilities.
1.4 Mineral Tenure and Mining Lease Agreements
Mineral tenure and mining lease agreements are described in Section 4.3
GQM holds directly or controls via mining lease agreements with landholders a total of 33 patented lode mining claims, 134 unpatented lode mining claims, 1 patented millsite, 12 unpatented millsites, and 1 unpatented placer claim and upward of 980 acres of fee land, collectively referred to as the Property.
1.5 Royalties
Royalties are described in Section 4.4.
GQM is required to pay advance, minimum royalties under the mining lease agreements. In some instances, the Company will receive a credit for the advance minimum royalty payments made on commencement of commercial production. Weighted average royalty rates on production will range from a low of 1.0% to a high of 5.0% depending upon the area being mined and gold and silver prices.
Royalty calculations from production will be complex. Norwest has developed a model for an accurate royalty calculation and this is attached to the cash flow model.
State royalties for payable gold and silver are charged at the following rates:
| | • | Gold royalty = $5.00/oz gold (post-smelter) |
| | | |
| | • | Silver royalty = $0.10/oz silver (post-smelter) |
The mining lease agreements also typically provide for an additional royalty if non-mineral commodities, such as aggregates, are produced and sold.
| October 2012 | 1-2 | |
| Soledad Mountain Project
Kern County, CA, USA
Technical Report |
1.6 Approvals and Permits
1.6.1 Land Use - Conditional Use Permits
Environmental issues were fully addressed in the Supplemental Environmental Impact Report (SEIR) and this is described in sub-section 21.1.
The Kern County Planning Commission formally considered the Project on April 8, 2010. At the meeting, the Planning Commission, consisting of a panel of three commissioners, unanimously approved the Project. The Planning Commission certified the SEIR and adopted a Mitigation Measures Monitoring Program and a set of Conditions of Approval for the Project. The Mitigation Measures Monitoring Program and Conditions of Approval for the Project were amended by Planning Commission Resolution No. 171-10 adopted on October 28, 2010 and are now final.
The Bureau of Land Management confirmed that its Record of Decision approving the Plan of Operations under NEPA in November 1997 remains valid.
1.6.2 Water Quality– Waste Discharge Requirements
The Lahontan Regional Water Quality Control Board (the Board) unanimously approved Waste Discharge Requirements and a Monitoring and Reporting Program for the Project at a public hearing held in South Lake Tahoe on July 14, 2010. The Board order was subsequently signed by the Executive Officer of the Board and is now in effect.
1.6.3 Air Quality– Authority to Construct and Permit to Operate
The Air Quality and Health Risk Assessments for the Project were completed and submitted to the Planning Department and the Eastern Kern Air Pollution Control District (EKAPCD) on July 21, 2009. This report was approved by the Planning Commission on April 8, 2010, as part of the certification of the SEIR.
Ten applications for Authority to Construct permits were submitted to the EKAPCD in February 2011. The EKAPCD confirmed that the information required to support the applications was complete. The draft Authority to Construct permits were received in September 2011. The
Company’s consulting engineers and legal counsel completed their review of the draft Authority to Construct permits in January 2012. The Authority to Construct permits were issued by EKAPCD on February 8, 2012.
The Authority to Construct approvals will be converted to a Permit to Operate after construction has been completed and subject to inspection by EKAPCD.
1.7 Considerations of Social and Community Impacts
The impact of the Project on Mojave and the surrounding areas is described in Section 21.3.
| October 2012 | 1-3 | |
| Soledad Mountain Project
Kern County, CA, USA
Technical Report |
Mojave and the surrounding areas are areas of relatively high unemployment and employment has not recovered since the start of the financial downturn in 2008. The Project has therefore had a positive response from the local communities.
1.8 Geology and Mineralization
Soledad Mountain is located within the Mojave structural block, a triangular-shaped area bounded to the east by the northwest-trending San Andreas Fault and to the north by the northeast-trending, Garlock Fault. The Mojave block is broken into an orthogonal pattern of N50E to N60E and N40W to N50W fracture systems. These fracture zones likely developed as the result of Late Cretaceous compressional stresses that were present prior to formation of the Garlock and San Andreas Faults. Gold and silver mineralization at Soledad Mountain is hosted by northwest-trending, en-echelon faults and fracture systems. Cretaceous quartz monzonite forms the basement of stratigraphic sequences in the Mojave block. The quartz monzonite is overlain by Miocene-age, quartz latite and rhyolitic volcanic rocks. Volcanic centers appear to have formed at intersections of the northeast and northwest-trending fracture systems. Major volcanic centers are present at Soledad Mountain, Willow Springs and Middle Buttes. These volcanic centers consist generally of initial, widespread sheet flows and pyroclastics of quartz latite, followed by restricted centers of rhyolitic flows and rhyolite porphyry intrusives. Rhyolitic flows and intrusives are elongated somewhat along northwest-trending vents and feeder zones. Gold deposits in the Mojave block include Soledad Mountain, Standard Hill, Cactus and Tropico. Of these gold deposits, only Soledad Mountain is in the Project area. At Soledad Mountain gold mineralization occurs in low-sulfidation style, quartz-adularia veins and stockworks that strike northwest. Gold mineralization at Standard Hill, located 1 mile northeast of Soledad, consists of north to northwest-striking quartz veins in Cretaceous quartz monzonite and Tertiary, quartz latite volcanic rocks. At the Cactus Gold Mine, 5 miles west of Soledad, gold occurs in northwest and northeast-striking quartz veins, breccias and irregular zones of silicification in quartz latite, rhyolitic flows and rhyolitic intrusive breccias.
At least 14 separate vein systems and related vein splits occur at Soledad Mountain. Veins generally strike N20-40W and dip at high angles either to the northeast or to the southwest. Separate, parallel or en-echelon vein systems are present over a total strike length of 6,000 ft. trending northwest and a total width of 4,500 ft. Veins and zones are from 5 ft. to 150 ft. thick, 325 ft. to 3,000 ft. long and from 300 ft. to 1,000 ft. deep along dip. The horizontal distance between individual veins is from 50 ft. to over 400 ft. Mineralization consists of fine-grained pyrite, covellite, chalcocite, tetrahedrite, acanthite, native silver, pyrargyrite, polybasite, native gold and electrum within discrete quartz veins, veinlets, stockworks and irregular zones of silicification. Electrum is about 25% silver.
1.9 Golden Queen Mining Co., Inc.
Golden Queen Mining Co. Ltd. was formed in November 1985 to acquire Golden Queen Mining Co., Inc. (GQM), a California corporation, which had secured, by agreement, a core group ofclaims on Soledad Mountain. Golden Queen Mining Co, Ltd. Is a Canadian public company listed on the Toronto Stock Exchange and is registered with the U.S. Securities And Exchange Commission as a foreign, private issuer.
| October 2012 | 1-4 | |
| Soledad Mountain Project
Kern County, CA, USA
Technical Report |
The mine operator is Golden Queen Mining Co., Inc., the wholly-owned subsidiary of Golden Queen Mining Co. Ltd. The Project has California Mine ID #91-15-0098.
GQM’s activities have included construction of infrastructure to support exploration activities, reconnaissance and geological mapping, aerial photography; rock chip and soil sampling, geophysical surveys, reverse-circulation and core drilling, underground channel sampling, condemnation drilling, metallurgical test work, geotechnical studies, baseline environmental and a range of other studies, mine design, community consultations and permit applications and a range of mineral resource and mineral reserve estimates. Feasibility studies were done in 1996 (Pincock Allen & Holt, 1996), 1998 (M3 Engineering & Technology Corp., 1998), 2000 (Golden Queen Mining Co., Inc., 2000), 2008 (Norwest Corporation, 2008), 2011 (Norwest Corporation, 2011) with the current update prepared as a NI 43-101 Technical Report.
1.10 Exploration Potential
Exploration and exploration potential are described in Section 9 and sub-section 9.8 respectively.
A number of areas with exploration potential have been identified. The Hope Cabin area has good potential for vein-type mineralization under alluvial cover and the Alphson areas may contain stockwork vein-type mineralization south of existing planned open pits. In addition, gold and silver mineralization extends at depth below the bottom of designed open pits and in areas immediately adjacent to the East Pit high walls along strike.
1.11 Drilling
Data from 1,374 reverse-circulation (RC) holes, diamond core holes and underground cross-cut channels was loaded into the MineSight® files for a total of 379,326.4 ft. of data. Approximately 86.5% of the drilling in the database wascompleted during GQM’s ownership from 1986 to2011. The remaining 13.5% of the drilling was conducted by Gold Fields America Development Co (GFA) , Shell/Billiton, and Noranda.
Twenty- holes were drilled for a total of 6,932 ft. in 2011.
Core sizes used on the Project include AQ (27mm) for core drilling done by GFA and HQ (63.5mm) core drilling completed by GQM. RC bit sizes used by GQM ranged from 4.0 inch to 5.5 inch.
Industry standard logging and sampling conventions were used to capture information from the RC chips, diamond drill core and underground, cross-cut channel samples. Data logged included lithology, alteration, mineralization, structural, oxidation state, and geotechnical data.
| October 2012 | 1-5 | |
| Soledad Mountain Project
Kern County, CA, USA
Technical Report |
Recovery was not recorded for diamond core holes DDH 1-16. Only general comments regarding recovery were made for holes DDH 17-21. 100% recovery was noted for most mineralized intervals except in drill hole DDH 21, which experienced recoveries as low as 25%. All remaining drill logs recorded measured recoveries for each cored interval. The number of mineralized intervals with poor core recovery is relatively small for the 43 core holes that have recovery information ranging from 10 to 70%. Mineral Resources Development Inc. (MRDI)(2000) reports that recovery appears to have been adequate to meet industry standards for holes DDH 22through DDH97-10.
GQM drill-hole collar locations during 1986-2000 were surveyed relative to the historical mine grid by DeWalt Corporation of Bakersfield, California. Surveys were carried out using either a Total Station Wild TC-1610 theodolite or Trimble 4000 SSI RTK Global Positioning System. Drill hole collar locations of GQM holes drilled in 2011 were surveyed by Quality Surveying, Inc. of Lancaster, California.
The positions of underground cross-cut samples were located by GQM by using historical transit surveys of underground workings. Portal elevations were corrected during surface surveying of drill sites.
Down-hole surveys were not performed for holes drilled prior to 1994. RC holes GQ-1 to GQ-475 and core holes DDH-1 to DDH-16 were not surveyed. GQM imposed an average downward deviation adjustment on these holes. Diamond drill holes DDH-17 through DDH-42 and DDH 97-1 through DDH 97-10 were surveyed for dip and azimuth using a Baker Hughes/Inteq Magnetic Single Shot Survey Tool. RC holes GQ-475 through GQ-632 were surveyed for dip using a MD-Totco Special Operating Unit Deviation Tool. Inclined RC holes show a downward deviation of from 1.5 to 3 degrees per 100 ft. The lateral deviations in azimuth are unknown. Drill holes for the 2011 program were down-hole surveyed by Golder Associates Inc. (Golder) Golder used a Mount Sopris Instruments 2DVA-1000 (deviation) borehole logging probe mounted on an 4MXB-1000 winch with approximately 410 meters of 1/8-inch single-conductor wireline and controlled using an MGXII control console. Only three out of twenty drill holes were down-hole surveyed due to holes being blocked.
1.12 Sample Analysis and Security
A number of commercial assay laboratories were contracted to assay GQM samples for gold and silver from 1986-2000. The assay labs that GQM used were Jacobs, in Tucson, Bondar-Clegg in Sparks, Barringer in Sparks, GSI, Skyline, Mountain States Research, and American Assay in Sparks, and ALS Chemex, Reno.
The GQM 2011 RC samples were analysed by ALS Chemex, a well-established and recognized assay and geochemical analytical services company. Samples were weighed upon receipt at the laboratory, dried, crushed to 70% passing 2 mm, riffle split to obtain a nominal 250 g subsample, and this subsample was pulverized to 85% passing 75 µm. Gold was assayed by conventional fire assay of a 30 g split of pulverized material, then determined by atomic absorptionspectrometry (ALS Chemex code Au-AA23). Silver was assayed by aqua-regia digestion and atomic absorption spectrometry (ALS Chemex code Ag-AA62). Those samples returning greater than two ppm gold (> 2.0 ppm Au) by method Au-AA23 were reassayed by fire assay of a 30 g subsample with a gravimetric finish (ALS Chemex code Au-GRA21).
| October 2012 | 1-6 | |
| Soledad Mountain Project
Kern County, CA, USA
Technical Report |
No information is available documenting sample security procedures prior to 1994. Since 1994, sample security measures include moving core from the drill site to a locked storage warehouse on the Project site at the end of each shift. RC cuttings were allowed to dry at the drill site before being locked in a semi-trailer to be shipped to the laboratory. Access roads into the Project site are locked with either a gate across the road or padlocked with a heavy metal chain across the road. GQM is of the opinion that sample storage is sufficiently secure.
1.13 Data Verification
A series of data audits and verification programs have been conducted over the Project’s history,in support of mining studies and technical reports. Checks were performed in 1998 by Mine Reserve Associates, in 2000 by MRDI, and in 2006 by Steffen, Robertson & Kirsten (U.S.), Inc. (SRK).
Database audit of the 2011 drilling showed 0% error in assay records and a 0.4% error rate in lithology and oxidation codes. AMEC typically uses a criterion of less than 1.0% errors to determine whether or not a database is acceptably error-free.
AMEC is of the opinion that the database is sufficiently error free and acceptable for Mineral Resources and Mineral Reserve estimation.
1.14 Process Development
Process development and the extensive metallurgical test work done between 1998 and 2007 are described in Section 13.
The primary ore types that will be mined are rhyolite porphyry and flow-banded rhyolite, pyroclastics and quartz latite porphyry representing approximately 70%, 10% and 20% of the ore tonnage respectively. Minor quantities of siliceous vein material (0.1%) will also be mined.
Extensive test work and process development work done on the Project ore types from 1988 to 2007 show that these ores are readily amenable to heap leaching provided the material is crushed to relatively small sizes. The test work for a total of 45 column leach tests is well documented and the test results have been used in a number of feasibility studies. Parameters such as agglomerate strength, percolation rate, cyanide consumption and cement and/or lime required for pH control were also determined in numerous tests.
A series of tests using a high-pressure grinding roll (HPGR) and bottle roll and column leach tests was performed between 2003 and 2007 to confirm the flow sheet and to provide design criteria for the design of the crushing-screening plant.
| October 2012 | 1-7 | |
| Soledad Mountain Project
Kern County, CA, USA
Technical Report |
The test work shows that the HPGR will have distinct advantages over conventional crushing and screening in preparing particles for heap leaching in this particular application.
Tests completed in 2006 were performed on a low-grade and a high-grade rhyolite sample to test the range of grades that is expected in the commercial operation. The test on rhyolite with a lower head grade in the 0.3 g/t (0.009 oz/ton) range is especially important to give an indication of the tail grade and thus the recovery that should be used when doing cut-off grade analyses. No new column leach tests have been done on pyroclastic ore since the 1997-1999 tests.
Recoveries for gold and silver are based upon tails obtained in HPGR-based column leach tests. The recovery analysis for gold and the recovery analysis for silver are described in detail in subsection 13.5 and sub-section 13.6 respectively. The projected recoveries based upon the tails analysis are shown below.
Recoveries for Gold & Silver
| | | Gold | Silver |
| | Proportion | Head Grade | Recovery | Head Grade | Recovery |
| Primary Rock Types | % | g/t | % | g/t | % |
| Pyroclastics | 10.5 | 0.906 | 85.2 | 12.79 | 52.5 |
| Quartz Latite | 21.3 | 0.831 | 89.9 | 19.49 | 52.5 |
| Rhyolite | 68.1 | 0.821 | 83.4 | 11.72 | 52.5 |
| Undefined | 0.1 | 0.870 | Not included | 15.75 | Not Included |
| Total & Average | 100.00 | 0.831 | 85.0 | 13.49 | 52.5 |
An extensive characterization program using bottle roll tests on reverse circulation drill cuttings was completed by an independent consulting engineer in 1995. The deposit was divided into six areas, four rock types and three vertical zones for this program and 46 standard bottle roll tests were performed. An analysis of the results showed that there was no discernible difference in metallurgical response for a particular rock type from area to area and from strata to strata.
The final product that will be produced in the refinery on site is a dorè. There is no indication of deleterious elements in the dorè. Allowance has been made for 1.5% of minor metals in the dorè.
1.15 Mineral Resources
The updated mineral resources study to determine mineral resources was supervised by Mark Hertel, Principal Geologist, with AMEC.
Geologic and grade shell polygons were created in cross-sections and level plans and used to create three-dimensional solids. The block model was assigned two mineralized domains, four rock type domains and five structural domains.
| October 2012 | 1-8 | |
| Soledad Mountain Project
Kern County, CA, USA
Technical Report |
Three tonnage factors were assigned based on rock type: 13.76 cubic yard/ton for pyroclastics, 13.86 cubic yard/ton for quartz latite, and 13.94 cubic yard/ton for rhyolite.
Composites were created on 10 ft. intervals along the drill hole trace. A minimum of two composites were required to develop a low-grade grade shell polygon. The low-grade mineralization was based on a gold equivalent grade of >0.003 oz/ton. The high-grade grade shell only required a single ten foot composite >=0.100 oz/ton Au for modeling. The influence of high-grade gold and silver composites on grade estimation was confined by high-grade shells and range-restricted by the use of outlier restrictions. Ordinary Kriging was used to estimate gold and silver except for one structural zone which used Inverse distance.
Interpolation of grade into the blocks was conducted on three passes based upon increasing search distances out to 500 ft. Gold and silver grades were estimated separately by structural domains within low-grade mineralized solids and within high-grade mineralized solids. High-grade composites were identified as >=0.100 oz/ton gold.
Gold and silver block model grades were validated visually against drill holes and composites in section and plan. A nearest-neighbour block was based on 20 foot down the hole composite. Grade profile plots were created on the 20 ft. x 20 ft. x 20 ft. Measured and Indicated resource block and no estimation biases were noted.
AMEC constrained the Mineral Resources within a economic pit based on a mining costs cost of $1.25/ton, a processing cost including G&A of $4.98/ton processed, pit wall slope angles of 55o, and gold recoveries ranging from 83.4 to 89.9% and silver recoveries of 53.5% . Gold price was set at $1,310/oz Au and silver price was set at $24.05/oz Ag.
Factors which may affect the conceptual pit shells used to constrain the mineral resources, and therefore the Mineral Resources include changes to the following assumptions and parameters:
| | • | Commodity price assumptions |
| | | |
| | • | Mining and processing cost assumptions |
| | | |
| | • | Metallurgical recovery assumptions |
| | | |
| | • | Pit slope angles used for the mine design |
| | | |
| | • | Assignment of SG values |
1.16 Mineral Resources Statement
The QP for the Mineral Resources is Mark Hertel, Principal Geologist, R.M. SME Registered Member, and an employee of AMEC. Mineral Resources are reported in Table 1.1 with gold and silver prices of $1,310/oz and $24.05/oz respectively, have an effective date of February 29, 2012, and are inclusive of Mineral Reserves. Mineral Resources take into account geologic, mining, processing and economic constraints, and have been confined within appropriate Lerchs-Grossman pit shells, and therefore are classified in accordance with the 2010 CIM Definition Standards for Mineral Resources and Mineral Reserves.
| October 2012 | 1-9 | |
| Soledad Mountain Project
Kern County, CA, USA
Technical Report |
Table 1.1 Mineral Resources
Effective Date February 29, 2012, Mark Hertel, SME Registered Member
| | | | In-situ Grade | Contained Metal |
| | | | Gold | Silver | Gold | Silver |
| Classification | tonnes | ton | g/t | oz/ton | g/t | oz/ton | oz | oz |
| Measured | 26,727,000 | 29,400,000 | 0.850 | 0.025 | 13.29 | 0.39 | 729,000 | 11,403,000 |
| Indicated | 118,090,000 | 129,900,000 | 0.442 | 0.013 | 8.53 | 0.25 | 1,675,000 | 32,301,000 |
| Total & Average | 144,817,000 | 159,300,000 | 0.517 | 0.015 | 9.42 | 0.27 | 2,404,000 | 43,704,000 |
| Inferred | 14,545,000 | 16,000,000 | 0.362 | 0.011 | 7.89 | 0.23 | 169,000 | 3,681,000 |
Notes to Accompany Soledad Mountain Mineral Resources Table:
| 1. | Mineral Resources are inclusive of Mineral Reserves. |
| | |
| 2. | Mineral Resources that are not Mineral Reserves do not have demonstrated economic viability. |
| | |
| 3. | Mineral Resources are reported at a 0.004 oz/ton (0.137 g/t) AuEq cut-off. |
| | |
| 4. | Mineral Resources are reported as undiluted. |
| | |
| 5. | Mineral Resources are reported within a conceptual pit shell that has been merged with the 2012 Mineral Reserve pit. |
| | |
| 6. | Mineral Resources are reported using a long-term Au price of US$1310/oz, silver price of $24.05/oz, mining and processing costs and variable recoveries that are based on rock type classification. |
| | |
| 7. | Gold equivalent grades were calculated based on the equation: |
| AuEq(oz/ton) = Au(oz/ton) + (Ag(oz/ton) * [(Ag price(US$/oz)/Au price(US$/oz)) * (Ag recovery(%)/Au recovery(%)]) |
| | |
| 8. | Rounding as required by reporting guidelines may result in apparent summation differences between tons, grade and contained metal content. |
| | |
| 9. | Tonnage and grade measurements are in US and metric units. Grades are reported in troy ounces per short tons and in grams per tonne. |
| | |
| 10. | Mineral zones were shaped manually with a cutoff grade of 0.004 oz/ton (0.137 g/t) AuEq. |
1.17 Mineral Reserves
The mine design is described in Section 16.3.
Norwest accepted the geological and block model provided by AMEC and relied upon these in the preparation of the mine plan for the Project. The mine plan was based upon a series of Lerchs Grossman pit optimization studies.
The MineSight 3D (Mintec©) software was used to carry out the detailed mine design.
1.18 Mineral Reserves Statement
The QP for the Mineral Reserves is Sean Ennis, Vice President, Mining, P.Eng. APEGBC Registered Member, and an employee of Norwest. Mineral Reserves are reported in Table 1.2 and have an effective date of August 31, 2012.
| October 2012 | 1-10 | |
| Soledad Mountain Project
Kern County, CA, USA
Technical Report |
Table 1.2: Mineral Reserves
| | | | In-Situ Grade | Contained Metal |
| | | | Gold | Silver | Gold | Silver |
| Reserve Category | tonnes | tons | g/t | oz/ton | g/t | oz/ton | oz | oz |
| Proven | 18,371,000 | 20,250,000 | 0.910 | 0.027 | 14.49 | 0.423 | 537,700 | 8,558,500 |
| Probable | 42,237,000 | 46,558,000 | 0.529 | 0.015 | 10.58 | 0.309 | 717,900 | 14,372,500 |
| Total & Average | 60,608,000 | 66,808,000 | 0.644 | 0.019 | 11.77 | 0.343 | 1,255,600 | 22,931,000 |
Note: Gold equivalent cut-off grade= 0.240g/t or 0.007 oz/ton was used.
1.19 Open Pit Operation
The open pit operation is described in Section 16.
The operation will be an open pit operation. Wheel loaders and haul trucks with a capacity of 90 tonnes (100 ton) will be used as the primary mining equipment. Smaller equipment will be used for pioneering access roads, mining narrower benches, and final ore extraction at the bottom of the various mining phases. Support equipment such as a grader, a water truck and tracked dozers and a wheel dozer will be used for road and bench maintenance, dust control and work in the waste rock disposal areas.
1.20 Production of Gold and Silver
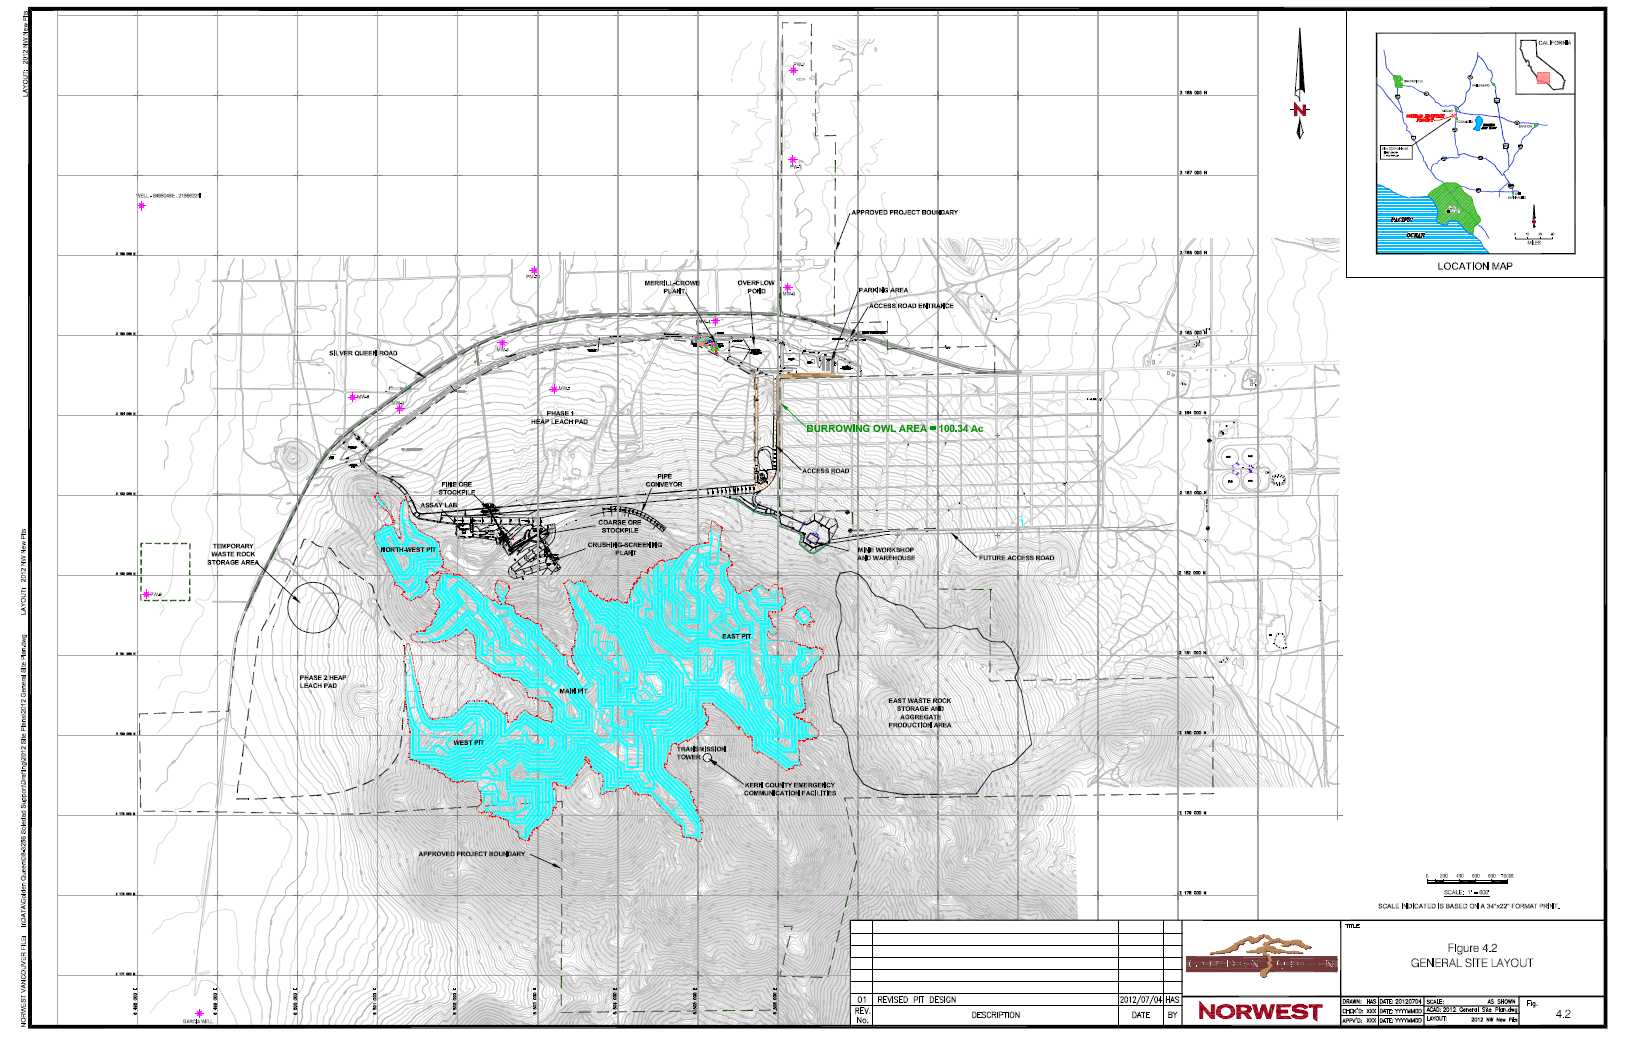
The operation has been designed to mine approximately 5.1 million tons (4.6 Mtonnes) of ore and the associated waste rock per year. Ore will be fed to a crushing-screening plant. The crushing-screening plant includes a primary and secondary cone crusher, primary screen, a high-pressure grinding roll (HPGR) as the key comminution device and the required ore chutes and conveyors. Crushed and agglomerated ore will be stacked on two heap leach pads. A dilute sodium cyanide solution will be used to leach gold and silver from the ore. Leach solutions will flow to the toe of the heap and from there to a pump box. The Merrill-Crowe process will be used to precipitate gold and silver from the pregnant solution. The precipitate will be further processed in a refinery on site to produce a dorè.
The design, construction and operation of the heap leach facilities are described in Section 18.
1.21 Local Resources and Infrastructure
Services such as a hospital, ambulance, fire-protection, garbage and hazardous waste disposal, schools, motels and housing, shopping, airport and recreation are available in Mojave and its surroundings. Telephone and internet service are available on site. Mojave is a railroad hub for the Burlington Northern/Santa Fe and Union Pacific/Southern Pacific railroad lines.
Infrastructure is described in Section 19 and this includes both on-site and off-site infrastructure.
| October 2012 | 1-11 | |
| Soledad Mountain Project
Kern County, CA, USA
Technical Report |
Off-site infrastructure such as the availability of power and a backup water supply are described in sub-section 19.3.
1.22 Market Studies
A dorè will be produced in the refinery on site. It is expected that the dorè will be shipped to the refinery owned by Johnson Matthey Inc. in Salt Lake City, Utah. The dorè will be smelted and refined to produce saleable gold and silver. The gold and silver will be sold by Johnson Matthey Inc. at spot price on the day it is produced. That is the conventional and generally accepted procedure for dealing with gold and silver produced by a smaller heap leach operation such as the Project.
GQM has therefore not entered into any agreement for selling refined gold and silver. GQM has also stated in its public documents such as the Form 10-K dated March 29, 2012 that it is not expected that GQM will hedge any of its gold or silver production. Refer to sub-section 1.27 for a comment on the aggregate component of the Project.
1.23 Capital Cost Estimates
Capital costs are described in sub-section 22.2 and summarized in sub-section 22.2.8.
Engineering has been substantially completed for all major components of the Project and this includes the design of the crushing-screening plant with the HPGR as the key comminution device by a Vancouver-based consulting engineering firm. Capital cost estimates are based upon quotes for construction from a number of key vendors and contractors based in southern California. The capital cost required is estimated to be $108.5 million and this includes unallocated costs of $12.5 million. It is estimated that a further $10.5 million will be required as working capital. Total estimated capital costs are therefore $119 million. The company is evaluating a leasing agreement for major mine equipment which reduce initial capital costs to $107 million however this case has not been used as the base case for financial evaluation.
The sustaining capital is estimated to be a further $30.6 million over the life of the gold and silver heap leach operation with detail provided in Table 16.7. The bulk of the sustaining capital will be required for construction of the second and third stages of the heap leach pad and for major equipment replacement.
1.24 Operating Cost Estimates
Operating costs are described in sub-section 22.4 and summarized in sub-section 22.4.6.
Detailed operating cost estimates have been prepared with information provided by independent consulting engineers and vendors of services and supplies such as diesel fuel and explosives, reagents such as cement and sodium cyanide and operating supplies and spare parts for both the major mining equipment and support equipment and equipment in the various processing facilities.
| October 2012 | 1-12 | |
| Soledad Mountain Project
Kern County, CA, USA
Technical Report |
The all-inclusive average cash operating cost is projected at $10.02/ton of ore mined for the life of the gold and silver heap leach operation. There is no allowance for escalation or inflation in the operating cost estimates from the third quarter 2012 onwards. Operating costs for the life of the mine are summarized in Table 22.6.
Note that an allowance for unallocated costs has been added to the operating cost estimates in the cash flow model.
1.25 Financial Analysis
1.25.1Pre-tax Cash Flow Analysis
The pre-tax cash flow analysis is described in sub-section 23.4.1. This analysis includes detail on a number of items that make up the cash flow model.
The base cash flow analysis is done on a constant United States dollar, pre-tax, stand-alone project basis.
The Project has an indicated internal rate of return (IRR) on capital employed of 82.9% . The net present value (NPV) is $787 million with a discount rate of 8.0% and the undiscounted, cumulative net cash flow is approximately $1.49billion. For comparison, at a 5% discount rate the NPV is $986 million. The indicated contribution of gold and silver to gross revenues is 83% and 17% respectively at current gold and silver prices with an all-inclusive, average cash cost per ounce of gold produced, net of silver credits, of $256/oz. Gold and silver prices used to model the cash flows were $1,749.00 and $33.03 respectively, the London fix for precious metals on October 17, 2012.
1.26 Sensitivity Analysis
Sensitivity analyses are described in sub-section 23.4.2.
If gold and silver prices are reduced by 10% from current levels, the indicated IRR is 72.4 %, the NPV is $669 million with a discount rate of 8% and the undiscounted, cumulative net cash flow is $1.28 billion. The all-inclusive, average cash cost per ounce of gold produced, net of silver credits, increases from $256/oz to $275/oz at these lower gold and silver prices.
When trailing 36-month average gold and silver prices of $1,438/oz and $27.65/oz respectively to the end of September, 2012 are used to model the cash flows, the indicated IRR is 64.4% before taxes, the NPV is $580 million with a discount rate of 8% and the undiscounted, cumulative net cash flow is $1.13 billion. The all-inclusive, average cash cost per ounce of gold produced, net of silver credits, increases further to $285/oz. The trailing 36-month average precious metals prices are accepted by the U.S. Securities And Exchange Commission when reporting mineral reserves.
| October 2012 | 1-13 | |
| Soledad Mountain Project
Kern County, CA, USA
Technical Report |
1.27 Aggregate
GQM expects to develop a by-product aggregate and construction materials business once the heap leach operation is in full production, based on the location of the Project in southern California with close proximity to major highways and railway lines. The source of raw materials will be suitable quality waste rock specifically stockpiled for this purpose. The waste rock can be classified into a range of products such as riprap, crushed stone and sand with little further processing. Test work done in the 1990s confirmed the suitability of waste rock as aggregate and construction material. GQM also plans to process and sell leached and rinsed residues from the heap leach operation for a range of uses to local and regional markets. It is intended that these products will be sold over an extended mine life beyond the current planned gold and silver production periodbut no contributions from the sale of such products will be included in the cash flow projections until long term contracts for the sales of these products are secured.
1.28 Project Schedule
The Company now has final approvals in place for the Project. The Company is therefore continuing with the design of the Phase 1, Stage 1 heap leach pad and the associated site drainage plans, design of a number of site grading plans, design of the sub-station required for the distribution of power to the operating facilities and all of these designs are being done for construction
Once a production decision is made, the Company will need significant additional financing to develop the Project into an operating mine. The Company is evaluating various financing options for the Project and these may be combined:
| | a. | An equity financing; |
| | | |
| | b. | A combination of equity and debt and |
| | | |
| | c. | A merger with an established mining company. |
The Company estimates that construction can be completed in approximately fifteen months once project financing has been secured. The target for the start of production is therefore the first quarter of 2014.
1.29 Interpretation and Conclusions
1.29.1Interpretation and Conclusions by Norwest
The Norwest QP finds the following:
| | 1. | The Project utilizes standard mining and processing methods which are well understood in the region. |
| October 2012 | 1-14 | |
| Soledad Mountain Project
Kern County, CA, USA
Technical Report |
| | 2. | The development plan follows a reasonable timeline for construction and production ramp-up. |
| | | |
| | 3. | The Project has a robust cash flow with a relatively low sensitivity to increases in the capital and operating costs. |
| | | |
| | 4. | There is sufficient area within the Project to host an open pit mining operation including any proposed open pit, waste dumps, and leach pads |
| | | |
| | 5. | The current mine plan includes mining and dumping activities beyond areas currently within the permitted limits. Norwest understands that GQM owns or is in negotiations with landholders to secure access however failure to do so could affect the current mine plan. |
| | | |
| | 6. | The current pit configuration is constrained by permit backfill requirements rather than economic strip ratio limits. The potential to expand the mineable ore tonnage exists if the constraints related to backfilling can be mitigated. |
1.29.2 Interpretation and Conclusions by AMEC
In the opinion of AMEC E&C QPs, the following interpretations and conclusions, based on the Feasibility Study Report, can be reached:
| | • | The project geology and mineralization is sufficiently well established and understood to support mineral resource estimation. |
| | | |
| | • | Completed exploration programs were appropriate to the mineralization style. |
| | | |
| | • | Work programs included geological mapping, geochemical sampling, channel sampling, petrography, mineralogical studies, and drilling. |
| | | |
| | • | Drill data collected by GQM meets industry standards for exploration of gold and silver deposits. No material factors were identified with the drill data collection that could affect Mineral Resource estimation. Drill hole sampling employed by GQM is in line with industry norms. Sample preparation for samples that support Mineral Resource estimation has followed a similar procedure for the GQM programs. The GQM drill samples were analyzed by reputable independent, accredited laboratories using analytical methods appropriate to the gold and silver concentration. Drill data are typically verified by AMEC prior to Mineral Resource estimation, by running a software program check. |
| | | |
| | • | Drill sampling has been adequately spaced to first define, then infill, gold and silver anomalies to produce prospect-scale and deposit-scale drill data. Drill hole spacing varies with depth. Drill hole spacing increases with depth as the number of holes decrease and holes deviate apart. |
| | | |
| | • | Sample data collected adequately reflect deposit dimensions, true widths of mineralization, and the style of the deposits. |
| October 2012 | 1-15 | |
| Soledad Mountain Project
Kern County, CA, USA
Technical Report |
| | • | Gold grades were estimated inside a grade shell using primarily ordinary kriging and inverse distance. Mineralization was confined within a conceptual open pit shell, which used economic parameters developed by Norwest from first principles. AMEC has reviewed the economic parameters used in the Mineral Resource and is of the opinion that they are reasonable for supporting Mineral Resource declaration within a conceptual open pit shell. |
1.30 Cautionary Statement
As noted in Section 1.6, the Project has been approved by the Kern County Planning Commission and the Kern Country Planning and Community Development Department. The Commission accepted the project plan subject to a number of Conditions of Approval. A number of these conditions specifically address issues related to reclamation of the property including backfilling and restoration to approximate pre-mining topography.
The mine plan presented in this document represents best efforts by Norwest to develop a mine plan which maximizes in-pit backfill while not unduly penalizing the Project’s economic viability. The pit shells used as a basis for this feasibility were selected based on consideration of both economic and waste volume considerations with the goal of developing pit configurations which balanced ore tonnage against waste quantities.
In order for the current mine plan to meet all the conditions laid out by the County, approximately 19 million tons of waste rock must be sold as aggregate and removed from site prior to final reclamation. In addition, all the leached residues must be either permitted to remain in place or be sold as aggregate. If this quantity cannot be sold, the necessity of handling this additional volume as part of the reclamation plan will affect the overall ore tonnage that can be mined at site. While no costs or revenues associated with aggregate production using this material, have been included in the Project economic analysis, removal of these materials is an integral component of the integrated mining and backfilling plan. If these quantities of material remain onsite, it will require revision of the mining plan in order to meet the backfill requirements which could reduce the life of the heap leach operation by up to 5 years.
Norwest has worked with GQM to develop a scenario which limits the effect of this on the mine life and GQM has had promising discussions with a local aggregate contractor regarding the saleability of the waste rock and leached residues into the regional market. However, there is still a potential risk that meeting the requirements of the Conditions of Approval could affect the overall mine life.
The current mine plan includes mining and dumping activities beyond areas currently within the permitted limits. Norwest understands that GQM owns or is in negotiations with landholders to secure access and to expand the permit boundary however failure to do so could affect the current mine plan.
| October 2012 | 1-16 | |
| Soledad Mountain Project
Kern County, CA, USA
Technical Report |
2.1 Terms of Reference
GQM engaged Norwest Corporation (Norwest) and AMEC to prepare an updated NI 43-101 compliant Technical Report to assess mineral reserves for the Project as part of an independent feasibility study based upon technical work and engineering designs completed up to monthend May 2012. The results of the Norwest study were disclosed in a press release on September 6, 2012.
The geological model for the Project was developed by AMEC effective February 29, 2012. Norwest has used this model as a basis for pit optimization and the development of the mining plan in the feasibility study.
Detailed studies have been completed by GQM internally under the guidance of Lutz Klingmann, P.Eng., President of GQM. Norwest has incorporated the findings of many of the engineering and technical studies commissioned by GQM as these studies have been completed by qualified independent third parties. These studies are referenced in this feasibility report and a list of all references is included. Where revisions have been made to previous work they are noted (example: capital and operating cost updates).
2.2 Qualified Persons
The following people served as the QPs as defined in National Instrument 43-101, Standards of Disclosure for Mineral Projects, and in compliance with Form 43-101F1:
| | • | Mark Hertel, SME Registered Member, Principal Geologist, AMEC Mesa, AZ. |
| | | |
| | • | Sean Ennis, APEGBC Registered Member, Vice President, Mining, Norwest Corporation, Vancouver BC. |
2.3 Site Visits and Scope of Personal Inspections
AMEC’s QP conducted a site visit as shown in Table 2.1.
| October 2012 | 2-1 | |
| Soledad Mountain Project
Kern County, CA, USA
Technical Report |
Table 2.1 QPs Areas of Report Responsibility and Site Visits
| Qualified Person | Site Visits | Report Sections of Responsibility(or Shared Responsibility) |
| Sean Ennis | | Sections 1.1 – 1.7, 1.9, 1.14, 1.17-1.30, 2, 3, 4, 5, 9.6-9.7, 13,15, 16, 17, 18, 19, 20, 21, 22, 23, 25, 26.3-26.4, 27.2-27.3 |
| Jay Horton | November 4 -5, 2010 | - |
| Mark Hertel | July 26, 2011 | Sections 1.8, 1.10, 1.11, 1,12, 1,13, 1,15, 1.16, 1.29.2, 6, 7, 8, 9.1, 9.2, 9.3, 9.4, 9.5, 9.8, 9.9, 10, 11, 12, 14, 24, 26.1, 26.2, 26.4, and 27.1. |
Mr. Hertel inspected surface geology, drill hole collars, drill core and RC chip trays, logging procedures, sampling protocols, proposed open pit location, and sites amenable for locating infrastructure.
Jay Horton, a Norwest QP conducted his most recent site visit as shown in Table 2.1. Mr. Horton observed the proposed pit, dump and leach pad areas. He reviewed the site configuration to confirm the reasonableness of planned pre-development and mining assumptions.
2.4 Effective Dates
The Report has a number of effective dates as follows:
| | • | Effective date of the database closeout for Soledad Mountain for the purposes of estimation of Mineral Resources: 31 December 2011 |
| | | |
| | • | Effective date of the Mineral Resources for Soledad Mountain: 29 February 2012 |
| | | |
| | • | Effective date of the mineral tenure and surface rights data: October, 10, 2012 |
| | | |
| | • | Effective date of the mineral reserves: August 31, 2012 |
| | | |
| | • | Effective date of the financial analysis: October 17, 2012 |
| | | |
| | • | Effective date of the final report: October, 17, 2012 |
There has been no material change to the scientific and technical information on the Project between the effective date of the Report, and the signature date.
2.5 Information Sources and References
Reports and documents listed in Section 3 Reliance on Other Experts and Section 28 References were also used to support preparation of the Report. Additional information was provided by GQM personnel where required.
2.6 Previous Technical Reports
GQM has previously filed the following technical reports:
| October 2012 | 2-2 | |
| Soledad Mountain Project
Kern County, CA, USA
Technical Report |
Table 2.2 Previously Filed Technical Reports
| Name of Report | | Date of Report | Date Filed onSEDAR | Category Filed onSEDAR |
| | | | |
| Soledad Mountain Feasibility Study (Prepared by Norwest Corporation) | | May 2, 2011 | May 17, 2011 | Other |
| | | | | |
| Technical Report Soledad Mountain Project (Prepared by Norwest Corporation) | | January 23, 2008 | January 31, 2008 | Technical Report NI 43-101 |
| | | | | |
| NI 43-101 Technical Report Soledad Mountain Project (Prepared by SRK Consulting U.S., Inc.) | | March 2006 | March 21, 2006 | Technical Report NI 43-101 |
| | | | | |
| Soledad Mountain Project Technical Report (Prepared by John Barton Fairbairn) | | June 20, 1997 | August 26, 1997 | Other |
| October 2012 | 2-3 | |
| Soledad Mountain Project
Kern County, CA, USA
Technical Report |
| 3 | RELIANCE ON OTHER EXPERTS |
| | |
| AMEC and Norwest QP have relied upon and disclaim responsibility for information derived from reports pertaining to mineral tenure, surface rights, water rights, environmental approvals and permits. |
3.1 Mineral Tenure and Royalties
The AMEC QP has not independently verified the legal status of ownership of land within the Approved Project Boundary. AMEC has fully relied upon, and disclaims responsibility for information provided by GQM staff and experts retained by GQM for information relating to mineral tenure, landholders’ title to properties, and mining lease agreements GQM has with landholders. The following document was referred to with respect to mineral ownership and royalty rights:
Letter from E.E. Riffenburgh, Gresham Savage, Attorneys at Law, October, 10, 2012.
Detail is provided in Section 4.3 and 4.4. This information is used in Sections 4.3, 4.4, and 14.
3.2 Surface and Water Rights
The AMEC QP has fully relied upon and disclaims responsibility for information provided by GQM staff and experts retained by GQM for information relating to surface rights and water rights in California. The following document was referred to with respect to current surface and water rights:
Independent California legal counsel, Paul Singarella, Esq., Latham & Watkins LLP, Costa Mesa, California, prepared a document titled “Memorandum, July 18, 2007, Initial Diligence Report and Potential Action Items – Golden Queen Mining’s Soledad Mountain Project”.
Kern County Board of Supervisors approved a water entitlement of 170 m3/h (750 gal/min) in the CUPs issued in 1997
An assessment of surface rights and water rights is provided in Sections 4.5, 4.6 and 5.5 of the Report. This information is used in Sections 4.5, 4.6, 5.5, 14 and 15.
3.3 Environmental Studies and Approvals and Permits
The AMEC QP has fully relied upon and disclaims responsibility for information provided by GQM staff and experts retained by GQM for information relating to the environmental studies performed and approvals and permits obtained for the Project. The following documents were referred to with respect to environmental studies, approvals and permits.
“California Regional Water Quality Control Board, Lahontan Region, Board Order No. R6V-2012-0031, Waste Discharge Requirements, July 23, 2012.”
| October 2012 | 3-1 | |
| Soledad Mountain Project
Kern County, CA, USA
Technical Report |
A Supplemental Environmental Impact Report (SEIR) was issued by GQM in January 2010. The Kern County Planning Commission formally considered the Project at its regularly scheduled meeting in Bakersfield on April 8, 2010. The Planning Commission certified the SEIR, adopted a Mitigation Measures Monitoring Program and Conditions of Approval for the Project which define conditions and performance standards which the mining operation must meet. The Mitigation Measures Monitoring Program and Conditions of Approval for the Project were amended by Planning Commission Resolution No. 171-10 adopted on October 28, 2010
Detail is provided in Section 21 of the Report. This information was used in Section 14 of this report.
| October 2012 | 3-2 | |
| Soledad Mountain Project
Kern County, CA, USA
Technical Report |
| 4 | PROPERTY DESCRIPTION AND LOCATION |
4.1 Location
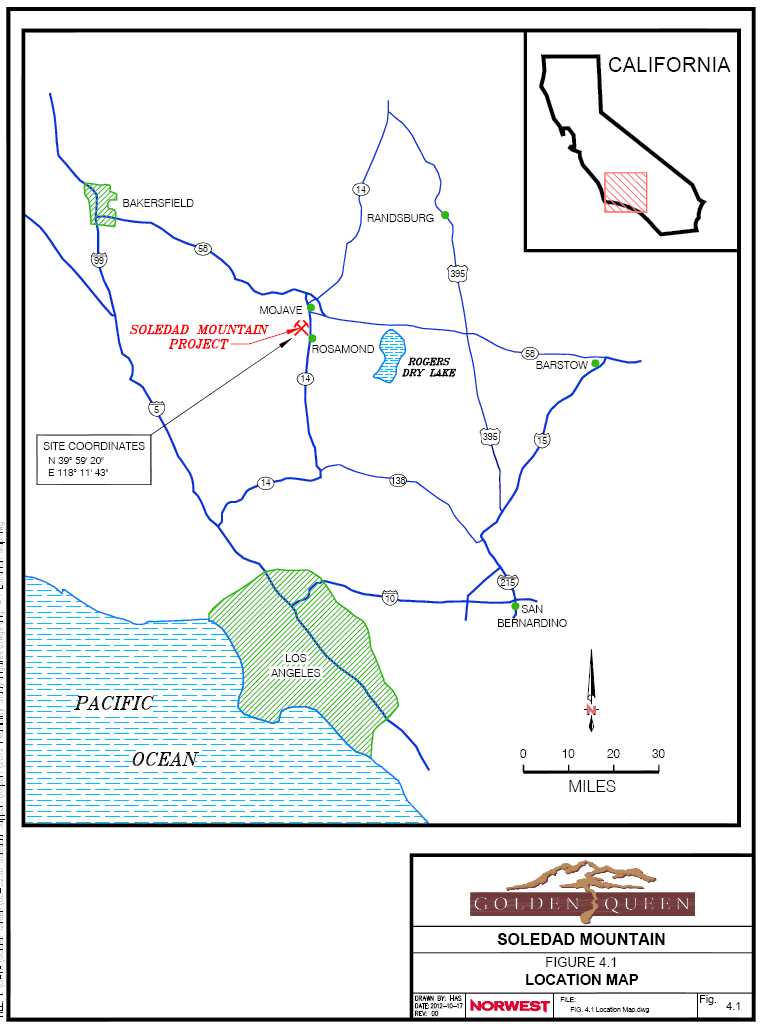
The Project is located in Kern County in southern California as shown in Figure 4.1. The Project is located approximately 5 miles south of the town of Mojave. The metropolitan areas of Rosamond and Lancaster lie approximately 9 miles and 20 miles to the south respectively. Los Angeles is about 70 miles south of Mojave. California City lies approximately 10 miles northeast of Mojave.
The project coordinates are N 39º 59’ 20” and E 118º 11’ 43”.
The Project is within the Mojave Mining District along with the former Cactus Gold Mine, Standard Hill Mine and Tropico Mine. These former operating mines are located within a radius of five miles of the site.
A general site layout is shown in Figure 4 2.
4.2 Land Holdings
GQM controls approximately 2,500 acres (1,000 hectares) of land in the area, consisting of private (fee land and patented lode mining claims and millsites) and federal lands (unpatented mining claims and millsites) administered by the BLM, collectively referred to as the Property. The total area required for the Project, which is surrounded by an Approved Project Boundary, is approximately 1,400 acres (600 hectares) in size. The actual area that will be disturbed by mining, waste rock disposal, the construction of the heap leach pads and the heap and the facilities will be approximately 912 acres (369 hectares) in size of which approximately 835 acres (338 hectares) will be reclaimed during and at the end of the mine life.
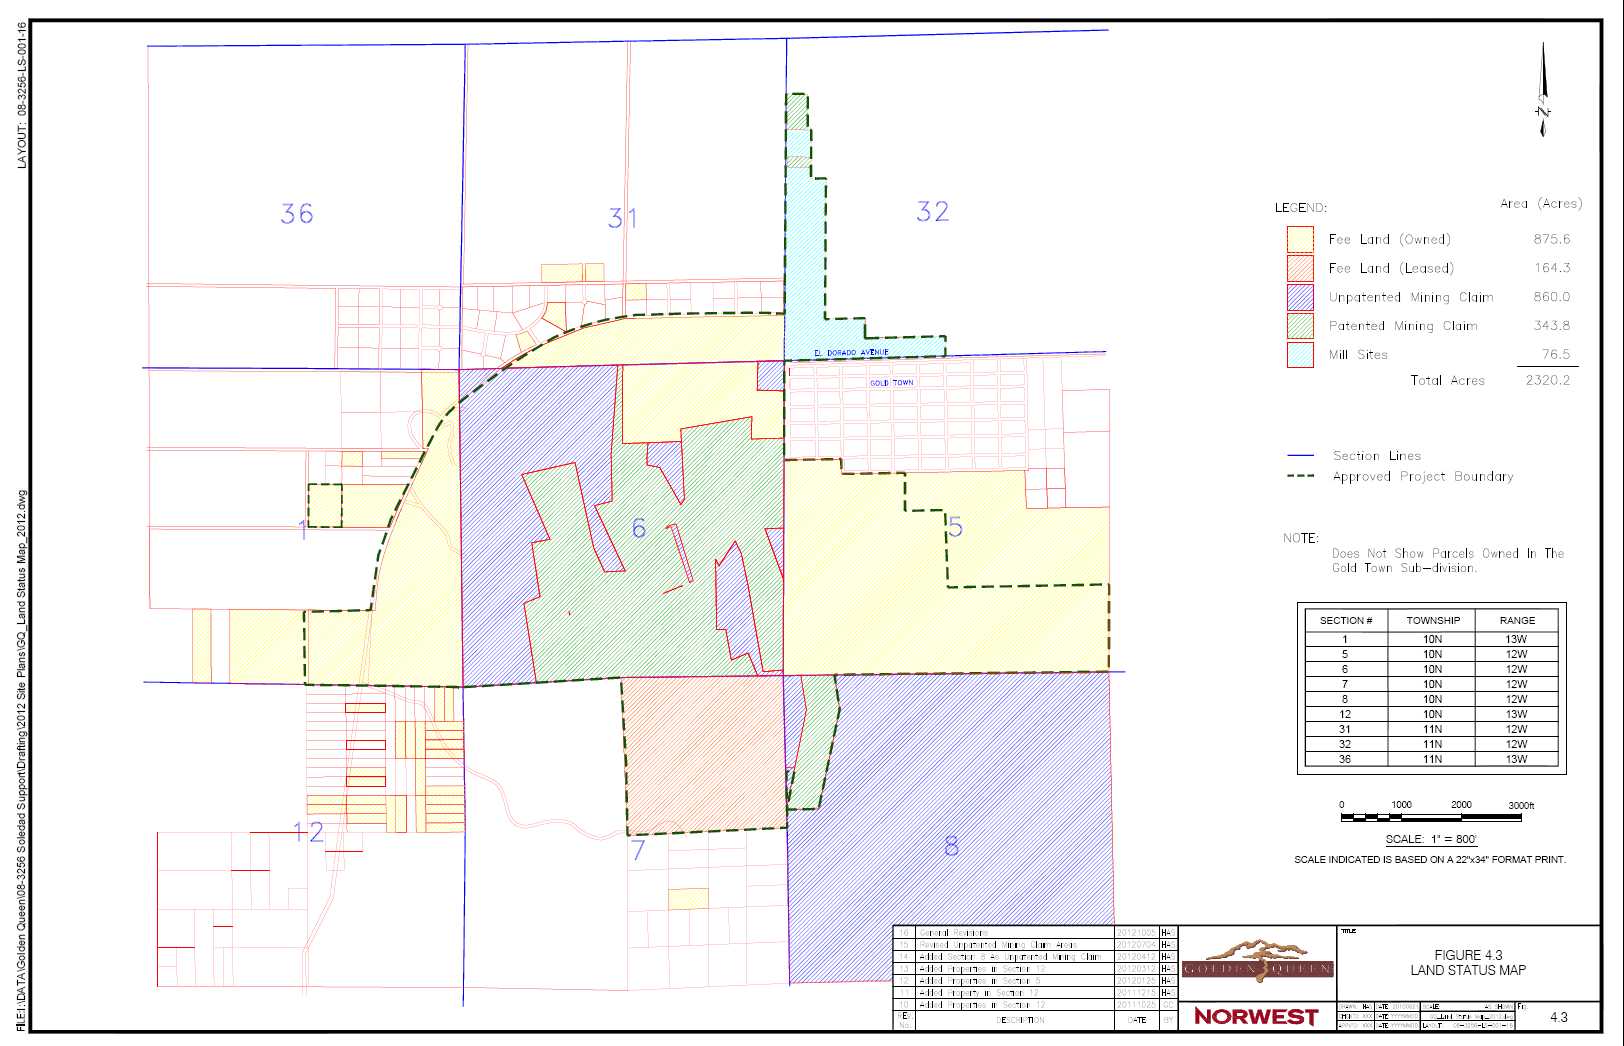
The Property is located west of California State Highway 14 and largely south of Silver Queen Road in Kern County, California, and covers all of Section 6 and portions of Sections 5, 7 and 8 in Township 10 North (T10N), Range 12 West (R12W), portions of Sections 1 and 12 in T10N, R13W, portions of Section 18 in T9N, R12W, and portions of Section 32 in T11N, R12W, all from the San Bernardino Baseline and Meridian. The Project facilities will be located in Section 6 of T10N, R12W. Two water production wells have been drilled in Section 32, T11N, R12W, on land controlled by GQM. A third water production well was drilled in Section 1, T11N, R12W, on land controlled by GQM in 2008.
4.3 Mineral Tenure and Mining Lease Agreements
GQM holds or controls via agreement 33 patented lode mining claims, 134 unpatented lode mining claims, 1 patented millsite, 12 unpatented millsites, 1 unpatented placer claim and 867 acres of fee land. A summary of the land held or controlled by GQM is shown in Table 4.1. As noted above, additional land is held by GQM which may be incorporated into the project area in the future if required. The land status is shown in Figure 4.3.
| October 2012 | 4-1 | |
| Soledad Mountain Project
Kern County, CA, USA
Technical Report |
Table 4.1 Land Status
| Land Status | Acres | Hectares |
| Fee Land (Owned) | 875.6 | 354.3 |
| Unpatented Mining Claims | 860.0 | 348.0 |
| Patented Mining Claims | 343.8 | 139.1 |
| Fee Land (Leased) | 164.3 | 66.5 |
| Millsites | 76.5 | 31.0 |
| Total | 2320.2 | 938.9 |
GQM holds or controls the properties under mining leases with 53 individual landholders, two groups of landholders and 2 incorporated entities. Contact information for the landholders is available on file at the GQM offices in Vancouver. Length of the agreements varies and the current approach is to have agreements extend to the year 2045.
GQM believes that all the land required for the Project either has been secured under a mining lease or is held by GQM through ownership of the land in fee or via unpatented mining claims. GQM executed land purchases or entered into agreements from 1990 onwards, and is continuing to add to its land position in the area.
A formal title review was done by Gresham Savage Nolan & Tilden, a firm with experience in title matters. The report was dated September 6, 1996 and was updated to April 26, 1999. This title review was done to provide confirmation that titles remained valid. Work on mining lease agreements and confirmation of titles is on-going and is being done by GQM’s “Legal Counsel, Gresham, Savage, Nolan and Tilden”.
A formal title review was again done by an independent landman, Sylvia Good, in May 2004.
4.4Royalties
Royalties paid to third party landholders and the State are shown as line items in the Project cash flows in Table 22.1.
There are multiple third party landholders and the royalty formula applied to mine production varies with each property. This leads to a complex set of royalty calculations. A standard net smelter return per ton formula has been applied to the cash flows to calculate the estimated royalty payable. The estimated royalty payable over the Project’s life is approximately $80million for the base case.
State royalties for payable gold and silver have been applied at the following rates:
| | • | Gold royalty = $5.00/oz gold (post-smelter) |
| | | |
| | • | Silver royalty = $0.10/oz silver (post-smelter) |
| October 2012 | 4-2 | |
| Soledad Mountain Project
Kern County, CA, USA
Technical Report |
The estimated combined gold and silver royalty paid to the State over the Project’s life is $6.4 million for the base case.
4.5 Surface Rights
About 45% of the land in California is controlled by the Federal Government; most of this land is administered by the US Bureau of Land Management (BLM), the US Forest Service, the National Park Service, or the US Department of Defense. Much of the land controlled by the BLM and Forest Service is open to prospecting and claim location. The distribution of public lands in California is shown on the BLM “Land Status Map of California” (1990) at scales of 1:500,000 and 1:1,000,000.
Bureau of Land Management regulations regarding surface disturbance and reclamation require that a notice be submitted to the appropriate Field Office of the Bureau of Land Management for exploration activities in which five acres or fewer are proposed for disturbance (43 CFR 3809.1 -1 through 3809.1 -4). A Plan of Operations is needed for all mining and processing activities, plus all activities exceeding five acres of proposed disturbance. A Plan of Operations is also needed for any bulk sampling in which 1,000 or more tons of presumed ore are proposed for removal (43 CFR 3802.1 through 3802.6, 3809.1 -4, 3809.1 -5). The BLM also requires the posting of bonds for reclamation for any surface disturbance caused by more than casual use (43 CFR 3809.500 through 3809.560.
4.6 Water Rights
Independent California legal counsel (“Memorandum, July 18, 2007, Initial Diligence Report and Potential Action Items – Golden Queen Mining’s Soledad Mountain Project”, Prepared by Paul Singarella, Esq., Latham & Watkins LLP, Costa Mesa, California.) did an analysis of water rights in California on a confidential basis. The following are key points:
| | a. | California does not regulate the use of groundwater under a state-wide administrative permit program; |
| | | |
| | b. | A land holder with land overlying groundwater does not need to have the right to pump water verified before the land holder can drill wells and pump water; |
| | | |
| | c. | Groundwater rights rules include a hierarchy of rights under which the rights of the overlying users are paramount; |
| | | |
| | d. | When a groundwater basin is in an overdraft condition, competing water uses will frequently initiate judicial proceedings to test the claims of competing rights; |
| | | |
| | e. | Groundwater rights can be determined, and pumping limited, through court adjudications; |
| | | |
| | f. | The Project will draw groundwater from the Fremont Valley groundwater basin and this basin is separated from other basins by significant geological features; |
| October 2012 | 4-3 | |
| Soledad Mountain Project
Kern County, CA, USA
Technical Report |
| | g. | Ongoing monitoring will be required to ensure that the groundwater immediately underlying the Project is not in an overdraft condition; |
| | | |
| | h. | If the Project’s groundwater demands were to contribute to an overdraft condition, GQM would be bound by the correlative rights doctrine, which provides that as between overlying owners, all have equal rights to the water and must share in any water shortages; |
| | | |
| | i. | An adjudication of groundwater resources in the Antelope Valley is ongoing and this also needs ongoing monitoring to confirm that the Fremont Valley groundwater basin is not drawn into this adjudication and |
| | | |
| | j. | Under Article X, Section 2 of the California Constitution, water must be put to |
| | | |
| | | “reasonable and beneficial use” and the California Code of Regulations expressly defines “beneficial uses” to include mining. |
Kern County Board of Supervisors approved a water entitlement of 170 m3/h (750 gal/min) in the CUPs issued in 1997.
Water required for the Project and alternative water supplies are described in Section 19.3.3, 19.4.3 and 19.4.4.
4.7 Reclamation and Reclamation Financial Assurance
GQM has provided reclamation financial assurance in the form of an Irrevocable Standby Letter Of Credit backed by a Certificate Of Deposit with Union Bank of California in the amount of US$286,653.00. This is the current estimate for reclamation of historical disturbances on the property and this is reassessed annually.
GQM prepared detailed cost estimates for ongoing reclamation and reclamation at the end of the life of the mine and these cost estimates were included in the Application for a revised Surface Mining Reclamation Plan. GQM will provide the necessary financial assurance as required by the regulatory authorities. Cost estimates for site reclamation are included in the discussion of the project economics and operating costs.
A number of additional approvals and permits will be required as project development proceeds, as detailed below:
| | • | Storm water permit; |
| | | |
| | • | Kern County building permits to include all applicable California codes and |
| | | |
| | • | Permit to store and dispense fuel onsite with provision for gasoline vapor recovery. |
Newly implemented security requirements make contract blasting a preferred option and a contract blasting service will be used. The contractor will be required to obtain the necessary approvals and permits.
| October 2012 | 4-4 | |
| Soledad Mountain Project
Kern County, CA, USA
Technical Report |
Conditions GQM must meet both before the start of construction, during operations and after operations have ended are set out in the Mitigation Measures Monitoring Program and Conditions of Approval.
4.8 Cautionary Statement
As noted in Section 1.6, the Project has been approved by the Kern County Planning Commission and the Kern Country Planning and Community Development Department. The Commission accepted the project plan subject to a number of Conditions of Approval. A number of these conditions specifically address issues related to reclamation of the property including backfilling and restoration to approximate pre-mining topography.
The mine plan presented in this document represents best efforts by Norwest to develop a mine plan which maximizes in-pit backfill while not unduly penalizing the Project’s economic viability. The pit shells used as a basis for this feasibility study were selected based on consideration of both economic and waste volume considerations with the goal of developing pit configurations which balanced ore tonnage against waste quantities.
In order for the current mine plan to meet all the conditions laid out by the County, approximately 19 million tons of waste rock must be sold as aggregate and removed from site prior to final reclamation. In addition, all the leached residues must be either permitted to remain in place or be sold as aggregate. If this quantity cannot be sold, the necessity of handling this additional volume as part of the reclamation plan will affect the overall ore tonnage that can be mined at site. While no costs or revenues associated with aggregate production using this material, have been included in the Project economic analysis, removal of these materials is an integral component of the integrated mining and backfilling plan. If these quantities of material remain onsite, it will require revision of the mining plan in order to meet the backfill requirements which could reduce the life of the heap leach operation by up to 5 years.
Norwest has worked with GQM to develop a scenario which limits the effect of this on the mine life and GQM has had promising discussions with a local aggregate contractor regarding the saleability of the waste rock and leached residues into the regional market. However, there is still a potential risk that meeting the requirements of the Conditions of Approval could affect the overall mine life.
The current mine plan includes mining and dumping activities beyond areas currently within the permitted limits. Norwest understands that GQM owns or is in negotiations with landholders to secure access and to expand the permit boundary however failure to do so could affect the current mine plan.
| October 2012 | 4-5 | |
| Soledad Mountain Project
Kern County, CA, USA
Technical Report |
| October 2012 | 4-6 | |
| Soledad Mountain Project
Kern County, CA, USA
Technical Report |
| 5 | ACCESSIBILITY, CLIMATE, LOCAL RESOURCES, INFRASTRUCTURE AND PHYSIOGRAPHY |
5.1 Access
Refer to sub-section 19.1 for a detailed description of access to site.
Access to site is from State Route 14 and Silver Queen Road, an existing paved county road. Access also exists from the south via Mojave Tropico Road, an existing paved county road. State Route 14 is the major highway, which connects Mojave, Rosamond, Lancaster and Palmdale to the greater Los Angeles area.
The Kern County Planning Department has assigned a new street address for the Project – 2818 Silver Queen Road, Mojave, CA 93501.
5.2 Climate
The Mojave region is generally characterized as arid, with a wet season from December through March. Rainfall events tend to be short-lived and of high intensity. Mojave experiences high summer temperatures up to 113°F. The minimum temperature may reach 20°F. Maximum wind speed is 90mph with Exposure C for design purposes. Mean recorded annual rainfall is 6.14 inch with a mean maximum month of 1.11 inch.
Exploration is possible year round, though snow in winter and wet conditions can make travel on unimproved dirt roads difficult. It is also expected that mining operations will be conducted year round.
5.3 Local Resources
Services such as a hospital, ambulance, fire-protection, garbage and hazardous waste disposal, schools, motels and housing, shopping, airport and recreation are available in Mojave and its surroundings. Telephone and internet service are available on site.
Mojave is a railroad hub for the Burlington Northern/Santa Fe and Union Pacific/Southern Pacific railroad lines.
Off-site infrastructure such as the availability of power and a backup water supply is described in sub-section 19.3.
5.4 Physiography
The Soledad Mountain gold-silver deposit is hosted in a volcanic sequence of rhyolite porphyries, quartz latites and bedded pyroclastics that form a large dome-shaped feature, called Soledad Mountain, along the margins of a collapsed caldera. The deposit is located on the central-northeast flank of Soledad Mountain. The mountain has a domal form that is a reflection of an original, dome-shaped volcanic center. The Project is located on the flanks of Soledad Mountain. Elevations range from 4,180 ft. above mean sea level at the highest point of Soledad Mountain to 2,840 ft. above mean sea level at the valley floor north of the mountain. The topographic relief ranges from moderate to steep.
| October 2012 | 5-1 | |
| Soledad Mountain Project
Kern County, CA, USA
Technical Report |
Vegetation is typical of the Basin and Range physiographic province. The lower slopes of Soledad Mountain are covered by sagebrush, grass, and various desert shrubs. Fauna that have been observed in the Project area are typical of those of the Great Basin area.
5.5 Sufficiency of Surface Rights
The Kern County Planning Commission formally considered the Project on April 8, 2010. At the meeting, the Commission, consisting of a panel of three commissioners, unanimously approved the Project. The Planning Commission certified the Supplemental Environmental Impact Report (SEIR) and adopted a Mitigation Measures Monitoring Program and a set of Conditions of Approval for the Project. The Mitigation Measures Monitoring Program and Conditions of Approval for the Project were amended by Commission Resolution No. 171-10 adopted on October 28, 2010 and are now final. The Approved Plan for the Project includes an Approved Project Boundary with a legal description checked and confirmed by the Kern County Engineering, Surveying & Permit Services Department.
GQM believes that the land required for the Project, which has been included within the Approved Project Boundary, has either been secured under a mining lease or is held by GQM through ownership of the land in fee or via patented and unpatented lode mining claims or millsites. Detail on the SEIR is provided in sub-section 21.1.1.
The current mine plan includes mining and dumping activities beyond areas currently within the permitted limits. Norwest understands that GQM owns or is in negotiations with landholders to secure access and to expand the permit boundary however failure to do so could affect the current mine plan.
5.6 Comments on Section 5
In the opinion of the Norwest QP:
The proposed project site is located in an area with access and services that can support the development and operation of the configuration and scale currently planned by GQM.
| October 2012 | 5-2 | |
| Soledad Mountain Project
Kern County, CA, USA
Technical Report |
| 6 | HISTORY | |
| | |
| The first recorded mining activity in the Mojave Mining District occurred on March 8, 1894,when W.W. Bowers discovered gold on a promontory south of Mojave, then named Bowers' Hilland now known as Standard Hill. This soon led to the discovery of the Exposed Treasure vein onthe same hill.Later that year gold was found on Tropico Hill, in the Rosamond Hills.Prospecting also started on Soledad Mountain and gold was found on the Queen Esther, Karma,Echo, Elephant and Gray Eagle properties. |
| | |
| The first mill was built at the Exposed Treasure Mine in 1901. This mill had 20 stamps and acyanide plant. Construction of other mills followed rapidly - the Echo mill in 1902 with 10stamps, the Queen Esther mill in 1903 and the Karma mill in 1904 with 20 stamps. Of theseproperties, the Exposed Treasure, with production equivalent to 3,260 kg or 105,000 oz of gold,was the largest; the Queen Esther, with production equivalent to 1,930 kg or 62,000 oz ofgold,was second and the Karma third with production equivalent to 1,150 kg or 37,000 oz ofgold.The last of these early mills was shut down in 1914 when the readily available ore wasexhausted. |
| | |
| The district attracted brief attention eight years later with a find of rich ore on the Yellow Dogclaim located on a small butte near Bowers' Hill, but interest soon waned as the deposit proved tobe small. |
| | |
| The revival of the district is attributable in part to the Burton Brothers, who, as owners of theTropico mine and mill, assisted lessors in the district by grub-staking prospectors and providinga mill for the treatment of lessees' ore. Lessees looking for a new area to work (George Holmes)found some float that led to the discovery of the Silver Queen vein system on Soledad Mountain in1933.Claims were staked and exploration was done. The property was sold to a syndicate(Golden Queen Mining Co.) headed by Gold Fields America Development Co. (GFA) in January1933. |
| | |
| GFA did extensive exploration on the property in the next few years, which resulted in a largeincrease in ore reserves. The Golden Queen vein was also discovered at that time. During thisperiod of exploration on the Golden Queen vein, an area south and west of the Golden Queenvein was also explored and a large vein was discovered on the Starlight claim. The SoledadExtension vein, west of the Starlight vein was also discovered. The Lodestar Mining Co. obtainedcontrol of this area. |
| | |
| GFA built a 300 ton/d mill on the property and production started in October 1935. The mill wasthen expanded to 400 ton/d. Ore was extracted from the Silver Queen, Golden Queen, Soledad,Queen Esther and Karma veins plus ore was custom-milled from other properties in the area.Tailings from smaller, historical mining operations were also retreated. Production continueduntil the mine was closed by Order L-208 of the War Production Board in 1942. Althoughrecords are incomplete, it is estimated that 1.3 million ton of ore was mined and milled withaverage grades of 9.5 g/t gold or 0.277 oz/ton gold and 223 g/t silver or 6.5 oz/ton silver. The mine did not resume production after the war although some exploration and development work was done. GFA returned the property to its former owners in 1953 and the company was dissolved. |
| October 2012 | 6-1 | |
| Soledad Mountain Project
Kern County, CA, USA
Technical Report |
It is estimated that a total of 8,030 ton of ore was mined in the Project area by lessors in the early 1950s.
The only exploration of note in the project area between 1953 and 1985 was undertaken by Rosario Exploration and Shell/Billiton and is further discussed in Section 10.2.
The Cactus Gold Mine, Standard Hill Mine and Tropico Mine are also located in the Mojave Mining District. These former operating mines are located within a 5 mile radius of Soledad Mountain.
| October 2012 | 6-2 | |
| Soledad Mountain Project
Kern County, CA, USA
Technical Report |
| 7 | GEOLOGICAL SETTING AND MINERALIZATION |
| | |
| Ttwo evaluations of the geology of the Soledad Mountain area were carried out, the first by MRDI and the second by SRK, who issued a NI 43-101 compliant Technical Report in March 2006, which is available on SEDAR and on the GQM website at www.goldenqueen.com. |
7.1 Regional Geology
Soledad Mountain is located within the Mojave structural block, a triangular-shaped area bounded to the east by the northwest-trending San Andreas Fault and to the north by the northeast-trending, Garlock Fault (Figure 7.1) . The Mojave block is broken into an orthogonal pattern of N50E to N60E and N40W to N50W fracture systems. These fracture zones likely developed as the result of Late Cretaceous compressional stresses that were present prior to formation of the Garlock and San Andreas Faults. Gold and silver mineralization at Soledad Mountain is hosted by northwest-trending, en-echelon faults and fracture systems. Cretaceous quartz monzonite forms the basement of stratigraphic sequences in the Mojave block. The quartz monzonite is overlain by Miocene-age, quartz latite and rhyolitic volcanic rocks. Volcanic centers appear to have formed at intersections of the northeast and northwest-trending fracture systems. Major volcanic centers are present at Soledad Mountain, Willow Springs and Middle Buttes. These volcanic centers consist generally of initial, widespread sheet flows and pyroclastics of quartz latite, followed by restricted centers of rhyolitic flows and rhyolite porphyry intrusives. Rhyolitic flows and intrusives are elongated somewhat along northwest-trending vents and feeder zones. Gold deposits in the Mojave block include Soledad Mountain, Standard Hill, Cactus and Tropico. Of these deposits, only Soledad Mountain is in the Project area. At Soledad Mountain gold mineralization occurs in low-sulfidation style, quartz-adularia veins and stockworks that strike northwest. Gold mineralization at Standard Hill, located 1 mile northeast of Soledad, consists of north to northwest-striking quartz veins in Cretaceous quartz monzonite and Tertiary, quartz latite volcanic rocks. At the Cactus Gold Mine, 5 miles west of Soledad, gold occurs in northwest and northeast-striking quartz veins, breccias and irregular zones of silicification in quartz latite, rhyolitic flows and rhyolitic intrusive breccias. A regional geologic map is shown in Figure 7.2.
| October 2012 | 7-1 | |
| Soledad Mountain Project
Kern County, CA, USA
Technical Report |
Figure 7.1 Structural Map Showing Location of Soledad Mountain Project (modified from Dibblee, 1963)
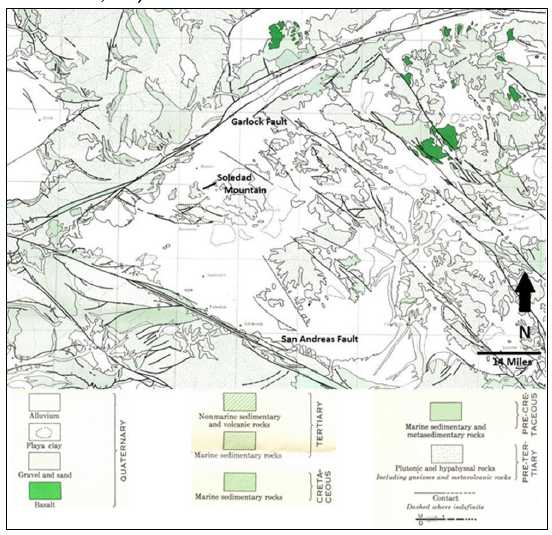
| October 2012 | 7-2 | |
| Soledad Mountain Project
Kern County, CA, USA
Technical Report |
Figure 7.2 Regional Geologic Map (Dibblee, 1963)
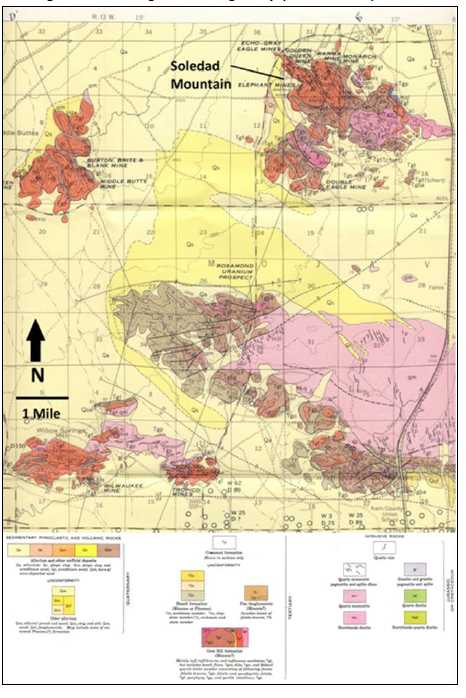
| October 2012 | 7-3 | |
| Soledad Mountain Project
Kern County, CA, USA
Technical Report |
7.2 Property Geology
McCusker (1982) mapped Soledad Mountain in detail and defined the major stratigraphic and structural features of the volcanic complex present there.GQM has retained McCusker’snomenclature without significant modification. Volcanics at Soledad Mountain comprise coalescing intrusive-extrusive domes, flows and pyroclastics. This volcanic center presumably overlies Cretaceous quartz monzonite, such as is exposed at the adjacent Standard Hill mine, although drill holes have not penetrated basement rocks at the deposit. Age dates of 21.5 Ma to 16.9 Ma have been obtained from the volcanic rocks, suggesting that the volcanic center formed over a relatively long period from early to middle Miocene age. The lower-most volcanic unit penetrated in drilling is an early Miocene quartz latite flow that strikes northwest and dips at low angles to the northeast. Overlying the quartz latite is a section of middle Miocene pyroclastics,(“lower pyroclastics”), comprising a vent-proximal sequence of coarse-grained volcanic debris, breccias and tuffs. Flow-banded rhyolites intrude and overly the lower pyroclastic unit. The rhyolites appear to have flowed out along a northwest-trending, high-angle vent coinciding generally with the center of the deposit and then north-eastward away from the vent. Coarse- grained, pyroclastic breccias occur locally over the flow-banded rhyolites along the axis of the vents. These pyroclastic rocks likely represent laterally discontinuous zones of vent eruptions and collapse breccias that formed after the main pulse of rhyolite extrusion. The youngest volcanic unit is a massive, quartz-eye rhyolite porphyry of middle Miocene age. This unit is present over most of the southwest portion of the property. The rhyolite porphyry forms the core of the volcanic complex, intruding and displacing previous volcanic units south of the deposit center. Emplacement of the porphyry may have been controlled by a northwest fault that now coincides with the Soledad Extension Vein. GQM has classified volcanic lithologies into four units (Figure 7.3); Quartz latite: present over most of the northeast portion of the deposit and in the subsurface of the center of the deposit; Pyroclastics: present in the subsurface of the north-central portion of the deposit beneath flow-banded rhyolite; Flow-banded rhyolite: present at the surface in the north-central portion of the deposit and, as an intrusive, extending deep into the center of the deposit; and rhyolite porphyry: present as a massive body extending from the surface to the bottom of drilling over most of the southwest portion of the deposit.
| October 2012 | 7-4 | |
| Soledad Mountain Project
Kern County, CA, USA
Technical Report |
Figure 7.3 Geologic Map of Soledad Mountain Project with Vein Systems
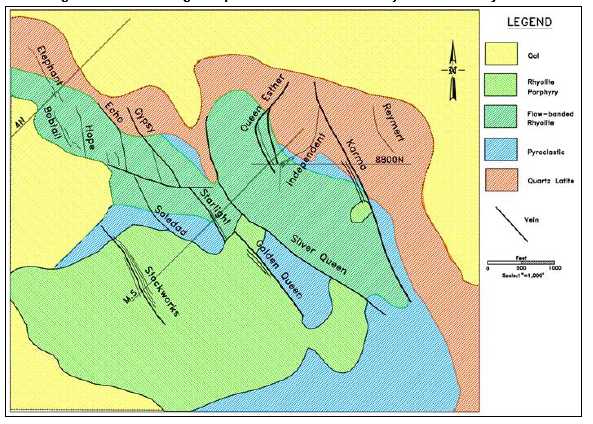
Note: Figure provided by GQM 2000.
7.3 Mineralization and Alteration
At least 14 separate veins and related vein splits occur at Soledad Mountain. Veins generally strike N40W and dip at high angles either to the northeast or to the southwest. Mineralization consists of fine-grained pyrite, covellite chalcocite, tetrahedrite acanthite, native silver, pyrargyrite, polybasite, native gold and electrum within discrete quartz veins, veinlets, veinlet stockworks and irregular zones of silicification. Electrum is about 25% silver. Native gold is generally associated with siliceous gangue and occurs as particles with diameters ranging from less than 10 µm to as much as 150 µm. Gangue minerals include quartz, potassium feldspar, ferruginous kaolinitic clay, sericite, hematite, magnetite, geothite and limonite. Veins formed by the process of intense alteration of volcanic rocks and by deposition of quartz and sericite-rich material in fault and fracture zones (Figure 7.4) . The alteration is generally low in sulfur, withtotal sulfide content being 1% or less. Vein “zones” consist of one or more central veinssurrounded by either a stockwork or parallel zones of veinlets. The effect is to have a core vein of 1 ft. to 20 ft. wide (with gold grades being generally greater than 0.1 oz/ton), surrounded by lower grade mineralization with widths ranging from 5 ft. to 150 ft. The boundary between mineralized and non-mineralized material must be determined by assay.
| October 2012 | 7-5 | |
| Soledad Mountain Project
Kern County, CA, USA
Technical Report |
Figure 7.4 Schematic Section of Epithermal Deposit at Soledad Mountain. (Hall & Thornsberry, 1999)

7.4 Vein Geometry
Important veins (Figure 7.3), from the northeast to southwest, are the Reymert, Karma, Independent, Queen Esther, Silver Queen, Golden Queen, Starlight, Gypsy, Echo, Soledad Extension, Hope, Elephant and Bobtail. Veins northeast of the Golden Queen Vein dip from 40° to 70° northeast. Veins south of the Golden Queen Vein dip about 70° southwest. A zone of“Flat Ore” is present between the Starlight and Silver Queen Vein. Flat Ore is a complex zone ofveins and stockwork mineralization that is from 100 ft. to 125 ft. thick and nearly horizontal. It may have been produced by post-ore faulting of higher levels of the Starlight Vein. Separate, parallel or en-echelon vein systems are present over a total strike length of 6,000 ft. trending northwest and a total width of 4,500 ft. Veins and zones are from 5 ft. to 150 ft. thick, 325 ft. to 3,000 ft. long and from 300 ft. to 1,000 ft. deep along dip. The horizontal distance between individual veins is from 50 ft. to over 400 ft.
Gold grades greater than 0.1 oz/ton appear to occur where veins exhibit multiple generations of quartz, adularia and sericite. Sheeted vein systems and stockwork veins decrease in grade laterally outward from core veins. Silver to gold ratios vary from 1:1 in shallow portions of veins in the south half of the deposit to greater than 35:1 at deeper levels (600 Level) in the north half of the deposit. A consulting geologist, working for GQM, studied spatial variations in silver to gold ratios throughout the vein systems (GQM internal report, April 1998). Silver to gold ratios were found to increase generally with depth from about 10:1 at the surface of the Golden Queen Vein (historical GFA 0 Level) to about 35:1 at the 600 Level in the same vein. The district average ranges from 15:1 to 18:1.
| October 2012 | 7-6 | |
| Soledad Mountain Project
Kern County, CA, USA
Technical Report |
A map showing the surface trace of the various veins was completed on the property over a number of years in the 1990s. A copy of the open pit layouts superimposed on the vein trace map is shown in Figure 7.5. The information is available in the Norwest offices in Vancouver.
7.5 Prospects
Exploration and exploration potential are described in Section 9.0 and Section 9.8 respectively.
7.6 Comments on Section 7
In the opinion of the AMEC QP:
| | • | Knowledge of the deposit settings, lithologies, and structural and alteration controlson mineralization is sufficient to support determination of Mineral Resources andMineral Reserve estimation. |
| | | |
| | • | The mineralization style and setting of the Project deposit is sufficiently wellunderstood to support determination of Mineral Resources and Mineral Reserveestimation. |
| | | |
| | • | Prospects (refer to Section 9.8) are at an earlier stage of exploration, and thelithologies, structural, and alteration controls on mineralization are currentlyinsufficiently understood to support determination of Mineral Resources. |
| October 2012 | 7-7 | |
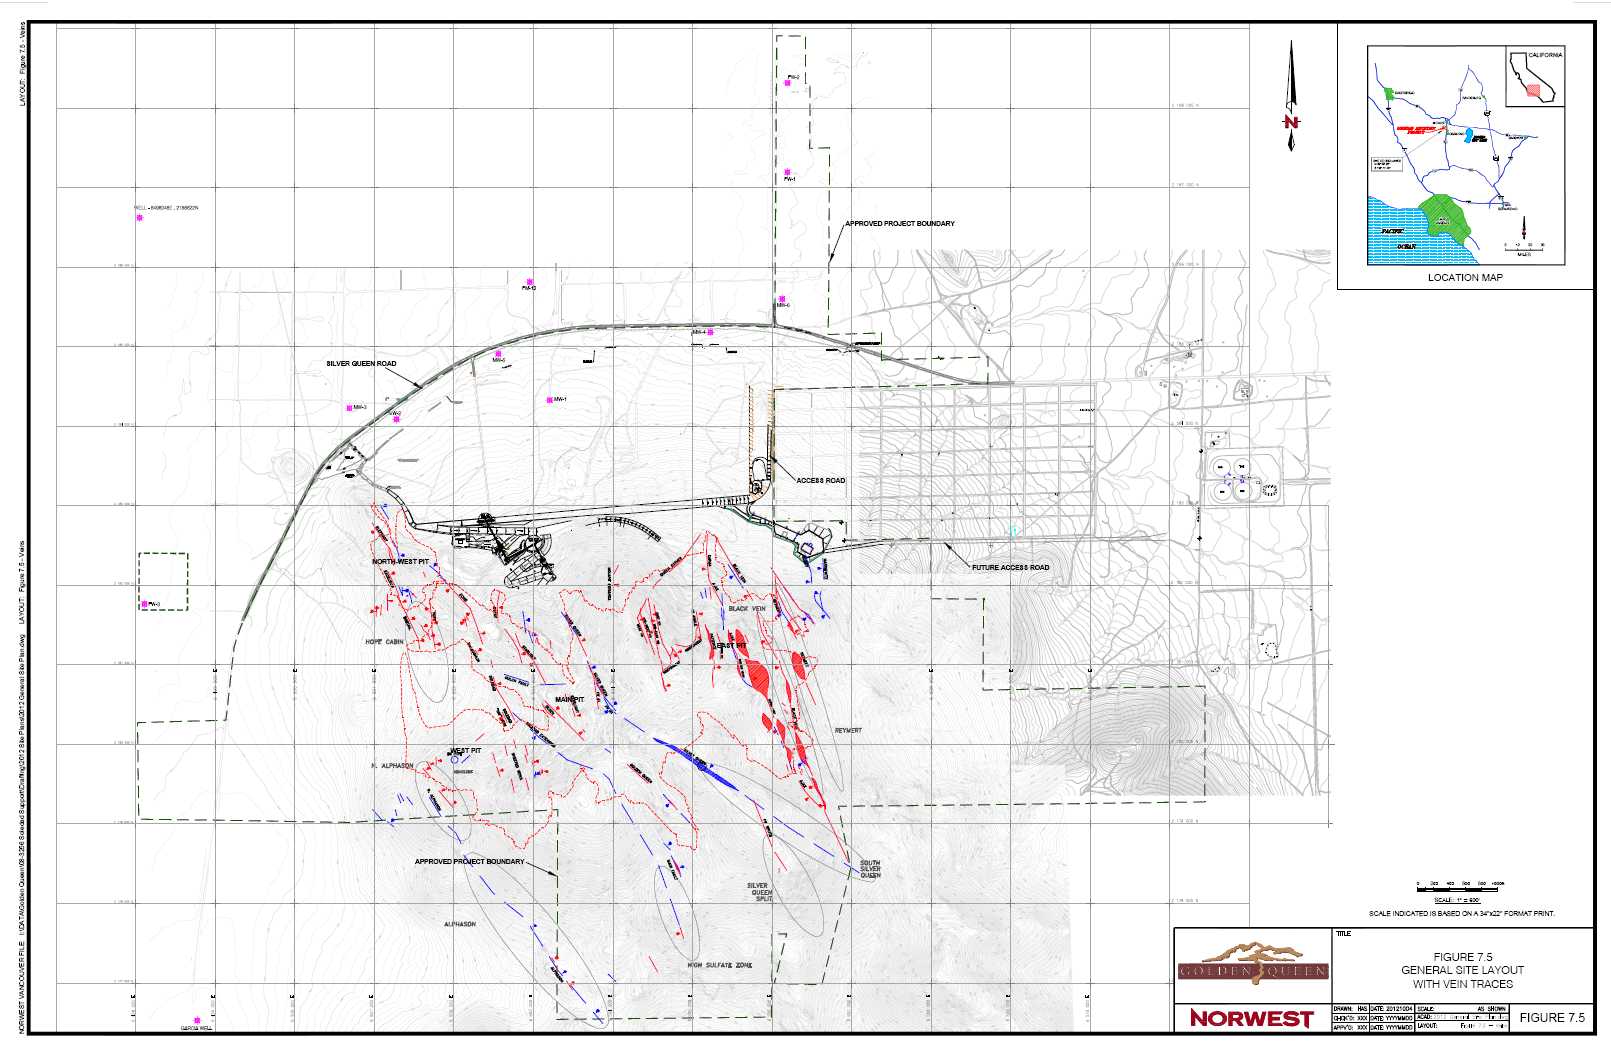
| Soledad Mountain Project
Kern County, CA, USA
Technical Report |
| 8 | DEPOSIT TYPES |
| | |
| GQM interprets the deposition of precious metals to be related to a large epithermal, multi- episodic, fault/fissure vein system. Gold mineralization occurs in low sulfidation style, quartz adularia veins and stockworks that strike northwest. Veins formed by the process of alteration of volcanic rocks by convecting groundwaters with the deposition of quartz and sericite-rich material in fault and fracture zones (Figure 7 4). The total sulfide content is one percent or less.Vein “zones” consist of one or more central veins surrounded by either a stockwork or parallel zones of veinlets. High grade mineralization shoots form where dilational opening and cymoid loops develop, typically where the strike or dip of the fault changes, allowing solutions to undergo cooling, degasification by fluid mixing, boiling, pH changes of hydrothermal solutions, and decompression. |
8.1 Comments on Section 8
In the opinion of the AMEC QP, deposit genesis and models as used in the exploration programs and for the development of Mineral Resource and Mineral reserve estimates are appropriate based on the style and settings of the mineralization.
| October 2012 | 8-1 | |
| Soledad Mountain Project
Kern County, CA, USA
Technical Report |
9.1 Grids and Surveys
A new topographic database was produced in 2004. DeWalt Corporation, Bakersfield set the control points around the perimeter of the area. Foto Flight Surveys Ltd., Calgary did the aerial photography in July 2004. Triathlon Ltd., Vancouver (a company that is no longer in business) scanned colour film, completed aerial triangulation, photogrammetric mapping and digital ortho-photography. Project specifications were as follows:
| | • | Control points 8 targeted and surveyed control points. |
| | | |
| | • | Photo scale 1:16,000. |
| | | |
| | • | Mapping scale 1 inch = 200 ft. |
| | | |
| | • | Contour interval 5 ft. |
| | | |
| | • | Projection California State Plane Zone 5. |
| | | |
| | • | Horizontal datum NAD83. |
| | | |
| | • | Vertical datum NAV88. |
| | | |
| | • | Units - Survey Feet. |
9.2 Geological Mapping
Geologic mapping of Soledad Mountain was completed by McCusker in 1982 as part of a MS Thesis study and by GQM geologists during the first phase of development from 1986 to 1991. GQM completed a 1:200 geologic scale mapping program over the entire Project area.
9.3 Pits and Trenches
Several legacy trenches were noted on the southern extension of the Golden Queen vein. Channel samples indicate that anomalous gold mineralization is present. However assay results were not used in developing Mineral Resources and Mineral Reserves for the Project.
9.4 Geochemical Surveys
Geochemical surveys were completed on the property over a number of years in the 1990s. GQM found a map in the records but could not locate the supporting information. Golder Associates Inc., Lakewood created a Geochemical Survey Map from the historical map to provide a more permanent record (Project No. 043-2299C). The Geochemical Survey Map is shown in Figure 9.1. The information is available in the Norwest offices in Vancouver.
9.5 Petrology, Mineralogy and Research Studies
In 1989, Russell Honea examined polished sections from metallurgical test samples in order toenhance GQM’s understanding of mineralization species. In 1997 and 1998, Pittsburgh Mineral& Environmental Technology, Inc. reviewed 11 metallurgical test samples to identify gold and silver mineralogy, mode of occurrence of gold and silver, and determine the liberation/locking characteristics of gold and silver.
| October 2012 | 9-1 | |
| Soledad Mountain Project
Kern County, CA, USA
Technical Report |
The gold and silver mineralogy for rhyolite and quartz latite are essentially the same as determined by Amtel Ltd. in ten studies and reports from 2003 to 2007. Rhyolite is however typically more highly silicified than quartz latite and more gold has consistently been extracted from quartz latite than from rhyolite in column leach tests.
9.6 Geotechnical and Hydrological Studies
9.6.1 Geotechnical Studies
A summary of the geotechnical programs that have been conducted on the property since 1995 is provided in this section.
The heap and heap leach pad design was completed by Golder as per the detail provided in a revised, geotechnical design report and this was included as Appendix 2 in the revised Report of Waste Discharge prepared for the Lahontan Regional Water Quality Control Board (GQM, 2012).
Geotechnical field exploration was done on site by Charles Van Alstine (1995), The Glasgow Engineering Group Inc. (1995 and 1996), Golder {1997, 2004, 2006, 2011(2), 2012} and Fielden Engineering Group (2012). The work was done to assess the surface and subsurface geotechnical conditions to support the design for the Phase 1 and Phase 2 heap leach pads, the foundations for the crushing-screening plant, the foundations for the workshop-warehouse, for site runoff control, and to identify suitable soils for use as low-permeability soil liner material. The programs consisted of geotechnical borings using cone-penetration, hollow-stem auger drilling, and excavating test pits with backhoes both on site and in the area of a proposed borrow pit west of Mojave-Tropico Road.
The location of borings and test pits is shown on Drawing 4 of the revised, geotechnical design report referred to above. The field data, test pit logs, borehole logs and the results of extensive test work done on samples are available in the Golder offices in Denver.
Five diamond drill holes were drilled to obtain information for various rock types and discontinuities for slope stability analyses in 1997. A series of strength-related tests was performed on the drill core and the following information was recorded: A geological description, faults and fractures, unconfined compressive strength, point load strength, elastic modulus, specific weight and moisture content. More detail is provided in Section 16.1.1.
9.6.2 Hydrological Studies
The most recent study of site drainage was prepared by Golder (Golder, 2012) and this was included as Appendix 5 in the revised Report of Waste Discharge prepared for the Lahontan Regional Water Quality Control Board (GQM, 2012).
| October 2012 | 9-2 | |
| Soledad Mountain Project
Kern County, CA, USA
Technical Report |
The site drainage patterns are characterized by sheet flows over the surface with incised channels along preferred pathways. These patterns are influenced by local topography and features from historical mining operations on the property. Most of the surface runoff drains to an ephemeral drainage channel that runs from east to west just to the south of Silver Queen Road. The eastern portion of the drainage channel has been designated as a FEMA 100-year floodplain.
Runoff rates for onsite and offsite basins that are tributary to the drainage channel are presented in the Soledad Mountain Hydrology Study by Rivertech Inc. (Rivertech, 2009). The information was used to support the design of the low-flow access road to the property. Golder also determined runoff volumes for the basins that drain to the east and to the west.
Site drainage as it applies to the open pit operation is described in Section 16.8. Site drainage as it applies to the heap leach operation is described in Section 18.1.2.
The most recent study of groundwater flows was prepared by ARCADIS U.S., Inc. (ARCADIS, 2012) and this was included as Appendix 8 in the revised Report of Waste Discharge prepared for the Lahontan Regional Water Quality Control Board (GQM, 2012).
The Project is located at the southern end of the Fremont Valley groundwater basin and at the northern end of the Gloster subunit, immediately adjacent to the Chaffee subunit. The primary aquifer in the Project area is the Quaternary alluvium which fills the basins and wide expanses of the Mojave Desert between isolated bedrock outcrops. The alluvium ranges in thickness from 0m (0ft) to 100m (300ft) on the flanks of Soledad Mountain and may be up to 217m (700ft) thick in the Mojave area. Older alluvium is typically composed of silt, sand, gravel and boulders. Local altering of feldspars to clay may occur. Younger alluvium composed of silt- and clay-rich lake bed and playa deposits occurs interbedded with the coarser materials. The lower permeability layers restrict downward flow above and in the aquifer. Studies have shown that the aquifer materials have a relatively low permeability in the order of 1x10⁻⁴cm/sec.
Regionally, groundwater in the Fremont Valley flows east, then northeast towards Koehn Lake. Locally, groundwater flow directions are complicated by the essentially impermeable bedrock of Soledad Mountain. East of Soledad Mountain, groundwater flows into the California City sub-basin and further down-gradient to Koehn Lake, a dry lake, and this is the lowest point in the Fremont Valley basin with an elevation of 1,940 ft. above mean sea level.
The depths to groundwater north of the site range from approximately 200 ft. to 250 ft. based upon levels obtained from 6 monitoring and 3 production wells drilled, equipped and tested by GQM. Local domestic water wells have low yields (below 50 gallons per minute), however wells located further to the north have indicated higher yields with rates as much as 2,500 gallons per minutes at the Jameson Ranch located 4 miles to the north of the Project. Water levels in the characterization and production wells on site show that groundwater in the area has minimal gradient and water levels have remained virtually static for the past ten years. Information provided by the Mojave Public Utilities District indicates that water levels in wells surrounding the town of Mojave have remained relatively static for the past two decades.
| October 2012 | 9-3 | |
| Soledad Mountain Project
Kern County, CA, USA
Technical Report |
Groundwater recharge is primarily from the Tehachapi and San Gabriel mountains several miles to the southwest, west and northwest of the Project area. At the mountain front, alluvial fans (termed bajadas) receive runoff from the higher mountains and act as points of recharge. As groundwater flows from west to east, faults and bedrock outcrops act as barriers to groundwater flowing through the alluvium. These barriers contribute to the groundwater basin and sub-basin outlines.
There are no springs or intermittent streams in the immediate Project area. The closest stream is approximately 5km (3miles) to the west. Evaporation rates are high. Precipitation, which does not evaporate, runs off rapidly with no evidence of groundwater recharge from runoff in the area.
The Water Quality Control Board has identified four possible uses for groundwater in the groundwater basin – municipal and domestic, agricultural, industrial and domestic water replenishment. Most of the wells in the immediate Project area are small-diameter, relatively shallow, domestic water wells. There is currently no known agricultural or industrial use of groundwater in the immediate area.
Groundwater quality is analyzed in detail in the report prepared by ARCADIS U.S., Inc. referred to above. GQM has drilled and equipped 6 characterization and future water quality monitoring wells along Silver Queen Road and just to the north of the Approved Project Boundary. Water samples have been taken and analyzed since the 1990s. GQM introduced a strict sampling and analysis protocol in 2008 and the protocol has been followed since that time. GQM has submitted quarterly and an annual reports in compliance with the Waste Discharge Requirements set by Lahontan Regional Water Quality Control Board since 2010.
The use of groundwater as the water supply for the Project is described in Section 19.3.2.
9.7 Metallurgical Studies
A number of phases of metallurgical test work were completed between 1989 and 2007, and these are described in Section 13.
9.8 Exploration Potential
GQM notes the following exploration targets (see Figure 7.5):
| | • | Southeast extension of Silver Queen Vein. Surface float of gold-bearing quartzboulders suggest the presence of an extension of “high-grade” (>0.1oz/ton) drillintercepts on the Silver Queen Vein. |
| | | |
| | • | Junction of Silver Queen and Ajax/Karma Veins. This projected intercept has notbeen drilled. |
| | | |
| | • | Markiewitz and Reymert Veins.Additional drilling may extend current drillintercepts to the northwest and southeast. |
| October 2012 | 9-4 | |
| Soledad Mountain Project
Kern County, CA, USA
Technical Report |
| | • | Alphson Vein Systems.Previous drilling by Noranda produced several 20 ft.intercepts of 0.02-0.035 oz/ton gold that need to be followed up with additionaldrilling. |
| | | |
| | • | Northwest Alphson Vein Systems.A 50 ft. wide zone of quartz veining, exposed onthe surface, has not been sampled.At least three GQM RC holes drilled northwest ofthe quartz veining encountered 5 ft. intercepts of 0.1-0.4 oz/ton gold. Additionaldrilling is warranted to test the subsurface extent of the Alphson zone. |
| | | |
| | • | Hope Cabin Flat. The Bobtail Vein and Hope Vein systems project southeast into anarea covered by recent alluvium. Additional drilling may increase the resource onthese two veins. |
| | | |
| | • | Southern end of the Golden Queen Footwall Vein. A core hole drilled in the early 1980s encountered sporadic 0.01-0.1 oz/ton grades in strongly silicified tuffs. The silicification appears to be nearly horizontal and may represent pervasive silicification above a higher grade, structurally controlled feeder zone. |
9.9 Comments on Section 9
In the opinion of the AMEC QP:
| | • | The exploration programs completed to date are appropriate to the style of thedeposits and prospects within the Project. |
| | | |
| | • | The exploration and research work supports the interpretations of the orogenesis ofthe deposits. |
| | | |
| | • | The Project retains significant exploration potential, and additional work is plannedafter the start of production. |
In the opinion of the Norwest QP:
| | • | The geotechnical and hydrological studies completed to date support a feasibility level engineering study and mine plan. |
| October 2012 | 9-5 | |
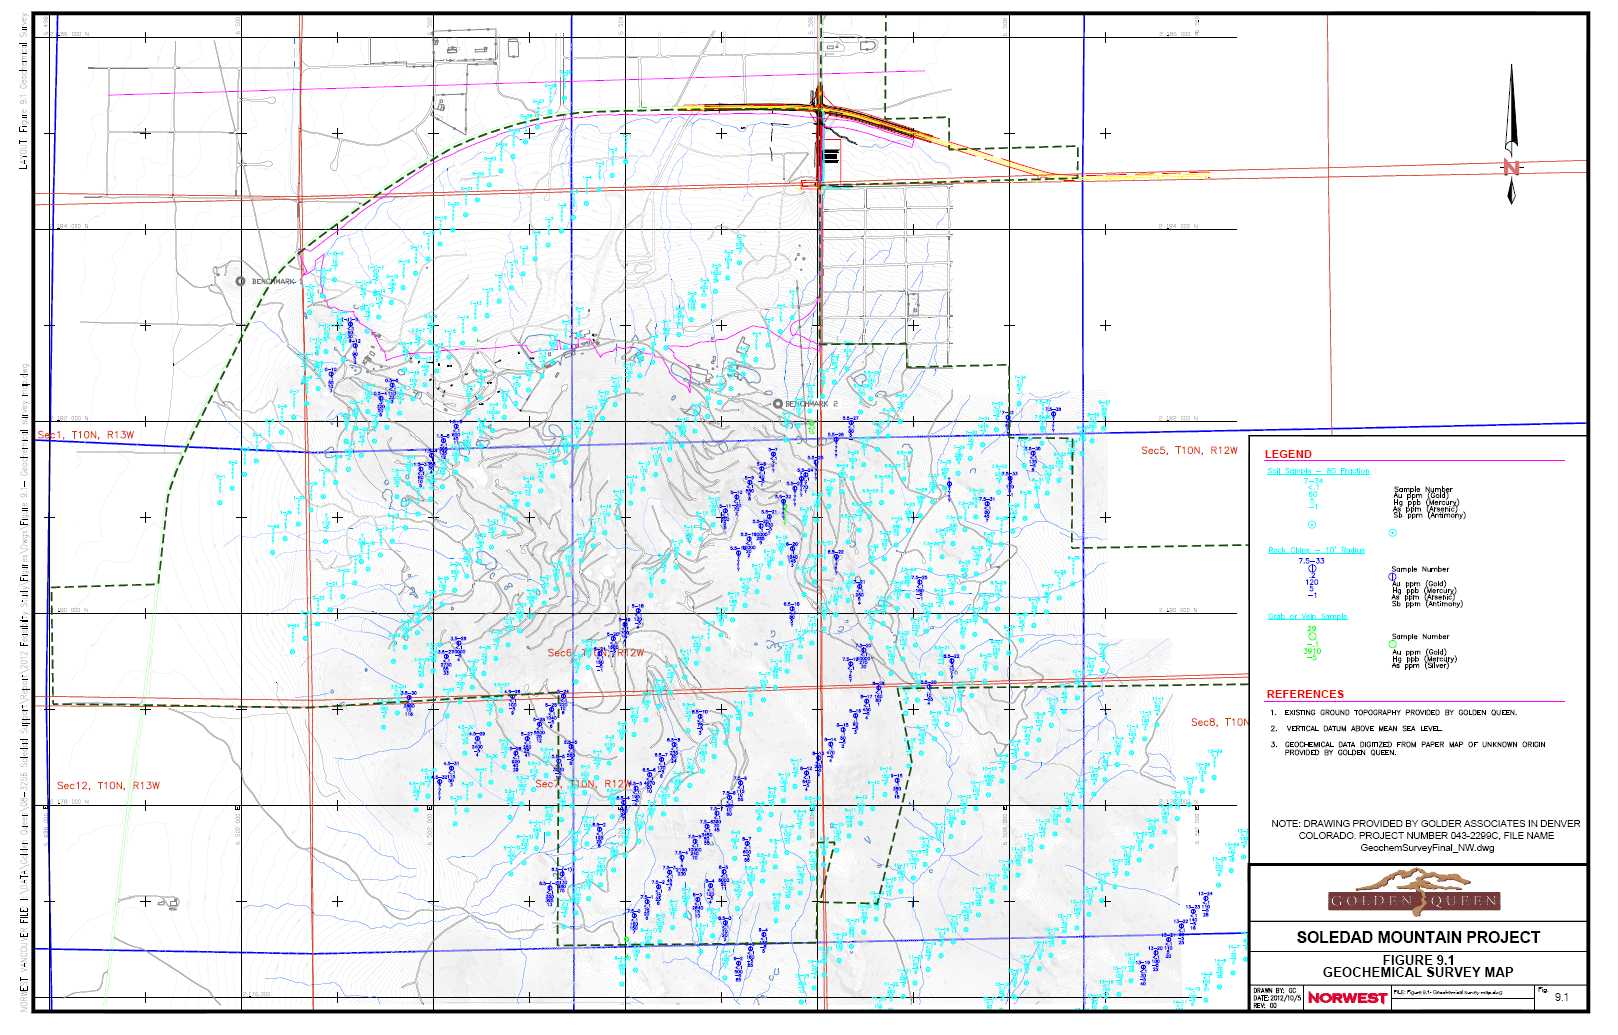
| Soledad Mountain Project
Kern County, CA, USA
Technical Report |
| 10 | DRILLING |
| | |
| The drilling database consists of surface and underground drill hole samples as well as underground cross-cut channel samples. All underground cross-cut channel samples were labelled and treated as drill holes. |
| | |
| Data from 1,374 RC holes, diamond core holes and underground cross-cut channels was loaded into the MineSight® files for a total of 379,326.4 ft. of data. Approximately 86.5% of the drilling in the database was completed during GQM’s ownership from 1986-2011. The remaining 13.5% of the drilling was completed by Shell/Billiton, Rosario, and Noranda. |
| | |
| All un-assayed intervals (missing samples) were set to null values and not used in the resource estimation. Figure 10.1 shows the distribution and general orientation of the drill holes for the deposit. |
| | |
| Twenty RC holes were drilled for a total of 6,287 ft. in 2011. The RC holes were concentrated in Szones 2 and 4 on the northern limit of the mineralized zones. The general location and orientation of the RC holes is shown in Figure 10.1. |
Figure 10.1: Drill Hole Location Map Showing Areas Drilled in 2011 (red ellipse, not all drill hole
in ellipse are new) and All Drill Holes Drilled to Date.
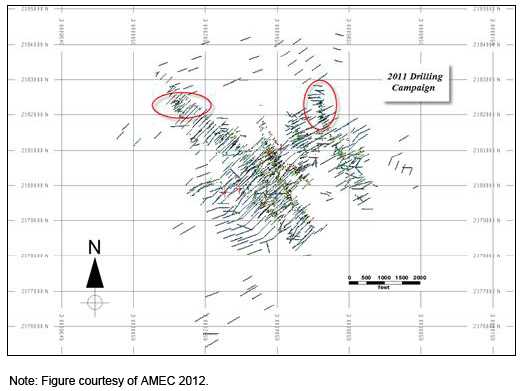
| October 2012 | 10-1 | |
| Soledad Mountain Project
Kern County, CA, USA
Technical Report |
10.1 Pre-World War Drill and Cross-cut Channel Sampling Campaigns
A syndicate headed by GFA acquired most of the properties in 1933 and completed extensive exploration programs until ordered to cease operations by Order L-208 of the War Production Board in 1942. GQM added information from 388 GFA cross-cut channel samples for a total of 23,031.3 ft. and 59 underground diamond drill holes for a total of 16,108 ft. on the Silver Queen and Golden Queen vein systems to the database.
Additional channel samples were collected by various operators on other vein systems (Karma) since the district was discovered. Information from an additional 97 underground channel samples totalling 6,397.1 ft. was added to the database.
10.2 Post World War II to Pre-GQM Drill Campaigns
Rosario and Shell-Billiton drilled 52 RC holes totalling 11,738 ft. before GQM acquired its first properties in 1985.
10.3 1985-2000 GQM Drill and Cross-cut Channel Sampling Campaigns
Drilling by GQM from 1985 to 2000 consisted of 663 RC drill holes and 58 diamond drill holes.
The first round of exploration drilling ended in 1991 and the Project was placed on care and maintenance from 1991 to 1994. GQM added 332 RC holes for a total of 112,309 ft. and 12 diamond drill holes for a total of 7,117.5 ft. during this first round of exploration. Drilling was restarted in 1994 and carried on until 1999. During this second period of drilling, an additional 369 RC drill holes for a total of 171,235 ft. and 46 diamond drill holes for a total of 25,103.5 ft. were completed.
GQM collected information from an additional 97 underground cross-cut channel samples totalling 6,397.1 ft. that was added to the database. Veins sampled were Echo, Karma, Elephant, Rabb, Independent, Queen Esther, Ajax, Starlight, Golden Queen, Eagle, Silver Queen Excelsior, and Hope.
10.4 2011 GQM Drill Campaign
GQM drilled a total of 6,287 ft. in 20 RC drill holes in 2011. Nine drill holes were collared in the North-west Pit area, and the remaining 11 were drilled in the East Pit area. This drill program was based on recommendations made by AMEC to increase the drill density in these two areas.
Harris Drilling from Escondido, California did the drilling for the 2011 campaign using a Foremost Explorer 1500 Buggy-mounted drill with 4 inch diameter drill pipe and a 5 ½ inch diameter hammer drill bit. RC drilling was completed wet with water injection to control dust emissions. AMEC did not observe the 2011 drilling in the field.
| October 2012 | 10-2 | |
| Soledad Mountain Project
Kern County, CA, USA
Technical Report |
10.4.1Opinion Statement
Based upon the discrepancies between the collar survey orientations and the downhole surveys at East Pit performed by Golder, AMEC believes there is significant uncertainty in the true orientation of the 2011 drill holes at Soledad Mountain. Because the lengths of the drill holes are relatively short, the risk of a significant error in the location of mineralized intercepts is low. AMEC calculated the theoretical cumulative downhole deviation as a result of a 6.9 degree difference in azimuth and a 2.7 degree difference in dip, and found a 27.3 ft. offset at 325 ft. (average length of 2011 drill holes) and a 45.8 ft. horizontal offset at 545 ft. (longest drill hole from the 2011 campaign).
10.5 Drill Methods
10.5.1Reverse-Circulation Holes
Drilling methods are described here from information compiled by MRA(2008). MRDI checkedthis information where it was noted on drill logs stored in GQM’s files. MRDI reports thatinformation on contractors and drill-rigs used for the first 332 RC holes drilled from 1985 to 1991 was not available. From 1994 to 1999, RC holes were drilled by Hackworth Drilling Company and P.C. Exploration Company using track-mounted MPDH 1000 drill-rigs. Drill bits ranging from 4.75 inch to 5.5 inch diameter were used. Samples reportedly were collected at the drill rig at 5 ft. intervals. According to GQM staff, drilling was carried out with water injectionto control dust emissions. This required use of a rotating wet splitter. A “rig duplicate” samplewas collected and left at the drill site. MRDI inspected five drill sites near the 200 Level portal and found that the plastic bags in which rig duplicate samples had been stored had decayed, ruining the sample, or that samples had been destroyed during subsequent road work. As a result, very few rig duplicate samples were preserved in a condition that permitted check sampling. RC samples were not weighed at the time they were collected; therefore, sample recovery could not be determined. MRDI reports that RC drilling, logging and sampling methods did appear to meet industry standards.
GQM drilled a total of 6,287 ft. in 20 RC drill holes in 2011. Harris Drilling, Escondido, California did the drilling for the 2011 campaign using a Foremost Explorer 1500 Buggy-mounted drill with 4 inch diameter drill pipe and a 5 ½ inch diameter hammer drill bit. RC drilling was completed wet with water injection to control dust emissions. AMEC did not observe the 2011 drilling in the field.
10.5.2Core Holes
Information given here was obtained from MRA’s description contained in the M3 feasibilitystudy of March 1998. This information was checked during MRDI’s2000 audit, where the information was available on drill logs.
Twelve surface diamond drill holes were drilled from 1985 to 1991 by several contractors. Information is not available concerning drill-rigs utilized. From 1994 onwards, surface diamonddrilling has been carried out by McFeron and Marcus Exploration, Inc., using a DMW-65 drill rig. All core was HQ (2.5 inch diameter).
| October 2012 | 10-3 | |
| Soledad Mountain Project
Kern County, CA, USA
Technical Report |
Underground core drilling was done, starting in 1994, by Boart Longyear Company using LM75 drill rigs. All core was HQ (2.5 inch diameter). Core from holes drilled by GQM was inspected by MRDI in 2000 and SRK in 2005 at a storage warehouse on site. Core boxes are in good condition and stored in a secure, well-organized fashion on wooden shelves. Core sampling techniques were examined by MRDI for holes DDH 97-1 and DDH 97-5. The core was either split mechanically or sawed. Three quarters of the core was collected for assaying, and one quarter was retained for reference. Core logs were reviewed for all 59 holes to check core recovery through zones of mineralization. Recovery was not recorded for core holes 1-16. Only general comments regarding recovery were made for holes DDH 17-21 rather than recording actual measurements for each drill run. “100% recovery” was noted for most mineralizedintervals except hole DDH 21, which experienced recoveries as low as 25% in mineralized intervals. The remainder of drill logs recorded measured recoveries for each core interval. The number of mineralized intervals with poor core recovery is relatively small for the 43 core holes for which recovery information is available. MRDI reports that recovery appears to have been adequate to meet industry standards for holes 22 and onward. Records are substandard for the earliest 16 holes, however, and the impact of poor recovery in these holesis expected to be insignificant on Mineral Reserve estimates. Only three of the 16 drill holes lie within the Mineral Reserve pit and two of the drill holes are supported by nearby RC drill holes or cross cut data within 100 ft.
GQM did not drill any core holes in 2011.
10.5.3Underground Cross-Cut Channel Sampling
MRDI reported inspecting sample channels cut across the Golden Queen Vein on the 200 Level by GFA in the 1930s. Channels are 6 inch wide and 1 inch deep and generally at least 5 ft. long. The technique of sampling employed by GFA is unknown, but it appears that a 2 in by 6 in board was used as a guide and the channel was cut with hand chisels until the board fit neatly within the channel. Channels of this size should have produced a sample weighing about 33 lb to 35 lb per 5 ft. sample length. Samples reportedly were assayed at the mill laboratory on site. Information on sample preparation and assay method is not available.
In 1997 and 1998, GQM carried out a program of re-sampling those cross-cuts that were channel-sampled by GFA, and a program of channel sampling other cross-cuts that either had not been previously sampled or where results for previous sampling were not available in a usable form. MRDI inspected GQM sample channels across the Golden Queen, Starlight and Footwall Veins on the 200 Level. GQM staff used a pneumatic hammer to cut horizontal channels from 2 inch to 3 inch wide and 5 feet long. An attempt was made to closely duplicate original channels cut by GFA, but this was not always possible because markings of the original channels did not survive or were illegible. In these cases, the locations of the original channels were relocated using map linens of sample locations and underground survey markers. Rockchips were collected on a canvas sheet. Samples weighing about 32 lb were produced from GQM channels. All channels inspected were relatively consistent in width and depth. Additional channel samples were cut by GQM in 1999 to provide check information. MRDI reported that underground channel sampling by GFA and GQM met industry standards at the time.
| October 2012 | 10-4 | |
| Soledad Mountain Project
Kern County, CA, USA
Technical Report |
10.6 Geological Logging
10.6.11985-2000 GQM Core
MRDI reported in 2000 that drill logs were examined for core holes numbered DDH-17 through DDH-59, GT-1 through GT-5 (geotechnical holes) and DDH 97-1 through DDH 97-10. Logs do not exist for holes DDH-1 through DDH-16. Logs generally record:
| | • | Core run. |
| | | |
| | • | Recovery. |
| | | |
| | • | Sample number. |
| | | |
| | • | Lithology:quartz latite, flow-banded rhyolite, pyroclastics, rhyolite porphyry andvein. |
| | | |
| | • | Alteration:silicic, sericitic, argillic and propylitic, with a numerical estimate ofweak to strong. |
| | | |
| | • | Mineralization: minerals and estimated percentages for each. |
| | | |
| | • | Oxidation: weak, medium or strong oxidation dependent upon the amount of pyriteand iron oxide products produced by the weathering of sulfides. |
| | | |
| | • | Structures: Weak to strong fracturing, faulting and brecciation. |
Logs for all features in core for hole DDH 97-1 in the intervals of 100 ft to 170 ft, 245 ft to 265 ftand 335 ft to 380 ft were compared with actual core stored in GQM’s warehouse. The logaccurately describes core observed by MRDI in core boxes.
Rock Quality Designation (RQD) was not measured prior to splitting core for any holes other than the five geotechnical holes.
Core logging data and procedures met industry standards at the time.
10.6.21985-2000 GQM Reverse-Circulation Chips
Samples from RC drill holes were sieved, washed and either mounted on chip boards or retained in plastic chip trays. Chips were logged at the office with a binocular microscope, and observations were recorded on logs.
Parameters recorded were lithology, alteration, mineralization, oxidation and structural features such as intensity of fracturing and brecciation.
| October 2012 | 10-5 | |
| Soledad Mountain Project
Kern County, CA, USA
Technical Report |
Logs were inspected for 20 drill holes, representing three percent of the total number of reverse-circulation drill holes. The quality of logging was professional, although the visual similarity between rhyolite porphyry, silicified pyroclastics and flow-banded rhyolites was a source of error in interpretations by different geologists logging the same drill chips. GQM resolved errors in interpretation prior to modelling for the feasibility study.
Logging of reverse-circulation holes is adequate for a feasibility study.
10.6.32011 GQM Core
GQM did not drill core holes in 2011.
10.6.42011 GQM Reverse-Circulation Chips
Samples from reverse-circulation drill holes were sieved, washed and retained in plastic chip trays. Chips were logged at the office with a binocular microscope, and observations were recorded on logs.
Parameters recorded were lithology, alteration, mineralization, oxidation and structural features such as intensity of fracturing and brecciation.
10.7 Drill Hole Collar and Underground Cross-cut Channel Locations
10.7.11985-2000 GQM Programs
Drill-hole collar locations were surveyed relative to the historical mine grid by DeWalt Corporation, Bakersfield, California. Surveys were carried out using either a Total Station Wild TC-1610 theodolite or Trimble 4000 SSI RTK Global Positioning System.
The accuracy of collar surveys for all drill holes was checked by MRDI by plotting drill-hole collar elevations on a digital topographic map (contour interval of 10 ft) and checking drill collar elevations against the topographic elevation. A total of 26 drill holes were found to have collar elevations greater than 10 ft above or below the topographic elevation. Local systematic errors, such as groups of drill holes with errors corresponding to the same direction in error relative to the topographic elevation, were found. Discrepancies in the horizontal location of collars range from 25 ft to as much as 100 ft. One group of 14 RC drill holes targeting the Queen Esther Vein had a systematic error in which drill collars were located from 20 ft to 50 ft southwest of the correct location. MRDI informed GQM staff of the survey discrepancies and GQM made corrections to the database while MRDI was on site.
The collar positions of GQ-88 and GQ-525 were checked in the field and were found to be reasonable relative to the portal of the 200 level. The collar for GQ-19 could not be found and most likely was destroyed by later road work.
The positions of underground cross-cut channel samples were located by GQM by using historical transit surveys of underground workings. Portal elevations were corrected duringsurface surveying of drill sites if portal elevations on mine maps did not agree with GQM’s topographic map. The location of cross-cut channel samples was corrected by GQM if the elevation of those samples were tied to incorrect portal elevations.
| October 2012 | 10-6 | |
| Soledad Mountain Project
Kern County, CA, USA
Technical Report |
10.7.22011 GQM Drill Campaign
Drill holes completed in the Northwest Pit area were inclined between 45° and 60° from horizontal, and oriented primarily to the southwest and east-northeast (Table 10 1). Two drill holes were completed in a vertical orientation. Total depths for the drill holes ranged between 90 ft and 480 ft. Drill hole collars were located by Quality Surveying, Inc., Lancaster, California.
Drill holes completed in the East Pit area were inclined between 50° and 6°0 from vertical, and oriented to the west (Table 10.1) . Total depths for the drill holes ranged between 290 ft and 500 ft. Drill hole collars were located by Quality Surveying.
During the audit of the East Pit drill data, AMEC found that the collar azimuth information provided by Golder differed significantly (by 12° to 15°) from the starting azimuth for downhole survey information for the three drill holes surveyed by Golder. At the request of GQM, Golder revisited the collar locations of drill holes GQ-716 to GQ-726 to confirm the collar orientations(Lowry and Kiel, 2011). Golder��s resurveys of the collar orientations differed from the original(planned) orientations by an average of 5.9° in azimuth, and 3.3° in dip (Table 10 2). While the new surveyed orientations agree with the down-hole surveys for drill hole GQ-718, the differences in orientation for drill holes GQ-717 and GQ-719 remain significant (Table 10.2) . It is not expected that this will have a significant effect on Mineral Resources since drill hole GQ-717 is bracketed by three additional RC drill holes within 72 ft and GQ-719 is supported by a RC drill hole and a nearby cross cuts within 80 ft.
| October 2012 | 10-7 | |
| Soledad Mountain Project
Kern County, CA, USA
Technical Report |
Table 10.1 2011 GQM Drilling at Soledad Mountain
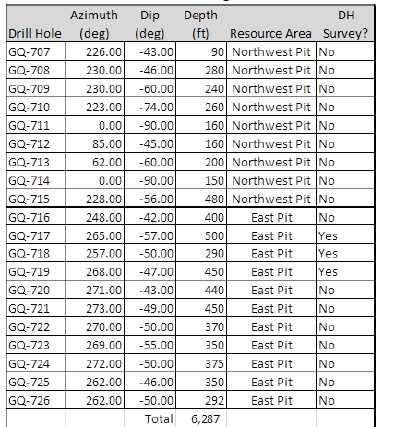
Table 10.2 East Pit Collar Orientation Surveys
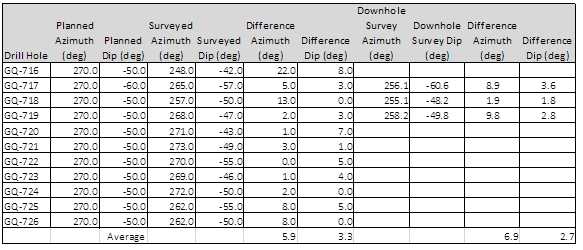
10.8 Down-hole Surveys
10.8.11985– 2000 GQM Programs
Down-hole surveys were not performed for holes drilled before 1994. RC holes GQ-1 to GQ-475 and core holes DDH-1 to DDH-16 were not surveyed.
| October 2012 | 10-8 | |
| Soledad Mountain Project
Kern County, CA, USA
Technical Report |
Diamond drill holes DDH-17 through DDH-42 and DDH 97-1 through DDH 97-10 were surveyed for dip and azimuth using a Baker Hughes/Inteq Magnetic Single Shot Survey Tool.
RC holes GQ-475 through GQ-632 were surveyed for dip using a MD-Totco Special Operating Unit Deviation Tool. Inclined RC holes show a downward deviation of from 1.5 to 30 per 100 ft. The lateral deviations in azimuth are unknown.
The absence of down-hole surveys for more than 70% of the drill holes will contribute to errors in the predicted location of zones of mineralization. The drill path of un-surveyed RC drill holes was adjusted by GQM to incorporate 2° of downward deviation per one hundred feet of hole. This correction has produced a more reasonable interpretation of the location of veins and surrounding stockwork mineralization, as confirmed by comparisons between the location of veins in RC holes, core holes and underground workings. The absence of down-hole surveys for RC holes should not materially affect resource estimation, given the average correction used and the fact that vein intercepts as found by RC drilling agree reasonably well with the locations of veins as indicated by underground cross-cut channel sampling and core drilling.
Future RC drill holes should be surveyed with a gyroscopic instrument or Reflex Maxi-bore, which will allow collection of dip and azimuth information inside the drill pipe
10.8.22011 GQM Drill Campaign
Golder was contracted by GQM to complete down-hole surveys on the 2011 drilling. All of the holes in the Northwest Pit area were blocked and down-hole surveys were not completed (Fahringer and Benson, 2011). Three of the 11 drill holes completed in the East Pit area were surveyed down-hole by Golder; the remaining 10 were blocked (Fahringer and Benson, 2011).
Golder used a Mount Sopris Instruments 2DVA-1000 (deviation) borehole logging probe mounted on an 4MXB-1000 winch with approximately 1,345 ft of 1/8-inch single-conductor wireline and controlled using an MGXII control console.
The 2DVA-1000 uses three flux-gate magnetometers to measure the magnetic field in the direction of each of the three axes. Three piezoelectric accelerometers measure the acceleration due to gravity. These accelerometers are oriented along the same axis as the magnetometers. The probe transmits magnetic field strength, magnetic orientation, and probe tilt and azimuth. The data are depth-encoded and transmitted through the wireline as a digital data stream, and are captured, decoded and displayed on a field computer. The acquired data was supplied to AMEC in the form of an Excel® spreadsheet.
10.8.3Opinion Statement
Based upon the discrepancies between the collar survey orientations and the downhole surveys at East Pit performed by Golder, AMEC believes there is significant uncertainty in the true orientation of the 2011 drill holes at Soledad Mountain. Because the lengths of the drill holes are relatively short, the risk of a significant error in the location of mineralized intercepts is low.
| October 2012 | 10-9 | |
| Soledad Mountain Project
Kern County, CA, USA
Technical Report |
AMEC calculated the theoretical cumulative downhole deviation as a result of a 6.9 degree difference in azimuth and a 2.7 degree difference in dip, and found a 27.3 ft. offset at 325 ft. (average length of 2011 drill holes) and a 45.8 ft. horizontal offset at 545 ft. (longest drill hole from the 2011 campaign).
10.9 Recovery
10.9.11985– 2000 GQM Programs
RC samples were drilled wet and not weighed at the time they were collected; therefore, sample recovery could not be determined and therefore assessed.
Recovery was not recorded for core holes DDH 1-16. Only general comments regarding recovery were made for holes DDH 17-21. “100% recovery” was noted for most mineralizedintervals except hole DDH 21, which experienced recoveries as low as 25% in mineralized intervals. The remainder of drill logs recorded measured recoveries for each cored interval. The number of mineralized intervals with poor core recovery is relatively small for the 43 core holes that have recovery information ranging from 10% to 70%. MRDI reported that recovery appeared to have been adequate to meet industry standards for holes 22 and onward.
10.9.22011 GQM Drill Campaign
RC samples were drilled wet and not weighed at the time they were collected; therefore, sample recovery could not be determined.
GQM did not drill core holes in 2011.
10.10Sample Length/True Thickness
The RC and core drill holes completed by GQM were designed to confirm the geology, thickness and grade of gold and silver mineralization along historically-known, steeply dipping, mineralized structures.
Mineralized zones are regular in shape and generally conform to the orientation of the moderate to high angle structures. These structures dip from 45° to 70°. Where possible, drill holes were designed to intersect mineralization at right angles. However, due to surface disturbance concerns, cost, and time, drill pads were designed to host multiple drill holes at variable dips. Therefore reported mineralized intercepts are generally longer than the true thickness of the mineralization.
10.11Drilling Done to Support Geotechnical, Hydrological and Metallurgical Studies
Drilling done to support geotechnical and hydrological studies is described in Section 9.6.
| October 2012 | 10-10 | |
| Soledad Mountain Project
Kern County, CA, USA
Technical Report |
A number of phases of metallurgical test work were completed between 1989 and 2007, and these are described in Section 13.
10.12Condemnation Drilling
Twenty reverse circulation holes were drilled as condemnation holes in the area of the Phase 1 heap leach pad in 1997. Holes ranged in depth from 98 m (320 ft) to 183 m (600 ft). Chips were logged and samples analyzed for gold and silver by Barringer Laboratories Inc., Reno, NV. Only minor gold and silver values were recorded.
Exploration drilling done in the 1990s confirms that there is no mineral potential in the area where the workshop-warehouse and the crushing-screening plant will be located.
10.13Comments on Section 10
In the opinion of the AMEC QP, the quantity and quality of the lithological, geotechnical, and collar and down-hole survey data collected in the exploration and drill campaigns completed by GQM, and the verification performed by GQM on legacy drill data are sufficient to support Mineral Resource and Mineral Reserve estimation as follows:
| | • | GQM RC chip and core logging meets industry standards for exploration of an oxidegold and silver deposit. |
| | | |
| | • | Collar surveys and re-surveys of legacy drill hole collar locations have beenperformed using industry-standard instrumentation |
| | | |
| | • | No down-hole surveys were performed before 1994. AMEC does not consider theabsence of down-hole surveys to be a significant concern since the dips in these holeswere adjusted to the average dip deviation, locations of mineralization is knownbased on underground workings, and drilling since 1994 has down-hole surveys. |
| | | |
| | • | Recoveries from GQM core drill programs are acceptable.Core recoveries from GFAare unknown. |
| | | |
| | • | Geotechnical logging of drill core meets industry standards for planned open pitoperations |
| | | |
| | • | Drill orientations are generally appropriate for the mineralization style, and havebeen drilled at orientations that are optimal for the orientation of mineralization formost of the deposit area |
| | | |
| | • | No material factors were identified with the data collection from the explorationprograms that could affect Mineral Resource or Mineral Reserve estimation. |
| | | |
| | • | Based upon the discrepancies between the surveyed collar orientations and down-hole surveys at East Pit performed by Golder, AMEC believes there is significantuncertainty in the true orientation of the 2011 RC drill holes. Because the lengths ofthe drill holes are relatively short, the risk of a significant error in the location ofmineralized intercepts is low. |
| October 2012 | 10-12 | |
| Soledad Mountain Project
Kern County, CA, USA
Technical Report |
| | • | AMEC finds the 2011 RC drill sampling procedures to be adequate and consistentwith industry standard practice. The sample mass collected is appropriate formineralization that does not include coarse (>40 micrometres) gold. |
| October 2012 | 10-13 | |
| Soledad Mountain Project
Kern County, CA, USA
Technical Report |
| 11 | SAMPLE PREPARATION, ANALYSES, AND SECURITY |
11.1 Reverse-Circulation Sampling
11.1.11985– 2000 GQM Drill Campaign
Drilling methods are described herein from information compiled by MRA (1998). MRDI (2000) checked this information where it wasnoted on drill logs stored in GQM’s files.
Information on contractors and drill rigs utilized for the first 332 reverse-circulation holes drilled from 1985 to 1994 was not available. Since 1994, reverse-circulation holes were drilled by Hackworth Drilling Company and P.C. Exploration Company using track-mounted MPDH 1000 drill rigs. Drill bits ranging from 4.75 inches to 5.5 inches in diameter were used.
Samples reportedly were collected at the drill rig at five-foot intervals. According to GQM staff, drilling was carried out with water injection to reduce dust emissions. This required use of arotating wet splitter. A “rig duplicate” sample was collected and left at the drill site. MRDIinspected five drill sites near the 200 Level portal and found that the plastic bags in which rig duplicates were stored had decayed, ruining the sample, or that samples had been destroyed during subsequent road work. As a result, very few rig duplicates are preserved in a condition that would permit check sampling.
RC samples were not weighed at the time they were collected; therefore, sample recovery could not be evaluated.
Best practice requires collection of duplicates for at least one of every 20 samples, recording the fractional split taken as a sample and measuring the entire weight of each sample interval.
11.1.22011 GQM Drill Campaign
AMEC did not observe any of the sampling conducted during the 2011 drill campaign. Harris Drilling reports that RC cuttings were returned from the bit face, back up through the drill pipe, and into a cyclone on the surface to reduce velocity. The cuttings then passed from the cyclone into a wet splitter below the cyclone, and the sample split was deposited into bags or five gallon buckets in five foot intervals. Sample bags were marked and organized by the GQM geologist attending the drill rig.
The weight of samples reported as received by the assay laboratory ranged between 2 and 4.4 lb.
11.1.3Opinion Statement
AMEC finds the 1985 to 2000 and the 2011 RC drill sampling procedures to be adequate and consistent with industry standard practice. The sample mass collected is appropriate for mineralization that does not include coarse (>40 micrometres) gold.
| October 2012 | 11-1 | |
| Soledad Mountain Project
Kern County, CA, USA
Technical Report |
11.2 Core Sampling
11.2.11985– 2000 GQM Core Sampling
Information given herein was obtained from MRA’s description contained in the M3 Engineering Technology March, 1998 Feasibility Study. This information was checked during MRDI’s audit,where the information was available on drill logs.
Twelve surface diamond drill holes were drilled from 1985 to 1994 by several contractors. Information is not available concerning drill rigs utilized. Since 1994, surface diamond drilling has been carried out by McFeron and Marcus Exploration, Inc., using a DMW-65 drill rig. All core was HQ (2.5 inch diameter).
Underground core drilling was conducted, starting in 1994, by Boart Longyear Company using LM-75 drill rigs. All core was HQ (2.5 inch diameter).
Core from holes drilled by GQM was inspected at a storage warehouse at the mine site. Core boxes are in good condition and stored in a secure, well-organized fashion on wooden shelves.
Core sampling techniques were examined for holes DDH 97-1 and DDH 97-5. The core was either split mechanically or sawed. Three quarters of the core was collected for assaying, and one quarter was retained for reference.
Core logs were reviewed for all 59 holes to check for poor recoveries through zones of mineralization. Recovery was not recorded for core holes 1-16. Only general comments regarding recovery were made for holes DDH 17-21 rather than recording actual measurementsfor each drill run. “100 percent recovery” was noted for most mineralized intervals except holeDDH 21, which experienced recoveries as low as 25 percent in mineralized intervals. The remainder of drill logs recorded measured recoveries for each cored interval. MRDI found the following mineralized intervals to be coincident with poor core recovery:
| | • | DDH26: 60% -70% in mineralized intervals |
| | | |
| | • | DDH28: 40% -60% at340-380 ft |
| | | |
| | • | DDH29: 30% -93 % at 480-520 ft |
| | | |
| | • | DDH30: 68% -84% at520-580 ft |
| | | |
| | | |
| | • | DDH 32% - 30% at 301-306 ft |
| | | |
| | • | DDH 33: 10% at 347-352 ft |
Core recoveries from 90% to 100% were obtained for all other intervals of mineralization in these holes and for the remaining 32 core holes.
The number of mineralized intervals with poor core recovery is relatively small for the 43 core holes that have recovery information. Recovery appears to have been adequate to meet industrystandards for holes 22 and later. Records are substandard for the earliest 16 holes, however, and the impact of poor recovery in these holes cannot be assessed.
| October 2012 | 11-2 | |
| Soledad Mountain Project
Kern County, CA, USA
Technical Report |
11.2.2 2011 GQM Drill Campaign
No core drilling was conducted during this campaign.
11.3 Underground Cross-cut Sampling
11.3.1 Historical GFA Cross-Cut Sampling
GFA cross cut sampling is described in Section 10.5.3.
11.3.2 1985– 2000 Cross-Cut Sampling Campaign
GQM cross cut sampling is described in Section 10.5.3.
11.3.3 2011 GQM Core Sampling
No core drilling was conducted in 2011.
11.4 Metallurgical Sampling
Process development and metallurgical test programs are described in detail in Section 13.
11.5 Density Determinations
11.5.1 1986-2000 GQM Density Determinations
Refer to section 14.7
11.5.2 2011 GQM Density Determinations
No density samples were collected during the 2011 drilling campaign.
11.6 Analytical and Test Laboratories
A number of commercial assay laboratories were contracted to assay GQM samples for gold and silver from 1986-2000. Table 11 .1 lists the different laboratories used from 1985-2000.
The GQM 2011 RC samples were analysed by ALS Chemex, a well-established and recognized assay and geochemical analytical services company. The Sparks (Reno) laboratory of ALS Chemex holds a ISO9001:2000 registration.
| October 2012 | 11-3 | |
| Soledad Mountain Project
Kern County, CA, USA
Technical Report |
11.7 Sample Preparation and Analysis
11.7.1Historical Drill and Cross-cut Channel Sampling Programs (circa 1932)
Nothing is clearly knownwith certainty about GFA’s sample preparation methods (circa 1932);no documents related to preparation or assaying of mine samples survive from that time. GQM was able to find a copy of a sample preparation flowsheet used by Gold Fields for custom ore (Golden Queen Sample Dressing Practice, December 12, 1939 - 100 Tons Custom Ore). It is possible, but not certain that this sample preparation protocol was used for routine mine samples.
Assay results from underground channel sampling of cross-cuts collected and assayed by GFAcirca 1932 were digitized from historic level map “linens.” These old plans of the undergroundworkings were annotated with assays. Numeric entries usually had two places after the decimal place and rarely, three (e.g., 0.01, and only rarely 0.001) . No supporting documentation, such as assay certificates, is known to exist.
11.7.21985– 2000 Drill Programs
More recent sample preparation procedures consist of crushing samples to approximately 10 mesh, then riffle splitting a sample of approximately 300 to 600 g, which is then pulverized in a ring-and-puck type pulveriser. These procedures generally meet industry standards for sample preparation in this type of gold and silver deposit.
More recent assaying consists of either one or two assay-ton charges with either a gravimetric or atomic absorption finish. The commercial assay laboratory performing the work varies over time, as summarized in Table 11.1.
| October 2012 | 11-4 | |
| Soledad Mountain Project
Kern County, CA, USA
Technical Report |
Table 11.1 Summary of Assaying at GQM from 1986 to 2000
| Hole (File) Names | Date | | | Au |
| | | | | | | Detection |
| From | To | From | To | Laboratory | Protocol* | Limit, |
| | | | | | | oz/ton |
| DDH-1 | DDH-6 | Nov-88 | Jan-89 | Jacobs, Tucson | 2ATG | 0.001 |
| | | | | | | |
| DDH-07 | DDH-12 | Sep-89 | Dec-89 | Bondar-Clegg, Sparks | 2x1AT | 0.002 |
| | | | | | | |
| DDH 17 | DDH 46 | Feb-97 | Jun-97 | Barringer | AA for low, | |
| | | | | | | |
| DDH 97-1 | DDH 97-10 | Apr-97 | Apr-97 | Barringer | G for high | |
| | | | | | | |
| DDH GT1 | DDH GT5 | Jun-97 | Jun-97 | Barringer | | 0.001 |
| | | | | | | |
| GQ-2 | GQ-26 | May-88 | Jul-88 | GSI | 2ATG | 0.0025 |
| | | | | | | |
| GQ-20 | GQ-28 | Jul-88 | Jul-88 | Skyline | not stated | 0.001 |
| | | | | | | |
| GQ-28 | GQ-166 | Aug-88 | Sep-89 | Mountain StatesRsch. | not stated | 0.001 |
| | | | | | | |
| GQ-167 | GQ-282 | Sep-89 | May90 | Bondar-Clegg, Sparks | 1or2 AT | 0.002 |
| | | | | | | |
| GQ-283 | GQ-350 | Jun-94 | Jul-94 | Barringer | FA G | 0.005 |
| | | | | | | |
| GQ-351 | GQ-399 | Feb-95 | Mar-95 | American Assay,Sparks | 1ATG | 0.001 |
| | | | | | | |
| GQ-400 | GQ-437 | Oct-95 | Jun-97 | Barringer | AA or G | .001 or.005 |
| | | | | | | |
| GQ-438 | GQ-706 | Jul-97 | May-00 | Chemex | AA or G | .001 or.005 |
*AT= assay ton. Hence 2AT refers to a 2 assay-ton charge. 2X1AT refers to two AT assays that have been averaged together. G=gravimetric finish. AA=atomic absorption finish.
Many of the high-grade drill samples have been assayed twice: an initial fire assay with an atomic absorption spectrometer (AA) finish, then a second assay by gravimetric finish if the first assay had a result higher than a set criterion. Where the fire assay value superseded the AA finish value, the fire assay value was entered into the assay database.
11.7.32011 GQM Soledad Mountain Drill Campaign
All drill samples from the 2011 GQM RC drill campaign were assayed for gold and silver by ALS Chemex. Samples were weighed upon receipt at the laboratory, dried, crushed to 70% passing 2 mm, riffle split to obtain a nominal 250 g subsample, and this subsample was pulverized to 85% passing 75 µm. Gold was assayed by conventional fire assay of a 30 g split of pulverized material, then determined by atomic absorption spectrometry (ALS Chemex code Au-AA23). Silver was assayed by aqua-regia digestion and atomic absorption spectrometry (ALS Chemex code Ag-AA62). Those samples returning greater than two ppm gold (> 2.0 ppm Au) by method Au-AA23 were reassayed by fire assay of a 30 g subsample with a gravimetric finish (ALS Chemex code Au-GRA21).
| October 2012 | 11-5 | |
| Soledad Mountain Project
Kern County, CA, USA
Technical Report |
11.7.4Opinion Statement
AMEC finds the sample preparation and assay methodology for gold and silver samples collected from 1985 to 2011 to be adequate for Mineral Resource and Mineral reserve estimation. Sample preparation and assay methodology for samples collected by GFA, Rosario, Noranda, and Shell/Billiton are assumed to have met industry standard at the time..
11.8 Quality Assurance and Quality Control
11.8.1Legacy Drill Programs
Fifty pulps from 33 different drill holes were submitted by MRDI to Chemex (now ALS Chemex) for gold fire assay (Figure 11.1) . Fifty rig duplicates, selected at random by MRDI from available splits of RC samples stored on site, were re-submitted to Barringer Laboratory under new sample numbers (Figure 11.2) . These selected samples were from 28 different drill holes. Both these sets covered samples from various drill holes between GQ-497 and GQ-603, but no effort was made to select matching identical drill-hole intervals for the two sets of data and, it so happens, no drill-hole interval was represented in both groups.
Results of the 50 rig duplicates averaged 0.0425 oz/ton Au compared to the mean of original results of 0.0406, a 4.5% difference. The agreement is within acceptable limits and suggests that no significant bias exists in the drilling sample splits selected for assay. MRDI reduced the probability of significant selection bias by utilizing a 30-ft buffer zone around ore-grade (using³ 0.02 oz/ton Au) intervals. Since many barren intervals were included, the effect of selection bias is considered to be low.
Figure 11.1: Chemex Same-Pulp Check Assays - Scatter (xy) Plot
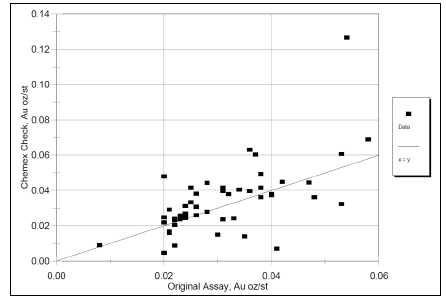
Note: figure courtesy of MRDI 2000.
| October 2012 | 11-6 | |
| Soledad Mountain Project
Kern County, CA, USA
Technical Report |
Figure 11.2: Rig Duplicates Assayed by Barringer - Scatter (xy) Plot
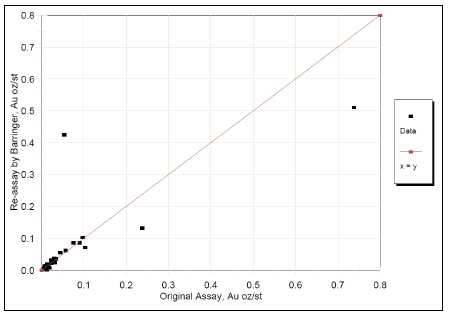
Note: figure courtesy of MRDI 2000.
Precision varies with grade, as is reflected in the scatter plots (Figure 11.1 and Figure 11.2) . A more direct comparison can be made by plotting the precision reflected by sample pairs having similar grade (as estimated from the pair means). One approach is to arrange the pairs in ascending order by pair mean, and to plot the standard deviation of the pair differences for a moving window (hence, a group of pairs most similar in grade) against the mean grade for that group. In order to express the precision as a percent, as is usually done, the relative standard deviation of differences can be plotted against the mean grade, by dividing the standard deviation by the mean grade (Figure 11.3) . It can be shown that the standard deviation of the pair differences differs from the standard deviation of the group of pairs (sigma) by the square root of two (because there are twice as many measurements as there are pair differences). Thus, in terms of stating what percentage of repeated assays (on the same sample material) would be expected to fall within the percentage shown on the graph, the line corresponds to 1.41 sigma; about 85% of subsequent measurements on the same sample should show agreement better than the line on the graph, assuming a normal distribution. Other defining lines of precision sometimes used are one sigma (the 67th percent interval), 1.65 sigma (the 90th percent interval), and 2 sigma (the 95th percent interval).
The important aspect of the comparison of the Chemex check assays of pulps and the rig duplicates is that the precision appears similar for both groups. Because the rig duplicates incorporate sampling errors related to splitting the sample which the pulp re-assays do not, pulp duplicates should show better precision. The fact that the precision for the pulps is slightly worse than that obtained for the rig duplicates is caused by the fact that the pulp assay comparison incorporates small biases between the two laboratories, i.e. ALS Chemex and BarringerLaboratory. If a population of two assays performed by the same laboratory on the same pulp were compared, the estimated precision would be better. An estimate of same-pulp, same-lab precision can be obtained using duplicate assays provided for some of the underground sampling (Figure 11.4) . This comparison is only valid to the extent that the population of pulp samples for the underground samples is similar to the population for the drilling samples.
| October 2012 | 11--7 | |
| Soledad Mountain Project
Kern County, CA, USA
Technical Report |
The comparison suggests that the overall precision is controlled by the last step of the process: the sub-sampling of the sample pulp for fire assay. This is often found to be the case for depositsthat contain visible gold, and is a consequence of gold’s malleable nature resisting size reduction(to more numerous, smaller particles) below the “free-milling” particle size. This is an aspect of the “nugget effect.” It is usually addressed by either firing larger masses of pulp (either in largecrucibles or multiple firings of one assay-ton), or by screening the sample to separate the oversize gold particles, and assaying both the screen oversize and one or more samples of the undersize. Which approach is more effective at providing more reproducible gold estimates depends upon the distribution of gold particle sizes in a pulp, and details of the protocol, such as the screen size used, effectiveness of methods used to minimize heterogeneity before taking any sub-sample of pulp, and the total mass of sample fired.
The other noteworthy point is that precision worsens with increasing grade (Figure 11.3) . This suggests that higher-grade samples are not composed of a larger number of gold grains of similar size to that found in samples having lower grade, but instead include larger gold particles.
MRDI selected the 30 sample pairs from the 50 pairs that have pair means greater than 0.008 oz/ton Au and less than 0.08 oz/ton Au, in order to obtain a population where precision is relatively insensitive to grade. This population was divided in half, with one-half containing the 15 samples with the lowest sample weights (average weight 8.0 lb), and the other half containing the 15 heaviest sample weights (average weight 14.3 lb). The two groups showed similar average gold grades (0.0199 and 0.0193 oz/ton Au). Comparison of the average pair differences of the two groups did not show any significant difference using a t-test for unpaired data assuming equal variances. The available data indicate the reverse-circulation sample mass collected is not the controlling factor in the obtained precision.
11.8.2 Opinion Statement
Precision appears acceptable above 0.008 oz/ton Au, and therefore is adequate for a feasibility study.
| October 2012 | 11-8 | |
| Soledad Mountain Project
Kern County, CA, USA
Technical Report |
Figure 11.3: Precision versus Gold Grade Comparison of Rig Duplicate Performance and Chemex Checks on Pulps

Note: figure courtesy of MRDI 2000.
| | Figure 11.4: | Precision versus Gold Grade, Same Pulp Duplicates by BarringerUnderground Samples Arranged Ascending by Pair Mean |

Note: figure courtesy of MRDI 2000.
| October 2012 | 11-9 | |
| Soledad Mountain Project
Kern County, CA, USA
Technical Report |
11.8.32011 GQM Soledad Mountain Drill Campaign
A total of 48 standard reference materials (SRMs) and 20 fine blanks were submitted with a total of 1,232 project samples from the 2011 drilling. AMEC finds the insertion rates of the control samples to be low compared to best practice and recommends increasing the rate of SRMs and blanks to 5% each. AMEC also recommends that pulp duplicates be added to the Soledad Mountain QA/QC protocol at the rate of 5% of project samples. Duplicate samples are used to determine the precision of the assays.
GQM used three SRMs from Minerals, Exploration, and Environment Geochemistry (MEG) from Washoe Valley, Nevada. The SRMs have a range of gold grades consistent with what is expected from project samples at Soledad Mountain. Silver is not certified for these SRMs. All SRM results for gold except 5 (10%) were within 10% of the recommended value of the SRM. AMEC investigated the five SRMs with gold results greater than 10% different than the certified value and instructed ALS Chemex to reassay one batch of 20 samples surrounding a failed SRM for drill hole GQ-726. The reassayed values, though consistently slightly higher in grade, confirmed the original assays for the project samples (Table 11.2) .
Table 11.2 GQ-726 Reassays
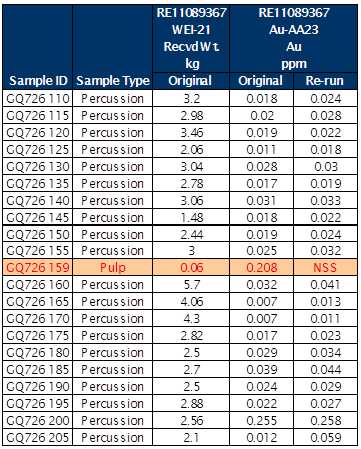
| October 2012 | 11-10 | |
| Soledad Mountain Project
Kern County, CA, USA
Technical Report |
In order to provide a check on assay accuracy for silver and additional checks on gold, GQM selected a total of 50 pulps from 2011 project samples and submitted them to Inspectorate Labs in Reno, Nevada for gold and silver assays. Five packets of three separate SRMs, obtained by AMEC from WCM Minerals in Vancouver and certified for both gold and silver, were inserted into the batch of pulps submitted to Inspectorate and show that the Inspectorate gold and silver assays are accurate.
AMEC compared the Inspectorate gold check assays to the original ALS Chemex gold assays and found them to be comparable at grades less than 1.0 ppm (Figure 11.5 and Figure 11.6 ). Figure 11.5 displays all check assay data where displays only those data less than 0.6 ppm gold and with outliers and likely sample swaps removed. The two check assays reporting greater than 1.0 ppm indicate that the ALS Chemex assays may be biased high at grades higher than 1.0 ppm, but this conclusion is tentative because of the limited number of results.
Two of the MEG external SRMs submitted with Soledad Mountain project samples to ALS Chemex have a recommended value greater than 1.0 ppm (1.15 and 1.34 ppm) gold, and average results for these SRMs show a slight negative bias, which does not support the high bias indicated by the Inspectorate check assay results. Also, a chart of internal ALS Chemex SRMs provided to AMEC show acceptable accuracy from an internal SRM (OREAS-16b) at the 2.2 ppm gold level.
AMEC also compared the Inspectorate silver check assays to the original ALS Chemex silver assays and found them comparable (Figure 11.7) . Figure 11.7 displays all check assay data where only those data less than 30 ppm silver and with outliers and likely sample swaps removed. No significant bias was observed in the check assay data and thus AMEC concludes that the ALS Chemex gold and silver data are acceptably accurate.
Blank samples submitted with the Soledad Mountain project samples reported gold and silver less than five times the lower detection limit. The blank samples were acquired by GQM from MEG and represents pulverized quartz sand that is 99.9% quartz. AMEC finds no significant carryover contamination in the ALS Chemex gold and silver assays.
In order to check the precision of the gold assays, AMEC requested and was provided with the ALS Chemex internal pulp duplicate assay data directly from ALS Chemex. From the 72 pulp duplicate data provided, 34 reported average gold values greater than 0.050 ppm and were used to calculate precision. AMEC calculated the precision of the ALS Chemex gold assays to be ±17% at the 90% confidence level. AMEC considers precision levels for pulp duplicates should be ±10% at the 90% confidence level, though gold duplicate assays rarely attain this level of precision.
| October 2012 | 11-11 | |
| Soledad Mountain Project
Kern County, CA, USA
Technical Report |
Figure 11.5: Inspectorate Gold Check Assays on ALS Chemex Original Assays
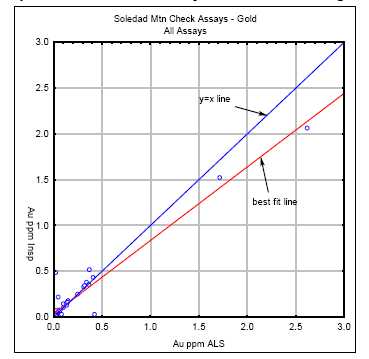
Note: figure courtesy of AMEC 2000.
Figure 11.6: Gold Check Assays between 0.0 and 0.6 ppm with outliers removed
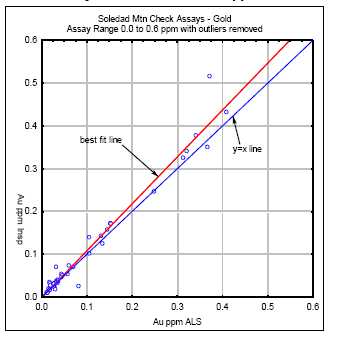
Note: figure courtesy of AMEC 2000.
| October 2012 | 11-12 | |
| Soledad Mountain Project
Kern County, CA, USA
Technical Report |
Figure 11.7: Inspectorate Silver Check Assays on ALS Chemex Original Assays
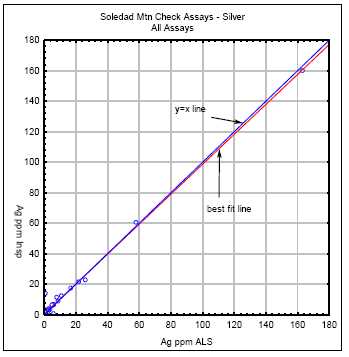
Note: figure courtesy of AMEC 2000.
Figure 11.8: Silver Check Assays between 0 and 30 ppm with outliers removed
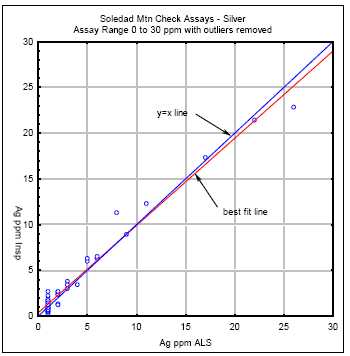
Note: figure courtesy of AMEC 2000.
| October 2012 | 11-13 | |
| Soledad Mountain Project
Kern County, CA, USA
Technical Report |
11.8.4Opinion Statement
AMEC considers the ALS Chemex gold and silver assay data to be acceptably accurate and free of contamination in the sample preparation process. AMEC also finds the ALS Chemex gold assays to be adequately precise based upon the internal ALS pulp duplicate data. AMEC recommends that GQM add duplicate samples to their external QA/QC protocol as determining assay accuracy and precision from external control samples (as opposed to relying upon internal laboratory data) provides an independent check on the stated assay laboratory program and is industry standard.
AMEC recommends that GQM employ SRMs that are certified for both gold and silver.
11.9 Databases
Drill data collected from geological logging and sampling are currently stored in a MineSight® database. The most current database is stored on the AMEC server in Reno, Nevada. Legacy drill data, in paper format, are stored in a container near the Soledad Mountain project site in Mojave, California.
Geological data from the most recent drilling programs are collected in Excel® spreadsheets, and subsequently uploaded to the MineSight ® database. Analytical data are supplied in digital (CSV) format by ALS Chemex and loaded into the MineSight® database. Assay certificates are supplied in PDF® format. Collar survey data was provided by Golder Associates in Excel® andPDF® format. Digital data are stored in Golden Queen Mining’s Vancouver Canada office,additional copies may exist on the AMEC server in Reno Nevada.
11.10Sample Security
No information is available documenting sample security procedures prior to 1994. Since 1994, sample security measures include moving core from the drill site to a locked storage warehouse on the Project site at the end of each shift. RC cuttings were allowed to dry at the drill site before being locked in a semi-trailer to be shipped to the laboratory. Access roads into the Project site are locked with either a gate across the road or padlocked with a heavy metal chain across the road. GQM is of the opinion that sample storage is sufficiently secure.
AMEC is of the opinion that from 1994 to 2011 sample security meets industry standards.
11.11Comments on Section 11
AMEC’s review of the 2011 exploration data resulted in the following conclusions:
| | • | AMEC finds the 2011 sample preparation and assay methodology for gold and silverto be adequate for the Soledad Mountain gold and silver deposit. |
| | | |
| | • | AMEC finds that the 2011 drill data adequately match the original records and thatthe database is acceptable for purposes of resource estimation. |
| October 2012 | 11-14 | |
| Soledad Mountain Project
Kern County, CA, USA
Technical Report |
| | • | AMEC considers the 2011 ALS Chemex gold and silver assay data to be acceptablyaccurate and free of contamination in the sample preparation process. |
| | | |
| | • | AMEC finds the 2011 ALS Chemex gold assays to be adequately precise based uponthe internal ALS pulp duplicate data. |
| October 2012 | 11-15 | |
| Soledad Mountain Project
Kern County, CA, USA
Technical Report |
12.1 Data Verification by MRDI
12.1.1Introduction
Mineral Resources Development, Inc. (MRDI) of San Mateo, California did a detailed due diligence review of the procedures, assays and geological and resource models used by GQM and its consulting engineers between 1998 and 2000. This work involved statistical analyses, the evaluation of grade capping, the design of appropriate kriging techniques and setting criteria for the classification of resources. Two resource models were developed with input from MRDI– the Addendum 1 and Addendum 2 Resource Models. MRDI submitted a final report with recommendations in May 2000.
12.1.2Underground Cross-cut Channel Sample Assays
Assays audited by MRDI in June, 1998 were comprised of drill sample and underground sample assays available at that time. Five percent of Au and Ag assays were randomly selected from the database in three groups (described below) and checked against assay certificates.
Data entries for 217 samples were checked against assay certificates and sample map linens. Errors found included:
| | • | 3typographical errors |
| | | |
| | • | 8duplicate entries |
| | | |
| | • | 6 location errors |
This comprises a total of 17 errors in 271 entries, or 3.9% of the audited data. This error rate is higher than the industry standard of one 1% or less. However, only one error (0.3% of selected data) was of a nature that would have affected resource estimates None of the remaining errors would have affected resource estimates, since typographical errors represent less than 10% of the entered value, duplicate entries have an insignificant weighting and the remaining location errors are the width of a cross cut (6 ft). A list of all errors was provided to GQM staff. GQM staff confirmed in later documentation that corrections had been made.
| October 2012 | 12-1 | |
| Soledad Mountain Project
Kern County, CA, USA
Technical Report |
12.1.4GFA Underground Cross-cut Channel Sample Analysis
Background
The following is a discussion from MRDI’s review in 2000 of results from GQM’s efforts toduplicate and validate GFA underground cross-cut channel sampling.
It cannot be proven that the historical GFA gold assay data is inaccurate. However, GQM re-sampling done in 1998 of areas previously sampled and assayed by GFA have provided assays that are 44% lower, on average, than the GFA assays. Hypotheses for the large observed differences can be grouped into two categories: differences collecting the samples and differences in sample preparation and assaying.
If the difference between GQM and GFA results is a consequence of assaying, it is reasonable to conclude that the GFA assays are biased high, because the quality of the GQM assays has been validated by duplicating the samples, and performing QA/QC checks. No QA/QC information on GFA assays is available. GQM samples have been stored on site
If the difference between GQM and GFA results is a consequence of sampling, either (or both) sets of results may be biased. Any mining activity, including the collection of specimens, would render sampling of the remaining material biased. Smaller sample mass (GQM cut smaller channel volumes than GFA) could affect the proportion of samples having a grade belowdetection, which could influence the grade estimation. GFA’s selection of the sample sites, iflocated by careful inspection to pass through the richest ore, could produce results with a selection bias that would result in over-estimation. Selection by GFA of only higher-grade data to plot on the linens, from which the GFA data have been resurrected by GQM, and sampling by GQM of previously unsampled, low-grade areas, would likely produce grade distributions of underground GQM sampling lower than those obtained from the GFA data.
Because GQM’s best efforts to re-sample areas previously sampled by GFA provided substantially lower gold grades, a conservative approach to any resource model that uses the historical data must include some steps that compensate for the possibility the GFA data have a high bias.
Grade differences between GQM and GFA silver channel results were insignificant and no adjustments were implemented.
Adjustment of GFA 10-ft Gold Composites: Reduced Major Axis
The following adjustment analysis is based on follow-up work conducted by MRDI in 2000. AMEC has accepted the MRDI adjustment recommendation and applied the correction to GFA gold assay data.
The technique of Reduced Major Axis (RMA) is described by Agterberg (1974) and Davis (1986).
| October 2012 | 12-2 | |
| Soledad Mountain Project
Kern County, CA, USA
Technical Report |
The RMA line is
y = mx +b
for paired data (x,y) where m is calculated from
m = σy / σx
where σy and σx are the standard deviations of the y and x populations. The intercept bis determined by substituting into the linear equation (1) the mean of the y population for y, the mean of the x population for x, m as calculated in (2), and solving for b. This technique provides a procedure for transforming the x (here GFA) population into one with the mean and variance of the y population.
Error on slope m can be calculated from
me = m[(1 - r2 )/n] ½
and error on intercept b is
be = σy{[(1 -r2 )/n] [2 + (x/σx)2(1+r)]}½
where r is the correlation coefficient between x and y and n is the number of pairs.
The fit to the data is poor using all the data (Table 12.1 and Figure 12.1a and b).
| Table 12.1 Using all Paired 10-tt Gold Composites |
| | GFA = x | GQM = y | |
| N | | | 187 |
| Mean | 0.0474 | 0.0266 | |
| Standard Dev. σ | 0.0952 | 0.0438 | |
| Coeff. of Variation | 2.01 | 1.65 | |
| Correlation Coeff. R | | | 0.726 |
| Slope m | | | 0.4598 |
| Intercept b | | | 0.0048 |
| Slope Error | | | 0.0231 |
| Intercept Error | | | 0.0041 |
| October 2012 | 12-3 | |
| Soledad Mountain Project
Kern County, CA, USA
Technical Report |
Figure 12.1a and b: 1998 Underground Re-Sampling Study - All Pairs
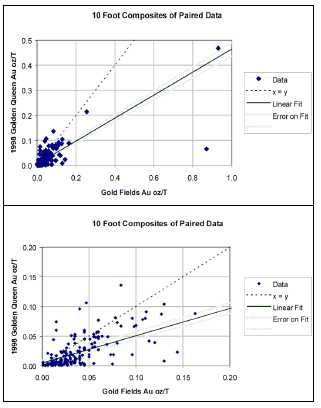
Note: Top figure is A, and bottom figure is B. Figure courtesy of MRDI 1999.
Removal of the three pairs of data having gold values exceeding (in either x or y) 0.2 oz/ton Au provides a more reasonable fit to the data (Table 12.2 and Figure 12.2) . Figure 12.3 shows a scatterplot of GQM versus adjusted GF data.
| Table 12.2 Excluding 3 Paris with Au > 0.2 oz/ton |
| | GFA = x | GQM = y | |
| N | | | 184 |
| Mean | 0.0370 | 0.0230 | |
| Standard Dev. σ | 0.0302 | 0.0259 | |
| Coeff. Of Variation | 0.82 | 1.13 | |
| Correlation Coeff. R | | | 0.667 |
| Slope m | | | 0.8571 |
| Intercept b | | | -0.0088 |
| Slope Error | | | 0.0471 |
| Intercept Error | | | 0.0050 |
| October 2012 | 12-4 | |
| Soledad Mountain Project
Kern County, CA, USA
Technical Report |
Figure 12.2: 1998 Underground Re-Sampling Study Scatter (xy) Plot Excluding 3 Points with Au > 0.3 oz/ton
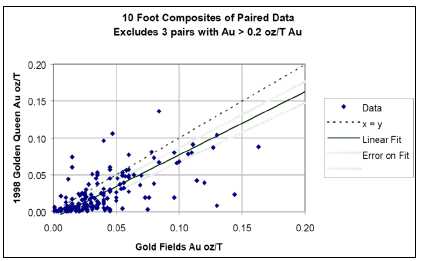
Note: figure courtesy of MRDI 1999.
Figure 12.3: 1998 Underground Re-Sampling Study New Results Versus Adjusted GFA Originals
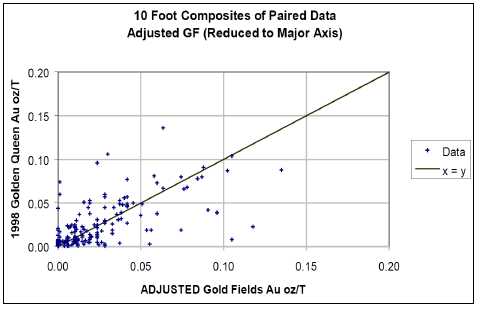
Note: figure courtesy of MRDI 1999.
Selection and Grade-Thickness Comparisons
If cross-cut areas selected for the re-sampling study have higher or lower grades than the typical cross-cuts sampled by GFA, a selection bias exists. If the population of re-sampled cross-cuts have higher grades than are representative of the population, then re-sampling them will typically provide results that are overall lower. Conversely, if the cross-cuts selected have lower grades than are typically found for the population of original results, the re-sampling resultswould typically return higher values. The size of the difference generated by a selection bias depends upon the severity of the selection process and the precision of the sampling. Where the selection process is severe (for example, only the one cross cut with the very highest grade is selected for re-sampling) and the precision poor (available evidence indicates this is clearly so for GQM sampling and assaying) the effect of selection bias can be very large.
| October 2012 | 12-5 | |
| Soledad Mountain Project
Kern County, CA, USA
Technical Report |
Some imprecision and resultant selection bias could be introduced if GQM and GFA sample intervals are not precisely the same. To avoid this, MRDI had GQM composite the grades of both sets of samples by cross-cut. Both composite grade and grade-thickness were examined.
A check for this type of selection bias can be performed by comparing the population of GFA cross cut gold assays that were re-sampled, to the population of all GFA cross cut results in the computer database. The validity of this comparison is predicated upon the computer-entered historical GFA data being representative of the population of GFA underground sampling results. The comparison shows the channels that were re-sampled had an average grade about half that of the average grade of all GFA channels in the database (Figure 12.4) . Thus, the selection bias would favour the average grade of the samples from the re-sampling program being higher, which is not the case. The bias between the original and re-sample results cannot be attributed to selecting higher-grade channels for re-sampling.
Figure 12.4: Gold Grade Distributions of GFA Underground Channel SamplesComposited by
Cross-cut: Average (length-weighted) Grade of AllChannels
versus Grade of Channels Selected for Re-sampling |
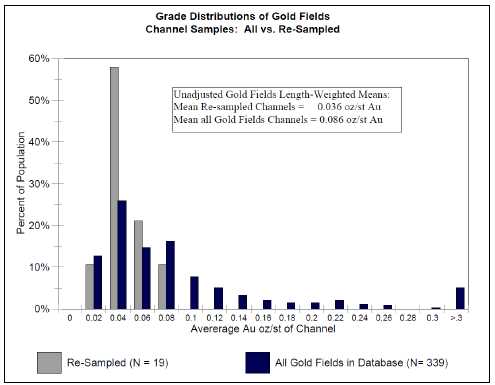
Note: figure courtesy of MRDI 1999.
| October 2012 | 12-6 | |
| Soledad Mountain Project
Kern County, CA, USA
Technical Report |
Grade-thickness calculations provide another method of comparing the new and historical results. To calculate these, the grade of each sample is multiplied by the length of channel cut for that sample. These numbers are then summed for each cross-cut channel location. This is done separately for the original and re-sample data; making a pair of grade-thickness estimates for each cross cut location. This can be plotted on a graph and subjected to the same Reduced Major axis fit as performed on the single-sample pairings. The comparison provides results similar to those obtained previously.
Table 12.3 indicates the GFA results are about 42% higher than GQM re-sample results.
Table 12.3 Channel Grade Thickness Comparison |
| | Ft-oz/ton Au | | Reduced |
| | GFA = x | GQM = y | Major Axis |
| N | | | 19 |
| Mean | 3.20 | 1.86 | |
| Standard Dev. | 3.11 | 1.85 | |
| Correlation Coeff. R | | | 0.877 |
| Slope m | | | 0.581 |
| Intercept b | | | 0.046 |
| Slope Error | | | 0.064 |
| Intercept Error | | | 0.044 |
Because 10-ft composites are used for resource modelling, MRDI made a reduced major axis correction to 10-ft GFA composites, as shown in Figure 12.5.
GFA Gold Grade Adjustment
AMEC adjusted GFA gold assay data as recommended by MRDI in the year 2000 as follows:
The GFA Au values should be adjusted using the formula:
Adjusted value = 0.8571 x GFA - ..0088.
The adjusted values falling below 0.001 oz/ton Au should be set to 0.001 oz/ton Au.
| October 2012 | 12-7 | |
| Soledad Mountain Project
Kern County, CA, USA
Technical Report |
| | Figure 12.5: | Underground Re sampling Study: Grade Thickness Comparison of Re-sampled Cross-cuts A. All dataB. Detail for Au ft oz/ton < 2 |
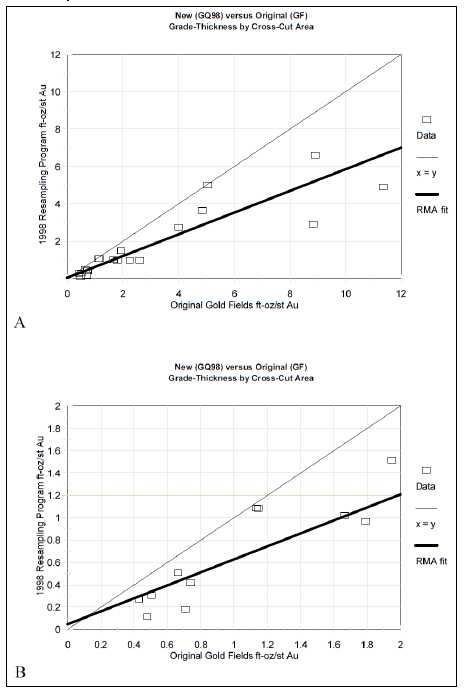
Note: figure courtesy of MRDI 1999.
| October 2012 | 12-8 | |
| Soledad Mountain Project
Kern County, CA, USA
Technical Report |
12.1.5Drill Hole Sample Assays
A total of 1,627 assay entries were randomly selected for drill holes DDH-04 through GQ-602 and checked against assay certificates. A total of 40 entries for gold (2.45% of the gold data) and 2 entries for silver (0.12% of the Ag data) were found to differ from values listed on certificates filed with drill logs. GQM later provided documentation that 35 of the gold values represent averages of two assays. This reduced the gold entry error rate to 0.3% of the checked database. This meets the accepted industry standard for errors of 1% or less.
A second selection was made of all assay entries that exceed 0.3 oz/ton Au or 4.0 oz/ton Ag. Twelve gold values (9.45% of the 127 selected assays) disagreed with assay certificates filed with drill logs. GQM later provided documentation that 10 of the values in the database were averages of two assays. The remaining two entries were the second assay, which had not been averaged with the assay found by MRDI. This produces an error rate of 1.6% (2 of 127 selected values), but the error is not significant because the relative difference between the two assays did not exceed five percent. No other systematic errors were found that would influence resource estimates.
12.2 Data Verification by SRK 2006
In 2006, SRK randomly selected a total of 1,600 assay entries from the 1999 drill campaign and checked them against assay certificates. A total of 2 entries for gold (0.12% of the gold data) were found to be different from values listed on certificates filed with drill logs. This meets the accepted industry standard for errors of 1% or less.
12.3 Data Verification by AMEC 2011
AMEC checked the records for the 2011 GQM RC drilling in the database against original documentation and found the database to be acceptably error-free.
AMEC checked a total of 390 (39% of the 2011 assays) gold and silver assay records against original assay certificates and found no errors. A total of 160 lithology and oxidation codes were checked from 416 total lithology records (38% check) with only two errors found. The error rate for the lithology records is 0.4% and therefore meets the criteria (less than 1.0% errors) that AMEC typically uses to determine whether or not a database is acceptably error-free. Collar coordinates for all 2011 drill holes were found to be acceptably accurate. Three of the 2011 drill holes used in the resource was surveyed down-hole.
12.4 Twin Drill Holes and Comparison of Cross-Cut Sample versus Drill Hole Sample Assays
Assays of twinned RC and diamond drill holes were compared to assess the spatial variations in gold grades and possible differences in assays resulting from different drilling methods. Only qualitative comparisons are possible because of the small number of twinned drill holes.
| October 2012 | 12-9 | |
| Soledad Mountain Project
Kern County, CA, USA
Technical Report |
RC holes GQ-293 and GQ-386 are two vertical holes that were drilled 25 ft apart on Section M5.Both holes tested the “Flat Ore” Zone between the Starlight and Silver Queen Veins. Throughthe Flat Ore Zone, GQ-293 produced samples assaying 0.213 oz/ton Au over 45 ft and 0.016 oz/ton Au over 55 ft (total of 10.47 ft oz). Adjacent intervals in hole GQ-386 produced samples assaying 0.182 oz/ton Au over 40 ft and 0.031 oz/ton Au over 40 ft (total of 8.52 ft oz).
RC holes GQ-518 and GQ-580 are two vertical holes that were drilled 20 ft apart on Section N5. Both holes targeted mineralization in the upper portion of the Golden Queen Vein. GQ-518 produced samples assaying 0.039 oz/ton Au over 20 ft (0.78 ft oz). GQ-580 produced samples assaying 0.048 oz/ton Au over 15 ft (0.72 ft oz). Cross-cut 2-75 ¾, located 20 ft south of GQ-580 produced samples assaying 0.040 oz/ton Au over 30 ft (1.20 ft oz).
The only diamond drill hole and RC drill hole pair comprises holes DDH-7 and GQ-32, drilled 10 ft apart on Section F. Both holes encountered sporadic, low-grade mineralization (less than 0.01 oz/ton Au); thus, a comparison is not useful.
RC hole GQ-600 was drilled on Section F at azimuth S45W, dipping minus 60°. The hole was positioned to test the Footwall Silver Queen Vein. The drill hole passed over the back of Cross-Cut UD20-024. Hole GQ-600 produced samples assaying 0.032 oz/ton Au over 40 ft (1.28 ft oz). Cross-Cut UD20-024 produced samples assaying 0.036 oz/ton Au over 30 ft (1.08 ft oz).
Intercepts of RC twins and RC/cross-cut twins produced grade x thicknesses varying in a range of ± 15%. This suggests good continuity of mineralization over the separation differences represented and consistency in sampling.
12.5 Reverse-Circulation Hole Decay and Cyclicity
MRDI plotted decay and cyclicity plots for all RC drill holes in the database drilled before 2000 to check for down-hole contamination or grade spikes at rod changes. The dataset used contains 679 drill holes with a total of 51,206 assays. Of the intervals inspected, 508 were not assayed and 6,654 had a grade of 0.00 oz/ton Au. Rock codes were incorporated in the analyses to identify changes in gold values that could be attributed to vein mineralization. Decay and cyclicity plots revealed no abnormal changes in grade that could not be explained by abrupt changes in geology, such as a change from weakly altered rock to strongly mineralized rock.
12.6 Opinion Statement
AMEC finds that the 2011 drill data adequately matches the original records and that the assay, geology and collar survey database is acceptable for purposes of Mineral Resource and Mineral Reserve estimation.
| October 2012 | 12-10 | |
| Soledad Mountain Project
Kern County, CA, USA
Technical Report |
| 13 | MINERAL PROCESSING AND METALLURGICAL TESTING |
13.1 Occurrence of Gold and Silver
Soledad Mountain is located within the Mojave structural block, a triangular-shaped area bounded to the east by the northwest-trending San Andreas Fault and to the north by the northeast-trending, Garlock Fault. The Mojave block is broken into an orthogonal pattern of N50E to N60E and N40W to N50W fracture systems. These fracture zones likely developed as the result of Late Cretaceous compressional stresses that were present prior to formation of the Garlock and San Andreas Faults. Gold and silver mineralization at Soledad Mountain is hosted by northwest-trending, en-echelon faults and fracture systems. Cretaceous quartz monzonite forms the basement of stratigraphic sequences in the Mojave block. The quartz monzonite is overlain by Miocene-age, quartz latite and rhyolitic volcanic rocks. Volcanic centers appear to have formed at intersections of the northeast and northwest-trending fracture systems. Major volcanic centers are present at Soledad Mountain, Willow Springs and Middle Buttes. These volcanic centers consist generally of initial, widespread sheet flows and pyroclastics of quartz latite, followed by restricted centers of rhyolitic flows and rhyolite porphyry intrusives. Rhyolitic flows and intrusives are elongated somewhat along northwest-trending vents and feeder zones. Gold deposits in the Mojave block include Soledad Mountain, Standard Hill, Cactus and Tropico. At Soledad Mountain gold mineralization occurs in low-sulfidation style, quartz-adularia veins and stockworks that strike northwest. Gold mineralization at Standard Hill, located 1 mile northeast of Soledad, consists of north to northwest-striking quartz veins in Cretaceous quartz monzonite and Tertiary, quartz latite volcanic rocks. At the Cactus Gold Mine, 5 miles west of Soledad, gold occurs in northwest and northeast-striking quartz veins, breccias and irregular zones of silicification in quartz latite, rhyolitic flows and rhyolitic intrusive breccias.
At least 14 separate veins and related vein splits occur at Soledad Mountain. Veins generally strike N40W and dip at high angles either to the northeast or to the southwest. Mineralization consists of fine-grained pyrite, covellite, chalcocite, tetrahedrite, acanthite, native silver, pyrargyrite, polybasite, native gold and electrum within discrete quartz veins, veinlets, stockworks and irregular zones of silicification. Electrum is about 25% silver.Gold is present as native gold and electrum (gold with silver greater than approximately 20%) ranging in size from less than 10 micron to greater than 150 micron with the silver content of the electrum as high as 25%. Silver is also present principally as the mineral acanthite (Ag2S), with some native silver, pyrargyrite (Ag3SbS3) and polybasite ((Ag,Cu)16Sb2S11). Minerals of potential environmental concern include pyrite (FeS2), galena (PbS) and chalcopyrite (CuFeS2), which are present in minor amounts.
13.2 Primary Ore Types
The primary ore types that will be mined are rhyolite porphyry and flow-banded rhyolite, pyroclastics and quartz latite porphyry representing approximately 70%, 10% and 20% of the ore tonnage respectively. Minor quantities of siliceous vein material (0.1%) will also be mined. The rock types will be found in different areas and at various stages of the mine life. The primary rock types are of extrusive volcanic origin and are quite similar in chemical composition and are high in silica with little or no clay.
| October 2012 | 13-1 | |
| Soledad Mountain Project
Kern County, CA, USA
Technical Report |
The gold and silver mineralogy for rhyolite and quartz latite are essentially the same as determined by Amtel Ltd. in a number of reports from 2003 to 2007. Rhyolite is however typically more highly silicified than quartz latite and more gold has consistently been extracted from quartz latite than from rhyolite in column leach tests.
The interpretation of the ore body composition has changed since the early 1990s and a significant portion of the pyroclastics has been reclassified as rhyolite. Behaviour of rhyolite and pyroclastics has been similar in column leach tests with gold recovery for pyroclastics typically higher by 2.5% than the gold recovery for rhyolite. The higher gold recovery for pyroclastics is explainable as pyroclastics are more porous and friable than the rhyolite. Also, the leach curves for rhyolite and pyroclastics are indistinguishable from one another.
13.3 Process Development
Extensive test work and process development work done on the Project ore types from 1988 to 2007 show that these ores are readily amenable to heap leaching provided the material is crushed to relatively small sizes. The test work for a total of 45 column leach tests is well documented and the test results have been used in a number of feasibility studies. Parameters such as agglomerate strength, percolation rate, cyanide consumption and cement and/or lime required for pH control were also determined in numerous tests.
Tests were done on bulk samples of rhyolite, pyroclastics, quartz latite and vein material obtained from surface and old underground workings between 1997 and 1999. The material was crushedin a vertical shaft impact crusher (VSI) and screened to produce samples sized to 100% minus 8 mesh or 100% minus 2.37 mm. McClelland Laboratories, Inc. completed both bottle roll and column leach test work on these samples and the final report was dated February 25, 1999. This was considered to be the definitive test program to provide detailed information required for both the design of a four-stage crushing-screening plant and to complete a feasibility study.
The four-stage crushing-screening plant, the design of which was based upon the results of the 1997 - 1999 test programs, would be exceptionally costly to design, build and operate and a more cost-effective solution had to be found for a viable Project. An alternative flow sheet was developed with a HPGR as the key comminution device in 2002. A series of HPGR and bottle roll and column leach tests was performed between 2003 and 2007 to confirm the flow sheet and to provide design criteria for the design of the crushing-screening plant.
The test work shows that the HPGR will have distinct advantages over conventional crushing and screening in preparing particles for heap leaching in this particular application as described in Section 13.4.
| October 2012 | 13-2 | |
| Soledad Mountain Project
Kern County, CA, USA
Technical Report |
13.4 Test Programs
Column leach test data was reviewed for tests done from 2003 to 2007. Tests completed in 2006 were performed on a low-grade and a high-grade rhyolite sample to test the range of grades that is expected in the commercial operation. The test on rhyolite with a lower head grade in the 0.3 g/t (0.009 oz/ton) range is especially important to give an indication of the tail grade and thus the recovery that should be used when doing cut-off grade analyses. No new column leach tests have been done on pyroclastic ore since the 1997-1999 tests.
The ‘actual’ data represents the results as of the last day of the column leach test. This data should not be used to estimate percentage extraction as gold and silver were still being extracted from the ore when the tests were ended. However, enough data had been collected by the end of the test to reliably perform a logarithmic regression analysis of the data and project what the extraction would be if the test had been continued for a total of 200 days. The regression analyses therefore put all of the column leach test results on a common 200-day basis.
The following conclusions can be drawn from an analysis of the tails obtained in the extended 1997-1999 tests for rhyolite, quartz latite and pyroclastics in which the samples were crushed with a VSI and the tails obtained in the series of HPGR-based tests done from 2003 to 2007:
| | A. | Extended Leach Time - Test results show that extended leach time is a factor in achieving low tails. The only long-term tests done were the 1997-1999 VSI tests. The tails obtained in these tests were however not as low as the tails obtained in the HPGR tests with shorter leach times. The conclusion is that extended leach time is a factor in achieving low tails but possibly of lesser importance when the HPGR is the comminution equipment. |
| | | |
| | B. | Particle Size Distribution - A particle size distribution is the direct result of the crushing technology used to prepare the sample for leaching. The analysis of test results shows that it is the particle size distribution for any particular test rather than a point value such as a P80 that is key to interpreting and understanding the results of the tests. Particle size distributions were therefore plotted and analyzed for all tests performed from 2003 to 2007. In general, the VSI products are finer than the HPGR products in all size ranges, yet the tails from the HPGR tests are consistently lower than those from the VSI tests and this indicates that another factor such as micro-cracking is important to achieve low tails grades. Understanding and monitoring of particle size distributions will be important in the commercial operation. |
| | | |
| | C. | Micro-cracking - An analysis of test results and microphotographs show that micro- cracks are developed in ore particles in the HPGR that allow relatively more gold and silver to be extracted than in the VSI tests. The conclusion is that the formation of micro- cracks increases recovery and lowers tails. |
| | | |
| | D. | Specific Press Force - An analysis of the tails obtained in the HPGR-based column leach tests shows that tails and thus recoveries are affected by specific press force. A higher specific press force gives a finer overall particle size distribution and leads to a greater density of micro-cracks and this directly affects tails and thus recoveries. The conclusion is that the specific press force is the determining operating parameter. |
| October 2012 | 13-3 | |
| Soledad Mountain Project
Kern County, CA, USA
Technical Report |
| | E. | In Summary - The analysis indicates that it is reasonable to limit the determination of recoveries to the HPGR-based column leach tests and this places the emphasis on tests performed between 2003 and 2007. |
13.5 Tails Analysis for Gold
The recovery analysis is based upon tails obtained in HPGR-based column leach tests.
A plot of tails versus calculated head grades for the three principal ore types is shown in Figure 13.1. The mineral reserve grades for rhyolite, quartz latite and pyroclastics and the cut-off grade that was used to delimit the low-grade resource model outlines are also shown.
Three curves that show the projected tails for the three ore types after 200 days of leaching have been drawn as best-fit curves from the data points shown in Figure 13.1. The curve for pyroclastics was drawn parallel to the curve for rhyolite with an allowance for recoveries from pyroclastics higher by 1.25% (50% of the indicated difference) than the recoveries for rhyolite. The curve for quartz latite was drawn through the data point and parallel to the curve for rhyolite.
The calculated recoveries based upon the tails analysis are shown in Table 13.1 and are the recoveries projected for the commercial operation.
13.6 Tails Analysis for Silver
A plot of tails versus calculated head grades is shown in Figure 13.2. Key information is shown with each data point. The mineral reserve grades for the three ore types are also shown. It does not appear to be feasible to draw curves that will distinguish between the three ore types so a single curve has therefore been plotted.
The calculated recoveries based upon the tails analysis are shown in Table 13.1 and are the recoveries projected for the commercial operation.
It should be noted that the proportions of ore used in this recovery calculation for both gold and silver were based on earlier open pit plans and the proportions have shifted somewhat in the current plan. However, the change is insignificant in terms of the calculated recoveries for gold and silver, and therefore the calculations have not been adjusted from the previous work.
| October 2012 | 13-4 | |
| Soledad Mountain Project
Kern County, CA, USA
Technical Report |
| Table 13.1 Recoveries for Gold & Silver |
| | | Gold | Silver |
| | Proportion | Head Grade | Recovery | Head Grade | Recovery |
| Primary Rock Types | % | g/t | % | g/t | % |
| Pyroclastics | 10.5 | 0.906 | 85.2 | 12.79 | 52.5 |
| Quartz Latite | 21.3 | 0.831 | 89.9 | 19.49 | 52.5 |
| Rhyolite | 68.1 | 0.821 | 83.4 | 11.72 | 52.5 |
| Undefined | 0.1 | 0.870 | Not included | 15.75 | Not Included |
| Total & Average | 100.00 | 0.831 | 85.0 | 13.49 | 52.5 |
13.7 Assessment
The tails analysis confirms that the HPGR is a viable option for preparing ore particles for heap leaching for the Project.
A tails target for gold can be calculated from the recovery analysis for gold and this is a weighted average tail of 0.130 g/t (0.0038 oz/ton) for the three primary ore types after 200 days of leaching.
Note that current silver production is based upon a silver recovery of 52.5% . Silver recovery of 65.0% was used for the feasibility study update prepared in 2000 and a long-term recovery of 75.0% was projected.
13.8 Metallurgical Variability
An extensive characterization program using bottle roll tests on reverse circulation drill cuttings was completed by an independent consulting engineer in 1995. The deposit was divided into six areas, four rock types and three vertical zones for this program and 46 standard bottle roll tests were performed. An analysis of the results showed that there was no discernible difference in metallurgical response for a particular rock type from area to area and from strata to strata. This is of significance both in guiding sampling programs for leach test work and as it allows the use of the information provided by such leach test work to be applied to recovery analyses and to project production of gold and silver in a commercial operation with confidence for all areas that will be mined.
13.9 Final Product
The final product that will be produced in the refinery on site is a dorè. The average silver to gold ratio in the dorè will be 11.3:1 with a typical range from 8.7:1 to 15.8:1. The estimated quantity of dorè that will we produced will vary from year to year and is expected to average 870,000 oz over a period of 15 years. A detailed estimate of dorè production is provided in Section 16.4.1.
| October 2012 | 13-5 | |
| Soledad Mountain Project
Kern County, CA, USA
Technical Report |
13.10 Deleterious Elements
Allowance has been made for 1.5% of minor metals in the dorè as shown in Table 13.2.
| Table 13.2 Minor Metals Present in Dorè |
| Element | % |
| Cu | 0.450 |
| Fe | 0.375 |
| Zn | 0.375 |
| Ni | 0.150 |
| Co | 0.113 |
| Pb | 0.037 |
| Total | 1.500 |
The minor metals content of the dorè is based upon 33 element ICP scans of pregnant solution from column leach tests and CAM WET tests on ore samples. It is not expected that these concentrations of minor metals will interfere with zinc precipitation in the Merrill-Crowe process. Refer to Section 17.3.1 for a description of the Merrill-Crowe process.
The dorè will be cleaned and prepared for shipment by the operators on site. It is expected that shipments will be made every 7 days.
Johnson Matthey Inc. (JMI) owns and operates a precious metals refinery in Salt Lake City, Utah and it is expected that the dorè will be shipped to JMI for refining. JMI has assessed the expected quality of the dorè and sees the mine as a silver producer rather than a gold producer and the dorè will be refined following the procedures for silver rather than gold.
JMI provided the following levels for minor metals in dorè at which penalties would apply as shown in Table 13.3.
| Table 13.3 Refinery Penalty Triggers for Dorè |
| Element | % |
| AS | 0.20 |
| BI | 0.005 |
| CD | 0.05 |
| HG | 0.01 |
| SE | 0.01 |
| TE | 0.01 |
| SN | 0.50 |
| BE | 0.00 |
It is not expected that the dorè will contain penalty elements that would trigger a penalty.
| October 2012 | 13-6 | |
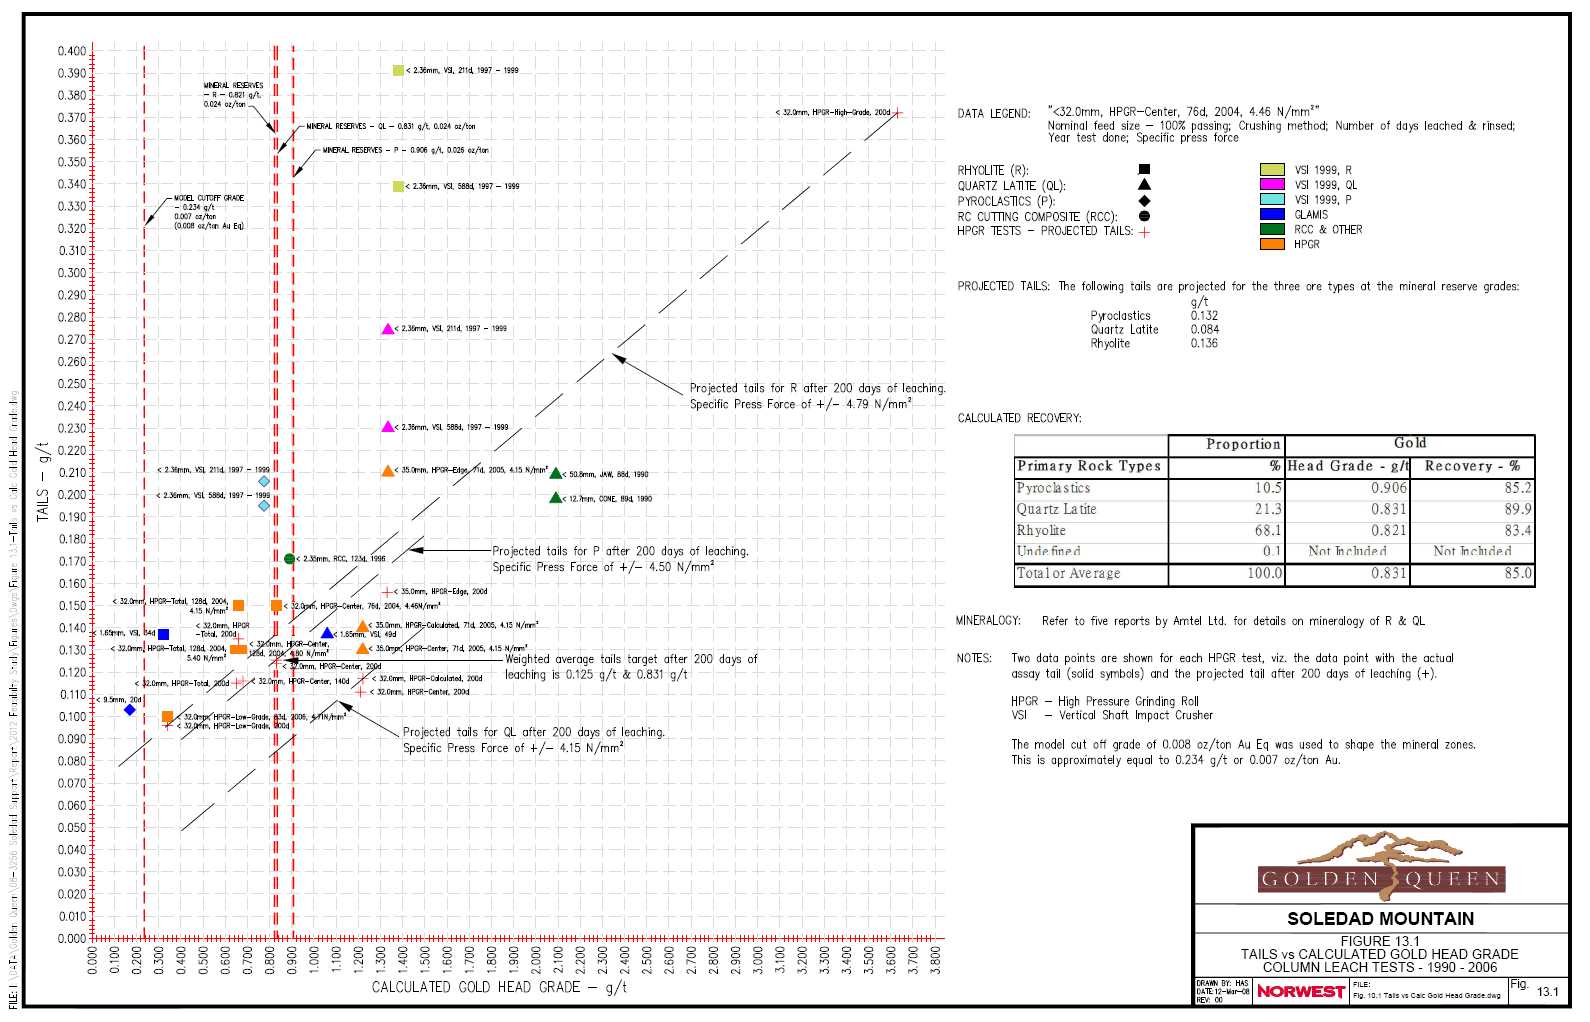
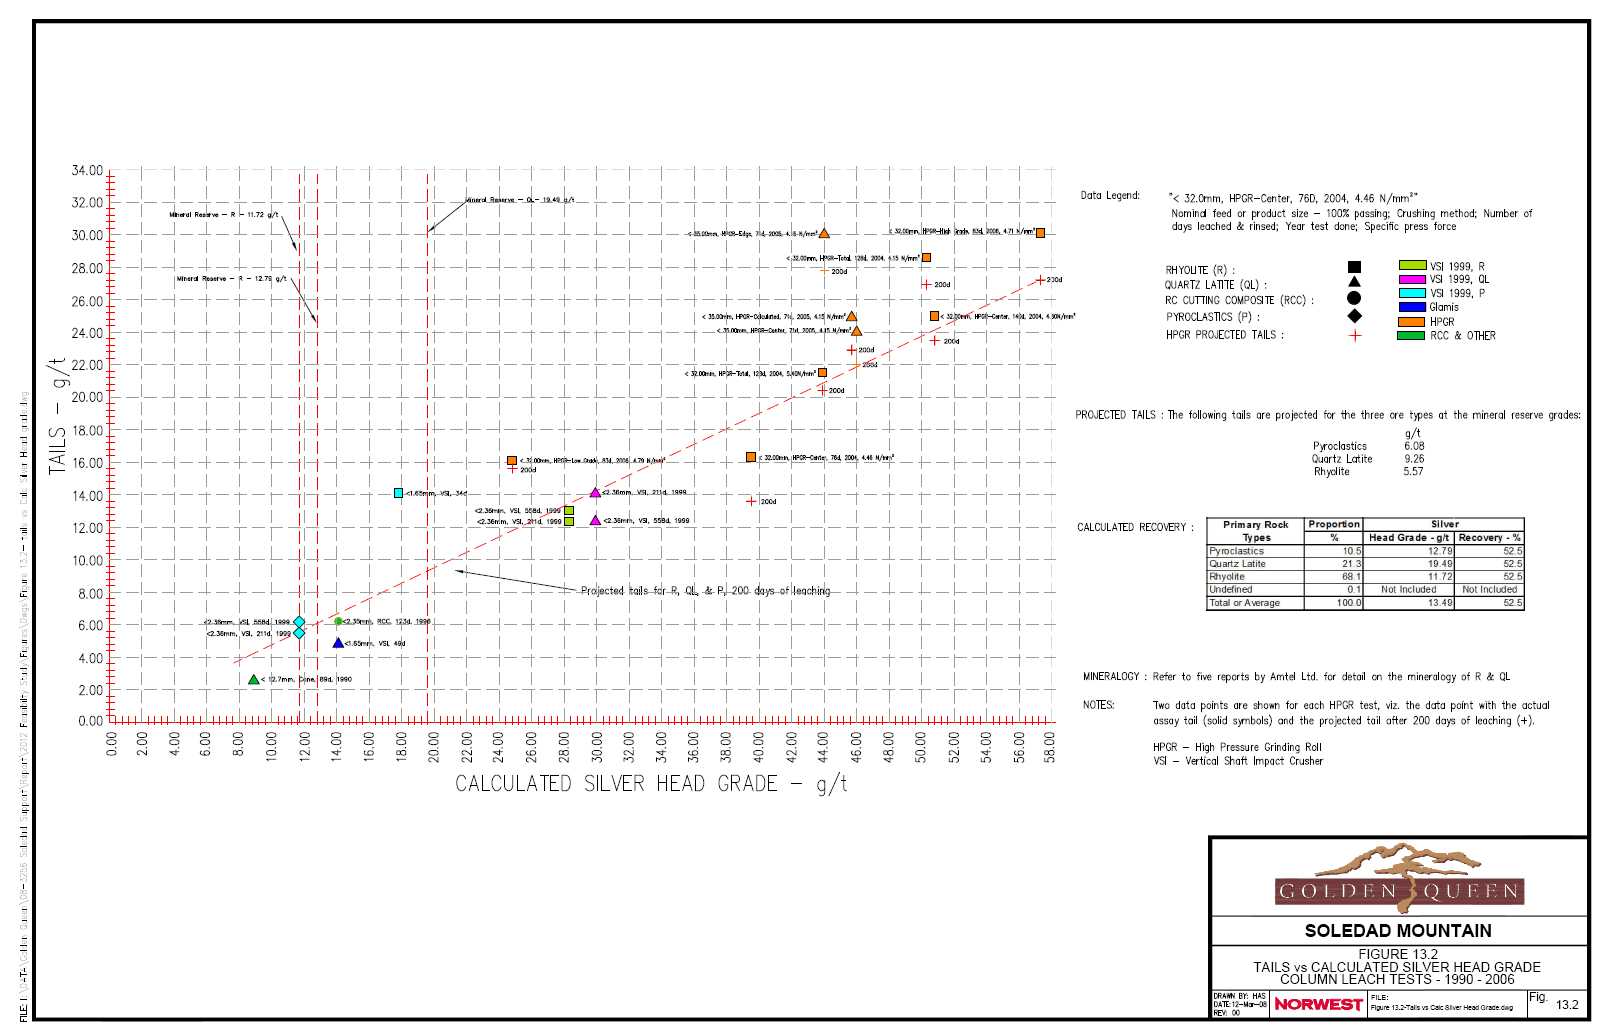
| Soledad Mountain Project
Kern County, CA, USA
Technical Report |
| 14 | MINERAL RESOURCE ESTIMATES |
| | |
| The geological, grade shell, and grade estimation models were developed by AMEC’s Principal Geologists Edward J. C. Orbock III, and Michael Munroe under the supervision of AMEC’s |
| | |
| Principal Geologist and QP for the Mineral Resource, Mark Hertel. Mr. Orbock was Chief Geologist for GQM from 1994-2000. |
The geologic and resource model are based on all drilling through the 2011 drill campaign. The cut-off date for the assay database was 31 December 2011 and no new data has been added since that time.
Construction of the assay and composite drill hole file and 3D solid models were made using MineSight® commercial mine modeling software. The model extends 10,000 ft (3,280m) in the east-west direction, 10,000 ft (3,280m) in the north-south direction, and 2,000 ft (656m) in the vertical direction. The block model was created with a constant block size of 20 ft x 20 ft x 20 ft (6.56m x 6.56m x 6.56m)
GQM carried out an aerial survey of the Project area in 2004 and produced a topographic map with 5 ft contour intervals in the Project area using California State Plane Zone 5 coordinates as described in more detail in section 9.1.
14.1 Basis of Estimate
This resource estimate is an update from the previous estimate completed by SRK in 2007 to include the data from the 2011 drilling program. New drill data was received in the form of Excel® spreadsheets, and appended to the MineSight assay database. The database consists of surface and underground drill holes samples as well as underground channel samples. All underground channel samples were labelled and treated as drill holes.
The database includes 1,374 reverse circulation, diamond core holes, and underground channel samples totalling 379,326.4 feet of drilling. All un-assayed intervals (missing samples) were set to null values and not used in the resource estimation. In 2011, 20 holes (6,287 feet) were drilled and concentrated in two structural zones on the northwest and northeast ends of the Project. Drill holes were infill and step out holes in areas that are scheduled for early production.
The 2011 model was constructed using similar procedures, parameters and geologic interpretations developed by MRDI in 2000 and by AMEC in 2005. The model setup parameters used for the 2011 model are unchanged from 2005 and are shown in Table 14.1.
| October 2012 | 14-1 | |
| Soledad Mountain Project
Kern County, CA, USA
Technical Report |
Table 14.1 Golden Queen Model Parameters |
| | Minimum (ft.) | Maximum (ft) | Size | Number |
| East | 6,498,640 | 6,508,640 | 20 | 500 |
| North | 2,175,400 | 2,185,400 | 20 | 500 |
| Elev | 2,200 | 4,200 | 20 | 100 |
14.2 Geological and Grade Shell Models
The computer model constructed for the Soledad Mountain deposit was based in part on the geological interpretation (lithologies) developed by the GQM staff in 2000 and on the structural (Szone) interpretation developed by AMEC in 2012. Rock types, high grade zones, low grade envelopes, areas of stope, and zones of internal waste were delineated on cross-sections and bench plans and then loaded into the model. Plan block maps were plotted from the model to check the block code assignments and corrections were made where necessary.
AMEC constructed mineralized envelopes or “grade polygons” to define the geometry ofmineralization to control the limits of resource estimation. Polygons were first drawn around a minimum of two consecutive 10 foot composites with grades greater than or equal 0.003 oz/ton gold equivalent on 100 foot sections. Internal to the 0.003 oz/ton gold equivalent polygons, high-grade grade shells were drawn around a minimum of one 10 foot composite with gold grades greater than 0.100 oz/ton Au. Material within the 0.003 oz/ton gold equivalent polygon and outside of the high-grade grade shell were defined low-grade. The cross section grade polygons were reconciled in plan at the toe elevation for each 20 ft bench. Bench grade polygons then were extruded upward 20 feet to create 3-D grade domain solids in order to code the composites and blocks to be used for resource estimation. Composites and blocks were coded using a 50% or greater length or volume rule, respectively, within the grade domain. Proper assignment of the grade domain code was validated by comparing composites and blocks in cross sections and bench plans to the grade shells on the computer screen. The volume of the grade domain solid was compared to the volume of tagged blocks within the grade domain and shown to be less than one percent difference.
Each record in the drill hole database has a field for drill hole name, from and to footage, interval length, Au and Ag fire assay grades, rock type and structural zone (Szone). The rock type codes differentiate the mapable lithologies (Table 14 2). Common vein systems with similar strike and dip directions were grouped together to form a Szone so that they may be statistically analyzed as a single vein system (Table 14.3 and Figure 14.1) .
| October 2012 | 14-2 | |
| Soledad Mountain Project
Kern County, CA, USA
Technical Report |
| Table 14.2 Soledad Mountain Rock Types |
| Rock Code | Rock Type |
| 1 | Pyroclastic |
| 2 | Quartz Latite |
| 6 | Rhyolite Porphyry |
| 13 | Rhyolite |
| Table 14.3 Soledad Mountain Szones |
| | Structure Orientation | |
| SZone | | | Vein System |
| | Strike | Dip | |
| 1 | N30OW | 75OSW | Golden Queen, Starlight, Soledad, and Hope |
| 2 | N30OW | 60Oto 75ONE | Silver Queen |
| 3 | N30OW | 45Oto 60ONE | Queen Esther and Independent |
| 4 | N30OW | 80ONE | Karma, Ajax, Black and Raymert |
| 5 | N30OW | 75ONE | Stockworks |
Figure 14.1: Plan Map of Bench 3600 showing Szones
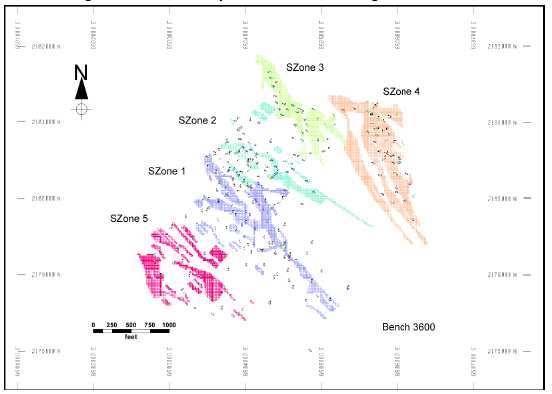
Note: figure courtesy of AMEC 2012.
| October 2012 | 14-3 | |
| Soledad Mountain Project
Kern County, CA, USA
Technical Report |
14.3 Composites
Soledad Mountain assay data was composited on 10 foot down-the-hole intervals beginning at the collar since model domains were based on grade and not lithology. Composites with a length of less than five feet were not used in grade interpolation. AMEC confirmed that the composites were properly calculated by manually compositing a few selected assays and comparing composite values to MineSight results.
14.4 Exploratory Data Analysis (EDA)
To better understand the distribution of gold and silver mineralization, gold and silver statistics were categorized by cut-off grade. Table 14.4, Table 12.2 and Table 14.5 summarize the statistics for all uncapped, length-weighted gold and silver assays respectively for all assays.
Table 14.4 Gold Assays (oz/ton) Categorized by Cut-off – All Assays |
| Cutoff (Au) | >=0.000 | >=0.001 | >=0.004 | >=0.010 | >=0.100 |
| Number of samples | 52,420 | 46,991 | 14,071 | 5,964 | 462 |
| Mean (weighed) | 0.006 | 0.007 | 0.020 | 0.040 | 0.209 |
| Maximum | 4.729 | 4.729 | 4.729 | 4.729 | 4.729 |
| Minimum | 0.000 | 0.001 | 0.004 | 0.010 | 0.100 |
| Standard deviation | 0.033 | 0.035 | 0.061 | 0.090 | 0.268 |
| Variance | 0.001 | 0.001 | 0.004 | 0.008 | 0.072 |
| Coefficient of var. | 5.178 | 4.886 | 3.022 | 2.244 | 1.279 |
| Skewness | 66.179 | 63.007 | 37.353 | 26.856 | 11.640 |
| Median | 0.002 | 0.002 | 0.007 | 0.021 | 0.144 |
| Upper quartile | 0.002 | 0.002 | 0.017 | 0.040 | 0.215 |
| Lower quartile | 0.002 | 0.002 | 0.007 | 0.012 | 0.116 |
| Percent Total | 100% | 90% | 27% | 11% | 1% |
| October 2012 | 14-4 | |
| Soledad Mountain Project
Kern County, CA, USA
Technical Report |
| Table 14.5 Silver Assays (oz/ton) Categorized by Cut-off – All Assays |
| Cutoff (Au) | >=0.000 | >=0.001 | >=0.004 | >=0.010 | >=0.100 |
| Number of samples | 52,419 | 46,990 | 14,071 | 5,964 | 462 |
| Mean (weighed) | 0.12 | 0.13 | 0.29 | 0.50 | 1.67 |
| Maximum | 35.62 | 35.62 | 35.62 | 35.62 | 35.62 |
| Minimum | 0.00 | 0.00 | 0.00 | 0.00 | 0.00 |
| Standard deviation | 0.41 | 0.43 | 0.74 | 1.07 | 2.68 |
| Variance | 0.17 | 0.19 | 0.55 | 1.14 | 7.18 |
| Coefficient of var. | 3.38 | 3.26 | 2.53 | 2.13 | 1.61 |
| Skewness | 24.96 | 23.98 | 15.29 | 11.37 | 6.23 |
| Median | 0.03 | 0.03 | 0.08 | 0.20 | 0.87 |
| Upper quartile | 0.08 | 0.08 | 0.25 | 0.48 | 1.98 |
| Lower quartile | 0.03 | 0.03 | 0.03 | 0.08 | 0.36 |
| Percent Total | 100% | 90% | 27% | 11% | 1% |
The difference in gold and silver grades by rock lithologies is shown in Figure 14.2 and Figure 14.3 for all Szones. Rock types 1, 2, 6 and 13 correspond to pyroclastics, quartz latite, rhyolite porphyry and flow-banded rhyolite respectively. The figures illustrate that lithology is not a major contributing factor for gold or silver mineralization.
Figure 14.2: Gold Assay Statistics (in oz/ton) Summarized by Rock Type for All Szones

Note: Figure courtesy of AMEC 2012.
| October 2012 | 14-5 | |
| Soledad Mountain Project
Kern County, CA, USA
Technical Report |
Figure 14.3: Silver Assay Statistics (in oz/ton) Summarized by Rock Type for All Szones
Note: Figure courtesy of AMEC 2012.
14.5 Data Adjustment
14.5.1Shell-Billiton Surface Drill Holes
All Shell/Billiton cyanide Au assays (identified as SAMPL=5 in the assay file) were adjusted using the following formula to correct to a calculated fire assay:
Calculated Fire Gold Assay = 1.0774 * (Shell/Billiton cyanide gold assay).
14.5.2GFA Channel Samples
All GFA Au assays (identified as SAMPL=1 or 2 in the assay file) were adjusted using the following formula:
(Adjusted GFA Au assay)1= 0.8571* GFA gold assay –0.0088 oz/ton Au, for Au ≥0.001 then,
(Adjusted GFA Au assay)2= 0.001oz/ton Au, for (Adjusted GFA Au assay)1 <0.001 oz/ton Au.
The Mineral Resource impact of adjusting GFA gold assays indicates that approximately 137,000 ounces of gold was removed from the Mineral Resource. However, approximately 836,000 ounces of silver was added to the Mineral Resources due to changing selection assignments of the silver composite from high-grade to the low-grade zones.
| October 2012 | 14-6 | |
| Soledad Mountain Project
Kern County, CA, USA
Technical Report |
14.6 Gold Equivalent Calculations
Gold equivalents were based on a gold price of US$1200.00 oz and US$20.70 oz for silver basedon AMEC’s metal price guidelines in July 2011. Gold recoveries vary by rock type and are listed in Table 14.6. Silver recoveries are the same for all rock types.
| Table 14.6 Gold and Silver Recoveries by Rock Type |
| Rock | | % Recovery |
| | Rock Type | | |
| Code | | Au | Ag |
| 1 | Pyroclastics | 85.4 | 52.5 |
| 2 | Qtz Latite | 89.9 | 52.5 |
| 6 | Rhyolite Porphyry | 83.4 | 52.5 |
| 13 | Flow Banded Rhyolite | 83.4 | 52.5 |
| 9 | Undefined | 83.4 | 52.5 |
Gold equivalent (AuEq) calculations were calculated using the following formulas depending on rock type metallurgical recoveries.
AuEq( oz/ ton) = Au( oz/ ton) + (Ag( oz/ ton) * [( Ag price(US$/oz)/ Au price(US$/oz)) * ( Ag recovery(%)/ Au recovery(%)])
Colour coded gold-equivalent grades for a Bench 3600 are shown in Figure 14.4.
| October 2012 | 14-7 | |
| Soledad Mountain Project
Kern County, CA, USA
Technical Report |
Figure 14.4: Plan Map of Bench 3600 Mine Blocks Showing Colour-Coded Gold Equivalent (AuEq) Grades
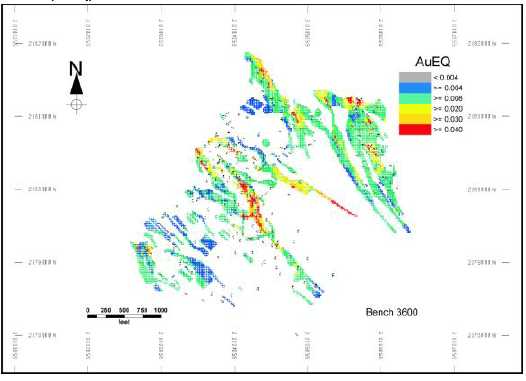
Note: Figure courtesy of AMEC 2012.
14.7 Density Assignment
In early 1997, McClelland Laboratories, Inc., (MLI) of Sparks, Nevada carried out wax coated density tests for 70 drill core and underground rock samples. A total of 320 individual measurements were made to obtain averages for the 70 samples. The following rock types were represented:
| | • | Pyroclastics; |
| | | |
| | • | Quartz latite; |
| | | |
| | • | Rhyolite porphyry; and |
| | | |
| | • | Flow-banded rhyolite |
Samples were proportioned in nearly equal numbers for the three major lithological types (pyroclastics, quartz latite and rhyolites).
The average densities obtained by MLI for each rock type are shown in Table 14.7.
| October 2012 | 14-8 | |
| Soledad Mountain Project
Kern County, CA, USA
Technical Report |
| Table 14.7 Bulk Densities, Soledad Mountain Rock Types |
| | Model | S.G. | Tonnage |
| Rock Type | Code | (g/cm3) | Factor(ft3/ton) |
| Pyroclastics | 1 | 2.33 | 13.76 |
| Quartz Latite | 2 | 2.31 | 13.86 |
| Rhyolite Porphyry | 6 | 2.30 | 13.94 |
| Flow Banded Rhyolite | 13 | 2.30 | 13.94 |
MRDI (2000) compared density certificates to core logs and sample locations, and determined that the density tests are representative of un-mineralized material and mineralized rock with gold values up to 0.074 oz/ton. MRDI plotted the location of each drill core and undergrounddensity sample and AMEC accepts MRDI’s conclusion that they represent a reasonable coverageof rock types and locations and that density tests meet the requirements for a feasibility study.
14.8 Grade Capping/Outlier Restrictions
14.8.1Low-Grade Zones
Composites used to interpolate low-grade zones had gold and silver assays capped. Gold assays were capped to 1 opt Au and silver assays were capped to 9 oz/ton prior to compositing. Low grade zones used only composites that were capped and selected only composites that were <0.100 oz/ton Au.
14.8.2High-Grade Zones
The resource model utilizes an outlier restriction approach to restricting/capping high grade composites within the high-grade zone. Gold and silver assays were not capped prior to compositing. No grade restrictions on composites were used from 0 to 20 ft., composites were capped at 2.0 oz/ton from 20 to 40 ft, and capped at 1.0 oz/ton greater than 40 ft. Silver grades were not capped from 0 to 20 ft., capped at 40.0 oz/ton from 20 to 40 ft and capped to 9.0 oz/ton greater than 40 ft.
14.9 Variography
AMEC used Sage2001® to construct and model experimental variograms using the correlogram method and henceforth referred to as variograms. AMEC developed and reviewed variograms using only composite data within the grade shells by Szone domain.
Experimental variograms were created in the northwest-southeast direction using an azimuth of 150°. The dip component varies by zone from near vertical (80°) for Szone 4 to moderately dipping (45°) for Szone 3. With the exception of Szone 1 all dip components dip to the northeast. Szone 1 dips southwest.
| October 2012 | 14-9 | |
| Soledad Mountain Project
Kern County, CA, USA
Technical Report |
The gold and silver experimental variograms were modeled using two nested spherical schemes and a nugget variance calculated from the down-the-hole variograms where the short-range variability is better defined.
14.10 Estimation/Interpolation Methods
Prior to modeling the gold and silver assays were combined to form gold equivalent values (section 14.6) . Gold, silver and the gold equivalent grades were individually composited in 10 ft lengths down-the-hole.
These composites were used as the basis for the interpretation of high-grade and low-grade zones. The interpretations were completed on approximately 100 ft spaced vertical sections on two different grids (Figure 14.5) .
The sectional interpretations were translated to 20 ft bench plans, re-reconciled, digitized and coded into the block model. Zones greater than 0.003 oz/ton AuEq were classified as low-grade zones. Within these zones, high-grade zones were defined based on composites >=0.100 oz/ton Au. No high-grade zones exist outside of the low-grade zones. Visual inspection showed that using a 0.100 oz/ton Au threshold showed reasonable continuity of the higher-grade material which is also evidenced in underground workings. The minimum “width” of the high-grade zone is 10 ft, (based upon the 10 ft composite length), which equates to a smaller true horizontal width, (depending upon the drillhole angle and dip of the veins). The low-grade zone has a minimum composite-length of 20 ft, (two 10 ft composites). Blocks with centroids falling within the outline of the low-grade zone were coded as low-grade. Subsequently the high-grade and low-grade outlines were used to assign the percentage of high-grade and low-grade to each block. During resource estimation the percentage of high- and low-grade are used with their respective interpolated grades to calculate the whole block grade. Internal waste was weight-averaged into the entire width of the mineralized zone and the grade of the zone was reduced accordingly. Waste intervals in excess of 20 ft wide were drawn as separate blocks.
| October 2012 | 14-10 | |
| Soledad Mountain Project
Kern County, CA, USA
Technical Report |
Figure 14.5: Orientation of Sectional Grids
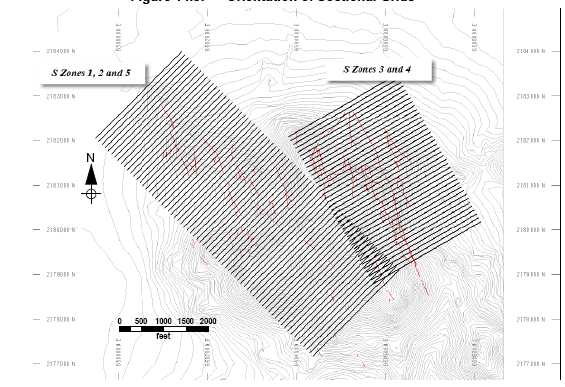
Note: Figure courtesy of AMEC 2012
14.10.1Within Grade Shells
A single resource model was generated using numerous estimation passes. Separate low-grade and high-grade passes ensure smearing of high grade is minimized. The final model included seven separate passes detailed in Table 14.8.
Table 14.8 Kriging Run Search Parameters
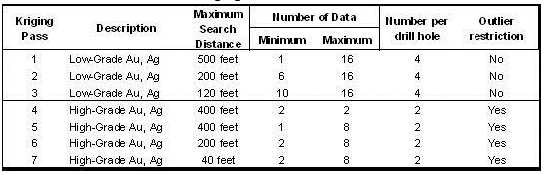
14.10.2Outside of Grade Shells
Blocks outside the limits of the grade shells were not interpolated and assumed to be waste with grade of zero for gold and silver. Waste densities were assigned based on rock type.
| October 2012 | 14-11 | |
| Soledad Mountain Project
Kern County, CA, USA
Technical Report |
14.1 1Classification of Mineral Resources
AMEC calculated the confidence limits for determining appropriate drill hole spacing for Measured and Indicated Resources. The statistical criterion used by AMEC is that the Measured Resource should be known to at least within ±15 percent with 90 percent confidence on a quarterly production (0.75 M ton). A drill hole grid spacing of 75 ft gives a 90 percent confidence interval of ±11 percent on a quarterly basis.
Mineral resources were classified as Measured when a block is located within 60 ft to the nearest composite and two additional composites from two drill hole are within 85 ft. Drill hole spacing for Measured Resources would broadly correspond to a 75 x 75 foot grid.
The statistical criterion used by AMEC is that the Indicated Resource should be known within ±15 percent within 90 percent confidence level on a yearly production (3 M ton). A drill hole grid spacing of 200 ft gives a 90 percent confidence interval of ±11 percent on an annual basis. Mineral resources were classified as Indicated when a block is located within 160 ft to the nearest composite and one additional composite from another drill hole is within 220 ft. Drill hole spacing for Indicated Resources would broadly correspond to a 200 x 200 ft grid.
Visual checks on cross section and plan show good geological and grade continuity at this distance. However, tighter drill grid spacing may be required to define high grade zones, ore and waste contacts, structural offsets, and to define final pit limits. AMEC recommends that Golden Queen Mining maintain a maximum drill grid spacing of less than 200 ft for Indicated Resources.
AMEC is of the opinion that continuity of geology and grade is adequately known for Measured and Indicated Resources for grade interpolation and mine planning.
Blocks were classified as Inferred Resources if they were located within 300 ft of a composite within the grade shell.
14.12 Block Model Validation
14.12.1Visual Inspections
The gold and silver block model grades were validated visually against drill holes and composites in section and plan view and block model grades compare well with the composite grades.
| | • | Local bias checks by comparing the means of the OK grade to the NNgradeforblocks identified as potentially being Measured and Indicated Resources |
| | • | Evaluating degree of smoothing in the kriged block model estimates |
| | • | Swath plots |
No potential biases were noted in the model from the validations.
| October 2012 | 14-12 | |
| Soledad Mountain Project
Kern County, CA, USA
Technical Report |
14.12.2Change of Support Analyses
The degree of smoothing in the kriged block model estimates was evaluated using the Discrete Gaussian or Hermitian Polynomial Change of Support method described by Journel and Huijbregts, Mining Geostatistics, Academic Press, (1978). This method uses the nearestneighbor model (or “declustered” distribution of composite grades) to predict the distribution ofgrades for selective mining unit (SMU) sized blocks. The NN grades are adjusted to account for the change in support as one goes from smaller drill hole composite samples to larger blocks in the model, while maintaining the same mean as the original declustered composites. From this, the distribution of the hypothetical block grade can be compared to the ordinary kriged model by means of a grade-tonnage curve.
The grade-tonnage curves allow for the comparison of the grade and tonnage distribution of the two models. If there is significant separation from the curves, then there is a potential problem with the estimated resource.
The Herco validation was performed with the AMEC FORTRAN Programs HERCO04D.EXE and GTCOMP.EXE.
Figure 14.6 shows the gold grade and grade-tonnage distribution of a calculated SMU (20x20x20 ft) for Measured and Indicated Szone 1 blocks. The figure shows that the grade and tonnages estimated by OK closely follows the Herco predictions up to about 0.018 oz/ton Au. At a cut-off grade of 0.004 oz/ton Au, the model should produce slightly more tons at a slightly lower grade than predicted by the theoretical Herco model.
Figure 14.7 shows the silver grade and grade-tonnage distribution for Measured and Indicated Szone 1 blocks. The figure shows that the grade and tonnages estimated by OK closely follows the Herco predictions up to 1 oz/ton Ag. The resource model should produce slightly more tons at a slightly less grade, then predicted by the theoretical Herco model.
| October 2012 | 14-13 | |
| Soledad Mountain Project
Kern County, CA, USA
Technical Report |
Figure 14.6: Gold Herco Graph Szone 1– Measured and Indicated Resource
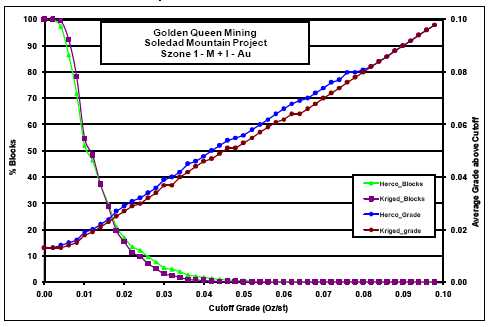
Note: Figure courtesy of AMEC 2012
Figure 14.7: Silver Herco Graph Szone 1– Measured and Indicated Resource
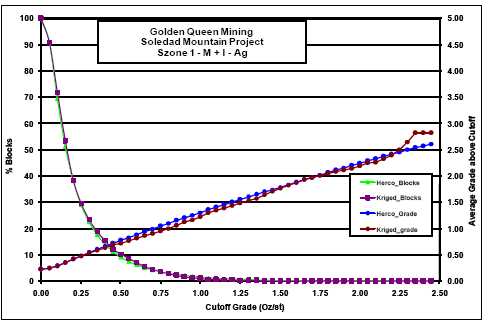
Note: Figure courtesy of AMEC 2012
| October 2012 | 14-14 | |
| Soledad Mountain Project
Kern County, CA, USA
Technical Report |
14.13Swath Plots
Swath plot validation was performed with the in-house AMEC FORTRAN program SWATH2.EXE that allows for spatial comparison of the kriged estimate, the nearest neighbor (NN) estimate, and the drill hole composites. The program separates the block model into user defined slices (swaths) that are orthogonal to easting, northing, and elevation and calculates the average grade and number of blocks (or composites) for each swath.. Swath plots check for local bias by visual comparison of how well the estimated model grades follows NN model grades. Figure 14.8 shows an example of the North-South swath plot for gold from Szone 1 for Measured and Indicated blocks. Swath plots of kriged and NN models compare well and indicate that the estimation is locally unbiased
Figure 14.9 show a North-South swath plots for silver from Szone 1 Measured and Indicated blocks.
Figure 14.8: North-South Gold Swath Plot for Szone 1. Measured and Indicated Blocks
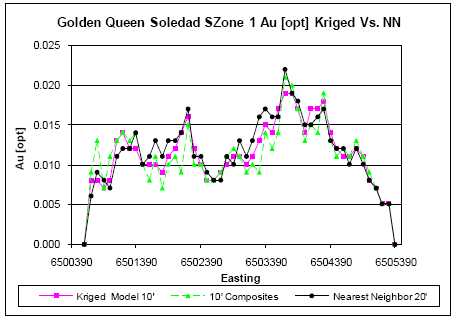
Note: Figure courtesy of AMEC 2012
| October 2012 | 14-15 | |
| Soledad Mountain Project
Kern County, CA, USA
Technical Report |
Figure 14.9: North-South Silver Swath Plot for Szone 1. Measured and Indicated Blocks

Note: Figure courtesy of AMEC 2012
14.14Model Check Using Inverse Distance
An inverse distance weighted block model was created using the same search ellipsoids and other estimation parameters as the kriged models. At an AuEq cut-off of 0.004 oz/ton, there was less than 1% difference in tons and less than 2% difference for gold and silver grades in the Measured and Indicated categories.
14.15Reasonable Prospects of Economic Extraction
Mining costs were developed by Norwest in May 2011. An qualified staff from AMEC the mining and processing costs used in developed by Norwest and are of the opinion that sufficient detailed mine planning and metallurgical testing has been completed with reasonable costs developed for a Feasibility Level Study. Table 14.9 summarizes Norwest mining cost, processing cost, G&A costs, pit wall slope angles, and gold and silver recoveries, and these were used by AMEC to produce the open pit shell that the Mineral Resources were constrained within. AMEC has updated the gold and silver prices since May 2011.
AMEC is of theopinion that blocks which display geological and grade continuity, and are contained within a pit shell generated using these parameters meet reasonable prospects for economic extraction (Figure14.10) ..
| October 2012 | 14-16 | |
| Soledad Mountain Project
Kern County, CA, USA
Technical Report |
Table 14.9 Assumptions used in Soledad Mountain LG Shell
| Item | Description |
| Mining Method | Open-pit, Truck and Loader |
| | |
| Process Method | Heap Leach |
| | |
| Gold Price | $1,310.00/ Ounce Au |
| | |
| Silver Price | $24.05 / Ounce Ag |
| | |
| Gold Recovery | Ranges from 83.4 to 89.9% |
| | |
| Silver Recovery | 52.5% |
| | |
| Tonnage Factor | Ranges from 13.8 to 13.9ft3/ton |
| | |
| Mining Cost | $1.25/ton |
| | |
| Processing Cost Including G&A | $4.98/ton |
| | |
| Pit Slope Angles | 55 degrees |
Figure 14.10: Oblique View Looking Northwest of the Base Case Mineral Resource LG Pit shell (blue) with 0.003 oz/ton AuEq Grade Shells (red)
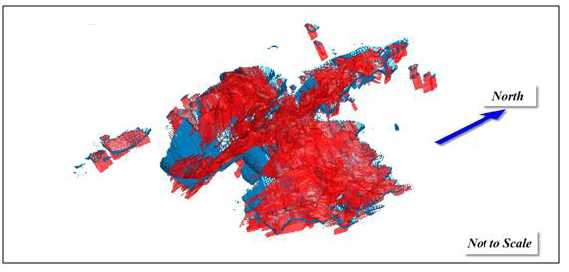
Note: Figure courtesy of AMEC 2012
14.16Mineral Resource Statement
Mineral Resources take into account geologic, mining, processing and economic constraints, and have been confined within appropriate LG pit shells, and therefore are classified in accordance with the 2010 CIM Definition Standards for Mineral Resources and Mineral Reserves.
Mr. Mark Hertel, an AMEC, Principal Geologist, is the QP for the Mineral Resources for Soledad Mountain. Mineral Resources are stated in Table 14.10, using a commodity price of US$1,310/oz gold, US$24.05/oz silver, a cut-off grade of 0.004 oz/ton AuEq, and have aneffective date of 29 February, 2012. Mineral Resources are reported inclusive of Mineral Reserves.
| October 2012 | 14-17 | |
| Soledad Mountain Project
Kern County, CA, USA
Technical Report |
Table 14.10 Soledad Mountain Mineral Resource Estimate,
Effective Date 29, February 2012, Mark Hertel, SME Registered Member
| | | | In-situ Grade | Contained Metal |
| | | | Gold | Silver | Gold | Silver |
| Classification | tonnes | ton | g/t | oz/ton | g/t | oz/ton | oz | oz |
| Measured | 26,727,000 | 29,400,000 | 0.850 | 0.025 | 13.29 | 0.39 | 729,000 | 11,403,000 |
| Indicated | 118,090,000 | 129,900,000 | 0.442 | 0.013 | 8.53 | 0.25 | 1,675,000 | 32,301,000 |
| Total & Average | 144,817,000 | 159,300,000 | 0.517 | 0.015 | 9.42 | 0.27 | 2,404,000 | 43,704,000 |
| Inferred | 14,545,000 | 16,000,000 | 0.362 | 0.011 | 7.89 | 0.23 | 169,000 | 3,681,000 |
Notes to Accompany Soledad Mountain Mineral Resources Table:
| | 1. | Mineral Resources are inclusive of Mineral Reserves. |
| | | |
| | 2. | Mineral Resources that are not Mineral Reserves do not have demonstrated economic viability. |
| | | |
| | 3. | Mineral Resources are reported at a 0.004 oz/ton (0.137 g/t) AuEq cut-off. |
| | | |
| | 4. | Mineral Resources are reported as undiluted. |
| | | |
| | 5. | Mineral Resources are reported within a conceptual pit shell that has been merged with the 2012 Mineral Reserve pit. |
| | | |
| | 6. | Mineral Resources are reported using a long-term Au price of US$1310/oz and Ag price of US$24.05/oz, mining and processing costs and variable recoveries that are based on rock type classification. |
| | | |
| | 7. | Gold equivalent grades were calculated based on the equation: |
| | | |
| | | AuEq(oz/ton) = Au(oz/ton) + (Ag(oz/ton) * [(Ag price(US$/oz)/Au price(US$/oz)) * (Ag recovery(%)/Au recovery(%)]) |
| | | |
| | 8. | Rounding as required by reporting guidelines may result in apparent summation differences between tons, grade and contained metal content. |
| | | |
| | 9. | Tonnage and grade measurements are reported in US and metric units. Grades are reported in troy ounces per short ton and in grams per tonne |
| | | |
| | 10. | Mineral zones were shaped manually with a cutoff grade of 0.004 oz/ton (0.137 g/t) AuEq. |
14.16.1Note on Rounding
Most organizations and agencies responsible for overseeing the classification and reporting of resources and reserves require results that are rounded to a level that does not imply unrealistic levels of precision. This can create apparent arithmetic inconsistencies in summations and quotients that are difficult to completely eliminate. In this report many of the key numbers are rounded to thousands of tons and ounces.
14.16.2Metal Price Sensitivity
Figure 14.11 shows a series of LG pit shells in cross section at various metal prices, -10% and + 30% from the base case.
| October 2012 | 14-18 | |
| Soledad Mountain Project
Kern County, CA, USA
Technical Report |
Figure 14.11: Vertical Cross Section Showing a Series of LG Pits Using Various Metal Prices.
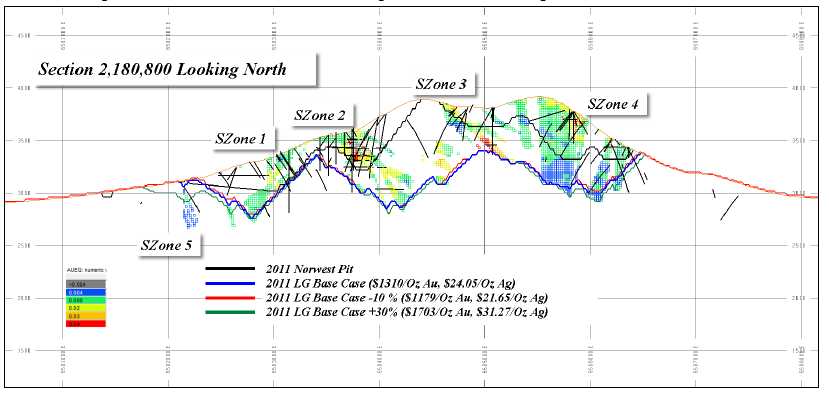
Note: Figure courtesy of AMEC 2012
| October 2012 | 14-19 | |
| Soledad Mountain Project
Kern County, CA, USA
Technical Report |
14.17Factors That May Affect Mineral Resources
Factors which may affect the conceptual pit shells used to constrain the mineral resources, and therefore the Mineral Resources include changes to the following assumptions and parameters:
| | • | Commodity price assumptions |
| | | |
| | • | Mining and processing cost assumptions |
| | | |
| | • | Metallurgical recovery assumptions |
| | | |
| | • | Pit slope angles used for the mine design |
| | | |
| | • | Assignment of SG values |
| | | |
| | • | Upside potential on higher GFA gold values. |
14.18Comments on Section 14
The QP is of the opinion that the development and classification of Mineral Resources mineralization, for the Project, which that have been estimated using exploration data and constrained to an economic pit shell, have been performed to industry best practices, conform to the requirements of CIM (2010) and are suitable for Mineral Resources and Mineral Reserves.
Mineral resources are classified as Measured when a block within the grade shell was located within 60 ft of the nearest composite and two composites from two additional drill holes was within 85 ft. Drill hole spacing for Measured Resources would broadly correspond to a 75 ft x 75 ft grid.
Mineral resources are classified as Indicated when a block within the grade shell was located within 160 ft of the nearest composite and one additional composite from another drill hole was within 220 ft. Drill hole spacing for Indicated Resources would broadly correspond to a 200 ft x 200 ft grid.
Mineral resources are classified as Inferred when a block within the grade shell was located within 300 ft of the nearest composite within the grade shell. Drill hole spacing for declaration of Inferred Mineral Resources would broadly correspond to a 300 ft x 300 ft grid.
| October 2012 | 14-20 | |
| Soledad Mountain Project
Kern County, CA, USA
Technical Report |
| 15 | MINERAL RESERVE ESTIMATES |
15.1 Conversion Factors from Mineral Resources to Mineral Reserves
15.1.1Pit Slopes
Geotechnical domains, slope angles, and assumptions were provided by Golder Associates (Golder). The proposed pit wall angle is a maximum of 71.6 degree bench face angle with a maximum overall inter-ramp angle of 55 degrees. The pit wall parameters were used in pit optimization and in pit design.
15.1.2Dilution and Mining Losses
Prior to the 2012 feasibility study update, dilution and ore loss values were assigned as part of the reserve estimate. The current mineral reserve estimates do not include dilution because the current ore-body is a low grade halo surrounding the higher grade ore zones. Given the current metal prices and cut-off grade criteria, the transition in ore grades is gradual as compared to the more sharply defined vein structure ore zone limits in the previous interpretations. Almost all of the pit designs exist within the ore zone that is above the cut-off grade; therefore it was judged reasonable to not assign any dilution or mining losses.
It is expected that good sampling and operational control practices will still be carried out as part of on-going operations in order to confirm modeling and mine planning assumptions.
15.1.3Mining Inputs
The feasibility level mine plan was developed for an open pit mining operation feeding approximately 5 million tons per year of ore to a crushing-screening plant for placement on a heap leach pad. Gold and silver would be recovered from the leach solution on-site in the form of dorè. The pit designs for the property were based upon the results of a series of Lerchs-Grossman pit optimization analyses and the estimated reserves are summarized in Table 15.1.
The mine plan is based on utilizing wheel loaders and 100 ton capacity haul trucks for the primary mining supported by a smaller development fleet for pioneering access roads, upper pit benches and final ore mining at the bottom of the various mining phases. The primary mining fleet is supported by additional equipment for road maintenance, dumping operations, stockpile activities and feed to the crushing-screening plant. For additional information regarding pit design, please refer to section 16.3.
15.1.4Process Inputs
The crushing-screening plant includes a primary and secondary crusher and screen. A high pressure grinding roll (HPGR) is used as part of the crushing circuit to prepare the ore for stacking on the leach pad. The two leach pads are designed to have capacity for the total mine production which requires placement of approximately 66 million tons of ore on the pads. Pregnant solution will be handled through a Merrill-Crowe plant which will extract the gold and silver from solution for the production of dorè. The dorè will be transported to an off-site smelter and refinery for final production of saleable gold and silver.
| October 2012 | 15-1 | |
| Soledad Mountain Project
Kern County, CA, USA
Technical Report |
15.2 Mineral Reserves Statement
Mineral Reserves have been modified from Mineral Resources by including geological, mining, processing, and economic factors detailed in this report. The reserves are classified in accordance with the 2010 CIM Definition Standards for Mineral Resources and Mineral Reserves.
The Qualified Person for the Mineral Reserves is Sean Ennis, P.Eng, Vice President of Mining for Norwest Corporation.
The Mineral Reserves are summarized in Table 15.1
Table 15.1 Mineral Reserves
| | | | In-Situ Grade | Contained Metal |
| | | | Gold | Silver | Gold | Silver |
| Reserve Category | tonnes | ton | g/t | oz/ton | g/t | oz/ton | oz | oz |
| Proven | 18,371,000 | 20,250,000 | 0.910 | 0.027 | 14.49 | 0.423 | 537,700 | 8,558,500 |
| Probable | 42,237,000 | 46,558,000 | 0.529 | 0.015 | 10.58 | 0.309 | 717,900 | 14,372,500 |
| Total & Average | 60,608,000 | 66,808,000 | 0.644 | 0.019 | 11.77 | 0.343 | 1,255,600 | 22,931,000 |
Notes: 1) Mine cut-off grade = 0.240g/t or 0.007 gold oz/ton.
15.3 Factors That May Affect the Mineral Reserve Estimate
The following factors may affect the mineral reserve estimate
| | • | Geotechnical assumptions |
| | | |
| | • | Ability of the mining operation to meet the annual production rate |
| | | |
| | • | Capital and operating cost estimates |
| | | |
| | • | Amount of rock that’s appropriate for aggregate production. The current mine permit does not allow any waste rock material to be placed 25ft higher than the original topography. Materials that could not be sold as aggregate would have to be backfilled. |
| | | |
| | • | A change in the mining permit. If the mining permit allows the operation to place waste rock 25ft higher than the original topography at the end of the mine life, this would allow GQM to mine additional ore. |
| | | |
| | • | Heap leach pad capacity. |
| | | |
| | • | Gold and silver prices affect overall economics but at current prices, the primary driver of mineral reserves is the permitting constraints which limit pit size and configuration. |
| October 2012 | 15-2 | |
| Soledad Mountain Project
Kern County, CA, USA
Technical Report |
15.4 Comments on Section 15
The current mineral reserves estimates are based on the most current knowledge, permit, and constraints. The reserves have been estimated using industry best practices and confirm to the CIM requirement. The current pit design is not the most economical pit. It was constrained by the permitted production quantities, backfilled regulations, and surface boundary constrain. Pit optimization was done at the current mining and processing cost, but at a gold price of $540 /oz and silver price of $9.00/oz to generate an optimized pit shell at the permitted production quantity and volumes. The reserve pit had a boundary constraint at the mountain peak because there is a permanent county owned radio tower that could not be removed.
| October 2012 | 15-31 | |
| Soledad Mountain Project
Kern County, CA, USA
Technical Report |
16.1 Geotechnical Considerations
16.1.1Open Pit Slope Design
Open pit slope designs done by Norwest for the Project used design guidelines and constraints set forth in the report prepared by Seegmiller International (Seegmiller) in June 1997. Five vertical diamond drill holes were drilled in locations selected by Seegmiller to obtain information for various rock types for slope stability purposes. Hole size was HQ3T. Holes ranged in depth from 92 m (302 ft) to 213 m (700 ft). The following information was recorded: geological description, faults and fractures, unconfined compressive strength, point load strength, specific weight and moisture content. Typical rock strength parameters are shown in Table 16.1.
| Table 16.1 Rock Strength Parameters |
| | Compressive | Point Load | | | |
| Rock Type | Strength | Strength | Specific Weight | w% | SG |
| | psi | MPa | psi | MPa | lb/ft3 | kg/m3 | | |
| Flow-banded Rhyolite | 12,620 | 87 | 950 | 6.6 | 147.4 | 2,361.10 | 0.4 | 2.36 |
| Altered Flow-banded Rhyolite | 490 | 3.4 | 84 | 0.6 | 113.3 | 1,814.80 | | 1.81 |
| Rhyolite Porphyry | 17,200 | 118.9 | 1,000 | 6.9 | 143.1 | 2,292.20 | 0.4 | 2.29 |
| Pyroclastics | 3,880 | 26.8 | 200 | 1.4 | 135.6 | 2,172.00 | 0.5 | 2.18 |
| Altered Pyroclastics | 320 | 2.2 | 50 | 0.3 | 88.1 | 1,411.20 | | 1.41 |
| Quartz Latite Porphyry | 13,200 | 91 | 1,010 | 7 | 146.2 | 2,341.80 | 0.6 | 2.34 |
| Altered Quartz Latite Porphyry | 3,160 | 21.8 | 581 | 4 | 133.8 | 2,143.20 | | 2.15 |
| Waste Rock (Average) | | | | | 143.6 | 2,300.00 | 0.5 | 2.30 |
Pit slopes were designed based upon stability analyses done using rock mass properties for four main rock types found on Soledad Mountain. These are Flow-Banded Rhyolite, Rhyolite Porphyry, Pyroclastics, and Quartz Latite Porphyry. Other minor rock types, including brecciated zones, can be found in some areas. For simplification purposes, with the exception of two small brecciated zones, all rocks were included in one of the four main rock groups. For the slope stability analysis, the location of contacts between rock types was defined by GQM in-house work.
Norwest carried out a site visit, identified the rock types used in the Seegmiller analysis, and found no rock types which were not consistent with this analysis.
The design constraints are provided in Section 16.1.3 Open Pit Slope Design Criteria of the Report.
| October 2012 | 16-1 | |
| Soledad Mountain Project
Kern County, CA, USA
Technical Report |
16.1.2Open Pit Slope Design Evaluation
Norwest reviewed the slope stability assessments completed to date and closely evaluated the most recent and detailed report by Seegmiller. For this evaluation, Norwest examined the sources of information used, regional geology and geologic structures as they relate to slope stability, and confirmed rock mass parameters determined by geotechnical investigations and laboratory tests. Norwest also reviewed hydrogeological conditions relevant to slope stability.
Norwest recommends the following operational procedures to reduce the potential for slope failures and to support the pit slope design:
| | • | Employ blast damage reduction techniques. |
| | | |
| | • | Divert storm-water run-off away from open pits and do not allow run-off to enter cracks along the pit perimeters. |
| | | |
| | • | Do not undercut flow-banding. It may be necessary to use rock-bolting in certain areas. |
| | | |
| | • | Employ displacement monitoring and analyses and inspect pit slopes for signs of failure. |
| | | |
| | • | Construct a test slope on the slope with the lowest static factor of safety and monitor it by monthly surveys and visual observations. This slope is hosted in Flow-banded Rhyolite, strikes N30W, and has a maximum height of 580 ft. A qualified geotechnical consultant should examine the site during and after construction of the test slope. |
| | | |
| | • | Take care to prevent and eliminate rock fall hazard zones. |
| | | |
| | • | Continue bench face structure mapping as mining progresses to support and confirm the stability analyses. |
| | | |
| | • | Complete a follow-up study during the first year of operations and review slope stability on a regular basis throughout the mine life. |
| | | |
| | • | Develop appropriate safety and loss control measures for individuals and equipment working around pit slopes and include policies and procedures in a safety manual. |
Based upon Norwest’s evaluation of Seegmiller’s pit slope stability assessment for the Project, Norwest accepts Seegmiller’s assessment as appropriate for feasibility-level mine design. As mining proceeds, additional information (see above) is required to confirm the pit slope design parameters.
16.1.3Open Pit Slope Design Criteria
The open pit slope design criteria are provided in Table 16.2.
| October 2012 | 16-2 | |
| Soledad Mountain Project
Kern County, CA, USA
Technical Report |
| Table 16.2 Pit Slope Design Criteria |
| Slope Characteristic | Magnitude |
| Maximum Bench Height | 60 ft |
| Minimum Catch Bench Width | 22 ft |
| Maximum Bench Face Angle | 71.6o( 3V:1H) |
| Maximum Inter-ramp Slope Angle | 55o |
| Bench Development | 3 lifts, 20 ft each |
16.1.4Waste Rock Dump Design
The most recent waste rock dump stability evaluation was carried out by Golder and documented in their report to GQM (May 13, 2010). Prior to this most recent work, Norwest had reviewed previous Golder waste rock dump stability reports and visited the site and identified no soft clays, adversely oriented major shear structures or other geotechnical anomalies which could contribute to waste rock dump foundation failure.
Waste rock dumps were designed using material strength parameters for foundation materials and waste rock. Strength parameters were determined by laboratory tests of rock samples for specific weight, friction angles, and cohesion. GQM suggested a waste rock internal friction angle of 37o, which is in keeping with Norwest’s experience for hard rock, run-of-mine waste rock piles.
Design constraints are provided in Section 16.1.6 Waste Rock Dump Design Criteria of this Report.
16.1.5Waste Rock Dump Design Evaluation
Current waste rock dump stability analyses were carried out by Golder on the east waste rock dump area. Previous feasibility level stability analysis was completed by Norwest on other dump areas as detailed in the 2007 Norwest feasibility study. Although the configuration of some dumping areas has been altered, the general dump designs follow the previous criteria and are therefore judged suitable for feasibility level planning.
Based upon waste rock dump stability and rock rollout analysis, Norwest recommends the following operational procedures to provide for waste rock dump stability and minimize safety hazards:
| | • | Divert storm-water run-off away from waste rock dumps. |
| | | |
| | • | Inspect crests of waste rock dumps regularly for signs of settlement or failure and employ displacement monitoring and analyses where indicated. |
| | | |
| | • | Work to prevent rock rollout hazards. |
| | | |
| | • | Develop appropriate safety and loss control measures for individuals and equipment working around waste rock dumps and include policies and procedures in a safety manual. |
| October 2012 | 16-3 | |
| Soledad Mountain Project
Kern County, CA, USA
Technical Report |
Based upon Norwest’s evaluation of waste rock dump designs completed for the Project, Norwest believes that they are appropriate for use as feasibility level designs. As mining proceeds, additional information is required to confirm design parameters.
16.1.6Waste Rock Dump Design Criteria
Final dump design guidelines are based upon stability analyses carried out by Golder and Norwest. Waste dump design criteria are provided in Table 16.3.
| Table 16.3Waste Dump Design Criteria |
| Dump Characteristic | Magnitude |
| Maximum Slope Angle | 37o(1.3H:1:V) |
| Maximum Reclaimed Slope Angle | 27o(2H:1V) |
| Maximum Dump Slope Height | 310 ft |
| Maximum Foundation Grade | 15o |
| Dump Face Height | 380 ft |
| | * | Maximum dump slope height is the maximum vertical distance from the dump elevation to original topography |
| | * | Maximum dump face height is the maximum vertical distance from the dump crest to the toe of the dump |
The following are additional design criteria for catch ditches and berms necessary to limit rock rollouts from waste dumps located above haul roads.
| | • | Minimum berm height – 6 ft |
| | | |
| | • | Minimum catch ditch depth – 2 ft |
| | | |
| | • | Minimum catch ditch width – 6 ft |
These design criteria limit rock rollouts to 2% of the total rock falls tested based on a simulation of 10,000 rockfall events.
16.2 Pit Optimization
16.2.1Pit Optimization Studies
The 3D block model prepared by AMEC in 2012 was used for development and evaluation of the pit shells for the Project. This section reviews the work carried out to develop detailed pit designs starting with a discussion of the initial pit shell optimization process and the design parameters and constraints which were used. The Minesight 3D (Mintec©) software package was used for the optimization and pit design process.
16.2.2Pit Shells– Design Parameters and Constraints
For the purposes of this feasibility study the following material parameters have been assumed. Note that only imperial units are shown in this section as the geological model was constructed with parameters specified in imperial units.
| October 2012 | 16-4 | |
| Soledad Mountain Project
Kern County, CA, USA
Technical Report |
| | • | In situ ore and waste density of 1.95 ton/yd3 |
| | | |
| | • | Waste swell factor of 30% |
| | | |
| | • | Loose density of 1.5 ton/yd3 |
| | | |
| | • | Overall maximum ore tons of 66 million tons |
| | | |
| | • | Mining constraints for the two peaks of Soledad Mountain |
| | | |
| | • | A series of pit shells was created using the pit optimization tools in MineSight© by varying parameters the gold and silver prices |
The range of parameters used in the 2012 optimization runs is summarized in Table 16.4.
| Table 16.4 Pit Optimization Variables |
| Parameter | Units | Low
Range | Upper
Range | Comments |
| | | | | |
| Gold Price | US$/oz | $480 | $660 | $540 base case |
| | | | | |
| Silver Price | US$/oz | $8 | $11 | $9.00 base case |
| | | | | |
| Ore Mining + Processing Cost | $/ton | 4.37 | $4.37 | $4.37 Based on 2011 Feasibility Study |
| | | | | |
| Waste Cost | $/ton | 1.39 | $1.39 | $1.39 based on 2011 Feasibility Study |
| | | | | |
| Overall Pit Slope Angle | degrees | 55 | 55 | 55 degrees base case |
| | | | | |
| Process Cut-off Grade | oz/ton | .007 | 0.007 | 0.007 base case |
There are several constraints which affect the selection of a suitable pit shell as well as the mining sequence. These constraints are summarized as follows:
| | • | Sufficient ore to fill the heap leach pad. |
| | | |
| | • | Minimize waste volumes. |
| | | |
| | • | Pit limits which fall within desired development boundaries. |
The updated pit designs developed here have been adapted from the original 2007 designs in order to enhance the opportunities for backfill placement and to develop pit phasing and access which lower the costs associated with backfill placement.
16.3 Pit Design
Using the selected pit shell limits, the final pit designs were created using the Pit Expansion tool in MineSight 3D following the pit slope guidelines discussed in Section 16.1.2. In addition to the geotechnical design parameters, operational parameters which were incorporated into the detailed pit design are summarized in Table 16.5.
| October 2012 | 16-5 | |
| Soledad Mountain Project
Kern County, CA, USA
Technical Report |
| Table 16.5 Detailed Mine Design Parameters |
| Design Parameter | Configuration | Comments |
| | | |
| Haul road width – two way traffic | 80 ft | Includes berm + ditch / catch bench |
| | | |
| Haul road width – one way traffic | 60 ft | Includes berm + ditch / catch bench |
| | | |
| Bench height | 20 ft | Pit triple benched to 60 feet |
| | | |
| Berm width | 22 ft | |
| | | |
| Ramp grades | 10% maximum | 10% used for final access ramp to pit bottom and portion of the external access |
| | | |
| Berm heights | 4 ft | Based on 3/4 tire height |
| | | |
| Ore and waste bank density | 1.95 ton/yd3 | |
| | | |
| Waste loose density | 1.50 ton/yd3 | Based on 30% swell factor |
16.3.1Haul Road Design
The configuration of the Soledad Mountain project presents a particular challenge in terms of pit access due to the significant changes in elevation and steep slopes. Haul road designs have been based on a maximum truck dimension equivalent to a one hundred ton capacity rear dump haul truck (Komatsu HD785 or equivalent). Ramp grades have been specified at a maximum of 10%. Roads have been designed for two way haul truck traffic except for limited cases where road width is constrained by topography or at pit bottoms.
16.3.2Ore / Waste Parameters
Ore and waste rock bank density values were based on test work carried out on samples of rock from the site. Waste rock density was applied based on the tonnage factor included in the block model. A swell factor of 30% was selected as being typical for blasted and mined waste rock.
16.3.3Dilution and Ore Loss
Based on Norwest’s interpretation of the updated geology, it is deemed reasonable for purposed of assigning dilution and ore loss to treat the ore zones as disseminated instead of vein structure. There is a gradational boundary from high grade to low grade ore to waste rock. Given the pit boundaries and ore body geometry, Norwest felt it reasonable to not assign any ore loss and dilution to the reserve estimates.
16.3.4Ultimate Pit Boundaries
The revised ultimate pit boundaries are shown in Figure 16.1 with sections provided in Figure 16.2. These boundaries are based on the detailed pit shell limits selected which met the desired goals of a low strip ratio (to limit waste quantities) and provided sufficient ore to meet the capacity of the Phase 1 and 2 heap leach pad. The shell outlines have been adjusted to reflect on mining constraints including access, geo-mining conditions, interaction between the various pit phases and property boundaries.
| October 2012 | 16-6 | |
| Soledad Mountain Project
Kern County, CA, USA
Technical Report |
In general terms, the pits are constrained mostly by the space available on the Phase 1 and 2 heap leach pad, the property boundary, the cut-off grade, back fill requirements and waste dump space. If any of those constraints were changed, the pit designs could change significantly. In overall terms, the breakdown of waste placement in the current mine plan is as follows: 53% of waste remains in external storage (ex-pit), 28% is backfilled into the mined out pits, and 19% is projected to be moved off-site when sold as aggregate.
Table 16.6 provides the final quantities within the pits designed. All of the ore within these pits is classified as proven (30%) or probable reserves (70%).
Table 16.6 Pit Quantities
| | Ore | Waste | Strip Ratio
(tons/tons) | Total Au
Oz | Total Ag
Oz |
| YDS3 | tons | Au Grade
(oz/ton) | Ag Grade
(oz/ton) | YDS3 | tons |
| Northwest Pit | 967,000 | 1,885,000 | 0.021 | 0.059 | 1,584,000 | 3,089,000 | 1.64 | 39,900 | 111,400 |
| East Pit | 14,230,000 | 27,748,000 | 0.016 | 0.364 | 11,628,000 | 22,674,000 | 0.82 | 442,900 | 10,113,900 |
| Main Pit | 13,218,000 | 25,775,000 | 0.023 | 0.413 | 28,793,000 | 56,146,000 | 2.18 | 602,900 | 10,637,900 |
| West Pit | 5,238,000 | 10,214,000 | 0.015 | 0.173 | 7,054,000 | 13,756,000 | 1.35 | 150,500 | 1,767,400 |
| Mine Totals: | 33,652,000 | 65,622,000 | 0.019 | 0.345 | 49,059,000 | 95,665,000 | 1.46 | 1,236,200 | 22,630,700 |
| Road Cuts | 608,000 | 1,186,000 | 0.016 | 0.253 | 1,930,000 | 3,763,000 | 3.17 | 19,400 | 300,300 |
| Total | 34,261,000 | 66,808,000 | 0.019 | 0.343 | 50,989,000 | 99,428,000 | 1.49 | 1,255,600 | 22,931,000 |
It should be noted that a portion of the West Pit crosses the existing permit limit boundary and into an area which is currently not controlled by GQM. GQM (L. Klingmann, personal communication) has informed Norwest that negotiations are progressing with the landholder however should tenure not be secured the loss of this mining area would decrease the overall mineable ore and recoverable metal ounces by the following amounts:
| | • | Ore tonnage reduced by 2.182 million tons |
| | | |
| | • | Insitu gold ounces reduced by 36,100 oz. (recoverable gold 30,700 oz.) |
| | | |
| | • | Insitu silver ounces reduced by 199,500 oz. (recoverable silver 104,700 oz.) |
These quantities represent less than 3% of the insitu gold and less than 1% of the insitu silver ounces respectively.
16.3.5Discussion of Cut-off Grade Calculation
A range of cut-off grades have been utilized in the preceding feasibility studies as the metal prices and modeling parameters have been revised.
The relationship between these various values is explained as follows:
| | • | 0.015 oz/ton AuEq: This mining cut-off grade used by Norwest for selected 2007 pit optimization runs in order to determine the sensitivity of the pit shells to a higher cut- off grade based on the 2007 metal, mining and recovery estimates. |
| | | |
| | • | 0.007 oz/ton AuEq: Norwest utilized this grade as the mining cut-off grade for the 2012 pit optimization runs including the pit shell that was selected for the base case. This cut-off value was calculated using the estimated cost inputs and mining inputs from the 2011 feasibility study. |
| October 2012 | 16-7 | |
| Soledad Mountain Project
Kern County, CA, USA
Technical Report |
| | • | 0.004 oz/ton AuEq: This cut-off value is used for the cut-off grade in the resource estimates (see AMEC discussion). |
16.4 Production Schedule
The mine production schedule developed for the Project is based on increasing ore output to full production levels at an achievable rate while also sequencing the pits to allow for external and in-pit waste placement to limit the mine’s ultimate footprint.
A summary schedule of the ore and waste release for the project life is shown in the Table 16.7. Figure 16.3 shows graphically the ore and waste tonnage on an annual basis over the 15 year life of the Project.
| October 2012 | 16-8 | |
| Soledad Mountain Project
Kern County, CA, USA
Technical Report |
Table 16.7 Production Schedule

| October 2012 | 16-9 | |
| Soledad Mountain Project
Kern County, CA, USA
Technical Report |
16.4.1Ore Release
As shown in Table 16.7 and Figure 16.3, the ore production increases from approximately 3.2 million tonnes (3.5 million tons) during the first year of production to the maximum production level of approximately 4.5 million tonnes (5.1 million tons) in Years 2 to 6. The production does not reach maximum capacity for year 7 to 10. From year 7 to 9, it is maintained above 3.8 million tonnes (4.2 million tons), and in year 10, it decreases to 2.9 million tonnes (3.2 million tons). From year 11 to 14, it is maintained at the maximum production of 4.5 million tonnes.
The release of gold and silver over the Project life is shown in Table 16.7. The average gold dorè production over years 2 to 14 is approximately 77,000 oz with maximum production of 120,000 oz in year 9. The average annual silver dorè production is approximately 890,000 oz over this same period, with maximum production of 1.5 million oz in year 4.
16.4.2Waste Mining
Table 16.7 shows the waste production schedule over the life of the heap leach operation. The waste production varies between 3.3 to 10.7 million tons over the Project life. Waste mining is higher in year 1 because of access development. It is also higher in year 10 due to higher strip ratio at the top of the Main Pit.
The variation in the range of waste mining is driven by a combination of factors. The mine production schedule is constrained by the ore processing capacity limit of approximately 5.1 million tons per year and the permit limit of 14 million tons of material mined per year. In most years, the operation has excess mining capacity but ore production cannot exceed process capacity. If opportunity exists to undertake additional waste mining in a given year where the ore production capacity is met and the mining configuration makes additional waste stripping practical, then this waste mining has been scheduled.
16.4.3Pit Phasing and Backfilling
The pit phasing has been developed with the intent of taking advantage of opportunities for pit backfill and to allow for access to the various pit phases. Plans detailing the mining sequence can be found in Figures 16.4 through 16.20.
16.4.4Scheduling Considerations
This updated feasibility report assumes a pre-production start date early in Year 0. There are three main types of schedule considerations; equipment, plant and access.
| | • | Equipment: Initially a development fleet is employed for the first three quarters for road construction and preparation of the North-West pit area for mining in the pre-production and construction year (or Year 0). Two primary truck and loader fleets will be acquired sequentially at the end of the pre-production year and phased in to start work in Year 1. |
| October 2012 | 16-10 | |
| Soledad Mountain Project
Kern County, CA, USA
Technical Report |
| | • | Plant: The crushing-screening plant and the Merrill-Crowe plant are scheduled to be commissioned toward the end of Year 0 and to be available for production at the start Year 1. During plant construction, a stockpile will be necessary for the ore released during road construction and from the upper benches in the North-West pit. |
| | | |
| | • | Access: The steeply dipping topography and paired nature of the Main pits provide scheduling constraints on pit development. When possible, pits are mined simultaneously to simplify access as well as providing a shorter haul to the waste rock dump. Pit backfilling is a crucial component of the access to other pits, since those backfills are often turned into roads. |
| | | |
| | • | Stockpile management: During periods of high ore production, throughput capacity of the crushing system is a potential bottleneck in the ore handling system. Management of ore stockpiles during these periods will be required to ensure ore mining is not constrained and the equipment fleet can tram and feed ore to the crushing system efficiently. |
16.5 Production Schedule
The production schedule (Table 16.7) is developed from the mine phasing and other parameters as described above. The schedule includes the production from the access and haul road construction.
| Year 0 | (Figure 16.4) In pre-production, the development fleet will be constructing pioneer roads and undertaking initial mining in the North-West Pit. All the waste rock will be used to develop the Phase 1, Stage 1 heap leach pad, the overland conveyor route and the crushing-screening plant foundations. The extra waste rock will go towards building a fill road to the East Pit area. The crushing- screening plant is assembled during the second and third quarters and should be operational by the beginning of October. Ore that is released during the pre- construction period is to be used for the preload of the heap leach pad and the rest is to be stockpiled. |
| | | |
| Year 1 | (Figure 16.5) The development fleet will be constructing an access to the lower bench of East Pit. During that time, the two primary fleets will be mining the North-West Pit, and the top of East Pit. The waste rock from the road construction, East Pit and the North-West Pit will all be hauled to build a foundation for the aggregate plant within the East rock dump footprint, and the extra material will be placed in lifts in the East rock dump as well. |
| | | |
| Year 2 | (Figure 16.6) The two primary fleets will be mining in the East Pit. The waste rock from the East Pit will be placed in the East rock dump. The development fleet will be used for construction of the West Pit access and another access for the lower portion of the East Pit. The waste rock from the west pit access cuts will be backfilled into the North-West Pit. |
| October 2012 | 16-11 | |
| Soledad Mountain Project
Kern County, CA, USA
Technical Report |
| | Year 3 | (Figure 16.7) The development fleet is used to construct the remaining part of the West pit access. When the development fleet finishes constructing this access, it will switch over to general mining support. The two primary fleets continue to mine down East Pit, and the waste rock from East Pit is hauled to East rock dump. Planned aggregate production will begin this year, producing up to 318,000 tonnes (351,000 tons) annually of aggregate beyond the planned gold and silver production period. |
| | | |
| | Year 4 | (Figure 16.8) The two primary fleets continue to mine at full capacity in East Pit. About 1 million tonnes (1.1 million tons) of waste rock is backfilled into North West Pit. The rest of the waste rock produced is hauled to the East rock dump. The development fleet is used for mine support. |
| | | |
| | Year 5 | (Figure 16.9) One of the primary fleets is moved to East Pit phase 3, and the other primary fleet moves to Main Pit 2. The waste rock from East Pit phase 3 is hauled to the East rock dump, and the waste rock from Main Pit 2 is backfilled to the front portion of the East Pit below 3635ft elevation. The development fleet is used for general mine support. |
| | | |
| | Year 6 | (Figure 16.10) One primary fleet continues to mine down East Pit phase 3. The waste rock is placed in the East rock dump. The second primary fleet mines down Main Pit phase 3, and the waste rock is backfilled into East Pit. The Main Pit is accessed using the West Pit access haulroad. The development fleet is used for mining the small area of the East Pit phase 3 and general mine support. |
| | | |
| | Year 7 | (Figure 16.11) Mining continues in East pit 3 with the last bench mined by the development fleet, and it is completed in the first quarter. This waste rock is backfilled into the front of the East Pit. The two primary fleets mine down Main Pit 3 together until the second half of the year where one fleet is moved to Main Pit 1. Approximately 250,000 tons of waste rock from Main Pit 1 is backfilled to the North West Pit, and the rest of the waste rock is backfilled into East Pit. The waste rock from Main pit 3 continues to be backfilled into East Pit. |
| | | |
| | Year 8 | (Figure 16.12) The primary fleet finishes mining in Main Pit 1, and moves back to Main Pit 3 leaving the last bench of Main Pit 1 for the development fleet. The waste rock from Main Pit 1 can be backfilled into East Pit. The two primary fleets continue to mine down Main Pit 3. An uphill ramp is required into East Pit to allow placement of backfill. The secondary fleet is used to develop an access from the lower elevation of Main Pit 3 to the East rock dump. This will become the main ore and waste haul road for Year 9. |
| October 2012 | 16-12 | |
| Soledad Mountain Project
Kern County, CA, USA
Technical Report |
| | Year 9 | (Figure 16.13) The two primary fleets continue to advance in Main Pit 3 until the end of the year. The waste rock is backfilled into East Pit using the access developed in the previous year. The development fleet is used to construct access for the lower portion of the Main Pit and general mine support. |
| | | |
| | Year 10 | (Figure 16.14) In this year, the two primary fleets move to Main Pit phase 4 and West Pit phase 1. The waste rock is backfilled into Main Pit 3 to create an access that connects the West Pit with the external rock dump. The extra waste material is placed in the East rock dump. The Main Pit 3 cannot be backfilled during the first three months while mining is not complete. For that three month period, the waste rock from Main Pit phase 4 and West Pit 1 is backfilled into Main Pit 1. |
| | | |
| | Year 11 | (Figure 16.15) Both primary fleets continue to mine in West Pit and Main Pit phase 4. The waste rock is backfilled into Main Pit. The development fleet is used for mine support as required. |
| | | |
| | Year 12 | (Figure 16.16) Both primary fleets mine down the Main Pit 4. The waste is backfilled into Main Pit phase 3. The development fleet is used as support and to mine out the small area remaining in Main Pit phase 4. |
| | | |
| | Year 13 | (Figures 16.17) Both primary fleets mine down Main Pit 4 for four months and then move to the West Pit. The waste rock from Main Pit phase 4 and West Pit is backfilled into Main Pit. The secondary fleet is used for mining the last bench of Main Pit Phase 4 and general mine support. |
| | | |
| | Year 14 | (Figure 16.18) The two primary fleets continue to mine in the West Pit. The waste rock is backfilled into Main Pit. The development fleet is used for general mine support. |
| | | |
| | Year 15 | (Figure 16.19) The last few benches are mined out with primary fleets except for the final backhoe mining which is completed by the development fleet. The waste rock is backfilled into Main Pit. Aggregate production is expected to continue for an extended period depending upon annual production rates. Reclamation of the site (excluding aggregate production area) will continue for two more years. |
| | | |
| | Year 16-32 | (Figure 16.20) Aggregate production continues until year 31. Figure 6.18 shows the site at the end of aggregate production after all backfilling, regrading and reclamation have been completed. Note that the figure shows the ultimate regrading limits where regrading of waste materials has occurred beyond the current permitted limits. The areas within the regrading limits on the east side of the property are on land owned by GQM, but which have not yet included within the permitted disturbance area. |
| October 2012 | 16-13 | |
| Soledad Mountain Project
Kern County, CA, USA
Technical Report |
16.6 Mining Equipment
This section describes the mining equipment selected for the Project and reviews the operating parameters and assumptions which were used to estimate equipment productivities and unit requirements over the life of the open pit heap leach operation. Equipment selection was based on Norwest’s current understanding of the pit geology and configuration, required production levels and mining constraints. The current production schedule and pit phasing requires the use of two primary equipment fleets with a smaller development fleet.
The primary fleets would be responsible for the main ore and waste excavation and haulage once initial pit access and development work was completed. The smaller fleet for road building and initial bench development is required over most of the mine life as the multiple pit phases are developed.
16.6.1Primary Mining Fleet
The configuration and phasing of the pits requires that the primary loading equipment be mobile and flexible in terms of loading conditions. In addition, the equipment needs to have the capability to mine selectively in order to limit ore loss and dilution while still meeting production targets. With these considerations in mind, Norwest judged that front-end loaders (FEL) would best meet the Project requirements. A loader bucket capacity in the range of 11 cubic metres (15 cubic yards) would allow for sufficient production capacity and selectivity. Based on this selection, the primary mining fleet has been configured as follows:
Primary Mining Fleet
| | • | Loading: Front end loader 11m3(15 yd3) capacity) (Komatsu WA 800-3 or equivalent) |
| | | |
| | • | Haulage: 90t (100 ton) capacity rear-dump truck (Komatsu HD785-7 or equivalent) |
| | | |
| | • | Drilling: 175mm (6 ¾ inch) diesel-powered (Atlas Copco DM45 or equivalent) |
A listing of the number of units required is contained in Table 16.8.
16.6.2Development Fleet
Initial mine production and development work is carried out solely by the smaller development fleet during the first year of the mine’s life. Once the primary fleet equipment is on site, the main role for the development fleet is the pioneering of access roads and mining of the smaller upper benches and bottoms of the pits. The equipment for this fleet was selected based on its ability to work in tight conditions with limited digging room. In addition, the trucks would be required to operate on relatively narrow roads with higher gradients during initial development. However the development schedule also requires equipment which can achieve relatively high levels of production during some periods of the Project life. Based on these requirements, it was judged that a hydraulic excavator matched with articulated rear-dump haul trucks was suitable. The small drill would also be available for site utility work such as secondary blasting. The equipment fleet chosen to meet these requirements is listed below and number of units shown in Table 16.8:
| October 2012 | 16-14 | |
| Soledad Mountain Project
Kern County, CA, USA
Technical Report |
Development fleet
| | • | Loading: Hydraulic excavator (5 yd3capacity) (Komatsu PC650 or equivalent) |
| | | |
| | • | Haulage: Articulated rear-dump truck (40 ton capacity Komatsu HM400 or equivalent) |
| | | |
| | • | Drilling: 4 ½ inch dia. percussion drill (Atlas Copco Roc D9-11 drill or equivalent) |
16.6.3Support Equipment
Support equipment for the Project would be required for the following tasks:
| | • | Clean-up and support for in-pit waste and ore loading |
| | | |
| | • | Movement of waste on rock dumps and resloping of dumps |
| | | |
| | • | Maintenance of haulroads |
| | | |
| | • | Loading and control of ore stockpiles |
| | | |
| | • | Maintenance of mining equipment |
| | | |
| | • | Heap leach construction |
The exact size and configuration would be finalized at the detailed engineering stage, however the composition of the support equipment fleet is expected to include units of the following type:
| | • | Track-type dozers (Komatsu D275 or equivalents) |
| | | |
| | • | Motor grader (Komatsu GD655 or equivalent) |
| | | |
| | • | Front end loader with tool carrier (CAT 980 w/ attachments or equivalent) |
| | | |
| | • | Water wagon for road dust control |
| | | |
| | • | Wheel dozer (WD600 or equivalent) |
| | | |
| | • | Various maintenance vehicles: lube truck, heavy forklifts, tow truck, flat deck truck |
| | | |
| | • | Hydraulic backhoe (Komatsu PC220 class) |
| October 2012 | 16-15 | |
| Soledad Mountain Project
Kern County, CA, USA
Technical Report |
| Table 16.8 List of Support Equipment |
| | Equipment | Number of units |
| Primary Fleet | Wheel Loaders (15 yd3) | 2 |
| Trucks (100 tons) | 7 |
Development
Fleet | Excavator (5yd3) | 1 |
| Trucks (40 tons) | 2* |
Support
Equipment | Track-Type dozer (452hp) | 2 |
| Wheeled Dozer (522 hp) | 1 |
| Primary drill (9.75 inch) | 2 |
| Percussion Drill (3-4 inch) | 1 |
* Note – during pre-production an additional number of trucks would be required on a short-term basis for access and development activities.
16.7 Blasting and Explosives
The new security requirements that were introduced to combat the threat of terrorist activities in the United States make contract blasting the preferred option and a contract blaster will be used. There are several suppliers in the region capable of meeting the requirements of the project. Alpha Explosives Inc. (Alpha), a Dyno Nobel distributor based in Mojave, and Maxam North America (Maxam) based in Salt Lake City have both made full-service proposals.
Based on the available groundwater data, blastholes are expected to be dry through the life of the mine and only ANFO will be used as a blasting agent. A powder factor of 0.18 kg/t or 0.42 kg/m3(0.36 lb/ton or 0.71 lb/yd3) was used to estimate explosives consumption.
Alpha prices are effective August 1, 2012. The full-service price on the basis of one blast every second day is $0.1913/t ($0.1736/ton) of ore and waste. This assumes that Alpha provides labor for stemming blast holes and this could be done at a lower cost by the mine helpers.
Alpha provides service to a number of mines and quarries in the area and has a bulk storage facility for ammonium nitrate prill in Mojave. Alpha also receives prill by rail and this is a key consideration in dealing with a local supplier as moving freight by rail is more energy efficient than moving the same quantity of prill by truck on the highway. This is reflected in the above price.
16.8 Site Drainage
Golder prepared a Site Drainage Plan for the Project dated March 8, 2012 and this was included as Appendix 5 in the revised Report of Waste Discharge prepared for the Lahontan Regional Water Quality Control Board (GQM, 2012). This is the fourth update of the site drainage plan prepared by Golder for the Project and addresses site drainage as it applies to the open pit operation. The underlying engineering assumptions meet the requirements of the California State Water Resources Control Board and the Kern County Engineering, Surveying & Permit Services Department. A Stage I, Surface Water, Sediment and Erosion Control Plan has been prepared for the construction and early mining phases of the Project.
| October 2012 | 16-16 | |
| Soledad Mountain Project
Kern County, CA, USA
Technical Report |
The Post-Mining Drainage Plan for the Project is shown in Figure 16.21. The site drainage plan can quickly be revised as open pit designs change and this will include detailed designs for sediment ponds and drainage channels as required.
Storm Water discharges will be regulated by the Water Board under the State’s NPDES General
Construction Storm Water Permit during the initial construction phase of the Project and under the NPDES General Industrial Storm Water Permit during mine operations. GQM’s consulting engineers, ARCADIS-U.S., Inc., a Qualified SWPPP Developer in California, have therefore prepared the designs and the GQM has filed Permit Registration Documents electronically through the Storm Water Multiple Application and Report Tracking System (SMARTS). The Documents include a Notice of Intent, Storm Water Pollution Prevention Plan (SWPPP), Risk Assessment, a Site Map and a signed certification statement by the Legally Responsible Person. GQM also paid the first annual fee. Note that the SWPPP alone is a 200-page document. The Documents filed through SMARTS meet applicable NPDES Storm Water Program requirements of the Kern County Engineering, Surveying & Permit Services Department.
| October 2012 | 16-17 | |
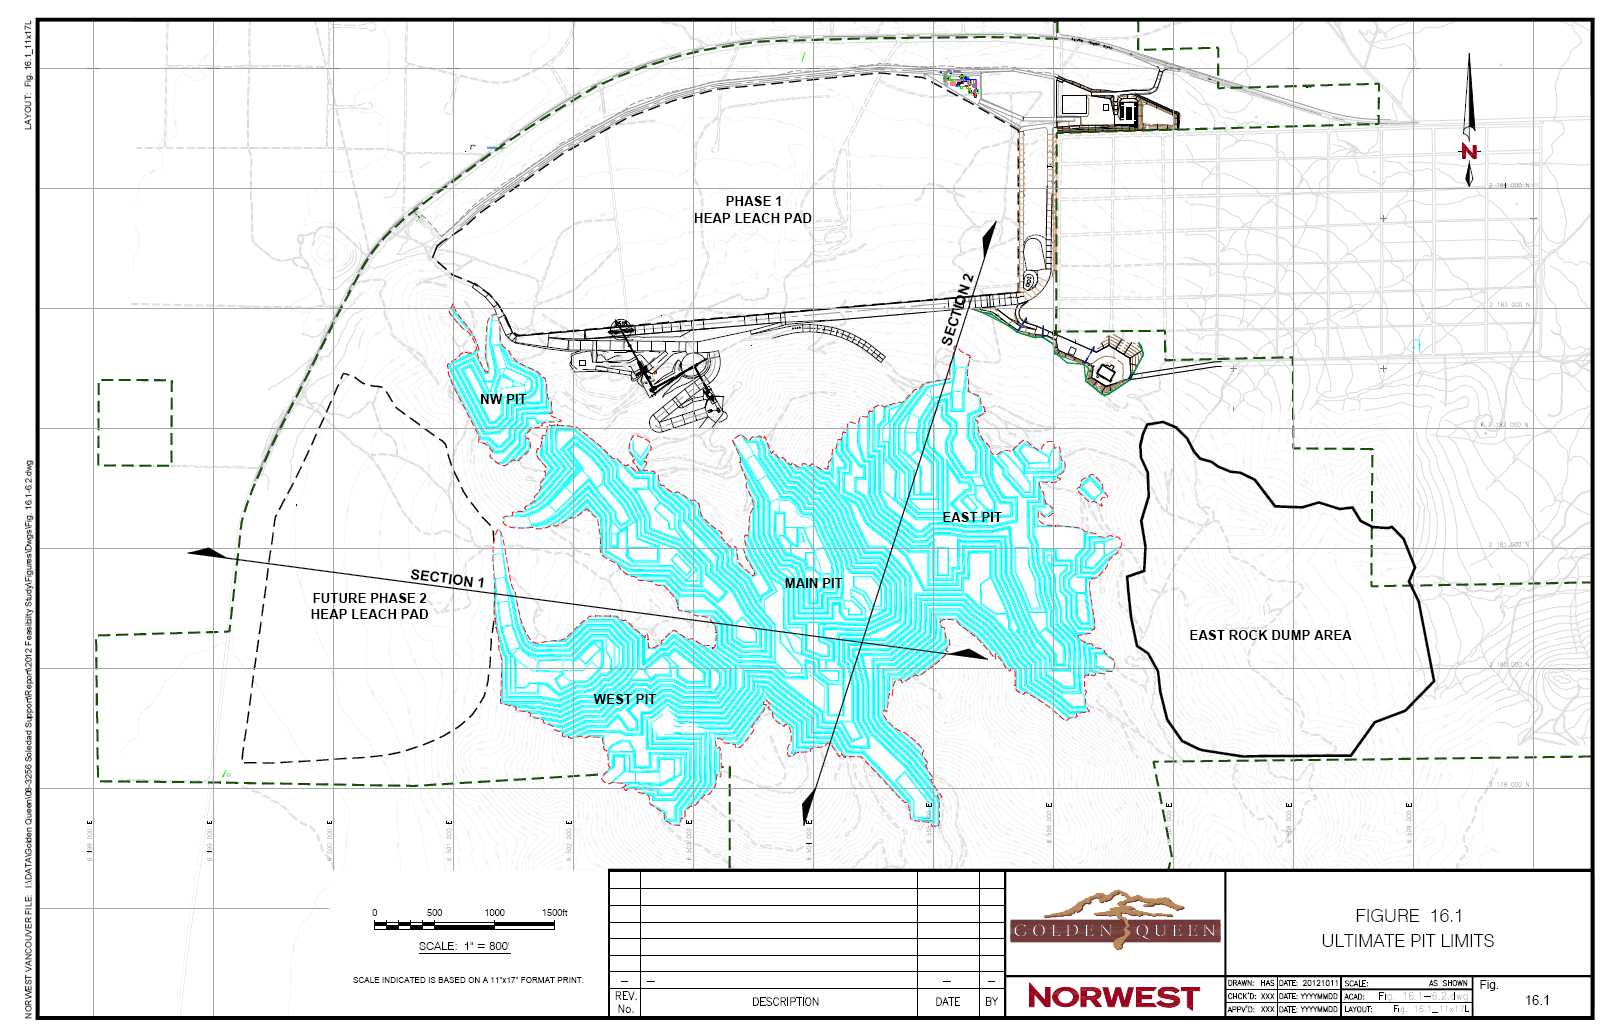
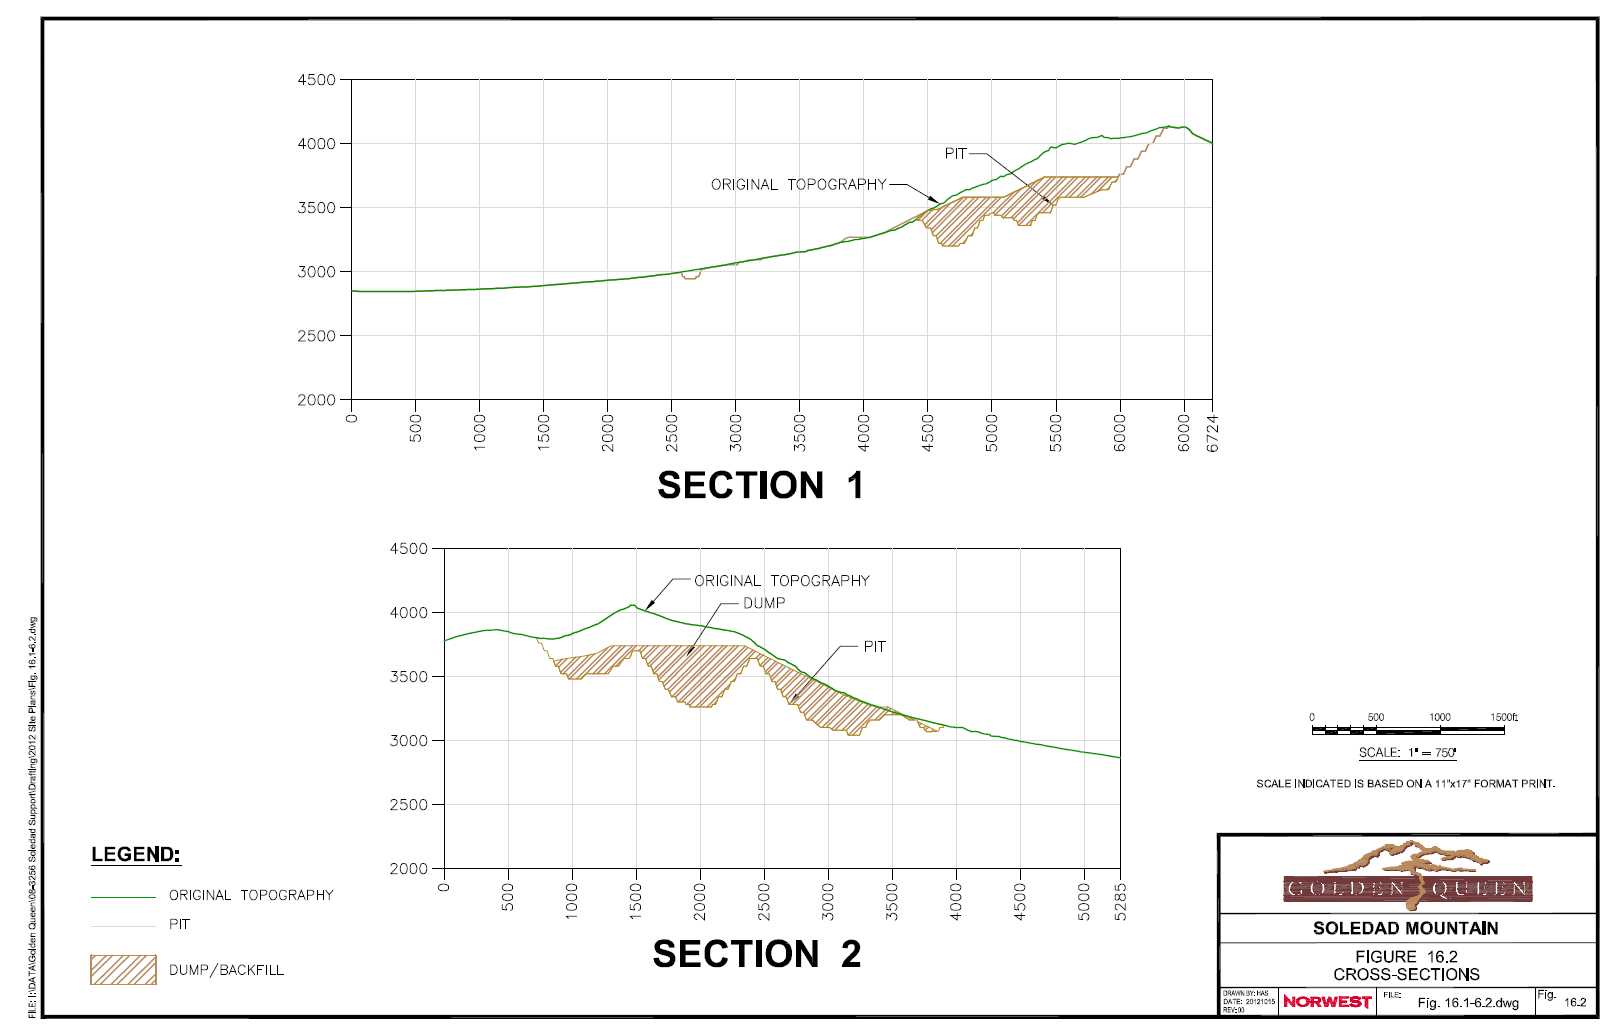

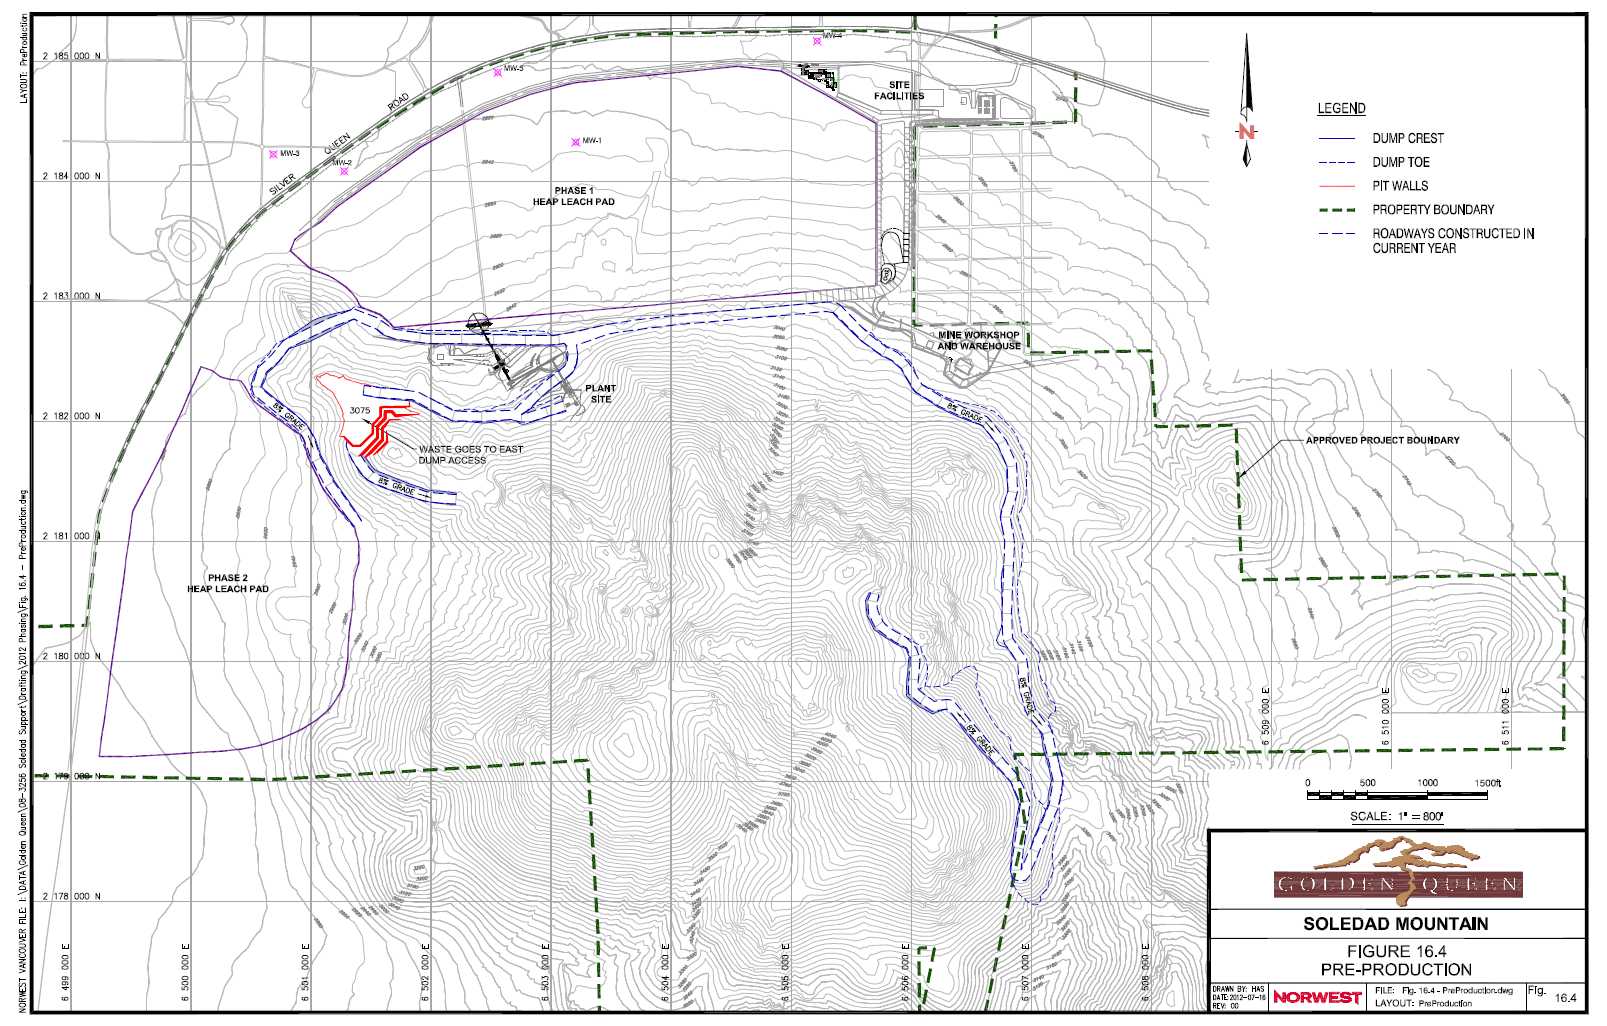
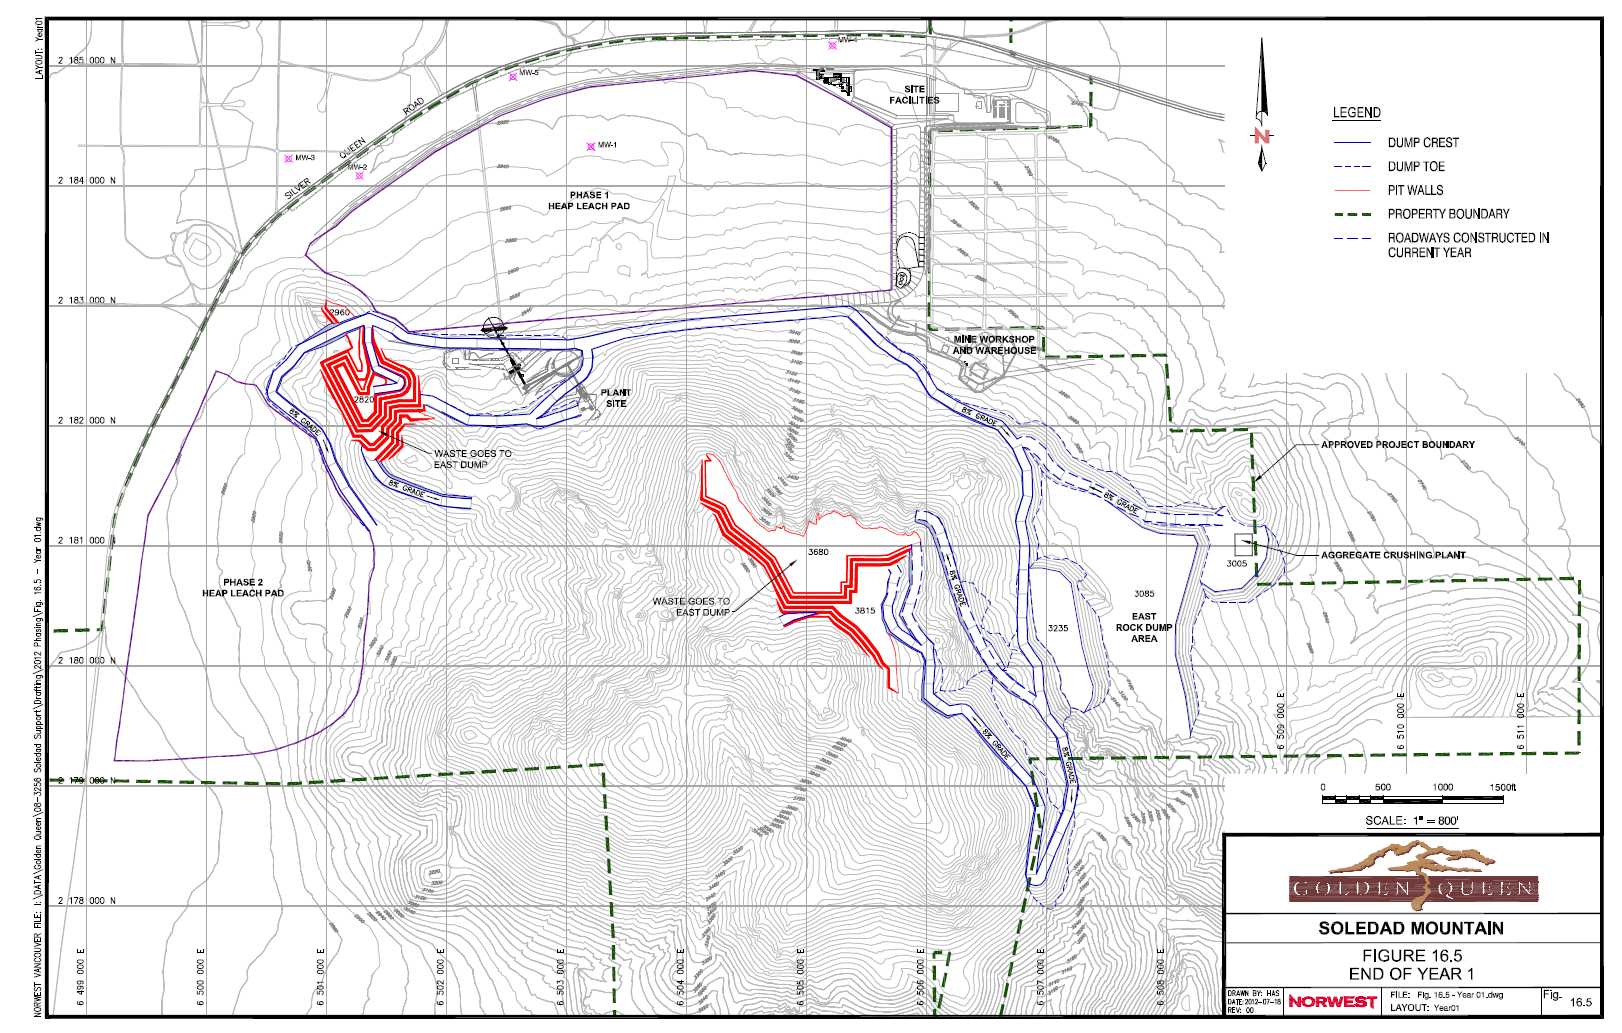

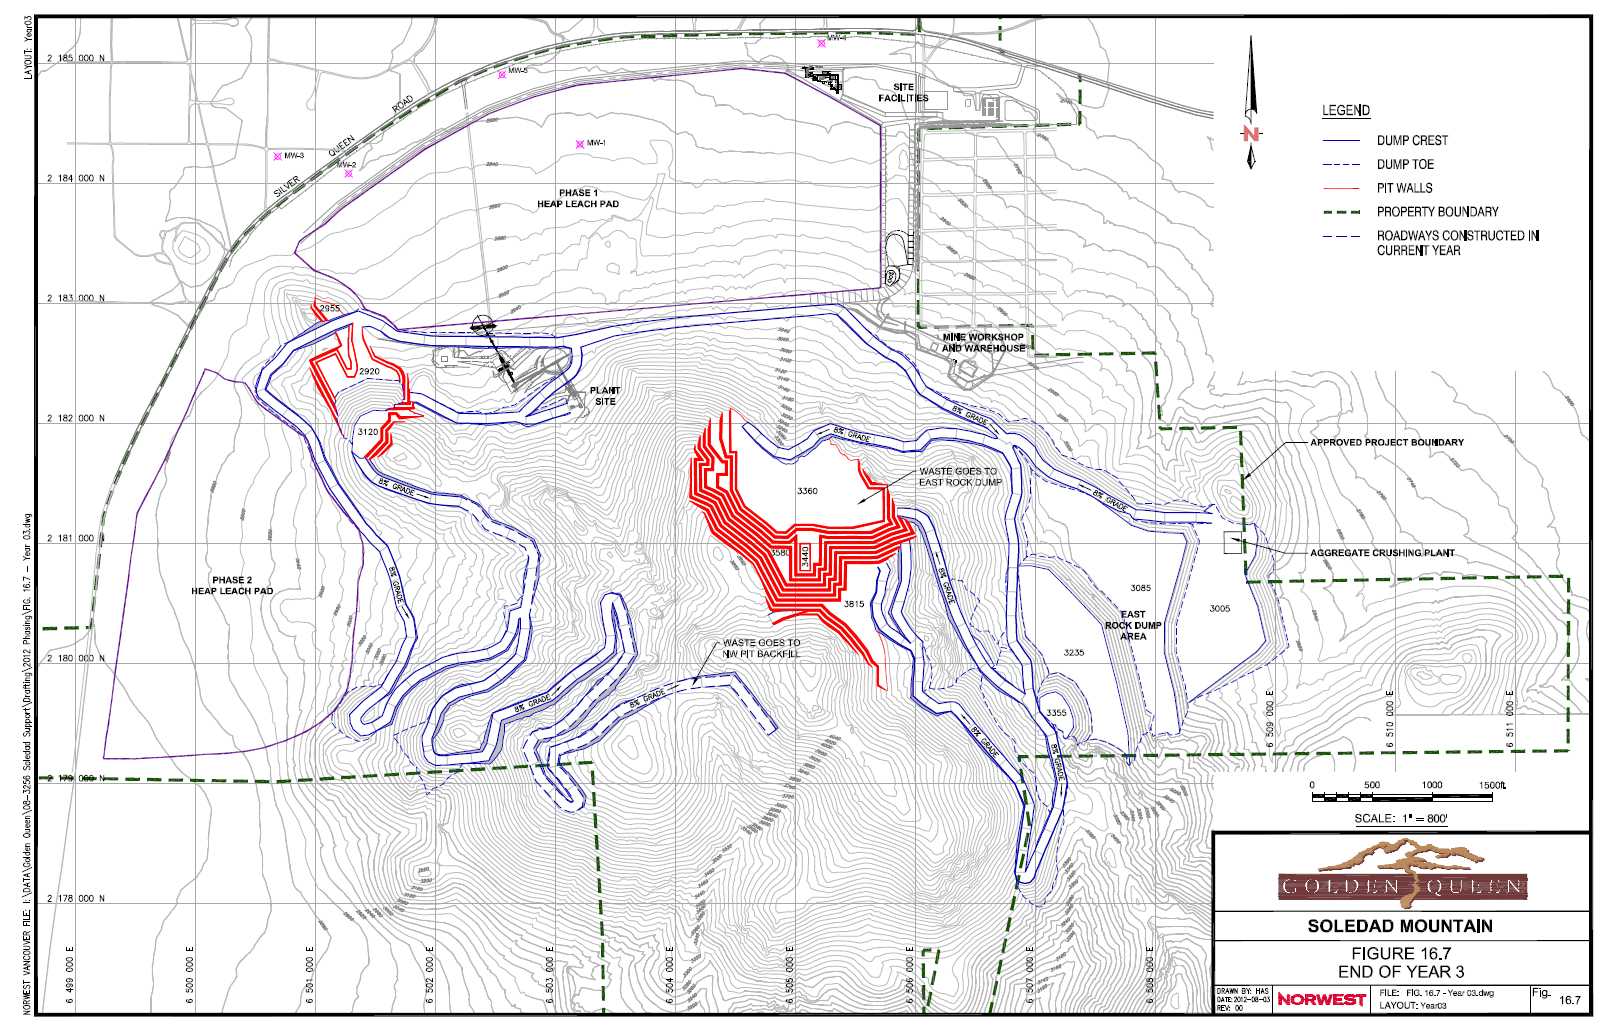
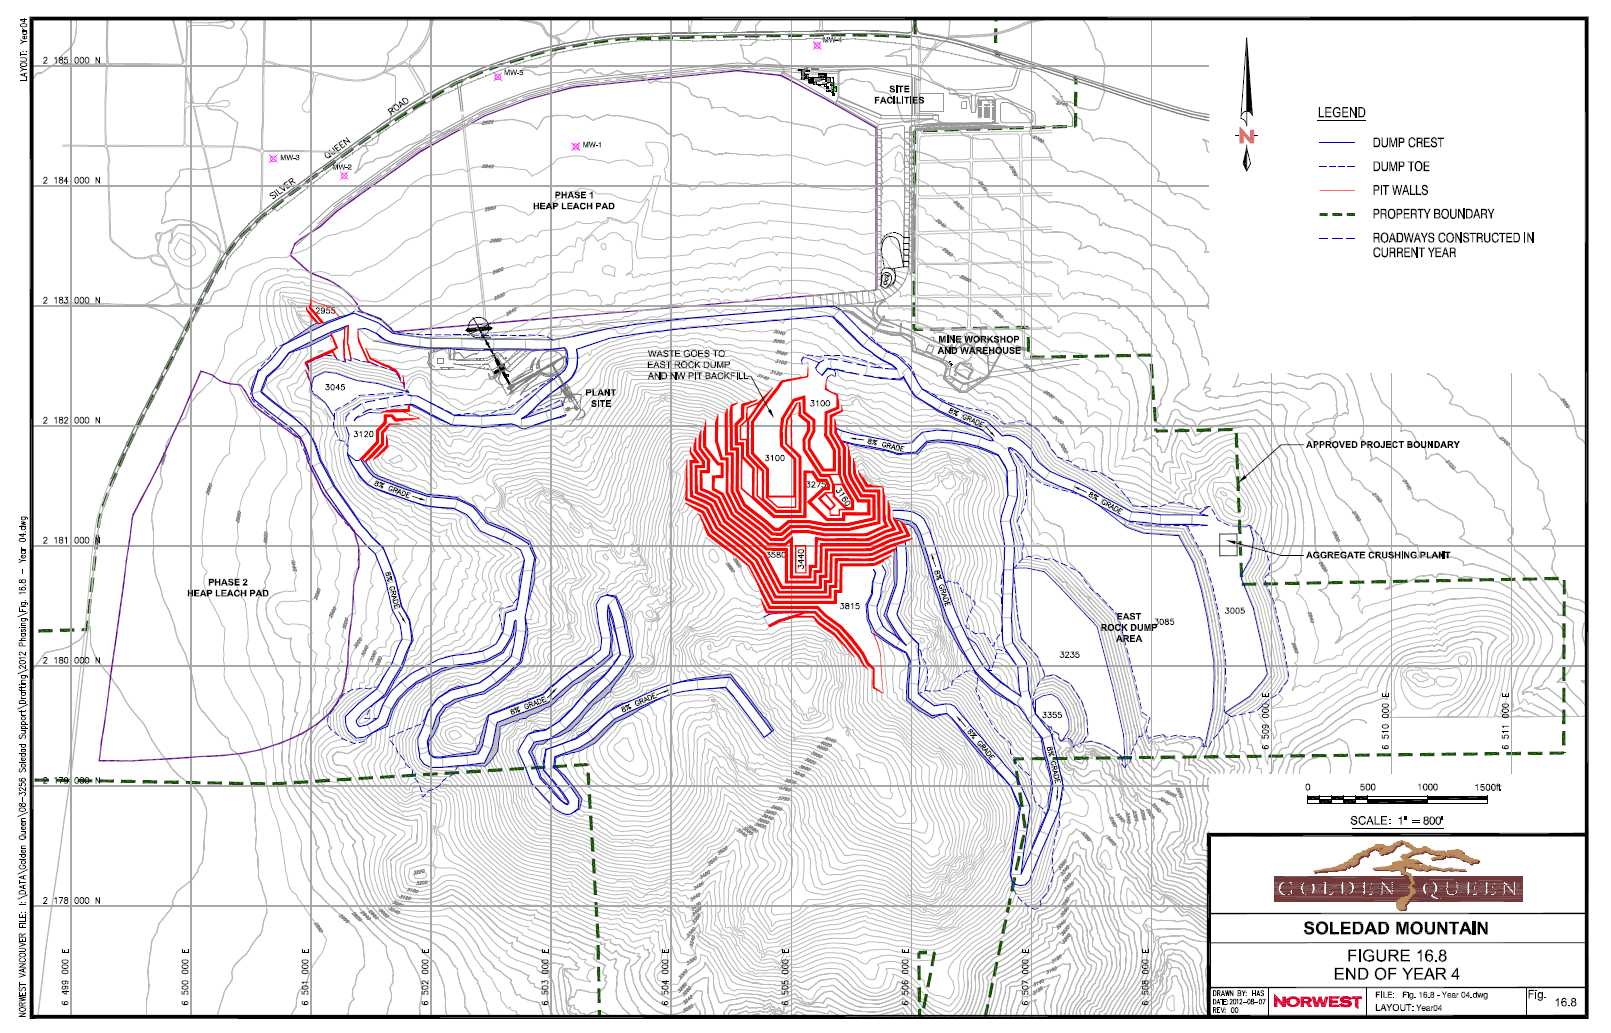
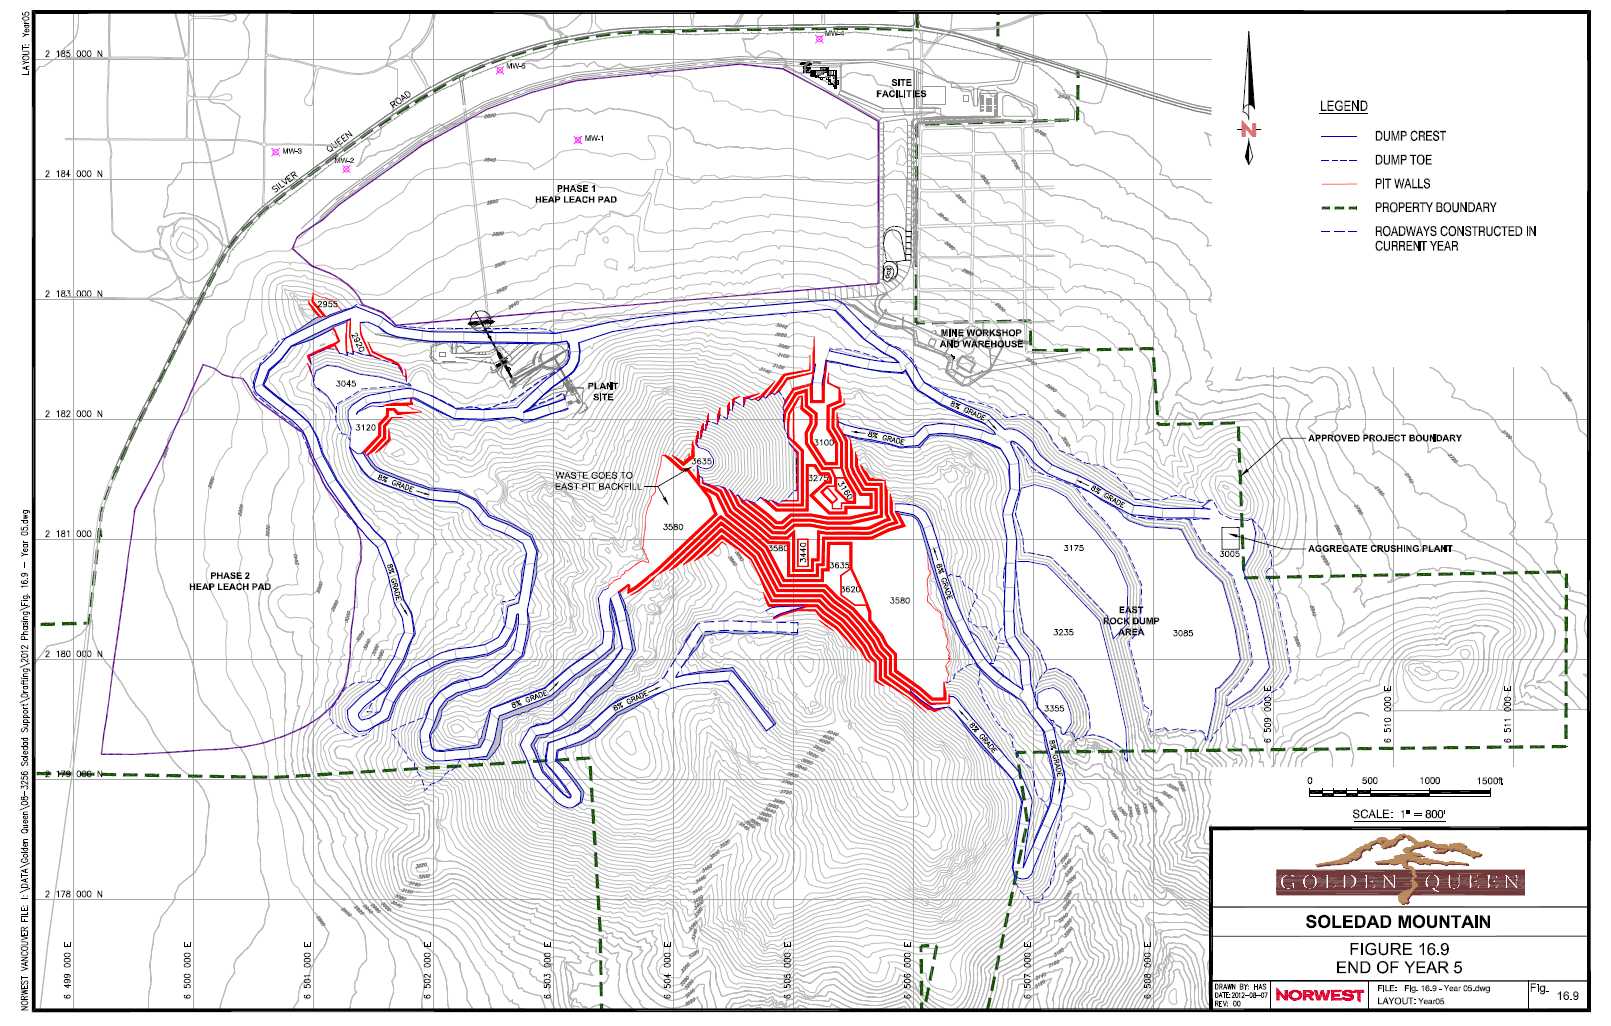
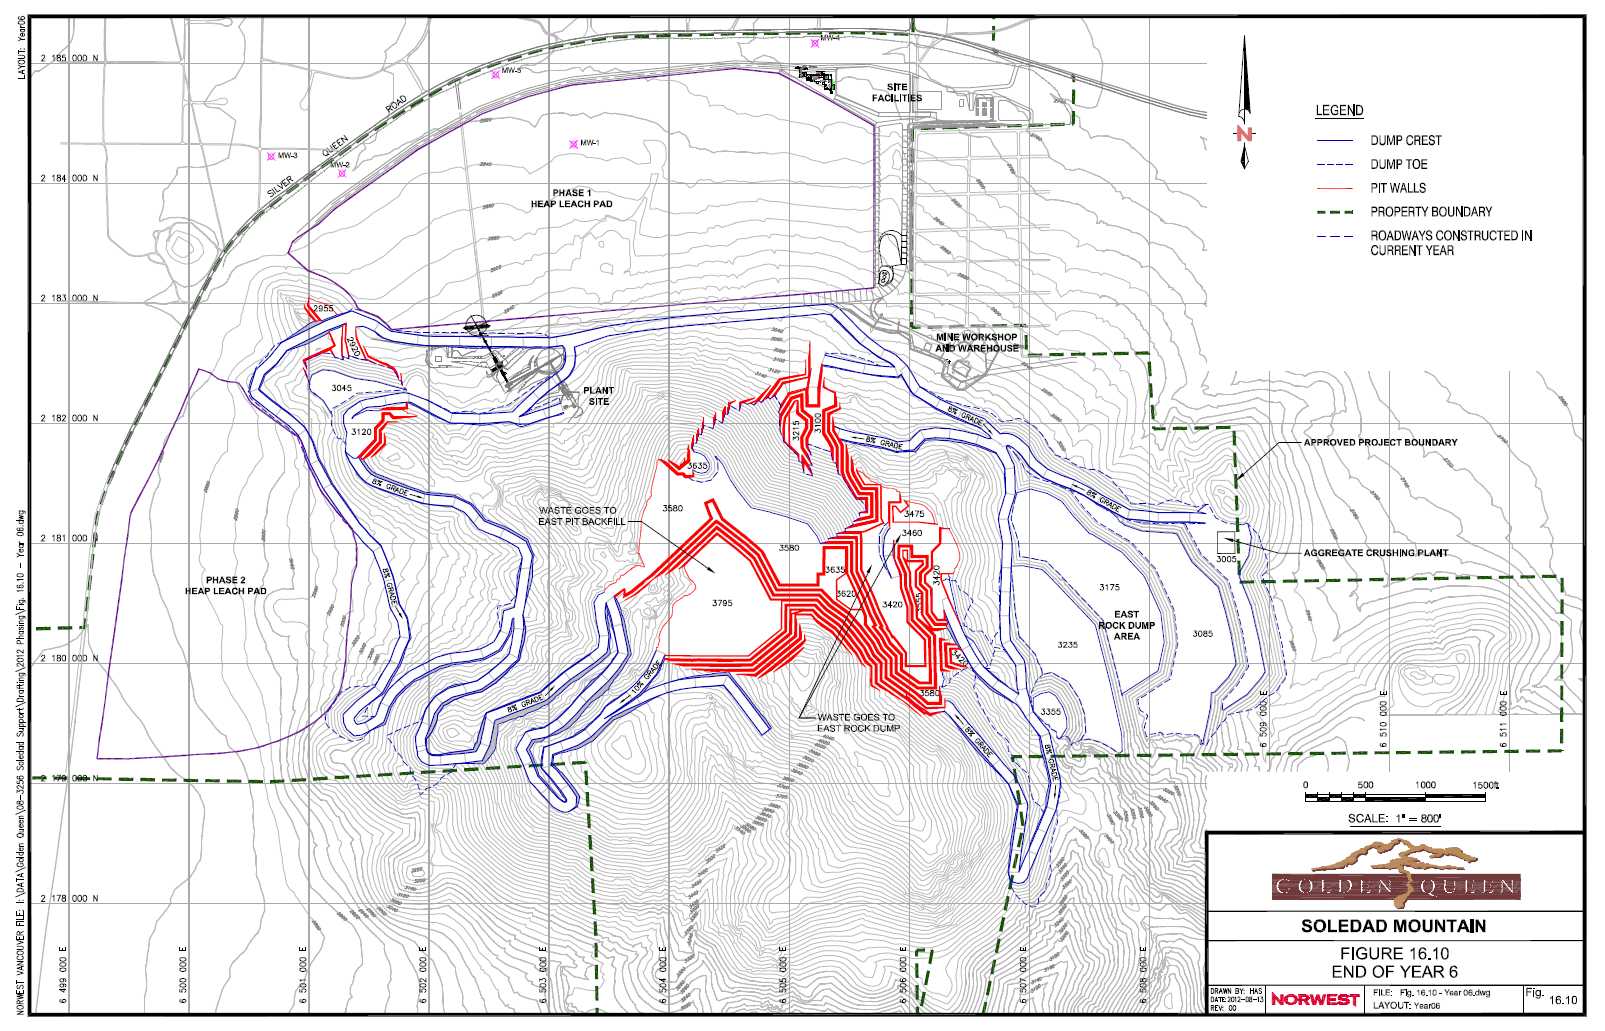
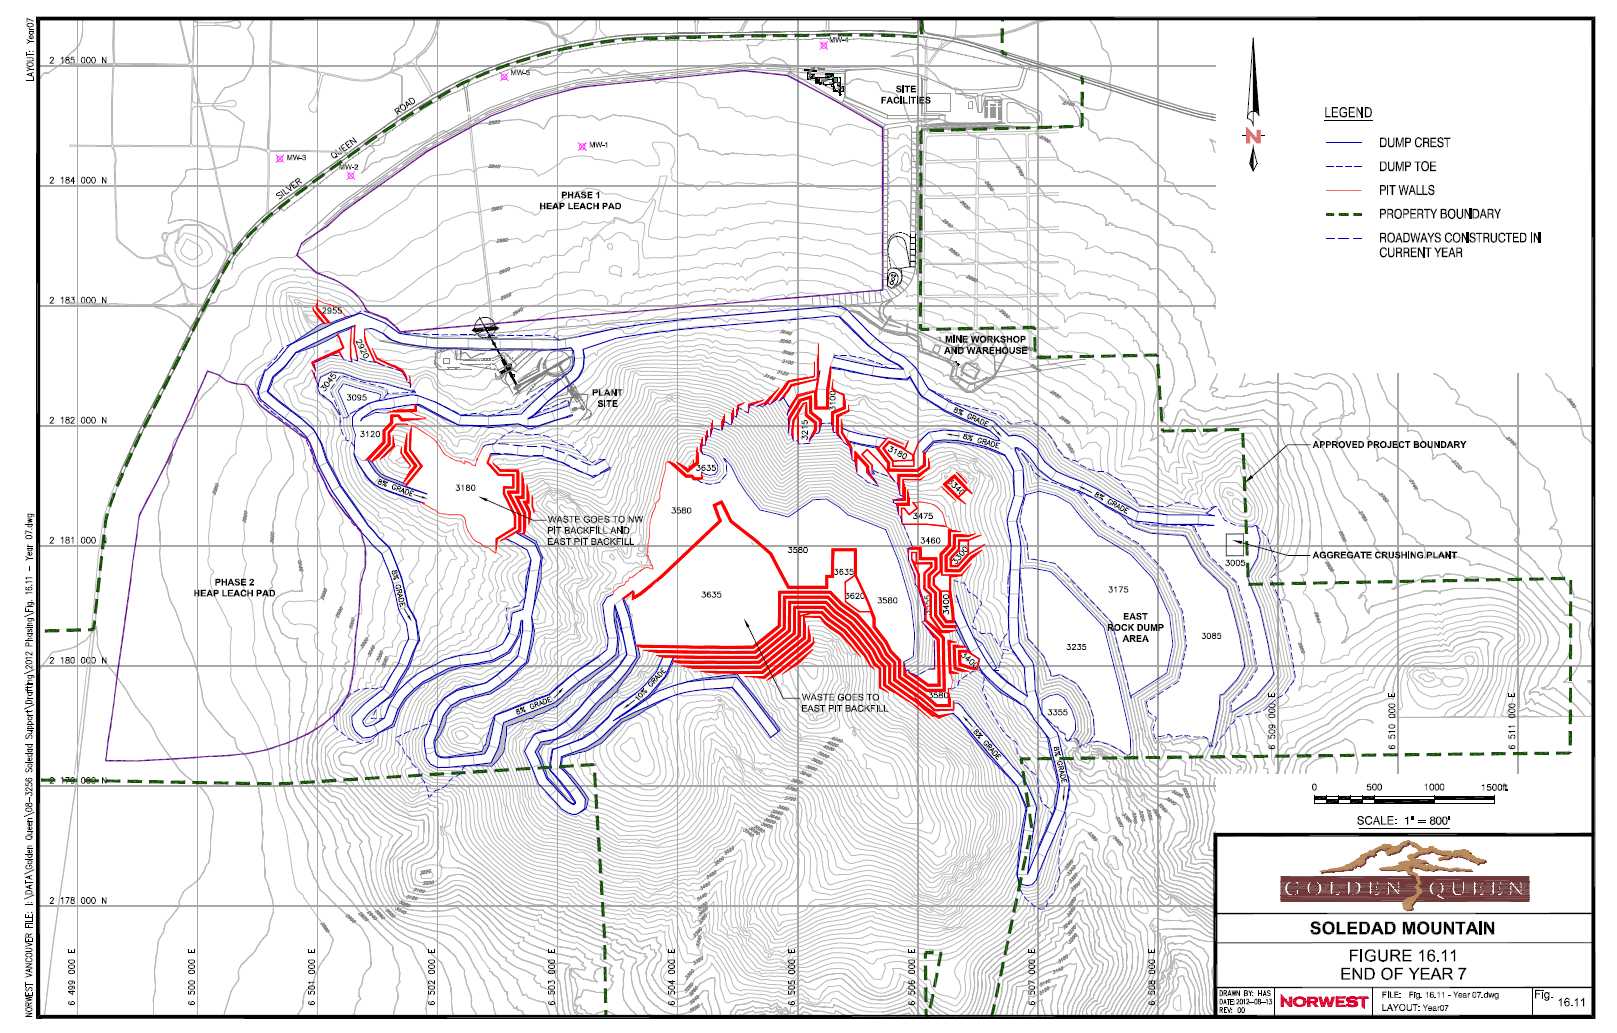
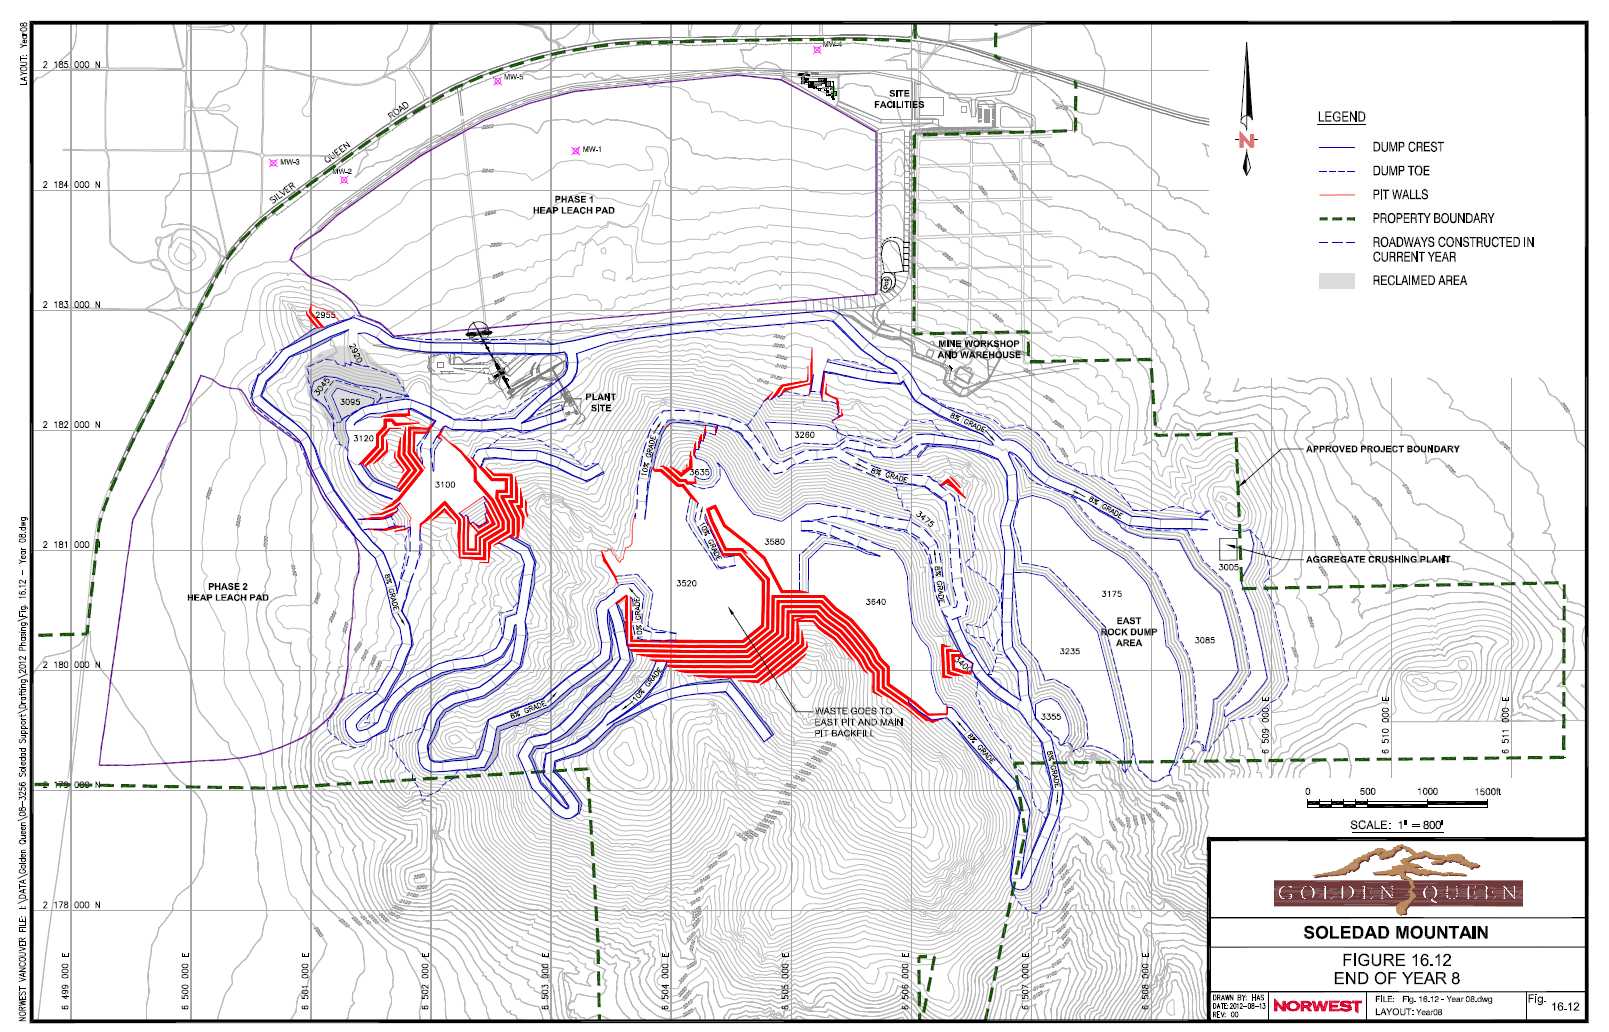
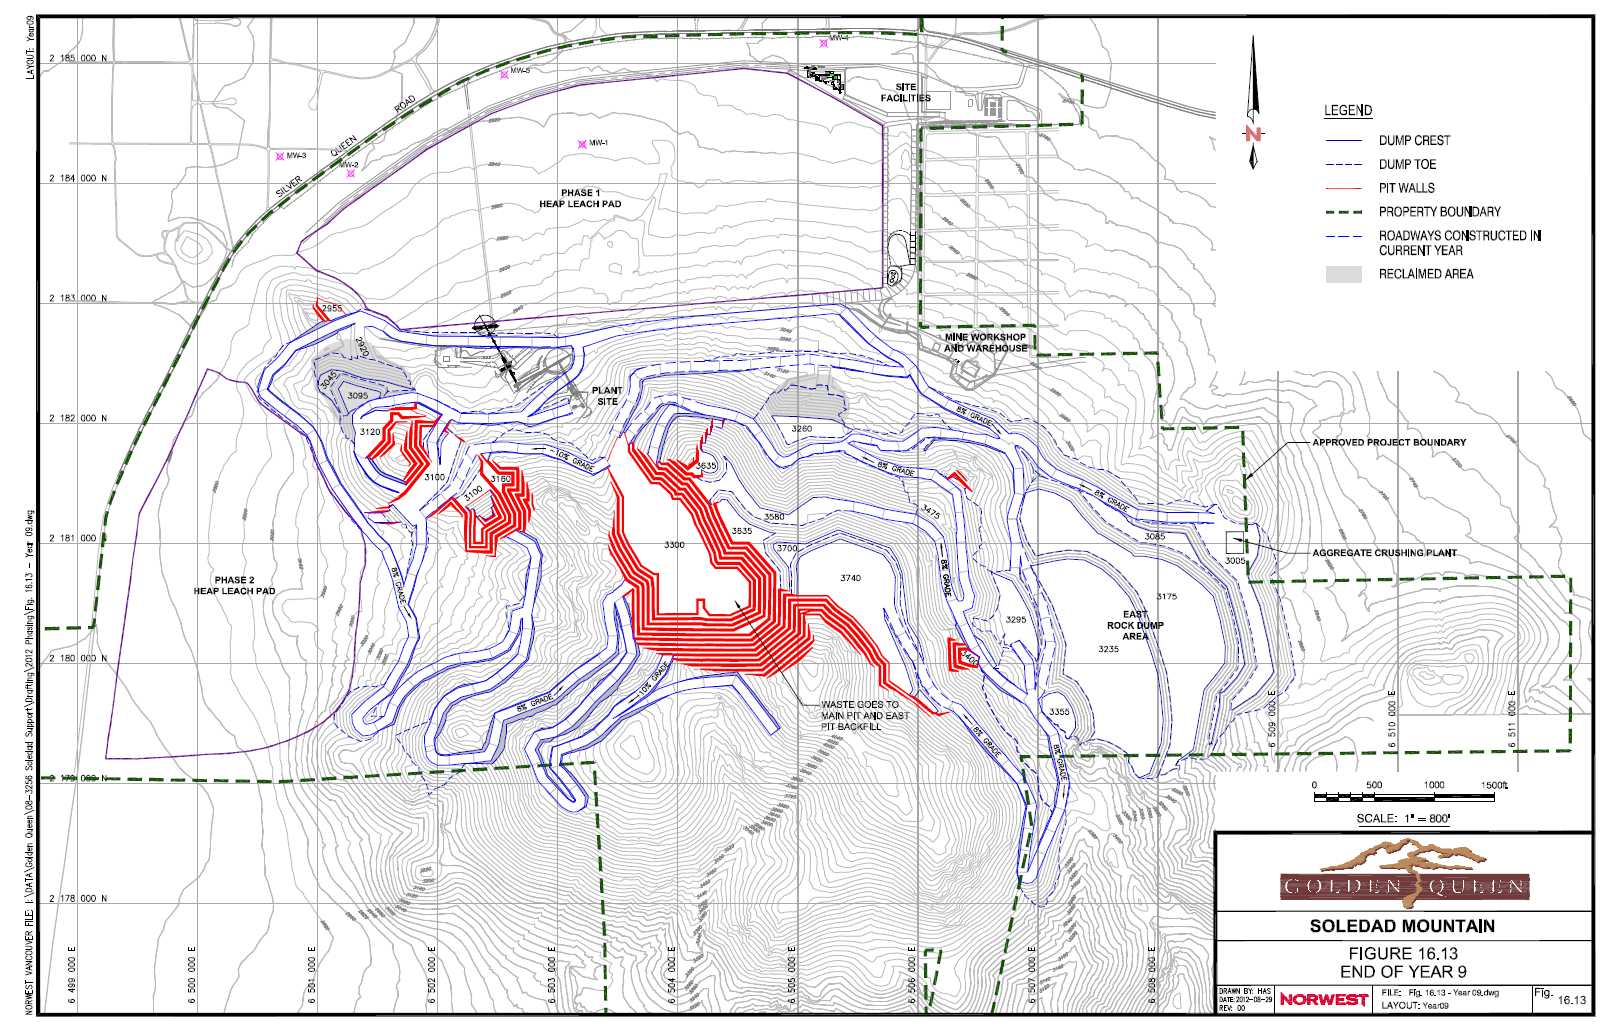
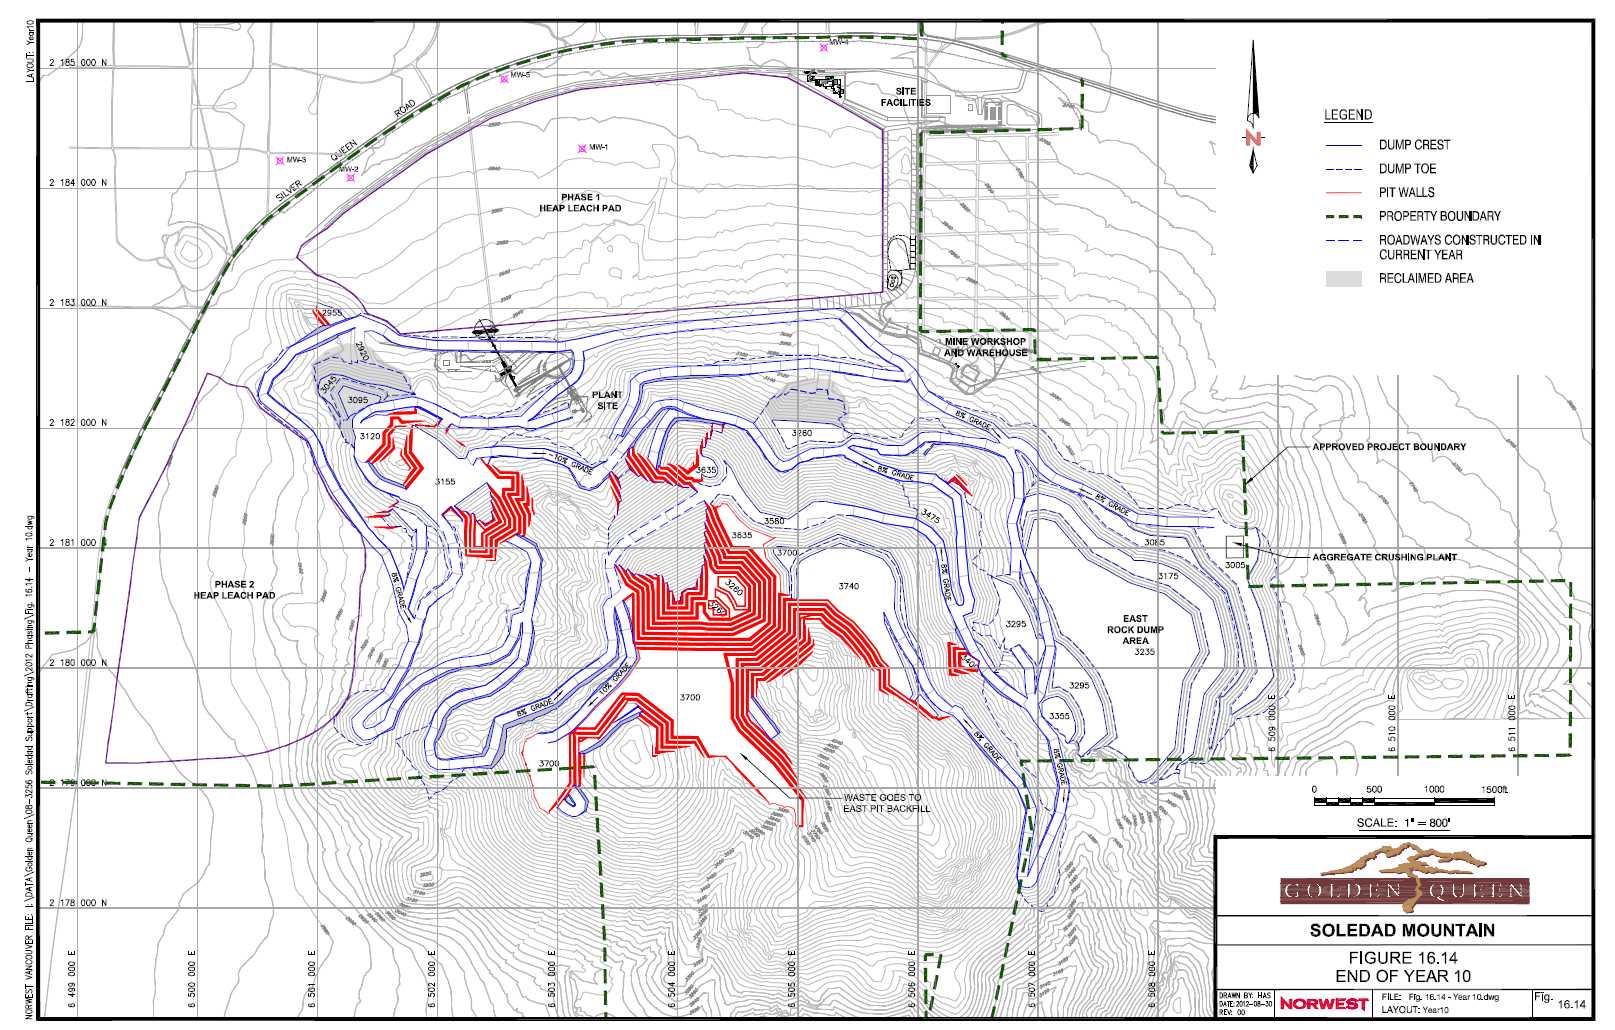
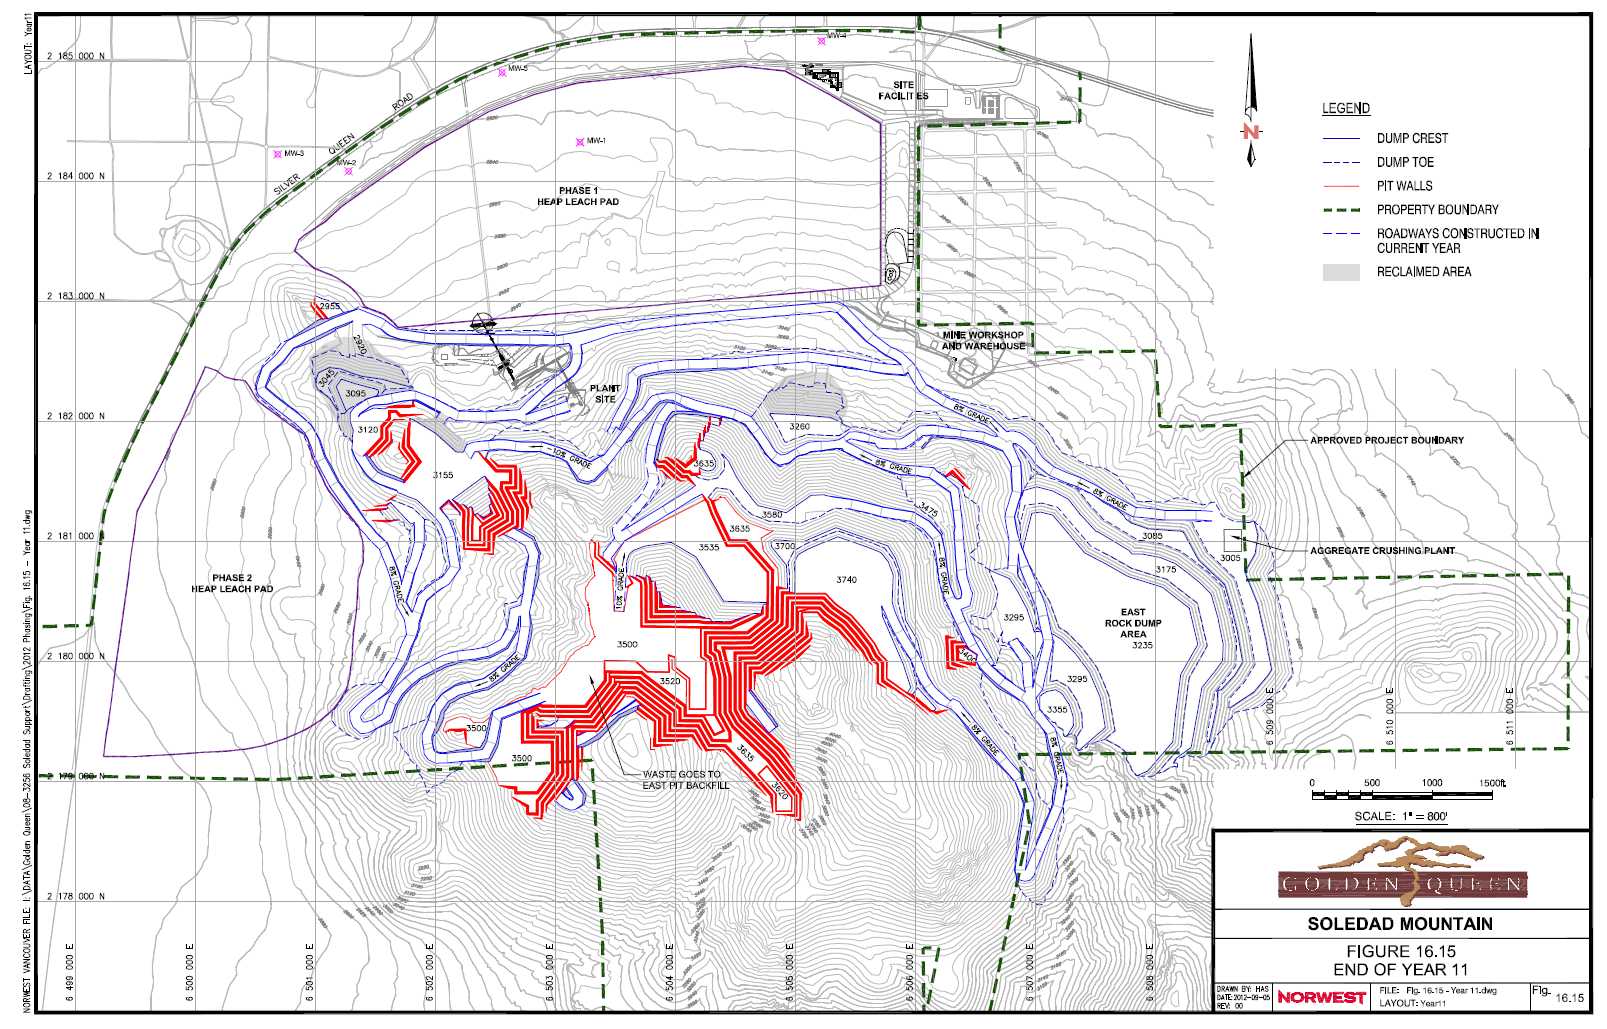
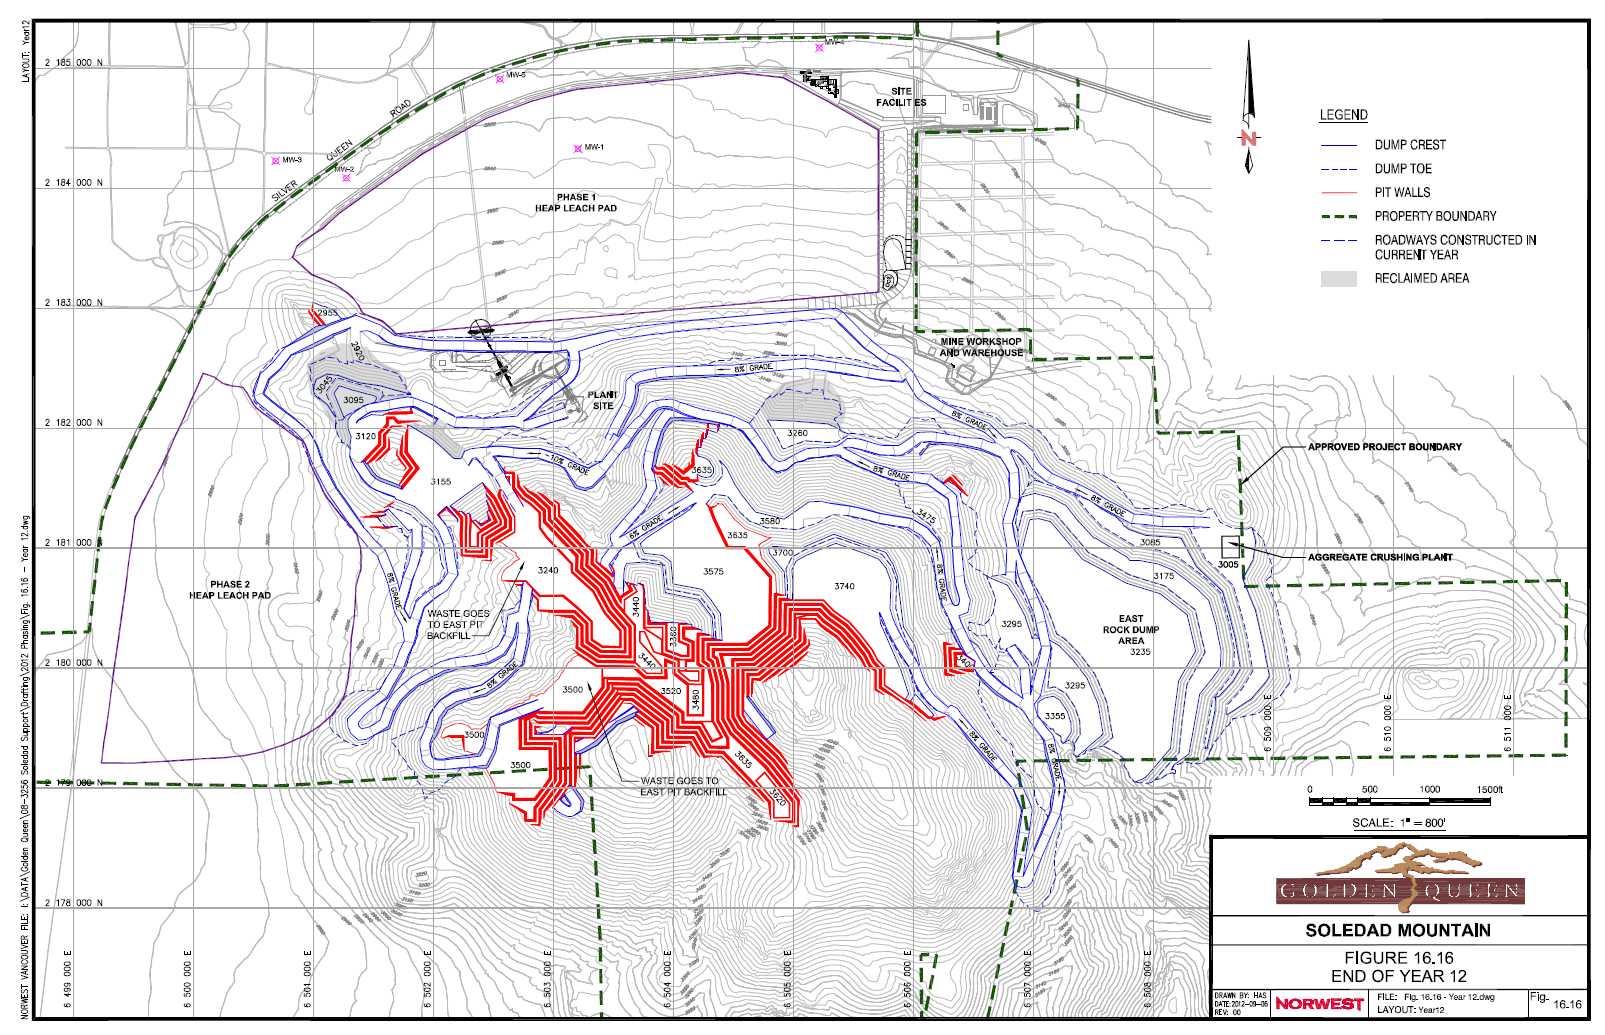

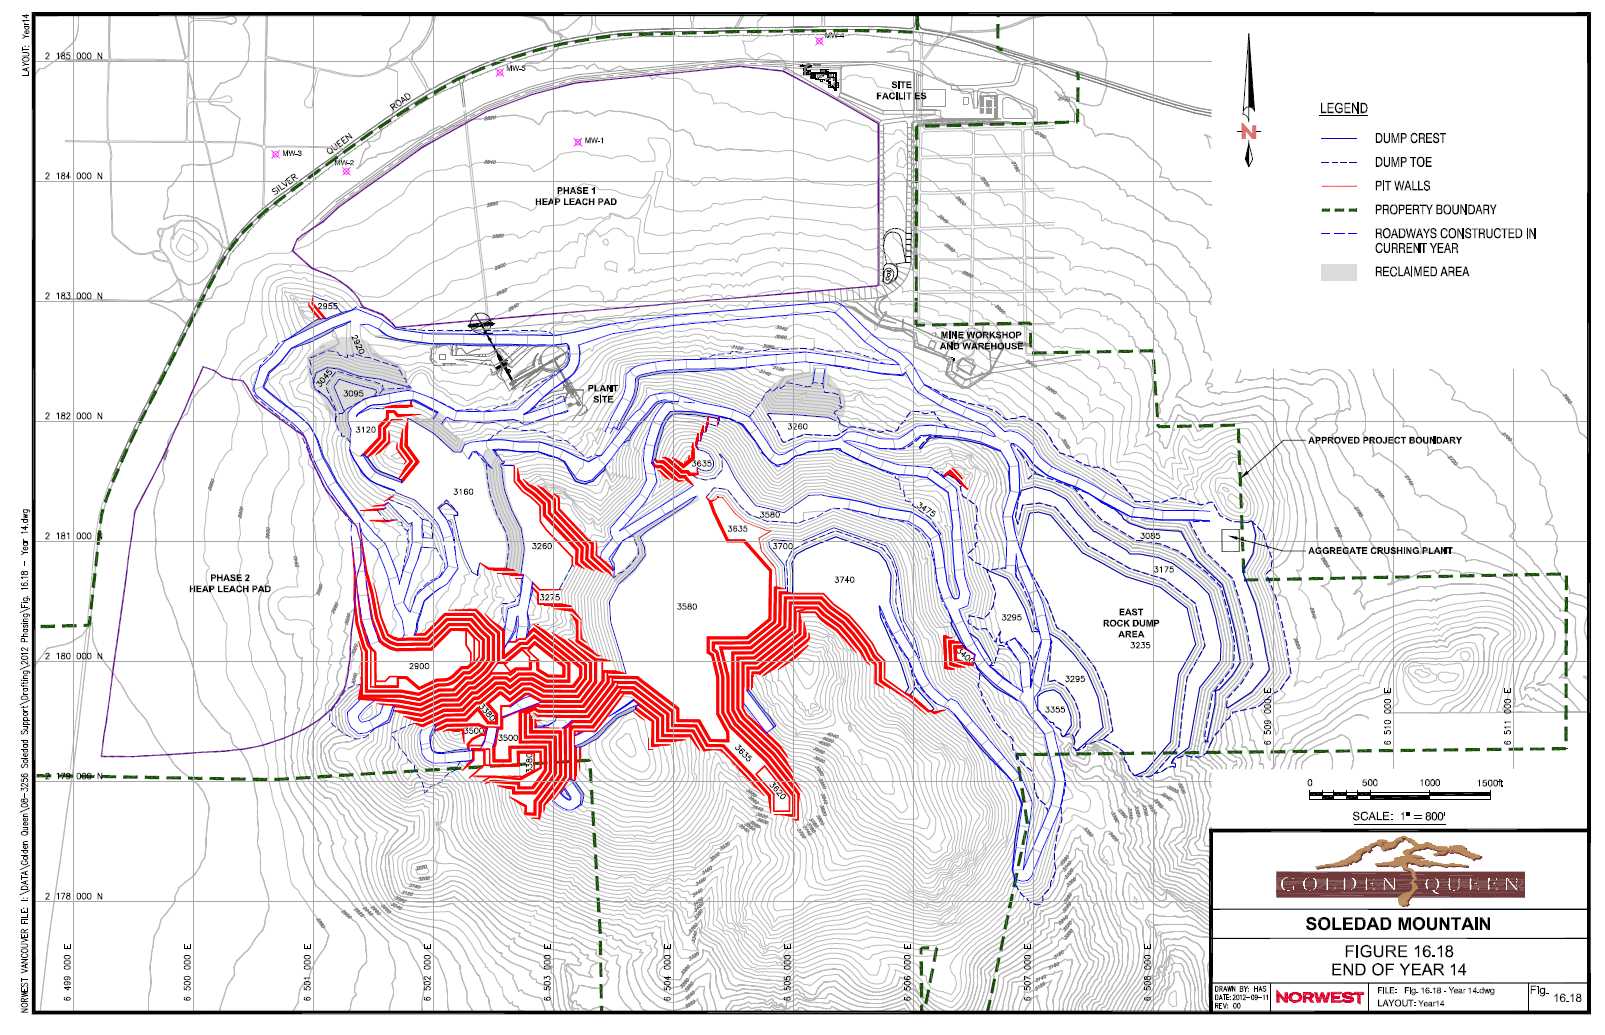
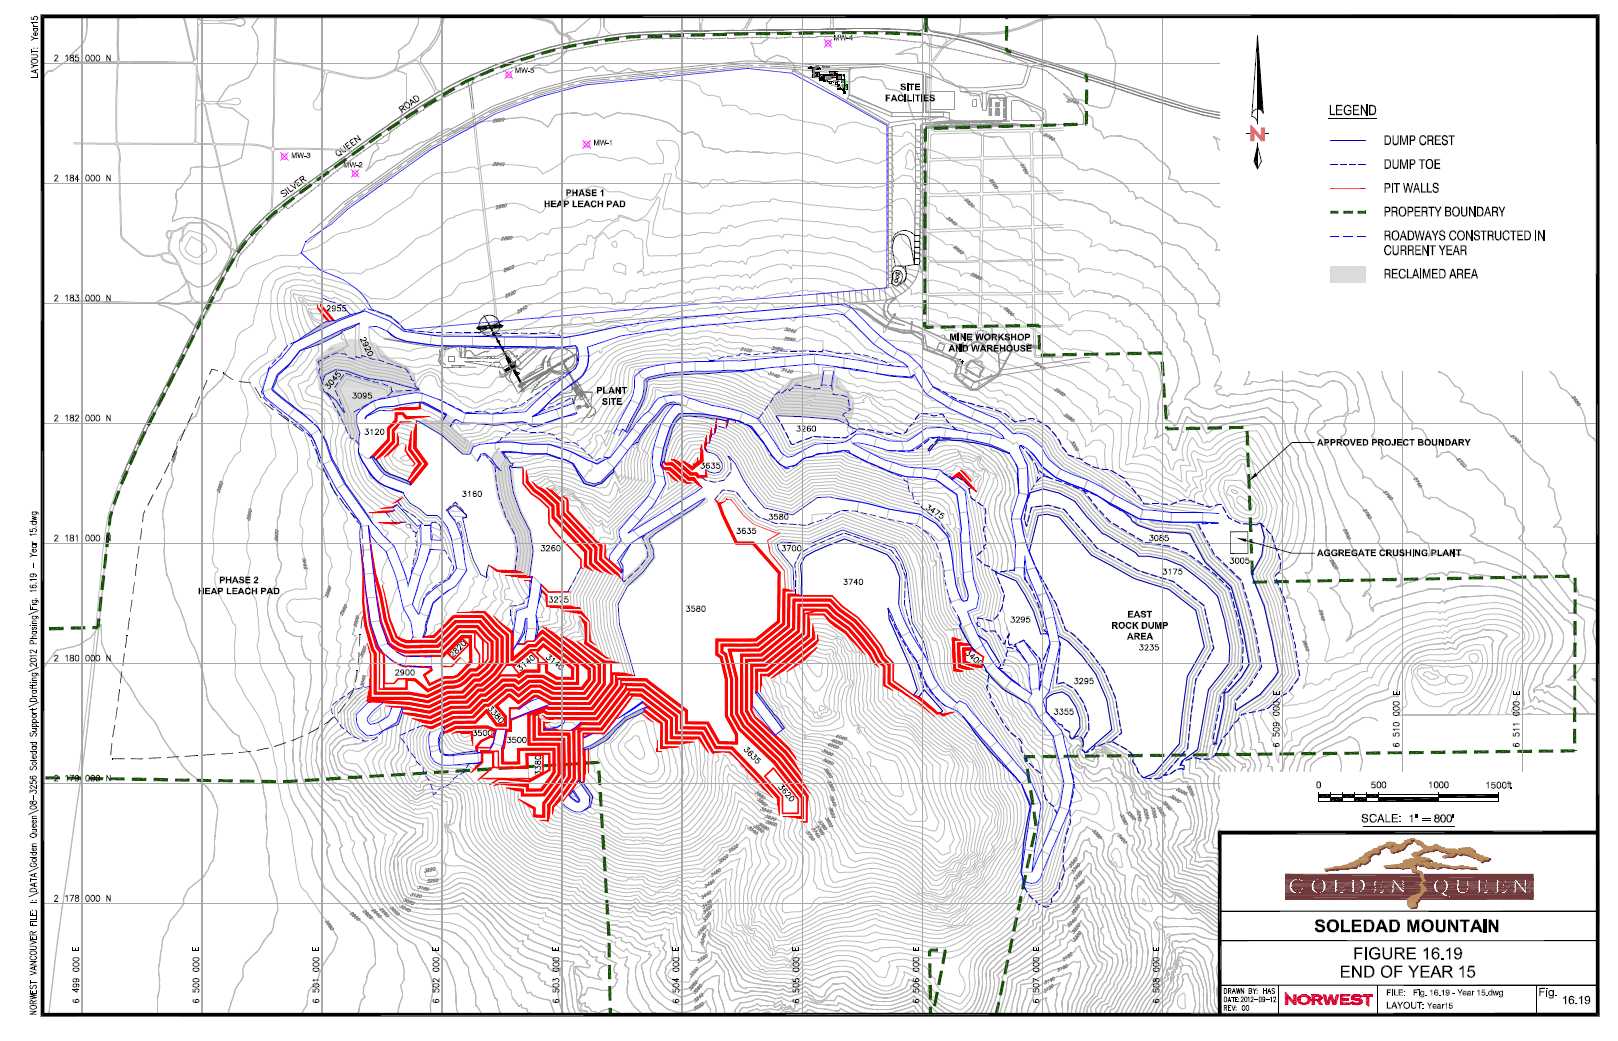
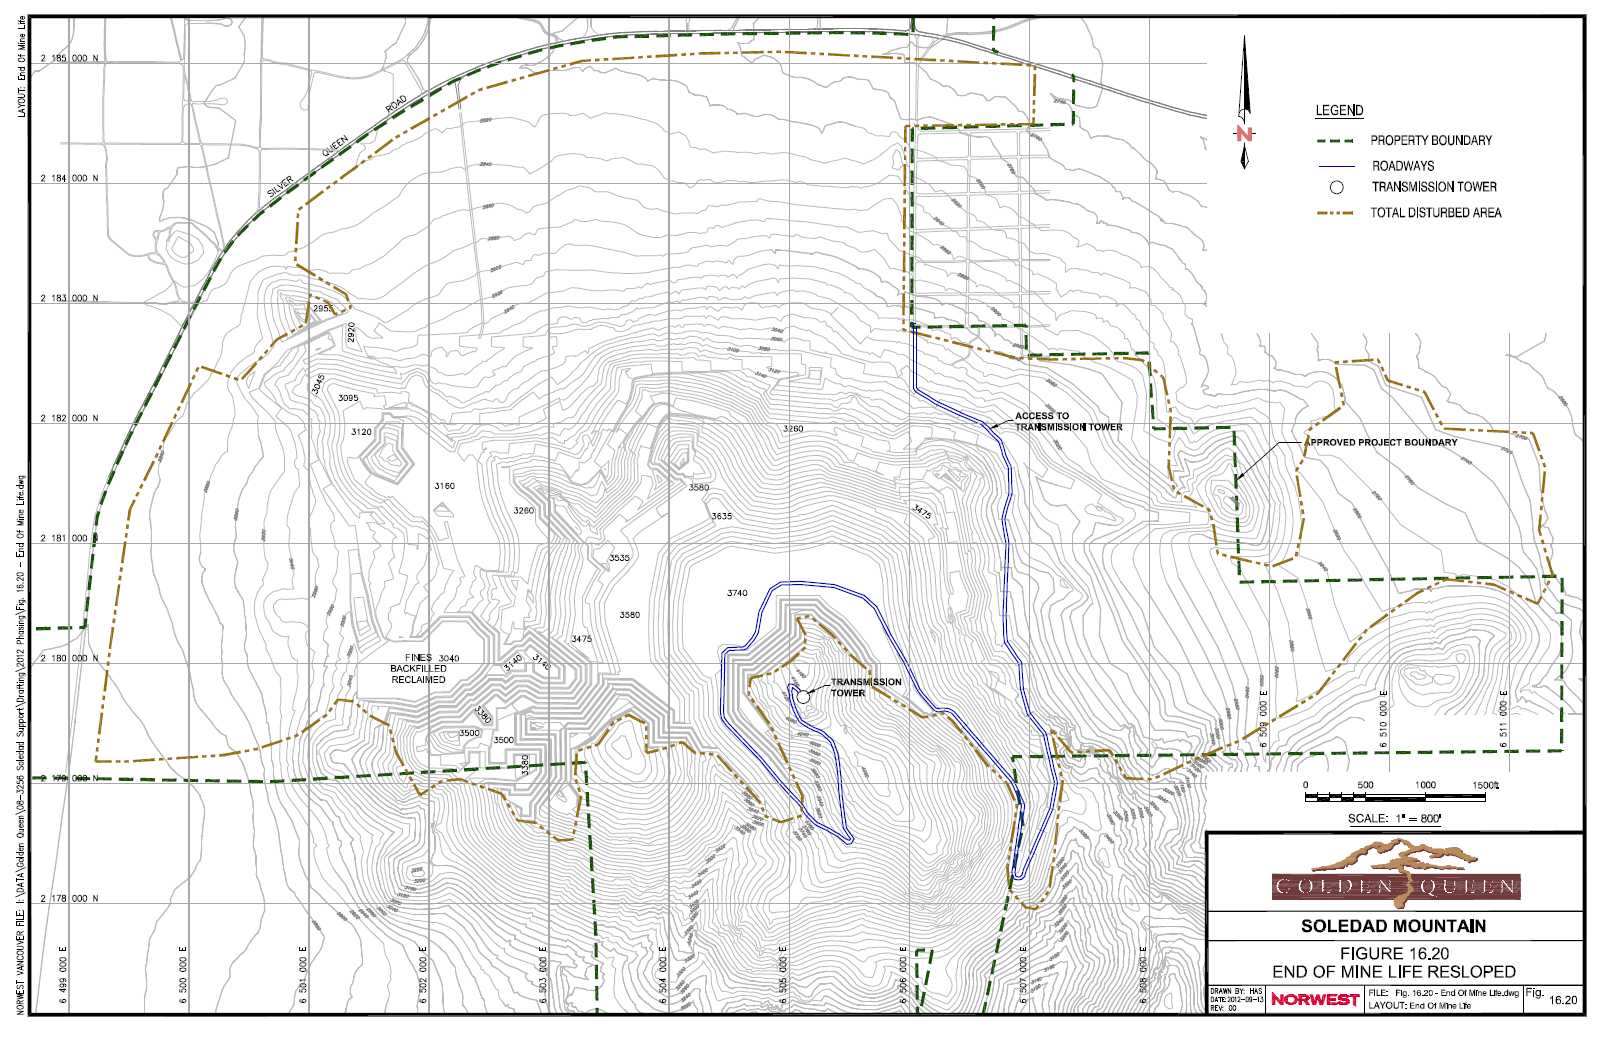
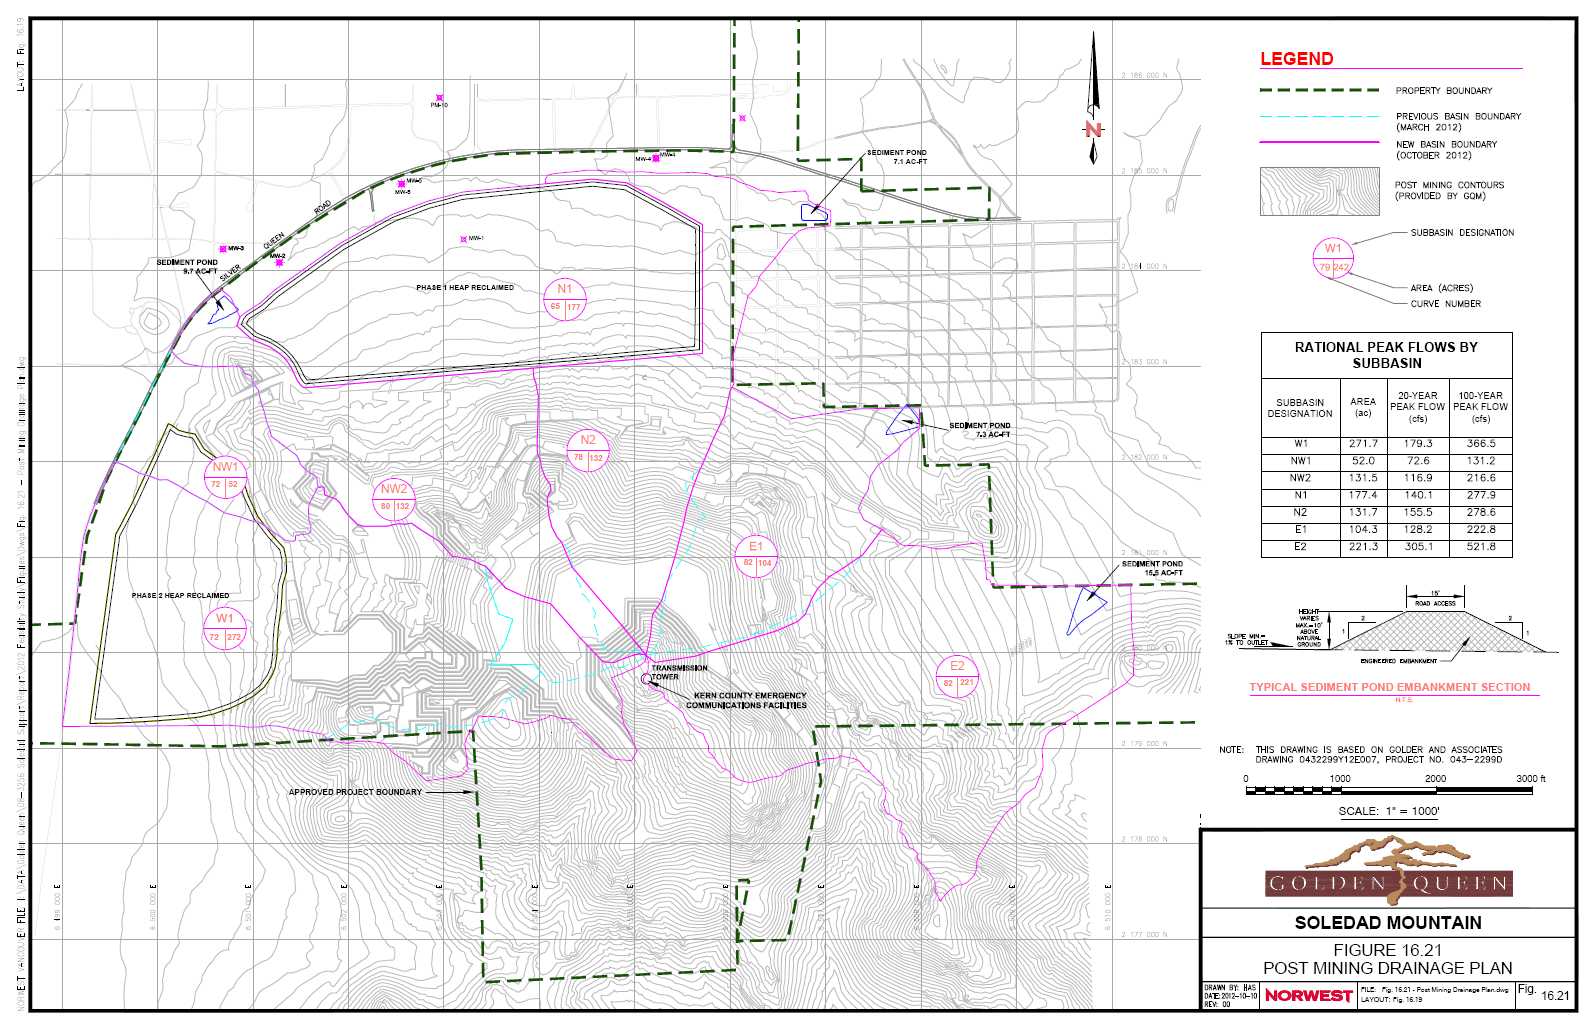
| Soledad Mountain Project
Kern County, CA, USA
Technical Report |
| 17 | MINERAL PROCESSING AND ORE HANDLING |
17.1 Process Flow Sheet
The operation will be an open pit, gold-silver heap leach operation. Process development, metallurgical test work and the recovery analyses for gold and silver are described in Section 13. The crushing-screening plant, the Merrill-Crowe plant and the assay laboratory are described in Section 17. Other equipment required for the operation such as the conveying and stacking system is described in Section 18.1.3 and solution management is described in Section 18.2.
The flow sheet for the crushing-screening plant is shown in Figure 17.1.
17.2 Crushing and Screening
17.2.1Ore Handling Overview
Run-of-mine ore will be delivered to the crushing-screening plant located south of the Phase 1 heap leach pad.
Ore will be fed directly to the primary crusher when possible; otherwise the ore will be stockpiled adjacent to the primary crusher or in temporary stockpiles within or adjacent to the open pits. When ore is not being mined, a front end loader will reclaim the ore from the stockpile and feed it to the primary crusher.
Crushed ore will be conveyed to a coarse ore stockpile. This will allow a more steady flow to the primary screen and secondary crusher and the HPGR. The HPGR discharge will be conveyed to a fine ore stockpile and then conveyed by overland conveyor to a stacker and placed on one of two heap leach pads. Agglomeration of the ore will be achieved with plows on the first three of the grass hopper conveyors.
17.2.2Crushing-Screening Plant
AMEC Americas Limited (AMEC), an engineering company with extensive experience in the design of crushing-screening plants, has completed a detailed design of the crushing-screening plant and this is shown in plan and section in Figure 17.2 (AMEC, 2011).
Allowance has been made in the design of the crushing-screening plant for two seven-day shutdowns per year to replace the HPGR tires. This therefore allows for 351 operating days per year. The mechanical availability of the HPGR is expected to be <95% and the operating availability of the secondary crushing-screening plant and HPGR is expected to average a minimum of 85%. The assumed overall availability for the crushing-screening plant is only 81.7% and this can be achieved with standard maintenance practices. The number of operating hours available for the crushing-screening plant is 7,160 h/y.
| October 2012 | 17-1 | |
| Soledad Mountain Project
Kern County, CA, USA
Technical Report |
The primary crusher will not be operating once the coarse ore stockpile is full, e.g. when the crushing-screening plant is down for maintenance. The maximum feed rate to the primary crusher is 800 t/h (880 ton/h) as per the AMEC design. The required feed rate to the primary crusher based upon a production rate of 4,654,000 t/y (5,119,000 ton/y) and 18 hours of crushing per day for 351 d/y is 737 t/h (811 ton/h). The number of operating hours available for the primary crusher is 6,318 h/y.
Note that the size of the primary jaw crusher will be reassessed and increased in throughput capacity before the start of construction to provide greater flexibility to the ore haul. An increase in the size and capacity of the jaw crusher will only entail a nominal increase in capital costs for the crusher and will not significantly affect capital costs for the crusher system.
Two hours will be required per crushing-screening plant operating day for heap conveyor and stacker moves - estimated at 597 h/y. Major conveyor and stacker moves will be scheduled to coincide with downtime in the crushing-screening plant for maintenance. The number of operating hours available for the heap conveyors and stacker is 6,563 h/y.
The following are the key design and operating parameters:
| Available hours in a full year of production | h | 8,760 |
| Operating time for the primary crusher and coarse ore conveyors | h/y | 6,318 |
| Overall availability of the primary crusher | % | 72.1 |
| Design feed rate to the process | ton/h | 715 |
| Operating time for the crushing-screening plant | h/y | 7,160 |
| Overall availability of the crushing-screening plant | % | 81.7 |
| Operating time for the conveyors and stacker | h/y | 6,563 |
| Overall availability of the conveyors and stacker | % | 74.9 |
Note that the average ore mining rate based upon 351 days of mining per year is 12,000 t/d (13,225 ton/d) or 4.22 million tonnes or 4.64 million tons of ore per year based upon the current Norwest schedule.
The design annual throughput is 4,654,000 tonnes or 5,119,000 tons per year and that is the rate used for the design and quote for construction by Turn-Key Processing Solutions, LLC.
In years of higher ore production, it should be possible to increase the throughput of the plant by adjusting the plant operating parameters. Peak years with production of approximately 5 million tons of ore per year are planned between year 2 to year 6 and year 11 to year 14 of the current schedule.
The crusher settings and screen openings may be adjusted from those given in the following paragraphs during operations and they may vary depending upon the type of ore being crushed.
| October 2012 | 17-2 | |
| Soledad Mountain Project
Kern County, CA, USA
Technical Report |
The following are the key components of the plant:
| | A. | Primary Crusher Station- Run-of mine ore will be delivered to a dump hopper with a capacity of 200 t (220 ton). The dump hopper will be fitted with fine mist sprays to suppress dust. The dump hopper will also have a canopy sufficiently large to permit trucks to permit truck access and to contain dust when ore is dumped. The ore will be withdrawn from the dump hopper by a variable speed, vibrating grizzly feeder, Oversize ore will be fed to a jaw crusher. Oversize rock will be broken using a fixed rock breaker set beside the crusher feed opening. Grizzly undersize and jaw crusher product will be conveyed to a coarse ore stockpile. |
| | | |
| | B. | Coarse Ore Stockpile- To the extent practical the crushing-screening plant has been buffered from the mining and heap conveying-stacking operations by providing stockpiles (the coarse ore stockpile and the fine ore stockpile) which provide surge capacity. The coarse ore stockpile has a live capacity of 7,500t (8,250 tons) which provides feed for a half day of plant production. |
| | | |
| | C. | Coarse Ore Feeders- Ore will be fed to the primary screen by two Syntron-type vibratory feeders located in the reclaim tunnel. The number of feeders has been selected to ensure adequate live capacity in the coarse ore stockpile. Access to the feeders under the coarse ore stockpile is available from two directions for maintenance and cleanup. |
| | | |
| | D. | Secondary Screen- The secondary crushing stage, which includes the primary screen and the cone crusher, has been specifically designed to prepare the feed for the HPGR. A single screen will be required and this will operate in closed circuit with the cone crusher. The screen undersize is 32 mm (1 ¼ inch) and this will be the HPGR feed. A distributor will be required at the feed point to ensure good distribution of the feed across the width of the screen and this has been included in the design. The screen has also been specified with a dust enclosure. Consistent feed with no oversize are key to a long life of the HPGR tires. |
| | | |
| | E. | Secondary Crusher- A single cone crusher will be required as a secondary crusher. Analysis completed by Sandvik Rock Processing (Sandvik) shows that the model CH660 cone crusher can do the duty and has therefore been selected for the Project. |
| | | |
| | F. | Fine Ore Bin- The screen undersize will be conveyed to a fine ore bin with a capacity of 200t (220 tons). Ore will be drawn from the fine ore bin by a Syntron-type vibratory feeder. |
| | | |
| | G. | Binder Addition- Normal Portland cement will be added as a binder to the feed ahead of the HPGR. The intent is to ensure adequate mixing of the cement with the feed. |
| | | |
| | H. | HPGR- The layout considerations for the HPGR were an important element in the overall layout of the plant and this was done in extensive consultation with Polysius. The HPGR feed conveyor will have a width 1.1 times the width of the HPGR tires, and the feed will flow in line with the rolls to minimize the risk of segregation, as recommended by Polysius. |
| October 2012 | 17-3 | |
| Soledad Mountain Project
Kern County, CA, USA
Technical Report |
| | I. | Fine Ore Stockpile- The fine ore stockpile was included in the circuit to provide flexibility in the operation of the plant. The live capacity of the fine ore stockpile must be large enough to permit the operators to move and reposition the heap conveyors and the stacker every day without interrupting the operation of the plant and especially the HPGR. The current estimate is that repositioning of the heap conveyor-stacker system will require two hours per day on average. The fine ore stockpile will have a minimum live capacity of 3,000 t (3,300 tons) which provides capacity for approximately four hours of plant production |
| | | |
| | J. | Weightometers- A weightometer will be installed ahead of the secondary screen and cone crusher to control the feed to the screen and the cone crusher and to record the total throughput. The weightometer will be installed in the conveyor tunnel. Additionally a weightometer will also be installed ahead of the HPGR to control cement addition and water addition rates. |
| | | |
| | K. | Self-cleaning Magnets- Self-cleaning magnets and metal detectors will be installed to protect the coarse ore stacker conveyor, the primary screen and cone crusher and on the HPGR feed conveyor to protect the HPGR. |
17.2.3Description of the HPGR
Assessments carried out by Polysius and GQM’s internal review have shown the indicated benefits of using the HPGR could include:
| | • | Higher gold and silver recoveries due to the formation of micro-cracks in ore particles. |
| | | |
| | • | Faster gold and silver extraction rates. |
| | | |
| | • | Stronger agglomerates due to a more favorable overall particle size distribution and this will also impact the flow rate of solutions through the heap. |
| | | |
| | • | Substantially lower capital costs than a four-stage, conventional crushing-screening plant. |
| | | |
| | • | Manageable dust control with fewer transfer points. |
| | | |
| | • | Lower energy consumption and thus lower operating costs. |
| | | |
| | • | Circuit flexibility that will readily permit future upgrades such as a finer HPGR feed size or the recycle of edge product. |
The HPGR consists basically of two counter-rotating rolls – one a fixed roll and the other a ‘floating’ roll. The ‘floating’ roll is mounted on and can move freely on two slides and the grinding forces are applied by four hydraulic rams. Ore is choke-fed to the gap between the rolls and comminution takes place by inter-particle crushing in the bed of particles. The gap between the rolls is determined by the nip-in characteristics of the feed and the total grinding force applied, which in turn depends upon the pressures in the hydraulic system. Each roll is driven by an electric motor via a planetary gear reducer.
| October 2012 | 17-4 | |
| Soledad Mountain Project
Kern County, CA, USA
Technical Report |
The total grinding force can range from 750 kN to 20,000 kN and pressures in the gap can range from 50MPa (approximately 7,000 lb/in2) to 250 MPa (approximately 36,000 lb/in2). The unconfined compressive strengths of Soledad Mountain ores range from 2.2 MPa (320 lb/in2) to 118.9 MPa (17,200 lb/in2) by comparison.
Comminution in the HPGR is achieved without impact and essentially without attrition of the wear protection on the surface of the rolls.
The HPGR is an energy efficient comminution device and power consumption will be lower than power consumption projected in the 1990s.
17.2.4Sampler
A sampler will be fitted to the discharge end of the HPGR product conveyor. The HPGR product will be sampled on a frequent basis to provide ore grade information and the information required to monitor the following performance parameters of the HPGR:
| | • | HPGR product particle size distribution. |
| | | |
| | • | HPGR product moisture content. |
| | | |
| | • | Gold and silver head grades. |
17.2.5Construction and Commissioning of the Crushing-Screening Plant
A design-build concept will be considered in an effort to reduce the capital cost of the project. Note that a contractor, Turn-Key Processing Solutions, LLC, has provided a quotation for construction of the crushing-screening plant based upon the design done by AMEC.
The crushing-screening plant is a relatively simple plant and it is expected that it can be commissioned by the operators with the assistance of Turn-Key Processing Solutions, LLC, equipment suppliers and specifically Polysius. An allowance for this support has been included in the capital cost estimates.
17.2.6Manpower Required
Management will consist of 1 plant operations manager who will work 8 h/d for 5 d/week. The operating crew will consist of 2 plant operations foremen and 4 primary crusher operators, 4 crushing-screening plant operators and 4 helpers who will work a continuous shift schedule.
| October 2012 | 17-5 | |
| Soledad Mountain Project
Kern County, CA, USA
Technical Report |
17.3 Merrill-Crowe Plant
17.3.1Merrill-Crowe Process
Gold and silver are typically recovered by dissolution in a dilute sodium cyanide solution and then by precipitation with zinc or adsorption on activated carbon. The zinc precipitation process, referred to as the Merrill-Crowe process after its developers, is used to recover gold and silver when the silver to gold ratio is greater than 10:1. This ratio is expected to average 11:1 for the Project (range 1:1 to 17:1) and ratios greater than 30:1 were noted in recent test work. The Merrill-Crowe process is well established and the process is highly efficient.
In the Merrill-Crowe process, suspended solids and dissolved oxygen must first be removed from the pregnant solution. Clarifying filters are used to remove the suspended solids to less than 1 ppm. Zinc dust is metered into the deaerated solution and combines with the cyanide in a rapid, cementation-type reaction and gold and silver are precipitated as micron-sized particles of metallic gold and silver.
After precipitation, the dilute slurry is pumped to plate and frame filters where the gold and silver particles are removed. These filters are located in the refinery and this is where all subsequent processing takes place. Any mercury present in pregnant solution is precipitated with the gold and silver. The gold and silver precipitate is removed manually from the presses and stored in the mercury retort pans. Then the precipitate is heated in the mercury retort where water and mercury vapours are condensed and collected in the retort condensing system and the mercury trap. The dried precipitate is mixed with selected fluxes, typically silica, borax and soda ash and melted in an induction furnace. Impurities in the melt combine with the fluxes to form slag. Slag is tapped as required and poured into slag pots. Slag is cooled and crushed and occluded particles of gold and silver are recovered by gravity for further processing. The molten mix of gold and silver, i.e. the dorè, is poured into molds. Dorè is cooled, cleaned and shipped to a commercial refinery where gold and silver bullion are produced for sale.
The barren solution is pumped to the barren solution tank and is returned to the heap.
17.3.2Merrill-Crowe Plant
Kappes, Cassiday & Associates (Kappes, Cassiday), an engineering company with extensive experience in process development and the design of processing plants, has completed a detailed design and prepared capital and operating cost estimates for the Merrill-Crowe plant (Soledad Mountain Project, Merrill-Crowe Plant, Engineering and Cost Estimate Study, updated by Kappes, Cassiday & Associates, , Project No: 456H, August 10, 2012).
The plant has been designed for a pregnant solution flow rate of 450 m3/h (2,000 gal/min).
Provision has been made in the design of the plant for containment of spills. The liner under the plant will be seamlessly connected to the overflow pond liner for containment in case of a spill.
| October 2012 | 17-6 | |
| Soledad Mountain Project
Kern County, CA, USA
Technical Report |
A mercury retort has been included in the Merrill-Crowe plant as required for environmental control and also required by the Conditional Use Permits issued by Kern County and the Authority to Construct Permits issued by the Eastern Kern Air Pollution Control District. The mercury retort exhaust fumes are cooled and flow to a sulfonated carbon bed scrubber for PM10 and mercury emissions control. The melting furnace exhaust fumes flow via a collection hood and flow to a wet scrubber and then to a sulfonated carbon bed scrubber for PM10 and mercury emissions control.
The location of the Merrill-Crowe plant within the site footprint is shown in Figure 11.2 with the floor plan of the plant shown in Figure 17.3. Ready access for the bulk delivery of reagents is a key concern and this has been allowed for in the layout of the site access road to the plant.
17.3.3Construction and Commissioning of the Merrill-Crowe Plant
GQM plans to have the Merrill-Crowe plant constructed and commissioned on a turn-key basis.
17.3.4Delivery of Reagents and Use of Reagents
The following is a list of the reagents that will be used with indicated rates of use:
| | A. | Cyanide- The cyanide will be delivered as a 30% aqueous solution with a pH of 12.5 in a tanker truck directly from the producer’s plant. The contained weight of sodium-cyanide (NaCN) in solution will be approximately 6,800 kg (15,000 lb) per load. The cyanide solution will be transferred to a 175 m3(approximately 45,000 gal) storage tank on site. The producer will supply and install a complete handling and storage system and this will include telemetry for a managed inventory. |
| | | |
| | B. | The bulk of the cyanide will be added to the barren solution to adjust the cyanide concentration. Smaller quantities of cyanide will be added to the clarified pregnant solution to aid in zinc cementation as well as to the recycled intermediate solution on the heap. Estimated consumption is 0.39 lb/ton of ore on the heap. |
| | | |
| | C. | Zinc Dust- Zinc dust in the form of Merrillite or equivalent will be added as a dry powder to the zinc cone just downstream of the deaeration tower. Estimated consumption is 1.0 oz zinc /oz of combined gold plus silver in the pregnant solution. |
| | | |
| | D. | Lead Nitrate- Lead nitrate will be added to the leach solution only if required. If required, lead nitrate would be added to the pregnant solution tank to precipitate soluble sulfides ahead of the clarifiers and zinc precipitation or to the zinc cone to enhance the effectiveness of the zinc dust. If needed, it is estimated that the quantity of lead nitrate would be in the range of 10% to 15% of the weight of zinc used. |
| | | |
| | E. | Antiscalant- Carbonates and some sulfates will precipitate in pipes and pumps. Antiscalants will prevent or minimize the formation of such scale. The supplier of antiscalants will typically provide metering systems for adding the liquid antiscalant at a typical rate of 3 mg/L (3 ppm) to the various solution pump intakes. |
| October 2012 | 17-7 | |
| Soledad Mountain Project
Kern County, CA, USA
Technical Report |
| | F. | Diatomaceous Earth- Diatomaceous earth (DE) will be used as a precoat on filters and as body feed. DE will be delivered in 22 kg (50 lb) bags on pallets. DE will be slurried and pumped to clarifiers, the precipitation presses or the zinc cone as required. The estimated consumption is 1,038 kg/day (2,283 lb/day) at full production only. |
| | | |
| | G. | Binder- Normal Portland cement will be used as a binder and to provide protective alkalinity in the heaped ore. Local suppliers exist and the cement mix can be readily delivered and stored on site. Estimated consumption is 4 kg/t (8.0 lb/ton) of ore on the heap. |
17.3.5Cyanide Consumption
The most recent estimate of cyanide consumption of 0.185 kg/t (0.37 lb/ton) of ore was made by Herb Osborne, independent metallurgical consultant, in 2005. The data collected since the 2005 work suggests that the consumption may be slightly higher than this estimate. Test work during the past three years was examined by Paul Chamberlin. Bottle roll tests, as performed by McClelland Laboratories, give a fairly good estimate of cyanide consumption in commercial scale operations. Based on bottle roll tests during the past three years, the average consumption was 0.25 kg/t (0.50 lb/ton). The cyanide consumption in column tests is always much higher than in commercial operations, generally 3 to 4 times as high. Consumption is nearly proportional to the column leach time. Typically a 60-day column leach time is the norm. Reviewing the column tests from the past three years and reducing the consumption to that of a 60-day test indicates an average consumption of 0.195 kg/t (0.39 lb/ton).
For the feasibility study, the cyanide consumption is projected to be 0.195 kg/t (0.39 lb/ton) of ore crushed. Information provided by suppliers indicates that typical cyanide consumption in the industry ranges from 0.19 kg/t (0.38 lb/ton) to 0.20 kg/t (0.40 lb/ton) of ore on the heap.
McClelland Laboratories, Inc. indicated that the Soledad ores were clean and that there were no ‘red flags’ raised in any of the test work. Furthermore, the samples crushed in the HPGR had a lower proportion of fines than the samples crushed to 100% - 8 mesh, which could lead to lower cyanide consumption than previously estimated.
17.3.6Manpower Required
The operating crew will consist of 1 experienced Process Engineer who will work 8 hours per day for 5 days per week and a shift crew of 4 operators who will work a continuous shift schedule.
The operating crew in the refinery will consist of 3 operators who will work 10 hours per day and 4 days per week as per the detailed discussions with Kappes, Cassiday.
| October 2012 | 17-8 | |
| Soledad Mountain Project
Kern County, CA, USA
Technical Report |
The refinery will be a key area and security will be paramount. An independent supervisor will be added to the operating crew on days that melting is being done.
17.3.7Carbon Columns for Closure
The Merrill-Crowe process requires a cyanide concentration of approximately 150 mg/L or 150 ppm for efficient precipitation of gold and silver and this is well above the environmental rinse limits. A set of carbon columns will therefore be required once the neutralization process starts to recover residual gold and silver, as carbon is not affected by low cyanide concentrations. Experience shows that gold will be leached until cyanide concentrations drop to approximately 1 mg/L or 1 ppm. The rate at which silver will be leached slows at cyanide concentrations of 50 mg/L or 50 ppm and stops at approximately 10 mg/L or 10 ppm. The Merrill-Crowe circuit will need to be shut down once cyanide concentration drops below 150 mg/L or 150 ppm and electro-winning cells will be brought in to recover gold and silver.
Allowance has been made for a carbon plant in Sustaining Capital in Year 12 of production.
17.3.8International Cyanide Management Code
GQM expects to sign the International Cyanide Management Code. The Code was developed under the auspices of the United Nations Environment Program and the International Council on Metals and the Environment. The International Cyanide Management Institute, a non-profit organization, administers the Code. Signatories to the Code commit to follow the Principles set out in Code and to follow the Standards of Practice. Companies are expected to design, construct, operate and decommission their facilities consistent with the requirements of the Code and must have their operations audited by an independent third party. Audit results are made public.
GQM has engaged an independent consulting engineer to proceed with pre-operational certification.
17.4Assay Laboratory
17.4.1Laboratory Testing QA/QC
The laboratory has been designed to cope with the planned workload including the required sample preparation and solid and solution analyses for gold and silver as well as analyses required to manage the heap leach operation (CNfree, CNwad, CNt, protective alkalinity and pH). Environmental control analyses will be performed for low level NaCN and metals (Hg, Ag, As, Cu, Fe, Zn, Mo, Cd, Ni, Co, Cr, Mn, Pb).
Fire assays will be the key assay and the laboratory will have capacity to do 60 fire assays per day with a 70% efficiency.
Mr. Jack Stanley, Analytical Laboratory Consultants Ltd, developed the concepts. Jack Stanley and Northern Trailer Ltd., Kamloops did the detailed engineering and provided the capital and operating cost estimates for the laboratory and only new equipment prices were used. Capital and operating costs were brought current in the third quarter 2012.
| October 2012 | 17-9 | |
| Soledad Mountain Project
Kern County, CA, USA
Technical Report |
The laboratory will be constructed on a turn-key basis.
The laboratory will consist of three modules 4.3 m (14 ft) wide and 15.2 m (50 ft) long and will include areas for sample preparation, fire assays and related wet chemistry and metallurgical test work such as bottle roll tests and column leach tests. The modules will be shipped to site with the equipment installed wherever possible to minimize construction on site. The modules will be set on concrete slabs. It will be important to anchor the modules properly to the slab because of the high winds in the area.
Extensive provision has been made for dust control. All lead waste and dust containing heavy metals will be shipped to a designated disposal site. Rock dust and rejects from sample preparation will be returned to the process. Scrubbers will be fitted to fume hoods.
The laboratory has been designed to meet all State codes. Fire alarms and a sprinkler system will be installed in certain areas of the laboratory.
The laboratory has been sized to do from 50 to 200 solid and from 10 to 50 solution samples per day depending upon requirements.
In addition to the test work done on site, a quality assurance and quality control program using an outside laboratory will be implemented for the following reasons:
| | • | Independent repeat analyses to gain statistical confidence in the in-house analyses. |
| | | |
| | • | Confirmation analyses to satisfy permit and approval requirements. |
| | | |
| | • | Geochemical analyses that may be in the ppb range and that cannot be performed in- house. |
| | | |
| | • | Unexpected laboratory load due to exploration drill programs. |
| | | |
| | • | ICP scans of solutions to develop historical trends. |
17.4.2Manpower Required
The laboratory will be staffed by a chief chemist, two assayers and four sample preparation technicians. The two assayers and the four sample preparation technicians will work a continuous shift schedule. This will ensure that a sample preparation technician is on duty for 24 hours per day and seven days per week. The analytical capacity of the laboratory can be doubled by adding a second shift per day.
17.5 Power and Water Required
17.5.1Power Required
Power required for the operation is described in Section 19.2.2.
| October 2012 | 17-10 | |
| Soledad Mountain Project
Kern County, CA, USA
Technical Report |
17.5.2Water Required
Water required for the operation is described in Section 19.2.1.
| October 2012 | 17-11 | |
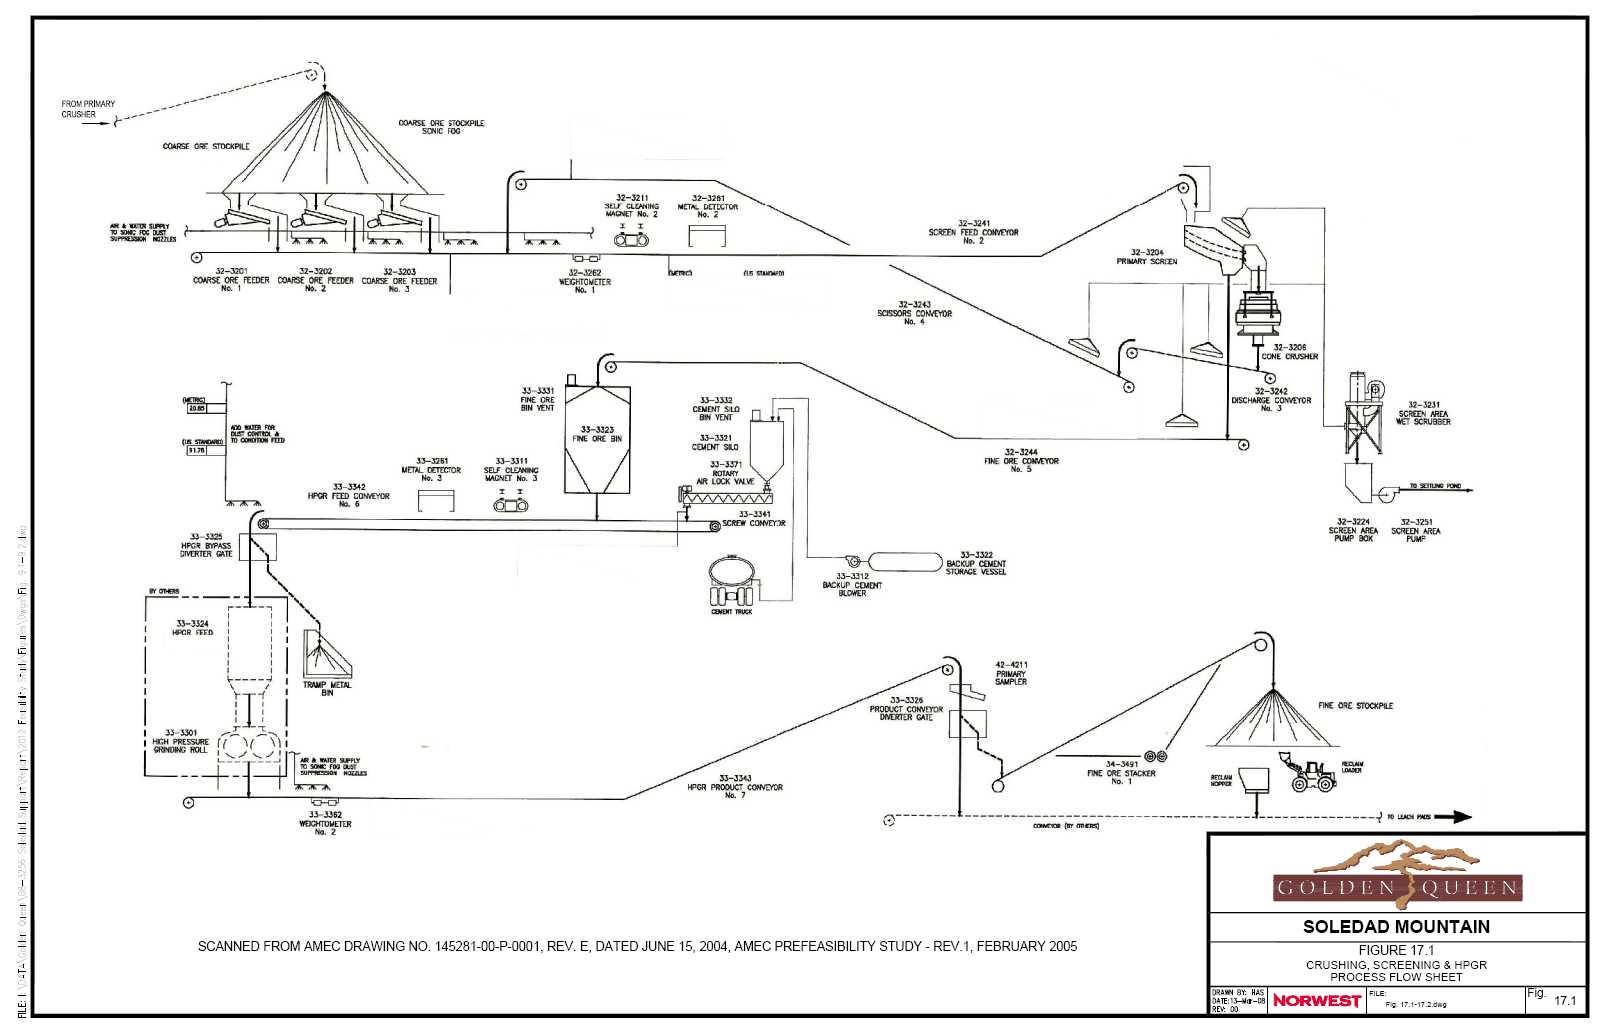
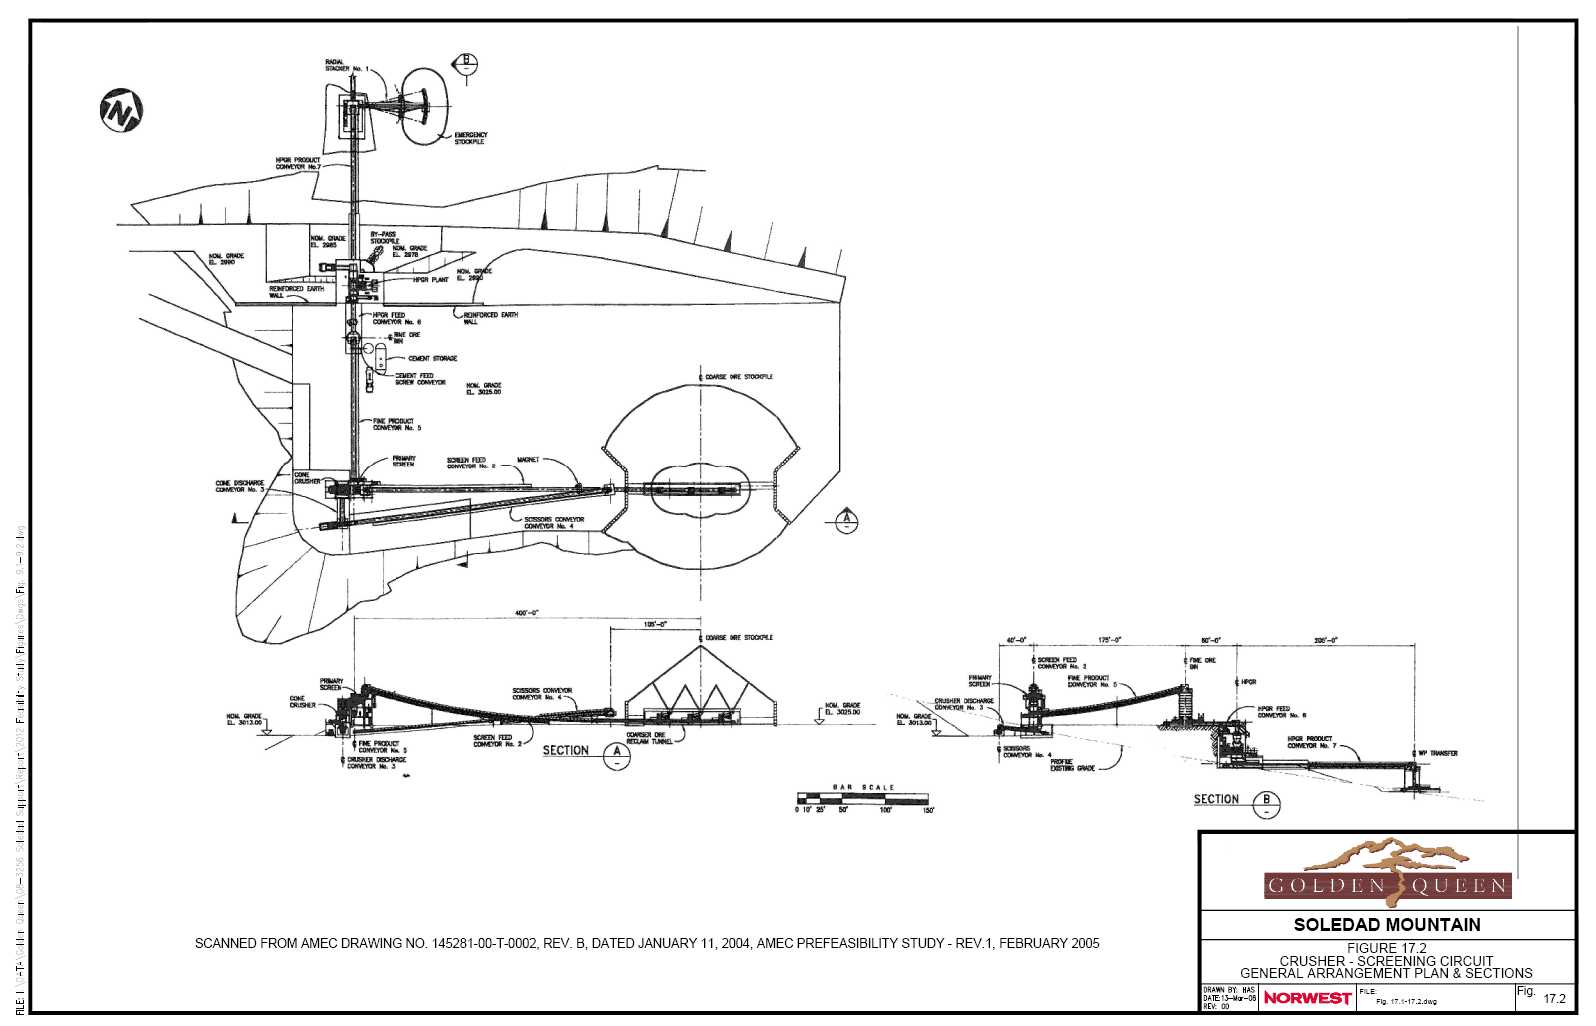
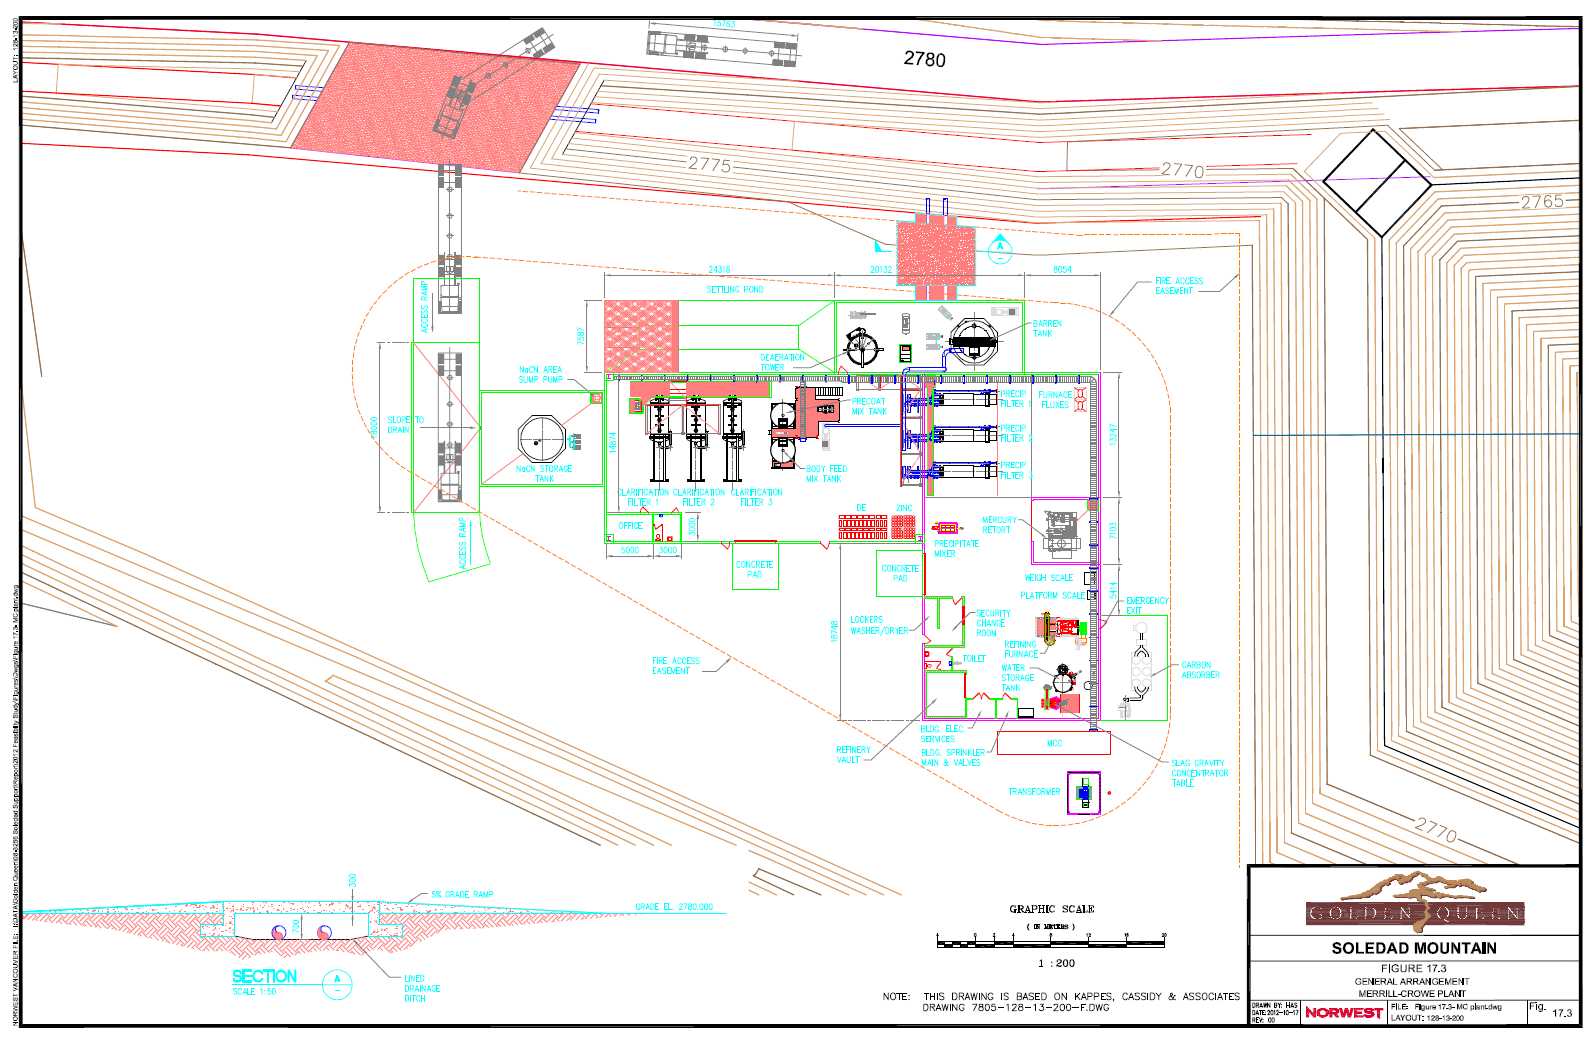
| Soledad Mountain Project
Kern County, CA, USA
Technical Report |
| 18 | MINERAL PROCESSING - HEAP LEACH OPERATION |
18.1 Heap Leach Operation
18.1.1Design of the Facilities
GQM commissioned Golder to finalize the design of the Phase 1 heap leach pad (Golder, March 2012) and to do a conceptual design of the Phase 2 pad. GQM is now purchasing land that may be suitable for a Phase 3 pad south of the Phase 2 pad.
The Phase 1, Stage 1 heap leach pad as designed in 2006 would require that a portion of the historical tailings would be handled twice. This would create possibly unmanageable dust that must be avoided. An alternative construction sequence was therefore selected as described below and a revised design report was prepared by Golder and submitted to GQM in December 2010 to reflect this change and other changes, which had been made to the Project since 2007. The design was again revised after the decision was made to eliminate any and all encroachment on the floodplain in mid-2011. This was done in agreement with Kern County Engineering, Surveying & Permit Services Department.
Areas and capacities of the two heap leach pads was determined by Golder and recorded in a Technical Memorandum, “Soledad Mountain Heap Leach Facility, Phase 1 and Phase 2 Capacity Estimate” (Golder, 2012). The Phase 1 heap leach pad has an area of 797,500 m2 (8,580,000 ft2) and this has been divided into 3 stages, viz. Stage 1 (5 cells), Stage 2 (6 cells) and Stage 3 (6 cells) as shown in Figure 18.1. The Phase 2 pad has an area of 455,500 m2 (4,900,000 ft2) as shown in Figure 18.2. The following is the lined area and capacity for each stage of the Phase 1 pad and the Phase 2 pad:
| Table 18.1 Leach Pad Stages |
| Leach Pad Area | ft2 | tons | tonnes |
| Pad 1 - Stage 1 | 2,900,000 | 12,200,000 | 11,068,000 |
| Pad 1 - Stage 2 | 3,450,000 | 20,000,000 | 18,144,000 |
| Pad 1 - Stage 3 | 2,230,000 | 11,000,000 | 9,790,000 |
| Total Pad 1 | 8,580,000 | 43,100,000 | 39,002,000 |
| Phase 2 | 4,900,000 | 23,532,000 | 21,348,000 |
| Total Pad Capacity | 13,480,000 | 66,632,000 | 60,350,000 |
A specific weight of 1.36 t/m3 (85.0 lb/ft3) is used to determine the quantities of ore on the heap.
Phase 1, Stage 1 will be stacked 5 cells wide and a maximum of 5 lifts high for a total of approximately 8 million tonnes (9 million tons) based upon the TNT design. Note that ore mined in the first 3 years of the schedule is approximately 12.9 million tonnes (14.2 million tons).
| October 2012 | 18-1 | |
| Soledad Mountain Project
Kern County, CA, USA
Technical Report |
The layout of the Phase 1 heap permits stacking in rectangular panels and this will lend itself to a straightforward conveyor stacking system.
A perimeter access road is included and this is 6 m (20 ft) wide with safety berms. The road width allows for the near-pad side offset for the liner system anchor trench.
Note again that a specific weight of 1.36 t/m3 (85.0 lb/ft3) has been used to determine the quantities of ore on the heap. This makes no allowance for self-compaction of ore at maximum heap height. Information on the experience at the Coeur Rochester Mine shows an increase in specific weight of greater than 20% under self-compaction at a heap height of 60 m (200 ft) for the lower lifts. Test work done by Golder on leached residues of low-grade and high-grade rhyolite samples from Soledad Mountain shows an average increase in specific weight of 13% above 85.0 lb/ft3 at 30 m (100 ft) heap height. An increase in specific weight of approximately 15% within the central portion of the heap leach would increase the placed ore specific weight to 1.56 t/m3 (97.5 lb/ft3) which in turn would increase in the capacity of the heaps. Based on the site specific test data and regional experience, the expectation of this level of load induced compaction is deemed reasonable. Note that the area available on top of the Phase 1 heap is also large enough that some additional ore could be placed on the heap if stacked ore permeabilities will permit.
Stage 1 of the Phase 1 heap leach pad and the overflow pond and other supporting features will be constructed in Year 0. Stage 2 will be constructed in Year 3 of production. Stage 3 will be constructed in Year 7 or Year 8 depending upon the actual ore mining rate and the overall performance of the heap. The Phase 2 pad will be constructed in Year 10 again depending upon the actual ore mining rate and the overall performance of the Phase 1 heap. The cost of constructing Stage 1 has been included in the Project capital cost while the cost of constructing Stage 2, Stage 3 and the Phase 2 pad has been included in the Sustaining Capital.
Guinn Construction Company, Bakersfied has provided a current estimate for construction of the Phase 1, Stage 1 heap leach pad.
Stages 1, 2 and 3 of the Phase 1 heap leach pad are divided into hydraulically isolated zones in order to allow for proper sequencing of construction and leaching activities.
GQM retained AMEC Americas Ltd., Vancouver to do detailed engineering for the pump box, pumps and pipeline to convey solutions from the pump box to the Merrill-Crowe plant. The design was done with close interaction between engineers employed by AMEC Americas Ltd., engineers familiar with conditions on site and GQM management. A strategy for the operation of the system is set out in a memorandum dated December 3, 2010 and this note, a set of drawings and cost estimates are available in the GQM offices in Vancouver.
The pump box has been placed below grade and the inlet of the pump box mirrors the cross-section of the solution conveyance channel. Golder has designed a liner system for the pump box to ensure full containment of solutions.
| October 2012 | 18-2 | |
| Soledad Mountain Project
Kern County, CA, USA
Technical Report |
The pump box overflows to the overflow pond. Solutions will be returned from the overflow pond to the pump box with a sump pump.
Two pumps will initially be required to pump the pregnant solution to the Merrill-Crowe plant. Only one of the pumps will be in use at any one time and the second pump will be a backup pump. Vertical turbine pumps have been selected.
The layout for the Phase 1, Stage 1 heap leach pad is compact and this allows for a short length of the lined channel to route solutions to the pump box.
Golder determined the size of a two-stage overflow pond based upon the water balance for the Project – approximately 121,000 m3 (32 million gallons). This capacity is adequate to contain heap drain-down and runoff from storm events and includes 0.5 m (2 ft) of freeboard. The pond is double-lined and includes a leak detection and leakage recovery system. The layout ensures that the pond will receive all spills from processing operations and overflows from the pump box. The overflow pond is not expected to discharge; however an emergency overflow has been included on the north side of the pond.
Water can initially be stored in the overflow pond to provide a reserve of water required for irrigating the heap during start-up of the operation.
18.1.2Geotechnical Considerations that Apply to the Design of the Facilities
The following is a summary of the geotechnical considerations as these apply to the design of the heap and the heap leach pads.
Heap and Heap Leach Pad Design
The heap and heap leach pad design was completed by Golder as per the detail provided in the revised geotechnical design report (Golder, 2012).
Heap leach pads will be constructed where the slopes range from 2o to 8o on Arizo soils. The soil is a sandy loam with gravel and cobbles with depth. Much of the soil surface in the area of the Phase 1 pad consists of altered materials and this includes tailings from an earlier mining and milling operation on the property. Historical mine shafts are also present within the limits of the Phase 1 pad.
Golder did a detailed analysis of site drainage as described in Section 9.6.2. Note that most of the storm water runoff towards the areas where the process facilities and heap leach pads will be constructed will be intercepted by the open pits. Allowance has been made in the design of the facilities to intercept the remaining runoff in diversion ditches with erosion control measures.
Norwest personnel visited the site and the proposed Phase 1 pad area was inspected and no geotechnical hazards, other than those discussed and provided for in the Golder report, were identified.
| October 2012 | 18-3 | |
| Soledad Mountain Project
Kern County, CA, USA
Technical Report |
Heap and Heap Leach Pad Design Evaluation
Norwest has reviewed and accepted the design recommendations in the revised geotechnical design report as suitable for feasibility level planning (Golder, 2012). If heap leach pad designs change and as mining proceeds, additional information may be required to confirm design recommendations.
Phase 1 Heap & Heap Leach Pad Design Criteria
Phase 1 heap and heap leach pad design criteria were based upon analyses completed by Golder. The following are heap and heap leach design criteria relevant to geotechnical stability:
| | • | Ore stacked in 10 m (33 ft) lifts. |
| | | |
| | • | Maximum ore height over liner of 60 m (200 ft). |
| | | |
| | • | Ore to be stacked in lifts at the angle of repose with set-back benches to form overall side slopes of 2.5H:1V along the north, northwest and east slopes and 2H:1V along the south and southwest slopes. |
| | | |
| | • | Upstream and side stream diversion channels for storm-water runoff. |
18.1.3Conveying and Stacking System
The available Phase 1 heap leach pad area has been divided into 17 cells with 5 cells in Stage 1, 6 cells in Stage 2 and 6 cells in Stage 3. Individual cells are rectangular and this layout allows for a simple and efficient stacking system. Ore will be stacked in lifts of 10 m (33 ft) in height, 80 m (262 ft) in width for a total of six lifts to the ultimate heap height allowed for in the design of 60 m (200 ft). The size of each cell and lift has been made as large as possible to limit the total number of cells and lifts and thus the cumulative activity on the heap. This is being done to limit the inevitable traffic induced compaction that will be experienced prior to leaching.
Terra Nova Technologies, Inc. (TNT), San Diego has designed the conveyors and the stacker to convey up to 1,000 t/h (1,100 ton/h) and retreat stacking will be performed. Details of the TNT design are contained in their report submitted to GQM (Soledad Mountain Project, Heap Leach Stacking System, Recommendation and Cost Estimate, January 31, 2005, Terra Nova Technologies, Inc.). The conveying and stacking system is a traditional fixed pad, multiple lift, portable stacking system.
Ore will be drawn from the fine ore stockpile by a Syntron-type vibratory feeder and conveyed on the overland conveyor. Ore on the overland conveyor will subsequently be dumped on the tail end of a series of portable ramp conveyors via a rubber-tired tripper. Then the ore will be conveyed to the top of the heap and dumped on the tail end of a string of standard portable conveyors, which will in turn convey the ore to the horizontal feed conveyor system, and ultimately the radial stacker. The overland conveyor will be approximately 1,100 m (3,600 ft) long and run along the south side of the Phase 1 heap leach pad.
| October 2012 | 18-4 | |
| Soledad Mountain Project
Kern County, CA, USA
Technical Report |
Barren solution will be used to wet the ore at locations on the heap leach pad so as to provide containment of the cyanide solution. The belt plows will be installed on the first three grasshopper conveyors to provide mixing (agglomeration) of the barren solution, ore and cement. Barren solution addition rate will be controlled with a valve and linked to a weightometer. The target moisture content for the wetted ore to be stacked on the heap is 8%.
An operator will be required to operate the stacker. TNT experience shows that this will give better operating results than an automated system.
18.1.4Support Equipment
The following support equipment will be provided for work on the heap:
| | • | A Polaris 6x6 ATV - This will be used by the operators to transport tools and smaller operating supplies. |
| | | |
| | • | A Cat D6K LGP dozer (or equivalent) – The dozer will be used to level the surface before prior to placement of drip lines and scarifying the surface prior to stacking additional ore lifts. |
| | | |
| | • | A used forklift – This will be used to move the grasshopper conveyors. |
No specialized belt handling equipment will be required.
18.2 Solution Management
18.2.1Distribution of Solutions on the Heap
Provision has been made in the design of the system for counter-current solution flow on the heap, i.e. barren solution to secondary leach, recycle solution to primary leach and pregnant solution to the Merrill-Crowe plant. Current indications are that the counter-current solution flow will only be introduced later in the life of the mine and only if indicated by solution grades.
Primary and secondary solution application rates are 9.77 L/h/m2 (0.004 gal/min/ft2) and 4.89 L/h/m2 (0.002 gal/min/ft2) respectively with pregnant solution flow rate of 450 m3/h (2,000 gal/min) and barren solution flow rate of 473 m3/h (2,100 gal/min) (after allowing for 5% evaporation makeup). The primary leach area (top) will be approximately 46,000 m2 (500,000 ft2). This area can be irrigated for 49 days on average at the design flow rates and this will be the primary leach period. The average slope area will be approximately 4,600 m2 (50,000 ft2) or 10% of the top area and slope areas will be irrigated at the secondary solution application rate.
Time for solution “breakthrough” will depend upon the number of lifts on the heap and this could range from 1 day to 10 days. It is further expected that a total of 7 days will be required to prepare the heap for a new lift and both will be determined by operating experience.
| October 2012 | 18-5 | |
| Soledad Mountain Project
Kern County, CA, USA
Technical Report |
The leachate or pregnant solution and the recycle solution will be collected in a network of perforated pipes and will be directed to pipes in the lined solution conveyance channel. The solutions then flow to a two-compartment pump box and are pumped to the Merrill-Crowe plant.
The area of a commercial heap that can be irrigated with the design flow rates will be approximately 177,000 m2 (1,900,000 ft2). At any one time there will be enough solution to irrigate (actively leach) 49 days’ worth of primary ore (higher grade) and 102 days of secondary ore (low grade) for a total of 151 days of ore on the top lift. In addition to leaching the top lift, the leach solution that is applied to the top lift also percolates down through the underlying lifts, thus giving them more leach time. This means that the ore on the top lift, say lift #6, will receive at least 151 days of active leaching (probably more if the pregnant solution grade is high enough to warrant longer leaching) and the underlying lifts will get:
| | • | Lift #6 at least 151 days |
| | | |
| | • | Lift #5 at least 302 days |
| | | |
| | • | Lift #4 at least 453 days |
| | | |
| | • | Lift #3 at least 604 days |
| | | |
| | • | Lift #2 at least 755 days |
| | | |
| | • | Lift #1 at least 906 days |
All of the ore will be leached long enough to obtain the gold and silver extractions that were achieved in the column leach tests, even lift number 6 if it is irrigated for 290 days (see below). The column leach extractions are based on 200 days of active column leaching. There is a rule of thumb in gold heap leaching, based on experience, which relates column leach time to commercial scale heap leach time:
| | • | First 30 column days = 90 days commercial scale |
| | | |
| | • | Second 30 column days = 60 days commercial scale |
| | | |
| | • | Remaining column days @ 1:1 (i.e. 140 days) = 140 days commercial scale |
| | | |
| | • | Totalling approximately 200 column days = 290 days commercial scale |
This means that extractions based on a 200-day column test, such as those obtained from the logarithmic regression analyses, will require 290 days (say 300 days), to achieve the same extraction in commercial scale practice.
Operating experience may show that it will be advantageous to reduce both the primary and secondary solution application rates and increase the total area under irrigation to allow diffusion-controlled leaching to take place for an extended period of time. The ore in a particular lift will require as much leaching as possible before it is covered with another lift or overall recoveries may be reduced because of the channelling of flow that invariably occurs.
| October 2012 | 18-6 | |
| Soledad Mountain Project
Kern County, CA, USA
Technical Report |
Frequent sampling of the various solution streams will be required to ensure that barren solution and the recycle solution are applied to the heap most effectively. Operating experience will ultimately be required to develop an effective solution management system.
18.2.2Netafim USA Design Elements
Drip emitters will be used to irrigate the ore on the heap. Drip emitters will be placed on new ore as quickly as possible to ensure rapid solution breakthrough.
Netafim USA (Netafim) is the key supplier of components used extensively in agriculture for irrigation. Netafim provided the design and cost estimates for the solution distribution system.
The Netafim system is suitable for irrigating large level areas and slopes. Layouts can be changed and refined and this will depend upon operating experience. The spacing of the driplines will be approximately 1 m or 36 inches apart and the recommended length of driplines is 60 m (200 ft).
18.2.3Moisture Content, Specific Weight and Slump
The moisture content, specific weight and ‘slump’ for all tests done since 1990 are shown in
Table 18.1. A comparison of moisture contents from two different test programs is illustrative in showing the difference in moisture contents between the VSI crusher and the HPGR-based approach.
| Table 18.1 Moisture Content Test Results |
| | 1997-1999 VSI Crusher Tests | HPGR Tests |
| | 100 % - 8 mesh | Low- & High-Grade |
| | Moisture Content % | Moisture Content % |
| To agglomerate the ore | 11.5 | 12.8 | 10.6 |
| To saturate the ore | 37.2 | 13.8 | 14.0 |
| Retained moisture | 21.1 | 10.7 | 11.9 |
The lower moisture contents required to saturate the ore and the lower retained moisture contents obtained in the HPGR-based test programs will have a significant and positive impact on the ability to construct a heap to an ultimate height of 60 m (200 ft).
No difficulties with solution percolation, solution channelling or fines migration were observed in any of the HPGR-based column leach tests done between 2003 and 2007.
18.2.4Percolation Rates Under Load
Test work was done to determine percolation rates under load (Golder, 2010). Indications are that no percolation difficulties will be encountered with six lifts of 10 m (33 ft) each and an ultimate heap height of 60 m (200 ft) (This is based upon guidance provided by third party consulting engineers). This will require adequate addition of a binder and proper agglomeration procedures at all times.
| October 2012 | 18-7 | |
| Soledad Mountain Project
Kern County, CA, USA
Technical Report |
Additional perforated pipe can be installed between lifts if required to direct solution away from lower lifts if difficulties are experienced in the commercial scale operation. This is a decision to be made by the operators once experience has been obtained with particular ore types.
Solution application rates may also have to be reduced if ponding is observed on the heap.
18.2.5Problems with Multiple Lifts
It is known that solutions percolating through a heap find the easiest channels to follow (preferential flow) and that perfect wetting of all ore particles is not achievable in practice. This problem usually increases as the number of lifts increases, however this issue can be overcome to some extent by deep ripping a lift that has been leached before a new lift is stacked on top of it. Ripping the upper six feet of an exhausted lift will redistribute the flow channels. A D275 (or equivalent) dozer with a long ripper will be available for deep ripping if the need for this activity is indicated by operating experience. It is however possible that deep ripping will destroy the agglomerates and scarifying the surface may be all that is required to ensure good solution flows from lift to lift. Operating experience and test trials will help the operation to select the suitable method.
18.2.6Water Required
The average water use for the heap leach operation is projected to be 96.6 m3/h (425 gal/min) and this includes an allowance for evaporation losses.
18.2.7Rinsing and Neutralization of the Leached Residues on the Heap
Cyanide concentrations in the leach solutions must be reduced to the weak acid dissociable (WAD) standard of 0.2 mg/L (0.2 ppm) and a pH ranging from 6.0 to 8.5. Cyanide concentrations in the leached residue must be reduced to the WAD standard of 0.5 mg/kg (0.5 ppm). Also, contaminants in any effluent from the leached residue will not be permitted to degrade surface run-off or groundwater. The basic approach to reducing the cyanide concentrations is to allow natural processes to occur and to carry out a staged rinse with fresh water. A 90-day rinse cycle has been used successfully at other heap leach operations in the California desert environment. Hydrogen peroxide or an equivalent oxidizing agent can be used to speed up the neutralization process as required. The hydrogen peroxide can be injected into any of the solution distribution lines with a chemical feed pump. The rinse water will be applied to the heaps using drip emitters.
Solutions from each cell of the heap and from the lysimeters and leak detection monitoring points will be sampled regularly and taken to the assay laboratory on site for analysis. The samples will be analyzed for gold, silver, pH and free cyanide and the analyses will be used to control and direct the rinse solution to various parts of the heaps. Analyses may occasionally be required for other metals such as copper, selenium and chromium.
| October 2012 | 18-8 | |
| Soledad Mountain Project
Kern County, CA, USA
Technical Report |
Adding fresh water to rinse the heap must be balanced by losses due to evaporation. Estimated total (mean) annual evaporation is 2,027 mm (79.8 inch) versus a mean annual rainfall of approximately 152 mm (6 inch) in the greater Mojave area. Snow making equipment (sprayer systems) has been successfully used at other heap leach operations to speed evaporation.
Experience at other heap leach operations in the California deserts shows that standards set by the California State Water Resources Control Board can be met successfully.
18.2.8Manpower Required
A shift crew of 4 heap leach operators will work a continuous shift schedule. The heap leach operator will control the operation of the stacker and conveyors on shift. The heap leach operator will be assisted on day shift by a utility loader/forklift/Hiab operator and a helper to move conveyors and pipe and drip emitters and generally manage the operation of the heap. These 2 operators per shift or a total of 4 operators will work a continuous shift schedule.
18.3 Comments on Section 18
Norwest has relied upon the detailed heap leach designs prepared by Golder and Associates for the completion of this section of the report. Golder and Associates are a qualified consulting engineering firm with extensive experience in the design of leach pad facilities and Norwest accepts the Golder and Associates’ designs and recommendations that have been provided by GQM.
| October 2012 | 18-9 | |
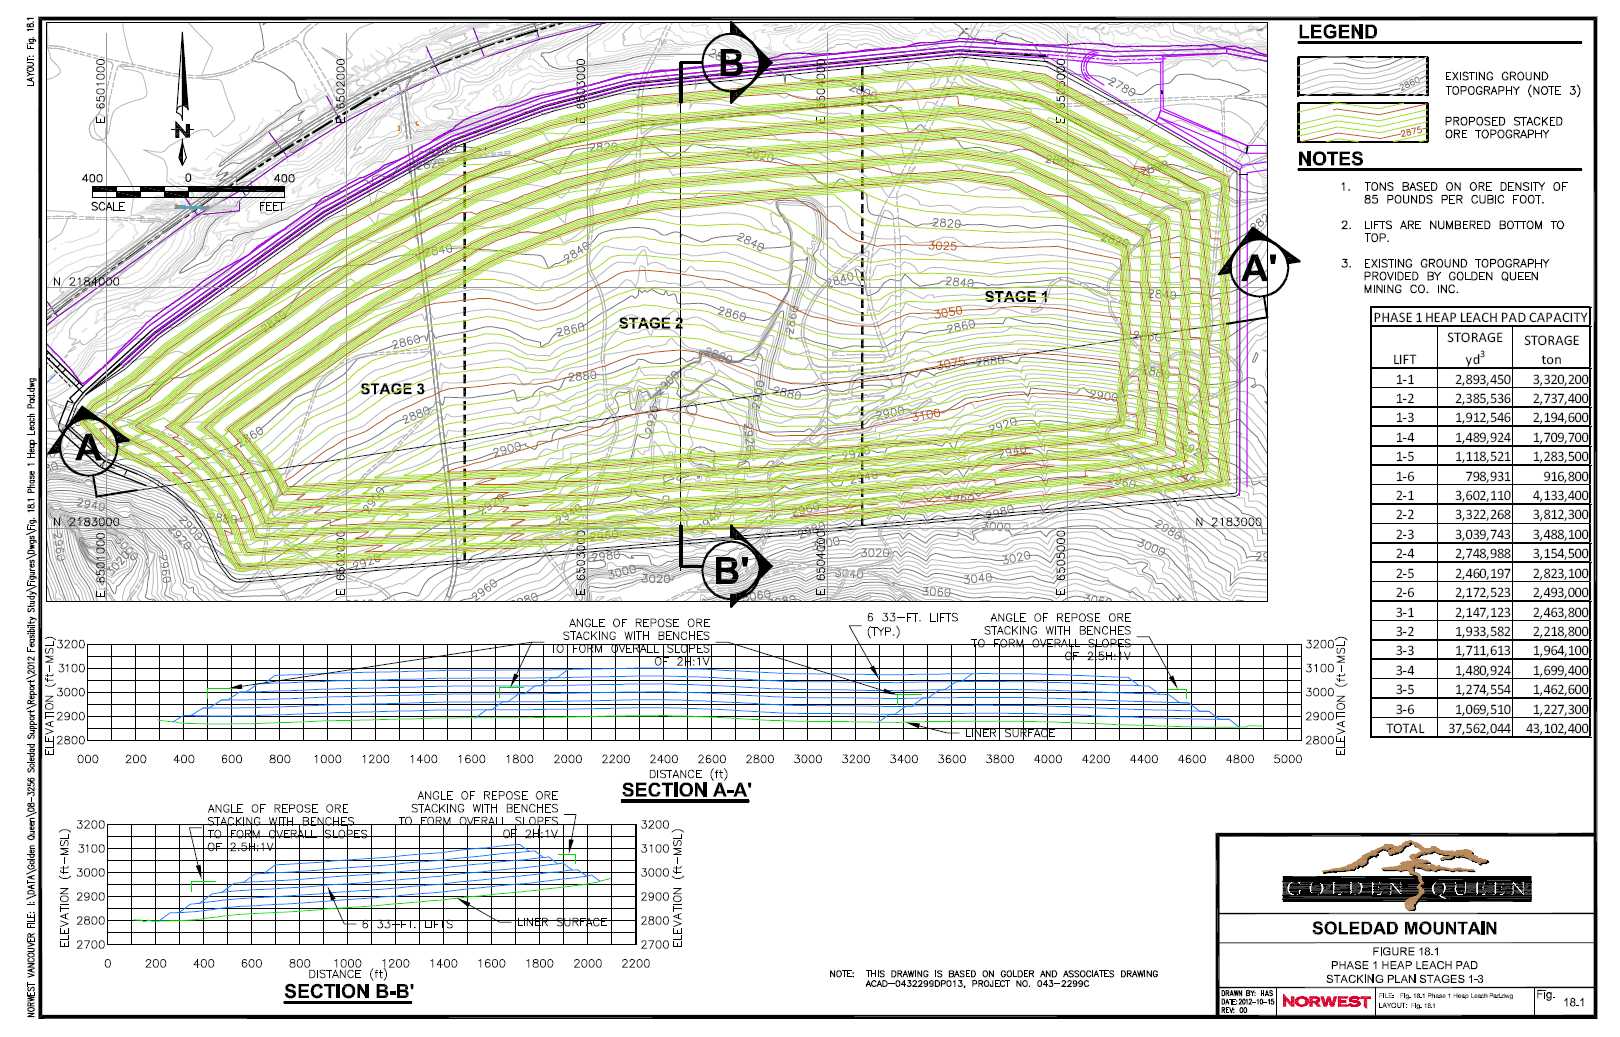
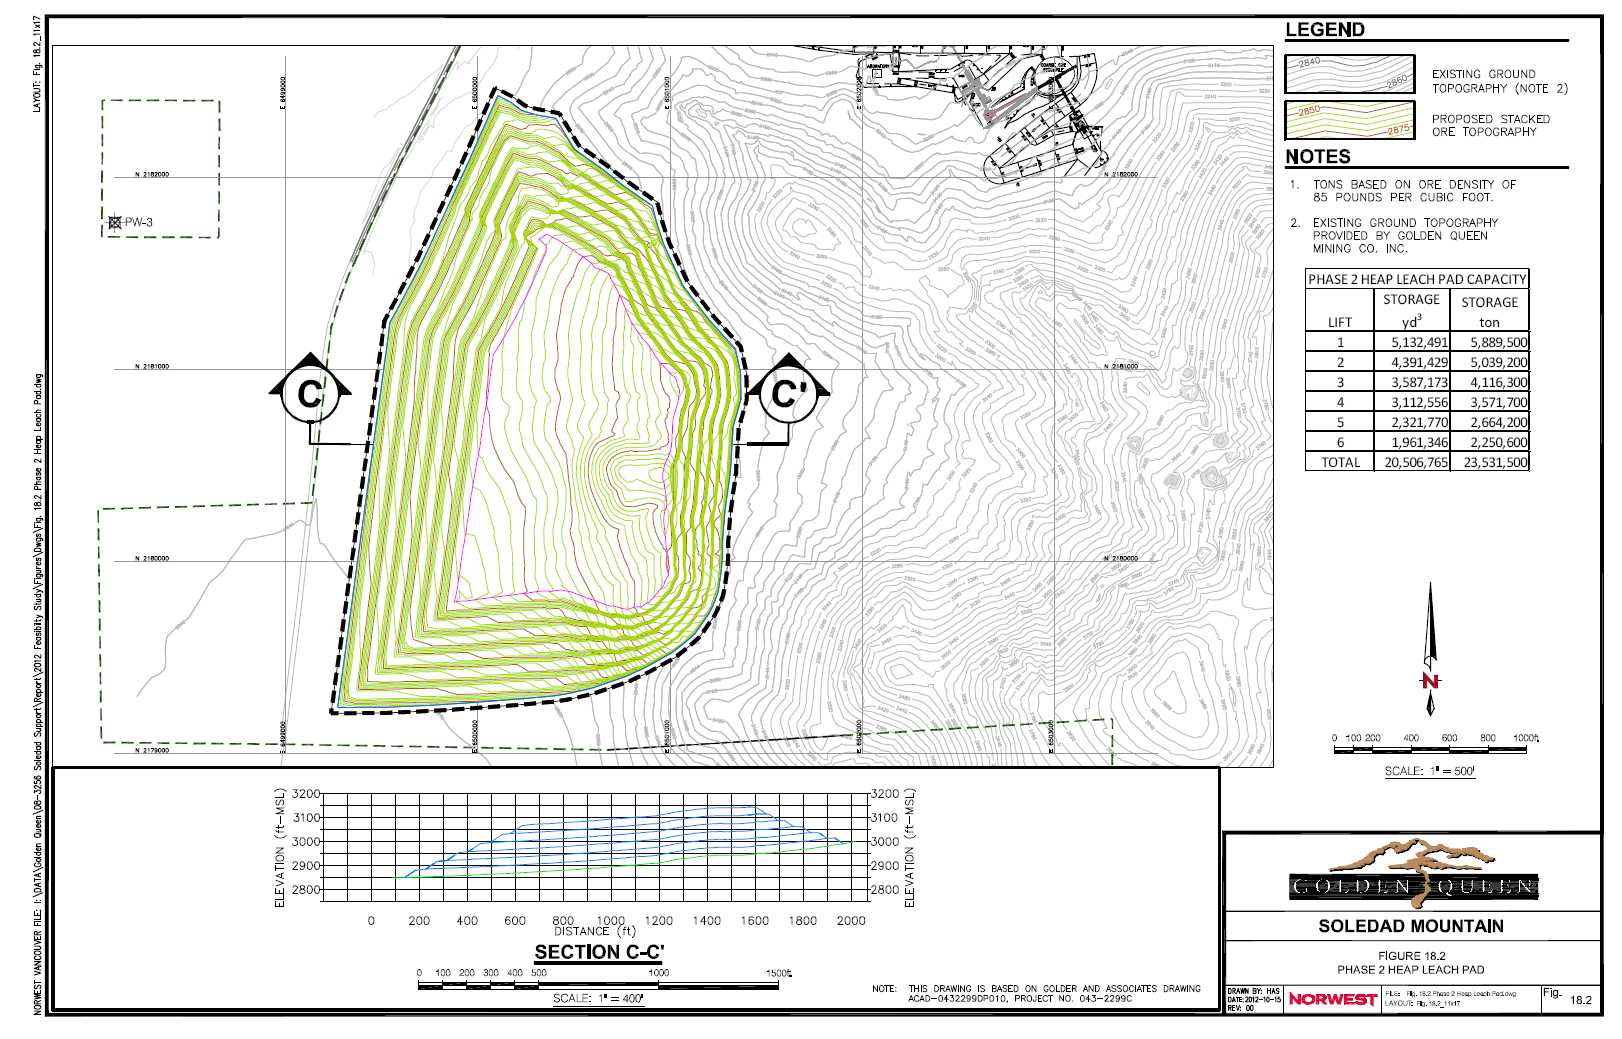
| Soledad Mountain Project
Kern County, CA, USA
Technical Report |
19.1 Access
Good access exists from the north via Silver Queen Road and from the south via Mojave Tropico Road. Both roads are paved and are in excellent condition. Silver Queen Road intersects State Route 14 two miles east of the site. State Route 14 is the major highway, which connects Mojave, Rosamond and Lancaster to the greater Los Angeles area.
Access to site will be from Silver Queen Road, which borders the site on the north as shown in Figure 4.2. The two existing roads, the dirt road to the old offices and the paved road to the 3025ft level will be used for immediate access during the construction period.
A new turn-off from Silver Queen Road will be constructed approximately 900 m (1,000 ft) east of Gold Town Road. This will include a left-hand turning lane as a safety measure. A local civil engineering firm, T.J. Cross Engineers, Inc., based in Bakersfield, has completed the detailed design of the turn-off and Kern County Roads Department has approved the design. T.J. Cross Engineers, Inc. has provided a current estimate for construction.
Fielden Engineering Group, a local engineering firm based in Lancaster, has prepared a detailed site grading plan with provision for site drainage for the area immediately adjoining the new turn-off from Silver Queen Road. The site grading plan now includes a dip-crossing for the natural drainage that runs from west to east along Silver Queen Road. A bitumen seal will be required on the new access road as far as the security trailer as a dust control measure. A parking area for employee vehicles has been included in the design of the access road. The site will be fenced. The site grading plan has received extensive reviews by the Kern County Engineering, Surveying & Permit Services Department and has now been approved. Gary Little Construction, Inc., a building contractor based in Lancaster, has provided a quotation for site preparation.
Good local infrastructure and the ready access to site at all times of the year will have a significant positive impact on both the capital cost to the start of production and the operating cost.
19.2 On-Site Infrastructure
19.2.1Water Required
Water rights in California are described in Section 4.6. The hydrological studies done to support the Project are described in Section 9.6.2.
A water supply will be required and groundwater will be the initial source of water.
Three production wells have been drilled and equipped on site. Production well PW-1 was drilled and developed in September 1996. The well was tested to yield 170 m3/h (750 gal/min). It was considered prudent to drill and test production well PW-2 to support the 2005 feasibility study.
| October 2012 | 19-1 | |
| Soledad Mountain Project
Kern County, CA, USA
Technical Report |
The well was drilled in 2005 and was developed and tested to yield from 45 m3/h (200 gal/min) to 68 m3/h (300 gal/min). A third production well, PW-3, was drilled west of Soledad Mountain to a depth of 183 m (600 ft) in October 2008. The well was developed and tested to yield only approximately 9 m3/h (40 gal/min). The well was subsequently chlorinated and capped.
Water will be required for dust control during construction and for compaction when laying the foundation of the Phase 1, Stage 1 heap leach pad. Water will be drawn from production well PW-1 and pumped to the main water storage tank.
The estimated average rate at which water will be required once the mine is in full production is 147.6 m3 (650 gal/min) with detail shown in Table 19.1.
| Table 19.1 Water Consumption at Full Production |
| Project Area | Water Consumption |
| L/min | gal/min |
| Process water | 1815 | 479 |
| Dust control (roads, stockpiles) | 409 | 108 |
| Aggregate Processing & Miscellaneous | 239 | 63 |
| Total | 2464 | 650 |
It is expected that the combined capacity of the three production wells will be able to supply the water requirements for the Project. Security of water supply for the Project is however a concern and GQM is actively pursuing additional options as set out below.
Note that the Kern County Board of Supvervisors approved a water entitlement of 170 m3/h (750 gal/min) in the CUPs issued in 1997.
The water balance for the Project was done by Golder. The Golder analysis indicates that a small portion of the water required will be made up by precipitation that will accumulate in the overflow pond although this has not been allowed for in the overall water usage balance.
19.2.2Power Required
The detailed electrical design, power consumption estimates and capital and operating cost estimates were prepared by AMEC Americas Ltd. The estimated annual power consumption at maximum planned ore production levels of 4.654 million tonnes (5.119 million tons) per year and the allocation is shown in Table 19.2. Annual power consumption ranges from 20 to 28 million kilowatt-hours depending upon ore production. Power distribution on site is shown in Figure 19.1 and a single line diagram is shown in Figure 19.2.
| October 2012 | 19-2 | |
| Soledad Mountain Project
Kern County, CA, USA
Technical Report |
| Table 19.2Power Consumption at Full Production |
| Project Area | Annual Power Consumption |
| | 000’s kWh |
| Ore Supply | 1,618 |
| Crushing & Screening | 3,609 |
| HPGR | 11,247 |
| Heap Leach Conveying & Stacking | 2,822 |
| General Plant Services | 182 |
| Merrill-Crowe Plant | 5,724 |
| Laboratory | 911 |
| Solution Management and Water Supply | 1,197 |
| Workshop & Warehouse | 297 |
| Fuel Storage & General Services | 268 |
| Total | 28,313 |
An allowance has been made for a diesel-powered generator to provide standby power and this will be located beside the Merrill-Crowe plant. The standby generator will power the pregnant, barren and future recycle solution pumps in case of a power outage.
19.3 Off-Site Infrastructure
19.3.1Power Supply
Southern California Edison (SCE), the regional utility, will supply power. A main power line with three sets of two conductors currently reaches the property boundary. The top two sets of conductors carries 66 kV while the bottom set of conductors carries 12.4 kV. These are the common primary voltages in this part of the SCE territory.
GQM will install and own the utility tie-in substation to the 66kV line, which will transform the incoming voltage of 66 kV to 11.37 kV and this will be the mine distribution voltage. Overhead transmission lines will distribute power from the substation to the areas where power is required.
SCE indicates that the power factor is an absolutely critical item in SCE territory. SCE requires a minimum operating power factor of 0.95 and a load-sensitive capacitor bank will be installed to achieve this. SCE may also limit the number of starts permitted for the major motors per day which could place some constraints on plant operations during full production periods.
SCE provided an average rate for power $0.08/kWh and this is the rate for power used in the feasibility study. The rate structure is complex and a mix of consumption and demand charges applies to peak, mid-peak and off-peak periods.
| October 2012 | 19-3 | |
| Soledad Mountain Project
Kern County, CA, USA
Technical Report |
19.3.2AVEK Water Supply
It is a condition set in the Conditional Use Permits issued by Kern County for the Project {*(20) 1997 FEIR/EIS MM #16)} that GQM will monitor groundwater levels in the production wells on a monthly basis and compare water levels to those predicted by the groundwater drawdown model. If the actual drawdown exceeds the predicted levels for six consecutive months, GQM must supplement the water drawn from the production wells with up to 68 m3/h (300 gal/min) of water purchased from the Antelope Valley – East Kern Water Agency (AVEK).
GQM engaged Dee Jaspar & Associates, Inc., an independent consulting engineering firm based in Bakersfield, to design and provide a cost estimate for a pipe line to link a supply point provided by AVEK to site. The pipe line has been designed for the full flow of 2,461 L/min (650 gal/min).
19.3.3Recycled Water Supply
GQM is evaluating the use of recycled water or Title 22 water for the Project with the Rosamond Community Services District. A number of alternative routes for a pipe line are being checked. The use of Title 22 water would be an environmental plus for the Project.
19.4 Office/Warehouse/Maintenance Facilities
The location of the workshop-warehouse and the equipment wash slab are shown in Figure 4.2. A detailed layout of the area is shown in Figure 17.3.
Fielden Engineering Group, a local engineering firm based in Lancaster, has prepared a detailed design for the workshop-warehouse, an equipment wash slab and the septic system and leach field. The designs have been approved for construction by the Kern County Building Department. Gary Little Construction, Inc., a contractor based in Lancaster has provided quotes for construction of this facility.
The workshop-warehouse will serve both the mine and the crushing-screening plant and other processing facilities. The workshop includes three service bays, which have been sized large enough to service mobile equipment such as the 11 m3 (15 yd3) wheel loader, 90 t (100 ton) off-highway haul trucks, the large track-type tractor and the motor grader as well as for plant maintenance. Extensive provision has been made for heating and ventilation in all areas.
A gantry crane with a capacity of 13 t (15 ton) will be provided for lifting large loads (such as loader buckets and dozer blades) in and out of the welding bay.
A light vehicle service bay will share the third bay. Allowance has been made for a vehicle hoist so that light vehicles can be serviced effectively. A set of lube reels will be set between two service bays and on the wall of the light vehicle service bay. Lubricants will be dispensed from lube cubes and drums. A waste oil storage tank will be required and this tank will be set within a small containment clear of the workshop-warehouse.
| October 2012 | 19-4 | |
| Soledad Mountain Project
Kern County, CA, USA
Technical Report |
The warehouse will have two floors. The upper floor will have a large open plan area which will serve as the site offices.
The equipment wash slab will have an area of approximately 1,860 m2 (2,000 ft2). The design includes primary and secondary settling basins and an oil-water separator. The sediments will be removed as required and disposed of in an approved location. A hot water pressure washer will be required for cleaning equipment and this has been included in the capital cost estimates.
Fielden Engineering Group has prepared a detailed site grading plan with provision for site drainage. This site grading plan has received extensive reviews by the Kern County Engineering, Surveying & Permit Services Department and has been approved. Gary Little Construction, Inc. has provided a quotation for site preparation.
Fielden Engineering Group has prepared a detailed design for the fire protection system for the workshop-warehouse. This includes a fire pump, fire water line and fire hydrant and has been approved by the Kern County Fire Marshall. Gary Little Construction, Inc. has provided a quotation for construction of the fire protection system.
19.5 Fuel Consumption, Supply and Storage
19.5.1Fuel Consumption
The estimated annual consumption of diesel and gasoline is approximately 1 million gallons and 22,000 gallonsrespectively. Diesel fuel consumption will vary from year to year depending upon the rate of mining ore and waste rock.
19.5.2Fuel Delivery
Schwebel Petroleum Co., a Shell dealer, can deliver fuel from Bakersfield.
The Jankovich Company, a Mobil/Exxon dealer, can supply fuel from Paramount.
Ramos/Strong, Inc., a Chevron dealer, can deliver fuel from Mojave.
19.5.3Fuel Storage on Site
Diesel fuel will be drawn from the 10,000gal storage tank on site to supply both individual trucks and other equipment and a fuel truck that will take fuel to various mining areas.
Gasoline will be drawn from the 1,000gal storage tank only to supply only individual pickup trucks.
19.5.4Design and Quotation
An equipment vendor based in Bakersfield did a design and submitted a quotation for a fuel storage facility to be constructed on site.
| October 2012 | 19-5 | |
| Soledad Mountain Project
Kern County, CA, USA
Technical Report |
The fuel storage facility has been designed to meet California codes. The equipment vendor has met with the Kern County fire marshal to discuss this particular facility and will obtain the necessary permits.
19.5.5Waste Oil Storage and Disposal
Waste oil, solvents, grease and other such wastes will be collected in a waste oil storage tank located beside the workshop.
A commercial recycling firm based in Mojave will collect waste oil periodically.
| October 2012 | 19-6 | |
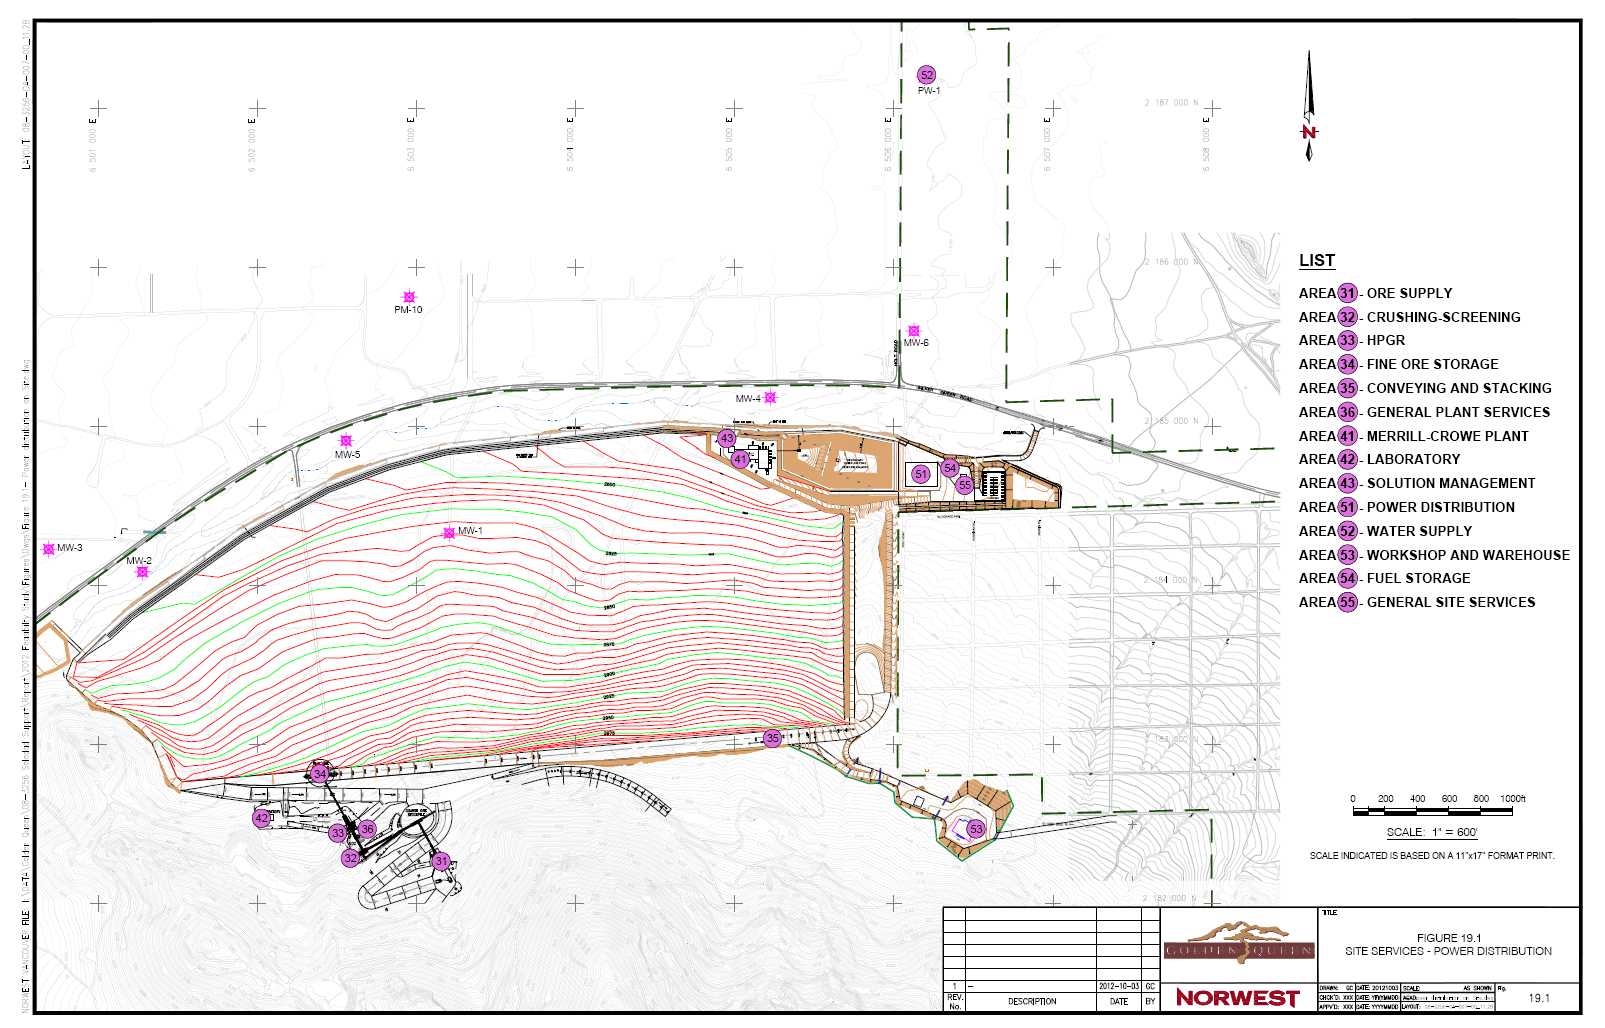
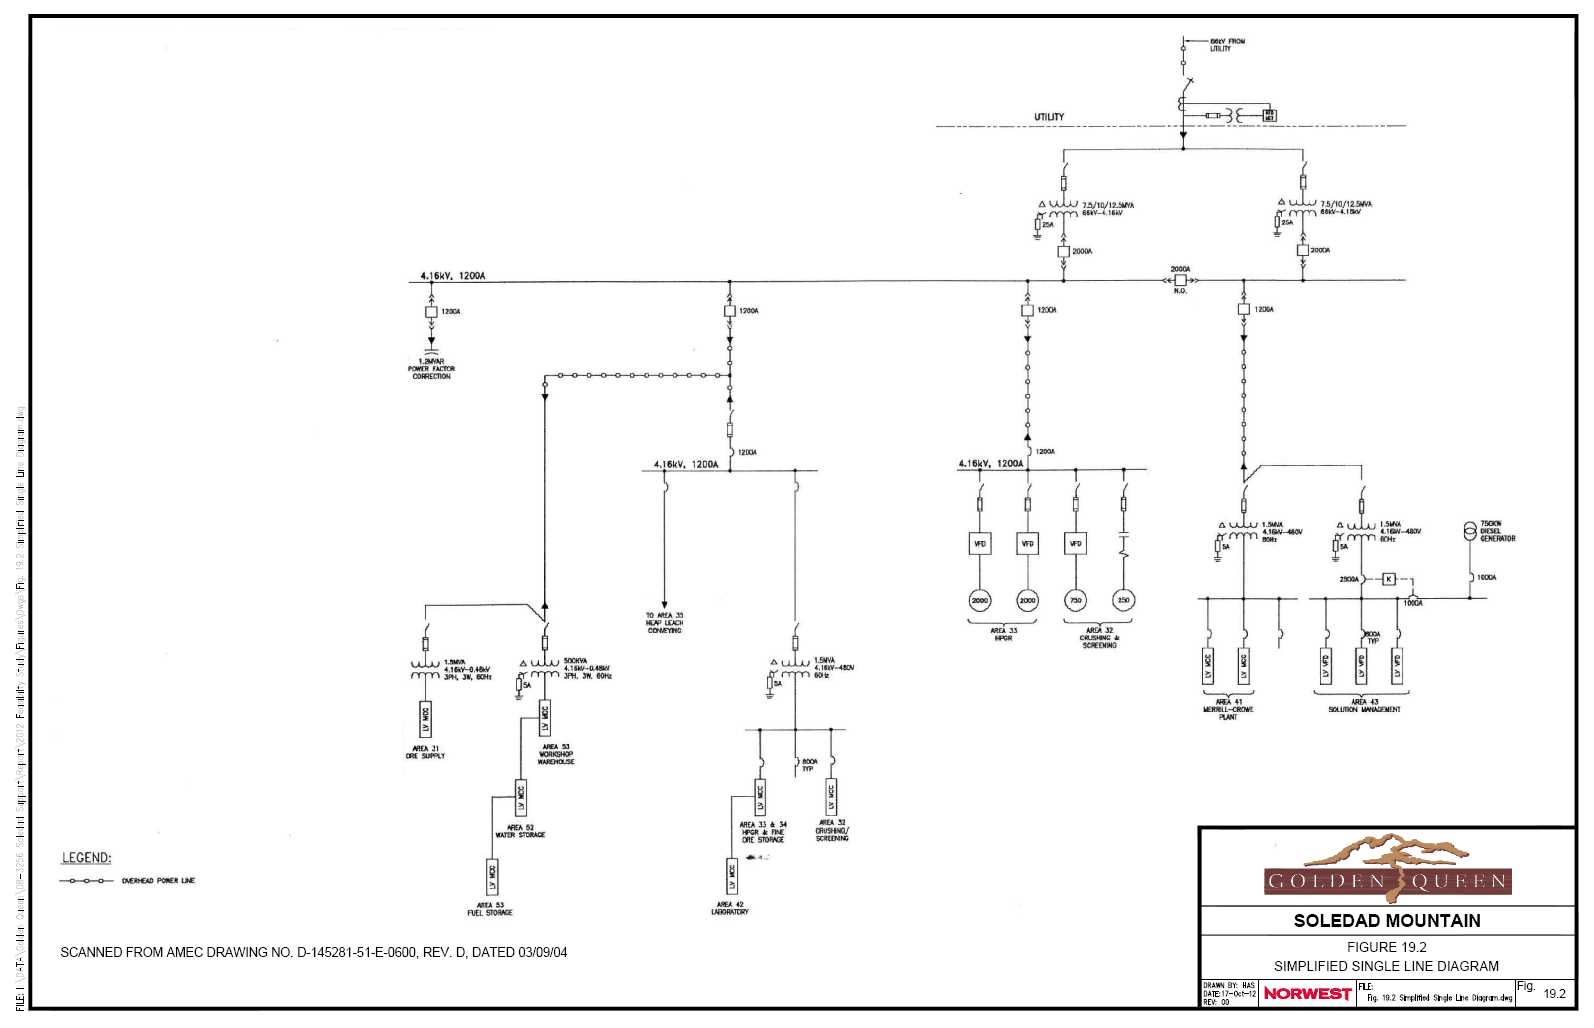
| Soledad Mountain Project
Kern County, CA, USA
Technical Report |
| 20 | MARKET STUDIES AND CONTRACTS |
20.1 Marketing Agreements
GQM has not entered into any agreement for selling refined gold and silver. GQM has also stated in its public documents such as the Form 10-K dated March 29, 2012 that it is not expected that GQM will hedge any of its gold or silver production.
It is expected that a by-product aggregate and construction materials business can be developed once the heap leach operation is in full production, based on the location of the Project in southern California with close proximity to major highways and railway lines. The source of raw materials will be suitable quality waste rock specifically stockpiled for this purpose. The waste rock can be classified into a range of products such as riprap, crushed stone and sand with little further processing. Test work done in the 1990s confirmed the suitability of waste rock as aggregate and construction material. The Company also plans to process and sell leached and rinsed residues from the heap leach operation for a range of uses to local and regional markets. It is intended that these products will be sold over a period that extends beyond the planned gold and silver production period, but no contributions from the sale of such products will be included in the cash flow projections until long term contracts for the sales of these products are secured.
20.2 Gold and Silver Sales
The Project will produce a dorè in the refinery on site. It is expected that the dorè will be shipped to the refinery owned by Johnson Matthey Inc. in Salt Lake City, Utah. The dorè will be smelted and refined to produce saleable gold and silver. The gold and silver will be sold by Johnson Matthey Inc. at spot on the day it is produced. That is the conventional and generally accepted procedure for dealing with gold and silver produced by a smaller heap leach operation such as the Project. Smelting and refining charges were confirmed by Johnson Matthey Inc. in August 2012.
Norwest’s QP has reviewed and accepts these documents as supporting the assumptions in the feasibility study and technical report.
| October 2012 | 20-1 | |
| Soledad Mountain Project
Kern County, CA, USA
Technical Report |
| 21 | ENVIRONMENTAL STUDIES, PERMITTING, COMMUNITY IMPACT |
21.1 Approvals and Permits
The Project is subject to Federal, State and County acts and regulations governing precious metal cyanide heap leach operations.
21.1.1Land Use - Conditional Use Permits
The environmental setting of the Project was documented in a number of baseline studies completed from 1990 onwards and in the final Environmental Impact Report (the EIR) and Environmental Impact Statement (the EIS) completed in 1997. The Kern County Board of Supervisors unanimously approved two Conditional Use Permits (CUPs) for the Project in September 1997 (i.e. CUP Case No. 41, Map No. 213 and CUP Case No. 22, Map No. 214). The Bureau of Land Management subsequently issued its Record of Decision approving the Plan of Operations under NEPA in November 1997. The company completed a number of studies and did significant work on site in 2005 and 2006 to document that the environmental setting for the Project has not changed since 1997.
The State of California introduced backfilling requirements for certain types of open pit, metal mines in December 2002. The company contended that these regulations did not apply to the Project under a grandfathering provision included in the regulation. The company therefore pursued both a favorable interpretation under the regulation and subsequently an amendment of the regulation with the State Mining and Geology Board (the Board) in 2006. These efforts were supported by Kern County officials. Both approaches were rejected by the Board and the decision was duly recorded by the Board in January 2007.
Norwest prepared a life-of-mine waste rock management plan and this plan incorporates sequential and partial backfilling of mined-out phases of the open pit with rehandle of waste at the end of the mine life to meet backfill requirements. This plan was included in an Application for a revised Surface Mining Reclamation Plan, which was submitted to the Kern County Planning & Community Development Department (the Planning Department) on April 9, 2007.
The Kern County Planning Department completed its review of the Application as set out in a letter dated July 24, 2007. The Planning Department noted that changes proposed for the Project constituted new information that required evaluation of potential impacts and mitigation in a Supplemental Environmental Impact Report (SEIR).
The draft SEIR was completed and distributed in January 2010. The Kern County Planning Commission formally considered the Project at its regularly scheduled meeting in Bakersfield on April 8. At the meeting, the Planning Commission, consisting of a panel of three commissioners, unanimously approved the Project. All appeals that were subsequently filed against the Planning Commission’s decision have been withdrawn and the decision made by the Planning Commission is now final. The Planning Commission certified the SEIR, adopted a Mitigation Measures Monitoring Program and Conditions of Approval for the Project which define conditions and performance standards which the mining operation must meet. The Mitigation Measures Monitoring Program and Conditions of Approval for the Project were amended by Planning Commission Resolution No. 171-10 adopted on October 28, 2010 and are now final. Record of the certification is available at GQM’s office in Vancouver and at the offices of the Kern County Planning Department in Bakersfield.
| October 2012 | 21-1 | |
| Soledad Mountain Project
Kern County, CA, USA
Technical Report |
The Bureau of Land Management confirmed that its Record of Decision approving the Plan of Operations under NEPA in November 1997 remains valid.
GQM is currently addressing conditions in the CUPs that apply to closure and closing reclamation.
21.1.2Water Quality– Report of Waste Discharge and Waste Discharge Requirements
The Lahontan Regional Water Quality Control Board (the Regional Board) is responsible for ensuring compliance with the federal Clean Water Act and California’s Porter-Cologne Water Quality Act.
GQM submitted a Report of Waste Discharge (ROWD), prepared by WZI Inc., Bakersfield, to the Regional Board in June 1997. The Regional Board adopted Board Order No. 6-98-9 on March 5, 1998 at a meeting held in Lancaster and this set the Waste Discharge Requirements for the Project.
GQM and its consulting engineers prepared and submitted a revised ROWD to the Regional Board on March 8, 2007. The revised ROWD was prepared at the request of the Regional Board to document changes in the layout and design of the heap leach facility plus other changes proposed for the Project.
The Regional Board unanimously approved Waste Discharge Requirements (WDR) and a Monitoring and Reporting Program for the Project at a public hearing held in South Lake Tahoe on July 14, 2010 (reference Board Order No. R6V-2010-0031). The Board Order was subsequently signed by the Executive Officer of the Board and is now in effect.
The order approving the WDRs is a critical authorization for the construction and operation of, and establishes the discharge and monitoring standards for, the heap leach pads, rock stockpiles and other activities that have the potential to affect surface and ground waters.
A Stage I, Surface Water, Sediment and Erosion Control Plan has been prepared for the construction and early mining phases of the Project. This design applies to both the Approved Plan and the “What If Scenario”. Storm Water discharges will be regulated by the Water Board under the State’s NPDES General Construction Storm Water Permit during the initial construction phase of the Project and under the NPDES General Industrial Storm Water Permit during mine operations. ARCADIS U.S., Inc., a Qualified SWPPP Developer in California, therefore prepared the designs and GQM has filed Permit Registration Documents electronically through the Storm Water Multiple Application and Report Tracking System (SMARTS). The Documents include a Notice of Intent, Storm Water Pollution Prevention Plan (SWPPP), Risk Assessment, a Site Map and a signed certification statement by the Legally Responsible Person. GQM has also paid the first annual fee. Note that the SWPPP alone is a 200-page document. Note further that the Documents filed through SMARTS meet applicable NPDES Storm Water Program requirements of the Kern County Engineering, Surveying & Permit Services Department. The Notice of Intent is now active.
| October 2012 | 21-2 | |
| Soledad Mountain Project
Kern County, CA, USA
Technical Report |
GQM and its consulting engineers prepared and submitted a second, revised ROWD to the Regional Board on April 16, 2012. The revised ROWD was prepared at the request of the Regional Board bring current all of the information that has been developed for the Project since 2007. The revised ROWD also includes an updated Closure Plan.
Rinsing and neutralization of the leached residues on the heap are described in sub-section 18.2.7.
21.1.3Air Quality– Authority to Construct and Permit to Operate
GQM had obtained seven Authority to Construct permits dated March 16, 2002. These permits expired on March 16, 2004 and were not renewed due to changes anticipated in the Project.
A revised and updated Air Quality and Health Risk Assessment for the Project was completed and submitted to the Planning Department and the Eastern Kern Air Pollution Control District (EKAPCD) on July 21, 2009. All concerns about possible emissions were fully addressed in the SEIR. Feasible mitigation measures to reduce potential impacts from the Project to levels that are less than significant were recommended in the SEIR and included in the Mitigation Measures Monitoring Program or Conditions of Approval.
Ten applications for Authority to Construct permits were submitted to the EKAPCD in February 2011. The EKAPCD confirmed that the information required to support the applications was complete. The draft Authority to Construct permits were received in September 2011. The Company’s consulting engineers and legal counsel completed their review of the draft Authority to Construct permits in January 2012. The Authority to Construct permits were issued by EKAPCD on February 8, 2012.
The Authority to Construct permits will be converted to a Permit to Operate after construction has been completed and subject to inspection by EKAPCD.
21.1.4Closure, Reclamation and Reclamation Financial Assurance
GQM prepared detailed a detailed closure and reclamation plan and cost estimates for ongoing reclamation and reclamation at the end of the life of the mine and the reclamation plan and cost estimates were included in the Application for a revised Surface Mining Reclamation Plan. The revised ROWD also includes an updated Closure Plan, see Section 21.1.1.
| October 2012 | 21-3 | |
| Soledad Mountain Project
Kern County, CA, USA
Technical Report |
Cost estimates for site reclamation are described in Section 22.6. GQM will provide reclamation financial assurance as required by the regulatory authorities as described in Section 22.6.
21.1.5Additional Approvals and Permits
A number of additional approvals and permits will be required as project development proceeds, as detailed below:
| | • | New Eagle Road non-summary street vacation (Completed March 20, 2012). |
| | | |
| | • | Kern County building permits to include all applicable California codes. |
| | | |
| | • | Permit to store and dispense fuel onsite with provision for gasoline vapor recovery. |
| | | |
| | • | Newly implemented security requirements make contract blasting a preferred option and a contract blasting service will be used. The contractor will obtain the necessary approvals and permits. |
21.1.6Environmental Management System
Golden Queen Mining Co., Inc. is implementing an Environmental Management System (EMS) for its Soledad Mountain Project to manage the compliance obligations of its approvals and permits and applicable regulations. Basic elements of the system include:
| | • | Define and review legal requirements; |
| | | |
| | • | Develop a set of objectives and set targets to ensure compliance; |
| | | |
| | • | Establish programs to meet these objectives and targets; |
| | | |
| | • | Monitor and measure progress in achieving the objectives; |
| | | |
| | • | Track regulatory citations and permit terms and stipulations; |
| | | |
| | • | Schedule compliance obligations tasks with email reminders; |
| | | |
| | • | Document incident details as required by federal, state and local agencies; |
| | | |
| | • | Schedule and record employees' environmental training; |
| | | |
| | • | Generate the information necessary for agency-required reports, and |
| | | |
| | • | Periodically review the effectiveness of the EMS and make improvements. |
The EMS will assist the company in addressing its regulatory requirements in a systematic and cost-effective manner. This proactive approach reflects the company’s commitment to reduce the risk of non-compliance. The EMS will also help manage non-regulated opportunities, such as energy conservation, and can promote stronger operational control and employee stewardship.
21.2 Environmental Issues
Environmental issues were fully addressed in the SEIR, which is described in sub-section 21.1.1. The Kern County Planning Commission certified the SEIR, adopted a Mitigation Measures Monitoring Program and Conditions of Approval for the Project which define conditions and performance standards which the mining operation must meet. The Mitigation Measures Monitoring Program and Conditions of Approval for the Project were amended by Planning Commission Resolution No. 171-10 adopted on October 28, 2010 and are now final.
| October 2012 | 21-4 | |
| Soledad Mountain Project
Kern County, CA, USA
Technical Report |
21.3 Considerations of Social and Community Impacts
Mojave and the surrounding areas are areas of relatively high unemployment and employment has not recovered since the start of the financial downturn in 2008. The Project has therefore had a positive response from the local communities.
The Project is expected generate 200 jobs for an estimated total of 142 man-years of employment during construction. The Project will further have between 150 and 165 employees for the gold and silver heap leach operation once the mine is in full production and a further 15 employees for during the period when aggregrate is being produced from the site.
Jobs in the mining industry tend to be high-paying jobs when compared to the service industry.
GQM plans hire personnel mainly from the local area. The Kern County career-development office in Mojave had received upwards of 1,200 applications for employment specifically targeted at the Project at last count on February 1, 2012. These include applications from a significant number of experienced equipment operators and persons with a range of skills in the maintenance area.
Training of personnel for the operation will be required and will be done on an ongoing basis.
| October 2012 | 21-5 | |
| Soledad Mountain Project
Kern County, CA, USA
Technical Report |
| 22 | CAPITAL AND OPERATING COSTS |
22.1 Manpower Estimates
22.1.1Salaried Personnel
GQM salaried employees will be responsible for the management and technical aspects of the operation. Responsibilities handled by salaried employees cover the areas of mining, processing, maintenance, purchasing/accounting/payroll and environmental management. During full production, the number of salaried employees on site will typically be 31.
The shift schedule of the salaried employees is dependent upon their position. Mine operations, plant operations and maintenance foremen will work with the production crew they are responsible for on a 12-hour shift. The managers, most of the engineers and administrative/clerical employees will work an 8-hour shift.
A number of salaried employees will be hired in the pre-production year prior to assist in the construction phase of the Project.
Salary and benefits are discussed in Section 22.1.3.
22.1.2Hourly-Paid Personnel
Hourly-paid personnel will be responsible for direct mining and processing operations,, maintenance and support. Personnel will be employed directly by GQM.
GQM plans hire personnel mainly from the surrounding communities. Currently, unemployment in the area is relatively high. However, given the limited amount of mining activity in the area, training of personnel for the operation will be required on an ongoing basis.
The schedule and method of calculating earnings for the hourly-paid employees is based on the following assumptions:
| | • | The mine will operate 24 hours per day, seven days per week and 365 days per year. |
| | | |
| | • | Employees working a continuous shift schedule will work a four days on and four days off schedule and the shift will be 12 hours long. |
| | | |
| | • | The working year for hourly-paid employees is based upon 351 days per year and 10 working days of vacation. The number of hours worked by an employee is therefore 2,106 hours. |
| | | |
| | • | Number of shifts worked by an hourly-paid employee is 175.5 shifts. |
| | | |
| | • | Straight time is paid for eight hours per shift and overtime is paid for four hours per shift. Note that this is a conservative estimate of the overtime paid as variations are permissible in California. |
The assumptions have been used to calculate the number of hourly-paid employees required and employee pay per year.
| October 2012 | 22-1 | |
| Soledad Mountain Project
Kern County, CA, USA
Technical Report |
The estimated number of hourly-paid employees required over the Project’s life vary from a low of 116 to a high of 138 employees depending upon the ore and waste rock mining rates over the Project life. In order to reduce the variation in the number of hourly-paid employees from year to year, the feasibility of using increased overtime to cover peak production periods should be examined.
Salary and benefits are discussed in Section 22.1.3.
22.1.3Salary and Benefits
Every effort has been made to obtain realistic estimates for salaries, rates of pay for hourly-paid employees and benefits. This will require regular monitoring and updates as economic conditions change in the greater Mojave area.
22.2 Capital Cost Estimates
22.2.1Estimating Methods
In order to generate an estimate with an accuracy of +/- 10%, engineering designs have been completed for all of the facilities required for the Project. Drawings range from basic topographical maps of the site to process flow sheets, P&IDs and detailed general arrangement drawings.
Bids were solicited from equipment manufacturers and from contractors that can construct the facilities with a focus on acquiring bids from contractors located in the region, most of whom are familiar with conditions in the area.
Construction manpower and equipment required and bulk material quantity costs were estimated using current Project data and take-offs from the engineering drawings.
Cost estimates for major components have been updated during 2012.
22.2.2Basis of Estimate
The following criteria were used to develop the capital and operating cost estimates:
| | • | Project location and classification– approximately 8km (5 miles) south of Mojave, California; new open pit mine development; includes upgrade of existing access to site. |
| | | |
| | • | Power supply– power to be supplied by Southern California Edison from a 66 kV line that runs along the property boundary. |
| | | |
| | • | Water supply– initial water supply from groundwater with possible supply of treated water from AVEK or recycled water from the Rosamond Community Services District. |
| October 2012 | 22-2 | |
| Soledad Mountain Project
Kern County, CA, USA
Technical Report |
| | • | Estimated design and construction dates– detailed engineering design for construction began in 2009 to support construction beginning in the first quarter of 2013. |
| | | |
| | • | Current mine life / life of facilities– fifteen months for construction, fifteen years of mining with one year of additional leaching and two years of neutralizing and rinsing. The potential for aggregate production using crushed waste rock and the sale of leached and rinsed residues is being actively pursued and could be carried on for some period beyond the planned gold and silver production period. |
| | | |
| | • | Facility usage level– 351 days/year, 24 hours/day (two 12-hour shifts) mining and operation of the crushing-screening plant and conveying and stacking system and 365 days/year, 24 hours/day (two 12-hour shifts) for the processing facilities such as the Merrill-Crowe plant and the assay laboratory and support facilities. |
| | | |
| | • | Design ore processing capacity– 4.6 million tonnes or 5.1 million tons per year. |
| | | |
| | • | Regulatory requirements– designs require approval and sign-off by a number of Federal, State and County agencies. |
| | | |
| | • | Equipment– only new equipment is used for the capital and operating cost estimates. |
| | | |
| | • | Personnel availability– excellent manpower availability in the greater Mojave area; travel to/from Mojave and the surrounding communities during construction; no construction camp required. |
| | | |
| | • | Waste rock management– only one waste rock dump east of the open pits and backfilling in mined-out phases of the open pits; waste rock processed and sold as aggregate. |
22.2.3Construction Field Coordination
It is assumed that GQM will maintain oversight of all construction and initial mining activities with a number of contractors managing construction of the key Project components. The construction management team will consist of the GQM project manager and support personnel, design consultants, and construction personnel. The start-up commissioning team will consist of
GQM’s site team with support from the construction team.
Key project components are set out below:
| | • | Pre-production mining |
| | | |
| | • | Site preparation |
| | | |
| | • | Access road |
| | | |
| | • | Crushing-screening plant |
| | | |
| | • | Construction of leach pad phase 1, stage 1 |
| | | |
| | • | Conveying and stacking |
| | | |
| | • | Merrill-Crowe plant |
| | | |
| | • | Laboratory |
| | | |
| | • | Workshop and warehouse |
| October 2012 | 22-3 | |
| Soledad Mountain Project
Kern County, CA, USA
Technical Report |
| | • | Water supply and water storage |
| | | |
| | • | Power supply and distribution |
22.2.4Allowances
Specific allowances have been included in the capital cost estimates:
| | • | Construction equipment requirements determined by consulting engineers and contractors |
| | | |
| | • | QA/QC during construction |
| | | |
| | • | Vendor representatives on site during construction and commissioning |
| | | |
| | • | Commissioning spare parts |
| | | |
| | • | Initial fills |
| | | |
| | • | Operating and maintenance manuals |
| | | |
| | • | Owner’s insurance included in the pre-production overhead |
22.2.5Pre-production Development of the North-west Open Pit
Initial waste rock and ore mining and road construction have been included in the development capital. The geology of the North-West Pit is such that ore is released early in mining without the need for significant pre-stripping of waste rock. A portion of the ore mined during Year 0 will be stockpiled and then crushed and placed on the Phase 1, Stage 1 heap leach pad as the drainage layer.
22.2.6Unallocated Cost
Allowance has been made for unallocated costs of 7.5% or $6.26 million of the estimated capital costs (excluding major mine equipment). This is judged to be a reasonable allowance in light of the detailed engineering that has been completed and accompanying cost estimates that have been obtained from vendors and contractors for the Project.
22.2.7Working Capital
The estimated working capital required is $10 million. This is an estimate of the cash required from the initial commissioning of the facilities until positive cash flow is achieved. This estimate is approximately equal to four months of operating costs.
22.2.8Capital Cost Summary
The estimated capital cost including owner’s cost is $90.68 million excluding major mining equipment. The estimated capital cost does not include the cost of major mining equipment but does include the cost of leasing mining equipment for pre-production mining in Year 0. The initial capital cost of the major mining equipment is $17.23million.
| October 2012 | 22-4 | |
| Soledad Mountain Project
Kern County, CA, USA
Technical Report |
Norwest understands that GQM has received a proposal for lease financing the major mining equipment and this has been allowed for in the above capital cost estimate. The effects of leasing the major mining equipment are discussed in Section 22.5.
22.3Sustaining Capital Cost Estimates
Estimated sustaining capital costs are shown in Table 23.1. The estimated sustaining capital for the Project is approximately $30.58 million inclusive of sales taxes. The sustaining capital includes purchase of a carbon plant for short-term use during the neutralizing and rinsing phase of the operation.
A State sales tax of 8.25% has been applied to all applicable costs (see also Section 22.4.5) .
22.4 Operating Cost Estimates
22.4.1Estimating Methods
Tables in Section 22.4 and Section 22.5 have been taken directly from the cash flow model developed for the Project. Table 22.1 summarizes annual operating costs by major project components.
The operating costs are developed from zero-base budgeting using estimated labour rates, equipment productivities and supply costs (i.e. diesel fuel, explosives, reagents and a range of operating supplies).
The mine operating cost estimates include all mining and process related activities from the start of production up to the production of gold and silver dorè. Downstream smelting and refining charges and royalties are included as stand-alone items in the cash flow model and are included in the economic analysis.
22.4.2Basis of Estimate
The operating costs have been developed based on a number of specific operating cost centres as set out below.
| | • | Mining (Drilling, Blasting, Loading, Hauling, Surface Crew, Overhauls) |
| | | |
| | • | Ore Supply |
| | | |
| | • | Crushing & Screening |
| | | |
| | • | Conveying & Stacking |
| | | |
| | • | Solution Management |
| | | |
| | • | Merrill-Crowe Plant |
| | | |
| | • | Laboratory |
| | | |
| | • | Maintenance |
| October 2012 | 22-5 | |
| Soledad Mountain Project
Kern County, CA, USA
Technical Report |
| | • | General Site Support |
| | | |
| | • | Services |
| | | |
| | • | Administration |
| | | |
| | • | Power Consumption & Costs |
| | | |
| | • | Diesel Fuel Contingency |
| | | |
| | • | Equipment Leases |
A detailed, life of mine operating cost estimate has been prepared for each of the operating cost centers set out above and is included in Norwest’s feasibility study report. Each of the tables includes notes that provide a basis for the estimates.
Costs reported assume an owner-operated mine.
The effect of leasing the primary mining equipment is discussed in Section 22.5.
22.4.3Hourly Operating Costs for Mining and Support Equipment
Detailed cost estimates per operating hour were prepared for the mining and support equipment based on annual hours of usage determined from the mine plan. The estimated hourly operating costs are an important set of cost estimates for the Project and were incorporated into the overall cashflow model.
22.4.4Diesel Fuel Contingency
Diesel fuel consumption has been estimated for the mining and support equipment. The base cost for dyed diesel fuel was $2.77 on per gallon on August 13, 2010 and this was provided by a fuel vendor based in Mojave. This base cost has been allowed for in the operating costs estimates for each of the operating cost centres shown in Section 22.4.2. Allowance has however been made for a diesel fuel contingency. The diesel fuel contingency can be updated by contacting the vendor in Mojave and this is allowed for as a line item in the cash flow model.
22.4.5Sales Tax
A State sales tax of 8.25% has been applied to all applicable capital and operating costs. Sales taxes have been explicitly broken out for materials with the exception of fuel, lubricants, explosives and power where it is already included in the price. Detail is provided in each of the operating cost centres. Sales taxes on operating supplies are shown as a line item in the cash flow table.
22.4.6Operating Cost Summary
Operating costs are based on second or third quarter 2012 estimates. No escalation or inflation is included in any of the operating cost estimates from the third quarter 2012 onwards. Operating costs are summarized in Table 22.1 for the life of the mine. The costs in Table 22.1 show direct costs per ton as well as all-in costs per ounce and ton ore. Average direct operating costs per ounce Au-eq are $354/oz.
| October 2012 | 22-6 | |
| Soledad Mountain Project
Kern County, CA, USA
Technical Report |
22.5 Equipment Lease Financing
The base case cash flow projection for the Project assumes purchase of the major mining equipment as described in Section 23. The preferred alternative is however lease financing for the major mining equipment.
GQM has had discussions with major equipment suppliers related to lease financing of the major mining equipment. An equipment distributor for Komatsu equipment with significant operations in Arizona and southern California has made a lease-financing proposal. This proposal allows that when equipment needs to be replaced, a new lease following similar conditions to the original lease will be available.
Note that the equipment distributor for the Komatsu equipment intends to build a maintenance facility in Mojave to support the Komatsu equipment in use by a number of mining operations and quarries in the region. The decision to build such a facility would be triggered by GQM’s decision to acquire Komatsu equipment for the Project. The equipment distributor also has extensive experience with equipment maintenance and could readily do the maintenance of the equipment under contract for a number of years. A maintenance facility built in Mojave would be a significant boost for Mojave as well.
The decision to either purchase or lease the major mining equipment is a choice between financing options and this is a choice that must be made by GQM management.
22.6 Financial Assurance Cost Estimates for Closure and Reclamation
22.6.1Background Information
Financial assurance cost estimates are reviewed annually and financial assurances adjusted in accordance with the requirements the Surface Mining and Reclamation Act of 1975 (“SMARA”) to ensure that adequate funds are provided for reclamation of disturbed areas.
| October 2012 | 22-7 | |
| Soledad Mountain Project
Kern County, CA, USA
Technical Report |
Table 22.1 Operating Costs Summary
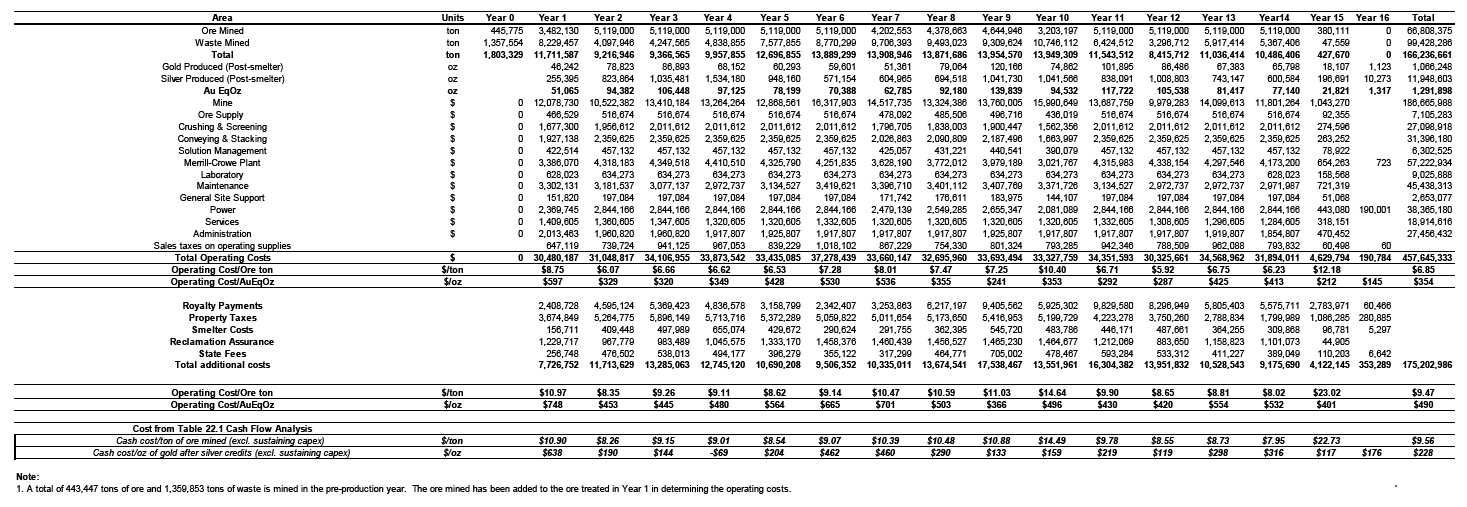
| October 2012 | 22-8 | |
| Soledad Mountain Project
Kern County, CA, USA
Technical Report |
Financial assurance is required in three forms:
| | i. | Reclamation financial assurance required by Kern County under SMARA; |
| | | |
| | ii. | Neutralization and Closure financial assurance required by the Board Order and |
| | | |
| | iii. | “Reasonably Foreseeable Release” financial assurance required by the Board Order. |
The following provision was included in CUP #27, Map #196, October 28, 2010:
(57) Prior to commencement of mining operations, the applicant shall post or establish and maintain with the Director of the Kern County Engineering, Surveying, and Permit Services Department and the California Department of Conservation/Office of Mine Reclamation one of the following:
| | a. | An irrevocable letter of credit. |
| | | |
| | b. | A surety bond. |
| | | |
| | c. | A trust fund in accordance with the approved financial assurances to guarantee the reclamation work will be completed in accordance with the approved reclamation plan. |
The financial institution or surety company shall give the County at least 120 days’ notice of intent to terminate the letter of credit or bond. Financial assurances shall be reviewed annually and adjusted in accordance with the Surface Mining and Reclamation Act of 1975 (SMARA) requirements to substantiate that adequate funds exist to ensure reclamation of all existing disturbed acreage and the maximum amount of acreage expected to be disturbed during each coming calendar year. In addition, the financial assurances shall be adjusted annually to guarantee reclamation of excavated materials placed on site that exceed 25 feet of original surface contours pursuant to California Code of Regulations Section 3704.1. Prior to the approval of revised financial assurance, the Lead Agency shall submit all documentation to the California Department of Conservation/Office of Mine Reclamation for a 45 day review and comment period, pursuant to SMARA Section 2774.
22.6.2Form of Financial Assurance
Kern County has various forms in which the financial assurance can be provided as set out above and information is available on the County web site at www.co.kern.ca.us/planning.
22.6.3SMARA Financial Assurance - 2012
The estimate for reclamation of historical disturbances on the property is $335,457. GQM provides the financial assurance in the form of an Irrevocable Standby Letter of Credit and the amount is on deposit with a branch of Union Bank, N.A., Bakersfield.
| October 2012 | 22-9 | |
| Soledad Mountain Project
Kern County, CA, USA
Technical Report |
22.6.4Closure and Reclamation Cost Estimates - 2007
Closure and reclamation cost estimates were prepared by Golder for the Application for a revised Surface Mining and Reclamation Plan prepared by GQM and submitted to the Kern County Planning and Community Development Department in April 2007 (Revised May 25, 2009).
The following closure and reclamation cost estimates were prepared by Golder:
The estimate was to $8,052,703 or $0.0555/t ($0.0505/ton)
| | 2. | Neutralization & Closure |
The estimate was $1,314,937 or $0.0280/t ($0.0255/ton) .
| | 3. | “Reasonably Foreseeable Release” |
The estimate was $464,250 or $0.0320/t (0.0291/ton) .
The total reclamation accrual was $0.1155/t ($0.1050/ton) of ore and waste mined.
22.6.5Reclamation and Closure Cost Estimates - 2012
There is a requirement in the approvals received for the Project that the closure and reclamation cost estimates be revised every year and be submitted for approval.
Financial assurance for the “Reasonably Foreseeable Release” estimated at $461,350 will be provided at the start of production. In addition, the reclamation accrual allowed for in the cash flow model is $0.1155/t ($0.1050/ton) of ore and waste rock mined for the life of the mine and this is accumulated in a reclamation fund. Interest is allowed for at 2.0% . The total accrual is $17.45 million over the 15 year period. Reclamation is done from Year 15 onwards.
The reclamation accrual and the actual reclamation costs incurred from Year 15 onwards are only indicative at best at this point in time. Since costs have been charged as a cash operating cost through the life of the mine, there will be no further impact on Project cash flows.
The financial assurance will be released as reclamation work is completed and this procedure is well-established.
| October 2012 | 22-10 | |
| Soledad Mountain Project
Kern County, CA, USA
Technical Report |
23.1 Valuation Methodology
Tables referred to in Section 23 have been taken directly from the cash flow model for the Project and have been grouped in Attachment C, for example Table 23.1.
The valuation is based upon net present values and internal rates of return using a discounted cash flow approach.
Project cash flows from year zero to year sixteen or from Project start-up to closure and reclamation of the heap leach facilities are shown in Table 23.1.
The pre-tax cash flow analyses are presented in Section 23.4.
23.2 Financial Model Parameters
23.2.1Basic Parameters
The base case cash flow analysis is done on a constant United States dollar, pre-tax, stand-alone project basis. The base case analysis assumes that GQM provides the capital required for preproduction mining, construction and the start-up of operations. Capital cost estimates are based upon quotes for construction from a number of key vendors and contractors based in southern California. The capital cost required is estimated to be $108.5 million and this includes unallocated costs of $12.5 million. It is estimated that a further $10.5 million will be required as working capital. Total estimated capital costs are therefore $119 million.
Operating costs are described in Section 22.4. Operating costs are based on second or third quarter 2012 estimates. No escalation or inflation is included in any of the operating cost estimates from the third quarter 2012 onwards.
Capital cost estimates for all major components have been brought current in Q2 or Q3 2012.
23.2.2Metal Prices
Gold and silver prices used to model the base case cash flows are $1,749.00 and $33.03 respectively, the London fix for precious metals on October 17, 2012. Prices are fixed for the life of the mine.
An analysis is done with trailing 36-month average gold and silver prices of $1,438/oz and $27.65/oz respectively to the end of September 2012. The trailing 36-month average metals prices are accepted by the U.S. Securities And Exchange Commission for reporting mineral reserves.
| October 2012 | 23-1 | |
| Soledad Mountain Project
Kern County, CA, USA
Technical Report |
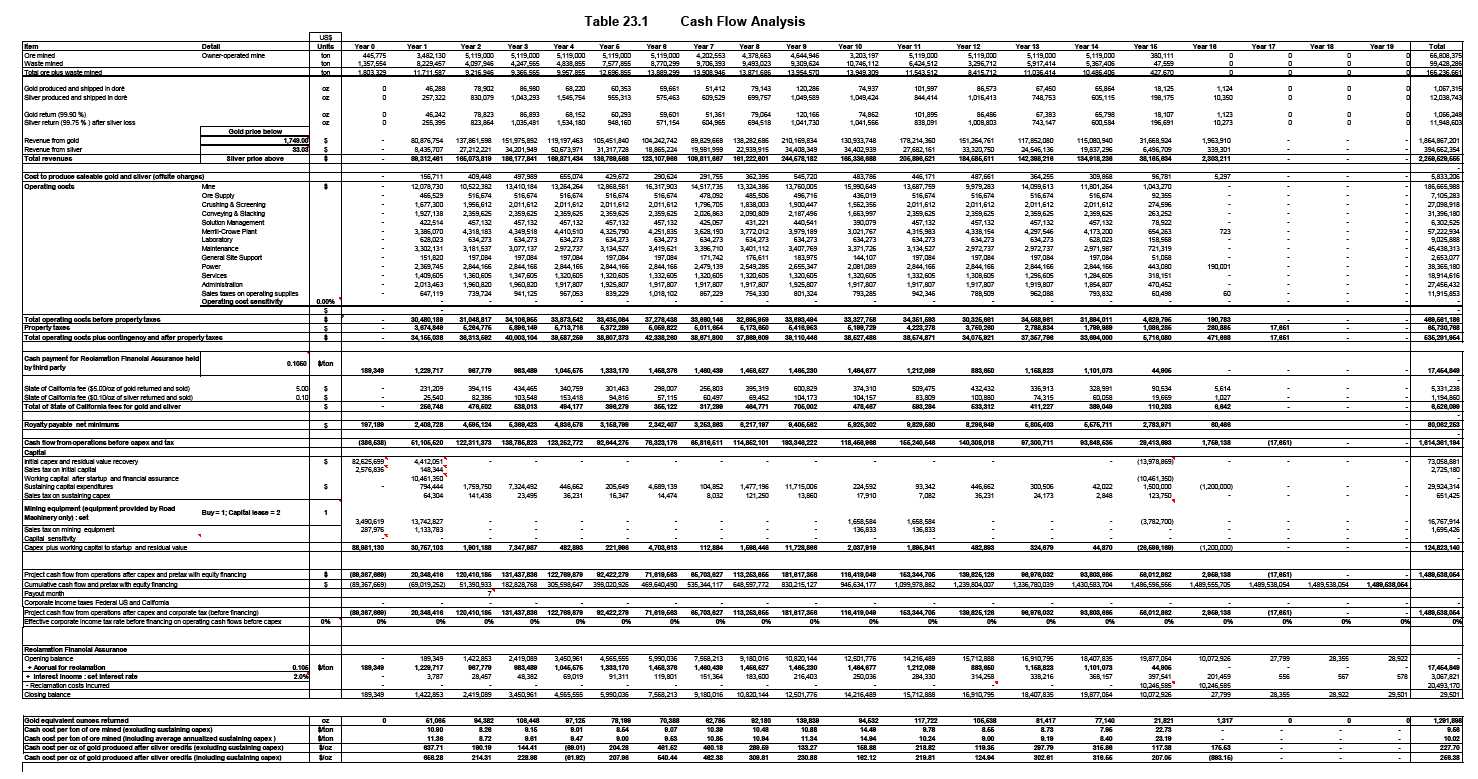
| October 2012 | 23-2 | |
| Soledad Mountain Project
Kern County, CA, USA
Technical Report |
23.2.3Net Smelter Returns
The Project will produce a dorè in the refinery on site. The quantity and quality of the dorè produced on site are described in Section 13.8 and Section 13.9 respectively. It is expected that the dorè will be shipped to the refinery owned by Johnson Matthey Inc. in Salt Lake City, Utah and that is the assumption that has been made for the cash flow analysis. The smelting and refining charges provided by Johnson Matthey Inc. are described in Section 13.10. The payable gold and silver, freight from site to Salt Lake City and treatment costs are shown in Table 16.7.
23.2.4Sales Taxes
A State sales tax of 8.25% has been applied to all applicable capital and operating costs as described in Section 22.4.5. Sales taxes on operating supplies are shown as a line item in the cash flow table.
23.2.5Property Taxes
Kern County property taxes are treated as an operating cost in the cash flow model. Property taxes for industrial projects in Kern County are calculated based on 1.0% of the calculated annual remaining net present value for the Project. The net present value is calculated on net cash flow after subtracting cost to produce saleable gold and silver, operating costs, accrual for reclamation, and all capital expenditures. The discount rate used for calculation of the annual NPV is negotiated with the County. The County has indicated that a discount rate in the range of 19.0% is reasonable. A discount rate of 19.0% has been used for the calculation of property taxes. Property taxes are shown as a line item in the cash flow table.
23.2.6Reclamation and Closure Costs
Reclamation and closure cost estimates are described in Section 22.6. The reclamation accrual is shown as a line item in the cash flow table.
23.2.7Royalties and State Fees
There are multiple third party landholders and the royalty formula applied to mine production varies with each landholder. This leads to a complex set of royalty calculations. Norwest has developed a model for a detailed royalty calculation and this is a separate tab in the cash flow model.
State fees for payable gold and silver have been applied at the following rates:
| | • | Gold royalty = $5.00/oz gold (post-smelter) |
| | | |
| | • | Silver royalty = $0.10/oz silver (post-smelter) |
Royalties paid to third party landholders and fees paid to the State are shown as line items in the cash flow table.
| October 2012 | 23-3 | |
| Soledad Mountain Project
Kern County, CA, USA
Technical Report |
23.2.8Salvage Value
The valuation assumes there is a salvage value of $14 million realized in Year 15 from the sale of mine equipment and plant facilities which can be removed from site. The salvage value for the mine equipment has been estimated by prorating the original equipment cost by the remaining useful life of the equipment and then applying a discount factor.
23.2.9Federal and State Taxes
Norwest has developed a model for a detailed calculation of Federal and State taxes and this is a separate tab in the cash flow model. The taxes are calculated on the assumption that Golden Queen Mining Co., Inc. is a stand-alone company with the Soledad Mountain Project its only asset. The tax calculation also allows for the tax loss carry-forward as per the GQM’s financial statements to December 31, 2011. Federal and State taxes are shown as a line item in the cash flow table.
23.3 Equipment Lease Financing
Lease financing of major mining equipment is described in Section 22.5.
Lease financing of equipment is a financing technique and this is one of the options being analyzed by GQM management for consideration as the project moves forward.
23.4 Cash Flow Analysis
23.4.1Pre-tax Cash Flow Analysis
The base case cash flow analysis is done on a constant United States dollar, pre-tax, stand-alone project basis.
At current gold and silver prices, the Project has a pre-tax indicated internal rate of return (“IRR”) on capital employed of 82.9% . The net present value (“NPV”) is $787 million with a discount rate of 8%, and the undiscounted, cumulative net cash flow is approximately $1.49 billion. For comparison, at a 5% discount rate the NPV is $986 million. The indicated contribution of gold and silver to gross revenues is 83% and 17% respectively with an all-inclusive average cash cost per ounce of gold produced, net of silver credits, of $256/oz. Gold and silver prices used to model the cash flows are $1,749 and $33.03 respectively, the London fix for precious metals on October 17, 2012.
When trailing 36-month average gold and silver prices of $1,438 /oz and $27.65/oz respectively to the end of August 2012 are used to model the cash flows, the pre-tax indicated IRR is 64.4%, the NPV is $580 million with a discount rate of 8% and the undiscounted, cumulative net cash flow is $1.13 billion. The all-inclusive average cash cost per ounce of gold produced, net of silver credits, increases to $285/oz. The equivalent after-tax IRR is 50.5%, the NPV is $490 million with a discount rate of 5% and the undiscounted, cumulative net cash flow is $760 million.
| October 2012 | 23-4 | |
| Soledad Mountain Project
Kern County, CA, USA
Technical Report |
The trailing 36-month average precious metals prices are accepted by the U.S. Securities And Exchange Commission when reporting mineral reserves.
The Project generates positive cash flow in the first year of production and reaches cumulative positive cash flow in the second year of production. Cash flows remain positive each year thereafter through the mine life.
23.4.2Sensitivity Analysis
The sensitivity of Project cash flows to increases in capital and operating costs was evaluated using the base case gold and silver prices. The Project NPV is relatively insensitive to increases in either of these costs as shown in the table below.
Table 23.2 Project NPVs with Changes in Capital and Operating Costs
| Constant Dollars Change in Variable – Discount Rate at 8% |
| Constant Dollars | Change in Variable–Discount Rate at 8% |
| Change in Operating Costs | +5% | +10% | +15% |
| NPV Before Tax ($M) | $773.8 | $760.6 | $747.4 |
| Change in Capital Costs | +5% | +10% | +15% |
| NPV Before Tax ($M) | $780.6 | $774.2 | $767.7 |
Note: Capital escalation includes initial capital + working capital.
The sensitivity of the Project cash flows to changes in gold and silver prices was further examined. The NPVs for a range of silver and gold price variances of +/-10% from the base case are shown in the table below.
Table 23.3 Project NPVs with Changing Metal Prices
| | | Combined | Increase ( decrease) in spot gold price |
| NPV US$ | | -15% | -10% | 0% | 10% | 15% |
| Increase | -15% | 610.0 | 658.6 | 755.6 | 852.5 | 900.9 |
| (decrease) | -10% | 620.5 | 669.1 | 766.1 | 862.9 | 911.3 |
| in silver spot | 0% | 641.5 | 690.0 | 787.0 | 883.8 | 932.2 |
| | 10% | 662.4 | 711.0 | 807.9 | 904.7 | 953.1 |
| | 15% | 672.9 | 721.4 | 818.4 | 915.1 | 963.5 |
| October 2012 | 23-5 | |
| Soledad Mountain Project
Kern County, CA, USA
Technical Report |
| 24 | ADJACENT PROPERTIES |
| | |
| This section is not relevant to the Report. |
| October 2012 | 24-1 | |
| Soledad Mountain Project
Kern County, CA, USA
Technical Report |
| 25 | OTHER RELEVANT DATA AND INFORMATION |
25.1 Risks
25.1.1Mining Risk
It will be important to implement effective grade control procedures, as otherwise dilution and/or ore losses may be higher than the estimates used in this study.
Project ore grades may be higher than currently modeled, or increases in gold price above the currently forecast level, could allow for lower grade ore to be mined economically. This could increase the size of the pits. It will be important to identify this as early as possible in the life of the mine, so that a different pit phasing can be followed to mine to the larger pit limits. Should additional ore be mined, leach pad capacity will be critical and strategies for optimizing the ore crushed and stacked on the pad or developing the Phase 3 heap leach pad may become necessary.
The current geological model incorporates a relatively gradual ore grade transition for high grade to low grade zones. Based on this gradual transition zone, Norwest has assumed zero ore loss and dilution in the calculation of ore tonnages. If the actual ore grade transition is sharper than the assumption of no dilution and ore loss will need to be revised and will effect overall ore tonnage estimates.
25.1.2Processing Risk
Heap leach operations will need to be optimized with operational experience. The leaching properties and timelines may be different on a large scale than indicated by the lab testing.
25.1.3Environmental Risk
Dust management may require additional efforts to control. This may include amending the surfaces of the haul roads to keep down dust. GQM has made allowance for the use of a lignin-based dust control product in discussion with GE Power & Water. The product is a binder specifically formulated to control fugitive dust from stockpiles and haul roads.
25.1.4Capital Cost Risk
Costs for contractors, personnel, materials and equipment are volatile throughout North America. There could be significant changes in the construction costs depending upon the construction timeline for the Project.
25.1.5Operating Cost Risk
Costs for contractors, personnel and equipment are volatile throughout North America. There could be significant changes in the actual prices paid both before operations commence and during the Project’s operational mine life.
| October 2012 | 25-1 | |
| Soledad Mountain Project
Kern County, CA, USA
Technical Report |
The Project is sensitive to changes in the price of diesel fuel as this is required for both the mining equipment and as a component of the explosives used on site. A diesel fuel contingency has been included as an operating cost item and this allows rapid adjustment of the operating cost estimates as diesel fuel prices fluctuate.
Process operating costs are based on the samples tested and the accuracy of the methods used to calculate reagent consumptions. To mitigate this risk and fully take advantage of any opportunities, an experienced and stable processing crew is required.
25.1.6Aggregate Sales Risk
The current mine plan assumes GQM is able to sell a significant volume of the produced waste rock as aggregate material. Although no revenues are shown in the cashflow analyses for aggregate sales, the backfill and permitting requirements of the mine permit limit the production life of the mine if no aggregate sales can be completed. The operations production life could be reduced by up to five years if confirmation of aggregate sales is not achieved during initial 5 – 7 years of mining.
25.1.7Legal/Permitting Risk
The mine plan as currently configured includes portions of the haulroad and pit development which extend outside the existing permit limit. The breakdown of areas is as follows:
| | • | West pit – Mining onto privately held land. If tenure and royalty agreement cannot be made this will decrease overall ore tonnage and recoverable ounces as discussed in Section 16.3.4. |
| | | |
| | • | East access haulroad – The southern portion of the east pit access haulroad extends across the permit limit and onto BLM land. If access is not secured, reconfiguration of the haulroad could increase haul cycle times. |
| | | |
| | • | East waste dump regrade area – Final regrading of the east side waste dump includes regrading of waste rock onto land currently owned by GQM but outside the permit limit. Failure to permit this additional area will require that the rock volume which is planned to be spread over this area be hauled and backfilled within the permitted footprint. This has the potential to decrease the overall ore production by requiring smaller pits to be mined initially. |
Norwest understands that GQM is in the process of securing access/use to this land for future mining activities. Failure to secure this access/use would alter the mine development plan and could affect recoverable ore tonnage. However based on Norwest’s review to date, the effects would not be material to the project nor its overall economics.
25.2 Opportunities
Opportunities exist for refinements in the Mineral Resource modelling to address:
| October 2012 | 25-2 | |
| Soledad Mountain Project
Kern County, CA, USA
Technical Report |
| | • | Potential for an increase in gold grade from GFA mineralization; |
| | | |
| | • | Potential for mineralization in extensions along strike and in depth of known gold-bearing vein systems and; |
| | | |
| | • | Infill drilling that could support a potential upgrade of the Inferred MineralResources within the current open pits. |
25.2.1Geological Opportunity
If operating costs are lower than estimated or gold and silver prices continue to stay at higher levels than assumed for the base case evaluation, cut-off grades could be lowered, increasing the size of the resource.
Within the existing pits there is a significant portion of inferred resource. Should this resource be proven in the course of operations it could add approximately fifty thousand ounces of gold and over one million ounces of silver. Note that GQM has initiated a limited infill drill program to demonstrate that inferred resources can in fact be converted to reserves with minimal additional drilling.
There are significant resources on the property that have not been included in this study due to various constraints. A large, high stripping ratio pit exists south of the Main Pit and this could add significant ounces to the Project. This ore is economic at the costs and metal values developed for this report, but has been left behind due to waste rock disposal constraints.
25.2.2Processing Opportunity
The recovery figures obtained from laboratory testing were used as recommended in the recovery estimates that were utilized for this study. There are numerous projects that have failed to achieve the recoveries anticipated from test work but there are also numerous projects that were able to achieve higher recoveries than would have been anticipated. Higher recoveries would lead to higher overall gold and silver production with the resulting benefit to Project economics.
Note specifically that the current silver recovery is estimated at only 52.5% . The tails analysis shows a possible higher silver recovery of up to 65.8% . Silver recoveries of 65.0% were projected in a number of feasibility studies done by independent consulting engineers before 2000.
25.2.3Aggregate Production
GQM is actively investigating the potential for developing a by-product aggregate and construction materials business once the heap leach operation is in full production. The source of raw materials will be suitable quality waste rock specifically stockpiled for this purpose. Test work done in the 1990s confirmed the suitability of waste rock as aggregate and construction material. There is also the potential to market the rinsed leach material when mine operations cease. Based on currently projected mine plans, there may be sufficient material to allow aggregate for production for an extended period beyond the gold and silver production period.
| October 2012 | 25-3 | |
| Soledad Mountain Project
Kern County, CA, USA
Technical Report |
However, no contributions from the sale of such products will be included in the cash flow projections until long term contracts for the sales of these products are secured. In addition to the benefit of aggregate sales revenue, if additional waste dump volume can be achieved through selling the waste rock as aggregate, the potential for increasing the mineable ore quantity exists the current mine plan is constrained by backfill and waste dump permitting limitations.
25.3 Project Schedule
GQM is proceeding with its efforts to secure financing for the Project.
25.4 Holding Costs
The following is an indication of the holding costs for a typical year:
BLM Annual Maintenance Fees
The annual BLM payments are made in lieu of the assessment work requirement of the past. Payment is made for unpatented mining claims and unpatented millsites. This change was instituted in 1993 to replace the annual assessment work, with one exception. Small miners with fewer than 10 claims or millsites are allowed to do assessment work in lieu of making the payments to the BLM.
The annual maintenance fee is $140.00 per claim for the unpatented mining claims and millsites. The filing for 2011 was done by Mr. Richard K. Thompson, Harris & Thompson, Reno. The filing was completed on June 21, 2011 and the claim status remains in good order. The total cost incurred for 2011 was $22,377.00 and this includes legal fees. The payment is due before or on August 31 of any year.
An allowance of $22,400 per year has been included in the holding cost estimates.
Property Taxes
Property taxes are approximately $37,500 per year.
Reclamation Financial Assurance
The Company provided reclamation financial assurance in the form of a Payment Bond Certificate backed by a Certificate Of Deposit with Union Bank of California in the amount of $296,180 effective October 2011. The estimate for reclamation financial assurance is $314,712 for 2012 and this estimate has been submitted to the Kern County Engineering, Surveying & Permit Services Department for review and approval. The estimate for reclamation financial assurance is reassessed annually.
The estimated increase in reclamation financial assurance is 2.5% or $7,500 per year and this is the amount that has been included in the holding cost estimate.
State and County Permit Fees |
Fees payable to various State and Kern County departments are estimated at $12,000 per year.
| October 2012 | 25-4 | |
| Soledad Mountain Project
Kern County, CA, USA
Technical Report |
Groundwater Sampling and Reports to the Water Board
Groundwater sampling and analysis and quarterly and annual reports are required as a condition of the Waste Discharge Requirements (Board Order No. R6V-2010-0031) issued by the Lahontan Regional Water Quality Control Board in July 2010. Costs are $60,000 per year.
Meteorological Monitoring and Reports to the Eastern Kern Air Pollution Control District
Ongoing monitoring is required and quarterly reports are prepared and submitted to the Eastern Kern Air Pollution Control District. The estimated cost for monitoring and to maintain the station is $60,000 per year.
State of California Annual Fee
The State of California annual fee is $800.
Safety Inspections and Site Maintenance
An independent contractor does the weekly safety inspections and essential site maintenance on gates, fences and signs and house maintenance at a cost of $3,500 per month or $42,000 per year.
Site Visits by an Independent Consulting Engineer
An independent consulting engineer does a site visit at least every six weeks to provide oversight and supervision for the independent contractor at a cost of $1,500 per visit or $12,000 per year.
Site Services
Site services such as power, propane and garbage removal are estimated at $900 per month or $10,800 per year.
Advance Minimum Royalties
The Company is required to make advance, minimum royalty payments under the mining lease agreements. These can vary depending upon the status of the various agreements but are approximately $250,000 per year.
Accounting Fees
Fees of $800 are incurred for preparing the Form 1099 filings for landholders once per year.
Insurance
A package insurance policy that includes property and general liability, automobile, worker’s compensation and umbrella is provided by Federal Insurance Company and this is renewed in effective September 1 of every year. The cost was $28,900 in 2011 and an allowance of $30,000 has been included in the holding cost estimates.
Legal Fees
Legal fees will be incurred to maintain agreements with landholders and other more general legal fees. An allowance of $5,000 per month or $60,000 per year has been included in the holding cost estimates.
| October 2012 | 25-5 | |
| Soledad Mountain Project
Kern County, CA, USA
Technical Report |
Holding Cost
The total estimated holding cost is the sum of the above amounts and this is $605,800 per year.
| October 2012 | 25-6 | |
| Soledad Mountain Project
Kern County, CA, USA
Technical Report |
| 26 | INTERPRETATION AND CONCLUSIONS |
26.1 Geology and Mineralization
GQM is knowledgeable of the deposit genesis, lithologies, and structural and alteration controls on mineralization, and the mineralization style and setting is sufficient to support Mineral Resource and Mineral Reserve estimation.
26.2 Exploration, Drilling and Data Analysis
Exploration programs and studies completed to date are appropriate to the style of mineralization within the Project. Exploration and research work supports the orogenesis interpretations.
The overall quantity and quality of the collar and down-hole surveys used to define the locations and inclination of drill holes are sufficient to support Mineral Resource and Mineral Reserve estimation.
Sampling methods are acceptable, meet industry-standard practice, and are adequate for Mineral Resource and Mineral Reserve estimation.
The quality of gold and silver analytical data, collected by GQM, is sufficiently reliable to support Mineral Resource and Mineral Reserve estimation. Sample preparation, analysis and security are generally performed in accordance with exploration best practices and industry standards. The quality of gold and silver analytical data collected by GFA is believed to have been collected in a prudent manner that met industry-standards at that time. As a precaution, GQM has factored GFA gold values lower so as not to potentially overestimate gold content during Mineral Resource and Mineral Reserve estimation.
Data verification, undertaken on the data collected from the Project, sufficiently supports the analytical and database quality and geological interpretations and therefore supports the use of the data in Mineral Resource and Mineral Reserve estimation.
26.3 Metallurgical Testwork
The primary ore types that will be mined are rhyolite porphyry and flow-banded rhyolite, pyroclastics and quartz latite porphyry representing approximately 70%, 10% and 20% of the ore tonnage respectively.
Extensive test work and process development work done on the Project ore types from 1988 to 2007 show that these ores are readily amenable to heap leaching provided the material is crushed to relatively small sizes. A series of tests using a high-pressure grinding roll (HPGR) and bottle roll and column leach tests was performed to confirm the flow sheet and to provide design criteria for the design of the crushing-screening plant. The test work shows that the HPGR will have distinct advantages over conventional crushing and screening in preparing particles for heap leaching in this particular application. Recoveries for gold and silver are based upon tails obtained in HPGR-based column leach tests. The work completed during the various metallurgical test programs supports the assumptions and designs discussed in this technical report.Mineral Resource Estimation
| October 2012 | 26-1 | |
| Soledad Mountain Project
Kern County, CA, USA
Technical Report |
Mineral Resource and Mineral Reserve estimation for the Project conform to industry best practices, and meets the requirements of CIM (2010). An open pit mining scenario is appropriate for the style of mineralization and LG pit shells that have been used to constrain the estimates. Assumptions used to develop the LG pit shells are appropriate for the envisaged mine plan and processing of ores.
Measured and Indicated Mineral Resources total 159.3 M tonnes grading 0.015 oz/t Au, and 0.27 oz/t Ag and are inclusive of Mineral Reserves. Inferred Mineral Resources total 16 M tons grading 0.011 oz/t Au and 0.23 oz/t Ag. Mineral Resources that are not Mineral Reserves have not have demonstrated economic viability. Mineral Resources are contained within a conceptual Measured, Indicated and Inferred optimized pit shell and reported using a AuEq cut-off grade of 0.004 oz/ton calculated using the following parameters:
| | • | gold price of US$1,310/oz |
| | | |
| | • | silver price of US$25.05/oz |
| | | |
| | • | open pit slopes of 55 |
| | | |
| | • | processing cost including G & A of US$4.98/ton |
| | | |
| | • | mining cost of US$1.25/ton |
| | | |
| | • | variable gold recoveries ranging from 83.4% to 89.9% and silver recovery of 52.5% |
Factors which may affect Mineral Resources include gold and silver prices:
| | • | changes in the assumptions used to generate the AuEq cut-off grade |
| | | |
| | • | changes in 0.003 oz/ton AuEq threshold used for defining mineralized shells |
| | | |
| | • | changes in the maximum projection of grade shells from last composite |
| | | |
| | • | changes to the search orientations used for grade estimation; changes is MineralResource classification criteria |
| | | |
| | • | changes in the assumptions used to generate the LG pit shells constraining theestimate |
| | | |
| | • | upside grade potential for GFA gold values |
26.4 Mineral Reserve Estimation
The feasibility level mine plan was developed for an open pit mining operation feeding approximately 5 million tons per year of ore to a crushing-screening plant for placement on a heap leach pad. Gold and silver would be recovered from the leach solution on-site in the form of dorè. The pit designs for the property were based upon the results of a series of Lerchs-Grossman pit optimization analyses.
| October 2012 | 26-2 | |
| Soledad Mountain Project
Kern County, CA, USA
Technical Report |
The mine plan is based on utilizing wheel loaders and rear-dump haul trucks for the primary mining supported by a smaller development fleet for pioneering access roads, upper pit benches and final ore mining at the bottom of the various mining phases.
The crushing-screening plant includes a primary and secondary crusher and screen. A high pressure grinding roll (HPGR) is used as part of the crushing circuit to prepare the ore for stacking on the two leach pads. Pregnant solution will be handled through a Merrill-Crowe plant which will extract the gold and silver from solution for the production of dorè. The dorè will be transported to an off-site smelter and refinery for final production of saleable gold and silver.
Mineral Reserves have been modified from Mineral Resources by including geological, mining, processing, and economic factors. The reserves are classified in accordance with the 2010 CIM Definition Standards for Mineral Resources and Mineral Reserves.
The Mineral Reserves are summarized below:
| Table 26.1 Mineral Reserves |
| | | | In-Situ Grade | Contained Metal |
| | | | Gold | | Silver | | Gold | Silver |
| Reserve Category | tonnes | ton | g/t | oz/ton | g/t | oz/ton | oz | oz |
| Proven | 18,371,000 | 20,250,000 | 0.910 | 0.0266 | 14.49 | 0.423 | 537,700 | 8,558,500 |
| Probable | 42,237,000 | 46,558,000 | 0.529 | 0.0154 | 10.58 | 0.309 | 717,900 | 14,372,500 |
| Total & Average | 60,608,000 | 66,808,000 | 0.644 | 0.0188 | 11.77 | 0.343 | 1,255,600 | 22,931,000 |
Note: Mine cut-off grade = 0.007 gold oz/ton.
The following factors may affect the mineral reserve estimate
| | • | Geotechnical assumptions |
| | | |
| | • | Ability of the mining operation to meet the annual production rate |
| | | |
| | • | Capital and operating cost estimates |
| | | |
| | • | Amount of rock that’s appropriate for aggregate production. The current mine permit does not allow any waste rock material to be placed 25ft higher than the original topography. Materials that could not be sold as aggregate would have to be backfilled. |
| | | |
| | • | A change in the mining permit. If the mining permit allows the operation to place waste rock 25ft higher than the original topography at the end of the mine life, this would allow GQM to mine additional ore. |
| | | |
| | • | Heap leach pad capacity. |
| October 2012 | 26-3 | |
| Soledad Mountain Project
Kern County, CA, USA
Technical Report |
| | • | Gold and silver prices affect overall economics but at current prices, the primary driver of mineral reserves is the permitting constraints which limit pit size and configuration. |
The current mineral reserves estimates are based on the most current knowledge, permit, and constraints. The reserves have been estimated using industry best practices and confirm to the CIM requirement. The current pit design is not the most economical pit. It was constrained by the permitted production quantities, backfilled regulations, and surface boundary constrain.
| October 2012 | 26-4 | |
| Soledad Mountain Project
Kern County, CA, USA
Technical Report |
27.1 Geology, Block Modeling, and Mineral Resources
AMEC submits the following Phase 1 recommendations resulting from the review of the 2012 resource modeling results and exploration data:
| | • | AMEC finds the insertion rates of the control samples to be low compared to bestpractice and recommends increasing the rate of standard reference materials (SRMs)and blanks to 5% each. |
| | | |
| | • | AMEC recommends that pulp duplicates be added to the GQM QA/QC protocol atthe rate of 5% of project samples. |
| | | |
| | • | AMEC recommends that GQM use SRMs that are certified for both gold and silver. |
| | | |
| | • | AMEC recommends that GQM do in-fill drilling in the Stockworks area to 200 ftspacing. Approximately 26 drill holes totalling 12,000 ft is required. Estimated costis $500,000. |
| | | |
| | • | AMEC recommends that GQM undertake a review of Reserve pit bottoms to ensurethat mineralization at pit floors have been sufficiently drill-tested and assayed. |
| | | |
| | • | AMEC recommends that GQM submit samples from the Stockworks area formetallurgical recovery studies. Estimated cost for core drilling and metallurgicaltesting is $250,000. |
| | | |
| | • | All Phase 1 work can be conducted concurrently. Total cost of Phase 1 is $750,000. |
27.2 Mine Development
Norwest recommends that GQM continue to secure control of land adjacent to the property in order to address the risks related to access and development of portions of the planned mine development. In addition, if aggregate sales do not meet expected levels, access to additional areas for external waste placement could maintain the mine’s operating life with the accompanying benefit to the overall project economics.
27.3 Aggregate Sales Contracts
Norwest recommends that GQM seek out opportunities to formalize sales contracts for aggregate materials from the site. The early confirmation of the feasibility of aggregate sales from the site could have significant upside potential for the side in terms of revision of permitting constraints which would in turn have the potential to increase project life and ore tonnage.
| October 2012 | 27-1 | |
| Soledad Mountain Project
Kern County, CA, USA
Technical Report |
Agterberg (1974). Geomathematics - Mathematical Background and Geo-Science Applications: Elsevier, Amsterdam, p596.
AMEC, 2007: Soledad Mountain Resource Estimate, Unpublished report prepared for Golden Queen Mining Co., Ltd. by AMEC E&C Services, 31 August 2007.
AMEC Americas Limited, 2011. “Study and Capital Cost Estimate for Crushing-Screening Plant”, Submitted to Golden Queen Mining Co. Ltd., January 2011, AMEC Project No. 168716.
ARCADIS U.S., Inc., 2012. “Soledad Mountain Project – Hydrogeology Study (Update)”, Submitted to Golden Queen Mining Co., Ltd., Highlands Ranch, CO, February 27, 2012.
Davis, J. C., 1986, Statistics and Data Analysis in Geology, John Wiley and Sons, New York, p646.
Dibblee, T. W. 1963: Geology of the Willow Springs and Rosamond Quandrangles California, Geological Survey Bulletin 1089-C, p249
Fahringer, P., and Benson, M.A., 2011: Geophysical Borehole Investigation, Unpublished report prepared for Golden Queen Mining Co., Ltd. by Golder Associates, 30 June 2011.
Golden Queen Mining Co., Inc., 2007. “Report Of Waste Discharge For The Soledad Mountain Project”, Two Volumes, Revised March 8 and May 2, 2007, Updated April 16, 2012, Submitted to the Lahontan Regional Water Quality Control Board.
Golder Associates Inc., 2012. “Heap Leach Facility, Revised Geotechnical Design Report”, 043-2299D, Revised April 16, 2012.
Hall, B. And Thornsberry, V. 1999, personal communications
Journel and Huijbregts, 1978, Mining Geostatistics, Academic Press, 1978
Kappes, Cassiday & Associates, 2010. “Soledad Mountain Project, Merrill-Crowe Plant, Engineering And Cost Estimate Study”, Prepared for Golden Queen Mining Co., Inc., (Project No. 456H, File No. 7805), October 25, 2010.
Klingmann, H. L., 2007. “Tails Analysis”. In-house report, September 14, 2007.
Lowry, D., and Kiel, R., 2011: Orientation Survey of Boreholes P-1 through P-9, Unpublished report prepared for Golden Queen Mining by Golder Associates, 20 July 2011.
McCusker, R, 1982. Geology of the Soledad Mountain Volcanic Complex, Mojave Desert, California, Master Thesis, San Jose State University, p113
| October 2012 | 28-1 | |
| Soledad Mountain Project
Kern County, CA, USA
Technical Report |
MRA, 1998. Soledad Mountain Project Feasibility Report, Golden Queen Mining Company, Incorporated, Mojave California, M3 Engineering & Technology Corp, March 1998.
Norwest Corporation, 2008. “43-101 Technical Report, Soledad Mountain Project”. Report prepared for Golden Queen Mining Co. Inc.
Norwest Corporation, 2011. “Soledad Mountain Feasibility Study”. Report prepared for Golden
Queen Mining Co. Inc.
Parker, H. M., 2000. “Final Report – Review Of Resource Model And Assays, Soledad Mountain Project, California”. Mineral Resources Development, Inc., May 10, 2000.
Singarella, Paul, 2007. “Initial Diligence Report and Potential Action Items – Golden Queen Mining’s Soledad Mountain Project”, Memorandum prepared by Latham & Watkins LLP, July 18, 2007.
Singarella, Paul, 2007. “Memorandum, July 18, 2007, Initial Diligence Report and Potential Action Items – Golden Queen Mining’s Soledad Mountain Project”, Latham & Watkins LLP, Costa Mesa, California.
The ROWD was updated at the request of the Regional Board. The ROWD was posted on the Water Board’s website, geotracker, as well.
The ROWD was prepared by Golden Queen Mining Co., Inc. and a team of consulting engineers.
| October 2012 | 28-2 | |
| Soledad Mountain Project
Kern County, CA, USA
Technical Report |
| 29 | STATEMENT OF QUALIFICATIONS |
| October 2012 | 29-1 | |
CERTIFICATE OF QUALIFICATIONS
I, Sean Ennis, P.Eng., P.E., do hereby certify that:
| 1. | I am currently employed as Vice President, Mining by: |
Norwest Corporation
Suite 1830, 1066 West Hastings St.,
Vancouver, British Columbia, Canada
V6E 3X2
| 2. | I graduated with a Bachelor of Science degree in Mining Engineering from the University of Alberta in 1991 and with a Master’s of Engineering Degree in Geo-environmental Engineering from the University of Alberta in 1997. |
| | |
| 3. | I am a member of the Association of Professional Engineers, Geologists and Geophysicists of British Columbia, (Member #24279) and the Association of Professional Engineers and Geoscientists of Alberta, (Member #M52576). |
| | |
| 4. | I have worked as a mining engineer for 19 years. |
| | |
| 5. | I have read the definition of “qualified person” set out in National Instrument 43-101 (“NI 43- 101”) and certify that by reason of my education, affiliation with a professional associations (as defined in NI 43-101) and past relevant work experience, I fulfill the requirements to be a “qualified person” for the purposes of NI 43-101. |
| | |
| 6. | I am responsible for the preparation of Sections 15, 16, 17, 18, 19, 20, 21, 22, 23, 25 and those portions of the Executive Summary, Interpretations and Conclusions and Recommendations that pertain to those Sections as well as portions of Sections 2, 3, 4, 9 and 10, of the report titled “Soledad Mountain Project Technical Report” dated October 17, 2012. I have also reviewed the entire report on behalf of Norwest Corporation. |
| | |
| 7. | I am not aware of any material fact or material change with respect to the subject matter of the Feasibility Study that is not reflected in the Feasibility Study, the omission to disclose which makes the Feasibility Study misleading. |
| | |
| 8. | I am independent of the issuer applying all of the tests in Section 1.5 of National Instrument 43- 101. |
Dated this 24th day of October, 2012.
“Signed and sealed hardcopy on file”
___________________________________
Sean Ennis, P.Eng.
Vice President, Mining

CERTIFICATE OF QUALIFIED PERSON
Mark P. Hertel, SME Registered Member
AMEC E&C Services, Inc.
1640 Stapley Dr., Suite 241
Mesa, AZ., 85204-6667
Tel 480-253-4930
Fax: 480-253-4932
mark.hertel@amec.com
I, Mark P Hertel, SME Registered Member, am employed as a Principal Geologist with AMEC E&C Services Inc.
This certificate applies to the technical report entitled “Soledad Mountain Project Technical Report, Kern County, CA”, (the “Technical Report”) dated October 17, 2012.
I am a Registered Member of Society of Mining, Metallurgy and Exploration (# 4046984).
I graduated from Southern Illinois University, Carbondale, Illinois in 1978 with a B.S. degree in Geology and from Metropolitan State College, Denver Colorado, in 1987 with a B.S. degree in Mathematics. I have practiced my profession continuously since 1988 and have been involved in mining operations in Nevada and Arizona. I have been directly involved in exploration, resource and reserve estimation, geologic modeling and mine planning for a variety of commodities including uranium, oil, copper, cobalt, gold, silver and industrial minerals.
As a result of my experience and qualifications, I am a Qualified Person as defined in National Instrument 43–101Standards of Disclosure for Mineral Projects(“NI 43–101”).
I visited the Soledad Mountain Project on July 26, 2011.
I am responsible for Sections 1.8, 1.10, 1.11, 1,12, 1,13, 1,15, 1.16, 1.29.2, 6, 7, 8, 9.1, 9.2, 9.3, 9.4, 9.5, 9.8, 9.9, 10, 11, 12, 14, 26.1, 26.2, 26.4, and 27.1.
I am independent of Golden Queen Mining Company, Inc. as independence is described by Section 1.5 of NI 43-101.
I have been involved with the Soledad Project since June 2009 during the preparation of a mineral resource estimate and subsequent completion of a technical report.
I have read NI 43–101 and the portions of the Technical Report, for which I am responsible, have been prepared in compliance with that Instrument.
As of the date of this certificate, to the best of my knowledge, information and belief, those section of the Technical Report for which I am responsible contain all scientific and technical information that is required to be disclosed to make the Technical Report not misleading.
“signed and sealed”
Mark P. Hertel, SME Registered Member
Date: 24 October 2012
AMEC E&C Services, Inc.
1640 Stapley Dr.
Mesa, AZ, 85204
Tel (480) 253 4930
Fax (480) 253 4932
www.amec.com