Exhibit 99.1
Golden Queen Mining Co. Ltd.
Formal Valuation and Fairness Opinion as at April 1, 2019


| Table of Contents | | |
| Introduction | | 3 |
| Engagement of EY | | 3 |
| Credentials of EY | | 4 |
| Independence of EY | | 4 |
| Fair market value | | 4 |
| Scope of review | | 5 |
| Prior valuations | | 5 |
| Assumptions and limitations | | 5 |
| Corporate overview | | 7 |
| The Mine | | 8 |
| Reserves and resources at the Mine | | 10 |
| Golden Queen’s share price history | | 10 |
| Historical operating results | | 11 |
| Industry overview | | 14 |
| United States economic overview | | 14 |
| Global economic overview | | 14 |
| Valuation methodologies | | 16 |
| Income approach | | 16 |
| Market approach | | 16 |
| Cost approach | | 16 |
| Selected approaches | | 17 |
| Income approach: discounted cash flow analysis | | 17 |
| LOM overview | | 17 |
| Discount rate | | 17 |
| NAV multiple | | 18 |
| DCF analysis | | 19 |
| Mine value based on WACC - NPVWACC | | 20 |
| Mine value based on 5% discount rate and NAV multiple - NPV5% x NAV | | 20 |
| Market approach: Trading multiples | | 21 |
| Market approach: Transaction multiples | | 23 |
| Summarized value of the Mine | | 25 |
| Adjusted net asset approach | | 25 |
| Value range in respect of Golden Queen common shares | | 25 |
| Conclusion of value of Golden Queen common shares | | 26 |
| Conclusion of value of the Proposed Transaction | | 26 |
| EY’s opinion and its rationale | | 26 |
| Schedule of Limiting Conditions | | 28 |
PRIVATE & CONFIDENTIAL The Special Committee of the Board of Directors of Golden Queen Mining Co. Ltd. 1066 West Hastings Street, Suite 2300 Vancouver, BC V6E 3X2 | April 5, 2019 |
Formal Valuation and Fairness Opinion
Introduction
On January 8, 2019, Golden Queen Mining Co. Ltd. (“Golden Queen”) announced that on January 4, 2019 it received a preliminary non-binding proposal letter from Mr. Thomas M. Clay, on behalf of certain members of the Clay family and associated entities (collectively, the “Clay Group”), wherein the Clay Group proposed to acquire all of the outstanding equity interests of Golden Queen Mining Company, LLC (“GQM LLC”) held indirectly by Golden Queen in exchange for: (i) the surrender of the notes and all indebtedness held by the Clay Group under a loan agreement dated November 21, 2016; (ii) surrender of all common shares, warrants and options of Golden Queen held by the Clay Group; and (iii) a cash payment. GQM LLC at that time held a 100% ownership interest in the Soledad Mountain Project (the “Mine”) and Golden Queen held a 50% effective interest in GQM LLC, subject to certain options held by Gauss LLC (as described herein) on Golden Queen’s indirect interest in GQM LLC.
On February 8, 2019, Golden Queen announced that it had entered into a binding share purchase agreement (the “Transaction Agreement”) with the Clay Group, whereby the Clay Group agreed to acquire Golden Queen’s wholly-owned US subsidiary Golden Queen Mining Holdings Inc. (“GQM US”), through which Golden Queen held its ownership interest in GQM LLC (the “Proposed Transaction”). The purchase price (the “Consideration”) comprised of:
| 1. | extinguishment of all amounts owing to the Clay Group by Golden Queen; |
| 2. | cancellation of all of the Clay Group’s ownership interest in Golden Queen (consisting of 177,701,229 common shares, 457,500 options and 18,000,000 warrants); |
| 3. | cash consideration of US$4.25 million; and |
| 4. | a contingent payment if at any time prior to June 30, 2020, the Clay Group sells or transfers the acquired interest for net proceeds greater than US$55 million (subject to adjustment in certain circumstances); where the contingent amount would be measured as 20% of such excess proceeds (the “Contingent Payment”). |
The Transaction Agreement allowed Golden Queen to continue to solicit an alternative acquisition proposal that would be superior (a “Superior Proposal”) to the terms of the Proposed Transaction during the period of February 7, 2019 to April 1, 2019 (the “Go Shop Period”), subject to customary deal-protection provisions, including a right for the Clay Group to match any Superior Proposal. The Transaction Agreement also included a termination fee of US$1 million, payable by Golden Queen, under certain circumstances, including if the Transaction Agreement is terminated in connection with Golden Queen accepting a Superior Proposal.
Engagement of EY
We are advised by legal counsel for the Special Committee of the Board of Directors of Golden Queen (“Special Committee”) that the formal valuation requirements set forth in Multilateral Instrument 61-101, Protection of the Minority Security Holders in Special Transactions (“MI 61-101”) apply to the Proposed Transaction.
In connection with the Proposed Transaction, the Special Committee has engaged Ernst & Young LLP (“EY”) to prepare and deliver to the Special Committee:
| a. | a formal valuation of the issued and outstanding common shares of Golden Queen in accordance with the requirements of MI 61-101 (the “Formal Valuation”); and |
| b. | an opinion as to whether the Consideration payable by the Clay Group pursuant to the Proposed Transaction, is fair, from a financial point of view, to the holders of common shares of Golden Queen, other than the Clay Group (the “Fairness Opinion”). |
This Formal Valuation and Fairness Opinion has been prepared to provide information for consideration by the Special Committee with respect to the Proposed Transaction, but does not constitute a recommendation to any party as to any course of action they might take. Despite any conclusions reached herein, the circumstances of individual shareholders will necessarily determine what course of action they will take in responding to the Proposed Transaction.
The Formal Valuation has been prepared in accordance with the practice standards of The Canadian Institute of Chartered Business Valuators (“CICBV”).
Credentials of EY
EY is one of the largest global professional service firms, providing assurance, tax, transaction and advisory services. EY’s global transaction services include: valuations and fairness opinions, corporate finance and merger & acquisition advisory, transaction diligence and integration, transaction tax advisory, and corporate restructuring.
Independence of EY
EY has developed the Formal Valuation and Fairness Opinion herein on the basis of an independent review and analysis of Golden Queen. The conclusions expressed herein are that of EY, including approval by a committee of senior EY practitioners, experienced in providing valuation and fairness opinions, merger & acquisition advisory services, and other corporate transaction services.
The analysis herein and the conclusions reached are those of the valuation professionals within EY.
EY is independent of all “interested parties” to the Proposed Transaction, in accordance with the requirements of MI 61-101 and in accordance with EY’s professional standards:
| · | Over the past three years EY’s services to Leucadia National Corp. (an indirect partial owner of GQM LLC) have been limited to non-audit services that are not a conflict under MI 61-101 or EY’s independence policies. |
| · | No services were provided to Golden Queen, Jonathan Clay, Thomas M. Clay, Harris Clay, The Landon T. Clay 2009 Irrevocable Trust, or Auvergne LLC during the past three years. |
| · | Based on our review, EY is “independent” of all “interested parties” to the Proposed Transaction as such terms are defined in MI 61-101: |
| · | EY has no financial interest in Golden Queen and its subsidiaries, or in the outcome of the Proposed Transaction. |
| · | EY has not conducted a prior valuation of Golden Queen, as determined in accordance with applicable securities regulations. |
| · | There are no understandings or agreements between EY and Golden Queen or its associates or affiliates, with respect to future business dealings. |
| · | EY’s fees are not contingent on the completion of the Proposed Transaction or on the conclusions expressed herein. |
Fair market value
The analysis and estimate of value set out herein have been developed with reference to the concepts of fair market value, defined under MI 61-101 as:
“The monetary consideration that, in an open and unrestricted market, a prudent and informed buyer would pay to a prudent and informed seller, each acting at arm's length with the other and under no compulsion to act.”1
Scope of review
In developing this Formal Valuation and Fairness Opinion, EY had discussions with the Special Committee and management of Golden Queen (“Management”), conducted the procedures noted below, and relied on information obtained from these general procedures, without independent verification, which among others included:
| 1. | Reviewed the terms of the Proposed Transaction. |
| 2. | Reviewed the business of Golden Queen, including review of certain business and financial information deemed to be relevant. |
| 3. | Reviewed historical annual audited financial statements of Golden Queen for the years ended December 31, 2013 to 2018 and interim unaudited financial statements as at February 28, 2019. |
| 4. | Conducted discussions with Management. |
| 5. | Prepared value analyses relating to the Mine, GQM LLC, GQM US, Golden Queen and the common shares of Golden Queen. |
| 6. | Prepared value analyses of the assets and interests involved in the Proposed Transaction. |
| 7. | Reviewed historical trading prices of the Golden Queen’s common shares. |
| 8. | Reviewed various background materials concerning Golden Queen’s business, debt and equity financing efforts by Golden Queen, including efforts of Maxit Capital LP during the Go Shop Period, as well as, industry data and information considered relevant to assessing fairness from a financial point of view. |
| 9. | Reviewed a range of economic, investment, stock and commodity market trading, and acquisition transaction data in the process of developing factors and rates of return relevant to the assessing fairness from a financial point of view. |
| 10. | Prepared this Formal Valuation and Fairness Opinion. |
| 11. | Assessed fairness of the Proposed Transaction to the common shareholders of Golden Queen, other than the Clay Group, from a financial point of view. |
Prior valuations
The Chief Financial Officer of Golden Queen has represented to EY that, to the best of his knowledge, information and belief, and after due enquiry, there are no valuations or appraisals relating to Golden Queen or any of its subsidiaries or any of their respective material properties or assets made in the preceding 24 months.
Assumptions and limitations
EY has relied upon the completeness, accuracy and fair presentation of all of the financial and other information obtained from public sources, and from Management for purposes of developing the valuation and fairness conclusions set out herein. This Formal Valuation and Fairness Opinion is conditional upon the completeness and accuracy of such information. Subject to the exercise of professional valuation judgement and except as expressly described herein, we have not attempted to verify for valuation purposes the completeness, accuracy or fair presentation of any of the information relied upon in developing this Formal Valuation and Fairness Opinion. The attached Schedule of Limiting Conditions includes additional assumptions concerning the information reviewed.
| 1 | Consistent with MI 61-101, Section 6.4 (2) (d), we have not made any downward adjustments to reflect the liquidity of the common shares, the effect of the Proposed Transaction on the common shares or the fact that the common shares may or may not form part of a controlling interest. |
Based on representations from Management, EY has assumed that there are no material changes in the financial position or operating results (other than changes in debt balances) for Golden Queen, including its wholly and partially owned entities, from the date of the most recently available audited financial statements, December 31, 2018, to April 1, 2019 (the “Valuation Date”).
Management has represented to us that the information provided for the purpose of this Formal Valuation and Fairness Opinion is true and correct in all material respects as of April 5, 2019.This Formal Valuation and Fairness Opinion has been prepared for the specific purpose identified above and is not to be used in any other context without the express written consent of EY. This Formal Valuation and Fairness Opinion is developed as of a specific date on the basis of identifiable information and EY has not undertaken to update it to any other date. Should information relevant to the conclusions herein become available to EY subsequent to the date of this report, EY reserves the right, but will be under no obligation, to revise this report.
In completing the Formal Valuation and Fairness Opinion, EY has made numerous assumptions with respect to economic, industry, and company performance and expectations that are matters over which EY has no control. Going concern business value is inherently and inescapably a matter of implicit or explicit perceptions of the potential future economic performance of the business to be valued and the environment in which that performance will take place. Recognizing that those perceptions are developed under conditions where neither contractual nor other bases exist to ensure that actual operating results will conform to the assumptions employed for valuation purposes, this analysis necessarily works with contingent and uncertain information and there is a corresponding degree of uncertainty in the resultant estimates of value.
In some measure this uncertainty is recognized in the process of specifying the valuation results as a range of amounts. However, such range specification also acknowledges that in any market for a total business enterprise it is necessary to assume multiple bidders each of which will bring different perceptions of the potential for the business as an investment opportunity to bear on the acquisition bidding process. It must accordingly be recognized that EY does not warrant that the projections and estimates employed in developing this Formal Valuation and Fairness Opinion represent commitments as to what the future performance of the businesses will be.
The values are considered to be reasonable estimates on the basis of the information and assumptions upon which they are predicated and as of the time when the estimates were developed. However, should significant deviations from these assumptions emerge in the future, the estimates may well cease to be representative of value.
EY believes that its analysis within this Formal Valuation and Fairness Opinion must be considered as a whole and that selecting portions of this analysis without considering the other factors and analyses, may create a misleading view of the valuation process and valuation results.
Unless otherwise specified, all dollar amounts herein are expressed in Canadian dollars (“C$”).
Corporate overview
The following chart depicts the current corporate structure of Golden Queen, including its material subsidiaries and ownership of the Mine, as well as Golden Queen’s joint venture partner in the Mine.
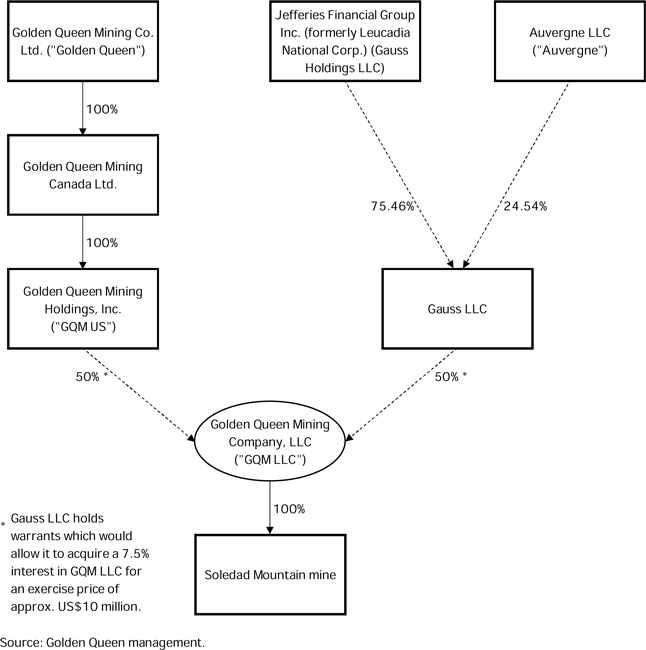
| 1. | Golden Queen is listed on the Toronto Stock Exchange and was incorporated in 1985. It acquired its initial interest in the Mine in 1985. The Clay Group owns approximately 59.21% of Golden Queen’s common shares2. |
| 2 | Given that the 457,500 options and 18,000,000 warrants held by the Clay Group are not in the money they have not been considered in computing the Clay Group’s percentage ownership interest. |
| 2. | Golden Queen Mining Canada Ltd. is a 100% owned Canadian subsidiary of Golden Queen. This entity is a holding company which we understand will be wound up into Golden Queen following the completion of the Transaction. It is not discussed hereinafter as its only asset is its equity interest in GQM US. |
| 3. | GQM US is a 100% owned US subsidiary of Golden Queen. It holds a 50% (see 4 below) interest in the Mine through a joint venture (“JV”), GQM LLC. |
| 4. | GQM LLC is a JV owned equally by GQM US and Gauss LLC. On October 12, 2018 Gauss LLC, as part of a revolving credit facility obtained warrants which would allow it to acquire a 7.5% interest in GQM LLC for an exercise price of approximately US$10 million. The warrants expire in October 2023. |
| a. | 75.46% by Jefferies Financial Group Inc. (formerly called Leucadia National Corp.), a New York Stock Exchange listed financial services company, and |
| | b. | 24.54% by Auvergne LLC (“Auvergne”). Auvergne is controlled by the Clay Group. |
The Mine
The Mine is an open pit, heap leach mining operation producing gold and silver and is located just outside the town of Mojave in Kern County, in southern California.
The Mine is located approximately 8 km south of the town of Mojave. Los Angeles is about 113 km south of Mojave. Mojave is a railroad hub for the Burlington Northern/Santa Fe and Union Pacific/Southern Pacific railroad lines. This proximity provides good access to infrastructure and other services.
Mojave and the surrounding areas are areas of relatively high unemployment and employment has not recovered since the start of the financial downturn in 2008. The Mine has therefore had a positive response from the local communities.
Construction permits were issued in February 2012 and were subsequently converted to a permit to operate after construction had been completed.
Golden Queen completed site preparations and started construction of infrastructure-related items in July 2013. In June 2014, Golden Queen announced that Gauss LLC would invest US$110 million and become a 50% JV partner in respect of the Soledad Mountain property. The JV investment closed in September 2014. Construction was completed in February 2016 with first gold pour occurring on March 1, 2016. The Mine achieved commercial production in December 2016 when the process plant was operating in line with design specifications and management expectations.
The crushing screening plant consists of a three-stage process and is sized to process 5.1 million tons (4.6 million tonnes) of ore per year. The crushing screening plant includes a primary and secondary cone crusher, primary screen, and HPGR (High Pressure Grinding Rolls).
The HPGR discharge is conveyed to an agglomeration drum where cement and process solution are added, and then conveyed by overland conveyor and a series of grass-hopper conveyors to a stacker and placed on the heap leach pad.
Gold and silver recovery is by dissolution in a dilute sodium cyanide solution and then by recovery in the Merrill-Crowe process, which includes the typical clarification, deaeration, precipitation with zinc dust, and filtration, drying (retorting), and smelting of the precious metal sludge into a doré product.
The heap leach pad is a multi-lift single-use pad. The design considered development in four stages to minimize initial capital costs and improve solution management. The designed pad capacity was approximately 51.6 million tons (46.8 million tonnes), with a planned height of 230 ft (70 m) and individual lifts designed for 33 ft (10 m) in height. The actual leach pad capacity constructed is less than what was designed.
The heap surface is irrigated with diluted cyanide solution by drip emitters, for a primary leaching cycle of 70 days and a complete leach cycle of 270 to 290 days. The Mine presently is unable to meet the 270- to 290-day cycle as the Mine’s wet process is limited in the amount of solution that can be placed on the leach pad, limiting the tonnage of ore under leach and hence production, resulting in higher gold in inventory on the pad.
The Mine ships doré made on site to a refinery for smelting and refining to produce saleable gold and silver.
A by-product of mining at the Mine is aggregate, which can be used for construction materials, with delivery in the southern California market possible given proximity to major highways and railway lines. The source of raw materials is quality waste rock specifically stockpiled for this purpose. Additionally, we understand that the Mine is permitted as a quarry. The waste rock and any quarried materials are intended to be sold over an extended period beyond the current mine life. Operating a quarry after the current mine life is expected to mitigate rehabilitation obligations. No contribution from the sale of aggregate is presently included in the cash flow projections as there are no long term contracts in place and the Mine is still testing the suitability of the rock on site for specifications acceptable in aggregate markets.
Reserves and resources at the Mine
The Mine’s reserves and resources (before the Mine commenced operations) are set out below.
| | | Ton | | | Gold:
In-Site Grade | | | Silver:
In-Site Grade | | | Contained Metal | |
| | | (000s) | | | g/t | | | Oz/ton | | | g/t | | | Oz/ton | | | Gold Oz
(000s) | | | Silver Oz
(000’s) | |
| Proven | | | 3,701 | | | | 0.948 | | | | 0.028 | | | | 14.056 | | | | 0.410 | | | | 102.3 | | | | 1,517.1 | |
| Probable | | | 47,352 | | | | 0.638 | | | | 0.019 | | | | 10.860 | | | | 0.317 | | | | 881.3 | | | | 14,999.1 | |
| Measured & Indicated* | | | 92,082 | | | | 0.575 | | | | 0.017 | | | | 9.53 | | | | 0.28 | | | | 1,545.0 | | | | 25,598.0 | |
| Inferred | | | 23,581 | | | | 0.343 | | | | 0.010 | | | | 7.20 | | | | 0.21 | | | | 245.0 | | | | 4,965.0 | |
| | | | | | | | | | | | | | | | | | | | | | | | | | | | | |
| * Mineral resources are inclusive of mineral reserves. |
| | | | | | | | | | | | | | | | | | | | | | | | | | | | | |
| Source: 2015 feasibility study reported in Golden Queen’s 10-K for the year ended December 31, 2018 |
Golden Queen, in its 2018 10-K filing, reported the above proven and probable reserves (which are before mining commenced) as 1.158 million gold equivalent ounces. In the same filing, Golden Queen reported the remaining proven and probable reserves, as at December 31, 2018, as 941,193 gold equivalent ounces. Further, based on discussions with Management and considering the production in the period of January 1, 2019 to March 31, 2019 the remaining proven and probable reserves, as at the Valuation Date are estimated to be approximately 918,701 gold equivalent ounces.
Golden Queen’s share price history
Golden Queen’s share price peaked at around C$2.00 in April 2016, soon after the first gold pour, but trended down to C$0.20 by the time the final prospectus was filed for the rights offering in November 2017 (the offering closed in February 2018). Between November 2018 and before the Proposed Transaction was announced, the common shares traded between C$0.10 and C$0.15.
On the day prior to January 8, 2019 when the non-binding proposal from the Clay Group was announced, Golden Queen’s common shares closed at C$0.135. Between February 5, 2019 when Golden Queen announced that it had entered into a non-binding letter of intent and February 8, 2019, when it announced that it had entered into the Transaction Agreement, Golden Queen common shares traded at between C$0.04 and C$0.05.
With the significant shareholding held by the Clay Group since February 2018, Golden Queen’s public share float is small and has been approximately 40% since February 2018, albeit the shares traded on nearly all trading days during 2014 to 2018 (as seen below).
| | | Low (C$) | | | High (C$) | | | Close (C$) | | | Volume | | | Days Traded | |
| Year – 2014 | | | 0.800 | | | | 1.990 | | | | 1.442 | | | | 9,560,880 | | | | 96 | % |
| Year – 2015 | | | 0.650 | | | | 1.680 | | | | 1.016 | | | | 12,060,330 | | | | 93 | % |
| Year – 2016 | | | 0.700 | | | | 2.000 | | | | 1.331 | | | | 19,483,940 | | | | 96 | % |
| Year – 2017 | | | 0.180 | | | | 1.090 | | | | 0.647 | | | | 30,244,430 | | | | 96 | % |
| Year – 2018 | | | 0.100 | | | | 0.235 | | | | 0.177 | | | | 28,696,970 | | | | 93 | % |
| Month – Jan 2019 | | | 0.045 | | | | 0.135 | | | | 0.062 | | | | 6,518,280 | | | | 80 | % |
| Month – Feb 2019 | | | 0.025 | | | | 0.060 | | | | 0.036 | | | | 10,951,120 | | | | 68 | % |
| Month – Mar 2019 | | | 0.035 | | | | 0.055 | | | | 0.042 | | | | 4,638,590 | | | | 61 | % |
| | | | | | | | | | | | | | | | | | | | | |
| Source: S&P Capital IQ and EY Analysis | |
Historical operating results
A summary of Golden Queen Mining Co. Ltd.’s consolidated operating results for the years ended December 31, 2015 through to 2018 as well as GQM LLC’s standalone operating results for 2018 is set out below.
| | | Golden Queen (Consolidated) | | | GQM LLC | |
| US $000s (except ounces) | | 2015 | | | 2016 | | | 2017 | | | 2018 | | | 2018 | |
| Gold production (ounces) | | | - | | | | 18,837 | | | | 46,039 | | | | 42,252 | | | | 42,252 | |
| Silver production (ounces) | | | - | | | | 193,202 | | | | 237,089 | | | | 372,724 | | | | 372,724 | |
| Revenue | | | - | | | | 27,193 | | | | 62,121 | | | | 58,403 | | | | 58,403 | |
| Direct mining costs | | | - | | | | (21,569 | ) | | | (56,131 | ) | | | (44,491 | ) | | | (44,491 | ) |
| Depreciation and depletion | | | - | | | | (7,427 | ) | | | (11,955 | ) | | | (9,678 | ) | | | (9,254 | ) |
| | | | | | | | | | | | | | | | | | | | | |
| Accretion | | | - | | | | (90 | ) | | | (126 | ) | | | (167 | ) | | | (167 | ) |
| Income (loss) from mine operations | | | - | | | | (1,893 | ) | | | (6,091 | ) | | | 4,067 | | | | 4,491 | |
| G&A expenses | | | (4,616 | ) | | | (4,308 | ) | | | (5,235 | ) | | | (5,095 | ) | | | (3,363 | ) |
| Operating loss | | | (4,616 | ) | | | (6,201 | ) | | | (11,326 | ) | | | (1,028 | ) | | | 1,128 | |
| Finance expense | | | (4,507 | ) | | | (5,488 | ) | �� | | (5,217 | ) | | | (5,925 | ) | | | (803 | ) |
| Other income (expenses) | | | 1,887 | | | | 1,997 | | | | 5,643 | | | | 465 | | | | 36 | |
| Income tax benefit (expense) | | | - | | | | - | | | | 4,725 | | | | (391 | ) | | | 0 | |
| Income/(loss) | | | (7,236 | ) | | | (9,692 | ) | | | (6,175 | ) | | | (6,879 | ) | | | 361 | |
| Less: (Income)/loss attributable to NCI | | | 1,775 | | | | 2,263 | | | | 5,010 | | | | (180 | ) | | | (180 | ) |
| Net income/(loss) attributable to Golden Queen | | | (5,461 | ) | | | (7,429 | ) | | | (1,165 | ) | | | (7,059 | ) | | | 180 | |
Source: Golden Queen’s audited consolidated financial statements and Management provided financial information
Commercial production at the Mine was announced on December 19, 2016, and 2017 was the first full year of production at the Mine. Golden Queen recorded an attributable net and comprehensive loss of $7.059 million during the year ended December 31, 2018 as compared to an attributable net and comprehensive loss of $1.165 million during the year ended December 31, 2017.
2018 was the first year in which the Mine generated positive operating income. This was driven by improvements in mining efficiencies throughout the year and higher grade ore being delivered to pad each month. However, the Mine continues to face mechanical maintenance issues, impacting mine operations and profitability. These issues caused the Mine’s ore loaded to pad to be 20% under budget in Q4 2018. Improvements to the crushing process have been implemented to improve efficiency.
Additionally, as noted in the table below, the Mine’s crusher mechanical availability and apparent cumulative recoveries have varied over the last two years of production. Asset efficiency reached a high of 73.8% in Q2 2017, but has decreased since then. Apparent cumulative gold recoveries increased over 2017, but peaked in 2017 Q4 and decreased over 2018.
| | | 2017 | | | 2018 | |
| | | Q1 | | | Q2 | | | Q3 | | | Q4 | | | Q1 | | | Q2 | | | Q3 | | | Q4 | |
| Asset efficiency | | | 55.7 | % | | | 73.8 | % | | | 63.2 | % | | | 60.9 | % | | | 58.9 | % | | | 65.7 | % | | | 60.7 | % | | | 58.7 | % |
| | | | | | | | | | | | | | | | | | | | | | | | | | | | | | | | | |
| Apparent cumulative recovery – gold3 | | | 63.3 | % | | | 68.0 | % | | | 73.0 | % | | | 75.5 | % | | | 71.5 | % | | | 69.1 | % | | | 67.1 | % | | | 67.2 | % |
| | | | | | | | | | | | | | | | | | | | | | | | | | | | | | | | | |
| Apparent cumulative recovery – silver | | | 25.3 | % | | | 25.3 | % | | | 25.8 | % | | | 27.4 | % | | | 27.1 | % | | | 27.7 | % | | | 28.5 | % | | | 27.1 | % |
| 3 | Apparent cumulative gold recovery is defined as total gold ounces recovered divided by the total gold ounces on the pad. |
The table below sets out a summary of Golden Queen’s consolidated financial position as at December 31, 2015 through to 2018, including 100% of GQM LLC’s assets and liabilities, as well as GQM LLC’s standalone financial position as at December 31, 2018.
| | | Golden Queen (Consolidated) | | | GQM LLC | |
| US $000s | | 2015 | | | 2016 | | | 2017 | | | 2018 | | | 2018 | |
| Cash and restricted cash | | | 37,587 | | | | 13,301 | | | | 2,937 | | | | 6,730 | | | | 4,149 | |
| Receivables | | | 24 | | | | 34 | | | | - | | | | - | | | | 5 | |
| Inventory | | | 1,936 | | | | 10,941 | | | | 9,028 | | | | 31,944 | | | | 31,944 | |
| Prepaid expenses | | | 432 | | | | 577 | | | | 699 | | | | 467 | | | | 411 | |
| | | | 39,979 | | | | 24,853 | | | | 12,664 | | | | 39,141 | | | | 36,509 | |
| PPE | | | 128,259 | | | | 134,550 | | | | 141,848 | | | | 135,818 | | | | 131,014 | |
| Other assets | | | 1,206 | | | | 303 | | | | 304 | | | | 3,811 | | | | 3,811 | |
| Total assets | | | 169,444 | | | | 159,706 | | | | 154,816 | | | | 178,770 | | | | 171,334 | |
| | | | | | | | | | | | | | | | | | | | | |
| AP and accruals | | | 3,258 | | | | 4,265 | | | | 6,320 | | | | 6,899 | | | | 6,773 | |
| Interest payable | | | 970 | | | | 296 | | | | 664 | | | | 773 | | | | 121 | |
| Current portion of debt | | | 40,996 | | | | 5,656 | | | | 18,341 | | | | 31,268 | | | | - | |
| Derivative liabilities | | | 2,498 | | | | 6,430 | | | | 441 | | | | 3,390 | | | | 3,314 | |
| | | | 47,722 | | | | 16,647 | | | | 25,766 | | | | 42,330 | | | | 10,208 | |
| Long-term debt | | | 13,430 | | | | 35,841 | | | | 32,001 | | | | 10,622 | | | | 17,200 | |
| Asset retirement obligation | | | 978 | | | | 1,366 | | | | 1,838 | | | | 2,497 | | | | 2,497 | |
| Deferred tax liability | | | 12,922 | | | | 12,922 | | | | 8,197 | | | | 8,588 | | | | - | |
| Total liabilities | | | 75,052 | | | | 66,776 | | | | 67,802 | | | | 64,037 | | | | 29,904 | |
| | | | | | | | | | | | | | | | | | | | | |
| Redeemable portion of NCI | | | 27,124 | | | | 26,219 | | | | 24,214 | | | | 24,286 | | | | - | |
| Non-controlling interest | | | 40,686 | | | | 39,327 | | | | 36,321 | | | | 46,429 | | | | | |
| Shareholders' equity attributable to GQM Ltd. | | | 26,582 | | | | 27,384 | | | | 26,479 | | | | 44,002 | | | | 141,430 | |
| Total liabilities and equity | | | 169,444 | | | | 159,706 | | | | 154,816 | | | | 178,770 | | | | 171,334 | |
Source:Golden Queen’s audited consolidated financial statements and Management provided financial information
As at December 31, 2018, Golden Queen had approximately $178.8 million in assets, with 76% of this balance consisting of property, plant and equipment and 18% of this balance consisting of inventory. Net working capital (excluding cash and interest payable) was $25.5 million as at December 31, 2018.
The Mine’s inventory on hand increased significantly during 2018. This is due to having two months of ore production stockpiled in the pit, in addition to capacity limit impacting the tonnage of ore on the leach pad. Management has designed a solution to decrease the amount of inventory on hand.
As December 31, 2018, significant liabilities included $24.7 million of note payable, $5.0 million of credit facility, $12.2 million of loan payable, and $8.6 million of deferred tax liability.
Industry overview4
Gold is used mainly for jewellery fabrication, and as a safe haven (a hedge against inflation and financial turmoil). Globally, gold industry demand has picked up, driven by the highest central bank buying in decades, increased investment in gold bars and gold coins, as well as steady demand in jewellery, but offset by decreased demand for ETFs. According to GFMS, one of the world’s leading economic consultants in precious metals, the physical demand for gold increased by approximately 4% in 2018.
The primary sources for gold supply include mine production in major economies, secondary gold recovery from scrap jewellery and gold-bearing materials, and net gold exports from transitional economies such as former Soviet Union Republics, North Korea, and Cuba. Global gold mine production increased by 0.93% year-over-year in 2018 to 3,260 tonnes as compared to 3,230 tonnes in 2017. China is the largest gold producer with an estimated output of 400 tonnes in 2018, representing 12.3% of global production.
Global gold demand is comprised of fabrication demand, official transactions, and net private investment (investment demand). Fabrication demand includes gold used in jewellery, electronics, dentistry and other industrial and decorative applications. Official transactions represent gold reserves purchased and sold by the International Monetary Fund and government central banks. Global jewellery demand in 2018 was 2,200 tonnes, a 0% change from 2017, on account of growth in demand in China and United States, offset by a decrease in Middle Eastern demand due to economic hardships and US sanctions on Iran.
United States economic overview5
The United States economy grew by 2.9% in 2018, as compared to 2.2% growth in 2017, equaling the highest growth rate achieved in the last ten years. Consumer prices increased by 1.5% year-on-year in February 2019 as compared to a 1.6% rise in January 2019 on the back of decreases in gasoline and clothing costs and stagnation in electricity prices. According to Oxford Economics, consumer price increases are expected to remain below the Federal Reserve’s 2% target over the year. The Federal Reserve in its March 2019 meeting kept the federal funds rate at 2.25%-2.50%. The rate is expected to remain at the current level at least until the end of the year.
The current account deficit remained at -2.3% of GDP in 2018. It is forecasted to be -2.7% in 2019 and -2.8% in 2020. Exports of goods and services are forecasted to grow by 2.1% in 2019 as compared to a 3.9% rise in 2018. Imports of goods and services are expected to rise by 3.5% in 2019 as compared to the 4.6% growth in 2018.
The United States GDP is forecasted to grow by 2.3% and 1.8% in 2019 and 2020, as compared to 2.9% growth in 2018, on account of reduced monetary policy support, trade uncertainty and weakened global economic conditions.
Global economic overview6
The global economy witnessed sluggish growth in 2018 on account of trade tension and decline in growth in emerging markets and developing economies.
The Eurozone real GDP grew by 0.2% quarter-on-quarter in Q4 2018, as compared to 0.1% growth in Q3 2018, on the back of improvement in fixed investments, net exports and a small increase in household spending.
Sub-Saharan Africa witnessed steady growth of 2.7% in 2018 on account of moderate trade growth, tight financial conditions and weak metals and agricultural commodity prices. The region is forecasted to witness growth of 3.4%, 3.6% and 3.7% in 2019, 2020 and 2021, respectively, on the back of robust growth in non-resource intensive countries.
In South Asia, real GDP increased to 6.9% in 2018 from 6.2% in 2017, underscored by increased domestic demand in India. The region is expected to grow by 7.1% until 2021 due to robust domestic demand. In the Middle-East and North Africa, real GDP is forecasted to grow by 1.9% in 2019 and 2.7% in 2020 and 2021, as compared to 1.7% growth in 2018 on the back of growth in Saudi Arabia and Egypt offset by contraction in Iran due to oil sanctions. The region is expected to witness stronger growth in 2020 and 2021 on the back of favourable monetary and diversification policies.
| 4 | Source: World Gold Council, Gold Demand Trends, Q4 2018; US Geological Survey, Mineral Commodity Summaries, February 2019 |
| 5 | Source: Oxford Economics and Trading Economics |
| 6 | Source: Global Economic prospects, World Bank Group, January 2019; United States- Oxford Economics, March 2019; Eurozone - Oxford Economics, March 2019 |
According to the World Bank, global real GDP is expected to increase by 2.9% in 2019, 2.8% and 2.8% in 2020 and 2021. US real GDP growth is expected to decrease from 2.9% in 2018 to 2.5% in 2019, 1.7% in 2020 and 1.6% in 2021. Eurozone real GDP is forecasted to grow by 1.6% in 2019, 1.5% in 2020 and 1.3% in 2021 from 1.9% in 2018.
Latin America is forecasted to witness economic growth of 1.7%, 2.4% and 2.5% in 2019, 2020, and 2021 respectively due to strengthening output from Brazil and Mexico.
Europe and Central Asia is forecasted to witness slow growth of 2.3%, 2.7% and 2.9% in 2019, 2020 and 2021 respectively on account of less supportive external conditions and slowdown in Turkey and Central European economies.
Valuation methodologies
Mineral properties can be classified into exploration, development, or producing assets. Depending on the availability of engineering and financial information one or more of the income, market and cost approaches may be favoured (these are described below). Typically, an income approach is most suitable where a life of mine plan and financial model are available and this would generally be the case with a development or producing asset. While market approaches can be applied to exploration and development assets it is important to recognize that there are no “true” comparables and application of market approaches can be subjective as every mineral property is unique. Application of a market approach to a producing property would also be impacted by lack of “true” comparables. Nonetheless a combination of approaches may be considered for an informed view of value.
Income approach
The income approach focuses on the income-producing capability of an asset. The underlying premise of this approach is that the value of an asset can be measured by the present worth of the net economic benefit (cash receipts less cash outlays) to be received over the life of the subject asset. The steps followed in applying this approach include estimating the expected after-tax cash flows attributable to the asset over its life and converting these after-tax cash flows to present value through “discounting”. The discounting process uses a rate of return that accounts for both the time value of money and investment risk factors. Finally, the present value of the after-tax cash flows over the life of the asset is summed to arrive at an indication of the value of the asset.
Market approach
The market approach is comprised of the “trading multiples” and “transaction multiples” methods.
The trading multiples method focuses on “guideline” publicly traded companies to derive value indications of comparable assets owned by such guideline companies.
When the transaction multiples method is utilized, data is collected on the prices paid for reasonably comparable assets. Adjustments are made to the purchase consideration to compensate for differences between reasonably similar assets and the asset being valued.
Cost approach
The cost approach relies on the principal of substitution. It recognizes that a prudent investor would pay no more for an asset than the cost to replace it with an identical or similar unit of equivalent utility.
Where an entity does not carry on business operations, individual assets and liabilities are valued on a standalone basis and value of equity is calculated as the sum of the parts. This method is often described as an “adjusted net assets” method and is often employed in the valuation of holding companies or for consideration of non-operating and financial assets and liabilities of operating companies.
Selected approaches
In estimating the value of Golden Queen’s common shares:
| 1. | we have employed income and market approaches to estimate a range of fair market value for the Mine; more particularly, we employed a discounted cash flow and trading and transaction multiples (in-situ gold equivalent ounce (“GoldEq.Oz”) multiples) methods; and |
| 2. | we utilized an adjusted net assets method to value the net financial liabilities of GQM LLC, and the net non-operating and net financial liabilities of GQM US and Golden Queen. |
Income approach: discounted cash flow analysis
In applying an income approach EY undertook a discounted cash flow (“DCF”) analysis. The DCF analysis discussed herein relies on a life on mine (“LOM”) plan prepared by GQM LLC and reviewed by Management.
LOM overview
Key expectations as of December 31, 2018 in respect of the Mine within the LOM, in real US dollars, are as follows:
| Life of mine | 13 years |
| Ore mined | 47.8m tons7 |
| Gold production | 813k oz |
| Silver production | 6.1m oz |
| Avg. cash costs | US$875/GoldEq.Oz |
| Avg. AISC incl. capex | US$930/GoldEq.Oz |
| Total capex | US$49.6m |
| Total closure cost | US$33m |
Source: LOM provided by Management
Discount rate
In order to undertake the DCF analysis, EY calculated the discount rate by determining the required rate of return as a weighted average cost of capital (“WACC”). WACC is used to discount pre-interest (but post-tax) cash flows to derive value at an enterprise (or pre-debt) level.
WACC is calculated by multiplying the cost of equity by the percentage of equity in the capital structure and then adding the after-tax cost of debt multiplied by the percentage of debt in the capital structure. The cost of equity herein has been estimated using the capital asset pricing model.
The financial projections were denominated in “real” (as opposed to “nominal”) US dollars. As such, the discount rate herein has been adjusted for forecast inflation to convert the “nominal” discount rate into a “real” discount rate.
| 7 | A portion of these tons, i.e. approximately 8 million tons, are over and above the Mine’s current leach pad capacity. |
The assumptions used by EY in estimating the discount rate for the Mine at 11.5% are provided below:
| | | Low | | | High | |
| Risk-free rate(1) | | | 2.5 | % | | | 2.5 | % |
| Beta(2) | | | 0.85 | | | | 0.90 | |
| Equity risk premium(3) | | | 6.0 | % | | | 6.0 | % |
| Size premium(4) | | | 5.2 | % | | | 5.2 | % |
| Specific risk premium(5) | | | 1.0 | % | | | 2.0 | % |
| Cost of equity(6) | | | 13.8 | % | | | 15.1 | % |
| Equity % in the capital structure(2) | | | 85.0 | % | | | 85.0 | % |
| | | | | | | | | |
| Pre-tax cost of debt(7) | | | 10.0 | % | | | 10.5 | % |
| Tax(8) | | | 21.0 | % | | | 21.0 | % |
| After-tax cost of debt | | | 7.9 | % | | | 8.3 | % |
| Debt % in the capital structure(2) | | | 15.0 | % | | | 15.0 | % |
| | | | | | | | | |
| Nominal WACC | | | 12.9 | % | | | 14.1 | % |
| Inflation(9) | | | 2.0 | % | | | 2.0 | % |
| Real WACC (rounded) | | | 11.0 | % | | | 12.0 | % |
| Selected WACC | | | 11.5% | |
| 1. | Average yield to maturity on 10 year and 20 year US Treasury bonds. |
| 2. | Based on EY’s review of publicly traded operating stage gold mining guideline companies. |
| 3. | Based on EY’s consideration of historical realized returns over the short-term and the long-term, forward-looking premium estimates, published views and academic studies. |
| 4. | Based on the Duff & Phelps Guide to Cost of Capital (10th decile) considering the relative size of the Mine. |
| 5. | Premium to consider cash flow and financing risks inherent in the LOM plan. |
| 6. | Cost of equity = risk-free rate + beta x equity risk premium + size premium + specific risk premium. |
| 7. | Estimated cost of debt considers historical cost of financing. |
| 8. | Applicable US corporate tax rate. |
| 9. | Based on estimates of long-term US dollar inflation. |
Source: EY research and analysis.
NAV multiple
The value computed herein based on the selected WACC of 11.5% is referred to herein asNPVWACC. We draw this distinction as we are mindful that it is common in the gold mining industry to consider a 5% real discount rate in conjunction with a net asset value (“NAV”) multiple; where a NAV multiple of less than 1.0 captures incremental risk relative to the 5% real discount rate and a NAV multiple of greater than 1.0 implicitly ascribes value to upside, if any, arising from metal price optionality, value increment attributable to management flexibility to slow or accelerate mining operations in response to metal prices, and the likelihood of mining for longer periods or higher volumes than determinable from known reserves and resources as a result of further exploration and discovery of new mineable material. The value computed herein based on a 5% discount rate and an application of a NAV multiple is referred to herein asNPV5% x NAV.
In this regard, EY researched available equity analyst reports in respect of guideline companies for price to NAV (P/NAV) multiples8 and selected a NAV multiple of 0.65x as summarized below:
| | | Number of Analysts | | Average P/NAV
multiple |
| Alio Gold Inc. | | 5 | | 0.39x |
| Atlantic Gold Corporation | | 5 | | 1.08x |
| TMAC Resources Inc. | | 5 | | 0.78x |
| Anaconda Mining Inc. | | 2 | | 0.30x |
| Harte Gold Corp. | | 2 | | 0.79x |
| Bonterra Resources Inc. | | 1 | | 0.40x |
| Fiore Gold Inc. | | 1 | | 0.31x |
| Golden Queen Mining Co. Ltd. | | 1 | | 0.30x |
| | | | | |
| Average | | | | 0.54x |
| Median | | | | 0.40x |
| Average (3+ analysts) | | | | 0.75x |
| EY selected | | | | 0.65x |
Source: EY research and analysis
DCF analysis
EY developed a DCF analysis based on the financial forecast in the LOM plan provided by Management9. EY discussed the LOM plan with Management and reflected the following in the DCF analysis:
| · | Revenues were calculated at metal prices of US$1,300 per oz. for gold and US$16 per oz. for silver based on industry analyst consensus prices around the Valuation Date; |
| · | Closure costs of US$33 million (as provided by Management) after the last year of mine life i.e. 2032; |
| · | Income taxes based on Management’s tax calculations (“Tax Model”). Based on discussions with Management we understand that the Tax Model considered all tax attributes available to GQM US (including tax losses of US$49 million) and hence reflects future cash taxes which would be attributable to Golden Queen’s share of taxable income of the Mine; |
| · | Non-cash working capital change based on an estimated working capital requirement as a percentage of revenue of 20.5% having regard to the historical balance sheet of GQM LLC and discussions with Management; and |
| · | A present value calculation as of the Valuation Date, which pro-rates the full year 2019 forecast based on time. |
| 8 | As these are Price to NAV multiples they would be applicable at an equity level, as opposed to an enterprise level. |
| 9 | Corporate costs in respect of Golden Queen are not reflected in the LOM plan and hence the DCF analysis. We consider them separately in determining the value of Golden Queen’s common shares. |
A summary of the financial forecasts of the Mine (100% basis) and the resulting after-tax unlevered (pre-debt) cash flow, for calendar years, is presented below:
| All amounts in US$000s | | 2019 | | | 2020 | | | 2021 | | | 2022 | | | 2023 | | | 2024 to 2032 | |
| Revenue | | | 97,744 | | | | 99,185 | | | | 77,621 | | | | 121,118 | | | | 120,669 | | | | 640,148 | |
| Costs | | | (79,990 | ) | | | (84,418 | ) | | | (86,893 | ) | | | (94,937 | ) | | | (84,588 | ) | | | (450,331 | ) |
| Closure costs | | | - | | | | - | | | | - | | | | - | | | | - | | | | (33,000 | ) |
| EBITDA | | | 17,753 | | | | 14,768 | | | | (9,272 | ) | | | 26,181 | | | | 36,082 | | | | 156,817 | |
| Capital expenditures | | | (11,391 | ) | | | (23,340 | ) | | | (1,790 | ) | | | (7,175 | ) | | | (175 | ) | | | (5,760 | ) |
| Working capital change | | | 6,034 | | | | (296 | ) | | | 4,423 | | | | (8,922 | ) | | | 92 | | | | 24,752 | |
| Taxes | | | (14 | ) | | | (14 | ) | | | (14 | ) | | | (14 | ) | | | (14 | ) | | | (2,910 | ) |
| After-tax Unlevered Discretionary Cash Flow | | | 12,382 | | | | (8,882 | ) | | | (6,653 | ) | | | 10,069 | | | | 35,984 | | | | 172,899 | |
| Cumulative after-tax Unlevered Discretionary Cash Flow | | | 12,382 | | | | 3,500 | | | | (3,151 | ) | | | 6,916 | | | | 42,900 | | | | 215,799 | |
Source: Management provided LOM plan and EY Analysis
As seen above, the negative unlevered cash flows in 2020 and 2021 (including negative EBITDA in 2021), reflect the Mine’s need for additional financing to cover near-term capital expenditures and operating costs. The Mine will not reach cumulative positive unlevered cash flows until 2022, requiring positive cash flows from 2019 to cover future cash shortfalls. It should also be noted that the above summary is on a pre-debt basis; as such, cash flows required by GQM LLC to fund interest and debt repayments are not included. GQM LLC has a $20 million revolving credit loan facility with a maturity date of March 31, 2020, of which $10 million of principal has been drawn as at the Valuation Date. This debt due must be considered when looking at the Mine’s future cash flows and cash position. In addition, Golden Queen’s debt with the Clay Group is coming due in May 2019, representing an additional significant cash requirement not represented above in the DCF analysis.
Mine value based on WACC - NPVWACC
Based on the above financial forecasts the net present value (100% basis), before deducting net debt, is US$97.8 million at US$1,300/oz gold price and 11.5% discount rate. Reducing the gold price by US$25 and discount rate by 1%, or increasing the gold price by US$25 and discount rate by 1% results in a change in value by approximately US$6 million as illustrated below:
| All amounts in US$000s | | Gold price | |
| | | | | | | 1,275 | | | | 1,300 | | | | 1,325 | |
| | | | 12.50 | % | | | 81,107 | | | | 92,009 | | | | 102,911 | |
| Discount | | | 11.50 | % | | | 86,425 | | | | 97,783 | | | | 109,142 | |
| rate | | | 10.50 | % | | | 92,180 | | | | 104,026 | | | | 115,873 | |
Based on the above, EY adopted the NPVWACCvalue of the Mine (100% basis), before debt, to be between US$92.2 million to US$102.9 million10.
Mine value based on 5% discount rate and NAV multiple - NPV5% x NAV
Based on the above financial forecasts and adopting a 5% real discount rate along with a 0.65x NAV multiple (as discussed above) results in a value (100% basis), before deducting net debt, of US$96.9 million at US$1,300/oz gold price. Varying the gold price by US$25 results in a change in value of approximately US$10 million as illustrated below:
| 10 | These amounts are before considering Golden Queen’s annual corporate costs. |
| All amounts in US$000s | | Gold price | |
| | | | 1,275 | | | | 1,300 | | | | 1,325 | |
| 5% and 0.65x NAV | | | 86,934 | | | | 96,852 | | | | 106,769 | |
Based on the above, EY adopted the NPV5% x NAV value of the Mine (100% basis), before debt, to be between US$86.9 million to US$106.8 million11.
Market approach: Trading multiples
EY identified publicly-traded companies whose principal assets were comparable operating gold mines in North America which had both gold and silver resources and were heap leach operations.
EY calculated multiples by considering:
| 1. | The total enterprise value (“TEV”) of each guideline company calculated as market capitalization adjusted for control premium, plus debt, less cash and cash equivalents, further adjusted for any non-controlling interests in the assets or entities owned by the guideline companies. We applied a control premium of 40% to the market capitalization (which would be based on minority traded positions in the stock market) to reflecten bloc equity value. |
| 2. | Gold equivalent economic ounce (“GoldEq. Economic Oz.”) multiple of each guideline company by applying economic adjustment factors to reported reserves and resources (“R&R”). Our economic adjustment factors reflect the decreasing level of confidence level acknowledged by market participants depending on the reported reserve or resource category starting with the highest confidence in proven and probable reserves to least confidence in inferred resources. We considered and applied economic adjustment factors of 100% to proven and probable reserves, 60% to measured and indicated resources and 30% to inferred resources. |
| 11 | These amounts are before considering Golden Queen’s annual corporate costs. |
The list of guideline companies and calculated TEV/ GoldEq. Economic Oz. multiples are shown in the table below. Multiples marked with an asterisk (*) are considered outliers and are excluded from our average and median observations.
| | | Exchange &
Ticker | | TEV (US
$000s) | | | Economic
GoldEq. R&R
(kOz) | | | TEV/GoldEq.
Economic Oz
(US$) | |
| | | | | | | | | | | | |
| TMAC Resources Inc. | | TSXV:NEE | | | 593,983 | | | | 4,806.9 | | | | 123.57 | |
| Atlantic Gold Corporation | | TSX:TMR | | | 563,799 | | | | 1,569.1 | | | | 359.32 | * |
| Harte Gold Corp. | | TSXV:AGB | | | 273,712 | | | | 832.2 | | | | 328.90 | * |
| Bonterra Resources Inc. | | TSX:HRT | | | 123,102 | | | | 827.7 | | | | 148.73 | |
| Monarch Gold Corporation | | TSXV:BTR | | | 78,586 | | | | 2,853.3 | | | | 27.54 | |
| Alio Gold Inc. | | TSX:ALO | | | 69,399 | | | | 4,408.5 | | | | 15.74 | |
| Northern Vertex Mining Corp. | | TSXV:NEE | | | 60,878 | | | | 349.0 | | | | 174.41 | * |
| Pershing Gold Corporation | | TSX:MQR | | | 56,540 | | | | 761.4 | | | | 74.26 | |
| Anaconda Mining Inc. | | TSX:ANX | | | 34,130 | | | | 788.1 | | | | 43.31 | |
| Fiore Gold Ltd. | | TSXV:F | | | 27,477 | | | | 1,862.5 | | | | 14,75 | |
| West Kirkland Mining Inc. | | TSXV:WKM | | | 22,046 | | | | 793.5 | | | | 27.78 | |
| Abcourt Mines Inc. | | TSXV:ABI | | | 15,029 | | | | 1,131.6 | | | | 13.28 | |
| Scorpio Gold Corporation | | TSXV:SGN | | | 10,503 | | | | 344.6 | | | | 30.48 | |
| | | | | | | | | | | | | | | |
| | | | | | | | | | Average | | | | 51.94 | |
| | | | | | | | | | Median | | | | 29.13 | |
Source: S&P Capital IQ, S&P Global Market Intelligence and EY analysis
The overall average multiple was US$51.94 per GoldEq. Economic Oz. and the median multiple was US$29.13 per GoldEq. Economic Oz. Based on a review of these multiples, EY selected a multiple range of US$40 to US$60 per GoldEq. Economic Oz., with a mid-point of US$50 per GoldEq. Economic Oz.
EY estimated that the Mine had approximately 1,414,439 GoldEq. Economic Ozs. as at Valuation Date12.
| 12 | These ounces are based on Management’s estimate of gold equivalent ounces aggregating 918,701 in the proven and probable category as at the Valuation Date, plus EY’s estimate of gold equivalent ounces in the measured and indicated and inferred categories adjusted by 60% and 30% economic factor adjustments, respectively. EY’s gold equivalent ounce calculation differs from Management’s as EY considers forward looking prices of $1,300 for gold $16 for silver (netting to a ratio of approximately 81); whereas Management’s ratio approximates 88 (as Management considers gold / silver price ratio of 55 plus a gold silver recovery ratio of 1.6). |
Based on the selected trading multiples, expressed on a GoldEq. Economic Oz. basis, ranging from US$40 to US$60 per GoldEq. Economic Oz., we calculated the value of the Mine (100% basis), before deducting net debt, as illustrated below:
| | | Low | | | Mid | | | High | |
| GoldEq. Economic Oz at the Mine | | | 1,414,439 | | | | 1,414,439 | | | | 1,414,439 | |
| Selected multiple in US$s | | | 40 | | | | 50 | | | | 60 | |
| Selected Mine Value (rounded) in US$000s | | | 57,000 | | | | 71,000 | | | | 85,000 | |
Based on the above, EY adopted the trading multiples based value of the Mine (100% basis), before debt, to be between US$57 million to US$85 million.
Market approach: Transaction multiples
EY identified precedent transactions representing the purchase and sale of companies or mining assets considered comparable to the Mine. We primarily considered completed transactions in respect of assets in the United States or Canada in respect of operating mines whose primary commodity was gold.
When analyzing these transactions, EY considered the deal value per GoldEq. Economic Oz., calculated as the deal value (at an enterprise level or asset level, i.e. pre-cash and debt) divided by the reported reserves and resources of the underlying assets, converted to gold equivalent economic ounces. Each transaction multiple was adjusted for the change in gold asset values between the transaction completion date and the Valuation Date, by adjusting the GoldEq. Economic Oz. multiple from the transaction by the percentage change in the HUI Index13. EY applied a selected range of multiples from these adjusted multiples, to the Mine’s gold equivalent economic ounces in order to calculate the value of the Mine.
| 13 | The NYSE ARCA Gold BUGS Index (HUI) is a modified equal dollar weighted index of companies involved in gold mining. The HUI Index was designed to provide significant exposure to near term movements in gold prices by including companies that do not hedge their gold production beyond 1.5 years. |
EY identified 12 precedent guideline transactions. The list of precedent transactions and calculated multiples is included below.
| Buyer | | Target | | Completion
Date | | Deal
Value
(US$ m) | | | Economic
GoldEq. R&R
(oz)14 | | | HUI
Adjusted
GoldEq.
Economic
Oz. | |
| Huakan International Mining | | Greenwood Gold project | | 26-Mar-14 | | | 2.7 | | | | 80,443 | | | | 25.28 | |
| Silver Standard Resources | | Marigold mine | | 04-Apr-14 | | | 275.0 | | | | 4,548,600 | | | | 44.42 | |
| Waterton Global Value | | Nixon Fork gold mine | | 07-Jul-14 | | | 0.2 | | | | 93,726 | | | | 1.77 | * |
| Avino Silver & Gold Mines | | Bralorne Gold Mines Ltd. | | 09-Jul-14 | | | 2.5 | | | | 16,016 | | | | 105.27 | |
| Integra Gold Corporation | | Sigma-Lamaque | | 08-Oct-14 | | | 7.2 | | | | 1,087,300 | | | | 5.49 | * |
| Avino Silver & Gold Mines | | Bralorne Gold Mines Ltd. | | 20-Oct-14 | | | 3.8 | | | | 20,950 | | | | 157.84 | * |
| Premier Gold Mines | | South Arturo project | | 02-Jun-15 | | | 41.0 | | | | 722,337 | | | | 56.15 | |
| Klondex Mines | | Rice Lake mine | | 21-Jan-16 | | | 32.0 | | | | 892,550 | | | | 56.37 | |
| McEwen Mining | | Black Fox mine and complex | | 03-Oct-17 | | | 32.5 | | | | 846,300 | | | | 32.05 | |
| Hecla Mining Company | | Klondex Mines Ltd. | | 20-Jul-18 | | | 446.4 | | | | 2,724,743 | | | | 158.44 | * |
| Northern Star Resources | | Pogo gold mine | | 28-Sep-18 | | | 260.3 | | | | 2,497,000 | | | | 122.93 | |
| Equinox Gold | | Mesquite mine | | 26-Oct-18 | | | 158.0 | | | | 1,869,700 | | | | 97.18 | |
| | | | | | | | | | | | | | | | | |
| | | | | | | | | | | | Average | | | | 67.46 | |
| | | | | | | | | | | | Median | | | | 56.26 | |
Source: S&P Global Market Intelligence and EY research and analysis
Multiples marked with an asterisk (*) are considered outliers and are excluded from our average and median observations.
The overall average multiple was US$67.46 per GoldEq. Economic Oz. and the median multiple was US$56.26 per GoldEq. Economic Oz. Based on a review of these multiples, EY selected a multiple range of US$55 to US$65 per GoldEq. Economic Oz., with a mid-point of US$60 per GoldEq. Economic Oz.
Based on the selected transaction multiples, expressed on a GoldEq. Economic Oz. basis, ranging from US$55 to US$65 per GoldEq. Economic Oz., we calculated the value of the Mine (100% basis), before deducting net debt, as illustrated below:
| | | Low | | | Mid | | | High | |
| GoldEq. Economic Ozs at the Mine | | | 1,414,439 | | | | 1,414,439 | | | | 1,414,439 | |
| Selected multiple in US$s | | | 55 | | | | 60 | | | | 65 | |
| Selected Mine Value (rounded) in US$000s | | | 78,000 | | | | 85,000 | | | | 92,000 | |
Based on the above, EY adopted the transaction multiples based value of the Mine (100% basis), before debt, to be between US$78 million to US$92 million.
| 14 | Wherever a split between Measured & Indicated and Inferred resources was not available, an economic factor of 45% (i.e. average of 60% and 30%) was applied to total resources. |
Summarized value of the Mine
Below we present a summarized view of the various approaches considered above in respect of the value of the Mine:
| In US$ millions | | Mine value before Golden
Queen’s corporate costs
(100% basis) | | | Golden Queen’s
corporate costs (50%
basis) | | Mine value after Golden
Queen’s corporate costs (50%
basis) | |
| | | Low | | | High | | | | | Low | | | High | |
| NPVWACC | | | 92.2 | | | | 102.9 | | | 8.7 | 15 | | 37.4 | | | | 42.8 | |
| NPV5% x NAV | | | 86.9 | | | | 106.8 | | | 8.1 | 16 | | 35.4 | | | | 45.3 | |
| Trading multiples | | | 57.0 | | | | 85.0 | | | not applicable | | | 28.5 | | | | 42.5 | |
| Transaction multiples | | | 78.0 | | | | 92.0 | | | not applicable | | | 39.0 | | | | 46.0 | |
| | | | | | | | | | | | | | | | | | | |
| Average | | | | | | | | | | | | | 35.1 | | | | 44.1 | |
| | | | | | | | | | | | | | | | | | | |
| Source: Management information and EY Analysis | |
In our view, the income approaches and market approaches, viewed together, provide consistent outcome of value of Golden Queen’s 50% interest in the Mine.
Adjusted net asset approach
We next present the adjusted net assets analysis in respect of the net debt of GQM LLC and Golden Queen as they would impact the value of Golden Queen; and hence the resultingen bloc value of Golden Queen’s common shares:
| In US$ millions | | Mine value after Golden
Queen’s corporate costs
(50% basis) | | | Net debt17,18 | | | Value of Golden Queen
common shares (en
bloc) | |
| | | Low | | | High | | | GQM LLC (at
50%) | | | Golden
Queen | | | Low | | | High | |
| NPVWACC | | | 37.4 | | | | 42.8 | | | | 6.6 | | | | 24.7 | | | | 6.1 | | | | 11.5 | |
| NPV5% x NAV | | | 35.4 | | | | 45.3 | | | | 4.319 | | | | 24.7 | | | | 6.4 | | | | 16.3 | |
| Trading multiples | | | 28.5 | | | | 42.5 | | | | 6.6 | | | | 24.7 | | | | (2.8 | ) | | | 11.2 | |
| Transaction multiples | | | 39.0 | | | | 46.0 | | | | 6.6 | | | | 24.7 | | | | 7.7 | | | | 14.7 | |
| | | | | | | | | | | | | | | | | | | | | | | | | |
| Source: Management information and EY Analysis | | | | | | |
Value range in respect of Golden Queen common shares
The table below presents the range of values of Golden Queen’s common shares having regard to a C$ to US$ exchange rate of 1.3447 on the Valuation Date and Golden Queen’s 300,101,441 issued and outstanding common shares.
| | | Value of Golden Queen
common shares, en bloc
(US$ millions) | | | Value of a Golden Queen common
share (Canadian cents) | |
| | | Low | | | High | | | Low | | | High | |
| NPVWACC | | | 6.1 | | | | 11.5 | | | | 2.7 | | | | 5.1 | |
| NPV5% x NAV | | | 6.4 | | | | 16.3 | | | | 2.9 | | | | 7.3 | |
| Trading multiples | | | (2.8 | ) | | | 11.2 | | | | 0.0 | | | | 5.0 | |
| Transaction multiples | | | 7.7 | | | | 14.7 | | | | 3.5 | | | | 6.6 | |
| | | | | | | | | | | | | | | | | |
| Average | | | | | | | | | | | 2.3 | | | | 6.0 | |
| Median | | | | | | | | | | | 2.8 | | | | 5.9 | |
| Selected (Median, rounded) | | | | | | | | | | | 3.0 | | | | 6.0 | |
| | | | | | | | | | | | | | | | | |
| Source: EY Analysis | |
| 15 | Present value of Golden Queen’s monthly corporate costs of US$110,000 over 13 years at an 11.5% discount rate. |
| 16 | Present value of Golden Queen’s monthly corporate costs of US$110,000 over 13 years at a 5% discount rate and 0.65 NAV multiple. |
| 17 | GQM LLC’s net debt (100% basis) is comprised of cash of $4.1 million and debt of $17.3 million as at December 31, 2018. As noted earlier, we have assumed that there are no material changes in the financial position or operating results for GQM LLC from December 31, 2018 to the Valuation Date. |
| 18 | Golden Queen’s net debt at the Valuation Date is comprised of cash of $2.2 million, working capital of $60 thousand and debt of $27 million. The cash adjustment includes $1.005 million of restricted cash representing collateral relating to Golden Queen’s reclamation deposit surety bonds. |
| 19 | Net debt adjusted by NAV multiple of 0.65x. |
Conclusion of value of Golden Queen common shares
Based on the information reviewed, observations, assumptions, limitations, analyses and other relevant factors, it is EY’s opinion that the per share value of the Golden Queen common shares is between C$0.03 and C$0.06 before the Proposed Transaction is effected, and assuming Golden Queen can continue as a going concern and can meet its debt obligations as they come due, and/or can refinance the Clay Group loan which matures on May 21, 2019.
Conclusion of value of the Proposed Transaction
If the Proposed Transaction is undertaken then the value of the Golden Queen common shares would be C$0.05 per share (US$4.25 million cash consideration, converted at an exchange rate of 1.3447 and divided amongst 122,400,212 shares20), before considering any costs of the Proposed Transaction and any other assets (such as cash) remaining in Golden Queen.
EY’s opinion and its rationale
Based on the information reviewed, observations, assumptions, limitations, analyses and other relevant factors, it is EY’s opinion that, the Proposed Transaction is fair from a financial point of view to the existing shareholders of the common shares of Golden Queen, other than the Clay Group.
In reaching our fairness opinion we considered the following:
| · | Golden Queen’s debt with the Clay Group matures on May 21, 2019. As at February 1, 2019 the balance owed was US$26.496 million. Payments due on February 1, 2019 through to May 21, 2019 aggregate US$27.6 million (inclusive of interest accruing through to May 21). The Clay Group has informed Golden Queen that it will no longer extend the loan or provide further financing. |
| · | Golden Queen’s revolving credit loan facility with Gauss LLC and Auvergne LLC matures on March 31, 2020, and the current balance drawn is $10 million as at the Valuation Date, representing a significant additional cash outflow over the near term. |
| · | GQM LLC will mine low grade ore in 2021 and along with some significant capital expenditure requirements in 2020 and 2021 (partially financed by equipment loans) the funding requirements in 2020 at a 100% ownership level are expected to be approximately US$8.9 million and US$6.7 million in 2021. The Mine is expected to generate positive cash flow of US$12.3 million in 2019. |
| · | The last equity financing undertaken by Golden Queen, announced on November 14, 2017 (closed February 22, 2018), was a rights offering backstopped by the Clay Group. The rights offering was undertaken at US$0.1325. On November 14, 2017, the 20 day VWAP (volume weighted average price) of Golden Queen’s shares was approximately US$0.24 (implying a rights offering discount of 44%), and on November 28, 2017 it was US$0.187 (implying a rights offering discount of 29%). Despite the significant discount, some 65% of the then minority shareholders did not exercise their subscription rights, leading to the Clay Group, who backstopped the US$25 million rights offering, increasing their ownership from 30.5% to 58.94%. In that round, 75% of the US$25 million was raised from the Clay Group. The dominant shareholding of the Clay Group would be seen as a deterrent to any meaningful equity investor interest as at the Valuation Date and hence severely limits Golden Queen’s ability to raise equity financing. |
| · | Based on our discussions with Maxit Capital LP, who are advisors to Golden Queen, there was no alternative transaction (divestiture or financing) identified during the Go Shop Period. More particularly, the ability to raise debt financing is very limited as the Mine will not generate net positive cash flow, in aggregate, until 2022. Golden Queen has been working with Maxit since 2015 to explore financing or M&A opportunities, but the company has had difficulty attracting sufficient capital to cover its cash needs and has relied upon the Clay Group historically. |
| 20 | Total outstanding shares 300,101,441 less Clay Group shares of 177,701,229. |
| · | The per share value of the Golden Queen common shares is estimated herein to be between C$0.03 and C$0.06 before the Proposed Transaction is effected, and assuming Golden Queen can continue as a going concern and can meet its debt obligations as they come due, and/or can refinance the Clay Group loan which matures on May 21, 2019. Absent a restructuring or refinancing of the loan, the value per Common Share could quickly approach C$nil per share. |
Sincerely,
Ernst & Young LLP
Schedule of Limiting Conditions
| 1. | Ernst & Young LLP ("EY") has prepared this Fairness Opinion and Formal Valuation solely for the purpose stated, and it should not be used for any other purpose. This report is confidential and may be privileged. In carrying out our work, we have worked solely on the instructions of our client and this Fairness Opinion and Formal Valuation has been prepared solely for the use of the Special Committee of the Board of Directors of Golden Queen. Our Fairness Opinion and Formal Valuation may not have considered issues relevant to third parties and EY shall have no responsibility whatsoever to any third party which obtains a copy of this Fairness Opinion and Formal Valuation. Any use such a third party may choose to make of this Fairness Opinion and Formal Valuation is entirely at its own risk. |
| 2. | EY, by reason of its services hereunder, is not required to furnish additional work or services, or to give testimony, or be in attendance in court with reference to the subject assets, properties, or business interest or to update any report, recommendation, analysis, conclusion or other document relating to its services for any events or circumstances except as stipulated in the engagement letter under which this report was prepared. |
| 3. | Provision of valuation conclusions and/or recommendations and considerations of the issues described herein are areas of valuation practice for which we believe that we have knowledge and experience. The services provided are limited to such knowledge and experience and do not represent audit, advisory or tax-related services that may otherwise be provided by EY or another Ernst & Young member firm. |
| 4. | No investigation of the title to the subject company and subject assets has been made, and the ownership claims to the subject company and subject assets are assumed to be valid. To the extent that EY’s services include assets, properties or business interests, EY shall assume no responsibility for matters of legal description or title, and EY shall be entitled to make the following assumptions: (i) title is good and marketable, (ii) there exist no liens or encumbrances, (iii) there is full compliance with all applicable government regulations and laws (including, without limitation, zoning regulations), and (iv) all required licenses, certificates of occupancy, consents, or legislative or administrative authority from any government, private entity or organization have been or can be obtained or renewed for any use on which EY services are to be based. |
| 5. | The value conclusions and/or recommendations contained herein are not intended to represent the values of the subject assets at any time other than the effective date that is specifically stated in this report. Changes in market conditions could result in recommendations of value substantially different than those presented at the stated effective date. We assume no responsibility for changes in market conditions or for the inability of the owner to locate a purchaser of the subject assets at the values stated herein. |
| 6. | No responsibility is assumed for information furnished by others (including management), and such information is believed to be reliable. |
| 7. | In the course of our analysis, we were provided with written information, oral information, and/or data in electronic form, related to the structure, operation, and financial performance of the subject company and subject assets. We have relied upon this information in our analyses and in the preparation of this report and have not independently verified its accuracy or completeness. |
| 8. | Certain historical financial data used in our engagement were derived from unaudited financial statements and are the responsibility of management. These financial statements may not have included disclosures required by generally accepted accounting principles. We have not independently verified the accuracy or completeness of the data provided and do not express an opinion or offer any form of assurance regarding its accuracy or completeness. |
| 9. | The estimates of cash flow data underlying the analysis herein is solely for use in the valuation analysis. We have not performed an examination or compilation of the underlying cash flow data in accordance with standards prescribed by the Canadian Institute of Chartered Accountants, and, accordingly, do not express an opinion or offer any form of assurance on the underlying cash flow data. Furthermore, there will usually be differences between estimated and actual results because events and circumstances frequently do not occur as expected, and those differences may be material. |
| 10. | Our Fairness Opinion and Formal Valuation assumes full compliance with all applicable federal, provincial, local, and other zoning, usage, environmental and similar laws and regulations, unless otherwise stated. |
| 11. | We assume no responsibility for any financial and tax reporting decisions, which are appropriately those of management. It is our understanding that management accepts the responsibility for any financial statement and tax reporting issues with respect to the subject assets. |
| 12. | We reserve the right (but will not be obligated) to revise this report in light of any relevant information (that we consider material to this Fairness Opinion and Formal Valuation) that comes to our attention after the date of issuance. |
EY | Assurance | Tax | Transactions | Advisory
About EY
EY is a global leader in assurance, tax, transaction and advisory services. The insights and quality services we deliver help build trust and confidence in the capital markets and in economies the world over. We develop outstanding leaders who team to deliver on our promises to all of our stakeholders. In so doing, we play a critical role in building a better working world for our people, for our clients and for our communities.
EY refers to the global organization, and may refer to one or more, of the member firms of Ernst & Young Global Limited, each of which is a separate legal entity. Ernst & Young Global Limited, a UK company limited by guarantee, does not provide services to clients.
For more information about our organization, please visit ey.com/ca
© 2019 Ernst & Young LLP, A member firm of Ernst & Young Global Limited. All Rights Reserved.
A member firm of Ernst & Young Global Limited