WPC Corporate Overview
New York Society of Security Analysts
14th Annual REIT Conference
April 14, 2004
Serving Investors Since 1973
© Copyright W. P. Carey & Co. LLC 2004

Table of Contents
2
Page
Corporate Overview
3-5
Market Opportunity
6
Unique Business Model
7-8
Diversified Stable Portfolio
9-11
Management/Advisory Business
12-17
W. P. Carey Fundamentals
18-26
Running the Business as Owners
27
Corporate Overview
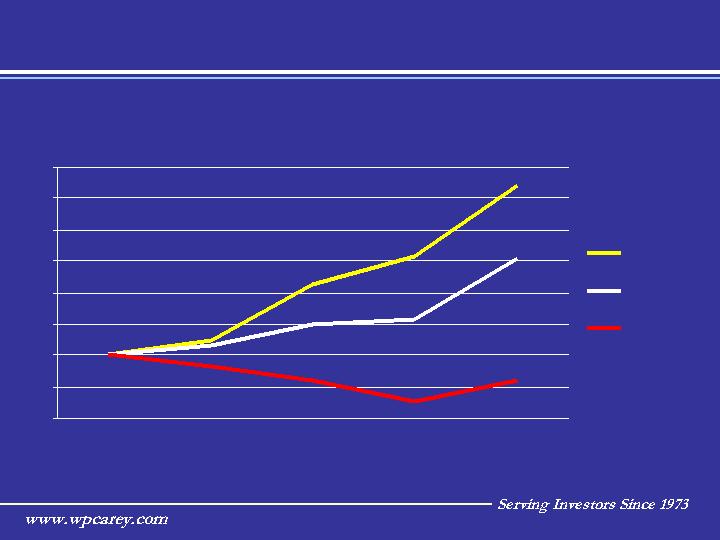
Returns Since W. P. Carey’s Merger in 2000
3
50
75
100
125
150
175
200
225
250
6/28/2000
2000
2001
2002
2003
WPC
NAREIT
S&P 500

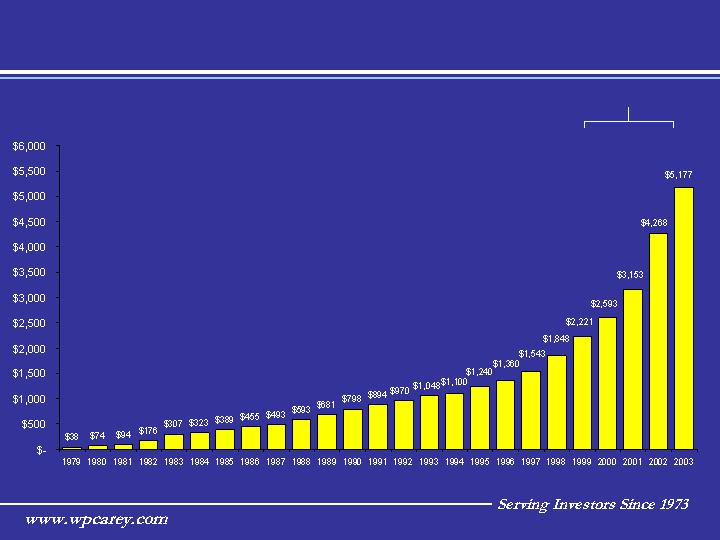
Since listing on the NYSE in 1998, funds from operations have grown at a 17% compound annual growth rate.
Growth in FFO
Corporate Overview
($ in millions)
4

Corporate Overview
Leading Sale-Leaseback Investor
30 years as premier sale-leaseback investor
Expertise across many industries
Ability to underwrite extremely complex
transactions
5
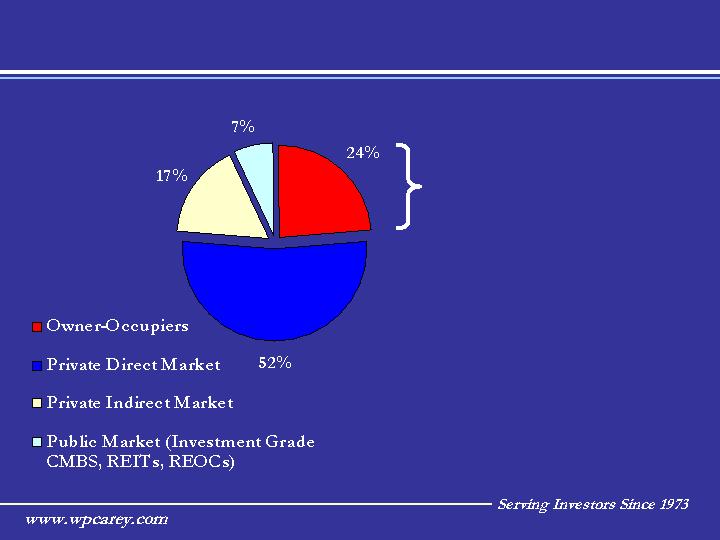
Approximately 24% of
commercial real estate is
owner-occupied,
representing over $1
trillion in investment
opportunity
Domestic Market Opportunity
Ownership of U.S. Commercial Real Estate*
*(Source: Jones Lang LaSalle)
6

Unique Business Model
W. P. Carey & Co. LLC
OWNS
MANAGES
Generates 54% of its revenue by
managing day-to-day operations
and new real estate investments
$800 million in
net-leased real estate
Generates 46% of its revenue
through rental income from its
owned assets.
$4.4 billion in net-leased
real estate
DIVERSIFIED STABLE
PORTFOLIO
CPA® REITS
7

Why a Limited Liability Company (LLC)?
Unique Business Model
LIMITED LIABILITY
COMPANY
OWNS
C Corp
Carey Asset Management
CURRENT
STRUCTURE
MANAGES
Taxation – More efficient than REIT or C-Corp. Minimizes corporate level
taxation
Operating flexibility – Less restrictive than a REIT on sources of revenue and
real estate business activity
The LLC structure provides W. P. Carey's management with the
flexibility it needs to implement the Company's unique business model
while providing its shareholders with the most efficient tax treatment.
8

W. P. Carey & Co. LLC
OWNS
MANAGES
$800 million in
net-leased real estate
Generates 46% of its revenue
through rental income from its
owned assets.
DIVERSIFIED STABLE
PORTFOLIO
Diversified Stable Portfolio
9

Diversified Income
5.0%
-
7.5%
0
2.5%
-
5.0%
2
2.5% or Less
95
10
MANAGES
OWNS
W. P. Carey & Co. LLC
Diversified Stable Portfolio
% of Total Revenues # of Tenants/Guarantors
Only two tenants represent more than 2.5% of W. P. Carey’s total revenues
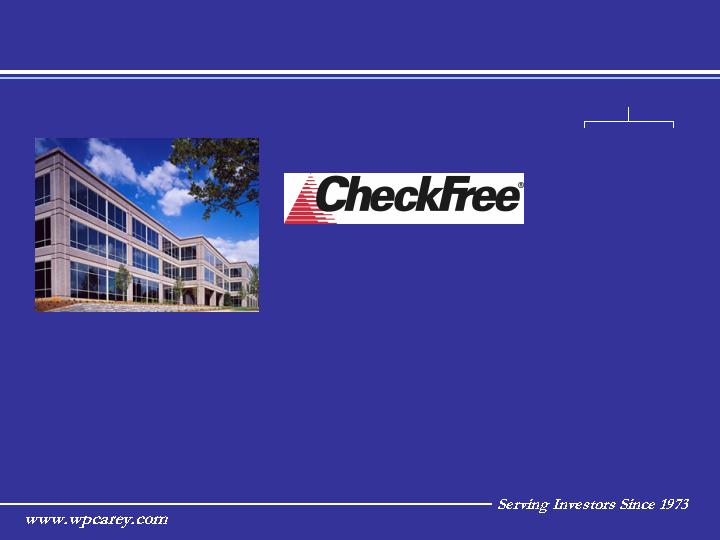
Diversified Stable Portfolio
Location: Norcross, GA
Purchase Price: $42 million
Lease Term: December 2015
Rent Escalation Provision: CPI Indexed
CheckFree Corporation
Corporate Office Headquarters Campus
11
MANAGES
OWNS
W. P. Carey & Co. LLC

Management/Advisory Business
W. P. Carey & Co. LLC
OWNS
MANAGES
Generates 54% of its revenue by
managing day-to-day operations
and new real estate investments.
$4.4 billion in net-leased
real estate
CPA® REITS
12

Institutional - Carey Institutional Properties (CIP®)
- Variety of pension fund clients
- Formerly exclusive CalPERS advisor for net lease asset class
Individual - Corporate Property Associates (CPA®) series
- More than 80,000 investors in CPA® funds
- Sold through relationships with UBS Financial Services, Inc., American
Express Financial Advisors, and 30 additional broker/dealers
Investment Attributes
- Yield
- Low volatility
- Preservation of capital
- Upside “kicker”
Management/Advisory Business
W. P. Carey & Co. LLC
OWNS
MANAGES
13

Unusually Valuable Franchise
Superior Performance
- All funds have met or exceeded investor expectations
- No full-term investor has lost money in any program
- Ten programs have gone full cycle to liquidity with average annual return of 12%
- Distributed 680 dividends with 89% of those larger than the preceding one
Structure
- Designed as closed-end funds
- CPA ®: 12, CPA®: 14 and CPA® : 15 were structured with redemption programs;
redemptions totaled less than 0.2% of assets in 2002
Management/Advisory Business
W. P. Carey & Co. LLC
OWNS
MANAGES
14

Convergence of Two Major Trends
Investor interest in yield investments
Corporations facing capital market constraints
Investor
interest in
yield
investments
and stability
Corporate
capital
constraints and
desire to shed
real estate
W. P. Carey & Co. LLC
Management/Advisory Business
W. P. Carey & Co. LLC
OWNS
MANAGES
15
($ in millions)
Growth in Assets Under Ownership and Management
W. P. Carey & Co. LLC
OWNS
MANAGES
Total assets under management and ownership have grown at a compound annual rate of 23% over the last 24 years
Management/Advisory Business
16
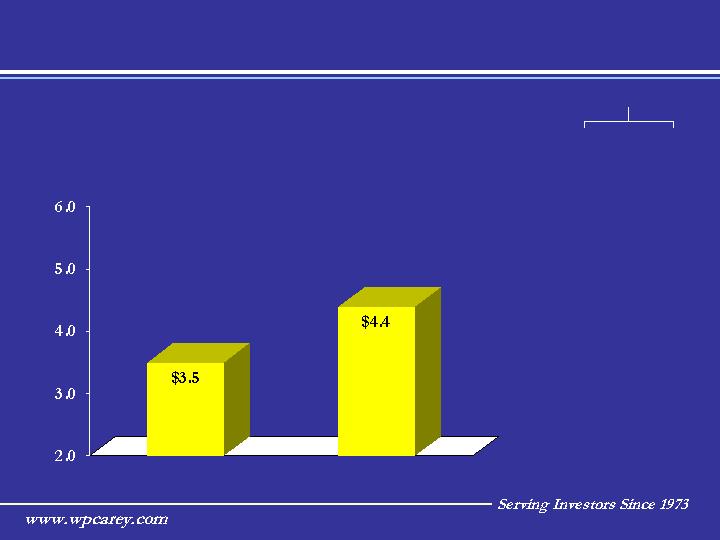
Assets Under Management Growth
Management/Advisory Business
($ in billions)
Year-Over-Year
Growth in
Assets Under
Management
26%
billion
billion
December 2002
December 2003
W. P. Carey & Co. LLC
OWNS
MANAGES
17

WPC Fundamentals
18

WPC Financial Results
(in thousands except per share amounts)
19
12 Months Ended
12 Months Ended
12 Months Ended
12/31/01
12/31/02
12/31/03
Revenues:
Principal Revenues
$92,500
$86,670
$80,840
Management Revenues
$46,911
$84,255
$88,060
Expenses:
Interest Expense
$21,603
$16,134
$15,116
G&A Expense
$29,435
$42,592
$43,698
Net Income:
$35,761
$46,588
$62,878
Per Share
$1.02
$1.28
$1.65

WPC Financial Results
(in thousands except per share amounts)
Funds from Operations
Funds from Operations
(in millions)
20
$84
$102
$106
$60
$80
$100
$120
2001
2002
2003
2003
2002
2001
$3.00
$2.80
$2.60
$2.40
$2.20
$2.00
$2.78
$2.81
$2.41
12 Months Ended
12 Months Ended
12 Months Ended
12/31/01
12/31/02
12/31/03
Funds From Operations:
$84,160
$102,013
$105,518
Per Share (Diluted)
$2.41
$2.81
$2.78

WPC Financial Results
(in thousands except per share amounts)
21
12 Months Ended
12 Months Ended
12 Months Ended
12/31/01
12/31/02
12/31/03
Per Share:
Funds From Operations
$2.41
$2.81
$2.79
Dividend
$1.704
$1.72
$1.73
Dividend Coverage
141%
163%
161%
Average Shares Outstanding
34,952
36,265
38,008
Balance Sheet:
Total Assets
$915,883
$893,524
$906,505
Non-Recourse Mortgage Payable $200,515
$186,049
$180,193
Notes Payable
$95,000
$49,000
$29,000

WPC Capital Structure
(in thousands except per share amounts)
22
Market Capitalization:
WPC
Equity Market Capitalization
$966,364
Debt Market Capitalization
$209,193
Total Market Capitalization
$1,175,557
WPC
NAREIT
Equity % of Total Market Cap
82%
61%
Debt % of Total Market Cap
18%
39%
Unsecured Debt % of Total Market Cap
2.5%
19%
Source: NAREIT, SEC Filings, SNL DataSource
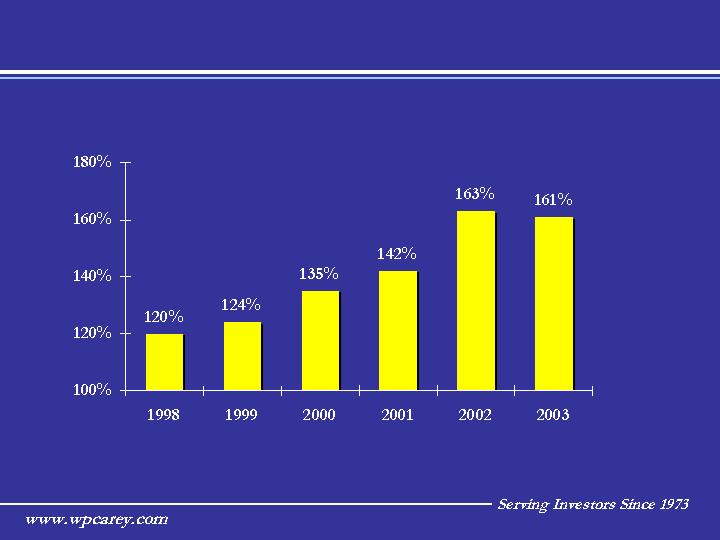
WPC Conservative Approach
W. P. Carey & Co. and its affiliates continue to provide investors with a safe, steady flow
of income and have paid more than 680 consecutive dividends.
Dividend Coverage Since Listing
23

FFO Multiple vs. REIT Peer Group
W. P. Carey Current Valuation
24
Close
4/12/03
2003 FFO
FFO Multiple
AMB Property
$32.10
$2.13
15.1
Alexandria Real Estate
$57.75
$4.23
13.7
Capital Automotive REIT
$29.42
$2.40
12.3
Commercial Net Lease Rlty
$17.18
$1.46
11.8
Lexington Corp. Properties
$19.25
$1.82
10.6
Realty Income
$37.80
$2.92
12.9
Washington REIT
$27.57
$2.04
13.5
iSTAR Financial
$38.18
$3.25
11.7
ProLogis Trust
$30.75
$2.41
12.8
W. P. Carey & Co. LLC
$26.30
$2.78
9.5
Peer Average
12.7

Dividend Yield vs. REIT Peer Group
W. P. Carey Current Valuation
WPC is currently yielding over 240 basis points above the 10-Year Treasury while the
NAREIT Equity Index is yielding 150 basis points above the 10-Year Treasury
25
Close
4/12/03
FFO Multiple
Yield
Div. Coverage
AMB Property
$32.10
15.8
5.30%
129%
Alexandria Real Estate
$57.75
13.7
4.16%
198%
Capital Automotive REIT
$29.42
12.3
5.66%
146%
Commercial Net Lease Rlty
$17.18
11.8
7.45%
114%
Lexington Corp. Properties
$19.25
10.6
7.27%
136%
Realty Income
$37.80
12.9
6.39%
124%
Washington REIT
$27.57
13.5
5.40%
136%
iSTAR Financial
$38.18
11.7
7.44%
123%
ProLogis Trust
$30.75
12.8
4.75%
167%
W. P. Carey & Co. LLC
$26.30
9.5
6.63%
161%
Peer Average
5.98%
141%

FFO Multiple vs. Investment Manager Peer Group
W. P. Carey Current Valuation
26
Close
4/12/03
2003 Net Income
P/E Ratio
Alliance Capital
$36.93
$2.11
17.5
Franklin Resources
$57.06
$2.22
25.7
BlackRock
$63.90
$2.36
27.1
Eaton Vance
$39.21
$1.60
24.5
Federated Investors
$31.75
$1.83
17.3
Janus Capital Group
$16.70
$0.86
19.4
Legg Mason
$99.10
$3.57
27.8
T. Rowe Price
$53.90
$1.77
30.5
Gabelli Asset Mgmt
$40.50
$1.64
24.7
W.P. Stewart
$20.55
$0.96
21.4
Waddell & Reed
$24.52
$1.13
21.7
W. P. Carey & Co. LLC
$26.30
$1.65
15.9
Peer Average
23.4

Running the Business as Owners
13.90%
Fortune 500
16.71%
Equity REIT Industry
8.16%
Peer Group
39.70%
WPC
% of Management Ownership as of 2003 Proxy Season
27