The Wall Street Transcript’s
REIT Industry Conference
Tuesday, August 17, 2004
Harvard Club, New York City

W. P. Carey & Co. trades on the New York Stock Exchange under the ticker symbol WPC. Approximately
54% of its revenues are from management fees and 46% are from property holdings.
CPA® funds, which are advised by W. P. Carey, are created periodically as warranted by market opportunities.
The information contained in this presentation reflects CPA ®:1 through CPA ®:16 - Global. Subsequent
CPA ®funds will not own the same properties. There can be no guarantee that the performance of subsequent
CPA® funds will be similar to that of W. P. Carey or any prior CPA®portfolio.
Past performance does not assure future results.
The following presentation includes forward looking statements. Forward looking statements, which are based
on certain assumptions, describe future plans, strategies and expectations of WPC. Forward-looking statements
discuss matters that are not historical facts. Because they discuss future events or conditions, forward-looking
statements may include words such as "anticipate", "believe", "expect", "estimate", "intend", "could", "should",
"would", "may", or similar expressions. Do not unduly rely on forward looking statements. They give our
expectations about the future and are not guarantees, and speak only as of the date they are made. Such
statements involve known and unknown risks, uncertainties and other factors that may cause the actual results,
performance or achievement of W. P. Carey & Co. to be materially different from the results of operations or
plan expressed or implied by such forward looking statements. The risk factors are fully described in Item 1 of
the Annual Report on Form 10-K for the year ended December 31, 2003.
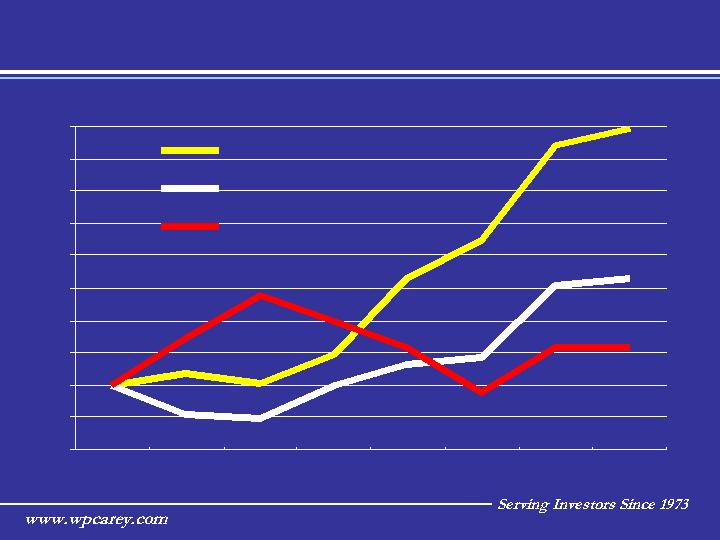
Returns Since NYSE Listing in 1998
Shareholder Returns
3
60
80
100
120
140
160
180
200
220
240
260
1/21/98
1998
1999
2000
2001
2002
2003
2004
YTD
WPC
NAREIT
S&P 500
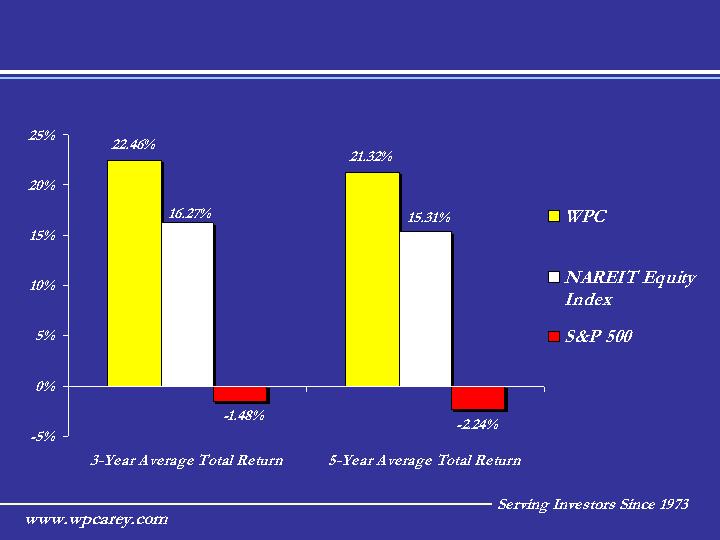
Comparative Total Returns
Shareholder Returns
4
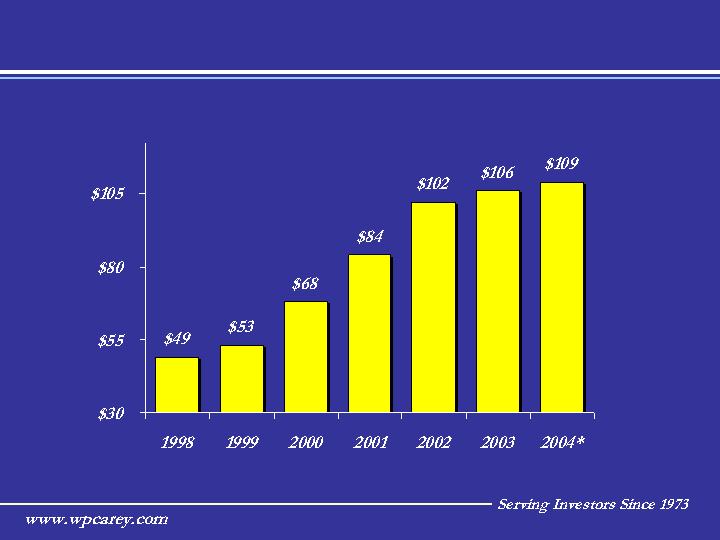
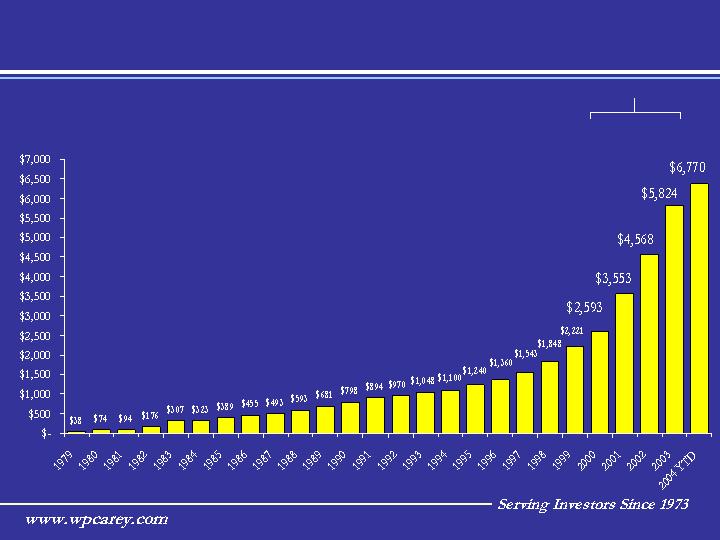
Since listing on the NYSE in 1998, Funds from Operations have grown at a 17% compound annual growth rate.
Growth in FFO
FFO Growth
($ in millions)
*Annualized 6-month FFO – Not a projection by the Company
5

Unique Business Model
W. P. Carey & Co. LLC
OWNS
MANAGES
Generates 54% of its revenue by
managing day-to-day operations
and new real estate investments.
$1.4 billion total
market capitalization
Generates 46% of its revenue
through rental income from its
owned assets.
$5.4 billion in net-leased
real estate
DIVERSIFIED STABLE
PORTFOLIO
CPA® REITS
6

W. P. Carey & Co. LLC
OWNS
MANAGES
Generates 46% of its revenue
through rental income from its
owned assets.
DIVERSIFIED STABLE
PORTFOLIO
Diversified Stable Portfolio
$1.4 billion total
market capitalization
7

Diversified Income
Diversified Stable Portfolio
1.4%
3.1%
2,393,255
AutoZone, Inc.
1.6%
3.4%
2,655,320
Orbital Sciences Corporation
1.6%
3.5%
2,709,076
Quebecor Printing USA
1.7%
3.7%
2,837,889
America West Holdings
1.7%
3.7%
2,888,424
Carrefour France, SA
1.7%
3.7%
2,922,348
Federal Express Corporation
2.1%
4.6%
3,535,408
Bouygues Telecom, S.A.
2.2%
4.8%
3,720,000
American Greetings Corporation
2.5%
5.4%
4,157,524
Detroit Diesel Corporation
2.6%
5.8%
$ 4,474,720
Dr Pepper/Seven Up Bottling
Percentage of
Total Revenue
Percentage of
Total Rent
Annual Rent
Top Ten Tenants/
Lease Guarantors
W. P. Carey & Co. LLC
OWNS
MANAGES
8
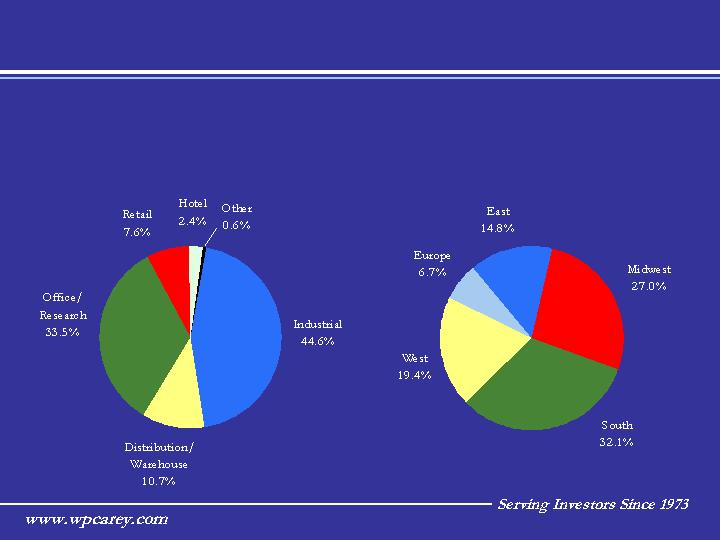
By Geographic Region
By Property Type
Portfolio Diversification
Note: Based on Annualized Rent
Diversified Stable Portfolio
9

Management/Advisory Business
W. P. Carey & Co. LLC
OWNS
MANAGES
Generates 54% of its revenue by
managing day-to-day operations
and new real estate investments.
$5.4 billion in net-leased
real estate
CPA® REITS
10

Approximately 24% of
commercial real estate is
owner-occupied,
representing over $1
trillion in investment
opportunity
Ownership of U.S. Commercial Real Estate*
*(Source: Jones Lang LaSalle)
Domestic Market Opportunity
11

Convergence of Two Major Trends
Investor
interest in
yield
investments
and stability
Corporations
desire to
outsource real
estate assets
W. P. Carey & Co. LLC
Management/Advisory Business
W. P. Carey & Co. LLC
OWNS
MANAGES
12
Investor interest in yield investments
Corporations desire to outsource real estate assets
($ in millions)
Growth in Assets Under Ownership and Management
W. P. Carey & Co. LLC
OWNS
MANAGES
Management/Advisory Business
Total assets under management and
ownership have grown at a compound
annual rate of 23% over the last 24 years
13

Investment Overview 2001 - 2004
Transaction Statistics
15
20
24
19
Number of Industries
17.8
19.5
16.7
19.6
Average Lease Term of
New Investments (years)
5
5
3
3
Number of Countries
$45,439
$24,993
$33,601
$19,753
Average Investment Size*
17
29
30
20
Number of Investments
$727,027
$724,788
$1,008,027
$395,064
Total Investment Volume*
2004 YTD
2003
2002
2001
* in thousands
W. P. Carey & Co. LLC
OWNS
MANAGES
14

Recent Acquisitions
15
Facility Type:
Self-Storage & Truck Rental Facilities
Purchase Price:
$312,445,000
Location:
78 locations throughout the U.S.
Acquired by:
CPA® :14, CPA®:15, CPA® :16 - Global
U-Haul is the nation’s leading do-it-yourself moving company with a network
of over 14,000 locations in all 50 United States and 10 Canadian provinces.
The facilities are located in 69 cities in 24 states. All 78 locations contain a
truck rental facility, and all but one contains a self-storage facility. Under the
terms of the two separate bond-type net lease agreements the self-storage
facilities will be leased for an initial term of 20 years, while the truck rental
facilities will be leased for an initial term of 10 years.
16
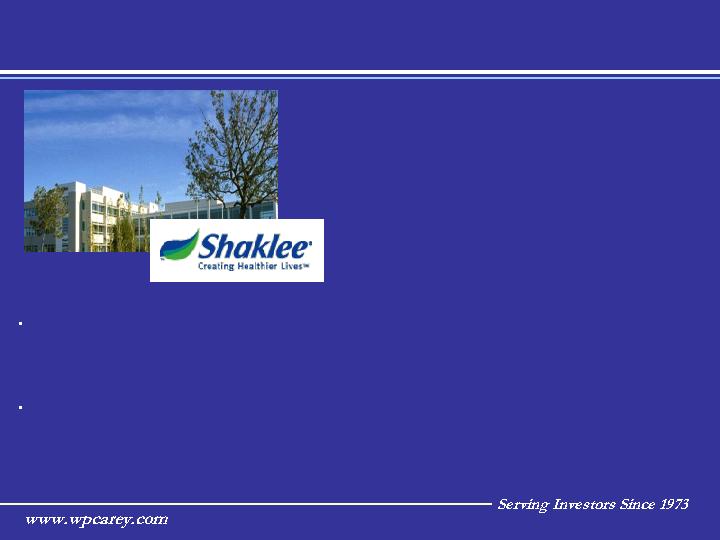
Recent Acquisitions
Shaklee Corporation is a leading provider of premium quality, natural,
environmentally friendly nutrition, personal care, and household products as
well as state-of-the art air and water treatment systems.
The 124,000 square foot facility will be leased under a 20-year triple net
lease followed by two, ten-year renewal options. The transaction provided
acquisition financing to the private equity firm acquiring the Company.
Facility Type:
Corporate Headquarters
Purchase Price:
$32,461,000
Location:
Pleasanton, CA
Acquired by:
CPA® :15
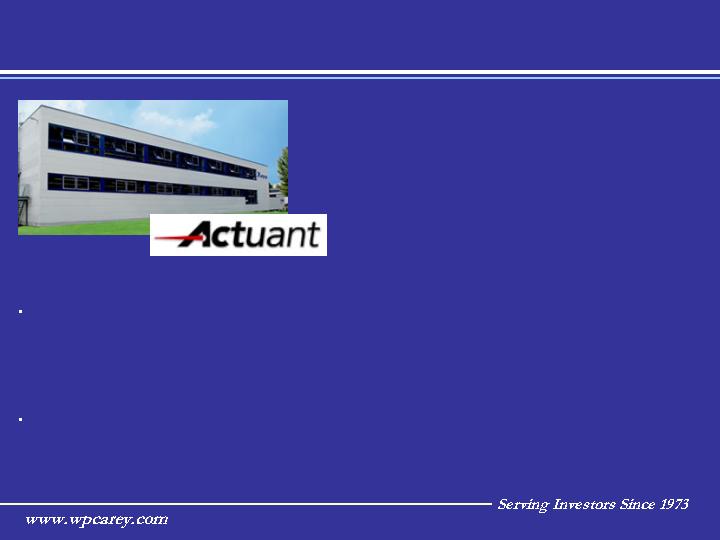
Recent Acquisitions
17
Facility Type:
Manufacturing/Office
Purchase Price:
$16,690,000
Location:
Kahl am Main, Germany
Acquired by:
CPA® :15, CPA®:16 - Global
Actuant is a global manufacturer and marketer of a wide range of industrial
products and systems. The Actuant businesses are market leaders in highly
engineered position and motion control systems and branded hydraulic and
electrical tools.
The 305,700 square foot facility will be leased under a 17-year triple net
lease followed by two, five-year renewal options.

Recent Highlights
18
Launched CPA®:16 – Global in December 2003 and raised
$350 million program to date
Completed $727 million of investments on behalf of
CPA REITs in 2004 year-to-date
Assets under ownership and management surpasses
$6 billion
W. P. Carey proposed liquidity transaction for CIP ®

Carey Institutional Properties (CIP ®)’s
Proposed Liquidity Transaction Details
Management/Advisory Business
W. P. Carey & Co. LLC
OWNS
MANAGES
19
$13.90 NAV per share represents 39% increase in initial
principal value
Upon approval, including dividends received and capital
appreciation, CIP® shareholders have achieved an average
annual total return of 11.3%
CIP® shareholders have outperformed the
NCREIF Property Index by
450 basis points per year over the past 12 years.
* When returns are calculated using similar methodologies.

CPA® Program Track Record
Management/Advisory Business
W. P. Carey & Co. LLC
OWNS
MANAGES
Full-Cycle
Programs
Average
Annual
Return
= 12%
20
Fund
Date of
End Value
Cumulative
Average
Final Closing
Plus Distributions
Return
Annual Return
CPA® :1
6/12/79
$2,367
137%
7.3%
CPA® :2
9/23/80
$3,687
269%
15.3%
CPA® :3
5/13/82
$4,082
308%
19.4%
CPA® :4
6/16/83
$3,101
210%
14.3%
CPA® :5
12/21/83
$2,103
110%
7.9%
CPA® :6
2/13/85
$2,639
164%
12.7%
CPA® :7
9/17/87
$2,151
115%
10.8%
CPA® :8
11/21/88
$2,286
129%
13.8%
CPA® :9
4/30/90
$1,839
84%
10.4%
CPA® :10
7/17/91
$2,083
108%
9.0%
CIP®
12/19/91
$1,390
141%
11.3%
CPA® :12
5/12/94
$1,170
99%
9.8%
CPA® :14
4/3/98
$1,130
57%
9.1%

WPC Fundamentals
21

WPC Financial Results
(in thousands except per share amounts)
22
12 Months Ended
12 Months Ended
12 Months Ended
12/31/01
12/31/02
12/31/03
Revenues:
Principal Revenues
$92,500
$86,670
$80,840
Management Revenues
$46,911
$84,255
$88,060
Expenses:
Interest Expense
$21,603
$16,134
$15,116
G&A Expense
$29,435
$42,592
$43,698
Net Income:
$35,761
$46,588
$62,878
Per Share
$1.02
$1.28
$1.65

WPC Capital Structure
(in thousands)
Effect of 25 b.p.
interest rate
= $.001 FFO
per Share
23
Market Capitalization (as of June 30, 2004):
W. P. Carey
Equity Market Capitalization
$1,151,783
Fixed Rate Debt Capitalization
$ 217,227
Variable Rate Debt Capitalization
$
30,536
Total Market Capitalization
$1,399,546
NAREIT
W. P. Carey
Equity Index
Equity % of Total Market Cap
82%
61%
Debt % of Total Market Cap
18%
39%
Recourse Debt % of Total Market Cap
1.2%
17%
Interest Coverage
7.9x
3.0x
Source: SEC Filings, SNL DataSource

FFO Multiple vs. REIT Peer Group
W. P. Carey Current Valuation
*Annualized 6-month FFO – Not a projection by the Company
24
Close
8/11/04
2004 Est. FFO
FFO Multiple
AMB Property
$34.95
$2.33
15.0
Alexandria Real Estate
$60.50
$4.48
13.5
Capital Automotive REIT
$29.42
$2.46
12.0
Commercial Net Lease Realty
$16.69
$1.40
11.9
Lexington Corp. Properties
$19.94
$1.74
11.5
Realty Income
$40.71
$3.05
13.3
Washington REIT
$28.68
$2.09
13.7
iSTAR Financial
$38.74
$3.47
11.2
ProLogis Trust
$34.27
$2.37
14.5
W. P. Carey & Co. LLC
$30.47
$2.82*
10.8
Peer Average
12.9

Earnings Multiple vs. Investment Manager Peer Group
W. P. Carey Current Valuation
25
Close
2003
8/11/04
Net Income
P/E Ratio
Alliance Capital
$32.80
$2.12
15.5
Franklin Resources
$48.76
$2.22
22.0
BlackRock
$62.29
$2.36
26.4
Eaton Vance
$36.38
$1.51
24.1
Federated Investors
$28.26
$1.82
15.5
Janus Capital Group
$13.15
$0.86
15.3
Legg Mason
$77.17
$3.99
19.3
T. Rowe Price
$46.08
$1.77
26.0
Gabelli Asset Mgmt
$39.14
$1.64
23.9
W.P. Stewart
$19.45
$0.96
20.3
Waddell & Reed
$19.36
$1.13
17.1
W. P. Carey & Co. LLC
$30.47
$1.65
18.5
Peer Average
20.5
W. P. Carey Current Valuation
Annualized
EBITDA
= $68,000,000
Annualized Funds from
Operations
= $52,000,000
OWNS
MANAGES
Average REIT Peer Group
P/2004 FFO Multiple
12.9x
Average Asset Manager Peer Group
P/2004 EBITDA Multiple
10x
WPC Market Cap at
Average Multiples
= $1,350,800,000
Vs.
Current Market Cap
= $1,176,000,000
26

Running the Business as Owners
13.90%
Fortune 500*
14.59%
Equity REIT Industry
7.50%
Peer Group
40.17%
W. P. Carey
Percentage of Management Ownership
as of 2004 Proxy Season
* As of 2003 Proxy Season
27

1-800 WP CAREY IR@wpcarey.com
28