Exhibit 99.1
W. P. Carey & Co. LLC
Supplemental Disclosure Report
For the Year Ended
December 31, 2005
W. P. CAREY & CO. LLC
Supplemental Disclosure Report for the Year ended December 31, 2005
| | | | | |
| Contents | | Page | |
| | | | | |
CORPORATE PROFILE: | | | | |
| Company Overview | | | 4 | |
| Full Year and Fourth Quarter Ended December 31, 2005 Results | | | 5 | |
| Financial Highlights | | | 6 | |
| | | | | |
FINANCIAL ANALYSIS: | | | | |
| Reconciliation of Net Income to FFO and FAD Analysis | | | 8 | |
| Debt Structure Analysis | | | 9 | |
| Total Capitalization Analysis | | | 10 | |
| Revenue Diversification Analysis | | | 11 | |
| Revenue Stability Analysis | | | 12 | |
| Selected Financial Ratios | | | 13 | |
| Portfolio Debt Summary | | | 14 | |
| Mortgage Debt Maturity Profile | | | 15 | |
| | | | | |
ACQUISITIONS & DISPOSITIONS: | | | | |
| Acquisitions Update | | | 17 | |
| Dispositions Update | | | 18 | |
| | | | | |
PORTFOLIO ANALYSIS: | | | | |
| Portfolio Diversification Analysis by Rent Contribution | | | 20 | |
| Portfolio Diversification Analysis by Property Type | | | 21 | |
| Portfolio Diversification Analysis by Tenant Industry | | | 22 | |
| Portfolio Diversification Analysis by Geography | | | 23 | |
| Portfolio Lease Maturity Analysis | | | 24 | |
| | | | | |
EXHIBITS: | | | | |
Consolidated Balance Sheets | | Exhibit A |
Consolidated Statements of Income | | Exhibit B |
Consolidated Statements of Cash Flows | | Exhibit C |
Quarterly Reconciliation of Net Income to Funds from Operations | | Exhibit D |
Detailed Property Summary | | Exhibit E |
SECTION: CORPORATE PROFILE
W. P. CAREY & CO. LLC
Company Overview December 31, 2005
| | | | | |
| STOCK DATA | | | | |
| Exchanges | | NYSE & PCX |
| Ticker | | WPC |
| Closing Price Range twelve months ended December 31, 2005 | | $ | 23.95-$35.52 | |
| Listed Shares Outstanding as of December 31, 2005 | | | 37,706,247 | |
BANKS
JPMorgan Chase Bank — Administrative Agent
The Bank of New York — Syndication Agent
PNC Bank, N.A. — Syndication Agent
Wells Fargo Bank, N.A. — Syndication Agent
Bank of America, N.A. — Documentation Agent
INDEPENDENT AUDITORS
PricewaterhouseCoopers LLP
RESEARCH COVERAGE
A. G. Edwards & Sons, Inc.
COMPANY CONTACTS
Mark DeCesaris
Managing Director, Acting Chief Financial Officer
Susan C. Hyde
Executive Director, Director of Investor Relations
Gagan Singh
First Vice President, Finance
Ryan Colbert
Analyst, Finance
EXECUTIVE OFFICES
50 Rockefeller Plaza
New York, NY 10020
Tel: 1-800-WPCAREY or (212) 492-1100
Fax: (212) 492-8922
Web Site Address:www.wpcarey.com
| | |
| Ticker: WPC | | www.wpcarey.com |
4
SECTION: CORPORATE PROFILE
W. P. CAREY & CO. LLC
Full Year & Fourth Quarter Ended December 31, 2005 Results
Financial Results
Net income for the three-month period was $11.5 million, as compared to $4.1 million during the similar period in 2004. Net income for the twelve-month period was $48.6 million, as compared to $65.8 million during 2004. Diluted earnings per share (EPS) for the three-month period were $0.30, as compared to $0.10 during the same period in 2004. Diluted EPS for the twelve-month period were $1.25 versus $1.69 for 2004.
Funds from Operations (FFO) for the three-month period were $0.63 per diluted share, or $24.2 million, as compared to $0.53 per diluted share, or $20.7 million, for the comparable period in 2004. FFO for the twelve-month period were $2.53 per diluted share, or $98.6 million, as compared to $3.47 per diluted share, or $135.1 million, for 2004.
Income from continuing operations for the three-month period was $11.1 million, as compared to $5.7 million during the same period in 2004. For the twelve-month period, income from continuing operations was $42.9 million, as compared to $68.1 million for 2004.
Cash flows from operating activities for the twelve-month period were $52.7 million, as compared to $98.8 million during 2004.
Dividend Increase
The Board of Directors raised the quarterly cash dividend to $0.45 per listed share, from $0.448 per listed share, which was paid on January 15, 2006 to shareholders of record on December 31, 2005.
Annual & Fourth Quarter Investment Highlights
For the fourth quarter of 2005, total investments made by the Company on behalf of its Corporate Property Associates (CPA®) funds were $87 million, as compared to $55 million during the fourth quarter of 2004. For the fourth quarter of 2005, international transactions accounted for $42 million of the total investment volume, as compared to $31 million during the same period in 2004. Total investments for the twelve-month period were $865 million, as compared to $890 million for 2004. For the twelve-month period, international investments accounted for $468 million of this volume, as compared to $285 million for 2004.
| | |
| Ticker: WPC | | www.wpcarey.com |
5
SECTION: CORPORATE PROFILE
W. P. CAREY & CO. LLC
Financial Highlights
(in thousands, except share and per share data)
| | | | | | | | | | | | | |
| | | For the Year | | | For the Year | | | For the Year | |
| | | Ended | | | Ended | | | Ended | |
| | | December 31, 2005 | | | December 31, 2004 | | | December 31, 2003 | |
Operations | | | | | | | | | | | | |
| Total Revenues from Continuing Operations | | $ | 174,117 | | | $ | 222,202 | | | $ | 154,045 | |
| Net Income | | $ | 48,604 | | | $ | 65,841 | | | $ | 62,878 | |
| Funds From Operations (FFO) | | $ | 98,571 | | | $ | 135,139 | | | $ | 105,518 | |
| | | | | | | | | | | | | |
Per Share | | | | | | | | | | | | |
| FFO (Diluted) | | $ | 2.53 | | | $ | 3.47 | | | $ | 2.75 | |
| Dividends Declared | | $ | 1.788 | | | $ | 1.756 | | | $ | 1.734 | |
| Pay Out Ratio (Dividends Declared/FFO) | | | 70.8 | % | | | 50.6 | % | | | 63.2 | % |
Weighted Average Listed Shares Outstanding (Diluted)(3) | | | 39,020,801 | | | | 38,961,748 | | | | 38,434,169 | |
| | | | | | | | | | | | | |
| Balance Sheet | | As of 12/31/05 | | | As of 12/31/04 | | | As of 12/31/03 | |
| Total Assets | | $ | 983,262 | | | $ | 1,013,539 | | | $ | 906,505 | |
Limited Recourse Mortgage Debt(1) | | $ | 231,113 | | | $ | 190,698 | | | $ | 180,193 | |
| Credit Facility | | $ | 15,000 | | | $ | 102,000 | | | $ | 29,000 | |
| Shareholders Equity | | $ | 607,468 | | | $ | 620,651 | | | $ | 594,787 | |
| | | | | | | | | | | | | |
Stock Data | | | | | | | | | | | | |
| Price Range | | $ | 23.95-$35.52 | | | | | | | | | |
| Dividend Yield Range | | | 5.00%-7.52 | % | | | | | | | | |
| Average Trading Volume | | | 39,915 | | | | | | | | | |
Price/Estimated FFO(2) | | | 9.19 | | | | | | | | | |
| | |
| (1) | | Excludes pro rata mortgage debt of equity investments in properties leased to Federal Express Corporation, CheckFree Holdings, Inc., Information Resources, Inc., Childtime Childcare, Inc., Hologic, Inc., Carrefour France, SAS, and SICOR, Inc. See the Portfolio Debt Summary on page 14 for details. |
| |
| (2) | | Based on a stock price of $25.65 on March 2, 2006 and 2006 analyst FFO forecast of $2.79. |
| |
| (3) | | Diluted shares outstanding for 2003 were revised from 38,008,762 to 38,434,169. |
| |
| | | |
| | |
| Ticker: WPC | | www.wpcarey.com |
6
SECTION: FINANCIAL ANALYSIS
W. P. CAREY & CO. LLC
Reconciliation of Net Income to Funds From Operations (FFO) & FAD Analysis
(in thousands, except share and per share data)
| | | | | | | | | | | | | |
| | | For the Year | | | For the Year | | | For the Year | |
| | | Ended | | | Ended | | | Ended | |
| | | December 31, 2005 | | | December 31, 2004 | | | December 31, 2003 | |
| Net income | | $ | 48,604 | | | $ | 65,841 | | | $ | 62,878 | |
| Gain on sale of real estate | | | (12,474 | ) | | | (92 | ) | | | (1,238 | ) |
| FFO of equity investees in excess of equity income | | | 10,358 | | | | 7,010 | | | | 4,396 | |
| Depreciation, amortization, deferred taxes and other non-cash charges | | | 27,094 | | | | 39,113 | | | | 34,688 | |
| FFO applicable to minority investees in excess of minority income | | | (602 | ) | | | (555 | ) | | | (344 | ) |
| Straight-line rent adjustment | | | 3,821 | | | | 1,724 | | | | 910 | |
| Impairment loss on investments | | | 21,770 | | | | 22,098 | | | | 3,878 | |
| Charge on extinguishment of debt | | | — | | | | — | | | | 350 | |
| | | | | | | | | | |
Funds From Operations (FFO) | | $ | 98,571 | | | $ | 135,139 | | | $ | 105,518 | |
| | | | | | | | | | |
| | | | | | | | | | | | | |
| Weighted Average Listed Shares Outstanding | | | | | | | | | | | | |
| Basic | | | 37,688,835 | | | | 37,417,918 | | | | 36,566,338 | |
| Diluted | | | 39,020,801 | | | | 38,961,748 | | | | 38,434,169 | |
FFO per Share | | | | | | | | | | | | |
Basic | | $ | 2.62 | | | $ | 3.61 | | | $ | 2.89 | |
Diluted | | $ | 2.53 | | | $ | 3.47 | | | $ | 2.75 | |
Pay Out Ratio (Dividend/FFO) | | | 70.8 | % | | | 50.6 | % | | | 63.2 | % |
| | | | | | | | | | | | | |
| Funds From Operations (FFO) | | | 98,571 | | | | 135,139 | | | | 105,518 | |
| Recurring and non-revenue enhancing capital expenditure | | | (939 | ) | | | (215 | ) | | | (100 | ) |
| | | | | | | | | | |
Funds Available For Distribution (FAD) | | $ | 97,632 | | | $ | 134,924 | | | $ | 105,418 | |
| | | | | | | | | | |
| | | | | | | | | | | | | |
FAD Per Share | | | | | | | | | | | | |
Basic | | $ | 2.59 | | | $ | 3.61 | | | $ | 2.88 | |
Diluted | | $ | 2.50 | | | $ | 3.46 | | | $ | 2.74 | |
Pay Out Ratio (Dividend/FAD) | | | 71.5 | % | | | 50.7 | % | | | 63.2 | % |
| | | | | | | | | | | | | |
| | |
| W.P. Carey Co. LLC | | www.wpcarey.com |
8
SECTION: FINANCIAL ANALYSIS
W. P. CAREY & CO. LLC
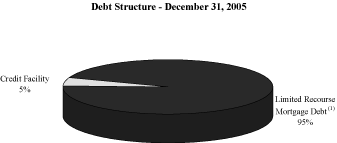
Debt Structure Analysis
(in thousands)
Debt Structure
®
| | | | | | | | | |
| September 30, 2005 | |
Limited Recourse Mortgage Debt(1) | | $ | 234,727 | | | | 75 | % |
| Credit Facility | | | 78,000 | | | | 25 | % |
| | | | | | | | |
| Total Debt | | $ | 312,727 | | | | | |
| | | | | | | | | |
| December 31, 2005 | |
Limited Recourse Mortgage Debt(1) | | $ | 292,511 | | | | 95 | % |
| Credit Facility | | | 15,000 | | | | 5 | % |
| | | | | | | | |
| Total Debt | | $ | 307,511 | | | | | |
| | |
| (1) | | Includes pro rata mortgage debt of equity investments in properties leased to Federal Express Corporation, CheckFree Holdings, Inc., Information Resources, Inc., Childtime Childcare, Inc., Hologic, Inc., Carrefour, SAS, and SICOR, Inc. See the Portfolio Debt Summary on page 14 for details. |
| |
| | | |
| | |
| W.P. Carey Co. LLC | | www.wpcarey.com |
9
SECTION: FINANCIAL ANALYSIS
W. P. CAREY & CO. LLC
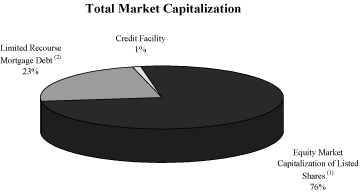
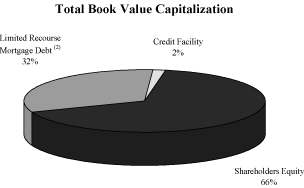
Total Capitalization Analysis
December 31, 2005
(in thousands)
| | | | | | | | | |
| Total Market Capitalization Analysis | |
Equity Market Capitalization of Listed Shares(1) | | $ | 967,165 | | | | 76 | % |
Limited Recourse Mortgage Debt(2) | | | 292,511 | | | | 23 | % |
| Credit Facility | | | 15,000 | | | | 1 | % |
| | | |
| Total Debt | | | 307,511 | | | | 24 | % |
| | | | | | | | | |
| | | |
Total Market Capitalization(3) | | $ | 1,274,677 | | | | 100 | % |
| | | | | | | | | |
| Total Book Value Capitalization Analysis | |
| Shareholders Equity | | $ | 607,468 | | | | 66 | % |
Limited Recourse Mortgage Debt(2) | | | 292,511 | | | | 32 | % |
| Credit Facility | | | 15,000 | | | | 2 | % |
| | | |
| Total Debt | | | 307,511 | | | | 34 | % |
| | | | | | | | | |
| | | |
Total Book Value Capitalization | | $ | 914,979 | | | | 100 | % |
| | |
| (1) | | Stock price of $25.65 is as of the fourth quarter earnings release date of March 2, 2006. Indicated shares outstanding of 37,706,247 is as of December 31, 2005. |
| |
| (2) | | Includes pro rata mortgage debt of equity investments in properties leased to Federal Express Corporation, CheckFree Holdings, Inc., Information Resources, Inc., Childtime Childcare, Inc., Hologic, Inc., Carrefour, SAS, and SICOR, Inc. See the Portfolio Debt Summary on page 14 for details. |
| |
| (3) | | Numbers may not add up due to rounding. |
| |
| | | |
| | |
| Ticker: WPC | | www.wpcarey.com |
10
SECTION: FINANCIAL ANALYSIS
W. P. CAREY & CO. LLC
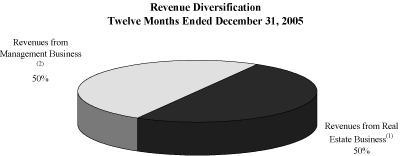
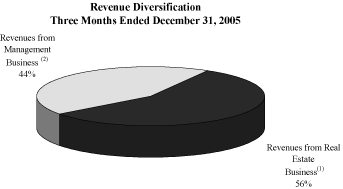
Revenue Diversification Analysis(GAAP Modified)
(in thousands)
| | | | | | | | | |
| Twelve Months Ended | |
| December 31, 2005 | |
| |
| | | | | | | | | |
Revenues from Real Estate Business(1) | | $ | 90,731 | | | | 50 | % |
| Revenues from Management Business | | | 90,490 | | | | 50 | % |
| | | | | | | | |
| Total Revenues | | $ | 181,221 | | | | | |
| | | | | | | | | |
| Three Months Ended | |
| December 31, 2005 | |
| |
| | | | | | | | | |
Revenues from Real Estate Business(1) | | $ | 24,476 | | | | 56 | % |
| Revenues from Management Business | | | 19,006 | | | | 44 | % |
| | | | | | | | |
| Total Revenues | | $ | 43,482 | | | | | |
Definitions
| | |
| (1) | | Revenues from Real Estate Business (continuing and discontinued operations) = rental income + interest income from direct financing leases + other interest income + other income + revenues of other business operations. |
| |
| (2) | | Revenues from Management Business = asset management revenue + structuring revenue + reimbursements revenue from CPAÒREITs. |
| |
| | | |
| | |
| Ticker: WPC | | www.wpcarey.com |
11
SECTION: FINANCIAL ANALYSIS
W. P. CAREY & CO. LLC
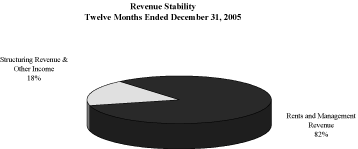
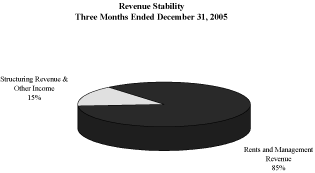
Revenue Stability Analysis(GAAP Modified)
(in thousands except per share data)
| | | | | | | | | | | | | |
| | | | | | | Diluted | | | | |
| | | Twelve Months Ended | | | Per | | | % | |
| Revenue Type | | December 31, 2005 | | | Share | | | Change | |
| |
| | | | | | | | | | | | | |
Rents(1) | | $ | 84,102 | | | $ | 2.16 | | | | | |
Management revenue(2) | | | 64,676 | | | $ | 1.66 | | | | | |
| | | | | | | | | | | |
Rents and Management Revenue(3) | | | 148,779 | | | $ | 3.82 | | | | 82 | % |
| | | | | | | | | | | | | |
| Structuring revenue | | | 25,814 | | | $ | 0.66 | | | | | |
| Other income | | | 6,628 | | | $ | 0.17 | | | | | |
| | | | | | | | | | | |
Structuring Revenue & Other Income | | | 32,442 | | | $ | 0.83 | | | | 18 | % |
| | | | | | | | | | | |
Total(3) | | $ | 181,221 | | | $ | 4.64 | | | | | |
| | | | | | | | | | | | | |
| | | | | | | Diluted | | | | |
| | | Three Months Ended | | | Per | | | % | |
| Revenue Type | | December 31, 2005 | | | Share | | | Change | |
| |
| | | | | | | | | | | | | |
Rents(1) | | $ | 20,881 | | | $ | 0.54 | | | | | |
Management revenue(2) | | | 16,086 | | | $ | 0.42 | | | | | |
| | | | | | | | | | | |
Rents and Management Revenue | | | 36,967 | | | $ | 0.96 | | | | 85 | % |
| | | | | | | | | | | | | |
| Structuring revenue | | | 2,920 | | | $ | 0.08 | | | | | |
| Other income | | | 3,595 | | | $ | 0.09 | | | | | |
| | | | | | | | | | | |
Structuring Revenue & Other Income | | | 6,515 | | | $ | 0.17 | | | | 15 | % |
| | | | | | | | | | | |
Total(3) | | $ | 43,482 | | | $ | 1.12 | | | | | |
| | |
| (1) | | Rents (continuing and discontinued operations) = rental income + interest income from direct financing leases + other interest income + revenues of other business operations. |
| |
| (2) | | Management revenues include management and performance revenues earned from CPAÒ REITs under management as well as reimbursements of expenses. |
| |
| (3) | | Numbers may not add up due to rounding. |
| |
| | | |
| | |
| Ticker: WPC | | www.wpcarey.com |
12
SECTION: FINANCIAL ANALYSIS
W. P. CAREY & CO. LLC
Selected Financial Ratios Analysis
December 31, 2005
| | | | | | | | | | | | | |
| | | For the Twelve Months | | | For the Twelve Months | | | For the Twelve Months | |
| | | Ended | | | Ended | | | Ended | |
| Financial Strength | | December 31, 2005 | | | December 31, 2004 | | | December 31, 2003 | |
Leverage | | | | | | | | | | | | |
| Recourse debt/Book value of equity | | | 2.5 | % | | | 16.5 | % | | | 4.9 | % |
| Total debt/Total market capitalization | | | 31.8 | % | | | 28.3 | % | | | 20.0 | % |
| Total debt/EBITDA | | | 2.41 | | | | 1.95 | | | | 2.26 | |
| FFO/Total debt | | | 32.1 | % | | | 38.2 | % | | | 38.9 | % |
Coverage | | | | | | | | | | | | |
| EBITDA/Total interest expense | | | 6.00 | | | | 9.67 | | | | 7.95 | |
| Fixed charge coverage ratio | | | 4.08 | | | | 6.34 | | | | 5.08 | |
| FFO/Total interest expense | | | 4.63 | | | | 6.34 | | | | 6.98 | |
| | | | | | | | | | | | | |
Valuation Ratios | | | | | | | | | | | | |
| Price/Earnings | | | 20.52 | | | | 19.73 | | | | 17.99 | |
| Price/FFO | | | 10.14 | | | | 9.61 | | | | 10.73 | |
| Price/Revenues | | | 5.52 | | | | 5.52 | | | | 6.71 | |
| Price/Book Value of Equity | | | 1.59 | | | | 2.02 | | | | 1.82 | |
| | | | | | | | | | | | | |
Per Share Data | | | | | | | | | | | | |
| Earnings | | $ | 1.25 | | | $ | 1.69 | | | $ | 1.64 | |
| FFO | | $ | 2.53 | | | $ | 3.47 | | | $ | 2.75 | |
| Revenues | | $ | 4.64 | | | $ | 6.04 | | | $ | 4.39 | |
| Book Value of Equity | | $ | 16.11 | | | $ | 16.49 | | | $ | 16.19 | |
Definitions
| | |
| (1) | | Recourse debt = Company level indebtedness that is not secured by a lien. |
| |
| (2) | | Total debt = long-term debt = recourse debt + limited recourse mortgage debt, including adjustments for joint ventures. |
| |
| (3) | | Total market capitalization = equity market capitalization + debt capitalization. |
| |
| (4) | | Fixed charge coverage ratio = EBITDA/(interest expense + scheduled principal amortization + preferred dividends (if any) + adjustments for joint ventures). |
| |
| (5) | | EBITDA = net income + interest + taxes + depreciation + amortization +/- extraordinary loss (gain) + noncash charges / gains + adjustments for JVs. |
| |
| (6) | | Price = Closing Price as of earnings release date of March 2, 2006. |
| |
| (7) | | Revenues = revenue from continuing operations + revenue from discontinued operations + interest income. |
| |
| | | |
| | |
| Ticker: WPC | | www.wpcarey.com |
13
SECTION: FINANCIAL ANALYSIS
W. P. CAREY & CO. LLC
Portfolio Debt Summary
(pro rata basis)
December 31, 2005
| | | | | | | | | | | | | | | | | | | | | | | |
| | | Number of | | | | | | | | | | | | | | | |
| Tenant/Lease Guarantor | | Properties | | | Fixed / Variable | | Original Balance | | | Current Balance | | | Interest Rate | | | Maturity Date | |
| |
| CheckFree Holdings, Inc. | | | 1 | | | Variable | | | 11,650,000 | | | | 10,404,539 | | | | 6.61 | % | | Jun-06 |
| Quebecor Printing USA (MS) | | | 1 | | | Fixed | | | 5,000,000 | | | | 4,411,741 | | | | 7.00 | % | | Jul-06 |
| Quebecor Printing USA (GA) | | | 1 | | | Fixed | | | 7,000,000 | | | | 6,385,141 | | | | 6.82 | % | | Aug-07 |
| Amerisure Insurance | | | 1 | | | Fixed | | | 9,500,000 | | | | 9,711,477 | | | | 8.80 | % | | Dec-07 |
Billipp Portfolio(1) | | | 7 | | | Variable | | | 5,000,000 | | | | 5,000,000 | | | | 5.92 | % | | Dec-08 |
| SICOR, Inc. | | | 2 | | | Fixed | | | 2,777,183 | | | | 2,072,936 | | | | 8.13 | % | | Jan-09 |
| Orbital Sciences Corporation | | | 1 | | | Fixed | | | 15,000,000 | | | | 13,260,742 | | | | 7.38 | % | | Jun-09 |
| America West Holdings Corporation | | | 1 | | | Fixed | | | 25,000,000 | | | | 16,514,734 | | | | 7.23 | % | | Aug-09 |
| Bell South Telecommunications | | | 1 | | | Fixed | | | 5,995,498 | | | | 4,442,605 | | | | 8.11 | % | | Jan-10 |
| Unisource Worldwide, Inc. | | | 1 | | | Fixed | | | 7,000,000 | | | | 2,865,363 | | | | 7.24 | % | | Feb-10 |
| Hibbett Sports | | | 1 | | | Fixed | | | 4,995,033 | | | | 4,794,839 | | | | 7.50 | % | | Apr-10 |
| Detroit Diesel Corporation | | | 1 | | | Fixed | | | 25,000,000 | | | | 10,696,264 | | | | 7.96 | % | | Jun-10 |
| Omnicom Group, Inc. | | | 1 | | | Fixed | | | 4,574,481 | | | | 3,933,819 | | | | 7.65 | % | | Sep-10 |
| EnviroWorks, Inc. | | | 1 | | | Fixed | | | 3,563,292 | | | | 3,164,046 | | | | 10.13 | % | | Oct-10 |
| Federal Express Corporation | | | 1 | | | Fixed | | | 18,000,000 | | | | 17,050,432 | | | | 7.50 | % | | Jan-11 |
| Autozone — Series A | | | 12 | | | Fixed | | | 4,099,504 | | | | 2,220,797 | | | | 6.85 | % | | Jan-11 |
| Childtime Childcare, Inc. | | | 12 | | | Fixed | | | 2,522,816 | | | | 2,396,255 | | | | 7.50 | % | | Jan-11 |
| Information Resources, Inc. | | | 2 | | | Fixed | | | 8,665,800 | | | | 7,919,986 | | | | 7.60 | % | | Jan-11 |
| Cendant Operations, Inc. | | | 1 | | | Fixed | | | 6,000,000 | | | | 5,710,053 | | | | 7.34 | % | | Jan-11 |
| Autozone, Inc. — Series B | | | 19 | | | Fixed | | | 6,289,699 | | | | 3,437,345 | | | | 6.85 | % | | Feb-11 |
| Sprint Spectrum, LP | | | 1 | | | Fixed | | | 8,753,000 | | | | 8,414,630 | | | | 7.64 | % | | Aug-11 |
| Qwest Communications, Inc. | | | 1 | | | Fixed | | | 1,594,023 | | | | 1,547,362 | | | | 7.50 | % | | Jun-12 |
| Autozone — Series C | | | 6 | | | Fixed | | | 2,033,191 | | | | 1,263,722 | | | | 6.85 | % | | Aug-12 |
| BE Aerospace, Inc. | | | 3 | | | Fixed | | | 9,200,000 | | | | 8,862,726 | | | | 6.11 | % | | Nov-12 |
Faurecia (AP Parts)(2) | | | 1 | | | Fixed | | | 2,675,000 | | | | 2,670,614 | | | | 5.16 | % | | Nov-12 |
Anthony, Inc. Industry(2) | | | 4 | | | Fixed | | | 9,285,000 | | | | 9,285,000 | | | | 5.11 | % | | Nov-12 |
Alstom & Werner(2) | | | 3 | | | Fixed | | | 10,750,000 | | | | 10,750,000 | | | | 5.18 | % | | Dec-12 |
SAS Pantin Invest France(3) | | | 1 | | | Fixed | | | 12,683,000 | | | | 8,118,024 | | | | 4.92 | % | | Jul-13 |
| Autozone — Series D | | | 11 | | | Fixed | | | 4,667,621 | | | | 3,097,200 | | | | 6.85 | % | | Aug-13 |
Aviva France (fka Tellit Assurances -SA)(3) | | | 1 | | | Fixed until 2008, variable thereafter. | | | 3,300,750 | | | | 2,420,641 | | | | 4.49 | % | | Aug-13 |
Direction Regional des Affaires Sanitaires et Sociales (aka SCI Le Mail)(3) | | | 1 | | | Fixed until 2008, variable thereafter. | | | 1,341,000 | | | | 900,546 | | | | 4.60 | % | | Aug-13 |
SARL S3T (aka SAS Immo Invest)(3) | | | 1 | | | Variable | | | 1,429,728 | | | | 1,307,353 | | | | 4.56 | % | | May-14 |
DSM Food Specialties (aka SAS Immo Invest)(3) | | | 1 | | | Variable | | | 1,728,672 | | | | 1,081,269 | | | | 4.56 | % | | May-14 |
Carrefour France, SAS(3) | | | 8 | | | Fixed | | | 26,078,798 | | | | 24,773,569 | | | | 5.55 | % | | Dec-14 |
| Lowe’s Home Improvement Warehouse (Eagle Hardware) | | | 1 | | | Fixed | | | 9,725,000 | | | | 9,725,000 | | | | 4.87 | % | | Sep-15 |
Bouygues Telecom, S.A. (Tours)(3) | | | 1 | | | Fixed until 2010, variable thereafter. | | | 9,877,469 | | | | 7,904,221 | | | | 3.86 | % | | Oct-15 |
Dr. Pepper(2) | | | 2 | | | Fixed | | | 33,950,000 | | | | 33,950,000 | | | | 5.13 | % | | Nov-15 |
Bouygues Telecom, S.A. (Illkirch-Graffenstaden)(3) | | | 1 | | | Fixed until 2006, variable thereafter | | | 16,874,000 | | | | 13,829,458 | | | | 5.45 | % | | Oct-16 |
| Hologic, Inc. | | | 2 | | | Fixed | | | 6,660,000 | | | | 6,216,856 | | | | 6.40 | % | | May-23 |
| | | | | | | |
Total Limited Recourse Debt(7) | | | 118 | | | | | $ | 350,239,559 | | | $ | 292,511,307 | | | | 6.38 | %(4) | | | | |
| | | | | | | |
| | | | | | | | | Credit Facility(5) | | $ | 15,000,000 | | | | 4.98 | % | | May-07 |
| | | | | | | | | | | | | | | | | |
| | | | | | | | | Total Debt | | $ | 307,511,307 | | | | 6.31 | %(5) | | | | |
| | | | | | | | | | | | | | | | | |
| | |
| (1) | | New loan as of December 29, 2005. |
| |
| (2) | | New portfolio refinancing activity completed fourth quarter 2005. |
| |
| (3) | | Debt balance calculated using an exchange rate of 1.1844 USD/EUR at December 31, 2005. |
| |
| (4) | | Reflects weighted average interest rate for the mortgage debt only. |
| |
| (5) | | Indicated interest rate is based on Libor + 110 bps and represents the weighted average on outstanding tranches at December 31, 2005. Floating rate subject to change depending on leverage ratios and debt ratings (if applicable). |
| |
| (6) | | Reflects weighted average interest rate for the entire portfolio including the line of credit debt. |
| |
| (7) | | Numbers may not add up due to rounding. |
| | | |
| Ticker: WPC | | www.wpcarey.com |
14
SECTION: FINANCIAL ANALYSIS
W. P. CAREY & CO. LLC
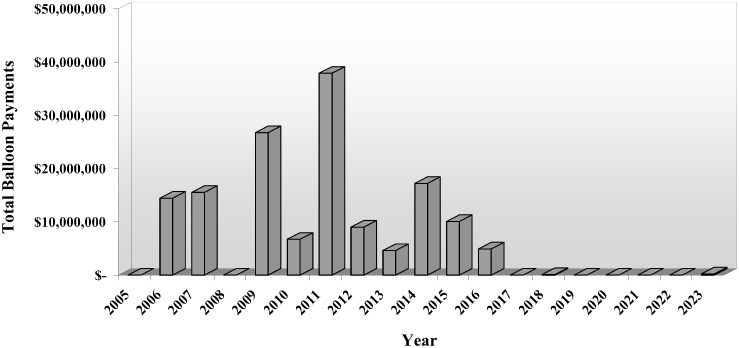
Mortgage Debt Maturity Profile
(pro rata basis)
December 31, 2005
| | | | | |
| Year | | Balloon Payments | |
| |
| 2005 | | | — | |
| 2006 | | | 14,452,927 | |
| 2007 | | | 15,540,508 | |
| 2008 | | | — | |
| 2009 | | | 26,754,760 | |
| 2010 | | | 6,741,951 | |
| 2011 | | | 37,912,078 | |
| 2012 | | | 9,023,825 | |
| 2013 | | | 4,635,588 | |
| 2014 | | | 17,239,220 | |
| 2015 | | | 10,071,205 | |
| 2016 | | | 4,921,209 | |
| 2017 | | | — | |
| 2018 | | | 129,778 | |
| 2019 | | | — | |
| 2020 | | | — | |
| 2021 | | | — | |
| 2022 | | | — | |
| 2023 | | | 231,984 | |
| |
Total | | $ | 147,655,033 | |
| | |
| | | |
| Ticker: WPC | | www.wpcarey.com |
15
ACQUISITIONS & DISPOSITIONS
16
SECTION: ACQUISITIONS/DISPOSITIONS
W. P. CAREY & CO. LLC
2005 Acquisitions Update
| | | | | | | | | | | | | | | | | |
| | | | | | | Purchase Price | | | | | | | Gross Square | |
| Portfolio(s) | | Tenant/Lease Guarantor | | Property Location | | (000s) | | | Closing Date | | Property Type | | Footage | |
| |
| | | | | | | | | | | | | | | | | |
Management Business | | | | | | | | | | | | | | |
| | | | | | | | | | | | | | | | | |
CPA®:16 - Global | | HMS Healthcare | | Southfield, Michigan | | $ | 18,732 | | | January 3, 2005 | | Office | | | 94,127 | |
CPAs®:15, 16 - Global | | Pohjola | | Helsinki, Finland | | | 113,514 | | | January 3, 2005 | | Office | | | 579,884 | |
CPA®:16 - Global | | Clean Earth | | Cynthiana, KY | | | 7,366 | | | January 14, 2005 | | Industrial | | | 329,000 | |
CPA®:16 - Global | | Precise Technology II | | Buffalo Grove, IL | | | 16,469 | | | January 18, 2005 | | Warehouse/Manufacturing | | | 264,695 | |
CPA®:16 - Global | | Integrated Distribution Systems(1) | | Ayutthaya, Thailand | | | 23,689 | | | January 28, 2005 | | Industrial/Distribution | | | 609,789 | |
CPA®:16 - Global | | Reyes Holding Note(2) | | N/A | | | 12,778 | | | January 31, 2005 | | N/A | | | N/A | |
CPA®:16 - Global | | Finisar | | Allen, TX & Sunnyvale, CA | | | 29,292 | | | February 7, 2005 | | Office & Industrial | | | 252,050 | |
CPA®:16 - Global | | MetalsAmerica | | Shelby, NC | | | 7,437 | | | February 9, 2005 | | Industrial | | | 169,916 | |
CPA®:16 - Global | | Polypipe | | Gainsville, TX, Sandersville, GA, Erwin, TN, and Ferley, NV | | | 8,714 | | | February 25, 2005 | | Industrial | | | 240,067 | |
CPA®:16 - Global | | Telecordia Technologies | | Piscataway, NJ | | | 116,459 | | | March 15, 2005 | | Office | | | 885,653 | |
CPA®:15 | | Berry Plastics Expansion(1) (3) | | Alsip and Tolleson, AZ; Geddes, NY | | | 2,640 | | | March 31, 2005 | | Warehouse/Manufacturing | | | 78,000 | |
CPA®:15 | | UTI Philadelphia Expansion(1) (3) | | Philadelphia, PA | | | 6,663 | | | March 31, 2005 | | Office/Training Facility | | | 40,875 | |
CPA®:15, 16 - Global | | Hinckley | | Stuart, FL, Southwest Harbor and Trenton, ME and Portsmouth, RI | | | 58,319 | | | May 6, 2005 | | Industrial | | | 473,975 | |
CPA®:16 - Global | | MetoKote | | OH, TN, IL, & Ontario, Canada | | | 38,306 | | | May 27, 2005 | | Industrial | | | 782,010 | |
CPA®:15, 16 - Global | | Hellweg | | 16 Locations throughout Germany | | | 154,364 | | | June 9, 2005 | | Retail | | | 1,371,312 | |
CPA®:16 - Global | | Career Education | | Nashville, Tennessee | | | 10,541 | | | June 24, 2005 | | Office | | | 66,263 | |
CPA®:14 | | Societe Genedis Promocash (Carrefour) | | Le Mans, France | | | 1,993 | | | July 12, 2005 | | Retail | | | 44,799 | |
CPA®:15, 16 - Global | | French Government-SNC Rue Albert | | 13th Arrondissement, Paris France | | | 107,074 | | | July 14, 2005 | | Office | | | 241,335 | |
CPA®:16 - Global | | MetoKote-Mexico | | Saltillo, Mexico | | | 3,782 | | | July 15, 2005 | | Industrial | | | 85,900 | |
CPA®:16 - Global | | Bob's Discount Furniture | | Norwich, CT | | | 22,938 | | | August 17, 2005 | | Warehouse/Distribution | | | 660,519 | |
CPA®:16 - Global | | John McGavigan (Pressac)- Advanced Decorative Systems | | Glasgow, Scotland UK | | | 12,209 | | | August 18, 2005 | | Manufacturing | | | 112,099 | |
CPA®:16 - Global | | Advanced Circuits, Inc. | | Aurora, CO | | | 5,261 | | | September 20, 2005 | | Industrial | | | 61,233 | |
CPA®:16 - Global | | John Nurminen | | Helsinki, Finland | | | 9,979 | | | October 31, 2005 | | Warehouse/Distribution | | | 178,110 | |
CPA®:14, 16 - Global | | Dick's Sporting Goods Expansion(1) (3) | | Plainfield, IN | | | 18,429 | | | November 18, 2005 | | Retail | | | 361,000 | |
CPA®:15 | | Innovative Holdings Limited Expansion(1) (3) | | Birmingham, England | | | 6,688 | | | December 2, 2005 | | Warehouse/Distribution | | | 35,038 | |
CPA®:16 - Global | | Corinthian Blairsville(3) | | Blairsville, PA | | | 26,463 | | | December 6, 2005 | | Residential | | | 198,660 | |
CPA®:16 - Global | | Murray Intl. Metals | | Newbridge, Midlothian, Scotland, UK | | | 25,249 | | | December 19, 2005 | | Warehouse/Distribution | | | 213,394 | |
| | | | | | | | | | | | | | | | | |
| | | | | | | | | | | | | | | |
| | | Total(4) | | | | $ | 865,347 | | | | | | | | 8,429,703 | |
| | | | | | | | | | | | | | | |
| | |
| (1) | | Represents a facility expansion. |
| |
| (2) | | Mortgage note investment. |
| |
| (3) | | Represents a build-to-suit transaction. |
| |
| (4) | | Numbers may not add up due to rounding. |
| | | |
| | |
| Ticker: WPC | | www.wpcarey.com |
17
SECTION: ACQUISITIONS/DISPOSITIONS
W. P. CAREY & CO. LLC
2005 Dispositions Update
| | | | | | | | | | | |
| | | | | | | | | Sale Price | |
| Portfolio(s) | | Tenant/Lease Guarantor | | Property Location(s) | | Disposition Date | | (000s) | |
| |
| | | | | | | | | | | |
Real Estate Business | | | | | | | | |
| | | | | | | | | | | |
| WPC LLC | | Rochester Button | | South Boston, VA | | February 11, 2005 | | $ | 65 | |
| WPC LLC | | Blue Tools, Inc. (DeVlieg Bullard) | | Frankenmuth, MI | | March 3, 2005 | | | 1,704 | |
| WPC LLC | | K-Mart | | Denton, TX | | March 4, 2005 | | | 2,000 | |
| WPC LLC | | Apogent | | Rochestor, NY, Dubuque, IA, Portsmouth, NH | | May 2, 2005 | | | 28,850 | |
| WPC LLC | | Penn Virginia | | Duffield, VA | | October 3, 2005 | | | 1,050 | |
| WPC LLC | | Gibson Greetings(1) | | Berea, KY & Cincinnati, OH | | December 9, 2005 | | | 12,000 | |
| WPC LLC | | Games Workshop | | Glen Burnie, MD | | December 15, 2005 | | | 3,250 | |
| | | | | | | | | | |
| | | Subtotal | | | | | | $ | 48,919 | |
| | | | | | | | | | | |
Management Business | | | | | | | | |
| | | | | | | | | | | |
CPA®:14 | | Stellex | | Valencia, CA | | February 25, 2005 | | $ | 4,116 | |
CPA®:12 | | Scott(2) | | San Leandro, CA | | March 1, 2005 | | | 563 | |
CPA®:12 | | Lanxide | | Newark, DE | | March 31, 2005 | | | 3,000 | |
CPA®:15 | | Blackstone | | Miami, FL | | April 19, 2005 | | | 20,500 | |
CPA®:14 | | Buffets (land sale) | | Eagan, MN | | August 4, 2005 | | | 1,626 | |
CPA®:15 | | Fleming(3) | | Tulsa, OK | | November 1, 2005 | | | 29,651 | |
CPA®:15 | | Holiday Inn Toulouse(4) | | Toulouse, France | | December 1, 2005 | | | 4,445 | |
CPA®:12 | | Scott(5) | | San Leandro, CA | | December 15, 2005 | | | 14,175 | |
| | | | | | | | | | |
| | | Subtotal | | | | | | $ | 78,076 | |
| | | Total | | | | | | $ | 126,995 | |
| | | | | | | | | | |
| | |
| 1) | | Includes $3 million lease termination fee. |
| |
| 2) | | Represents partial land sale. |
| |
| 3) | | Sold certain FFE valued at approximately $1.6 million for approximately $215,000. Deed in lieu. |
| |
| 4) | | Toulouse sales price is 3,699,250 EUR at a rate of 1.2017. |
| |
| 5) | | Represents full land sale. |
| | |
| Ticker: WPC | | www.wpcarey.com |
18
SECTION: PORTFOLIO ANALYSIS
W. P. CAREY & CO. LLC
Portfolio Diversification Analysis by Rent Contribution
December 31, 2005
Based on Ongoing Rental Income
| | | | | | | | | | | | | |
| Top Ten Tenants/Lease Guarantors | | Annualized | | Percentage of Total | | Percentage of |
| | | Rent | | Annualized Rent | | Revenue(1) |
| |
| Detroit Diesel Corporation | | $ | 4,634,253 | | | | 5.4 | % | | | 2.6 | % |
| Dr Pepper/Seven Up Bottling Group | | | 4,598,841 | | | | 5.4 | % | | | 2.5 | % |
| Carrefour France, S.A. | | | 3,459,579 | | | | 4.0 | % | | | 1.9 | % |
| Bouygues Telecom, S.A. | | | 3,458,398 | | | | 4.0 | % | | | 1.9 | % |
| Quebecor Printing USA | | | 3,127,203 | | | | 3.7 | % | | | 1.7 | % |
| Orbital Sciences Corporation | | | 3,022,947 | | | | 3.5 | % | | | 1.7 | % |
| Federal Express Corporation | | | 2,986,085 | | | | 3.5 | % | | | 1.6 | % |
| The Titan Corporation | | | 2,862,068 | | | | 3.3 | % | | | 1.6 | % |
| America West Holdings Corporation | | | 2,837,889 | | | | 3.3 | % | | | 1.6 | % |
| CheckFree Holdings, Inc. | | | 2,247,148 | | | | 2.6 | % | | | 1.2 | % |
| | | | | |
| Percentage of Total | | Number of Tenants/Lease |
| Annualized Rent | | Guarantors |
| |
| 10.0% < rent | | | 0 | |
10.0% > ,³ 7.5% | | | 0 | |
7.5% > ,³ 5.0% | | | 2 | |
5.0% > ,³ 2.5% | | | 9 | |
| 2.5% > rent | | | 97 | |
| | | | | |
| Percentage of | | Number of Tenants/Lease |
| Revenue(1) | | Guarantors |
| |
| 10.0% < rent | | | 0 | |
10.0% > ,³ 7.5% | | | 0 | |
7.5% > ,³ 5.0% | | | 0 | |
5.0% > ,³ 2.5% | | | 2 | |
| 2.5% > rent | | | 106 | |
| | |
| (1) | | Revenues = revenue from continuing operations + revenue from discontinued operations + interest income. |
| | | | |
| | | | | |
| Ticker: WPC | | | | www.wpcarey.com |
20
SECTION: PORTFOLIO ANALYSIS
W. P. CAREY & CO. LLC
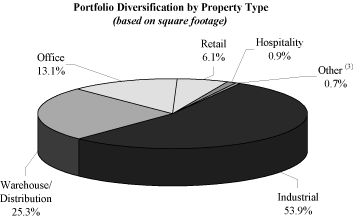
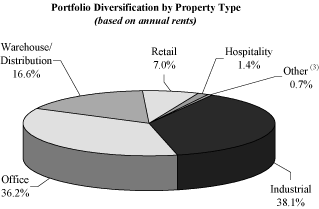
Portfolio Diversification Analysis by Property Type
December 31, 2005
| | | | | | | | | |
| Property Type | | Square Footage(2) | | | Percent | |
| |
| | | | | | | | | |
| Industrial | | | 9,207,690 | | | | 53.9 | % |
| Warehouse/Distribution | | | 4,314,893 | | | | 25.3 | % |
| Office | | | 2,234,445 | | | | 13.1 | % |
| Retail | | | 1,043,736 | | | | 6.1 | % |
| Hospitality | | | 158,000 | | | | 0.9 | % |
Other(3) | | | 115,606 | | | | 0.7 | % |
| | | | | | | | | |
| |
Total | | | 17,074,370 | | | | 100.0 | % |
| |
| | | | | | | | | |
| Property Type | | Annual Rent(1) | | | Percent | |
| |
| | | | | | | | | |
| Industrial | | $ | 32,602,044 | | | | 38.1 | % |
| Office | | | 30,951,317 | | | | 36.2 | % |
| Warehouse/Distribution | | | 14,220,390 | | | | 16.6 | % |
| Retail | | | 6,022,360 | | | | 7.0 | % |
| Hospitality | | | 1,200,000 | | | | 1.4 | % |
Other(3) | | | 570,677 | | | | 0.7 | % |
| | | | | | | | | |
| |
Total(4) | | $ | 85,566,789 | | | | 100.0 | % |
| |
| | |
| (1) | | Rents reflect current annualized rates on a pro rata basis. |
| |
| (2) | | Square footage for jointly owned properties is not shown on a pro rata basis. |
| |
| (3) | | Reflects land used for educational purposes & unoccupied land. |
| |
| (4) | | Numbers may not add up due to rounding. |
| | | | |
| | | | | |
| Ticker: WPC | | | | www.wpcarey.com |
21
SECTION: PORTFOLIO ANALYSIS
W. P. CAREY & CO. LLC
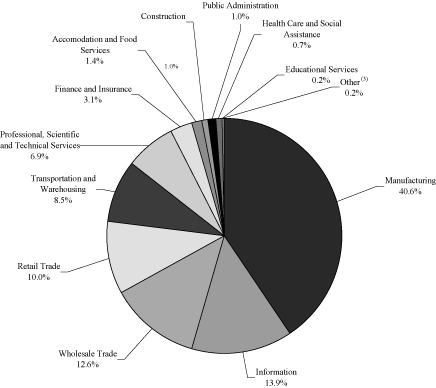
Portfolio Diversification Analysis by Tenant Industry
December 31, 2005
| | | | | | | | | |
| | | | | | | Percentage of | |
| Industry Type(1) | | Annual Rent | | | Rent(2) | |
| |
| Manufacturing | | $ | 34,712,042 | | | | 40.6 | % |
| Information | | | 11,873,904 | | | | 13.9 | % |
| Wholesale Trade | | | 10,811,337 | | | | 12.6 | % |
| Retail Trade | | | 8,517,776 | | | | 10.0 | % |
| Transportation and Warehousing | | | 7,296,183 | | | | 8.5 | % |
| Professional, Scientific and Technical Services | | | 5,920,529 | | | | 6.9 | % |
| Finance and Insurance | | | 2,615,212 | | | | 3.1 | % |
| Accomodation and Food Services | | | 1,209,000 | | | | 1.4 | % |
| Construction | | | 823,077 | | | | 1.0 | % |
| Public Administration | | | 832,478 | | | | 1.0 | % |
| Health Care and Social Assistance | | | 620,062 | | | | 0.7 | % |
| Educational Services | | | 169,320 | | | | 0.2 | % |
Other(3) | | | 165,868 | | | | 0.2 | % |
| |
Total(4) | | $ | 85,566,789 | | | | 100.0 | % |
| |
| | |
| (1) | | Based on the North American Industry Classification System (NAICS) and information provided by the tenant. |
| |
| (2) | | Rents reflect current annualized rates on a pro rata basis. |
| |
| (3) | | Reflects land used for Administrative, Support, Waste Management, Remediation Services, Arts, Entertainment & Recreation, and Other Services (except Public Administration). |
| |
| (4) | | Numbers may not add up due to rounding. |
| | | | |
| | | | | |
| Ticker: WPC | | | | www.wpcarey.com |
22
SECTION: PORTFOLIO ANALYSIS
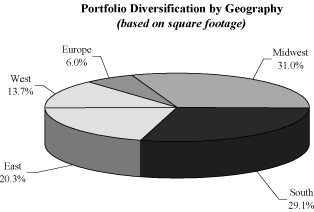
W. P. CAREY & CO. LLC
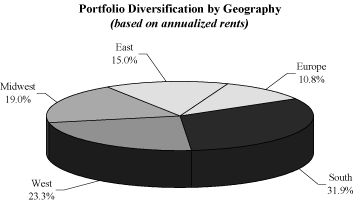
Portfolio Diversification Analysis by Geography
December 31, 2005
| | | | | | | | | |
| Region | | Square Footage(2) | | | Percentage | |
| |
| Midwest | | | 5,286,077 | | | | 31.0 | % |
| South | | | 4,963,611 | | | | 29.1 | % |
| East | | | 3,464,671 | | | | 20.3 | % |
| West | | | 2,331,364 | | | | 13.7 | % |
| Europe | | | 1,028,647 | | | | 6.0 | % |
| | | | | | | | | |
| |
Total | | | 17,074,370 | | | | 100.0 | % |
| |
| | | | | | | | | |
| Region | | Annual Rent(1) | | | Percentage | |
| |
| South | | $ | 27,294,946 | | | | 31.9 | % |
| West | | | 19,944,583 | | | | 23.3 | % |
| Midwest | | | 16,222,285 | | | | 19.0 | % |
| East | | | 12,822,665 | | | | 15.0 | % |
| Europe | | | 9,282,309 | | | | 10.8 | % |
| | | | | | | | | |
| |
Total(3) | | $ | 85,566,789 | | | | 100.0 | % |
| |
| | |
| (1) | | Rents reflect current annualized rates on a pro rata basis. |
| |
| (2) | | Square footage for jointly owned properties shown on a pro rata basis. |
| |
| (3) | | Numbers may not add up due to rounding. |
| | | | |
| | | | | |
| Ticker: WPC | | | | www.wpcarey.com |
23
SECTION: PORTFOLIO ANALYSIS
W. P. CAREY & CO. LLC
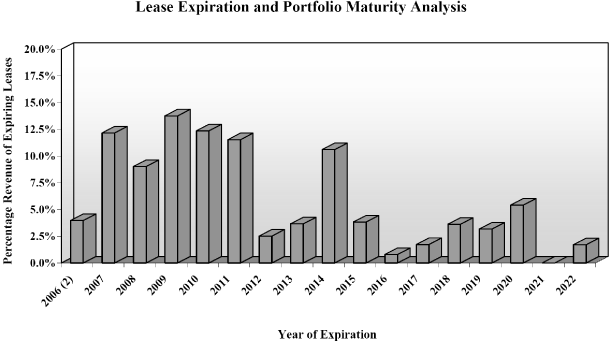
Portfolio Lease Maturity Analysis
December 31, 2005
| | | | | | | | | | | | | | | | | |
| Year of | | Number of | | | Annualized | | | Percentage of Total | | | Years to | |
| Lease Expiration | | Leases | | | Rents(1) | | | Annualized Rents | | | Maturity | |
| |
2006(2) | | | 24 | | | | 3,405,776 | | | | 4.0 | % | | | 1.00 | |
| 2007 | | | 19 | | | | 10,416,955 | | | | 12.2 | % | | | 2.00 | |
| 2008 | | | 14 | | | | 7,732,535 | | | | 9.0 | % | | | 3.00 | |
| 2009 | | | 13 | | | | 11,780,526 | | | | 13.8 | % | | | 4.00 | |
| 2010 | | | 18 | | | | 10,591,772 | | | | 12.4 | % | | | 5.00 | |
| 2011 | | | 10 | | | | 9,874,323 | | | | 11.5 | % | | | 6.00 | |
| 2012 | | | 6 | | | | 2,161,190 | | | | 2.5 | % | | | 7.00 | |
| 2013 | | | 7 | | | | 3,137,564 | | | | 3.7 | % | | | 8.00 | |
| 2014 | | | 4 | | | | 9,077,462 | | | | 10.6 | % | | | 9.00 | |
| 2015 | | | 2 | | | | 3,289,698 | | | | 3.8 | % | | | 10.00 | |
| 2016 | | | 2 | | | | 684,430 | | | | 0.8 | % | | | 11.00 | |
| 2017 | | | 1 | | | | 1,485,809 | | | | 1.7 | % | | | 12.00 | |
| 2018 | | | 3 | | | | 3,105,709 | | | | 3.6 | % | | | 13.00 | |
| 2019 | | | 1 | | | | 2,716,648 | | | | 3.2 | % | | | 14.00 | |
| 2020 | | | 1 | | | | 4,634,253 | | | | 5.4 | % | | | 15.00 | |
| 2021 | | | — | | | | — | | | | 0.0 | % | | | 16.00 | |
| 2022 | | | 2 | | | | 1,472,138 | | | | 1.7 | % | | | 17.00 | |
| | | | | |
Total(3) | | | 127 | | | $ | 85,566,789 | | | | 100 | % | | | | |
| | | | | |
| | | | | | | | | | | | | | | | | |
| | | | | |
| Weighted Average Years to Maturity: | | | | | | | 6.54 | | | | | |
| | | | | |
| | |
| (1) | | Month to month properties are counted in current year’s revenue stream. |
| |
| (2) | | 2006 lease expirations include Broomfield tenants counted as separate leases. |
| |
| (3) | | Numbers may not add up due to rounding. |
| | | | |
| | | | | |
| Ticker: WPC | | | | www.wpcarey.com |
24
EXHIBITS (1)
| | |
| (1) | | Sources for Exhibits A, B, C and D include a) Forms 10-K for the years 2003, 2004 & 2005 b) Company Press Releases |
EXHIBIT A
W. P. CAREY & CO. LLC
Consolidated Balance Sheets
(in thousands except share amounts)
| | | | | | | | | | |
| | | The Company | | | | The Company | |
| | | Consolidated as of | | | | Consolidated as of | |
| | | December 31, 2005 | | | | December 31, 2004 | |
ASSETS: | | | | | | | | | |
| Real estate, net | | $ | 454,478 | | | | $ | 476,365 | |
| Net investment in direct financing leases | | | 131,975 | | | | | 190,644 | |
| Equity Investments | | | 134,567 | | | | | 110,379 | |
| Operating real estate | | | 7,865 | | | | | 9,140 | |
| Assets held for sale | | | 18,815 | | | | | 12,802 | |
| Cash and cash equivalents | | | 13,014 | | | | | 16,715 | |
| Due from affiliates | | | 82,933 | | | | | 63,471 | |
| Goodwill | | | 63,607 | | | | | 63,607 | |
| Intangible assets, net | | | 40,700 | | | | | 50,501 | |
| Other assets, net | | | 35,308 | | | | | 19,915 | |
| | | | | | | | |
| Total assets | | $ | 983,262 | | | | $ | 1,013,539 | |
| | | | | | | | |
| | | | | | | | | | |
LIABILITIES, MINORITY INTEREST AND MEMBERS’ EQUITY: | | | | | | | | | |
| Liabilities: | | | | | | | | | |
| Mortgage notes payable | | $ | 226,701 | | | | $ | 190,698 | |
| Mortgage notes payable on assets held for sale | | | 4,412 | | | | | — | |
| Credit facility | | | 15,000 | | | | | 102,000 | |
| Accrued interest | | | 2,036 | | | | | 1,389 | |
| Dividends payable | | | 16,963 | | | | | 16,626 | |
| Due to affiliates | | | 2,994 | | | | | 2,033 | |
| Accounts payable and accrued expense | | | 23,002 | | | | | 19,838 | |
| Prepaid rental income and security deposits | | | 4,391 | | | | | 4,881 | |
| Accrued income taxes | | | 634 | | | | | 3,909 | |
| Deferred income taxes, net | | | 39,908 | | | | | 38,359 | |
| Other liabilities | | | 36,064 | | | | | 11,748 | |
| | | | | | | | |
| Total Liabilities | | | 372,105 | | | | | 391,481 | |
| | | | | | | | |
| Minority interest | | | 3,689 | | | | | 1,407 | |
| | | | | | | | |
| Commitments and contingencies | | | | | | | | | |
| Members’ Equity: | | | | | | | | | |
| Listed Shares, no par value, 100,000,000 shares authorized, 37,706,247, and 37,523,462 shares issued and outstanding at December 31, 2005 and 2004 | | | 740,593 | | | | | 734,658 | |
| Distributions in excess of accumulated earnings | | | (131,178 | ) | | | | (112,441 | ) |
| Unearned compensation | | | (5,119 | ) | | | | (5,366 | ) |
| Accumulated other comprehensive income | | | 3,172 | | | | | 3,800 | |
| Total members’ equity | | | 607,468 | | | | | 620,651 | |
| | | | | | | | |
| Total liabilities, minority interest and members’ equity | | $ | 983,262 | | | | $ | 1,013,539 | |
| | | | | | | | |
| | | | |
| | | | | |
| Ticker: WPC | | | | www.wpcarey.com |
EXHIBIT B
W. P. CAREY & CO. LLC
Consolidated Statements of Income
(in thousands, except share and per share amounts)
| | | | | | | | | | | | | | |
| | | For the Year | | | | For the Year | | | For the Year | |
| | | Ended | | | | Ended | | | Ended | |
| | | December 31, 2005 | | | | December 31, 2004 | | | December 31, 2003 | |
REVENUES: | | | | | | | | | | | | | |
| Asset management income | | $ | 62,294 | | | | $ | 61,194 | | | $ | 56,402 | |
| Structuring revenue | | | 28,197 | | | | | 45,168 | | | | 31,658 | |
| Rental Income | | | 52,386 | | | | | 44,817 | | | | 40,558 | |
| Interest income from direct financing leases | | | 17,149 | | | | | 17,580 | | | | 17,118 | |
Incentive and subordinated disposition revenue from CIP® merger | | | — | | | | | 42,095 | | | | — | |
| Other operating income | | | 6,592 | | | | | 5,623 | | | | 5,211 | |
| Revenues of other business operations | | | 7,499 | | | | | 5,725 | | | | 3,098 | |
| | | | | | | | | | | |
| | | | 174,117 | | | | | 222,202 | | | | 154,045 | |
| | | | | | | | | | | |
| | | | | | | | | | | | | | |
OPERATING EXPENSES: | | | | | | | | | | | | | |
| General and administrative | | | (55,184 | ) | | | | (50,985 | ) | | | (43,695 | ) |
| Depreciation | | | (11,939 | ) | | | | (10,954 | ) | | | (8,939 | ) |
| Amortization | | | (8,813 | ) | | | | (10,074 | ) | | | (7,259 | ) |
| Property expenses | | | (7,396 | ) | | | | (5,577 | ) | | | (5,745 | ) |
| Impairment charges and loan losses | | | (15,154 | ) | | | | (12,899 | ) | | | (1,480 | ) |
| Operating expenses of other business operations | | | (6,327 | ) | | | | (6,261 | ) | | | (1,209 | ) |
| | | | | | | | | | | |
| | | | (104,813 | ) | | | | (96,750 | ) | | | (68,327 | ) |
| | | | | | | | | | | |
OTHER INCOME AND EXPENSES: | | | | | | | | | | | | | |
| Other interest income | | | 3,511 | | | | | 3,127 | | | | 2,581 | |
| Income from equity investments | | | 5,182 | | | | | 5,308 | | | | 4,008 | |
| Minority interest in income | | | (264 | ) | | | | (1,499 | ) | | | (370 | ) |
| Gain on foreign currency transactions and other gains, net | | | 1,305 | | | | | 1,222 | | | | 48 | |
| Interest expense | | | (16,787 | ) | | | | (14,488 | ) | | | (14,660 | ) |
| | | | | | | | | | | |
| | | | (7,053 | ) | | | | (6,330 | ) | | | (8,393 | ) |
| | | | | | | | | | | |
| Income from continuing operations before income taxes | | | 62,251 | | | | | 119,122 | | | | 77,325 | |
| Provision for income taxes | | | (19,390 | ) | | | | (50,983 | ) | | | (19,116 | ) |
| | | | | | | | | | | |
| Income from continuing operations | | | 42,861 | | | | | 68,139 | | | | 58,209 | |
| | | | | | | | | | | |
DISCONTINUED OPERATIONS: | | | | | | | | | | | | | |
| Income from operations of discontinued properties | | | 1,885 | | | | | 6,812 | | | | 6,391 | |
| Gains on sale of real estate, net | | | 10,474 | | | | | 89 | | | | 1,238 | |
| Impairment charges on properties held for sale | | | (6,616 | ) | | | | (9,199 | ) | | | (2,960 | ) |
| | | | | | | | | | | |
| Income (loss) from discontinued operations | | | 5,743 | | | | | (2,298 | ) | | | 4,669 | |
| | | | | | | | | | | |
NET INCOME | | $ | 48,604 | | | | $ | 65,841 | | | $ | 62,878 | |
| | | | | | | | | | | |
BASIC EARNINGS PER SHARE: | | | | | | | | | | | | | |
| Income from continuing operations | | $ | 1.14 | | | | $ | 1.82 | | | $ | 1.59 | |
| Income (loss) from discontinued operations | | | 0.15 | | | | | (0.06 | ) | | | 0.13 | |
| | | | | | | | | | | |
| Net Income | | $ | 1.29 | | | | $ | 1.76 | | | $ | 1.72 | |
| | | | | | | | | | | |
DILUTED EARNINGS PER SHARE: | | | | | | | | | | | | | |
| Income from continuing operations | | $ | 1.10 | | | | $ | 1.75 | | | $ | 1.52 | |
| Income (loss) from discontinued operations | | | 0.15 | | | | | (0.06 | ) | | | 0.12 | |
| | | | | | | | | | | |
| Net Income | | $ | 1.25 | | | | $ | 1.69 | | | $ | 1.64 | |
| | | | | | | | | | | |
DIVIDENDS DECLARED PER SHARE: | | $ | 1.79 | | | | $ | 1.76 | | | $ | 1.73 | |
| | | | | | | | | | | |
WEIGHTED AVERAGE SHARES OUTSTANDING: | | | | | | | | | | | | | |
| Basic | | | 37,688,835 | | | | | 37,417,918 | | | | 36,566,338 | |
| | | | | | | | | | | |
| Diluted | | | 39,020,801 | | | | | 38,961,748 | | | | 38,434,169 | |
| | | | | | | | | | | |
| | | | |
| | | | | |
| Ticker: WPC | | | | www.wpcarey.com |
EXHIBIT C
W. P. CAREY & CO. LLC
Consolidated Statements of Cash Flows
(in thousands)
| | | | | | | | | | | | | | |
| | | For the Year | | | | For the Year | | | For the Year | |
| | | Ended | | | | Ended | | | Ended | |
| | | December 31, 2005 | | | | December 31, 2004 | | | December 31, 2003 | |
| Cash flows from operating activities: | | | | | | | | | | | | | |
| Net income | | $ | 48,604 | | | | $ | 65,841 | | | $ | 62,878 | |
| Adjustments to reconcile net income to net cash provided by operating activities: | | | | | | | | | | | | | |
| Depreciation and amortization of intangible assets and deferred financing costs | | | 21,623 | | | | | 22,298 | | | | 19,340 | |
| Distribution received in excess of accumulated earnings and equity income in excess of distributions | | | 479 | | | | | (793 | ) | | | (23 | ) |
| Gain on sales of real estate and securities, net | | | (10,570 | ) | | | | (90 | ) | | | (660 | ) |
| Recognition of deferred gain on completion of development project | | | (2,000 | ) | | | | — | | | | — | |
| Minority interest in income | | | 264 | | | | | 1,499 | | | | 370 | |
| Straight-line rent adjustments | | | 3,776 | | | | | 1,732 | | | | 74 | |
| Management income received in shares of affiliates | | | (31,858 | ) | | | | (20,999 | ) | | | (18,599 | ) |
| Unrealized loss (gain) on foreign currency transactions and warrants | | | 779 | | | | | (790 | ) | | | (130 | ) |
| Impairment charges and loan losses | | | 21,770 | | | | | 22,098 | | | | 4,440 | |
| Deferred income taxes | | | 1,549 | | | | | 8,827 | | | | 9,769 | |
| Realized loss (gain) on foreign currency transaction | | | 19 | | | | | (430 | ) | | | (556 | ) |
| Costs paid by issuance of shares | | | 201 | | | | | 168 | | | | 215 | |
| (Decrease) increase in accrued taxes payable | | | (3,274 | ) | | | | 2,099 | | | | (3,475 | ) |
| Tax charge — share incentive plans | | | 604 | | | | | 3,423 | | | | 2,700 | |
| Amortization of unearned compensation | | | 3,936 | | | | | 3,768 | | | | 3,536 | |
| Deferred acquisition revenue received | | | 8,961 | | | | | 5,978 | | | | 1,495 | |
| Increase in structuring revenue receivable | | | (5,304 | ) | | | | (14,860 | ) | | | (13,424 | ) |
| Net changes in other operating assets and liabilities | | | (6,852 | ) | | | | (920 | ) | | | (655 | ) |
| | | | | | | | | | | |
| Net cash provided by operating activities | | | 52,707 | | | | | 98,849 | | | | 67,295 | |
| | | | | | | | | | | |
| | | | | | | | | | | | | | |
| Cash flows from investing activities: | | | | | | | | | | | | | |
| Distributions received from equity investments in excess of equity income | | | 6,164 | | | | | 6,933 | | | | 3,503 | |
| Capital distributions from equity investment | | | — | | | | | — | | | | 6,582 | |
| Purchases of real estate and equity investments | | | — | | | | | (115,522 | ) | | | (8,184 | ) |
| Capital expenditures | | | (2,975 | ) | | | | (1,596 | ) | | | (2,843 | ) |
| Purchase of investment | | | (465 | ) | | | | — | | | | — | |
| Payment of deferred acquisition revenue to affiliate | | | (524 | ) | | | | (524 | ) | | | (524 | ) |
| Release of funds from escrow in connection with the sale of a property | | | — | | | | | 7,185 | | | | — | |
| Proceeds from sales of property and investments | | | 45,542 | | | | | 6,548 | | | | 24,395 | |
| Cash acquired on acquisition of subsidiary | | | — | | | | | — | | | | 1,300 | |
| | | | | | | | | | | |
| Net cash provided by (used in) investing activities | | | 47,742 | | | | | (96,976 | ) | | | 24,229 | |
| | | | | | | | | | | |
| | | | | | | | | | | | | | |
| Cash flows from financing activities: | | | | | | | | | | | | | |
| Dividends paid | | | (67,004 | ) | | | | (65,073 | ) | | | (62,978 | ) |
| Contributions from minority interests | | | 1,539 | | | | | — | | | | — | |
| Distributions to minority interests | | | (355 | ) | | | | (1,101 | ) | | | — | |
| Scheduled payments of mortgage principal | | | (9,229 | ) | | | | (9,428 | ) | | | (8,548 | ) |
| Proceeds from mortgages and credit facility | | | 121,764 | | | | | 170,000 | | | | 82,683 | |
| Prepayments of mortgages principal and credit facility | | | (151,893 | ) | | | | (106,962 | ) | | | (107,854 | ) |
| Payment of financing costs | | | (797 | ) | | | | (1,238 | ) | | | (391 | ) |
| Proceeds from issuance of shares | | | 4,400 | | | | | 6,649 | | | | 7,789 | |
| Retirement of shares | | | (2,206 | ) | | | | (2,543 | ) | | | — | |
| | | | | | | | | | | |
| Net cash used in financing activities: | | | (103,781 | ) | | | | (9,696 | ) | | | (89,299 | ) |
| | | | | | | | | | | |
| Effect of exchange rate changes on cash | | | (369 | ) | | | | 179 | | | | 830 | |
| | | | | | | | | | | |
| Net (decrease) increase in cash and cash equivalents | | | (3,701 | ) | | | | (7,644 | ) | | | 3,055 | |
| Cash and cash equivalents, beginning of year | | | 16,715 | | | | | 24,359 | | | | 21,304 | |
| | | | | | | | | | | |
| Cash and cash equivalents, end of year | | $ | 13,014 | | | | $ | 16,715 | | | $ | 24,359 | |
| | | | | | | | | | | |
| | | | |
| | | | | |
| Ticker: WPC | | | | www.wpcarey.com |
EXHIBIT D
W. P. CAREY & CO. LLC
Quarterly Reconciliation of Net Income to Funds from Operations
(in thousands, except share and per share amounts)
| | | | | | | | | | | | | | | | | |
| | | For the Quarter | | | For the Quarter | | | For the Quarter | | | For the Quarter | |
| | | Ended | | | Ended | | | Ended | | | Ended | |
| | | December 31, 2005 | | | September 30, 2005 | | | June 30, 2005 | | | March 31, 2005 | |
| Net income | | $ | 11,488 | | | $ | 14,328 | | | $ | 16,933 | | | $ | 5,855 | |
| (Gain) loss on sale of real estate | | | (3,355 | ) | | | — | | | | (9,139 | ) | | | 20 | |
| FFO of equity investees in excess of equity income | | | 2,833 | | | | 2,690 | | | | 2,608 | | | | 2,227 | |
| Depreciation, amortization, deferred taxes and other non-cash charges | | | 6,396 | | | | 7,957 | | | | 7,400 | | | | 5,341 | |
| FFO applicable to minority investees in excess of minority income | | | (183 | ) | | | (193 | ) | | | (108 | ) | | | (118 | ) |
| Straight-line rent adjustment | | | 1,119 | | | | 824 | | | | 964 | | | | 914 | |
| Impairment charges and loan losses | | | 5,949 | | | | — | | | | 6,149 | | | | 9,672 | |
| | | | | | | | | | | | | |
Funds From Operations (FFO) | | $ | 24,247 | | | $ | 25,606 | | | $ | 24,807 | | | $ | 23,911 | |
| | | | | | | | | | | | | |
| | | | | | | | | | | | | | | | | |
| Weighted Average Listed Shares Outstanding | | | | | | | | | | | | | | | | |
| Basic | | | 37,762,361 | | | | 37,727,008 | | | | 37,670,305 | | | | 37,592,343 | |
| Diluted | | | 38,674,396 | | | | 38,948,980 | | | | 39,017,636 | | | | 39,377,650 | |
FFO per Share | | | | | | | | | | | | | | | | |
Basic | | $ | 0.64 | | | $ | 0.68 | | | $ | 0.66 | | | $ | 0.64 | |
Diluted | | $ | 0.63 | | | $ | 0.66 | | | $ | 0.64 | | | $ | 0.61 | |
| | | | |
| | | | | |
| Ticker: WPC | | | | www.wpcarey.com |
EXHIBIT E
W. P. CAREY & CO. LLC
Detailed Property Summary
December 31, 2005
| | | | | | | | | | | | | | | | | | | | | | | | | | | | | | | | | | | | | | | | | |
| | | | | | | | | | | | | | | | | | | | | | | Percentage of | | | Increase | | | Lease | | | Maximum | | | | |
| Tenant/Lease Guarantor | | Property Location | | | Property Type | | | Tenant Type | | | Region | | | Square Footage | | | Annual Rent | | | Total Rent | | | Factor | | | Expiration | | | Term | |
| |
| | | | | | | | | | | | | | | | | | | | | | | | | | | | | | | | | | | | | | | | | |
| Detroit Diesel Corporation | | Detroit, MI | | Industrial | | Manufacturing | | Midwest | | | 2,730,750 | | | | 4,634,253 | | | | 5.42 | % | | PPI | | June-20 | | June-40 |
| | | | | | | | | | | | | | | | | | | | | | | | | | | | | | | |
Detroit Diesel Corporation Total | | | | | | | | | | | | | | | | | | | 2,730,750 | | | | 4,634,253 | | | | 5.42 | % | | | | | | | | | | | | |
| | | | | | | | | | | | | | | | | | | | | | | | | | | | | | | | | | | | | | | | | |
| Dr Pepper/Seven Up Bottling Group | | Irving, TX | | Industrial | | Manufacturing | | South | | | 459,497 | | | | 2,789,657 | | | | 3.26 | % | | CPI | | June-14 | | June-29 |
| Dr Pepper/Seven Up Bottling Group | | Houston, TX | | Industrial | | Manufacturing | | South | | | 262,450 | | | | 1,809,184 | | | | 2.11 | % | | CPI | | June-14 | | June-29 |
| | | | | | | | | | | | | | | | | | | | | | | | | | | | | | | |
Dr Pepper/Seven Up Bottling Group Total | | | | | | | | | | | | | | | | | | | 721,947 | | | | 4,598,841 | | | | 5.37 | % | | | | | | | | | | | | |
| | | | | | | | | | | | | | | | | | | | | | | | | | | | | | | | | | | | | | | | | |
Carrefour France, SAS(4) | | Lens, France | | Warehouse/Distribution | | Retail Trade | | Europe | | | 62,349 | | | | 361,758 | | | | 0.42 | % | | INSEE(2) | | December-11 | | December-11 |
Carrefour France, SAS(4) | | Lens, France | | Warehouse/Distribution | | Retail Trade | | Europe | | | 1,276 | | | | 7,406 | | | | 0.01 | % | | INSEE(2) | | December-11 | | December-11 |
Carrefour France, SAS(4) | | Lens, France | | Warehouse/Distribution | | Retail Trade | | Europe | | | 2,136 | | | | 12,394 | | | | 0.01 | % | | INSEE(2) | | December-11 | | December-11 |
Carrefour France, SAS(4) | | Nimes, France | | Warehouse/Distribution | | Retail Trade | | Europe | | | 66,285 | | | | 317,542 | | | | 0.37 | % | | INSEE(2) | | December-11 | | December-11 |
Carrefour France, SAS(4) | | Nimes, France | | Warehouse/Distribution | | Retail Trade | | Europe | | | 1,255 | | | | 6,010 | | | | 0.01 | % | | INSEE(2) | | December-11 | | December-11 |
Carrefour France, SAS(4) | | Nimes, France | | Warehouse/Distribution | | Retail Trade | | Europe | | | 293 | | | | 1,403 | | | | 0.00 | % | | INSEE(2) | | December-11 | | December-11 |
Carrefour France, SAS(4) | | Nimes, France | | Warehouse/Distribution | | Retail Trade | | Europe | | | 87,334 | | | | 476,347 | | | | 0.56 | % | | INSEE(2) | | November-12 | | November-12 |
Carrefour France, SAS(4) | | Colomiers, France | | Warehouse/Distribution | | Retail Trade | | Europe | | | 85,602 | | | | 458,976 | | | | 0.54 | % | | INSEE(2) | | December-11 | | December-11 |
Carrefour France, SAS(4) | | Colomiers, France | | Warehouse/Distribution | | Retail Trade | | Europe | | | 29,617 | | | | 158,801 | | | | 0.19 | % | | INSEE(2) | | December-11 | | December-11 |
Carrefour France, SAS(4) | | Colomiers, France | | Warehouse/Distribution | | Retail Trade | | Europe | | | 3,696 | | | | 19,816 | | | | 0.02 | % | | INSEE(2) | | December-11 | | December-11 |
Carrefour France, SAS(4) | | Colomiers, France | | Warehouse/Distribution | | Retail Trade | | Europe | | | 1,424 | | | | 7,635 | | | | 0.01 | % | | INSEE(2) | | December-11 | | December-11 |
Carrefour France, SAS(4) | | Thuit Hebert, France | | Warehouse/Distribution | | Retail Trade | | Europe | | | 53,032 | | | | 228,393 | | | | 0.27 | % | | INSEE(2) | | December-11 | | December-11 |
Carrefour France, SAS(4) | | Thuit Hebert, France | | Warehouse/Distribution | | Retail Trade | | Europe | | | 33,638 | | | | 144,867 | | | | 0.17 | % | | INSEE(2) | | December-11 | | December-11 |
Carrefour France, SAS(4) | | Crepy en Valois, France | | Warehouse/Distribution | | Retail Trade | | Europe | | | 49,736 | | | | 296,860 | | | | 0.35 | % | | INSEE(2) | | December-11 | | December-11 |
Carrefour France, SAS(4) | | Crepy en Valois, France | | Warehouse/Distribution | | Retail Trade | | Europe | | | 74,846 | | | | 446,733 | | | | 0.52 | % | | INSEE(2) | | December-11 | | December-11 |
Carrefour France, SAS(4) | | Ploufragen, France | | Warehouse/Distribution | | Retail Trade | | Europe | | | 60,221 | | | | 276,871 | | | | 0.32 | % | | INSEE(2) | | December-11 | | December-11 |
Carrefour France, SAS(4) | | Cholet, France | | Warehouse/Distribution | | Retail Trade | | Europe | | | 48,760 | | | | 237,767 | | | | 0.28 | % | | INSEE(2) | | December-11 | | December-11 |
| | | | | | | | | | | | | | | | | | | | | | | | | | | | | | | |
Carrefour France, SAS Total | | | | | | | | | | | | | | | | | | | 661,500 | | | | 3,459,579 | | | | 4.04 | % | | | | | | | | | | | | |
| | | | | | | | | | | | | | | | | | | | | | | | | | | | | | | | | | | | | | | | | |
Bouygues Telecom, S.A.(1) | | Tours, France | | Office | | Information | | Europe | | | 102,237 | | | | 1,327,973 | | | | 1.55 | % | | INSEE(2) | | September-09 | | September-12 |
Bouygues Telecom, S.A.(3) | | Illkirch-Graffenstaden, France | | Office | | Information | | Europe | | | 80,729 | | | | 2,130,425 | | | | 2.49 | % | | INSEE(2) | | December-08 | | July-13 |
| | | | | | | | | | | | | | | | | | | | | | | | | | | | | | | |
Bouygues Telecom, S.A. Total | | | | | | | | | | | | | | | | | | | 182,966 | | | | 3,458,398 | | | | 4.04 | % | | | | | | | | | | | | |
| | | | | | | | | | | | | | | | | | | | | | | | | | | | | | | | | | | | | | | | | |
| Quebecor Printing USA | | Doraville, GA | | Industrial | | Manufacturing | | South | | | 432,559 | | | | 1,940,625 | | | | 2.27 | % | | CPI | | December-09 | | December-34 |
| Quebecor Printing USA | | Olive Branch, MS | | Industrial | | Manufacturing | | South | | | 285,500 | | | | 1,186,578 | | | | 1.39 | % | | None | | June-08 | | June-33 |
| | | | | | | | | | | | | | | | | | | | | | | | | | | | | | | |
Quebecor Printing USA Total | | | | | | | | | | | | | | | | | | | 718,059 | | | | 3,127,203 | | | | 3.65 | % | | | | | | | | | | | | |
| | | | | | | | | | | | | | | | | | | | | | | | | | | | | | | | | | | | | | | | | |
| Orbital Sciences Corporation | | Chandler, AZ | | Industrial | | Manufacturing | | West | | | 335,307 | | | | 3,022,947 | | | | 3.53 | % | | CPI | | September-09 | | September-29 |
| | | | | | | | | | | | | | | | | | | | | | | | | | | | | | | |
Orbital Sciences Corporation Total | | | | | | | | | | | | | | | | | | | 335,307 | | | | 3,022,947 | | | | 3.53 | % | | | | | | | | | | | | |
| | | | | | | | | | | | | | | | | | | | | | | | | | | | | | | | | | | | | | | | | |
Federal Express Corporation (5) | | Collierville, TN | | Office | | Transportation and Warehousing | | South | | | 39,038 | | | | 679,162 | | | | 0.79 | % | | CPI | | August-19 | | August-39 |
Federal Express Corporation (5) | | Collierville, TN | | Office | | Transportation and Warehousing | | South | | | 39,038 | | | | 679,162 | | | | 0.79 | % | | CPI | | August-19 | | August-39 |
Federal Express Corporation (5) | | Collierville, TN | | Office | | Transportation and Warehousing | | South | | | 39,038 | | | | 679,162 | | | | 0.79 | % | | CPI | | August-19 | | August-39 |
Federal Express Corporation (5) | | Collierville, TN | | Office | | Transportation and Warehousing | | South | | | 39,038 | | | | 679,162 | | | | 0.79 | % | | CPI | | August-19 | | August-39 |
Federal Express Corporation (5) | | College Station, TX | | Warehouse/Distribution | | Transportation and Warehousing | | South | | | 12,080 | | | | 68,400 | | | | 0.08 | % | | Stated | | April-07 | | January-09 |
Federal Express Corporation (5) | | Corpus Christi, TX | | Warehouse/Distribution | | Transportation and Warehousing | | South | | | 30,212 | | | | 201,037 | | | | 0.23 | % | | Stated | | May-07 | | May-12 |
| | | | | | | | | | | | | | | | | | | | | | | | | | | | | | | |
Federal Express Corporation Total | | | | | | | | | | | | | | | | | | | 198,444 | | | | 2,986,085 | | | | 3.49 | % | | | | | | | | | | | | |
| | | | | | | | | | | | | | | | | | | | | | | | | | | | | | | | | | | | | | | | | |
| Titan Corporation, The | | San Diego, CA | | Office | | Manufacturing | | West | | | 166,403 | | | | 2,862,068 | | | | 3.34 | % | | CPI | | July-07 | | July-32 |
| | | | | | | | | | | | | | | | | | | | | | | | | | | | | | | |
Titan Corporation, The Total | | | | | | | | | | | | | | | | | | | 166,403 | | | | 2,862,068 | | | | 3.34 | % | | | | | | | | | | | | |
| | | | | | | | | | | | | | | | | | | | | | | | | | | | | | | | | | | | | | | | | |
America West Holdings Corporation(6) | | Tempe, AZ | | Office | | Transportation and Warehousing | | West | | | 167,913 | | | | 2,837,889 | | | | 3.32 | % | | CPI | | April-14 | | April-24 |
| | | | | | | | | | | | | | | | | | | | | | | | | | | | | | | |
America West Holdings Corporation Total | | | | | | | | | | | | | | | | | | | 167,913 | | | | 2,837,889 | | | | 3.32 | % | | | | | | | | | | | | |
| | | | | | | | | | | | | | | | | | | | | | | | | | | | | | | | | | | | | | | | | |
CheckFree Holdings, Inc. (7) | | Norcross, GA | | Office | | Information | | South | | | 50,063 | | | | 877,937 | | | | 1.03 | % | | CPI | | December-15 | | December-30 |
CheckFree Holdings, Inc. (7) | | Norcross, GA | | Office | | Information | | South | | | 34,150 | | | | 739,790 | | | | 0.86 | % | | CPI | | December-15 | | December-30 |
CheckFree Holdings, Inc. (7) | | Norcross, GA | | Office | | Information | | South | | | 26,125 | | | | 567,053 | | | | 0.66 | % | | CPI | | December-15 | | December-30 |
CheckFree Holdings, Inc. (7) | | Norcross, GA | | Office | | Information | | South | | | 0 | | | | 62,368 | | | | 0.07 | % | | CPI | | December-15 | | December-30 |
| | | | | | | | | | | | | | | | | | | | | | | | | | | | | | | |
CheckFree Holdings, Inc. Total | | | | | | | | | | | | | | | | | | | 110,338 | | | | 2,247,148 | | | | 2.63 | % | | | | | | | | | | | | |
| | | | |
| | | | | |
| Ticker: WPC | | | | www.wpcarey.com |
EXHIBIT E
| | | | | | | | | | | | | | | | | | | | | | | | | | | | | | | | | | | | | | | | | |
| | | | | | | | | | | | | | | | | | | | | | | Percentage of | | | Increase | | | Lease | | | Maximum | | | | |
| Tenant/Lease Guarantor | | Property Location | | | Property Type | | | Tenant Type | | | Region | | | Square Footage | | | Annual Rent | | | Total Rent | | | Factor | | | Expiration | | | Term | |
| |
| | | | | | | | | | | | | | | | | | | | | | | | | | | | | | | | | | | | | | | | | |
| AutoZone, Inc. | | Decatur, AL | | Retail | | Retail Trade | | South | | | 5,400 | | | | 44,620 | | | | 0.05 | % | | % Sales | | February-11 | | February-26 |
| AutoZone, Inc. | | Bessemer, AL | | Retail | | Retail Trade | | South | | | 5,400 | | | | 32,158 | | | | 0.04 | % | | % Sales | | February-11 | | February-26 |
| AutoZone, Inc. | | Phenix City, AL | | Retail | | Retail Trade | | South | | | 5,400 | | | | 44,620 | | | | 0.05 | % | | % Sales | | February-11 | | February-26 |
| AutoZone, Inc. | | Mobile, AL | | Retail | | Retail Trade | | South | | | 5,400 | | | | 44,620 | | | | 0.05 | % | | % Sales | | February-11 | | February-26 |
| AutoZone, Inc. | | Chickasaw, AL | | Retail | | Retail Trade | | South | | | 5,400 | | | | 43,414 | | | | 0.05 | % | | % Sales | | February-11 | | February-26 |
| AutoZone, Inc. | | Montgomery, AL | | Retail | | Retail Trade | | South | | | 5,400 | | | | 43,414 | | | | 0.05 | % | | % Sales | | February-11 | | February-26 |
| AutoZone, Inc. | | Panama City, FL | | Retail | | Retail Trade | | South | | | 5,401 | | | | 35,345 | | | | 0.04 | % | | % Sales | | August-12 | | August-37 |
| AutoZone, Inc. | | Jacksonville, FL | | Retail | | Retail Trade | | South | | | 5,000 | | | | 34,867 | | | | 0.04 | % | | % Sales | | August-12 | | August-37 |
| AutoZone, Inc. | | Jacksonville, FL | | Retail | | Retail Trade | | South | | | 5,400 | | | | 47,772 | | | | 0.06 | % | | % Sales | | August-13 | | August-37 |
| AutoZone, Inc. | | Jacksonville, FL | | Retail | | Retail Trade | | South | | | 5,400 | | | | 54,379 | | | | 0.06 | % | | % Sales | | August-13 | | August-37 |
| AutoZone, Inc. | | Columbus, GA | | Retail | | Retail Trade | | South | | | 5,400 | | | | 43,414 | | | | 0.05 | % | | % Sales | | February-11 | | February-26 |
| AutoZone, Inc. | | Albany, GA | | Retail | | Retail Trade | | South | | | 5,400 | | | | 43,262 | | | | 0.05 | % | | % Sales | | August-13 | | August-37 |
| AutoZone, Inc. | | Brunswick, GA | | Retail | | Retail Trade | | South | | | 5,400 | | | | 39,854 | | | | 0.05 | % | | % Sales | | August-13 | | August-37 |
| AutoZone, Inc. | | Augusta, GA | | Retail | | Retail Trade | | South | | | 5,400 | | | | 34,138 | | | | 0.04 | % | | % Sales | | August-13 | | August-37 |
| AutoZone, Inc. | | Macon, GA | | Retail | | Retail Trade | | South | | | 5,400 | | | | 49,503 | | | | 0.06 | % | | % Sales | | August-13 | | August-37 |
| AutoZone, Inc. | | Collinsville, IL | | Retail | | Retail Trade | | Midwest | | | 5,400 | | | | 36,178 | | | | 0.04 | % | | % Sales | | February-11 | | February-26 |
| AutoZone, Inc. | | Alton, IL | | Retail | | Retail Trade | | Midwest | | | 5,400 | | | | 44,620 | | | | 0.05 | % | | % Sales | | February-11 | | February-26 |
| AutoZone, Inc. | | Wood River, IL | | Retail | | Retail Trade | | Midwest | | | 5,400 | | | | 36,178 | | | | 0.04 | % | | % Sales | | February-11 | | February-26 |
| AutoZone, Inc. | | Belleville, IL | | Retail | | Retail Trade | | Midwest | | | 5,400 | | | | 44,620 | | | | 0.05 | % | | % Sales | | February-11 | | February-26 |
| AutoZone, Inc. | | West Monroe, LA | | Retail | | Retail Trade | | South | | | 5,400 | | | | 43,414 | | | | 0.05 | % | | % Sales | | February-11 | | February-26 |
| AutoZone, Inc. | | Baton Rouge, LA | | Retail | | Retail Trade | | South | | | 5,400 | | | | 43,414 | | | | 0.05 | % | | % Sales | | February-11 | | February-26 |
| AutoZone, Inc. | | Lake Charles, LA | | Retail | | Retail Trade | | South | | | 6,480 | | | | 43,414 | | | | 0.05 | % | | % Sales | | February-11 | | February-26 |
| AutoZone, Inc. | | Lake Charles, LA | | Retail | | Retail Trade | | South | | | 6,480 | | | | 43,414 | | | | 0.05 | % | | % Sales | | February-11 | | February-26 |
| AutoZone, Inc. | | Baton Rouge, LA | | Retail | | Retail Trade | | South | | | 6,600 | | | | 21,567 | | | | 0.03 | % | | % Sales | | March-09 | | March-14 |
| AutoZone, Inc. | | Baton Rouge, LA | | Retail | | Retail Trade | | South | | | 5,401 | | | | 23,124 | | | | 0.03 | % | | % Sales | | April-09 | | April-09 |
| AutoZone, Inc. | | Hammond, LA | | Retail | | Retail Trade | | South | | | 6,480 | | | | 40,121 | | | | 0.05 | % | | % Sales | | August-12 | | August-37 |
| AutoZone, Inc. | | Maplewood, MO | | Retail | | Retail Trade | | Midwest | | | 6,480 | | | | 43,414 | | | | 0.05 | % | | % Sales | | February-11 | | February-26 |
| AutoZone, Inc. | | Overland, MO | | Retail | | Retail Trade | | Midwest | | | 6,480 | | | | 43,414 | | | | 0.05 | % | | % Sales | | February-11 | | February-26 |
| AutoZone, Inc. | | St. Louis, MO | | Retail | | Retail Trade | | Midwest | | | 5,400 | | | | 36,178 | | | | 0.04 | % | | % Sales | | February-11 | | February-26 |
| AutoZone, Inc. | | Breckenridge, MO | | Retail | | Retail Trade | | Midwest | | | 5,400 | | | | 44,151 | | | | 0.05 | % | | % Sales | | February-11 | | February-26 |
| AutoZone, Inc. | | St. Peters, MO | | Retail | | Retail Trade | | Midwest | | | 5,400 | | | | 48,957 | | | | 0.06 | % | | % Sales | | August-12 | | August-37 |
| AutoZone, Inc. | | St. Peters, MO | | Retail | | Retail Trade | | Midwest | | | 6,660 | | | | 48,718 | | | | 0.06 | % | | % Sales | | August-12 | | August-37 |
| AutoZone, Inc. | | Gastonia, NC | | Retail | | Retail Trade | | East | | | 5,400 | | | | 52,149 | | | | 0.06 | % | | % Sales | | January-11 | | January-26 |
| AutoZone, Inc. | | Charlotte, NC | | Retail | | Retail Trade | | East | | | 5,400 | | | | 42,283 | | | | 0.05 | % | | % Sales | | January-11 | | January-26 |
| AutoZone, Inc. | | Statesville, NC | | Retail | | Retail Trade | | East | | | 5,400 | | | | 50,739 | | | | 0.06 | % | | % Sales | | January-11 | | January-26 |
| AutoZone, Inc. | | Lenoir, NC | | Retail | | Retail Trade | | East | | | 5,400 | | | | 50,739 | | | | 0.06 | % | | % Sales | | January-11 | | January-26 |
| AutoZone, Inc. | | Shelby, NC | | Retail | | Retail Trade | | East | | | 6,660 | | | | 30,807 | | | | 0.04 | % | | % Sales | | August-12 | | August-38 |
| AutoZone, Inc. | | Kannapolis, NC | | Retail | | Retail Trade | | East | | | 6,408 | | | | 24,069 | | | | 0.03 | % | | % Sales | | October-10 | | March-35 |
| AutoZone, Inc. | | Morgantown, NC | | Retail | | Retail Trade | | East | | | 5,400 | | | | 19,451 | | | | 0.02 | % | | % Sales | | October-10 | | March-35 |
| AutoZone, Inc. | | Albuquerque, NM | | Retail | | Retail Trade | | West | | | 5,400 | | | | 54,642 | | | | 0.06 | % | | % Sales | | August-13 | | March-35 |
| AutoZone, Inc. | | Farmington, NM | | Retail | | Retail Trade | | West | | | 5,400 | | | | 41,479 | | | | 0.05 | % | | % Sales | | August-13 | | August-13 |
| AutoZone, Inc. | | Lexington, SC | | Retail | | Retail Trade | | East | | | 5,400 | | | | 50,079 | | | | 0.06 | % | | % Sales | | August-13 | | June-08 |
| AutoZone, Inc. | | East Ridge, TN | | Retail | | Retail Trade | | South | | | 6,480 | | | | 20,602 | | | | 0.02 | % | | % Sales | | October-08 | | October-13 |
| AutoZone, Inc. | | Knoxville, TN | | Retail | | Retail Trade | | South | | | 6,660 | | | | 23,008 | | | | 0.03 | % | | % Sales | | May-09 | | May-09 |
| AutoZone, Inc. | | Austin, TX | | Retail | | Retail Trade | | South | | | 4,000 | | | | 31,321 | | | | 0.04 | % | | % Sales | | January-11 | | January-26 |
| AutoZone, Inc. | | Waco, TX | | Retail | | Retail Trade | | South | | | 4,800 | | | | 37,585 | | | | 0.04 | % | | % Sales | | January-11 | | January-26 |
| AutoZone, Inc. | | Corpus Christi, TX | | Retail | | Retail Trade | | South | | | 6,600 | | | | 51,679 | | | | 0.06 | % | | % Sales | | January-11 | | January-26 |
| AutoZone, Inc. | | Corpus Christi, TX | | Retail | | Retail Trade | | South | | | 6,480 | | | | 50,739 | | | | 0.06 | % | | % Sales | | January-11 | | January-26 |
| AutoZone, Inc. | | Victoria, TX | | Retail | | Retail Trade | | South | | | 6,480 | | | | 50,739 | | | | 0.06 | % | | % Sales | | January-11 | | January-26 |
| AutoZone, Inc. | | San Antonio, TX | | Retail | | Retail Trade | | South | | | 5,400 | | | | 42,283 | | | | 0.05 | % | | % Sales | | January-11 | | January-26 |
| AutoZone, Inc. | | Nederland, TX | | Retail | | Retail Trade | | South | | | 4,000 | | | | 31,321 | | | | 0.04 | % | | % Sales | | January-11 | | January-26 |
| AutoZone, Inc. | | West Orange, TX | | Retail | | Retail Trade | | South | | | 4,000 | | | | 31,321 | | | | 0.04 | % | | % Sales | | January-11 | | January-26 |
| AutoZone, Inc. | | Houston, TX | | Retail | | Retail Trade | | South | | | 5,400 | | | | 53,488 | | | | 0.06 | % | | % Sales | | August-13 | | August-38 |
| AutoZone, Inc. | | San Antonio, TX | | Retail | | Retail Trade | | South | | | 5,400 | | | | 55,795 | | | | 0.07 | % | | % Sales | | August-13 | | August-38 |
| | | | | | | | | | | | | | | | | | | | | | | | | | | | | | | |
AutoZone, Inc. Total | | | | | | | | | | | | | | | | | | | 302,230 | | | | 2,216,594 | | | | 2.59 | % | | | | | | | | | | | | |
| | | | | | | | | | | | | | | | | | | | | | | | | | | | | | | | | | | | | | | | | |
| Lucent Technologies, Inc. | | Charlotte, NC | | Industrial | | Wholesale Trade | | East | | | 568,670 | | | | 1,941,727 | | | | 2.27 | % | | None | | March-07 | | March-20 |
| | | | | | | | | | | | | | | | | | | | | | | | | | | | | | | |
Lucent Technologies, Inc. Total | | | | | | | | | | | | | | | | | | | 568,670 | | | | 1,941,727 | | | | 2.27 | % | | | | | | | | | | | | |
| | | | | | | | | | | | | | | | | | | | | | | | | | | | | | | | | | | | | | | | | |
Information Resources, Inc. (8) | | Chicago, IL | | Office | | Professional, Scientific and Technical Servic | | es Midwest | | | 30,797 | | | | 683,141 | | | | 0.80 | % | | CPI | | October-13 | | October-23 |
Information Resources, Inc. (8) | | Chicago, IL | | Office | | Professional, Scientific and Technical Servic | | es Midwest | | | 53,195 | | | | 1,179,801 | | | | 1.38 | % | | CPI | | October-13 | | October-23 |
| | | | | | | | | | | | | | | | | | | | | | | | | | | | | | | |
Information Resources, Inc. Total | | | | | | | | | | | | | | | | | | | 83,992 | | | | 1,862,942 | | | | 2.18 | % | | | | | | | | | | | | |
| | | | | | | | | | | | | | | | | | | | | | | | | | | | | | | | | | | | | | | | | |
| Sybron Dental Specialties, Inc. (Apogent Technologies, Inc) | | Glendora, CA | | Office | | Manufacturing | | West | | | 25,000 | | | | 489,246 | | | | 0.57 | % | | CPI | | December-18 | | December-43 |
| Sybron Dental Specialties, Inc. (Apogent Technologies, Inc) | | Romulus, MI | | Industrial | | Manufacturing | | Midwest | | | 220,000 | | | | 1,281,052 | | | | 1.50 | % | | CPI | | December-18 | | December-43 |
| | | | | | | | | | | | | | | | | | | | | | | | | | | | | | | |
Sybron Dental Specialties, Inc. (Apogent Technologies, Inc) Total | | | | | | | | | | | | | | | | | | | 245,000 | | | | 1,770,298 | | | | 2.07 | % | | | | | | | | | | | | |
| | | | | | | | | | | | | | | | | | | | | | | | | | | | | | | | | | | | | | | | | |
| Unisource Worldwide, Inc. | | Anchorage, AK | | Warehouse/Distribution | | Wholesale Trade | | West | | | 44,712 | | | | 344,803 | | | | 0.40 | % | | Stated | | December-09 | | December-29 |
| Unisource Worldwide, Inc. | | Commerce, CA | | Warehouse/Distribution | | Wholesale Trade | | West | | | 411,561 | | | | 1,422,080 | | | | 1.66 | % | | Stated | | April-10 | | April-30 |
| | | | | | | | | | | | | | | | | | | | | | | | | | | | | | | |
Unisource Worldwide, Inc. Total | | | | | | | | | | | | | | | | | | | 456,273 | | | | 1,766,883 | | | | 2.06 | % | | | | | | | | | | | | |
| | | | |
| | | | | |
| Ticker: WPC | | | | www.wpcarey.com |
EXHIBIT E
| | | | | | | | | | | | | | | | | | | | | | | | | | | | | | | | | | | | | | | | | |
| | | | | | | | | | | | | | | | | | | | | | | Percentage of | | | Increase | | | Lease | | | Maximum | | | | |
| Tenant/Lease Guarantor | | Property Location | | | Property Type | | | Tenant Type | | | Region | | | Square Footage | | | Annual Rent | | | Total Rent | | | Factor | | | Expiration | | | Term | |
| |
| | | | | | | | | | | | | | | | | | | | | | | | | | | | | | | | | | | | | | | | | |
| CSS Industries, Inc. (Cleo, Inc) | | Memphis, TN | | Warehouse/Distribution | | Accomodation and Food Services | | South | | | 1,006,170 | | | | 1,735,352 | | | | 2.03 | % | | CPI | | December-10 | | December-15 |
| | | | | | | | | | | | | | | | | | | | | | | | | | | | | | | |
CSS Industries, Inc. (Cleo, Inc) Total | | | | | | | | | | | | | | | | | | | 1,006,170 | | | | 1,735,352 | | | | 2.03 | % | | | | | | | | | | | | |
| | | | | | | | | | | | | | | | | | | | | | | | | | | | | | | | | | | | | | | | | |
| Brodart Company | | Williamsport, PA | | Industrial | | Wholesale Trade | | East | | | 309,030 | | | | 1,015,205 | | | | 1.19 | % | | CPI | | June-08 | | June-28 |
| Brodart Company | | Williamsport, PA | | Industrial | | Wholesale Trade | | East | | | 212,210 | | | | 705,481 | | | | 0.82 | % | | CPI | | June-08 | | June-28 |
| | | | | | | | | | | | | | | | | | | | | | | | | | | | | | | |
Brodart Company Total | | | | | | | | | | | | | | | | | | | 521,240 | | | | 1,720,686 | | | | 2.01 | % | | | | | | | | | | | | |
| | | | | | | | | | | | | | | | | | | | | | | | | | | | | | | | | | | | | | | | | |
| SICOR, Inc. | | San Diego, CA | | Office | | Manufacturing | | West | | | 35,951 | | | | 835,705 | | | | 0.98 | % | | CPI | | July-09 | | July-49 |
| SICOR, Inc. | | San Diego, CA | | Office | | Manufacturing | | West | | | 36,205 | | | | 835,705 | | | | 0.98 | % | | CPI | | July-09 | | July-49 |
| | | | | | | | | | | | | | | | | | | | | | | | | | | | | | | |
SICOR, Inc. Total | | | | | | | | | | | | | | | | | | | 72,156 | | | | 1,671,410 | | | | 1.95 | % | | | | | | | | | | | | |
| | | | | | | | | | | | | | | | | | | | | | | | | | | | | | | | | | | | | | | | | |
| Fiskars, Inc. (aka enviroWorks) | | Apopka, FL | | Industrial | | Manufacturing | | South | | | 260,160 | | | | 1,125,458 | | | | 1.32 | % | | CPI | | March-10 | | March-35 |
| Fiskars, Inc. (aka enviroWorks) | | Apopka, FL | | Industrial | | Manufacturing | | South | | | 109,377 | | | | 473,143 | | | | 0.55 | % | | CPI | | March-10 | | March-35 |
| Fiskars, Inc. (aka enviroWorks) | | Apopka, FL | | Industrial | | Manufacturing | | South | | | 5,292 | | | | 22,863 | | | | 0.03 | % | | CPI | | March-10 | | March-35 |
| | | | | | | | | | | | | | | | | | | | | | | | | | | | | | | |
Fiskars, Inc. (aka enviroWorks) Total | | | | | | | | | | | | | | | | | | | 374,829 | | | | 1,621,464 | | | | 1.89 | % | | | | | | | | | | | | |
| | | | | | | | | | | | | | | | | | | | | | | | | | | | | | | | | | | | | | | | | |
| BE Aerospace, Inc. | | Lenexa, KA | | Office | | Manufacturing | | Midwest | | | 130,094 | | | | 617,799 | | | | 0.72 | % | | Stated | | September-17 | | September-37 |
| BE Aerospace, Inc. | | Winston-Salem, NC | | Industrial | | Manufacturing | | East | | | 90,800 | | | | 248,458 | | | | 0.29 | % | | Stated | | September-17 | | September-37 |
| BE Aerospace, Inc. | | Winston-Salem, NC | | Industrial | | Manufacturing | | East | | | 74,026 | | | | 202,553 | | | | 0.24 | % | | Stated | | September-17 | | September-37 |
| BE Aerospace, Inc. | | Winston-Salem, NC | | Industrial | | Manufacturing | | East | | | 50,200 | | | | 137,364 | | | | 0.16 | % | | Stated | | September-17 | | September-37 |
| BE Aerospace, Inc. | | Winston-Salem, NC | | Office | | Manufacturing | | East | | | 43,788 | | | | 119,813 | | | | 0.14 | % | | Stated | | September-17 | | September-37 |
| BE Aerospace, Inc. | | Winston-Salem, NC | | Industrial | | Manufacturing | | East | | | 15,402 | | | | 42,146 | | | | 0.05 | % | | Stated | | September-17 | | September-37 |
| BE Aerospace, Inc. | | Dallas, TX | | Office | | Manufacturing | | South | | | 22,680 | | | | 117,676 | | | | 0.14 | % | | Stated | | September-17 | | September-37 |
| | | | | | | | | | | | | | | | | | | | | | | | | | | | | | | |
BE Aerospace, Inc. Total | | | | | | | | | | | | | | | | | | | 426,990 | | | | 1,485,809 | | | | 1.74 | % | | | | | | | | | | | | |
| | | | | | | | | | | | | | | | | | | | | | | | | | | | | | | | | | | | | | | | | |
| Sprint Spectrum, L.P. | | Rio Rancho, NM | | Office | | Information | | West | | | 94,730 | | | | 1,424,561 | | | | 1.66 | % | | None | | May-11 | | May-21 |
| | | | | | | | | | | | | | | | | | | | | | | | | | | | | | | |
Sprint Spectrum, L.P. Total | | | | | | | | | | | | | | | | | | | 94,730 | | | | 1,424,561 | | | | 1.66 | % | | | | | | | | | | | | |
| | | | | | | | | | | | | | | | | | | | | | | | | | | | | | | | | | | | | | | | | |
| Amerisure Mutual Insurance Co. | | Charleston, SC | | Office | | Finance and Insurance | | East | | | 67,160 | | | | 729,195 | | | | 0.85 | % | | None | | December-07 | | December-28 |
| Amerisure Mutual Insurance Co. | | Charleston, SC | | Office | | Finance and Insurance | | East | | | 22,557 | | | | 246,235 | | | | 0.29 | % | | None | | December-07 | | December-28 |
| Amerisure Mutual Insurance Co. | | Charleston, SC | | Office | | Finance and Insurance | | East | | | 38,037 | | | | 406,826 | | | | 0.48 | % | | None | | December-07 | | December-28 |
| | | | | | | | | | | | | | | | | | | | | | | | | | | | | | | |
Amerisure Mutual Insurance Co. Total | | | | | | | | | | | | | | | | | | | 127,754 | | | | 1,382,256 | | | | 1.62 | % | | | | | | | | | | | | |
| | | | | | | | | | | | | | | | | | | | | | | | | | | | | | | | | | | | | | | | | |
| BellSouth Telecommunications | | Lafayette, LA | | Office | | Information | | South | | | 66,846 | | | | 1,351,150 | | | | 1.58 | % | | Stated | | December-09 | | December-39 |
| | | | | | | | | | | | | | | | | | | | | | | | | | | | | | | |
BellSouth Telecommunications Total | | | | | | | | | | | | | | | | | | | 66,846 | | | | 1,351,150 | | | | 1.58 | % | | | | | | | | | | | | |
| | | | | | | | | | | | | | | | | | | | | | | | | | | | | | | | | | | | | | | | | |
| Lowe’s Home Improvement Warehouse | | Bellevue, WA | | Retail | | Wholesale Trade | | West | | | 143,352 | | | | 1,335,411 | | | | 1.56 | % | | CPI & % Sales | | August-18 | | August-18 |
| | | | | | | | | | | | | | | | | | | | | | | | | | | | | | | |
Lowe’s Home Improvement Warehouse Total | | | | | | | | | | | | | | | | | | | 143,352 | | | | 1,335,411 | | | | 1.56 | % | | | | | | | | | | | | |
| | | | | | | | | | | | | | | | | | | | | | | | | | | | | | | | | | | | | | | | | |
| AT&T Corporation | | Bridgeton, MO | | Industrial | | Information | | Midwest | | | 85,510 | | | | 1,257,410 | | | | 1.47 | % | | Stated | | September-11 | | September-21 |
| | | | | | | | | | | | | | | | | | | | | | | | | | | | | | | |
AT&T Corporation Total | | | | | | | | | | | | | | | | | | | 85,510 | | | | 1,257,410 | | | | 1.47 | % | | | | | | | | | | | | |
| | | | | | | | | | | | | | | | | | | | | | | | | | | | | | | | | | | | | | | | | |
| Swat-Fame, Inc. (City of Industry, CA) | | City of Industry, CA | | Industrial | | Manufacturing | | West | | | 92,595 | | | | 292,781 | | | | 0.34 | % | | Stated | | July-06 | | July-08 |
| Swat-Fame, Inc. (City of Industry, CA) | | City of Industry, CA | | Industrial | | Manufacturing | | West | | | 233,205 | | | | 949,663 | | | | 1.11 | % | | CPI | | December-10 | | December-20 |
| | | | | | | | | | | | | | | | | | | | | | | | | | | | | | | |
Swat-Fame, Inc. (City of Industry, CA) Total | | | | | | | | | | | | | | | | | | | 325,800 | | | | 1,242,444 | | | | 1.45 | % | | | | | | | | | | | | |
| | | | | | | | | | | | | | | | | | | | | | | | | | | | | | | | | | | | | | | | | |
| United States Postal Service (Bloomington, IL) | | Bloomingdale, IL | | Office | | Transportation and Warehousing | | Midwest | | | 60,000 | | | | 1,233,000 | | | | 1.44 | % | | Stated | | April-11 | | | N/A | |
| | | | | | | | | | | | | | | | | | | | | | | | | | | | | | | |
United States Postal Service (Bloomington, IL) Total | | | | | | | | | | | | | | | | | | | 60,000 | | | | 1,233,000 | | | | 1.44 | % | | | | | | | | | | | | |
| | | | | | | | | | | | | | | | | | | | | | | | | | | | | | | | | | | | | | | | | |
| Livho Inc. | | Livonia, MI | | Hospitality | | Accomodation and Food Services | | Midwest | | | 158,000 | | | | 1,200,000 | | | | 1.40 | % | | Stated | | January-07 | | January-08 |
| | | | | | | | | | | | | | | | | | | | | | | | | | | | | | | |
Livho Inc. Total | | | | | | | | | | | | | | | | | | | 158,000 | | | | 1,200,000 | | | | 1.40 | % | | | | | | | | | | | | |
| | | | | | | | | | | | | | | | | | | | | | | | | | | | | | | | | | | | | | | | | |
Hologic, Inc. (9) | | Danbury, CT | | Industrial | | Manufacturing | | East | | | 22,335 | | | | 210,526 | | | | 0.25 | % | | CPI | | August-22 | | August-42 |
Hologic, Inc. (9) | | Bedford, MA | | Industrial | | Manufacturing | | East | | | 74,520 | | | | 925,612 | | | | 1.08 | % | | CPI | | August-22 | | August-42 |
| | | | | | | | | | | | | | | | | | | | | | | | | | | | | | | |
Hologic, Inc. Total | | | | | | | | | | | | | | | | | | | 96,855 | | | | 1,136,138 | | | | 1.33 | % | | | | | | | | | | | | |
| | | | | | | | | | | | | | | | | | | | | | | | | | | | | | | | | | | | | | | | | |
| Anthony’s Manufacturing Company, Inc. | | San Fernando, CA | | Industrial | | Wholesale Trade | | West | | | 7,220 | | | | 43,127 | | | | 0.05 | % | | CPI/Market | | May-12 | | May-12 |
| Anthony’s Manufacturing Company, Inc. | | San Fernando, CA | | Industrial | | Wholesale Trade | | West | | | 40,285 | | | | 240,527 | | | | 0.28 | % | | CPI/Market | | May-12 | | May-12 |
| Anthony’s Manufacturing Company, Inc. | | San Fernando, CA | | Industrial | | Wholesale Trade | | West | | | 39,920 | | | | 238,343 | | | | 0.28 | % | | CPI/Market | | May-12 | | May-12 |
| Anthony’s Manufacturing Company, Inc. | | San Fernando, CA | | Industrial | | Wholesale Trade | | West | | | 95,420 | | | | 569,819 | | | | 0.67 | % | | CPI/Market | | May-12 | | May-12 |
| | | | | | | | | | | | | | | | | | | | | | | | | | | | | | | |
Anthony’s Manufacturing Company, Inc. Total | | | | | | | | | | | | | | | | | | | 182,845 | | | | 1,091,816 | | | | 1.28 | % | | | | | | | | | | | | |
| | | | | | | | | | | | | | | | | | | | | | | | | | | | | | | | | | | | | | | | | |
| Omnicom Group, Inc. | | Venice, CA | | Office | | Professional, Scientific and Technical Servic | | es West | | | 77,719 | | | | 1,082,685 | | | | 1.27 | % | | Stated | | September-10 | | September-30 |
| | | | | | | | | | | | | | | | | | | | | | | | | | | | | | | |
Omnicom Group, Inc. Total | | | | | | | | | | | | | | | | | | | 77,719 | | | | 1,082,685 | | | | 1.27 | % | | | | | | | | | | | | |
| | | | | | | | | | | | | | | | | | | | | | | | | | | | | | | | | | | | | | | | | |
| Lockheed Martin Corporation | | King of Prussia, PA | | Office | | Professional, Scientific and Technical Servic | | es East | | | 84,926 | | | | 797,202 | | | | 0.93 | % | | Stated | | July-08 | | July-13 |
| Lockheed Martin Corporation | | Houston, TX | | Industrial | | Professional, Scientific and Technical Servic | | es South | | | 30,176 | | | | 241,416 | | | | 0.28 | % | | Stated | | December-07 | | December-09 |
| | | | | | | | | | | | | | | | | | | | | | | | | | | | | | | |
Lockheed Martin Corporation Total | | | | | | | | | | | | | | | | | | | 115,102 | | | | 1,038,618 | | | | 1.21 | % | | | | | | | | | | | | |
| | | | |
| | | | | |
| Ticker: WPC | | | | www.wpcarey.com |
EXHIBIT E
| | | | | | | | | | | | | | | | | | | | | | | | | | | | | | | | | | | | | | | | | |
| | | | | | | | | | | | | | | | | | | | | | | Percentage of | | | Increase | | | Lease | | | Maximum | | | | |
| Tenant/Lease Guarantor | | Property Location | | | Property Type | | | Tenant Type | | | Region | | | Square Footage | | | Annual Rent | | | Total Rent | | | Factor | | | Expiration | | | Term | |
| |
| | | | | | | | | | | | | | | | | | | | | | | | | | | | | | | | | | | | | | | | | |
| Werner Co. | | Erlanger, KY | | Warehouse/Distribution | | Manufacturing | | East | | | 409,600 | | | | 762,048 | | | | 0.89 | % | | CPI | | July-15 | | July-21 |
| Werner Co. | | Erlanger, KY | | Warehouse/Distribution | | Manufacturing | | East | | | 162,604 | | | | 274,365 | | | | 0.32 | % | | CPI | | July-15 | | July-21 |
| | | | | | | | | | | | | | | | | | | | | | | | | | | | | | | |
Werner Co. Total | | | | | | | | | | | | | | | | | | | 572,204 | | | | 1,036,413 | | | | 1.21 | % | | | | | | | | | | | | |
| | | | | | | | | | | | �� | | | | | | | | | | | | | | | | | | | | | | | | | | | | | |
| United Stationers Supply Company | | New Orleans, LA | | Warehouse/Distribution | | Wholesale Trade | | South | | | 59,000 | | | | 366,539 | | | | 0.43 | % | | CPI | | March-10 | | March-30 |
| United Stationers Supply Company | | Memphis, TN | | Warehouse/Distribution | | Wholesale Trade | | South | | | 75,000 | | | | 317,385 | | | | 0.37 | % | | CPI | | March-10 | | March-30 |
| United Stationers Supply Company | | San Antonio, TX | | Warehouse/Distribution | | Wholesale Trade | | South | | | 63,098 | | | | 350,913 | | | | 0.41 | % | | CPI | | March-10 | | March-30 |
| | | | | | | | | | | | | | | | | | | | | | | | | | | | | | | |
United Stationers Supply Company Total | | | | | | | | | | | | | | | | | | | 197,098 | | | | 1,034,837 | | | | 1.21 | % | | | | | | | | | | | | |
| | | | | | | | | | | | | | | | | | | | | | | | | | | | | | | | | | | | | | | | | |
| United Space Alliance LLC | | Webster, TX | | Warehouse/Distribution | | Professional, Scientific and Technical Servic | | es South | | | 88,200 | | | | 505,020 | | | | 0.59 | % | | Stated | | September-06 | | September-15 |
| United Space Alliance LLC | | Houston, TX | | Industrial | | Professional, Scientific and Technical Servic | | es South | | | 38,150 | | | | 381,500 | | | | 0.45 | % | | Stated | | April-06 | | April-11 |
| United Space Alliance LLC | | Houston, TX | | Industrial | | Professional, Scientific and Technical Servic | | es South | | | 7,151 | | | | 71,508 | | | | 0.08 | % | | None | | April-06 | | April-06 |
| United Space Alliance LLC | | Houston, TX | | Industrial | | Professional, Scientific and Technical Servic | | es South | | | 6,104 | | | | 61,040 | | | | 0.07 | % | | Stated | | April-06 | | April-06 |
| | | | | | | | | | | | | | | | | | | | | | | | | | | | | | | |
United Space Alliance LLC Total | | | | | | | | | | | | | | | | | | | 139,605 | | | | 1,019,068 | | | | 1.19 | % | | | | | | | | | | | | |
| | | | | | | | | | | | | | | | | | | | | | | | | | | | | | | | | | | | | | | | | |
| GATX Logistics, Inc. (aka Sears logistics services) | | Jacksonville, FL | | Warehouse/Distribution | | Wholesale Trade | | South | | | 240,000 | | | | 969,946 | | | | 1.13 | % | | None | | September-07 | | September-07 |
| | | | | | | | | | | | | | | | | | | | | | | | | | | | | | | |
GATX Logistics, Inc. (aka Sears logistics services) Total | | | | | | | | | | | | | | | | | | | 240,000 | | | | 969,946 | | | | 1.13 | % | | | | | | | | | | | | |
| | | | | | | | | | | | | | | | | | | | | | | | | | | | | | | | | | | | | | | | | |
| Wal-Mart Stores, Inc. | | West Mifflin, PA | | Retail | | Retail Trade | | East | | | 118,125 | | | | 950,905 | | | | 1.11 | % | | CPI | | January-07 | | January-37 |
| | | | | | | | | | | | | | | | | | | | | | | | | | | | | | | |
Wal-Mart Stores, Inc. Total | | | | | | | | | | | | | | | | | | | 118,125 | | | | 950,905 | | | | 1.11 | % | | | | | | | | | | | | |
| | | | | | | | | | | | | | | | | | | | | | | | | | | | | | | | | | | | | | | | | |
| Pre Finish Metals, Inc. | | Walbridge, OH | | Industrial | | Manufacturing | | Midwest | | | 313,704 | | | | 892,091 | | | | 1.04 | % | | CPI | | June-08 | | June-28 |
| | | | | | | | | | | | | | | | | | | | | | | | | | | | | | | |
Pre Finish Metals, Inc. Total | | | | | | | | | | | | | | | | | | | 313,704 | | | | 892,091 | | | | 1.04 | % | | | | | | | | | | | | |
| | | | | | | | | | | | | | | | | | | | | | | | | | | | | | | | | | | | | | | | | |
| NVR L.P. (aka NV Ryan, Inc.) | | Thurmont, MD | | Industrial | | Construction | | East | | | 150,468 | | | | 687,992 | | | | 0.80 | % | | CPI | | March-14 | | March-39 |
| NVR L.P. (aka NV Ryan, Inc.) | | Farmington, NY | | Industrial | | Construction | | East | | | 29,273 | | | | 132,805 | | | | 0.16 | % | | CPI | | March-14 | | March-39 |
| | | | | | | | | | | | | | | | | | | | | | | | | | | | | | | |
NVR L.P. (aka NV Ryan, Inc.) Total | | | | | | | | | | | | | | | | | | | 179,741 | | | | 820,797 | | | | 0.96 | % | | | | | | | | | | | | |
| | | | | | | | | | | | | | | | | | | | | | | | | | | | | | | | | | | | | | | | | |
| Hibbett Sporting Goods, Inc. | | Birmingham, AL | | Warehouse/Distribution | | Retail Trade | | South | | | 219,312 | | | | 819,935 | | | | 0.96 | % | | CPI | | December-14 | | December-29 |
| | | | | | | | | | | | | | | | | | | | | | | | | | | | | | | |
Hibbett Sporting Goods, Inc. Total | | | | | | | | | | | | | | | | | | | 219,312 | | | | 819,935 | | | | 0.96 | % | | | | | | | | | | | | |
| | | | | | | | | | | | | | | | | | | | | | | | | | | | | | | | | | | | | | | | | |
| AMS Holding Group (Vertafore, Inc.) | | College Station, TX | | Office | | Information | | South | | | 52,552 | | | | 765,101 | | | | 0.89 | % | | None | | December-09 | | December-09 |
| | | | | | | | | | | | | | | | | | | | | | | | | | | | | | | |
AMS Holding Group (Vertafore, Inc.) Total | | | | | | | | | | | | | | | | | | | 52,552 | | | | 765,101 | | | | 0.89 | % | | | | | | | | | | | | |
| | | | | | | | | | | | | | | | | | | | | | | | | | | | | | | | | | | | | | | | | |
| Powerware Corporation (aka Exide Electronics Corp.) | | Raleigh, NC | | Office | | Manufacturing | | East | | | 27,770 | | | | 730,215 | | | | 0.85 | % | | CPI | | July-06 | | July-31 |
| | | | | | | | | | | | | | | | | | | | | | | | | | | | | | | |
Powerware Corporation (aka Exide Electronics Corp.) Total | | | | | | | | | | | | | | | | | | | 27,770 | | | | 730,215 | | | | 0.85 | % | | | | | | | | | | | | |
| | | | | | | | | | | | | | | | | | | | | | | | | | | | | | | | | | | | | | | | | |
| BellSouth Entertainment, Inc. | | Ft. Lauderdale, FL | | Warehouse/Distribution | | Information | | South | | | 80,450 | | | | 576,372 | | | | 0.67 | % | | None | | June-09 | | June-19 |
| | | | | | | | | | | | | | | | | | | | | | | | | | | | | | | |
BellSouth Entertainment, Inc. Total | | | | | | | | | | | | | | | | | | | 80,450 | | | | 576,372 | | | | 0.67 | % | | | | | | | | | | | | |
| | | | | | | | | | | | | | | | | | | | | | | | | | | | | | | | | | | | | | | | | |
| Western Union Financial Services, Inc. | | Bridgeton, MO | | Office | | Finance and Insurance | | Midwest | | | 78,080 | | | | 573,221 | | | | 0.67 | % | | Stated | | November-06 | | November-11 |
| | | | | | | | | | | | | | | | | | | | | | | | | | | | | | | |
Western Union Financial Services, Inc. Total | | | | | | | | | | | | | | | | | | | 78,080 | | | | 573,221 | | | | 0.67 | % | | | | | | | | | | | | |
| | | | | | | | | | | | | | | | | | | | | | | | | | | | | | | | | | | | | | | | | |
| Deloro Stellite (DS) Group Ltd. Total | | Goshen, IN | | Industrial | | Manufacturing | | Midwest | | | 52,000 | | | | 563,715 | | | | 0.66 | % | | CPI | | February-10 | | February-35 |
| | | | | | | | | | | | | | | | | | | | | | | | | | | | | | | |
Deloro Stellite (DS) Group Ltd. Total Total | | | | | | | | | | | | | | | | | | | 52,000 | | | | 563,715 | | | | 0.66 | % | | | | | | | | | | | | |
| | | | | | | | | | | | | | | | | | | | | | | | | | | | | | | | | | | | | | | | | |
Aviva France (fka Tellit Assurances — Sun Alliance) (3) | | Rouen, France | | Office | | Finance and Insurance | | Europe | | | 27,593 | | | | 488,535 | | | | 0.57 | % | | INSEE(2) | | September-10 | | September-10 |
| | | | | | | | | | | | | | | | | | | | | | | | | | | | | | | |
Aviva France (fka Tellit Assurances — Sun Alliance) Total | | | | | | | | | | | | | | | | | | | 27,593 | | | | 488,535 | | | | 0.57 | % | | | | | | | | | | | | |
| | | | | | | | | | | | | | | | | | | | | | | | | | | | | | | | | | | | | | | | | |
Childtime Childcare, Inc. (10) | | Chandler, AZ | | Other Properties | | Health Care and Social Assistance | | West | | | 2,026 | | | | 32,259 | | | | 0.04 | % | | CPI | | January-16 | | January-41 |
Childtime Childcare, Inc. (10) | | Tucson, AZ | | Other Properties | | Health Care and Social Assistance | | West | | | 2,165 | | | | 33,628 | | | | 0.04 | % | | CPI | | January-16 | | January-41 |
Childtime Childcare, Inc. (10) | | Alhambra, CA | | Other Properties | | Health Care and Social Assistance | | West | | | 2,262 | | | | 48,506 | | | | 0.06 | % | | CPI | | January-16 | | January-41 |
Childtime Childcare, Inc. (10) | | Chino, CA | | Other Properties | | Health Care and Social Assistance | | West | | | 2,166 | | | | 42,366 | | | | 0.05 | % | | CPI | | January-16 | | January-41 |
Childtime Childcare, Inc. (10) | | Garden Grove, CA | | Other Properties | | Health Care and Social Assistance | | West | | | 2,848 | | | | 41,657 | | | | 0.05 | % | | CPI | | January-16 | | January-41 |
Childtime Childcare, Inc. (10) | | Tustin, CA | | Other Properties | | Health Care and Social Assistance | | West | | | 2,264 | | | | 48,128 | | | | 0.06 | % | | CPI | | January-16 | | January-41 |
Childtime Childcare, Inc. (10) | | Westland, MI | | Other Properties | | Health Care and Social Assistance | | Midwest | | | 2,472 | | | | 24,135 | | | | 0.03 | % | | CPI | | January-16 | | January-41 |
Childtime Childcare, Inc. (10) | | Sterling Heights, MI | | Other Properties | | Health Care and Social Assistance | | Midwest | | | 2,311 | | | | 43,736 | | | | 0.05 | % | | CPI | | January-16 | | January-41 |
Childtime Childcare, Inc. (10) | | Westland, MI | | Other Properties | | Health Care and Social Assistance | | Midwest | | | 2,787 | | | | 31,645 | | | | 0.04 | % | | CPI | | January-16 | | January-41 |
Childtime Childcare, Inc. (10) | | Carrollton, TX | | Other Properties | | Health Care and Social Assistance | | South | | | 2,438 | | | | 42,083 | | | | 0.05 | % | | CPI | | January-16 | | January-41 |
Childtime Childcare, Inc. (10) | | Duncanville, TX | | Other Properties | | Health Care and Social Assistance | | South | | | 2,438 | | | | 42,083 | | | | 0.05 | % | | CPI | | January-16 | | January-41 |
Childtime Childcare, Inc. (10) | | Lewisville, TX | | Other Properties | | Health Care and Social Assistance | | South | | | 2,440 | | | | 42,083 | | | | 0.05 | % | | CPI | | January-16 | | January-41 |
| | | | | | | | | | | | | | | | | | | | | | | | | | | | | | | |
Childtime Childcare, Inc. Total | | | | | | | | | | | | | | | | | | | 28,617 | | | | 472,309 | | | | 0.55 | % | | | | | | | | | | | | |
| | | | | | | | | | | | | | | | | | | | | | | | | | | | | | | | | | | | | | | | | |
| ALCOA Inc | | Salisbury, NC | | Warehouse/Distribution | | Manufacturing | | East | | | 200,000 | | | | 459,082 | | | | 0.54 | % | | CPI | | June-10 | | June-20 |
| | | | | | | | | | | | | | | | | | | | | | | | | | | | | | | |
ALCOA Inc Total | | | | | | | | | | | | | | | | | | | 200,000 | | | | 459,082 | | | | 0.54 | % | | | | | | | | | | | | |
| | | | |
| | | | | |
| Ticker: WPC | | | | www.wpcarey.com |
EXHIBIT E
| | | | | | | | | | | | | | | | | | | | | | | | | | | | | | | | | | | | | | | | | |
| | | | | | | | | | | | | | | | | | | | | | | Percentage of | | | Increase | | | Lease | | | Maximum | | | | |
| Tenant/Lease Guarantor | | Property Location | | | Property Type | | | Tenant Type | | | Region | | | Square Footage | | | Annual Rent | | | Total Rent | | | Factor | | | Expiration | | | Term | |
| |
| | | | | | | | | | | | | | | | | | | | | | | | | | | | | | | | | | | | | | | | | |
| Yale Security, Inc. | | Lemont, IL | | Industrial | | Manufacturing | | Midwest | | | 113,133 | | | | 459,000 | | | | 0.54 | % | | Stated | | March-11 | | March-11 |
| | | | | | | | | | | | | | | | | | | | | | | | | | | | | | | |
Yale Security, Inc. Total | | | | | | | | | | | | | | | | | | | 113,133 | | | | 459,000 | | | | 0.54 | % | | | | | | | | | | | | |
| | | | | | | | | | | | | | | | | | | | | | | | | | | | | | | | | | | | | | | | | |
| Affiliated Foods Southwest, Inc. | | Hope, AR | | Retail | | Wholesale Trade | | South | | | 35,784 | | | | 85,882 | | | | 0.10 | % | | CPI | | March-07 | | March-37 |
| Affiliated Foods Southwest, Inc. | | Hope, AR | | Retail | | Wholesale Trade | | South | | | 21,932 | | | | 34,745 | | | | 0.04 | % | | CPI | | March-07 | | March-22 |
| Affiliated Foods Southwest, Inc. | | Little Rock, AR | | Retail | | Wholesale Trade | | South | | | 64,358 | | | | 279,522 | | | | 0.33 | % | | None | | January-09 | | January-24 |
| | | | | | | | | | | | | | | | | | | | | | | | | | | | | | | |
Affiliated Foods Southwest, Inc. Total | | | | | | | | | | | | | | | | | | | 122,074 | | | | 400,149 | | | | 0.47 | % | | | | | | | | | | | | |
| | | | | | | | | | | | | | | | | | | | | | | | | | | | | | | | | | | | | | | | | |
| Kmart Corporation | | Citrus Heights, CA | | Retail | | Retail Trade | | West | | | 89,760 | | | | 180,000 | | | | 0.21 | % | | None | | May-11 | | May-26 |
| Kmart Corporation | | Drayton Plains, MI | | Retail | | Retail Trade | | Midwest | | | 103,018 | | | | 210,000 | | | | 0.25 | % | | None | | March-11 | | March-26 |
| | | | | | | | | | | | | | | | | | | | | | | | | | | | | | | |
Kmart Corporation Total | | | | | | | | | | | | | | | | | | | 192,778 | | | | 390,000 | | | | 0.46 | % | | | | | | | | | | | | |
| | | | | | | | | | | | | | | | | | | | | | | | | | | | | | | | | | | | | | | | | |
| Industrial Data Systems Corp. (aka Petrocon Engineering, Inc.) | | Beaumont, TX | | Office | | Construction | | South | | | 34,300 | | | | 288,120 | | | | 0.34 | % | | Stated | | December-11 | | December-14 |
| Industrial Data Systems Corp. (aka Petrocon Engineering, Inc.) | | Beaumont, TX | | Office | | Construction | | South | | | 8,580 | | | | 72,072 | | | | 0.08 | % | | Stated | | December-11 | | December-14 |
| | | | | | | | | | | | | | | | | | | | | | | | | | | | | | | |
Industrial Data Systems Corp. (aka Petrocon Engineering, Inc.) Total | | | | | | | | | | | | | | | | | | | 42,880 | | | | 360,192 | | | | 0.42 | % | | | | | | | | | | | | |
| | | | | | | | | | | | | | | | | | | | | | | | | | | | | | | | | | | | | | | | | |
Laboratoires Nycomed Amersham (3) | | Pantin, France | | Office | | Manufacturing | | Europe | | | 15,404 | | | | 349,320 | | | | 0.41 | % | | INSEE(2) | | January-10 | | January-10 |
| | | | | | | | | | | | | | | | | | | | | | | | | | | | | | | |
Laboratoires Nycomed Amersham Total | | | | | | | | | | | | | | | | | | | 15,404 | | | | 349,320 | | | | 0.41 | % | | | | | | | | | | | | |
| | | | | | | | | | | | | | | | | | | | | | | | | | | | | | | | | | | | | | | | | |
| Faurecia Exhaust Systems, Inc. (fka AP Parts Manufacturing, Co.) | | Toledo, OH | | Industrial | | Manufacturing | | Midwest | | | 61,000 | | | | 336,000 | | | | 0.39 | % | | CPI | | November-22 | | November-42 |
| | | | | | | | | | | | | | | | | | | | | | | | | | | | | | | |
Faurecia Exhaust Systems, Inc. (fka AP Parts Manufacturing, Co.) Total | | | | | | | | | | | | | | | | | | | 61,000 | | | | 336,000 | | | | 0.39 | % | | | | | | | | | | | | |
| | | | | | | | | | | | | | | | | | | | | | | | | | | | | | | | | | | | | | | | | |
| Alstom Power Inc. | | Erlanger, KY | | Warehouse/Distribution | | Professional, Scientific and Technical Servic | | es East | | | 118,200 | | | | 287,226 | | | | 0.34 | % | | Stated | | May-13 | | May-13 |
| | | | | | | | | | | | | | | | | | | | | | | | | | | | | | | |
Alstom Power Inc. Total | | | | | | | | | | | | | | | | | | | 118,200 | | | | 287,226 | | | | 0.34 | % | | | | | | | | | | | | |
| | | | | | | | | | | | | | | | | | | | | | | | | | | | | | | | | | | | | | | | | |
| Roof Center, Inc., The | | Manassas, VA | | Industrial | | Wholesale Trade | | East | | | 60,446 | | | | 280,901 | | | | 0.33 | % | | Stated | | July-09 | | July-09 |
| | | | | | | | | | | | | | | | | | | | | | | | | | | | | | | |
Roof Center, Inc., The Total | | | | | | | | | | | | | | | | | | | 60,446 | | | | 280,901 | | | | 0.33 | % | | | | | | | | | | | | |
| | | | | | | | | | | | | | | | | | | | | | | | | | | | | | | | | | | | | | | | | |
| Winn-Dixie, Inc. | | Montgomery, AL | | Retail | | Retail Trade | | South | | | 32,690 | | | | 138,933 | | | | 0.16 | % | | % Sales | | March-08 | | March-38 |
| Winn-Dixie, Inc. | | Brewton, AL | | Retail | | Retail Trade | | South | | | 30,625 | | | | 134,500 | | | | 0.16 | % | | % Sales | | October-10 | | October-10 |
| | | | | | | | | | | | | | | | | | | | | | | | | | | | | | | |
Winn-Dixie, Inc. Total | | | | | | | | | | | | | | | | | | | 63,315 | | | | 273,433 | | | | 0.32 | % | | | | | | | | | | | | |
| | | | | | | | | | | | | | | | | | | | | | | | | | | | | | | | | | | | | | | | | |
| US WEST Communications, Inc. (Qwest Communications) | | Scottsdale, AZ | | Industrial | | Information | | West | | | 2,900 | | | | 175,735 | | | | 0.21 | % | | None | | February-07 | | February-07 |
| US WEST Communications, Inc. (Qwest Communications) | | Scottsdale, AZ | | Industrial | | Information | | West | | | 1,560 | | | | 94,535 | | | | 0.11 | % | | None | | February-07 | | February-07 |
| | | | | | | | | | | | | | | | | | | | | | | | | | | | | | | |
US WEST Communications, Inc. (Qwest Communications) Total | | | | | | | | | | | | | | | | | | | 4,460 | | | | 270,270 | | | | 0.32 | % | | | | | | | | | | | | |
| | | | | | | | | | | | | | | | | | | | | | | | | | | | | | | | | | | | | | | | | |
| Honeywell, Inc. | | Houston, TX | | Office | | Manufacturing | | South | | | 86,989 | | | | 36,000 | | | | 0.04 | % | | Stated | | September-10 | | September-05 |
| Honeywell, Inc. | | Houston, TX | | Warehouse/Distribution | | Manufacturing | | South | | | 32,320 | | | | 228,828 | | | | 0.27 | % | | Stated | | September-10 | | December-22 |
| | | | | | | | | | | | | | | | | | | | | | | | | | | | | | | |
Honeywell, Inc. Total | | | | | | | | | | | | | | | | | | | 119,309 | | | | 264,828 | | | | 0.31 | % | | | | | | | | | | | | |
| | | | | | | | | | | | | | | | | | | | | | | | | | | | | | | | | | | | | | | | | |
SARL S3T(11) | | Loire, France | | Office | | Information | | Europe | | | 55,594 | | | | 263,045 | | | | 0.31 | % | | INSEE(2) | | May-08 | | May-08 |
| | | | | | | | | | | | | | | | | | | | | | | | | | | | | | | |
SARL S3T Total | | | | | | | | | | | | | | | | | | | 55,594 | | | | 263,045 | | | | 0.31 | % | | | | | | | | | | | | |
| | | | | | | | | | | | | | | | | | | | | | | | | | | | | | | | | | | | | | | | | |
| Northern Tube, Inc. | | Pinconning, MI | | Industrial | | Manufacturing | | Midwest | | | 220,588 | | | | 254,538 | | | | 0.30 | % | | CPI | | July-13 | | July-23 |
| | | | | | | | | | | | | | | | | | | | | | | | | | | | | | | |
Northern Tube, Inc. Total | | | | | | | | | | | | | | | | | | | 220,588 | | | | 254,538 | | | | 0.30 | % | | | | | | | | | | | | |
| | | | | | | | | | | | | | | | | | | | | | | | | | | | | | | | | | | | | | | | | |
Direction Regional des Affaires Sanitaires et Sociales(3) | | Rouen, France | | Office | | Public Administration | | Europe | | | 19,214 | | | | 240,750 | | | | 0.28 | % | | INSEE(2) | | March-06 | | March-06 |
| | | | | | | | | | | | | | | | | | | | | | | | | | | | | | | |
Direction Regional des Affaires Sanitaires et Sociales Total | | | | | | | | | | | | | | | | | | | 19,214 | | | | 240,750 | | | | 0.28 | % | | | | | | | | | | | | |
| | | | | | | | | | | | | | | | | | | | | | | | | | | | | | | | | | | | | | | | | |
| Penberthy Products, Inc. | | Prophetstown, IL | | Industrial | | Manufacturing | | Midwest | | | 161,878 | | | | 237,486 | | | | 0.28 | % | | CPI | | April-11 | | April-26 |
| | | | | | | | | | | | | | | | | | | | | | | | | | | | | | | |
Penberthy Products, Inc. Total | | | | | | | | | | | | | | | | | | | 161,878 | | | | 237,486 | | | | 0.28 | % | | | | | | | | | | | | |
| | | | | | | | | | | | | | | | | | | | | | | | | | | | | | | | | | | | | | | | | |
DSM Food Specialties (11) | | Lille, France | | Office | | Wholesale Trade | | Europe | | | 29,870 | | | | 228,879 | | | | 0.27 | % | | INSEE(2) | | May-08 | | May-08 |
| | | | | | | | | | | | | | | | | | | | | | | | | | | | | | | |
DSM Food Specialties Total | | | | | | | | | | | | | | | | | | | 29,870 | | | | 228,879 | | | | 0.27 | % | | | | | | | | | | | | |
| | | | | | | | | | | | | | | | | | | | | | | | | | | | | | | | | | | | | | | | | |
| Ace Hardware (Bay Area Blvd, Houston TX) | | Houston, TX | | Retail | | Wholesale Trade | | South | | | 23,569 | | | | 212,121 | | | | 0.25 | % | | Stated | | March-16 | | March-16 |
| | | | | | | | | | | | | | | | | | | | | | | | | | | | | | | |
Ace Hardware (Bay Area Blvd, Houston TX) Total | | | | | | | | | | | | | | | | | | | 23,569 | | | | 212,121 | | | | 0.25 | % | | | | | | | | | | | | |
| | | | | | | | | | | | | | | | | | | | | | | | | | | | | | | | | | | | | | | | | |
| Verizon Communications, Inc. | | Milton, VT | | Industrial | | Information | | East | | | 30,624 | | | | 208,467 | | | | 0.24 | % | | Stated | | February-13 | | February-13 |
| | | | | | | | | | | | | | | | | | | | | | | | | | | | | | | |
Verizon Communications, Inc. Total | | | | | | | | | | | | | | | | | | | 30,624 | | | | 208,467 | | | | 0.24 | % | | | | | | | | | | | | |
| | | | | | | | | | | | | | | | | | | | | | | | | | | | | | | | | | | | | | | | | |
Department de Seine St. Denis(3) | | Pantin, France | | Office | | Public Administration | | Europe | | | 8,451 | | | | 207,875 | | | | 0.24 | % | | INSEE(2) | | December-11 | | December-11 |
| | | | | | | | | | | | | | | | | | | | | | | | | | | | | | | |
Department de Seine St. Denis Total | | | | | | | | | | | | | | | | | | | 8,451 | | | | 207,875 | | | | 0.24 | % | | | | | | | | | | | | |
| | | | | | | | | | | | | | | | | | | | | | | | | | | | | | | | | | | | | | | | | |
La Region Ile de France(3) | | Pantin, France | | Office | | Public Administration | | Europe | | | 7,613 | | | | 183,012 | | | | 0.21 | % | | INSEE(2) | | October-12 | | October-12 |
| | | | | | | | | | | | | | | | | | | | | | | | | | | | | | | |
La Region Ile de France Total | | | | | | | | | | | | | | | | | | | 7,613 | | | | 183,012 | | | | 0.21 | % | | | | | | | | | | | | |
| | | | | | | | | | | | | | | | | | | | | | | | | | | | | | | | | | | | | | | | | |
GIE Groupe Vauban(3) | | Pantin, France | | Office | | Finance and Insurance | | Europe | | | 7,613 | | | | 171,200 | | | | 0.20 | % | | INSEE(2) | | September-12 | | September-12 |
| | | | | | | | | | | | | | | | | | | | | | | | | | | | | | | |
GIE Groupe Vauban Total | | | | | | | | | | | | | | | | | | | 7,613 | | | | 171,200 | | | | 0.20 | % | | | | | | | | | | | | |
| | | | |
| | | | | |
| Ticker: WPC | | | | www.wpcarey.com |
EXHIBIT E
| | | | | | | | | | | | | | | | | | | | | | | | | | | | | | | | | | | | | | | | | |
| | | | | | | | | | | | | | | | | | | | | | | Percentage of | | | Increase | | | Lease | | | Maximum | | | | |
| Tenant/Lease Guarantor | | Property Location | | | Property Type | | | Tenant Type | | | Region | | | Square Footage | | | Annual Rent | | | Total Rent | | | Factor | | | Expiration | | | Term | |
| |
| | | | | | | | | | | | | | | | | | | | | | | | | | | | | | | | | | | | | | | | | |
| Xerox Corporation | | Hot Springs, AR | | Retail | | Manufacturing | | South | | | 36,850 | | | | 167,667 | | | | 0.20 | % | | None | | May-10 | | May-21 |
| | | | | | | | | | | | | | | | | | | | | | | | | | | | | | | |
Xerox Corporation Total | | | | | | | | | | | | | | | | | | | 36,850 | | | | 167,667 | | | | 0.20 | % | | | | | | | | | | | | |
| | | | | | | | | | | | | | | | | | | | | | | | | | | | | | | | | | | | | | | | | |
| Continental Airlines, Inc. | | Houston, TX | | Warehouse/Distribution | | Transportation and Warehousing | | South | | | 25,125 | | | | 157,200 | | | | 0.18 | % | | Stated | | July-08 | | July-08 |
| | | | | | | | | | | | | | | | | | | | | | | | | | | | | | | |
Continental Airlines, Inc. Total | | | | | | | | | | | | | | | | | | | 25,125 | | | | 157,200 | | | | 0.18 | % | | | | | | | | | | | | |
| | | | | | | | | | | | | | | | | | | | | | | | | | | | | | | | | | | | | | | | | |
| Golder Associates Inc. | | Houston, TX | | Office | | Professional, Scientific and Technical Servic | | es South | | | 11,396 | | | | 103,368 | | | | 0.12 | % | | None | | October-10 | | October-20 |
| | | | | | | | | | | | | | | | | | | | | | | | | | | | | | | |
Golder Associates Inc. Total | | | | | | | | | | | | | | | | | | | 11,396 | | | | 103,368 | | | | 0.12 | % | | | | | | | | | | | | |
| | | | | | | | | | | | | | | | | | | | | | | | | | | | | | | | | | | | | | | | | |
| Custom Training Group | | Houston, TX | | Warehouse/Distribution | | Educational Services | | South | | | 4,456 | | | | 40,080 | | | | 0.05 | % | | Stated | | August-06 | | August-06 |
| Custom Training Group | | Houston, TX | | Warehouse/Distribution | | Educational Services | | South | | | 7,248 | | | | 59,400 | | | | 0.07 | % | | Stated | | December-06 | | December-06 |
| | | | | | | | | | | | | | | | | | | | | | | | | | | | | | | |
Custom Training Group Total | | | | | | | | | | | | | | | | | | | 11,704 | | | | 99,480 | | | | 0.12 | % | | | | | | | | | | | | |
| | | | | | | | | | | | | | | | | | | | | | | | | | | | | | | | | | | | | | | | | |
RATP (3) | | Pantin, France | | Office | | Transportation and Warehousing | | Europe | | | 3,407 | | | | 82,009 | | | | 0.10 | % | | INSEE(2) | | November-09 | | November-09 |
| | | | | | | | | | | | | | | | | | | | | | | | | | | | | | | |
RATP Total | | | | | | | | | | | | | | | | | | | 3,407 | | | | 82,009 | | | | 0.10 | % | | | | | | | | | | | | |
| | | | | | | | | | | | | | | | | | | | | | | | | | | | | | | | | | | | | | | | | |
| General Services Administration (US Government) in Bloomington ,IL | | Bloomingdale, IL | | Office | | Public Administration | | Midwest | | | 3,949 | | | | 74,834 | | | | 0.09 | % | | Stated | | April-06 | | April-06 |
| | | | | | | | | | | | | | | | | | | | | | | | | | | | | | | |
General Services Administration (US Government) in Bloomington ,IL Total | | | | | | | | | | | | | | | | | | | 3,949 | | | | 74,834 | | | | 0.09 | % | | | | | | | | | | | | |
| | | | | | | | | | | | | | | | | | | | | | | | | | | | | | | | | | | | | | | | | |
| Sverdrup Technology Inc. | | Houston, TX | | Warehouse/Distribution | | Professional, Scientific and Technical Servic | | es South | | | 10,960 | | | | 73,644 | | | | 0.09 | % | | None | | January-06 | | January-07 |
| | | | | | | | | | | | | | | | | | | | | | | | | | | | | | | |
Sverdrup Technology Inc. Total | | | | | | | | | | | | | | | | | | | 10,960 | | | | 73,644 | | | | 0.09 | % | | | | | | | | | | | | |
| | | | | | | | | | | | | | | | | | | | | | | | | | | | | | | | | | | | | | | | | |
| Bike Barn Holding Company, Inc. (Bay Area Blvd, Houston, TX) | | Houston, TX | | Retail | | Retail Trade | | South | | | 6,216 | | | | 71,280 | | | | 0.08 | % | | Stated | | August-10 | | August-10 |
| | | | | | | | | | | | | | | | | | | | | | | | | | | | | | | |
Bike Barn Holding Company, Inc. (Bay Area Blvd, Houston, TX) Total | | | | | | | | | | | | | | | | | | | 6,216 | | | | 71,280 | | | | 0.08 | % | | | | | | | | | | | | |
| | | | | | | | | | | | | | | | | | | | | | | | | | | | | | | | | | | | | | | | | |
| Work Ready, Inc (Century Plaza Drive Houston, TX) | | Houston, TX | | Warehouse/Distribution | | Health Care and Social Assistance | | South | | | 7,306 | | | | 70,560 | | | | 0.08 | % | | Stated | | August-06 | | August-06 |
| | | | | | | | | | | | | | | | | | | | | | | | | | | | | | | |
Work Ready, Inc (Century Plaza Drive Houston, TX) Total | | | | | | | | | | | | | | | | | | | 7,306 | | | | 70,560 | | | | 0.08 | % | | | | | | | | | | | | |
| | | | | | | | | | | | | | | | | | | | | | | | | | | | | | | | | | | | | | | | | |
| Kenyon International Emergency Services (Pepsi) | | Houston, TX | | Warehouse/Distribution | | Manufacturing | | South | | | 17,725 | | | | 70,014 | | | | 0.08 | % | | Stated | | October-09 | | October-19 |
| | | | | | | | | | | | | | | | | | | | | | | | | | | | | | | |
Kenyon International Emergency Services (Pepsi) Total | | | | | | | | | | | | | | | | | | | 17,725 | | | | 70,014 | | | | 0.08 | % | | | | | | | | | | | | |
| | | | | | | | | | | | | | | | | | | | | | | | | | | | | | | | | | | | | | | | | |
| Richard Millburn Academy (Century Plaza Drive Houston, TX) | | Houston, TX | | Warehouse/Distribution | | Educational Services | | South | | | 7,860 | | | | 69,840 | | | | 0.08 | % | | Stated | | September-08 | | September-08 |
| | | | | | | | | | | | | | | | | | | | | | | | | | | | | | | |
Richard Millburn Academy (Century Plaza Drive Houston, TX) Total | | | | | | | | | | | | | | | | | | | 7,860 | | | | 69,840 | | | | 0.08 | % | | | | | | | | | | | | |
| | | | | | | | | | | | | | | | | | | | | | | | | | | | | | | | | | | | | | | | | |
L’Agence Nationale Pour L’Emploi (3) | | Pantin, France | | Office | | Public Administration | | Europe | | | 3,633 | | | | 67,353 | | | | 0.08 | % | | INSEE(2) | | June-07 | | June-07 |
| | | | | | | | | | | | | | | | | | | | | | | | | | | | | | | |
L’Agence Nationale Pour L’Emploi Total | | | | | | | | | | | | | | | | | | | 3,633 | | | | 67,353 | | | | 0.08 | % | | | | | | | | | | | | |
| | | | | | | | | | | | | | | | | | | | | | | | | | | | | | | | | | | | | | | | | |
| Raytheon Company | | Webster, TX | | Industrial | | Professional, Scientific and Technical Servic | | es South | | | 9,138 | | | | 65,796 | | | | 0.08 | % | | Stated | | July-10 | | July-25 |
| | | | | | | | | | | | | | | | | | | | | | | | | | | | | | | |
Raytheon Company Total | | | | | | | | | | | | | | | | | | | 9,138 | | | | 65,796 | | | | 0.08 | % | | | | | | | | | | | | |
| | | | | | | | | | | | | | | | | | | | | | | | | | | | | | | | | | | | | | | | | |
| Rocky Mountain Pool Table Co. (Broomfield Tech Center) | | Broomfield, CO | | Office | | Retail Trade | | West | | | 13,091 | | | | 62,112 | | | | 0.07 | % | | None | | March-06 | | March-06 |
| | | | | | | | | | | | | | | | | | | | | | | | | | | | | | | |
Rocky Mountain Pool Table Co. (Broomfield Tech Center) Total | | | | | | | | | | | | | | | | | | | 13,091 | | | | 62,112 | | | | 0.07 | % | | | | | | | | | | | | |
| | | | | | | | | | | | | | | | | | | | | | | | | | | | | | | | | | | | | | | | | |
AFPOLS (3) | | Pantin, France | | Office | | Public Administration | | Europe | | | 3,488 | | | | 58,654 | | | | 0.07 | % | | INSEE(2) | | June-08 | | June-08 |
| | | | | | | | | | | | | | | | | | | | | | | | | | | | | | | |
AFPOLS Total | | | | | | | | | | | | | | | | | | | 3,488 | | | | 58,654 | | | | 0.07 | % | | | | | | | | | | | | |
| | | | | | | | | | | | | | | | | | | | | | | | | | | | | | | | | | | | | | | | | |
| Tru-Check, Inc. | | Broomfield, CO | | Office | | Information | | West | | | 14,914 | | | | 51,602 | | | | 0.06 | % | | None | | February-06 | | February-06 |
| | | | | | | | | | | | | | | | | | | | | | | | | | | | | | | |
Tru-Check, Inc. Total | | | | | | | | | | | | | | | | | | | 14,914 | | | | 51,602 | | | | 0.06 | % | | | | | | | | | | | | |
| | | | | | | | | | | | | | | | | | | | | | | | | | | | | | | | | | | | | | | | | |
| Trans American Automation Inc. (Century Plaza Drive Houston, TX) | | Houston, TX | | Warehouse/Distribution | | Manufacturing | | South | | | 5,632 | | | | 48,660 | | | | 0.06 | % | | Stated | | February-07 | | February-12 |
| | | | | | | | | | | | | | | | | | | | | | | | | | | | | | | |
Trans American Automation Inc. (Century Plaza Drive Houston, TX) Total | | | | | | | | | | | | | | | | | | | 5,632 | | | | 48,660 | | | | 0.06 | % | | | | | | | | | | | | |
| | | | | | | | | | | | | | | | | | | | | | | | | | | | | | | | | | | | | | | | | |
| Olmstead Kirk Paper Company (Beaumont, TX) | | Beaumont, TX | | Office | | Manufacturing | | South | | | 5,760 | | | | 40,102 | | | | 0.05 | % | | Stated | | December-07 | | December-07 |
| | | | | | | | | | | | | | | | | | | | | | | | | | | | | | | |
Olmstead Kirk Paper Company (Beaumont, TX) Total | | | | | | | | | | | | | | | | | | | 5,760 | | | | 40,102 | | | | 0.05 | % | | | | | | | | | | | | |
| | | | | | | | | | | | | | | | | | | | | | | | | | | | | | | | | | | | | | | | | |
| Rhino Liners | | Broomfield, CO | | Office | | Retail Trade | | West | | | 5,517 | | | | 35,861 | | | | 0.04 | % | | None | | June-06 | | June-06 |
| | | | | | | | | | | | | | | | | | | | | | | | | | | | | | | |
Rhino Liners Total | | | | | | | | | | | | | | | | | | | 5,517 | | | | 35,861 | | | | 0.04 | % | | | | | | | | | | | | |
| | | | | | | | | | | | | | | | | | | | | | | | | | | | | | | | | | | | | | | | | |
| Introtell (Broomfield Tech Center) | | Broomfield, CO | | Office | | Retail Trade | | West | | | 10,952 | | | | 34,080 | | | | 0.04 | % | | None | | February-10 | | February-10 |
| | | | | | | | | | | | | | | | | | | | | | | | | | | | | | | |
Introtell (Broomfield Tech Center) Total | | | | | | | | | | | | | | | | | | | 10,952 | | | | 34,080 | | | | 0.04 | % | | | | | | | | | | | | |
| | | | | | | | | | | Administrative and Support and Waste | | | | | | | | | | | | | | | | | | | | | | | | | | | | |
| | | | | | | | | | | | | | | | | | | | | | | | | | | | | | | | | | | | | | | | | |
| Facilities Management Solutions | | Webster, TX | | Warehouse/Distribution | | Management and Remediation Services | | South | | | 3,600 | | | | 30,240 | | | | 0.04 | % | | Stated | | December-05 | | December-05 |
| | | | | | | | | | | | | | | | | | | | | | | | | | | | | | | |
Facilities Management Solutions Total | | | | | | | | | | | | | | | | | | | 3,600 | | | | 30,240 | | | | 0.04 | % | | | | | | | | | | | | |
| | | | |
| | | | | |
| Ticker: WPC | | | | www.wpcarey.com |
EXHIBIT E
| | | | | | | | | | | | | | | | | | | | | | | | | | | | | | | | | | | | | | | | | |
| | | | | | | | | | | | | | | | | | | | | | | Percentage of | | | Increase | | | Lease | | | Maximum | | | | |
| Tenant/Lease Guarantor | | Property Location | | | Property Type | | | Tenant Type | | | Region | | | Square Footage | | | Annual Rent | | | Total Rent | | | Factor | | | Expiration | | | Term | |
| |
| | | | | | | | | | | | | | | | | | | | | | | | | | | | | | | | | | | | | | | | | |
| G.T. of the Front Range | | Broomfield, CO | | Office | | Retail Trade | | West | | | 9,401 | | | | 25,956 | | | | 0.03 | % | | None | | May-06 | | May-06 |
| | | | | | | | | | | | | | | | | | | | | | | | | | | | | | | |
G.T. of the Front Range Total | | | | | | | | | | | | | | | | | | | 9,401 | | | | 25,956 | | | | 0.03 | % | | | | | | | | | | | | |
| | | | | | | | | | | | | | | | | | | | | | | | | | | | | | | | | | | | | | | | | |
| Aardvark IT Solutions | | Broomfield, CO | | Office | | Retail Trade | | West | | | 5,953 | | | | 19,347 | | | | 0.02 | % | | None | | September-06 | | | N/A | |
| | | | | | | | | | | | | | | | | | | | | | | | | | | | | | | |
Aardvark IT Solutions Total | | | | | | | | | | | | | | | | | | | 5,953 | | | | 19,347 | | | | 0.02 | % | | | | | | | | | | | | |
| | | | | | | | | | | | | | | | | | | | | | | | | | | | | | | | | | | | | | | | | |
| Michael Lau | | Broomfield, CO | | Office | | | N/A | | | West | | | 4,162 | | | | 14,400 | | | | 0.02 | % | | None | | April-06 | | April-06 |
| | | | | | | | | | | | | | | | | | | | | | | | | | | | | | | |
Michael Lau Total | | | | | | | | | | | | | | | | | | | 4,162 | | | | 14,400 | | | | 0.02 | % | | | | | | | | | | | | |
| | | | | | | | | | | | | | | | | | | | | | | | | | | | | | | | | | | | | | | | | |
| Marathon System Service | | Broomfield, CO | | Office | | Information | | West | | | 2,283 | | | | 14,177 | | | | 0.02 | % | | None | | November-07 | | November-07 |
| | | | | | | | | | | | | | | | | | | | | | | | | | | | | | | |
Marathon System Service Total | | | | | | | | | | | | | | | | | | | 2,283 | | | | 14,177 | | | | 0.02 | % | | | | | | | | | | | | |
| | | | | | | | | | | | | | | | | | | | | | | | | | | | | | | | | | | | | | | | | |
| Sundew Technologies | | Broomfield, CO | | Office | | Management and Remediation Services | | West | | | 3,745 | | | | 12,805 | | | | 0.01 | % | | None | | October-07 | | October-07 |
| | | | | | | | | | | | | | | | | | | | | | | | | | | | | | | |
Sundew Technologies Total | | | | | | | | | | | | | | | | | | | 3,745 | | | | 12,805 | | | | 0.01 | % | | | | | | | | | | | | |
| | | | | | | | | | | | | | | | | | | | | | | | | | | | | | | | | | | | | | | | | |
| Red Cloud Telecom Products, Inc. | | Broomfield, CO | | Office | | Information | | West | | | 2,093 | | | | 12,000 | | | | 0.01 | % | | None | | June-06 | | June-06 |
| | | | | | | | | | | | | | | | | | | | | | | | | | | | | | | |
Red Cloud Telecom Products, Inc. Total | | | | | | | | | | | | | | | | | | | 2,093 | | | | 12,000 | | | | 0.01 | % | | | | | | | | | | | | |
| | | | | | | | | | | | | | | | | | | | | | | | | | | | | | | | | | | | | | | | | |
| Appointment Quest | | Broomfield, CO | | Office | | Information | | West | | | 1,670 | | | | 11,460 | | | | 0.01 | % | | None | | May-06 | | | N/A | |
| | | | | | | | | | | | | | | | | | | | | | | | | | | | | | | |
Appointment Quest Total | | | | | | | | | | | | | | | | | | | 1,670 | | | | 11,460 | | | | 0.01 | % | | | | | | | | | | | | |
| | | | | | | | | | | | | | | | | | | | | | | | | | | | | | | | | | | | | | | | | |
| Abilis | | Pantin, France | | Office | | Other Services (except Public Administ | | ration) Europe | | | 0 | | | | 9,178 | | | | 0.01 | % | | INSEE(2) | | February-07 | | January-08 |
| | | | | | | | | | | | | | | | | | | | | | | | | | | | | | | |
Abilis Total | | | | | | | | | | | | | | | | | | | 0 | | | | 9,178 | | | | 0.01 | % | | | | | | | | | | | | |
| | | | | | | | | | | | | | | | | | | | | | | | | | | | | | | | | | | | | | | | | |
| Classic Cuisines Catering | | Bloomingdale, IL | | Office | | Accomodation and Food Services | | Midwest | | | 1,000 | | | | 9,000 | | | | 0.01 | % | | None | | October-08 | | | N/A | |
| �� | | | | | | | | | | | | | | | | | | | | | | | | | | | | | | |
Classic Cuisines Catering Total | | | | | | | | | | | | | | | | | | | 1,000 | | | | 9,000 | | | | 0.01 | % | | | | | | | | | | | | |
| | | | | | | | | | | | | | | | | | | | | | | | | | | | | | | | | | | | | | | | | |
| Ass Comite Dept du Tourisme | | Pantin, France | | Office | | Tourism | | Europe | | | N/A | | | | 8,385 | | | | 0.01 | % | | INSEE(2) | | June-07 | | June-07 |
| | | | | | | | | | | | | | | | | | | | | | | | | | | | | | | |
Ass Comite Dept du Tourisme Total | | | | | | | | | | | | | | | | | | | 0 | | | | 8,385 | | | | 0.01 | % | | | | | | | | | | | | |
| | | | | | | | | | | | | | | | | | | | | | | | | | | | | | | | | | | | | | | | | |
| AT&T Wireless Service | | Broomfield, CO | | Office | | Information | | West | | | 730 | | | | 8,208 | | | | 0.01 | % | | Stated | | May-06 | | | N/A | |
| | | | | | | | | | | | | | | | | | | | | | | | | | | | | | | |
AT&T Wireless Service Total | | | | | | | | | | | | | | | | | | | 730 | | | | 8,208 | | | | 0.01 | % | | | | | | | | | | | | |
| | | | | | | | | | | | | | | | | | | | | | | | | | | | | | | | | | | | | | | | | |
| Fine Art Mannequins, LLC | | Broomfield, CO | | Office | | | N/A | | | West | | | 2,209 | | | | 7,643 | | | | 0.01 | % | | None | | April-07 | | April-07 |
| | | | | | | | | | | | | | | | | | | | | | | | | | | | | | | |
Fine Art Mannequins, LLC Total | | | | | | | | | | | | | | | | | | | 2,209 | | | | 7,643 | | | | 0.01 | % | | | | | | | | | | | | |
| | | | | | | | | | | | | | | | | | | | | | | | | | | | | | | | | | | | | | | | | |
| Remote Access Diagnostic Radiography | | Broomfield, CO | | Office | | | N/A | | | West | | | 2,093 | | | | 7,179 | | | | 0.01 | % | | None | | October-06 | | October-06 |
| | | | | | | | | | | | | | | | | | | | | | | | | | | | | | | |
Remote Access Diagnostic Radiography Total | | | | | | | | | | | | | | | | | | | 2,093 | | | | 7,179 | | | | 0.01 | % | | | | | | | | | | | | |
| | | | | | | | | | | | | | | | | | | | | | | | | | | | | | | | | | | | | | | | | |
Orange(3) | | Pantin, France | | Office | | Information | | Europe | | | N/A | | | | 6,137 | | | | 0.01 | % | | None | | June-15 | | | N/A | |
| | | | | | | | | | | | | | | | | | | | | | | | | | | | | | | |
Orange Total | | | | | | | | | | | | | | | | | | | 0 | | | | 6,137 | | | | 0.01 | % | | | | | | | | | | | | |
| | | | | | | | | | | | | | | | | | | | | | | | | | | | | | | | | | | | | | | | | |
| Photo Center | | Hot Springs, AR | | Retail | | Manufacturing | | South | | | 340 | | | | 4,800 | | | | 0.01 | % | | | N/A | | | | N/A | | | | N/A | |
| | | | | | | | | | | | | | | | | | | | | | | | | | | | | | | |
Photo Center Total | | | | | | | | | | | | | | | | | | | 340 | | | | 4,800 | | | | 0.01 | % | | | | | | | | | | | | |
| | | | | | | | | | | | | | | | | | | | | | | | | | | | | | | | | | | | | | | | | |
| Byron Jacquot | | Broomfield, CO | | Office | | | N/A | | | West | | | 1,105 | | | | 3,978 | | | | 0.00 | % | | None | | September-06 | | September-06 |
| | | | | | | | | | | | | | | | | | | | | | | | | | | | | | | |
Byron Jacquot Total | | | | | | | | | | | | | | | | | | | 1,105 | | | | 3,978 | | | | 0.00 | % | | | | | | | | | | | | |
| | | | | | | | | | | | | | | | | | | | | | | | | | | | | | | | | | | | | | | | | |
| DLH Management Corporation | | Broomfield, CO | | Office | | | N/A | �� | | West | | | 1,510 | | | | 2,280 | | | | 0.00 | % | | None | | February-06 | | February-06 |
| | | | | | | | | | | | | | | | | | | | | | | | | | | | | | | |
DLH Management Corporation Total | | | | | | | | | | | | | | | | | | | 1,510 | | | | 2,280 | | | | 0.00 | % | | | | | | | | | | | | |
| | | | | | | | | | | | | | | | | | | | | | | | | | | | | | | | | | | | | | | | | |
| Tempered Air Services, Inc. | | Broomfield, CO | | Office | | | N/A | | | West | | | 1,200 | | | | 1,200 | | | | 0.00 | % | | None | | December-05 | | December-05 |
| | | | | | | | | | | | | | | | | | | | | | | | | | | | | | | |
Tempered Air Services, Inc. Total | | | | | | | | | | | | | | | | | | | 1,200 | | | | 1,200 | | | | 0.00 | % | | | | | | | | | | | | |
| | | | |
| | | | | |
| Ticker: WPC | | | | www.wpcarey.com |
EXHIBIT E
| | | | | | | | | | | | | | | | | | | | | | | | | | | | | | | | | | | | | | | | | |
| | | | | | | | | | | | | | | | | | | | | | | Percentage of | | | Increase | | | Lease | | | Maximum | | | | |
| Tenant/Lease Guarantor | | Property Location | | | Property Type | | | Tenant Type | | | Region | | | Square Footage | | | Annual Rent | | | Total Rent | | | Factor | | | Expiration | | | Term | |
| |
| | | | | | | | | | | | | | | | | | | | | | | | | | | | | | | | | | | | | | | | | |
| Vacant | | Cincinnati, OH | | Industrial | | Manufacturing | | Midwest | | | 593,340 | | | | | | | | | | | | | | | | | | | | | |
| Vacant | | Travelers Rest, SC | | Industrial | | | N/A | | | East | | | 181,700 | | | | — | | | | — | | | | N/A | | | | N/A | | | | N/A | |
| Vacant | | Salisbury, NC | | Warehouse/Distribution | | | N/A | | | East | | | 88,000 | | | | | | | | | | | | | | | | | | | | | |
| Vacant | | Erlanger, KY | | Warehouse/Distribution | | | N/A | | | East | | | 79,200 | | | | — | | | | — | | | | N/A | | | | N/A | | | | N/A | |
| Vacant | | Moorestown, NJ | | Office | | | N/A | | | East | | | 65,567 | | | | | | | | | | | | | | | | | | | | | |
| Vacant | | Reno, NV | | Office | | Transportation and Warehousing | | West | | | 53,158 | | | | | | | | | | | | N/A | | | | N/A | | | | N/A | |
| Vacant | | Bloomingdale, IL | | Office | | | N/A | | | Midwest | | | 36,967 | | | | — | | | | — | | | | N/A | | | | N/A | | | | N/A | |
| Vacant | | Bay Minette, AL | | Retail | | | N/A | | | South | | | 34,887 | | | | | | | | | | | | | | | | | | | | | |
| Vacant | | Broomfield, CO | | Office | | | N/A | | | West | | | 22,477 | | | | | | | | | | | | | | | | | | | | | |
| Vacant | | Webster, TX | | Industrial | | | N/A | | | South | | | 17,859 | | | | | | | | | | | | | | | | | | | | | |
| Vacant (Common Area Space) | | Bloomingdale, IL | | Office | | | N/A | | | Midwest | | | 14,084 | | | | | | | | | | | | | | | | | | | | | |
| Vacant | | Salisbury, NC | | Industrial | | | N/A | | | East | | | 13,284 | | | | | | | | | | | | | | | | | | | | | |
| Vacant | | Salisbury, NC | | Warehouse/Distribution | | | N/A | | | East | | | 10,681 | | | | — | | | | — | | | | N/A | | | | N/A | | | | N/A | |
| Vacant | | Broomfield, CO | | Office | | | N/A | | | West | | | 5,819 | | | | — | | | | — | | | | N/A | | | | N/A | | | | N/A | |
| Vacant | | Houston, TX | | Office | | | N/A | | | South | | | 5,742 | | | | | | | | | | | | | | | | | | | | | |
| Vacant | | Paris, France | | Office | | | N/A | | | Europe | | | 2,301 | | | | | | | | | | | | | | | | | | | | | |
| Vacant | | Broomfield, CO | | Office | | | N/A | | | West | | | 1,033 | | | | — | | | | — | | | | N/A | | | | N/A | | | | N/A | |
| | | | | | | | | | | | | | | | | | | | | | | | | | | | | | | | | | | | | | | | | |
Vacant Total | | | | | | | | | | | | | | | | | | | 1,226,099 | | | | — | | | | — | | | | | | | | | | | | | |
| | | | | | | | | | | | | | | | | | | | | | | | | | | | | | | | | | | | | | | | | |
Grand Total | | | | | | | | | | | | | | | | | | | 17,074,370 | | | | 85,566,789 | | | | 100 | % | | | | | | | | | | | | |
| | |
| (1) | | WPC LLC owns 95% of this property. Rents reflect a conversion rate of 1.1844 USD/EUR as of December 31, 2005. |
| |
| (2) | | INSEE construction index, an index published quarterly by the French Government. |
| |
| (3) | | WPC LLC owns 75% of this property. Rents reflect a conversion rate of 1.1844 USD/EUR as of December 31, 2005. |
| |
| (4) | | WPC LLC owns 22.5% of this property. Rents reflect a conversion rate of 1.1844 USD/EUR as of December 31, 2005. |
| |
| (5) | | WPC LLC owns 40% of this property. |
| |
| (6) | | WPC LLC owns 74.583% of this property. |
| |
| (7) | | WPC LLC owns 50% of this property. |
| |
| (8) | | WPC LLC owns 33.33% of this property. |
| |
| (9) | | WPC LLC owns 36.00% of this property. |
| |
| (10) | | WPC LLC owns 33.93% of this property. |
| |
| (11) | | WPC LLC owns 80% of this property. Rents reflect a conversion rate of 1.1844 USD/EUR as of December 31, 2005. |
| | | | |
| | | | | |
| Ticker: WPC | | | | www.wpcarey.com |