Exhibit 99.2
W. P. Carey Inc.
Supplemental Information
Second Quarter 2014
W. P. Carey Inc. unaudited supplemental financial and operating information.
Important Disclosures About This Supplemental Package
As used in this supplemental package, the terms “W. P. Carey,” “WPC,” “the Company,” “we,” “us,” and “our” include W. P. Carey Inc., its consolidated subsidiaries, and predecessors, unless otherwise indicated. The “CPA®:16 Merger” means our merger with Corporate Property Associates 16 – Global Incorporated, or CPA®:16 – Global, which was completed on January 31, 2014. “CPA® REITs” means CPA®:16 – Global (through the date of the CPA®:16 Merger), Corporate Property Associates 17 – Global Incorporated, or CPA®:17 – Global, and Corporate Property Associates 18 – Global Incorporated, or CPA®:18 – Global. The “Managed REITs” means the CPA® REITs and Carey Watermark Investors Incorporated, or CWI. "U.S." means United States.
Important Note Regarding Non-GAAP Financial Measures
This supplemental package includes certain “non-GAAP” supplemental measures that are not defined by generally accepted accounting principles, or GAAP, including funds from operations, or FFO, adjusted funds from operations, previously referred to as funds from operations – as adjusted, or AFFO, earnings before interest, taxes, depreciation, and amortization, or EBITDA, adjusted EBITDA, pro rata cash net operating income, or pro rata cash NOI, and normalized pro rata cash NOI. A description of these non-GAAP financial measures and reconciliations to their most directly comparable GAAP measures as well as a description of other metrics presented are provided within the Appendix to this supplemental package. FFO is a non-GAAP measure defined by the National Association of Real Estate Investments Trusts, or NAREIT.
W. P. Carey Inc.
Supplemental Information – Second Quarter 2014
|
| |
| Overview | |
| |
| |
| | |
| Financial Results | |
| |
| |
| | |
| Balance Sheet and Capitalization | |
| |
| |
| |
| |
| | |
| Owned Real Estate Portfolio | |
| |
| |
| |
| |
| |
| |
| |
| |
| |
| | |
| Investment Management | |
| |
| |
| | |
| Appendix | |
| |
| |
| |
| |
| | |
W. P. Carey Inc.
Overview – Second Quarter 2014
As of or for the three months ended June 30, 2014.
|
| | | | | | | | | | | |
| Financial Results | | | | | |
| Real estate revenues, excluding reimbursable tenant costs ($'000) | | | | | $ | 170,985 |
|
| Revenues from the Managed REITs, excluding reimbursable costs ($'000) | | | | | 34,248 |
|
| Net income attributable to W. P. Carey ($'000) | | | | | 64,739 |
|
| Net income attributable to W. P. Carey per diluted share | | | | | 0.64 |
|
AFFO ($'000) (a) | | | | | 122,246 |
|
AFFO per diluted share (a) | | | | | 1.21 |
|
Normalized pro rata cash NOI ($’000) (b) | | | | | 157,162 |
|
Adjusted EBITDA ($'000) (c) | | | | | 175,142 |
|
| | | | | | |
| Distributions declared per share – current quarter | | | | | 0.900 |
|
| Distributions declared per share – current quarter annualized | | | | | 3.60 |
|
| Dividend yield (annualized, based on end of period share price) | | | | | 5.6 | % |
Dividend payout (annualized) (d) | | | | | 74.4 | % |
| | | | | | |
| Balance Sheet and Capitalization | | | | | |
| Shares outstanding | | | | | 99,379,788 |
|
| Stock price – at quarter end | | | | | $ | 64.40 |
|
| | | | | | |
| Equity market capitalization ($'000) | | | | | 6,400,058 |
|
Total pro rata debt outstanding ($'000) (e) | | | | | 3,716,758 |
|
| Consolidated cash and cash equivalents ($'000) | | | | | 214,971 |
|
Enterprise value ($'000) (f) | | | | | 9,901,845 |
|
Net pro rata debt ($'000) (g) | | | | | 3,501,787 |
|
| Total consolidated debt ($'000) | | | | | 3,798,370 |
|
Gross assets ($’000) (h) | | | | | 8,510,903 |
|
Liquidity ($'000) (i) | | | | | 988,271 |
|
| | | | | | |
| Net pro rata debt to enterprise value | | | | | 35.4 | % |
| Net pro rata debt to adjusted EBITDA (annualized) | | | | | 5.0x |
|
| Total consolidated debt to gross assets | | | | | 44.6 | % |
| Carrying value of unencumbered real estate portfolio ($'000) | | | | | $ | 1,583,879 |
|
| | | | | | |
Weighted average interest rate (e) | | | | | 4.6 | % |
Weighted average debt maturity (years) (e) | | | | | 5.2 |
|
| | | | | | |
| Standard & Poor's Rating Services (January 2014) | | | | | BBB (stable) |
|
| Moody's Investors Service (January 2014) | | | | | Baa2 (stable) |
|
| | | | | | |
| Owned Real Estate Portfolio (Pro Rata) | | | | | |
| Number of net-leased properties | | | | | 686 |
|
| Number of operating properties | | | | | 4 |
|
Number of tenants (net-leased properties) | | | | | 216 |
|
Number of investment grade tenants (net-leased properties) (j) | | | | | 39 |
|
ABR from Investment Grade tenants as a % of total ABR (net-leased properties) (k) | | | | | 25.1 | % |
| | | | | | |
| Net-leased properties – square feet (millions) | | | | | 81.8 |
|
Operating properties – square feet (millions) (l) | | | | | 0.3 |
|
| Total square feet (millions) | | | | | 82.1 |
|
| | | | | | |
Occupancy – net-leased properties (%) (m) | | | | | 98.5 | % |
| Weighted average lease term (years) | | | | | 8.6 |
|
| | | | | | |
| Acquisitions – current quarter ($'000) | | | | | $ | 47,208 |
|
| Dispositions – current quarter ($'000) | | | | | 170,638 |
|
| | | | | | |
| Managed REITs | CPA® REITs | | CWI | | Total |
AUM ($'000) (n) | $ | 6,651,323 |
| | $ | 1,567,074 |
| | $ | 8,218,397 |
|
| Acquisitions – current quarter ($'000) | 151,859 |
| | 407,394 |
| | 559,253 |
|
| Dispositions – current quarter ($'000) | 68,250 |
| | — |
| | 68,250 |
|
|
| | |
|
| Investing for the long runTM | 1 |
W. P. Carey Inc.
Overview – Second Quarter 2014
________
| |
| (a) | AFFO is a non-GAAP measure. See the Terms and Definitions section in the Appendix for a description of our non-GAAP measures and for a reconciliation of net income to AFFO. |
| |
| (b) | Normalized pro rata cash NOI is a non-GAAP measure. See the Terms and Definitions section in the Appendix for a description of our non-GAAP measures and for details on how normalized pro rata cash NOI is calculated. |
| |
| (c) | Adjusted EBITDA is a non-GAAP measure. See the Terms and Definitions section in the Appendix for a description of our non-GAAP measures and for a reconciliation of net income to adjusted EBITDA. |
| |
| (d) | Annualized dividend per share divided by annualized AFFO per share. |
| |
| (e) | Presented on a pro rata basis. See the Terms and Definitions section in the Appendix for a description of pro rata. |
| |
| (f) | Represents equity market capitalization plus total pro rata debt outstanding, less consolidated cash and cash equivalents. See the Terms and Definitions section in the Appendix for a description of pro rata. |
| |
| (g) | Represents total pro rata debt outstanding less consolidated cash and cash equivalents. See the Terms and Definitions section in the Appendix for a description of pro rata. |
| |
| (h) | Gross assets represent consolidated total assets before accumulated depreciation. |
| |
| (i) | Represents availability on our Senior Unsecured Credit Facility – Revolver plus cash and cash equivalents. |
| |
| (j) | Includes only Investment Grade tenants, defined as those having a BBB- rating or higher by Standard & Poor’s Rating Services. We evaluate the credit quality of our tenants utilizing an internal five-point credit rating scale, with one representing the highest credit quality, comprised solely of Investment Grade tenants, and five representing the lowest credit quality. The credit quality evaluation of our tenants is updated quarterly. We had 177 non-investment grade tenants as of June 30, 2014, with a weighted-average credit rating of 3.2. |
| |
| (k) | Percentage of portfolio is calculated based on contractual minimum annualized base rent, or ABR, as of June 30, 2014. |
| |
| (l) | Comprised of our two self-storage properties and two hotel properties. |
| |
| (m) | Represents occupancy for our net-leased properties. Occupancy for our two self-storage properties was 93.3% as of June 30, 2014. Occupancy for our two hotels was 83.4% for the six months ended June 30, 2014. |
| |
| (n) | Represents estimated value of real estate assets plus cash and cash equivalents, less distributions payable. |
|
| | |
|
| Investing for the long runTM | 2 |
W. P. Carey Inc.
Overview – Second Quarter 2014
|
| |
| Components of Net Asset Value |
In thousands, except shares, per share amounts, and percentages.
|
| | | | | | | |
| Real Estate | | | | | As of or for the Three Months Ended Jun. 30, 2014 |
| Owned Real Estate: | | | | | |
Normalized pro rata cash NOI (a) | | | | | $ | 157,162 |
|
| | | | | | |
| Operating Partnership Interests in Real Estate Cash Flow of Managed REITs: | | | | |
CPA®:17 – Global | | | | | 4,590 |
|
CPA®:18 – Global | | | | | 537 |
|
| CWI | | | | | 108 |
|
| | | | | | 5,235 |
|
| Investment Management | | | | | |
| Investment Management Revenues: | | | | | |
| Structuring revenue | | | | | 17,254 |
|
| Asset management revenue | | | | | 9,045 |
|
| | | | | | 26,299 |
|
| Balance Sheet - Selected Information (Consolidated Unless Otherwise Stated) |
| Assets: | | | | | |
| Cash and cash equivalents | | | | | $ | 214,971 |
|
| Due from affiliates | | | | | 39,516 |
|
| Other assets, net: | | | | | |
| Restricted cash, including escrow | | | | | $ | 194,080 |
|
| Other intangible assets, net | | | | | 36,695 |
|
| Straight-line rent adjustments | | | | | 23,818 |
|
| Notes receivable | | | | | 21,003 |
|
| Deferred charges | | | | | 18,481 |
|
| Accounts receivable | | | | | 17,504 |
|
| Prepaid expenses | | | | | 12,063 |
|
| Leasehold improvements, furniture, and fixtures | | | | | 10,692 |
|
| Securities and derivatives | | | | | 8,666 |
|
| Other | | | | | 3,851 |
|
| Total other assets, net | | | | | $ | 346,853 |
|
| | | | | | |
| Liabilities: | | | | | |
Total pro rata debt outstanding (b) | | | | | $ | 3,716,758 |
|
| Distributions payable | | | | | 90,610 |
|
| Deferred income taxes | | | | | 87,991 |
|
| Other liabilities: | | | | | |
| Accounts payable and accrued expenses | | | | | $ | 167,801 |
|
| Prepaid and deferred rents | | | | | 72,576 |
|
| Tenant security deposits | | | | | 40,706 |
|
| Accrued income taxes payable | | | | | 14,729 |
|
| Straight-line rent adjustments | | | | | 2,337 |
|
| Other | | | | | 283 |
|
| Total other liabilities | | | | | $ | 298,432 |
|
|
| | |
|
| Investing for the long runTM | 3 |
W. P. Carey Inc.
Overview – Second Quarter 2014
|
| | | | | | | | | | |
| Other | Number of Shares Owned | | NAV / Offering Price Per Share | | Implied Value |
| | A | | B | | A x B |
Ownership in Managed REITs: (c) | | | | |
|
|
CPA®:17 – Global (2.3% ownership) | 7,413,076 |
| | $ | 9.50 |
| (d) | $ | 70,424 |
|
CPA®:18 – Global (0.1% ownership) | 106,781 |
| | 10.00 |
| (e) | 1,068 |
|
| CWI (0.9% ownership) | 738,996 |
| | 9.00 |
| (f) | 6,651 |
|
| | | | | | $ | 78,143 |
|
________
| |
| (a) | Normalized pro rata cash NOI is a non-GAAP measure. See the Terms and Definitions section in the Appendix for a description of our non-GAAP measures and for details on how normalized pro rata cash NOI is calculated. |
| |
| (b) | Presented on a pro rata basis. See the Terms and Definitions section in the Appendix for a description of pro rata. |
| |
| (c) | Excludes operating partnership interests. |
| |
| (d) | The estimated net asset value per share, or NAV, for CPA®:17 – Global was determined as of December 31, 2013. WPC calculated CPA®:17 – Global’s NAV by relying in part on an estimate of the fair market value of CPA®:17 – Global’s provided by a third party, adjusted to give effect to the estimated fair value of mortgage loans encumbering its assets (also provided by a third party) as well as other adjustments. |
| |
| (e) | The offering price shown is the initial offering price for shares of CPA®:18 – Global’s Class A common stock, as WPC owns shares of CPA®:18 – Global’s Class A common stock. |
| |
| (f) | CWI’s NAV was calculated by WPC, relying in part on appraisals of the fair market value of CWI’s real estate portfolio and mortgage debt provided by third parties. The net amount was then adjusted for estimated disposition costs (including estimates of expenses, commissions, and fees payable to WPC) and CWI’s other net assets and liabilities at the same date. CWI’s NAV was estimated at $10.24 per share as of September 30, 2013, and was based on shares of common stock outstanding at November 30, 2013. In December 2013, CWI declared a special stock dividend in which stockholders of record as of the close of business on December 16, 2013 received 0.1375 shares of its common stock for each share owned. Shares were issued on December 19, 2013. As a result of the increased number of outstanding shares of CWI’s common stock due to the stock dividend, CWI’s estimated NAV was adjusted from $10.24 to $9.00. This adjustment facilitates equivalent treatment of investors in CWI’s initial public offering and investors in its follow-on offering and enables CWI to offer its stock in the follow-on offering at a consistent price of $10.00 per share, inclusive of commissions and offering costs. |
|
| | |
|
| Investing for the long runTM | 4 |
W. P. Carey Inc.
Financial Results
Second Quarter 2014
|
| | |
|
| Investing for the long runTM | 5 |
W. P. Carey Inc.
Financial Results – Second Quarter 2014
|
| |
| Consolidated Statements of Income |
In thousands, except share and per share amounts. Unaudited.
|
| | | | | | | |
| | Three Months Ended |
| | Jun. 30, 2014 | | Mar. 31, 2014 |
| Revenues | | | (Revised) (a) |
| Real estate revenues: | | | |
| Lease revenues | $ | 148,253 |
| | $ | 123,068 |
|
| Reimbursable tenant costs | 5,749 |
| | 6,014 |
|
| Operating property revenues | 8,251 |
| | 4,992 |
|
| Lease termination income and other | 14,481 |
| | 1,000 |
|
| | 176,734 |
| | 135,074 |
|
| Revenues from the Managed REITs: | | | |
| Reimbursable costs | 41,925 |
| | 39,732 |
|
| Structuring revenue | 17,254 |
| | 17,750 |
|
| Asset management revenue | 9,045 |
| | 9,777 |
|
| Dealer manager fees | 7,949 |
| | 6,676 |
|
| | 76,173 |
| | 73,935 |
|
| | 252,907 |
| | 209,009 |
|
| Operating Expenses | | | |
| Depreciation and amortization | 63,445 |
| | 52,673 |
|
| Reimbursable tenant and affiliate costs | 47,674 |
| | 45,746 |
|
| General and administrative | 19,133 |
| | 22,671 |
|
| Property expenses, excluding reimbursable tenant costs | 11,209 |
| | 8,418 |
|
| Stock-based compensation expense | 7,957 |
| | 7,043 |
|
| Dealer manager fees and expenses | 6,285 |
| | 5,424 |
|
| Subadvisor fees | 2,451 |
| | 18 |
|
| Impairment charges | 2,066 |
| | — |
|
| Merger and acquisition expenses | 1,137 |
| | 29,613 |
|
| | 161,357 |
| | 171,606 |
|
| Other Income and Expenses | | | |
| Net income from equity investments in real estate and the Managed REITs | 9,452 |
| | 14,262 |
|
Gain on change in control of interests (a) | — |
| | 104,645 |
|
| Interest expense | (47,733 | ) | | (39,075 | ) |
| Other income and (expenses) | (883 | ) | | (5,451 | ) |
| | (39,164 | ) | | 74,381 |
|
| Income from continuing operations before income taxes | 52,386 |
| | 111,784 |
|
| Provision for from income taxes | (8,053 | ) | | (2,240 | ) |
| Income from continuing operations before (loss) gain on sale of real estate | 44,333 |
| | 109,544 |
|
| Income from discontinued operations, net of tax | 26,460 |
| | 6,392 |
|
| (Loss) gain on sale of real estate, net of tax | (3,821 | ) | | 80 |
|
| Net Income | 66,972 |
| | 116,016 |
|
| Net income attributable to noncontrolling interests | (2,344 | ) | | (1,578 | ) |
| Net loss (income) attributable to redeemable noncontrolling interest | 111 |
| | (262 | ) |
| Net Income Attributable to W. P. Carey | $ | 64,739 |
| | $ | 114,176 |
|
| Basic Earnings Per Share | | | |
| Income from continuing operations attributable to W. P. Carey | $ | 0.38 |
| | $ | 1.20 |
|
| Income from discontinued operations attributable to W. P. Carey | 0.26 |
| | 0.07 |
|
| Net Income Attributable to W. P. Carey | $ | 0.64 |
| | $ | 1.27 |
|
| Diluted Earnings Per Share | | | |
| Income from continuing operations attributable to W. P. Carey | $ | 0.38 |
| | $ | 1.19 |
|
| Income from discontinued operations attributable to W. P. Carey | 0.26 |
| | 0.07 |
|
| Net Income Attributable to W. P. Carey | $ | 0.64 |
| | $ | 1.26 |
|
| Weighted Average Shares Outstanding | | | |
| Basic | 100,236,362 |
| | 89,366,055 |
|
| Diluted | 100,995,225 |
| | 90,375,311 |
|
| Amounts Attributable to W. P. Carey | | | |
| Income from continuing operations, net of tax | $ | 38,236 |
| | $ | 107,636 |
|
| Income from discontinued operations, net of tax | 26,503 |
| | 6,540 |
|
| Net Income | $ | 64,739 |
| | $ | 114,176 |
|
| Distributions Declared Per Share | $ | 0.900 |
| | $ | 0.895 |
|
|
| | |
|
| Investing for the long runTM | 6 |
W. P. Carey Inc.
Financial Results – Second Quarter 2014
________
| |
| (a) | Gain on change in control of interests for the three months ended March 31, 2014 represents a gain of $74.4 million recognized on our previously-held interest in shares of CPA®:16 – Global common stock, and a gain of $30.2 million recognized on the purchase of the remaining interests in nine investments from CPA®:16 – Global, which we had previously accounted for under the equity method. During the six months ended June 30, 2014, one of these investments was sold. During the second quarter of 2014, we identified certain measurement period adjustments which increased the fair value of our previously-held interest in shares of CPA®:16 – Global common stock by $1.3 million. We did not record this adjustment during the three months ended June 30, 2014 but rather in the three months ended March 31, 2014. Consequently, amounts presented above for gain on change in control of interests and net income for the three months ended March 31, 2014 differ from amounts presented in the first quarter filings. |
|
| | |
|
| Investing for the long runTM | 7 |
W. P. Carey Inc.
Financial Results – Second Quarter 2014
|
| |
| Reconciliation of Consolidated Statement of Income to AFFO |
In thousands, except per share amounts. Unaudited. Three months ended June 30, 2014.
We believe that the table below is useful for investors to help them better understand our business by illustrating the impact of each of our AFFO adjustments on our GAAP statement of income. This presentation is not an alternative to the GAAP statement of income, nor is AFFO an alternative to net income as determined by GAAP. The reconciliation of GAAP net income to AFFO required by SEC Regulation G, as well as other important disclosures regarding our calculation of AFFO and the limitations on its usefulness to investors, are presented in the Appendix.
|
| | | | | | | | | | | | | | | | | | | | | | | |
| | GAAP - Basis (a) | | Add: Equity Investments (b) | | Less: Noncontrolling Interests (c) | | WPC's Pro Rata Share (d) | | AFFO Adjustments | | AFFO |
| Revenues | A | | B | | C | | A + B + C = D | | E | | D + E |
| Real estate revenues: | | | | | | | | | | | |
| Lease revenues (e) | $ | 148,253 |
| | $ | 4,777 |
| | $ | (6,472 | ) | | $ | 146,558 |
| | $ | 13,006 |
| (f) | $ | 159,564 |
|
| Reimbursable tenant costs | 5,749 |
| | 98 |
| | (248 | ) | | 5,599 |
| | — |
| | 5,599 |
|
| Operating property revenues: | | | | | | | | | | | |
| Hotel revenues | 7,992 |
| | — |
| | — |
| | 7,992 |
| | — |
| | 7,992 |
|
| Self-storage revenues | 259 |
| | — |
| | (88 | ) | | 171 |
| | — |
| | 171 |
|
| Lease termination income and other | 14,481 |
| | — |
| | (2 | ) | | 14,479 |
| | (10,301 | ) | (g) | 4,178 |
|
| | 176,734 |
|
| 4,875 |
| | (6,810 | ) | | 174,799 |
| | 2,705 |
| | 177,504 |
|
| Revenues from affiliates: | | | | | | | | | | | |
| Reimbursable costs | 41,925 |
| | — |
| | (150 | ) | | 41,775 |
| | — |
| | 41,775 |
|
| Structuring revenue | 17,254 |
| | — |
| | (89 | ) | | 17,165 |
| | — |
| | 17,165 |
|
| Asset management revenue | 9,045 |
| | — |
| | (115 | ) | | 8,930 |
| | — |
| | 8,930 |
|
| Dealer manager fees | 7,949 |
| | — |
| | — |
| | 7,949 |
| | — |
| | 7,949 |
|
| | 76,173 |
| | — |
| | (354 | ) | | 75,819 |
| | — |
| | 75,819 |
|
| | 252,907 |
| | 4,875 |
| | (7,164 | ) | | 250,618 |
| | 2,705 |
| | 253,323 |
|
| Operating Expenses | | | | | | | | | | | |
| Depreciation and amortization | 63,445 |
| | 544 |
| | (3,006 | ) | | 60,983 |
| | (59,792 | ) | | 1,191 |
|
| Reimbursable tenant and affiliate costs | 47,674 |
| | 98 |
| | (104 | ) | | 47,668 |
| | — |
| | 47,668 |
|
| General and administrative | 19,133 |
| | 2 |
| | (479 | ) | | 18,656 |
| | — |
| | 18,656 |
|
| Property expenses, excluding reimbursable tenant costs: |
| Non-reimbursable property expenses | 5,588 |
| | 10 |
| | (16 | ) | | 5,582 |
| | — |
| | 5,582 |
|
| Hotel expenses | 5,482 |
| | — |
| | — |
| | 5,482 |
| | — |
| | 5,482 |
|
| Self-storage expenses | 139 |
| | — |
| | (50 | ) | | 89 |
| | — |
| | 89 |
|
| Stock-based compensation expense | 7,957 |
| | — |
| | (28 | ) | | 7,929 |
| | (7,929 | ) | | — |
|
| Dealer manager fees and expenses | 6,285 |
| | — |
| | — |
| | 6,285 |
| | — |
| | 6,285 |
|
| Subadvisor fees | 2,451 |
| | — |
| | — |
| | 2,451 |
| | — |
| | 2,451 |
|
| Impairment charges | 2,066 |
| | — |
| | — |
| | 2,066 |
| | (2,066 | ) | | — |
|
| Merger and acquisition expenses | 1,137 |
| | — |
| | — |
| | 1,137 |
| | (1,137 | ) | | — |
|
| | 161,357 |
| | 654 |
| | (3,683 | ) | | 158,328 |
| | (70,924 | ) | | 87,404 |
|
| Other Income and Expenses | | | | | | | | | | | |
| Net income from equity investments in real estate and the Managed REITs: |
| Joint ventures | 3,567 |
| | (3,567 | ) | | — |
| | — |
| | — |
| | — |
|
| Income related to our ownership in the Managed REITs | 649 |
| | — |
| | — |
| | 649 |
| | 935 |
| (h) | 1,584 |
|
| Income related to our general partnership interests | 5,236 |
| | — |
| | (19 | ) | | 5,217 |
| | — |
| | 5,217 |
|
| Total net income from equity investments in real estate and the Managed REITs | 9,452 |
| | (3,567 | ) | | (19 | ) | | 5,866 |
| | 935 |
| | 6,801 |
|
| Interest expense | (47,733 | ) | | (1,296 | ) | | 2,406 |
| | (46,623 | ) | | 2,716 |
| (i) | (43,907 | ) |
| Other income and (expenses) | (883 | ) | | 621 |
| | (296 | ) | | (558 | ) | | 1,607 |
| (j) | 1,049 |
|
| | (39,164 | ) | | (4,242 | ) | | 2,091 |
| | (41,315 | ) | | 5,258 |
| | (36,057 | ) |
| Income from continuing operations before income taxes | 52,386 |
| | (21 | ) | | (1,390 | ) | | 50,975 |
| | 78,887 |
| | 129,862 |
|
| Provision for income taxes | (8,053 | ) | | 21 |
| | (443 | ) | | (8,475 | ) | | (708 | ) | (k) | (9,183 | ) |
| Income from continuing operations before loss on sale of real estate | 44,333 |
| | — |
| | (1,833 | ) | | 42,500 |
| | 78,179 |
| | 120,679 |
|
| Discontinued Operations | | | | | | | | | | | |
| Income from operations of discontinued properties | 1,624 |
| | — |
| | — |
| | 1,624 |
| | (57 | ) | (l) | 1,567 |
|
| Gain on extinguishment of debt | 249 |
| | — |
| | — |
| | 249 |
| | (249 | ) | | — |
|
| Gain on the sale of real estate | 24,574 |
| | — |
| | — |
| | 24,574 |
| | (24,574 | ) | | — |
|
| Other | 13 |
| | — |
| | — |
| | 13 |
| | (13 | ) | | — |
|
| Income from Discontinued Operations, Net of Tax | 26,460 |
| | — |
| | — |
| | 26,460 |
| | (24,893 | ) | | 1,567 |
|
| Loss on sale of real estate, net of tax | (3,821 | ) | | — |
| | (400 | ) | | (4,221 | ) | | 4,221 |
| | — |
|
| Net Income | 66,972 |
| | — |
| | (2,233 | ) | | 64,739 |
| | 57,507 |
| | 122,246 |
|
| Net income attributable to noncontrolling interests | (2,344 | ) | | — |
| | 2,344 |
| | — |
| | — |
| | — |
|
| Net income attributable to redeemable noncontrolling interest | 111 |
| | — |
| | (111 | ) | | — |
| | — |
| | — |
|
| Net Income / AFFO Attributable to W. P. Carey | $ | 64,739 |
| | $ | — |
| | $ | — |
| | $ | 64,739 |
| | $ | 57,507 |
| | $ | 122,246 |
|
| Earnings / AFFO Per Diluted Share | $ | 0.64 |
| | | | | | | | | | $ | 1.21 |
|
|
| | |
|
| Investing for the long runTM | 8 |
W. P. Carey Inc.
Financial Results – Second Quarter 2014
________
| |
| (a) | Consolidated amounts shown represent WPC's Consolidated Statement of Income for the three months ended June 30, 2014. |
| |
| (b) | Represents the break-out by line item of amounts recorded in net income from equity investments in real estate and the Managed REITs – Joint ventures. |
| |
| (c) | Represents the break-out by line item of amounts recorded in noncontrolling interest and redeemable noncontrolling interest. |
| |
| (d) | Represents our share in fully-owned entities and co-owned entities. See the Terms and Definitions section that follows for a description of pro rata. |
| |
| (e) | Lease revenues on a pro rata basis in this schedule reflect only revenues from continuing operations. Lease revenues from discontinued operations for the three months ended June 30, 2014 were $1.8 million. |
| |
| (f) | Represents the elimination of non-cash amounts related to straight-line rent and the reversal of amortization of above- or below-market lease intangibles. |
| |
| (g) | Represents the elimination of lease termination fees booked under GAAP that management considers to be either a gain on sale of real estate or a stream of future monthly cash lease revenues. |
| |
| (h) | Adjustments include MFFO from the Managed REITs in place of our pro rata share of net income from our ownership in the Managed REITs. |
| |
| (i) | Represents the elimination of non-cash components of interest expense, primarily for fair market value related to mortgage loans. |
| |
| (j) | Represents eliminations or (gains) losses related to the extinguishment of debt, foreign currency, derivatives, and other related to continuing operations. |
| |
| (k) | Represents elimination of deferred taxes. |
| |
| (l) | Represents depreciation and amortization and gain on foreign exchange related to discontinued operations. |
|
| | |
|
| Investing for the long runTM | 9 |
W. P. Carey Inc.
Balance Sheet and Capitalization
Second Quarter 2014
|
| | |
|
| Investing for the long runTM | 10 |
W. P. Carey Inc.
Balance Sheet and Capitalization – Second Quarter 2014 |
| |
| Consolidated Balance Sheets |
In thousands. Unaudited.
|
| | | | | | | |
| | Jun. 30, 2014 | | Dec. 31, 2013 |
| Assets | | | |
| Investments in real estate: | | | |
| Real estate, at cost | $ | 4,497,999 |
| | $ | 2,516,325 |
|
| Operating real estate, at cost | 84,544 |
| | 6,024 |
|
| Accumulated depreciation | (217,155 | ) | | (168,958 | ) |
| Net investments in properties | 4,365,388 |
| | 2,353,391 |
|
| Net investments in direct financing leases | 880,000 |
| | 363,420 |
|
| Assets held for sale | — |
| | 86,823 |
|
Equity investments in real estate and the Managed REITs (a) | 211,225 |
| | 530,020 |
|
| Net investments in real estate | 5,456,613 |
| | 3,333,654 |
|
| Cash and cash equivalents | 214,971 |
| | 117,519 |
|
| Due from affiliates | 39,516 |
| | 32,034 |
|
| Goodwill | 698,891 |
| | 350,208 |
|
| In-place lease intangible assets, net | 966,406 |
| | 467,127 |
|
| Above-market rent intangible assets, net | 570,498 |
| | 241,975 |
|
| Other assets, net | 346,853 |
| | 136,433 |
|
| Total Assets | $ | 8,293,748 |
| | $ | 4,678,950 |
|
| | | | |
| Liabilities and Equity | | | |
| Liabilities: | | | |
| Non-recourse debt | $ | 2,823,415 |
| | $ | 1,492,410 |
|
| Senior credit facility and unsecured term loan | 476,700 |
| | 575,000 |
|
| Senior unsecured notes | 498,255 |
| | — |
|
| Below-market rent and other intangible liabilities, net | 180,364 |
| | 128,202 |
|
| Accounts payable, accrued expenses and other liabilities | 298,432 |
| | 166,385 |
|
| Deferred income taxes | 87,991 |
| | 39,040 |
|
| Distributions payable | 90,610 |
| | 67,746 |
|
| Total liabilities | 4,455,767 |
| | 2,468,783 |
|
| Redeemable noncontrolling interest | 6,418 |
| | 7,436 |
|
| | | | |
| Equity: | | | |
| W. P. Carey stockholders' equity: | | | |
| Preferred stock (None issued) | — |
| | — |
|
| Common stock | 100 |
| | 69 |
|
| Additional paid-in capital | 4,024,039 |
| | 2,256,503 |
|
| Distributions in excess of accumulated earnings | (327,460 | ) | | (318,577 | ) |
| Deferred compensation obligation | 30,624 |
| | 11,354 |
|
| Accumulated other comprehensive income | 14,215 |
| | 15,336 |
|
| Less: treasury stock at cost | (60,948 | ) | | (60,270 | ) |
| Total W. P. Carey stockholders' equity | 3,680,570 |
| | 1,904,415 |
|
| Noncontrolling interests | 150,993 |
| | 298,316 |
|
| Total equity | 3,831,563 |
| | 2,202,731 |
|
| Total Liabilities and Equity | $ | 8,293,748 |
| | $ | 4,678,950 |
|
| |
| (a) | Our equity investments in real estate totaled $133.3 million and $185.0 million as of June 30, 2014 and December 31, 2013, respectively. Our equity investments in the Managed REITs totaled $77.9 million and $345.0 million as of June 30, 2014 and December 31, 2013, respectively. |
|
| | |
|
| Investing for the long runTM | 11 |
W. P. Carey Inc.
Balance Sheet and Capitalization – Second Quarter 2014
In thousands, except percentages and years. Pro rata. As of June 30, 2014.
|
| | | | | | | | | | | | | |
| Non-Recourse Debt | | Weighted Average Debt Maturity (Years) | | Weighted Average Interest Rate | | Total Outstanding Balance (a) | | Percent |
| Fixed | | 5.0 |
| | 5.6 | % | | $ | 2,199,020 |
| | 59.2 | % |
| Variable – Swapped | | 4.8 |
| | 5.0 | % | | 296,030 |
| | 8.0 | % |
| Variable – Capped | | 2.1 |
| | 1.6 | % | | 198,267 |
| | 5.3 | % |
| Variable – Floating | | 0.7 |
| | 3.4 | % | | 33,982 |
| | 0.9 | % |
| Variable – Future Rate Reset | | 10.4 |
| | 6.2 | % | | 14,504 |
| | 0.4 | % |
| | | 4.8 |
| | 5.2 | % | | 2,741,803 |
| | 73.8 | % |
| Recourse Debt | | | | | | | | |
| Fixed – Senior Unsecured Notes (due April 1, 2024) | | 9.8 |
| | 4.6 | % | | 498,255 |
| | 13.4 | % |
| Variable – Senior Unsecured Credit Facility – Term Loan (maturity: January 31, 2016) | | 1.6 |
| | 1.4 | % | | 250,000 |
| | 6.7 | % |
| Variable – Senior Unsecured Credit Facility – Revolver (maturity: January 31, 2018) | | 3.6 |
| | 1.2 | % | | 226,700 |
| | 6.1 | % |
Total Pro Rata Debt Outstanding (a) | | 5.2 |
| | 4.6 | % | | $ | 3,716,758 |
| | 100.0 | % |
________
| |
| (a) | Debt data is presented on a pro rata basis. See the Terms and Definitions section in the Appendix for a description of pro rata. |
|
| | |
|
| Investing for the long runTM | 12 |
W. P. Carey Inc.
Balance Sheet and Capitalization – Second Quarter 2014
In thousands, except number of properties and percentages. Pro rata. As of June 30, 2014.
|
| | | | | | | | | | | | | | | | | | |
| | | | | | | Weighted Average Interest Rate | | | | Total Outstanding Balance (b) (c) |
| | | Number of Properties (a) | | | | | | |
| Year of Maturity | | | ABR (a) | | | Balloon | |
| Remaining 2014 | | 14 |
| | $ | 31,616 |
| | 3.3 | % | | $ | 194,368 |
| | $ | 196,694 |
|
| 2015 | | 12 |
| | 19,939 |
| | 4.9 | % | | 144,910 |
| | 144,458 |
|
| 2016 | | 106 |
| | 41,692 |
| | 5.7 | % | | 237,247 |
| | 266,723 |
|
| 2017 | | 89 |
| | 102,585 |
| | 5.2 | % | | 624,354 |
| | 685,676 |
|
| 2018 | | 34 |
| | 53,987 |
| | 5.3 | % | | 292,343 |
| | 337,841 |
|
| 2019 | | 11 |
| | 16,383 |
| | 6.2 | % | | 51,450 |
| | 67,843 |
|
| 2020 | | 22 |
| | 39,153 |
| | 5.2 | % | | 201,876 |
| | 249,216 |
|
| 2021 | | 11 |
| | 20,416 |
| | 5.9 | % | | 89,920 |
| | 116,934 |
|
| 2022 | | 30 |
| | 42,388 |
| | 5.2 | % | | 210,776 |
| | 261,963 |
|
| 2023 | | 26 |
| | 38,738 |
| | 5.1 | % | | 123,300 |
| | 197,247 |
|
| 2024 | | 24 |
| | 21,237 |
| | 5.9 | % | | 7,936 |
| | 83,891 |
|
| Thereafter | | 24 |
| | 28,098 |
| | 6.0 | % | | 46,495 |
| | 133,317 |
|
| Non-Recourse Debt | | 403 |
| | $ | 456,232 |
| | 5.2 | % | | $ | 2,224,975 |
| | $ | 2,741,803 |
|
| Recourse Debt | | | | | | | | | | |
| Senior Unsecured Notes (due April 1, 2024) | | 4.6 | % | | | | 498,255 |
|
Senior Unsecured Credit Facility – Term Loan (maturity: January 31, 2016) (d) | | 1.4 | % | | | | 250,000 |
|
Senior Unsecured Credit Facility – Revolver (maturity: January 31, 2018) (e) | | 1.2 | % | | | | 226,700 |
|
Total Pro Rata Debt Outstanding (b) | | | | | | 4.6 | % | | | | $ | 3,716,758 |
|
________
| |
| (a) | Represents the number of properties and ABR associated with the debt that is maturing in each respective year. |
| |
| (b) | Debt maturity data is presented on a pro rata basis. See the Terms and Definitions section in the Appendix for a description of pro rata. |
| |
| (c) | Total outstanding balance includes balloon payments, scheduled amortization, and unamortized premium, net. |
| |
| (d) | During the six months ended June 30, 2014, we incurred interest at London Interbank Offered Rate, or LIBOR, plus 1.25% on our Senior Unsecured Credit Facility – Term Loan Facility. We have two options to extend the maturity date of our Senior Unsecured Credit Facility – Term Loan Facility by one year. |
| |
| (e) | During the six months ended June 30, 2014, we incurred interest at LIBOR plus 1.10% on our Senior Unsecured Credit Facility – Revolver. Availability under our Senior Unsecured Credit Facility – Revolver was $773.3 million as of June 30, 2014. We have an option to extend the maturity date of our Senior Unsecured Credit Facility – Revolver by one year. |
|
| | |
|
| Investing for the long runTM | 13 |
W. P. Carey Inc.
Balance Sheet and Capitalization – Second Quarter 2014
As of June 30, 2014.
Ratings
|
| | | | | | | | |
| | | Issuer / Corporate | | Senior Unsecured Notes |
| Ratings Agency | | Rating | | Outlook | | Rating | | Outlook |
| Standard and Poor's (January 2014) | | BBB | | Stable | | BBB- | | Stable |
| Moody's (January 2014) | | Baa2 | | Stable | | Baa2 | | Stable |
Senior Unsecured Note Covenants
In March 2014, we issued $500.0 million of senior unsecured notes with an interest rate of 4.6% due in 2024, or the Senior Unsecured Notes. The following is a summary of the key financial covenants for the Senior Unsecured Notes, as defined per the terms in the prospectus supplement filed with the SEC on March 13, 2014, along with our estimated calculations of our compliance with those covenants at the end of the period presented. These ratios are not measures of our liquidity or performance and serve only to demonstrate our ability to incur additional debt, as permitted by the covenants for the Senior Unsecured Notes.
|
| | | | | | |
| Covenant | | Metric | | Required | | As of Jun. 30, 2014 |
| Limitation on the incurrence of debt | | "Total Debt" / "Total Assets" | | ≤ 60% | | 41.7% |
| Limitation on the incurrence of secured debt | | "Secured Debt" / "Total Assets" | | ≤ 40% | | 30.8% |
| Limitation on the incurrence of debt based on consolidated EBITDA to annual debt service charge | | "Consolidated EBITDA" / "Annual Debt Service Charge" | | ≥ 1.5x | | 3.6x |
| Maintenance of unencumbered asset value | | "Unencumbered Assets" / "Total Unsecured Debt" | | ≥ 150% | | 279.5% |
|
| | |
|
| Investing for the long runTM | 14 |
W. P. Carey Inc.
Owned Real Estate Portfolio
Second Quarter 2014
|
| | |
|
| Investing for the long runTM | 15 |
W. P. Carey Inc.
Owned Real Estate Portfolio – Second Quarter 2014
In thousands, except square footage. Pro rata. For the six months ended June 30, 2014.
|
| | | | | | | | | | | | | |
| Acquisitions | | | | | | | | |
| Tenant / Lease Guarantor | | Property Location(s) | | Purchase Price | | Closing Date | | Property Type(s) | | Gross Square Footage |
| Q1 Acquisition | | | | | | | | | | |
| QBE Holdings Inc. | | Chandler, AZ | | $ | 41,919 |
| | Mar-14 | | Office | | 183,000 |
|
| Q2 Acquisition | | | | | | | | | | |
| Smucker Sales and Distribution Company | | University Park, IL | | 47,208 |
| | May-14 | | Warehouse/Distribution | | 824,624 |
|
| Total Acquisitions | | $ | 89,127 |
| | | | | | 1,007,624 |
|
|
| | | | | | | | | | | | | |
| Dispositions | | | | | | | | |
| Tenant / Lease Guarantor | | Property Location(s) | | Gross Sale Price | | Closing Date | | Property Type(s) | | Gross Square Footage |
| Q1 Dispositions | | | | | | | | | | |
| Juniper Networks, Inc. | | Sunnyvale, CA | | $ | 10,200 |
| | Jan-14 | | Office | | 50,311 |
|
| American Pad & Paper, LLC (2 properties) | | Mattoon, IL; Morristown, TN | | 6,900 |
| | Jan-14 | | Industrial | | 486,507 |
|
| Bell South Corporation | | Fort Lauderdale, FL | | 4,900 |
| | Jan-14 | | Warehouse/Distribution | | 80,450 |
|
| Barnes & Noble, Inc. | | Farmington, CT | | 3,600 |
| | Jan-14 | | Retail | | 21,600 |
|
Bouygues Telecom (a) | | Tours, France | | 9,497 |
| | Jan-14 | | Office | | 96,204 |
|
| Brown Machine LLC and Capital Equipment Group | | Beaverton, MI | | 4,040 |
| | Mar-14 | | Industrial | | 142,770 |
|
| SOHO House Beach House, LLC | | Miami Beach, FL | | 81,529 |
| | Mar-14 | | Hospitality | | 52,902 |
|
BA Kitchen Components Limited (a) | | Doncaster, United Kingdom | | 6,990 |
| | Mar-14 | | Industrial | | 177,604 |
|
| Total Q1 Dispositions | | | | 127,656 |
| | | | | | 1,108,348 |
|
| Q2 Dispositions | | | | | | | | | | |
| Gibson Guitar Corporation (3 properties) | | Elgin, IL; Bozeman, MT; and Nashville, TN | | 20,000 |
| | Apr-14 | | Industrial | | 249,702 |
|
| Fairpoint Communications, Inc. | | Milton, VT | | 1,800 |
| | Apr-14 | | Industrial | | 30,624 |
|
| Vacant (formerly The Upper Deck Company, LLC) | | Carlsbad, CA | | 16,000 |
| | May-14 | | Industrial | | 246,668 |
|
| Tower Automotive Products Co., Inc. | | Milan, TN | | 1,400 |
| | May-14 | | Industrial | | 531,370 |
|
| Telos Corporation | | Ashburn Junction, VA | | 15,603 |
| | May-14 | | Office | | 192,775 |
|
| Multiple Tenants (2 properties) | | Nashville, TN | | 3,002 |
| | May-14 | | Office | | 58,635 |
|
| Multiple Tenants | | Lindon, UT | | 7,751 |
| | May-14 | | Office | | 85,100 |
|
| Town Sports International Holdings, Inc. | | Newton, MA | | 16,398 |
| | Jun-14 | | Sports | | 68,000 |
|
| New Options, Inc. | | Dallas, TX | | 1,240 |
| | Jun-14 | | Industrial | | 22,680 |
|
| Swat-Fame, Inc. | | Industry, CA | | 21,444 |
| | Jun-14 | | Warehouse/Distribution | | 325,800 |
|
| LTF Real Estate Company, Inc. (2 properties) | | Rochester Hills, MI; Canton, MI | | 66,000 |
| | Jun-14 | | Sports | | 278,982 |
|
| Total Q2 Dispositions | | | | 170,638 |
| | | | | | 2,090,336 |
|
| Total Dispositions | | $ | 298,294 |
| | | | | | 3,198,684 |
|
________
| |
| (a) | Amounts are based on the applicable exchange rate on the date of disposition. |
|
| | |
|
| Investing for the long runTM | 16 |
W. P. Carey Inc.
Owned Real Estate Portfolio – Second Quarter 2014
|
| |
| Joint Venture Information |
In thousands, except percentages. As of June 30, 2014. |
| | | | | | | | | | | | | | | | | | | | | | | | | | | | | |
Joint Venture or JV (Principal Tenant) | | WPC % Interest in JV | | | | Total JV | | | WPC Pro Rata Share of Total JV (a) |
| | | JV Partner % | | Assets | | Liabilities | | Equity | | | Assets | | Liabilities | | Equity |
| | | | | | | | | | | | | | | | | | |
| Equity Method Joint Ventures | | | | | | | | | | | | | | | |
Wanbishi Archives Co. Ltd. (b) | | 3.00% | | CPA®:17 – Global - 97.00% | | $ | 40,991 |
| | $ | 28,249 |
| | $ | 12,742 |
| | | $ | 1,230 |
| | $ | 847 |
| | $ | 383 |
|
C1000 Logistiek Vastgoed B.V. (b) | | 15.00% | | CPA®:17 – Global - 85.00% | | 190,104 |
| | 95,139 |
| | 94,965 |
| | | 28,516 |
| | 14,271 |
| | 14,245 |
|
Actebis Peacock GmbH (b) | | 30.00% | | CPA®:17 – Global - 70.00% | | 42,836 |
| | 28,940 |
| | 13,896 |
| | | 12,851 |
| | 8,682 |
| | 4,169 |
|
Waldaschaff Automotive GmbH and Wagon Automotive Nagold GmbH (b) | | 33.33% | | CPA®:17 – Global - 67.00% | | 45,321 |
| | 20,191 |
| | 25,130 |
| | | 15,105 |
| | 6,730 |
| | 8,375 |
|
| Frontier Spinning Mills, Inc. | | 40.00% | | CPA®:17 – Global - 60.00% | | 37,576 |
| | 21,809 |
| | 15,767 |
| | | 15,030 |
| | 8,724 |
| | 6,306 |
|
| The New York Times Company | | 45.00% | | CPA®:17 – Global - 55.00% | | 250,365 |
| | 117,578 |
| | 132,787 |
| | | 112,664 |
| | 52,910 |
| | 59,754 |
|
| Total Equity Method Joint Ventures | | | | 607,193 |
| | 311,906 |
| | 295,287 |
| | | 185,396 |
| | 92,164 |
| | 93,232 |
|
| | | | | | | | | | | | | | | | | | |
| Consolidated Joint Ventures | | | | | | | | | | | | | | | |
| Carey Storage | | 38.30% | | Third parties - 61.70% | | 2,531 |
| | 2,917 |
| | (386 | ) | | | 969 |
| | 1,117 |
| | (148 | ) |
| Berry Plastics Corporation | | 50.00% | | CPA®:17 – Global - 50.00% | | 69,575 |
| | 27,398 |
| | 42,177 |
| | | 34,788 |
| | 13,699 |
| | 21,089 |
|
Tesco PLC (b) | | 51.00% | | CPA®:17 – Global - 49.00% | | 80,849 |
| | 48,093 |
| | 32,756 |
| | | 41,233 |
| | 24,527 |
| | 16,706 |
|
| Dick’s Sporting Goods, Inc. | | 55.00% | | CPA®:17 – Global - 45.00% | | 25,015 |
| | 21,439 |
| | 3,576 |
| | | 13,758 |
| | 11,791 |
| | 1,967 |
|
Hellweg Die Profi-Baumärkte GmbH & Co. KG (Hellweg 2) (b) | | 63.50% | | CPA®:17 – Global - 36.50% | | 399,557 |
| | 369,228 |
| | 30,329 |
| | | 253,719 |
| | 234,460 |
| | 19,259 |
|
Eroski Sociedad Cooperativa (b) | | 70.00% | | CPA®:17 – Global - 30.00% | | 32,834 |
| | 1,466 |
| | 31,368 |
| | | 22,984 |
| | 1,026 |
| | 21,958 |
|
Multi-tenant property in Illkirch-Graffens, France (b) | | 75.00% | | Third party - 25.00% | | 20,498 |
| | 14,587 |
| | 5,911 |
| | | 15,374 |
| | 10,940 |
| | 4,434 |
|
| U-Haul Moving Partners, Inc. and Mercury Partners, LP | | 88.46% | | CPA®:17 – Global - 11.54% | | 247,893 |
| | 16,705 |
| | 231,188 |
| | | 219,286 |
| | 14,777 |
| | 204,509 |
|
| Continental Airlines, Inc. | | 90.00% | | Third party - 10.00% | | 5,273 |
| | 4,276 |
| | 997 |
| | | 4,746 |
| | 3,848 |
| | 898 |
|
| Total Consolidated Joint Ventures | | | | 884,025 |
| | 506,109 |
| | 377,916 |
| | | 606,857 |
| | 316,185 |
| | 290,672 |
|
| Total Less Than Wholly-Owned Joint Ventures | | $ | 1,491,218 |
| | $ | 818,015 |
| | $ | 673,203 |
| | | $ | 792,253 |
| | $ | 408,349 |
| | $ | 383,904 |
|
________
| |
| (b) | Amounts are based on the applicable exchange rate at the end of the period. |
|
| | |
|
| Investing for the long runTM | 17 |
W. P. Carey Inc.
Owned Real Estate Portfolio – Second Quarter 2014
|
| |
| Diversification of Top Ten Tenants by ABR |
In thousands, except percentages. Pro rata. As of June 30, 2014.
|
| | | | | | | | | | | | | |
| Tenant / Lease Guarantor | | Property Type | | Tenant Industry | | Location | | ABR | | Percent |
Hellweg Die Profi-Baumärkte GmbH & Co. KG (a) | | Retail | | Retail Trade | | Germany | | $ | 42,355 |
| | 6.6 | % |
Carrefour France SAS (a) | | Warehouse/Distribution | | Retail Trade | | France | | 33,140 |
| | 5.2 | % |
| U-Haul Moving Partners Inc. and Mercury Partners, LP | | Self Storage | | Transportation - Personal | | Various U.S. | | 31,853 |
| | 5.0 | % |
OBI Group (a) | | Retail | | Retail Trade | | Poland | | 18,576 |
| | 2.9 | % |
| Marcourt Investments Inc. (Marriott Corporation) | | Hospitality | | Hotels and Gaming | | Various U.S. | | 16,100 |
| | 2.5 | % |
| True Value Company | | Warehouse/Distribution | | Construction and Building | | Various U.S. | | 14,775 |
| | 2.3 | % |
| UTI Holdings, Inc. | | Education | | Healthcare, Education and Childcare | | Various U.S. | | 14,529 |
| | 2.3 | % |
| Advanced Micro Devices, Inc. | | Office | | Electronics | | West U.S. | | 12,769 |
| | 2.0 | % |
| The New York Times Company | | Office | | Media: Printing and Publishing | | East U.S. | | 11,726 |
| | 1.8 | % |
| Dick's Sporting Goods, Inc. | | Retail and Warehouse/Distribution | | Retail Trade | | Various U.S. | | 11,639 |
| | 1.8 | % |
Total (b) (c) | | | | | | | | $ | 207,462 |
| | 32.4 | % |
________
| |
| (a) | Rent amounts are subject to fluctuations in foreign currency exchange rates. |
| |
| (b) | Represents our net-leased portfolio and, accordingly, excludes all operating properties. |
|
| | |
|
| Investing for the long runTM | 18 |
W. P. Carey Inc.
Owned Real Estate Portfolio – Second Quarter 2014
|
| |
| Diversification by Property Type |
In thousands, except percentages. Pro rata. As of June 30, 2014.
|
| | | | | | | | | | | | | | | | | | | | | | | | | | | |
| | | Total Portfolio | | | Unencumbered Portfolio (a) |
| Property Type | | ABR | | Percent | | Square Footage | | Percent | | | ABR | | Percent | | Square Footage | | Percent |
| Office | | $ | 176,453 |
| | 27.5 | % | | 10,341 |
| | 12.6 | % | | | $ | 40,555 |
| | 22.0 | % | | 2,676 |
| | 10.2 | % |
| Industrial | | 161,864 |
| | 25.3 | % | | 30,271 |
| | 37.0 | % | | | 58,464 |
| | 31.8 | % | | 10,297 |
| | 39.3 | % |
| Warehouse/Distribution | | 126,953 |
| | 19.8 | % | | 24,860 |
| | 30.4 | % | | | 25,225 |
| | 13.7 | % | | 5,456 |
| | 20.8 | % |
| Retail | | 90,044 |
| | 14.1 | % | | 7,718 |
| | 9.4 | % | | | 22,314 |
| | 12.1 | % | | 2,276 |
| | 8.7 | % |
| Self Storage | | 31,852 |
| | 5.0 | % | | 5,143 |
| | 6.3 | % | | | 31,852 |
| | 17.3 | % | | 5,143 |
| | 19.6 | % |
Other Properties (b) | | 53,227 |
| | 8.3 | % | | 3,482 |
| | 4.3 | % | | | 5,750 |
| | 3.1 | % | | 374 |
| | 1.4 | % |
Total (c) (d) | | $ | 640,393 |
| | 100.0 | % | | 81,815 |
| | 100.0 | % | | | $ | 184,160 |
| | 100.0 | % | | 26,222 |
| | 100.0 | % |
________
| |
| (a) | Represents properties unencumbered by non-recourse mortgage debt. |
| |
| (b) | Other properties include hospitality, education, sports, theater, residential, and unoccupied land. |
| |
| (c) | Represents our net-leased portfolio and, accordingly, excludes all operating properties. |
|
| | |
|
| Investing for the long runTM | 19 |
W. P. Carey Inc.
Owned Real Estate Portfolio – Second Quarter 2014
|
| |
| Diversification by Tenant Industry |
In thousands, except percentages. Pro rata. As of June 30, 2014.
|
| | | | | | | | | | | | | | | | | | | | | | | | | | | |
| | | Total Portfolio | | | Unencumbered Portfolio (b) |
Industry Type (a) | | ABR | | Percent | | Square Footage | | Percent | | | ABR | | Percent | | Square Footage | | Percent |
| Retail Trade | | $ | 131,915 |
| | 20.6 | % | | 16,919 |
| | 20.7 | % | | | $ | 24,819 |
| | 13.5 | % | | 2,953 |
| | 11.3 | % |
| Electronics | | 64,277 |
| | 10.0 | % | | 4,724 |
| | 5.8 | % | | | 12,674 |
| | 6.9 | % | | 1,411 |
| | 5.4 | % |
| Chemicals, Plastics, Rubber, and Glass | | 37,018 |
| | 5.8 | % | | 6,428 |
| | 7.9 | % | | | 8,672 |
| | 4.7 | % | | 1,437 |
| | 5.5 | % |
| Healthcare, Education and Childcare | | 34,071 |
| | 5.3 | % | | 2,733 |
| | 3.3 | % | | | 8,007 |
| | 4.3 | % | | 829 |
| | 3.2 | % |
| Business and Commercial Services | | 33,916 |
| | 5.3 | % | | 2,512 |
| | 3.1 | % | | | 3,131 |
| | 1.7 | % | | 252 |
| | 1.0 | % |
| Automobile | | 33,640 |
| | 5.3 | % | | 5,851 |
| | 7.1 | % | | | 11,519 |
| | 6.2 | % | | 1,974 |
| | 7.5 | % |
| Construction and Building | | 30,341 |
| | 4.8 | % | | 8,077 |
| | 9.9 | % | | | 11,901 |
| | 6.5 | % | | 2,957 |
| | 11.3 | % |
| Beverages, Food, and Tobacco | | 29,857 |
| | 4.7 | % | | 5,395 |
| | 6.5 | % | | | 8,069 |
| | 4.4 | % | | 1,794 |
| | 6.8 | % |
| Media: Printing and Publishing | | 25,383 |
| | 4.0 | % | | 2,759 |
| | 3.4 | % | | | 5,556 |
| | 3.0 | % | | 711 |
| | 2.7 | % |
| Buildings and Real Estate | | 20,704 |
| | 3.2 | % | | 3,343 |
| | 4.1 | % | | | 20,704 |
| | 11.2 | % | | 3,343 |
| | 12.7 | % |
| Machinery | | 20,147 |
| | 3.1 | % | | 2,742 |
| | 3.3 | % | | | 16,498 |
| | 9.0 | % | | 2,028 |
| | 7.7 | % |
| Transportation - Cargo | | 19,959 |
| | 3.1 | % | | 2,197 |
| | 2.7 | % | | | 1,928 |
| | 1.0 | % | | 426 |
| | 1.6 | % |
| Insurance | | 16,601 |
| | 2.6 | % | | 972 |
| | 1.2 | % | | | 6,829 |
| | 3.7 | % | | 392 |
| | 1.4 | % |
| Federal, State and Local Government | | 16,214 |
| | 2.5 | % | | 620 |
| | 0.8 | % | | | 5,008 |
| | 2.7 | % | | 254 |
| | 1.0 | % |
| Hotels and Gaming | | 16,100 |
| | 2.5 | % | | 1,036 |
| | 1.3 | % | | | — |
| | — | % | | — |
| | — | % |
| Telecommunications | | 15,494 |
| | 2.4 | % | | 908 |
| | 1.1 | % | | | 9,004 |
| | 4.9 | % | | 573 |
| | 2.2 | % |
| Leisure, Amusement, Entertainment | | 14,660 |
| | 2.3 | % | | 769 |
| | 0.9 | % | | | 3,096 |
| | 1.7 | % | | 223 |
| | 0.9 | % |
| Consumer Non-Durable Goods | | 13,678 |
| | 2.1 | % | | 2,585 |
| | 3.2 | % | | | 1,078 |
| | 0.6 | % | | 130 |
| | 0.5 | % |
| Grocery | | 12,355 |
| | 1.9 | % | | 1,198 |
| | 1.4 | % | | | 2,186 |
| | 1.2 | % | | 246 |
| | 0.9 | % |
| Transportation - Personal | | 11,356 |
| | 1.8 | % | | 1,825 |
| | 2.2 | % | | | 11,356 |
| | 6.2 | % | | 1,825 |
| | 7.0 | % |
| Aerospace and Defense | | 8,658 |
| | 1.4 | % | | 1,119 |
| | 1.4 | % | | | 2,340 |
| | 1.3 | % | | 448 |
| | 1.7 | % |
| Mining, Metals, and Primary Metal Industries | | 8,012 |
| | 1.3 | % | | 1,455 |
| | 1.8 | % | | | 1,330 |
| | 0.7 | % | | 344 |
| | 1.3 | % |
| Textiles, Leather, and Apparel | | 7,336 |
| | 1.1 | % | | 1,773 |
| | 2.2 | % | | | 3,181 |
| | 1.7 | % | | 474 |
| | 1.8 | % |
Other (c) | | 18,701 |
| | 2.9 | % | | 3,875 |
| | 4.7 | % | | | 5,274 |
| | 2.9 | % | | 1,198 |
| | 4.6 | % |
Total (d) (e) | | $ | 640,393 |
|
| 100.0 | % |
| 81,815 |
| | 100.0 | % | |
| $ | 184,160 |
|
| 100.0 | % |
| 26,222 |
|
| 100.0 | % |
________
| |
| (a) | Based on the Moody’s Classification System and information provided by the tenant. |
| |
| (b) | Represents properties unencumbered by non-recourse mortgage debt. |
| |
| (c) | Includes rent from tenants in the following industries: consumer and durable goods; forest products and paper; banking; consumer services; and utilities. |
| |
| (d) | Represents our net-leased portfolio and, accordingly, excludes all operating properties. |
|
| | |
|
| Investing for the long runTM | 20 |
W. P. Carey Inc.
Owned Real Estate Portfolio – Second Quarter 2014
|
| |
| Diversification by Geography |
In thousands, except percentages. Pro rata. As of June 30, 2014.
|
| | | | | | | | | | | | | | | | | | | | | | | | | | | |
| | | Total Portfolio | | | Unencumbered Portfolio (a) |
| Region | | ABR | | Percent | | Square Footage | | Percent | | | ABR | | Percent | | Square Footage | | Percent |
| U.S. | | | | | | | | | | | | | | | | | |
| East | | $ | 118,162 |
| | 18.5 | % | | 16,806 |
| | 20.5 | % | | | $ | 35,895 |
| | 19.5 | % | | 5,643 |
| | 21.5 | % |
| West | | 117,510 |
| | 18.3 | % | | 11,511 |
| | 14.1 | % | | | 31,289 |
| | 17.0 | % | | 3,721 |
| | 14.2 | % |
| South | | 114,898 |
| | 17.9 | % | | 16,549 |
| | 20.2 | % | | | 36,848 |
| | 20.0 | % | | 7,037 |
| | 26.8 | % |
| Midwest | | 80,932 |
| | 12.6 | % | | 13,113 |
| | 16.0 | % | | | 26,438 |
| | 14.3 | % | | 4,607 |
| | 17.6 | % |
| U.S. Total | | 431,502 |
| | 67.3 | % | | 57,979 |
| | 70.8 | % | |
| 130,470 |
|
| 70.8 | % |
| 21,008 |
|
| 80.1 | % |
| | | | | | | | | | | | | | | | | | |
| International | | | | | | | | | | | | | | | | | |
| Germany | | 68,975 |
| | 10.8 | % | | 7,009 |
| | 8.6 | % | | | 33,218 |
| | 18.0 | % | | 3,219 |
| | 12.3 | % |
| France | | 52,956 |
| | 8.3 | % | | 8,461 |
| | 10.4 | % | | | 1,788 |
| | 1.0 | % | | 242 |
| | 0.9 | % |
| Finland | | 33,716 |
| | 5.3 | % | | 2,133 |
| | 2.6 | % | | | 4,020 |
| | 2.2 | % | | 183 |
| | 0.7 | % |
| Poland | | 18,576 |
| | 2.9 | % | | 1,827 |
| | 2.2 | % | | | — |
| | — | % | | — |
| | — | % |
Other (b) | | 34,668 |
| | 5.4 | % | | 4,406 |
| | 5.4 | % | | | 14,664 |
| | 8.0 | % | | 1,570 |
| | 6.0 | % |
| International Total | | 208,891 |
| | 32.7 | % | | 23,836 |
| | 29.2 | % | |
| 53,690 |
|
| 29.2 | % |
| 5,214 |
|
| 19.9 | % |
Total (c) (d) | | $ | 640,393 |
| | 100.0 | % | | 81,815 |
| | 100.0 | % | |
| $ | 184,160 |
|
| 100.0 | % |
| 26,222 |
|
| 100.0 | % |
________
| |
| (a) | Represents properties unencumbered by non-recourse mortgage debt. |
| |
| (b) | Includes assets in the United Kingdom, the Netherlands, Hungary, Spain, Belgium, Sweden, Canada, Mexico, Thailand, Malaysia, and Japan. |
| |
| (c) | Represents our net-leased portfolio and, accordingly, excludes all operating properties. |
|
| | |
|
| Investing for the long runTM | 21 |
W. P. Carey Inc.
Owned Real Estate Portfolio – Second Quarter 2014
|
| |
| Contractual Rent Increases |
In thousands, except percentages. Pro rata. As of June 30, 2014.
|
| | | | | | | | | | | | | | | | | | | | | | | | | | | |
| | | Total Portfolio | | | Unencumbered Portfolio (a) |
| Rent Adjustment Measure | | ABR | | Percent | | Square Footage | | Percent | | | ABR | | Percent | | Square Footage | | Percent |
| CPI (Uncapped) | | $ | 281,602 |
| | 44.0 | % | | 35,195 |
| | 43.0 | % | | | $ | 87,931 |
| | 47.7 | % | | 11,868 |
| | 45.3 | % |
| CPI (Capped) | | 161,994 |
| | 25.3 | % | | 19,685 |
| | 24.1 | % | | | 46,543 |
| | 25.3 | % | | 6,972 |
| | 26.6 | % |
| Fixed | | 158,358 |
| | 24.7 | % | | 22,454 |
| | 27.4 | % | | | 38,915 |
| | 21.1 | % | | 6,109 |
| | 23.3 | % |
| Other | | 20,754 |
| | 3.2 | % | | 1,248 |
| | 1.5 | % | | | 4,691 |
| | 2.6 | % | | 222 |
| | 0.8 | % |
| None | | 17,685 |
| | 2.8 | % | | 3,233 |
| | 4.0 | % | | | 6,080 |
| | 3.3 | % | | 1,051 |
| | 4.0 | % |
Total (b) (c) | | $ | 640,393 |
| | 100.0 | % | | 81,815 |
| | 100.0 | % | | | $ | 184,160 |
| | 100.0 | % | | 26,222 |
| | 100.0 | % |
________
| |
| (a) | Represents properties unencumbered by non-recourse mortgage debt. |
| |
| (b) | Represents our net-leased portfolio and, accordingly, excludes all operating properties. |
|
| | |
|
| Investing for the long runTM | 22 |
W. P. Carey Inc.
Owned Real Estate Portfolio – Second Quarter 2014
|
| |
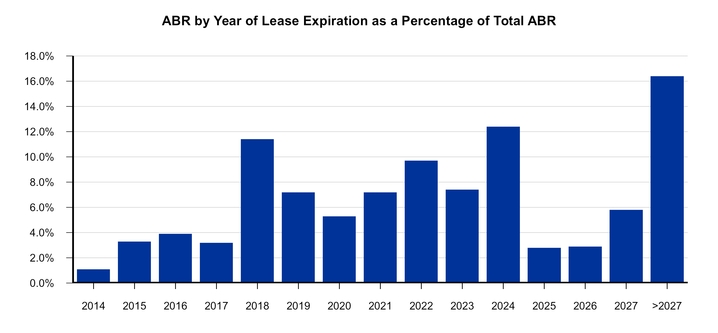
| Lease Expirations – Total Portfolio |
In thousands, except percentages and number of leases. Pro rata. As of June 30, 2014.
|
| | | | | | | | | | | | | | | | |
Year of Lease Expiration (a) | | Number of Leases Expiring | | ABR | | Percent | | Square Footage | | Percent |
Remaining 2014 (b) | | 9 |
| | $ | 6,922 |
| | 1.1 | % | | 775 |
| | 0.9 | % |
| 2015 | | 17 |
| | 21,062 |
| | 3.3 | % | | 2,005 |
| | 2.5 | % |
| 2016 | | 20 |
| | 25,061 |
| | 3.9 | % | | 2,937 |
| | 3.6 | % |
| 2017 | | 21 |
| | 20,192 |
| | 3.2 | % | | 3,243 |
| | 4.0 | % |
| 2018 | | 29 |
| | 72,957 |
| | 11.4 | % | | 8,367 |
| | 10.2 | % |
| 2019 | | 26 |
| | 46,245 |
| | 7.2 | % | | 4,336 |
| | 5.3 | % |
| 2020 | | 23 |
| | 33,967 |
| | 5.3 | % | | 3,624 |
| | 4.4 | % |
| 2021 | | 78 |
| | 46,247 |
| | 7.2 | % | | 7,330 |
| | 9.0 | % |
| 2022 | | 37 |
| | 62,354 |
| | 9.7 | % | | 8,694 |
| | 10.6 | % |
| 2023 | | 15 |
| | 47,321 |
| | 7.4 | % | | 5,627 |
| | 6.9 | % |
| 2024 | | 38 |
| | 79,667 |
| | 12.4 | % | | 12,299 |
| | 15.0 | % |
| 2025 | | 15 |
| | 17,772 |
| | 2.8 | % | | 2,219 |
| | 2.7 | % |
| 2026 | | 21 |
| | 18,467 |
| | 2.9 | % | | 2,497 |
| | 3.1 | % |
| 2027 | | 16 |
| | 36,999 |
| | 5.8 | % | | 5,380 |
| | 6.6 | % |
| Thereafter (>2027) | | 32 |
| | 105,160 |
| | 16.4 | % | | 11,245 |
| | 13.7 | % |
| Vacant | | — |
| | — |
| | — | % | | 1,237 |
| | 1.5 | % |
Total (c) (d) | | 397 |
| | $ | 640,393 |
| | 100.0 | % | | 81,815 |
| | 100.0 | % |
________
| |
| (a) | Assumes tenant does not exercise renewal option. |
| |
| (b) | Month-to-month properties are counted in 2014 ABR. |
| |
| (c) | Represents our net-leased portfolio and, accordingly, excludes all operating properties. |
|
| | |
|
| Investing for the long runTM | 23 |
W. P. Carey Inc.
Owned Real Estate Portfolio – Second Quarter 2014
|
| |
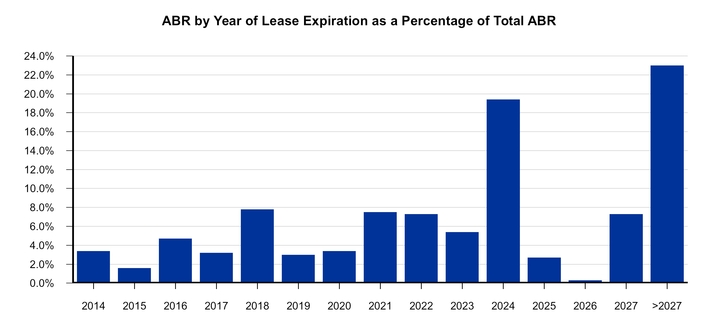
| Lease Expirations – Unencumbered Portfolio |
In thousands, except percentages and number of leases. Pro rata. As of June 30, 2014.
|
| | | | | | | | | | | | | | | | |
Year of Lease Expiration (a) | | Number of Leases Expiring | | ABR | | Percent | | Square Footage | | Percent |
Remaining 2014 (b) | | 9 |
| | $ | 6,316 |
| | 3.4 | % | | 684 |
| | 2.6 | % |
| 2015 | | 5 |
| | 2,901 |
| | 1.6 | % | | 508 |
| | 1.9 | % |
| 2016 | | 13 |
| | 8,580 |
| | 4.7 | % | | 1,141 |
| | 4.4 | % |
| 2017 | | 8 |
| | 5,826 |
| | 3.2 | % | | 1,083 |
| | 4.1 | % |
| 2018 | | 14 |
| | 14,301 |
| | 7.8 | % | | 2,207 |
| | 8.4 | % |
| 2019 | | 9 |
| | 5,522 |
| | 3.0 | % | | 781 |
| | 3.0 | % |
| 2020 | | 7 |
| | 6,361 |
| | 3.4 | % | | 1,210 |
| | 4.6 | % |
| 2021 | | 8 |
| | 13,854 |
| | 7.5 | % | | 2,328 |
| | 8.9 | % |
| 2022 | | 11 |
| | 13,360 |
| | 7.3 | % | | 2,686 |
| | 10.3 | % |
| 2023 | | 5 |
| | 9,998 |
| | 5.4 | % | | 1,393 |
| | 5.3 | % |
| 2024 | | 8 |
| | 35,783 |
| | 19.4 | % | | 6,329 |
| | 24.1 | % |
| 2025 | | 6 |
| | 5,034 |
| | 2.7 | % | | 585 |
| | 2.2 | % |
| 2026 | | 1 |
| | 552 |
| | 0.3 | % | | 124 |
| | 0.5 | % |
| 2027 | | 5 |
| | 13,432 |
| | 7.3 | % | | 1,452 |
| | 5.6 | % |
| Thereafter (>2027) | | 11 |
| | 42,340 |
| | 23.0 | % | | 3,495 |
| | 13.3 | % |
| Vacant | | — |
| | — |
| | — | % | | 216 |
| | 0.8 | % |
Total (c) (d) (e) | | 120 |
| | $ | 184,160 |
| | 100.0 | % | | 26,222 |
| | 100.0 | % |
________
| |
| (a) | Assumes tenant does not exercise renewal option. |
| |
| (b) | Month-to-month properties are counted in 2014 ABR. |
| |
| (c) | Represents our net-leased portfolio and, accordingly, excludes all operating properties. |
| |
| (e) | Represents properties unencumbered by non-recourse mortgage debt. |
|
| | |
|
| Investing for the long runTM | 24 |
W. P. Carey Inc.
Investment Management
Second Quarter 2014
|
| | |
|
| Investing for the long runTM | 25 |
W. P. Carey Inc.
Investment Management – Second Quarter 2014
|
| |
| Selected Data – Managed REITs |
Square footage and dollars in thousands. As of or for the three months ended June 30, 2014.
|
| | | | | | | | | | | |
| | Managed REITs |
| | CPA®:17 – Global | | CPA®:18 – Global | | CWI |
| Number of net-leased properties | 358 |
| | 24 |
| | N/A |
|
| Number of operating properties | 75 |
| | 2 |
| | 23 |
|
Number of tenants (a) | 108 |
| | 18 |
| | N/A |
|
Number of Investment Grade tenants (a) (b) | 11 |
| | 2 |
| | N/A |
|
Square footage (a) | 34,354 |
| | 5,270 |
| | 4,699 |
|
Occupancy (c) | 100.0 | % | | 100.0 | % | | 75.9 | % |
| | | | | | |
| Total AUM | $ | 5,448,660 |
| | $ | 1,202,663 |
| | $ | 1,567,074 |
|
| Acquisitions | 63,135 |
| | 88,724 |
| | 407,394 |
|
| Dispositions | 68,250 |
| | — |
| | — |
|
Gross offering proceeds (d) | N/A |
| | 398,707 |
| | 93,687 |
|
________
| |
| (a) | For CPA®:17 – Global and CPA®:18 – Global, excludes operating properties. |
| |
| (b) | Includes only Investment Grade tenants, defined as those having a BBB- rating or higher by Standard & Poor’s Rating Services. We evaluate the credit quality of the Managed REITs’ tenants utilizing an internal five-point credit rating scale, with one representing the highest credit quality, comprised solely of Investment Grade tenants, and five representing the lowest credit quality. The credit quality evaluation of the Managed REITs' tenants is updated quarterly. CPA®:17 – Global had 97 non-investment grade tenants as of June 30, 2014, with a weighted average credit rating of 3.2. CPA®:18 – Global had 16 non-investment grade tenants as of June 30, 2014, with a weighted average credit rating of 3.0. |
| |
| (c) | Represents occupancy for net-leased properties for CPA®:17 – Global and CPA®:18 – Global. Represents occupancy for hotels for CWI for the six months ended June 30, 2014. Occupancy for CPA®:17 – Global's 71 self-storage properties was 84.1% as of June 30, 2014. Occupancy for CPA®:18 – Global's two self-storage properties was 75.9% as of June 30, 2014. |
| |
| (d) | For CPA®:18 – Global, total gross offering proceeds is comprised of $375.0 million of Class A common stock and $23.7 million of Class C common stock. CPA®:18 – Global discontinued the sale of Class A shares subsequent to June 30, 2014. |
|
| | |
|
| Investing for the long runTM | 26 |
W. P. Carey Inc.
Investment Management – Second Quarter 2014
|
| |
| Investment Activity – Managed REITs |
In thousands, except square footage. Pro rata. For the six months ended June 30, 2014.
|
| | | | | | | | | | | | | | | |
| Acquisitions – Leased Properties | | | | | | | | | | |
| Portfolio(s) | | Tenant / Lease Guarantor | | Property Location(s) | | Purchase Price (a) | | Closing Date | | Property Type(s) | | Gross Square Footage |
| Q1 Acquisitions | | | | | | | | | | | | |
CPA®:18 – Global | | Air Enterprises Acquisition, LLC | | Streetsboro, OH | | $ | 5,901 |
| | Jan-14 | | Industrial | | 178,180 |
|
CPA®:18 – Global | | Solo Cup Company | | University Park, IL | | 80,650 |
| | Feb-14 | | Warehouse/Distribution | | 1,552,475 |
|
CPA®:17 – Global | | Raytheon Company | | Tucson, AZ | | 18,975 |
| | Feb-14 | | Office | | 143,650 |
|
CPA®:18 – Global | | Automobile Protection Corporation | | Norcross, GA | | 5,822 |
| | Feb-14 | | Office | | 50,600 |
|
CPA®:18 – Global | | Siemens AS (b) | | Oslo, Norway | | 84,109 |
| | Feb-14 | | Office | | 165,905 |
|
CPA®:18 – Global | | Crowne Group, LLC (2 properties) | | Fraser and Warren, MI | | 8,042 |
| | Mar-14 | | Industrial | | 212,152 |
|
CPA®:18 – Global (50%); CPA®:17 – Global (50%) | | Bank Pekao S.A. (b) | | Warsaw, Poland | | 147,904 |
| | Mar-14 | | Office | | 423,822 |
|
| Total Q1 Acquisitions | | | | | | 351,403 |
| | | | | | 2,726,784 |
|
| Q2 Acquisitions | | | | | | | | | | | | |
CPA®:17 – Global | | Wärtsilä Netherlands B.V. (b) (c) | | Drunen, Netherlands | | 18,782 |
| | Apr-14 | | Industrial | | BTS |
|
CPA®:17 – Global | | The PendaForm Company (2 properties) | | New Concord, OH; Bluffton, IN | | 8,075 |
| | Apr-14 | | Industrial | | 127,584 |
|
CPA®:18 – Global | | Swift Spinning Inc. (2 properties) | | Columbus, GA | | 11,931 |
| | Apr-14 | | Industrial | | 432,769 |
|
CPA®:18 – Global | | North American Lighting, Inc | | Farmington Hills, MI | | 8,403 |
| | May-14 | | Office | | 75,286 |
|
CPA®:17 – Global | | Konzum d.d. (b) (c) | | Krizevci, Croatia | | 7,482 |
| | May-14 | | Retail | | BTS |
|
CPA®:18 – Global | | Janus International LLC (3 properties) | | Surprise, AZ; Temple, GA; and Houston, TX | | 15,953 |
| | May-14 | | Industrial | | 330,306 |
|
CPA®:18 – Global | | Illinois Bell Telephone Company (AT&T) | | Chicago, IL | | 11,600 |
| | May-14 | | Warehouse/Distribution | | 206,000 |
|
CPA®:18 – Global | | Belk, Inc. (d) | | Jonesville, SC | | 40,837 |
| | Jun-14 | | Warehouse/Distribution | | 515,279 |
|
| Total Q2 Acquisitions | | | | | | 123,063 |
| | | | | | 1,687,224 |
|
| Total YTD Acquisitions – Leased Properties | | | | 474,466 |
| | | | | | 4,414,008 |
|
|
| | | | | | | |
| Acquisitions – Self-Storage | | | | | | |
| Portfolio(s) | | Property Location(s) | | Purchase Price (a) | | Closing Date |
| Q1 Acquisitions | | | | | | |
CPA®:18 – Global | | Kissimmee, FL | | 11,960 |
| | Jan-14 |
CPA®:18 – Global | | St. Petersburg, FL | | 11,550 |
| | Jan-14 |
| Total Q1 Acquisitions | | | | 23,510 |
| | |
| Q2 Acquisitions (N/A) | | | | | | |
| Total YTD Acquisitions – Self-Storage Properties | | | | 23,510 |
| | |
|
| | | | | | | |
| Acquisitions – Hospitality | | | | | | |
| Portfolio(s) | | Property Location(s) | | Purchase
Price (a) (e) | | Closing Date |
| Q1 Acquisitions (N/A) | | | | | | |
| Q2 Acquisitions | | | | | | |
| CWI | | Austin, TX | | 86,673 |
| | Apr-14 |
| CWI | | New York, NY | | 87,444 |
| | May-14 |
| CWI (80%) | | Austin, TX | | 90,221 |
| | May-14 |
| CWI | | Boca Raton, FL | | 61,794 |
| | Jun-14 |
| CWI | | Denver, CO | | 81,262 |
| | Jun-14 |
| Total YTD Acquisitions – Hospitality Properties | | | | 407,394 |
| | |
|
| | |
|
| Investing for the long runTM | 27 |
W. P. Carey Inc.
Investment Management – Second Quarter 2014
|
| | | | | | | | | | |
| Acquisitions – Other | | | | | | |
| Portfolio(s) | | Security Type | | Company | | Purchase
Price | | Closing Date |
| Q1 Acquisitions (N/A) | | | | | | | | |
| Q2 Acquisitions | | | | | | | | |
CPA®:17 – Global (7%) | | Follow-on Equity Investment | | Lineage Logistics Holdings, LLC | | 20,356 |
| | Apr-14 |
CPA®:17 – Global | | Non-Convertible Debenture | | Cayden Developers Private Limited | | 8,440 |
| | May-14 |
| Total YTD Acquisitions – Other | | | | 28,796 |
| | |
| | | | | | | | | |
| Total YTD Acquisitions | | | | $ | 934,166 |
| | |
|
| | | | | | | | | | |
| Dispositions – Other | | | | | | |
| Portfolio(s) | | Security Type | | Company | | Gross Sale Price | | Closing Date |
| Q1 Dispositions (N/A) | | | | | | | | |
| Q2 Disposition | | | | | | | | |
CPA®:17 – Global | | Note Receivable (f) | | I Shops LLC | | $ | 68,250 |
| | Apr-14 |
| Total YTD Disposition – Other | | | | $ | 68,250 |
| | |
________
| |
| (a) | Several acquisitions were classified as business combinations. For these acquisitions, purchase price excludes approximately $39.0 million of aggregate transaction costs and acquisition fees. |
| |
| (b) | Purchase price reflects applicable foreign exchange rate. |
| |
| (c) | Acquisition includes a build-to-suit transaction. Purchase price represents total commitment for build-to-suit funding. Gross square footage cannot be determined at this time. |
| |
| (d) | Acquisition includes a build-to-suit transaction. Purchase price represents price paid for existing facility plus total commitment for build-to-suit funding. Gross square footage represents square footage for existing facility. |
| |
| (e) | Purchase price excludes hotel renovation commitments. |
| |
| (f) | CPA®:17 – Global deconsolidated a portion of this investment when the investee substantially repaid the balance of the outstanding note receivable. This transaction was accounted for as a partial sale. |
|
| | |
|
| Investing for the long runTM | 28 |
W. P. Carey Inc.
Appendix
Second Quarter 2014
|
| | |
|
| Investing for the long runTM | 29 |
W. P. Carey Inc.
Appendix – Second Quarter 2014
|
| |
| Normalized Pro Rata Cash Net Operating Income (NOI) |
In thousands. From real estate.
|
| | | | |
| | | Three Months Ended
Jun. 30, 2014 |
| Consolidated Lease Revenues: | | |
| Total lease revenues – as reported | | $ | 148,253 |
|
| Total lease revenues – discontinued operations | | 1,841 |
|
| | | 150,094 |
|
| Less: Consolidated Non-Reimbursable Property Expenses: | | |
| Non-reimbursable property expenses – as reported | | 5,589 |
|
| Non-reimbursable property expenses – discontinued operations | | 57 |
|
| | | 5,646 |
|
| | | |
| | | 144,448 |
|
| | | |
| Plus: NOI from Operating Properties: | | |
| Hotel NOI | | 2,511 |
|
| Self-storage properties NOI | | 120 |
|
| | | 2,631 |
|
| | | |
| | | 147,079 |
|
| | | |
| Adjustments for Pro Rata Ownership of Real Estate Joint Ventures: | |
|
| Add: Pro rata share of NOI from equity investments | | 4,798 |
|
| Less: Pro rata share of NOI attributable to noncontrolling interests | | (6,337 | ) |
| | | (1,539 | ) |
| | | |
| | | 145,540 |
|
| | | |
| Adjustments for Pro Rata Non-Cash Items: | | |
| Add: Above- and below-market rent intangible lease amortization | | 16,522 |
|
| Less: Straight-line rent amortization | | (3,929 | ) |
| | | 12,593 |
|
| | | |
Pro rata cash NOI (a) | | $ | 158,133 |
|
| | | |
Adjustment to normalize for intra-period acquisitions and dispositions (b) | | (971 | ) |
| | | |
Normalized pro rata cash NOI (a) | | $ | 157,162 |
|
________
| |
| (a) | Pro rata cash NOI and normalized pro rata cash NOI are non-GAAP measures. See the Terms and Definitions section that follows for a description of our non-GAAP measures and for details on how pro rata cash NOI and normalized pro rata cash NOI are calculated. |
| |
| (b) | For properties acquired during the three months ended June 30, 2014, the adjustment replaces our pro rata share of cash NOI for the partial period with an amount equivalent to our pro rata share of cash NOI for the full period. For properties disposed of during the three months ended June 30, 2014, the adjustment removes our pro rata share of cash NOI for the period. Additionally, the adjustment removes $1.0 million of expenses related to a planned sale of several properties which was ultimately not consummated. |
|
| | |
|
| Investing for the long runTM | 30 |
W. P. Carey Inc.
Appendix – Second Quarter 2014
|
| |
| Reconciliation of Net Income to AFFO |
In thousands, except share and per share amounts.
|
| | | | | | | |
| | Three Months Ended |
| | Jun. 30, 2014 | | Mar. 31, 2014 |
| Real Estate Ownership | | | (Revised) (a) |
| Net income from Real Estate Ownership attributable to W. P. Carey | $ | 61,469 |
| | $ | 111,691 |
|
| Adjustments: | | | |
| Depreciation and amortization of real property | 62,354 |
| | 51,620 |
|
| Impairment charges | 2,066 |
| | — |
|
| Gain on sale of real estate, net | (25,582 | ) | | (3,176 | ) |
| Proportionate share of adjustments to equity in net income of partially-owned entities to arrive at FFO | 533 |
| | 1,265 |
|
| Proportionate share of adjustments for noncontrolling interests to arrive at FFO | (2,586 | ) | | (3,492 | ) |
| Total adjustments | 36,785 |
| | 46,217 |
|
FFO (as defined by NAREIT) - Real Estate Ownership (b) | 98,254 |
| | 157,908 |
|
| Adjustments: | | | |
Gain on change in control of interests (a) | — |
| | (104,645 | ) |
Merger and acquisition expenses (c) | 915 |
| | 29,511 |
|
| Loss on extinguishment of debt | 721 |
| | 7,463 |
|
| Other gains, net | (13 | ) | | (3 | ) |
| Other depreciation, amortization, and non-cash charges | 1,719 |
| | 483 |
|
| Stock-based compensation | 220 |
| | 220 |
|
| Deferred tax benefit | (1,246 | ) | | (5,944 | ) |
| Acquisition expenses | 224 |
| | 100 |
|
| Realized losses on foreign currency, derivatives, and other | 156 |
| | 655 |
|
| Amortization of deferred financing costs | 999 |
| | 873 |
|
| Straight-line and other rent adjustments | (8,999 | ) | | (2,669 | ) |
| Above- and below-market rent intangible lease amortization, net | 17,124 |
| | 13,486 |
|
| Proportionate share of adjustments to equity in net income of partially-owned entities to arrive at AFFO | (32 | ) | | 5 |
|
| AFFO adjustments to equity earnings from equity investments | 935 |
| | 2,936 |
|
| Proportionate share of adjustments for noncontrolling interests to arrive at AFFO | 259 |
| | (1,417 | ) |
| Total adjustments | 12,982 |
| | (58,946 | ) |
AFFO - Real Estate Ownership (b) | $ | 111,236 |
| | $ | 98,962 |
|
| Investment Management | | | |
| Net income from Investment Management attributable to W. P. Carey | $ | 3,270 |
| | $ | 2,485 |
|
FFO (as defined by NAREIT) - Investment Management (b) | 3,270 |
| | 2,485 |
|
| Adjustments: | | | |
Merger-related income tax expense (c) | — |
| | 13,867 |
|
| Other depreciation, amortization, and non-cash charges | — |
| | 937 |
|
| Stock-based compensation | 7,737 |
| | 6,823 |
|
| Deferred tax benefit | — |
| | (4,986 | ) |
| Realized losses on foreign currency | 3 |
| | 6 |
|
| Amortization of deferred financing costs | — |
| | 152 |
|
| Total adjustments | 7,740 |
| | 16,799 |
|
AFFO - Investment Management (b) | $ | 11,010 |
| | $ | 19,284 |
|
| Total Company | | | |
FFO (as defined by NAREIT) (b) | $ | 101,524 |
| | $ | 160,393 |
|
FFO (as defined by NAREIT) per diluted share (b) | $ | 1.01 |
| | $ | 1.77 |
|
AFFO (b) | $ | 122,246 |
| | $ | 118,246 |
|
AFFO per diluted share (b) | $ | 1.21 |
| | $ | 1.31 |
|
| Diluted weighted average shares outstanding | 100,995,225 |
| | 90,375,311 |
|
|
| | |
|
| Investing for the long runTM | 31 |
W. P. Carey Inc.
Appendix – Second Quarter 2014
________
| |
| (a) | Gain on change in control of interests for the three months ended March 31, 2014 represents a gain of $74.4 million recognized on our previously-held interest in shares of CPA®:16 – Global common stock, and a gain of $30.2 million recognized on the purchase of the remaining interests in nine investments from CPA®:16 – Global, which we had previously accounted for under the equity method. During the six months ended June 30, 2014, one of these investments was sold. During the second quarter of 2014, we identified certain measurement period adjustments, which increased the fair value of our previously-held interest in shares of CPA®:16 – Global common stock by $1.3 million. We did not record this adjustment during the three months ended June 30, 2014 but rather in the three months ended March 31, 2014. Consequently, amounts presented above for gain on change in control of interests and net income for the three months ended March 31, 2014 differ from amounts presented in the first quarter filings. |
| |
| (b) | FFO and AFFO are non-GAAP measures. See the Terms and Definitions section that follows for a description of our non-GAAP measures. |
| |
| (c) | Amount for the three months ended March 31, 2014 included $29.5 million of merger expenses for the Real Estate Ownership segment and $13.9 million of merger-related income tax expense for the Investment Management segment incurred in connection with the CPA®:16 Merger. |
|
| | |
|
| Investing for the long runTM | 32 |
W. P. Carey Inc.
Appendix – Second Quarter 2014
|
| |
| Reconciliation of Net Income to Adjusted EBITDA |
In thousands.
|
| | | | | | | |
| | Three Months Ended |
| | Jun. 30, 2014 | | Mar. 31, 2014 |
| | | | (Revised) (a) |
| Net income attributable to W. P. Carey | $ | 64,739 |
| | $ | 114,176 |
|
| | | | |
| Adjustments to Derive Consolidated EBITDA: | | | |
Depreciation and amortization (b) | 63,555 |
| | 53,244 |
|
Interest expense (b) | 47,826 |
| | 39,248 |
|
Provision for income taxes (b) | 8,340 |
| | 2,308 |
|
EBITDA (c) | 184,460 |
| | 208,976 |
|
| | | | |
| Adjustments to Derive Adjusted EBITDA: | | | |
| Adjustments for Non-Cash Items: | | | |
| Impairment charges | 2,066 |
| | — |
|
| Above- and below-market rent intangible and straight-line rent adjustments | 8,125 |
| | 10,817 |
|
Unrealized losses (gains) on hedging activity (d) | 1,231 |
| | (1,179 | ) |
| Stock-based compensation expenses | 7,957 |
| | 6,826 |
|
| | 19,379 |
| | 16,464 |
|
Adjustments for Non-Core Items: (e) | | | |
Gain on change in control of interests (a) | — |
| | (104,645 | ) |
Merger and acquisition expenses (f) | 1,140 |
| | 29,611 |
|
Realized (gains) losses on hedging activity (c) | (1,437 | ) | | 662 |
|
| Gain on sale of real estate, net | (25,582 | ) | | (3,176 | ) |
| Loss on extinguishment of debt | 192 |
| | 7,992 |
|
| | (25,687 | ) | | (69,556 | ) |
| Adjustments for Pro Rata Ownership: | | | |
Real Estate Joint Ventures: (g) | | | |
| Add: Pro rata share of adjustments for equity investments | 1,725 |
| | 3,048 |
|
| Less: Pro rata share of adjustments for amounts attributable to noncontrolling interests | (5,330 | ) | | (6,896 | ) |
| | (3,605 | ) | | (3,848 | ) |
Equity Investments in the Managed REITs: (h) | | | |
| Add: Distributions received from equity investments in the Managed REITs | 1,245 |
| | 7,431 |
|
| Less: Income from equity investments in the Managed REITs | (650 | ) | | (470 | ) |
| | 595 |
| | 6,961 |
|
| | | | |
Adjusted EBITDA (b) | $ | 175,142 |
| | $ | 158,997 |
|
________
| |
| (a) | For the three months ended March 31, 2014, represents a gain of $74.4 million recognized on our previously-held interest in shares of CPA®:16 – Global common stock and a gain of $30.2 million recognized on the purchase of the remaining interests in nine investments from CPA®:16 – Global, which were previously accounted for under the equity method. During the six months ended June 30, 2014, one of these investments was sold. During the second quarter of 2014, we identified certain measurement period adjustments which increased the fair value of our previously-held interest in shares of CPA®:16 – Global common stock by $1.3 million. We did not record this adjustment during the three months ended June 30, 2014 but rather in the three months ended March 31, 2014. Consequently, amounts presented above for gain on change of control in interests and net income for the three months ended March 31, 2014 differ from amounts presented in the first quarter filings. |
| |
| (b) | Includes amounts related to discontinued operations. |
| |
| (c) | EBITDA and adjusted EBITDA are non-GAAP measures. See the Terms and Definitions section that follows for a description of our non-GAAP measures. |
| |
| (d) | Comprised of unrealized (gains) losses on derivatives and unrealized (gains) losses on foreign currency hedges. |
| |
| (e) | Comprised of items that we do not consider to be part of our core operating business plan or representative of our overall long-term operating performance, based on a number of factors, including the nature of the item and/or the frequency with which it occurs. We believe that these adjustments provide a more representative view of EBITDA from our core operating business and allow for more meaningful comparisons. |
| |
| (f) | For the three months ended March 31, 2014, represents merger expenses incurred in connection with the CPA®:16 Merger. |
| |
| (g) | Adjustments to include our pro rata share of depreciation and amortization, interest expense, provision for income taxes, non-cash items, and non-core items from joint ventures. |
| |
| (h) | Adjustments to include cash distributions received from the Managed REITs in place of our pro rata share of net income from our ownership in the Managed REITs. |
|
| | |
|
| Investing for the long runTM | 33 |
W. P. Carey Inc.
Appendix – Second Quarter 2014
Non-GAAP Financial Disclosures
AFFO
FFO is a non-GAAP measure defined by NAREIT. NAREIT defines FFO as net income or loss (as computed in accordance with GAAP) excluding: depreciation and amortization expense from real estate assets, impairment charges on real estate, gains or losses from sales of depreciated real estate assets, and extraordinary items; however, FFO related to assets held for sale, sold, or otherwise transferred and included in the results of discontinued operations are included. These adjustments also incorporate the pro rata (described below) share of unconsolidated subsidiaries. FFO is used by management, investors, and analysts to facilitate meaningful comparisons of operating performance between periods and among our peers. Although NAREIT has published this definition of FFO, companies often modify this definition as they seek to provide financial measures that meaningfully reflect their distinctive operations.
We modify the NAREIT computation of FFO to include other adjustments to GAAP net income to adjust for certain non-cash charges such as amortization of intangibles, deferred income tax benefits and expenses, straight-line rents, stock compensation, gains or losses from extinguishment of debt and deconsolidation of subsidiaries, and unrealized foreign currency exchange gains and losses. Our assessment of our operations is focused on long-term sustainability and not on such non-cash items, which may cause short-term fluctuations in net income but have no impact on cash flows. Additionally, we exclude acquisition expenses and non-core expenses, such as merger and restructuring expenses. Merger expenses are related to the CPA®:16 Merger and restructuring expenses are related to the restructuring of Hellweg 2. We also exclude realized gains/losses on foreign exchange and derivatives which are not considered fundamental attributes of our business plan and do not affect our overall long-term operating performance. We refer to our modified definition of FFO as AFFO. We exclude these items from GAAP net income as they are not the primary drivers in our decision-making process and excluding those items provides investors a view of our portfolio performance over time and make it more comparable to other REITs that are currently not engaged in acquisitions, mergers, and restructurings, which are not part of our normal business operations. We use AFFO as one measure of our operating performance when we formulate corporate goals, evaluate the effectiveness of our strategies, and determine executive compensation.
We believe that AFFO is a useful supplemental measure for investors to consider because it will help them to better assess the sustainability of our operating performance without the potentially distorting impact of these short-term fluctuations. However, there are limits on the usefulness of AFFO to investors. For example, impairment charges and unrealized foreign currency losses that we exclude may become actual realized losses upon the ultimate disposition of the properties in the form of lower cash proceeds or other considerations. We use our FFO and AFFO measures as supplemental financial measures of operating performance. We do not use our FFO and AFFO measures as, nor should they be considered to be, alternatives to net earnings computed under GAAP, as alternatives to cash from operating activities computed under GAAP, or as indicators of our ability to fund our cash needs.
Pro Rata Cash NOI
Cash net operating income, or cash NOI, is a non-GAAP financial measure that is intended to reflect the performance of our net leased and operating properties. We define cash NOI as cash rents from our leased and operating properties less non-reimbursable property expenses. Cash NOI excludes amortization of intangibles and straight-line rent adjustments that are included in GAAP lease revenues. We present cash NOI on a pro rata basis, referred to as pro rata cash NOI, to account for our share of income related to unconsolidated joint ventures and noncontrolling interests. We believe that pro rata cash NOI is a helpful measure that both investors and management can use to evaluate the financial performance of our leased and operating properties and it allows for comparison of our operating performance between periods and to other REITs. Pro rata cash NOI should not be considered as an alternative to net income as an indication of our financial performance or to cash flows as a measure of liquidity or our ability to fund all needs. The method by which we calculate and present cash NOI and/or pro rata cash NOI, may not be directly comparable to the way other REITs present cash NOI.
Normalized Pro Rata Cash NOI
Normalized pro rata cash NOI is pro rata cash NOI as defined above adjusted primarily to exclude our pro rata share of cash NOI from properties disposed of during the most recent quarter and to include a full quarter’s pro rata cash NOI related to acquisitions purchased during the period. We believe this measure provides a helpful representation of our net operating income from our in-place leased and operating properties.
|
| | |
|
| Investing for the long runTM | 34 |
W. P. Carey Inc.
Appendix – Second Quarter 2014
Adjusted EBITDA
We believe that EBITDA is a useful supplemental measure to investors and analysts for assessing the performance of our business segments because it removes the impact of our capital structure from our operating results and because it is helpful when comparing our operating performance to that of companies in our industry without regard to such items, which can vary substantially from company to company. Adjusted EBITDA as disclosed represents EBITDA, modified to include other adjustments to GAAP net income for certain non-cash charges such as impairments, non-cash rent adjustments, and unrealized gain and losses from our hedging activity. Additionally, we exclude merger expenses related to the CPA®:16 Merger, which are considered non-core and gains/losses in real estate and are not considered fundamental attributes of our business plans and do not affect our overall long-term operating performance. We exclude these items from adjusted EBITDA as they are not the primary drivers in our decision-making process. Our assessment of our operations is focused on long-term sustainability and not on such non-cash and non-core items, which may cause short term fluctuations in net income but have no impact on cash flows. We believe that adjusted EBITDA is a useful supplemental measure to investors and analysts for assessing the performance of our business segments, although it does not represent net income that is computed in accordance with GAAP. Accordingly, adjusted EBITDA should not be considered as an alternative to net income or as an indicator of our financial performance. EBITDA and adjusted EBITDA as calculated by us may not be comparable to similarly titled measures of other companies.
Other Metrics
Pro Rata Metrics
This supplemental package contains certain metrics prepared under the pro rata consolidation method. We refer to these metrics as pro rata metrics. We have a number of investments, usually with our affiliates, in which our economic ownership is less than 100%. Under the full consolidation method, we report 100% of the assets, liabilities, revenues, and expenses of those investments that are deemed to be under our control or for which we are deemed to be the primary beneficiary, even if our ownership is less than 100%. Also, for all other jointly-owned investments, we report our net investment and our net income or loss from that investment. Under the pro rata consolidation method, we generally present our proportionate share, based on our economic ownership of these jointly-owned investments, of the assets, liabilities, revenues, and expenses of those investments.
ABR
ABR represents contractual minimum annualized base rent for our net-leased properties. ABR is not applicable to operating properties.
|
| | |
|
| Investing for the long runTM | 35 |