Exhibit 99.1
| INVESTING FOR THE LONG RUN™ |
| Introductory Remarks Trevor Bond, President and CEO Investment Process and Strategy Gino Sabatini, Managing Director and Co-Head of Global Investments Jason Fox, Managing Director and Co-Head of Global Investments Portfolio Review: An Active Approach to Asset Management Thomas E. Zacharias, COO and Head of Asset Management Brooks Gordon, Executive Director, Asset Management Investment Management: A Key Driver of Growth John Park, Managing Director and Director of Strategic Planning Overview of Managed Funds Mark Goldberg, Managing Director and President, Carey Financial Financial Review Katy Rice, Managing Director and CFO Conclusion Trevor Bond, President and CEO Q&A Investing for the long runTM | 2 Agenda |
| Forward-Looking Statements Certain of the matters discussed in this communication constitute forward-looking statements within the meaning of the Securities Act of 1933 and the Securities Exchange Act of 1934, both as amended by the Private Securities Litigation Reform Act of 1995. The forward-looking statements include, among other things, statements regarding the intent, belief or expectations of W. P. Carey Inc. and can be identified by the use of words such as “may,” “will,” “should,” “would,” “assume,” “outlook,” “seek,” “plan,” “believe,” “expect,” “anticipate,” “intend,” “estimate,” “forecast” and other comparable terms. These forward-looking statements include, but are not limited to, statements regarding stable cash flows given long-term leases, anticipated future financial and operating performance and results including estimates of growth. These statements are based on the current expectations of the management of W. P. Carey Inc. It is important to note that the company’s actual results could be materially different from those projected in such forward-looking statements. There are a number of risks and uncertainties that could cause actual results to differ materially from the forward-looking statements. Other unknown or unpredictable factors could also have material adverse effects on future results, performance or achievements of the company. Discussions of some of these other important factors and assumptions are contained in W. P. Carey Inc.’s filings with the SEC and are available at the SEC’s website at http://www.sec.gov, including Item 1A. Risk Factors in the Annual Report on Form 10-K for the year ended December 31, 2012 of W. P. Carey Inc. as filed with the SEC on February 26, 2013. In light of these risks, uncertainties, assumptions and factors, the forward-looking events discussed in this communication may not occur. Readers are cautioned not to place undue reliance on these forward-looking statements, which speak only as of the date of this communication. Except as required under the federal securities laws and the rules and regulations of the SEC, W. P. Carey Inc. does not undertake any obligation to release publicly any revisions to the forward-looking statements to reflect events or circumstances after the date of this communication or to reflect the occurrence of unanticipated events. W. P. Carey Group Disclosure W. P. Carey Group is used to refer to WPC, together with the funds for which it serves as the external advisor, namely, the CPA®: REITS and CWI. We believe that presenting W. P. Carey Group metrics is useful to investors and analysts as a supplemental measure of performance and we use it to evaluate the revenue stability of our managed investment portfolio. W. P. Carey Group metrics should not be considered as an alternative to financial metrics computed on a GAAP basis or as a measure of our profitability. W. P. Carey Group metrics may not be comparable to similarly titled measures of other companies. Investing for the long runTM | 3 Important Disclosures About This Presentation |
| Non-GAAP Financial Measures Funds from operations (“FFO”) is a non-GAAP defined by NAREIT. NAREIT defines FFO as net income or loss (as computed in accordance with GAAP) excluding: depreciation and amortization expense from real estate assets, impairment charges on real estate, gains or losses from sales of depreciated real estate assets and extraordinary items; however FFO related to assets held for sale, sold or otherwise transferred and included in the results of discontinued operations are included. These adjustments also incorporate the pro rata share of unconsolidated subsidiaries. FFO is used by management, investors and analysts to facilitate meaningful comparisons of operating performance between periods and among our peers. Although NAREIT has published this definition of FFO, companies often modify this definition as they seek to provide financial measures that meaningfully reflect their distinctive operations. We modify the NAREIT computation of FFO to include other adjustments to GAAP net income to adjust for certain non-cash charges such as amortization of intangibles, deferred income tax benefits and expenses, straight-line rents, stock compensation, gains or losses from extinguishment of debt and deconsolidation of subsidiaries and unrealized foreign currency exchange gains and losses. We refer to our modified definition of FFO as adjusted funds from operations (“AFFO”). We exclude these items from GAAP net income as they are not the primary drivers in our decision making process. Our assessment of our operations is focused on long-term sustainability and not on such non-cash items, which may cause short-term fluctuations in net income but have no impact on cash flows, and we therefore use AFFO as one measure of our operating performance when we formulate corporate goals, evaluate the effectiveness of our strategies, and determine executive compensation. We believe that AFFO is a useful supplemental measure for investors to consider because it will help them to better assess the sustainability of our operating performance without potentially distorting the impact of these short-term fluctuations. However, there are limits on the usefulness of AFFO to investors. For example, impairment charges and unrealized foreign currency losses that we exclude may become actual realized losses upon the ultimate disposition of the properties in the form of lower cash proceeds or other considerations. A description of these non-GAAP financial measures and reconciliations to the most directly comparable GAAP measurers are provided in our supplemental filing on Form 8-K filed with the Securities and Exchange Commission. All data as of December 31, 2012 unless otherwise noted. Investing for the long runTM | 4 Important Disclosures About This Presentation |
| 1973 – Company Founded by Wm. Polk Carey 1979 – CPA® Series Begins 1998 – CPA®:1-9 Go Public on NYSE as Carey Diversified LLC 1999 – London Office Established 2000 – Merger Between W. P. Carey & Co. LLC & Carey Diversified LLC 2012 – CPA ®:15 Merger / REIT Conversion 2013 – W. P. Carey Celebrates its 40th Anniversary Investing for the long runTM | 5 WPC Inc. Timeline |
| Net Lease Ownership Investment Management Business WPC Inc. 83% of overall revenues(1) $6.6 billion AUM(3) 98.7% occupancy 17% of overall revenues(2) $8.5 billion AUM(4) 98.2% occupancy Investing for the long runTM | 6 WPC Inc. Today – Our Business Model (1) Includes our fourth quarter 2012 annualized pro rata share of revenue from real estate ownership and equity investments. (2) Revenue from investment management includes fourth quarter 2012 annualized asset management revenue and full year 2012 structuring revenue. (3) Includes market cap based on March 28, 2013 closing price of $67.40 and pro rata debt as of December 31, 2012. (4) Includes the estimated value of assets under management, cash and distributions payable. |
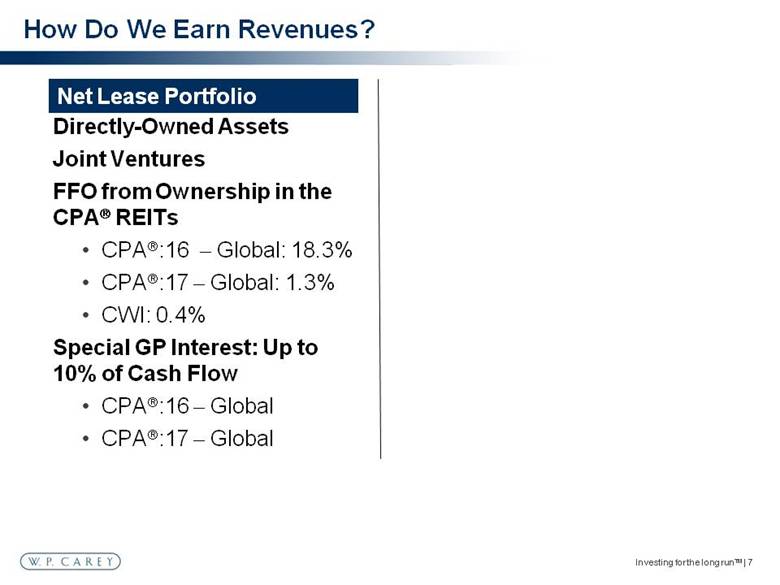
| Net Lease Portfolio Directly-Owned Assets Joint Ventures FFO from Ownership in the CPA® REITs CPA®:16 – Global: 18.3% CPA®:17 – Global: 1.3% CWI: 0.4% Special GP Interest: Up to 10% of Cash Flow CPA®:16 – Global CPA®:17 – Global Investing for the long runTM | 7 How Do We Earn Revenues? |
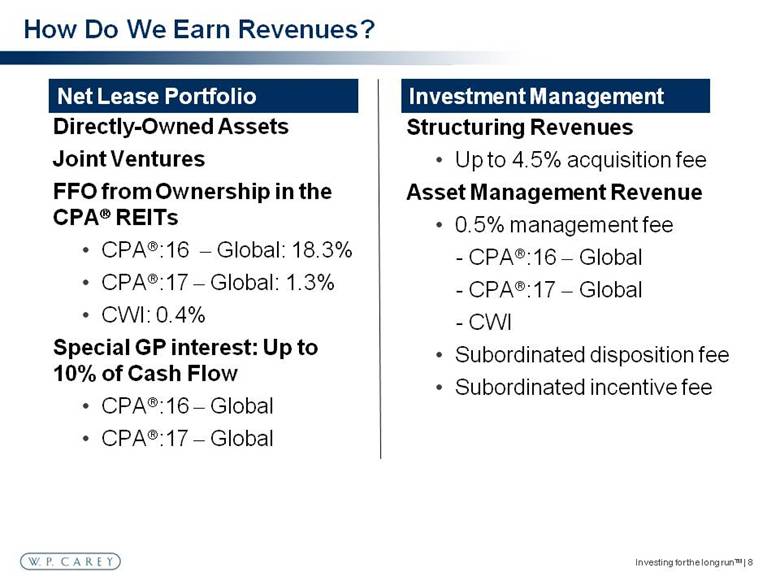
| Net Lease Portfolio Directly-Owned Assets Joint Ventures FFO from Ownership in the CPA® REITs CPA®:16 – Global: 18.3% CPA®:17 – Global: 1.3% CWI: 0.4% Special GP interest: Up to 10% of Cash Flow CPA®:16 – Global CPA®:17 – Global Investing for the long runTM | 8 How Do We Earn Revenues? Investment Management Structuring Revenues Up to 4.5% acquisition fee Asset Management Revenue 0.5% management fee - CPA®:16 – Global - CPA®:17 – Global - CWI Subordinated disposition fee Subordinated incentive fee |
| Investing for the long runTM | 9 Relative Size of WPC Group Portfolios In billions WPC(1) CPA®:16(2) CPA®:17(2) CWI(2) (1) Based on March 28, 2013 closing price of $67.40 and pro rata debt as of December 31, 2012. (2) Includes estimated value of assets under management, cash and distributions payable. |
| Investing for the long runTM | 10 WPC Group Today – Our Portfolios by Geography |
| Investing for the long runTM | 11 WPC Group Today – Our Portfolios by Industry Based on annualized base rents and exchange rates as of December 31, 2012. |

| Investing for the long runTM | 12 WPC Group Today – Our Portfolios by Property Type Based on annualized base rents and exchange rates as of December 31, 2012. Industrial Office Warehouse/Distribution Retail Other Self-Storage |
| Investing for the long runTM | 13 Investments Process and Strategy Gino Sabatini & Jason Fox Co-Heads of Global Investments |
| Our Approach to Net Lease Investing Investing for the long runTM | 14 Four Key Components of a Sale-Leaseback Transaction |
| Our Approach to Net Lease Investing Investing for the long runTM | 15 Creditworthiness of the tenant Four Key Components of a Sale-Leaseback Transaction |
| Industry drivers and trends Competitor analysis Company history Historical financials Capital structure Investment Process - Credit Worthiness Business model projections Margin and ratio analysis Management interviews Stress testing Our credit analysis is a top-down and bottom-up approach, which delves deeply into the tenant's business Investing for the long runTM | 16 |
| Our Approach to Net Lease Investing Investing for the long runTM | 17 Creditworthiness of the tenant Asset(s) critical to the tenant’s business Four Key Components of a Sale-Leaseback Transaction |
| Office: A Corporate Headquarters or Key R&D Facility? Industrial: Key Distribution Facility or Profitable Manufacturing Plant? Retail: Top Performing Stores? Investment Process - Criticality of Asset Look for mission-critical assets that are important to the tenant’s ongoing success Investing for the long runTM | 18 |
| Our Approach to Net Lease Investing Investing for the long runTM | 19 Creditworthiness of the tenant Asset(s) critical to the tenant’s business Fundamental value of the underlying real estate Four Key Components of a Sale-Leaseback Transaction |
| Local market analysis Property condition Environmental analysis Third party valuation Residual analysis We look to acquire real estate that has inherent value – helping to mitigate a tenant default Downside analysis - Contract rent vs. market rent - Market vacancy - TI's/LC’s for re-tenanting Investment Process – Real Estate Investing for the long runTM | 20 |
| Our Approach to Net Lease Investing Investing for the long runTM | 21 Creditworthiness of the tenant Asset(s) critical to the tenant’s business Transaction structure and pricing Fundamental value of the underlying real estate Four Key Components of a Sale-Leaseback Transaction |
| The proper structure helps to minimize risk in a default scenario, as well as maximize returns Lease terms Financial covenants Security deposits/LCs Prudent use of leverage Non-recourse, property level debt Long-term, fixed-rate, amortizing Investment Process – Structure Investing for the long runTM | 22 |
| Successful net lease investing requires balancing these four elements in a large, well-diversified portfolio Our Approach to Net Lease Investing Investing for the long runTM | 23 Creditworthiness of the tenant Asset(s) critical to the tenant’s business Transaction structure and pricing Fundamental value of the underlying real estate Four Key Components of a Sale-Leaseback Transaction |
| The W. P. Carey Difference – What Sets Us Apart Investing for the long runTM | 24 Unique In-House Capabilities Proprietary deal flow International presence – True Global Investor Diversified underwriting capabilities / active asset management |
| Relationship-Driven Deal Sourcing Well-known brand with 40 years of history in the industry Deep relationships with top investment sales and net lease brokers Long history with private equity firms and their portfolio companies Developers (build-to-suits) Installed base of existing tenants Investing for the long runTM | 25 Proprietary Deal Flow |
| Long Track Record W. P. Carey has been investing internationally for 15 years 19 countries globally, including 12 in Europe 289 properties internationally 52 tenants Approximately $3.5 billion international AUM Investing for the long runTM | 26 International Presence – True Global Investor |
| North America 12 Investment Professionals (New York and Dallas) Europe 4 Investment Professionals (London) Asia 5 Investment Professionals (Shanghai) Latin America 1 Investment Professional (São Paulo) India 1 Investment Professional (Delhi) Investing for the long runTM | 27 International Presence – True Global Investor |
| Why We Like Europe: More owner-occupied commercial real estate Higher population density Stronger political involvement deters plant closures Stricter zoning / land-use regulations High barriers to entry for competitors Opportunistic pricing: spreads currently almost 100 bps wider than similar US deals Investing for the long runTM | 28 International Presence – True Global Investor |
| Active Asset Management Highly Structured Investments Harmon Center/Walgreens Las Vegas NY Times In-House, Build-to-Suit Management ~20% of annual deal flow Dedicated personnel Value-Add Opportunities KBR Self Storage Investing for the long runTM | 29 |
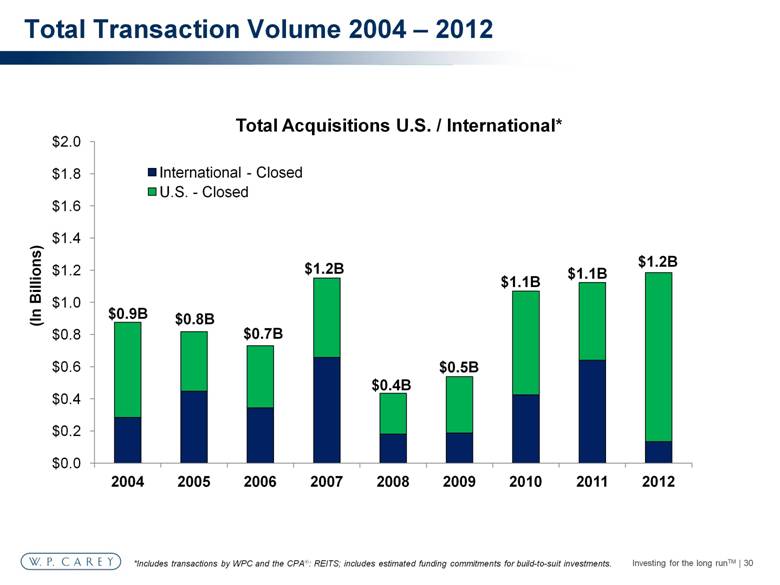
| Total Transaction Volume 2004 – 2012 Total Acquisitions U.S. / International* *Includes transactions by WPC and the CPA®: REITS; includes estimated funding commitments for build-to-suit investments. Investing for the long runTM | 30 (In Billions) $1.2B $0.7B |
| Investments: Case Studies Investing for the long runTM | 31 |

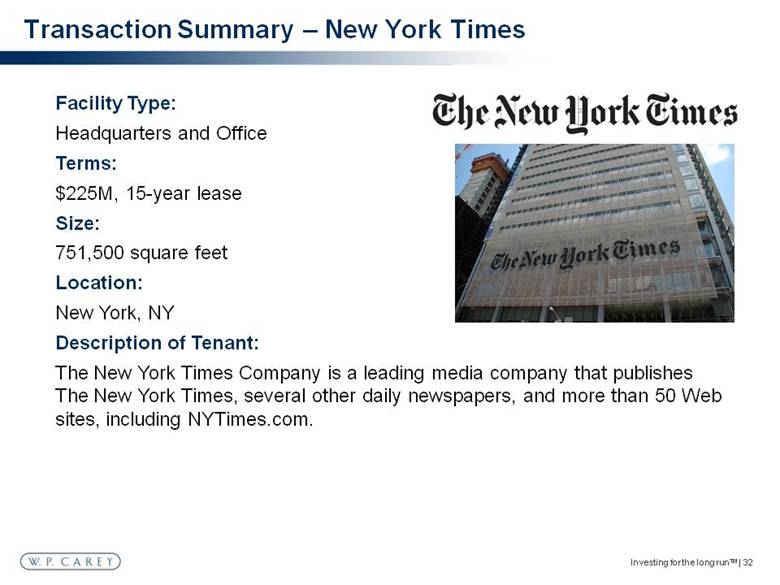
| Facility Type: Headquarters and Office Terms: $225M, 15-year lease Size: 751,500 square feet Location: New York, NY Description of Tenant: The New York Times Company is a leading media company that publishes The New York Times, several other daily newspapers, and more than 50 Web sites, including NYTimes.com. Transaction Summary – New York Times Investing for the long runTM | 32 |
| Facility Type: Office Terms: $42M, 14+ year lease Size: 204,063 square feet Debt: 64% LTV, 10-year term, non-recourse Location: The Woodlands, TX Description of Tenant: The US Oncology Network is one of the nation's largest networks of community-based oncology physicians dedicated to advancing cancer care in America. Approximately one year after original acquisition, McKesson (S&P: A-) acquired US Oncology (S&P: B), a significant credit upgrade. Transaction Summary – McKesson/US Oncology Investing for the long runTM | 33 |
| Facility Type: Headquarters and Office Terms: $72.5M, 10-year lease Size: 679,109 square feet Debt: 50% LTV, 10-year term, Location: Northfield, IL Description of Tenant: Kraft Foods Group is North America’s fourth largest consumer packaged food and beverage company, with revenues of approximately $18 billion in 2012. Its iconic brands include Kraft, Maxwell House, Oscar Mayer, Planters and JELL-O. Transaction Summary – Kraft Foods Investing for the long runTM | 34 |
| Facility Type: 37 Retail Stores Terms: Two transactions: $154M and $379M Debt: 87% LTV Location: Germany Description of Guarantor: Hellweg Die Profi-Baumarkte GmbH & Co. KG, originally founded in 1905 as a lumber retailer, has been operating in the Do-It-Yourself industry for the last 35 years and is presently owned by Mr. Reinhold Semer. Transaction Summary - Hellweg Investing for the long runTM | 35 |
| Walgreens Sale-Leaseback Terms: $38.5M, 30-year lease Size: 24,721 square feet Debt: $40M, 10-year term fixed rate Location: Las Vegas, NV Description of Tenant: Rated A by S&P and A3 by Moody’s, Walgreens is the largest drugstore chain in the United States, operating over 7,800 locations. Harmon Center Equity Conversion: As part of $30M loan to Developers, CPA®:17 exercised its option and converted a loan into a 15% equity stake in BPS Partners, owner of Harmon Ave Center. Transaction Summary – Walgreens Las Vegas Investing for the long runTM | 36 |

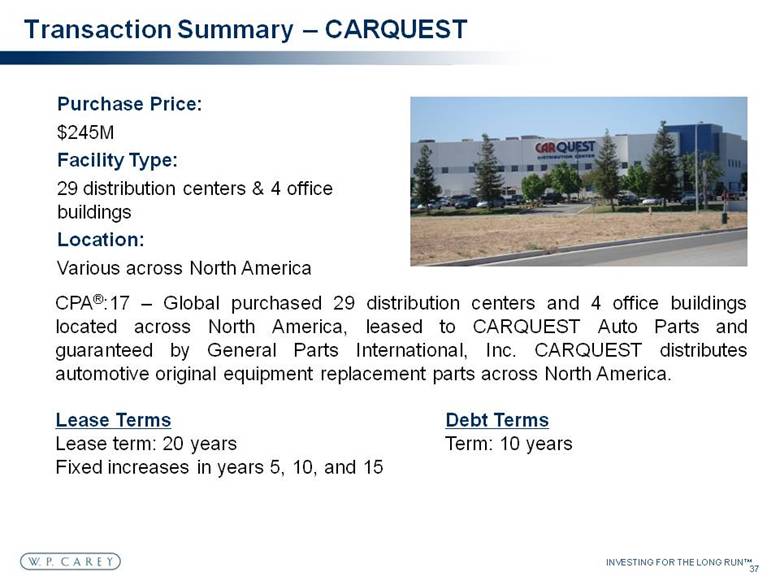
| INVESTING FOR THE LONG RUN™ 37 Purchase Price: $245M Facility Type: 29 distribution centers & 4 office buildings Location: Various across North America CPA®:17 – Global purchased 29 distribution centers and 4 office buildings located across North America, leased to CARQUEST Auto Parts and guaranteed by General Parts International, Inc. CARQUEST distributes automotive original equipment replacement parts across North America. Lease Terms Debt Terms Lease term: 20 years Term: 10 years Fixed increases in years 5, 10, and 15 Transaction Summary – CARQUEST |
| Facility Type: To-be-built Warehouse Facility Terms: $25.4M, 20-year lease Annual Euro CPI increases Size: 377,579 square feet Debt: 50% LTV, 5-year, fixed rate Location: Tarnobrzeg, Poland Description of Guarantor: NSG is the world’s 3rd largest sheet glass manufacturer producing windows for cars and trucks since 1993. Transaction Summary – NSG Build-to-Suit Investing for the long runTM | 38 |
| Facility Type: Warehouse/Distribution Terms: $55M, 10-year lease, 3% CPI increases every six years (starting in 2016) Size: 150,640 square feet Debt: 65% LTV, 5-year term, 2% fixed rate interest rate, interest only Location: Saitama Prefecture, Japan Description of Guarantor: Wanbishi is a market leader in information asset management and support services in Japan, including storage of paper documents and digital data, data destruction and recycling, consulting, and outsourcing of document management and disaster recovery. Transaction Summary – Wanbishi Archives Investing for the long runTM | 39 |
| Facility Type: Headquarters and Office Terms: $177.7M, ~17 year, variable increases Size: 1,047,748 square feet Debt: 72.1% LTV, 10-year term, Location: Houston, TX Description of Tenant: KBR is a global engineering, construction and services company supporting the energy, hydrocarbon, government services, minerals, civil infrastructure, power, industrial and commercial markets. Transaction Summary – KBR Investing for the long runTM | 40 |
| Q&A Investing for the long runTM | 41 |

| Portfolio Review: An Active Approach to Asset Management Thomas E. Zacharias, COO and Head of Asset Management Brooks Gordon, Executive Director, Asset Management Investing for the long runTM | 42 |
| Investing for the long runTM | 43 Presentation Overview WPC Inc. Portfolio Detail Proactive Asset Management - Structure and Capabilities Case Studies - Creating Value for Our Investors |
| Investing for the long runTM | 44 Relative Size of WPC Group Portfolios WPC CPA®:16 CPA®:17 CWI Square Feet (In Thousands) |
| Investing for the long runTM | 45 WPC Group Portfolio Key Statistics 1) Data pro rata as of 12/31/12. 2) WPC based on 3/28/2013 closing price of $67.40. WPC Inc. CPA®:16 - Global CPA®:17 - Global CWI W. P. Carey Group Total square feet 38.7M 47.3M 36.0M 1,751 rooms 122.0M Tenants 124 146 81 NA 296 Properties 423 500 394 8 1,005 Total annual rent(1) $317.7M $330.5M $291.2M NA $939.5M Vacant square feet 0.5M sf 1.5M sf 0 sf NA 2.1M sf Occupancy rate 98.7% 96.9% 100% NA 98.3% % revenue expiring by 12/15 13.8% 7.9% 0.2% NA 7.7% % investment grade tenants revenues 33.8% 15.6% 22.7% NA 24.0% Leverage 29.8%(2) 48.4% 41.6% 35.1% 37.8% Average lease term 8.9 yrs 10.3 yrs 15.8 yrs NA 11.5 yrs |
| Investing for the long runTM | 46 WPC Inc. Top 10 Tenants by Rent Annualized Rent % of Total Lease Term (Years) S&P Rating 1 $26,083,206 8.2% 16.9 - 2 18,741,438 5.9% 11.1 - 3 17,752,126 5.6% 9.8 BBB 4 16,794,030 5.3% 1.6 BBB 5 13,414,282 4.2% 11.4 - 6 10,108,215 3.2% 6.1 - 7 7,573,971 2.4% 6.9 BBB 8 7,101,031 2.2% 10.0 - 9 6,510,470 2.0% 9.4 BBB- 10 5,467,763 1.7% 2.2 A- Total / Weighted Average $129,546,532 40.7% 9.7 Based on annualized base rents and exchange rates as of December 31, 2012. |
| Investing for the long runTM | 47 WPC Inc. Geographic Diversification by Rent Based on annualized base rents and exchange rates as of December 31, 2012. Europe South West East Midwest |
| North America Investing for the long runTM | 48 WPC Inc. Property Type Diversification by Rent Europe Based on annualized base rents and exchange rates as of December 31, 2012. Office Industrial Other Warehouse Self-storage Retail |
| Investing for the long runTM | 49 WPC Inc. Internal Rent Growth Profile 98% of leases include either fixed or CPI-based rent increases or percentage rent. Based on annualized base rents and exchange rates as of December 31, 2012. Uncapped CPI CPI - Based Fixed Other None |
| Investing for the long runTM | 50 WPC Inc. Tenant Credit Diversification by Rent Investment Grade + Implied Investment Grade: 50.4% Bankruptcy Watch Stable Implied Investment List Investment Grade Grade Based on annualized base rents and exchange rates as of December 31, 2012. |
| Investing for the long runTM | 51 WPC Inc. Lease Expiration Schedule Based on annualized base rents and exchange rates as of December 31, 2012. |
| Investing for the long runTM | 52 WPC Inc. Debt Maturity 1) Reflects outstanding recourse debt on the unsecured line of credit (15.8% of total debt maturities). 2014(1) |
| Asset level & portfolio strategy Industry & credit analysis Tenant relationships Local market insight Residual risk analysis Proactive lease restructuring Opportunistic mindset Investing for the long runTM | 53 What Do We Mean by Proactive Asset Management? |
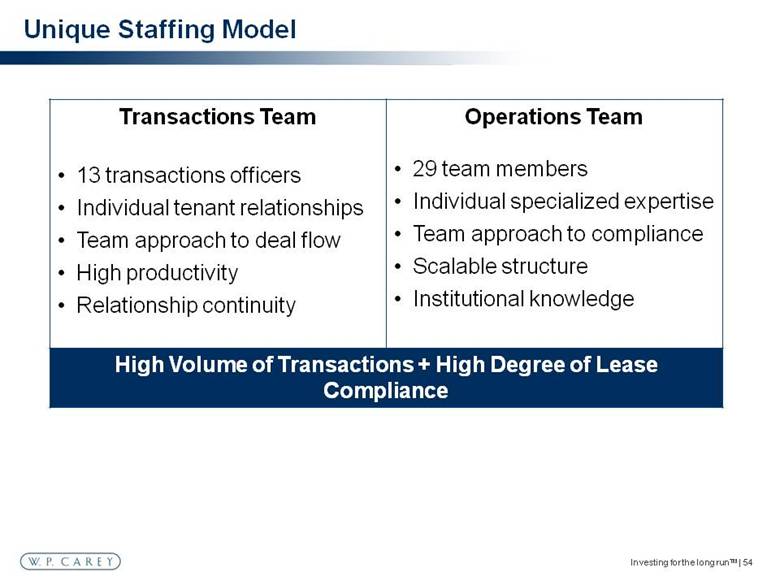
| Investing for the long runTM | 54 Unique Staffing Model Transactions Team 13 transactions officers Individual tenant relationships Team approach to deal flow High productivity Relationship continuity Operations Team 29 team members Individual specialized expertise Team approach to compliance Scalable structure Institutional knowledge High Volume of Transactions + High Degree of Lease Compliance |
| Location Transactions Operations Total New York 9 10 19 Amsterdam 3 18 21 Shanghai 1 1 2 Total 13 29 42 Investing for the long runTM | 55 Global Asset Management Presence Local “Boots on the Ground” Fluent in 18 languages In-Person tenant communication |
| Investing for the long runTM | 56 Asset Management Capabilities Leasing Mortgage financing Dispositions Lease modifications Credit & real estate risk analysis Bankruptcy & Workout Lease compliance Insurance Property inspections Non-NNN lease administration Real estate tax Build to suit Projections & portfolio valuation Operations Team Transactions Team |
| Asset Management: Case Studies Investing for the long runTM | 57 |
| Investing for the long runTM | 58 How Do We Minimize Vacancy & Downtime? Tenant relationships Early renewals Local market intelligence Strictly enforce maintenance & capex requirements |
| Investing for the long runTM | 59 Case Study: New Lease Google, Inc. Venice, CA Office Background Acquisition Date: 1994 Acquisition Price: $16.3M ($240 PSF) Square Feet: 67,682 Outcome New Tenant: Google New Rent: ~$30 PSF New Term: 15 years Early Visibility & Creative Approach |
| Investing for the long runTM | 60 When Do We Sell An Asset? Opportunistic sales Market value > Expected intrinsic value Underwritten credit & residual risk differs from market view Monetize upside & unlock value End of investment lifecycle |
| Investing for the long runTM | 61 Case Study: Market Value > Intrinsic Value B/E Aerospace Miami Warehouse/Office Background Acquisition Date: 2002 Acquisition Cost: $15.5M ($74 PSF) Square Feet: 209,000 Outcome Disposition Date: 2012 Disposition Price: $26M ($124 PSF) Result: 21.3% IRR Reinvested Capital: Kraft HQ Strategic Capital Recycling |
| Investing for the long runTM | 62 Case Study: Credit & Real Estate Risk Best Buy Co. Inc. National Big Box Portfolio Background Acquisition Date: 1993 Acquisition Cost: $46M ($102 PSF) Square Feet: 452,348 (12 stores) Outcome Disposition Date: 2011 Disposition Price: $53.3M ($118 PSF) Constant Credit & Real Estate Analysis |
| Investing for the long runTM | 63 Case Study: Opportunistic Sale Médica France, S.A. Nursing Homes in France Background Acquisition Date: 2002 Acquisition Cost: $43.5M ($129 PSF) Square Feet: 336,923 (6 facilities) Outcome Disposition Date: 2012 Disposition Price: $74.5M ($222 PSF) Result: IRR 27% Creative Structuring = Efficient Exit |
| Blend & extend Multi-property lease restructure Expansion Credit upgrade Sublease to direct Investing for the long runTM | 64 When Do We Restructure A Deal? |
| Investing for the long runTM | 65 Case Study: Expansion & Lease Extension Gestamp Alabama Auto Parts Plant Background Acquisition Date: 2003 Acquisition Cost: $15M ($38 PSF) Square Feet: 390,000 Outcome Transaction Date: 2013 Expansion: 80,000 SF New Investment: $6.35M New Lease Term: 15 years Tenant Relationships + Critical Assets = Opportunity |

| Investing for the long runTM | 65 Case Study: Expansion & Restructure Background Acquisition Date: March 2011 Acquisition Cost: $35M ($34 PSF) Square Feet: 1,010,859 Outcome Transaction Date: 2013 Expansion: 1,000,000 SF New Investment: $37M New Lease Term: 20 years Harbor Freight Tools East Coast Distribution Facility Follow-On Transactions to Extend Lease Term |
| Investing for the long runTM | 67 How Do We Proactively Manage Defaults? Early visibility Aggressively provide alternatives to default Creative workouts & flexibility Sophisticated bankruptcy expertise Non-recourse debt |
| Investing for the long runTM | 68 Case Study: Workout Wellbridge National Fitness Club Portfolio Background Acquisition Date: 2003 Acquisition Cost: $206M Size: 17 Fitness Clubs Outcome New Operators: Life Time & TSI Disposition Dates: 2007 & 2011 Disposition Price: $185M Total Result: 9.8% IRR Credit Driven Proactive Workout |
| Investing for the long runTM | 69 How Do We Optimize Our Asset-Level Debt? Comprehensive asset strategy prior to maturity Early lease renewals Direct lender relationships CMBS / balance sheet / insurance / regional / local Opportunistic refinancing Sophisticated document negotiation |
| Investing for the long runTM | 70 Conclusions Large & diversified portfolio Diverse skill set & unique staffing model High productivity & valuable relationship continuity Proactive asset & portfolio management to maximize returns Replicate successful outcomes across a variety of deals |
| Q&A Investing for the long runTM | 71 |

| Break Investing for the long runTM | 72 |

| Investment Management: A Key Driver of Growth John Park, Director of Strategic Planning Investing for the long runTM | 73 |
| Investing for the Long RunTM | 74 How do we translate our core competency of being a successful investor over the long term into shareholder wealth? Long-Term Strategy |
| Investing for the Long RunTM | 75 Keep fine tuning the investment /asset management process Long-Term Strategy |
| Investing for the Long RunTM | 76 Keep fine tuning the investment /asset management process Transform over time – C corp. Sub S LLC REIT – Asset manager to owner Long-Term Strategy |
| Investing for the Long RunTM | 77 Improved access to capital markets Currency to pursue future growth opportunities W. P. Carey REIT |
| Investing for the Long RunTM | 78 Why keep the investment management business? “Asset management business seems really complicated” W. P. Carey REIT |
| Investing for the Long RunTM | 79 Owner (100%, majority, minority), shareholder, GP and manager W. P. Carey REIT |
| Investing for the Long RunTM | 80 Owner (100%, majority, minority), shareholder, GP and manager W. P. Carey REIT Complex reporting = Complex business |
| Investing for the Long RunTM | 81 Same process Same people Operating leverage Same decision making W. P. Carey REIT |
| Investing for the Long RunTM | 82 Capital Source Non-dilutive to existing shareholders Long-term and patient Cycle resistant access Investment Management Business |
| CPA® Program Performance Investing for the long runTM | 83 Program Program Life Total Return as % of Original Investment Average Annual Total Return (Net of Fees) IRR (Net of Fees) CPA®:1 1979-1998 237% 7.2% 7.0% CPA®:2 1980-1998 369% 14.9% 13.2% CPA®:3 1982-1998 408% 18.8% 15.1% CPA®:4 1983-1998 310% 13.9% 12.2% CPA®:5 1984-1998 210% 7.7% 8.6% CPA®:6 1985-1998 264% 12.5% 10.6% CPA®:7 1987-1998 215% 10.2% 9.8% CPA®:8 1988-1998 229% 13.1% 11.5% CPA®:9 1989-1998 184% 9.6% 9.3% CPA®:10 1991-2002 208% 8.8% 8.6% CPA®:11 1992-2004 242% 11.2% 9.6% CPA®:12 1994-2006 237% 10.9% 9.4% CPA®:14 1998-2011 217% 9.0% 8.2% CPA®:15 2002-2012 202% 9.6% 8.5% Average 13 years 252% 11.2% 10.1% Note: Calculated assuming investment at program inception. |
| Investing for the Long RunTM | 84 Economic benefits of our investment management business High margins Allows us to spread our costs over a bigger asset base Investment Management |
| Investing for the long runTM | 85 We receive structuring revenue of up to 4.5% of the total cost of long-term, net-lease investments made by each CPA®: REIT. For certain types of non-long term net lease investments acquired on behalf of CPA®:17 – Global, structuring revenue may range from 0% to 1.75% of the equity invested. For CWI, we earn structuring revenue of 2.5% of the total investment cost of the properties acquired. We generally earn base asset management revenue of 0.5% of average invested assets. We receive up to 10% of distributions of available cash from the operating partnerships of CPA®:16 – Global, CPA®:17 – Global, and CWI, which is defined as cash generated from operations, excluding capital proceeds, as reduced by operating expenses and debt service, excluding prepayments and balloon payments. WPC earns contractual fees as Advisor to the CPA® REITs and CWI Acquisition Fee(1) Up to 4.5% Asset Management Fee(2) 0.5% per annum Cash Flow Participation(3) 10% Back-End Participation 15% of gain over 6% return Investment Management |
| Investing for the Long RunTM | 86 Keep fine tuning the investment / asset management process Maintain and enhance access to multiple sources of capital Long-Term Strategy |
| Overview of Managed Funds Mark Goldberg, President - Carey Financial Investing for the long runTM | 87 |

| Why as an investment manager do we like the Non-Traded REIT vehicle? Size and scope of the investment management space. Why do we attract significant capital? How does our investment discipline allow us to stand alone? Is the model sustainable? What are our growth prospects? Managed Funds Review Investing for the long runTM | 88 |
| Why As an Asset Manager Do We Like Non-Traded REITs? Average Holding Product Structure Period Mutual Funds Separate Accounts Variable Annuities Non-Traded REITs (CPA®) Sources: Cerulli Associates, Investment Company Institute, National Association of Variable Annuities and Investment Program Institute From a WPC shareholder perspective, the longer the better! Investing for the long runTM | 89 2.9 yrs 3.7 9.1 8-12 |

| Capital Inflow (in millions) The Size and Scope of Investment Management Funds Investing for the long runTM | 90 Public NT-REITs 2003 $7,057 2004 6,254 2005 5,837 2006 6,666 2007 11,519 2008 9,585 2009 6,105 2010 8,107 2011 8,358 2012 10,284 10-Yr Total $79,772 10-Yr Avg $7,977 |
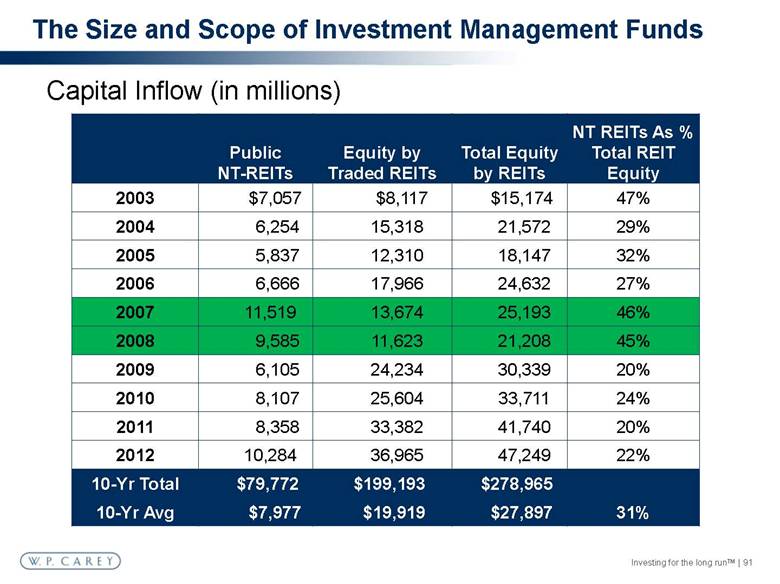
| Public NT-REITs Equity by Traded REITs Total Equity by REITs NT REITs As % Total REIT Equity 2003 $7,057 $8,117 $15,174 47% 2004 6,254 15,318 21,572 29% 2005 5,837 12,310 18,147 32% 2006 6,666 17,966 24,632 27% 2007 11,519 13,674 25,193 46% 2008 9,585 11,623 21,208 45% 2009 6,105 24,234 30,339 20% 2010 8,107 25,604 33,711 24% 2011 8,358 33,382 41,740 20% 2012 10,284 36,965 47,249 22% 10-Yr Total $79,772 $199,193 $278,965 10-Yr Avg $7,977 $19,919 $27,897 31% Capital Inflow (in millions) The Size and Scope of Investment Management Funds Investing for the long runTM | 91 |
| The Size and Scope of Investment Management Funds Investing for the long runTM | 92 Capital Inflow (in millions) |
| The Size and Scope of Investment Management Funds Investing for the long runTM | 93 Capital Inflow (in millions) |
| The Size and Scope of Investment Management Funds Investing for the long runTM | 94 Capital Inflow (in millions) |
| Non-Traded REIT Date of Liquidity Event Event Type Years Invested Equity $ in millions 1 Cornerstone Realty Income Trust, Inc. 4/1997 Listing 4.3 300 2 Apple Suites, Inc. 1/2003 Merger 3.5 125 3 Inland Real Estate Corporation 6/2004 Listing 9.7 539 4 CIP 8/2004 Merger 13.1 141 5 CPA®:10 8/2004 * Merger 14.2 72 6 CNL Restaurant Properties, Inc. (CNL American) 2/2005 Merger 9.8 747 7 Apple Residential Income Trust, Inc. 4/2005 Merger 8.4 302 8 CNL Retirement Properties, Inc. 10/2006 Acquisition 8.0 2,718 9 CPA®:12 12/2006 Merger/Sale 12.8 283 10 DCT Industrial Trust, Inc. (Dividend Capital Trust) 12/2006 Listing 4.4 1,525 11 Inland Retail Real Estate Trust, Inc. 3/2007 Acquisition 8.1 2,235 12 CNL Hotels & Resorts (CNL Hospitality) 4/2007 Acquisition 9.8 3,111 13 Apple Hospitality Two, Inc. 5/2007 Acquisition 6.1 300 14 Apple Hospitality Five, Inc. 10/2007 Acquisition 4.9 454 15 Piedmont Office Realty Trust (Wells REIT) 1/2011 ** Listing 13.0 4,715 16 CPA®:14 5/2011 Merger/Sale 13.4 657 17 American Realty Capital Trust, Inc. 3/2012 Listing 4.1 1,739 18 Inland Western Retail Real Estate Trust, Inc. 4/2012 Listing 9.1 4,260 19 CPA®:15 9/2012 Merger/Listing 10.8 1,046 20 American Realty Capital Trust III, Inc. 2/2013 Merger 2.3 1,743 *CPA® :10 investors were offered the opportunity to receive cash and .8445 shares of Carey Institutional Properties Inc. or a promissory note. Returns calculated for this REIT reflect the returns of those investors who chose to receive cash and .8445 shares of Carey Institutional Properties Inc. As a result, the full-cycle liquidity event was the same as that of CIP. Source: Blue Vault Partners, LLC, Nontraded REIT Industry Full-Cycle Performance Study 6/1/2012 ** While Piedmont Office Realty Trust listed its first tranche of shares on February 10, 2010, full-cycle returns are calculated on the assumption that investors held their shares and did not liquidate until the final tranche of common stock was converted into tradable shares, which was January 30, 2011. Full Cycle NTRs as of February 2013 Why Do NTRs Attract Significant Capital? Investing for the long runTM | 95 |
| Weighted Average Hold Weighted Average IRR - Low - High Investing for the long runTM | 96 Why Do NTRs Attract Significant Capital? Source: Blue Vault Partners, LLC, Nontraded REIT Industry Full-Cycle Performance Study 6/1/2012 8.5 years 9.55% 3.9% 27.8% |
| *Internally sourced. CPA®:1 CPA®:2 CPA®:3 CPA®:4 CPA®:5 CPA®:6 CPA®:7 CPA®:8 CPA®:9 CPA®:10 CPA®:11 CPA®:12 CPA®:14 CPA®:15 Standard Deviation Distribution of CPA® REIT IRRs show a very tight return dispersion How Our Investment Discipline Allows Us to Stand Alone Investing for the long runTM | 97 Average = 10.1% Fund Average IRR* |
| * As of 12/31/2012, not including DRIP proceeds. Data for 4 funds unavailable. Source: Stanger 72 remaining funds $59.9 billion in original equity* $88.3 billion of GAAP book assets Remaining Industry Non-Liquidated Funds Investing for the long runTM | 98 |
| 2003 $559M 2004 542 2005 10 2006 550 2007 0 2008 342 2009 438 2010 593 2011 630 2012 1,039 Total $4.7B W. P. Carey Managed Funds Capital Raised Top two sponsors raised $3.4B Top two sponsors raised $5.1B How Our Investment Discipline Allows Us to Stand Alone Investing for the long runTM | 99 |

| “I continue to be proud of the job that our people are doing for me as an investor and for all of my fellow investors. As to one of the things that I’ve been striving for was not to be too dependent upon investment volume because we don’t want to be pressured into investing when it’s not the time to do it. We want to be opportunistic. We want to purchase for our investors when it’s the right time to do it.” - W. P. Carey Founder, Wm. Polk Carey August 8, 2006 May 11, 1930 – January 2, 2012 How Our Investment Discipline Allows Us to Stand Alone Investing for the long runTM | 100 |
| The CPA® Programs have: 801 quarterly distributions over 34 year 676 quarterly distributions increasing over prior quarter 8 quarterly distributions decreasing over prior quarter How Our Investment Discipline Allows Us to Stand Alone Investing for the long runTM | 101 As of Past performance does not guarantee future results. Distributions increased 85% of the time |
| The CPA® Programs have: 801 quarterly distributions over 34 years 676 quarterly distributions increasing 8 quarterly distributions decreasing No full term investor has lost money in any completed CPA® Program. How Our Investment Discipline Allows Us to Stand Alone Investing for the long runTM | 102 As of Past performance does not guarantee future results. Distributions increased 85% of the time |
| Regulatory Actions High Commission Product Is the Model Sustainable? Investing for the long runTM | 103 |
| Carey Watermark Investors Future Funds Broader Distribution What Are Our Growth Prospects? Investing for the long runTM | 104 |
| Why as an asset manager do we like the NTR vehicle? Size and Scope of the NTR Investment Management Space. Why do NTRs attract significant capital? How does our investment discipline allow us to stand alone? Is the model sustainable? What are our growth prospects? Long duration Steady and growing Performance after fees Buy and Sell Discipline Change will inure to WPC’s benefit Limited by availability of sound investment opportunities Investment Funds Review Investing for the long runTM | 105 |
| Q&A Investing for the long runTM | 106 |

| Financial Review Katy Rice, Chief Financial Officer Investing for the long runTM | 107 |
| Investing for the long runTM | 108 Financial Highlights Strong Operating Results AFFO - 7.7% CAGR over past 5 years CPA®:15 merger and REIT conversion created platform for growth Note: Past performance does not guarantee future results. |
| Investing for the long runTM | 109 Financial Highlights Broad access to equity capital Public – Equity market for REITs remains strong Private Raised $2.9 billion via CPA®:17 – Global, with $372 million available(1) Raised $228 million via CWI, with $38 million available(1) Capital raises dictated by investment opportunities, not fee generation (1) As of April 1, 2013. Note: Past performance does not guarantee future results. |
| Investing for the long runTM | 110 Financial Highlights Conservative capital structure Total Debt to Total Market Cap of 29.8% All non-recourse leverage, except line of credit Exploring feasibility of unsecured debt funding model for WPC Note: Past performance does not guarantee future results. |
| Investing for the long runTM | 111 Financial Highlights Well-covered dividend Increased quarterly dividends each of the past 48 consecutive quarters Annual dividend growth has averaged 2.9% from 1998–2012 Note: Past performance does not guarantee future results. |
| Investing for the long runTM | 112 Historical Operating Results Includes market capitalization based on WPC’s 3/28/2013 closing price of $67.40 and pro rata debt as of 12/31/2012. Includes the estimated value of assets under management, cash and distributions payable. In millions 2008 2009 2010 2011 2012 WPC-Owned Real Estate(1) $ 1,397 $ 1,568 $ 1,778 $ 2,298 $ 5,510 Managed Funds-AUM as of 12/31(2) CPA®:15 2,992 2,821 2,808 2,705 - CPA®:16 – Global 2,439 2,408 2,390 3,923 3,723 CPA®:17 – Global 417 876 1,803 3,136 4,533 CWI - - - 85 282 Total – Managed Funds $ 5,848 $ 6,105 $ 7,001 $ 9,849 $ 8,538 Total – WPC Group $ 7,245 $ 7,673 $ 8,779 $ 12,147 $ 14,048 |
| Investing for the long runTM | 113 Historical Operating Results WPC Inc. 2008 2009 2010 2011 2012 AFFO $124.5 $122.9 $130.9 $188.9 $180.6 AFFO per share (diluted) $3.09 $3.09 $3.27 $4.71 $3.76 Diluted Shares outstanding (wtd avg) 40,221 39,713 40,008 40,098 48,078 88% of WPC’s pro forma AFFO is derived from real estate ownership In millions, except per share amounts |
| Investing for the long runTM | 114 Strong Balance Sheet WPC Inc. Capitalization Equity Market Capitalization(1) $4.6 billion Total Debt $2.0 billion Total Capitalization $6.6 billion Selected Metrics Total Debt / Total Market Capitalization (1) 29.8% Current Dividend Annualized $3.28 2012 AFFO Per Share $3.76 Dividend Yield(1) 4.9% 2012 AFFO Payout 65% Weighted Average Interest Rate 4.8% % Investment Grade Tenants 33.8% % Implied Investment Grade Tenants 16.6% Total 50.4% Based on March 28, 2013 closing price of $67.40. |
| Investing for the long runTM | 115 Dividend Growth Consistent Historical Growth WPC has increased its dividend every year since going public in 1998 Announced 24% dividend increase for Q1 2013 Reflects addition of CPA®:15 assets Target to distribute 100% of taxable income Note: Annualized dividend per share reflects annualized fourth quarter dividend per share for the respective year. Note: Past performance does not guarantee future results. * Represents the first quarter 2013 dividend on an annualized basis. Annualized Dividend Per Share |

| Returns have outpaced major indices, including the S&P 500 and the FTSE NAREIT Equity REIT index Investing for the long runTM | 116 Five-Year Total Return Comparison Note: Past performance does not guarantee future results. Source: SNL Financial LC, Charlottesville, VA, 2012, www.snl.com |
| Conclusion Trevor Bond, President and Chief Executive Officer Investing for the long runTM | 117 |

| Q&A Investing for the long runTM | 118 |
