Exhibit 99.1
Filed pursuant to Rule 425 under the Securities Act of 1933, as amended, and deemed filed pursuant to Rule14a-12 under the Securities Exchange Act of 1934, as amended
Filing Person: W. P. Carey Inc.
Subject Company: Corporate Property Associates 16 – Global Incorporated
Commission File No.: 001-32162

W. P. CAREY INC.
Supplemental Unaudited Operating and Financial Data
As of September 30, 2013
![]()
Important Disclosures About this Supplemental Package
As used in this supplemental package, the terms “W. P. Carey,” “WPC” “the Company,” “we,” “us” and “our” include W. P. Carey Inc., its consolidated subsidiaries, and predecessors, unless otherwise indicated. “WPC LLC” means W. P. Carey & Co. LLC, our predecessor company. The “CPA®:15 Merger” means our merger with Corporate Property Associates 15 Incorporated (“CPA®:15”), which was completed on September 28, 2012. The “Proposed Merger” means our proposed merger with Corporate Property Associates 16 – Global Incorporated (“CPA®:16 – Global”), which was announced on July 25, 2013. “CPA® REITs” means CPA®:15 (through the date of the CPA®:15 Merger), CPA®:16 – Global, Corporate Property Associates 17 – Global Incorporated (“CPA®:17 – Global”), and Corporate Property Associates 18 – Global Incorporated (“CPA®:18 – Global”). The “Managed REITs” means the CPA® REITs and Carey Watermark Investors Incorporated (“CWI”). “W. P. Carey Group” means W. P. Carey, together with the Managed REITs.
Important Note Regarding Non-GAAP Financial Measures
This supplemental package includes certain “non-GAAP” supplemental metrics that are not defined by generally accepted accounting principles (“GAAP”), including earnings before interest, taxes, depreciation and amortization (“EBITDA”), adjusted EBITDA, funds from operations (“FFO”), funds from operations - as adjusted (“AFFO”), pro rata net operating income (“NOI”), pro rata debt, total adjusted real estate revenue, total adjusted general and administrative expense (“Adjusted G&A”) and adjusted revenue. A description of these non-GAAP financial measures and reconciliations to the most directly comparable GAAP measures are provided on page 42 within this supplemental package. FFO is non-GAAP measure defined by the National Association of Real Estate Investments Trusts (“NAREIT”).
Cautionary Statement Concerning Forward-Looking Statements:
Certain of the matters discussed in this communication constitute forward-looking statements within the meaning of the Federal securities laws. The forward-looking statements include, among other things, statements regarding the intent, belief or expectations of W. P. Carey and can be identified by the use of words such as “may,” “will,” “should,” “would,” “assume,” “outlook,” “seek,” “plan,” “believe,” “expect,” “anticipate,” “intend,” “estimate,” “forecast” and other comparable terms. These statements are based on the current expectations of the management of W. P. Carey. It is important to note that W. P. Carey’s actual results could be materially different from those projected in such forward-looking statements. There are a number of risks and uncertainties that could cause actual results to differ materially from the forward-looking statements. Other unknown or unpredictable factors could also have material adverse effects on future results, performance or achievements of W. P. Carey. Discussions of some of these other important factors and assumptions are contained in W. P. Carey’s filings, and the filings of its predecessor, W. P. Carey & Co. LLC, with the Securities and Exchange Commission (“SEC”) and are available at the SEC’s website at http://www.sec.gov, including the Annual Report on Form 10-K for the year ended December 31, 2012 as filed with the SEC on February 26, 2013. In light of these risks, uncertainties, assumptions and factors, the forward-looking events discussed in this communication may not occur. Readers are cautioned not to place undue reliance on these forward-looking statements, which speak only as of the date of this communication. Except as required under the Federal securities laws and the rules and regulations of the SEC, W. P. Carey does not undertake any obligation to release publicly any revisions to the forward-looking statements to reflect events or circumstances after the date of this communication or to reflect the occurrence of unanticipated events.

Earnings Release and Supplemental
Financial Information
Unaudited, Third Quarter 2013
November 5, 2013
W. P. CAREY INC.
Supplemental Unaudited Operating and Financial Data
As of September 30, 2013
Overview |
|
Press Release | 1 |
|
|
Highlights |
|
Company Overview | 4 |
Financial and Operational Statistics | 5 |
|
|
Financial Information |
|
Consolidated Balance Sheets | 6 |
Consolidated Statements of Income | 7 |
Reconciliation of Net Income to Funds from Operations - as Adjusted (AFFO) | 8 |
Reconciliation of Consolidated Statement of Income to AFFO - Current Quarter | 10 |
Reconciliation of Consolidated Statement of Income to AFFO - Year-to-Date | 12 |
Reconciliation of GAAP Net Income to Adjusted EBITDA | 14 |
Adjusted Revenue Analysis | 15 |
Total Adjusted Real Estate Revenue - W. P. Carey Group | 17 |
Adjusted G&A | 18 |
Business Segment and Financial Information | 19 |
Pro Rata NOI | 20 |
|
|
Debt and Other Information |
|
Portfolio Debt Overview | 21 |
Detailed Debt Summary | 23 |
Selected Data for the Managed REITs | 26 |
Joint Venture Information | 27 |
|
|
WPC Portfolio Information |
|
Portfolio Information - Diversification of Top Ten Tenants by Rent and Historical Occupancy | 28 |
Portfolio Information - Diversification by Property Type | 29 |
Portfolio Information - Diversification by Tenant Industry | 30 |
Portfolio Information - Diversification by Geography | 31 |
Portfolio Information - Lease Maturities | 32 |
|
|
2013 Investment Activity |
|
Owned Portfolio - Acquisitions and Dispositions | 33 |
Managed REITs - Acquisitions | 34 |
Managed REITs - Dispositions | 37 |
|
|
Tenants by Annualized Contractual Minimum Base Rent | 38 |
|
|
Terms and Definitions | 42 |
Press Release
W. P. Carey Announces Third Quarter 2013 Financial Results
New York, NY – November 5, 2013 – W. P. Carey Inc. (NYSE: WPC), a real estate investment trust (“REIT”), today reported financial results for the third quarter ended September 30, 2013.
During the third quarter of 2013, the Company:
· Reported Funds from operations—as adjusted (“AFFO”) of $1.03 per diluted share
· Announced a merger agreement with Corporate Property Associates 16 – Global Incorporated (“CPA®:16 – Global”)
· Structured $428.9 million of investments on behalf of the Managed REITs
· Raised its annualized dividend rate to $3.44 per share, WPC’s 50th consecutive quarterly increase
QUARTERLY RESULTS
· AFFO for the third quarter of 2013 was $71.1 million or $1.03 per diluted share, compared to $33.9 million or $0.82 per diluted share for the third quarter of 2012. AFFO for the nine months ended September 30, 2013 was $216.0 million or $3.09 per diluted share, compared to $101.8 million or $2.48 per diluted share for the comparable period in 2012. The increased AFFO in the three and nine months ended September 30, 2013 as compared to the same periods in 2012 was primarily due to income from the properties we acquired in our merger with Corporate Property Associates 15 – Incorporated (“CPA®:15”) on September 28, 2012 (the “CPA®:15 Merger”) partially offset by the cessation of asset management revenue received from CPA®:15 after the CPA®:15 Merger was completed. Per share data for the 2013 periods also reflects the issuance of 28.2 million shares in connection with the CPA®:15 Merger to the stockholders of CPA®:15. Further information concerning AFFO, a non-GAAP supplemental performance metric, is presented in the accompanying tables and related notes.
· Total revenues net of reimbursed expenses for the third quarter of 2013 were $114.7 million, compared to $49.4 million for the third quarter of 2012. Total revenues net of reimbursed expenses for the nine months ended September 30, 2013 were $316.7 million, compared to $143.8 million for the comparable period in 2012. Reimbursed expenses are excluded from total revenues because they have no impact on net income.
· Net Income for the third quarter of 2013 was $18.5 million, compared to $2.6 million for the same period in 2012. Net Income for the nine months ended September 30, 2013 was $75.9 million, compared to $46.7 million for the prior year period.
· For the quarter ended September 30, 2013, we received approximately $14.5 million in cash distributions from our equity ownership in the Managed REITs including $7.3 million in Available Cash distributions related to our special general partnership interests in the Managed® REITs.
W. P. CAREY OWNED PORTFOLIO UPDATE
· In September 2013, W. P. Carey acquired an office facility of the Department of State for Communities and Local Government, a department of the UK Government, located in Manchester, UK. The total acquisition cost of the facility was approximately $63.3 million (GBP40.0 million/EUR47.0 million). Year to date, W. P. Carey has completed five transactions for a total investment of $248.5 million.
· During the third quarter of 2013, W. P. Carey disposed of three properties for total proceeds of $7.6 million.
|
|
|
| Investing for the long runTM |
Press Release
(Continued)
· The W. P. Carey owned portfolio currently consists primarily of 421 leased properties comprising 39.4 million square feet leased to 125 corporate tenants. The average lease term of the portfolio is 8.7 years and the occupancy rate is 99.0%.
W. P. CAREY MANAGED PORTFOLIO UPDATE
· W. P. Carey is the advisor to the CPA® REITs and Carey Watermark Investors Incorporated (“CWI”), which had aggregate real estate assets of $8.6 billion, cash of approximately $0.8 billion and total assets of $9.3 billion as of September 30, 2013. The average occupancy rate for the 78.6 million square feet owned by the CPA® REITs was 98.8%.
· CPA®:17 – GLOBAL: During the third quarter of 2013, we structured eight new investment transactions totaling $209.3 million on behalf of CPA®:17 – Global. Year to date, through October 31, 2013, we have structured $437.6 million of new investments on behalf of CPA®:17 – Global.
· CPA®:18 – GLOBAL: Year to date, through October 31, 2013, CPA®:18 – Global, our newest publicly-registered non-traded REIT offering, has raised approximately $65.6 million.
· CWI: Through the closing of its initial public offering on September 15, 2013, CWI, our lodging-focused non-traded REIT offering, raised approximately $582.4 million, inclusive of reinvested distributions through the distribution reinvestment plan. Year to date, through October 31, 2013, CWI has invested in 11 hotels for a total of $606.7 million, inclusive of two hotels during the third quarter of 2013 for $161.8 million.
On October 25, 2013, CWI filed a registration statement with the SEC for a possible public offering of up to an additional $350 million of its common stock. There can be no assurance that CWI will actually commence the follow-on offering or successfully sell the full number of shares registered, if any.
PROPOSED MERGER WITH CPA®:16 – GLOBAL
· On July 25, 2013, we announced that our Board of Directors and the Board of Directors of our publicly held, non-traded REIT affiliate, CPA®:16 – Global had each unanimously approved a merger agreement pursuant to which CPA®:16 – Global will merge with and into a subsidiary of W. P. Carey in a transaction valued at approximately $4.0 billion, including debt. Following the proposed merger, the combined company is expected to have an equity market capitalization of approximately $6.5 billion and a total enterprise value of approximately $10.0 billion.
· The proposed merger is subject to the approvals of the stockholders of both W. P. Carey and CPA®:16 – Global and other customary closing conditions. If the proposed merger is approved and the other closing conditions are satisfied, we currently expect that the closing will occur during the first quarter of 2014, although there can be no assurance that the transaction will close at such time, if at all.
DIVIDENDS
· As previously announced, the W. P. Carey Board of Directors raised the quarterly cash dividend to $0.86 per share for the third quarter of 2013. This represents a 2.4% increase from the second quarter of 2013 and a 32.3% increase over the third quarter of 2012. The dividend—our 50th consecutive quarterly increase—was paid on October 15, 2013 to stockholders of record as of September 30, 2013.
· W. P. Carey President and CEO Trevor Bond, noted, “The third quarter marks the conclusion of our first full year as a REIT and also included another significant milestone for the company with the announcement of our proposed merger with CPA®:16 – Global. This transaction will further increase our real estate assets under ownership and reinforce our status as a leading global net-lease REIT. While we continue to closely monitor the current economic environment, we believe that the strength our business model and adhering to our established, conservative investment criteria will enable us to continue providing steady income to both our stockholders and investors in our Managed REITs.”
|
|
|
| Investing for the long runTM |
Press Release
(Continued)
Conference Call and Audio Webcast Scheduled for 11:00 AM (ET)
Please call at least 10 minutes prior to call to register.
Time: Tuesday, November 5, 2013 at 11:00 AM (ET)
Call-in Number: 800-860-2442
(International) +1-412-858-4600
Webcast: www.wpcarey.com/Q3earnings
Podcast: www.wpcarey.com/podcast
Available after 2:00 PM (ET)
Replay Number: 877-344-7529
(International) + 1-412-317-0088
Replay Passcode: 10033805
Replay available until November 15, 2013 at 9:00 AM (ET).
W. P. Carey Inc.
Celebrating its 40th anniversary, W. P. Carey Inc. is a publicly traded REIT (NYSE: WPC) that provides long-term sale-leaseback and build-to-suit financing for companies worldwide and owns and manages an investment portfolio totaling approximately $15.8 billion. The largest owner/manager of net lease assets, WPC’s corporate finance-focused credit and real estate underwriting process is a constant that has been successfully leveraged across a wide variety of industries and property types. Its portfolio of long-term leases with creditworthy tenants has an established history of generating stable cash flows that have enabled the Company to deliver consistent dividend income to investors for nearly four decades. www.wpcarey.com
This press release contains forward-looking statements within the meaning of the Federal securities laws. Examples of such forward-looking statements include, but are not limited to, statements regarding the proposed merger and the statements made by Mr. Bond. A number of factors could cause W. P. Carey’s actual results, performance or achievement to differ materially from those anticipated. Among those risks, trends and uncertainties are the general economic climate; the supply of and demand for office and industrial properties; interest rate levels; the availability of financing; and other risks associated with the acquisition and ownership of properties, including risks that the tenants will not pay rent, or that costs may be greater than anticipated. For further information on factors that could impact W. P. Carey or the combined company after the proposed merger, reference is made to W. P. Carey’s filings with the Securities and Exchange Commission.
|
|
|
| Investing for the long runTM |
Company Overview
Key Company Contacts |
| Executive Offices |
Trevor P. Bond | President, Chief Executive Officer and Director | 50 Rockefeller Plaza |
Catherine D. Rice | Chief Financial Officer and Managing Director | New York, NY 10020 |
Thomas E. Zacharias | Chief Operating Officer and Managing Director | Tel: 1-800-WPCAREY or (212) 492-1100 |
Kristin A. Brown | Vice President, Investor Relations | Fax: (212) 492-8922 |
|
| Web Site Address: www.wpcarey.com |
Banks |
|
|
Bank of America, N.A. | Administrative and Documentation Agent |
|
The Bank of New York Mellon | Syndication Agent |
|
JPMorgan Chase Bank, N.A. | Syndication Agent |
|
PNC Bank, N.A. | Syndication Agent |
|
Wells Fargo Bank, N.A. | Syndication Agent |
|
RBS Citizens, N.A. | Syndication Agent |
|
Regions Bank | Syndication Agent |
|
U.S. Bank N.A. | Syndication Agent |
|
Fifth Third Bank | Syndication Agent |
|
Comerica Bank | Syndication Agent |
|
|
|
|
Analyst Coverage |
|
|
Daniel P. Donlan | Ladenburg Thalmann & Co., Inc. |
|
Sheila McGrath | Evercore Partners Inc. |
|
Paul Adornato | BMO Capital Markets |
|
Stock Data (NYSE: WPC) |
| Third Quarter |
|
| Second Quarter |
|
| First Quarter |
|
| Fourth Quarter |
|
| Third Quarter |
|
High Price | $ | 70.89 |
| $ | 78.58 |
| $ | 68.45 |
| $ | 54.70 |
| $ | 53.85 |
|
Low Price |
| 64.32 |
|
| 63.66 |
|
| 51.89 |
|
| 45.94 |
|
| 43.25 |
|
Closing Price |
| 64.70 |
|
| 66.17 |
|
| 67.40 |
|
| 52.15 |
|
| 49.00 |
|
Distributions declared per share - annualized | $ | 3.44 |
| $ | 3.36 |
| $ | 3.28 |
| $ | 2.64 |
| $ | 2.60 |
|
Distribution yield (annualized distribution / closing stock price) |
| 5.32% |
|
| 5.08% |
|
| 4.87% |
|
| 5.06% |
|
| 5.31% |
|
Shares outstanding at quarter end |
| 68,253,736 |
|
| 68,217,189 |
|
| 68,762,259 |
|
| 68,485,525 |
|
| 68,005,470 |
|
Market value of outstanding shares at quarter end ($’000) | $ | 4,416,017 |
| $ | 4,513,931 |
| $ | 4,634,576 |
| $ | 3,571,520 |
| $ | 3,332,268 |
|
| Investing for the long runTM | 4
|
Financial and Operational Statistics (Unaudited)
As of and for the Nine Months Ended September 30, 2013 | |||||||||
Market Capitalization |
| WPC | |||||||
Shares outstanding |
| 68,253,736 | |||||||
Stock price at end of period | $ |
| 64.70 | ||||||
Market capitalization (equity capitalization) ($’000) | $ |
| 4,416,017 | ||||||
Total capitalization ($’000) (a) | $ |
| 6,527,116 | ||||||
Enterprise value ($’000) (b) | $ |
| 6,433,496 | ||||||
High stock close price | $ |
| 70.89 | ||||||
Low stock close price | $ |
| 64.32 | ||||||
Financial Ratios |
| WPC | |||||||
Debt to total capitalization |
| 32.3% | |||||||
Net debt to total capitalization (c) |
| 30.9% | |||||||
Net debt to enterprise value (c) |
| 31.4% | |||||||
Adjusted EBITDA ($’000) (d) | $ |
| 400,176 | ||||||
Net debt to adjusted EBITDA (c) |
| 5.0 | |||||||
Total debt to gross assets (e) |
| 46.2% | |||||||
Unsecured debt to gross assets |
| 10.7% | |||||||
Interest coverage (f) |
| 3.70 | |||||||
Adjusted G&A / Total Adjusted Real Estate Revenue (g) |
| 7.1% | |||||||
Dividend (h) | $ |
| 3.44 | ||||||
Dividend payout (i) |
| 83.4% | |||||||
Weighted-average cost of debt |
| 4.4% | |||||||
Property Information |
| CPA®:16 – Global |
| CPA®:17 – Global |
| CPA®:18 – Global |
| WPC | |
Number of leased properties |
| 477 |
| 343 |
| 1 |
| 421 | |
Number of operating properties (j) |
| 2 |
| 73 |
| - |
| 22 | |
Total properties |
| 479 |
| 416 |
| 1 |
| 443 | |
Total square feet - leased properties (millions) |
| 45.6 |
| 32.8 |
| 0.2 |
| 39.4 | |
Total square feet - operating properties (millions) |
| 0.2 |
| 5.6 |
| - |
| 0.7 | |
Total square feet (millions) |
| 45.8 |
| 38.4 |
| 0.2 |
| 40.1 | |
Number of tenants (k) |
| 140 |
| 88 |
| 1 |
| 125 | |
Occupancy (k) |
| 98.0% |
| 100.0% |
| 100.0% |
| 99.0% | |
Weighted-average lease term (years) |
| 9.6 |
| 15.2 |
| 14.9 |
| 8.7 | |
Percent of investment grade tenants (l) |
| 13.3% |
| 21.1% |
| 100.0% |
| 31.1% | |
|
| ||
|
|
| |
(a) |
| Represents market capitalization plus total pro rata debt. Pro rata debt is a non-GAAP measure. See the Terms and Definitions section that begins on page 42 for a description of our non-GAAP measures. | |
|
|
| |
(b) |
| Represents total capitalization less cash. | |
|
|
| |
(c) |
| Net debt represents pro rata debt less cash. Pro rata debt is a non-GAAP measure. See the Terms and Definitions section that begins on page 42 for a description of our non-GAAP measures. | |
|
|
| |
(d) |
| Adjusted EBITDA reflects the annualized nine months ended September 30, 2013. Adjusted EBITDA is a non-GAAP measure. See the Terms and Definitions section that begins on page 42 for a description of our non-GAAP measures. | |
|
|
| |
(e) |
| Gross assets represent total assets, excluding goodwill, before accumulated depreciation. | |
|
|
| |
(f) |
| Computed by dividing Adjusted EBITDA by annualized interest expense. | |
|
|
| |
(g) |
| Adjusted G&A represents general and administrative expenses excluding CPA®:15 Merger and Proposed Merger-related costs, dealer manager fee-related expenses and stock-based compensation expense. Total Adjusted Real Estate Revenue represents total pro rata real estate revenues for WPC and the Managed REITs, as presented on page 17. Adjusted G&A and Total Adjusted Real Estate Revenue are non-GAAP measures. See the Terms and Definitions section that begins on page 42 for a description of our non-GAAP measures. | |
|
|
| |
(h) |
| Represents the annualized dividend per share based on the declared third quarter distribution. The annualized rate is not guaranteed. | |
|
|
| |
(i) |
| Computed by dividing annualized dividend per share by annualized AFFO per share. | |
|
|
| |
(j) |
| During the fourth quarter of 2013, we sold 19 self-storage properties and one hotel. | |
|
|
| |
(k) |
| Excludes all operating properties. | |
|
|
| |
(l) |
| Investment grade tenants are defined as having a BBB- rating or above. Percentage of portfolio is calculated based on annualized contractual minimum base rent. | |
| Investing for the long runTM | 5
|
Consolidated Balance Sheets
(in thousands) (unaudited)
|
|
| September 30, 2013 |
|
| December 31, 2012 |
Assets |
|
|
|
|
|
|
Investments in real estate: |
|
|
|
|
|
|
Real estate, at cost |
| $ | 2,515,475 |
| $ | 2,334,488 |
Operating real estate, at cost |
|
| 83,896 |
|
| 99,703 |
Accumulated depreciation |
|
| (170,085) |
|
| (136,068) |
Net investments in properties |
|
| 2,429,286 |
|
| 2,298,123 |
Net investments in direct financing leases |
|
| 360,240 |
|
| 376,005 |
Assets held for sale |
|
| 17,975 |
|
| 1,445 |
Equity investments in real estate and the Managed REITs |
|
| 557,513 |
|
| 565,626 |
Net investments in real estate |
|
| 3,365,014 |
|
| 3,241,199 |
Cash and cash equivalents |
|
| 93,620 |
|
| 123,904 |
Due from affiliates |
|
| 42,249 |
|
| 36,002 |
Goodwill |
|
| 327,973 |
|
| 329,132 |
In-place lease intangible assets, net |
|
| 487,527 |
|
| 447,278 |
Above-market rent intangible assets, net |
|
| 261,900 |
|
| 279,885 |
Other intangible assets, net |
|
| 15,519 |
|
| 10,200 |
Other assets, net |
|
| 132,558 |
|
| 141,442 |
Total Assets |
| $ | 4,726,360 |
| $ | 4,609,042 |
|
|
|
|
|
|
|
Liabilities and Equity |
|
|
|
|
|
|
Liabilities: |
|
|
|
|
|
|
Non-recourse debt |
| $ | 1,685,556 |
| $ | 1,715,397 |
Senior credit facility |
|
| 490,000 |
|
| 253,000 |
Accounts payable, accrued expenses and other liabilities |
|
| 282,489 |
|
| 265,132 |
Income taxes, net |
|
| 11,232 |
|
| 24,959 |
Distributions payable |
|
| 59,439 |
|
| 45,700 |
Total liabilities |
|
| 2,528,716 |
|
| 2,304,188 |
Redeemable noncontrolling interest |
|
| 7,316 |
|
| 7,531 |
Redeemable securities - related party |
|
| - |
|
| 40,000 |
|
|
|
|
|
|
|
Equity: |
|
|
|
|
|
|
W. P. Carey stockholders’ equity: |
|
|
|
|
|
|
Common stock |
|
| 69 |
|
| 69 |
Additional paid-in capital |
|
| 2,243,186 |
|
| 2,175,820 |
Distributions in excess of accumulated earnings |
|
| (273,850) |
|
| (172,182) |
Deferred compensation obligation |
|
| 11,354 |
|
| 8,358 |
Accumulated other comprehensive income (loss) |
|
| 8,626 |
|
| (4,649) |
Less: treasury stock, at cost |
|
| (60,270) |
|
| (20,270) |
Total W. P. Carey stockholders’ equity |
|
| 1,929,115 |
|
| 1,987,146 |
Noncontrolling interests |
|
| 261,213 |
|
| 270,177 |
Total equity |
|
| 2,190,328 |
|
| 2,257,323 |
Total Liabilities and Equity |
| $ | 4,726,360 |
| $ | 4,609,042 |
| Investing for the long runTM | 6
|
Consolidated Statements of Income
(in thousands, except share and per share amounts) (unaudited)
|
| Three Months Ended September 30, |
| Nine Months Ended September 30, | ||||||||
|
| 2013 |
| 2012 |
| 2013 |
| 2012 | ||||
Revenues |
|
|
|
|
|
|
|
| ||||
Total lease revenues |
| $ | 77,626 |
| $ | 16,126 |
| $ | 227,936 |
| $ | 49,320 |
Asset management revenue from affiliates |
| 10,961 |
| 15,850 |
| 31,330 |
| 47,088 | ||||
Structuring revenue from affiliates |
| 14,775 |
| 8,316 |
| 27,539 |
| 19,576 | ||||
Dealer manager fees from affiliates |
| 3,787 |
| 4,012 |
| 7,329 |
| 11,878 | ||||
Reimbursed costs from affiliates |
| 23,259 |
| 19,879 |
| 50,694 |
| 59,100 | ||||
Other real estate income |
| 7,506 |
| 5,095 |
| 22,547 |
| 15,977 | ||||
|
| 137,914 |
| 69,278 |
| 367,375 |
| 202,939 | ||||
Operating Expenses |
|
|
|
|
|
|
|
| ||||
General and administrative |
| 28,761 |
| 28,930 |
| 84,733 |
| 77,701 | ||||
Merger and acquisition expenses |
| 3,630 |
| 25,897 |
| 6,879 |
| 30,616 | ||||
Reimbursable costs |
| 23,259 |
| 19,879 |
| 50,694 |
| 59,100 | ||||
Depreciation and amortization |
| 31,560 |
| 6,120 |
| 92,741 |
| 18,549 | ||||
Property expenses |
| 5,746 |
| 2,069 |
| 16,307 |
| 7,112 | ||||
Other real estate expenses |
| 1,654 |
| 1,557 |
| 5,064 |
| 4,619 | ||||
Impairment charges |
| 1,416 |
| - |
| 1,416 |
| - | ||||
|
| 96,026 |
| 84,452 |
| 257,834 |
| 197,697 | ||||
Other Income and Expenses |
|
|
|
|
|
|
|
| ||||
Other interest income |
| 367 |
| 252 |
| 1,053 |
| 910 | ||||
Net income from equity investments in real estate and the Managed REITs (a) |
| 9,180 |
| 10,477 |
| 52,377 |
| 52,808 | ||||
Gain on change in control of interests |
| - |
| 20,794 |
| - |
| 20,794 | ||||
Other income and (expenses) |
| 2,484 |
| 503 |
| 5,453 |
| 2,026 | ||||
Interest expense |
| (27,482) |
| (7,845) |
| (81,187) |
| (22,253) | ||||
|
| (15,451) |
| 24,181 |
| (22,304) |
| 54,285 | ||||
Income from continuing operations before income taxes |
| 26,437 |
| 9,007 |
| 87,237 |
| 59,527 | ||||
Provision for income taxes |
| (5,375) |
| (379) |
| (3,020) |
| (192) | ||||
Income from continuing operations |
| 21,062 |
| 8,628 |
| 84,217 |
| 59,335 | ||||
Discontinued Operations |
|
|
|
|
|
|
|
| ||||
Income (loss) from operations of discontinued properties |
| 349 |
| (458) |
| 3,332 |
| (1,060) | ||||
Gain (loss) on sale of real estate |
| 239 |
| (409) |
| 622 |
| (888) | ||||
Gain on extinguishment of debt |
| - |
| - |
| 84 |
| - | ||||
Impairment charges |
| - |
| (5,535) |
| (4,950) |
| (12,262) | ||||
Income (loss) from discontinued operations, net of tax |
| 588 |
| (6,402) |
| (912) |
| (14,210) | ||||
Net Income |
| 21,650 |
| 2,226 |
| 83,305 |
| 45,125 | ||||
Net (income) loss attributable to noncontrolling interests |
| (2,912) |
| 325 |
| (7,312) |
| 1,383 | ||||
Net (income) loss attributable to redeemable noncontrolling interest |
| (232) |
| 37 |
| (139) |
| 146 | ||||
Net Income Attributable to W. P. Carey |
| $ | 18,506 |
| $ | 2,588 |
| $ | 75,854 |
| $ | 46,654 |
|
|
|
|
|
|
|
|
| ||||
Basic Earnings Per Share |
|
|
|
|
|
|
|
| ||||
Income from continuing operations attributable to W. P. Carey |
| $ | 0.26 |
| $ | 0.22 |
| $ | 1.11 |
| $ | 1.49 |
Income (loss) from discontinued operations attributable to W. P. Carey |
| 0.01 |
| (0.16) |
| (0.01) |
| (0.35) | ||||
Net Income Attributable to W. P. Carey |
| $ | 0.27 |
| $ | 0.06 |
| $ | 1.10 |
| $ | 1.14 |
|
|
|
|
|
|
|
|
| ||||
Diluted Earnings Per Share |
|
|
|
|
|
|
|
| ||||
Income from continuing operations attributable to W. P. Carey |
| $ | 0.26 |
| $ | 0.21 |
| $ | 1.09 |
| $ | 1.47 |
Income (loss) from discontinued operations attributable to W. P. Carey |
| 0.01 |
| (0.15) |
| (0.01) |
| (0.35) | ||||
Net Income Attributable to W. P. Carey |
| $ | 0.27 |
| $ | 0.06 |
| $ | 1.08 |
| $ | 1.12 |
|
|
|
|
|
|
|
|
| ||||
Weighted Average Shares Outstanding |
|
|
|
|
|
|
|
| ||||
Basic |
| 68,397,176 |
| 40,366,298 |
| 68,719,264 |
| 40,398,433 | ||||
Diluted |
| 69,400,825 |
| 41,127,404 |
| 69,846,320 |
| 41,029,578 | ||||
|
|
|
|
|
|
|
|
| ||||
Amounts Attributable to W. P. Carey |
|
|
|
|
|
|
|
| ||||
Income from continuing operations, net of tax |
| $ | 18,021 |
| $ | 8,990 |
| $ | 76,920 |
| $ | 60,864 |
Income (loss) from discontinued operations, net of tax |
| 485 |
| (6,402) |
| (1,066) |
| (14,210) | ||||
Net Income Attributable to W. P. Carey |
| $ | 18,506 |
| $ | 2,588 |
| $ | 75,854 |
| $ | 46,654 |
|
|
|
|
|
|
|
|
| ||||
Distributions Declared Per Share |
| $ | 0.860 |
| $ | 0.650 |
| $ | 2.520 |
| $ | 1.782 |
|
|
(a) Net income from equity investments in real estate and the Managed REITs for the nine months ended September 30, 2013, includes net income from our equity investments in real estate of $30.5 million, income from our ownership in the Managed REITs of $3.7 million and income from our special general partnership interests in the Managed REITs of $18.2 million.
| Investing for the long runTM | 7
|
Reconciliation of Net Income to Funds from Operations – As Adjusted (AFFO)
(in thousands, except share and per share amounts) (unaudited)
|
| Three Months Ended |
| Nine Months Ended |
| |||||||||||||||||||
Real Estate Ownership |
| September 30, 2013 |
| June 30, 2013 |
| March 31, 2013 |
| December 31, 2012 |
| September 30, 2012 |
| September 30, 2013 |
| September 30, 2012 |
| |||||||||
Net income from real estate ownership attributable to W. P. Carey |
| $ | 13,695 |
| $ | 43,107 |
| $ | 16,692 |
| $ | 5,507 |
| $ | 1,927 |
|
| $ | 73,494 |
| $ | 39,388 |
|
|
Adjustments: |
|
|
|
|
|
|
|
|
|
|
|
|
|
|
|
|
| |||||||
Depreciation and amortization of real property |
| 30,483 |
| 30,170 |
| 29,687 |
| 28,652 |
| 5,510 |
|
| 90,340 |
| 17,330 |
|
| |||||||
Impairment charges |
| 1,416 |
| 1,671 |
| 3,279 |
| 10,700 |
| 5,534 |
|
| 6,366 |
| 12,262 |
|
| |||||||
(Gain) loss on sale of real estate |
| (239 | ) | (981 | ) | 931 |
| 4,240 |
| (59 | ) |
| (289 | ) | (1,564 | ) |
| |||||||
Proportionate share of adjustments to equity in net income of partially-owned entities to arrive at FFO (a) |
| 2,365 |
| (16,304 | ) | 3,154 |
| 3,211 |
| 888 |
|
| (10,785 | ) | (12,899 | ) |
| |||||||
Proportionate share of adjustments for noncontrolling interests to arrive at FFO |
| (4,252 | ) | (4,247 | ) | (4,267 | ) | (4,236 | ) | (400 | ) |
| (12,766 | ) | (1,268 | ) |
| |||||||
Total adjustments: |
| 29,773 |
| 10,309 |
| 32,784 |
| 42,567 |
| 11,473 |
|
| 72,866 |
| 13,861 |
|
| |||||||
FFO (as defined by NAREIT) - Real Estate Ownership (b) |
| 43,468 |
| 53,416 |
| 49,476 |
| 48,074 |
| 13,400 |
|
| 146,360 |
| 53,249 |
|
| |||||||
Adjustments: |
|
|
|
|
|
|
|
|
|
|
|
|
|
|
|
|
| |||||||
Loss (gain) on change in control of interest (c) |
| - |
| - |
| - |
| 60 |
| (20,794 | ) |
| - |
| (20,794 | ) |
| |||||||
(Gain) loss on extinguishment of debt |
| (143 | ) | (141 | ) | 74 |
| 10 |
| - |
|
| (210 | ) | - |
|
| |||||||
Other gains, net |
| (32 | ) | - |
| (270 | ) | (12 | ) | - |
|
| (302 | ) | - |
|
| |||||||
Other depreciation, amortization and non-cash charges |
| (707 | ) | (515 | ) | 800 |
| (1,556 | ) | (130 | ) |
| (422 | ) | (106 | ) |
| |||||||
Stock based compensation |
| 259 |
| 911 |
| 174 |
| 211 |
| - |
|
| 1,344 |
| - |
|
| |||||||
Deferred tax expense |
| (732 | ) | (21 | ) | (1,025 | ) | (644 | ) | (917 | ) |
| (1,778 | ) | (2,101 | ) |
| |||||||
Acquisition expense |
| 1,076 |
| 2,909 |
| - |
| - |
| - |
|
| 3,985 |
| - |
|
| |||||||
Realized losses on foreign currency, derivatives, and other |
| 67 |
| 102 |
| 52 |
| 171 |
| 115 |
|
| 221 |
| 657 |
|
| |||||||
Amortization of deferred financing costs |
| 713 |
| 549 |
| 511 |
| 468 |
| 509 |
|
| 1,773 |
| 1,375 |
|
| |||||||
Straight-line and other rent adjustments |
| (1,930 | ) | (2,277 | ) | (2,169 | ) | (2,248 | ) | (200 | ) |
| (6,376 | ) | (2,198 | ) |
| |||||||
Above- and below -market rent intangible lease amortization, net |
| 7,330 |
| 7,237 |
| 7,256 |
| 7,534 |
| 51 |
|
| 21,823 |
| 162 |
|
| |||||||
CPA®:15 Merger and Proposed Merger expenses (d) |
| 2,463 |
| 218 |
| 111 |
| 1,049 |
| 35,570 |
|
| 2,792 |
| 40,289 |
|
| |||||||
Proportionate share of adjustments to equity in net income of partially-owned entities to arrive at AFFO |
| 306 |
| 279 |
| 278 |
| 123 |
| (25 | ) |
| 863 |
| (804 | ) |
| |||||||
AFFO adjustment for interests in CPA® REITs |
| 10,961 |
| 10,718 |
| 9,249 |
| 11,971 |
| 10,650 |
|
| 30,928 |
| 25,263 |
|
| |||||||
Proportionate share of adjustments for noncontrolling interests to arrive at AFFO |
| (1,470 | ) | (1,083 | ) | (1,561 | ) | (506 | ) | (141 | ) |
| (4,114 | ) | (186 | ) |
| |||||||
Total adjustments: |
| 18,161 |
| 18,886 |
| 13,480 |
| 16,631 |
| 24,688 |
|
| 50,527 |
| 41,557 |
|
| |||||||
AFFO - Real Estate Ownership (b) |
| $ | 61,629 |
| $ | 72,302 |
| $ | 62,956 |
| $ | 64,705 |
| $ | 38,088 |
|
| $ | 196,887 |
| $ | 94,806 |
|
|
Investment Management |
|
|
|
|
|
|
|
|
|
|
|
|
|
|
|
|
| |||||||
Net income (loss) from investment management attributable to W. P. Carey |
| $ | 4,811 |
| $ | 60 |
| $ | (2,511 | ) | $ | 9,971 |
| $ | 661 |
|
| $ | 2,360 |
| $ | 7,266 |
|
|
FFO (as defined by NAREIT) - Investment Management (b) |
| 4,811 |
| 60 |
| (2,511 | ) | 9,971 |
| 661 |
|
| 2,360 |
| 7,266 |
|
| |||||||
Adjustments: |
|
|
|
|
|
|
|
|
|
|
|
|
|
|
|
|
| |||||||
Other depreciation, amortization and non-cash charges |
| 264 |
| 253 |
| 262 |
| 226 |
| 247 |
|
| 779 |
| 735 |
|
| |||||||
Stock based compensation |
| 7,594 |
| 7,518 |
| 8,975 |
| 6,281 |
| 9,805 |
|
| 24,087 |
| 19,560 |
|
| |||||||
Deferred tax expense |
| (3,550 | ) | (7,815 | ) | 2,253 |
| (2,625 | ) | (15,207 | ) |
| (9,112 | ) | (21,430 | ) |
| |||||||
Realized (gains) losses on foreign currency, derivatives, and other |
| (7 | ) | 2 |
| 2 |
| (55 | ) | 17 |
|
| (3 | ) | (6 | ) |
| |||||||
Amortization of deferred financing costs |
| 404 |
| 318 |
| 318 |
| 318 |
| 308 |
|
| 1,040 |
| 879 |
|
| |||||||
Total adjustments: |
| 4,705 |
| 276 |
| 11,810 |
| 4,145 |
| (4,830 | ) |
| 16,791 |
| (262 | ) |
| |||||||
AFFO - Investment Management (b) |
| $ | 9,516 |
| $ | 336 |
| $ | 9,299 |
| $ | 14,116 |
| $ | (4,169 | ) |
| $ | 19,151 |
| $ | 7,004 |
|
|
Total Company |
|
|
|
|
|
|
|
|
|
|
|
|
|
|
|
|
| |||||||
FFO (as defined by NAREIT) (b) |
| $ | 48,279 |
| $ | 53,476 |
| $ | 46,965 |
| $ | 58,045 |
| $ | 14,061 |
|
| $ | 148,720 |
| $ | 60,515 |
|
|
FFO (as defined by NAREIT) per diluted share (b) |
| $ | 0.70 |
| $ | 0.77 |
| $ | 0.67 |
| $ | 0.84 |
| $ | 0.34 |
|
| $ | 2.13 |
| $ | 1.47 |
|
|
AFFO (b) |
| $ | 71,145 |
| $ | 72,638 |
| $ | 72,255 |
| $ | 78,821 |
| $ | 33,919 |
|
| $ | 216,038 |
| $ | 101,810 |
|
|
AFFO per diluted share (b) |
| $ | 1.03 |
| $ | 1.05 |
| $ | 1.03 |
| $ | 1.13 |
| $ | 0.82 |
|
| $ | 3.09 |
| $ | 2.48 |
|
|
Diluted weighted average shares outstanding |
| 69,400,825 |
| 69,493,902 |
| 69,975,293 |
| 69,505,871 |
| 41,127,404 |
|
| 69,846,320 |
| 41,029,578 |
|
| |||||||
|
Reconciliation of Net Income to Funds from Operations - As Adjusted (AFFO) - Notes
(Continued)
_________
(a) | Proportionate share of adjustments to equity in net income of partially-owned entities to arrive at FFO for the three months ended June 30, 2013 and nine months ended September 30, 2013, respectively, includes a $19.5 million gain on sale of our equity investments in U.S. Airways. During the nine months ended September 30, 2012 we recognized a $15.1 million gain on sale of our equity investments in Médica. |
|
|
(b) | FFO and AFFO are non-GAAP measures. See the Terms and Definitions section that begins on page 42 for a description of our non-GAAP measures. |
|
|
(c) | Gain on change in control of interests for the three months ended September 30, 2012 represents a gain of $14.6 million recognized on our previously-held interest in shares of CPA®:15 common stock, and a gain of $6.1 million recognized on the purchase of the remaining interests in five investments from CPA®:15, which we had previously accounted for under the equity method. We recognized a gain of $20.7 million to adjust the carrying value of our existing interests in these investments to their estimated fair values in connection with the CPA®:15 Merger. |
|
|
(d) | The three months ended September 30, 2012 includes current tax expense of $9.6 million relating to the conversion of CPA®:15 shares held by us before the CPA®:15 Merger. |
|
Reconciliation of Consolidated Statement of Income to AFFO – Current Quarter
(in thousands) (unaudited)
|
| Three Months Ended September 30, 2013 | ||||||||||||||||
|
| GAAP - Basis (a) |
| Add: Equity |
| Less: Noncontrolling |
| WPC’s |
| AFFO |
| AFFO | ||||||
Revenues |
|
|
|
|
|
|
|
|
|
|
|
| ||||||
Total lease revenues (e) |
| $ | 77,626 |
| $ | 9,282 |
| $ | (10,374) |
| $ | 76,534 |
| $ | 4,720 | (f) | $ | 81,254 |
Asset management revenue from affiliates |
| 10,961 |
| - |
| (142) |
| 10,819 |
| - |
| 10,819 | ||||||
Structuring revenue from affiliates |
| 14,775 |
| - |
| (430) |
| 14,345 |
| - | �� | 14,345 | ||||||
Dealer manager fees |
| 3,787 |
| - |
| - |
| 3,787 |
| - |
| 3,787 | ||||||
Reimbursed costs from affiliates |
| 23,259 |
| - |
| (1) |
| 23,258 |
| - |
| 23,258 | ||||||
Other real estate income: |
|
|
|
|
|
|
|
|
|
|
|
| ||||||
Self-storage revenues |
| 3,680 |
| - |
| (2,201) |
| 1,479 |
| - |
| 1,479 | ||||||
Hotel revenues |
| - |
| - |
| - |
| - |
| - |
| - | ||||||
Pass-through income |
| 3,478 |
| 217 |
| (470) |
| 3,225 |
| - |
| 3,225 | ||||||
Other property and tenant income |
| 348 |
| 102 |
| - |
| 450 |
| - |
| 450 | ||||||
Total other real estate income |
| 7,506 |
| 319 |
| (2,671) |
| 5,154 |
| - |
| 5,154 | ||||||
Total Revenues |
| 137,914 |
| 9,601 |
| (13,618) |
| 133,897 |
| 4,720 |
| 138,617 | ||||||
|
|
|
|
|
|
|
|
|
|
|
|
| ||||||
Operating Expenses |
|
|
|
|
|
|
|
|
|
|
|
| ||||||
General and administrative |
| 28,761 |
| 2 |
| (502) |
| 28,261 |
| (7,823) |
| 20,438 | ||||||
Merger and acquisition expenses |
| 3,630 |
| - |
| - |
| 3,630 |
| (3,540) |
| 90 | ||||||
Reimbursable costs |
| 23,259 |
| - |
| - |
| 23,259 |
| - |
| 23,259 | ||||||
Depreciation and amortization |
| 31,560 |
| 3,089 |
| (4,186) |
| 30,463 |
| (28,833) |
| 1,630 | ||||||
Property expenses |
| 5,746 |
| 350 |
| (813) |
| 5,283 |
| - |
| 5,283 | ||||||
Other real estate expenses |
| 1,654 |
| - |
| (983) |
| 671 |
| - |
| 671 | ||||||
Impairment charges |
| 1,416 |
| - |
| (71) |
| 1,345 |
| (1,345) |
| - | ||||||
Total Operating Expenses |
| 96,026 |
| 3,441 |
| (6,555) |
| 92,912 |
| (41,541) |
| 51,371 | ||||||
|
|
|
|
|
|
|
|
|
|
|
|
| ||||||
Other Income and Expenses |
|
|
|
|
|
|
|
|
|
|
|
| ||||||
Other interest income |
| 367 |
| 200 |
| (31) |
| 536 |
| - |
| 536 | ||||||
Net income from equity investments in real estate and the Managed REITs: |
|
|
|
|
|
|
|
|
|
|
|
| ||||||
Joint ventures (g) |
| 3,704 |
| (3,704) |
| - |
| - |
| - |
| - | ||||||
Income related to our ownership in the Managed REITs |
| 2,584 |
| - |
| - |
| 2,584 |
| 6,530 |
| 9,114 | ||||||
Income related to our general partnership interests |
| 2,892 |
| - |
| - |
| 2,892 |
| 4,431 |
| 7,323 | ||||||
Total net income from equity investments in real estate and the Managed REITs |
| 9,180 |
| (3,704) |
| - |
| 5,476 |
| 10,961 |
| 16,437 | ||||||
Other income and (expenses) |
| 2,484 |
| 907 |
| (1,232) |
| 2,159 |
| (2,214) |
| (55) | ||||||
Interest expense |
| (27,482) |
| (2,997) |
| 4,753 |
| (25,726) |
| 2,035 |
| (23,691) | ||||||
Total Other Income and Expenses |
| (15,451) |
| (5,594) |
| 3,490 |
| (17,555) |
| 10,782 |
| (6,773) | ||||||
Income from Continuing Operations before Income Taxes |
| 26,437 |
| 566 |
| (3,573) |
| 23,430 |
| 57,043 |
| 80,473 | ||||||
Benefit from(provision for) income taxes |
| (5,375) |
| (566) |
| 429 |
| (5,512) |
| (4,279) |
| (9,791) | ||||||
Income from Continuing Operations |
| 21,062 |
| - |
| (3,144) |
| 17,918 |
| 52,764 |
| 70,682 | ||||||
|
|
|
|
|
|
|
|
|
|
|
|
| ||||||
Discontinued Operations |
|
|
|
|
|
|
|
|
|
|
|
| ||||||
Income from operations of discontinued properties |
| 349 |
| - |
| - |
| 349 |
| 114 | (h) | 463 | ||||||
Gain on the sale of real estate |
| 239 |
| - |
| - |
| 239 |
| (239) |
| - | ||||||
Impairment charges |
| - |
| - |
| - |
| - |
| - |
| - | ||||||
Income from Discontinued Operations, Net of Taxes |
| 588 |
| - |
| - |
| 588 |
| (125) |
| 463 | ||||||
Net Income |
| 21,650 |
| - |
| (3,144) |
| 18,506 |
| 52,639 |
| 71,145 | ||||||
Net (income) attributable to noncontrolling interests |
| (2,912) |
| - |
| 2,912 |
| - |
| - |
| - | ||||||
Net loss attributable to redeemable noncontrolling interests |
| (232) |
| - |
| 232 |
| - |
| - |
| - | ||||||
Income / AFFO Attributable to W. P. Carey |
| $ | 18,506 |
| $ | - |
| $ | - |
| $ | 18,506 |
| $ | 52,639 |
| $ | 71,145 |
| Investing for the long runTM | 10 |
Reconciliation of Consolidated Statement of Income to AFFO – Current Quarter
(Continued)
(in thousands) (unaudited)
The following table presents the components of our General and Administrative Expenses:
Three Months Ended September 30, 2013 | ||||||||||||||||||
|
|
|
|
|
|
|
|
|
|
|
|
| ||||||
|
| GAAP - Basis (a) |
| Add: Equity |
| Less: Noncontrolling |
| WPC’s |
| AFFO |
| AFFO | ||||||
General and Administrative |
|
|
|
|
|
|
|
|
|
|
|
| ||||||
Compensation expense |
| $ | 23,419 |
| $ | - |
| $ | (189) |
| $ | 23,230 |
| $ | (7,823) | (i) | $ | 15,407 |
Organization and offering expenses |
| 4,296 |
| - |
| - |
| 4,296 |
| - |
| 4,296 | ||||||
General and administrative professional fees |
| 2,158 |
| (3) |
| (60) |
| 2,095 |
| - |
| 2,095 | ||||||
Reimbursable expenses |
| (5,358) |
| - |
| - |
| (5,358) |
| - |
| (5,358) | ||||||
Office expenses |
| 2,097 |
| - |
| (240) |
| 1,857 |
| - |
| 1,857 | ||||||
Other general and administrative |
| 2,149 |
| 5 |
| (13) |
| 2,141 |
| - |
| 2,141 | ||||||
Total General and Administrative |
| $ | 28,761 |
| $ | 2 |
| $ | (502) |
| $ | 28,261 |
| $ | (7,823) |
| $ | 20,438 |
The following table presents the components of Other Income and (Expenses):
Three Months Ended September 30, 2013 |
|
|
|
|
|
|
|
|
|
|
|
|
| ||||||
|
| GAAP - Basis (a) |
| Add: Equity |
| Less: Noncontrolling |
| WPC’s |
| AFFO |
| AFFO | ||||||
Other Income and (Expenses) |
|
|
|
|
|
|
|
|
|
|
|
| ||||||
Gain (loss) on foreign currency |
| $ | 1,624 |
| $ | - |
| $ | (74) |
| $ | 1,550 |
| $ | (1,549) |
| $ | 1 |
Gain (loss) on derivatives |
| 671 |
| - |
| (192) |
| 479 |
| (479) |
| - | ||||||
Gain (loss) on extinguishment of debt |
| 143 |
| - |
| - |
| 143 |
| (143) |
| - | ||||||
Other gain (loss) (j) |
| 46 |
| 907 |
| (966) |
| (13) |
| (43) |
| (56) | ||||||
Total Other Income and (Expenses) |
| $ | 2,484 |
| $ | 907 |
| $ | (1,232) |
| $ | 2,159 |
| $ | (2,214) |
| $ | (55) |
__________
(a) | Consolidated amounts shown represent WPC’s Consolidated Statement of Income for the three months ended September 30, 2013. |
(b) | Represents the break-out by line item of amounts recorded in net income from equity investments in real estate and the Managed REITs – Joint ventures. |
(c) | Represents the break-out by line item of amounts recorded in noncontrolling interest and redeemable noncontrolling interest. |
(d) | Represents our share in fully-owned entities and co-owned entities. Pro rata basis amounts are non-GAAP measures. See the Terms and Conditions section that begins on page 42 for a description of our non-GAAP measures. |
(e) | Lease revenues on a pro rata basis in this schedule reflect only revenues from continuing operations. Lease revenues from discontinued operations for the three months ended September 30, 2013 were $0.3 million. |
(f) | Represents adjustments for straight line and above/below market lease intangible amortization. |
(g) | To calculate the pro rata amounts, equity investments under joint ventures have been reclassified to allocate their impact on each line item. |
(h) | Represents depreciation and amortization related to discontinued operations. |
(i) | Represents add-back of stock-based compensation expense, less the pro rata share attributable to noncontrolling interests. |
(j) | Represents income in equity investments and noncontrolling interests that could not be broken-out by line item. |
| Investing for the long runTM | 11 |
Reconciliation of Consolidated Statement of Income to AFFO – Year-to-Date
(in thousands) (unaudited)
|
|
Nine Months Ended September 30, 2013 | ||||||||||||||||
|
| GAAP - Basis (a) |
| Add: Equity |
| Less: Noncontrolling |
| WPC’s |
| AFFO |
| AFFO | ||||||
Revenues |
|
|
|
|
|
|
|
|
|
|
|
| ||||||
Total lease revenues (e) |
| $ | 227,936 |
| $ | 29,010 |
| $ | (30,823) |
| $ | 226,123 |
| $ | 13,292 | (f) | $ | 239,415 |
Asset management revenue from affiliates |
| 31,330 |
| - |
| (445) |
| 30,885 |
| - |
| 30,885 | ||||||
Structuring revenue from affiliates |
| 27,539 |
| - |
| (430) |
| 27,109 |
| - |
| 27,109 | ||||||
Dealer manager fees |
| 7,329 |
| - |
| - |
| 7,329 |
| - |
| 7,329 | ||||||
Reimbursed costs from affiliates |
| 50,694 |
| - |
| (108) |
| 50,586 |
| - |
| 50,586 | ||||||
Other real estate income: |
|
|
|
|
|
|
|
|
|
|
|
| ||||||
Self-storage revenues |
| 10,622 |
| - |
| (6,353) |
| 4,269 |
| - |
| 4,269 | ||||||
Hotel revenues |
| - |
| - |
| - |
| - |
| - |
| - | ||||||
Pass-through income |
| 10,863 |
| 605 |
| (1,366) |
| 10,102 |
| - |
| 10,102 | ||||||
Other property and tenant income |
| 1,062 |
| 214 |
| (11) |
| 1,265 |
| - |
| 1,265 | ||||||
Total other real estate income |
| 22,547 |
| 819 |
| (7,730) |
| 15,636 |
| - |
| 15,636 | ||||||
Total Revenues |
| 367,375 |
| 29,829 |
| (39,536) |
| 357,668 |
| 13,292 |
| 370,960 | ||||||
|
|
|
|
|
|
|
|
|
|
|
|
| ||||||
Operating Expenses |
|
|
|
|
|
|
|
|
|
|
|
| ||||||
General and administrative |
| 84,733 |
| 48 |
| (1,696) |
| 83,085 |
| (25,337) |
| 57,748 | ||||||
Merger and acquisition expenses |
| 6,879 |
| - |
| - |
| 6,879 |
| (6,778) |
| 101 | ||||||
Reimbursable costs |
| 50,694 |
| - |
| 2 |
| 50,696 |
| - |
| 50,696 | ||||||
Depreciation and amortization |
| 92,741 |
| 9,383 |
| (12,712) |
| 89,412 |
| (86,151) |
| 3,261 | ||||||
Property expenses |
| 16,307 |
| 855 |
| (2,200) |
| 14,962 |
| - |
| 14,962 | ||||||
Other real estate expenses |
| 5,064 |
| - |
| (3,016) |
| 2,048 |
| - |
| 2,048 | ||||||
Impairment charges |
| 1,416 |
| - |
| (71) |
| 1,345 |
| (1,345) |
| - | ||||||
Total Operating Expenses |
| 257,834 |
| 10,286 |
| (19,693) |
| 248,427 |
| (119,611) |
| 128,816 | ||||||
|
|
|
|
|
|
|
|
|
|
|
|
| ||||||
Other Income and Expenses |
|
|
|
|
|
|
|
|
|
|
|
| ||||||
Other interest income |
| 1,053 |
| 594 |
| (100) |
| 1,547 |
| - |
| 1,547 | ||||||
Net income from equity investments in real estate and the Managed REITs: |
|
|
|
|
|
|
|
|
|
|
|
| ||||||
Joint ventures (g) |
| 30,531 |
| (30,531) |
| - |
| - |
| - |
| - | ||||||
Income related to our ownership in the Managed REITs |
| 3,668 |
| - |
| - |
| 3,668 |
| 25,215 |
| 28,883 | ||||||
Income related to our general partnership interests |
| 18,178 |
| - |
| - |
| 18,178 |
| 5,713 |
| 23,891 | ||||||
Total net income from equity investments in real estate and the Managed REITs |
| 52,377 |
| (30,531) |
| - |
| 21,846 |
| 30,928 |
| 52,774 | ||||||
Other income and (expenses) |
| 5,453 |
| 21,483 |
| (2,853) |
| 24,083 |
| (23,748) |
| 335 | ||||||
Interest expense |
| (81,187) |
| (9,486) |
| 14,318 |
| (76,355) |
| 5,728 |
| (70,627) | ||||||
Total Other Income and Expenses |
| (22,304) |
| (17,940) |
| 11,365 |
| (28,879) |
| 12,908 |
| (15,971) | ||||||
Income from Continuing Operations before Income Taxes |
| 87,237 |
| 1,603 |
| (8,478) |
| 80,362 |
| 145,811 |
| 226,173 | ||||||
Benefit from (provision for) income taxes |
| (3,020) |
| (1,603) |
| 1,027 |
| (3,596) |
| (10,876) |
| (14,472) | ||||||
Income from Continuing Operations |
| 84,217 |
| - |
| (7,451) |
| 76,766 |
| 134,935 |
| 211,701 | ||||||
|
|
|
|
|
|
|
|
|
|
|
|
| ||||||
Discontinued Operations |
|
|
|
|
|
|
|
|
|
|
|
| ||||||
Income from operations of discontinued properties |
| 3,332 |
| - |
| - |
| 3,332 |
| 1,005 | (h) | 4,337 | ||||||
Gain on the sale of real estate |
| 622 |
| - |
| - |
| 622 |
| (622) |
| - | ||||||
Gain on extinguishment of debt |
| 84 |
| - |
| - |
| 84 |
| (84) |
| - | ||||||
Impairment charges |
| (4,950) |
| - |
| - |
| (4,950) |
| 4,950 |
| - | ||||||
(Loss) income from Discontinued Operations, Net of Taxes |
| (912) |
| - |
| - |
| (912) |
| 5,249 |
| 4,337 | ||||||
Net Income |
| 83,305 |
| - |
| (7,451) |
| 75,854 |
| 140,184 |
| 216,038 | ||||||
Net income attributable to noncontrolling interests |
| (7,312) |
| - |
| 7,312 |
| - |
| - |
| - | ||||||
Net loss attributable to redeemable noncontrolling interests |
| (139) |
| - |
| 139 |
| - |
| - |
| - | ||||||
Income / AFFO Attributable to W. P. Carey |
| $ | 75,854 |
| $ | - |
| $ | - |
| $ | 75,854 |
| $ | 140,184 |
| $ | 216,038 |
|
| Investing for the long runTM | 12 |
Reconciliation of Consolidated Statement of Income to AFFO – Year-to-Date
(Continued)
(in thousands) (unaudited)
The following table presents the components of our General and Administrative Expenses:
Nine Months Ended September 30, 2013 | ||||||||||||||||||
|
| GAAP - Basis (a) |
| Add: Equity |
| Less: Noncontrolling |
| WPC’s |
| AFFO |
| AFFO | ||||||
General and Administrative |
|
|
|
|
|
|
|
|
|
|
|
| ||||||
Compensation expense |
| $ | 71,387 |
| $ | - |
| $ | (470) |
| $ | 70,917 |
| $ | (25,337) | (i) | $ | 45,580 |
Organization and offering expenses |
| 9,421 |
| - |
| - |
| 9,421 |
| - |
| 9,421 | ||||||
General and administrative professional fees |
| 7,384 |
| 37 |
| (214) |
| 7,207 |
| - |
| 7,207 | ||||||
Reimbursable expenses |
| (15,838) |
| - |
| - |
| (15,838) |
| - |
| (15,838) | ||||||
Office expenses |
| 6,115 |
| - |
| (972) |
| 5,143 |
| - |
| 5,143 | ||||||
Other general and administrative |
| 6,264 |
| 11 |
| (40) |
| 6,235 |
| - |
| 6,235 | ||||||
Total General and Administrative |
| $ | 84,733 |
| $ | 48 |
| $ | (1,696) |
| $ | 83,085 |
| $ | (25,337) |
| $ | 57,748 |
The following table presents the components of Other Income and (Expenses):
Nine Months Ended September 30, 2013 | ||||||||||||||||||
|
| GAAP - Basis (a) |
| Add: Equity |
| Less: Noncontrolling |
| WPC’s |
| AFFO |
| AFFO | ||||||
Other Income and (Expenses) |
|
|
|
|
|
|
|
|
|
|
|
| ||||||
Gain (loss) on sale of real estate |
| $ | (332) |
| $ | 19,461 |
| $ | - |
| $ | 19,129 |
| $ | (19,129) |
| $ | - |
Gain (loss) on foreign currency |
| 893 |
| - |
| (76) |
| 817 |
| (817) |
| - | ||||||
Gain (loss) on derivatives |
| 4,383 |
| - |
| (1,052) |
| 3,331 |
| (3,331) |
| - | ||||||
Gain (loss) on extinguishment of debt |
| 126 |
| - |
| (2) |
| 124 |
| (124) |
| - | ||||||
Other gain (loss) (j) |
| 383 |
| 2,022 |
| (1,723) |
| 682 |
| (347) |
| 335 | ||||||
Total Other Income and (Expenses) |
| $ | 5,453 |
| $ | 21,483 |
| $ | (2,853) |
| $ | 24,083 |
| $ | (23,748) |
| $ | 335 |
__________
(a) Consolidated amounts shown represent WPC’s Consolidated Statement of Income for the nine months ended September 30, 2013.
(b) Represents the break-out by line item of amounts recorded in net income from equity investments in real estate and the Managed REITs – Joint ventures.
(c) Represents the break-out by line item of amounts recorded in noncontrolling interest and redeemable noncontrolling interest.
(d) Represents our share in fully-owned entities and co-owned entities. Pro rata basis amounts are non-GAAP measures. See the Terms and Conditions section that begins on page 42 for a description of our non-GAAP measures.
(e) Lease revenues on a pro rata basis in this schedule reflect only revenues from continuing operations. Lease revenues from discontinued operations for the nine months ended September 30, 2013 were $2.1 million.
(f) Represents adjustments for straight line and above/below market lease intangible amortization.
(g) To calculate the pro rata amounts, equity investments under joint ventures have been reclassified to allocate their impact on each line item.
(h) Represents depreciation and amortization related to discontinued operations.
(i) Represents add-back of stock-based compensation expense, less the pro rata share attributable to noncontrolling interests.
(j) Represents income in equity investments and noncontrolling interests that could not be broken-out by line item.
|
| Investing for the long runTM | 13 |
Reconciliation of GAAP Net Income to Adjusted EBITDA
(in thousands, except share and per share amounts) (unaudited)
|
| Three Months Ended |
| Nine Months Ended | |||||||||||||||||
|
| September 30, |
| June 30, |
| March 31, |
| December 31, |
| September 30, |
| September 30, |
| September 30, | |||||||
Net Income Attributable to W. P. Carey |
| $ | 18,506 |
| $ | 43,167 |
| $ | 14,181 |
| $ | 15,478 |
| $ | 2,588 |
| $ | 75,854 |
| $ | 46,654 |
Adjustments: |
|
|
|
|
|
|
|
|
|
|
|
|
|
| |||||||
Depreciation and amortization |
| 31,673 |
| 31,157 |
| 30,983 |
| 30,108 |
| 6,761 |
| 93,813 |
| 20,897 | |||||||
Interest expense |
| 27,586 |
| 27,023 |
| 26,979 |
| 28,250 |
| 7,869 |
| 81,588 |
| 22,459 | |||||||
(Benefit from) provision for income taxes |
| 5,375 |
| (1,122) |
| (1,233) |
| 6,591 |
| 379 |
| 3,020 |
| 199 | |||||||
EBITDA (a) |
| 83,140 |
| 100,225 |
| 70,910 |
| 80,427 |
| 17,597 |
| 254,275 |
| 90,209 | |||||||
Proportionate share of adjustments from equity method investments (b) |
| 15,926 |
| 16,060 |
| 17,011 |
| 14,831 |
| 9,103 |
| 48,997 |
| 43,599 | |||||||
Proportionate share of adjustments for noncontrolling interests (b) |
| (9,369) |
| (9,391) |
| (9,290) |
| (9,313) |
| 928 |
| (28,050) |
| (431) | |||||||
|
| 89,697 |
| 106,894 |
| 78,631 |
| 85,945 |
| 27,628 |
| 275,222 |
| 133,377 | |||||||
Management Adjustments: |
|
|
|
|
|
|
|
|
|
|
|
|
|
| |||||||
Impairment charges |
| 1,416 |
| 1,671 |
| 3,279 |
| 10,700 |
| 5,535 |
| 6,366 |
| 12,261 | |||||||
(Gain) loss on sale of real estate |
| (239) |
| (981) |
| 931 |
| 1,081 |
| (59) |
| (289) |
| (1,564) | |||||||
(Gain) loss on extinguishment of debt |
| (143) |
| (141) |
| 74 |
| 10 |
| - |
| (210) |
| - | |||||||
Stock based compensation |
| 7,853 |
| 8,429 |
| 9,149 |
| 6,492 |
| 9,805 |
| 25,431 |
| 19,560 | |||||||
Merger expenses |
| 2,463 |
| 218 |
| 111 |
| 1,049 |
| 25,895 |
| 2,792 |
| 30,614 | |||||||
Losses (gains) on investment due to merger |
| - |
| - |
| - |
| 49 |
| (20,794) |
| - |
| (20,794) | |||||||
Realized and unrealized (gain) loss on foreign currency (net) |
| (1,624) |
| (365) |
| 1,097 |
| (1,106) |
| (46) |
| (892) |
| 527 | |||||||
Realized and unrealized (gain) loss on derivatives (net) |
| (671) |
| (1,691) |
| (2,022) |
| (370) |
| 49 |
| (4,384) |
| 19 | |||||||
Proportionate share of adjustments from equity method investments (c) |
| 5,735 |
| (14,611) |
| 4,010 |
| 5,941 |
| 7,632 |
| (4,866) |
| (8,938) | |||||||
Proportionate share of adjustments for noncontrolling interests (c) |
| 166 |
| 394 |
| 402 |
| 71 |
| (176) |
| 962 |
| (176) | |||||||
Total adjustments |
| 14,956 |
| (7,077) |
| 17,031 |
| 23,917 |
| 27,841 |
| 24,910 |
| 31,509 | |||||||
Adjusted EBITDA (a) |
| $ | 104,653 |
| $ | 99,817 |
| $ | 95,662 |
| $ | 109,862 |
| $ | 55,469 |
| $ | 300,132 |
| $ | 164,886 |
|
|
|
|
|
|
|
|
|
|
|
|
|
|
| |||||||
EBITDA per diluted share (a) |
| $ | 1.20 |
| $ | 1.44 |
| $ | 1.01 |
| $ | 1.16 |
| $ | 0.43 |
| $ | 3.64 |
| $ | 2.20 |
Adjusted EBITDA per diluted share (a) |
| $ | 1.51 |
| $ | 1.44 |
| $ | 1.37 |
| $ | 1.58 |
| $ | 1.35 |
| $ | 4.30 |
| $ | 4.02 |
Diluted weighted average shares outstanding |
| 69,400,825 |
| 69,493,902 |
| 69,975,293 |
| 69,505,871 |
| 41,127,404 |
| 69,846,320 |
| 41,029,578 | |||||||
__________
(a) EBITDA and Adjusted EBITDA are non-GAAP measures. See the Terms and Definition section that begins on page 42 for a description of our non-GAAP measures.
(b) Incorporates the pro rata share of depreciation, interest expense and tax provision adjustments for unconsolidated subsidiaries and joint ventures.
(c) Incorporates the pro rata share of impairments, loss on the sale of real estate, stock-based compensation, merger-related adjustments as well as the losses (gains) related to foreign exchange and derivative positions for unconsolidated subsidiaries and joint ventures.
|
| Investing for the long runTM | 14 |
Adjusted Revenue Analysis (Pro Rata-Basis)
(in thousands) (unaudited)
|
|
Three Months Ended
|
|
Nine Months Ended
| |||||||||||||||||
Reconciliation of Adjusted Revenue |
| September 30, |
| June 30, |
| March 31, |
| December 31, |
| September 30, |
| September 30, |
| September 30, | |||||||
Real Estate Revenue: |
|
|
|
|
|
|
|
|
|
|
|
|
|
| |||||||
Total lease revenue – as reported |
| $ | 77,626 |
| $ | 75,895 |
| $ | 74,415 |
| $ | 73,882 |
| $ | 16,126 |
| $ | 227,936 |
| $ | 49,320 |
Lease revenue – discontinued operations |
| 270 |
| 826 |
| 1,044 |
| 1,826 |
| 646 |
| 2,140 |
| 3,104 | |||||||
Total consolidated lease revenue |
| 77,896 |
| 76,721 |
| 75,459 |
| 75,708 |
| 16,772 |
| 230,076 |
| 52,424 | |||||||
Add: Pro rata share of revenue from equity investments |
| 9,288 |
| 9,751 |
| 9,976 |
| 9,910 |
| 5,313 |
| 29,015 |
| 17,463 | |||||||
Less: Pro rata share of revenue due to noncontrolling interests |
| (10,373) |
| (10,272) |
| (10,175) |
| (10,289) |
| (410) |
| (30,820) |
| (1,260) | |||||||
Total pro rata net lease revenue |
| 76,811 |
| 76,200 |
| 75,260 |
| 75,329 |
| 21,675 |
| 228,271 |
| 68,627 | |||||||
Add: Share of pro rata lease revenue – CPA® REITs |
|
|
|
|
|
|
|
|
|
|
|
|
|
| |||||||
CPA®:15 (a) |
| - |
| - |
| - |
| - |
| 4,234 |
| - |
| 12,726 | |||||||
CPA®:16 – Global |
| 14,071 |
| 14,109 |
| 14,062 |
| 13,954 |
| 13,785 |
| 42,242 |
| 42,340 | |||||||
CPA®:17 – Global |
| 1,367 |
| 1,190 |
| 1,058 |
| 883 |
| 809 |
| 3,615 |
| 2,187 | |||||||
CPA®:18 – Global |
| 32 |
| - |
| - |
| - |
| - |
| 32 |
| - | |||||||
Total share of pro rata lease revenue - CPA® REITs |
| 15,470 |
| 15,299 |
| 15,120 |
| 14,837 |
| 18,828 |
| 45,889 |
| 57,253 | |||||||
Add: share of lease revenue from special general partnership interest |
|
|
|
|
|
|
|
|
|
|
|
|
|
| |||||||
CPA®:16 – Global operating partnership |
| 3,766 |
| 3,830 |
| 3,614 |
| 3,825 |
| 3,685 |
| 11,210 |
| 11,564 | |||||||
CPA®:17 – Global operating partnership |
| 3,557 |
| 4,847 |
| 4,277 |
| 4,395 |
| 3,667 |
| 12,681 |
| 10,225 | |||||||
Total share of lease revenue from special general partnership interest |
| 7,323 |
| 8,677 |
| 7,891 |
| 8,220 |
| 7,352 |
| 23,891 |
| 21,789 | |||||||
Add: Other real estate income - as reported (b) |
| 7,506 |
| 7,412 |
| 7,629 |
| 6,504 |
| 5,095 |
| 22,547 |
| 15,977 | |||||||
Less: Pro rata share of other real estate income to noncontrolling interests |
| (2,201) |
| (2,127) |
| (2,025) |
| (1,972) |
| (2,050) |
| (6,353) |
| (5,757) | |||||||
Total Real Estate Revenue |
| 104,909 |
| 105,461 |
| 103,875 |
| 102,918 |
| 50,900 |
| 314,245 |
| 157,889 | |||||||
Investment Management Revenue: |
|
|
|
|
|
|
|
|
|
|
|
|
|
| |||||||
CPA®:15 |
| - |
| - |
| - |
| - |
| 6,126 |
| - |
| 18,545 | |||||||
CPA®:16 – Global |
| 4,426 |
| 4,465 |
| 4,498 |
| 4,624 |
| 4,631 |
| 13,389 |
| 13,929 | |||||||
CPA®:17 – Global |
| 5,636 |
| 5,311 |
| 5,111 |
| 4,696 |
| 4,906 |
| 16,058 |
| 14,224 | |||||||
CPA®:18 – Global |
| 32 |
| - |
| - |
| - |
| - |
| 32 |
| - | |||||||
CWI & Other |
| 867 |
| 579 |
| 405 |
| 258 |
| 187 |
| 1,851 |
| 389 | |||||||
Asset management revenue - as reported |
| 10,961 |
| 10,355 |
| 10,014 |
| 9,578 |
| 15,850 |
| 31,330 |
| 47,087 | |||||||
Structuring revenue - as reported (c) |
| 14,775 |
| 6,422 |
| 6,342 |
| 28,779 |
| 8,316 |
| 27,539 |
| 19,576 | |||||||
Total Investment Management Revenue |
| 25,736 |
| 16,777 |
| 16,356 |
| 38,357 |
| 24,166 |
| 58,869 |
| 66,663 | |||||||
Total Adjusted Revenue (d) |
| $ | 130,645 |
| $ | 122,238 |
| $ | 120,231 |
| $ | 141,275 |
| $ | 75,066 |
| $ | 373,114 |
| $ | 224,552 |
|
| Investing for the long runTM | 15 |
Adjusted Revenue Analysis (Pro Rata-Basis) - Notes
(Continued)
__________
(a) Represents pro rata lease revenue from CPA®:15 through September 28, 2012, the date of the CPA®:15 Merger.
(b) Other real estate income generally consists of revenue from Carey Storage Management LLC (“Carey Storage”), a subsidiary that invests in domestic self-storage properties, and Livho, Inc., a subsidiary that operates a hotel franchise. Other real estate income also includes lease termination payments and other non-rents related revenues from real estate ownership, and as a result, we expect Other real estate income to fluctuate period to period.
(c) We earn structuring revenue on acquisitions structured on behalf of the Managed REITS and expect significant period-to-period variation in such revenue based on changes in investment volume. Investments structured on behalf of the Managed REITS totaled approximately $429 million, $305 million, $193 million, $736 million, and $202 million for the three months ended September 30, 2013, June 30, 2013, March 31, 2013, December 31, 2012, and September 30, 2012, respectively. For the nine months ended September 30, 2013 and 2012, investments structured on behalf of the Managed REITs totaled approximately $927 million and $470 million, respectively.
(d) Total adjusted revenue excludes reimbursements of costs received from the Managed REITs as they have no impact on net income. Also excluded are dealer manager fees earned in connection with the public offerings of CPA®:18 – Global (initial public offering commenced on May 7, 2013), CPA®:17 – Global (which terminated on January 31, 2013) and CWI (which terminated on September 15, 2013), which are substantially offset by underwriting costs incurred in connection with the offerings. Adjusted revenue is a non-GAAP measure. See the Terms and Definitions section that begins on page 42 for a description of our non-GAAP measures.
|
| Investing for the long runTM | 16 |
Total Adjusted Real Estate Revenue – W. P. Carey Group
(in thousands) (unaudited)
|
|
Three Months Ended |
|
Nine Months Ended | |||||||||||||||||
|
|
September 30, |
|
June 30, |
|
March 31, |
|
December 31, |
|
September 30, |
|
September 30, |
|
September 30, | |||||||
|
|
|
|
|
|
|
|
|
|
|
|
|
|
| |||||||
W. P. Carey Pro Rata Revenue |
|
|
|
|
|
|
|
|
|
|
|
|
|
| |||||||
W. P. Carey pro rata lease revenue |
| $ | 76,811 |
| $ | 76,200 |
| $ | 75,260 |
| $ | 75,329 |
| $ | 21,675 |
| $ | 228,271 |
| $ | 68,627 |
W. P. Carey other real estate income (a) |
| 5,305 |
| 5,285 |
| 5,604 |
| 4,532 |
| 3,045 |
| 16,194 |
| 10,220 | |||||||
|
|
|
|
|
|
|
|
|
|
|
|
|
|
| |||||||
CPA® REITs Pro Rata Revenue |
|
|
|
|
|
|
|
|
|
|
|
|
|
| |||||||
CPA®:15 pro rata lease revenue (b) |
| - |
| - |
| - |
| - |
| 53,592 |
| - |
| 161,153 | |||||||
CPA®:15 other income (b) |
| - |
| - |
| - |
| - |
| 2,120 |
| - |
| 10,253 | |||||||
CPA®:16 – Global pro rata lease revenue |
| 75,937 |
| 76,058 |
| 76,176 |
| 76,129 |
| 75,537 |
| 228,171 |
| 233,258 | |||||||
CPA®:16 – Global other income |
| 12,592 |
| 18,733 |
| 9,817 |
| 9,947 |
| 10,055 |
| 41,142 |
| 30,989 | |||||||
CPA®:17 – Global pro rata lease revenue |
| 78,114 |
| 74,836 |
| 73,973 |
| 68,446 |
| 62,259 |
| 226,923 |
| 181,976 | |||||||
CPA®:17 – Global other income |
| 20,000 |
| 20,468 |
| 19,062 |
| 26,681 |
| 11,869 |
| 59,530 |
| 36,582 | |||||||
CPA®:18 – Global pro rata lease revenue |
| 470 |
| - |
| - |
| - |
| - |
| 470 |
| - | |||||||
CPA®:18 – Global other income |
| 3 |
| - |
| - |
| - |
| - |
| 3 |
| - | |||||||
CWI hotel revenue |
| 40,804 |
| 20,939 |
| 11,296 |
| 6,256 |
| 5,868 |
| 73,039 |
| 6,714 | |||||||
CWI other income |
| 117 |
| 350 |
| 132 |
| 266 |
| 928 |
| 599 |
| 1,345 | |||||||
|
|
|
|
|
|
|
|
|
|
|
|
|
|
| |||||||
Total Adjusted Real Estate Revenue (c) |
| $ | 310,153 |
| $ | 292,869 |
| $ | 271,320 |
| $ | 267,586 |
| $ | 246,948 |
| $ | 874,342 |
| $ | 741,117 |
__________
(a) Other real estate income generally consists of revenue from Carey Storage, a subsidiary that invests in domestic self-storage properties, and Livho, Inc., a subsidiary that operates a hotel franchise. Other real estate income also includes lease termination payments and other non-rent related revenues from real estate ownership, and as a result, we expect Other real estate income to fluctuate period to period. The hotel owned by Livho was sold in October 2013.
(b) Represents pro rata lease revenue from CPA®:15 through September 28, 2012, the date of the CPA®:15 Merger, for the three and nine months ended September 30, 2012.
(c) Total Adjusted Real Estate Revenue is a non-GAAP measure. See the Terms and Definitions section that begins on page 42 for a description of our non-GAAP measures.
| Investing for the long runTM | 17
|
Adjusted G&A
(in thousands, except percentages) (unaudited)
|
| Three Months Ended |
| Nine Months Ended | |||||||||||||||||
|
| September 30, |
| June 30, |
| March 31, |
| December 31, |
| September 30, |
| September 30, |
| September 30, | |||||||
General and administrative, as reported |
| $ | 28,761 |
| $ | 27,122 |
| $ | 28,850 |
| $ | 35,439 |
| $ | 28,930 |
| $ | 84,733 |
| $ | 77,701 |
Less: |
|
|
|
|
|
|
|
|
|
|
|
|
|
| |||||||
Dealer manager fee-related expenses (a) |
| (4,296) |
| (3,163) |
| (1,963) |
| (6,913) |
| (4,046) |
| (9,422) |
| (10,874) | |||||||
Stock-based compensation expense (b) |
| (7,853) |
| (8,429) |
| (9,149) |
| (6,492) |
| (9,805) |
| (25,431) |
| (19,560) | |||||||
Add: |
|
|
|
|
|
|
|
|
|
|
|
|
|
| |||||||
Reimbursable expenses (c) |
| 5,358 |
| 4,375 |
| 6,105 |
| 4,533 |
| 3,920 |
| 15,838 |
| 11,776 | |||||||
Adjusted G&A (d) |
| $ | 21,970 |
| $ | 19,905 |
| $ | 23,843 |
| $ | 26,567 |
| $ | 18,999 |
| $ | 65,718 |
| $ | 59,043 |
|
|
|
|
|
|
|
|
|
|
|
|
|
|
| |||||||
Total Adjusted Real Estate Revenue |
| $ | 310,153 |
| $ | 292,869 |
| $ | 271,320 |
| $ | 267,586 |
| $ | 246,948 |
| $ | 874,342 |
| $ | 741,117 |
As a % of Total Adjusted Real Estate Revenue |
| 7.1% |
| 6.8% |
| 8.8% |
| 9.9% |
| 7.7% |
| 7.5% |
| 8.0% | |||||||
__________
(a) Represents a reimbursement of dealer manager fee-related expenses, which substantially offsets Dealer manager revenues. Dealer manager revenues are not included in the calculation of Total Adjusted Real Estate Revenue; therefore, the offsetting expense is excluded from the calculation of Adjusted G&A expense.
(b) Represents a non-cash expense, this is reflected in the diluted share count.
(c) Effective January 1, 2013, we have included reimbursable expenses in the Adjusted G&A presentation. Results for the prior periods have been adjusted to conform to the current period.
(d) Adjusted G&A and Total Adjusted Real Estate Revenue are non-GAAP measures. See the Terms and Definitions section that begins on page 42 for a description of our non-GAAP measures.
| Investing for the long runTM | 18
|
Business Segment and Financial Information (Pro Rata-Basis)
(in thousands, except share and per share amounts, and percentages) (unaudited)
REAL ESTATE OWNERSHIP |
| Three Months Ended |
| Annualized | ||||||||||
Pro Rata NOI (Includes JVs) (a) (b) |
|
|
|
| ||||||||||
Pro Rata NOI |
| $ | 79,359 |
| $ | 317,436 | ||||||||
|
|
|
|
|
|
|
|
|
|
| ||||
Special General Partnership Interest in Cash Flow (Managed REITs) |
| Nine Months Ended |
| Annualized | ||||||||||
CPA®:16 – Global operating partnership |
| $ | 11,210 |
| $ | 14,947 | ||||||||
CPA®:17 – Global operating partnership |
| 12,681 |
| 16,908 | ||||||||||
Total |
| $ | 23,891 |
| $ | 31,855 | ||||||||
|
|
|
|
|
|
|
|
|
|
| ||||
|
| Three Months Ended September 30, 2013 |
|
| ||||||||||
Other Real Estate Income |
| Revenues |
| Expenses |
| Net Income |
| Annualized | ||||||
Storage income |
| $ | 1,479 |
| $ | 671 |
| $ | 808 |
| $ | 3,232 | ||
|
|
|
|
|
|
|
|
|
|
| ||||
Managed REITs - Shares Owned(c) |
| Current |
| Distributions |
| Most Recent NAV |
| Shares Owned |
| Total Value | ||||
CPA®:16 – Global (18.5% ownership) |
| 6.7% |
| $ | 18,919 |
| $ | 8.70 |
| 38,229,294 |
| $ | 332,595 | |
CPA®:17 – Global (1.7% ownership) |
| 6.5% |
| 2,057 |
| $ | 10.00 |
| 5,495,057 |
| 54,951 | |||
CPA®:18 – Global (1.1% ownership) |
| 8.4% |
| - |
| $ | 9.89 |
| 24,057 |
| 241 | |||
CWI (0.4% ownership) |
| 6.0% |
| 9 |
| $ | 10.00 |
| 231,245 |
| 2,312 | |||
Total |
|
|
| $ | 20,985 |
|
|
| 43,979,653 |
| $ | 390,099 | ||
|
|
|
|
|
|
|
|
|
|
| ||||
INVESTMENT MANAGEMENT (e) |
|
|
|
|
| Trailing Twelve |
| Three Months Ended |
| Annualized | ||||
Asset management revenue |
|
|
|
|
| $ | 40,908 |
| $ | 10,961 |
| $ | 43,844 | |
Structuring revenue |
|
|
|
|
| 56,318 |
| 14,775 |
| 59,100 | ||||
Dealer manager fees |
|
|
|
|
| 15,365 |
| 3,787 |
| 15,148 | ||||
Total |
|
|
|
|
| $ | 112,591 |
| $ | 29,523 |
| $ | 118,092 | |
|
|
|
|
|
|
|
|
|
|
| ||||
CONSOLIDATED BALANCE SHEET INFORMATION |
|
|
|
|
| |||||||||
|
|
|
|
|
| |||||||||
Assets |
|
|
|
|
|
|
| Liabilities |
|
| ||||
Cash |
|
|
| $ | 93,620 |
|
|
| Pro rata debt (Includes JVs) (b) |
| $ | 1,621,099 | ||
Due from affiliates |
|
|
| 42,249 |
|
|
| Line of Credit |
| 490,000 | ||||
Other assets, net |
|
|
| 132,558 |
|
|
| Accounts Payable |
| 282,489 | ||||
|
|
|
|
|
|
|
| Income Taxes, net |
| 11,232 | ||||
Shares Outstanding |
|
|
| 68,253,736 |
|
|
| Distributions Payable |
| 59,439 | ||||
__________
(a) Refer to schedule on the following page for a reconciliation from reported lease revenues and property expenses to pro rata lease revenues and pro rata non-reimbursable property expenses that includes our joint venture (“JV”) interests.
(b) Pro rata NOI and pro rata debt are non-GAAP measures. See page 20 for the detailed reconciliation of Pro Rata NOI. See the Terms and Definitions section that begins on page 42 for a description of our non-GAAP measures.
(c) Excludes investments in the operating partnerships of the Managed REITs.
(d) The estimated net asset value per share (“NAV”) of CPA®:16 – Global is as of December 31, 2012. NAVs have not been determined for CPA®:17 – Global, CPA®:18 – Global, and CWI; therefore, their offering prices have been presented in the table above. CPA®:18 – Global’s offering price is calculated by using a weighted-average of the Class A and Class C common shares outstanding at September 30, 2013 at their initial offering price of $10.00 and $9.35 per share, respectively.
(e) Excludes the asset management revenue related to CPA®:15, which ceased upon the completion of the CPA®:15 Merger on September 28, 2012.
| Investing for the long runTM | 19
|
Pro Rata NOI
(in thousands) (unaudited)
Reconciliation of Pro Rata NOI |
|
Three Months Ended |
| Annualized | ||
Pro Rata Lease Revenue |
|
|
|
| ||
Total lease revenue – as reported |
| $ | 77,626 |
| $ | 310,504 |
Total lease revenue – discontinued operations |
| 270 |
| 1,080 | ||
Total consolidated lease revenue |
| 77,896 |
| 311,584 | ||
Add: Pro rata share of revenue from equity investments |
| 9,288 |
| 37,152 | ||
Less: Pro rata share of revenue due to noncontrolling interests |
| (10,373) |
| (41,492) | ||
Total pro rata lease revenue (a) |
| 76,811 |
| 307,244 | ||
Less: Straight line rent amortization |
| (1,820) |
| (7,280) | ||
Less: Above-and below -market rent intangible lease amortization |
| 6,284 |
| 25,136 | ||
Total Pro Rata Cash Lease Revenues |
| 81,275 |
| 325,100 | ||
Pro Rata Non-Reimbursable Property Expenses: |
|
|
|
| ||
Property expenses – as reported |
| 5,746 |
| 22,984 | ||
Property expenses – discontinued operations |
| (38) |
| (152) | ||
Total consolidated property expenses |
| 5,708 |
| 22,832 | ||
Less: Reimbursable property expenses (b) |
| (3,597) |
| (14,388) | ||
Total non-reimbursable property expenses |
| 2,111 |
| 8,444 | ||
Add: Pro rata share of non-reimbursable property expenses from equity investments |
| 125 |
| 500 | ||
Less: Pro rata share of non-reimbursable property expenses due to noncontrolling interests |
| (320) |
| (1,280) | ||
Total Pro Rata Non-Reimbursable Property Expenses |
| 1,916 |
| 7,664 | ||
Pro Rata NOI (c) |
| $ | 79,359 |
| $ | 317,436 |
__________
(a) Total pro rata lease revenues differ from the amount presented in the reconciliation of Consolidated Statement of Income to AFFO due to the inclusion of discontinued operations.
(b) Reimbursable property expenses are entirely offset by revenues recorded in Other real estate income; therefore, these reimbursements are not included in lease revenue.
(c) Pro rata NOI is a non-GAAP measure. See the Terms and Definitions section that begins on page 42 for a description of our non-GAAP financial measures.
| Investing for the long runTM | 20
|
Portfolio Debt Overview (Pro Rata-Basis)
(in thousands, except percentages) (unaudited)
|
As of September 30, 2013 |
|
Portfolio Debt Maturity |
Year of Maturity |
| Balloon Payments |
| Other Principal |
| Debt Maturity(a) | |||
Remaining 2013 |
| $ | 273 |
| $ | 67 |
| $ | 340 |
2014 (b) |
| 750,654 |
| 12,835 |
| 763,489 | |||
2015 |
| 160,681 |
| 5,274 |
| 165,955 | |||
2016 |
| 59,383 |
| 10,920 |
| 70,303 | |||
2017 |
| 241,799 |
| 9,722 |
| 251,521 | |||
2018 |
| 160,395 |
| 24,365 |
| 184,760 | |||
2019 |
| 28,106 |
| 10,318 |
| 38,424 | |||
2020 |
| 125,861 |
| 27,724 |
| 153,585 | |||
2021 |
| 28,776 |
| 9,611 |
| 38,387 | |||
2022 |
| 159,420 |
| 42,531 |
| 201,951 | |||
2023 |
| 71,832 |
| 57,056 |
| 128,888 | |||
Thereafter |
| 34,473 |
| 79,023 |
| 113,496 | |||
Total |
| $ | 1,821,653 |
| $ | 289,446 |
| $ | 2,111,099 |
Debt Maturity Analysis (a) (in thousands) |
___________
(a) Debt maturity data is presented on a pro rata basis. Pro rata amounts are non-GAAP measures. See the Terms and Definitions section that begins on page 42 for a description of our non-GAAP measures.
(b) Amount includes outstanding recourse debt under the senior credit facility and the Unsecured Term Loan (see below) of $190.0 million and $300.0 million, respectively. On July 31, 2013, we entered into a new credit agreement with our existing lenders (the “Term Loan Credit Agreement”) for an unsecured term loan of up to $300.0 million (“Unsecured Term Loan”), which we drew down in full primarily to repay the then outstanding balance on our existing revolving credit facility. The Term Loan Credit Agreement has substantially the same terms as the Amended and Restated Credit Agreement and is scheduled to mature in July 2014 unless elected pursuant to the terms.
|
| Investing for the long runTM | 21 |
Portfolio Debt Overview (Pro Rata-Basis)
(Continued)
(in thousands, except percentages) (unaudited)
|
As of September 30, 2013 |
|
Fixed- and Variable-Rate Pro Rata Debt |
Non-Recourse Debt |
| Total Outstanding |
| Percent of Total | |
Fixed |
| $ | 1,264,042 |
| 59.9% |
Variable – Swapped |
| 207,493 |
| 9.8% | |
Variable – Capped |
| 110,067 |
| 5.2% | |
Variable – Future Rate Reset |
| 22,410 |
| 1.1% | |
Variable – Floating |
| 17,087 |
| 0.8% | |
|
| 1,621,099 |
| 76.8% | |
Recourse Debt |
|
|
|
| |
Variable – Unsecured Term Loan |
| 300,000 |
| 14.2% | |
Variable – Senior Credit Facility |
| 190,000 |
| 9.0% | |
Total Debt Pro Rata Outstanding (a) |
| $ | 2,111,099 |
| 100.0% |
__________
(a) Pro rata debt is a non-GAAP measure. See the Terms and Definitions section that begins on page 42 for a description of our non-GAAP financial measures.
|
| Investing for the long runTM | 22 |
Detailed Debt Summary (Pro Rata-Basis)
(in thousands, except percentages) (unaudited)
|
As of September 30, 2013 |
|
Detailed Debt Summary |
|
Tenant/Lease Guarantor |
| Maturity Date |
| Interest Rate |
| Rate Type |
| Percent |
| Pro Rata Outstanding | |
EDS Customer Relationship Mgmt. Inc. |
| Dec-13 |
| 10.00% |
| Fixed |
| 100% |
| $ | 340 |
U-Haul Moving Partners Inc. & Mercury Partners, LP |
| May-14 |
| 6.45% |
| Fixed |
| 58% |
| 86,002 | |
Actuant Corporation & GB Tools & Supplies, Inc. |
| May-14 |
| 6.82% |
| Fixed |
| 50% |
| 5,186 | |
TietoEnator Plc |
| Jul-14 |
| 5.16% |
| Fixed |
| 60% |
| 35,871 | |
Multiple Tenants |
| Jul-14 |
| 3.73% |
| Variable – Floating |
| 65% |
| 14,039 | |
LTF Real Estate Company, Inc. |
| Jul-14 |
| 6.43% |
| Fixed |
| 100% |
| 21,500 | |
Northrop Grumman Systems Corporation & Overland Storage Inc. |
| Aug-14 |
| 6.18% |
| Fixed |
| 100% |
| 16,949 | |
Plexus Corporation |
| Aug-14 |
| 7.25% |
| Fixed |
| 100% |
| 4,543 | |
Carrefour France SAS |
| Dec-14 |
| 1.22% |
| Variable – Capped |
| 100% |
| 89,399 | |
Sports Wholesale, Inc. |
| May-15 |
| 6.45% |
| Variable – Swapped |
| 100% |
| 4,320 | |
Hellweg Die Profi-Baumarkte GmbH Und Co. |
| May-15 |
| 4.50% |
| Fixed |
| 75% |
| 65,322 | |
Pohjola Non-Life Insurance Company LTD |
| May-15 |
| 4.59% |
| Fixed |
| 60% |
| 39,049 | |
Wagon Automotive Nagold GmbH & Waldaschaff Automotive |
| Aug-15 |
| 6.64% |
| Fixed |
| 33% |
| 6,390 | |
Lowes Home Improvement Warehouse |
| Sep-15 |
| 4.87% |
| Fixed |
| 100% |
| 8,062 | |
Bouygues Telecom and Caisse Centrale d’Activites Sociales |
| Oct-15 |
| 3.07% |
| Fixed |
| 95% |
| 4,344 | |
The American Bottling Company |
| Nov-15 |
| 5.13% |
| Fixed |
| 100% |
| 27,720 | |
Tata Steel UK Limited |
| Nov-15 |
| 6.17% |
| Fixed |
| 100% |
| 10,748 | |
Humco Holding Group, Inc. |
| Feb-16 |
| 4.75% |
| Fixed |
| 100% |
| 2,561 | |
World Color Printing (USA) Corp. |
| May-16 |
| 5.30% |
| Fixed |
| 100% |
| 4,773 | |
Fiserv, Inc. |
| Jun-16 |
| 6.18% |
| Fixed |
| 100% |
| 28,024 | |
Various self-storage facilities |
| Jul-16 |
| 6.27% |
| Variable – Future Rate Reset |
| 40% |
| 5,806 | |
Sprint Spectrum Realty Company, L. P. |
| Aug-16 |
| 4.85% |
| Fixed |
| 100% |
| 7,962 | |
Del Monte Corporation |
| Aug-16 |
| 4.80% |
| Fixed |
| 50% |
| 5,314 | |
Multiple Tenants |
| Oct-16 |
| 5.01% |
| Variable – Future Rate Reset |
| 75% |
| 9,353 | |
Consolidated Systems, Inc. |
| Nov-16 |
| 5.87% |
| Fixed |
| 60% |
| 6,510 | |
Hellweg Die Profi-Baumärkte GmbH & Co KG |
| Jan-17 |
| 5.49% |
| Fixed |
| 43% |
| 8,200 | |
Hellweg Die Profi-Baumärkte GmbH & Co KG |
| Jan-17 |
| 5.49% |
| Fixed |
| 40% |
| 137,379 | |
Hellweg Die Profi-Baumarkte GmbH Und Co. |
| Jan-17 |
| 6.74% |
| Fixed |
| 40% |
| (12,215) | |
SaarOTEC |
| Jan-17 |
| 5.32% |
| Fixed |
| 50% |
| 4,569 | |
Rave Motion Pictures Baton Rouge LLC |
| Feb-17 |
| 5.60% |
| Fixed |
| 100% |
| 9,910 | |
Qwest Communications, Inc. |
| Feb-17 |
| 4.50% |
| Fixed |
| 100% |
| 1,199 | |
TSI Newton, LLC |
| May-17 |
| 5.59% |
| Fixed |
| 44% |
| 3,308 | |
24 Hour Fitness USA, Inc. |
| Jun-17 |
| 5.50% |
| Variable – Floating |
| 100% |
| 3,048 | |
Amylin Pharmaceuticals, Inc. |
| Jul-17 |
| 6.20% |
| Fixed |
| 100% |
| 33,337 | |
Walgreens Co. |
| Jul-17 |
| 5.67% |
| Fixed |
| 100% |
| 22,000 | |
Advanced Micro Devices |
| Sep-17 |
| 5.80% |
| Fixed |
| 33% |
| 18,075 | |
Arch Chemicals, Inc. |
| Oct-17 |
| 4.83% |
| Fixed |
| 100% |
| 7,581 | |
PETsMART, Inc. |
| Nov-17 |
| 5.75% |
| Fixed |
| 100% |
| 2,544 | |
|
| Investing for the long runTM | 23 |
Detailed Debt Summary (Pro Rata-Basis)
(Continued)
(in thousands, except percentages) (unaudited)
|
As of September 30, 2013 |
|
Detailed Debt Summary |
|
Tenant/Lease Guarantor |
| Maturity Date |
| Interest Rate |
| Rate Type |
| Percent |
| Pro Rata Outstanding |
The United States Playing Card Company & Alstom Power |
| Dec-17 |
| 4.02% |
| Fixed |
| 100% |
| 5,624 |
The United States Playing Card Company & Alstom Power |
| Dec-17 |
| 4.02% |
| Fixed |
| 100% |
| 6,169 |
Wanbishi Archives Co. Ltd. |
| Dec-17 |
| 2.00% |
| Fixed |
| 3% |
| 793 |
OBI Group |
| Mar-18 |
| 5.10% |
| Variable – Swapped |
| 75% |
| 112,180 |
The New York Times Company |
| Apr-18 |
| 2.77% |
| Variable – Capped |
| 18% |
| 20,668 |
MediMedia USA, Inc. |
| Apr-18 |
| 5.90% |
| Fixed |
| 100% |
| 10,566 |
OBI Group |
| Mar-18 |
| 5.48% |
| Variable – Swapped |
| 100% |
| 8,419 |
Kerr Corporation |
| Oct-18 |
| 7.23% |
| Fixed |
| 100% |
| 7,190 |
Omnicom Group, Inc. |
| Oct-18 |
| 6.77% |
| Fixed |
| 100% |
| 25,737 |
Various self-storage facilities |
| Feb-19 |
| 7.03% |
| Variable – Future Rate Reset |
| 40% |
| 12,270 |
Barnes & Noble, Inc. |
| Feb-19 |
| 3.70% |
| Variable – Swapped |
| 100% |
| 3,411 |
Orbital Sciences Corporation |
| Jul-19 |
| 7.75% |
| Fixed |
| 100% |
| 11,568 |
Universal Technical Inst. of CA, Inc. |
| Nov-19 |
| 6.27% |
| Variable – Future Rate Reset |
| 100% |
| 11,175 |
24 Hour Fitness USA, Inc. |
| Jan-20 |
| 6.10% |
| Fixed |
| 100% |
| 3,023 |
C1000 Logistiek Vastgoed B.V. |
| Mar-20 |
| 3.75% |
| Variable – Swapped |
| 15% |
| 11,188 |
C1000 Logistiek Vastgoed B.V. |
| Mar-20 |
| 8.49% |
| Variable – Swapped |
| 15% |
| 2,972 |
Merit Medical Systems, Inc. |
| Apr-20 |
| 6.50% |
| Fixed |
| 100% |
| 12,881 |
JPMorgan Chas Bank, National Assoc. |
| Jul-20 |
| 5.47% |
| Variable – Swapped |
| 100% |
| 33,191 |
Prefecture de Police (Paris, France) |
| Aug-20 |
| 4.36% |
| Fixed |
| 50% |
| 37,429 |
Self-Storage Facility in Pensacola, FL |
| Nov-20 |
| 6.25% |
| Variable – Future Rate Reset |
| 100% |
| 1,772 |
Federal Express Corporation |
| Dec-20 |
| 5.48% |
| Fixed |
| 100% |
| 51,129 |
Universal Technical Inst. of Penn., Inc. |
| Jan-21 |
| 6.15% |
| Fixed |
| 100% |
| 12,730 |
SymphonyIRI Group, Inc. |
| Feb-21 |
| 5.96% |
| Variable – Future Rate Reset |
| 100% |
| 15,195 |
Datalogic Scanning, Inc. |
| Feb-21 |
| 5.80% |
| Fixed |
| 100% |
| 4,663 |
PETsMART, Inc. |
| Sep-21 |
| 6.50% |
| Fixed |
| 30% |
| 5,799 |
Integracolor, Ltd. |
| Mar-22 |
| 4.37% |
| Variable – Swapped |
| 100% |
| 6,763 |
24 Hour Fitness USA, Inc. |
| Apr-22 |
| 6.29% |
| Fixed |
| 100% |
| 3,895 |
Belgium Government |
| May-22 |
| 6.23% |
| Fixed |
| 100% |
| 10,969 |
EADS North America Defense Test & Services |
| Jun-22 |
| 4.70% |
| Fixed |
| 100% |
| 8,363 |
Anthony’s Manufacturing Company |
| Jun-22 |
| 4.65% |
| Fixed |
| 100% |
| 6,912 |
Foster Wheeler Realty Services |
| Aug-22 |
| 3.89% |
| Variable – Swapped |
| 100% |
| 25,049 |
Marriott Courtyard |
| Oct-22 |
| 5.04% |
| Fixed |
| 100% |
| 140,000 |
Pactiv Corporation |
| Mar-23 |
| 6.32% |
| Fixed |
| 100% |
| 6,179 |
Benchmark Electronics Manufacturing, Inc. |
| Apr-23 |
| 6.36% |
| Fixed |
| 100% |
| 4,947 |
True Value Company |
| Jan-23 |
| 4.26% |
| Fixed |
| 50% |
| 16,009 |
True Value Company |
| Feb-23 |
| 4.25% |
| Fixed |
| 50% |
| 14,801 |
Kraft Foods Group, Inc. |
| Feb-23 |
| 4.05% |
| Fixed |
| 100% |
| 36,500 |
|
| Investing for the long runTM | 24 |
Detailed Debt Summary (Pro Rata-Basis)
(Continued)
(in thousands, except percentages) (unaudited)
|
As of September 30, 2013 |
|
Detailed Debt Summary |
|
Tenant/Lease Guarantor |
| Maturity Date |
| Interest Rate |
| Rate Type |
| Percent |
| Pro Rata Outstanding | ||
|
|
|
|
|
|
|
|
|
|
| ||
Hologic, Inc. |
| May-23 |
| 6.40% |
| Fixed |
| 100% |
| 12,313 | ||
Galyan’s Trading Company |
| Sep-23 |
| 6.95% |
| Fixed |
| 100% |
| 2,928 | ||
Grande Communications Networks, Inc. |
| Sep-23 |
| 6.72% |
| Fixed |
| 100% |
| 5,066 | ||
Rexam Consumer Plastics, Inc. |
| Oct-23 |
| 6.30% |
| Fixed |
| 100% |
| 12,291 | ||
Galyan’s Trading Company |
| Oct-23 |
| 5.23% |
| Fixed |
| 100% |
| 8,300 | ||
EDS Customer Relationship Mgmt. Inc. |
| Dec-23 |
| 6.20% |
| Fixed |
| 100% |
| 9,554 | ||
Galyan’s Trading Company |
| Jan-24 |
| 5.07% |
| Fixed |
| 100% |
| 5,691 | ||
World Airways, Inc. |
| Jun-24 |
| 6.76% |
| Fixed |
| 100% |
| 3,802 | ||
Dick’s Sporting Goods |
| Oct-24 |
| 7.46% |
| Fixed |
| 100% |
| 4,030 | ||
Shaklee Corporation |
| Oct-24 |
| 5.54% |
| Fixed |
| 100% |
| 12,306 | ||
Berry Plastics Corporation |
| Nov-24 |
| 5.54% |
| Fixed |
| 100% |
| 14,504 | ||
Plumbmaster, Inc. |
| Nov-24 |
| 5.54% |
| Fixed |
| 100% |
| 4,310 | ||
Universal Technical Institute of Arizona |
| Dec-24 |
| 5.82% |
| Fixed |
| 100% |
| 12,767 | ||
24 Hour Fitness USA, Inc. |
| Jan-25 |
| 7.63% |
| Variable – Future Rate Reset |
| 100% |
| 2,561 | ||
The Talaria Company, LLC |
| Jun-25 |
| 6.26% |
| Variable – Future Rate Reset |
| 30% |
| 7,747 | ||
Google, Inc. |
| Nov-25 |
| 5.15% |
| Fixed |
| 100% |
| 23,714 | ||
Oriental Trading Company, Inc. |
| Sep-26 |
| 6.56% |
| Fixed |
| 100% |
|
| 22,064 | |
Total Non-Recourse Debt |
|
|
|
|
|
|
|
|
|
| $ | 1,621,099 |
|
|
|
|
|
|
|
|
|
|
|
| |
Unsecured - Term Loan |
| Jul-14 |
| 1.78% |
| Variable – Floating |
| 100% |
|
| 300,000 | |
Unsecured - Senior Credit Facility |
| Dec-14 |
| 1.94% |
| Variable – Floating |
| 100% |
|
| 190,000 | |
|
|
|
|
|
|
|
|
|
|
|
| |
Total Pro Rata Debt (b) |
|
|
|
|
|
|
|
|
|
| $ | 2,111,099 |
__________
(a) Based upon applicable exchange rates at September 30, 2013.
(b) Pro rata debt is a non-GAAP measure. See the Terms and Definitions section that begins on page 42 for a description of our non-GAAP financial measures.
|
| Investing for the long runTM | 25 |
Selected Data for the Managed REITs
(in thousands, except share amounts, per share amounts and percentages) (unaudited)
As of September 30, 2013 | |||||||||||||||||||
Selected Data for the Managed REITs | |||||||||||||||||||
| Ownership |
| Shares |
| Most Recent |
| Current |
|
| Distributions |
| Asset Management |
| Structuring |
| Special | |||
CPA®:16 – Global | 18.5% |
| 206,300,331 | $ | 8.70 |
| 6.7% |
| $ | 18,919 |
|
| 0.50% |
|
| 4.5% |
|
| 10.0% |
CPA®:17 – Global | 1.7% |
| 314,648,689 |
| 10.00 |
| 6.5% |
|
| 2,057 |
|
| 0.50% |
|
| 4.5% |
|
| 10.0% |
CPA®:18 – Global | 1.1% |
| 2,113,617 (e) |
| 9.89 |
| 8.4% |
|
| - |
|
| 0.50% |
|
| 4.5% |
|
| 10.0% |
CWI | 0.4% |
| 58,907,811 |
| 10.00 |
| 6.0% |
|
| 9 |
|
| 0.50% |
|
| 2.5% |
|
| 10.0% |
|
|
|
|
|
|
|
|
|
|
|
|
|
|
|
|
|
|
|
|
|
|
|
|
| Inception |
| Square Feet |
|
| Total |
|
| Total |
| Total |
| Total | ||
CPA®:16 – Global |
|
|
|
| 2003 |
| 45,583 |
| $ | 2,493,465 |
| $ | 1,038,597 |
| $ | 3,532,062 |
| $ | 1,690,241 |
CPA®:17 – Global |
|
|
|
| 2007 |
| 32,846 |
|
| 2,575,626 |
|
| 1,699,348 |
|
| 4,274,974 |
|
| 1,795,336 |
CPA®:18 – Global |
|
|
|
| 2012 |
| 240 |
|
| 56,536 |
|
| - |
|
| 56,536 |
|
| 72,800 (f) |
CWI |
|
|
|
| 2010 |
| N/A |
|
| 719,577 |
|
| - |
|
| 719,577 |
|
| 297,372 |
Total |
|
|
|
|
|
| 78,669 |
| $ | 5,845,204 |
| $ | 2,737,945 |
| $ | 8,583,149 |
| $ | 3,855,749 |
__________________
(a) WPC generally calculates the NAV for each of the Managed REITs, relying in part on an estimate of the fair market value of each of the Managed REITs’ real estate portfolio provided by a third party, adjusted to give effect to the estimated fair value of mortgages encumbering the Managed REITs’ assets as well as other adjustments. The NAVs are based on a number of variables, including individual tenant credits, lease terms, lending credit spreads, foreign currency exchange rates and tenant defaults, among others. The NAV of CPA®:16 – Global is as of December 31, 2012. NAVs have not been determined for CPA®:17 – Global, CPA®:18 – Global, and CWI. CPA®:18 – Global’s offering price is calculated by using a weighted-average of the Class A and Class C common shares outstanding at September 30, 2013 at their initial offering price of $10.00 and $9.35 per share, respectively.
(b) The current annualized distribution rate is based on quarterly distribution rate for the third quarter of 2013 (rate is not guaranteed). For CWI, approximately 83% of its third quarter distribution was paid in cash, with the remaining 17% paid in shares of its common stock.
(c) We generally earn asset management revenue of 0.5% per annum of average invested assets. For CPA®:17 – Global, we earn asset management revenue ranging from 0.5% per annum of average market value for long-term net leases and certain other types of real estate investments up to 1.75% per annum of the average equity value for certain types of securities. For CPA®:18 – Global, we earn asset management revenue ranging from 0.5% per annum of average market value of certain investments up to 1.5% per annum of the average equity value of certain investments. For 2013, we have elected to receive all base asset management revenue in shares of each of the Managed REITs common stock (except that, for CPA®:16 – Global, which on July 31, 2013, we elected to start receiving cash in lieu of shares at the request of the Special Committee of its Board of Directors in light of our proposed Merger with CPA®:16 – Global).
(d) We generally receive structuring revenue of up to an average of 4.5% of the total cost of all investments made by each CPA® REIT. For certain types of non-long term net lease investments acquired on behalf of CPA®:17 – Global, structuring revenue may range from 0% to 1.75% of the equity invested plus the related structuring revenue. For CWI, we earn structuring revenue of 2.5% of the total investment cost of the properties acquired.
(e) Represents the combined shares outstanding for the Class A and, Class C shares of CPA®:18–Global common stock.
(f) This amount excludes the $15.0 million loan borrowed from WPC, which was paid in full on October 3, 2013.
|
| Investing for the long runTM | 26 |
Joint Venture Information
(in thousands, except percentages) (unaudited)
As of September 30, 2013 | ||||||||||||||
Joint Venture Information | ||||||||||||||
Joint Venture or JV | WPC % | Remaining |
| Total JV |
| WPC | ||||||||
(Principal Tenant) | in JV | Interest in JV |
| Assets |
| Liabilities |
| Equity |
| Assets |
| Liabilities |
| Equity |
Actuant Corporation | 50.00% | CPA®:16 – Global - 50% | $ | 16,434 | $ | 11,291 | $ | 5,143 | $ | 8,225 | $ | 5,651 | $ | 2,574 |
Advanced Micro Devices, Inc. | 67.00% | CPA®:16 – Global - 33% |
| 84,597 |
| 65,304 |
| 19,293 |
| 56,392 |
| 43,532 |
| 12,860 |
Builders FirstSource, Inc. | 40.00% | CPA®:16 – Global - 60% |
| 9,925 |
| 423 |
| 9,502 |
| 3,970 |
| 169 |
| 3,801 |
C1000 Logistiek Vastgoed B.V. | 15.00% | CPA®:17 – Global - 85% |
| 191,035 |
| 95,732 |
| 95,303 |
| 28,655 |
| 14,360 |
| 14,295 |
Consolidated Systems, Inc. | 60.00% | CPA®:16 – Global - 40% |
| 16,018 |
| 11,084 |
| 4,934 |
| 9,610 |
| 6,650 |
| 2,960 |
Del Monte Corporation | 50.00% | CPA®:16 – Global - 50% |
| 12,409 |
| 10,778 |
| 1,631 |
| 6,204 |
| 5,389 |
| 815 |
Eroski Sociedad Cooperativa | 70.00% | CPA®:17 – Global - 30% |
| 31,954 |
| 194 |
| 31,760 |
| 22,368 |
| 136 |
| 22,232 |
Hellweg Die Profi-Baumärkte GmbH & Co. KG (Hellweg 1) | 75.00% | CPA®:16 – Global - 25% |
| 183,364 |
| 94,029 |
| 89,335 |
| 137,522 |
| 70,521 |
| 67,001 |
Hellweg Die Profi-Baumärkte GmbH & Co. KG (Hellweg 2) | 40.00% | CPA®:16 – Global - 27%; CPA®:17 – Global -33% |
| 407,042 |
| 352,644 |
| 54,398 |
| 163,766 |
| 140,082 |
| 23,684 |
PetSmart, Inc. | 30.00% | CPA®:16 – Global - 70% |
| 21,315 |
| 19,539 |
| 1,776 |
| 6,395 |
| 5,862 |
| 533 |
Barth Europa Transporte e.K/MSR Technologies GmbH | 67.00% | CPA®:16 – Global - 33% |
| 12,849 |
| 1,097 |
| 11,752 |
| 8,566 |
| 731 |
| 7,835 |
Arelis Broadcast, Veolia Transport, and Marchal Levage | 65.00% | CPA®:16 – Global - 35% |
| 23,989 |
| 23,634 |
| 355 |
| 15,593 |
| 15,362 |
| 231 |
Multi-tenant property in Illkirch-Graffens, France
| 75.00% | Third party - 25% |
| 21,082 |
| 13,408 |
| 7,674 |
| 15,812 |
| 10,056 |
| 5,756 |
Multi-tenant property in Tours, France | 95.00% | Third party - 5% |
| 12,035 |
| 8,321 |
| 3,714 |
| 11,433 |
| 7,905 |
| 3,528 |
The New York Times Company | 18.00% | CPA®:16 – Global - 27%; CPA®:17 – Global -55% |
| 249,378 |
| 120,597 |
| 128,781 |
| 44,265 |
| 21,406 |
| 22,859 |
OBI A.G. | 75.00% | CPA®:16 – Global - 25% |
| 158,699 |
| 150,444 |
| 8,255 |
| 119,025 |
| 112,833 |
| 6,192 |
Pohjola Non-Life Insurance Company
| 60.00% | CPA®:16 – Global - 40% |
| 89,880 |
| 77,222 |
| 12,658 |
| 53,928 |
| 46,333 |
| 7,595 |
Police Prefecture, French Government | 50.00% | CPA®:16 – Global - 50% |
| 90,967 |
| 82,873 |
| 8,094 |
| 45,484 |
| 41,437 |
| 4,047 |
SaarOTEC | 50.00% | CPA®:16 – Global - 50% |
| 6,131 |
| 9,481 |
| (3,350) |
| 3,065 |
| 4,740 |
| (1,675) |
Schuler A.G. | 67.00% | CPA®:16 – Global - 33% |
| 67,841 |
| 3,415 |
| 64,426 |
| 45,228 |
| 2,277 |
| 42,951 |
Carey Storage | 37.00% | Third parties - 63% |
| 75,724 |
| 47,154 |
| 28,570 |
| 27,715 |
| 17,258 |
| 10,457 |
TietoEnator Plc | 60.00% | CPA®:16 – Global - 40% |
| 82,991 |
| 63,248 |
| 19,743 |
| 49,795 |
| 37,949 |
| 11,846 |
The Talaria Company | 30.00% | CPA®:16 – Global - 70% |
| 41,315 |
| 26,367 |
| 14,948 |
| 12,394 |
| 7,910 |
| 4,484 |
Town Sports International Holdings, Inc.
| 44.00% | CPA®:16 – Global - 56% |
| 7,071 |
| 7,385 |
| (314) |
| 3,111 |
| 3,249 |
| (138) |
True Value Company | 50.00% | CPA®:16 – Global - 50% |
| 114,951 |
| 63,728 |
| 51,223 |
| 57,476 |
| 31,864 |
| 25,612 |
U-Haul Moving Partners, Inc. and Mercury Partners, L.P.
| 57.00% | CPA®:16 – Global - 31%; CPA®:17 – Global - 12%
|
| 268,558 |
| 170,044 |
| 98,514 |
| 154,932 |
| 98,099 |
| 56,833 |
The Upper Deck Company | 50.00% | CPA®:16 – Global - 50% |
| 21,763 |
| 82 |
| 21,681 |
| 10,881 |
| 41 |
| 10,840 |
Waldaschaff Automotive GmbH and Wagon Automotive Nagold GmbH | 33.00% | CPA®:17 – Global - 67% |
| 43,967 |
| 20,592 |
| 23,375 |
| 14,654 |
| 6,863 |
| 7,791 |
Wanbishi Archives Co. Ltd | 3.00% | CPA®:17 – Global - 97% |
| 42,957 |
| 29,095 |
| 13,862 |
| 1,289 |
| 873 |
| 416 |
|
|
| $ | 2,406,241 | $ | 1,579,205 | $ | 827,036 | $ | 1,137,753 | $ | 759,538 | $ | 378,215 |
______________
(a) Pro rata amounts are non-GAAP measures. See the Terms and Definitions section that begins on page 42 for a description of our non-GAAP financial measures.
|
| Investing for the long runTM | 27 |
Portfolio Information – Diversification of Top Ten Tenants by Rent and Historical Occupancy (Pro Rata-Basis)
(in thousands, except percentages) (unaudited)
As of September 30, 2013 |
Tenant / Lease Guarantor |
| Annualized Contractual |
| Percent | |
Hellweg Die Profi-Baumärkte GmbH & Co. KG (a) |
| $ | 27,417 |
| 8.3% |
U-Haul Moving Partners Inc. and Mercury Partners, LP |
| 18,741 |
| 5.7% | |
Carrefour France SAS (a) |
| 17,274 |
| 5.2% | |
Marcourt Investments Inc. |
| 16,100 |
| 4.9% | |
OBI Group (a) |
| 13,959 |
| 4.2% | |
UTI Holdings, Inc. |
| 9,044 |
| 2.7% | |
Federal Express Corporation |
| 7,593 |
| 2.3% | |
True Value Company |
| 7,243 |
| 2.2% | |
Foster Wheeler AG |
| 6,510 |
| 2.0% | |
Pohjola Non-Life Insurance Company LTD (a) |
| 5,742 |
| 1.7% | |
Total (b) |
| $ | 129,623 |
| 39.2% |
|
|
|
|
| |
Weighted-Average Lease Term for Portfolio |
| 8.7 | years | ||
Historical Occupancy (c)
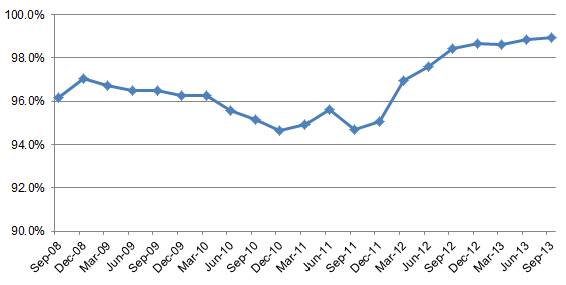
__________
(a) | Rent amounts are subject to fluctuations in foreign currency exchange rates. |
|
|
(b) | Pro rata amounts are non-GAAP measures. See the Terms and Definitions section that begins on page 42 for a description of our non-GAAP measures. |
|
|
(c) | Pre- CPA®:15 Merger periods include pro forma combined occupancy rates for WPC and CPA®:15. |
|
| Investing for the long runTM | 28 |
Portfolio Information – Diversification by Property Type (Pro Rata-Basis)
(in thousands, except percentages) (unaudited)
As of September 30, 2013 |
Property Type |
| Square Footage |
| Percent |
Industrial |
| 13,152 |
| 33.4% |
Warehouse/Distribution |
| 9,684 |
| 24.6% |
Office |
| 6,000 |
| 15.2% |
Retail |
| 4,856 |
| 12.3% |
Self Storage |
| 3,354 |
| 8.4% |
Other Properties (a) |
| 2,390 |
| 6.1% |
Total (b) (c) |
| 39,436 |
| 100.0% |
Property Type |
| Annualized Contractual |
| Percent | |
Office |
| $ | 101,820 |
| 30.7% |
Industrial |
| 70,409 |
| 21.2% | |
Retail |
| 52,112 |
| 15.7% | |
Warehouse/Distribution |
| 50,729 |
| 15.3% | |
Other Properties (a) |
| 37,858 |
| 11.4% | |
Self Storage |
| 18,741 |
| 5.7% | |
Total (b) (c) |
| $ | 331,669 |
| 100.0% |
Portfolio Diversification by Property Type (b) (c) (based on square footage) | Portfolio Diversification by Property Type (b) (c) (based on annualized contractual minimum base rent) |
|
|
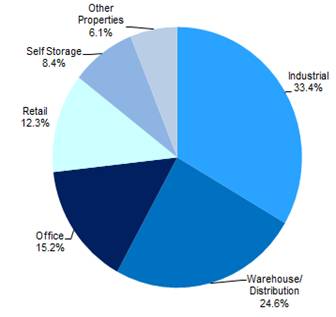
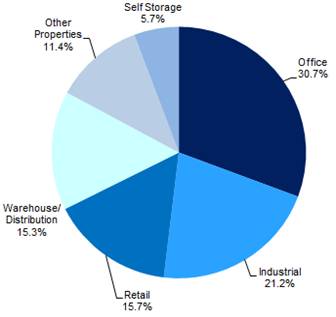
__________
(a) | Other properties include hospitality, education, health & fitness, theaters, and unoccupied land. |
|
|
(b) | Excludes all operating properties. |
|
|
(c) | Pro rata amounts are non-GAAP measures. See the Terms and Definitions section that begins on page 42 for a description of our non-GAAP measures. |
|
| Investing for the long runTM | 29 |
Portfolio Information – Diversification by Tenant Industry (Pro Rata-Basis)
(in thousands, except percentages) (unaudited)
As of September 30, 2013 |
Industry Type (a) |
| Square Footage |
| Percent |
| Annualized Contractual |
| Percent | |
Retail Trade |
| 8,459 |
| 21.4% |
| $ | 72,001 |
| 21.7% |
Electronics |
| 2,266 |
| 5.7% |
| 27,832 |
| 8.4% | |
Business and Commercial Services |
| 1,167 |
| 3.0% |
| 25,831 |
| 7.8% | |
Healthcare, Education and Childcare |
| 1,588 |
| 4.0% |
| 19,460 |
| 5.9% | |
Hotels and Gaming |
| 1,036 |
| 2.6% |
| 16,100 |
| 4.9% | |
Chemicals, Plastics, Rubber, and Glass |
| 3,110 |
| 7.9% |
| 14,416 |
| 4.3% | |
Beverages, Food, and Tobacco |
| 2,357 |
| 6.0% |
| 14,357 |
| 4.3% | |
Media: Printing and Publishing |
| 1,911 |
| 4.9% |
| 12,941 |
| 3.9% | |
Telecommunications |
| 922 |
| 2.4% |
| 12,487 |
| 3.8% | |
Buildings and Real Estate |
| 2,180 |
| 5.5% |
| 12,182 |
| 3.7% | |
Federal, State and Local Government |
| 480 |
| 1.2% |
| 11,027 |
| 3.3% | |
Leisure, Amusement, Entertainment |
| 564 |
| 1.5% |
| 10,823 |
| 3.3% | |
Machinery |
| 1,196 |
| 3.0% |
| 10,237 |
| 3.1% | |
Transportation - Cargo |
| 612 |
| 1.6% |
| 9,571 |
| 2.9% | |
Automobile |
| 2,091 |
| 5.3% |
| 9,090 |
| 2.7% | |
Construction and Building |
| 2,200 |
| 5.6% |
| 9,006 |
| 2.7% | |
Insurance |
| 643 |
| 1.6% |
| 7,625 |
| 2.3% | |
Transportation - Personal |
| 1,199 |
| 3.0% |
| 6,767 |
| 2.0% | |
Consumer and Durable Goods |
| 877 |
| 2.2% |
| 5,141 |
| 1.6% | |
Aerospace and Defense |
| 760 |
| 1.9% |
| 5,076 |
| 1.5% | |
Other (b) |
| 3,405 |
| 8.7% |
| 19,699 |
| 5.9% | |
Vacant |
| 413 |
| 1.0% |
| - |
| 0.0% | |
Total (c) (d) |
| 39,436 |
| 100.0% |
| $ | 331,669 |
| 100.0% |
__________
Portfolio Revenues – Contractual Increases (d) (e)
(based on annualized contractual minimum base rent)
(a) Based on the Moody’s Classification System and information provided by the tenant.
(b) Includes rent from tenants in the following industries: grocery; textiles, leather, and apparel; banking; forest products and paper; mining, metals, and primary metal industries; consumer non-durable goods; and multi-tenant properties.
(c) Excludes all operating properties.
(d) Pro rata amounts are non-GAAP measures. See the Terms and Definitions section that begins on page 42 for a description of our non-GAAP measures.
(e) Pro rata rents and applicable exchange rates as of September 30, 2013.
|
| Investing for the long runTM | 30 |
Portfolio Information – Diversification by Geography (Pro Rata-Basis)
(in thousands, except percentages) (unaudited)
As of September 30, 2013 | ||||||||||||
|
|
|
|
|
|
|
|
|
|
|
| |
Property |
| Square |
| Percent |
|
| Property |
| Annualized Contractual |
| Percent | |
|
|
|
|
|
|
|
|
|
|
|
| |
U.S. |
|
|
|
|
|
| U.S. |
|
|
|
| |
South |
| 10,225 |
| 25.9% |
|
| South |
| $ | 69,656 |
| 21.0% |
West |
| 6,713 |
| 17.0% |
|
| West |
| 67,358 |
| 20.3% | |
Midwest |
| 6,166 |
| 15.6% |
|
| East |
| 49,792 |
| 15.0% | |
East |
| 5,672 |
| 14.4% |
|
| Midwest |
| 40,158 |
| 12.1% | |
U.S. Total |
| 28,776 |
| 72.9% |
|
| U.S. Total |
| 226,964 |
| 68.4% | |
|
|
|
|
|
|
|
|
|
|
|
| |
International |
|
|
|
|
|
| International |
|
|
|
| |
Germany |
| 3,453 |
| 8.8% |
|
| Germany |
| 35,749 |
| 10.8% | |
France |
| 3,421 |
| 8.7% |
|
| France |
| 24,705 |
| 7.4% | |
Poland |
| 1,399 |
| 3.5% |
|
| Finland |
| 15,156 |
| 4.6% | |
Finland |
| 974 |
| 2.5% |
|
| Poland |
| 13,959 |
| 4.2% | |
Other (a) |
| 1,413 |
| 3.6% |
|
| Other (a) |
| 15,136 |
| 4.6% | |
International Total |
| 10,660 |
| 27.1% |
|
| International Total |
| 104,705 |
| 31.6% | |
Total (b) (c) |
| 39,436 |
| 100.0% |
|
| Total (b) (c) |
| $ | 331,669 |
| 100.0% |
|
|
|
|
|
|
|
|
|
|
|
| |
|
|
|
|
|
|
|
|
|
|
|
| |
Portfolio Diversification by Geography (b) (c) (based on square footage) |
|
| Portfolio Diversification by Geography (b) (c) (based on annualized contractual minimum base rent) | |||||||||
|
|
|
| |||||||||
|
|
|
| |||||||||
_________
(a) Includes assets in the United Kingdom, the Netherlands, Spain, Belgium and Japan.
(b) Excludes all operating properties.
(c) Pro rata amounts are non-GAAP measures. See the Terms and Definitions section that begins on page 42 for a description of our non-GAAP measures.
|
| Investing for the long runTM | 31 |
Portfolio Information – Lease Maturities (Pro Rata-Basis)
(in thousands, except percentages and number of leases) (unaudited)
As of September 30, 2013 |
Year of Lease Expiration (a) |
| Number of Leases |
| Square Feet |
| As % of |
| Annualized Contractual |
| As % of | |
Remaining 2013 (b) |
| 1 |
| 15 |
| 0.0% |
| $ | 27 |
| 0.0% |
2014 |
| 12 |
| 1,093 |
| 2.8% |
| 10,204 |
| 3.1% | |
2015 |
| 20 |
| 3,876 |
| 9.8% |
| 30,842 |
| 9.3% | |
2016 |
| 16 |
| 1,732 |
| 4.4% |
| 16,415 |
| 5.0% | |
2017 |
| 11 |
| 2,021 |
| 5.1% |
| 11,379 |
| 3.4% | |
2018 |
| 19 |
| 2,511 |
| 6.4% |
| 23,216 |
| 7.0% | |
2019 |
| 12 |
| 1,927 |
| 4.9% |
| 27,478 |
| 8.3% | |
2020 |
| 8 |
| 2,135 |
| 5.4% |
| 12,024 |
| 3.6% | |
2021 |
| 9 |
| 1,720 |
| 4.4% |
| 11,973 |
| 3.6% | |
2022 |
| 15 |
| 3,500 |
| 8.9% |
| 25,667 |
| 7.7% | |
2023 |
| 11 |
| 4,906 |
| 12.4% |
| 41,038 |
| 12.4% | |
2024 |
| 28 |
| 6,248 |
| 15.9% |
| 47,114 |
| 14.2% | |
2025 |
| 6 |
| 462 |
| 1.2% |
| 6,069 |
| 1.8% | |
2026 |
| 7 |
| 646 |
| 1.6% |
| 3,447 |
| 1.0% | |
Thereafter |
| 20 |
| 6,231 |
| 15.8% |
| 64,776 |
| 19.6% | |
Vacant |
| - |
| 413 |
| 1.0% |
| - |
| 0.0% | |
Total (c) (d) |
| 195 |
| 39,436 |
| 100.0% |
| $ | 331,669 |
| 100.0% |
Lease Revenue as a Percentage of Expiring Leases
__________
(a) Assumes tenant does not exercise renewal option.
(b) Month-to-month properties are counted in 2013 revenue stream.
(c) Excludes all operating properties.
(d) Pro rata amounts are non-GAAP measures. See the Terms and Definitions section that begins on page 42 for a description of our non-GAAP measures.
|
| Investing for the long runTM | 32 |
Investment Activity – Owned Portfolio – Acquisitions and Dispositions
(in thousands, except square footage) (unaudited)
For the Nine Months Ended September 30, 2013 |
Acquisitions - Owned Portfolio
Portfolio(s) |
| Tenant/Lease Guarantor |
| Property Location(s) |
| Purchase Price (a) |
| Closing Date |
| Property Type(s) |
| Gross Square | |
WPC |
| Kraft Foods Group, Inc. |
| Northfield, IL |
| $ | 72,360 |
| Jan-13 |
| Office |
| 679,109 |
WPC |
| Tommy Hilfiger Europe B.V. (b) |
| Venlo, Netherlands |
| 35,316 |
| Apr-13 |
| Warehouse/Distribution |
| 473,611 | |
WPC |
| Cargotec Corporation (b) |
| Tampere, Finland |
| 52,084 |
| Jun-13 |
| Industrial, Office |
| 183,568 | |
WPC |
| Arbella Capital Corporation |
| Quincy, MA |
| 25,500 |
| Jun-13 |
| Office |
| 132,160 | |
WPC |
| UK Government (b) |
| Manchester, United Kingdom |
| 63,251 |
| Sep-13 |
| Office |
| 211,367 | |
Total Owned Portfolio Acquisitions |
|
|
|
|
| $ | 248,511 |
|
|
|
|
| 1,679,815 |
Dispositions - Owned Portfolio
Portfolio(s) |
| Tenant/Lease Guarantor |
| Property Location(s) |
| Gross Sale Price |
| Date |
| Property Type(s) |
| Gross Square | |
WPC |
| Childtime Childcare, Inc. (c) |
| Naperville, IL |
| $ | 1,445 |
| Jan-13 |
| Education |
| 7,893 |
WPC |
| Garden Ridge, L.P. (c) |
| Oklahoma City, OK |
| 9,790 |
| Mar-13 |
| Retail |
| 141,585 | |
WPC |
| US Airways Group, Inc. |
| Tempe, AZ |
| 28,420 |
| Jun-13 |
| Office |
| 167,890 | |
WPC |
| Custom Food Products, LLC (c) |
| Owingsville, KY |
| 5,500 |
| Jun-13 |
| Industrial |
| 37,094 | |
WPC |
| Anthony, Inc. and Anthony Holdings, Inc. |
| San Fernando, CA |
| 3,122 |
| Jun-13 |
| Industrial |
| 40,306 | |
WPC |
| Broomfield Properties Corp. |
| Broomfield, CO |
| 1,300 |
| Jun-13 |
| Office |
| 41,281 | |
WPC |
| A. Duie Pyle |
| Westfield, MA |
| 3,350 |
| Jul-13 |
| Warehouse/Distribution |
| 169,102 | |
WPC |
| UTI Holdings, Inc. |
| Glendale Heights, IL |
| 3,975 |
| Jul-13 |
| Education |
| 101,194 | |
WPC |
| Federal Express Corporation |
| College Station, TX |
| 700 |
| Jul-13 |
| Warehouse/Distribution |
| 12,080 | |
Total Owned Portfolio Dispositions |
|
|
|
|
| $ | 57,602 |
|
|
|
|
| 718,425 |
__________
(a) Includes capitalized transaction costs, where applicable.
(b) Amounts are based on the applicable exchange rate on the date of acquisition.
(c) Properties were acquired in the CPA®:15 Merger.
|
| Investing for the long runTM | 33 |
Investment Activity – Managed REITs – Acquisitions
(in thousands, except square footage) (unaudited)
For the Nine Months Ended September 30, 2013 |
Acquisitions - Leased Properties
Portfolio(s) |
| Tenant/Lease Guarantor |
| Property Location(s) |
| Purchase |
| Closing Date |
| Property Type(s) |
| Gross Square | ||
CPA®:17 – Global |
| Penda Corporation |
| Portage, WI |
| $ | 10,871 |
| Jan-13 |
|
| Industrial |
| 270,500 |
CPA®:17 – Global |
| Live Nation Entertainment, Inc. |
| Dallas, TX |
| 15,700 |
| Feb-13 |
|
| Retail |
| 61,876 | |
CPA®:17 – Global |
| Harbor Freight Tools USA, Inc. (b) |
| Dillon, SC |
| 39,004 |
| Mar-13 |
|
| Warehouse/Distribution |
| BTS | |
CPA®:17 – Global |
| GEMS Chicago, Inc. |
| Chicago, IL |
| 18,188 |
| Apr-13 |
|
| Land |
| 324,176 | |
CPA®:17 – Global |
| Multi-Tenant |
| Northbrook, IL |
| 7,934 |
| May-13 |
|
| Retail |
| 6,006 | |
CPA®:16 – Global |
| Advanced Circuits, Inc. |
| Aurora, CO |
| 4,869 |
| May-13 |
|
| Industrial |
| 50,664 | |
CPA®:17 – Global |
| FrieslandCampina Nederland B.V. (c) |
| Wageningen, Netherlands |
| 38,569 |
| Jul-13 |
|
| Industrial |
| 185,957 | |
CPA®:17 – Global |
| H&M Hennes & Mauritz AB (c) |
| Poznan, Poland |
| 78,063 |
| Jul-13 |
|
| Warehouse/Distribution |
| 897,951 | |
CPA®:17 – Global (50%); CPA®:18 – Global (50%) |
| State Farm Mutual Automobile Company |
| Austin, TX |
| 115,604 |
| Aug-13 |
|
| Office |
| 239,706 | |
CPA®:17 – Global |
| RLJ-McLarty-Landers Automotive Holdings, LLC |
| Lewisville, TX |
| 15,310 |
| Aug-13 |
|
| Retail |
| 74,640 | |
Total Acquisitions - Leased Properties |
|
|
|
|
| 344,112 |
|
|
|
|
| 2,111,476 | ||
|
|
|
|
|
|
|
|
|
|
|
|
| ||
Acquisitions - Self-Storage |
|
|
|
|
|
|
|
|
|
|
|
| ||
Portfolio(s) |
| Property Type |
| Property Location(s) |
| Purchase |
| Closing Date |
|
|
|
| ||
CPA®:17 – Global |
| Self-Storage Facility |
| Cathedral City, CA |
| 2,755 |
| Mar-13 |
|
|
|
|
| |
CPA®:17 – Global |
| Self-Storage Facility |
| Hilo, HI |
| 6,100 |
| Jun-13 |
|
|
|
|
| |
CPA®:17 – Global |
| Self-Storage Facility (Equity investment) |
| New York, NY |
| 81,237 |
| Jun-13 |
|
|
|
|
| |
CPA®:17 – Global |
| Self-Storage Facilities (2 Facilities) |
| Tampa, FL |
| 4,430 |
| Jul-13 |
|
|
|
|
| |
CPA®:17 – Global |
| Self-Storage Facility |
| Winder, GA |
| 2,700 |
| Jul-13 |
|
|
|
|
| |
CPA®:17 – Global |
| Self-Storage Facility |
| Orlando, FL |
| 6,700 |
| Aug-13 |
|
|
|
|
| |
CPA®:17 – Global |
| Self-Storage Facility |
| Palm Coast, FL |
| 5,700 |
| Sep-13 |
|
|
|
|
| |
Total Acquisitions - Self-Storage Properties |
|
|
|
|
| 109,622 |
|
|
|
|
|
|
| |
| Investing for the long runTM | 34 |
Investment Activity – Managed REITs – Acquisitions (Unaudited)
(Continued)
(in thousands, except square footage)
For the Nine Months Ended September 30, 2013 |
Acquisitions - Hospitality
Portfolio(s) |
| Property Type |
| Property Location(s) |
| Purchase |
| Closing Date |
| |
CWI |
| Hospitality |
| Memphis, TN; Atlanta, GA; |
| 94,600 |
| Feb-13 |
| |
CWI |
| Hospitality |
| Pittsburgh, PA |
| 29,900 |
| Mar-13 |
| |
CWI |
| Hospitality |
| Nashville, TN |
| 73,600 |
| May-13 |
| |
CWI |
| Hospitality |
| New York, NY |
| 113,000 |
| Jun-13 |
| |
CWI |
| Hospitality |
| Sonoma, CA |
| 78,948 | (d) | Jul-13 |
| |
CWI |
| Hospitality |
| Raleigh, NC |
| 82,872 |
| Aug-13 |
| |
|
|
|
|
|
|
|
|
|
| |
Total Acquisitions - Hospitality Properties |
|
|
| 472,920 |
|
|
| |||
|
|
|
|
|
|
|
|
|
| |
Total Acquisitions |
|
|
|
|
| $ | 926,654 |
|
|
|
| Investing for the long runTM | 35 |
Investment Activity – Managed REITs – Acquisitions - Notes
(Continued)
__________
(a) | Includes capitalized transaction costs, where applicable. For equity investments, the purchase price represents the Managed REIT’s pro rata share of the jointly-owned investment estimated total asset value, excluding debt, plus capitalized transactions costs. |
|
|
(b) | Acquisition includes a build-to-suit (“BTS”) transaction. Purchase price represents total commitment for BTS funding. Gross square footage amounts cannot be determined at this time. |
|
|
(c) | Acquisition price reflects applicable foreign exchange rate. |
|
|
(d) | Represents the joint venture’s, purchase price to acquire the hotel less the noncontrolling interest contributed by the joint venture partner. |
| Investing for the long runTM | 36 |
Investment Activity – Managed REITs – Dispositions
(in thousands, except square footage) (unaudited)
For the Nine Months Ended September 30, 2013 |
Portfolio(s) |
| Tenant/Lease Guarantor |
| Property Location(s) |
| Gross Sale |
| Date |
| Property Type |
| Gross Square | |
CPA®:16 – Global |
| Vacant (formerly Barjan LLC) |
| Rock Island, IL |
| $ | 7,410 |
| Feb-13 |
| Warehouse/Distribution |
| 241,950 |
CPA®:16 – Global |
| Childtime Childcare, Inc. |
| Chandler, AZ; Hauppauge and Patchogue, NY; Silverdale, WAS; and Sugar Land, TX |
| 7,761 |
| Mar-13; Jul-13; Aug-13; Sep-13 |
| Education |
| 40,695 | |
CPA®:16 – Global |
| Vacant (formerly Metagenics, Inc.) |
| San Clemente, CA |
| 11,263 |
| Mar-13 |
| Industrial |
| 88,070 | |
CPA®:16 – Global |
| Garden Ridge, L.P. |
| Tulsa, OK |
| 9,810 |
| Mar-13 |
| Retail |
| 141,659 | |
CPA®:16 – Global |
| RR Donnelley & Sons Company |
| Waterloo, WI |
| - |
| Apr-13 |
| Industrial, Office, Warehouse/Distribution |
| 466,192 | |
CPA®:16 – Global |
| Waddington North America, Inc. |
| Florence, KY |
| 1,775 |
| Jun-13 |
| Industrial |
| 166,849 | |
CPA®:16 – Global |
| BA Kitchen Components Limited (a) |
| Doncaster, United Kingdom |
| 1,527 |
| Jun-13 |
| Industrial |
| 225,998 | |
CWI |
| Hotel Maya, a Doubletree Hotel and Residence Inn Long Beach (49% Equity investment) |
| Long Beach, CA |
| 22,640 |
| Jul-13 |
| Hospitality |
| N/A | |
CPA®:16 – Global |
| Fraikin SAS (a) |
| Créteil, Marseille, Vaulx en Velin, and Wasquehal, France |
| 4,589 |
| Jul-13 |
| Industrial |
| 43,550 | |
CPA®:16 – Global |
| Tower Automotive Products Co., Inc. |
| Upper Sandusky, OH |
| 875 |
| Aug-13 |
| Industrial |
| 80,212 | |
CPA®:16 – Global |
| Southwest Convenience Stores |
| Socorro, TX |
| 447 |
| Aug-13 |
| Retail |
| 4,114 | |
CPA®:16 – Global |
| Gerber Scientific, Inc. |
| South Windsor, CT |
| 4,200 |
| Sep-13 |
| Industrial |
| 60,000 | |
Total Dispositions |
|
|
|
|
| $ | 72,297 |
|
|
|
|
| 1,559,289 |
____________
(a) Disposition price reflects applicable foreign exchange rate.
|
| Investing for the long runTM | 37 |
Tenants by Annualized Contractual Minimum Base Rent (Pro Rata-Basis)
(in thousands, except number of locations and percentages) (unaudited)
As of September 30, 2013 |
Tenant |
|
| Location(s) |
|
| Number |
|
| Square |
|
| Annualized |
|
| Annualized |
|
| Increase |
|
| Property Type |
|
| Industry |
| |
Hellweg Die Profi-Baumärkte GmbH Und Co. KG |
|
| Germany |
|
| 53 |
|
| 2,308 |
|
| $ | 27,417 |
|
| 8.3% |
|
| CPI |
|
| Retail |
|
| Retail Stores |
|
Mercury Partners, LP/U-Haul Moving Partners Inc. |
|
| AL; AZ; CO; FL; GA; IL; IN; KS; LA; MA; MD; MN; MO; MS; NC; NJ; NM; NV; NY; OH; OK; TN; TX; VA
|
|
| 78 |
|
| 3,354 |
|
| 18,741 |
|
| 5.7% |
|
| CPI |
|
| Self-Storage |
|
| Buildings and Real Estate; Transportation-Personal |
| |
Carrefour France SAS |
|
| France
|
|
| 8 |
|
| 2,940 |
|
| 17,274 |
|
| 5.2% |
|
| CPI; FIXED |
|
| Warehouse/Distribution |
|
| Retail Stores |
| |
Marriott Corporation |
|
| CA; FL; IL; IN; KY; MD; NJ; NM; WA
|
|
| 12 |
|
| 1,036 |
|
| 16,100 |
|
| 4.9% |
|
| OTHER |
|
| Other Properties |
|
| Hotels and Gaming |
| |
OBI Group |
|
| Poland
|
|
| 18 |
|
| 1,398 |
|
| 13,959 |
|
| 4.2% |
|
| CPI |
|
| Office; Retail |
|
| Retail Stores |
| |
UTI Holdings, Inc. |
|
| Rancho Cucamonga, CA; Exton, PA; Avondale, AZ; Glendale Heights, IL
|
|
| 4 |
|
| 706 |
|
| 9,044 |
|
| 2.7% |
|
| CPI; FIXED |
|
| Other Properties |
|
| Healthcare, Education and Childcare |
| |
Federal Express Corporation |
|
| Collierville, TN; Corpus Christi, TX
|
|
| 2 |
|
| 421 |
|
| 7,593 |
|
| 2.3% |
|
| CPI; FIXED |
|
| Office; Warehouse/Distribution |
|
| Transportation - Cargo |
| |
True Value Company |
|
| Corsicana, TX; Fogelsville, PA; Jonesboro, GA; Kansas City, MO; Kingman, AZ; Springfield, OR; Woodland, CA
|
|
| 7 |
|
| 1,814 |
|
| 7,243 |
|
| 2.2% |
|
| FIXED |
|
| Warehouse/Distribution |
|
| Construction and Building |
| |
Foster Wheeler Realty Services |
|
| Clinton, NJ
|
|
| 1 |
|
| 292 |
|
| 6,510 |
|
| 2.0% |
|
| CPI |
|
| Office |
|
| Business and Commercial Services
|
| |
Pohjola Non-Life Insurance Company LTD |
|
| Finland
|
|
| 1 |
|
| 511 |
|
| 5,742 |
|
| 1.7% |
|
| CPI |
|
| Office |
|
| Insurance |
| |
Fiserv, Inc. |
|
| Norcross, GA
|
|
| 1 |
|
| 221 |
|
| 5,472 |
|
| 1.6% |
|
| CPI; FIXED |
|
| Land; Office |
|
| Business and Commercial Services
|
| |
Tieto OYJ |
|
| Finland |
|
| 2 |
|
| 280 |
|
| 5,432 |
|
| 1.6% |
|
| CPI |
|
| Office |
|
| Electronics |
| |
Kraft Foods Group, Inc. |
|
| Northfield, IL
|
|
| 1 |
|
| 679 |
|
| 5,000 |
|
| 1.5% |
|
| NONE |
|
| Office |
|
| Beverages, Food, and Tobacco
|
| |
Schuler AG |
|
| Germany
|
|
| 1 |
|
| 498 |
|
| 4,837 |
|
| 1.5% |
|
| CPI |
|
| Industrial |
|
| Machinery |
| |
Life Time Fitness, Inc. |
|
| Canton, MI; Rochester Hills, MI |
|
| 2 |
|
| 279 |
|
| 4,672 |
|
| 1.4% |
|
| FIXED |
|
| Other Properties |
|
| Leisure, Amusement, Entertainment
|
| |
Prefecture de Police |
|
| France |
|
| 1 |
|
| 121 |
|
| 4,649 |
|
| 1.4% |
|
| CPI |
|
| Office |
|
| Federal, State and Local Government
|
| |
|
| Investing for the long runTM | 38 |
Tenants by Annualized Contractual Minimum Base Rent (Pro Rata Basis)
(Continued)
(in thousands, except number of locations and percentages) (unaudited)
As of September 30, 2013 |
Tenant |
|
| Location(s) |
|
| Number |
|
| Square |
|
| Annualized |
|
| Annualized |
|
| Increase |
|
| Property Type |
|
| Industry |
|
|
|
|
|
|
|
|
|
|
|
|
|
|
|
|
|
|
|
|
|
|
|
|
|
|
|
The New York Times Company |
|
| New York, NY |
|
| 1 |
|
| 126 |
|
| 4,557 |
|
| 1.4% |
|
| FIXED |
|
| Office |
|
| Media: Printing and Publishing
|
|
Dr. Pepper Snapple Group, Inc. |
|
| Houston, TX; Irving, TX |
|
| 2 |
|
| 722 |
|
| 4,464 |
|
| 1.4% |
|
| CPI |
|
| Industrial |
|
| Beverages, Food, and Tobacco
|
|
UK Government |
|
| United Kingdom |
|
| 1 |
|
| 211 |
|
| 4,407 |
|
| 1.3% |
|
| OTHER |
|
| Office |
|
| Federal, State and Local Government
|
|
Omnicom Group, Inc. |
|
| Playa Vista, CA |
|
| 1 |
|
| 120 |
|
| 4,346 |
|
| 1.3% |
|
| CPI |
|
| Office |
|
| Business and Commercial Services
|
|
Oriental Trading Company, Inc. |
|
| La Vista, NE |
|
| 1 |
|
| 736 |
|
| 4,305 |
|
| 1.3% |
|
| CPI |
|
| Warehouse/Distribution |
|
| Consumer and Durable Goods
|
|
HP Enterprise Services, LLC |
|
| Louisville, CO |
|
| 1 |
|
| 404 |
|
| 4,185 |
|
| 1.3% |
|
| CPI |
|
| Industrial |
|
| Telecommunications
|
|
Hologic, Inc. |
|
| Bedford, MA; Danbury, CT |
|
| 2 |
|
| 269 |
|
| 4,068 |
|
| 1.2% |
|
| CPI |
|
| Industrial |
|
| Electronics
|
|
24 Hour Fitness USA, Inc. |
|
| Austin, TX; Bedford, TX; Englewood, CO; Memphis, TN |
|
| 4 |
|
| 181 |
|
| 4,008 |
|
| 1.2% |
|
| CPI; FIXED |
|
| Other Properties |
|
| Leisure, Amusement, Entertainment
|
|
JPMorgan Chase Bank, National Assoc. |
|
| Fort Worth, TX |
|
| 1 |
|
| 384 |
|
| 4,000 |
|
| 1.2% |
|
| CPI |
|
| Office |
|
| Banking
|
|
Berry Plastics Corporation |
|
| Alsip, IL; Solvay, NY; Tolleson, AZ |
|
| 4 |
|
| 941 |
|
| 3,992 |
|
| 1.2% |
|
| CPI |
|
| Industrial |
|
| Chemicals, Plastics, Rubber, and Glass
|
|
Cargotec Finland OY |
|
| Finland |
|
| 1 |
|
| 184 |
|
| 3,983 |
|
| 1.2% |
|
| CPI |
|
| Industrial; Office |
|
| Machinery
|
|
Advanced Micro Devices |
|
| Sunnyvale, CA |
|
| 1 |
|
| 121 |
|
| 3,981 |
|
| 1.2% |
|
| CPI |
|
| Office |
|
| Electronics
|
|
Amylin Pharmaceuticals, Inc. |
|
| San Diego, CA |
|
| 2 |
|
| 144 |
|
| 3,950 |
|
| 1.2% |
|
| FIXED |
|
| Office |
|
| Business and Commercial Services
|
|
Konica Minolta Business Solutions U.S.A., Inc. |
|
| St. Petersburg, FL |
|
| 2 |
|
| 338 |
|
| 3,815 |
|
| 1.2% |
|
| CPI |
|
| Office |
|
| Electronics |
|
Dick’ Sporting Goods, Inc. |
|
| Greenwood, IN (2); Freehold, NJ; Buffalo, NY
|
|
| 4 |
|
| 341 |
|
| 3,519 |
|
| 1.1% |
|
| CPI; FIXED |
|
| Retail |
|
| Retail Stores |
|
Orbital Sciences Corporation |
|
| Chandler, AZ |
|
| 1 |
|
| 355 |
|
| 3,307 |
|
| 1.0% |
|
| CPI |
|
| Industrial |
|
| Aerospace and Defense |
|
Rexam Healthcare Packaging Inc. |
|
| Buffalo Grove, IL; Excelsior Springs, MO; North Versailles, PA; St. Petersburg, FL; West Lafayette, IN
|
|
| 5 |
|
| 616 |
|
| 3,243 |
|
| 1.0% |
|
| CPI |
|
| Industrial |
|
| Chemicals, Plastics, Rubber, and Glass |
|
Shaklee Corporation |
|
| Pleasanton, CA |
|
| 1 |
|
| 112 |
|
| 3,101 |
|
| 0.9% |
|
| FIXED |
|
| Office |
|
| Healthcare, Education and Childcare
|
|
|
| Investing for the long runTM | 39 |
Tenants by Annualized Contractual Minimum Base Rent (Pro Rata Basis)
(Continued)
(in thousands, except number of locations and percentages) (unaudited)
As of September 30, 2013 |
Tenant |
|
| Location(s) |
|
| Number |
|
| Square |
|
| Annualized |
|
| Annualized |
|
| Increase |
|
| Property Type |
|
| Industry |
|
|
|
|
|
|
|
|
|
|
|
|
|
|
|
|
|
|
|
|
|
|
|
|
|
|
|
Tommy Hilfiger Europe B.V. |
|
| Netherlands |
|
| 2 |
|
| 474 |
|
| 3,100 |
|
| 0.9% |
|
| CPI |
|
| Warehouse/Distribution |
|
| Textiles, Leather, and Apparel
|
|
MBM-Beef |
|
| Lewisville, TX; Orlando, FL; Rocky Mount, NC |
|
| 4 |
|
| 556 |
|
| 3,076 |
|
| 0.9% |
|
| FIXED |
|
| Industrial |
|
| Beverages, Food, and Tobacco
|
|
Tower Automotive Operations USA I, LLC |
|
| Auburn, IN; Bluffton, OH; Milan, TN
|
|
| 3 |
|
| 844 |
|
| 2,919 |
|
| 0.9% |
|
| CPI |
|
| Industrial |
|
| Automobile |
|
MediMedia USA, Inc. |
|
| Lower Makefield, PA |
|
| 1 |
|
| 107 |
|
| 2,574 |
|
| 0.8% |
|
| FIXED |
|
| Office |
|
| Media: Printing and Publishing
|
|
Information Resources, Inc. |
|
| Chicago, IL |
|
| 1 |
|
| 160 |
|
| 2,521 |
|
| 0.8% |
|
| CPI |
|
| Office |
|
| Business and Commercial Services
|
|
C1000 Logistiek Vastgoed B.V. |
|
| Netherlands |
|
| 6 |
|
| 307 |
|
| 2,405 |
|
| 0.7% |
|
| CPI |
|
| Warehouse/Distribution |
|
| Grocery
|
|
AutoZone, Inc. |
|
| AL; FL; GA; IL; LA; MO; NC; NM; SC; TN; TX
|
|
| 54 |
|
| 302 |
|
| 2,219 |
|
| 0.7% |
|
| FIXED; NONE |
|
| Retail |
|
| Retail Stores |
|
Google Inc. |
|
| Venice, CA |
|
| 1 |
|
| 68 |
|
| 2,117 |
|
| 0.6% |
|
| FIXED |
|
| Office |
|
| Telecommunications
|
|
Gestamp Alabama LLC |
|
| McCalla, AL |
|
| 1 |
|
| 390 |
|
| 2,016 |
|
| 0.6% |
|
| CPI |
|
| Industrial |
|
| Automobile
|
|
Sybron Dental Specialties |
|
| Romulus, MI; Glendora, CA |
|
| 2 |
|
| 245 |
|
| 2,009 |
|
| 0.6% |
|
| CPI |
|
| Industrial |
|
| Healthcare, Education and Childcare
|
|
Overland Storage Inc. |
|
| San Diego, CA |
|
| 1 |
|
| 91 |
|
| 1,981 |
|
| 0.6% |
|
| FIXED |
|
| Office |
|
| Electronics
|
|
Unisource Worldwide, Inc. |
|
| Anchorage, AK; Commerce, CA |
|
| 2 |
|
| 456 |
|
| 1,926 |
|
| 0.6% |
|
| FIXED |
|
| Warehouse/Distribution |
|
| Forest Products and Paper
|
|
Grande Communications Networks, Inc. |
|
| Corpus Christi, TX; Odessa, TX; San Marcos, TX; Waco, TX
|
|
| 5 |
|
| 134 |
|
| 1,893 |
|
| 0.6% |
|
| CPI |
|
| Office |
|
| Telecommunications |
|
Arbella Service Company, Inc. |
|
| Quincy, MA |
|
| 1 |
|
| 132 |
|
| 1,883 |
|
| 0.6% |
|
| FIXED |
|
| Office |
|
| Insurance
|
|
Merit Medical Systems, Inc. |
|
| South Jordan, UT |
|
| 1 |
|
| 193 |
|
| 1,877 |
|
| 0.6% |
|
| CPI |
|
| Industrial |
|
| Healthcare, Education and Childcare
|
|
Eroski Sociedad Cooperativa |
|
| Spain |
|
| 1 |
|
| 138 |
|
| 1,868 |
|
| 0.6% |
|
| CPI |
|
| Warehouse/Distribution |
|
| Grocery
|
|
Quad/Graphics, Inc. |
|
| Doraville, GA |
|
| 1 |
|
| 433 |
|
| 1,801 |
|
| 0.5% |
|
| CPI |
|
| Industrial |
|
| Media: Printing and Publishing
|
|
Reynolds Group Holdings LTD |
|
| Mooresville, NC |
|
| 1 |
|
| 385 |
|
| 1,800 |
|
| 0.5% |
|
| CPI |
|
| Industrial |
|
| Chemicals, Plastics, Rubber, and Glass
|
|
Kerr Corporation |
|
| Bowling Green, KY; Jackson, TN |
|
| 2 |
|
| 368 |
|
| 1,788 |
|
| 0.5% |
|
| FIXED |
|
| Industrial |
|
| Chemicals, Plastics, Rubber, and Glass
|
|
BE Aerospace, Inc. |
|
| Lenexa, KS; Winston-Salem, NC |
|
| 2 |
|
| 404 |
|
| 1,769 |
|
| 0.5% |
|
| FIXED |
|
| Industrial |
|
| Aerospace and Defense
|
|
|
| Investing for the long runTM | 40 |
Tenants by Annualized Contractual Minimum Base Rent (Pro Rata Basis)
(Continued)
(in thousands, except number of locations and percentages) (unaudited)
As of September 30, 2013 |
| |||||||||||||||||
|
|
|
|
|
|
|
|
|
|
|
|
|
|
|
|
|
| |
Tenant |
| Location(s) |
| Number |
| Square |
| Annualized |
| Annualized |
| Increase |
| Property Type |
| Industry |
| |
|
|
|
|
|
|
|
|
|
|
|
|
|
|
|
|
|
| |
Del Monte Corporation |
| Mendota, IL; Plover, WI; Toppenish, WA; Yakima, WA |
| 4 |
| 368 |
| 1,763 |
| 0.5% |
| CPI |
| Warehouse/Distribution |
| Beverages, Food, and Tobacco
|
| |
EADS North America, Inc. |
| Irvine, CA |
| 1 |
| 99 |
| 1,755 |
| 0.5% |
| FIXED |
| Office |
| Electronics
|
| |
Walgreens Co. |
| Concord, NC; Florence, AL; Rockport, TX; Snellville, GA; Virginia Beach, VA
|
| 5 |
| 74 |
| 1,741 |
| 0.5% |
| NONE |
| Retail |
| Retail Stores |
| |
Childtime Childcare, Inc. |
| AZ; CA; MI; TX |
| 12 |
| 84 |
| 1,731 |
| 0.5% |
| CPI |
| Other Properties |
| Healthcare, Education and Childcare
|
| |
The United States Playing Card Company |
| Erlanger, KY |
| 2 |
| 770 |
| 1,720 |
| 0.5% |
| FIXED |
| Industrial |
| Media: Printing and Publishing
|
| |
Belgium Government |
| Belgium |
| 1 |
| 122 |
| 1,700 |
| 0.5% |
| CPI |
| Office |
| Federal, State and Local Government
|
| |
Plexus Corp. |
| Neenah, WI |
| 1 |
| 179 |
| 1,699 |
| 0.5% |
| CPI |
| Industrial |
| Electronics
|
| |
Integracolor, Ltd. |
| Mesquite, TX |
| 1 |
| 359 |
| 1,647 |
| 0.5% |
| CPI |
| Warehouse/Distribution; Industrial |
| Media: Printing and Publishing
|
| |
Others(a)
|
|
|
| 75 |
| 8,031 |
| 43,455 |
| 13.1% |
|
|
|
|
|
|
| |
Total(b) (c) |
|
|
| 421 |
| 39,436 |
| $ | 331,669 |
| 100.0% |
|
|
|
|
|
|
|
__________
(a) Number of locations includes properties that are partially vacant.
(b) Excludes all operating properties.
(c) Pro rata amounts are non-GAAP measures. See the Terms and Definitions section that begins on page 42 for a description of our non-GAAP measures.
|
| Investing for the long runTM | 41 |
Terms and Definitions
Non-GAAP Financial Disclosures
AFFO
Funds from Operations (“FFO”) is a non-GAAP measure defined by the National Association of Real Estate Investment Trusts (“NAREIT”). NAREIT defines FFO as net income or loss (as computed in accordance with GAAP) excluding: depreciation and amortization expense from real estate assets, impairment charges on real estate, gains or losses from sales of depreciated real estate assets and extraordinary items; however, FFO related to assets held for sale, sold or otherwise transferred and included in the results of discontinued operations are included. These adjustments also incorporate the pro rata share of unconsolidated subsidiaries. FFO is used by management, investors and analysts to facilitate meaningful comparisons of operating performance between periods and among our peers. Although NAREIT has published this definition of FFO, companies often modify this definition as they seek to provide financial measures that meaningfully reflect their distinctive operations.
We modify the NAREIT computation of FFO to include other adjustments to GAAP net income to adjust for certain non-cash charges such as amortization of intangibles, deferred income tax benefits and expenses, straight-line rents, stock compensation, gains or losses from extinguishment of debt and deconsolidation of subsidiaries and unrealized foreign currency exchange gains and losses. Our assessment of our operations is focused on long-term sustainability and not on such non-cash items, which may cause short-term fluctuations in net income but have no impact on cash flows. Additionally, we exclude expenses related to the CPA®:15 Merger and Proposed Merger and realized gain/losses on foreign exchange and derivatives which are not considered fundamental attributes of our business plan and do not affect our overall long-term operating performance. We refer to our modified definition of FFO as AFFO. We exclude these items from GAAP net income as they are not the primary drivers in our decision making process and excluding those items provides investors a view of our portfolio performance over time and make it more comparable to other REITs which are currently not engaged in acquisitions and mergers. We use AFFO as one measure of our operating performance when we formulate corporate goals, evaluate the effectiveness of our strategies, and determine executive compensation.
We believe that AFFO is a useful supplemental measure for investors to consider because it will help them to better assess the sustainability of our operating performance without the potentially distorting impact of these short-term fluctuations. However, there are limits on the usefulness of AFFO to investors. For example, impairment charges and unrealized foreign currency losses that we exclude may become actual realized losses upon the ultimate disposition of the properties in the form of lower cash proceeds or other considerations. We use our FFO and AFFO measures as supplemental financial measures of operating performance. We do not use our FFO and AFFO measures as, nor should they be considered to be, alternatives to net earnings computed under GAAP, as alternatives to cash from operating activities computed under GAAP or as indicators of our ability to fund our cash needs.
Adjusted EBITDA
We believe that earnings before interest, taxes, depreciation and amortization (“EBITDA”) is a useful supplemental measure to investors and analysts for assessing the performance of our business segments, although it does not represent net income that is computed in accordance with GAAP, because it removes the impact of our capital structure and asset base from our operating results and because it is helpful when comparing our operating performance to that of companies in our industry without regard to such items, which can vary substantially from company to company. Adjusted EBITDA as disclosed represents EBITDA, modified to include other adjustments to GAAP net income for certain non-cash charges such as impairments and stock compensation. Additionally, we exclude merger expenses related to the CPA®:15 Merger and the proposed merger with CPA®:16 - Global which are considered non-recurring and gain/losses in real estate, foreign exchange and derivatives which are not considered fundamental attributes of our business plans and do not affect our overall long-term operating performance. We exclude these items from Adjusted EBITDA as they are not the primary drivers in our decision making process. Our assessment of our operations is focused on long-term sustainability and not on such non-cash items, which may cause short term fluctuations in net income but have no impact on cash flows. We believe that Adjusted EBITDA is a useful supplemental measure to investors and analysts for assessing the performance of our business segments, although it does not represent net income that is computed in accordance with GAAP. Accordingly, Adjusted EBITDA should not be considered as an alternative to net income or as an indicator of our financial performance. EBITDA and Adjusted EBITDA may not be comparable to similarly titled measures of other companies. Therefore, we use EBITDA and Adjusted EBITDA as two of the measures of our operating performance when we formulate corporate goals, evaluate the effectiveness of our strategies, and determine executive compensation. Adjusted EBITDA may not be comparable to similarly titled measures of other companies.
Adjusted Revenue
Adjusted revenue is a non-GAAP financial measure that represents revenues on a GAAP basis adjusted for our pro rata share of revenues from equity investments as well as the pro rata share of revenues due to noncontrolling interests. We believe that adjusted revenue is useful to investors and analysts as a supplemental measure of revenues from our core operations, and we use it to evaluate
|
| Investing for the long runTM | 42 |
Terms and Definitions
(Continued)
the stability of our underlying revenue streams. Adjusted revenue should not be considered as an alternative to revenues computed on a GAAP basis as a measure of our profitability. Adjusted revenue may not be comparable to similarly titled measures of other companies.
Adjusted G&A
Total Adjusted G&A is a non-GAAP financial measure that represents WPC’s general and administrative expense on a GAAP basis adjusted for both non-recurring items including merger costs and recurring items including Dealer manager fee-related expense and non-cash stock compensation expense. We believe that Adjusted G&A is useful to investors and analysts as a supplemental measure of expenses related to Total Adjusted Real Estate Revenue, and we use it to evaluate the profitability of our overall operations. Total Adjusted G&A should not be considered as an alternative to general and administrative expense computed on a GAAP basis as a measure of our profitability. Adjusted G&A may not be comparable to similarly titled measures of other companies.
Pro Rata Amounts
This supplemental package contains certain measures prepared under the pro rata consolidation method, which is not in accordance with GAAP. We refer to these non-GAAP measures as pro rata measures. We believe that these pro rata measures, including primarily “pro rata debt” and “pro rata NOI,” are useful to investors as they provide supplemental information on the nature and performance of our investments that is not easily discernible in the equivalent GAAP measures. Consistent with industry practice and as a means of procuring opportunities and sharing risk, we have a number of investments, usually with our affiliates, in which our economic ownership is less than 100%. Under the full consolidation method required under GAAP, we report 100% of the assets, liabilities, revenues and expenses of those investments that are deemed to be under our control or for which we are deemed to be the primary beneficiary, even if our ownership is less than 100%. Also, under GAAP, for all other jointly-owned investments, we report our net investment and our net income or loss from that investment. Under the pro rata consolidation method, we generally present our proportionate share, based on our economic ownership of these jointly-owned investments, of the assets, liabilities, revenues and expenses of those investments, as we use this information to evaluate our financial performance without including any ownership of the other investors. Our non-GAAP measures are not intended to be performance measures that should be regarded as alternatives to or more meaningful than, our GAAP measures.
Total Adjusted Real Estate Revenue
Total Adjusted Real Estate Revenue represents WPC and the Managed REITs, as well as Corporate Property Associates 14 Incorporated (“CPA®:14”) prior to the CPA®:14 merger with CPA®:16 - Global in 2011. We believe that presenting Total Adjusted Real Estate Revenue is useful to investors and analysts as a supplemental measure of our Real Estate segment in relation to the aggregate amount of revenues that we manage. We use this non-GAAP measure because it allows for the evaluation of revenue stability of our owned and managed investment portfolios. Total Adjusted Real Estate Revenue should not be considered as an alternative to revenues computed on a GAAP basis or as a measure of our profitability. Total Adjusted Real Estate Revenue may not be comparable to similarly titled measures of other companies.
|
| Investing for the long runTM | 43 |