The Transformed Earthstone Bigger, Better and Built to Last March 9, 2022 Exhibit 99.2

2 Disclaimer Forward-Looking Statements This presentation contains forward-looking statements within the meaning of Section 27A of the Securities Act of 1933, as amended (the “Securities Act”), and Section 21E of the Securities Exchange Act of 1934, as amended (the “Exchange Act”). Statements that are not strictly historical statements constitute forward-looking statements and may often, but not always, be identified by the use of such words such as “expects,” “believes,” “intends,” “anticipates,” “plans,” “estimates,” “guidance,” “target,” “potential,” “possible,” or “probable” or statements that certain actions, events or results “may,” “will,” “should,” or “could” be taken, occur or be achieved. The forward-looking statements include statements about the expected benefits of Earthstone Energy, Inc. (“ESTE,” “Earthstone” or the “Company”) and its stockholders from the acquisition (the “Bighorn Acquisition”) of certain assets from Bighorn Permian Resources, LLC (“Bighorn”) by Earthstone, the acquisition (the “Chisholm Acquisition” and with the Bighorn Acquisition, the “Acquisitions”) of certain assets from Chisholm Energy Operating, LLC and Chisholm Energy Agent, Inc. (collectively, “Chisholm”) by Earthstone, the private placement (the “PIPE”) of Series A Convertible Preferred Stock by Earthstone in the amount of $280 million, the expected future reserves, production, financial position, business strategy, revenues, earnings, costs, capital expenditures and debt levels of the Company, and plans and objectives of management for future operations. Forward-looking statements are based on current expectations and assumptions and analyses made by Earthstone and its management in light of experience and perception of historical trends, current conditions and expected future developments, as well as other factors appropriate under the circumstances. However, whether actual results and developments will conform to expectations is subject to a number of material risks and uncertainties, including but not limited to: Earthstone’s ability to integrate the assets acquired in the Acquisitions and achieve anticipated benefits from them; risks relating to any unforeseen liabilities of Earthstone or the assets acquired in the Acquisitions; declines in oil, natural gas liquids or natural gas prices; the level of success in exploration, development and production activities; adverse weather conditions that may negatively impact development or production activities; the timing of exploration and development expenditures; inaccuracies of reserve estimates or assumptions underlying them; revisions to reserve estimates as a result of changes in commodity prices; impacts to financial statements as a result of impairment write-downs; risks related to level of indebtedness and periodic redeterminations of the borrowing base under the Company’s credit facility; Earthstone’s ability to generate sufficient cash flows from operations to fund all or portions of its future capital expenditures budget; Earthstone’s ability to obtain external capital to finance exploration and development operations and acquisitions; the impacts of hedging on results of operations; uninsured or underinsured losses resulting from oil and natural gas operations; Earthstone’s ability to replace oil and natural gas reserves; any loss of senior management or technical personnel; and the direct and indirect impact on most or all of the foregoing on the evolving COVID-19 pandemic. Earthstone’s annual report on Form 10-K for the year ended December 31, 2021, recent current reports on Form 8-K, and other Securities and Exchange Commission (“SEC”) filings discuss some of the important risk factors identified that may affect Earthstone’s business, results of operations, and financial condition. Earthstone undertakes no obligation to revise or update publicly any forward-looking statements except as required by law. This presentation contains estimates of Earthstone’s, Bighorn’s and Chisholm’s 2022 production, capital expenditures and expense guidance. The actual levels of production, capital expenditures and operating expenses may be higher or lower than these estimates due to, among other things, uncertainty in drilling schedules, oil and natural gas prices, changes in market demand for hydrocarbons and unanticipated delays in production and well completions. These estimates are based on numerous assumptions. All or any of these assumptions may not prove to be accurate, which could result in actual results differing materially from estimates. No assurance can be made that any new wells will produce in line with historical performance, or that existing wells will continue to produce in line with Earthstone’s expectations. Earthstone’s ability to fund its 2022 and future capital budgets is subject to numerous risks and uncertainties, including volatility in commodity prices and the potential for unanticipated production and completion delays and increases in costs associated with drilling, production and transportation. Industry and Market Data This presentation has been prepared by Earthstone and includes market data and other statistical information from third-party sources, including independent industry publications, government publications or other published independent sources. Although Earthstone believes these third-party sources are reliable as of their respective dates, Earthstone has not independently verified the accuracy or completeness of this information. Some data are also based on Earthstone’s good faith estimates, which are derived from its review of internal sources as well as the third-party sources described above.
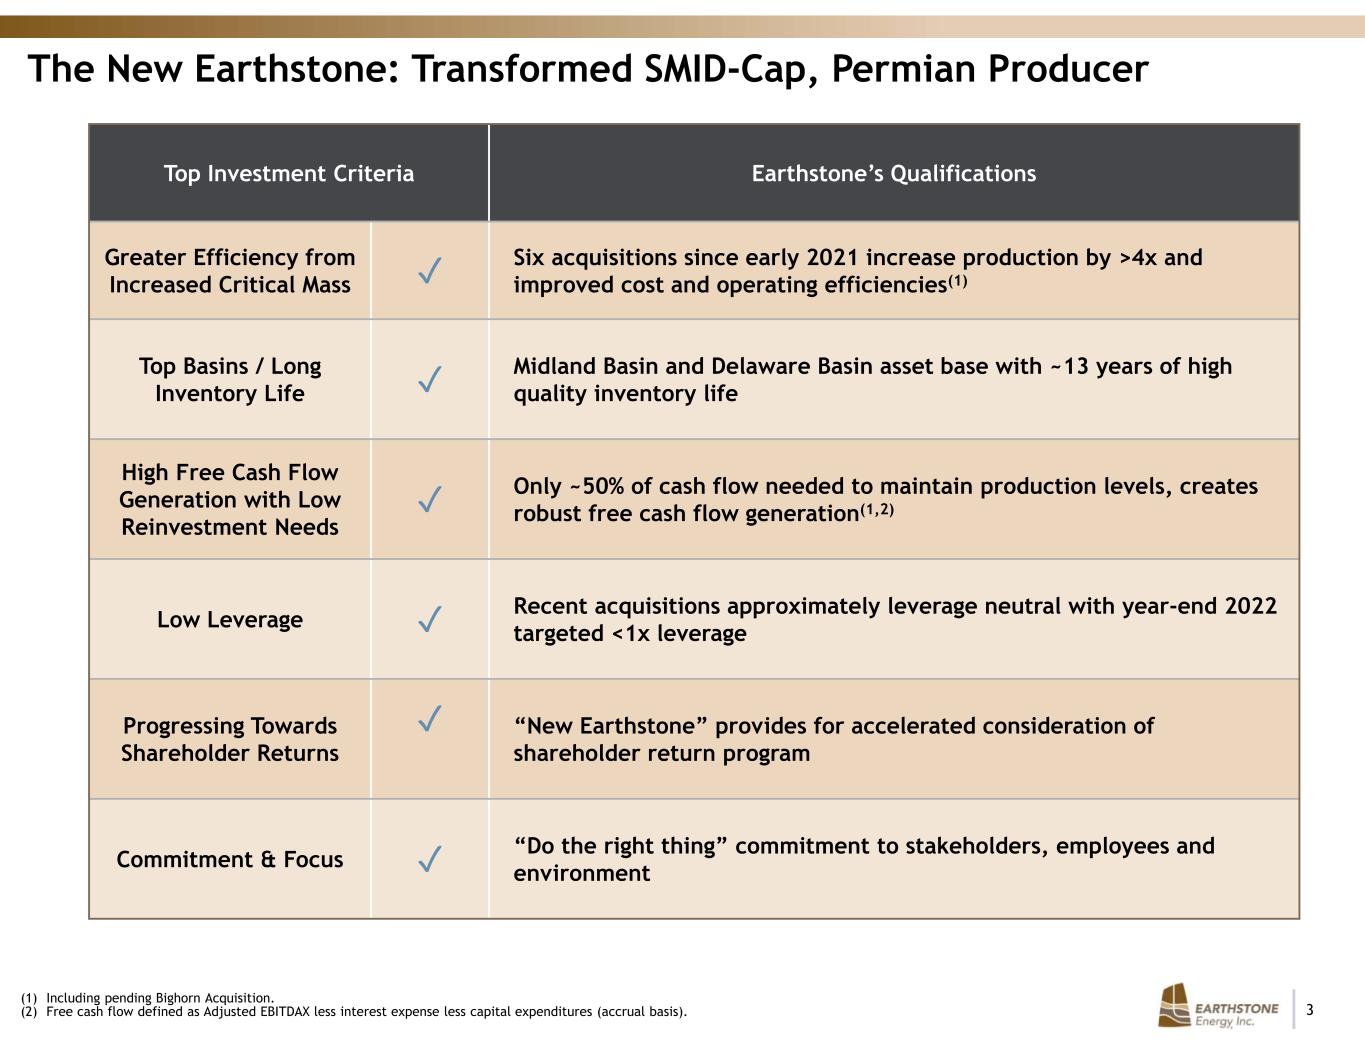
3 The New Earthstone: Transformed SMID-Cap, Permian Producer Top Investment Criteria Earthstone’s Qualifications Greater Efficiency from Increased Critical Mass ✓ Six acquisitions since early 2021 increase production by >4x and improved cost and operating efficiencies(1) Top Basins / Long Inventory Life ✓ Midland Basin and Delaware Basin asset base with ~13 years of high quality inventory life High Free Cash Flow Generation with Low Reinvestment Needs ✓ Only ~50% of cash flow needed to maintain production levels, creates robust free cash flow generation(1,2) Low Leverage ✓ Recent acquisitions approximately leverage neutral with year-end 2022 targeted <1x leverage Progressing Towards Shareholder Returns ✓ “New Earthstone” provides for accelerated consideration of shareholder return program Commitment & Focus ✓ “Do the right thing” commitment to stakeholders, employees and environment (1) Including pending Bighorn Acquisition. (2) Free cash flow defined as Adjusted EBITDAX less interest expense less capital expenditures (accrual basis).
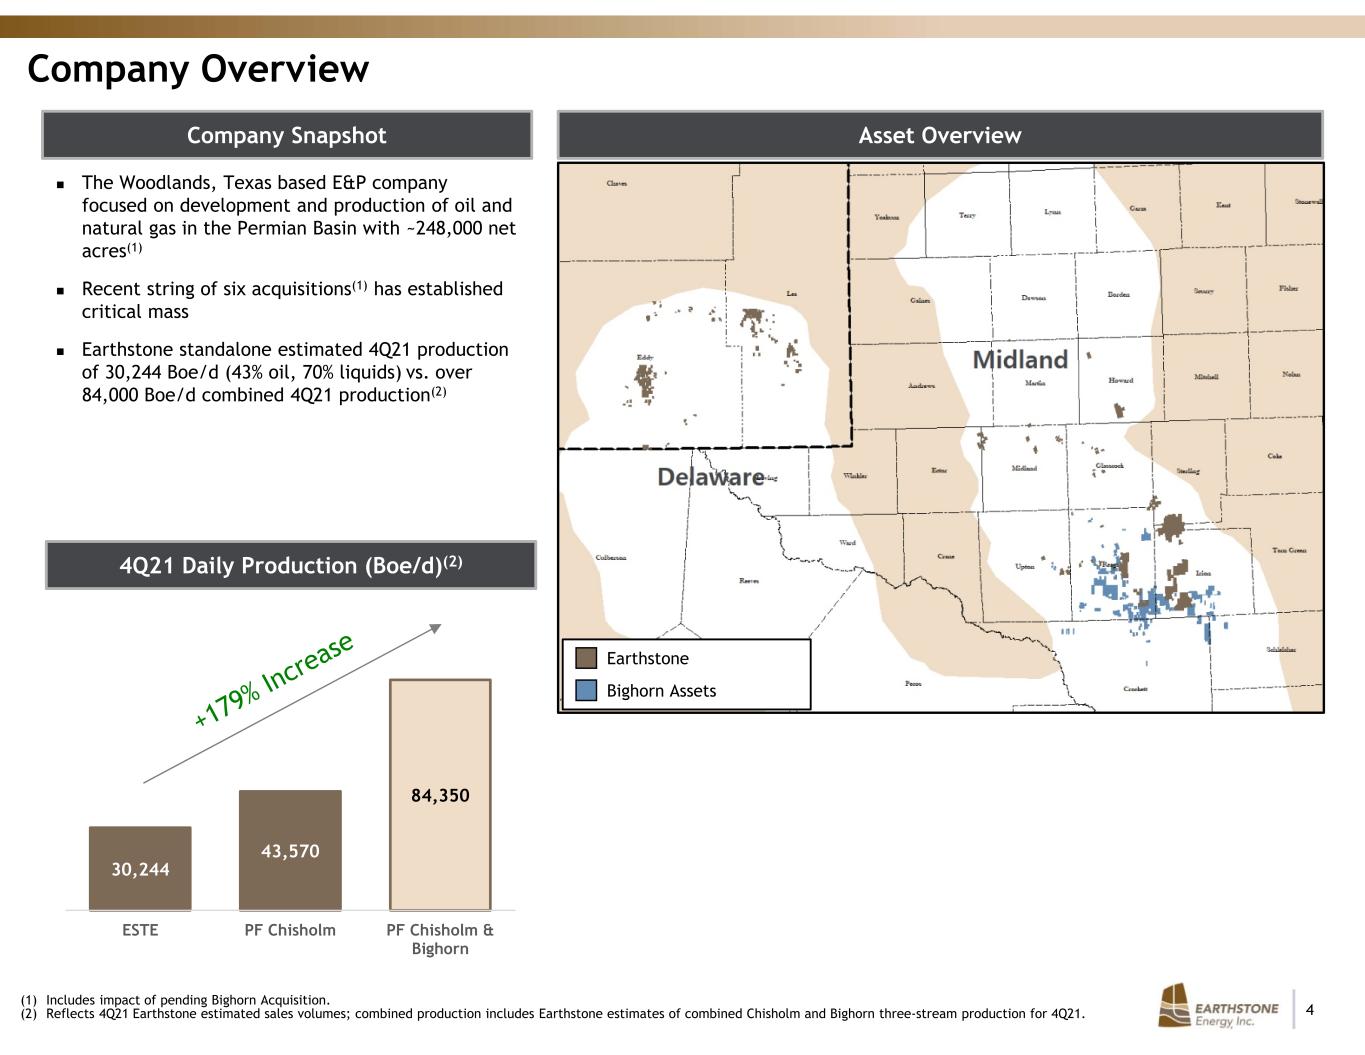
4 30,244 43,570 84,350 ESTE PF Chisholm PF Chisholm & Bighorn Company Overview Asset Overview The Woodlands, Texas based E&P company focused on development and production of oil and natural gas in the Permian Basin with ~248,000 net acres(1) Recent string of six acquisitions(1) has established critical mass Earthstone standalone estimated 4Q21 production of 30,244 Boe/d (43% oil, 70% liquids) vs. over 84,000 Boe/d combined 4Q21 production(2) (1) Includes impact of pending Bighorn Acquisition. (2) Reflects 4Q21 Earthstone estimated sales volumes; combined production includes Earthstone estimates of combined Chisholm and Bighorn three-stream production for 4Q21. Bighorn Assets Earthstone 4Q21 Daily Production (Boe/d)(2) Company Snapshot
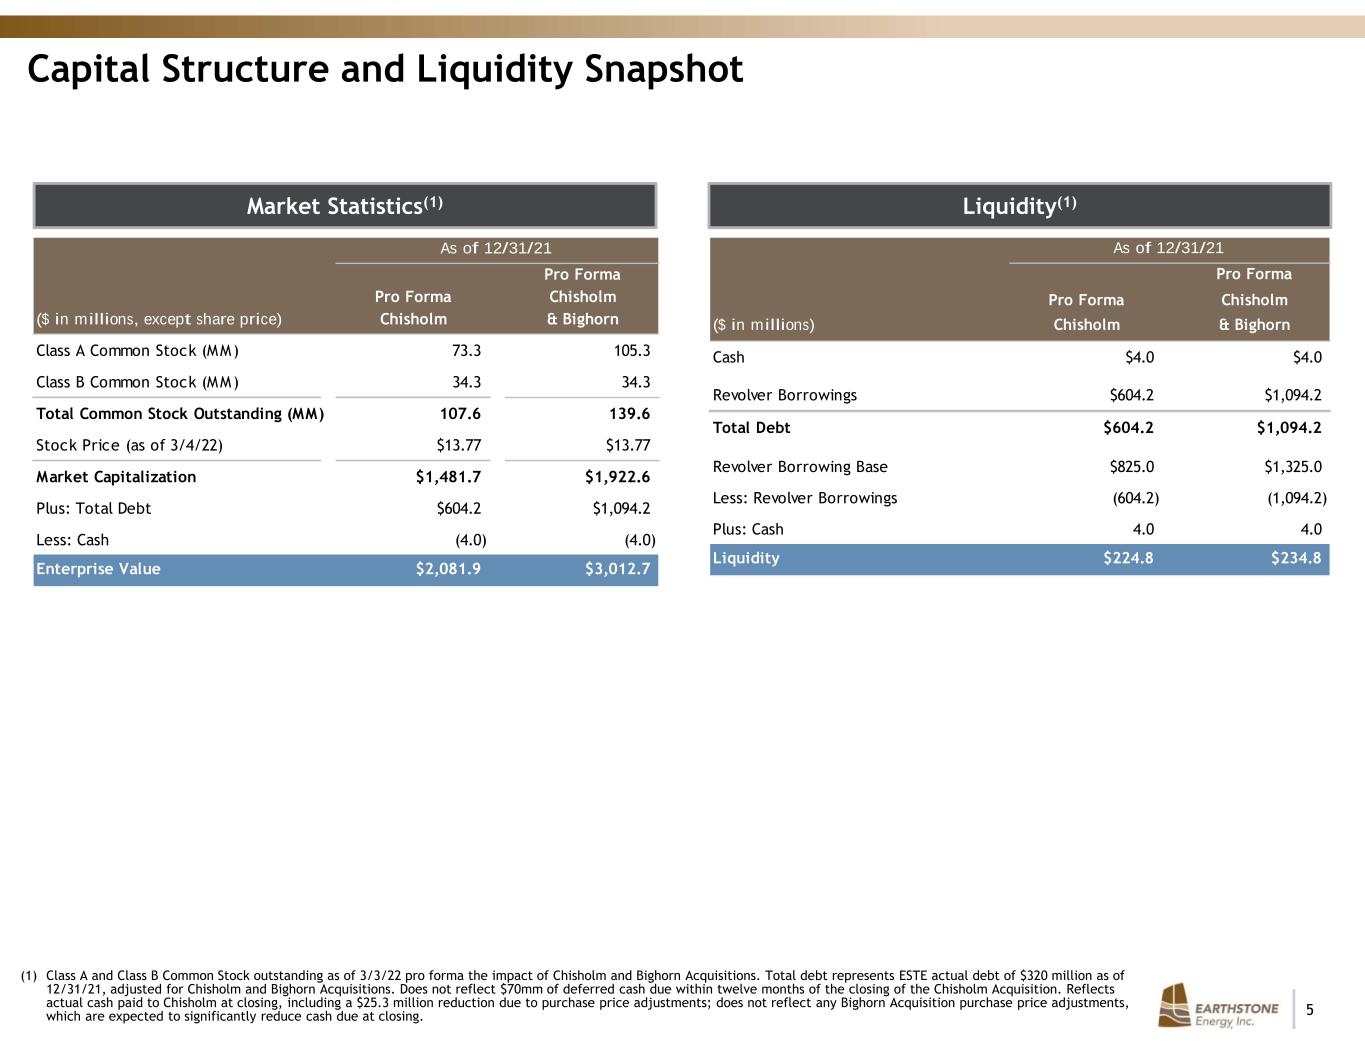
5 Capital Structure and Liquidity Snapshot Market Statistics(1) (1) Class A and Class B Common Stock outstanding as of 3/3/22 pro forma the impact of Chisholm and Bighorn Acquisitions. Total debt represents ESTE actual debt of $320 million as of 12/31/21, adjusted for Chisholm and Bighorn Acquisitions. Does not reflect $70mm of deferred cash due within twelve months of the closing of the Chisholm Acquisition. Reflects actual cash paid to Chisholm at closing, including a $25.3 million reduction due to purchase price adjustments; does not reflect any Bighorn Acquisition purchase price adjustments, which are expected to significantly reduce cash due at closing. Liquidity(1) As of 12/31/21 Pro Forma Pro Forma Chisholm ($ in millions) Chisholm & Bighorn Cash $4.0 $4.0 Revolver Borrowings $604.2 $1,094.2 Total Debt $604.2 $1,094.2 Revolver Borrowing Base $825.0 $1,325.0 Less: Revolver Borrowings (604.2) (1,094.2) Plus: Cash 4.0 4.0 Liquidity $224.8 $234.8 As of 12/31/21 Pro Forma Pro Forma Chisholm ($ in millions, except share price) Chisholm & Bighorn Class A Common Stock (MM) 73.3 105.3 Class B Common Stock (MM) 34.3 34.3 Total Common Stock Outstanding (MM) 107.6 139.6 Stock Price (as of 3/4/22) $13.77 $13.77 Market Capitalization $1,481.7 $1,922.6 Plus: Total Debt $604.2 $1,094.2 Less: Cash (4.0) (4.0) Enterprise Value $2,081.9 $3,012.7
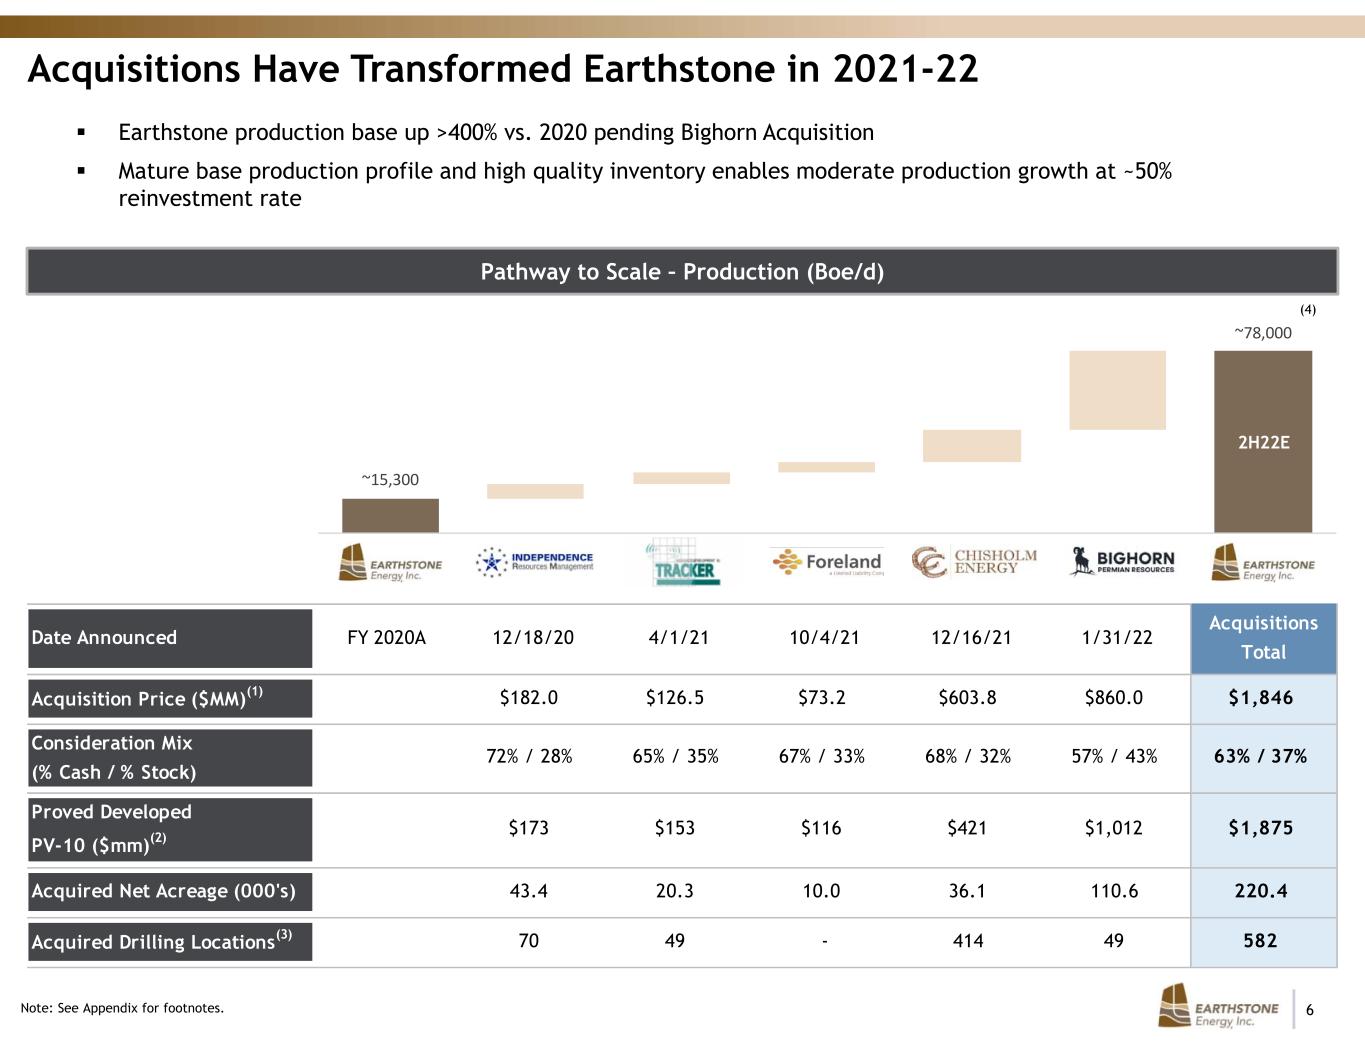
6 Date Announced FY 2020A 12/18/20 4/1/21 10/4/21 12/16/21 1/31/22 Acquisitions Total Acquisition Price ($MM)(1) $182.0 $126.5 $73.2 $603.8 $860.0 $1,846 Consideration Mix (% Cash / % Stock) 72% / 28% 65% / 35% 67% / 33% 68% / 32% 57% / 43% 63% / 37% Proved Developed PV-10 ($mm)(2) $173 $153 $116 $421 $1,012 $1,875 Acquired Net Acreage (000's) 43.4 20.3 10.0 36.1 110.6 220.4 Acquired Drilling Locations(3) 70 49 - 414 49 582 2H22E ~15,300 ~78,000 ESTE… IRM Tracker Foreland Chisholm Bighorn 2H22E Acquisitions Have Transformed Earthstone in 2021-22 Earthstone production base up >400% vs. 2020 pending Bighorn Acquisition Mature base production profile and high quality inventory enables moderate production growth at ~50% reinvestment rate Note: See Appendix for footnotes. Pathway to Scale – Production (Boe/d) (4)

7 18% 82% 25% 75% Northern Delaware Basin Asset Overview Delaware Acreage OverviewAcquisition Highlights 4Q21 Production (Boe/d) ~13,325 % Oil / % Liquids 65% / 81% Proved Developed PV-10 ($MM) $511 Proved Developed Reserves (MMBoe) 25.9 Total Net Acres ~36,100 % Operated / % HBP 92% / 85% Avg. % WI / % NRI 55% / 44% (1) Current Production is Earthstone management’s estimate of Chisholm three stream sales volumes for the most recent available 30-day period. PV-10 is a non-GAAP measure that differs from a measure under GAAP known as “standardized measure of discounted future net cash flows” in that PV-10 is calculated without including future income taxes. Proved Developed PV-10 value based upon NYMEX strip pricing as of 3/1/22 and an effective date of 1/1/22. ESTE’s recent acquisition in the Delaware Basin of the Chisholm assets brings significant production and cash flow High quality drilling inventory with high-graded operated location count of 414 gross (237 net) locations ESTE plans to maintain a 2-rig program in New Mexico (in addition to the 2-rigs in the Midland Basin) 79 federal/state drilling permits already in place and another 52 permits in process to support a 2-rig drilling program for the next several years Asset Highlights(1) 414 Gross Operated Locations ~13,325 4Q21 Boe/d EddyLea Delaware Production and Drilling Inventory by County Lea TEXAS NEW MEXICO Eddy Delaware Basin Earthstone

8 Bighorn Asset Overview – Pending Closing Acreage OverviewAcquisition Highlights Asset Highlights(1) 4Q21 Production (Boe/d) ~40,775 (25% Oil / 57% Liquids) PDP Reserves 107 MMBoe PDP PV-10 ($MM) $1,145 Total Net Acres ~110,600 % HBP / % Operated 99% / 98% Horizontal / Vertical Producing Wells 647 / 3 Avg. WI / NRI 93% / 70% Gross / Net Locations 49 / 35 (1) Assumes an 1/1/22 effective date and NYMEX strip pricing as of 3/1/22. PDP-weighted acquisition adds significant scale to Earthstone asset base at an attractive valuation relative to $1,145 million PDP-PV10 ~19% year 1 to year 2 PDP decline rate will reduce Earthstone’s corporate decline rate Opportunity to drive LOE costs lower given Earthstone operating experience in the area No plans to increase 2022 drilling and completion activities on account of Bighorn Acquisition Earthstone Acreage Bighorn Acreage

9 Pro Forma Earthstone Overview
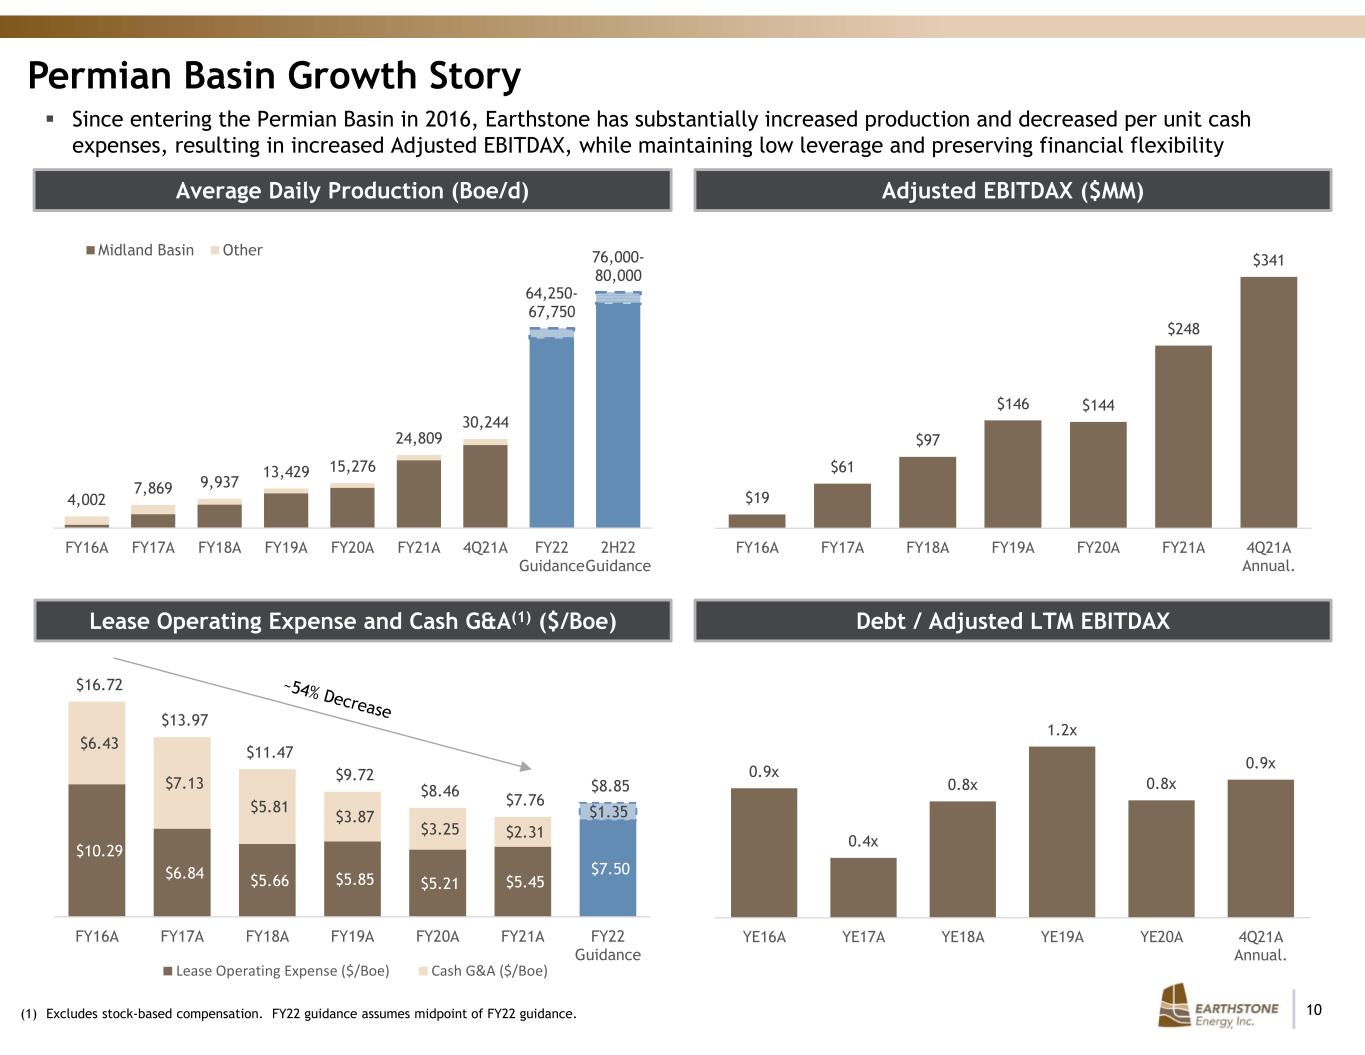
10 0.9x 0.4x 0.8x 1.2x 0.8x 0.9x YE16A YE17A YE18A YE19A YE20A 4Q21A Annual. $10.29 $6.84 $5.66 $5.85 $5.21 $5.45 $7.50 $6.43 $7.13 $5.81 $3.87 $3.25 $2.31 $1.35 $16.72 $13.97 $11.47 $9.72 $8.46 $7.76 $8.85 FY16A FY17A FY18A FY19A FY20A FY21A FY22 Guidance Lease Operating Expense ($/Boe) Cash G&A ($/Boe) 4,002 7,869 9,937 13,429 15,276 24,809 30,244 64,250- 67,750 76,000- 80,000 FY16A FY17A FY18A FY19A FY20A FY21A 4Q21A FY22 Guidance 2H22 Guidance Midland Basin Other (1) Excludes stock-based compensation. FY22 guidance assumes midpoint of FY22 guidance. Average Daily Production (Boe/d) Adjusted EBITDAX ($MM) Lease Operating Expense and Cash G&A(1) ($/Boe) Debt / Adjusted LTM EBITDAX Since entering the Permian Basin in 2016, Earthstone has substantially increased production and decreased per unit cash expenses, resulting in increased Adjusted EBITDAX, while maintaining low leverage and preserving financial flexibility Permian Basin Growth Story $19 $61 $97 $146 $144 $248 $341 FY16A FY17A FY18A FY19A FY20A FY21A 4Q21A Annual.
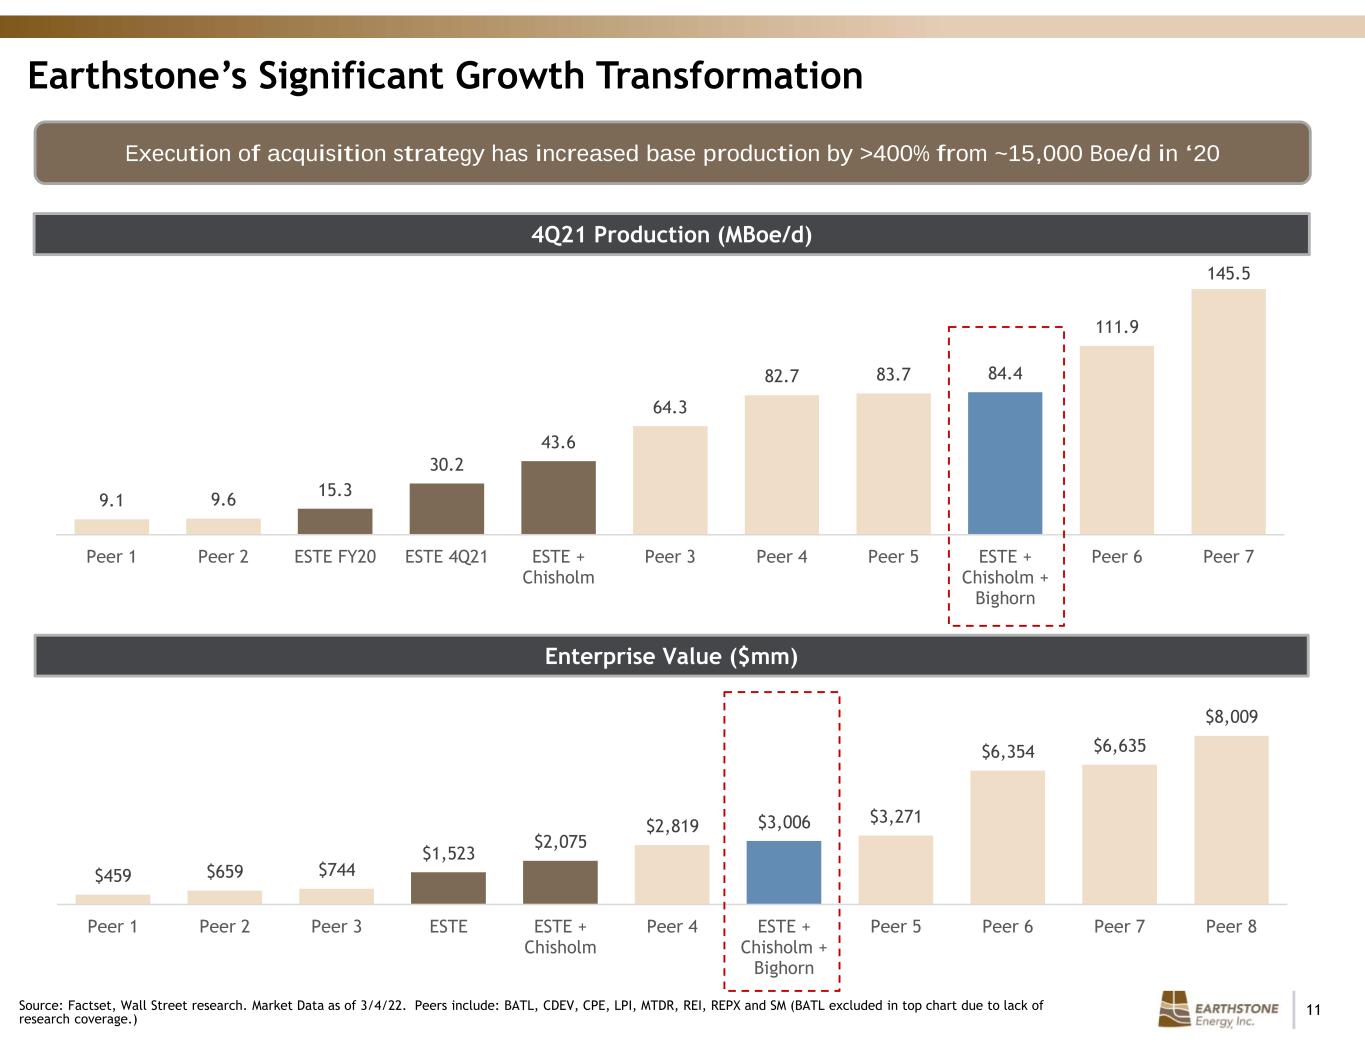
11 $459 $659 $744 $1,523 $2,075 $2,819 $3,006 $3,271 $6,354 $6,635 $8,009 Peer 1 Peer 2 Peer 3 ESTE ESTE + Chisholm Peer 4 ESTE + Chisholm + Bighorn Peer 5 Peer 6 Peer 7 Peer 8 9.1 9.6 15.3 30.2 43.6 64.3 82.7 83.7 84.4 111.9 145.5 Peer 1 Peer 2 ESTE FY20 ESTE 4Q21 ESTE + Chisholm Peer 3 Peer 4 Peer 5 ESTE + Chisholm + Bighorn Peer 6 Peer 7 4Q21 Production (MBoe/d) Enterprise Value ($mm) Earthstone’s Significant Growth Transformation Source: Factset, Wall Street research. Market Data as of 3/4/22. Peers include: BATL, CDEV, CPE, LPI, MTDR, REI, REPX and SM (BATL excluded in top chart due to lack of research coverage.) Execution of acquisition strategy has increased base production by >400% from ~15,000 Boe/d in ‘20
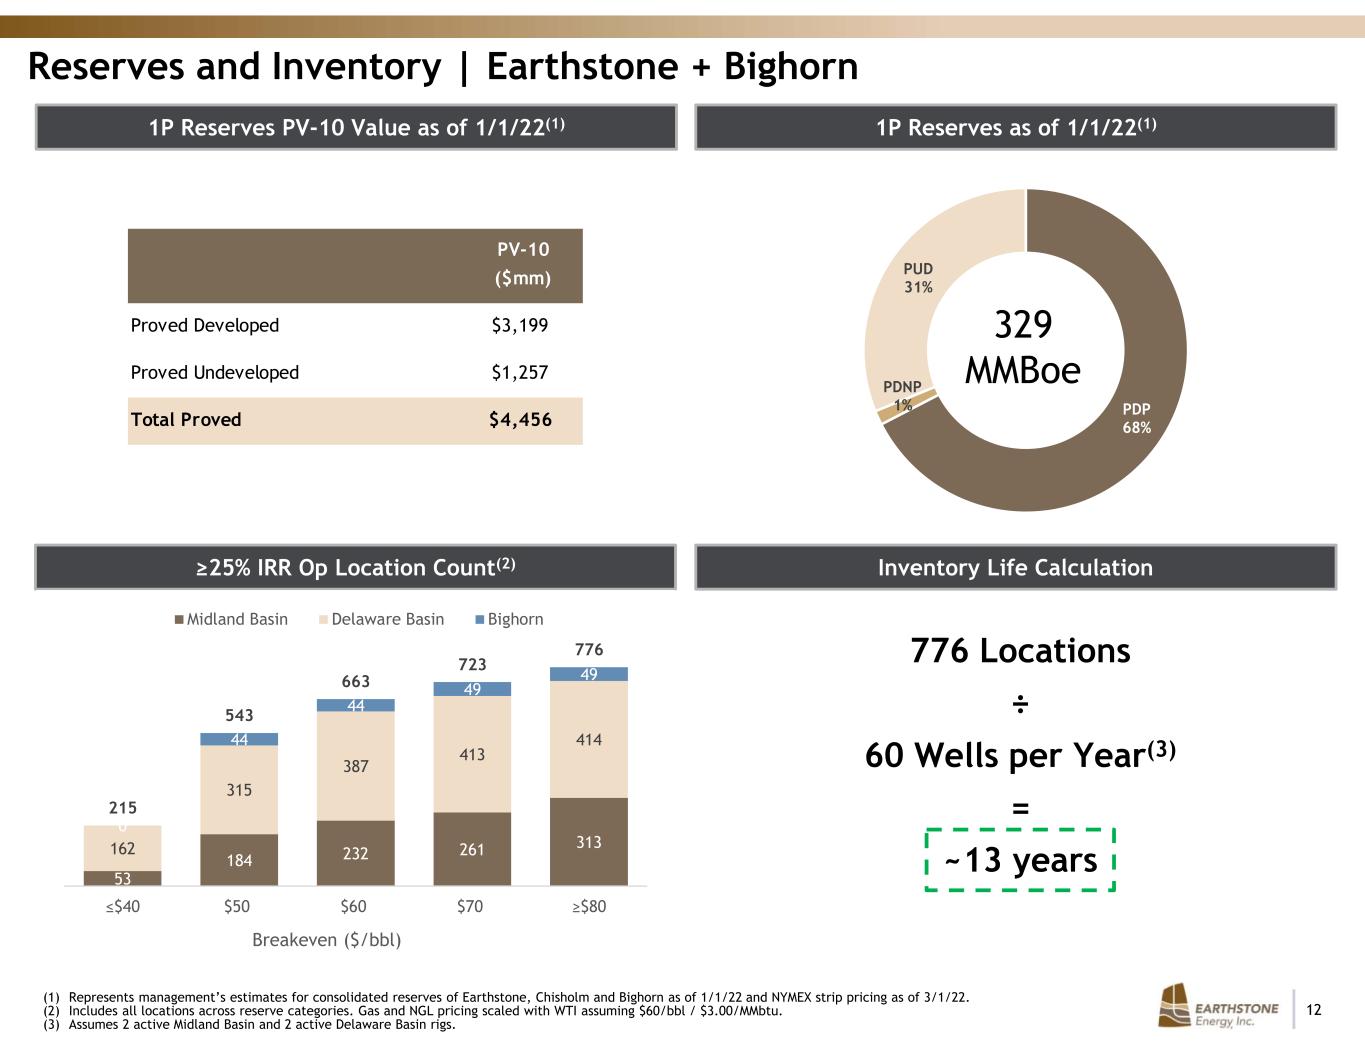
12 PDP 68% PDNP 1% PUD 31% Reserves and Inventory | Earthstone + Bighorn 1P Reserves as of 1/1/22(1)1P Reserves PV-10 Value as of 1/1/22(1) ≥25% IRR Op Location Count(2) Inventory Life Calculation 776 Locations ÷ 60 Wells per Year(3) = ~13 years (1) Represents management’s estimates for consolidated reserves of Earthstone, Chisholm and Bighorn as of 1/1/22 and NYMEX strip pricing as of 3/1/22. (2) Includes all locations across reserve categories. Gas and NGL pricing scaled with WTI assuming $60/bbl / $3.00/MMbtu. (3) Assumes 2 active Midland Basin and 2 active Delaware Basin rigs. 329 MMBoe 53 184 232 261 313 162 315 387 413 414 0 44 44 49 49 215 543 663 723 776 ≤$40 $50 $60 $70 ≥$80 Breakeven ($/bbl) Midland Basin Delaware Basin Bighorn PV-10 ($mm) Proved Developed $3,199 Proved Undeveloped $1,257 Total Proved $4,456

13 Financial Overview

14 2022 Guidance Production Guidance(1) Expense & Capex Guidance(1) Note: Guidance is forward-looking information that is subject to considerable change and numerous risks and uncertainties, many of which are beyond Earthstone’s control. See “Forward-Looking Statements”. Cash G&A is defined as general and administrative expenses excluding stock-based compensation. (1) Guidance assumes Bighorn Acquisition closes on 4/15/22. Production Guidance ESTE + Chisholm 1Q22 ESTE + Chisholm + Bighorn 2Q22 ESTE + Chisholm + Bighorn 3Q22 - 4Q22 ESTE + Chisholm + Bighorn FY22 Production (Boe/d) 35,000 - 37,000 70,000 - 74,000 76,000 - 80,000 64,250 - 67,750 % Oil ~44% ~41% ~41% ~41% % Liquids ~70% ~67% ~67% ~67% Expense & Capex Guidance ESTE + Chisholm 1Q22 ESTE + Chisholm + Bighorn FY22 Total Capital Expenditures ($MM) $95 - $100 $410 - $440 Lease Operating Expense ($/Boe) $6.50 - $7.00 $7.25 - $7.75 Production & Ad Valorem Taxes (% of Revenue) 7.25% - 7.75% 7.5% - 8.0% Cash G&A ($MM) $6 - $7 $31 - $34
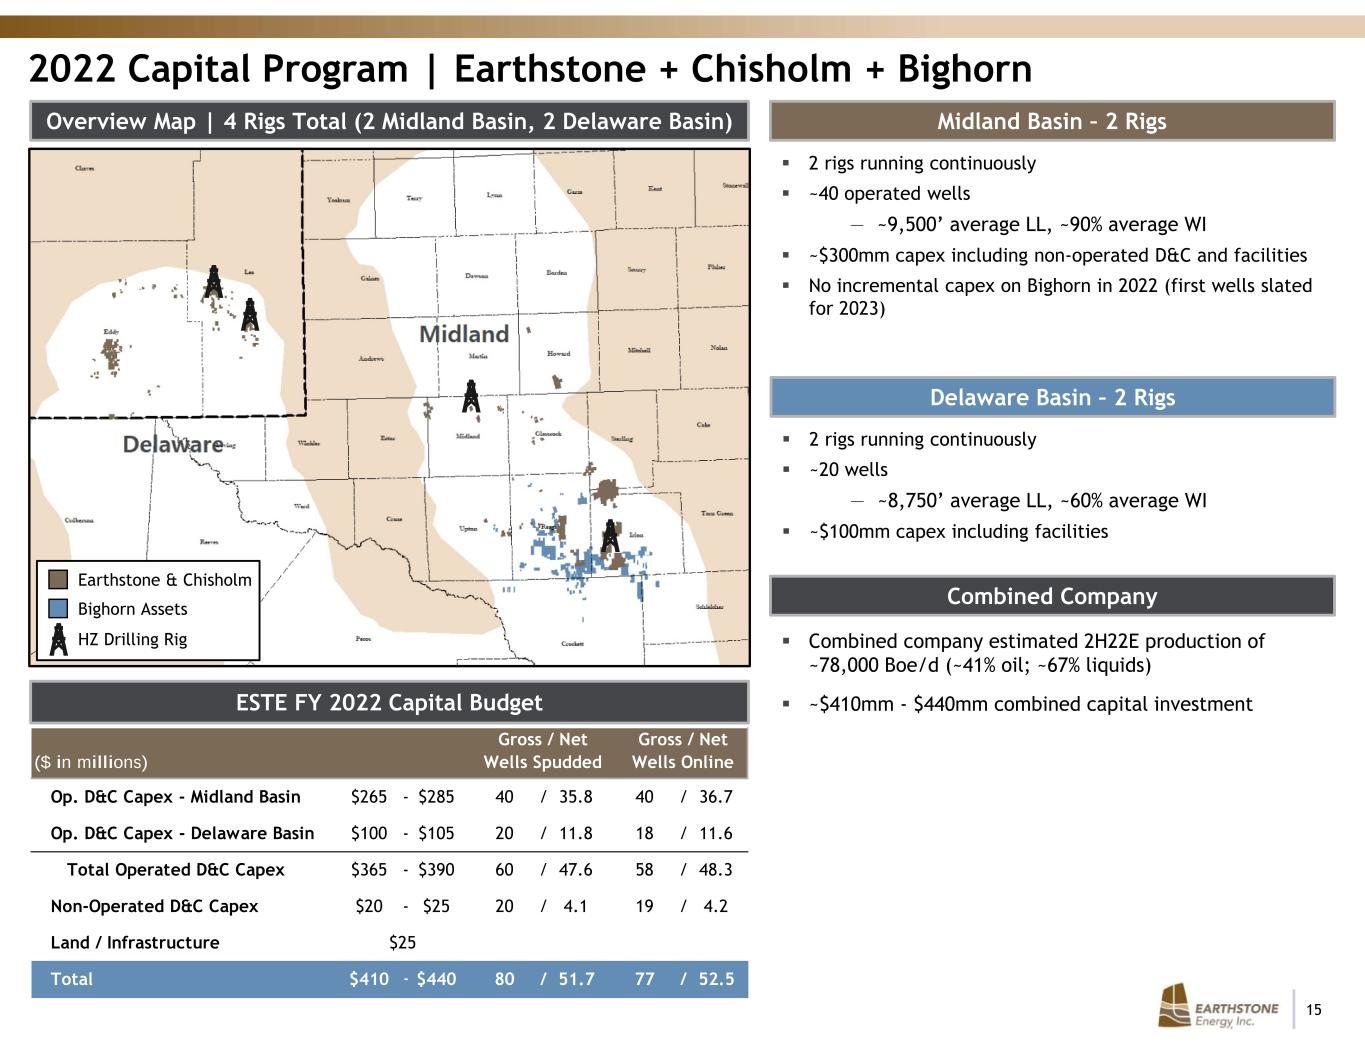
15 Midland Basin – 2 RigsOverview Map | 4 Rigs Total (2 Midland Basin, 2 Delaware Basin) 2 rigs running continuously ~40 operated wells — ~9,500’ average LL, ~90% average WI ~$300mm capex including non-operated D&C and facilities No incremental capex on Bighorn in 2022 (first wells slated for 2023) Delaware Basin – 2 Rigs 2 rigs running continuously ~20 wells — ~8,750’ average LL, ~60% average WI ~$100mm capex including facilities Combined company estimated 2H22E production of ~78,000 Boe/d (~41% oil; ~67% liquids) ~$410mm - $440mm combined capital investment 2022 Capital Program | Earthstone + Chisholm + Bighorn Combined Company Bighorn Assets Earthstone & Chisholm HZ Drilling Rig ESTE FY 2022 Capital Budget ($ in millions) Gross / Net Wells Spudded Gross / Net Wells Online Op. D&C Capex - Midland Basin $265 - $285 40 / 35.8 40 / 36.7 Op. D&C Capex - Delaware Basin $100 - $105 20 / 11.8 18 / 11.6 Total Operated D&C Capex $365 - $390 60 / 47.6 58 / 48.3 Non-Operated D&C Capex $20 - $25 20 / 4.1 19 / 4.2 Land / Infrastructure $25 Total $410 - $440 80 / 51.7 77 / 52.5

16 Oil and Gas Hedging Summary WTI Hedges (Bbls/d and $/Bbl(1)) Henry Hub Hedges (MMBtu/d and $/MMBtu(1)) Note: Includes all WTI and Henry Hub hedges as of 3/1/22. Does not include basis swaps. (1) Reflects weighted average swap price and weighted average collar floor / ceiling prices for each quarter. Disciplined approach to hedging majority of near-term volumes to provide cash flow visibility Lower hedging relative to production and utilization of some collars provide increased commodity upside exposure in 2022+ $56.60 $64.48 $66.70 $66.70 $64.33 $76.20 $60.00/$73.73 $68.03/$82.69 $70.00/$83.96 $70.00/$83.96 $68.45/$82.57 $62.98/$80.34 9,594 16,937 17,750 17,750 15,536 8,200 1Q 2022 2Q 2022 3Q 2022 4Q 2022 FY 2022 FY 2023 Swaps Collars $2.888 $3.595 $3.626 $3.332 $3.492 $3.352 $3.694 / $5.459 $3.595 / $5.109 $3.665 / $5.244 $3.700 / $5.868 $3.667/$5.471 $3.279 / $4.835 32,500 68,313 79,500 79,500 65,122 46,186 1Q 2022 2Q 2022 3Q 2022 4Q 2022 FY 2022 FY 2023 Swaps Collars
17 Analyst Coverage Firm Analyst Contact Info Alliance Global Partners Jeffrey Campbell / 888-543-4448 / jcampbell@allianceg.com Benchmark Subash Chandra / 212-312-6755 / schandra@benchmarkcompany.com Johnson Rice Charles Meade / 504-584-1274 / cmeade@jrco.com RBC Scott Hanold / 512-708-6354 / scott.hanold@rbccm.com Roth John White / 949-720-7115 / jwhite@roth.com Truist Neal Dingmann / 713-247-9000 / neal.dingmann@truist.com Water Tower Research Jeff Robertson / 469-343-9962 / jeff@watertowerresearch.com Wells Fargo Joseph McKay / 212-214-8007 / joseph.mckay@wellsfargo.com
18 Mark Lumpkin, Jr. EVP, Chief Financial Officer Scott Thelander Vice President of Finance Corporate Offices Houston 1400 Woodloch Forest Drive | Suite 300 | The Woodlands, TX 77380 | (281) 298-4246 Midland 600 N. Marienfeld | Suite 1000 | Midland, TX 79701 | (432) 686-1100 Website www.earthstoneenergy.com Contact Information

19 Appendix
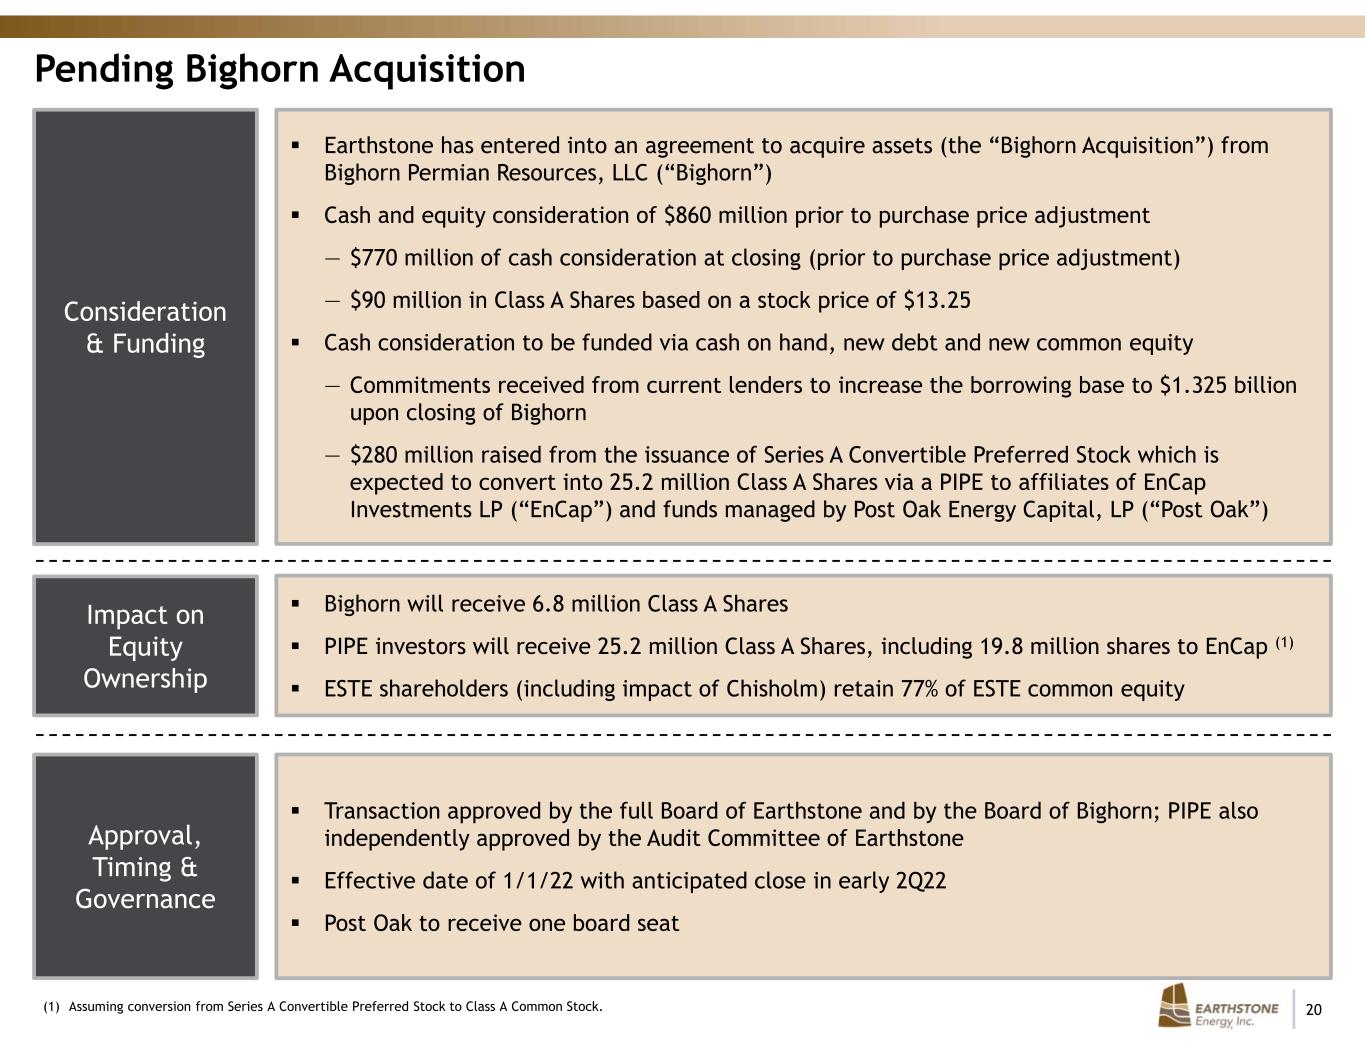
20 Pending Bighorn Acquisition Consideration & Funding Impact on Equity Ownership Approval, Timing & Governance Earthstone has entered into an agreement to acquire assets (the “Bighorn Acquisition”) from Bighorn Permian Resources, LLC (“Bighorn”) Cash and equity consideration of $860 million prior to purchase price adjustment ― $770 million of cash consideration at closing (prior to purchase price adjustment) ― $90 million in Class A Shares based on a stock price of $13.25 Cash consideration to be funded via cash on hand, new debt and new common equity ― Commitments received from current lenders to increase the borrowing base to $1.325 billion upon closing of Bighorn ― $280 million raised from the issuance of Series A Convertible Preferred Stock which is expected to convert into 25.2 million Class A Shares via a PIPE to affiliates of EnCap Investments LP (“EnCap”) and funds managed by Post Oak Energy Capital, LP (“Post Oak”) Bighorn will receive 6.8 million Class A Shares PIPE investors will receive 25.2 million Class A Shares, including 19.8 million shares to EnCap (1) ESTE shareholders (including impact of Chisholm) retain 77% of ESTE common equity Transaction approved by the full Board of Earthstone and by the Board of Bighorn; PIPE also independently approved by the Audit Committee of Earthstone Effective date of 1/1/22 with anticipated close in early 2Q22 Post Oak to receive one board seat (1) Assuming conversion from Series A Convertible Preferred Stock to Class A Common Stock.
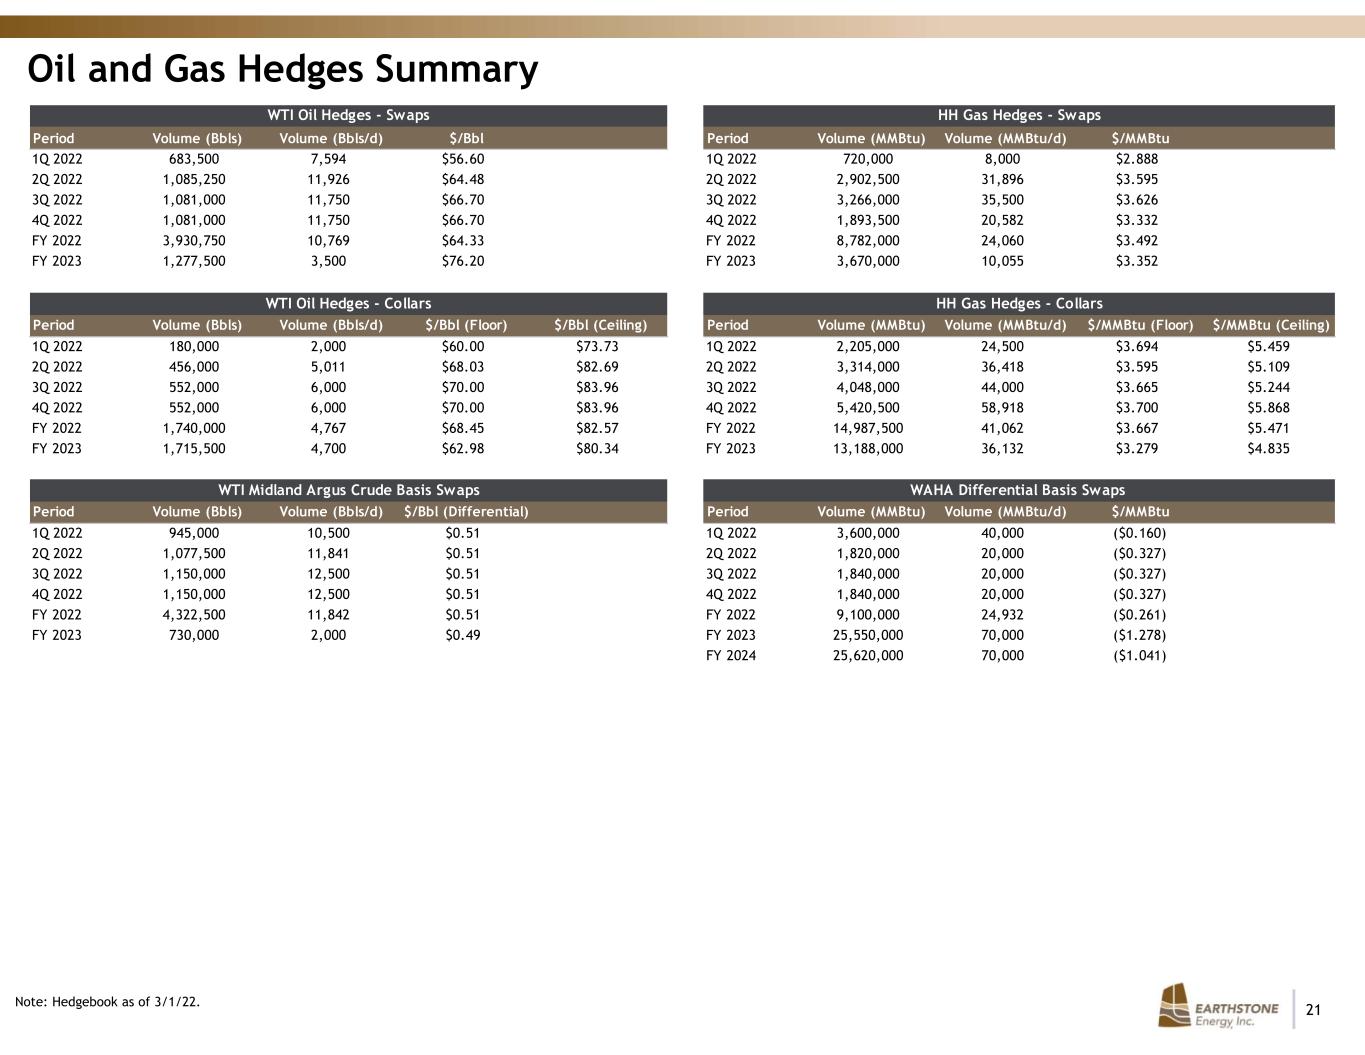
21 WTI Oil Hedges - Swaps HH Gas Hedges - Swaps Period Volume (Bbls) Volume (Bbls/d) $/Bbl Period Volume (MMBtu) Volume (MMBtu/d) $/MMBtu 1Q 2022 683,500 7,594 $56.60 1Q 2022 720,000 8,000 $2.888 2Q 2022 1,085,250 11,926 $64.48 2Q 2022 2,902,500 31,896 $3.595 3Q 2022 1,081,000 11,750 $66.70 3Q 2022 3,266,000 35,500 $3.626 4Q 2022 1,081,000 11,750 $66.70 4Q 2022 1,893,500 20,582 $3.332 FY 2022 3,930,750 10,769 $64.33 FY 2022 8,782,000 24,060 $3.492 FY 2023 1,277,500 3,500 $76.20 FY 2023 3,670,000 10,055 $3.352 WTI Oil Hedges - Collars HH Gas Hedges - Collars Period Volume (Bbls) Volume (Bbls/d) $/Bbl (Floor) $/Bbl (Ceiling) Period Volume (MMBtu) Volume (MMBtu/d) $/MMBtu (Floor) $/MMBtu (Ceiling) 1Q 2022 180,000 2,000 $60.00 $73.73 1Q 2022 2,205,000 24,500 $3.694 $5.459 2Q 2022 456,000 5,011 $68.03 $82.69 2Q 2022 3,314,000 36,418 $3.595 $5.109 3Q 2022 552,000 6,000 $70.00 $83.96 3Q 2022 4,048,000 44,000 $3.665 $5.244 4Q 2022 552,000 6,000 $70.00 $83.96 4Q 2022 5,420,500 58,918 $3.700 $5.868 FY 2022 1,740,000 4,767 $68.45 $82.57 FY 2022 14,987,500 41,062 $3.667 $5.471 FY 2023 1,715,500 4,700 $62.98 $80.34 FY 2023 13,188,000 36,132 $3.279 $4.835 WTI Midland Argus Crude Basis Swaps WAHA Differential Basis Swaps Period Volume (Bbls) Volume (Bbls/d) $/Bbl (Differential) Period Volume (MMBtu) Volume (MMBtu/d) $/MMBtu 1Q 2022 945,000 10,500 $0.51 1Q 2022 3,600,000 40,000 ($0.160) 2Q 2022 1,077,500 11,841 $0.51 2Q 2022 1,820,000 20,000 ($0.327) 3Q 2022 1,150,000 12,500 $0.51 3Q 2022 1,840,000 20,000 ($0.327) 4Q 2022 1,150,000 12,500 $0.51 4Q 2022 1,840,000 20,000 ($0.327) FY 2022 4,322,500 11,842 $0.51 FY 2022 9,100,000 24,932 ($0.261) FY 2023 730,000 2,000 $0.49 FY 2023 25,550,000 70,000 ($1.278) FY 2024 FY 2024 25,620,000 70,000 ($1.041) Oil and Gas Hedges Summary Note: Hedgebook as of 3/1/22.
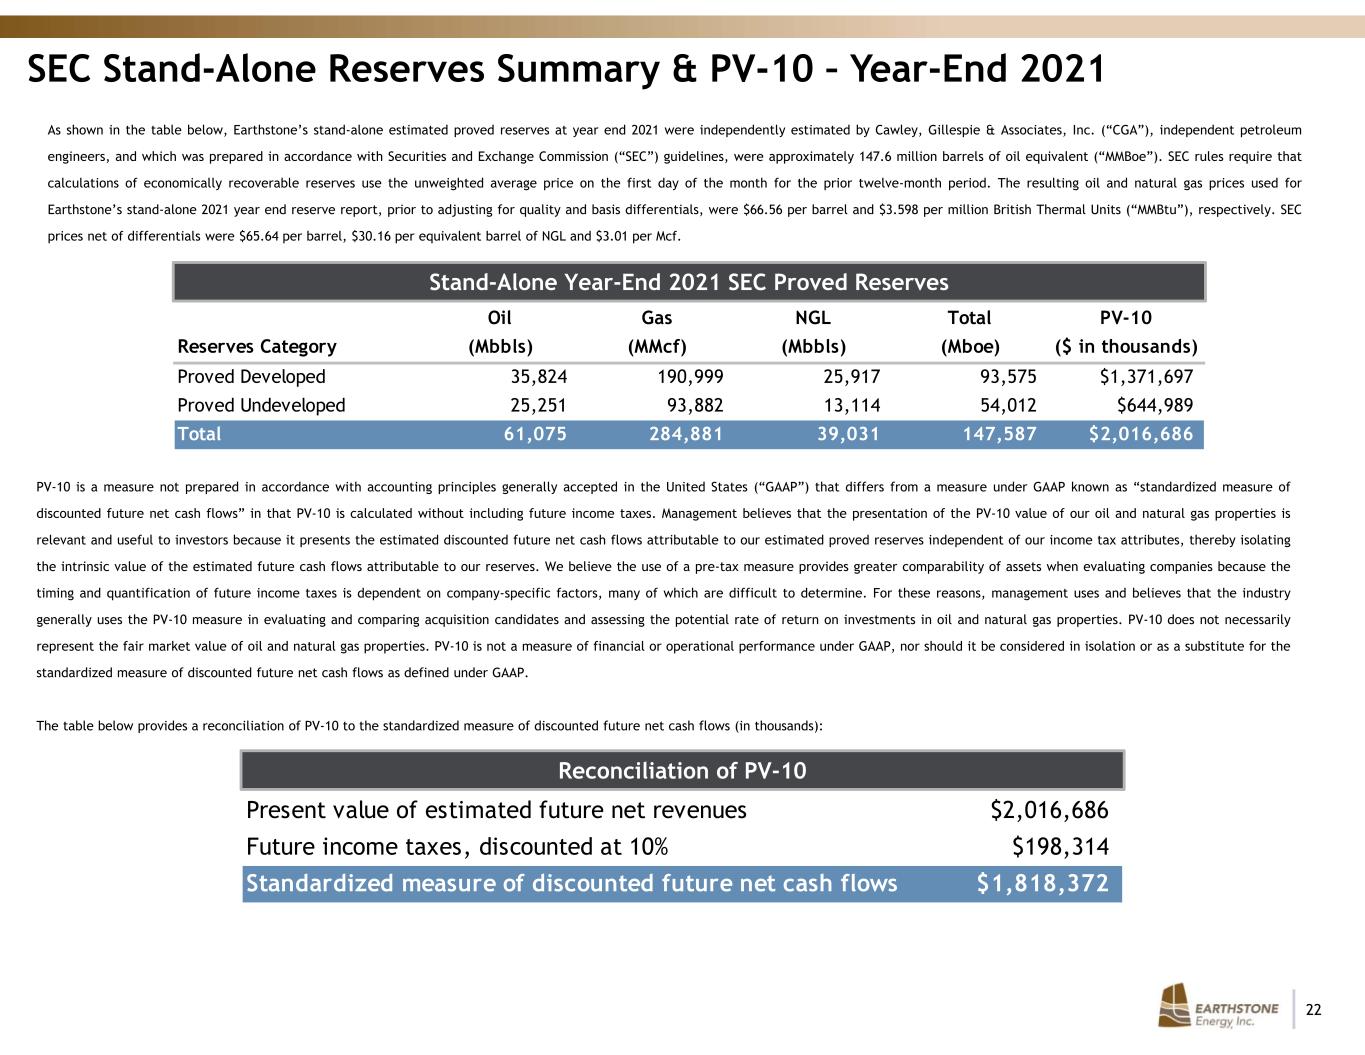
22 SEC Stand-Alone Reserves Summary & PV-10 – Year-End 2021 As shown in the table below, Earthstone’s stand-alone estimated proved reserves at year end 2021 were independently estimated by Cawley, Gillespie & Associates, Inc. (“CGA”), independent petroleum engineers, and which was prepared in accordance with Securities and Exchange Commission (“SEC”) guidelines, were approximately 147.6 million barrels of oil equivalent (“MMBoe”). SEC rules require that calculations of economically recoverable reserves use the unweighted average price on the first day of the month for the prior twelve-month period. The resulting oil and natural gas prices used for Earthstone’s stand-alone 2021 year end reserve report, prior to adjusting for quality and basis differentials, were $66.56 per barrel and $3.598 per million British Thermal Units (“MMBtu”), respectively. SEC prices net of differentials were $65.64 per barrel, $30.16 per equivalent barrel of NGL and $3.01 per Mcf. Stand-Alone Year-End 2021 SEC Proved Reserves PV-10 is a measure not prepared in accordance with accounting principles generally accepted in the United States (“GAAP”) that differs from a measure under GAAP known as “standardized measure of discounted future net cash flows” in that PV-10 is calculated without including future income taxes. Management believes that the presentation of the PV-10 value of our oil and natural gas properties is relevant and useful to investors because it presents the estimated discounted future net cash flows attributable to our estimated proved reserves independent of our income tax attributes, thereby isolating the intrinsic value of the estimated future cash flows attributable to our reserves. We believe the use of a pre-tax measure provides greater comparability of assets when evaluating companies because the timing and quantification of future income taxes is dependent on company-specific factors, many of which are difficult to determine. For these reasons, management uses and believes that the industry generally uses the PV-10 measure in evaluating and comparing acquisition candidates and assessing the potential rate of return on investments in oil and natural gas properties. PV-10 does not necessarily represent the fair market value of oil and natural gas properties. PV-10 is not a measure of financial or operational performance under GAAP, nor should it be considered in isolation or as a substitute for the standardized measure of discounted future net cash flows as defined under GAAP. The table below provides a reconciliation of PV-10 to the standardized measure of discounted future net cash flows (in thousands): Reconciliation of PV-10 Oil Gas NGL Total PV-10 Reserves Category (Mbbls) (MMcf) (Mbbls) (Mboe) ($ in thousands) Proved Developed 35,824 190,999 25,917 93,575 $1,371,697 Proved Undeveloped 25,251 93,882 13,114 54,012 $644,989 Total 61,075 284,881 39,031 147,587 $2,016,686 Present value of estimated future net revenues $2,016,686 Future income taxes, discounted at 10% $198,314 Standardized measure of discounted future net cash flows $1,818,372
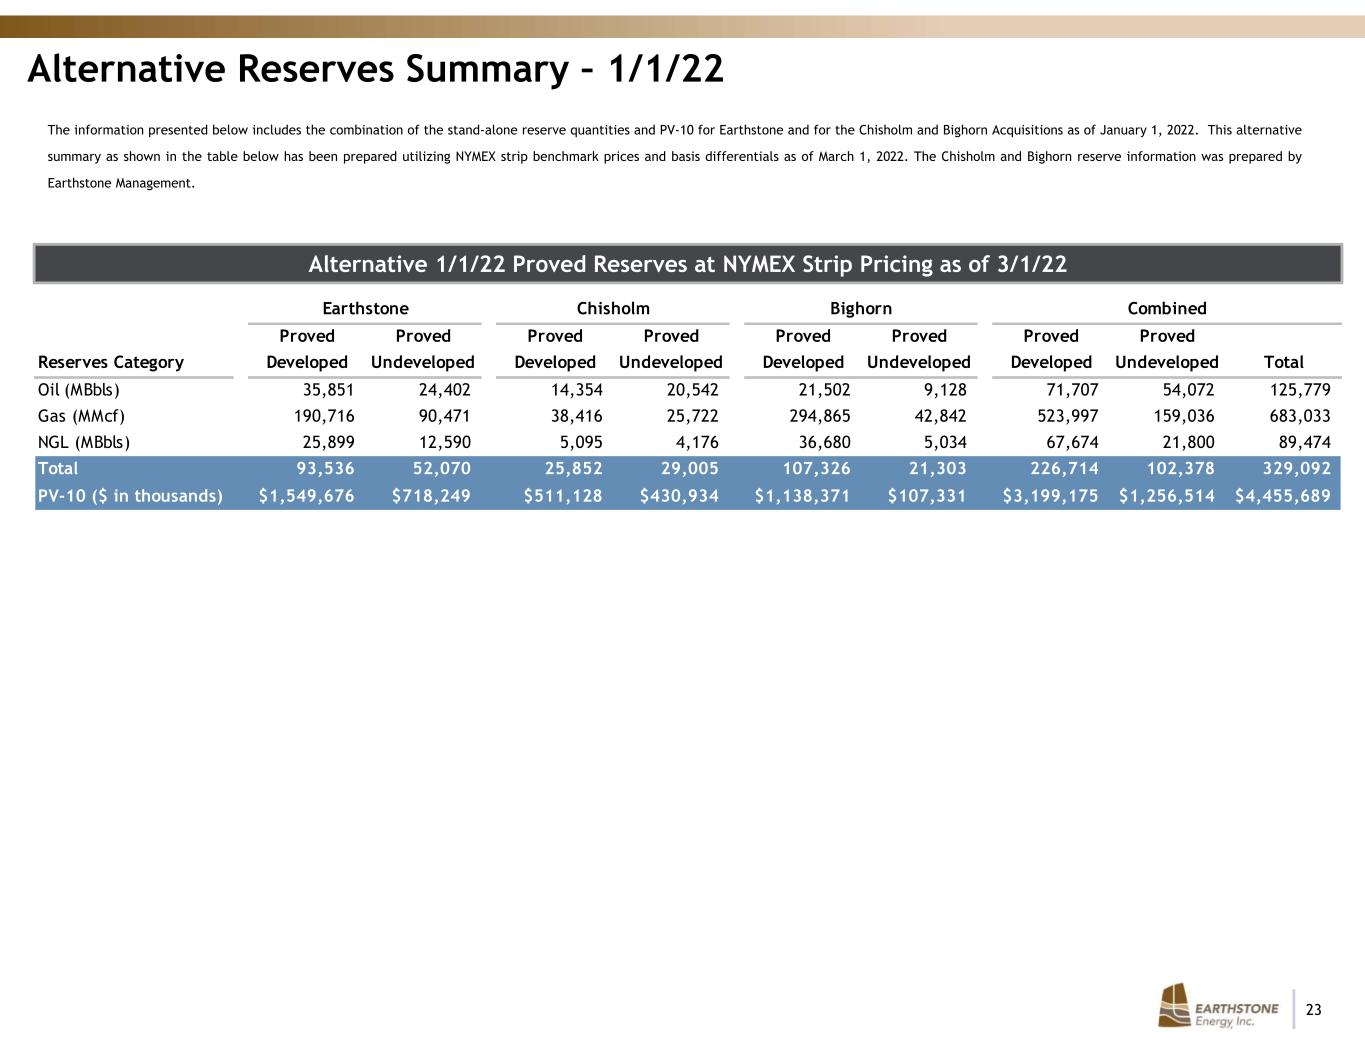
23 Alternative Reserves Summary – 1/1/22 The information presented below includes the combination of the stand-alone reserve quantities and PV-10 for Earthstone and for the Chisholm and Bighorn Acquisitions as of January 1, 2022. This alternative summary as shown in the table below has been prepared utilizing NYMEX strip benchmark prices and basis differentials as of March 1, 2022. The Chisholm and Bighorn reserve information was prepared by Earthstone Management. Alternative 1/1/22 Proved Reserves at NYMEX Strip Pricing as of 3/1/22 Earthstone Chisholm Bighorn Combined Proved Proved Proved Proved Proved Proved Proved Proved Reserves Category Developed Undeveloped Developed Undeveloped Developed Undeveloped Developed Undeveloped Total Oil (MBbls) 35,851 24,402 14,354 20,542 21,502 9,128 71,707 54,072 125,779 Gas (MMcf) 190,716 90,471 38,416 25,722 294,865 42,842 523,997 159,036 683,033 NGL (MBbls) 25,899 12,590 5,095 4,176 36,680 5,034 67,674 21,800 89,474 Total 93,536 52,070 25,852 29,005 107,326 21,303 226,714 102,378 329,092 PV-10 ($ in thousands) $1,549,676 $718,249 $511,128 $430,934 $1,138,371 $107,331 $3,199,175 $1,256,514 $4,455,689

24 Reconciliation of Non-GAAP Financial Measure – Adjusted EBITDAX Earthstone uses Adjusted EBITDAX, a financial measure that is not presented in accordance with GAAP. Adjusted EBITDAX is a supplemental non-GAAP financial measure that is used by Earthstone’s management team and external users of its financial statements, such as industry analysts, investors, lenders and rating agencies. Earthstone’s management team believes Adjusted EBITDAX is useful because it allows Earthstone to more effectively evaluate its operating performance and compare the results of its operations from period to period without regard to its financing methods or capital structure. Earthstone defines Adjusted EBITDAX as net income plus, when applicable, (gain) loss on sale of oil and gas properties, net; accretion of asset retirement obligations; depletion, depreciation and amortization; transaction costs; interest expense, net; exploration expense; unrealized loss (gain) on derivative contracts; stock based compensation; and income tax expense. Earthstone excludes the foregoing items from net income (loss) in arriving at Adjusted EBITDAX because these amounts can vary substantially from company to company within their industry depending upon accounting methods and book values of assets, capital structures and the method by which the assets were acquired. Adjusted EBITDAX should not be considered as an alternative to, or more meaningful than, net income as determined in accordance with GAAP or as an indicator of Earthstone’s operating performance or liquidity. Certain items excluded from Adjusted EBITDAX are significant components in understanding and assessing a company’s financial performance, such as a company’s cost of capital and tax structure, as well as the historic costs of depreciable assets, none of which are components of Adjusted EBITDAX. Earthstone’s computation of Adjusted EBITDAX may not be comparable to other similarly titled measures of other companies or to similar measures in Earthstone’s revolving credit facility. The following table provides a reconciliation of Net income to Adjusted EBITDAX for: (1) Consists of expense for non-cash equity awards and also for cash-based liability awards that are expected to be settled in cash. No cash-based liability awards were settled in cash during 2021. On February 9, 2022, cash-based awards were settled in the amount of $8.1 million. Stock-based compensation is included in General and administrative expense in the Consolidated Statements of Operations. FY 2021 Adjusted EBITDAX ($ in 000s)4Q 2021 Adjusted EBITDAX ($ in 000s) FY21 Net income $61,506 Accretion of asset retirement obligations $1,065 Depreciation, depletion and amortization $106,367 Interest expense, net $10,796 Transaction costs $4,875 Loss (gain) on sale of oil and gas properties ($738) Exploration expense $341 Unrealized loss (gain) on derivative contracts $40,795 Stock based compensation(1) $21,014 Income tax expense $1,859 Adjusted EBITDAX $247,880 4Q21 Net income $69,055 Accretion of asset retirement obligations $149 Depreciation, depletion and amortization $28,874 Interest expense, net $3,128 Transaction costs $1,969 Loss (gain) on sale of oil and gas properties $2 Exploration expense $15 Unrealized loss (gain) on derivative contracts ($30,460) Stock based compensation(1) $10,393 Income tax expense $2,202 Adjusted EBITDAX $85,327
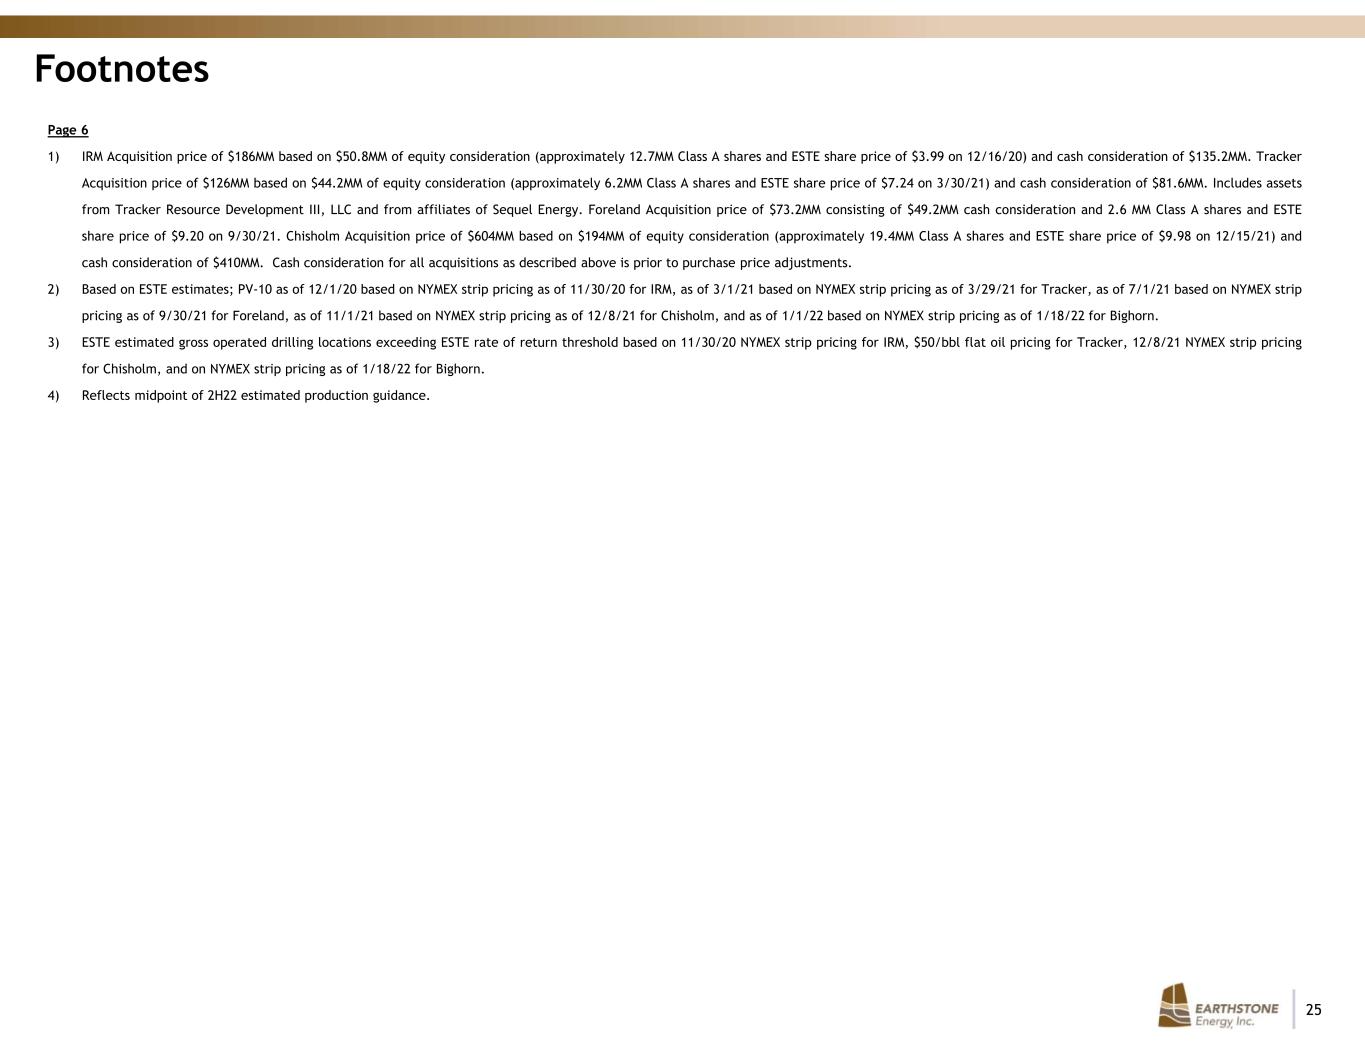
25 Footnotes Page 6 1) IRM Acquisition price of $186MM based on $50.8MM of equity consideration (approximately 12.7MM Class A shares and ESTE share price of $3.99 on 12/16/20) and cash consideration of $135.2MM. Tracker Acquisition price of $126MM based on $44.2MM of equity consideration (approximately 6.2MM Class A shares and ESTE share price of $7.24 on 3/30/21) and cash consideration of $81.6MM. Includes assets from Tracker Resource Development III, LLC and from affiliates of Sequel Energy. Foreland Acquisition price of $73.2MM consisting of $49.2MM cash consideration and 2.6 MM Class A shares and ESTE share price of $9.20 on 9/30/21. Chisholm Acquisition price of $604MM based on $194MM of equity consideration (approximately 19.4MM Class A shares and ESTE share price of $9.98 on 12/15/21) and cash consideration of $410MM. Cash consideration for all acquisitions as described above is prior to purchase price adjustments. 2) Based on ESTE estimates; PV-10 as of 12/1/20 based on NYMEX strip pricing as of 11/30/20 for IRM, as of 3/1/21 based on NYMEX strip pricing as of 3/29/21 for Tracker, as of 7/1/21 based on NYMEX strip pricing as of 9/30/21 for Foreland, as of 11/1/21 based on NYMEX strip pricing as of 12/8/21 for Chisholm, and as of 1/1/22 based on NYMEX strip pricing as of 1/18/22 for Bighorn. 3) ESTE estimated gross operated drilling locations exceeding ESTE rate of return threshold based on 11/30/20 NYMEX strip pricing for IRM, $50/bbl flat oil pricing for Tracker, 12/8/21 NYMEX strip pricing for Chisholm, and on NYMEX strip pricing as of 1/18/22 for Bighorn. 4) Reflects midpoint of 2H22 estimated production guidance.


