Some of the information in this report contains “forward-looking statements” within the meaning of and are intended to be covered by the safe harbor provisions of the Private Securities Litigation Reform Act of 1995. Forward-looking statements typically are identified with use of terms such as “may,” “might,” “will,” “should,” “expect,” “plan,” “anticipate,” “believe,” “estimate,” “predict,” “potential,” “could,” “continue” and the negative of these terms and similar words, although some forward-looking statements are expressed differently. Our ability to predict results or the actual effect of future plans or strategies is inherently uncertain. You should be aware that our actual results could differ materially from those contained in the forward-looking statements due to a number of factors, including, but not limited to: credit risk; changes in the appraised valuation of real estate securing impaired loans; outcomes of litigation and other contingencies; exposure to general and local economic conditions; risks associated with rapid increases or decreases in prevailing interest rates; consolidation within the banking industry; competition from banks and other financial institutions; our ability to attract and retain relationship officers and other key personnel; burdens imposed by federal and state regulation; changes in regulatory requirements; changes in accounting regulation or standards applicable to banks; and other risks discussed under the caption “Risk Factors” of our most recently filed Form 10-K and in Part II, 1A of our most recently filed Form 10-Q, all of which could cause the Company’s actual results to differ from those set forth in the forward-looking statements. Readers are cautioned not to place undue reliance on our forward-looking statements, which reflect management’s analysis and expectations only as of the date of such statements. Forward-looking statements speak only as of the date they are made, and the Company does not intend, and undertakes no obligation, to publicly revise or update forward-looking statements after the date of this report, whether as a result of new information, future events or otherwise, except as required by federal securities law. You should understand that it is not possible to predict or identify all risk factors. Readers should carefully review all disclosures we file from time to time with the Securities and Exchange Commission which are available on our website at www.enterprisebank.com. Forward-Looking Statement 1
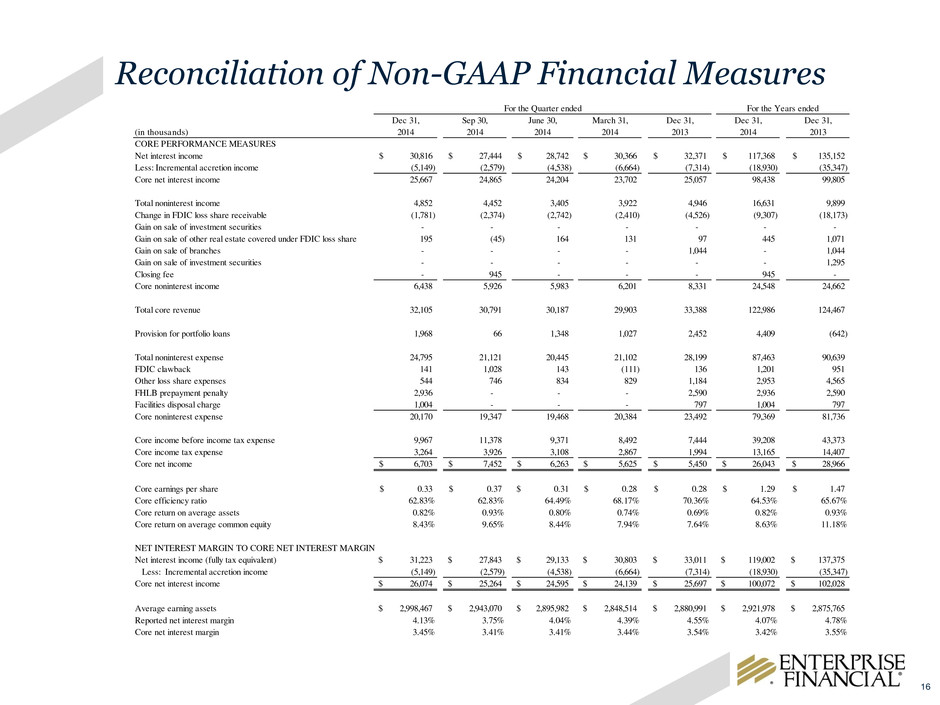
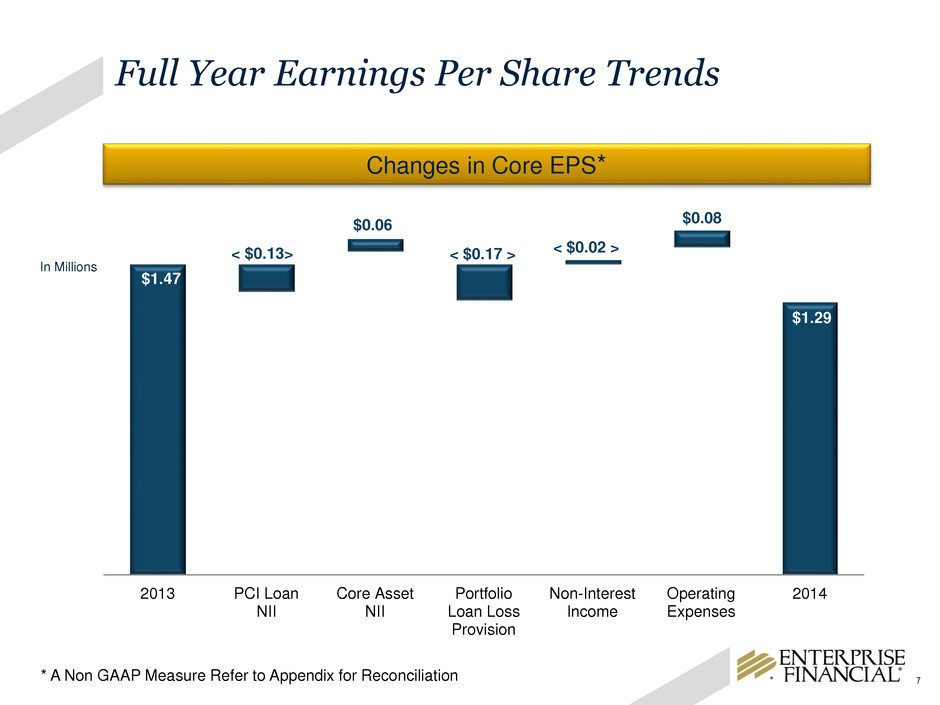
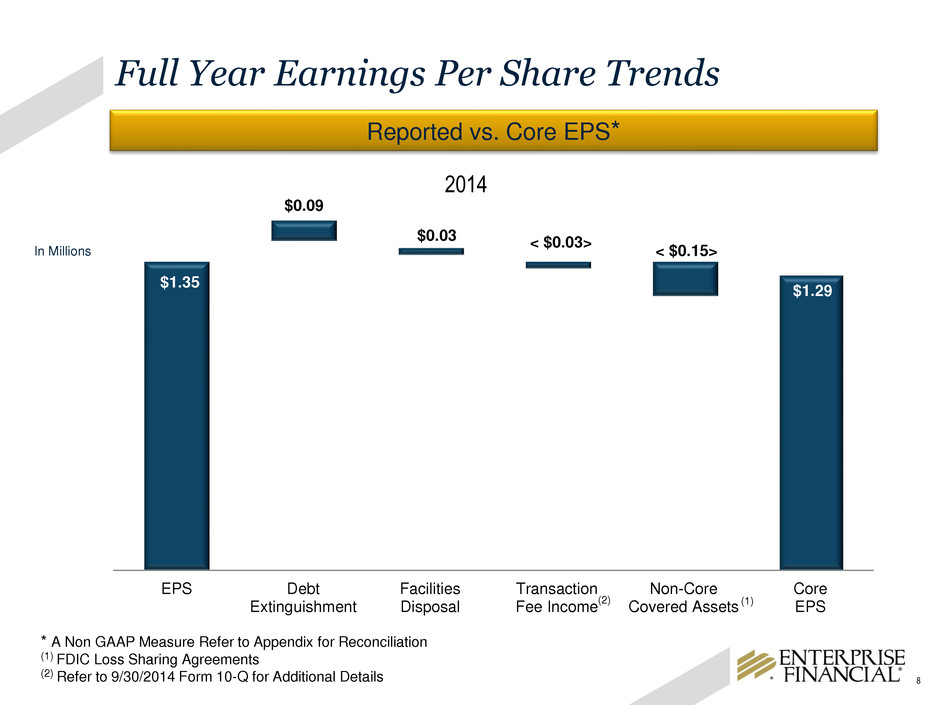
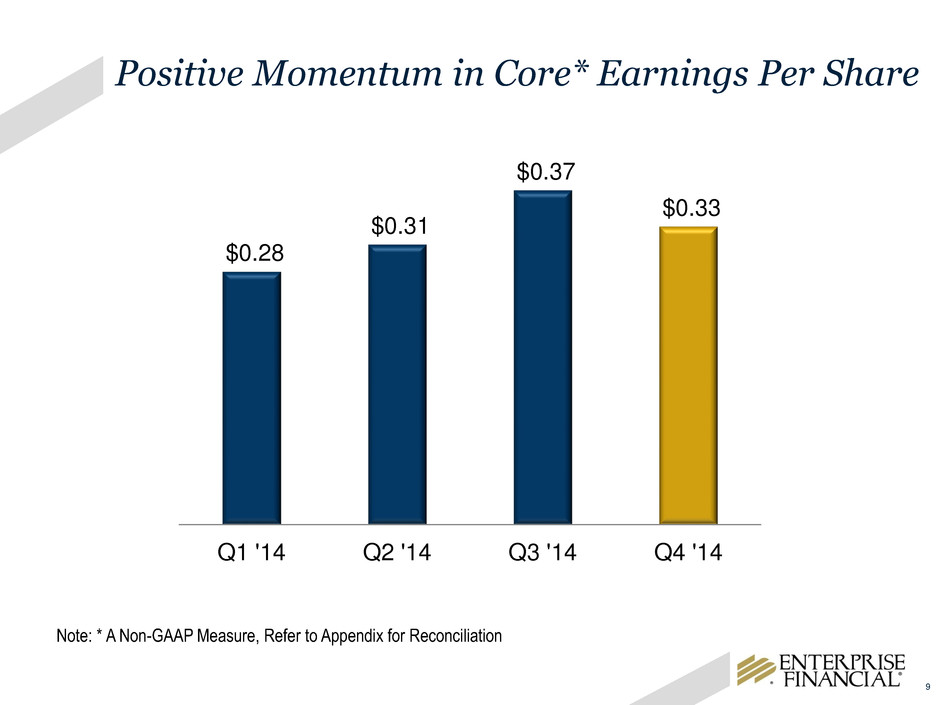
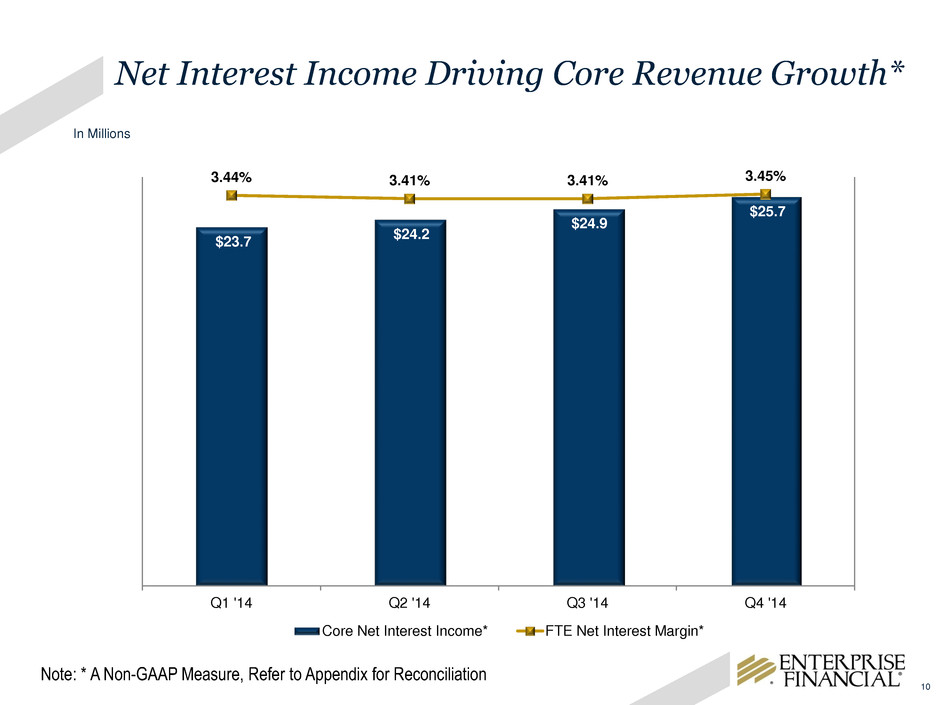
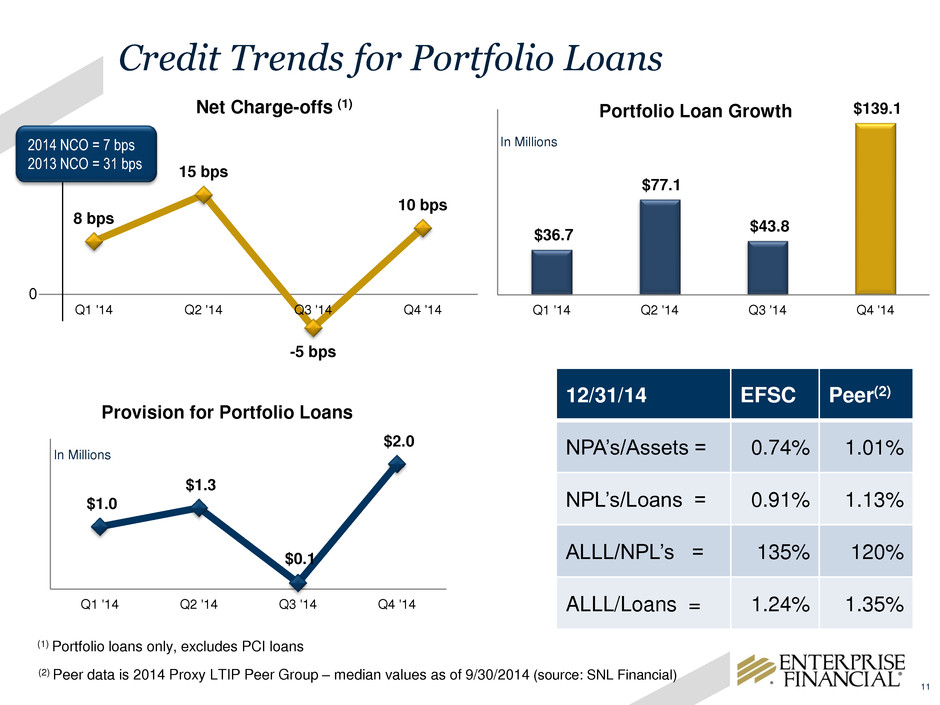
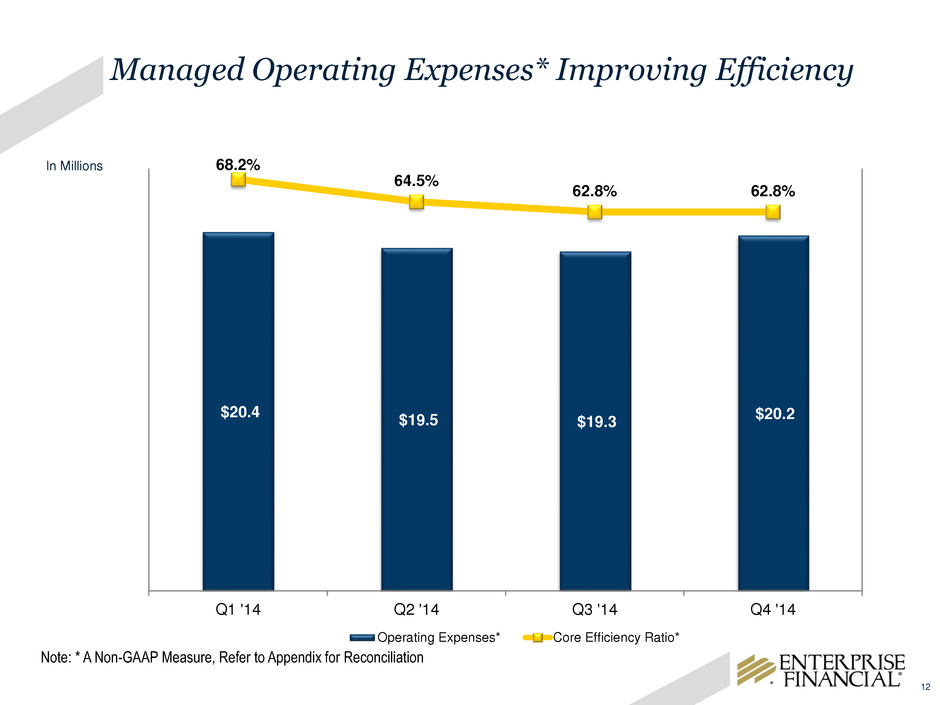
Reconciliation of Non-GAAP Financial Measures 16 Dec 31, Sep 30, June 30, March 31, Dec 31, Dec 31, Dec 31, (in thousands) 2014 2014 2014 2014 2013 2014 2013 CORE PERFORMANCE MEASURES Net interest income 30,816$ 27,444$ 28,742$ 30,366$ 32,371$ 117,368$ 135,152$ Less: Incremental accretion income (5,149) (2,579) (4,538) (6,664) (7,314) (18,930) (35,347) Core net interest income 25,667 24,865 24,204 23,702 25,057 98,438 99,805 Total noninterest income 4,852 4,452 3,405 3,922 4,946 16,631 9,899 Change in FDIC loss share receivable (1,781) (2,374) (2,742) (2,410) (4,526) (9,307) (18,173) Gain on sale of investment securities - - - - - - - Gain on sale of other real estate covered under FDIC loss share 195 (45) 164 131 97 445 1,071 Gain on sale of branches - - - - 1,044 - 1,044 Gain on sale of investment securities - - - - - - 1,295 Closing fee - 945 - - - 945 - Core noninterest income 6,438 5,926 5,983 6,201 8,331 24,548 24,662 Total core revenue 32,105 30,791 30,187 29,903 33,388 122,986 124,467 Provision for portfolio loans 1,968 66 1,348 1,027 2,452 4,409 (642) Total noninterest expense 24,795 21,121 20,445 21,102 28,199 87,463 90,639 FDIC clawback 141 1,028 143 (111) 136 1,201 951 Other loss share expenses 544 746 834 829 1,184 2,953 4,565 FHLB prepayment penalty 2,936 - - - 2,590 2,936 2,590 Facilities disposal charge 1,004 - - - 797 1,004 797 Core noninterest expense 20,170 19,347 19,468 20,384 23,492 79,369 81,736 Core income before income tax expense 9,967 11,378 9,371 8,492 7,444 39,208 43,373 Core income tax expense 3,264 3,926 3,108 2,867 1,994 13,165 14,407 Core net income 6,703$ 7,452$ 6,263$ 5,625$ 5,450$ 26,043$ 28,966$ Core earnings per share 0.33$ 0.37$ 0.31$ 0.28$ 0.28$ 1.29$ 1.47$ Core efficiency ratio 62.83% 62.83% 64.49% 68.17% 70.36% 64.53% 65.67% Core return on average assets 0.82% 0.93% 0.80% 0.74% 0.69% 0.82% 0.93% Core return on average common equity 8.43% 9.65% 8.44% 7.94% 7.64% 8.63% 11.18% NET INTEREST MARGIN TO CORE NET INTEREST MARGIN Net interest income (fully tax equivalent) 31,223$ 27,843$ 29,133$ 30,803$ 33,011$ 119,002$ 137,375$ Less: Incremental accretion income (5,149) (2,579) (4,538) (6,664) (7,314) (18,930) (35,347) Core net interest income 26,074$ 25,264$ 24,595$ 24,139$ 25,697$ 100,072$ 102,028$ Average earning assets 2,998,467$ 2,943,070$ 2,895,982$ 2,848,514$ 2,880,991$ 2,921,978$ 2,875,765$ Reported net interest margin 4.13% 3.75% 4.04% 4.39% 4.55% 4.07% 4.78% Core net interest margin 3.45% 3.41% 3.41% 3.44% 3.54% 3.42% 3.55% For the Quarter ended For the Years ended
