Enterprise Financial Services Corp 2015 SECOND QUARTER EARNINGS RELEASE

1 Some of the information in this report contains “forward-looking statements” within the meaning of and are intended to be covered by the safe harbor provisions of the Private Securities Litigation Reform Act of 1995. Forward-looking statements typically are identified with use of terms such as “may,” “might,” “will,” “should,” “expect,” “plan,” “anticipate,” “believe,” “estimate,” “predict,” “potential,” “could,” “continue” and the negative of these terms and similar words, although some forward- looking statements are expressed differently. Our ability to predict results or the actual effect of future plans or strategies is inherently uncertain. You should be aware that our actual results could differ materially from those contained in the forward- looking statements due to a number of factors, including, but not limited to: credit risk; changes in the appraised valuation of real estate securing impaired loans; outcomes of litigation and other contingencies; exposure to general and local economic conditions; risks associated with rapid increases or decreases in prevailing interest rates; consolidation within the banking industry; competition from banks and other financial institutions; our ability to attract and retain relationship officers and other key personnel; burdens imposed by federal and state regulation; changes in regulatory requirements; changes in accounting regulation or standards applicable to banks; and other risks discussed under the caption “Risk Factors” of our most recently filed Form 10-K and in Part II, 1A of our most recently filed Form 10-Q, all of which could cause the Company’s actual results to differ from those set forth in the forward-looking statements. Readers are cautioned not to place undue reliance on our forward-looking statements, which reflect management’s analysis and expectations only as of the date of such statements. Forward-looking statements speak only as of the date they are made, and the Company does not intend, and undertakes no obligation, to publicly revise or update forward-looking statements after the date of this report, whether as a result of new information, future events or otherwise, except as required by federal securities law. You should understand that it is not possible to predict or identify all risk factors. Readers should carefully review all disclosures we file from time to time with the Securities and Exchange Commission which are available on our website at www.enterprisebank.com. FORWARD-LOOKING STATEMENT

2 GROW CORE EPS DRIVE QUALITY LOAN GROWTH ENHANCE CORE NET INTEREST INCOME DEFEND CORE NET INTEREST MARGIN MAINTAIN HIGH CREDIT QUALITY METRICS IMPROVE OPERATING LEVERAGE 2015 OBJECTIVES

3 PORTFOLIO LOAN TRENDS $2,251 $2,295 $2,434 $2,436 $2,543 6/30/2014 9/30/2014 12/31/2014 3/31/2015 6/30/2015 In Millions

4 $1,135 $1,172 $1,270 $1,265 $1,335 6/30/2014 9/30/2014 12/31/2014 3/31/2015 6/30/2015 COMMERCIAL & INDUSTRIAL LOAN TRENDS In Millions

5 PORTFOLIO LOAN TRENDS 6/30/15 3/31/15 CHANGE ENTERPRISE VALUE LENDING $ 251 $ 204 $ 47 C&I GENERAL 712 696 16 LIFE INSURANCE PREMIUM FINANCING 239 230 9 TAX CREDIT 133 136 (3) COMMERCIAL/CRE 940 920 20 RESIDENTIAL 186 180 6 OTHER 82 70 12 PORTFOLIO LOANS $ 2,543 $ 2,436 $ 107 In Millions

6 PORTFOLIO LOANS BY REGION $1,760 $633 $150 St. Louis Kansas City Arizona 06/30/2015 $1,723 $574 $139 St. Louis Kansas City Arizona 3/31/2015 In Millions In Millions

7 DEPOSIT TRENDS $2,465 $2,510 $2,492 $2,675 $2,692 27.4% 27.7% 25.8% 25.5% 24.5% -30.0% -5.0% 20.0% Q2 '14 Q3 '14 Q4 '14 Q1 '15 Q2 '15 Deposits DDA %

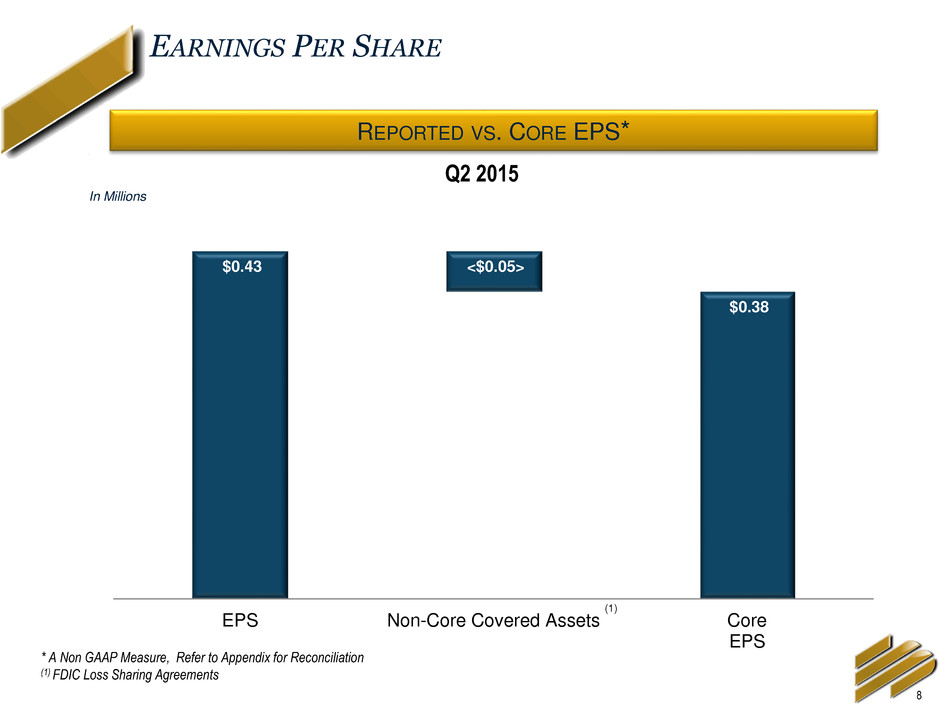
8 EARNINGS PER SHARE $22,387 $0.43 <$0.05> $0.38 EPS Non-Core Covered Assets Core EPS In Millions * A Non GAAP Measure, Refer to Appendix for Reconciliation (1) FDIC Loss Sharing Agreements REPORTED VS. CORE EPS* Q2 2015 (1)

9 EARNINGS PER SHARE TREND $0.35 $0.02 < $0.02> $0.03 $0.38 Q1 '15 Net Interest Income Portfolio Loan Loss Provision Non Interest Income Q2 '15 In Millions CHANGES IN CORE EPS* Note: * A Non GAAP Measure, Refer to Appendix for Reconciliation

10 NET INTEREST INCOME DRIVING CORE REVENUE GROWTH* In Millions Note: * A Non-GAAP Measure, Refer to Appendix for Reconciliation $24.2 $24.9 $25.7 $25.6 $26.3 3.41% 3.41% 3.45% 3.46% 3.46% 0.00% 0.50% 1.00% 1.50% 2.00% 2.50% 3.00% 3.50% $18.0 $19.0 $20.0 $21.0 $22.0 $23.0 $24.0 $25.0 $26.0 $27.0 Q2 '14 Q3 '14 Q4 '14 Q1 '15 Q2 '15 Core Net Interest Income* FTE Net Interest Margin*

11 CREDIT TRENDS FOR PORTFOLIO LOANS 15 bps -5 bps 10 bps 25 bps 11 bps Q2 '14 Q3 '14 Q4 '14 Q1 '15 Q2 '15 0 Net Charge-offs (1) 2014 NCO = 7 bps (1) Portfolio loans only, excludes PCI loans $77.1 $43.8 $139.0 $1.6 $107.0 0 50 100 150 Q2 '14 Q3 '14 Q4 '14 Q1 '15 Q2 '15 Portfolio Loan Growth $1.3 $0.1 $2.0 $1.6 $2.2 $- $0.6 $1.2 $1.8 $2.4 Q2 '14 Q3 '14 Q4 '14 Q1 '15 Q2 '15 Provision for Portfolio Loans Q2 2015 EFSC PEER(2) NPA’S/ASSETS = 0.58% 0.82% NPL’S/LOANS = 0.69% 0.87% ALLL/NPL’S = 182% 139% ALLL/LOANS = 1.25% 1.30% (2) Peer data as of 3/31/2015 (source: SNL Financial) In Millions In Millions

12 CORE NON-INTEREST INCOME* WM REVENUE WM REVENUE DEPOSIT SERVICE CHARGES DEPOSIT SERVICE CHARGES GAIN ON SALE OF ORE STATE TAX CREDITS STATE TAX CREDITS OTHER INCOME OTHER INCOME Q1 2015 Q2 2015 $5,839 $6,741 RECONCILIATION OF OTHER NON-INTEREST INCOME Q1 2015 $1,534 ALLOCATION FEE FROM TAX CREDITS 642 SWAP FEE INCOME 137 OTHER FEES 201 CARD INCOME 77 MORTGAGES 178 MISCELLANEOUS 123 OTHER NONINTEREST INCOME – Q2 ‘15 $2,892 Note: * A Non-GAAP Measure, Refer to Appendix for Reconciliation $ thousands

13 MANAGED OPERATING EXPENSES* IMPROVING EFFICIENCY In Millions Note: * A Non-GAAP Measure, Refer to Appendix for Reconciliation $19.5 $19.3 $20.2 $19.1 $19.0 64.5% 62.8% 62.8% 60.7% 57.6% 0.0% 10.0% 20.0% 30.0% 40.0% 50.0% 60.0% 70.0% -20 -5 10 25 Q2 '14 Q3 '14 Q4 '14 Q1 '15 Q2 '15 Operating Expenses* Core Efficiency Ratio*

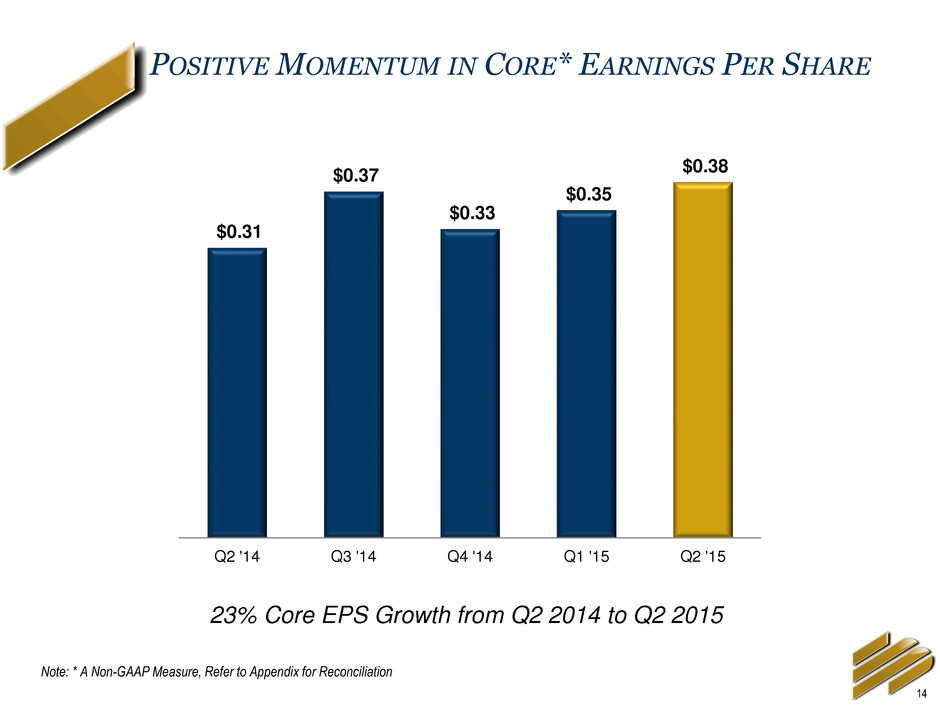
14 POSITIVE MOMENTUM IN CORE* EARNINGS PER SHARE $0.31 $0.37 $0.33 $0.35 $0.38 Q2 '14 Q3 '14 Q4 '14 Q1 '15 Q2 '15 Note: * A Non-GAAP Measure, Refer to Appendix for Reconciliation 23% Core EPS Growth from Q2 2014 to Q2 2015

15 CONTINUED GROWTH IN CORE EPS DRIVE NET INTEREST INCOME GROWTH IN DOLLARS WITH FAVORABLE LOAN GROWTH TRENDS DEFEND NET INTEREST MARGIN MAINTAIN HIGH QUALITY CREDIT PROFILE ACHIEVE FURTHER IMPROVEMENT IN OPERATING LEVERAGE ENHANCE DEPOSIT LEVELS TO SUPPORT GROWTH FINANCIAL PRIORITIES Q2 2015 Compared to Q2 2014 23% 9% 5 bps 0.17% NPLs/Loans 7% 9%

Appendix

17 USE OF NON-GAAP FINANCIAL MEASURES The Company's accounting and reporting policies conform to generally accepted accounting principles in the United States (“GAAP”) and the prevailing practices in the banking industry. However, the Company provides other financial measures, such as Core net income margin and other Core performance measures, in this presentation that are considered “non-GAAP financial measures.” Generally, a non-GAAP financial measure is a numerical measure of a company's financial performance, financial position or cash flows that exclude (or include) amounts that are included in (or excluded from) the most directly comparable measure calculated and presented in accordance with GAAP. The Company considers its Core performance measures presented in presentation as important measures of financial performance, even though they are non-GAAP measures, as they provide supplemental information by which to evaluate the impact of PCI loans and related income and expenses, the impact of nonrecurring items, and the Company's operating performance on an ongoing basis. Core performance measures include contractual interest on PCI loans but exclude incremental accretion on these loans. Core performance measures also exclude the Change in FDIC receivable, Gain or loss of other real estate covered under FDIC loss share agreements and expenses directly related to the PCI loans and other assets covered under FDIC loss share agreements. Core performance measures also exclude certain other income and expense items the Company believes to be not indicative of or useful to measure the Company's operating performance on an ongoing basis. The attached tables contain a reconciliation of these Core performance measures to the GAAP measures. The Company believes these non-GAAP measures and ratios, when taken together with the corresponding GAAP measures and ratios, provide meaningful supplemental information regarding the Company's performance and capital strength. The Company's management uses, and believes that investors benefit from referring to, these non-GAAP measures and ratios in assessing the Company's operating results and related trends and when forecasting future periods. However, these non-GAAP measures and ratios should be considered in addition to, and not as a substitute for or preferable to, ratios prepared in accordance with GAAP. In the tables below, the Company has provided a reconciliation of, where applicable, the most comparable GAAP financial measures and ratios to the non-GAAP financial measures and ratios, or a reconciliation of the non-GAAP calculation of the financial measure for the periods indicated. Peer group data consists of banks with total assets from $1-$10 billion with commercial loans greater than 20% and consumer loans less than 20%.

18 RECONCILIATION OF NON-GAAP FINANCIAL MEASURES Jun 30, Mar 31, Dec 31, Sep 30, Jun 30, Jun 30, Jun 30, (in thousands) 2015 2015 2014 2014 2014 2015 2014 CORE PERFORMANCE MEASURES Net interest income 29,280$ 29,045$ 30,816$ 27,444$ 28,742$ 58,325$ 59,108$ Less: Incremental accretion income 3,003 3,458 5,149 2,579 4,538 6,461 11,202 Core net interest income 26,277 25,587 25,667 24,865 24,204 51,864 47,906 Total noninterest income 5,806 3,583 4,852 4,452 3,405 9,389 7,327 Less: Change in FDIC loss share receivable (945) (2,264) (1,781) (2,374) (2,742) (3,209) (5,152) Less (Plus): Gain (loss) on sale of other real estate covered under FDIC loss share 10 (15) 195 (45) 164 (5) 295 Less: Gain on sale of investment securities - 23 - - - 23 - Less: Closing fee - - - 945 - - - Core noninterest income 6,741 5,839 6,438 5,926 5,983 12,580 12,184 Total core revenue 33,018 31,426 32,105 30,791 30,187 64,444 60,090 Provision for portfolio loans 2,150 1,580 1,968 66 1,348 3,730 2,375 Total noninterest expense 19,458 19,950 24,795 21,121 20,445 39,408 41,547 Less: FDIC clawback 50 412 141 1,028 143 462 32 Less: Other loss share expenses 378 470 544 746 834 848 1,663 Less: FHLB prepayment penalty - - 2,936 - - - - Less: Facilities disposal charge - - 1,004 - - - - Core noninterest expense 19,030 19,068 20,170 19,347 19,468 38,098 39,852 Core income before income tax expense 11,838 10,778 9,967 11,378 9,371 22,616 17,863 Core income tax expense 4,134 3,647 3,264 3,926 3,108 7,781 5,975 Core net income 7,704$ 7,131$ 6,703$ 7,452$ 6,263$ 14,835$ 11,888$ Core earnings per share 0.38$ 0.35$ 0.33$ 0.37$ 0.31$ 0.74$ 0.60$ Core return on average assets 0.93% 0.88% 0.82% 0.93% 0.80% 0.91% 0.77% Core return on average common equity 9.34% 8.99% 8.43% 9.65% 8.44% 9.17% 8.20% Core return on average tangible common equity 10.41% 10.06% 9.47% 10.89% 9.57% 10.24% 9.33% Core efficiency ratio 57.64% 60.67% 62.83% 62.83% 64.49% 59.12% 66.32% NET INTEREST MARGIN TO CORE NET INTEREST MARGIN Net interest income (fully tax equivalent) 29,691$ 29,467$ 31,223$ 27,843$ 29,133$ 59,158$ 59,936$ Less: Incremental accretion income 3,003 3,458 5,149 2,579 4,538 6,461 11,202 Core net interest income (fully tax equivalent) 26,688$ 26,009$ 26,074$ 25,264$ 24,595$ 52,697$ 48,734$ Average earning assets 3,096,294$ 3,047,815$ 2,998,467$ 2,943,070$ 2,895,982$ 3,072,188$ 2,872,380$ Reported net interest margin (fully tax equivalent) 3.85% 3.92% 4.13% 3.75% 4.04% 3.88% 4.21% Core net interest margin (fully tax equivalent) 3.46% 3.46% 3.45% 3.41% 3.41% 3.46% 3.42% For the Quarter ended For the Six Months ended


