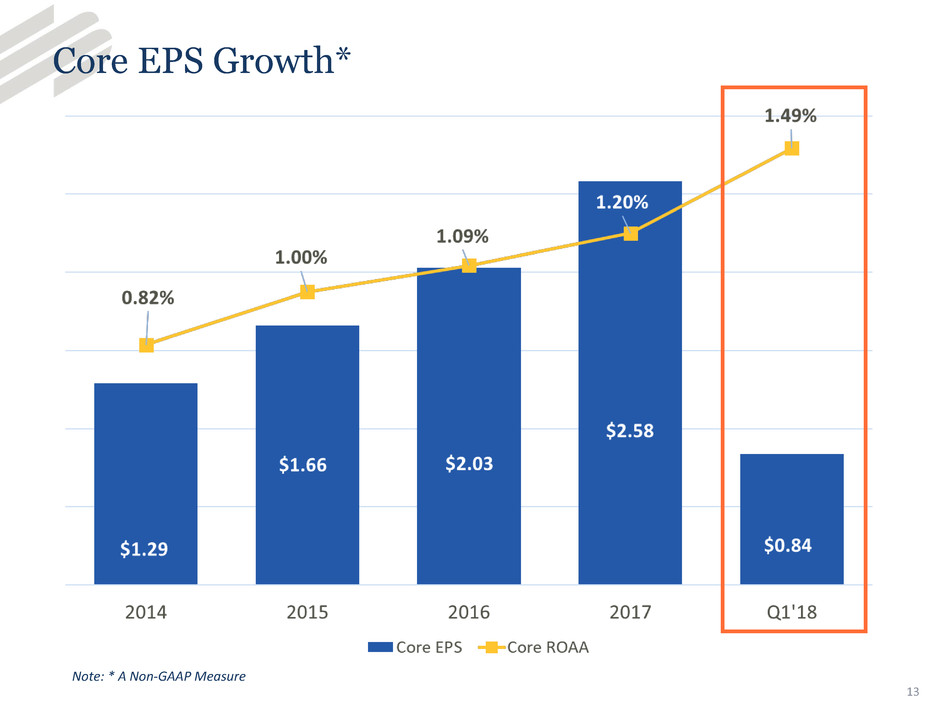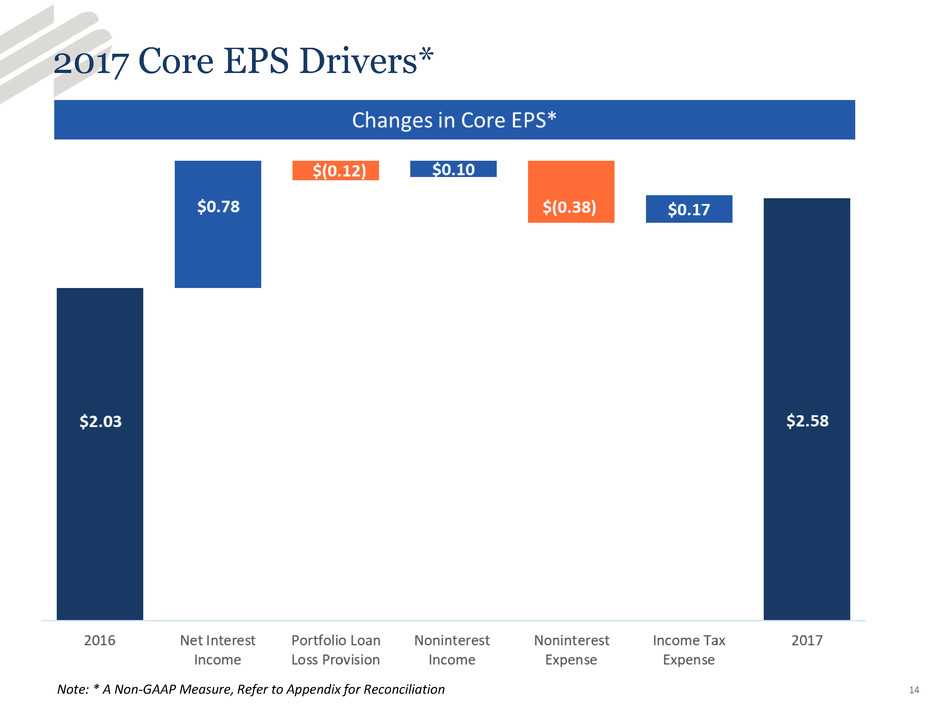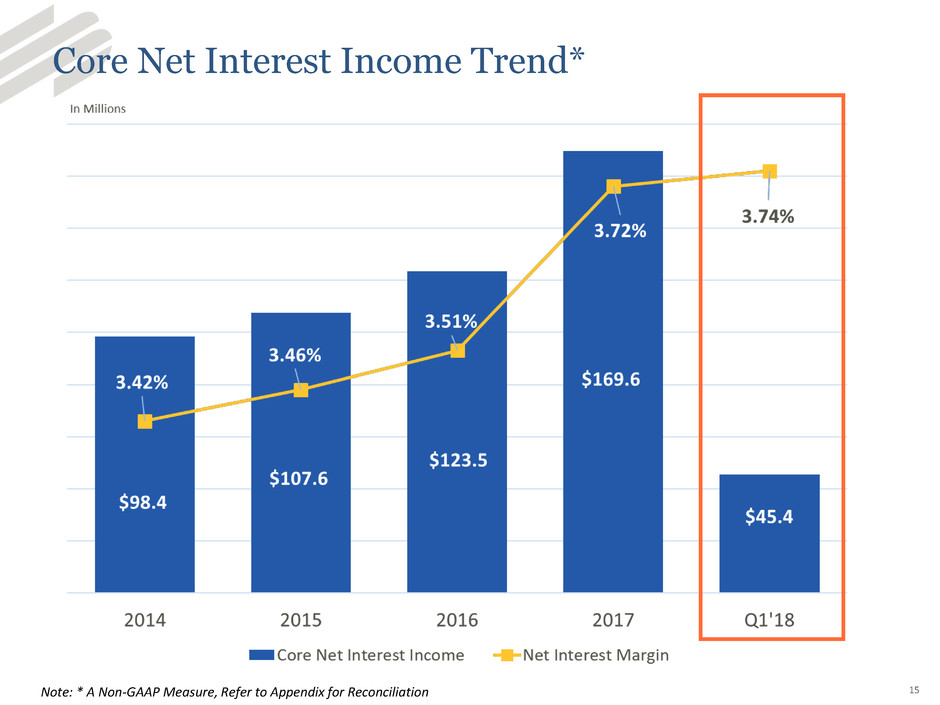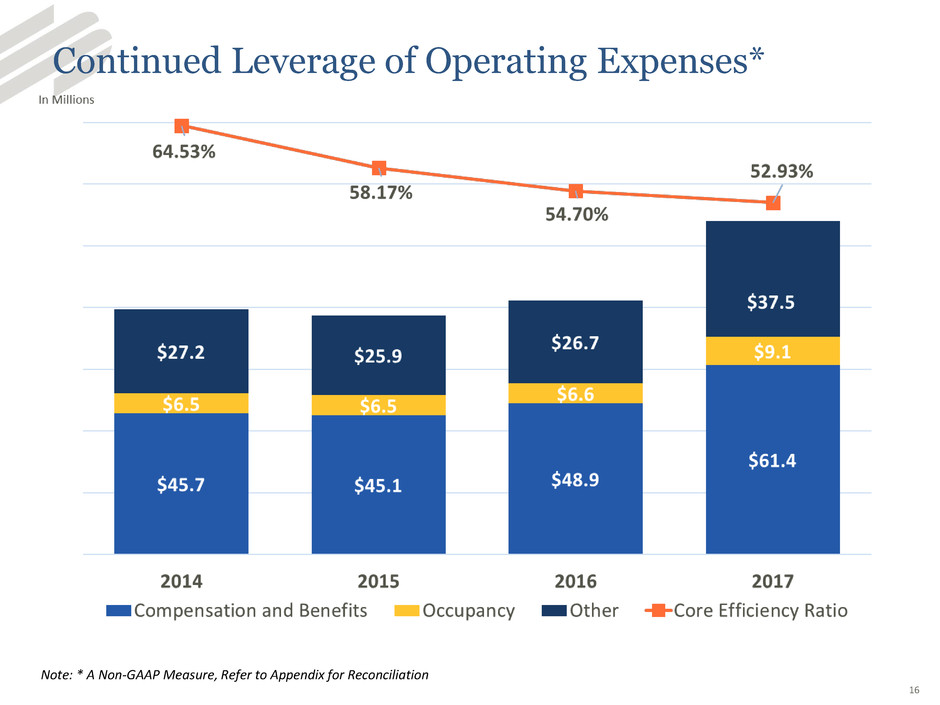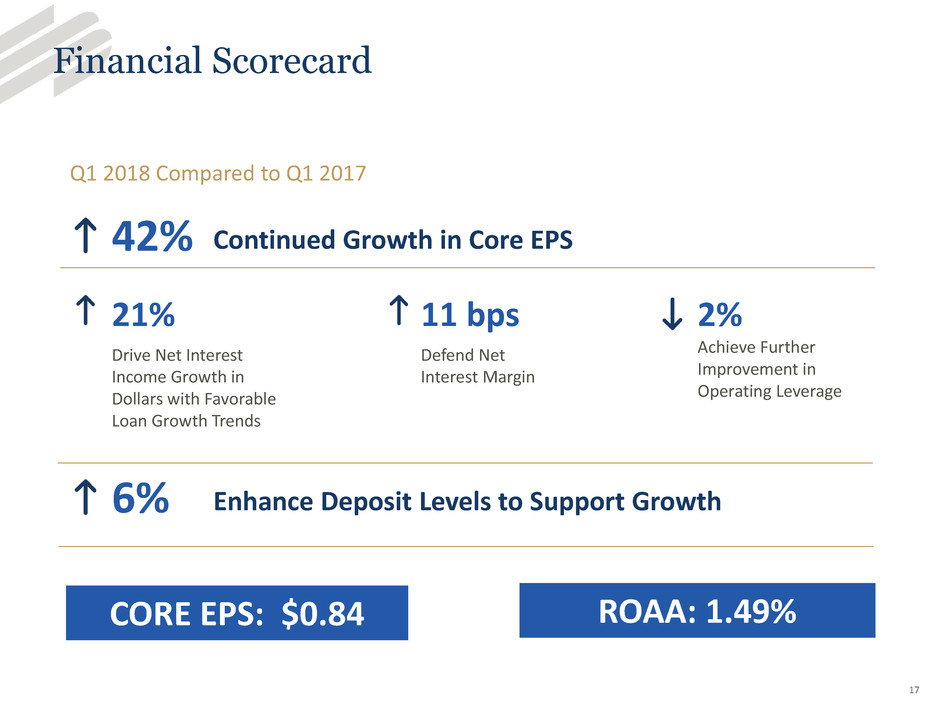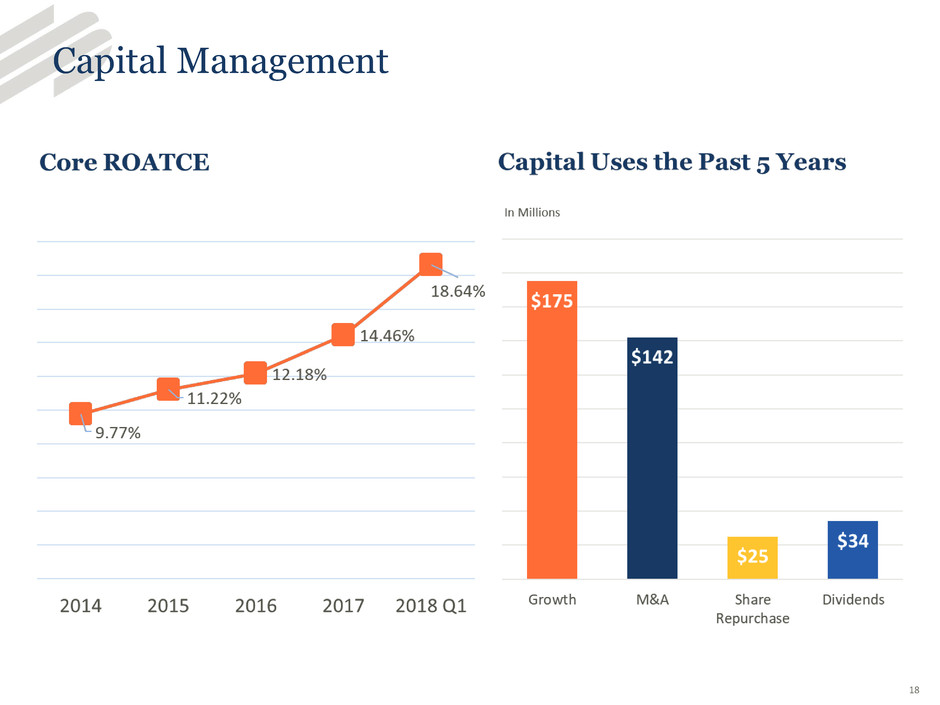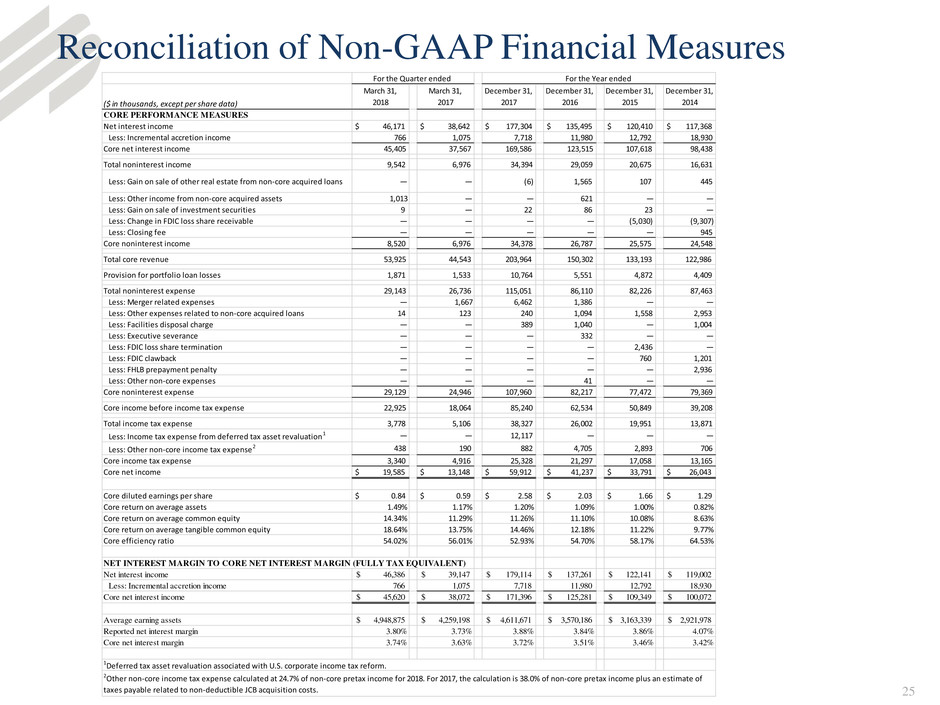
25 Reconciliation of Non-GAAP Financial Measures ($ in thousands, except per share data) March 31, 2018 March 31, 2017 December 31, 2017 December 31, 2016 December 31, 2015 December 31, 2014 CORE PERFORMANCE MEASURES Net interest income $ 46,171 $ 38,642 $ 177,304 $ 135,495 $ 120,410 $ 117,368 Less: Incremental accretion income 766 1,075 7,718 11,980 12,792 18,930 Core net interest income 45,405 37,567 169,586 123,515 107,618 98,438 Total noninterest income 9,542 6,976 34,394 29,059 20,675 16,631 Less: Gain on sale of other real estate from non-core acquired loans — — (6) 1,565 107 445 Less: Other income from non-core acquired assets 1,013 — — 621 — — Less: Gain on sale of investment securities 9 — 22 86 23 — Less: Change in FDIC loss share receivable — — — — (5,030) (9,307) Less: Closing fee — — — — — 945 Core noninterest income 8,520 6,976 34,378 26,787 25,575 24,548 Total core revenue 53,925 44,543 203,964 150,302 133,193 122,986 Provision for portfolio loan losses 1,871 1,533 10,764 5,551 4,872 4,409 Total noninterest expense 29,143 26,736 115,051 86,110 82,226 87,463 Less: Merger related expenses — 1,667 6,462 1,386 — — Less: Other expenses related to non-core acquired loans 14 123 240 1,094 1,558 2,953 Less: Facilities disposal charge — — 389 1,040 — 1,004 Less: Executive severance — — — 332 — — Less: FDIC loss share termination — — — — 2,436 — Less: FDIC clawback — — — — 760 1,201 Less: FHLB prepayment penalty — — — — — 2,936 Less: Other non-core expenses — — — 41 — — Core noninterest expense 29,129 24,946 107,960 82,217 77,472 79,369 Core income before income tax expense 22,925 18,064 85,240 62,534 50,849 39,208 Total income tax expense 3,778 5,106 38,327 26,002 19,951 13,871 Less: Income tax expense from deferred tax asset revaluation1 — — 12,117 — — — Less: Other non-core income tax expense2 438 190 882 4,705 2,893 706 Core income tax expense 3,340 4,916 25,328 21,297 17,058 13,165 Core net income $ 19,585 $ 13,148 $ 59,912 $ 41,237 $ 33,791 $ 26,043 Core diluted earnings per share $ 0.84 $ 0.59 $ 2.58 $ 2.03 $ 1.66 $ 1.29 Core return on average assets 1.49% 1.17% 1.20% 1.09% 1.00% 0.82% Core return on average common equity 14.34% 11.29% 11.26% 11.10% 10.08% 8.63% Core return on average tangible common equity 18.64% 13.75% 14.46% 12.18% 11.22% 9.77% Core efficiency ratio 54.02% 56.01% 52.93% 54.70% 58.17% 64.53% NET INTEREST MARGIN TO CORE NET INTEREST MARGIN (FULLY TAX EQUIVALENT) Net interest income 46,386$ 39,147$ 179,114$ 137,261$ 122,141$ 119,002$ Less: Incremental accretion income 766 1,075 7,718 11,980 12,792 18,930 Core net interest income 45,620$ 38,072$ 171,396$ 125,281$ 109,349$ 100,072$ Average earning assets 4,948,875$ 4,259,198$ 4,611,671$ 3,570,186$ 3,163,339$ 2,921,978$ Reported net interest margin 3.80% 3.73% 3.88% 3.84% 3.86% 4.07% Core net interest margin 3.74% 3.63% 3.72% 3.51% 3.46% 3.42% For the Year ended 1Deferred tax asset revaluation associated with U.S. corporate income tax reform. 2Other non-core income tax expense calculated at 24.7% of non-core pretax income for 2018. For 2017, the calculation is 38.0% of non-core pretax income plus an estimate of taxes payable related to non-deductible JCB acquisition costs. For the Quarter ended
