Enterprise Financial Services Corp First Quarter 2021 Investor Presentation Filed by Enterprise Financial Services Corp pursuant to Rule 425 under the Securities Act of 1933, as amended, and deemed filed pursuant to Rule 14a-12 under the Securities and Exchange Act of 1934, as amended Subject Company: First Choice Bancorp Commission File No: 001-38476 Exhibit 99.3
Forward-Looking Statements Certain statements contained in this report may be considered forward-looking statements regarding Enterprise, including its wholly- owned subsidiary EB&T, FCBP, including its wholly-owned subsidiary First Choice, and Enterprise’s proposed acquisition of FCBP and First Choice. These forward-looking statements may include: statements regarding the acquisition, the consideration payable in connection with the acquisition, and the ability of the parties to consummate the acquisition. Forward-looking statements are typically identified by words such as “believe,” “expect,” “anticipate,” “intend,” “outlook,” “estimate,” “forecast,” “project,” “pro forma” and other similar words and expressions. Forward-looking statements are subject to numerous assumptions, risks and uncertainties, which change over time. Forward-looking statements speak only as of the date they are made. Because forward-looking statements are subject to assumptions and uncertainties, actual results or future events could differ, possibly materially, from those that EFSC or FCBP anticipated in their forward-looking statements and future results could differ materially from historical performance. Factors that could cause or contribute to such differences include, but are not limited to, the possibility: that expected benefits of the acquisition may not materialize in the timeframe expected or at all, or may be more costly to achieve; that the acquisition may not be timely completed, if at all; the occurrence of any event, change or other circumstances that could give rise to the right of one or both of the parties to terminate the definitive transaction agreement; the outcome of any legal proceedings that may be instituted against EFSC or FCBP; that prior to the completion of the acquisition or thereafter, EFSC’s and FCBP’s respective businesses may not perform as expected due to transaction-related uncertainty or other factors; that the parties are unable to successfully implement integration strategies; that required regulatory, EFSC shareholder or FCBP shareholder or other approvals are not obtained or other closing conditions are not satisfied in a timely manner or at all; that adverse regulatory conditions may be imposed in connection with regulatory approvals of the acquisition; reputational risks and the reaction of the companies’ employees or customers to the transaction; diversion of management time on acquisition-related issues; that the COVID-19 pandemic, including uncertainty and volatility in financial, commodities and other markets, and disruptions to banking and other financial activity, could harm Enterprise and FCBP’s business, financial position and results of operations, and could adversely affect the timing and anticipated benefits of the proposed acquisition; and those factors and risks referenced from time to time in EFSC’s or FCBP’s filings with the SEC, including in their Annual Reports on Form 10-K for the fiscal year ended December 31, 2020, and their other filings with the SEC. For any forward-looking statements made in this press release or in any documents, EFSC and FCBP claim the protection of the safe harbor for forward-looking statements contained in the Private Securities Litigation Reform Act of 1995. Annualized, pro forma, projected and estimated numbers in this document are used for illustrative purposes only, are not forecasts and may not reflect actual results. Except to the extent required by applicable law or regulation, each of EFSC and FCBP disclaims any obligation to revise or publicly release any revision or update to any of the forward-looking statements included herein to reflect events or circumstances that occur after the date on which such statements were made. 2
Additional Information Additional Information About the Merger and Where to Find It In connection with the proposed acquisition transaction, along with other relevant documents, a registration statement on Form S-4 will be filed with the SEC that will include a joint proxy statement/prospectus to be distributed to the shareholders of Enterprise and First Choice in connection with their votes on the acquisition. SHAREHOLDERS OF ENTERPRISE AND FIRST CHOICE ARE URGED TO READ THE REGISTRATION STATEMENT AND ANY OTHER RELEVANT DOCUMENTS FILED WITH THE SEC, INCLUDING THE JOINT PROXY STATEMENT/PROSPECTUS THAT WILL BE PART OF THE REGISTRATION STATEMENT, AS WELL AS ANY AMENDMENTS OR SUPPLEMENTS TO THOSE DOCUMENTS, WHEN THEY BECOME AVAILABLE, BECAUSE THEY WILL CONTAIN IMPORTANT INFORMATION ABOUT THE PROPOSED ACQUISITION AND RELATED MATTERS. FREE COPIES OF THESE DOCUMENTS MAY BE OBTAINED AS DESCRIBED BELOW. The final joint proxy statement/prospectus will be mailed to shareholders of Enterprise and First Choice. Investors and security holders will be able to obtain the documents, and any other documents Enterprise has filed with the SEC, free of charge at the SEC’s website, www.sec.gov. In addition, documents filed with the SEC by Enterprise in connection with the proposed acquisition will be available free of charge by (1) accessing Enterprise’s website at www.enterprisebank.com under the “Investor Relations” link, (2) writing Enterprise at 150 North Meramec, Clayton, Missouri 63105, Attention: Investor Relations, (3) accessing First Choice’s website at https://investors.firstchoicebankca.com under the “SEC Filings” tab, or (4) writing First Choice at 17785 Center Court Drive, N Suite 750, Cerritos, CA 90703, Attention: General Counsel. Participants in Solicitation First Choice and certain of their directors and executive officers, and Enterprise and certain of their directors, executive officers and other certain members of management and employees, may be deemed to be participants in the solicitation of proxies from the shareholders of First Choice and the shareholders of Enterprise in connection with the Merger. Information about the directors and executive officers of Enterprise is set forth in the proxy statement for Enterprise’s 2021 annual meeting of shareholders, as filed with the SEC on a Schedule 14A on March 17, 2021. Information about the directors and officers of First Choice will be set forth in the Form-10-K/A, to be filed with the SEC on or about April 27, 2021 and in the proxy statement of First Choice to be filed on Schedule 14A during the third quarter of 2021. Additional information regarding the interests of those participants and other persons who may be deemed participants in the transaction may be obtained by reading the joint proxy statement/prospectus regarding the proposed acquisition when it becomes available. Free copies of this document, once filed, may be obtained as described in the preceding paragraph. 3

Executive Leadership Team JAMES B. LALLY 53, President & Chief Executive Officer, EFSC Enterprise Tenure – 17 years KEENE S. TURNER 41, EVP, Chief Financial Officer, EFSC Enterprise Tenure – 7 years SCOTT R. GOODMAN 57, President, Enterprise Bank & Trust Enterprise Tenure – 18 years DOUGLAS N. BAUCHE 51, EVP, Chief Credit Officer, Enterprise Bank & Trust Enterprise Tenure – 21 years MARK G. PONDER 50, EVP, Chief Administrative Officer, Enterprise Bank & Trust Enterprise Tenure – 9 years NICOLE M. IANNACONE 41, EVP, Chief Risk Officer & General Counsel, Enterprise Bank & Trust Enterprise Tenure – 7 years 4
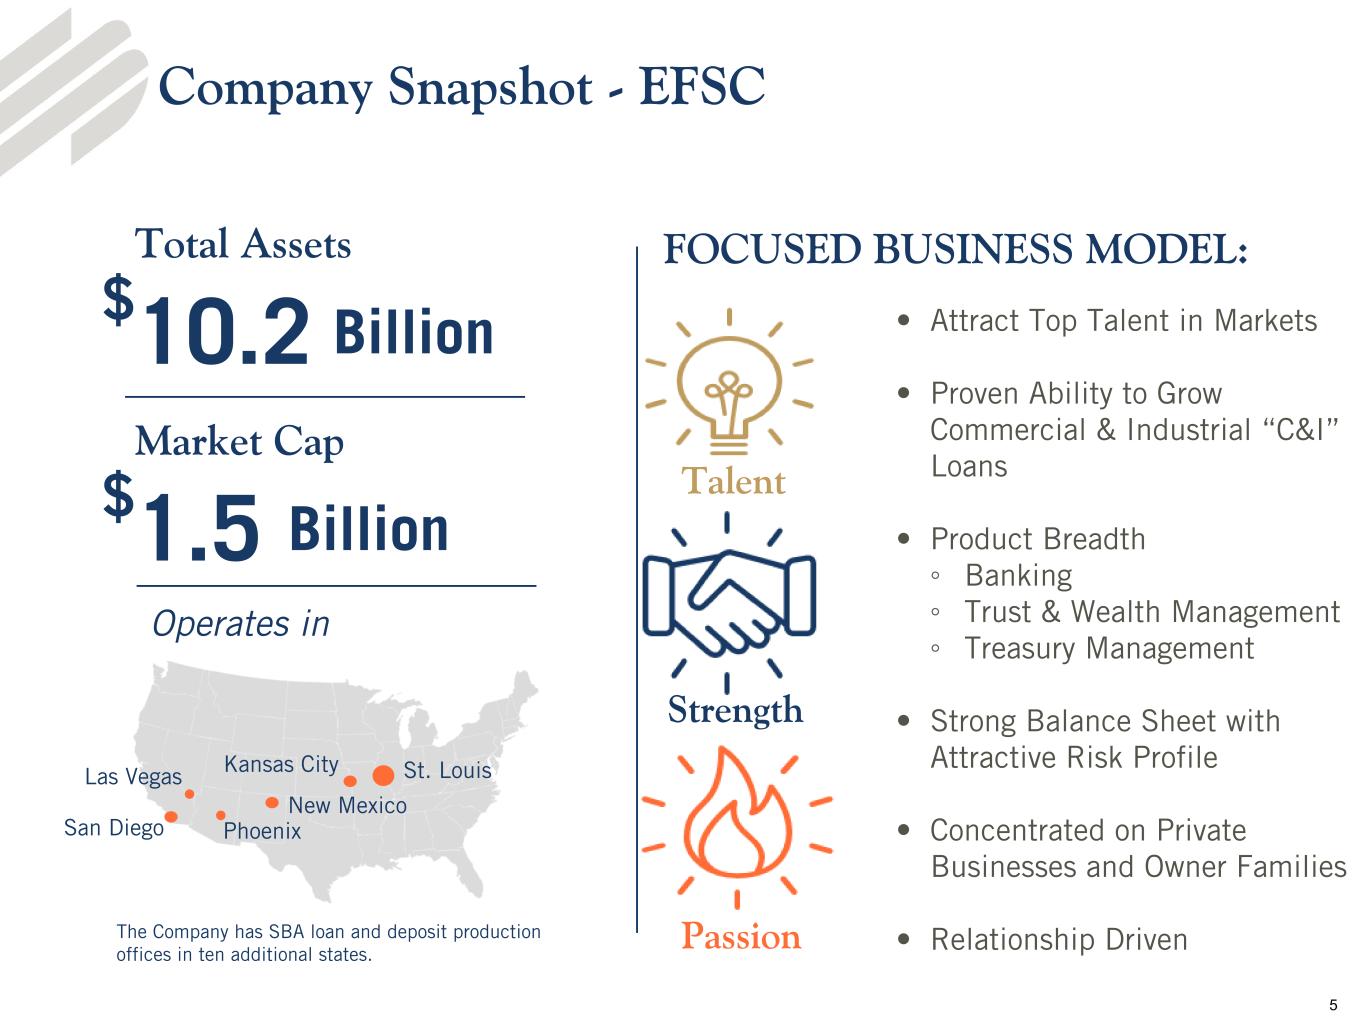
Company Snapshot - EFSC Total Assets $10.2 Billion Market Cap FOCUSED BUSINESS MODEL: Operates in St. LouisKansas City Phoenix $1.5 Billion • Attract Top Talent in Markets • Proven Ability to Grow Commercial & Industrial “C&I” Loans • Product Breadth ◦ Banking ◦ Trust & Wealth Management ◦ Treasury Management • Strong Balance Sheet with Attractive Risk Profile • Concentrated on Private Businesses and Owner Families • Relationship Driven Talent Strength Passion New Mexico San Diego Las Vegas The Company has SBA loan and deposit production offices in ten additional states. 5
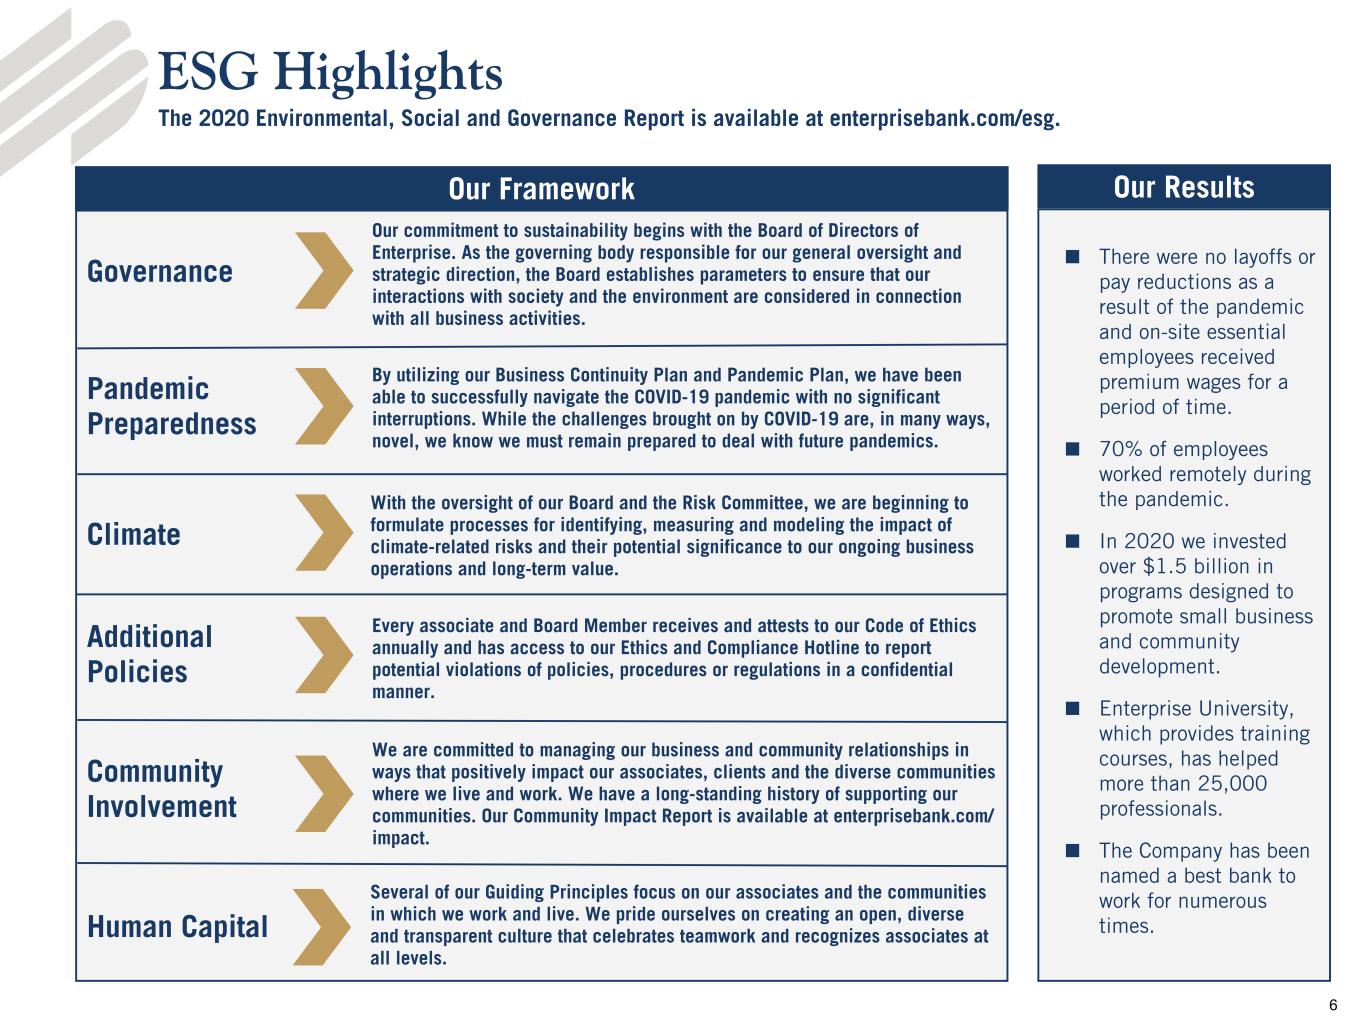
■ There were no layoffs or pay reductions as a result of the pandemic and on-site essential employees received premium wages for a period of time. ■ 70% of employees worked remotely during the pandemic. ■ In 2020 we invested over $1.5 billion in programs designed to promote small business and community development. ■ Enterprise University, which provides training courses, has helped more than 25,000 professionals. ■ The Company has been named a best bank to work for numerous times. ESG Highlights The 2020 Environmental, Social and Governance Report is available at enterprisebank.com/esg. Our Framework Additional Policies Every associate and Board Member receives and attests to our Code of Ethics annually and has access to our Ethics and Compliance Hotline to report potential violations of policies, procedures or regulations in a confidential manner. Our commitment to sustainability begins with the Board of Directors of Enterprise. As the governing body responsible for our general oversight and strategic direction, the Board establishes parameters to ensure that our interactions with society and the environment are considered in connection with all business activities. Governance Pandemic Preparedness By utilizing our Business Continuity Plan and Pandemic Plan, we have been able to successfully navigate the COVID-19 pandemic with no significant interruptions. While the challenges brought on by COVID-19 are, in many ways, novel, we know we must remain prepared to deal with future pandemics. Climate With the oversight of our Board and the Risk Committee, we are beginning to formulate processes for identifying, measuring and modeling the impact of climate-related risks and their potential significance to our ongoing business operations and long-term value. Community Involvement We are committed to managing our business and community relationships in ways that positively impact our associates, clients and the diverse communities where we live and work. We have a long-standing history of supporting our communities. Our Community Impact Report is available at enterprisebank.com/ impact. Human Capital Several of our Guiding Principles focus on our associates and the communities in which we work and live. We pride ourselves on creating an open, diverse and transparent culture that celebrates teamwork and recognizes associates at all levels. Our Results 6
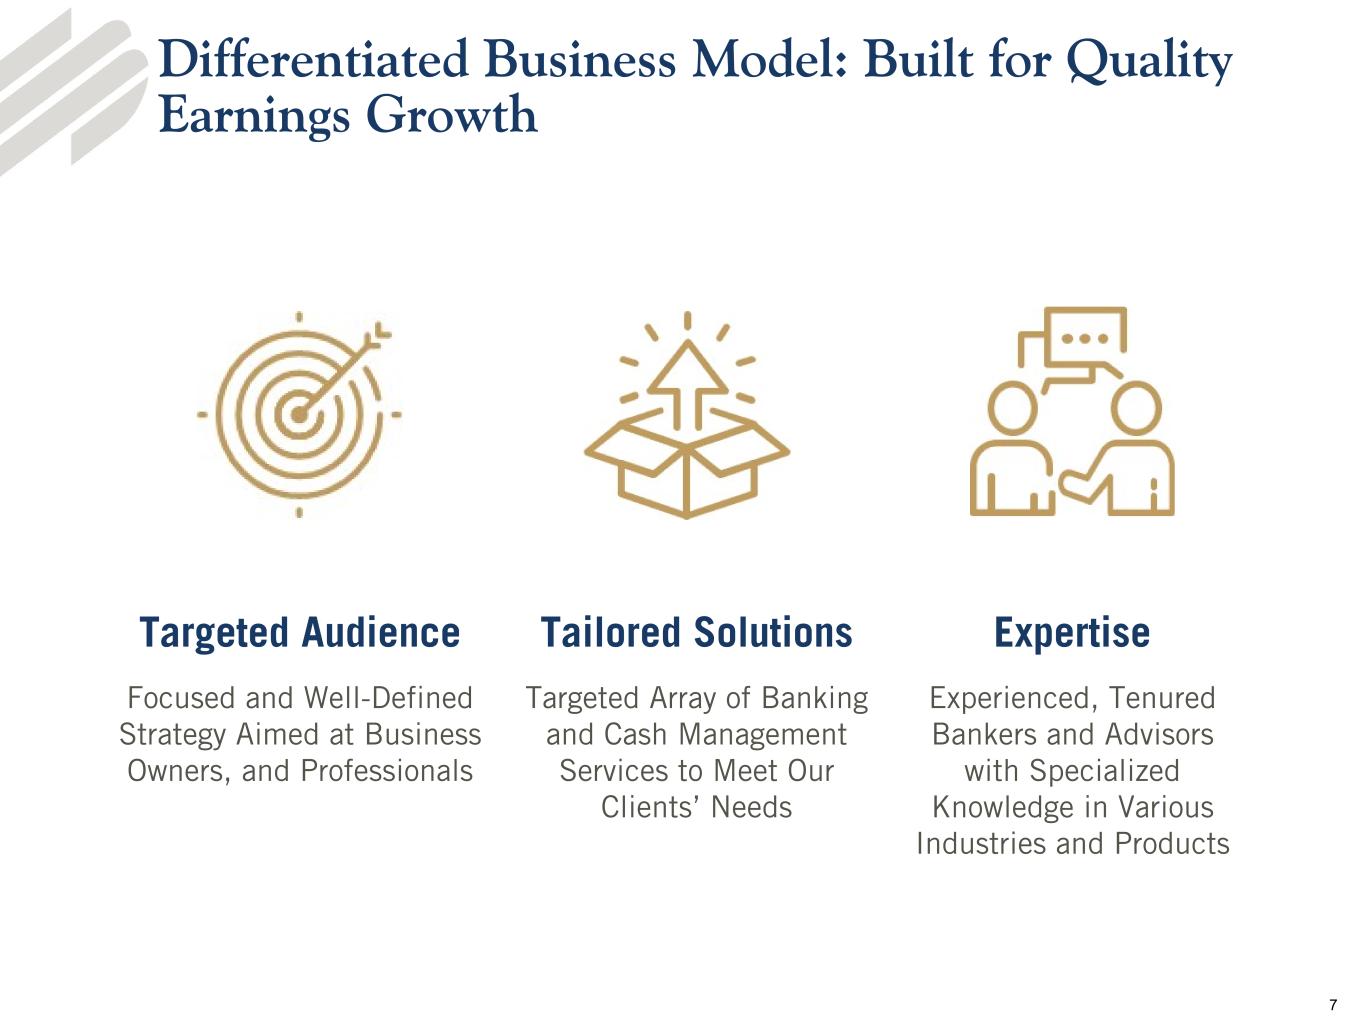
Differentiated Business Model: Built for Quality Earnings Growth Focused and Well-Defined Strategy Aimed at Business Owners, Executives and Professionals. Targeted Array of Banking and Wealth Management Services to Meet our Client’s Needs Experienced Bankers and Advisors Targeted Audience Focused and Well-Defined Strategy Aimed at Business Owners, and Professionals Tailored Solutions Targeted Array of Banking and Cash Management Services to Meet Our Clients’ Needs Expertise Experienced, Tenured Bankers and Advisors with Specialized Knowledge in Various Industries and Products 7

Customer Focus Source: Greenwich Associates 71 NPS NET PROMOTER SCORE A measure of client satisfaction INDUSTRY AVERAGE: 54 8
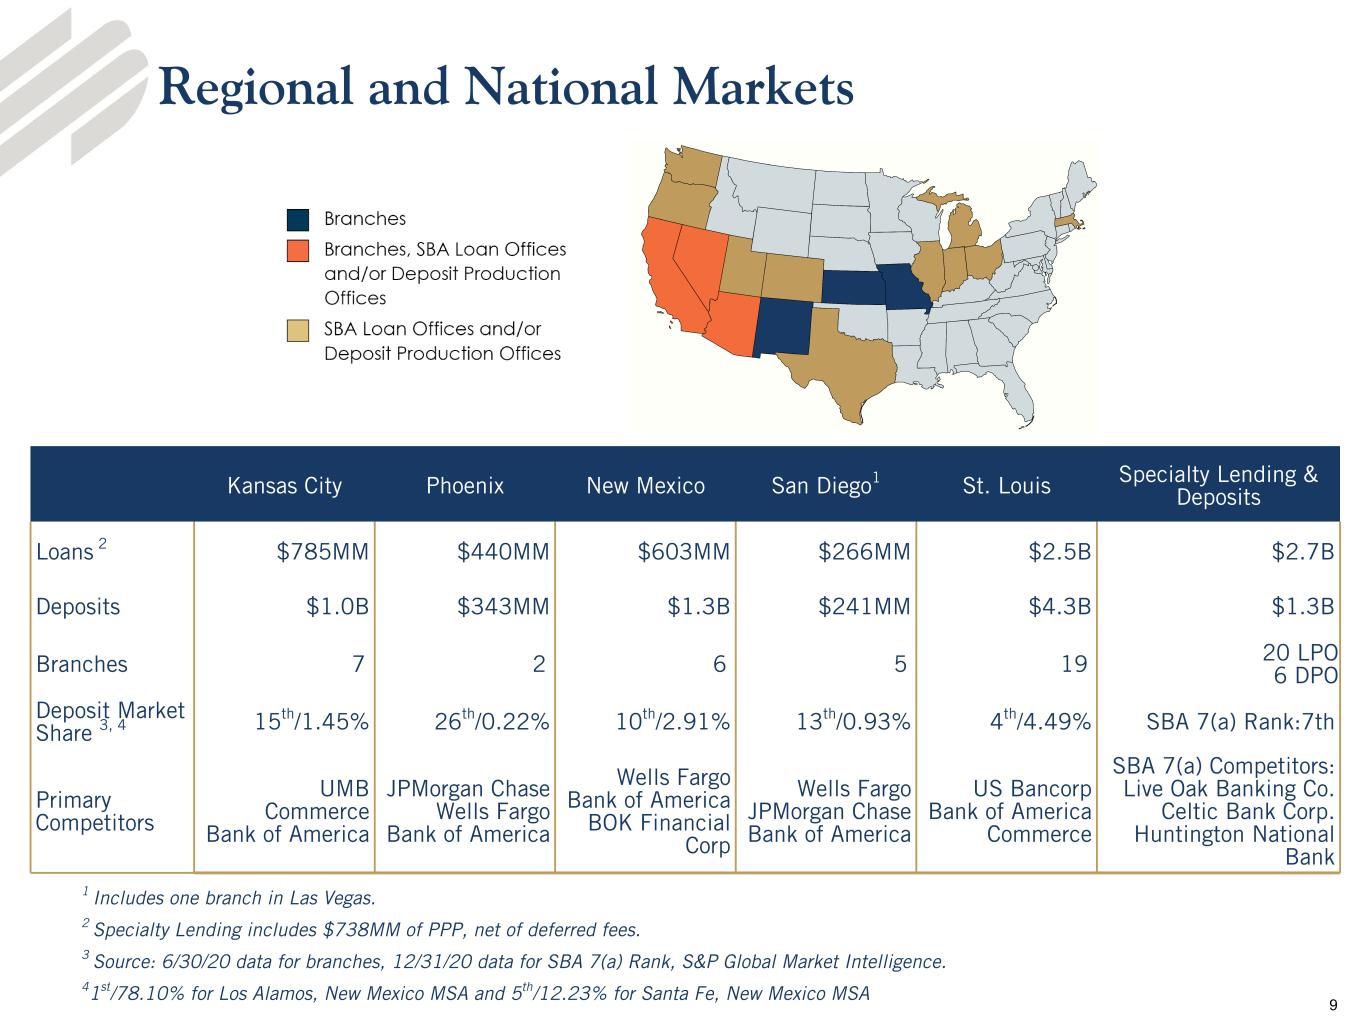
Regional and National Markets Kansas City Phoenix New Mexico San Diego1 St. Louis Specialty Lending & Deposits Loans 2 $785MM $440MM $603MM $266MM $2.5B $2.7B Deposits $1.0B $343MM $1.3B $241MM $4.3B $1.3B Branches 7 2 6 5 19 20 LPO6 DPO Deposit Market Share 3, 4 15 th/1.45% 26th/0.22% 10th/2.91% 13th/0.93% 4th/4.49% SBA 7(a) Rank:7th Primary Competitors UMB Commerce Bank of America JPMorgan Chase Wells Fargo Bank of America Wells Fargo Bank of America BOK Financial Corp Wells Fargo JPMorgan Chase Bank of America US Bancorp Bank of America Commerce SBA 7(a) Competitors: Live Oak Banking Co. Celtic Bank Corp. Huntington National Bank 1 Includes one branch in Las Vegas. 2 Specialty Lending includes $738MM of PPP, net of deferred fees. 3 Source: 6/30/20 data for branches, 12/31/20 data for SBA 7(a) Rank, S&P Global Market Intelligence. 41st/78.10% for Los Alamos, New Mexico MSA and 5th/12.23% for Santa Fe, New Mexico MSA 9
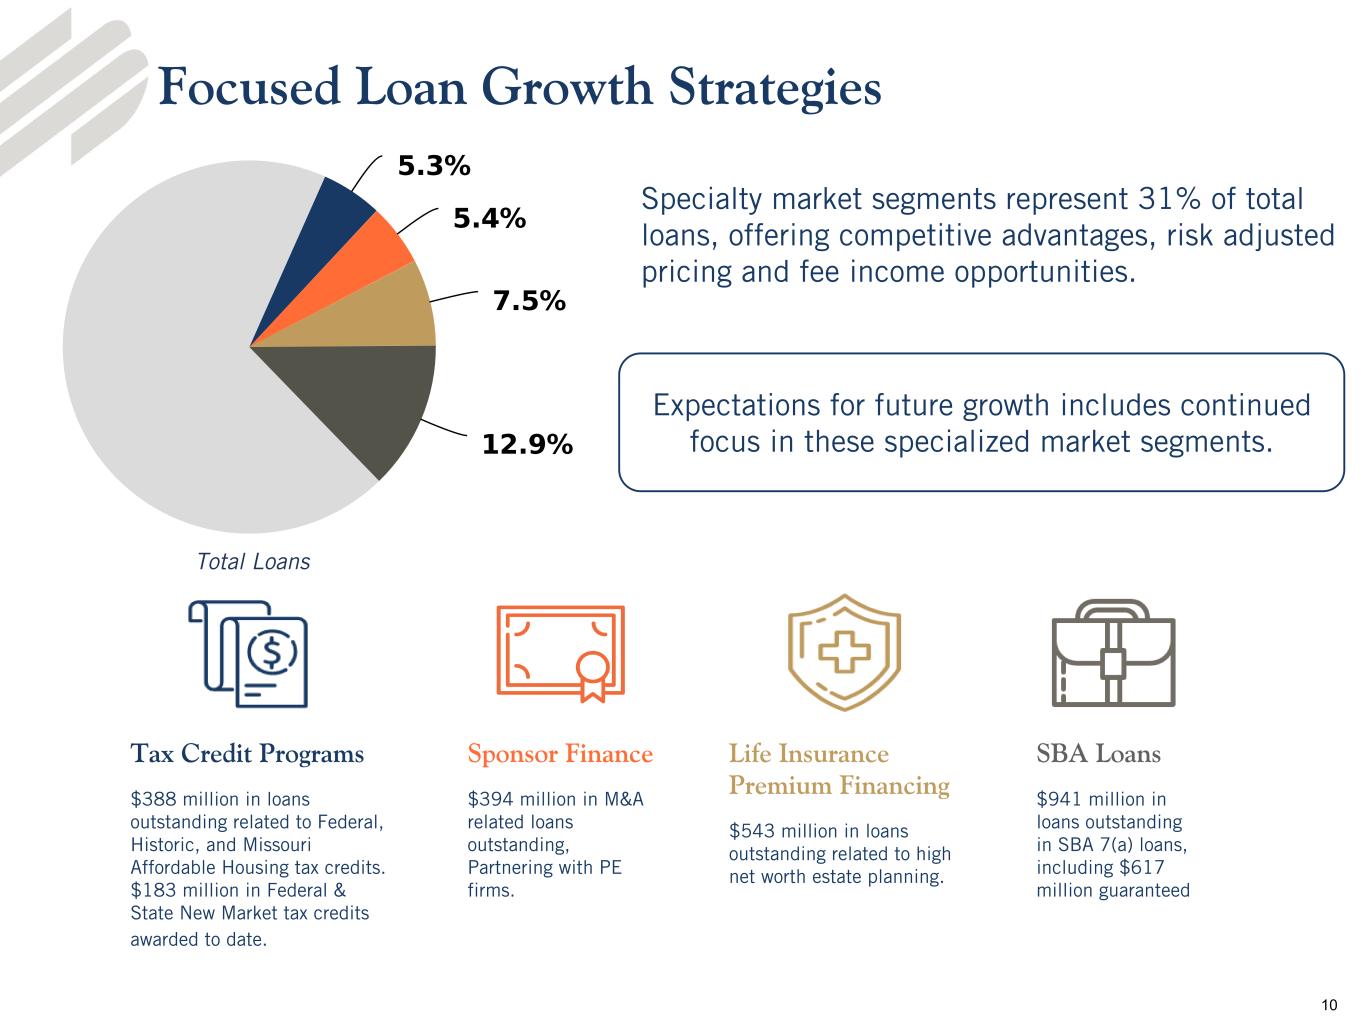
Focused Loan Growth Strategies Total Loans Specialty market segments represent 31% of total loans, offering competitive advantages, risk adjusted pricing and fee income opportunities. Tax Credit Programs $388 million in loans outstanding related to Federal, Historic, and Missouri Affordable Housing tax credits. $183 million in Federal & State New Market tax credits awarded to date. Sponsor Finance $394 million in M&A related loans outstanding, Partnering with PE firms. Life Insurance Premium Financing $543 million in loans outstanding related to high net worth estate planning. Expectations for future growth includes continued focus in these specialized market segments. SBA Loans $941 million in loans outstanding in SBA 7(a) loans, including $617 million guaranteed 10
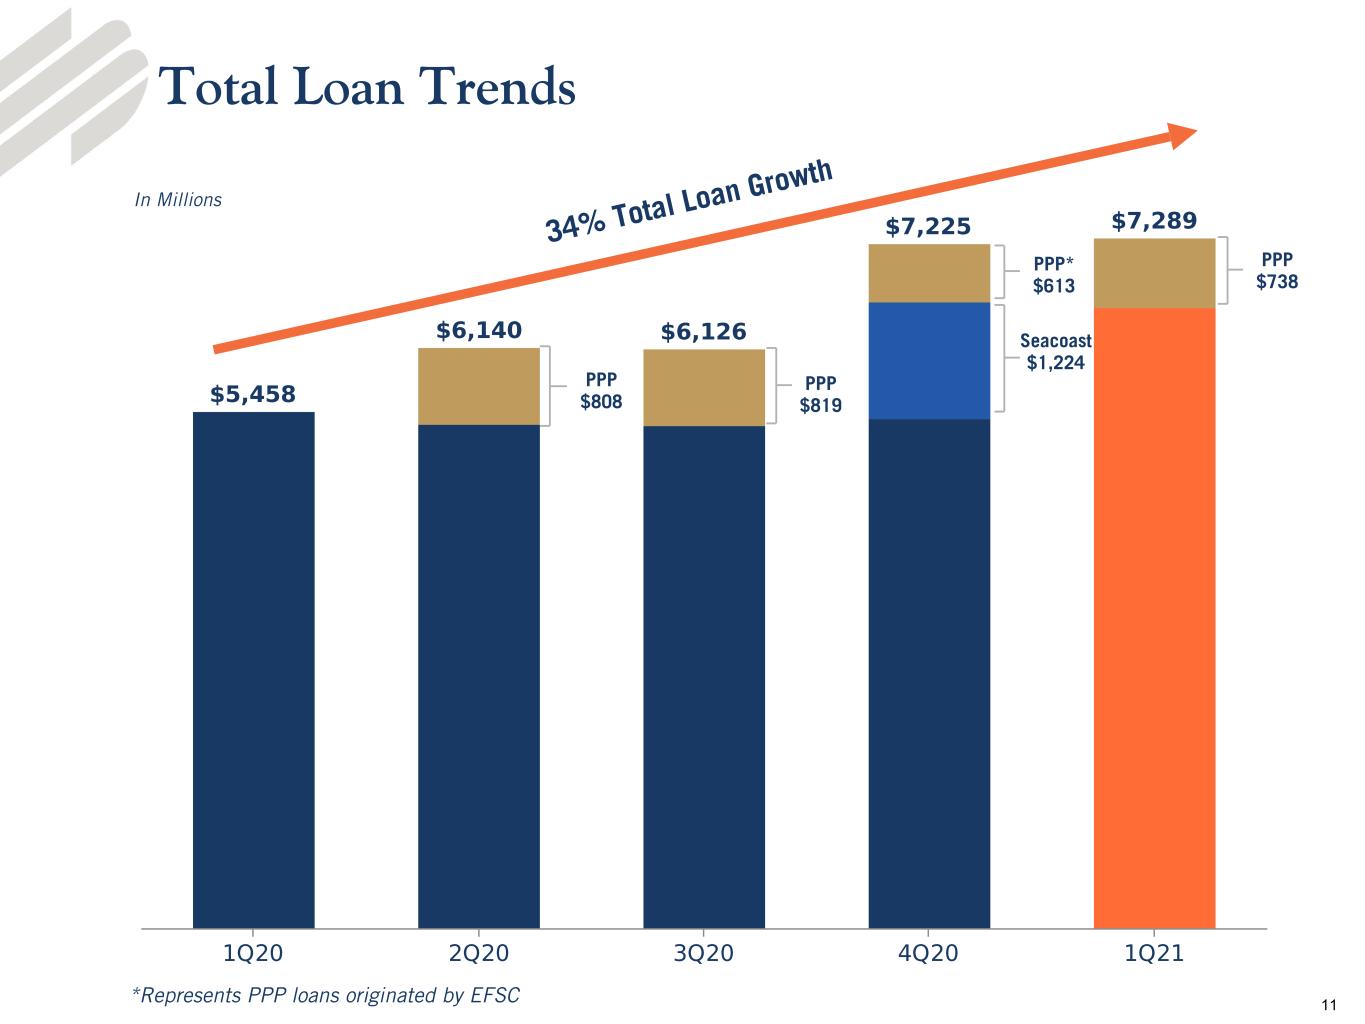
Total Loan Trends In Millions 34% T otal Lo an Gro wth PPP $819 PPP $808 PPP* $613 *Represents PPP loans originated by EFSC Seacoast $1,224 PPP $738 11
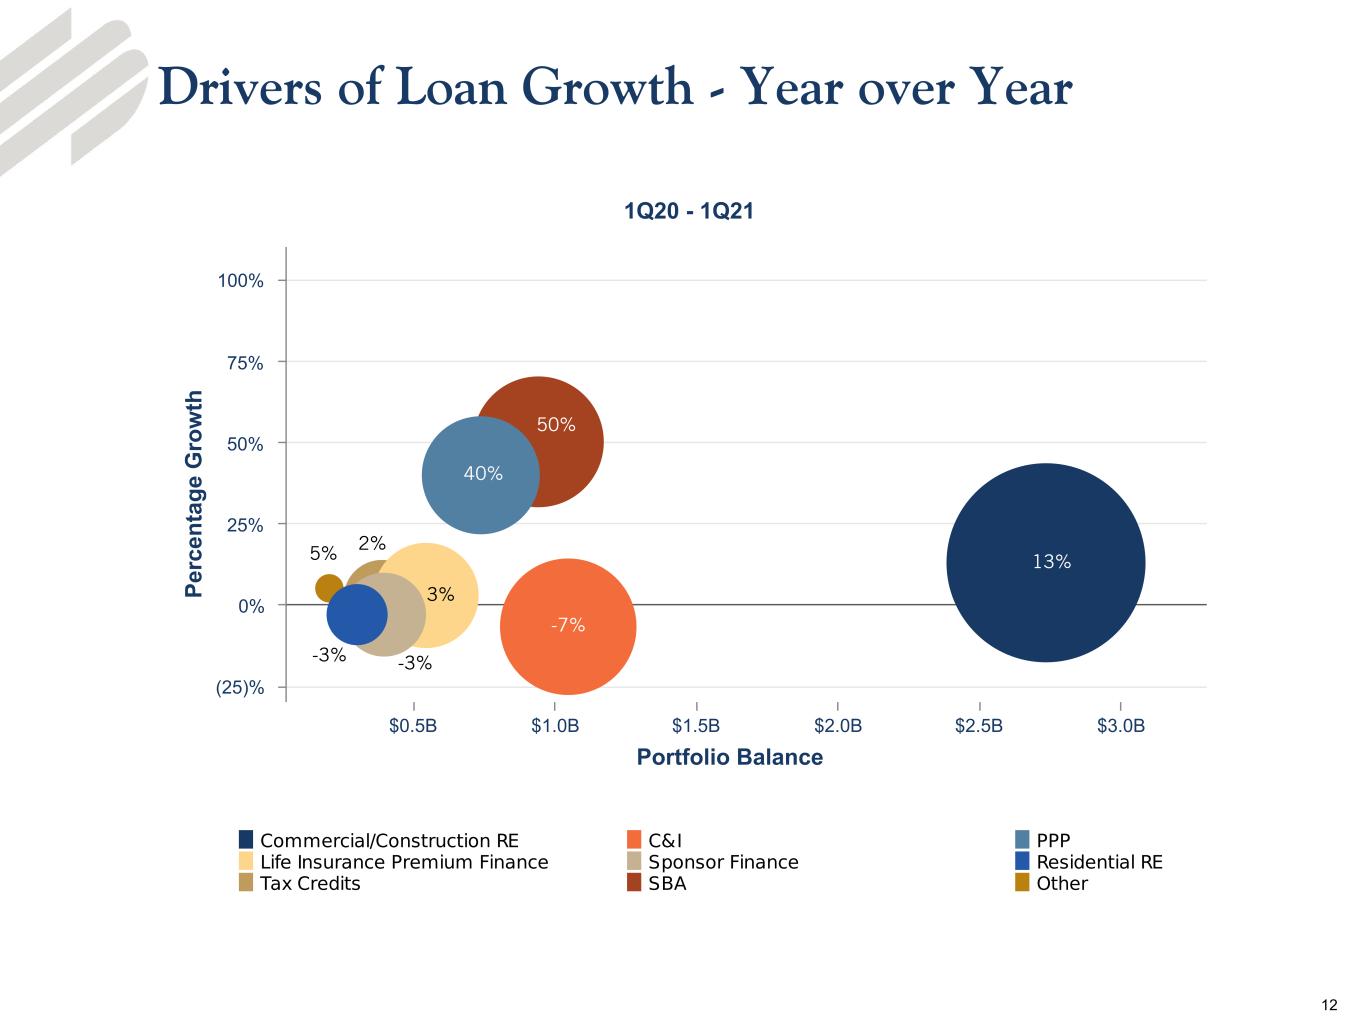
Portfolio Balance P er ce nt ag e G ro w th 1Q20 - 1Q21 $0.5B $1.0B $1.5B $2.0B $2.5B $3.0B (25)% 0% 25% 50% 75% 100% Drivers of Loan Growth - Year over Year 40% 13% -7% 3% 2% -3% -3% 5% 50% 12
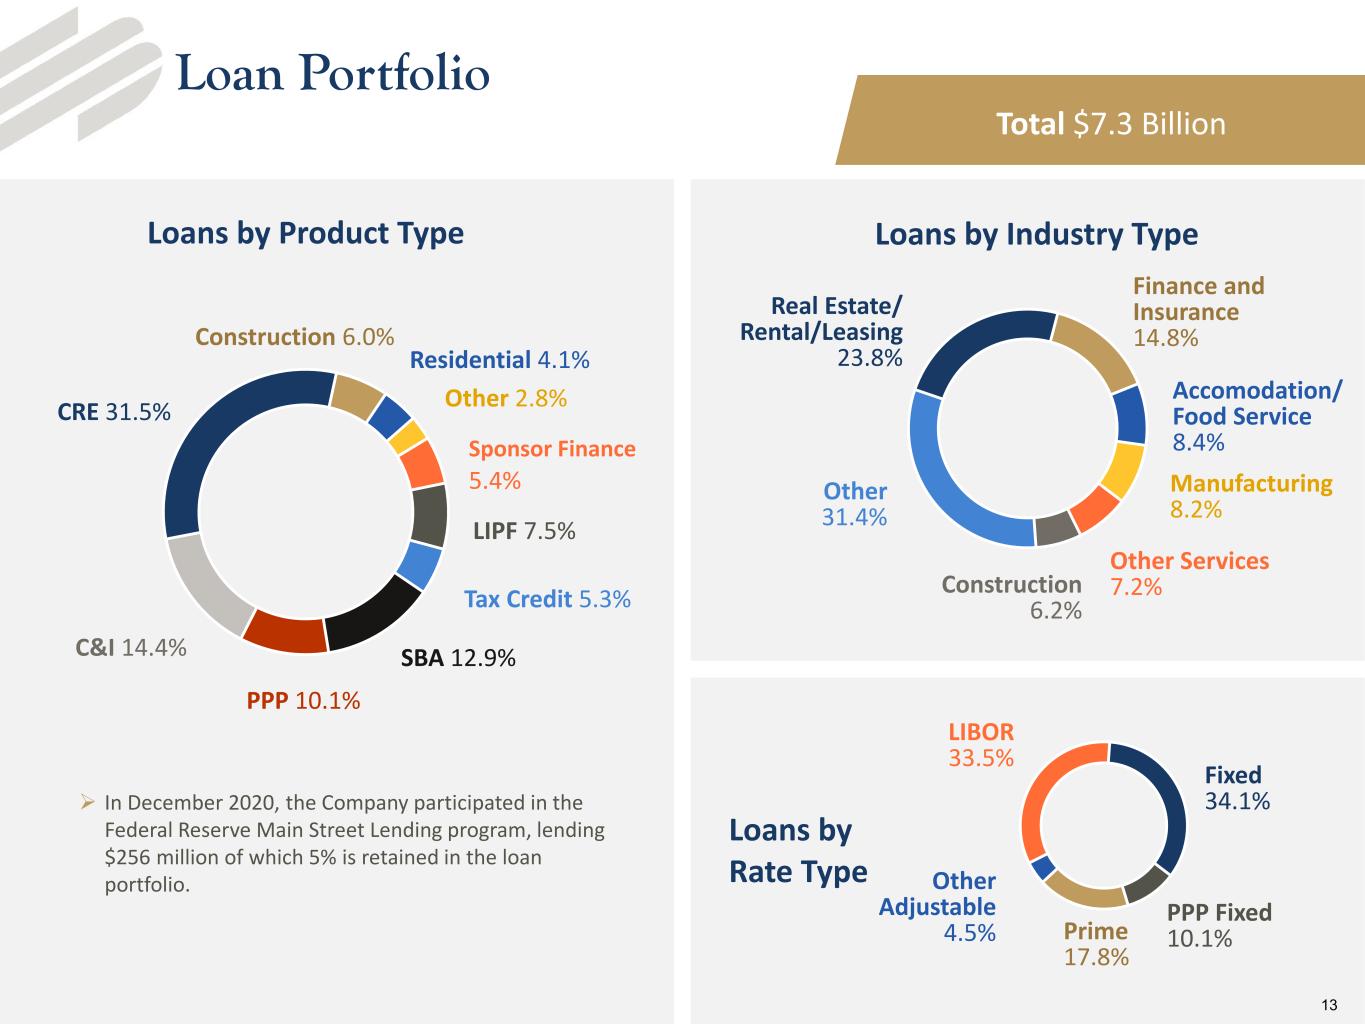
Loan Portfolio CRE 31.5% Construction 6.0% Residential 4.1% Other 2.8% Sponsor Finance 5.4% LIPF 7.5% Tax Credit 5.3% SBA 12.9% PPP 10.1% C&I 14.4% Loans by Product Type Real Estate/ Rental/Leasing 23.8% Finance and Insurance 14.8% Accomodation/ Food Service 8.4% Manufacturing 8.2% Other Services 7.2%Construction 6.2% Other 31.4% Loans by Industry Type Fixed 34.1% PPP Fixed 10.1%Prime 17.8% Other Adjustable 4.5% LIBOR 33.5% Loans by Rate Type In December 2020, the Company participated in the Federal Reserve Main Street Lending program, lending $256 million of which 5% is retained in the loan portfolio. Total $7.3 Billion 13
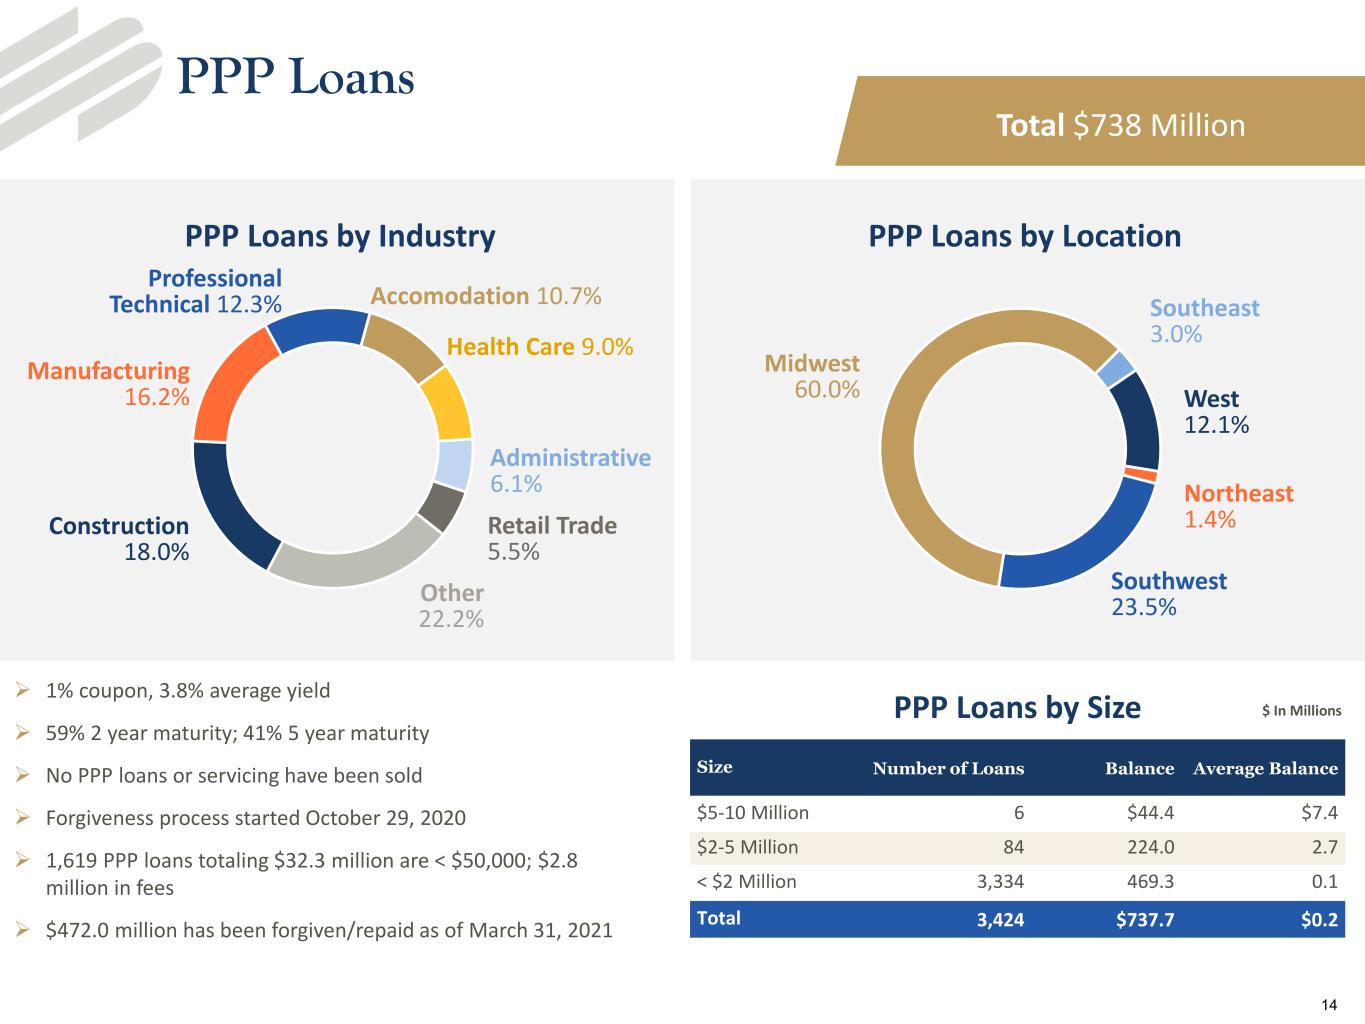
1% coupon, 3.8% average yield 59% 2 year maturity; 41% 5 year maturity No PPP loans or servicing have been sold Forgiveness process started October 29, 2020 1,619 PPP loans totaling $32.3 million are < $50,000; $2.8 million in fees $472.0 million has been forgiven/repaid as of March 31, 2021 Construction 18.0% Manufacturing 16.2% Professional Technical 12.3% Accomodation 10.7% Health Care 9.0% Administrative 6.1% Retail Trade 5.5% Other 22.2% Southeast 3.0% West 12.1% Northeast 1.4% Southwest 23.5% Midwest 60.0% Total $738 Million PPP Loans by Size $ In Millions PPP Loans PPP Loans by LocationPPP Loans by Industry Size Number of Loans Balance Average Balance $5-10 Million 6 $44.4 $7.4 $2-5 Million 84 224.0 2.7 < $2 Million 3,334 469.3 0.1 Total 3,424 $737.7 $0.2 14
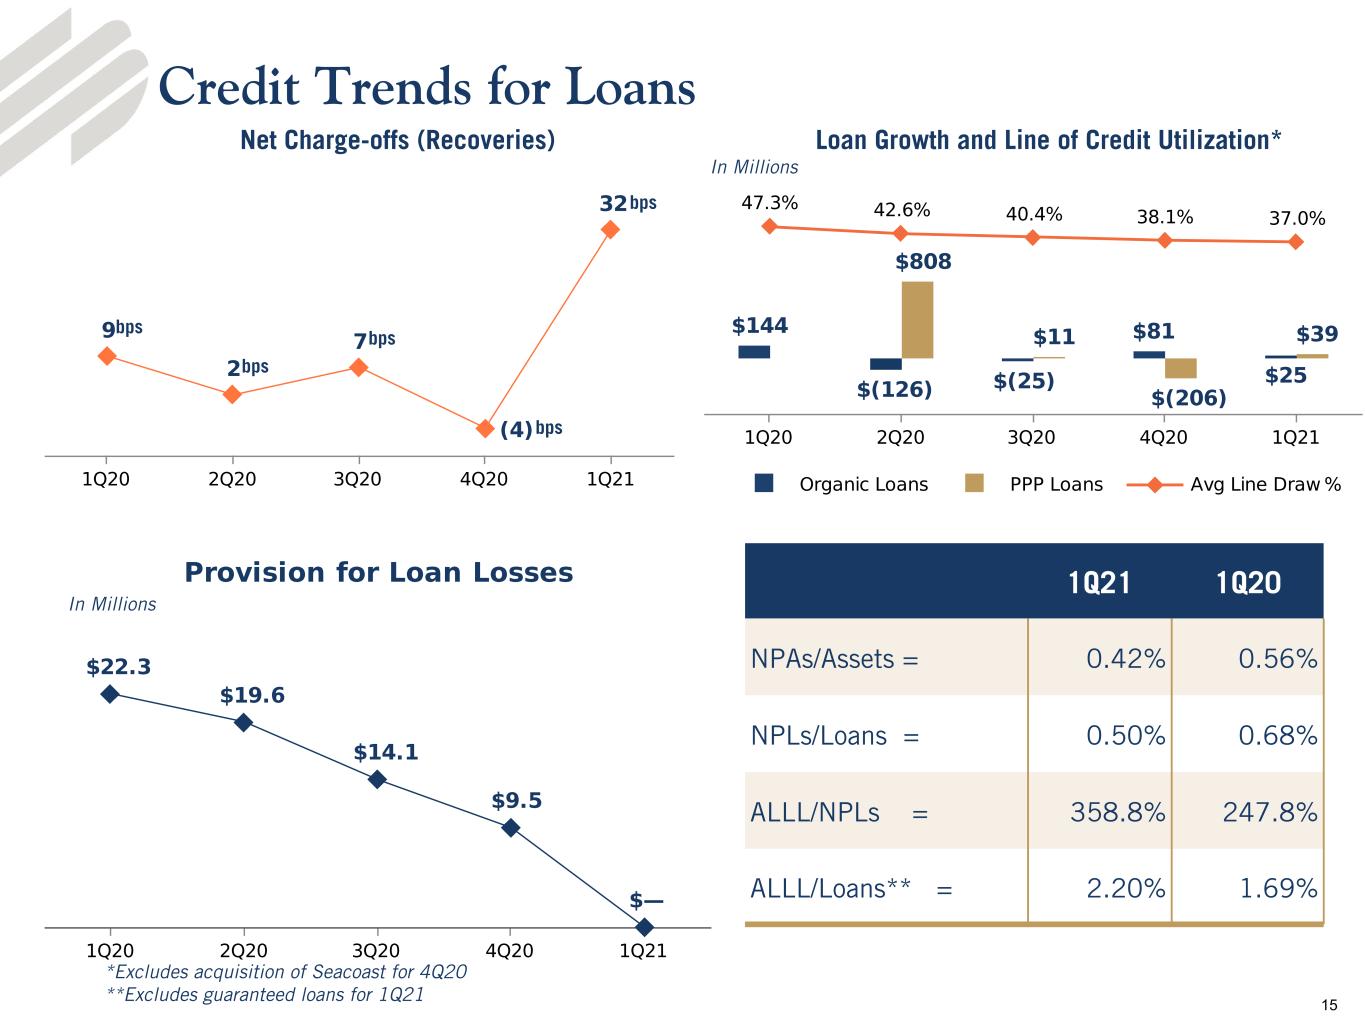
Credit Trends for Loans In Millions bps bps bps bps bps 1Q21 1Q20 NPAs/Assets = 0.42% 0.56% NPLs/Loans = 0.50% 0.68% ALLL/NPLs = 358.8% 247.8% ALLL/Loans** = 2.20% 1.69% In Millions *Excludes acquisition of Seacoast for 4Q20 **Excludes guaranteed loans for 1Q21 Net Charge-offs (Recoveries) Loan Growth and Line of Credit Utilization* 15
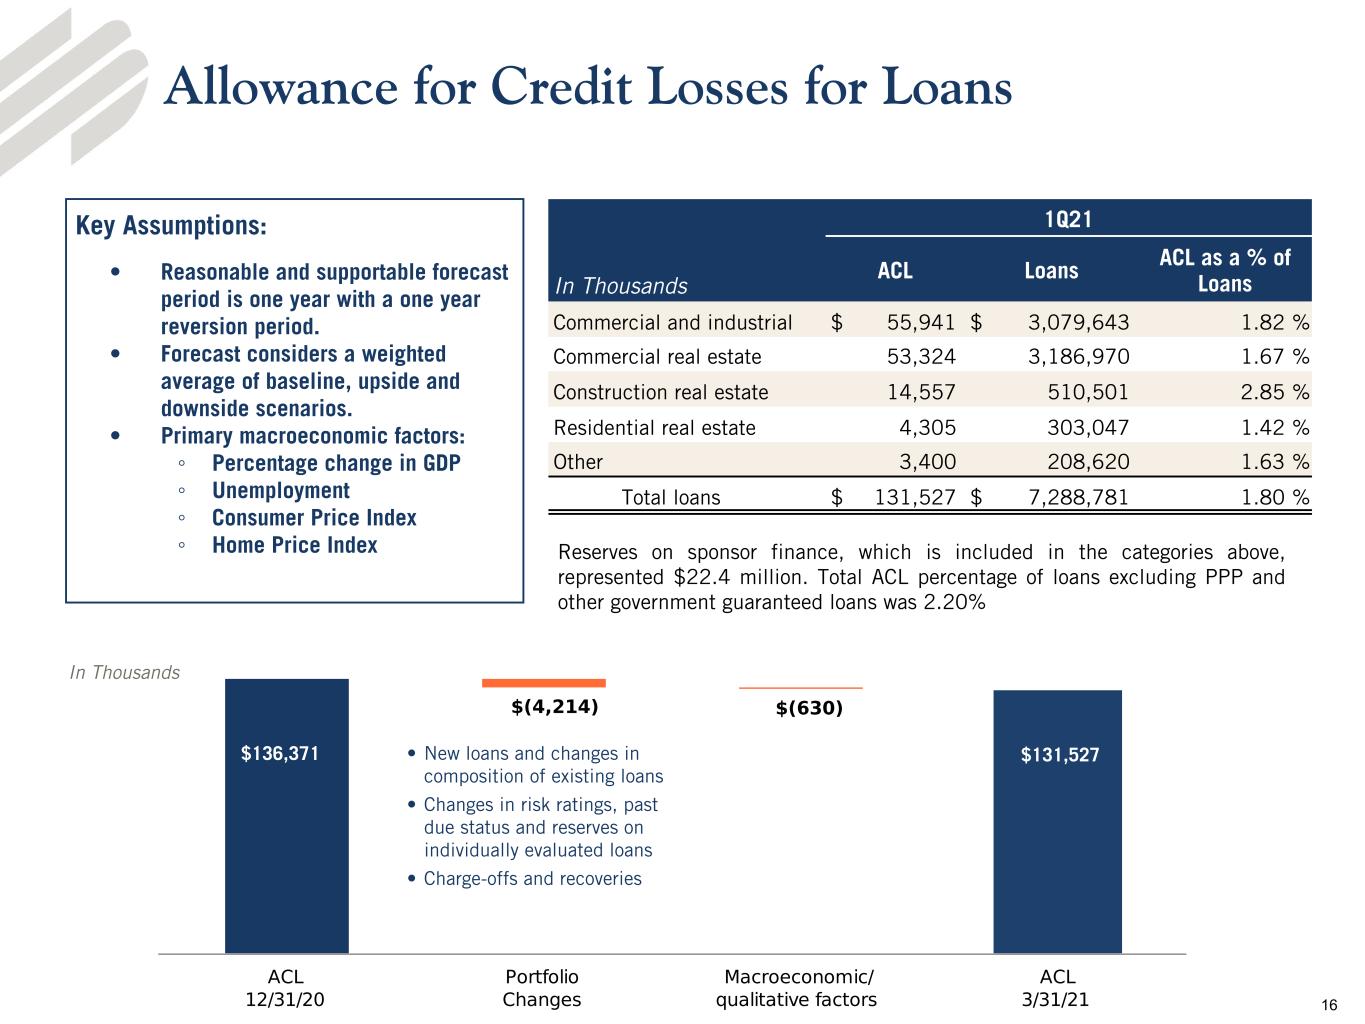
Allowance for Credit Losses for Loans In Thousands $136,371 $131,527• New loans and changes in composition of existing loans • Changes in risk ratings, past due status and reserves on individually evaluated loans • Charge-offs and recoveries 1Q21 In Thousands ACL Loans ACL as a % of Loans Commercial and industrial $ 55,941 $ 3,079,643 1.82 % Commercial real estate 53,324 3,186,970 1.67 % Construction real estate 14,557 510,501 2.85 % Residential real estate 4,305 303,047 1.42 % Other 3,400 208,620 1.63 % Total loans $ 131,527 $ 7,288,781 1.80 % Reserves on sponsor finance, which is included in the categories above, represented $22.4 million. Total ACL percentage of loans excluding PPP and other government guaranteed loans was 2.20% Key Assumptions: • Reasonable and supportable forecast period is one year with a one year reversion period. • Forecast considers a weighted average of baseline, upside and downside scenarios. • Primary macroeconomic factors: ◦ Percentage change in GDP ◦ Unemployment ◦ Consumer Price Index ◦ Home Price Index 16
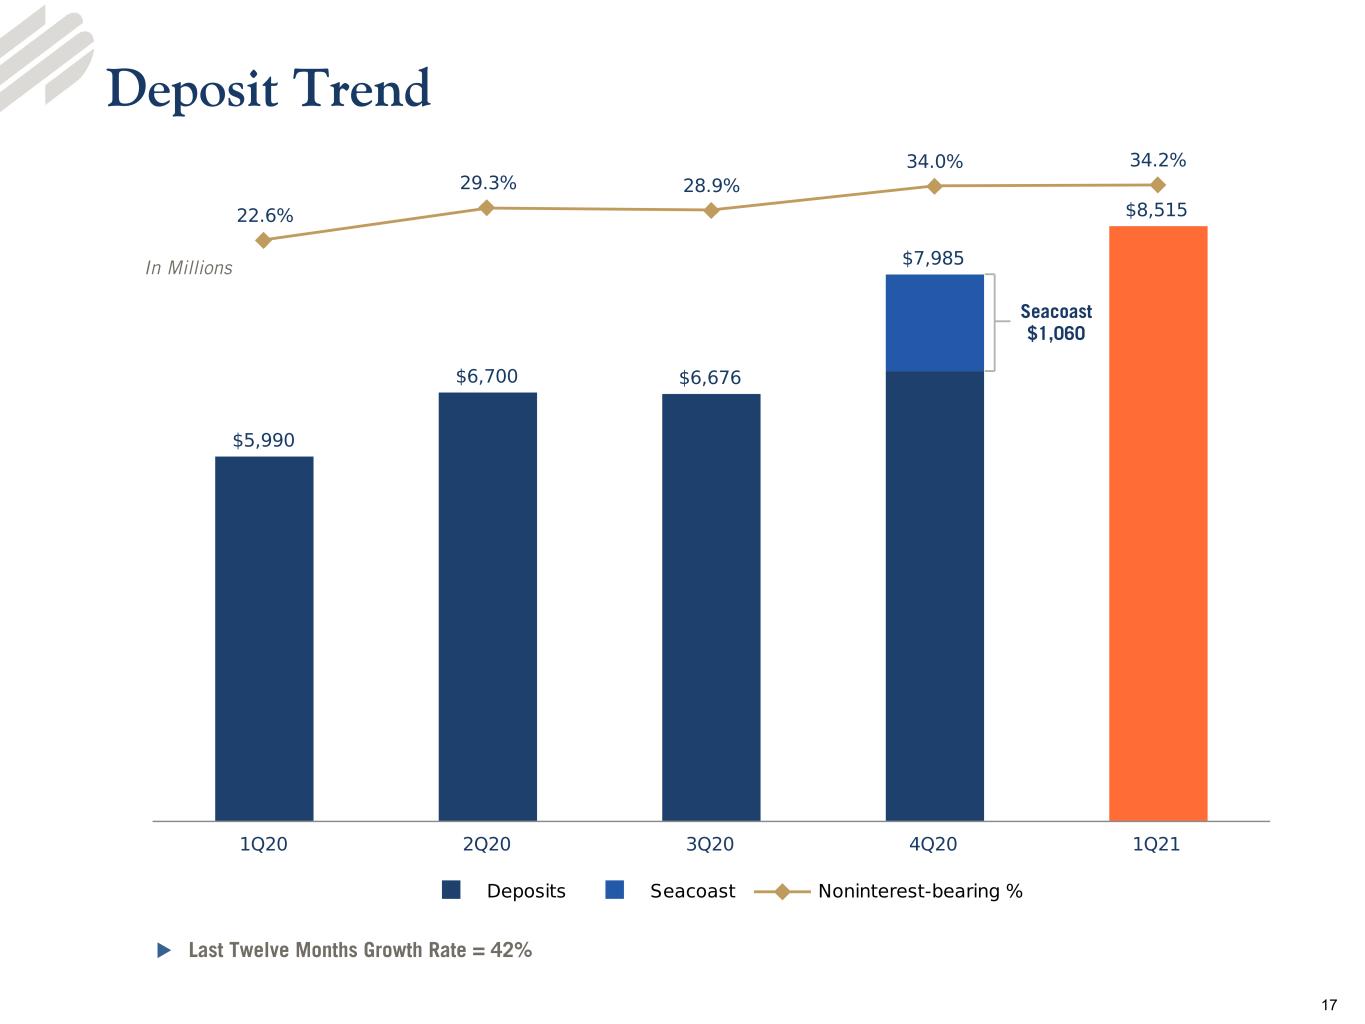
Last Twelve Months Growth Rate = 42% In Millions Deposit Trend u Seacoast $1,060 17
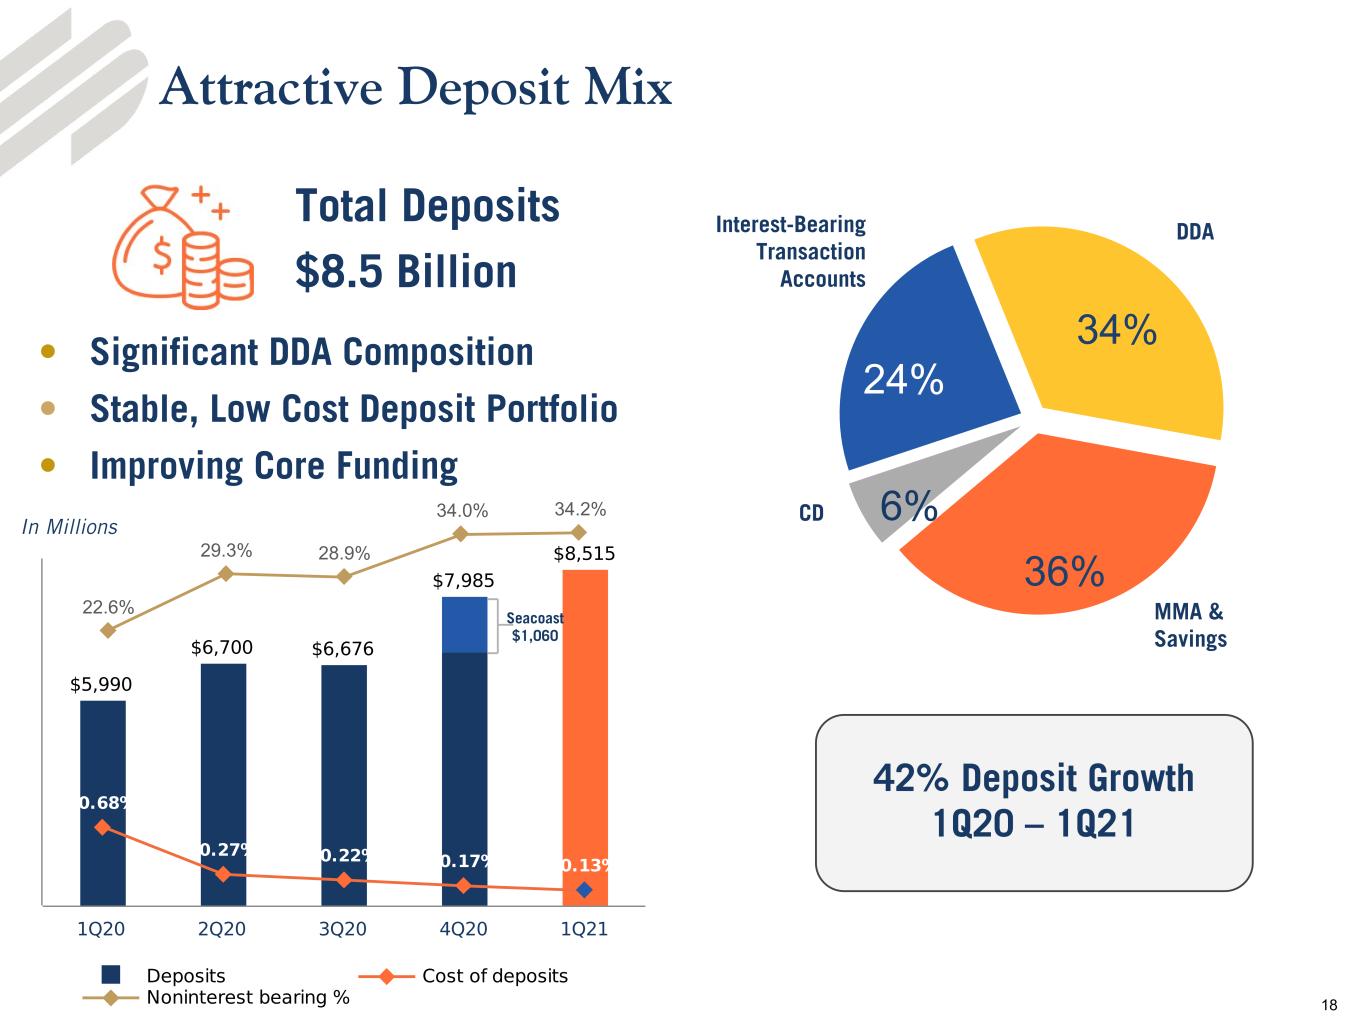
34% 36% 6% 24% Attractive Deposit Mix CD Interest-Bearing Transaction Accounts DDA MMA & Savings • Significant DDA Composition • Stable, Low Cost Deposit Portfolio • Improving Core Funding 42% Deposit Growth 1Q20 – 1Q21 In Millions Total Deposits $8.5 Billion 22.6% 29.3% 28.9% 34.0% 34.2% Seacoast $1,060 18
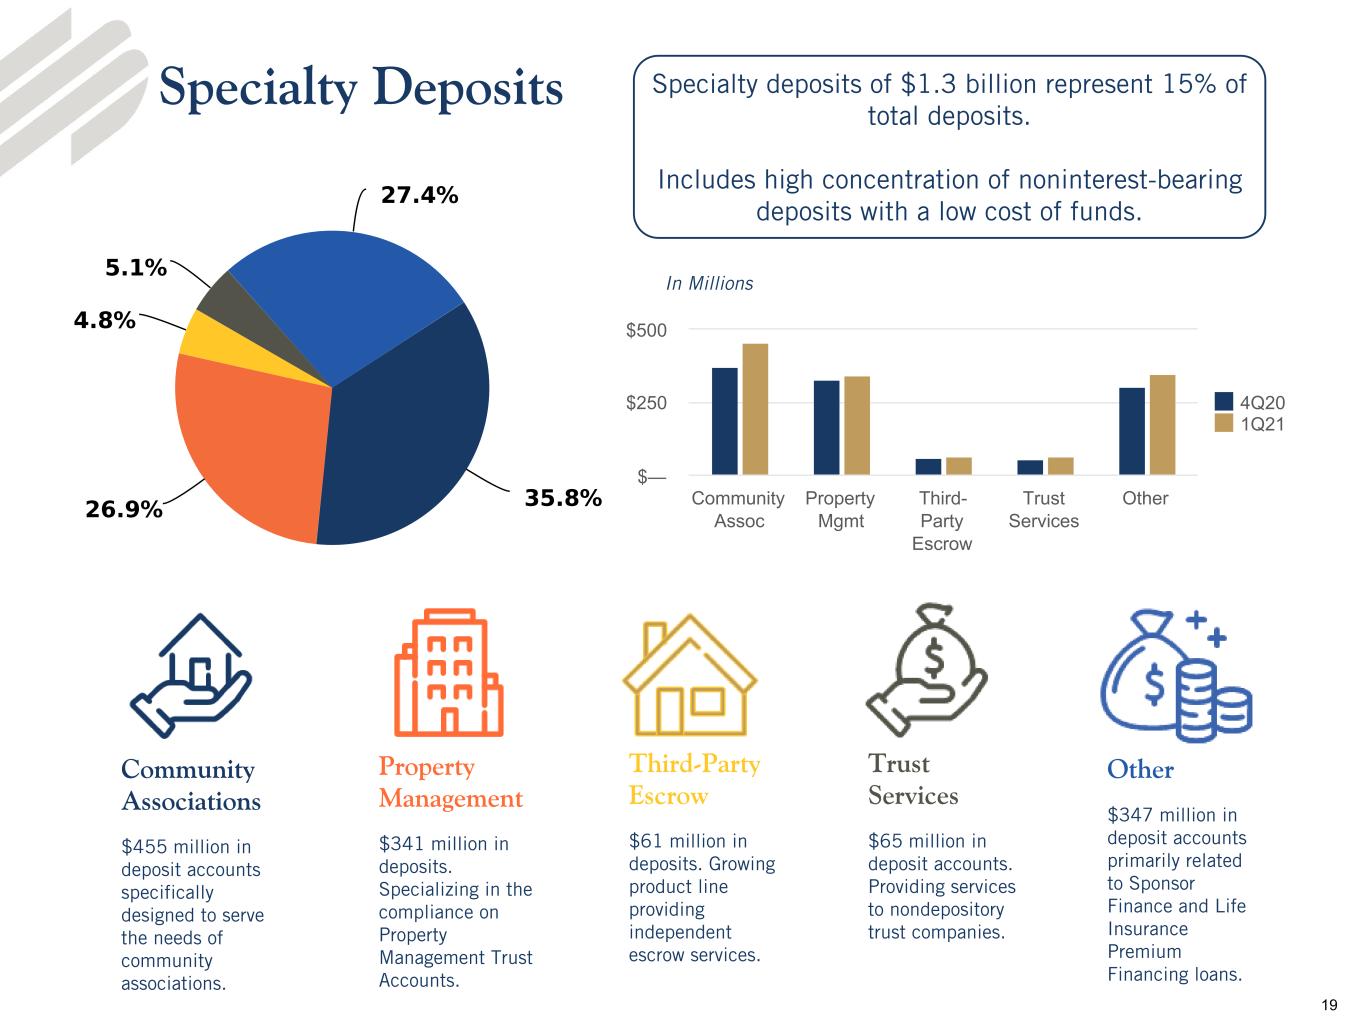
Specialty Deposits Community Associations $455 million in deposit accounts specifically designed to serve the needs of community associations. Property Management $341 million in deposits. Specializing in the compliance on Property Management Trust Accounts. Third-Party Escrow $61 million in deposits. Growing product line providing independent escrow services. Trust Services $65 million in deposit accounts. Providing services to nondepository trust companies. Specialty deposits of $1.3 billion represent 15% of total deposits. Includes high concentration of noninterest-bearing deposits with a low cost of funds. Other $347 million in deposit accounts primarily related to Sponsor Finance and Life Insurance Premium Financing loans. 4Q20 1Q21 Community Assoc Property Mgmt Third- Party Escrow Trust Services Other $— $250 $500 In Millions 19
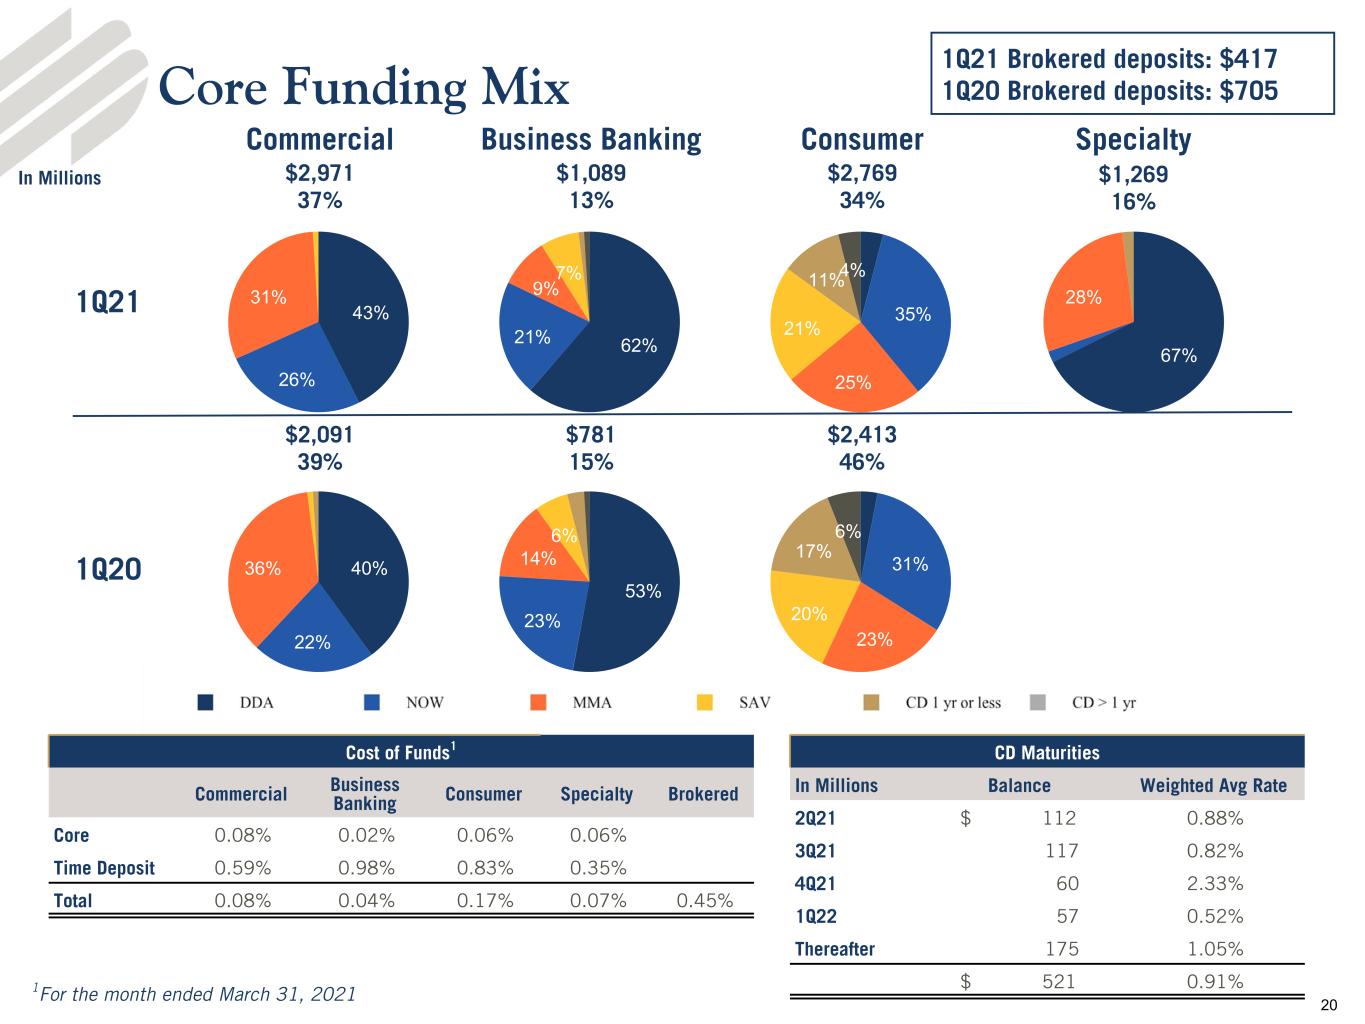
53% 23% 14% 6% 35% 25% 21% 11%4% 31% 23% 20% 17% 6% 40% 22% 36% Core Funding Mix Commercial Business Banking Consumer 1Q21 Brokered deposits: $417 1Q20 Brokered deposits: $705 In Millions $2,769 34% $2,413 46% $1,089 13% $781 15% $2,971 37% $2,091 39% Cost of Funds1 Commercial Business Banking Consumer Specialty Brokered Core 0.08% 0.02% 0.06% 0.06% Time Deposit 0.59% 0.98% 0.83% 0.35% Total 0.08% 0.04% 0.17% 0.07% 0.45% 1For the month ended March 31, 2021 62%21% 9% 7% Specialty $1,269 16% 67% 28% 43% 26% 31%1Q21 1Q20 CD Maturities In Millions Balance Weighted Avg Rate 2Q21 $ 112 0.88% 3Q21 117 0.82% 4Q21 60 2.33% 1Q22 57 0.52% Thereafter 175 1.05% $ 521 0.91% 20
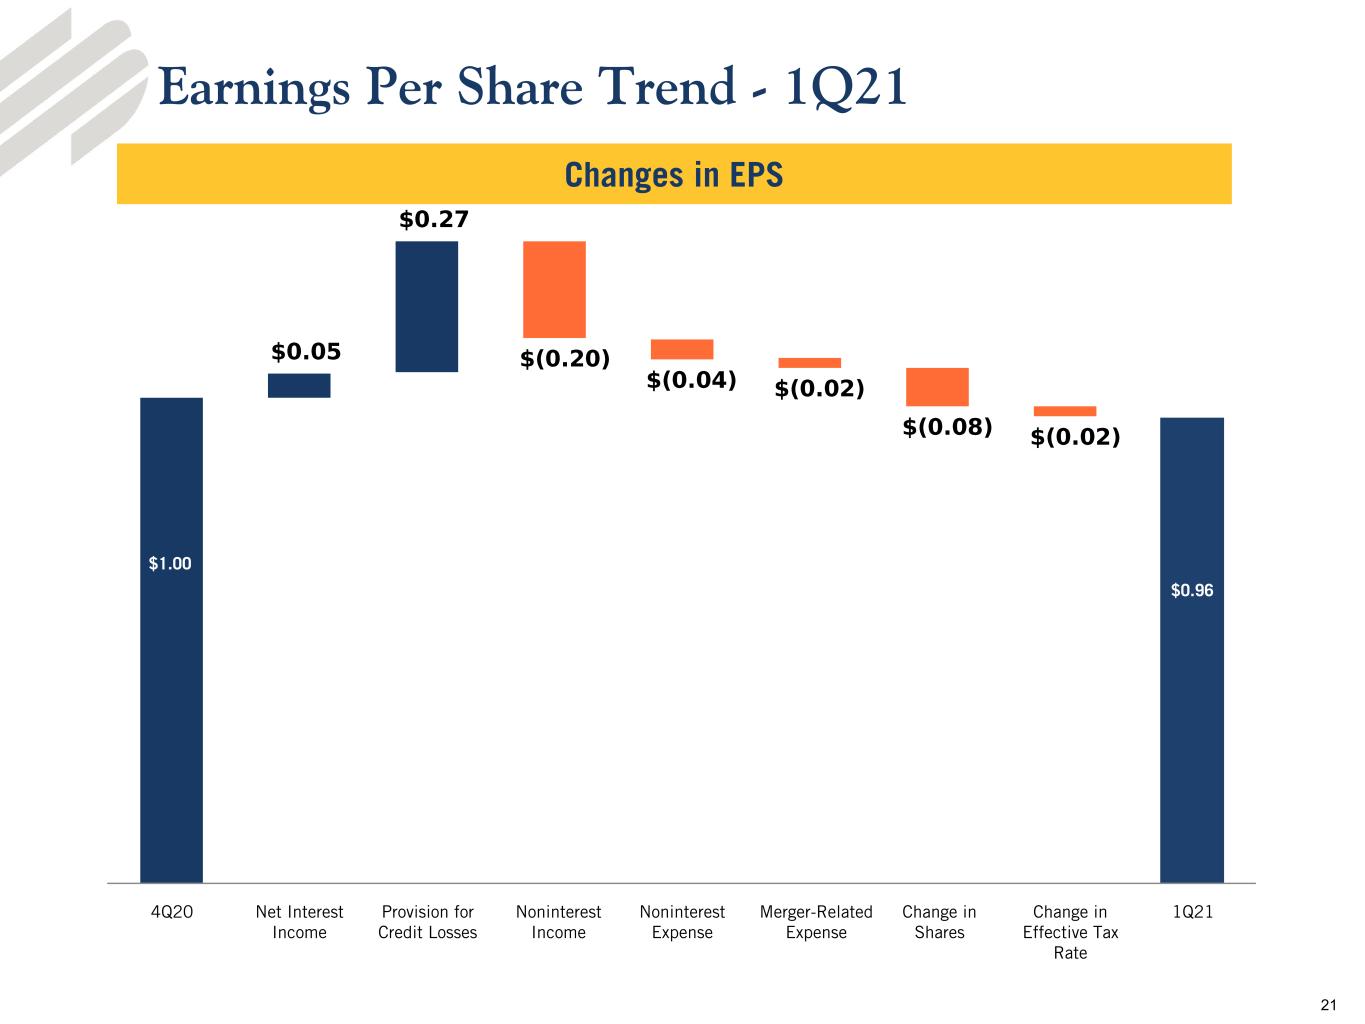
Earnings Per Share Trend - 1Q21 Changes in EPS $1.00 $0.96 4Q20 1Q21Net Interest Income Noninterest Income Provision for Credit Losses Merger-Related Expense Change in Shares Noninterest Expense Change in Effective Tax Rate 21
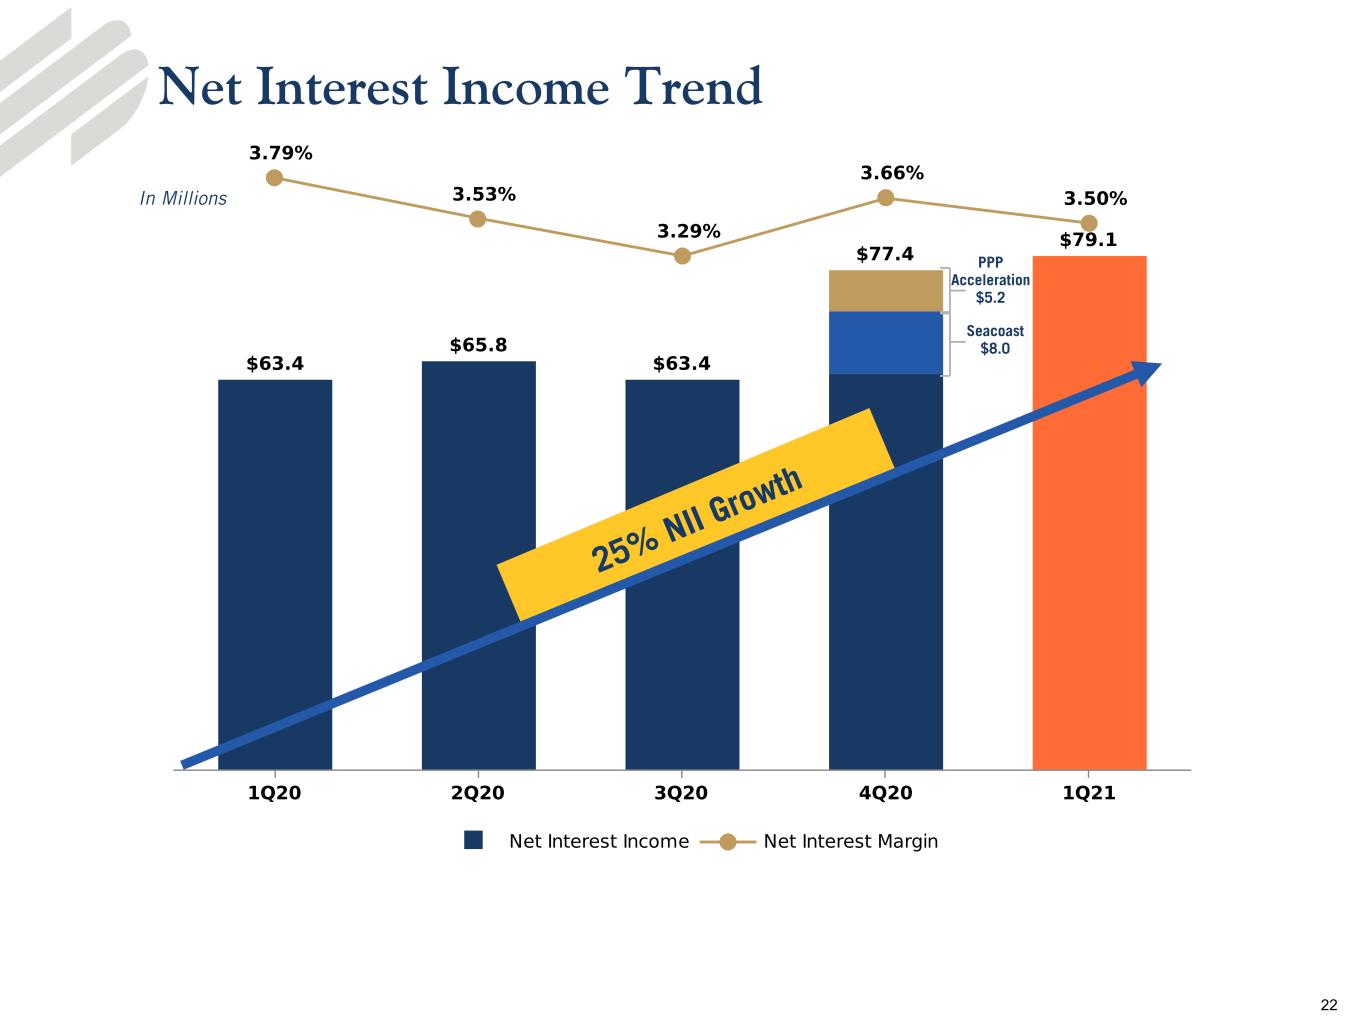
Net Interest Income Trend In Millions 25% NII Gro wth PPP Acceleration $5.2 Seacoast $8.0 22
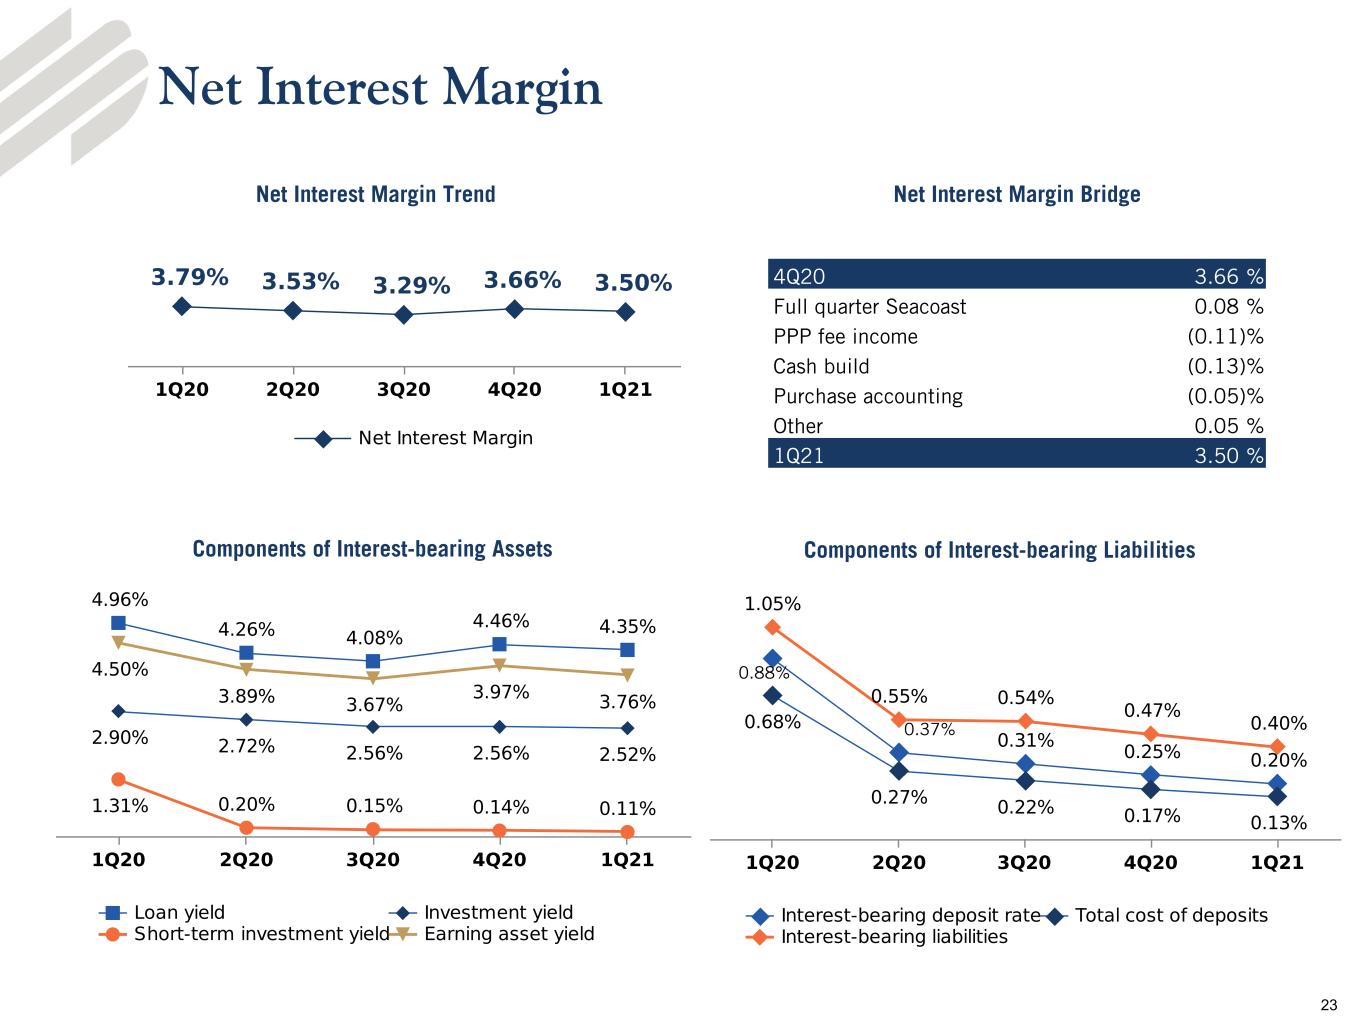
Net Interest Margin Components of Interest-bearing LiabilitiesComponents of Interest-bearing Assets 4Q20 3.66 % Full quarter Seacoast 0.08 % PPP fee income (0.11) % Cash build (0.13) % Purchase accounting (0.05) % Other 0.05 % 1Q21 3.50 % Net Interest Margin Trend Net Interest Margin Bridge 0.37% 0.88% 23
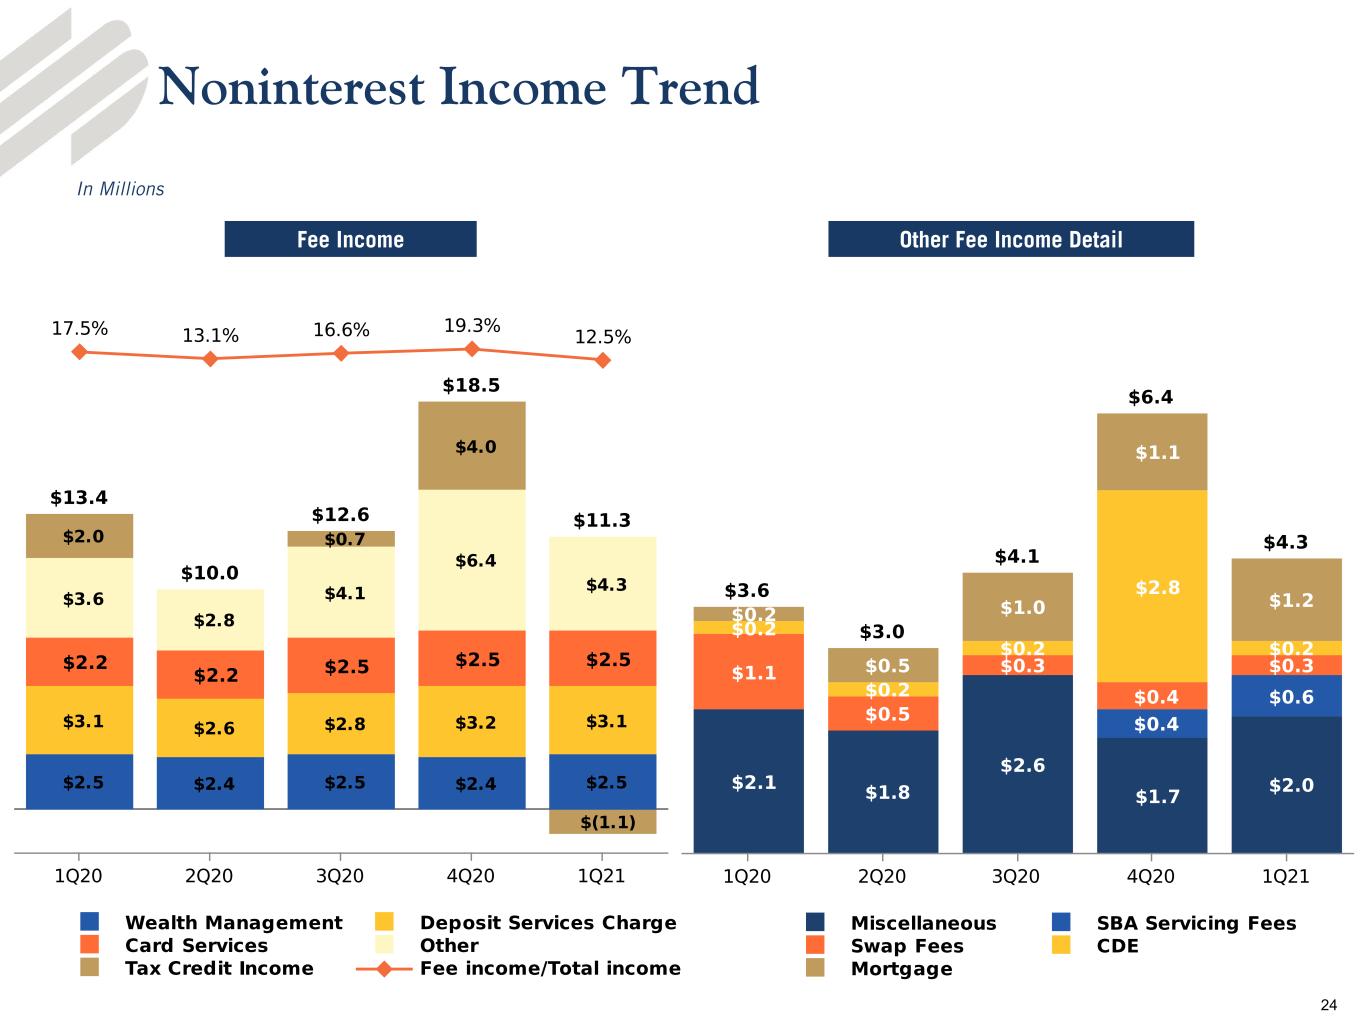
Noninterest Income Trend Other Fee Income DetailFee Income In Millions 24
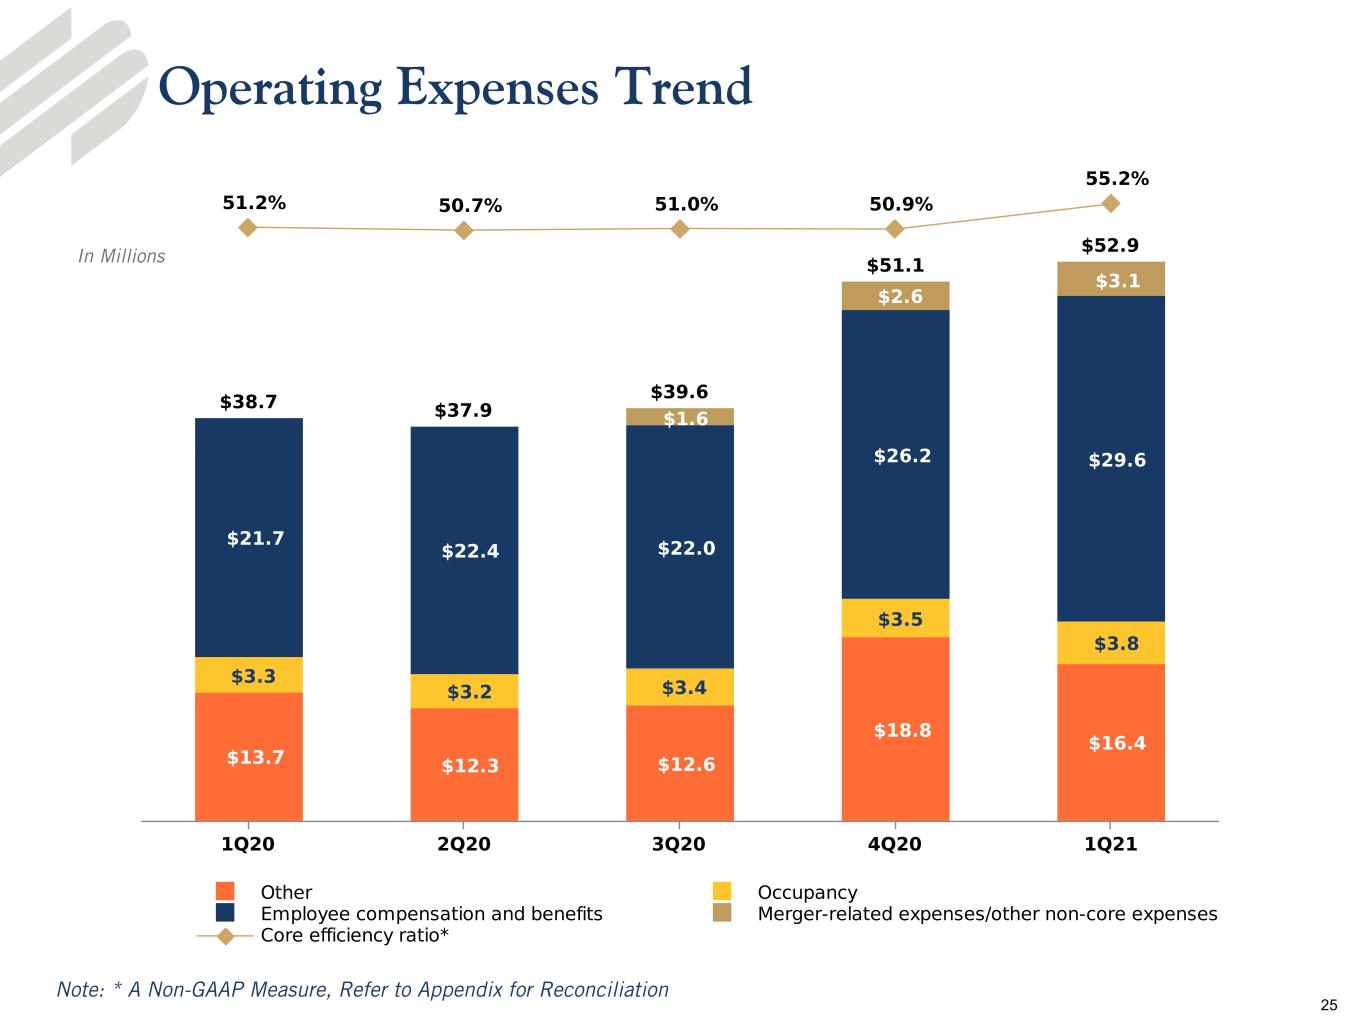
Operating Expenses Trend Note: * A Non-GAAP Measure, Refer to Appendix for Reconciliation In Millions 25
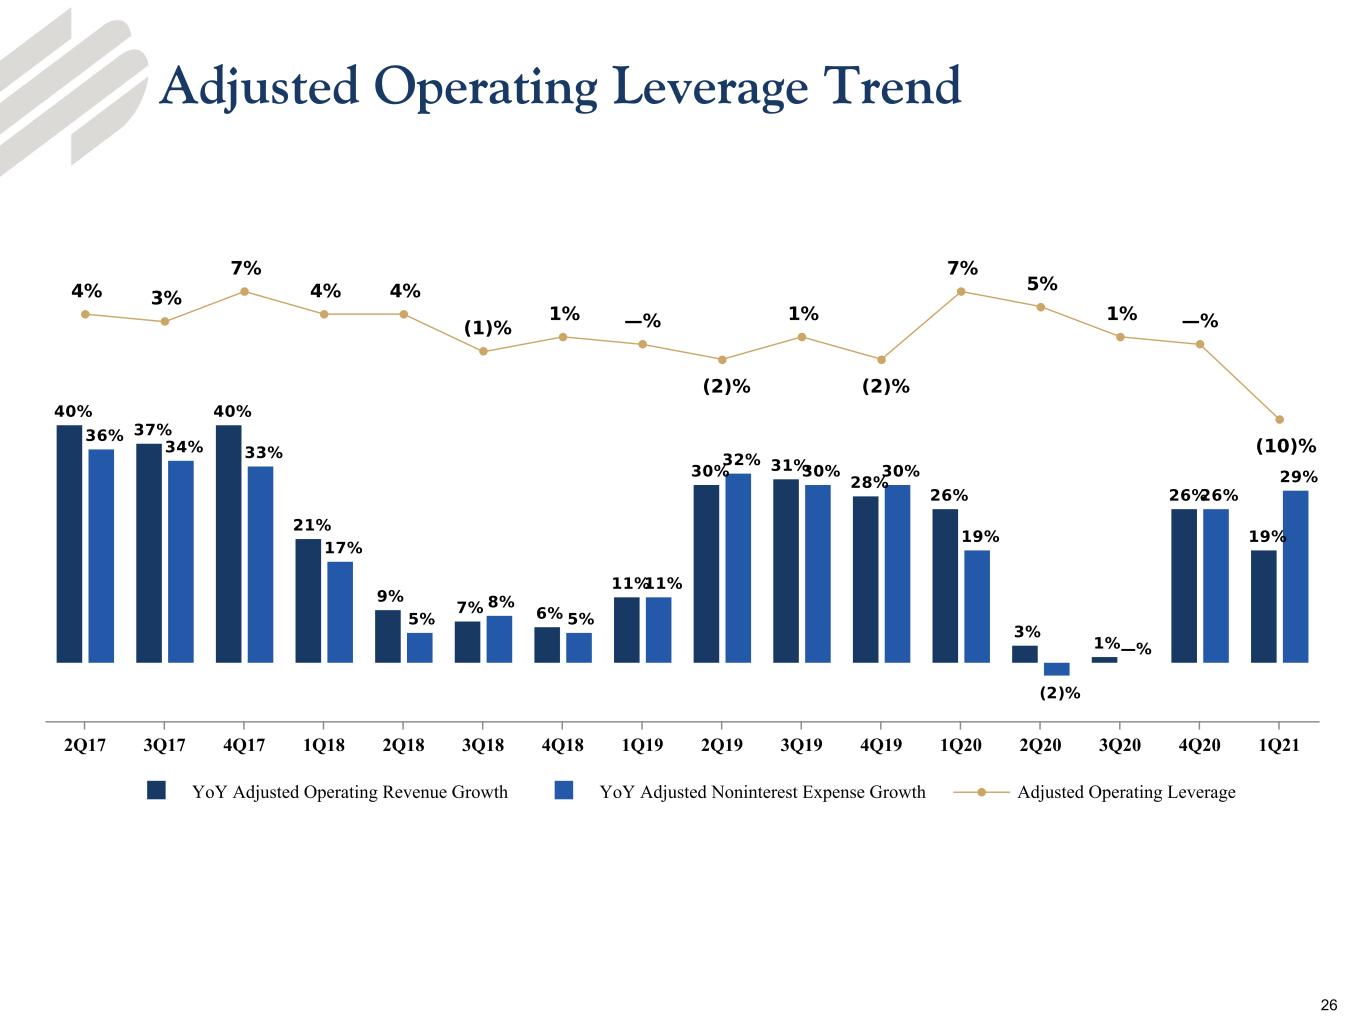
Adjusted Operating Leverage Trend YoY Adjusted Operating Revenue Growth YoY Adjusted Noninterest Expense Growth Adjusted Operating Leverage 2Q17 3Q17 4Q17 1Q18 2Q18 3Q18 4Q18 1Q19 2Q19 3Q19 4Q19 1Q20 2Q20 3Q20 4Q20 1Q21 26
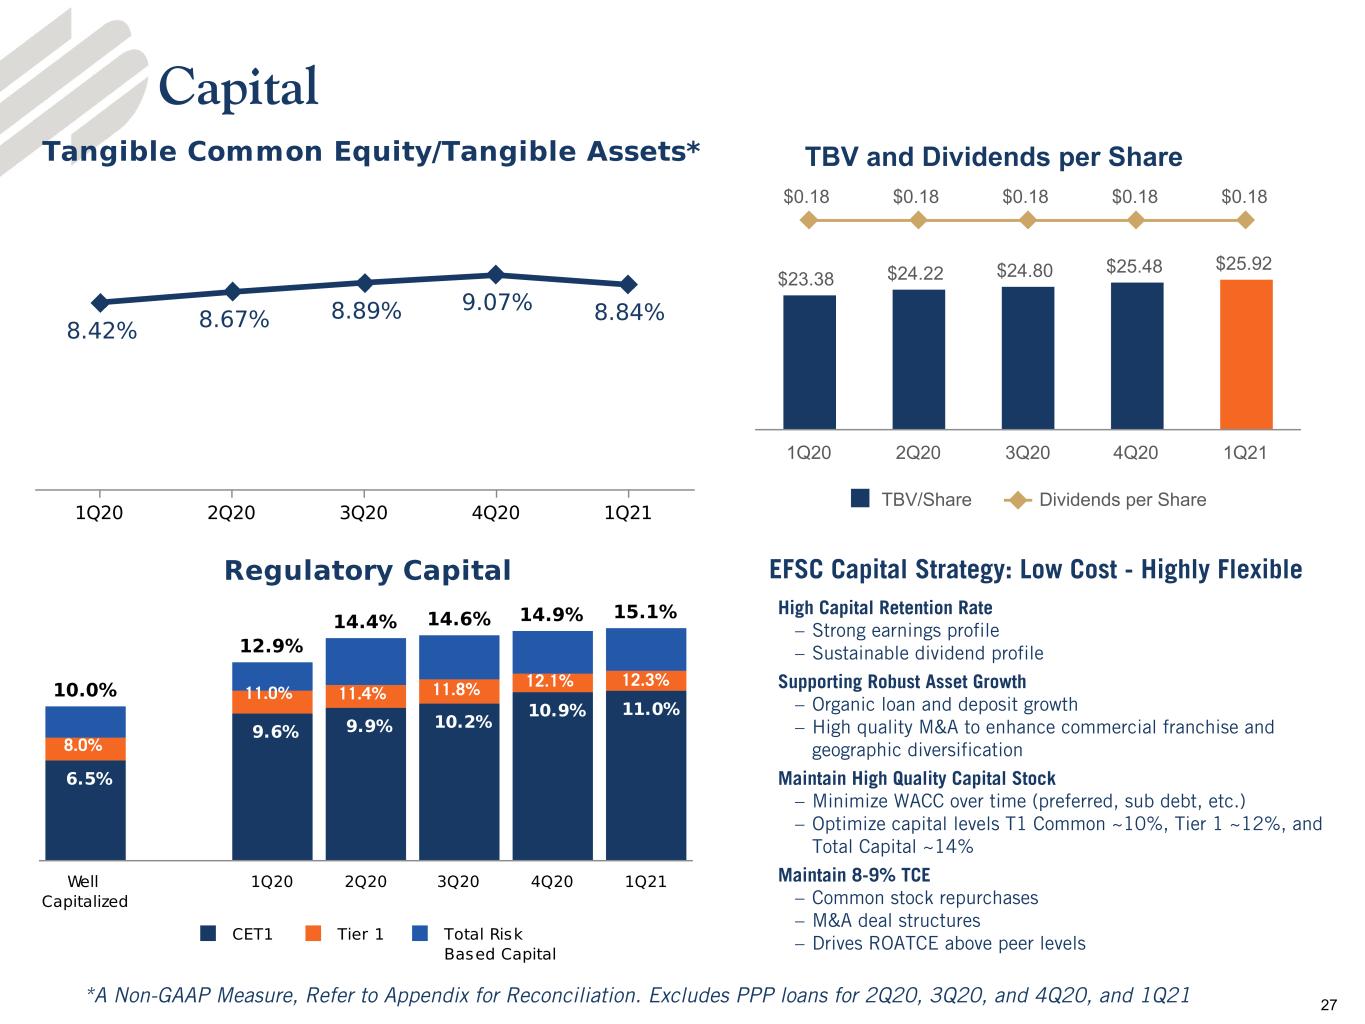
Capital *A Non-GAAP Measure, Refer to Appendix for Reconciliation. Excludes PPP loans for 2Q20, 3Q20, and 4Q20, and 1Q21 EFSC Capital Strategy: Low Cost - Highly Flexible High Capital Retention Rate – Strong earnings profile – Sustainable dividend profile Supporting Robust Asset Growth – Organic loan and deposit growth – High quality M&A to enhance commercial franchise and geographic diversification Maintain High Quality Capital Stock – Minimize WACC over time (preferred, sub debt, etc.) – Optimize capital levels T1 Common ~10%, Tier 1 ~12%, and Total Capital ~14% Maintain 8-9% TCE – Common stock repurchases – M&A deal structures – Drives ROATCE above peer levels 8.0% 11.0% 11.4% 11.8% 12.1% 12.3% TBV and Dividends per Share $23.38 $24.22 $24.80 $25.48 $25.92 $0.18 $0.18 $0.18 $0.18 $0.18 TBV/Share Dividends per Share 1Q20 2Q20 3Q20 4Q20 1Q21 27
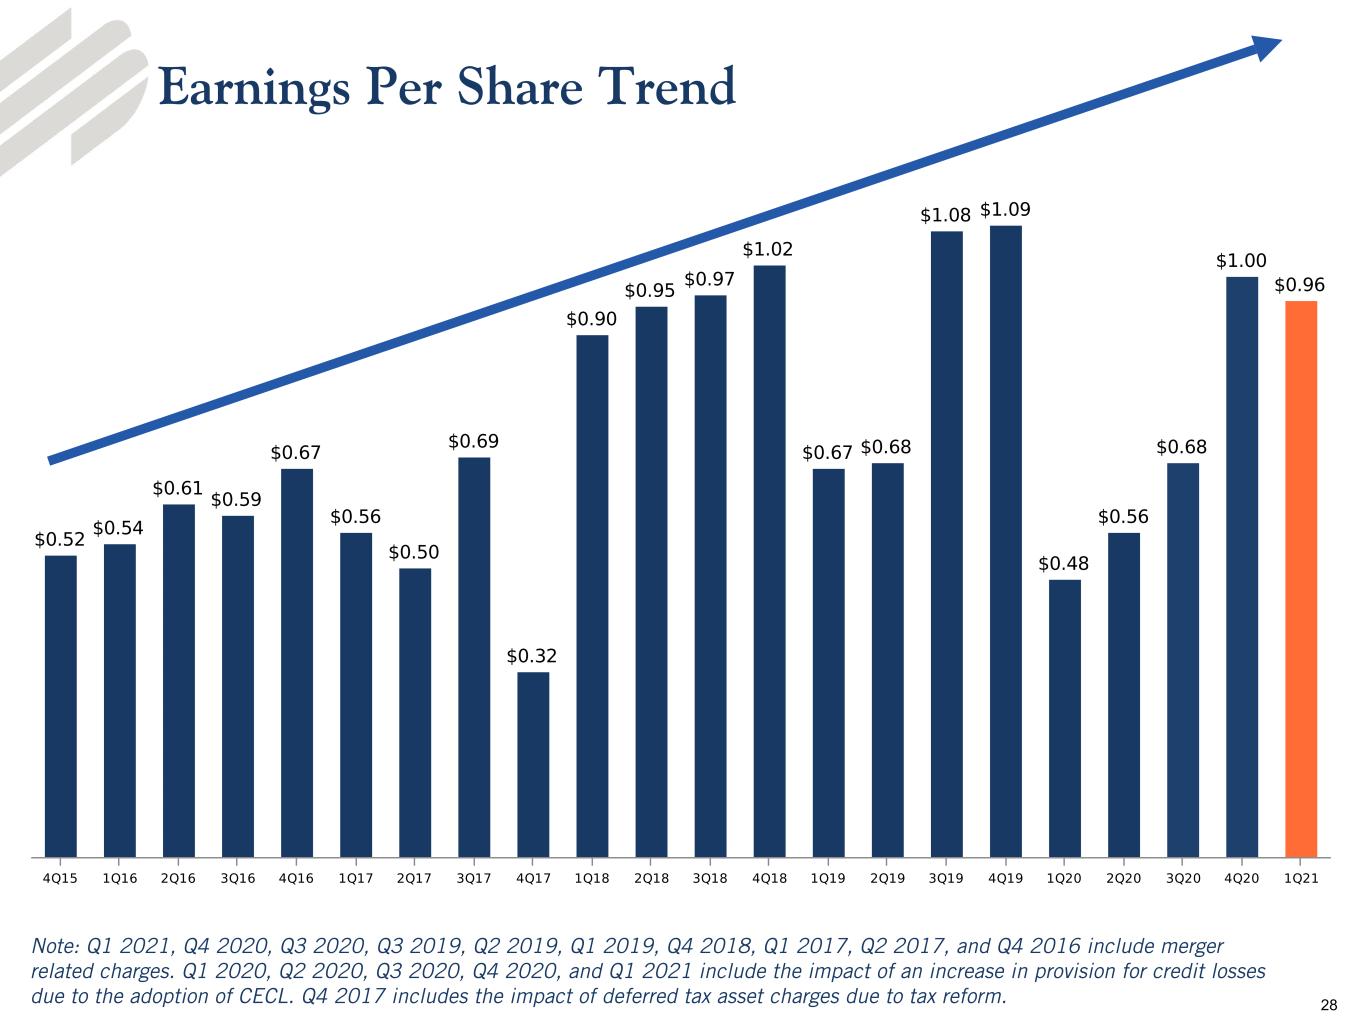
Earnings Per Share Trend Note: Q1 2021, Q4 2020, Q3 2020, Q3 2019, Q2 2019, Q1 2019, Q4 2018, Q1 2017, Q2 2017, and Q4 2016 include merger related charges. Q1 2020, Q2 2020, Q3 2020, Q4 2020, and Q1 2021 include the impact of an increase in provision for credit losses due to the adoption of CECL. Q4 2017 includes the impact of deferred tax asset charges due to tax reform. 28
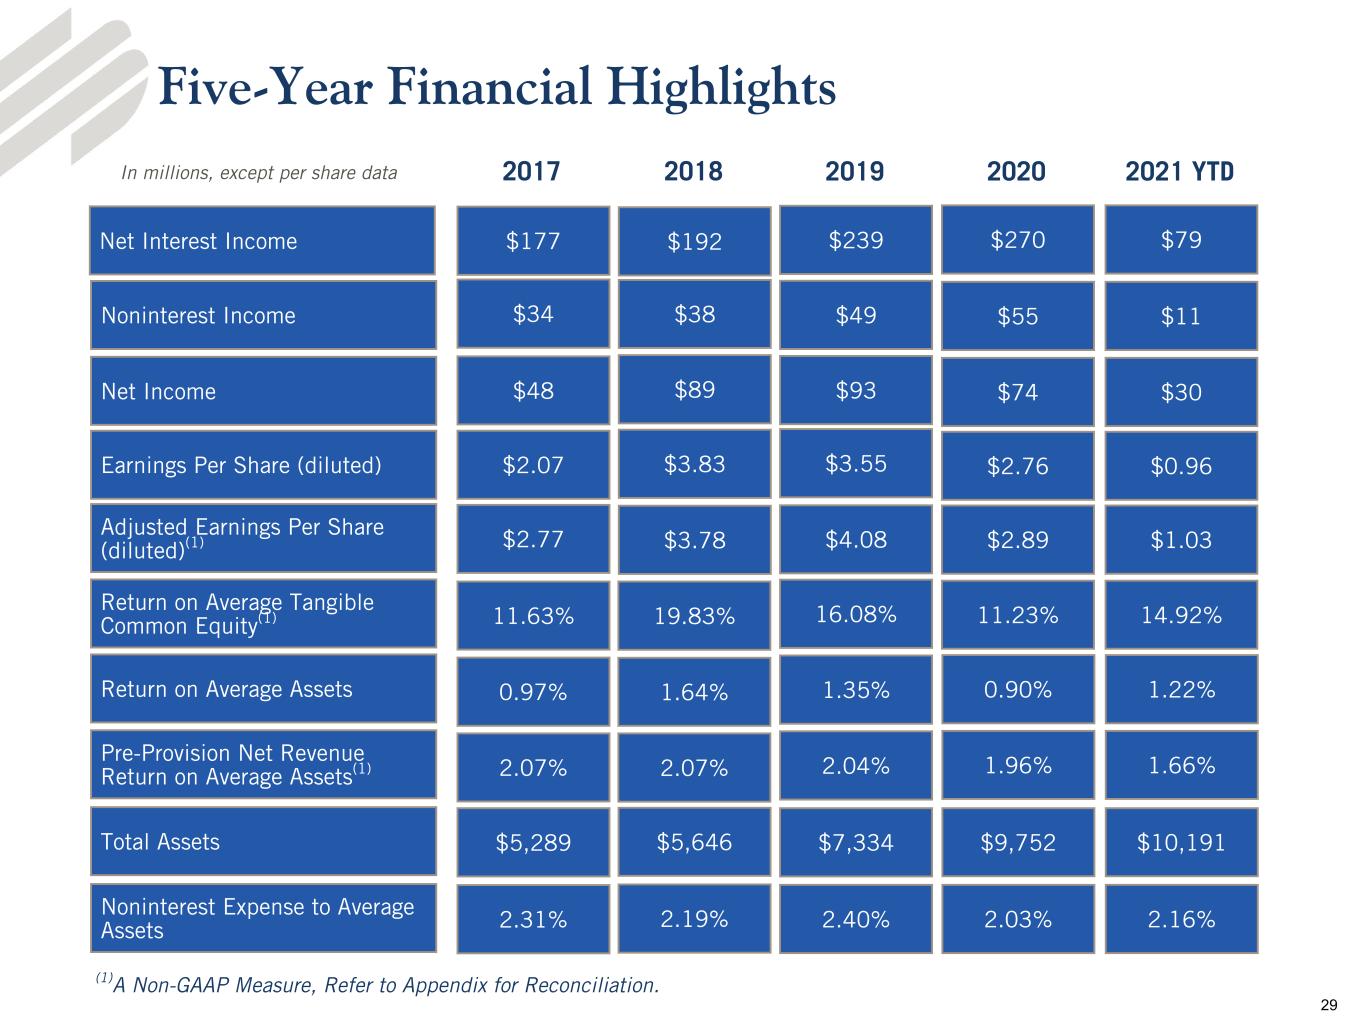
Five-Year Financial Highlights Noninterest Income Net Income Earnings Per Share (diluted) Return on Average Tangible Common Equity(1) Return on Average Assets Total Assets Net Interest Income $38 $89 $3.83 19.83% 1.64% $5,646 $192 2018 $49 $93 $3.55 16.08% 1.35% $7,334 $239 2019 $55 $74 $2.76 11.23% 0.90% $9,752 $270 2020 $34 $48 $2.07 11.63% 0.97% $5,289 $177 2017In millions, except per share data (1)A Non-GAAP Measure, Refer to Appendix for Reconciliation. Adjusted Earnings Per Share (diluted)(1) $3.78 $4.08 $2.89$2.77 Pre-Provision Net Revenue Return on Average Assets(1) 2.07% 2.04% 1.96%2.07% Noninterest Expense to Average Assets 2.19% 2.40% 2.03%2.31% $11 $30 $0.96 14.92% 1.22% $10,191 $79 2021 YTD $1.03 1.66% 2.16% 29
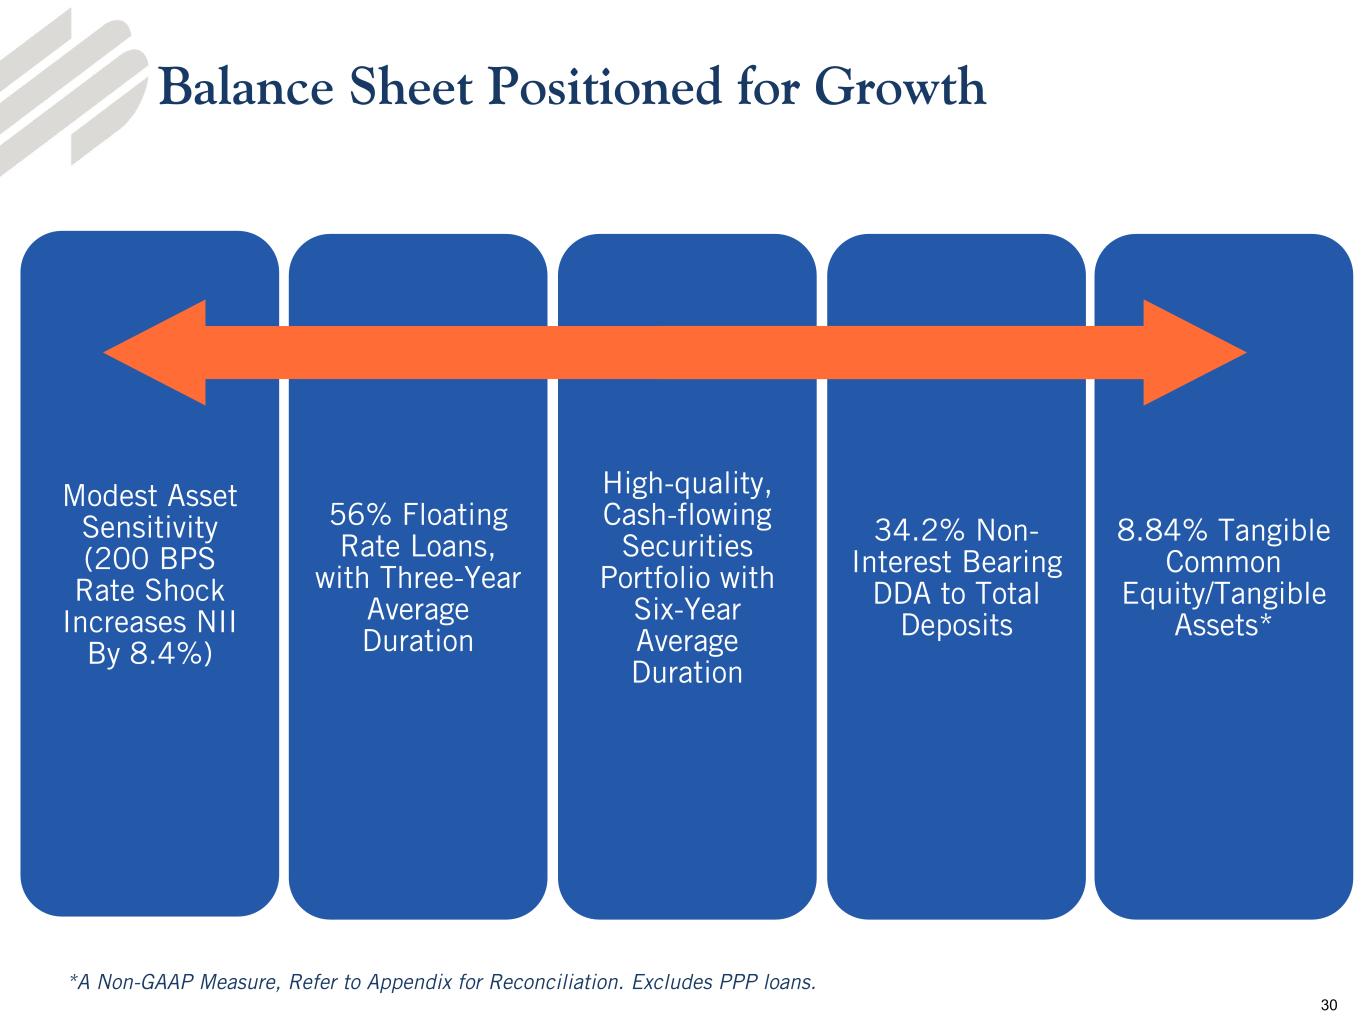
Modest Asset Sensitivity (200 BPS Rate Shock Increases NII By 8.4%) 56% Floating Rate Loans, with Three-Year Average Duration High-quality, Cash-flowing Securities Portfolio with Six-Year Average Duration 34.2% Non- Interest Bearing DDA to Total Deposits 8.84% Tangible Common Equity/Tangible Assets* Balance Sheet Positioned for Growth *A Non-GAAP Measure, Refer to Appendix for Reconciliation. Excludes PPP loans. 30
Appendix 1st Quarter 2021 EFSC Investor Presentation
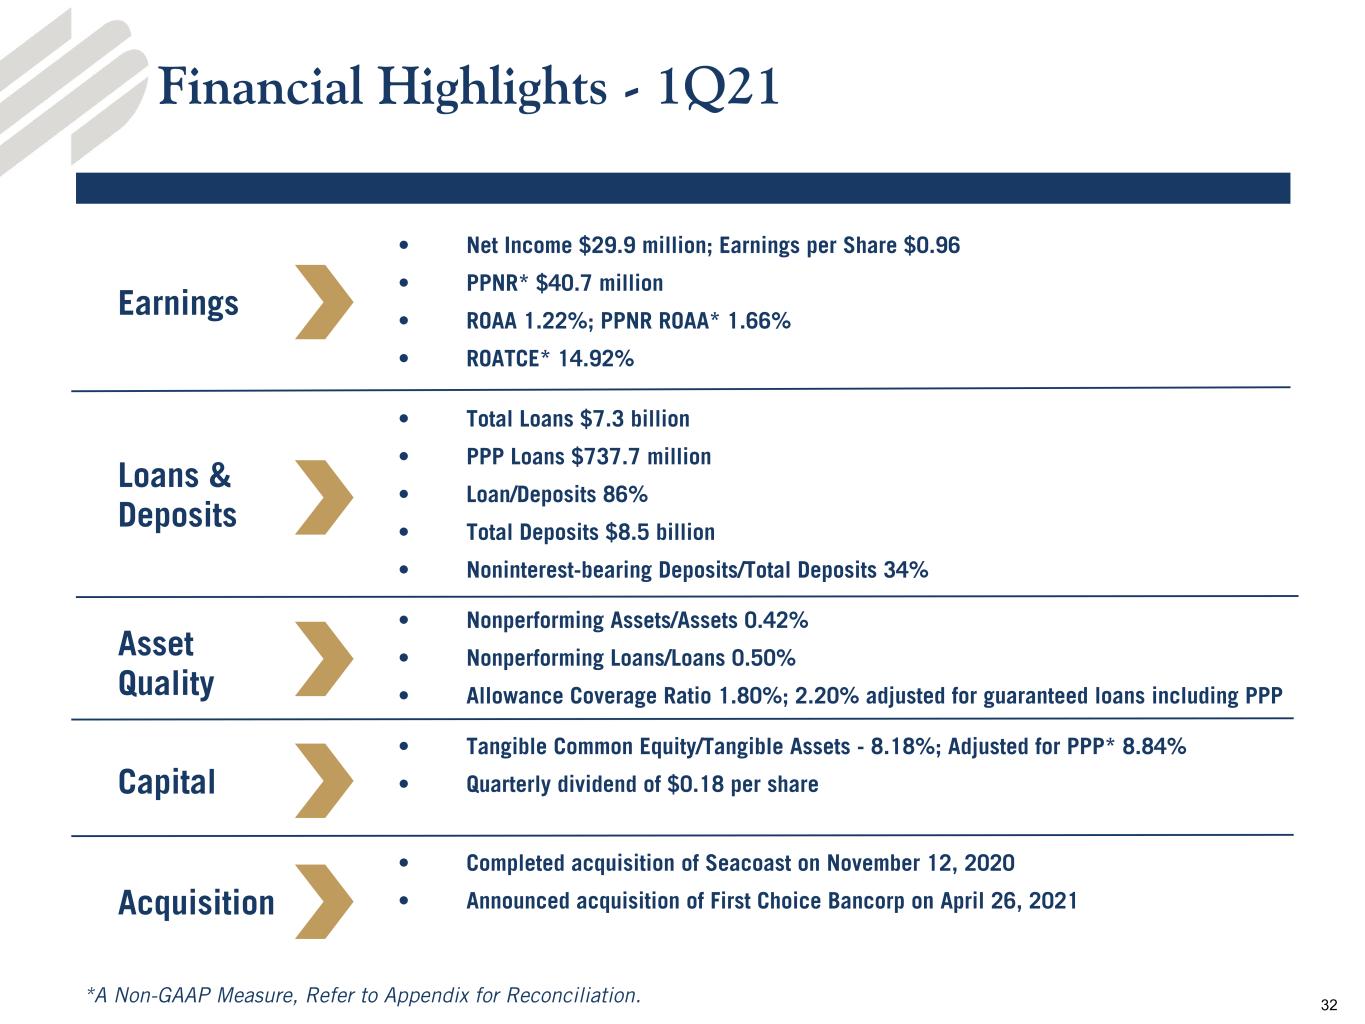
Financial Highlights - 1Q21 *A Non-GAAP Measure, Refer to Appendix for Reconciliation. Capital • Tangible Common Equity/Tangible Assets - 8.18%; Adjusted for PPP* 8.84% • Quarterly dividend of $0.18 per share • Net Income $29.9 million; Earnings per Share $0.96 • PPNR* $40.7 million • ROAA 1.22%; PPNR ROAA* 1.66% • ROATCE* 14.92% Earnings Loans & Deposits • Total Loans $7.3 billion • PPP Loans $737.7 million • Loan/Deposits 86% • Total Deposits $8.5 billion • Noninterest-bearing Deposits/Total Deposits 34% Asset Quality • Nonperforming Assets/Assets 0.42% • Nonperforming Loans/Loans 0.50% • Allowance Coverage Ratio 1.80%; 2.20% adjusted for guaranteed loans including PPP Acquisition • Completed acquisition of Seacoast on November 12, 2020 • Announced acquisition of First Choice Bancorp on April 26, 2021 32
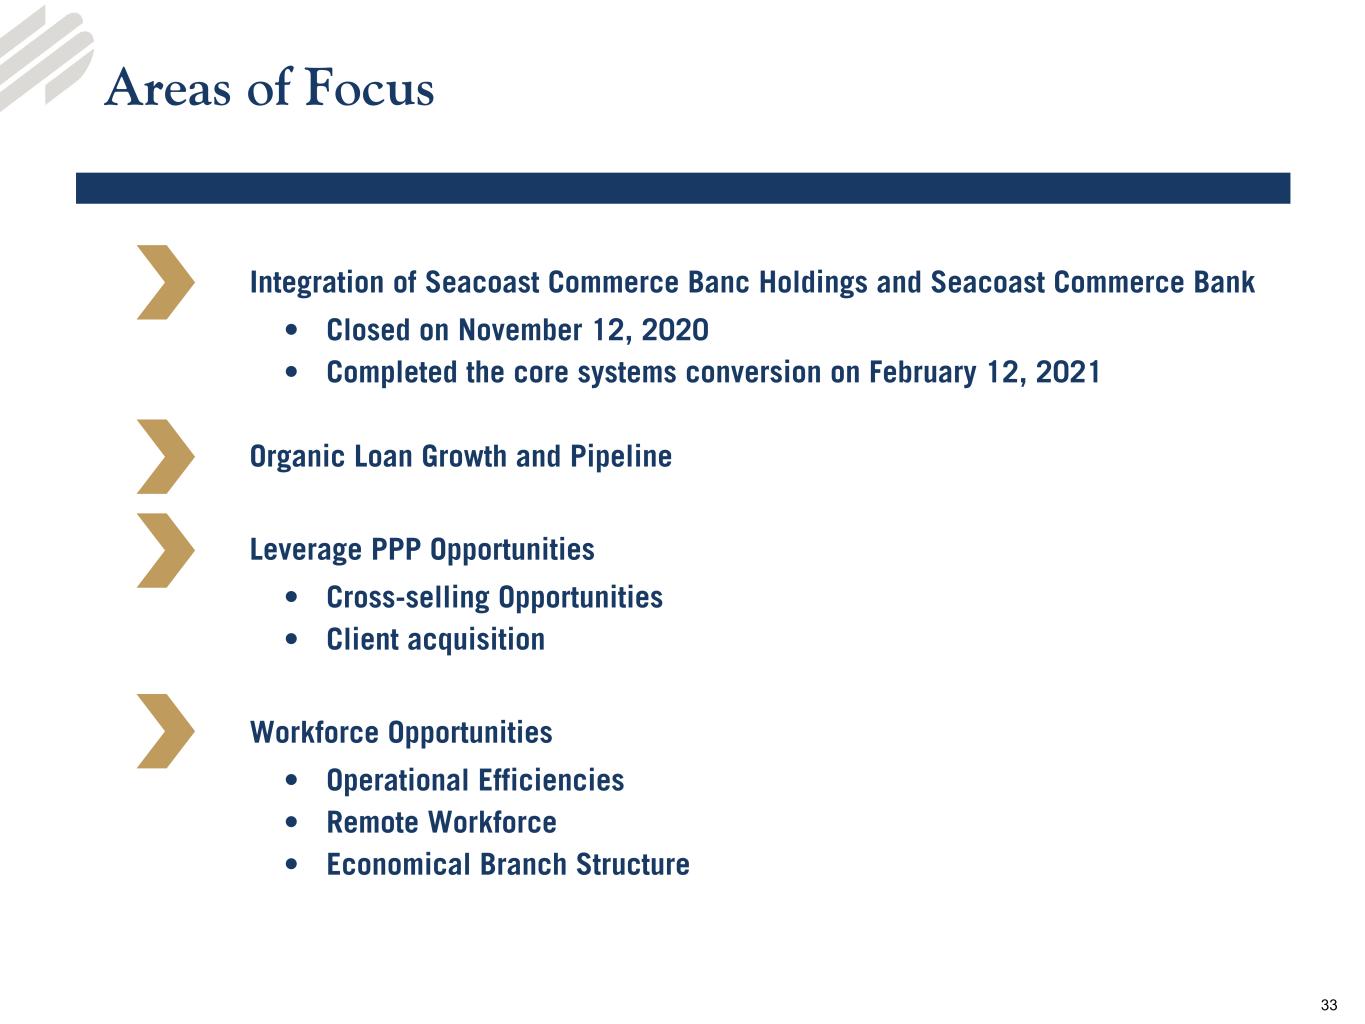
Areas of Focus Integration of Seacoast Commerce Banc Holdings and Seacoast Commerce Bank • Closed on November 12, 2020 • Completed the core systems conversion on February 12, 2021 Organic Loan Growth and Pipeline Leverage PPP Opportunities • Cross-selling Opportunities • Client acquisition Workforce Opportunities • Operational Efficiencies • Remote Workforce • Economical Branch Structure 33
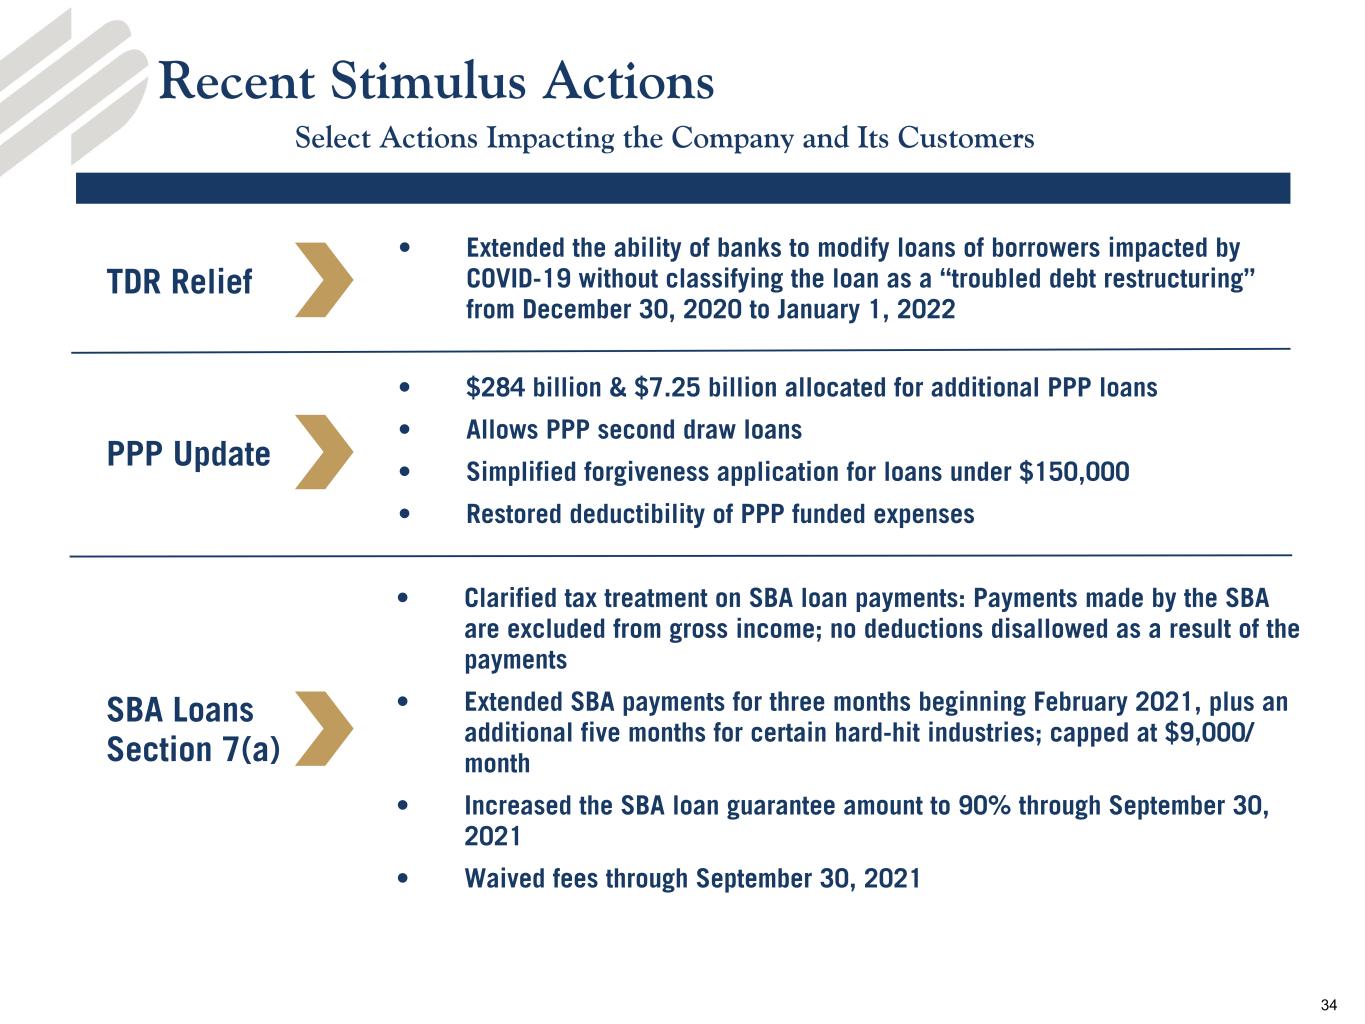
Recent Stimulus Actions Select Actions Impacting the Company and Its Customers • Extended the ability of banks to modify loans of borrowers impacted by COVID-19 without classifying the loan as a “troubled debt restructuring” from December 30, 2020 to January 1, 2022 PPP Update • $284 billion & $7.25 billion allocated for additional PPP loans • Allows PPP second draw loans • Simplified forgiveness application for loans under $150,000 • Restored deductibility of PPP funded expenses SBA Loans Section 7(a) • Clarified tax treatment on SBA loan payments: Payments made by the SBA are excluded from gross income; no deductions disallowed as a result of the payments • Extended SBA payments for three months beginning February 2021, plus an additional five months for certain hard-hit industries; capped at $9,000/ month • Increased the SBA loan guarantee amount to 90% through September 30, 2021 • Waived fees through September 30, 2021 TDR Relief 34
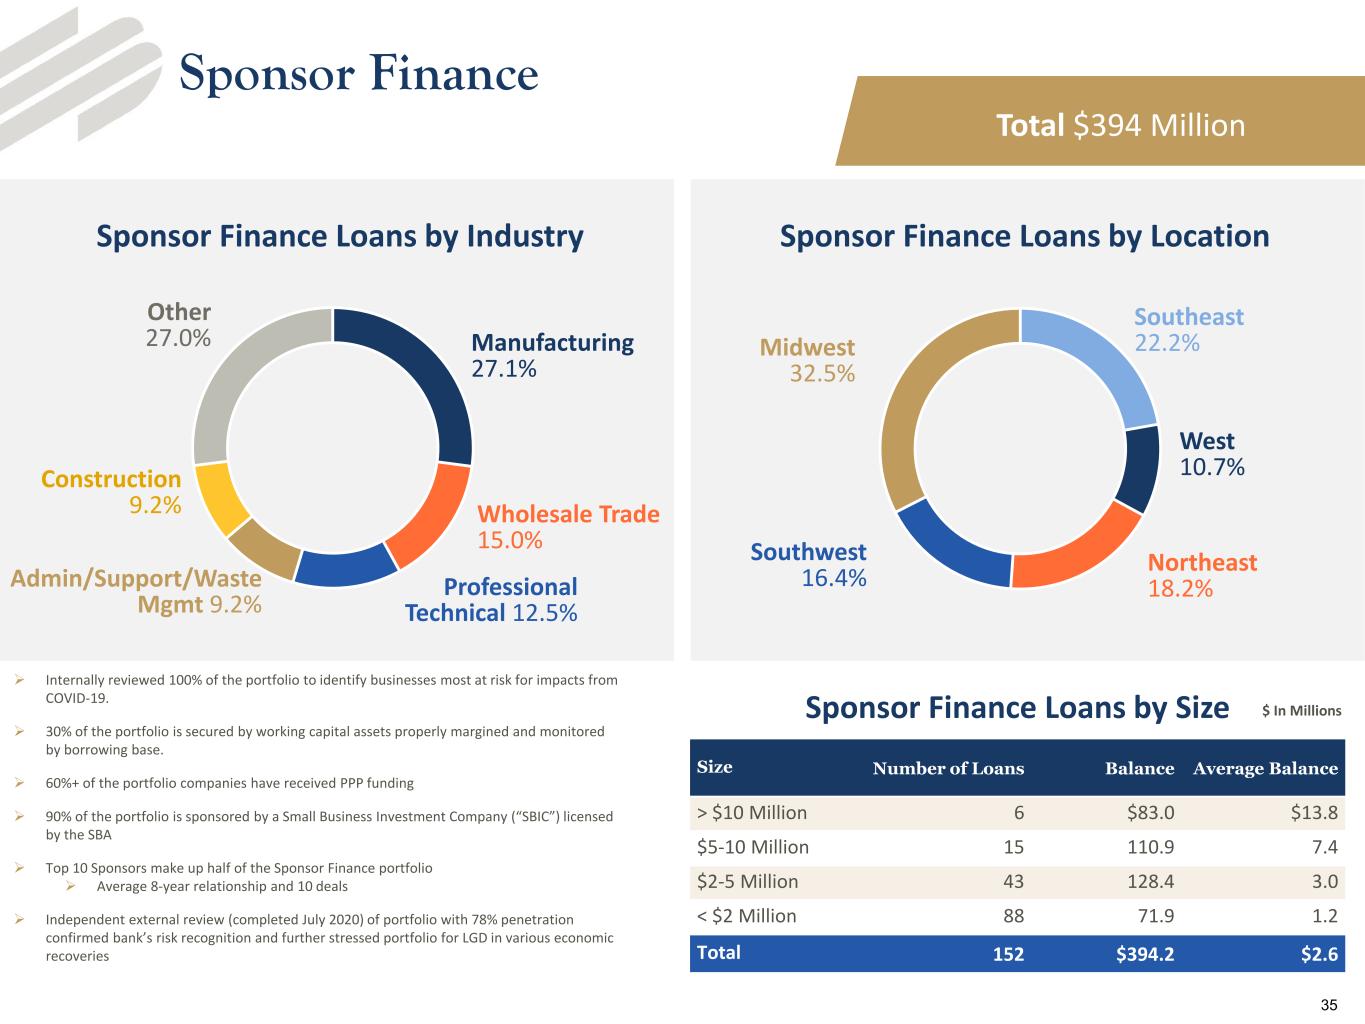
Manufacturing 27.1% Wholesale Trade 15.0% Professional Technical 12.5% Admin/Support/Waste Mgmt 9.2% Construction 9.2% Other 27.0% Southeast 22.2% West 10.7% Northeast 18.2% Southwest 16.4% Midwest 32.5% Total $394 Million Internally reviewed 100% of the portfolio to identify businesses most at risk for impacts from COVID-19. 30% of the portfolio is secured by working capital assets properly margined and monitored by borrowing base. 60%+ of the portfolio companies have received PPP funding 90% of the portfolio is sponsored by a Small Business Investment Company (“SBIC”) licensed by the SBA Top 10 Sponsors make up half of the Sponsor Finance portfolio Average 8-year relationship and 10 deals Independent external review (completed July 2020) of portfolio with 78% penetration confirmed bank’s risk recognition and further stressed portfolio for LGD in various economic recoveries Size Number of Loans Balance Average Balance > $10 Million 6 $83.0 $13.8 $5-10 Million 15 110.9 7.4 $2-5 Million 43 128.4 3.0 < $2 Million 88 71.9 1.2 Total 152 $394.2 $2.6 Sponsor Finance Loans by Size $ In Millions Sponsor Finance Sponsor Finance Loans by LocationSponsor Finance Loans by Industry 35
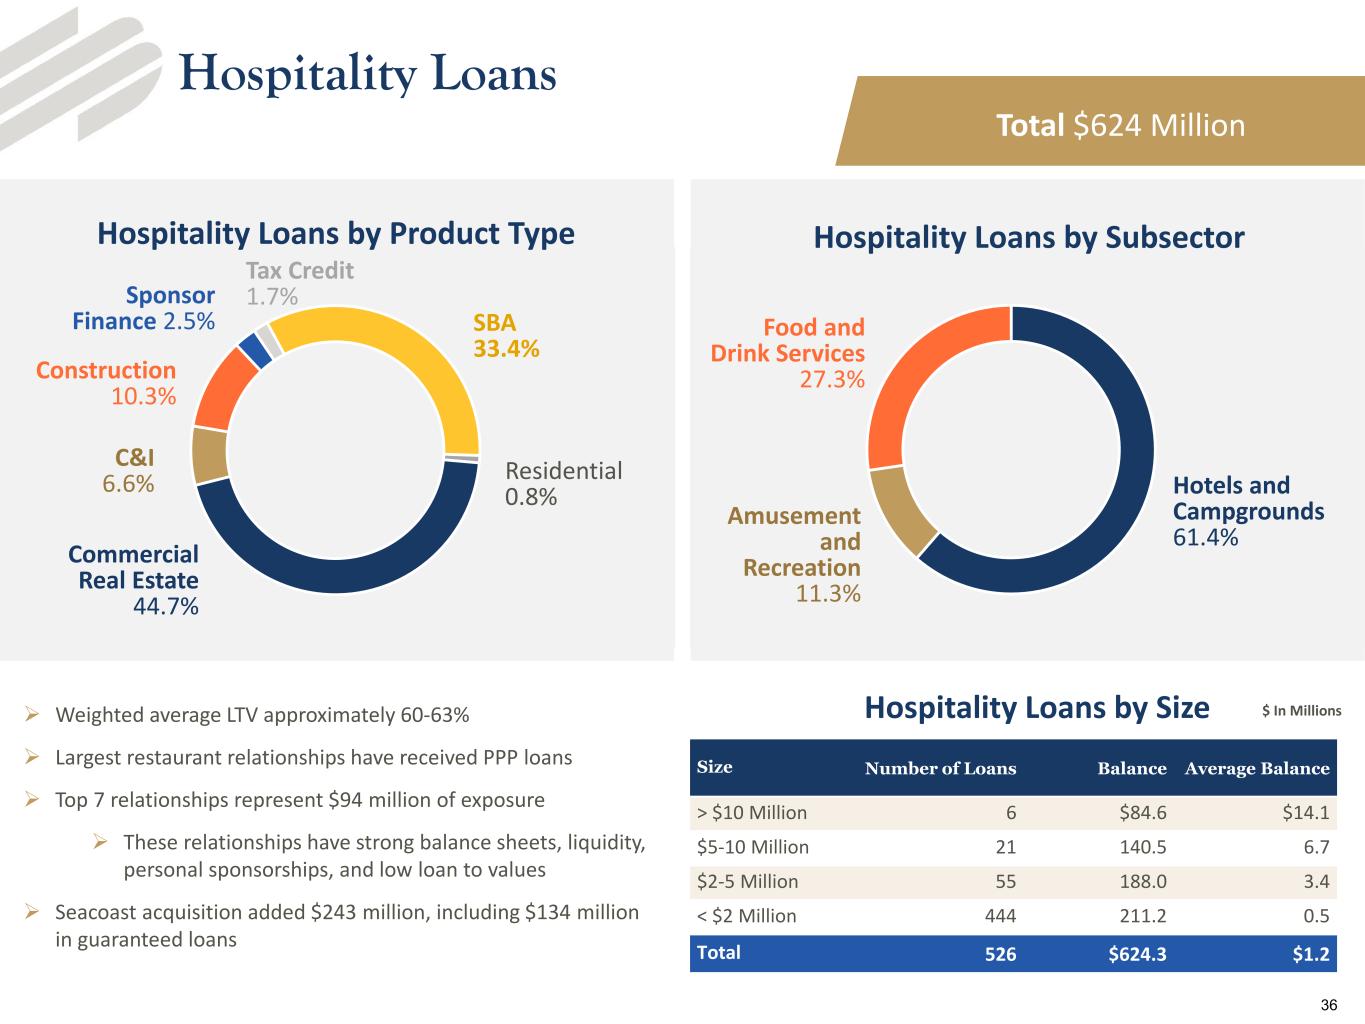
Hospitality Loans Size Number of Loans Balance Average Balance > $10 Million 6 $84.6 $14.1 $5-10 Million 21 140.5 6.7 $2-5 Million 55 188.0 3.4 < $2 Million 444 211.2 0.5 Total 526 $624.3 $1.2 Hospitality Loans by Size $ In Millions Commercial Real Estate 44.7% C&I 6.6% Construction 10.3% Sponsor Finance 2.5% Tax Credit 1.7% SBA 33.4% Residential 0.8% Hospitality Loans by Product Type Hotels and Campgrounds 61.4% Amusement and Recreation 11.3% Food and Drink Services 27.3% Hospitality Loans by Subsector Total $624 Million Weighted average LTV approximately 60-63% Largest restaurant relationships have received PPP loans Top 7 relationships represent $94 million of exposure These relationships have strong balance sheets, liquidity, personal sponsorships, and low loan to values Seacoast acquisition added $243 million, including $134 million in guaranteed loans 36
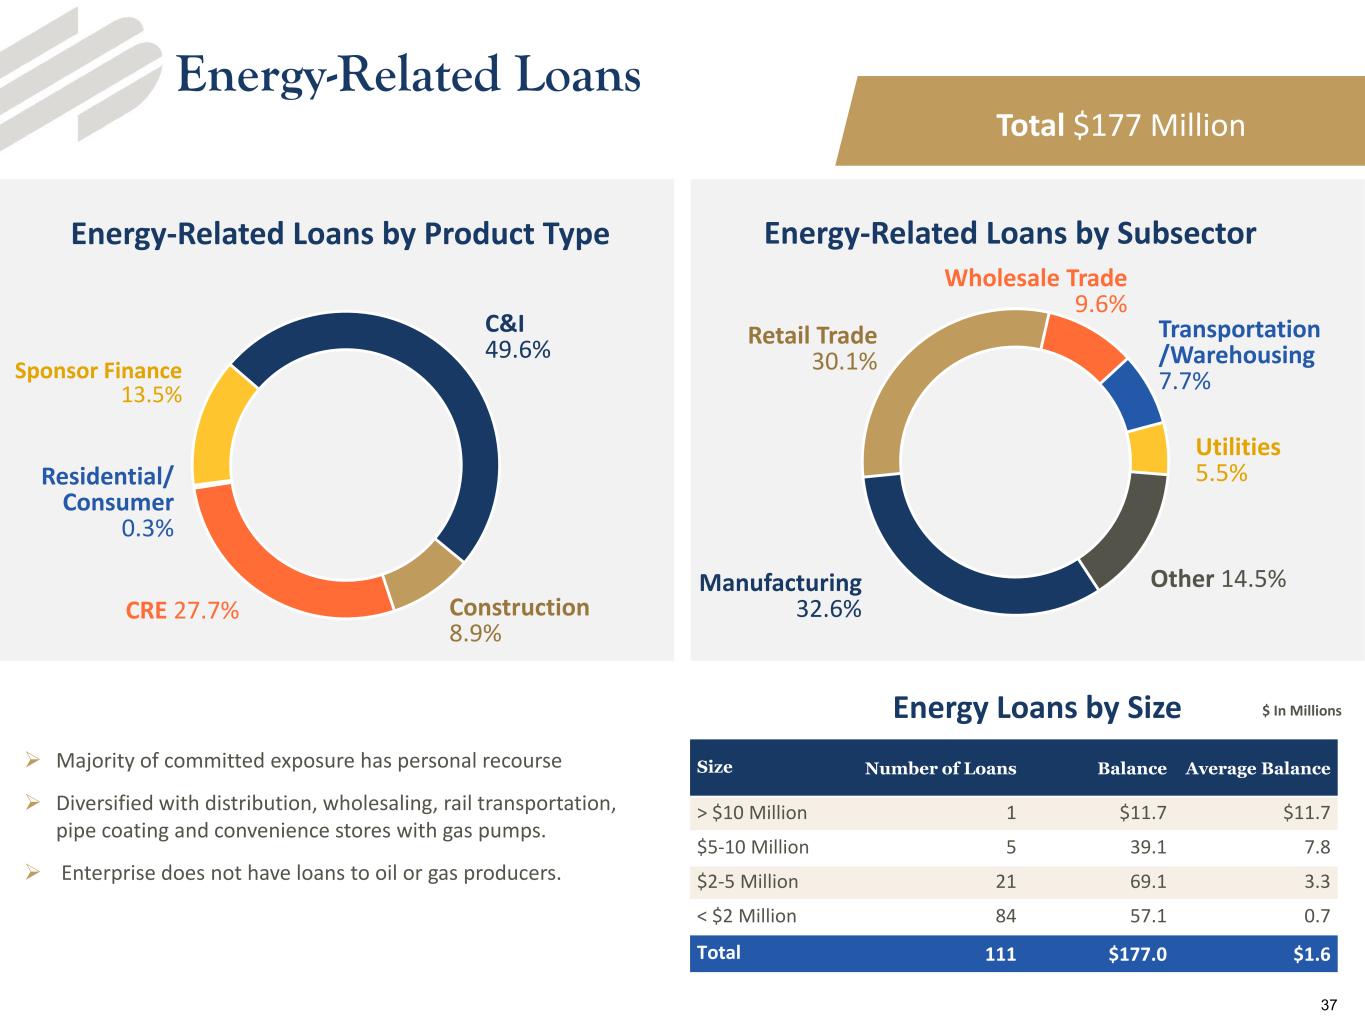
Total $177 Million Majority of committed exposure has personal recourse Diversified with distribution, wholesaling, rail transportation, pipe coating and convenience stores with gas pumps. Enterprise does not have loans to oil or gas producers. Energy Loans by Size $ In Millions C&I 49.6% Construction 8.9% CRE 27.7% Residential/ Consumer 0.3% Sponsor Finance 13.5% Energy-Related Loans by Product Type Manufacturing 32.6% Retail Trade 30.1% Wholesale Trade 9.6% Transportation /Warehousing 7.7% Utilities 5.5% Other 14.5% Energy-Related Loans by Subsector Energy-Related Loans Size Number of Loans Balance Average Balance > $10 Million 1 $11.7 $11.7 $5-10 Million 5 39.1 7.8 $2-5 Million 21 69.1 3.3 < $2 Million 84 57.1 0.7 Total 111 $177.0 $1.6 37
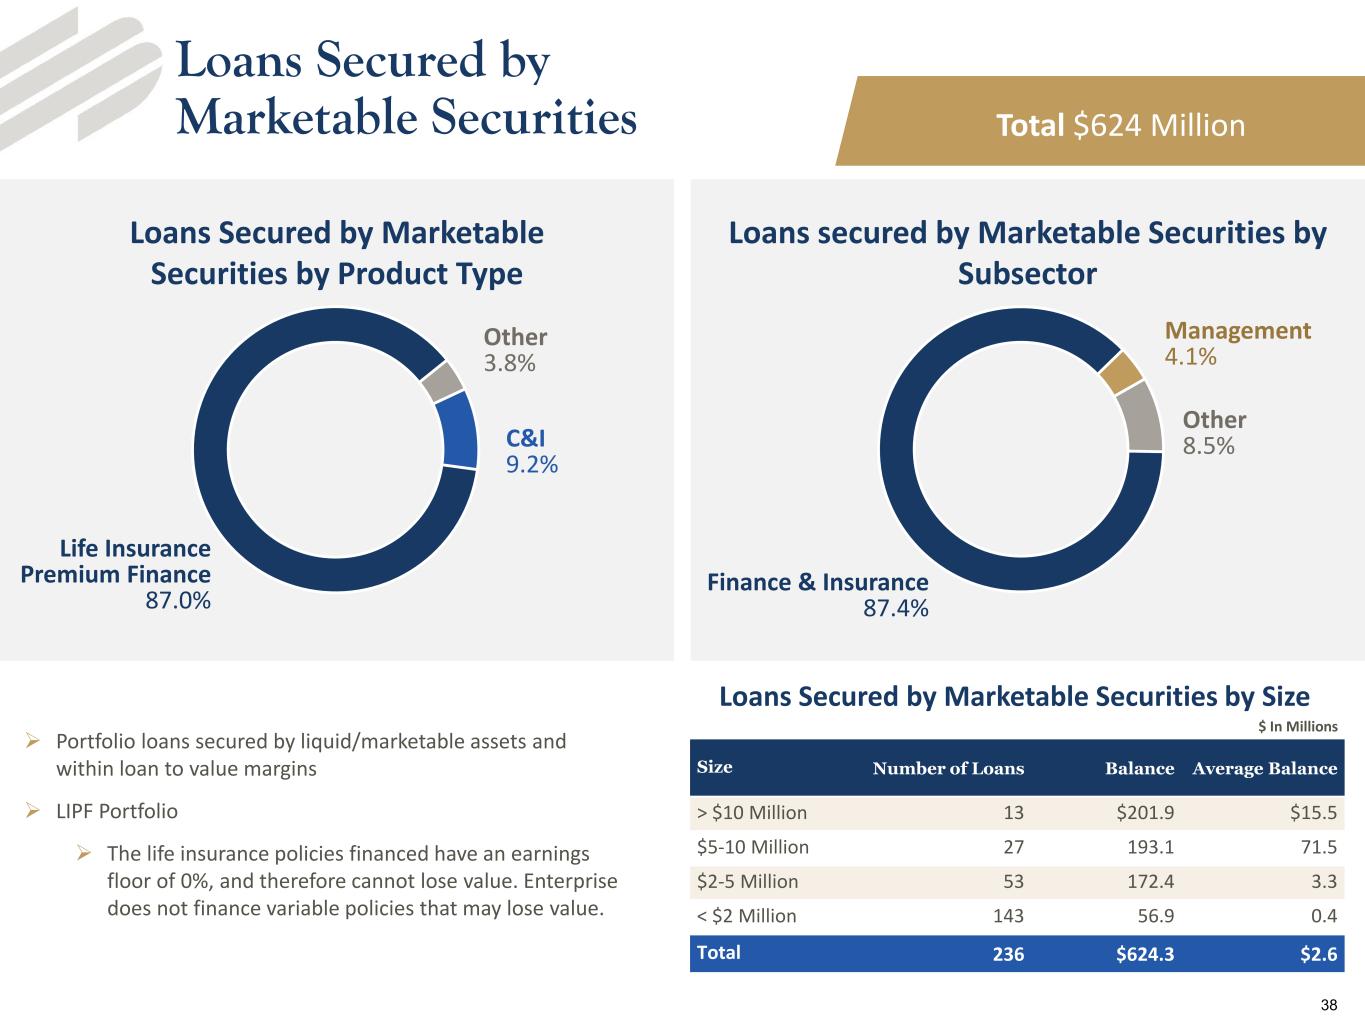
Total $624 Million Portfolio loans secured by liquid/marketable assets and within loan to value margins LIPF Portfolio The life insurance policies financed have an earnings floor of 0%, and therefore cannot lose value. Enterprise does not finance variable policies that may lose value. Size Number of Loans Balance Average Balance > $10 Million 13 $201.9 $15.5 $5-10 Million 27 193.1 71.5 $2-5 Million 53 172.4 3.3 < $2 Million 143 56.9 0.4 Total 236 $624.3 $2.6 Loans Secured by Marketable Securities by Size $ In Millions Loans Secured by Marketable Securities Life Insurance Premium Finance 87.0% Other 3.8% C&I 9.2% Finance & Insurance 87.4% Management 4.1% Other 8.5% Loans secured by Marketable Securities by Subsector Loans Secured by Marketable Securities by Product Type 38
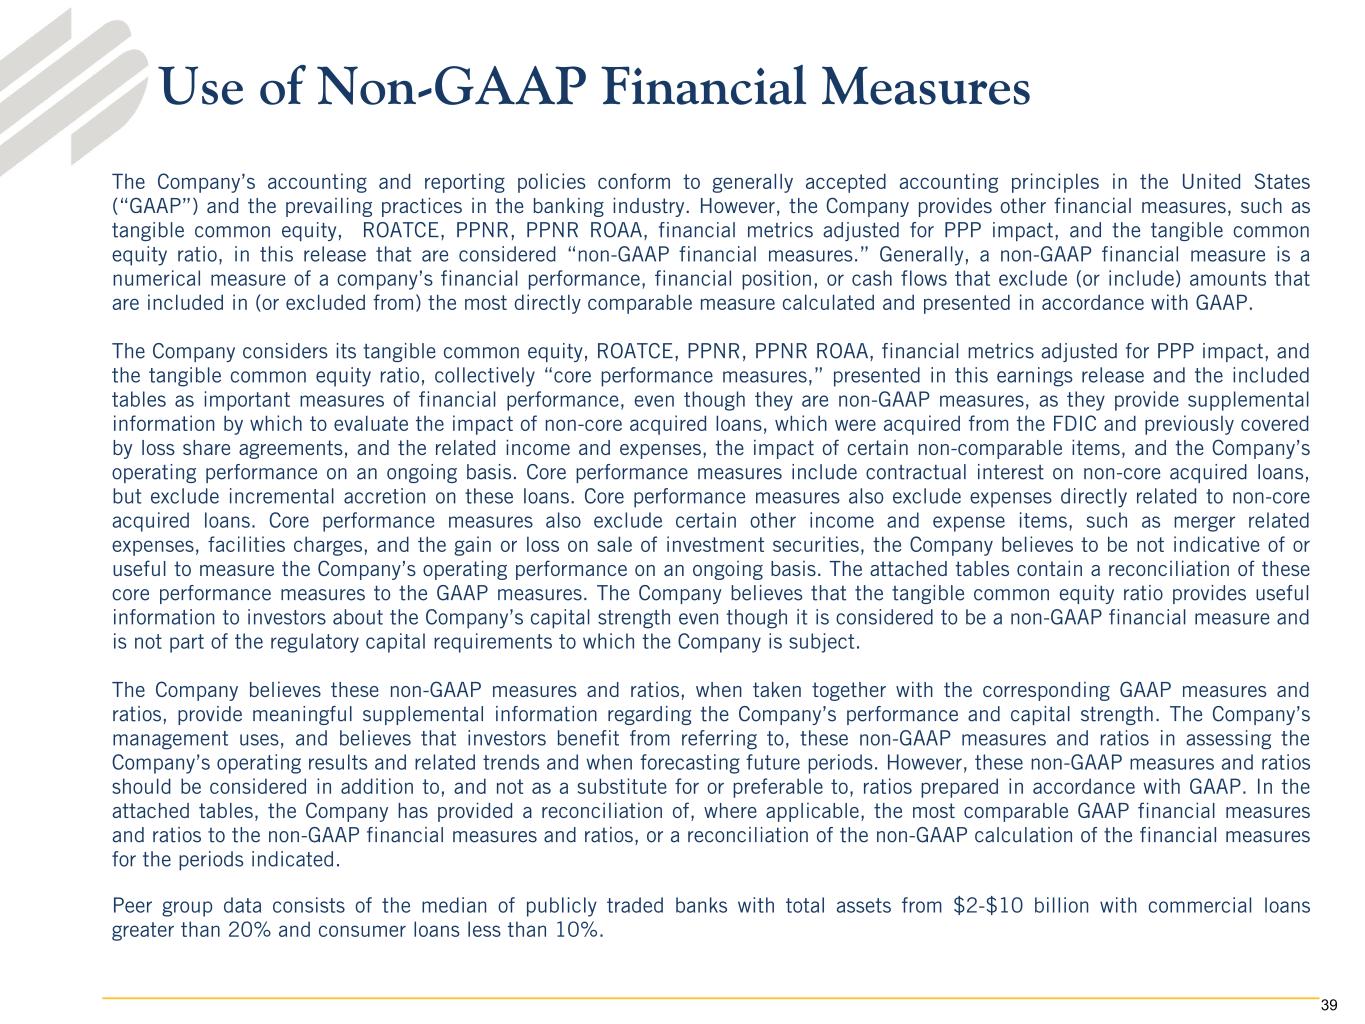
Use of Non-GAAP Financial Measures The Company’s accounting and reporting policies conform to generally accepted accounting principles in the United States (“GAAP”) and the prevailing practices in the banking industry. However, the Company provides other financial measures, such as tangible common equity, ROATCE, PPNR, PPNR ROAA, financial metrics adjusted for PPP impact, and the tangible common equity ratio, in this release that are considered “non-GAAP financial measures.” Generally, a non-GAAP financial measure is a numerical measure of a company’s financial performance, financial position, or cash flows that exclude (or include) amounts that are included in (or excluded from) the most directly comparable measure calculated and presented in accordance with GAAP. The Company considers its tangible common equity, ROATCE, PPNR, PPNR ROAA, financial metrics adjusted for PPP impact, and the tangible common equity ratio, collectively “core performance measures,” presented in this earnings release and the included tables as important measures of financial performance, even though they are non-GAAP measures, as they provide supplemental information by which to evaluate the impact of non-core acquired loans, which were acquired from the FDIC and previously covered by loss share agreements, and the related income and expenses, the impact of certain non-comparable items, and the Company’s operating performance on an ongoing basis. Core performance measures include contractual interest on non-core acquired loans, but exclude incremental accretion on these loans. Core performance measures also exclude expenses directly related to non-core acquired loans. Core performance measures also exclude certain other income and expense items, such as merger related expenses, facilities charges, and the gain or loss on sale of investment securities, the Company believes to be not indicative of or useful to measure the Company’s operating performance on an ongoing basis. The attached tables contain a reconciliation of these core performance measures to the GAAP measures. The Company believes that the tangible common equity ratio provides useful information to investors about the Company’s capital strength even though it is considered to be a non-GAAP financial measure and is not part of the regulatory capital requirements to which the Company is subject. The Company believes these non-GAAP measures and ratios, when taken together with the corresponding GAAP measures and ratios, provide meaningful supplemental information regarding the Company’s performance and capital strength. The Company’s management uses, and believes that investors benefit from referring to, these non-GAAP measures and ratios in assessing the Company’s operating results and related trends and when forecasting future periods. However, these non-GAAP measures and ratios should be considered in addition to, and not as a substitute for or preferable to, ratios prepared in accordance with GAAP. In the attached tables, the Company has provided a reconciliation of, where applicable, the most comparable GAAP financial measures and ratios to the non-GAAP financial measures and ratios, or a reconciliation of the non-GAAP calculation of the financial measures for the periods indicated. Peer group data consists of the median of publicly traded banks with total assets from $2-$10 billion with commercial loans greater than 20% and consumer loans less than 10%. 39
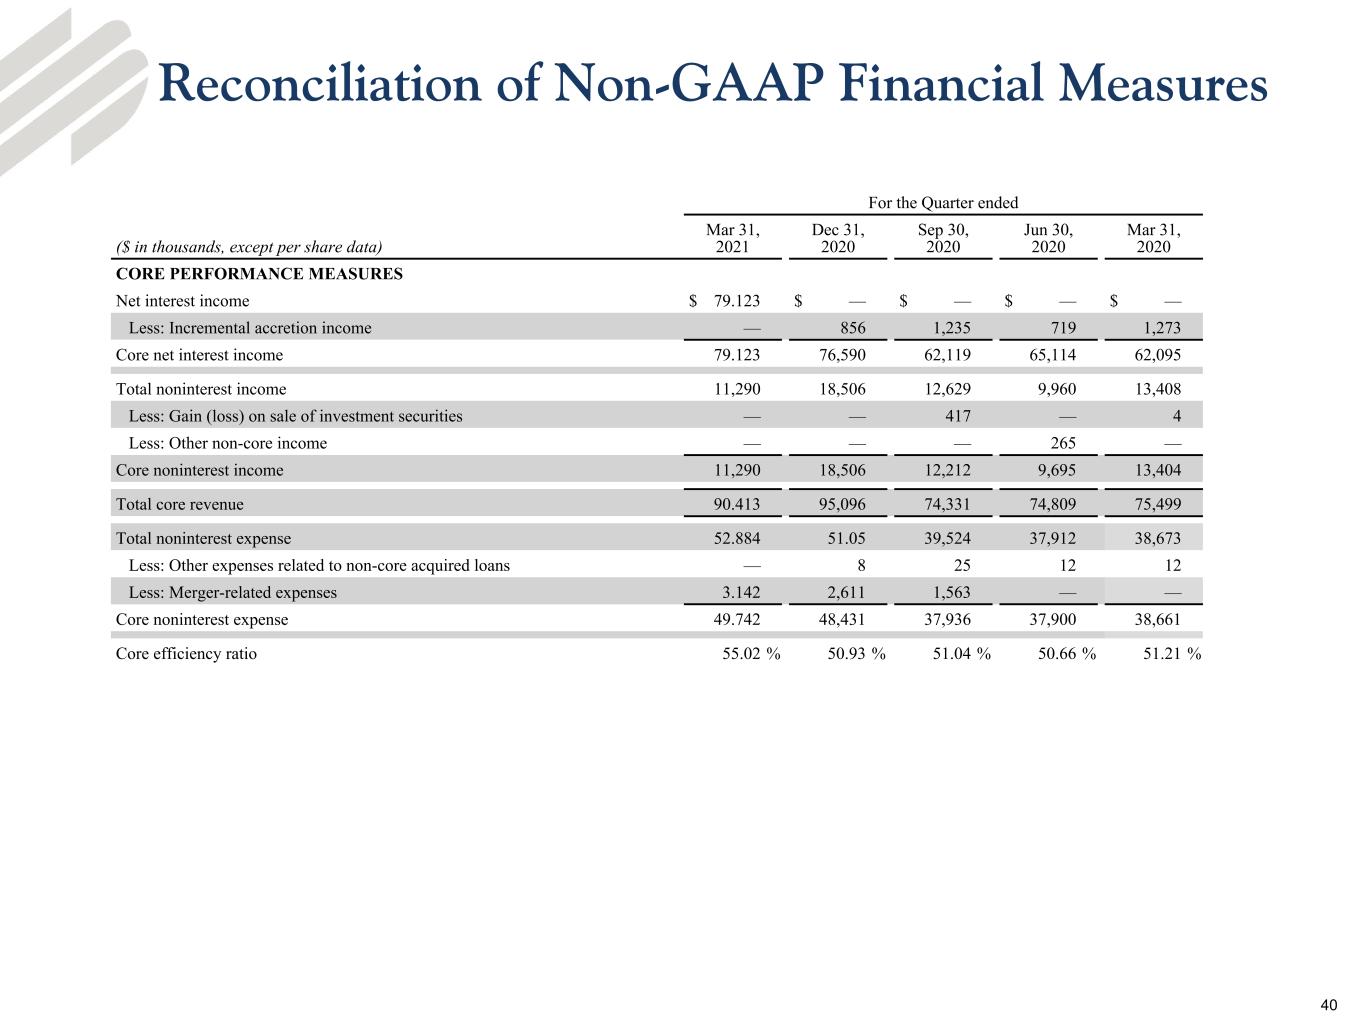
Reconciliation of Non-GAAP Financial Measures For the Quarter ended ($ in thousands, except per share data) Mar 31, 2021 Dec 31, 2020 Sep 30, 2020 Jun 30, 2020 Mar 31, 2020 CORE PERFORMANCE MEASURES Net interest income $ 79.123 $ — $ — $ — $ — Less: Incremental accretion income — 856 1,235 719 1,273 Core net interest income 79.123 76,590 62,119 65,114 62,095 Total noninterest income 11,290 18,506 12,629 9,960 13,408 Less: Gain (loss) on sale of investment securities — — 417 — 4 Less: Other non-core income — — — 265 — Core noninterest income 11,290 18,506 12,212 9,695 13,404 Total core revenue 90.413 95,096 74,331 74,809 75,499 Total noninterest expense 52.884 51.05 39,524 37,912 38,673 Less: Other expenses related to non-core acquired loans — 8 25 12 12 Less: Merger-related expenses 3.142 2,611 1,563 — — Core noninterest expense 49.742 48,431 37,936 37,900 38,661 Core efficiency ratio 55.02 % 50.93 % 51.04 % 50.66 % 51.21 % 40

Reconciliation of Non-GAAP Financial Measures (in thousands) March 31, 2021 December 31, 2020 December 31, 2019 December 31, 2018 December 31, 2017 Total shareholders' equity $ 1,092,497 $ 1,078,975 $ 867,185 $ 603,804 $ 548,573 Less: Goodwill 260,567 260,567 210,344 117,345 117,345 Less: Intangible assets 21,670 23,084 26,076 8,553 11,056 Tangible common equity $ 810,260 $ 795,324 $ 630,765 $ 477,906 $ 420,172 Total assets $ 10,190,699 $ 9,751,571 $ 7,333,791 $ 5,645,662 $ 5,289,225 Less: Goodwill 260,567 260,567 210,344 117,345 117,345 Less: Intangible assets 21,670 23,084 26,076 8,553 11,056 Tangible assets $ 9,908,462 $ 9,467,920 $ 7,097,371 $ 5,519,764 $ 5,160,824 Tangible common equity to tangible assets 8.18 % 8.40 % 8.89 % 8.66 % 8.14 % For the Quarter Ended For the Year Ended (in thousands) March 31, 2021 December 31, 2020 December 31, 2019 December 31, 2018 December 31, 2017 Average shareholder’s equity $ 1,096,481 $ 902,875 $ 795,477 $ 576,960 $ 532,306 Less: Average goodwill 260,567 217,205 193,804 117,345 106,850 Less: Average intangible assets 22,346 23,551 24,957 9,763 10,998 Average tangible common equity $ 813,568 $ 662,119 $ 576,716 $ 449,852 $ 414,458 Tangible Common Equity Ratio Average Shareholders’ Equity and Average Tangible Common Equity 41
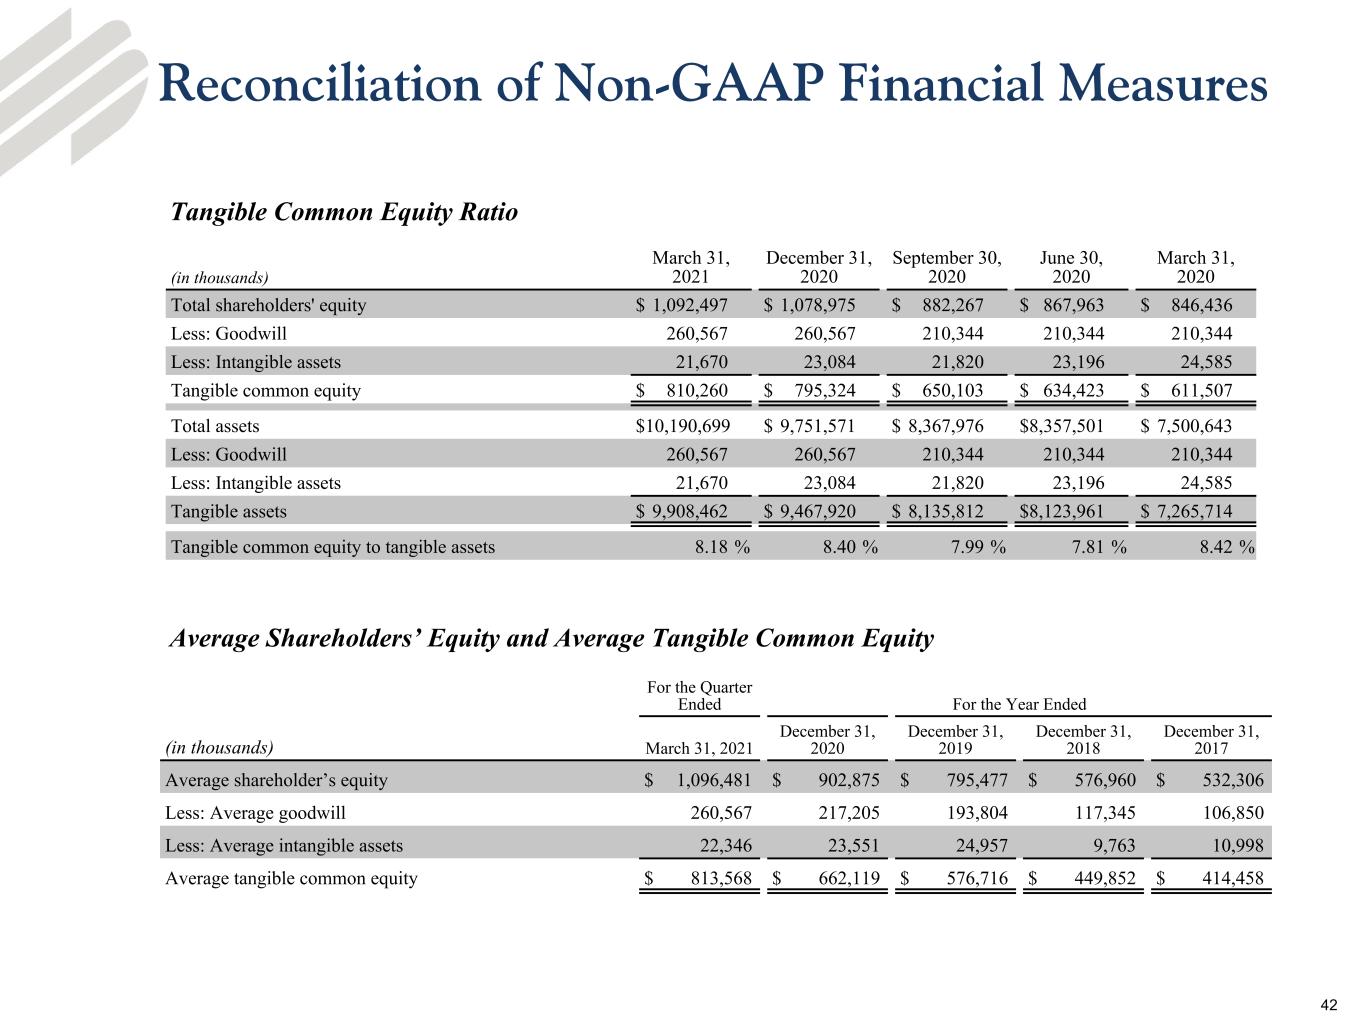
Reconciliation of Non-GAAP Financial Measures (in thousands) March 31, 2021 December 31, 2020 September 30, 2020 June 30, 2020 March 31, 2020 Total shareholders' equity $ 1,092,497 $ 1,078,975 $ 882,267 $ 867,963 $ 846,436 Less: Goodwill 260,567 260,567 210,344 210,344 210,344 Less: Intangible assets 21,670 23,084 21,820 23,196 24,585 Tangible common equity $ 810,260 $ 795,324 $ 650,103 $ 634,423 $ 611,507 Total assets $ 10,190,699 $ 9,751,571 $ 8,367,976 $ 8,357,501 $ 7,500,643 Less: Goodwill 260,567 260,567 210,344 210,344 210,344 Less: Intangible assets 21,670 23,084 21,820 23,196 24,585 Tangible assets $ 9,908,462 $ 9,467,920 $ 8,135,812 $ 8,123,961 $ 7,265,714 Tangible common equity to tangible assets 8.18 % 8.40 % 7.99 % 7.81 % 8.42 % For the Quarter Ended For the Year Ended (in thousands) March 31, 2021 December 31, 2020 December 31, 2019 December 31, 2018 December 31, 2017 Average shareholder’s equity $ 1,096,481 $ 902,875 $ 795,477 $ 576,960 $ 532,306 Less: Average goodwill 260,567 217,205 193,804 117,345 106,850 Less: Average intangible assets 22,346 23,551 24,957 9,763 10,998 Average tangible common equity $ 813,568 $ 662,119 $ 576,716 $ 449,852 $ 414,458 Tangible Common Equity Ratio Average Shareholders’ Equity and Average Tangible Common Equity 42
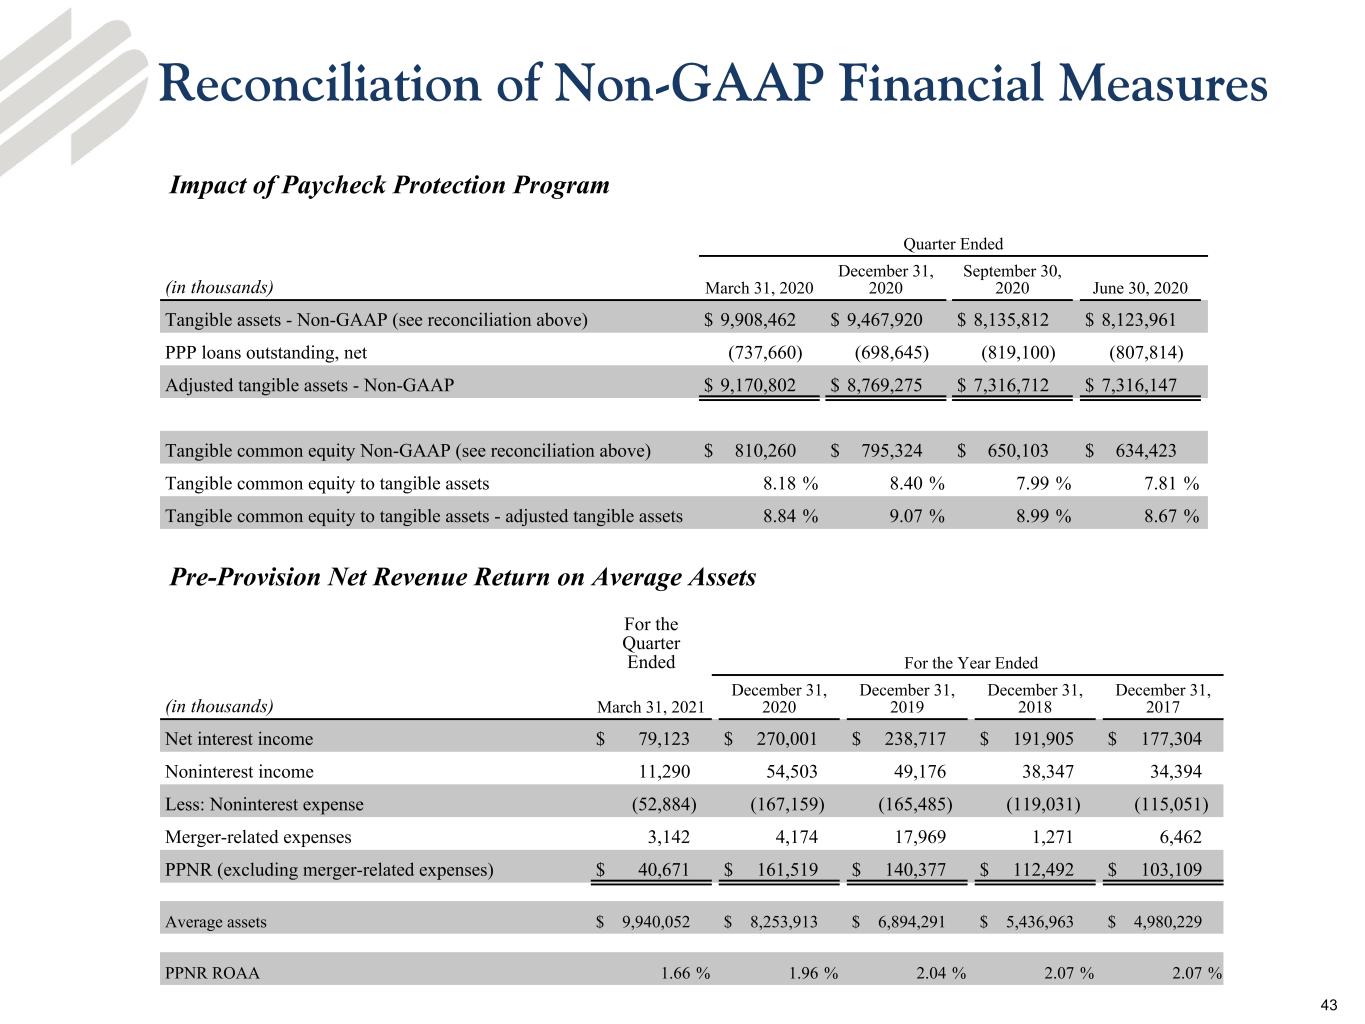
Reconciliation of Non-GAAP Financial Measures Quarter Ended (in thousands) March 31, 2020 December 31, 2020 September 30, 2020 June 30, 2020 Tangible assets - Non-GAAP (see reconciliation above) $ 9,908,462 $ 9,467,920 $ 8,135,812 $ 8,123,961 PPP loans outstanding, net (737,660) (698,645) (819,100) (807,814) Adjusted tangible assets - Non-GAAP $ 9,170,802 $ 8,769,275 $ 7,316,712 $ 7,316,147 Tangible common equity Non-GAAP (see reconciliation above) $ 810,260 $ 795,324 $ 650,103 $ 634,423 Tangible common equity to tangible assets 8.18 % 8.40 % 7.99 % 7.81 % Tangible common equity to tangible assets - adjusted tangible assets 8.84 % 9.07 % 8.99 % 8.67 % Impact of Paycheck Protection Program For the Quarter Ended For the Year Ended (in thousands) March 31, 2021 December 31, 2020 December 31, 2019 December 31, 2018 December 31, 2017 Net interest income $ 79,123 $ 270,001 $ 238,717 $ 191,905 $ 177,304 Noninterest income 11,290 54,503 49,176 38,347 34,394 Less: Noninterest expense (52,884) (167,159) (165,485) (119,031) (115,051) Merger-related expenses 3,142 4,174 17,969 1,271 6,462 PPNR (excluding merger-related expenses) $ 40,671 $ 161,519 $ 140,377 $ 112,492 $ 103,109 Average assets $ 9,940,052 $ 8,253,913 $ 6,894,291 $ 5,436,963 $ 4,980,229 PPNR ROAA 1.66 % 1.96 % 2.04 % 2.07 % 2.07 % Pre-Provision Net Revenue Return on Average Assets 43
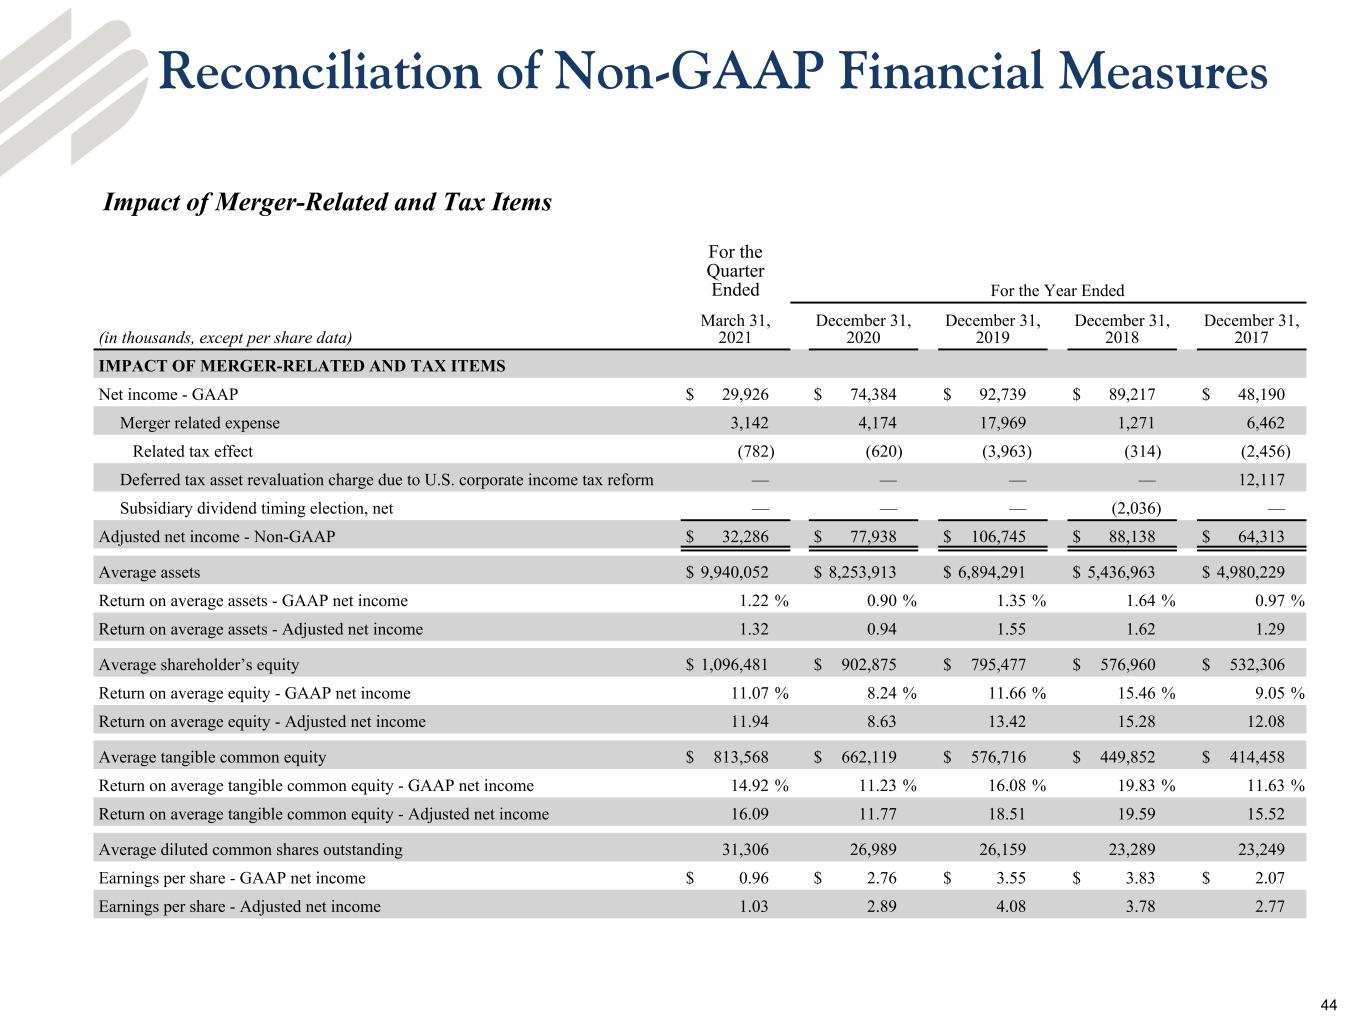
For the Quarter Ended For the Year Ended (in thousands, except per share data) March 31, 2021 December 31, 2020 December 31, 2019 December 31, 2018 December 31, 2017 IMPACT OF MERGER-RELATED AND TAX ITEMS Net income - GAAP $ 29,926 $ 74,384 $ 92,739 $ 89,217 $ 48,190 Merger related expense 3,142 4,174 17,969 1,271 6,462 Related tax effect (782) (620) (3,963) (314) (2,456) Deferred tax asset revaluation charge due to U.S. corporate income tax reform — — — — 12,117 Subsidiary dividend timing election, net — — — (2,036) — Adjusted net income - Non-GAAP $ 32,286 $ 77,938 $ 106,745 $ 88,138 $ 64,313 Average assets $ 9,940,052 $ 8,253,913 $ 6,894,291 $ 5,436,963 $ 4,980,229 Return on average assets - GAAP net income 1.22 % 0.90 % 1.35 % 1.64 % 0.97 % Return on average assets - Adjusted net income 1.32 0.94 1.55 1.62 1.29 Average shareholder’s equity $ 1,096,481 $ 902,875 $ 795,477 $ 576,960 $ 532,306 Return on average equity - GAAP net income 11.07 % 8.24 % 11.66 % 15.46 % 9.05 % Return on average equity - Adjusted net income 11.94 8.63 13.42 15.28 12.08 Average tangible common equity $ 813,568 $ 662,119 $ 576,716 $ 449,852 $ 414,458 Return on average tangible common equity - GAAP net income 14.92 % 11.23 % 16.08 % 19.83 % 11.63 % Return on average tangible common equity - Adjusted net income 16.09 11.77 18.51 19.59 15.52 Average diluted common shares outstanding 31,306 26,989 26,159 23,289 23,249 Earnings per share - GAAP net income $ 0.96 $ 2.76 $ 3.55 $ 3.83 $ 2.07 Earnings per share - Adjusted net income 1.03 2.89 4.08 3.78 2.77 Impact of Merger-Related and Tax Items Reconciliation of Non-GAAP Financial Measures 44
Q&A 1st Quarter 2021 EFSC Investor Presentation For more information contact Keene Turner, Executive Vice President and CFO (314) 512-7233


