Enterprise Financial Services Corp 2024 Third Quarter Earnings Webcast Exhibit 99.2
2 Forward-Looking Statements Some of the information in this report may contain “forward-looking statements” within the meaning of and intended to be covered by the safe harbor provisions of the Private Securities Litigation Reform Act of 1995. Such forward-looking statements may include projections based on management’s current expectations and beliefs concerning future developments and their potential effects on the Company including, without limitation, plans, strategies and goals, and statements about the Company’s expectations regarding revenue and asset growth, financial performance and profitability, loan and deposit growth, liquidity, yields and returns, loan diversification and credit management, shareholder value creation and the impact of acquisitions. Forward-looking statements are typically identified by words such as “believe,” “expect,” “anticipate,” “intend,” “outlook,” “estimate,” “forecast,” “project,” “pro forma,” “pipeline” and other similar words and expressions. Forward-looking statements are subject to numerous assumptions, risks and uncertainties, which change over time. Forward-looking statements speak only as of the date they are made. Because forward-looking statements are subject to assumptions and uncertainties, actual results or future events could differ, possibly materially, from those anticipated in the forward-looking statements and future results could differ materially from historical performance. They are neither statements of historical fact nor guarantees or assurances of future performance. While there is no assurance that any list of risks and uncertainties or risk factors is complete, important factors that could cause actual results to differ materially from those in the forward-looking statements include the following, without limitation: our ability to efficiently integrate acquisitions into our operations, retain the customers of these businesses and grow the acquired operations; credit risk; changes in the appraised valuation of real estate securing impaired loans; our ability to recover our investment in loans; fluctuations in the fair value of collateral underlying loans; outcomes of litigation and other contingencies; exposure to general and local economic and market conditions, including risk of recession, high unemployment rates, higher inflation and its impacts (including U.S. federal government measures to address higher inflation), U.S. fiscal debt, budget and tax matters, and any slowdown in global economic growth; risks associated with rapid increases or decreases in prevailing interest rates; changes in business prospects that could impact goodwill estimates and assumptions; consolidation within the banking industry; competition from banks and other financial institutions; the ability to attract and retain relationship officers and other key personnel; burdens imposed by federal and state regulation; changes in legislative or regulatory requirements, as well as current, pending or future legislation or regulation that could have a negative effect on our revenue and business, including rules and regulations relating to bank products and financial services; changes in accounting policies and practices or accounting standards; natural disasters; terrorist activities, war and geopolitical matters (including the war in Israel and potential for a broader regional conflict and the war in Ukraine and the imposition of additional sanctions and export controls in connection therewith), or pandemics, or other health emergencies and their effects on economic and business environments in which we operate, including the related disruption to the financial market and other economic activity; and other risks referenced from time to time in the Company’s filings with the Securities and Exchange Commission (the “SEC”), including in the Company’s Annual Report on Form 10-K for the fiscal year ended December 31, 2023, and the Company’s other filings with the SEC. The Company cautions that the preceding list is not exhaustive of all possible risk factors and other factors could also adversely affect the Company’s results. For any forward-looking statements made in this press release or in any documents, EFSC claims the protection of the safe harbor for forward-looking statements contained in the Private Securities Litigation Reform Act of 1995. Annualized, pro forma, projected and estimated numbers in this document are used for illustrative purposes only, are not forecasts and may not reflect actual results. Readers are cautioned not to place undue reliance on any forward-looking statements. Except to the extent required by applicable law or regulation, EFSC disclaims any obligation to revise or publicly release any revision or update to any of the forward-looking statements included herein to reflect events or circumstances that occur after the date on which such statements were made.

3 Financial Highlights - 3Q24* Capital • Tangible Common Equity/Tangible Assets** 9.50%, compared to 9.18% • Tangible Book Value Per Common Share** $37.26, compared to $35.02 • CET1 Ratio 11.9%, compared to 11.7% • Repurchased 195,114 shares at an average price of $49.73 • Quarterly common stock dividend of $0.27 per share in third quarter 2024 ($0.01 increase) • Quarterly preferred stock dividend of $12.50 per share ($0.3125 per depositary share) • Net Income $50.6 million, up $5.1 million; EPS $1.32 • Net Interest Income $143.5 million, up $2.9 million; NIM 4.17% • PPNR** $65.1 million, up $1.8 million • Adjusted ROAA** 1.32%, compared to 1.27%; PPNR ROAA** 1.74%, compared to 1.74% • Adjusted ROATCE** 14.16%, compared to 14.06% Earnings *Comparisons noted below are to the linked quarter unless otherwise noted. **A Non-GAAP Measure, Refer to Appendix for Reconciliation.

4 Financial Highlights, continued - 3Q24* *Comparisons noted below are to the linked quarter unless otherwise noted. **A Non-GAAP Measure, Refer to Appendix for Reconciliation. Loans & Deposits • Loans $11.1 billion, up $79.9 million • Loan/Deposit Ratio 89% • Deposits $12.5 billion, up $182.9 million or $196.9 million excluding brokered CDs • Noninterest-bearing Deposits/Total Deposits 32% Asset Quality • Nonperforming Loans/Loans 0.26% • Nonperforming Assets/Assets 0.22% • Allowance Coverage Ratio 1.26%; 1.38% adjusted for guaranteed loans** • Net Charge-offs $3.9 million

5 Areas of Focus Organic Loan and Deposit Growth • Continue Funding Loan Growth with Customer Deposits • Build Franchise Value by Expanding Existing and Acquiring New Relationships Disciplined Loan and Deposit Pricing Focused Credit Underwriting and Monitoring Focus on Long-term Earnings Trajectory Core System Conversion • Completed on October 11, 2024

6 $10,617 $10,884 $11,028 $11,000 $11,080 3Q23 4Q23 1Q24 2Q24 3Q24 $ In Millions 4% Total Loan Growth Loan Trends

7 Loan Details 3Q24 2Q24 3Q23 Qtr Change LTM Change C&I $ 2,145 $ 2,107 $ 2,020 $ 38 $ 125 CRE Investor Owned 2,347 2,309 2,260 38 87 CRE Owner Occupied 1,323 1,314 1,256 9 67 SBA loans* 1,273 1,269 1,309 4 (36) Sponsor Finance* 819 866 888 (47) (69) Life Insurance Premium Financing* 1,030 996 928 34 102 Tax Credits* 724 738 684 (14) 40 Residential Real Estate 346 340 365 6 (19) Construction and Land Development 797 792 640 5 157 Other 276 269 267 7 9 Total Loans $ 11,080 $ 11,000 $ 10,617 $ 80 $ 463 *Specialty loan category. $ In Millions

8 Loans By Region Specialty Lending $3,871 $3,959 $3,990 3Q23 2Q24 3Q24 $ In Millions Midwest $3,260 $3,279 $3,194 3Q23 2Q24 3Q24 Southwest $1,464 $1,649 $1,680 3Q23 2Q24 3Q24 Note: Excludes “Other” loans; Region Components: Midwest (St. Louis & Kansas City), Southwest (AZ, NM, Las Vegas, TX), West (Southern California) West $1,755 $1,844 $1,940 3Q23 2Q24 3Q24
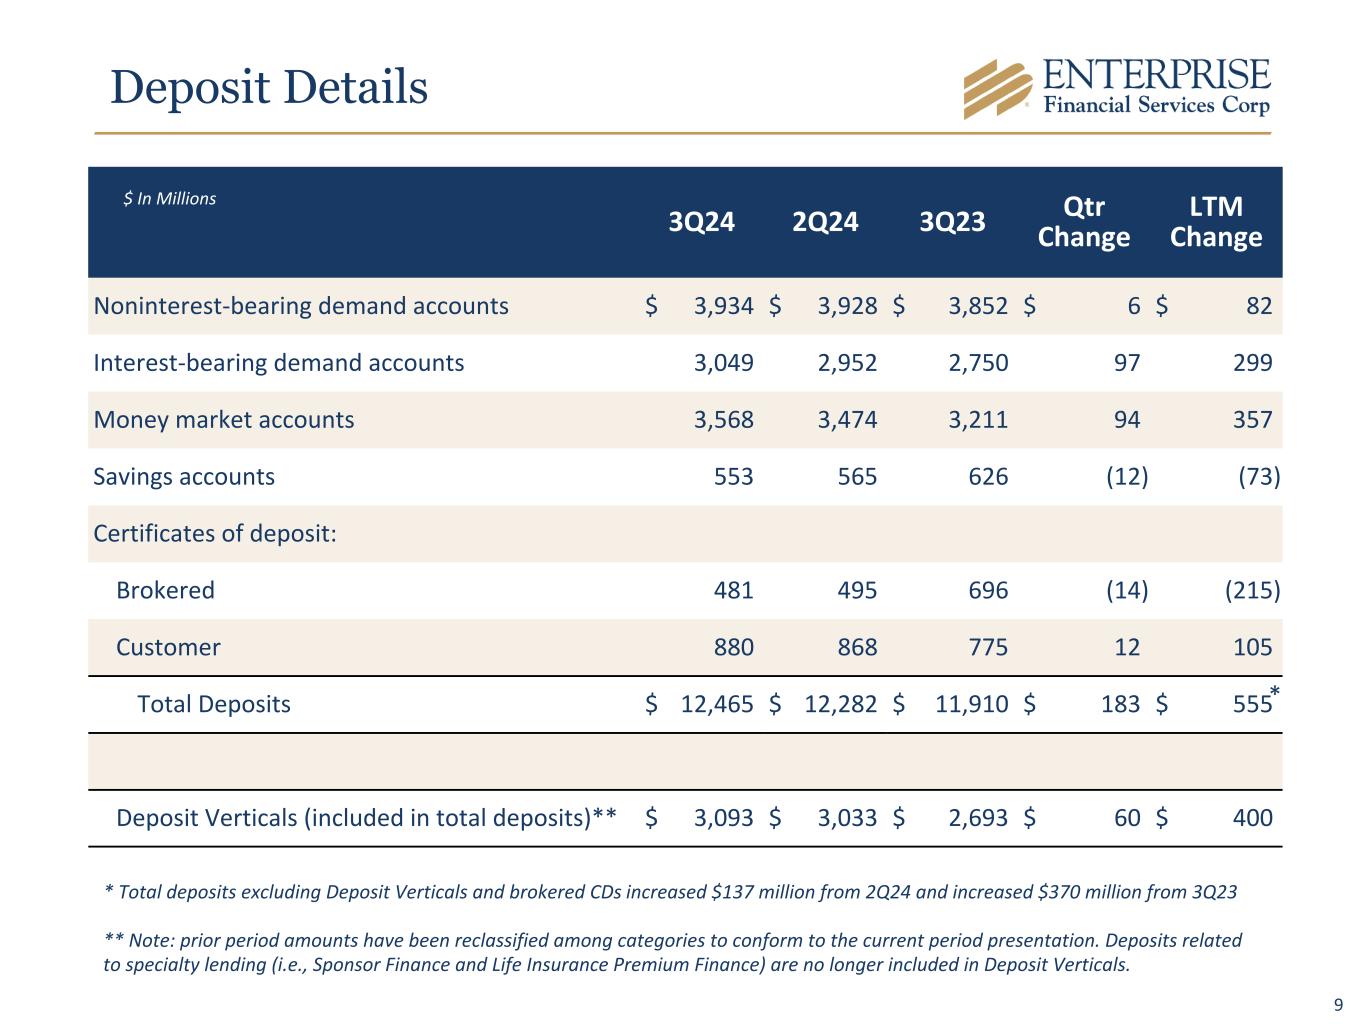
9 Deposit Details 3Q24 2Q24 3Q23 Qtr Change LTM Change Noninterest-bearing demand accounts $ 3,934 $ 3,928 $ 3,852 $ 6 $ 82 Interest-bearing demand accounts 3,049 2,952 2,750 97 299 Money market accounts 3,568 3,474 3,211 94 357 Savings accounts 553 565 626 (12) (73) Certificates of deposit: Brokered 481 495 696 (14) (215) Customer 880 868 775 12 105 Total Deposits $ 12,465 $ 12,282 $ 11,910 $ 183 $ 555 Deposit Verticals (included in total deposits)** $ 3,093 $ 3,033 $ 2,693 $ 60 $ 400 $ In Millions * Total deposits excluding Deposit Verticals and brokered CDs increased $137 million from 2Q24 and increased $370 million from 3Q23 ** Note: prior period amounts have been reclassified among categories to conform to the current period presentation. Deposits related to specialty lending (i.e., Sponsor Finance and Life Insurance Premium Finance) are no longer included in Deposit Verticals. *

10 Deposits By Region Deposit Verticals** $2,693 $3,033 $3,093 3Q23 2Q24 3Q24 $ In Millions Midwest(*)** $6,098 $6,111 $6,205 3Q23 2Q24 3Q24 Southwest $1,802 $1,984 $1,971 3Q23 2Q24 3Q24 West* $1,317 $1,154 $1,196 3Q23 2Q24 3Q24 Note: Region Components: Midwest (St. Louis & Kansas City), Southwest (AZ, NM, Las Vegas, TX), West (Southern California) *Includes brokered balances ** Note, prior period amounts have been reclassified among categories to conform to the current period presentation. Deposits related to specialty lending (i.e., Sponsor Finance and Life Insurance Premium Finance) are no longer included in Deposit Verticals.

11 Differentiated Deposit Verticals 37.7% 36.8% 25.5% Community Associations $1.2 billion in deposit accounts specifically designed to serve the needs of community associations. Property Management $1.1 billion in deposits. Specializing in the compliance of Property Management Trust Accounts. Legal Industry and Escrow Services $791 million in deposits. Product lines providing services to independent escrow and non- depository trust companies. • $3.09 billion - 25% of total deposits • $3.24 billion - Average deposits for 3Q24 • $23.8 million - Related deposit costs in noninterest expense, resulting in an average deposit vertical cost of 2.92% in 3Q24 • $144.3 million - Average Deposits per Branch for FDIC Insured Banks with a deposit portfolio between $5-20B* • 21 - Number of traditional branches that would support the EFSC deposit vertical portfolio *Data Source: Deposit data as of June 30th, 2024, per the FDIC Summary of Deposits. 3Q23 4Q23 1Q24 2Q24 3Q24 Community Associations Property Management Legal Industry and Escrow Services $— $500 $1,000 $ In Millions

12 Core Funding Mix Commercial Business Banking Consumer $ In Millions 1At September 30, 2024 2Excludes insured accounts, collateralized accounts, accounts that qualify for pass-through insurance, reciprocal accounts, and affiliated accounts. Note: Brokered deposits were $0.7 billion at 3Q24 Deposit Verticals 3Q24 Net New/Closed Deposit Accounts COMMERCIAL BUSINESS BANKING CONSUMER DEPOSIT VERTICALS Total net average balance ($ in thousands) 3Q24 $ 91,386 $ 8,093 $ 14,866 $ 138,514 2Q24 $ 64,583 $ 13,825 $ 20,882 $ 131,394 1Q24 $ 81,742 $ 16,921 $ 3,986 $ 142,484 4Q23 $ 85,358 $ 18,529 $ 26,556 $ 214,189 Number of accounts 3Q24 56 (89) (57) 828 2Q24 (73) (60) 215 878 1Q24 (48) 31 759 2,260 4Q23 84 (77) 842 1,452 Total Portfolio Average Account Size & Cost of Funds Average account size ($ in thousands) 3Q24 $ 283 $ 71 $ 23 $ 111 Cost of funds 3Q241 2.45 % 1.25 % 1.83 % 1.11 % • Estimated uninsured deposits of $3.7 billion, or 30% of total deposits2 • ~80% of commercial deposits utilize Treasury Management services • ~90% of checking and savings accounts utilize online banking services • ~60% of commercial deposits have a lending relationship • ~155% of on- and off-balance sheet liquidity to estimated uninsured deposits Overview 30% 38% 30% 41% 32% 19% 4% 6% 30% 21% 17% 22% 4% 60% 3% 36% $4,453 $3,093$2,794$1,404
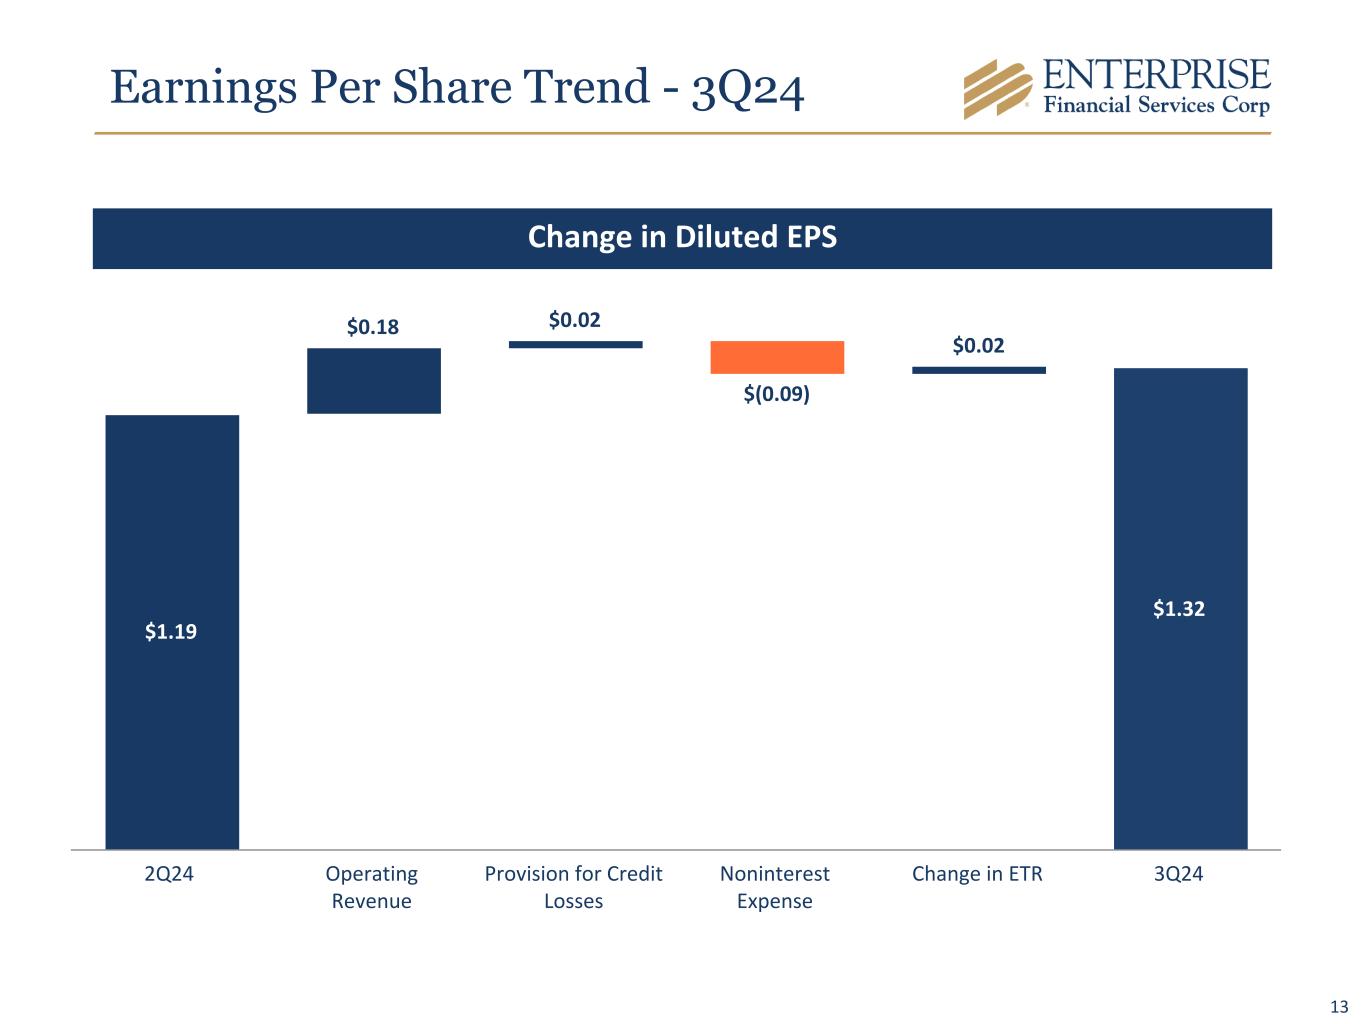
Earnings Per Share Trend - 3Q24 $1.19 $0.18 $0.02 $(0.09) $0.02 $1.32 2Q24 Operating Revenue Provision for Credit Losses Noninterest Expense Change in ETR 3Q24 Change in Diluted EPS 13

14 $141.6 $140.7 $137.7 $140.5 $143.5 4.33% 4.23% 4.13% 4.19% 4.17% 5.26% 5.33% 5.33% 5.33% 5.27% Net Interest Income Net Interest Margin Avg Fed Funds Rate 3Q23 4Q23 1Q24 2Q24 3Q24 Net Interest Income Trend $ In Millions Stable Net Interest Income 3Q23 4Q23 1Q24 2Q24 3Q24 Net Interest Income - FTE $ 143.7 $ 142.6 $ 139.8 $ 142.6 $ 145.6 Purchase Accounting Amortization/(Accretion) 0.6 (0.5) 0.5 (0.2) 0.5 Adjusted Net Interest Income - FTE $ 144.3 $ 142.1 $ 140.3 $ 142.4 $ 146.1 Net Interest Margin 4.33 % 4.23 % 4.13 % 4.19 % 4.17 % Purchase Accounting Amortization/(Accretion) 0.02 % (0.02) % 0.02 % 0.00 % 0.01 % Adjusted Net Interest Margin 4.35 % 4.21 % 4.15 % 4.19 % 4.18 %

15 Net Interest Margin 6.80% 6.87% 6.87% 6.95% 6.95% 3.11% 3.20% 3.27% 3.35% 3.40% 6.12% 6.20% 6.20% 6.28% 6.26% Earning asset yield Securities yield Loan yield 3Q23 4Q23 1Q24 2Q24 3Q24 2.77% 3.03% 3.14% 3.19% 3.22% 1.84% 2.03% 2.13% 2.16% 2.18% 2.84% 3.09% 3.22% 3.26% 3.28% Interest-bearing deposit rate Total cost of deposits Interest-bearing liabilities 3Q23 4Q23 1Q24 2Q24 3Q24 Components of Interest-bearing LiabilitiesComponents of Interest-earning Assets 4.19% (0.02)% 0.01% (0.01)% 4.17% 2Q24 Other Earning Asset Mix Funding Mix Cost of Funds 3Q24 Margin Bridge

16 26 106 22 2 14 3Q23 4Q23 1Q24 2Q24 3Q24 $104 $267 $144 $(28.5) $80 41.0% 42.0% 44.4% 45.8% 44.1% Organic Loans Avg Line Draw % 3Q23 4Q23 1Q24 2Q24 3Q24 3Q24 2Q24 3Q23 NPLs/Loans 0.26 % 0.36 % 0.46 % NPAs/Assets 0.22 % 0.33 % 0.40 % ACL/NPLs 492.6 % 354.1 % 290.5 % ACL/Loans** 1.38 % 1.38 % 1.47 % Annualized Net Charge-offs to Average Loans Provision for Credit Losses* $8.0 $18.1 $5.8 $4.8 $4.1 3Q23 4Q23 1Q24 2Q24 3Q24 $ In Millions bps bps bps bps bps $ In Millions Loan Growth and Average Line of Credit Utilization *Includes credit loss expense on loans, investments and unfunded commitments. **Excludes guaranteed loans. A Non-GAAP Measure, Refer to Appendix for Reconciliation. Credit Trends

17 $139.5 $4.2 $(3.9) $139.8 ACL 2Q24 Portfolio Changes Net Charge-offs ACL 3Q24 Allowance for Credit Losses for Loans $ In Millions • New loans and changes in composition of existing loans • Changes in risk ratings, past due status and reserves on individually evaluated loans • Changes in macroeconomic and qualitative factors 3Q24 $ In Millions Loans ACL ACL as a % of Loans Commercial and industrial $ 4,628 $ 64 1.38 % Commercial real estate 4,915 56 1.14 % Construction real estate 896 10 1.12 % Residential real estate 355 6 1.69 % Other 286 4 1.40 % Total $ 11,080 $ 140 1.26 % Reserves on sponsor finance, agricultural, and investor office CRE loans, which are included in the categories above, represented $23.0 million, $5.1 million, and $11.7 million, respectively. Total ACL percentage of loans excluding government guaranteed loans was 1.38%*. Key Assumptions: • Reasonable and supportable forecast period is one year with a one year reversion period. • Forecast considers a weighted average of baseline, upside and downside scenarios. • Primary macroeconomic factors: ◦ Percentage change in GDP ◦ Unemployment ◦ Percentage change in Retail Sales ◦ Percentage change in CRE Index *A Non-GAAP Measure, Refer to Appendix for Reconciliation.

18 Noninterest Income Trend $12.1 $25.5 $12.2 $15.5 $21.4 $5.4 $6.3 $5.0 $4.0 $8.3 $(2.7) $9.7 $(2.2) $1.9 $3.3 $4.2 $4.3 $4.4 $4.5 $4.6 $2.6 $2.7 $2.4 $2.5 $2.6 $2.6 $2.5 $2.6 $2.6 $2.6 7.9% 15.3% 8.1% 9.9% 13.0% Other Tax Credit Income Deposit Services Charge Card Services Wealth Management Noninterest income/Total income 3Q23 4Q23 1Q24 2Q24 3Q24 $5.4 $6.3 $5.0 $4.0 $8.3 $1.8 $2.3 $1.6 $1.6 $1.7 $0.7 $0.8 $0.3 $0.6 $0.5 $0.8 $1.3 $0.9 $0.9 $1.1 $0.1 $0.2 $0.2 $0.3 $1.0 $0.6 $0.3 $1.2$0.2 $0.7 $0.2 $0.4 $0.6$1.5 $1.4 $3.2 Miscellaneous Servicing Fees BOLI Swap Fees CDE Private Equity Fund Distribution Gain on SBA loan sales Gain on sale of OREO 3Q23 4Q23 1Q24 2Q24 3Q24 $ In Millions Noninterest Income Other Noninterest Income Detail
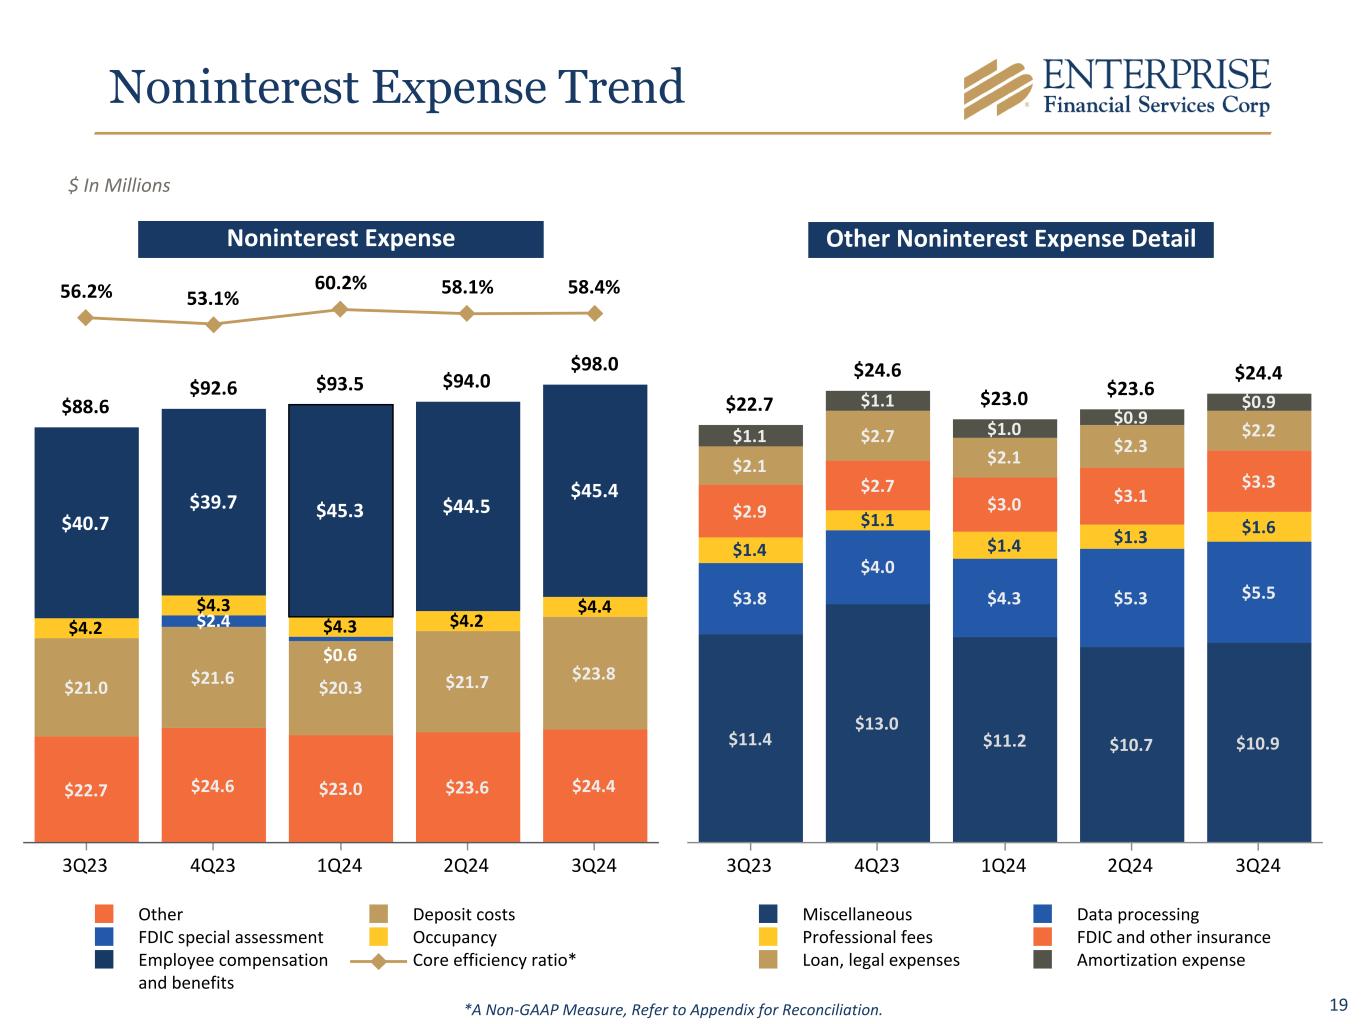
19 Noninterest Expense Trend Other Noninterest Expense DetailNoninterest Expense $ In Millions $88.6 $92.6 $93.5 $94.0 $98.0 $22.7 $24.6 $23.0 $23.6 $24.4 $21.0 $21.6 $20.3 $21.7 $23.8 $2.4 $0.6 $4.2 $4.3 $4.3 $4.2 $4.4 $40.7 $39.7 $45.3 $44.5 $45.4 56.2% 53.1% 60.2% 58.1% 58.4% Other Deposit costs FDIC special assessment Occupancy Employee compensation and benefits Core efficiency ratio* 3Q23 4Q23 1Q24 2Q24 3Q24 $22.7 $24.6 $23.0 $23.6 $24.4 $11.4 $13.0 $11.2 $10.7 $10.9 $3.8 $4.0 $4.3 $5.3 $5.5 $1.4 $1.1 $1.4 $1.3 $1.6 $2.9 $2.7 $3.0 $3.1 $3.3 $2.1 $2.7 $2.1 $2.3 $2.2$1.1 $1.1 $1.0 $0.9 $0.9 Miscellaneous Data processing Professional fees FDIC and other insurance Loan, legal expenses Amortization expense 3Q23 4Q23 1Q24 2Q24 3Q24 *A Non-GAAP Measure, Refer to Appendix for Reconciliation.

20 Capital Tangible Common Equity/Tangible Assets 8.51% 8.96% 9.01% 9.18% 9.50% Tangible Common Equity/Tangible Assets* 3Q23 4Q23 1Q24 2Q24 3Q24 *A Non-GAAP Measure, Refer to Appendix for Reconciliation. **Preliminary regulatory capital ratios. Regulatory Capital 10.0% 14.1% 14.2% 14.3% 14.6% 14.8% 6.5% 11.2% 11.3% 11.4% 11.7% 11.9% CET1 Tier 1 Total Risk Based Capital Minimum "Well Capitalized" Ratio 3Q23 4Q23 1Q24 2Q24 3Q24 8.0% 12.6% 12.7% 12.8% 13.0% EFSC Capital Strategy: Low Cost - Highly Flexible High Capital Retention Rate – Strong earnings profile – Sustainable dividend profile Supporting Robust Asset Growth – Organic loan and deposit growth – High quality M&A to enhance commercial franchise and geographic diversification Maintain High Quality Capital Stack – Minimize WACC over time (preferred, sub debt, etc.) – Optimize capital levels CET1 ~10%, Tier 1 ~12%, and Total Capital ~14% Maintain 8-9% TCE – Common stock repurchases ◦ 420,249 shares repurchased at an average price of $43.49 in 2024 – M&A deal structures – Drives ROATCE above peer levels TBV and Dividends per Share $31.06 $33.85 $34.21 $35.02 $37.26 $0.25 $0.25 $0.25 $0.26 $0.27 TBV/Share* Dividends per Share 3Q23 4Q23 1Q24 2Q24 3Q24 13.2% **

Appendix
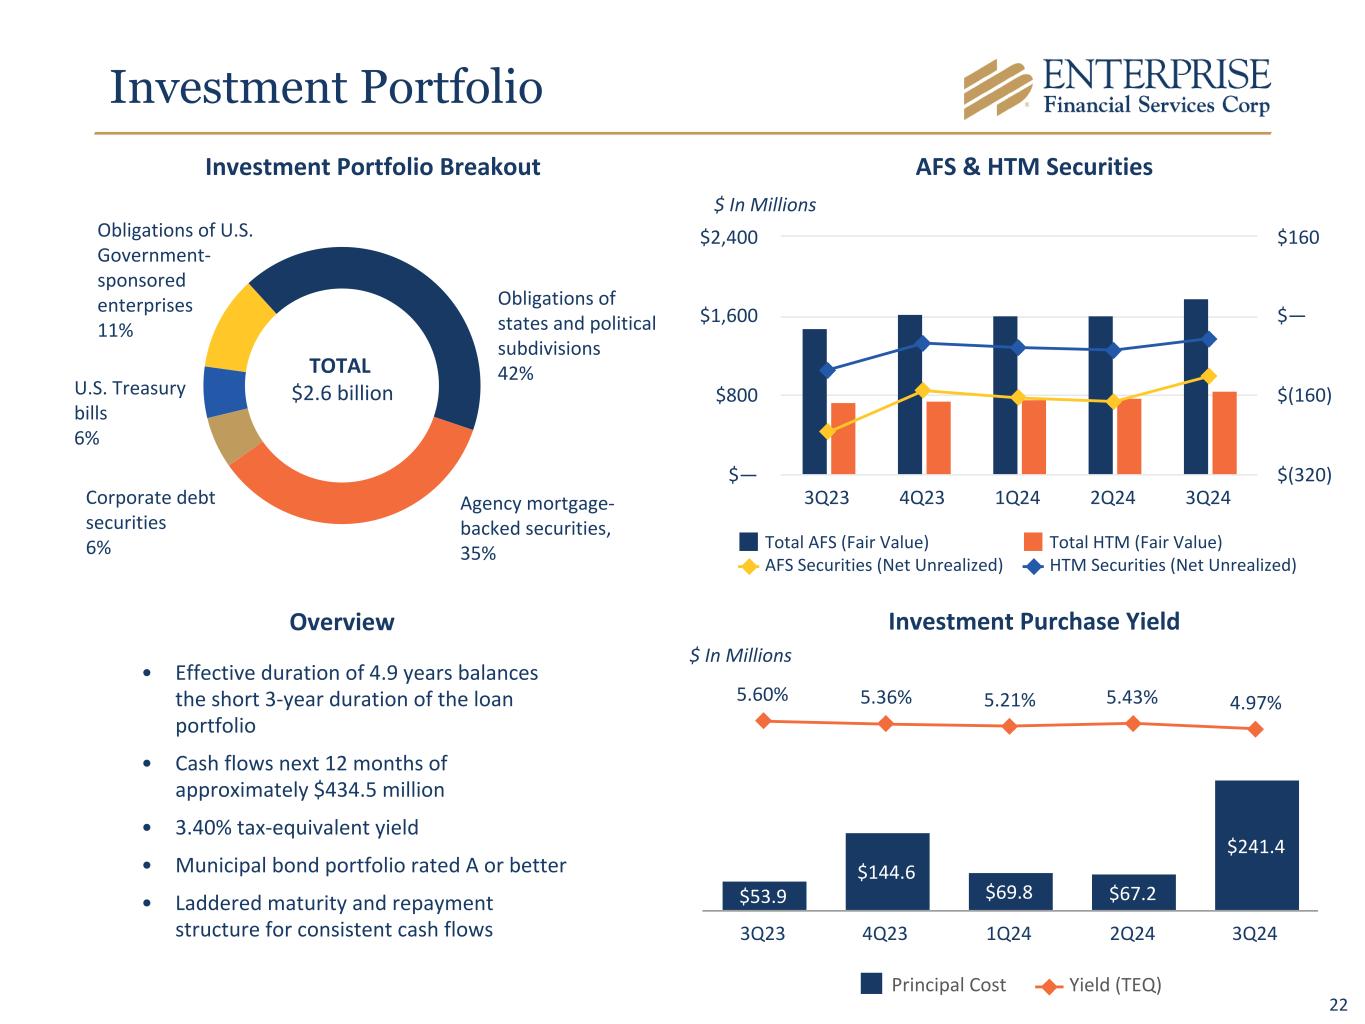
22 Investment Portfolio Breakout AFS & HTM Securities Obligations of U.S. Government- sponsored enterprises 11% Obligations of states and political subdivisions 42% Agency mortgage- backed securities, 35% Corporate debt securities 6% U.S. Treasury bills 6% TOTAL $2.6 billion • Effective duration of 4.9 years balances the short 3-year duration of the loan portfolio • Cash flows next 12 months of approximately $434.5 million • 3.40% tax-equivalent yield • Municipal bond portfolio rated A or better • Laddered maturity and repayment structure for consistent cash flows Overview Total AFS (Fair Value) Total HTM (Fair Value) AFS Securities (Net Unrealized) HTM Securities (Net Unrealized) 3Q23 4Q23 1Q24 2Q24 3Q24 $— $800 $1,600 $2,400 $(320) $(160) $— $160 $ In Millions $53.9 $144.6 $69.8 $67.2 $241.4 5.60% 5.36% 5.21% 5.43% 4.97% Principal Cost Yield (TEQ) 3Q23 4Q23 1Q24 2Q24 3Q24 Investment Purchase Yield $ In Millions Investment Portfolio
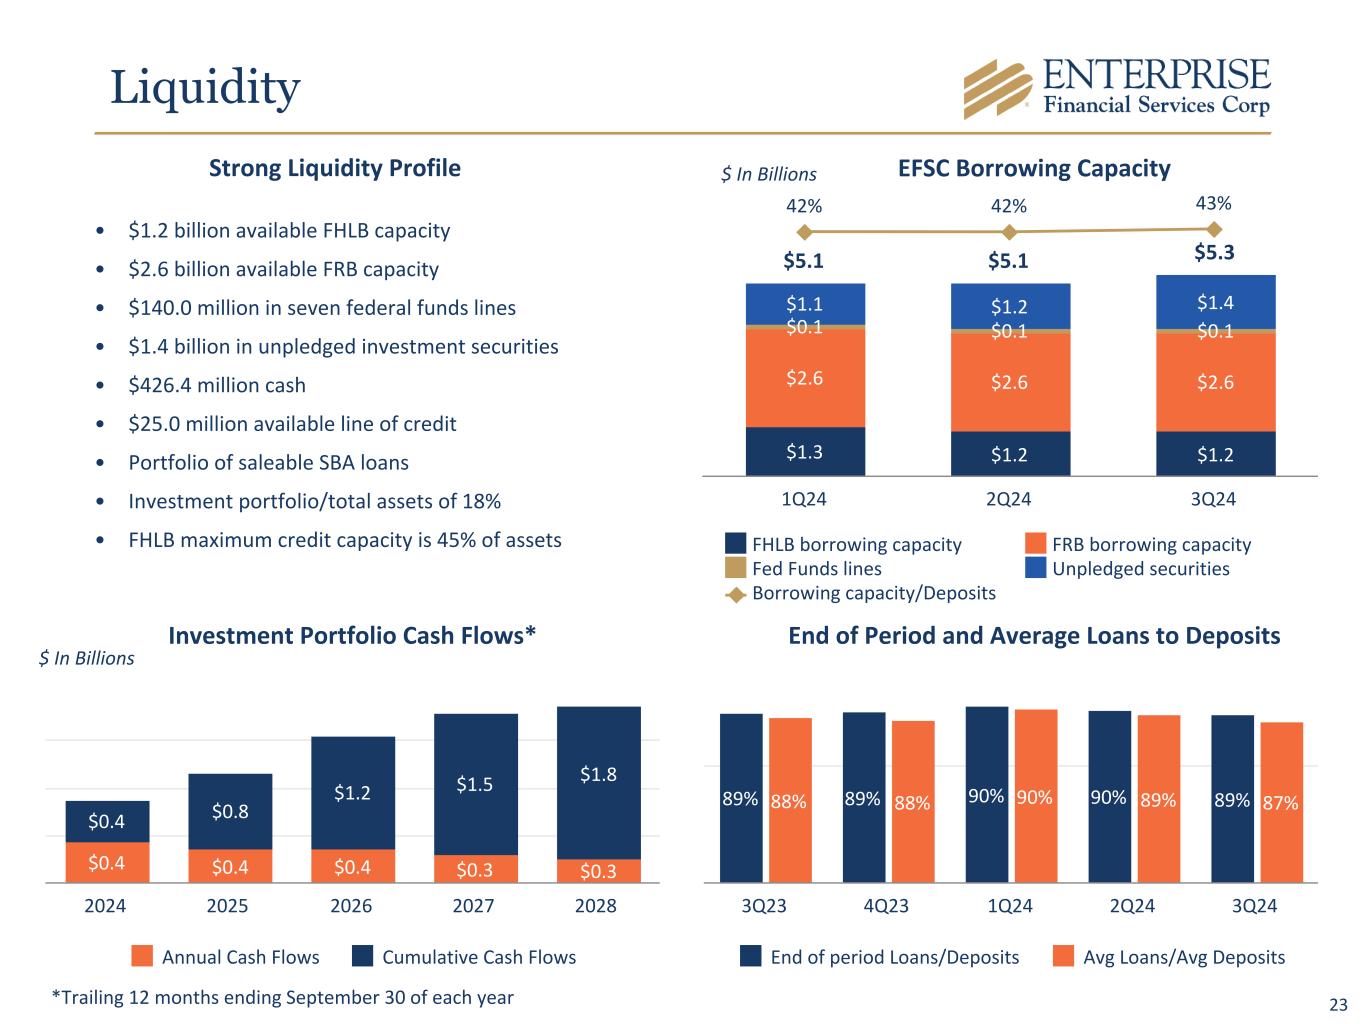
23 EFSC Borrowing Capacity $5.1 $5.1 $5.3 $1.3 $1.2 $1.2 $2.6 $2.6 $2.6 $0.1 $0.1 $0.1 $1.1 $1.2 $1.4 42% 42% 43% FHLB borrowing capacity FRB borrowing capacity Fed Funds lines Unpledged securities Borrowing capacity/Deposits 1Q24 2Q24 3Q24 $ In Billions End of Period and Average Loans to Deposits 89% 89% 90% 90% 89%88% 88% 90% 89% 87% End of period Loans/Deposits Avg Loans/Avg Deposits 3Q23 4Q23 1Q24 2Q24 3Q24 • $1.2 billion available FHLB capacity • $2.6 billion available FRB capacity • $140.0 million in seven federal funds lines • $1.4 billion in unpledged investment securities • $426.4 million cash • $25.0 million available line of credit • Portfolio of saleable SBA loans • Investment portfolio/total assets of 18% • FHLB maximum credit capacity is 45% of assets $0.4 $0.4 $0.4 $0.3 $0.3 $0.4 $0.8 $1.2 $1.5 $1.8 Annual Cash Flows Cumulative Cash Flows 2024 2025 2026 2027 2028 Investment Portfolio Cash Flows* $ In Billions Strong Liquidity Profile *Trailing 12 months ending September 30 of each year Liquidity

24 Office CRE (Non-owner Occupied) Total $503.1 million Midwest 46.9% Southwest 27.5% West 20.6% Specialty 5.0% Office CRE Loans by Location Real Estate/ Rental/Leasing 87.7% Health Care and Social Assistance 3.4% Other 8.9% Office CRE Loans by Industry Type Size Average Risk Rating Number of Loans Balance Average Balance > $10 Million 5.58 12 $ 187.5 $ 15.6 $5-10 Million 5.00 10 66.3 6.6 $2-5 Million 5.17 42 134.2 3.2 < $2 Million 5.30 202 115.1 0.6 Total 5.28 266 $ 503.1 $ 1.9 Office CRE Loans by Size $ In Millions • Average loan-to-origination value 52% • 71% of loans have recourse to owners • Average debt-service coverage ratio (DSCR) of 1.52x • Average market occupancy of 88%; average rents of $24 psf • 42% Class A, 54% Class B, 4% Class C • $11.5 million unfunded commitments • Limited near-term maturity risk: 10% to mature in 2024, 90% maturing in 2025 and beyond 24
25 Use of Non-GAAP Financial Measures The Company’s accounting and reporting policies conform to generally accepted accounting principles in the United States (“GAAP”) and the prevailing practices in the banking industry. However, the Company provides other financial measures, such as tangible common equity, PPNR, ROATCE, ROAA, PPNR return on average assets (“PPNR ROAA”), allowance for coverage ratio adjusted for guaranteed loans, the tangible common equity ratio, and tangible book value per common share, in this release that are considered “non-GAAP financial measures.” Generally, a non-GAAP financial measure is a numerical measure of a company’s financial performance, financial position, or cash flows that exclude (or include) amounts that are included in (or excluded from) the most directly comparable measure calculated and presented in accordance with GAAP. The Company considers its tangible common equity, PPNR, ROATCE, ROAA, PPNR ROAA, allowance for coverage ratio adjusted for guaranteed loans, the tangible common equity ratio, and tangible book value per common share, collectively “core performance measures,” presented in this earnings release and the included tables as important measures of financial performance, even though they are non-GAAP measures, as they provide supplemental information by which to evaluate the impact of certain non-comparable items, and the Company’s operating performance on an ongoing basis. Core performance measures exclude certain other income and expense items, such as the FDIC special assessment, merger-related expenses, facilities charges, and the gain or loss on sale of investment securities, that the Company believes to be not indicative of or useful to measure the Company’s operating performance on an ongoing basis. The attached tables contain a reconciliation of these core performance measures to the GAAP measures. The Company believes that the tangible common equity ratio provides useful information to investors about the Company’s capital strength even though it is considered to be a non-GAAP financial measure and is not part of the regulatory capital requirements to which the Company is subject. The Company believes these non-GAAP measures and ratios, when taken together with the corresponding GAAP measures and ratios, provide meaningful supplemental information regarding the Company’s performance and capital strength. The Company’s management uses, and believes that investors benefit from referring to, these non-GAAP measures and ratios in assessing the Company’s operating results and related trends and when forecasting future periods. However, these non-GAAP measures and ratios should be considered in addition to, and not as a substitute for or preferable to, ratios prepared in accordance with GAAP. In the attached tables, the Company has provided a reconciliation of, where applicable, the most comparable GAAP financial measures and ratios to the non-GAAP financial measures and ratios, or a reconciliation of the non-GAAP calculation of the financial measures for the periods indicated.

26 Reconciliation of Non-GAAP Financial Measures Quarter ended ($ in thousands) September 30, 2024 June 30, 2024 March 31, 2024 December 31, 2023 September 30, 2023 SHAREHOLDERS’ EQUITY TO TANGIBLE COMMON EQUITY AND TOTAL ASSETS TO TANGIBLE ASSETS Shareholders’ equity $ 1,832,011 $ 1,755,273 $ 1,731,725 $ 1,716,068 $ 1,611,880 Less preferred stock 71,988 71,988 71,988 71,988 71,988 Less goodwill 365,164 365,164 365,164 365,164 365,164 Less intangible assets 9,400 10,327 11,271 12,318 13,425 Tangible common equity $ 1,385,459 $ 1,307,794 $ 1,283,302 $ 1,266,598 $ 1,161,303 Common shares outstanding 37,184 37,344 37,515 37,416 37,385 Tangible book value per share (non-GAAP) $ 37.26 $ 35.02 $ 34.21 $ 33.85 $ 31.06 Total assets $ 14,954,125 $ 14,615,666 $ 14,613,338 $ 14,518,590 $ 14,025,042 Less goodwill 365,164 365,164 $ 365,164 365,164 365,164 Less intangible assets 9,400 10,327 $ 11,271 12,318 13,425 Tangible assets (non-GAAP) $ 14,579,561 $ 14,240,175 $ 14,236,903 $ 14,141,108 $ 13,646,453 Tangible common equity to tangible assets (non-GAAP) 9.50 % 9.18 % 9.01 % 8.96 % 8.51 % Quarter ended ($ in thousands) September 30, 2024 June 30, 2024 March 31, 2024 December 31, 2023 September 30, 2023 CALCULATION OF PRE-PROVISION NET REVENUE Net interest income $ 143,469 $ 140,529 $ 137,728 $ 140,732 $ 141,639 Noninterest income 21,420 15,494 12,158 25,452 12,085 FDIC special assessment — — 625 2,412 — Core conversion expense 1,375 1,250 350 — — Less gain on sale of investment securities — — — 220 — Less gain (loss) on sale of other real estate owned 3,159 — (2) Less noninterest expense 98,007 94,017 93,501 92,603 88,644 PPNR (non-GAAP) $ 65,098 $ 63,256 $ 57,362 $ 75,773 $ 65,080 Average assets $ 14,849,455 $ 14,646,381 $ 14,556,119 $ 14,332,804 $ 14,068,860 PPNR ROAA (non-GAAP) 1.74 % 1.74 % 1.58 % 2.10 % 1.84 %

27 Reconciliation of Non-GAAP Financial Measures Quarter ended ($ in thousands) September 30, 2024 June 30, 2024 March 31, 2024 December 31, 2023 September 30, 2023 RETURN ON AVERAGE TANGIBLE COMMON EQUITY (ROATCE) AND RETURN ON AVERAGE ASSETS (ROAA) Average shareholder’s equity $ 1,804,369 $ 1,748,240 $ 1,738,698 $ 1,652,882 $ 1,648,605 Less average preferred stock 71,988 71,988 71,988 71,988 71,988 Less average goodwill 365,164 365,164 365,164 365,164 365,164 Less average intangible assets 9,855 10,783 11,770 12,858 13,967 Average tangible common equity $ 1,357,362 $ 1,300,305 $ 1,289,776 $ 1,202,872 $ 1,197,486 Net income (GAAP) $ 50,585 $ 45,446 $ 40,401 $ 44,529 $ 44,665 FDIC special assessment (after tax) — — 470 1,814 — Core conversion expense (after tax) 1,034 940 263 — — Less gain on sale of investment securities (after tax) — — — 165 — Less gain on sales of other real estate owned (after tax) 2,375 — (1) — — Net income adjusted (non-GAAP) $ 49,244 $ 46,386 $ 41,135 $ 46,178 $ 44,665 Less preferred stock dividends 938 937 938 937 938 Net income available to common shareholders adjusted (non-GAAP) $ 48,306 $ 45,449 $ 40,197 $ 45,241 $ 43,727 ROATCE (non-GAAP) 14.55 % 13.77 % 12.31 % 14.38 % 14.49 % Adjusted ROATCE (non-GAAP) 14.16 % 14.06 % 12.53 % 14.92 % 14.49 % Average assets $ 14,849,455 $ 14,646,381 $ 14,556,119 $ 14,332,804 $ 14,068,860 Return on average assets (GAAP) 1.36 % 1.25 % 1.12 % 1.23 % 1.26 % Adjusted return on average assets (non-GAAP) 1.32 % 1.27 % 1.14 % 1.28 % 1.26 %

28 Reconciliation of Non-GAAP Financial Measures Quarter ended ($ in thousands) September 30, 2024 June 30, 2024 March 31, 2024 December 31, 2023 September 30, 2023 ALLOWANCE COVERAGE RATIO ADJUSTED FOR GUARANTEED LOANS Loans (GAAP) $ 11,079,892 $ 11,000,007 $ 11,028,492 $ 10,884,118 $ 10,616,820 Less guaranteed loans 928,272 923,794 924,633 932,118 950,909 Adjusted loans (non-GAAP) $ 10,151,620 $ 10,076,213 $ 10,103,859 $ 9,952,000 $ 9,665,911 Allowance for credit losses $ 139,778 $ 139,464 $ 135,498 $ 134,771 $ 142,133 Allowance for credit losses/loans (GAAP) 1.26 % 1.27 % 1.23 % 1.24 % 1.34 % Allowance for credit losses/adjusted loans (non-GAAP) 1.38 % 1.38 % 1.34 % 1.35 % 1.47 % Quarter ended ($ in thousands) September 30, 2024 June 30, 2024 March 31, 2024 December 31, 2023 September 30, 2023 CORE EFFICIENCY RATIO Net interest income (GAAP) $ 143,469 $ 140,529 $ 137,728 $ 140,732 $ 141,639 Tax-equivalent adjustment 2,086 2,047 2,040 1,915 2,061 Noninterest income (GAAP) 21,420 15,494 12,158 25,452 12,085 Less gain on sale of investment securities — — — 220 — Less gain (loss) on sale of other real estate owned 3,159 — (2) — — Core revenue (non-GAAP) $ 163,816 $ 158,070 $ 151,928 $ 167,879 $ 155,785 Noninterest expense (GAAP) $ 98,007 $ 94,017 $ 93,501 $ 92,603 $ 88,644 Less FDIC special assessment — — 625 2,412 — Less core conversion expense 1,375 1,250 350 — — Less amortization on intangibles 927 944 1,047 1,108 1,118 Core revenue (non-GAAP) $ 95,705 $ 91,823 $ 91,479 $ 89,083 $ 87,526 Core efficiency ratio (non-GAAP) 58.4 % 58.1 % 60.2 % 53.1 % 56.2 %


