Midwest Super Community Bank Conference Kevin Eichner, CEO
Frank Sanfilippo, CFO
FORWARD LOOKING STATEMENTS
It should be noted that in addition to the historical information contained herein, this presentation contains forward-looking statements which are inherently subject to risks and uncertainties that could cause actual results to differ materially from those contemplated from such statements. Factors that could cause or contribute to such differences include, but are not limited to, burdens imposed by federal and state regulations of banks, credit risk, exposure to local economic conditions, risks associated with rapid increase or decrease in prevailing interest rates and competition from banks and other financial institutions, as well as those risks described in Enterprise Financial’s 2003 Annual Report or Form 10-K.
OUR BUSINESS MODEL
Enterprise Financial Services Corp is a high growth bank holding company in two lines of business, focused on private businesses and their owner families, currently operating in two urban markets.

MISSION
Our mission is to guide our clients to a lifetime of financial success.
VISION
Our vision is to build an exceptional company that clients love, shareholders prize and associates are proud to serve.
We expect Enterprise to be one of the very highest performing growth companies in the industry.
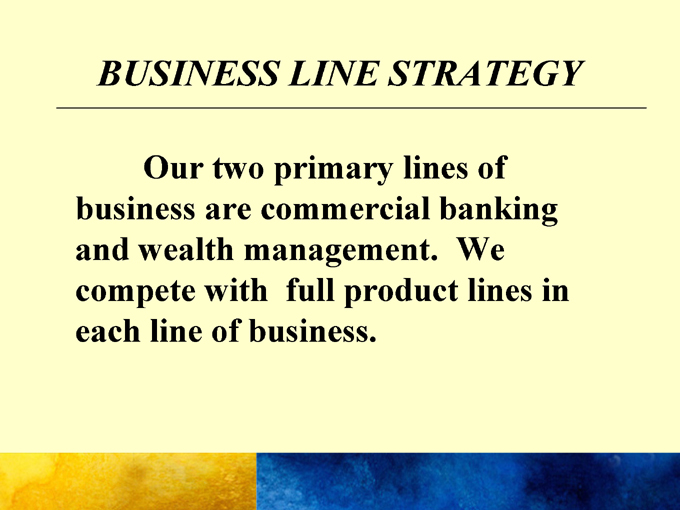
BUSINESS LINE STRATEGY
Our two primary lines of business are commercial banking and wealth management. We compete with full product lines in each line of business.
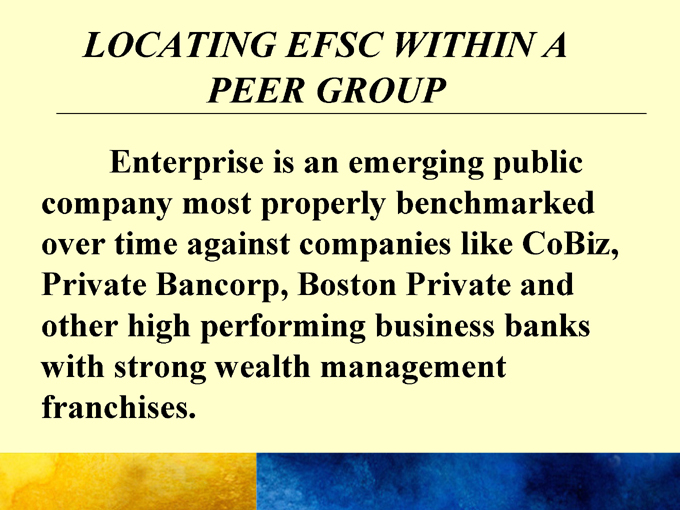
LOCATING EFSC WITHIN A
PEER GROUP
Enterprise is an emerging public company most properly benchmarked over time against companies like CoBiz, Private Bancorp, Boston Private and other high performing business banks with strong wealth management franchises.
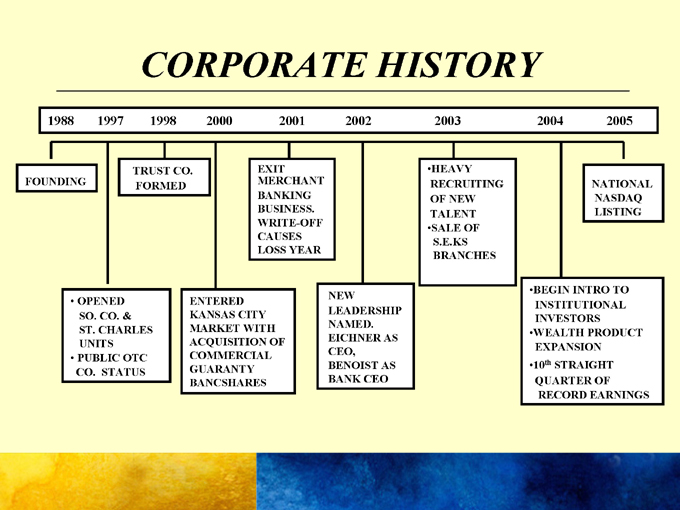
CORPORATE HISTORY
1988 1997 1998 2000 2001 2002 2003 2004 2005
FOUNDING
TRUST CO. FORMED
EXIT MERCHANT BANKING BUSINESS. WRITE-OFF CAUSES LOSS YEAR
HEAVY RECRUITING OF NEW TALENT SALE OF S.E.KS BRANCHES
NATIONAL NASDAQ LISTING
OPENED SO. CO. & ST. CHARLES UNITS
PUBLIC OTC CO. STATUS
ENTERED KANSAS CITY MARKET WITH ACQUISITION OF COMMERCIAL GUARANTY BANCSHARES
NEW
LEADERSHIP NAMED. EICHNER AS CEO, BENOIST AS BANK CEO
BEGIN INTRO TO INSTITUTIONAL INVESTORS WEALTH PRODUCT EXPANSION
10th STRAIGHT QUARTER OF
RECORD EARNINGS
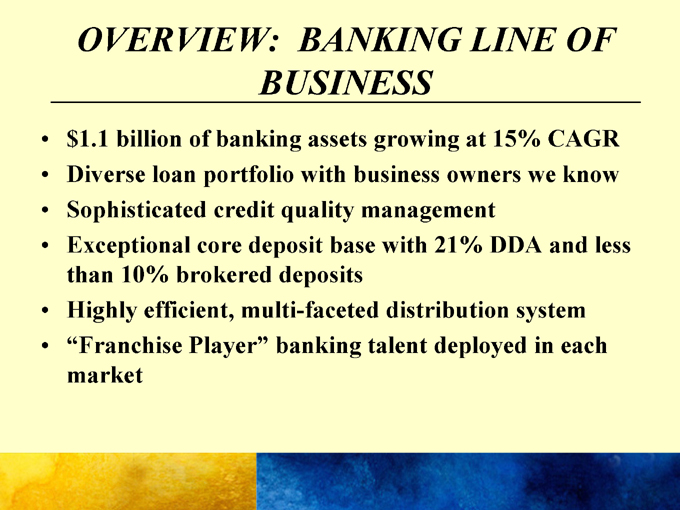
OVERVIEW: BANKING LINE OF BUSINESS
$1.1 billion of banking assets growing at 15% CAGR Diverse loan portfolio with business owners we know Sophisticated credit quality management Exceptional core deposit base with 21% DDA and less than 10% brokered deposits Highly efficient, multi-faceted distribution system “Franchise Player” banking talent deployed in each market
OVERVIEW: WEALTH MANAGEMENT LINE OF BUSINESS
Enterprise Trust has grown to $1.3 billion in assets in just six years – one of fastest growing Trust companies in U.S. Much more than money management with family office for business owners and other high net worth individuals Non-proprietary, open architecture platform Wealth Products and Business Consulting units augment Trust income and fill product voids LOB an excellent differentiator and now emerging as significant contributor to earnings lift Outstanding talent with full complement of attorneys, CFA’s, CPA’s, and other professionals

ST. LOUIS MARKET
St. Louis MSA is 18th largest in U.S. – Stable, diverse economic base A target-rich environment with nearly 60,000 privately held businesses 80,286 households with investible assets of $1 million or more
(Source: Investment News 12/04)
EFSC now largest and fastest growing billion dollar public bank holding company headquartered in St. Louis
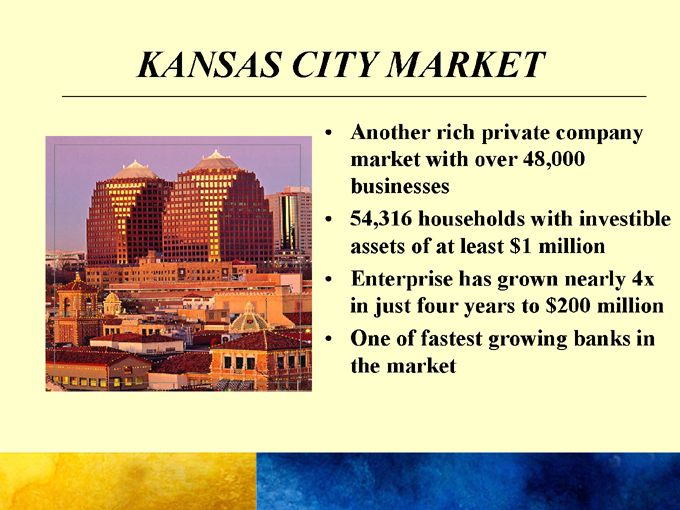
KANSAS CITY MARKET
Another rich private company market with over 48,000 businesses 54,316 households with investible assets of at least $1 million Enterprise has grown nearly 4x in just four years to $200 million One of fastest growing banks in the market
DIFFERENTIATORS
Our primary marketing differentiators are:
Holistic view of personal and business needs Name brand talent with outstanding reputations Exceptional service – top to bottom Sophisticated technology-enabled platform Narrow-cast marketing (e.g., Enterprise University)
ORGANIZATIONAL STRATEGIES
Enfranchisement recruiting model Fewer, but better people
Strong reward systems tied directly to annual and long-term performance contracts Very invested in assessment, training, and continuous development of talent Supportive, enjoyable culture High performance expectations with emphasis on disciplined execution
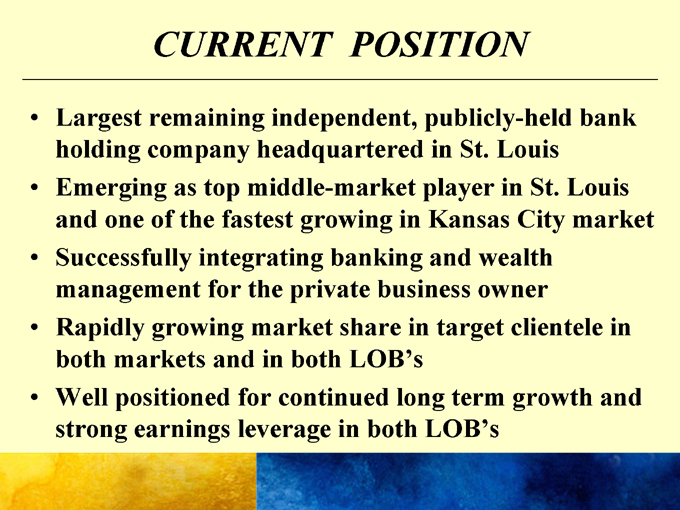
CURRENT POSITION
Largest remaining independent, publicly-held bank holding company headquartered in St. Louis Emerging as top middle-market player in St. Louis and one of the fastest growing in Kansas City market Successfully integrating banking and wealth management for the private business owner Rapidly growing market share in target clientele in both markets and in both LOB’s Well positioned for continued long term growth and strong earnings leverage in both LOB’s
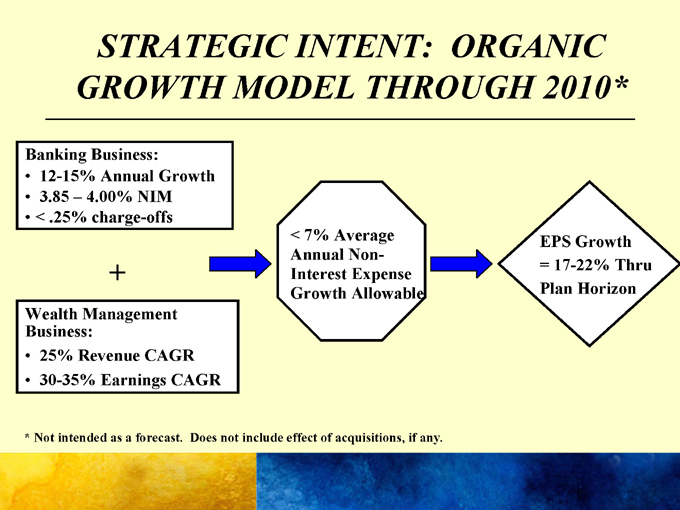
STRATEGIC INTENT: ORGANIC GROWTH MODEL THROUGH 2010*
Banking Business:
12-15% Annual Growth 3.85 – 4.00% NIM < .25% charge-offs
Wealth Management Business:
25% Revenue CAGR 30-35% Earnings CAGR
< 7% Average Annual Non-Interest Expense Growth Allowable
EPS Growth = 17-22% Thru Plan Horizon
* Not intended as a forecast. Does not include effect of acquisitions, if any.
+
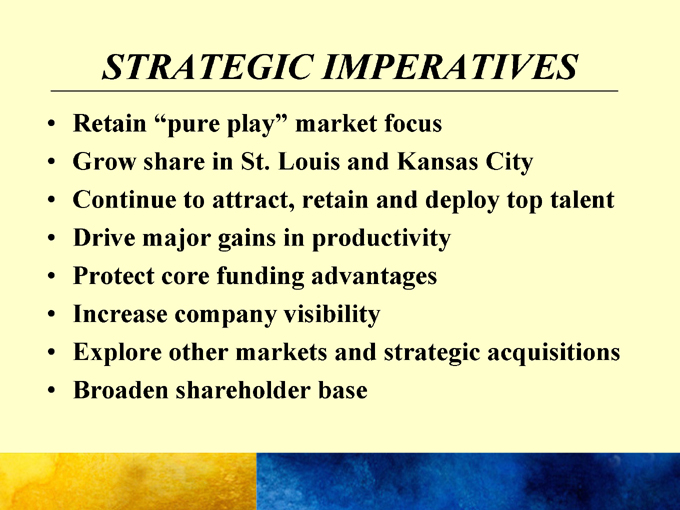
STRATEGIC IMPERATIVES
Retain “pure play” market focus Grow share in St. Louis and Kansas City Continue to attract, retain and deploy top talent Drive major gains in productivity Protect core funding advantages Increase company visibility Explore other markets and strategic acquisitions Broaden shareholder base

SELECTED FINANCIALS
FRANK SANFILIPPO
CFO
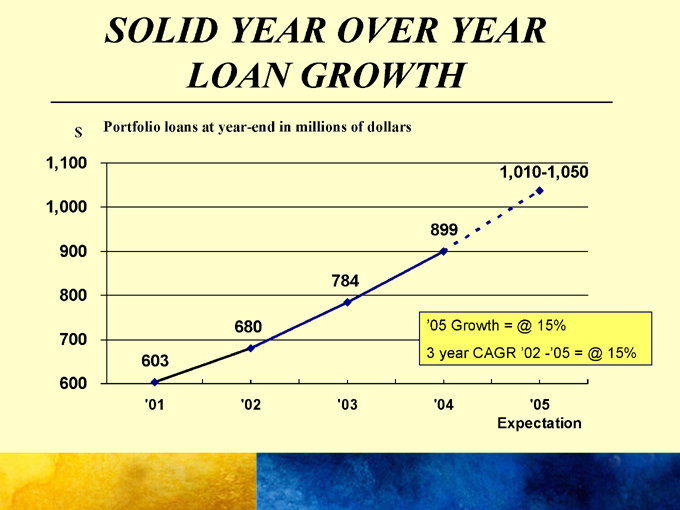
SOLID YEAR OVER YEAR
LOAN GROWTH
Portfolio loans at year-end in millions of dollars $
1,100 1,000 900 800 700 600
603
680
784
899
1,010-1,050
‘05 Growth = @ 15%
3 year CAGR ‘02 -‘05 = @ 15%
‘01 ‘02 ‘03 ‘04 ‘05 Expectation
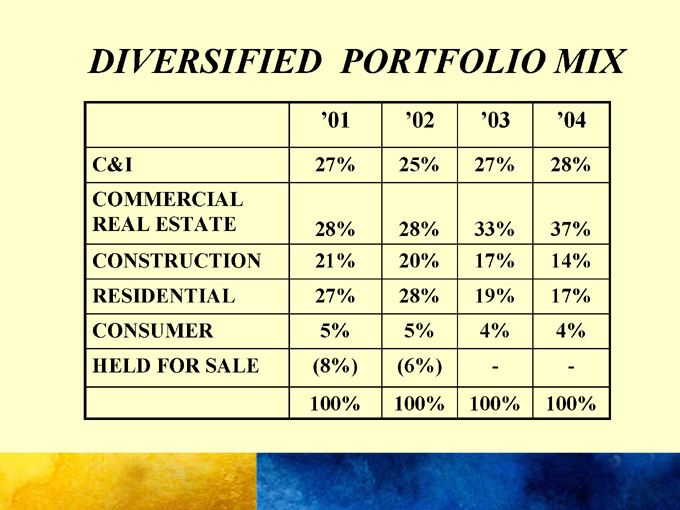
DIVERSIFIED PORTFOLIO MIX
‘01 ‘02 ‘03 ‘04
C&I 27% 25% 27% 28%
COMMERCIAL
REAL ESTATE 28% 28% 33% 37%
CONSTRUCTION 21% 20% 17% 14%
RESIDENTIAL 27% 28% 19% 17%
CONSUMER 5% 5% 4% 4%
HELD FOR SALE (8%) (6%) - -
100% 100% 100% 100%
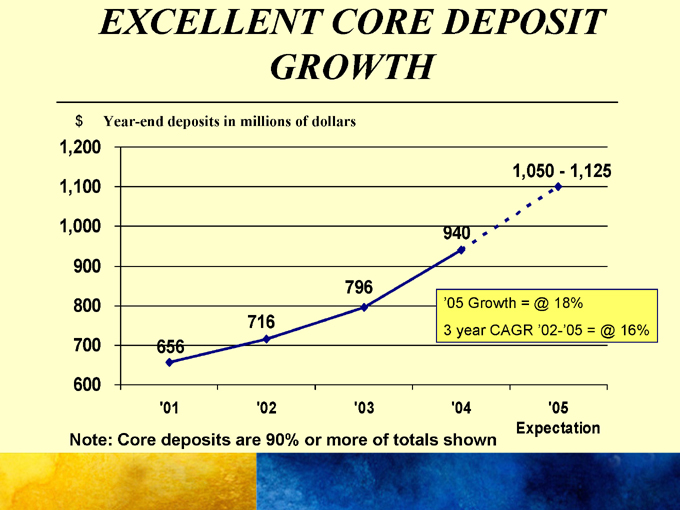
EXCELLENT CORE DEPOSIT
GROWTH
Year-end deposits in millions of dollars $
1,200 1,100 1,000 900 800 700 600
656
716
796
940
1,050-1,125
‘05 Growth = @ 18%
3 year CAGR ‘02-‘05 = @ 16%
‘01 ‘02 ‘03 ‘04 ‘05
Expectation
Note: Core deposits are 90% or more of totals shown
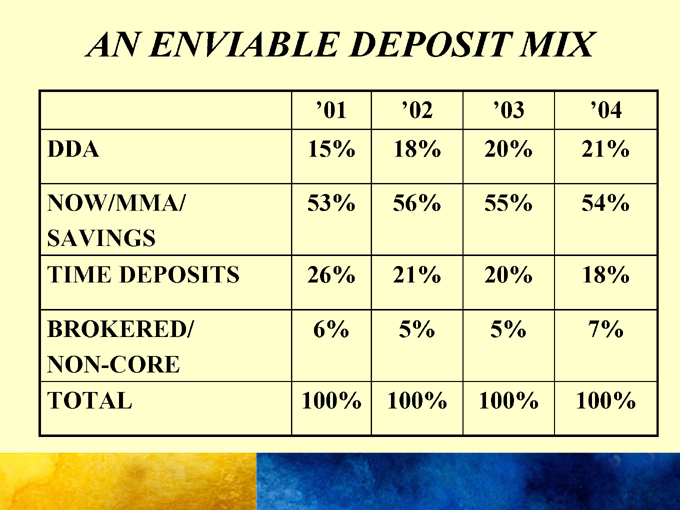
AN ENVIABLE DEPOSIT MIX
‘01 ‘02 ‘03 ‘04
DDA 15% 18% 20% 21%
NOW/MMA/ 53% 56% 55% 54%
SAVINGS
TIME DEPOSITS 26% 21% 20% 18%
BROKERED/ 6% 5% 5% 7%
NON-CORE
TOTAL 100% 100% 100% 100%
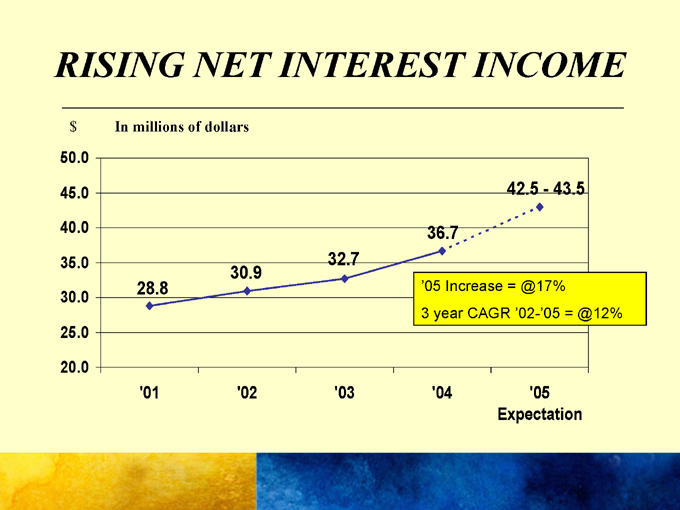
RISING NET INTEREST INCOME
In millions of dollars $
50.0 45.0 40.0 35.0 30.0 25.0 20.0
28.8
30.9
32.7
36.7
42.5-43.5
‘05 Increase = @17% 3 year CAGR ‘02-’05 = @12%
‘01 ‘02 ‘03 ‘04 ‘05 Expectation
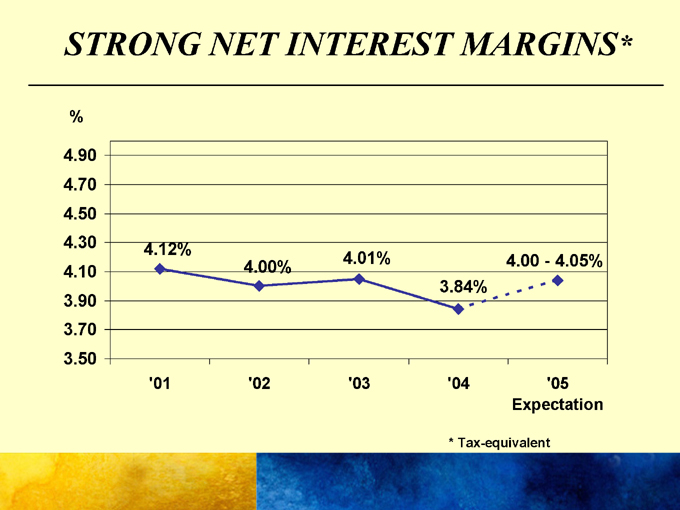
STRONG NET INTEREST MARGINS*
%
4.90 4.70 4.50
4.30 4.12%
4.01% 4.00 - 4.05% 4.10 4.00% 3.84% 3.90 3.70 3.50
‘01 ‘02 ‘03 ‘04 ‘05 Expectation
* Tax-equivalent
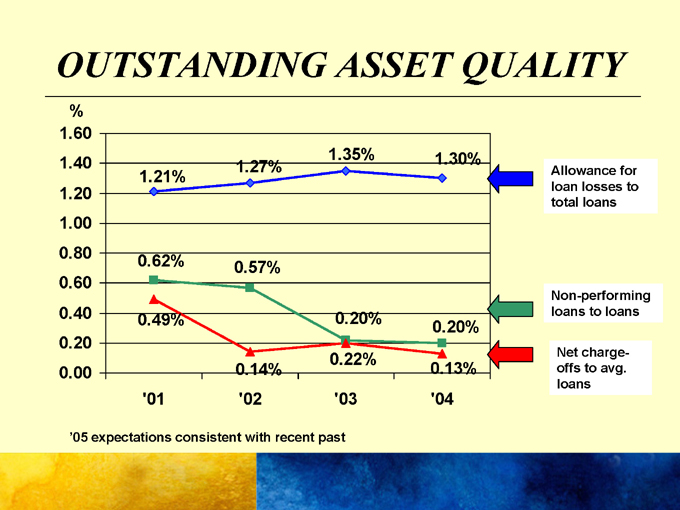
OUTSTANDING ASSET QUALITY
% 1.60
1.35% 1.30% 1.40 1.27% 1.21% 1.20 1.00 0.80 0.62% 0.57% 0.60 0.40 0.49% 0.20% 0.20% 0.20 0.22% 0.00 0.14% 0.13% ‘01 ‘02 ‘03 ‘04
Allowance for loan losses to total loans
Non-performing loans to loans
Net charge-offs to avg. loans
‘05 expectations consistent with recent past
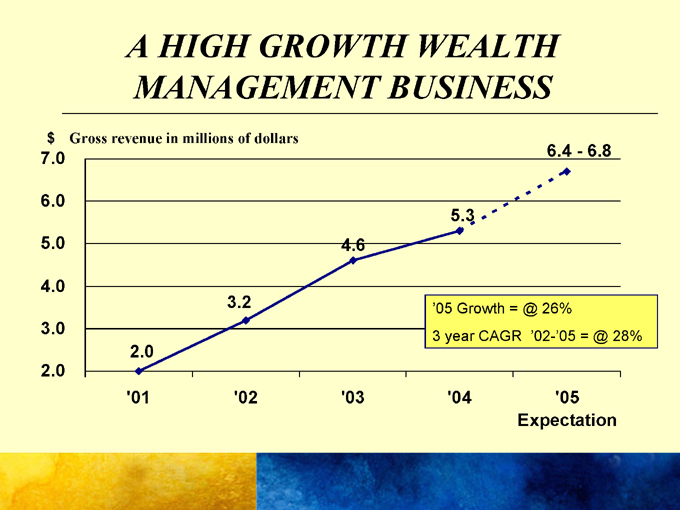
A HIGH GROWTH WEALTH MANAGEMENT BUSINESS
$ Gross revenue in millions of dollars
7.0 6.4-6.8 6.0 5.3 5.0 4.6
4.0
3.2 ‘05 Growth = @ 26%
3.0 3 year CAGR ‘02-’05 = @ 28%
2.0 2.0
‘01 ‘02 ‘03 ‘04 ‘05 Expectation
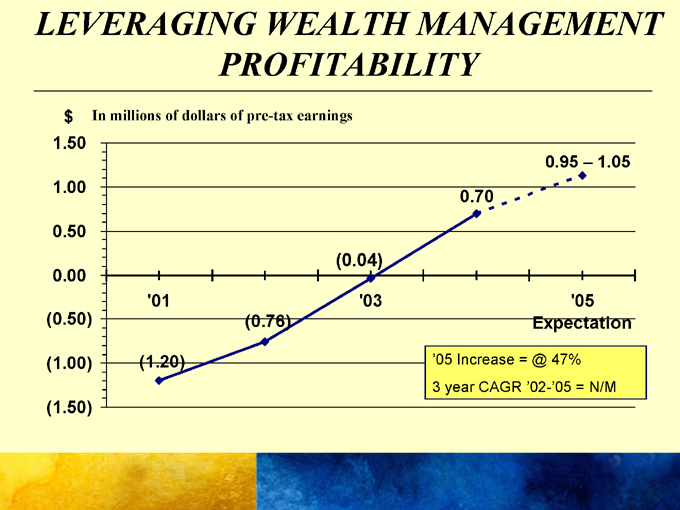
LEVERAGING WEALTH MANAGEMENT
PROFITABILITY
$ In millions of dollars of pre-tax earnings
1.50
0.95 – 1.05
1.00
0.70 0.50
(0.04)
0.00
‘01 ‘03 ‘05 (0.50) (0.76) Expectation
(1.00) (1.20) ‘05 Increase = @ 47% 3 year CAGR ‘02-’05 = N/M
(1.50)
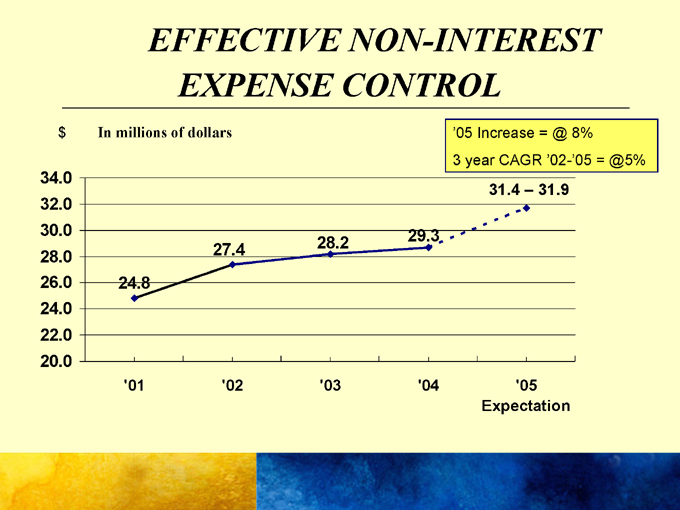
EFFECTIVE NON-INTEREST
EXPENSE CONTROL
$ In millions of dollars ‘05 Increase = @ 8% 3 year CAGR ‘02-’05 = @5%
34.0
31.4 – 31.9
32.0
30.0 29.3 27.4 28.2 28.0 26.0 24.8 24.0 22.0 20.0
‘01 ‘02 ‘03 ‘04 ‘05 Expectation
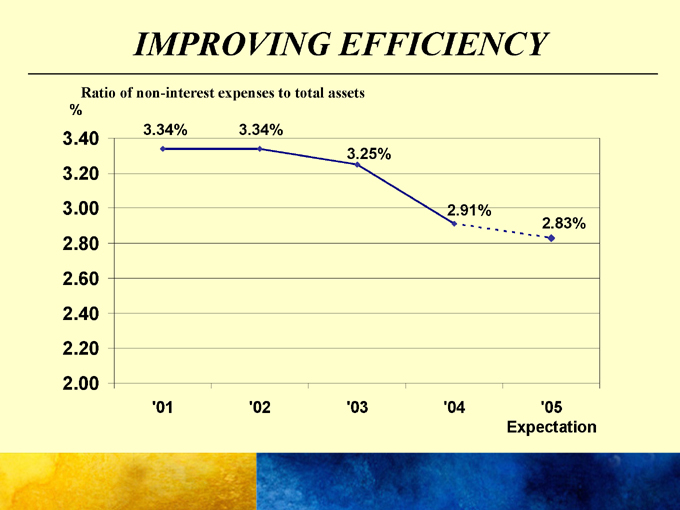
IMPROVING EFFICIENCY
Ratio of non-interest expenses to total assets
%
3.40 3.34% 3.34%
3.25%
3.20
3.00 2.91%
2.83%
2.80 2.60 2.40 2.20 2.00
‘01 ‘02 ‘03 ‘04 ‘05 Expectation
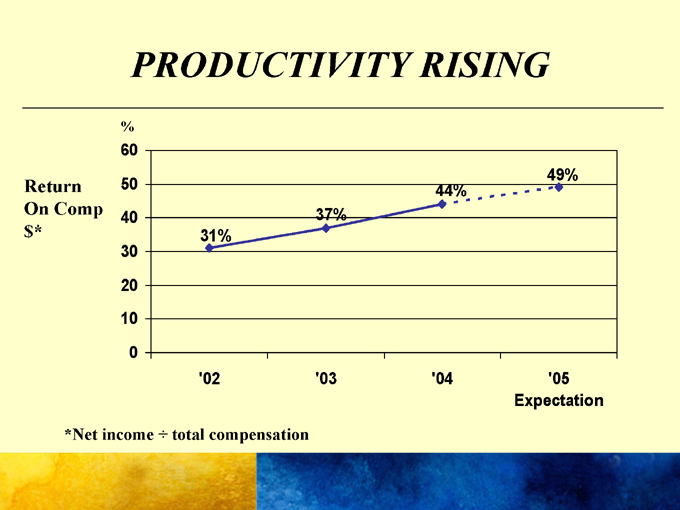
PRODUCTIVITY RISING
Return On Comp $*
%
60
49%
50 44%
40 37% 31% 30 20 10 0
‘02 ‘03 ‘04 ‘05 Expectation
*Net income ÷ total compensation
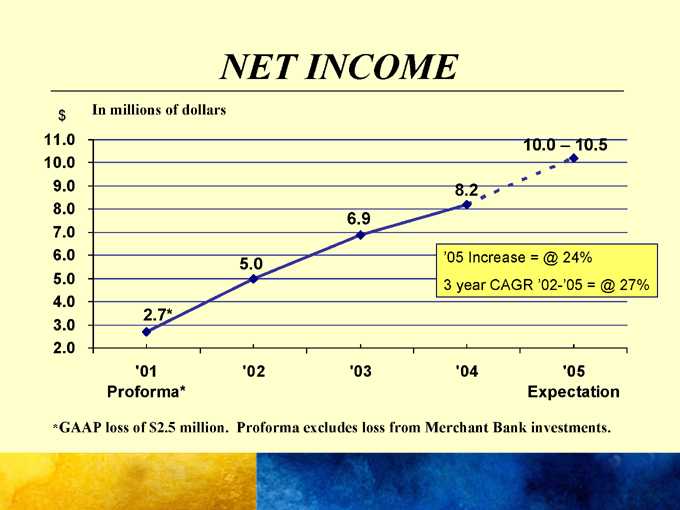
NET INCOME
In millions of dollars $
11.0 10.0 9.0 8.0 7.0 6.0 5.0 4.0 3.0 2.0
2.7*
5.0
6.9
8.2
10.0 – 10.5
‘05 Increase = @ 24% 3 year CAGR ‘02-’05 = @ 27%
‘01 ‘02 ‘03 ‘04 ‘05 Proforma* Expectation
*GAAP loss of $2.5 million. Proforma excludes loss from Merchant Bank investments.
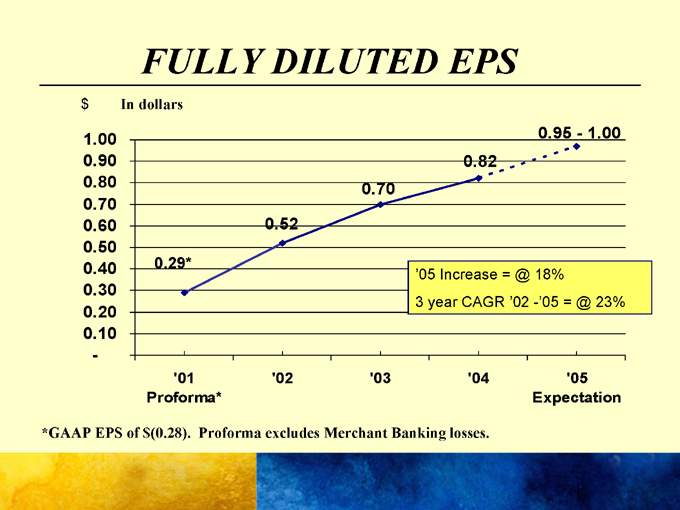
FULLY DILUTED EPS
$ In dollars
1.00 0.95-1.00 0.90 0.82 0.80 0.70 0.70 0.60 0.52 0.50 0.40 0.29*
‘05 Increase = @ 18%
0.30
3 year CAGR ‘02 -’05 = @ 23%
0.20 0.10 -
‘01 ‘02 ‘03 ‘04 ‘05 Proforma* Expectation
*GAAP EPS of $(0.28). Proforma excludes Merchant Banking losses.
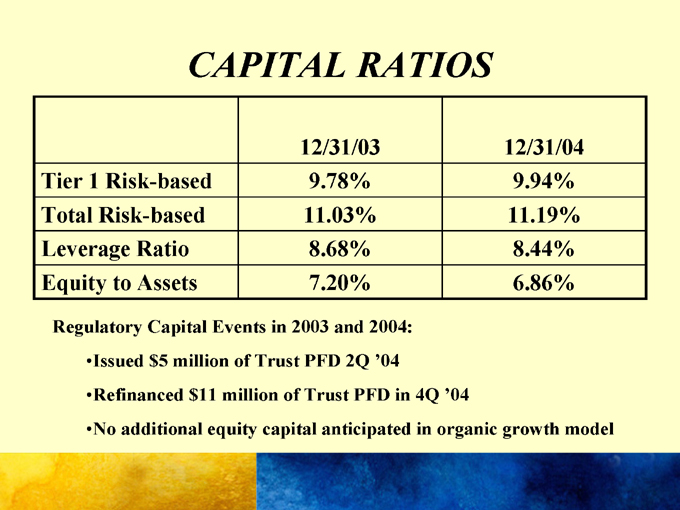
CAPITAL RATIOS
12/31/03 12/31/04
Tier 1 Risk-based 9.78% 9.94%
Total Risk-based 11.03% 11.19%
Leverage Ratio 8.68% 8.44%
Equity to Assets 7.20% 6.86%
Regulatory Capital Events in 2003 and 2004: Issued $5 million of Trust PFD 2Q ‘04 Refinanced $11 million of Trust PFD in 4Q ‘04
No additional equity capital anticipated in organic growth model
SUMMARY
KEVIN EICHNER
CEO
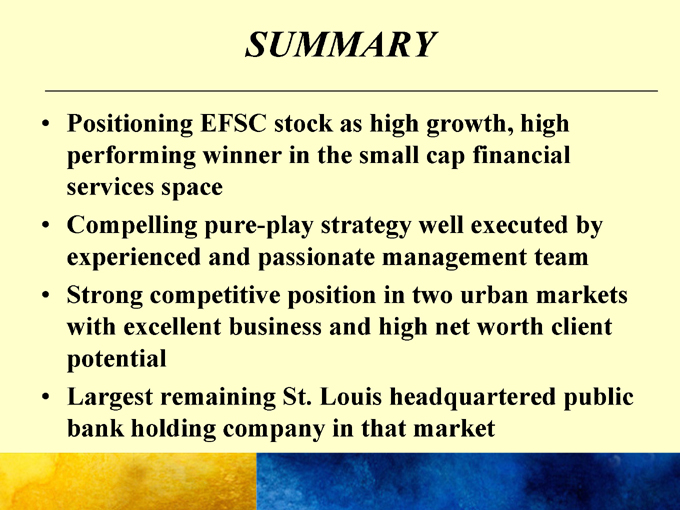
SUMMARY
Positioning EFSC stock as high growth, high performing winner in the small cap financial services space Compelling pure-play strategy well executed by experienced and passionate management team Strong competitive position in two urban markets with excellent business and high net worth client potential Largest remaining St. Louis headquartered public bank holding company in that market
SUMMARY (continued)
Achieving significant lift in EPS driven by:
Strong core banking growth Wealth management net fee income Non-interest expense control
Infrastructure and talent in place to support much larger business model Driving excellent shareholder returns with the prospect of continued long term growth Newly listed NASDAQ national market stock trading at just over 2.5x book with strong inside ownership
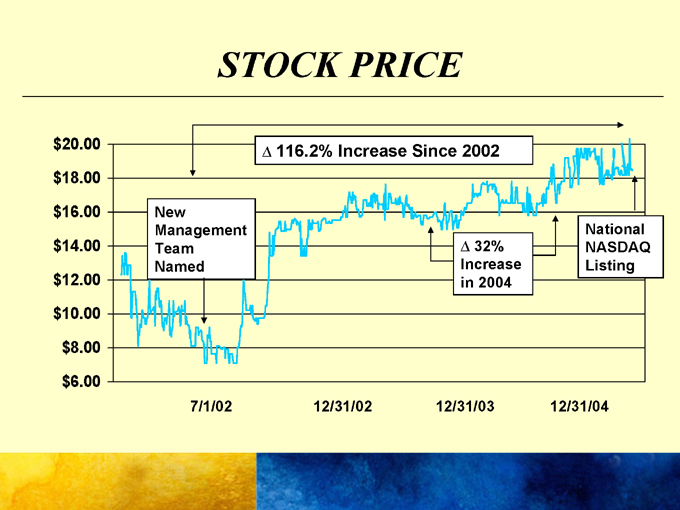
STOCK PRICE
$20.00 $18.00 $16.00 $14.00 $12.00 $10.00 $8.00 $6.00
New
Management Team Named
116.2% Increase Since 2002
32% Increase in 2004
National NASDAQ Listing
7/1/02 12/31/02 12/31/03 12/31/04

DISCUSSION