UNITED STATES
SECURITIES AND EXCHANGE COMMISSION
Washington, D.C. 20549
FORM N-CSR
CERTIFIED SHAREHOLDER REPORT OF REGISTERED MANAGEMENT INVESTMENT COMPANIES
Investment Company Act file number 811-05742 and 811-07885
Name of Fund: BlackRock Index Equity Portfolio of BlackRock Funds and Master S&P 500 Index Series of Quantitative Master Series LLC
Fund Address: 100 Bellevue Parkway, Wilmington, DE 19809
Name and address of agent for service: John M. Perlowski, Chief Executive Officer, BlackRock Index Equity Portfolio of BlackRock Funds and Master S&P 500 Index Series of Quantitative Master Series LLC, 40 East 52nd Street, New York, NY 10022
Registrant’s telephone number, including area code: (800) 441-7762
Date of fiscal year end: 12/31/2010
Date of reporting period: 12/31/2010
Item 1 – Report to Stockholders
|
|
| December 31, 2010 |

Annual Report
BlackRock Index Equity Portfolio | of BlackRock FundsSM
|
Not FDIC Insured • No Bank Guarantee • May Lose Value |
|
|
Table of Contents |
|
|
| Page |
| |
3 | |
Annual Report: |
|
4 | |
6 | |
6 | |
Portfolio Financial Statements: |
|
7 | |
8 | |
9 | |
10 | |
15 | |
Portfolio Report of Independent Registered Public Accounting Firm | 19 |
19 | |
20 | |
Series Financial Statements: |
|
21 | |
28 | |
29 | |
30 | |
30 | |
31 | |
Series Report of Independent Registered Public Accounting Firm | 35 |
36 | |
40 | |
43 |
|
|
|
2 | BLACKROCK INDEX EQUITY PORTFOLIO | DECEMBER 31, 2010 |
Economic data fluctuated widely throughout 2010 as the global economy continued to emerge from the “Great Recession.” As the year drew to a close, it became clear that cyclical stimulus had beaten out structural problems as economic data releases generally became more positive and financial markets showed signs of continuing improvement.
Debt and deflationary risks remained present throughout 2010, causing central banks worldwide to respond with unprecedented actions, most notably a second round of quantitative easing (informally known as “QE2”) from the US Federal Reserve Board (the “Fed”). Inflation remained a non-issue in the developed world, but continued to rear its ugly head in some emerging economies, most evidently in China. Global and US gross domestic product (“GDP”) growth both continued in a positive direction but remained subpar compared to most historical economic recoveries. In the United States, the corporate sector has been an important area of strength and consumer spending has shown improvement, although weakness in the housing and labor markets continues to burden the economy.
Stocks moved higher in the early months of 2010 on the continuation of the 2009 asset recovery story. The mid-year months saw a double-digit percentage correction on the back of the Greek sovereign debt crisis and a stalling in jobs growth, leading to fears of a double-dip recession. After touching a late summer low, equity markets rallied through year end as these concerns receded. The announcement of QE2 and extension of the Bush-era tax cuts further boosted equities as the year came to a close. Although the course was uneven and high volatility remained a constant for stocks, equity markets globally ended the year strong. Emerging markets outpaced the developed world in terms of economic growth and posted respectable gains for the year despite sovereign debt problems and heightening inflationary pressures. US stocks recorded double-digit percentage gains for the second consecutive year. Small cap stocks outperformed large caps as investors began to move into higher-risk assets.
In fixed income markets, yields trended lower over most of the year as investors continued to favor safer assets. That trend reversed abruptly in the fourth quarter when market fears abated and investors began seeking higher-risk assets, driving yields sharply upward through year end. However, yields were lower overall for the year and fixed income markets finished 2010 in positive territory. Although fixed income securities generally underperformed equities, high yield bonds only marginally trailed large cap stocks. Conversely, the tax-exempt municipal market was dealt an additional blow as it became apparent that an extension of the Build America Bond program was unlikely. In addition, the fourth quarter brought an increase in negative headlines regarding fiscal challenges faced by state and local governments, sparking additional volatility in the municipal market.
Cash investments, as represented by the 3-month Treasury bill, returned only a fraction over 0% for the year as short-term interest rates remained low. Yields on money market securities remain near all-time lows.
|
|
|
|
|
|
|
|
Total Returns as of December 31, 2010 |
| 6-month |
| 12-month |
| ||
US large cap equities (S&P 500 Index) |
| 23.27 | % |
| 15.06 | % |
|
US small cap equities (Russell 2000 Index) |
| 29.38 |
|
| 26.85 |
|
|
International equities (MSCI Europe, Australasia, Far East Index) |
| 24.18 |
|
| 7.75 |
|
|
3-month Treasury bill (BofA Merrill Lynch 3-Month Treasury Bill Index) |
| 0.08 |
|
| 0.13 |
|
|
US Treasury securities (BofA Merrill Lynch 10-Year US Treasury Index) |
| (1.33 | ) |
| 7.90 |
|
|
US investment grade bonds (Barclays Capital US Aggregate Bond Index) |
| 1.15 |
|
| 6.54 |
|
|
Tax-exempt municipal bonds (Barclays Capital Municipal Bond Index) |
| (0.90 | ) |
| 2.38 |
|
|
US high yield bonds (Barclays Capital US Corporate High Yield 2% Issuer Capped Index) |
| 10.04 |
|
| 14.94 |
|
|
Past performance is no guarantee of future results. Index performance shown for illustrative purposes only. You cannot invest directly in an index.
While no one can peer into a crystal ball and eliminate the uncertainties presented by the economic landscape and financial markets, BlackRock can offer investors the next best thing: partnership with the world’s largest asset management firm and a unique global perspective that allows us to identify trends early and capitalize on market opportunities. For additional market perspective and investment insight, visit www.blackrock.com/shareholdermagazine, where you’ll find the most recent issue of our award-winning Shareholder® magazine, as well as its quarterly companion newsletter, Shareholder Perspectives. As always, we thank you for entrusting BlackRock with your investments, and we look forward to your continued partnership in the months and years ahead.
|
Sincerely, |
|
|
|
Rob Kapito |
President, BlackRock Advisors, LLC |

|
|
|
| THIS PAGE NOT PART OF YOUR FUND REPORT | 3 |
|
Portfolio Management Commentary |
|
|
|
| How did the Portfolio perform? | |
|
| |
• | For the 12 months ended December 31,2010,the Institutional Shares of the BlackRock Index Equity Portfolio (the “Portfolio”) returned 14.94%, while the benchmark Standard & Poor’s (S&P) 500 Index returned 15.06% for the same period. The Portfolio’s Service, Investor A, Investor B and Investor C Shares also trailed the benchmark, returning 14.67%, 14.64%, 13.70% and 13.75%, respectively. The S&P 500 Index is a market-weighted index composed of 500 common stocks issued by large-capitalization companies in a wide range of businesses. The stocks included in the index collectively represent a substantial portion of all common stocks publicly traded in the United States. | |
|
| |
• | Returns for the Portfolio’s respective share classes differ from the benchmark index based on individual share class expenses. The Portfolio invests all of its assets in Master S&P 500 Index Series (the “Series”), a series of Quantitative Master Series LLC. | |
|
| |
| Describe the market environment. | |
|
| |
• | Over the course of 2010, cyclical stimulus beat out structural problems and stocks continued the choppy advance they began in 2009. The early months of 2010 saw risk assets move higher on the continuation of the 2009 asset recovery story, aided by preliminary signs of improvement in the employment situation and strong corporate earnings reported for fourth quarter 2009 and first quarter 2010. The middle months of 2010 saw a double-digit percentage correction on the back of the Greek sovereign debt crisis and a stalling in jobs growth, leading to fears of a double-dip recession. Investors were also unnerved by the May “flash crash” and the uncertainty surrounding the financial reform bill in the United States. Nevertheless, after touching a late summer low, equity markets experienced a strong finish to the year as double-dip fears receded, jobs growth resumed and the US midterm elections results were perceived to be capital markets friendly. Additionally, in the United States, Federal Reserve Chairman Ben Bernanke delivered his famous Jackson Hole speech, leading to a second round of quantitative easing measures (informally known as “QE2”) and, perhaps most importantly, the Bush-era tax cuts were extended and supplemented with some fiscal sweeteners. | |
|
| |
• | In 2010, US stocks posted double-digit percentage gains for the second consecutive year. The Dow Jones Industrial Average gained 14.06%, and in the process, moved past the levels last seen before the collapse of Lehman Brothers in late 2008. The S&P 500 Index advanced 15.06%, while the NASDAQ Composite Index moved up 18.02%. | |
|
| |
• | Within the benchmark S&P 500 Index, all 10 sectors posted gains for the period. Consumer discretionary posted the strongest returns (+27.66%), followed closely by industrials (+26.73%), materials (+22.20%) and energy (+20.46%), while the weakest returns came from health care (+2.90%) and utilities (+5.46%). | |
|
| |
| Describe recent portfolio activity. | |
|
| |
• | During the 12-month period, as changes were made to the composition of the S&P 500 Index, the Series purchased and sold securities to maintain its objective of replicating the risks and return of the benchmark. | |
|
| |
| Describe portfolio positioning at period end. | |
|
| |
• | The Series remains positioned to match the risk characteristics of its benchmark index, irrespective of the market’s future direction. | |
|
| |
|
| The views expressed reflect the opinions of BlackRock as of the date of this report and are subject to change based on changes in market, economic or other conditions. These views are not intended to be a forecast of future events and are no guarantee of future results. |
|
| |
|
Derivative Financial Instruments |
The Series may invest in various derivative instruments, including financial futures contracts, as specified in Note 2 of the Series’ Notes to Financial Statements, which constitute forms of economic leverage. Such instruments are used to obtain exposure to a market without owning or taking physical custody of securities or to hedge market and/or equity risks. Such derivative instruments involve risks, including the imperfect correlation between the value of a derivative instrument and the underlying asset or illiquidity of the derivative instrument. The Series’ ability to successfully use a derivative instrument depends on the investment advisor’s ability to accurately predict pertinent market movements, which cannot be assured. The use of derivative instruments may result in losses greater than if they had not been used, may require the Series to sell or purchase portfolio securities at inopportune times or for distressed values, may limit the amount of appreciation the Series can realize on an investment or may cause the Series to hold a security that it might otherwise sell. The Series’ investments in these instruments are discussed in detail in the Series’ Notes to Financial Statements.
|
|
|
4 | BLACKROCK INDEX EQUITY PORTFOLIO | DECEMBER 31, 2010 |
|
|
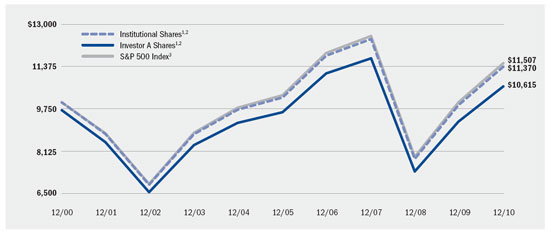
Total Return Based on a $10,000 Investment |
|
|
|
| 1 | Assuming maximum sales charges, transaction costs and other operating expenses, including investment advisory fees and administration fees, if any. Institutional Shares do not have a sales charge. |
|
|
|
| 2 | The Portfolio currently invests all of its assets in the Series. The Series’ investments are allocated among common stocks in approximately the same weightings as the S&P 500 Index. |
|
|
|
| 3 | This unmanaged index covers 500 industrial, utility, transportation and financial companies of the US markets (mostly New York Stock Exchange (“NYSE”) issues) representing about 75% of NYSE market capitalization and 30% of NYSE issues. |
|
Performance Summary for the Period Ended December 31, 2010 |
|
|
|
|
|
|
|
|
|
|
|
|
|
|
|
|
|
|
|
|
|
|
|
|
|
|
| Average Annual Total Returns4 |
| |||||||||||||||||
|
|
|
| |||||||||||||||||||
|
|
|
| 1 Year |
| 5 Years |
| 10 Years |
| |||||||||||||
|
|
|
|
|
| |||||||||||||||||
|
| 6-Month |
| w/o sales |
| w/sales |
| w/o sales |
| w/sales |
| w/o sales |
| w/sales |
| |||||||
Institutional |
| 23.19 | % |
| 14.94 | % |
| N/A |
|
| 2.22 | % |
| N/A |
|
| 1.29 | % |
| N/A |
|
|
Service |
| 23.07 |
|
| 14.67 |
|
| N/A |
|
| 2.01 |
|
| N/A |
|
| 0.98 |
|
| N/A |
|
|
Investor A |
| 23.07 |
|
| 14.64 |
|
| 11.20 | % |
| 1.98 |
|
| 1.36 | % |
| 0.91 |
|
| 0.60 | % |
|
Investor B |
| 22.51 |
|
| 13.70 |
|
| 9.20 |
|
| 1.16 |
|
| 0.77 |
|
| 0.28 |
|
| 0.28 |
|
|
Investor C |
| 22.57 |
|
| 13.75 |
|
| 12.75 |
|
| 1.16 |
|
| 1.16 |
|
| 0.12 |
|
| 0.12 |
|
|
S&P 500 Index |
| 23.27 |
|
| 15.06 |
|
| N/A |
|
| 2.29 |
|
| N/A |
|
| 1.41 |
|
| N/A |
|
|
|
|
|
| 4 | Assuming maximum sales charges, if any. Average annual total returns with and without sales charges reflect reductions for distribution and service fees. See “About Portfolio Performance” on page 6 for a detailed description of share classes, including any related sales charges and fees. |
|
| N/A — Not applicable as share class and index do not have a sales charge. |
|
| Past performance is not indicative of future results. |
|
|
|
|
| BLACKROCK INDEX EQUITY PORTFOLIO | DECEMBER 31, 2010 | 5 |
|
|
• | Institutional Shares are not subject to any sales charge. Institutional Shares bear no ongoing distribution or service fees and are available only to eligible investors. |
|
|
• | Service Shares are not subject to any sales charge. Service Shares are subject to a service fee of 0.15% per year (but no distribution fee) and are available only to eligible investors. |
|
|
• | Investor A Shares incur a maximum initial sales charge (front-end load) of 3% and a service fee of 0.15% per year (but no distribution fee). |
|
|
• | Investor B Shares are subject to a maximum contingent deferred sales charge of 4.50%, declining to 0% after six years. In addition, Investor B Shares are subject to a distribution fee of 0.75% per year and a service fee of 0.15% per year. These shares automatically convert to Investor A Shares after approximately eight years. (There is no initial sales charge for automatic share conversions.) All returns for periods greater than eight years reflect this conversion. |
|
|
• | Investor C Shares are subject to a 1% contingent deferred sales charge if redeemed within one year of purchase. In addition, these shares are subject to a distribution fee of 0.75% per year and a service fee of 0.15% per year. |
|
|
| Investor B and C Shares are closed to all investors. Institutional and Investor A Shares are closed to new investors but are open to existing investors for additional purchases. |
|
|
| Performance information reflects past performance and does not guarantee future results. Current performance may be lower or higher than the performance data quoted. Refer to www.blackrock.com/funds to obtain performance data current to the most recent month-end. Performance results do not reflect the deduction of taxes that a shareholder would pay on fund distributions or the redemption of fund shares. Figures shown in the performance table on the previous page assume reinvestment of all dividends and capital gain distributions, if any, at net asset value on the ex-dividend date. Investment return and principal value of shares will fluctuate so that shares, when redeemed, may be worth more or less than their original cost. Dividends paid to each class of shares will vary because of the different levels of service, distribution and transfer agency fees applicable to each class, which are deducted from the income available to be paid to shareholders. The Portfolio’s administrator waived a portion of its fee. Without such waiver, the Portfolio’s returns would have been lower. |
Shareholders of this Portfolio may incur the following charges: (a) expenses related to transactions, including sales charges; and (b) operating expenses, including administration fees, distribution fees including 12b-1 fees, and other Portfolio expenses. The expense example shown below (which is based on a hypothetical investment of $1,000 invested on July 1, 2010 and held through December 31, 2010) is intended to assist shareholders both in calculating expenses based on an investment in the Portfolio and in comparing these expenses with similar costs of investing in other mutual funds.
The table provides information about actual account values and actual expenses. In order to estimate the expenses a shareholder paid during the period covered by this report, shareholders can divide their account value by $1,000 and then multiply the result by the number corresponding to their share class under the heading entitled “Expenses Paid During the Period.”
The table also provides information about hypothetical account values and hypothetical expenses based on the Portfolio’s actual expense ratio and an assumed rate of return of 5% per year before expenses. In order to assist shareholders in comparing the ongoing expenses of investing in this Portfolio and other funds, compare the 5% hypothetical example with the 5% hypothetical examples that appear in other funds’ shareholder reports.
The expenses shown in the table are intended to highlight shareholders’ ongoing costs only and do not reflect any transactional expenses, such as sales charges, redemption fees or exchange fees. Therefore, the hypothetical example is useful in comparing ongoing expenses only, and will not help shareholders determine the relative total expenses of owning different funds. If these transactional expenses were included, shareholder expenses would have been higher.
|
Expense Example |
|
|
|
|
|
|
|
|
|
|
|
|
|
|
|
|
|
|
|
|
|
|
|
|
| Actual |
| Hypothetical2 |
|
|
| |||||||||||||||
|
|
|
|
|
| |||||||||||||||||
|
| Beginning |
| Ending |
| Expenses Paid |
| Beginning |
| Ending |
| Expenses Paid |
| Annualized |
| |||||||
Institutional |
| $ | 1,000.00 |
| $ | 1,231.90 |
| $ | 1.01 |
| $ | 1,000.00 |
| $ | 1,024.29 |
| $ | 0.92 |
|
| 0.18 | % |
Service |
| $ | 1,000.00 |
| $ | 1,230.70 |
| $ | 2.19 |
| $ | 1,000.00 |
| $ | 1,023.23 |
| $ | 1.99 |
|
| 0.39 | % |
Investor A |
| $ | 1,000.00 |
| $ | 1,230.70 |
| $ | 2.36 |
| $ | 1,000.00 |
| $ | 1,023.08 |
| $ | 2.14 |
|
| 0.42 | % |
Investor B |
| $ | 1,000.00 |
| $ | 1,225.10 |
| $ | 6.95 |
| $ | 1,000.00 |
| $ | 1,018.95 |
| $ | 6.31 |
|
| 1.24 | % |
Investor C |
| $ | 1,000.00 |
| $ | 1,225.70 |
| $ | 6.96 |
| $ | 1,000.00 |
| $ | 1,018.95 |
| $ | 6.31 |
|
| 1.24 | % |
|
|
|
| 1 | For each class of the Portfolio, expenses are equal to the expense ratio for the class, multiplied by the average account value over the period, multiplied by 184/365 (to reflect the one-half year period shown). Because the Portfolio is a feeder fund, the expense example reflects the expenses of both the feeder fund and the master fund in which it invests. |
|
|
|
| 2 | Hypothetical 5% annual return before expenses is calculated by pro rating the number of days in the most recent fiscal half year divided by 365. |
|
|
|
6 | BLACKROCK INDEX EQUITY PORTFOLIO | DECEMBER 31, 2010 |
|
|
|
|
|
December 31, 2010 |
|
|
|
|
Assets |
|
|
|
|
Investments at value — Master S&P 500 Index Series (cost — $620,870,434) |
| $ | 599,911,579 |
|
Withdrawals receivable from the Series |
|
| 3,918,886 |
|
Capital shares sold receivable |
|
| 2,437,862 |
|
Prepaid expenses |
|
| 37,112 |
|
|
|
| ||
Total assets |
|
| 606,305,439 |
|
|
|
| ||
|
|
|
|
|
Liabilities |
|
|
|
|
Capital shares redeemed payable |
|
| 6,356,748 |
|
Service and distribution fees payable |
|
| 86,586 |
|
Administration fees payable |
|
| 61,838 |
|
Other affiliates payable |
|
| 3,684 |
|
Officer’s fees payable |
|
| 136 |
|
Other accrued expenses payable |
|
| 181,414 |
|
|
|
| ||
Total liabilities |
|
| 6,690,406 |
|
|
|
| ||
Net Assets |
| $ | 599,615,033 |
|
|
|
| ||
|
|
|
|
|
Net Assets Consist of |
|
|
|
|
Paid-in capital |
| $ | 207,439,360 |
|
Undistributed net investment income |
|
| 383,486 |
|
Accumulated net realized gain allocated from the Series |
|
| 412,751,042 |
|
Net unrealized appreciation/depreciation allocated from the Series |
|
| (20,958,855 | ) |
|
|
| ||
Net Assets |
| $ | 599,615,033 |
|
|
|
| ||
|
|
|
|
|
Net Asset Value |
|
|
|
|
Institutional — Based on net assets of $317,357,377 and 13,132,405 shares outstanding, unlimited number of shares authorized, $0.001 par value |
| $ | 24.17 |
|
|
|
| ||
Service — Based on net assets of $27,234,303 and 1,134,730 shares outstanding, unlimited number of shares authorized, $0.001 par value |
| $ | 24.00 |
|
|
|
| ||
Investor A — Based on net assets of $174,714,061 and 7,285,894 shares outstanding, unlimited number of shares authorized, $0.001 par value |
| $ | 23.98 |
|
|
|
| ||
Investor B — Based on net assets of $4,593,716 and 193,736 shares outstanding, unlimited number of shares authorized, $0.001 par value |
| $ | 23.71 |
|
|
|
| ||
Investor C — Based on net assets of $75,715,576 and 3,214,127 shares outstanding, unlimited number of shares authorized, $0.001 par value |
| $ | 23.56 |
|
|
|
| ||
|
|
|
See Notes to Financial Statements. | ||
BLACKROCK INDEX EQUITY PORTFOLIO | DECEMBER 31, 2010 | 7 |
|
|
|
|
|
Year Ended December 31, 2010 |
|
|
|
|
Investment Income |
|
|
|
|
Net investment income allocated from the Series: |
|
|
|
|
Dividends — unaffiliated |
| $ | 12,109,033 |
|
Securities lending — affiliated |
|
| 52,699 |
|
Dividends — affiliated |
|
| 17,887 |
|
Expenses |
|
| (223,354 | ) |
|
|
| ||
Total income |
|
| 11,956,265 |
|
|
|
| ||
|
|
|
|
|
Expenses |
|
|
|
|
Administration |
|
| 432,362 |
|
Administration — class specific |
|
| 147,062 |
|
Service — Service |
|
| 36,727 |
|
Service — Investor A |
|
| 249,906 |
|
Service and distribution — Investor B |
|
| 60,488 |
|
Service and distribution — Investor C |
|
| 672,717 |
|
Transfer agent — Institutional |
|
| 116,440 |
|
Transfer agent — Service |
|
| 13,508 |
|
Transfer agent — Investor A |
|
| 148,937 |
|
Transfer agent — Investor B |
|
| 16,567 |
|
Transfer agent — Investor C |
|
| 109,801 |
|
Printing |
|
| 127,832 |
|
Registration |
|
| 59,816 |
|
Professional |
|
| 76,691 |
|
Officer |
|
| 274 |
|
Miscellaneous |
|
| 16,678 |
|
Recoupment of past waived fees — class specific |
|
| 14,452 |
|
|
|
| ||
Total expenses |
|
| 2,300,258 |
|
Less fees waived by administrator |
|
| (213 | ) |
Less fees waived by administrator — class specific |
|
| (85,905 | ) |
Less transfer agent fees waived and/or reimbursed — class specific |
|
| (58,283 | ) |
|
|
| ||
Total expenses after fees waived and/or reimbursed |
|
| 2,155,857 |
|
|
|
| ||
Net investment income |
|
| 9,800,408 |
|
|
|
| ||
|
|
|
|
|
Realized and Unrealized Gain (Loss) Allocated from the Series |
|
|
|
|
Net realized loss from investments and financial futures contracts |
|
| (19,969,914 | ) |
Net change in unrealized appreciation/depreciation on investments and financial futures contracts |
|
| 91,519,458 |
|
|
|
| ||
Total realized and unrealized gain |
|
| 71,549,544 |
|
|
|
| ||
Net Increase in Net Assets Resulting from Operations |
| $ | 81,349,952 |
|
|
|
| ||
|
|
|
See Notes to Financial Statements. | ||
8 | BLACKROCK INDEX EQUITY PORTFOLIO | DECEMBER 31, 2010 |
|
|
|
|
|
|
|
|
|
| Year Ended |
| ||||
|
|
| |||||
Increase (Decrease) in Net Assets: |
| 2010 |
| 2009 |
| ||
Operations |
|
|
|
|
|
|
|
Net investment income |
| $ | 9,800,408 |
| $ | 10,511,983 |
|
Net realized loss |
|
| (19,969,914 | ) |
| (51,140,292 | ) |
Net change in unrealized appreciation/depreciation |
|
| 91,519,458 |
|
| 170,459,436 |
|
|
|
| |||||
Net increase in net assets resulting from operations |
|
| 81,349,952 |
|
| 129,831,127 |
|
|
|
| |||||
Dividends to Shareholders From |
|
|
|
|
|
|
|
Net investment income: |
|
|
|
|
|
|
|
Institutional |
|
| (6,076,854 | ) |
| (6,400,893 | ) |
Service |
|
| (431,994 | ) |
| (386,057 | ) |
Investor A |
|
| (2,868,914 | ) |
| (2,768,464 | ) |
Investor B |
|
| (45,511 | ) |
| (124,163 | ) |
Investor C |
|
| (687,965 | ) |
| (843,974 | ) |
|
|
| |||||
Decrease in net assets resulting from dividends to shareholders |
|
| (10,111,238 | ) |
| (10,523,551 | ) |
|
|
| |||||
|
|
|
|
|
|
|
|
Capital Share Transactions |
|
|
|
|
|
|
|
Net decrease in net assets derived from capital share transactions |
|
| (89,535,289 | ) |
| (40,291,544 | ) |
|
|
| |||||
|
|
|
|
|
|
|
|
Net Assets |
|
|
|
|
|
|
|
Total increase (decrease) in net assets |
|
| (18,296,575 | ) |
| 79,016,032 |
|
Beginning of year |
|
| 617,911,608 |
|
| 538,895,576 |
|
|
|
| |||||
End of year |
| $ | 599,615,033 |
| $ | 617,911,608 |
|
|
|
|
|
|
|
|
|
|
|
| |||||
Undistributed net investment income |
| $ | 383,486 |
| $ | 694,316 |
|
|
|
| |||||
|
|
|
See Notes to Financial Statements. | ||
BLACKROCK INDEX EQUITY PORTFOLIO | DECEMBER 31, 2010 | 9 |
|
|
|
|
|
|
|
|
|
|
|
|
|
|
|
|
|
|
|
|
|
| Institutional |
| ||||||||||||||||
|
| ||||||||||||||||||
|
|
|
|
|
|
|
| Period |
|
|
|
|
| ||||||
|
| Year Ended |
|
| Year Ended |
| |||||||||||||
|
|
|
| ||||||||||||||||
|
| 2010 |
| 2009 |
| 2008 |
|
| 2007 |
| 2006 |
| |||||||
Per Share Operating Performance |
|
|
|
|
|
|
|
|
|
|
|
|
|
|
|
|
|
|
|
Net asset value, beginning of period |
| $ | 21.43 |
| $ | 17.32 |
| $ | 28.22 |
| $ | 29.58 |
| $ | 25.70 |
| $ | 23.63 |
|
|
| ||||||||||||||||||
Net investment income1 |
|
| 0.41 |
|
| 0.40 |
|
| 0.51 |
|
| 0.14 |
|
| 0.52 |
|
| 0.44 |
|
Net realized and unrealized gain (loss) |
|
| 2.76 |
|
| 4.11 |
|
| (10.88 | ) |
| (1.11 | ) |
| 3.64 | 2 |
| 2.08 | 2 |
|
| ||||||||||||||||||
Net increase (decrease) from investment operations |
|
| 3.17 |
|
| 4.51 |
|
| (10.37 | ) |
| (0.97 | ) |
| 4.16 |
|
| 2.52 |
|
|
| ||||||||||||||||||
Dividends from net investment income |
|
| (0.43 | ) |
| (0.40 | ) |
| (0.53 | ) |
| (0.39 | ) |
| (0.28 | ) |
| (0.45 | ) |
|
| ||||||||||||||||||
Net asset value, end of period |
| $ | 24.17 |
| $ | 21.43 |
| $ | 17.32 |
| $ | 28.22 |
| $ | 29.58 |
| $ | 25.70 |
|
|
| ||||||||||||||||||
|
|
|
|
|
|
|
|
|
|
|
|
|
|
|
|
|
|
|
|
Total Investment Return3 |
|
|
|
|
|
|
|
|
|
|
|
|
|
|
|
|
|
|
|
|
|
|
|
|
|
|
|
|
|
|
|
|
|
|
|
|
|
|
|
Based on net asset value |
|
| 14.94 | % |
| 26.38 | % |
| (37.06 | )% |
| (3.28 | )%4 |
| 16.27 | % |
| 10.75 | % |
|
| ||||||||||||||||||
|
|
|
|
|
|
|
|
|
|
|
|
|
|
|
|
|
|
|
|
Ratios to Average Net Assets5 |
|
|
|
|
|
|
|
|
|
|
|
|
|
|
|
|
|
|
|
Total expenses |
|
| 0.22 | % |
| 0.25 | % |
| 0.19 | % |
| 0.16 | %6 |
| 0.18 | % |
| 0.26 | % |
|
| ||||||||||||||||||
Total expenses excluding recoupment and before fees waived and reimbursed |
|
| 0.18 | % |
| 0.18 | % |
| 0.18 | % |
| 0.15 | %6 |
| 0.17 | % |
| 0.18 | % |
|
| ||||||||||||||||||
Total expenses after fees waived and reimbursed |
|
| 0.18 | % |
| 0.18 | % |
| 0.18 | % |
| 0.15 | %6 |
| 0.17 | % |
| 0.18 | % |
|
| ||||||||||||||||||
Net investment income |
|
| 1.89 | % |
| 2.18 | % |
| 2.18 | % |
| 1.89 | %6 |
| 1.89 | % |
| 1.81 | % |
|
| ||||||||||||||||||
|
|
|
|
|
|
|
|
|
|
|
|
|
|
|
|
|
|
|
|
Supplemental Data |
|
|
|
|
|
|
|
|
|
|
|
|
|
|
|
|
|
|
|
Net assets, end of period (000) |
| $ | 317,357 |
| $ | 338,651 |
| $ | 282,940 |
| $ | 464,166 |
| $ | 491,201 |
| $ | 474,801 |
|
|
| ||||||||||||||||||
Portfolio turnover of the Series |
|
| 5 | % |
| 7 | % |
| 8 | % |
| 4 | % |
| 1 | %7 |
| 4 | %8 |
|
| ||||||||||||||||||
|
|
|
| 1 | Based on average shares outstanding. |
|
|
|
| 2 | Includes a redemption fee, which is less than $0.01 per share. |
|
|
|
| 3 | Where applicable, total investment returns exclude the effects of any sales charges and include the reinvestment of dividends and distributions. |
|
|
|
| 4 | Aggregate total investment return. |
|
|
|
| 5 | Includes the Portfolio’s share of the Series’ (for the period June 4, 2007 to December 31, 2007 and the years ended December 31, 2008, 2009 and 2010) and The U.S. Large Company Series (for the year ended 2006 and the period October 1, 2006 to June 3, 2007) allocated expenses and/or net investment income. |
|
|
|
| 6 | Annualized. |
|
|
|
| 7 | Represents the portfolio turnover of the Series for the period June 4, 2007 to September 30, 2007. |
|
|
|
| 8 | Represents the portfolio turnover of The U.S. Large Company Series for the period October 1, 2005 to September 30, 2006. |
|
|
|
See Notes to Financial Statements. | ||
10 | BLACKROCK INDEX EQUITY PORTFOLIO | DECEMBER 31, 2010 |
|
|
|
|
Financial Highlights (continued) | BlackRock Index Equity Portfolio |
|
|
|
|
|
|
|
|
|
|
|
|
|
|
|
|
|
|
|
|
|
| Service |
| ||||||||||||||||
|
| ||||||||||||||||||
|
|
|
| Period |
|
| |||||||||||||
|
| Year Ended |
| Year Ended |
| ||||||||||||||
|
|
| |||||||||||||||||
|
| 2010 |
| 2009 |
| 2008 |
| 2007 |
| 2006 |
| ||||||||
Per Share Operating Performance |
|
|
|
|
|
|
|
|
|
|
|
|
|
|
|
|
|
|
|
Net asset value, beginning of period |
| $ | 21.29 |
| $ | 17.21 |
| $ | 28.04 |
| $ | 29.37 |
| $ | 25.53 |
| $ | 23.48 |
|
|
| ||||||||||||||||||
Net investment income1 |
|
| 0.37 |
|
| 0.35 |
|
| 0.46 |
|
| 0.14 |
|
| 0.46 |
|
| 0.37 |
|
Net realized and unrealized gain (loss) |
|
| 2.73 |
|
| 4.09 |
|
| (10.81 | ) |
| (1.11 | ) |
| 3.64 | 2 |
| 2.06 | 2 |
|
| ||||||||||||||||||
Net increase (decrease) from investment operations |
|
| 3.10 |
|
| 4.44 |
|
| (10.35 | ) |
| (0.97 | ) |
| 4.10 |
|
| 2.43 |
|
|
| ||||||||||||||||||
Dividends from net investment income |
|
| (0.39 | ) |
| (0.36 | ) |
| (0.48 | ) |
| (0.36 | ) |
| (0.26 | ) |
| (0.38 | ) |
|
| ||||||||||||||||||
Net asset value, end of period |
| $ | 24.00 |
| $ | 21.29 |
| $ | 17.21 |
| $ | 28.04 |
| $ | 29.37 |
| $ | 25.53 |
|
|
| ||||||||||||||||||
|
|
|
|
|
|
|
|
|
|
|
|
|
|
|
|
|
|
|
|
Total Investment Return3 |
|
|
|
|
|
|
|
|
|
|
|
|
|
|
|
|
|
|
|
Based on net asset value |
|
| 14.67 | % |
| 26.11 | % |
| (37.20 | )% |
| (3.28 | )%4 |
| 16.12 | % |
| 10.42 | % |
|
| ||||||||||||||||||
|
|
|
|
|
|
|
|
|
|
|
|
|
|
|
|
|
|
|
|
Ratios to Average Net Assets5 |
|
|
|
|
|
|
|
|
|
|
|
|
|
|
|
|
|
|
|
|
|
|
|
|
|
|
|
|
|
|
|
|
|
|
|
|
|
|
|
Total expenses |
|
| 0.39 | % |
| 0.42 | % |
| 0.40 | % |
| 0.17 | %6 |
| 0.34 | % |
| 0.49 | % |
|
| ||||||||||||||||||
Total expenses excluding recoupment and before fees waived and reimbursed |
|
| 0.39 | % |
| 0.41 | % |
| 0.40 | % |
| 0.17 | %6 |
| 0.34 | % |
| 0.49 | % |
|
| ||||||||||||||||||
Total expenses after fees waived and reimbursed |
|
| 0.39 | % |
| 0.41 | % |
| 0.40 | % |
| 0.16 | %6 |
| 0.33 | % |
| 0.46 | % |
|
| ||||||||||||||||||
Net investment income |
|
| 1.69 | % |
| 1.95 | % |
| 1.98 | % |
| 1.84 | %6 |
| 1.70 | % |
| 1.53 | % |
|
| ||||||||||||||||||
|
|
|
|
|
|
|
|
|
|
|
|
|
|
|
|
|
|
|
|
Supplemental Data |
|
|
|
|
|
|
|
|
|
|
|
|
|
|
|
|
|
|
|
Net assets, end of period (000) |
| $ | 27,234 |
| $ | 23,584 |
| $ | 17,256 |
| $ | 26,177 |
| $ | 35,719 |
| $ | 44,765 |
|
|
| ||||||||||||||||||
Portfolio turnover of the Series |
|
| 5 | % |
| 7 | % |
| 8 | % |
| 4 | % |
| 1 | %7 |
| 4 | %8 |
|
| ||||||||||||||||||
|
|
|
| 1 | Based on average shares outstanding. |
|
|
|
| 2 | Includes a redemption fee, which is less than $0.01 per share. |
|
|
|
| 3 | Where applicable, total investment returns include the reinvestment of dividends and distributions. |
|
|
|
| 4 | Aggregate total investment return. |
|
|
|
| 5 | Includes the Portfolio’s share of the Series’ (for the period June 4, 2007 to December 31, 2007 and the years ended December 31, 2008, 2009 and 2010) and The U.S. Large Company Series (for the year ended 2006 and the period October 1, 2006 to June 3, 2007) allocated expenses and/or net investment income. |
|
|
|
| 6 | Annualized. |
|
|
|
| 7 | Represents the portfolio turnover of the Series for the period June 4, 2007 to September 30, 2007. |
|
|
|
| 8 | Represents the portfolio turnover of The U.S. Large Company Series for the period October 1, 2005 to September 30, 2006. |
|
|
|
|
See Notes to Financial Statements. | |||
| BLACKROCK INDEX EQUITY PORTFOLIO | DECEMBER 31, 2010 | 11 |
|
|
|
|
Financial Highlights (continued) | BlackRock Index Equity Portfolio |
|
|
|
|
|
|
|
|
|
|
|
|
|
|
|
|
|
|
|
|
|
| Investor A |
| ||||||||||||||||
|
| ||||||||||||||||||
|
|
|
|
|
|
|
|
|
|
| Period |
|
|
|
|
|
| ||
|
| Year Ended |
| Year Ended |
| ||||||||||||||
|
|
| |||||||||||||||||
|
| 2010 |
| 2009 |
| 2008 |
| 2007 |
| 2006 |
| ||||||||
Per Share Operating Performance |
|
|
|
|
|
|
|
|
|
|
|
|
|
|
|
|
|
|
|
Net asset value, beginning of period |
| $ | 21.27 |
| $ | 17.19 |
| $ | 28.01 |
| $ | 29.34 |
| $ | 25.52 |
| $ | 23.46 |
|
|
| ||||||||||||||||||
Net investment income1 |
|
| 0.36 |
|
| 0.35 |
|
| 0.46 |
|
| 0.12 |
|
| 0.47 |
|
| 0.38 |
|
Net realized and unrealized gain (loss) |
|
| 2.73 |
|
| 4.08 |
|
| (10.80 | ) |
| (1.10 | ) |
| 3.60 | 2 |
| 2.07 | 2 |
|
| ||||||||||||||||||
Net increase (decrease) from investment operations |
|
| 3.09 |
|
| 4.43 |
|
| (10.34 | ) |
| (0.98 | ) |
| 4.07 |
|
| 2.45 |
|
|
| ||||||||||||||||||
Dividends from net investment income |
|
| (0.38 | ) |
| (0.35 | ) |
| (0.48 | ) |
| (0.35 | ) |
| (0.25 | ) |
| (0.39 | ) |
|
| ||||||||||||||||||
Net asset value, end of period |
| $ | 23.98 |
| $ | 21.27 |
| $ | 17.19 |
| $ | 28.01 |
| $ | 29.34 |
| $ | 25.52 |
|
|
| ||||||||||||||||||
|
|
|
|
|
|
|
|
|
|
|
|
|
|
|
|
|
|
|
|
Total Investment Return3 |
|
|
|
|
|
|
|
|
|
|
|
|
|
|
|
|
|
|
|
Based on net asset value |
|
| 14.64 | % |
| 26.08 | % |
| (37.21 | )% |
| (3.34 | )%4 |
| 16.01 | % |
| 10.52 | % |
|
| ||||||||||||||||||
|
|
|
|
|
|
|
|
|
|
|
|
|
|
|
|
|
|
|
|
Ratios to Average Net Assets5 |
|
|
|
|
|
|
|
|
|
|
|
|
|
|
|
|
|
|
|
Total expenses |
|
| 0.42 | % |
| 0.46 | % |
| 0.39 | % |
| 0.37 | %6 |
| 0.37 | % |
| 0.54 | % |
|
| ||||||||||||||||||
Total expenses excluding recoupment and before fees waived and reimbursed |
|
| 0.42 | % |
| 0.45 | % |
| 0.39 | % |
| 0.37 | %6 |
| 0.37 | % |
| 0.54 | % |
|
| ||||||||||||||||||
Total expenses after fees waived and reimbursed |
|
| 0.42 | % |
| 0.45 | % |
| 0.39 | % |
| 0.36 | %6 |
| 0.37 | % |
| 0.42 | % |
|
| ||||||||||||||||||
Net investment income |
|
| 1.65 | % |
| 1.92 | % |
| 1.95 | % |
| 1.68 | %6 |
| 1.69 | % |
| 1.57 | % |
|
| ||||||||||||||||||
|
|
|
|
|
|
|
|
|
|
|
|
|
|
|
|
|
|
|
|
Supplemental Data |
|
|
|
|
|
|
|
|
|
|
|
|
|
|
|
|
|
|
|
Net assets, end of period (000) |
| $ | 174,714 |
| $ | 166,313 |
| $ | 145,886 |
| $ | 272,771 |
| $ | 284,761 |
| $ | 287,288 |
|
|
| ||||||||||||||||||
Portfolio turnover of the Series |
|
| 5 | % |
| 7 | % |
| 8 | % |
| 4 | % |
| 1 | %7 |
| 4 | %8 |
|
| ||||||||||||||||||
|
|
|
| 1 | Based on average shares outstanding. |
|
|
|
| 2 | Includes a redemption fee, which is less than $0.01 per share. |
|
|
|
| 3 | Where applicable, total investment returns exclude the effects of any sales charges and include the reinvestment of dividends and distributions. |
|
|
|
| 4 | Aggregate total investment return. |
|
|
|
| 5 | Includes the Portfolio’s share of the Series’ (for the period June 4, 2007 to December 31, 2007 and the years ended December 31, 2008, 2009 and 2010) and The U.S. Large Company Series (for the year ended 2006 and the period October 1, 2006 to June 3, 2007) allocated expenses and/or net investment income. |
|
|
|
| 6 | Annualized. |
|
|
|
| 7 | Represents the portfolio turnover of the Series for the period June 4, 2007 to September 30, 2007. |
|
|
|
| 8 | Represents the portfolio turnover of The U.S. Large Company Series for the period October 1, 2005 to September 30, 2006. |
|
|
|
See Notes to Financial Statements. | ||
12 | BLACKROCK INDEX EQUITY PORTFOLIO | DECEMBER 31, 2010 |
|
|
|
|
Financial Highlights (continued) | BlackRock Index Equity Portfolio |
|
|
|
|
|
|
|
|
|
|
|
|
|
|
|
|
|
|
|
|
|
| Investor B |
| ||||||||||||||||
|
| ||||||||||||||||||
|
|
|
|
|
|
|
| Period |
|
|
| ||||||||
|
| Year Ended |
|
| Year Ended |
| |||||||||||||
|
|
|
|
| |||||||||||||||
|
|
|
| ||||||||||||||||
|
| 2010 |
| 2009 |
| 2008 |
|
| 2007 |
| 2006 |
| |||||||
Per Share Operating Performance |
|
|
|
|
|
|
|
|
|
|
|
|
|
|
|
|
|
|
|
Net asset value, beginning of period |
| $ | 21.01 |
| $ | 16.97 |
| $ | 27.60 |
| $ | 28.75 |
| $ | 25.09 |
| $ | 23.06 |
|
|
| ||||||||||||||||||
Net investment income1 |
|
| 0.17 |
|
| 0.21 |
|
| 0.26 |
|
| 0.06 |
|
| 0.24 |
|
| 0.18 |
|
Net realized and unrealized gain (loss) |
|
| 2.70 |
|
| 4.01 |
|
| (10.62 | ) |
| (1.08 | ) |
| 3.55 | 2 |
| 2.03 | 2 |
|
| ||||||||||||||||||
Net increase (decrease) from investment operations |
|
| 2.87 |
|
| 4.22 |
|
| (10.36 | ) |
| (1.02 | ) |
| 3.79 |
|
| 2.21 |
|
|
| ||||||||||||||||||
Dividends from net investment income |
|
| (0.17 | ) |
| (0.18 | ) |
| (0.27 | ) |
| (0.13 | ) |
| (0.13 | ) |
| (0.18 | ) |
|
| ||||||||||||||||||
Net asset value, end of period |
| $ | 23.71 |
| $ | 21.01 |
| $ | 16.97 |
| $ | 27.60 |
| $ | 28.75 |
| $ | 25.09 |
|
|
| ||||||||||||||||||
|
|
|
|
|
|
|
|
|
|
|
|
|
|
|
|
|
|
|
|
Total Investment Return3 |
|
|
|
|
|
|
|
|
|
|
|
|
|
|
|
|
|
|
|
Based on net asset value |
|
| 13.70 | % |
| 25.09 | % |
| (37.71 | )% |
| (3.55 | )%4 |
| 15.13 | % |
| 9.62 | % |
|
| ||||||||||||||||||
|
|
|
|
|
|
|
|
|
|
|
|
|
|
|
|
|
|
|
|
Ratios to Average Net Assets5 |
|
|
|
|
|
|
|
|
|
|
|
|
|
|
|
|
|
|
|
Total expenses |
|
| 1.35 | % |
| 1.43 | % |
| 1.28 | % |
| 1.24 | %6 |
| 1.21 | % |
| 1.34 | % |
|
| ||||||||||||||||||
Total expenses excluding recoupment and before fees waived and reimbursed |
|
| 1.24 | % |
| 1.24 | % |
| 1.22 | % |
| 1.17 | %6 |
| 1.19 | % |
| 1.23 | % |
|
| ||||||||||||||||||
Total expenses after fees waived and reimbursed |
|
| 1.24 | % |
| 1.24 | % |
| 1.22 | % |
| 1.17 | %6 |
| 1.19 | % |
| 1.23 | % |
|
| ||||||||||||||||||
Net investment income |
|
| 0.81 | % |
| 1.19 | % |
| 1.09 | % |
| 0.86 | %6 |
| 0.88 | % |
| 0.76 | % |
|
| ||||||||||||||||||
|
|
|
|
|
|
|
|
|
|
|
|
|
|
|
|
|
|
|
|
Supplemental Data |
|
|
|
|
|
|
|
|
|
|
|
|
|
|
|
|
|
|
|
Net assets, end of period (000) |
| $ | 4,594 |
| $ | 10,155 |
| $ | 17,226 |
| $ | 48,002 |
| $ | 56,503 |
| $ | 91,683 |
|
|
| ||||||||||||||||||
Portfolio turnover of the Series |
|
| 5 | % |
| 7 | % |
| 8 | % |
| 4 | % |
| 1 | %7 |
| 4 | %8 |
|
| ||||||||||||||||||
|
|
|
| 1 | Based on average shares outstanding. |
|
|
|
| 2 | Includes a redemption fee, which is less than $0.01 per share. |
|
|
|
| 3 | Where applicable, total investment returns exclude the effects of any sales charges and include the reinvestment of dividends and distributions. |
|
|
|
| 4 | Aggregate total investment return. |
|
|
|
| 5 | Includes the Portfolio’s share of the Series’ (for the period June 4, 2007 to December 31, 2007 and the years ended December 31, 2008, 2009 and 2010) and The U.S. Large Company Series (for the year ended 2006 and the period October 1, 2006 to June 3, 2007) allocated expenses and/or net investment income. |
|
|
|
| 6 | Annualized. |
|
|
|
| 7 | Represents the portfolio turnover of the Series for the period June 4, 2007 to September 30, 2007. |
|
|
|
| 8 | Represents the portfolio turnover of The U.S. Large Company Series for the period October 1, 2005 to September 30, 2006. |
|
|
|
See Notes to Financial Statements. | ||
BLACKROCK INDEX EQUITY PORTFOLIO | DECEMBER 31, 2010 | 13 |
|
|
|
|
Financial Highlights (concluded) | BlackRock Index Equity Portfolio |
|
|
|
|
|
|
|
|
|
|
|
|
|
|
|
|
|
|
|
| |
|
| Investor C |
| |||||||||||||||||
|
| |||||||||||||||||||
|
|
|
|
|
|
|
| Period |
|
|
|
|
| |||||||
|
| Year Ended |
|
| Year Ended |
| ||||||||||||||
|
|
|
| |||||||||||||||||
|
| 2010 |
| 2009 |
| 2008 |
|
| 2007 |
| 2006 |
| ||||||||
Per Share Operating Performance |
|
|
|
|
|
|
|
|
|
|
|
|
|
|
|
|
|
|
| |
Net asset value, beginning of period |
| $ | 20.90 |
| $ | 16.91 |
| $ | 27.52 |
| $ | 28.71 |
| $ | 25.07 |
| $ | 23.05 |
| |
|
| |||||||||||||||||||
Net investment income1 |
|
| 0.18 |
|
| 0.20 |
|
| 0.27 |
|
| 0.06 |
|
| 0.24 |
|
| 0.18 |
| |
Net realized and unrealized gain (loss) |
|
| 2.68 |
|
| 4.00 |
|
| (10.59 | ) |
| (1.08 | ) |
| 3.55 | 2 |
| 2.03 | 2 | |
|
| |||||||||||||||||||
Net increase (decrease) from investment operations |
|
| 2.86 |
|
| 4.20 |
|
| (10.32 | ) |
| (1.02 | ) |
| 3.79 |
|
| 2.21 |
| |
|
| |||||||||||||||||||
Dividends from net investment income |
|
| (0.20 | ) |
| (0.21 | ) |
| (0.29 | ) |
| (0.17 | ) |
| (0.15 | ) |
| (0.19 | ) | |
|
| |||||||||||||||||||
Net asset value, end of period |
| $ | 23.56 |
| $ | 20.90 |
| $ | 16.91 |
| $ | 27.52 |
| $ | 28.71 |
| $ | 25.07 |
| |
|
| |||||||||||||||||||
|
|
|
|
|
|
|
|
|
|
|
|
|
|
|
|
|
|
|
| |
Total Investment Return3 |
|
|
|
|
|
|
|
|
|
|
|
|
|
|
|
|
|
|
| |
Based on net asset value |
|
| 13.75 | % |
| 25.03 | % |
| (37.69 | )% |
| (3.56 | )%4 |
| 15.13 | % |
| 9.61 | % | |
|
| |||||||||||||||||||
|
|
|
|
|
|
|
|
|
|
|
|
|
|
|
|
|
|
|
| |
Ratios to Average Net Assets5 |
|
|
|
|
|
|
|
|
|
|
|
|
|
|
|
|
|
|
| |
Total expenses |
|
| 1.25 | % |
| 1.30 | % |
| 1.20 | % |
| 1.17 | %6 |
| 1.17 | % |
| 1.27 | % | |
|
| |||||||||||||||||||
Total expenses excluding recoupment and before fees waived and reimbursed |
|
| 1.24 | % |
| 1.24 | % |
| 1.19 | % |
| 1.17 | %6 |
| 1.17 | % |
| 1.23 | % | |
|
| |||||||||||||||||||
Total expenses after fees waived and reimbursed |
|
| 1.24 | % |
| 1.24 | % |
| 1.19 | % |
| 1.17 | %6 |
| 1.17 | % |
| 1.23 | % | |
|
| |||||||||||||||||||
Net investment income |
|
| 0.83 | % |
| 1.13 | % |
| 1.14 | % |
| 0.87 | %6 |
| 0.89 | % |
| 0.76 | % | |
|
| |||||||||||||||||||
|
|
|
|
|
|
|
|
|
|
|
|
|
|
|
|
|
|
|
| |
Supplemental Data |
|
|
|
|
|
|
|
|
|
|
|
|
|
|
|
|
|
|
| |
Net assets, end of period (000) |
| $ | 75,716 |
| $ | 79,209 |
| $ | 75,588 |
| $ | 154,330 |
| $ | 165,075 |
| $ | 179,134 |
| |
|
| |||||||||||||||||||
Portfolio turnover of the Series |
|
| 5 | % |
| 7 | % |
| 8 | % |
| 4 | % |
| 1 | %7 |
| 4 | %8 | |
|
| |||||||||||||||||||
|
|
|
| 1 | Based on average shares outstanding. |
|
|
|
| 2 | Includes a redemption fee, which is less than $0.01 per share. |
|
|
|
| 3 | Where applicable, total investment returns exclude the effects of any sales charges and include the reinvestment of dividends and distributions. |
|
|
|
| 4 | Aggregate total investment return. |
|
|
|
| 5 | Includes the Portfolio’s share of the Series’ (for the period June 4, 2007 to December 31, 2007 and the years ended December 31, 2008, 2009 and 2010) and The U.S. Large Company Series (for the year ended 2006 and the period October 1, 2006 to June 3, 2007) allocated expenses and/or net investment income. |
|
|
|
| 6 | Annualized. |
|
|
|
| 7 | Represents the portfolio turnover of the Series for the period June 4, 2007 to September 30, 2007. |
|
|
|
| 8 | Represents the portfolio turnover of The U.S. Large Company Series for the period October 1, 2005 to September 30, 2006. |
|
|
|
See Notes to Financial Statements. | ||
14 | BLACKROCK INDEX EQUITY PORTFOLIO | DECEMBER 31, 2010 |
1. Organization and Significant Accounting Policies:
BlackRock Index Equity Portfolio (the “Portfolio”) is a series of BlackRock FundsSM (the “Fund”), registered under the Investment Company Act of 1940, as amended (the “1940 Act”), as an open-end management investment company. The Fund is organized as a Massachusetts business trust. The Fund seeks to achieve its investment objective by investing all of its assets in Master S&P 500 Index Series (the “Series”), a series of Quantitative Master Series LLC, (the “Master LLC”), which has the same investment objective and strategies as the Portfolio. The value of the Portfolio’s investment in the Series reflects the Portfolio’s proportionate interest in the net assets of the Series. The percentage of the Series owned by the Portfolio at December 31, 2010 was 25.4%. The performance of the Portfolio is directly affected by the performance of the Series. The financial statements of the Series, including the Schedule of Investments, are included elsewhere in this report and should be read in conjunction with the Portfolio’s financial statements. The Portfolio’s financial statements are prepared in conformity with accounting principles generally accepted in the United States of America (“US GAAP”), which may require management to make estimates and assumptions that affect the reported amounts and disclosures in the financial statements. Actual results could differ from those estimates. The Board of Trustees and the Board of Directors of the Fund and the Master LLC, respectively, are referred to throughout this report as the “Board of Directors” or the “Board.” The Portfolio offers multiple classes of shares. Institutional Shares are sold without a sales charge and only to certain eligible investors. Service Shares are sold without a sales charge. Investor A Shares are generally sold with a front-end sales charge. Investor B and Investor C Shares may be subject to a contingent deferred sales charge. All classes of shares have identical voting, dividend, liquidation and other rights and the same terms and conditions, except that Service, Investor A, Investor B and Investor C Shares bear certain expenses related to the shareholder servicing of such shares, and Investor B and Investor C Shares also bear certain expenses related to the distribution of such shares. Investor B Shares automatically convert to Investor A Shares after approximately eight years. Investor B and Investor C Shares are closed to all investors. Each class has exclusive voting rights with respect to matters relating to its shareholder servicing and distribution expenditures (except that Investor B shareholders may vote on material changes to the Investor A distribution and service plan).
The following is a summary of significant accounting policies followed by the Portfolio:
Valuation: The Portfolio’s policy is to fair value its financial instruments at market value. For financial reporting purposes, contributions to and withdrawals from the Series are accounted for on a trade basis. The Portfolio records its investment in the Series at fair value based on the Portfolio’s proportionate interest in the net assets of the Series. Valuation of securities held by the Series, including categorization of fair value measurements, is discussed in Note 1 of the Series’ Notes to Financial Statements, which are included elsewhere in this report.
Investment Transactions and Investment Income: For financial reporting purposes, investment transactions in the Series are accounted for on a trade date basis. The Portfolio records daily its proportionate share of the Series’ income, expenses and realized and unrealized gains and losses. In addition, the Portfolio accrues its own expenses. Income and realized and unrealized gains and losses on investments are allocated daily to each class based on its relative net assets.
Dividends and Distributions: Dividends and distributions paid by the Portfolio are recorded on the ex-dividend dates. The amount and timing of dividends and distributions are determined in accordance with federal income tax regulations, which may differ from US GAAP.
Income Taxes: It is the Portfolio’s policy to comply with the requirements of the Internal Revenue Code of 1986, as amended, applicable to regulated investment companies and to distribute substantially all of its taxable income to its shareholders. Therefore, no federal income tax provision is required.
The Portfolio files US federal and various state and local tax returns. No income tax returns are currently under examination. The statute of limitations on the Portfolio’s US federal tax returns remains open for the year ended November 30, 2007, the period ended December 31, 2007 and the three years ended December 31, 2010. The statutes of limitations on the Portfolio’s state and local tax returns may remain open for an additional year depending upon the jurisdiction. Management does not believe there are any uncertain tax positions that require recognition of a tax liability.
Other: Expenses directly related to the Portfolio or its classes are charged to that Portfolio or class. Other operating expenses shared by several funds are pro rated among those funds on the basis of relative net assets or other appropriate methods. Other expenses of the Portfolio are allocated daily to each class based on its relative net assets.
2. Administration Agreement and Other Transactions with Affiliates:
The PNC Financial Services Group, Inc. (“PNC”), Bank of America Corporation (“BAC”) and Barclays Bank PLC (“Barclays”) are the largest stockholders of BlackRock, Inc. (“BlackRock”). Due to the ownership structure, PNC is an affiliate of the Portfolio for 1940 Act purposes, but BAC and Barclays are not.
|
|
|
|
| BLACKROCK INDEX EQUITY PORTFOLIO | DECEMBER 31, 2010 | 15 |
|
|
| |
Notes to Financial Statements (continued) | BlackRock Index Equity Portfolio |
The Fund, on behalf of the Portfolio, entered into an Administration Agreement with BlackRock Advisors, LLC (the “Manager”), an indirect, wholly owned subsidiary of BlackRock, and State Street Bank and Trust Company (collectively, the “Administrator”) to provide administrative services (other than investment advice and related portfolio activities). The Portfolio does not pay an investment advisory fee or investment management fee.
The Portfolio pays the Administrator a monthly fee based upon the average daily value of the Portfolio’s net assets at the following annual rates: 0.075% of the Portfolio’s average daily net assets not exceeding $500 million; 0.065% of average daily net assets in excess of $500 million but not exceeding $1 billion; and 0.055% of average daily net assets in excess of $1 billion. In addition, each of the share classes is charged an administration fee based upon the average daily net assets of each respective class at the following rates: 0.025% of the first $500 million, 0.015% of the next $500 million and 0.005% of average daily net assets in excess of $1 billion. This amount is shown as administration — class specific in the Statement of Operations. The amounts were as follows:
|
|
|
|
|
Institutional |
| $ | 78,955 |
|
Service |
| $ | 6,111 |
|
Investor A |
| $ | 41,633 |
|
Investor B |
| $ | 1,680 |
|
Investor C |
| $ | 18,683 |
|
The Manager contractually agreed to waive and/or reimburse fees or expenses, excluding interest expense, dividend expense, acquired fund fees and expenses and certain other fund expenses, in order to limit the Portfolio’s expenses as a percentage of average daily net assets as follows: 0.18% for Institutional; 0.615% for Service; 0.785% for Investor A, and 1.24% for Investor B and Investor C. The Manager has agreed not to reduce or discontinue this contractual waiver or reimbursement prior to May 1, 2012 unless approved by the Board, including a majority of the non-interested Trustees. These amounts are shown as fees waived by administrator — class specific and transfer agent fees waived and/or reimbursed, respectively, in the Statement of Operations. These amounts were as follows:
|
|
|
|
|
|
|
|
|
| Fees Waived |
| Transfer Agent |
| ||
Institutional |
| $ | 78,955 |
| $ | 52,330 |
|
Investor B |
| $ | 1,680 |
| $ | 5,953 |
|
Investor C |
| $ | 5,270 |
|
| — |
|
If during the Portfolio’s fiscal year the operating expenses of a share class, that at anytime during the prior two fiscal years received a waiver or reimbursement from the Manager, are less than the expense limit for that share class, the Manager is entitled to be reimbursed by such share class up to the amount of fees waived or expenses reimbursed during the prior two fiscal years under the agreement provided that: (1) the Portfolio of which the share class is a part of has more than $50 million in assets for the fiscal year and (2) the Manager or an affiliate continues to serve as the Portfolio’s investment advisor or administrator. In the event the expense limit for a share class is changed subsequent to a fiscal year in which the Manager becomes entitled to reimbursement for fees waived or reimbursed, the amount available to reimburse the Manager shall be calculated by reference to the expense limit for that share class in effect at the time the Manager became entitled to receive such reimbursement, rather than the subsequently changed expense limit for that share class.
For the year ended December 31, 2010, the Manager recouped waivers previously recorded, which are shown as recoupment of past waived fees — class specific in the Statement of Operations. These amounts were as follows:
|
|
|
|
|
Institutional |
| $ | 1,448 |
|
Investor B |
| $ | 1,390 |
|
Investor C |
| $ | 11,614 |
|
At December 31, 2010, the amounts subject to possible future recoupments under the expense limitation agreement are as follows:
|
|
|
|
|
Expires December 31, |
|
|
|
|
2011 |
| $ | 245,247 |
|
2012 |
| $ | 144,401 |
|
|
| |||
Total Waivers Subject to Recoupment |
| $ | 389,648 |
|
|
|
The Fund, on behalf of the Portfolio, entered into a Distribution Agreement and Distribution and Service Plan with BlackRock Investments, LLC (“BRIL”), an affiliate of BlackRock. Pursuant to the Distribution and Service Plan and in accordance with Rule 12b-1 under the 1940 Act, the Portfolio pays BRIL ongoing service and distribution fees. The fees are accrued daily and paid monthly at annual rates based upon the average daily net assets of the shares of the Portfolio as follows:
|
|
|
|
|
|
|
|
|
| Service |
| Distribution |
| ||
Service |
|
| 0.15 | % |
| — |
|
Investor A |
|
| 0.15 | % |
| — |
|
Investor B |
|
| 0.15 | % |
| 0.75 | % |
Investor C |
|
| 0.15 | % |
| 0.75 | % |
|
|
|
16 | BLACKROCK INDEX EQUITY PORTFOLIO | DECEMBER 31, 2010 |
|
|
| |
Notes to Financial Statements (continued) | BlackRock Index Equity Portfolio |
Pursuant to sub-agreements with BRIL, broker-dealers and BRIL provide shareholder servicing and distribution services to the Portfolio. The ongoing service and/or distribution fee compensates BRIL and each broker-dealer for providing shareholder servicing and/or distribution related services to Service, Investor A, Investor B and Investor C shareholders.
For the year ended December 31, 2010, affiliates earned underwriting discounts, direct commissions and dealer concessions on sales of the Portfolio’s Investor A Shares, which totaled $2,459.
For the year ended December 31, 2010, affiliates received the following contingent deferred sales charges relating to transactions in Investor B and Investor C Shares:
|
|
|
|
|
Investor B |
| $ | 2,006 |
|
Investor C |
| $ | 1,245 |
|
BNY Mellon Investment Servicing (US) Inc. (formerly PNC Global Investment Servicing (U.S.) Inc. (“PNCGIS”)), serves as transfer agent and dividend disbursing agent. On July 1, 2010, the Bank of New York Mellon Corporation purchased PNCGIS, which prior to this date was an indirect, wholly owned subsidiary of PNC and an affiliate of the Manager. Transfer agency fees borne by the Portfolio are comprised of those fees charged for all shareholder communications including mailing of shareholder reports, dividend and distribution notices, and proxy materials for shareholder meetings, as well as per account and per transaction fees related to servicing and maintenance of shareholder accounts, including the issuing, redeeming and transferring of shares, check writing, anti-money laundering services, and customer identification services. Pursuant to written agreements, certain financial intermediaries, some of which may be affiliates, provide the Portfolio with sub-accounting, recordkeeping, sub-transfer agency and other administrative services with respect to sub-accounts they service. For these services, these entities receive an annual fee per shareholder account which will vary depending on share class. Prior to July 1, 2010, PNCGIS was an affiliate and earned $104,143 in transfer agency fees for the period January 1, 2010 to June 30, 2010, which are included as a component of transfer agent — class specific in the Statement of Operations.
The Manager maintains a call center, which is responsible for providing certain shareholder services to the Portfolio, such as responding to shareholder inquiries and processing transactions based upon instructions from shareholders with respect to the subscription and redemption of Portfolio shares. For the year ended December 31, 2010, the Portfolio reimbursed the Manager the following amounts for costs incurred in running the call center, which are included in transfer agent — class specific in the Statement of Operations:
|
|
|
|
|
Institutional |
| $ | 1,198 |
|
Service |
| $ | 219 |
|
Investor A |
| $ | 4,378 |
|
Investor B |
| $ | 558 |
|
Investor C |
| $ | 2,871 |
|
Certain officers and/or directors of the Fund are officers and/or directors of BlackRock or its affiliates. The Portfolio reimburses the Manager for compensation paid to the Fund’s Chief Compliance Officer.
3. Income Tax Information:
Reclassifications: US GAAP require that certain components of net assets be adjusted to reflect permanent differences between financial and tax reporting. These reclassifications have no effect on net assets or net asset values per share. The following permanent difference as of December 31, 2010 attributable to the expiration of capital loss carryforward was reclassified to the following accounts:
|
|
|
|
|
Accumulated net realized gains |
| $ | 104,002,454 |
|
Paid-in capital |
| $ | (104,002,454 | ) |
The tax character of distributions paid during the fiscal years ended December 31, 2010 and December 31, 2009 was as follows:
|
|
|
|
|
|
|
|
|
| 12/31/10 |
| 12/31/09 |
| ||
Ordinary income |
| $ | 10,111,238 |
| $ | 10,523,551 |
|
|
| ||||||
Total distributions |
| $ | 10,111,238 |
| $ | 10,523,551 |
|
|
| ||||||
As of December 31, 2010, the tax components of accumulated gains were as follows:
|
|
|
|
|
Undistributed ordinary income |
| $ | 383,486 |
|
Capital loss carryforwards |
|
| (90,140,894 | ) |
Net unrealized gains* |
|
| 481,933,081 |
|
|
| |||
Total |
| $ | 392,175,673 |
|
|
|
|
|
|
| * | The differences between book-basis and tax-basis net unrealized gains were attributable primarily to the timing and recognition of partnership income. |
As of December 31, 2010, the Fund had capital loss carryforwards available to offset future realized capital gains through the indicated expiration dates:
|
|
|
|
|
Expires December 31, |
|
|
|
|
2012 |
| $ | 429,781 |
|
2016 |
|
| 77,557,447 |
|
2017 |
|
| 12,153,666 |
|
|
| |||
Total |
| $ | 90,140,894 |
|
|
|
|
|
|
|
| BLACKROCK INDEX EQUITY PORTFOLIO | DECEMBER 31, 2010 | 17 |
|
|
|
|
Notes to Financial Statements (concluded) | BlackRock Index Equity Portfolio |
Under the recently enacted Regulated Investment Company Modernization Act of 2010, capital losses incurred by the Fund after December 31, 2010 will not be subject to expiration. In addition, such losses must be utilized prior to the losses incurred in the years preceding enactment.
4. Capital Share Transactions:
Transactions in capital shares for each class were as follows:
|
|
|
|
|
|
|
|
|
|
|
|
|
|
|
| Year Ended |
| Year Ended |
| ||||||||
|
|
| |||||||||||
|
| Shares |
| Amount |
| Shares |
| Amount |
| ||||
Institutional |
|
|
|
|
|
|
|
|
|
|
|
|
|
Shares sold |
|
| 709,044 |
| $ | 15,579,432 |
|
| 1,818,901 |
| $ | 32,225,687 |
|
Shares issued to shareholders in reinvestment of dividends |
|
| 118,817 |
|
| 2,694,050 |
|
| 74,359 |
|
| 1,399,703 |
|
|
|
|
| ||||||||||
Total issued |
|
| 827,861 |
|
| 18,273,482 |
|
| 1,893,260 |
|
| 33,625,390 |
|
Shares redeemed |
|
| (3,497,605 | ) |
| (78,222,674 | ) |
| (2,429,926 | ) |
| (43,873,050 | ) |
|
|
|
| ||||||||||
Net decrease |
|
| (2,669,744 | ) | $ | (59,949,192 | ) |
| (536,666 | ) | $ | (10,247,660 | ) |
|
|
|
| ||||||||||
Service |
|
|
|
|
|
|
|
|
|
|
|
|
|
Shares sold |
|
| 447,005 |
| $ | 9,934,692 |
|
| 390,137 |
| $ | 6,825,793 |
|
Shares issued to shareholders in reinvestment of dividends |
|
| 18,716 |
|
| 421,726 |
|
| 19,519 |
|
| 364,497 |
|
|
|
|
| ||||||||||
Total issued |
|
| 465,721 |
|
| 10,356,418 |
|
| 409,656 |
|
| 7,190,290 |
|
Shares redeemed |
|
| (438,862 | ) |
| (9,587,005 | ) |
| (304,610 | ) |
| (5,257,679 | ) |
|
|
|
| ||||||||||
Net increase |
|
| 26,859 |
| $ | 769,413 |
|
| 105,046 |
| $ | 1,932,611 |
|
|
|
|
| ||||||||||
Investor A |
|
|
|
|
|
|
|
|
|
|
|
|
|
Shares sold and automatic conversion of shares |
|
| 974,485 |
| $ | 21,201,297 |
|
| 1,601,689 |
| $ | 28,935,293 |
|
Shares issued to shareholders in reinvestment of dividends |
|
| 123,494 |
|
| 2,780,622 |
|
| 144,579 |
|
| 2,681,840 |
|
|
|
|
| ||||||||||
Total issued |
|
| 1,097,979 |
|
| 23,981,919 |
|
| 1,746,268 |
|
| 31,617,133 |
|
Shares redeemed |
|
| (1,631,229 | ) |
| (35,804,180 | ) |
| (2,412,584 | ) |
| (42,361,397 | ) |
|
|
|
| ||||||||||
Net decrease |
|
| (533,250 | ) | $ | (11,822,261 | ) |
| (666,316 | ) | $ | (10,744,264 | ) |
|
|
|
| ||||||||||
Investor B |
|
|
|
|
|
|
|
|
|
|
|
|
|
Shares issued to shareholders in reinvestment of dividends |
|
| 1,831 |
| $ | 40,684 |
|
| 4,358 |
| $ | 76,579 |
|
|
|
|
| ||||||||||
Total issued |
|
| 1,831 |
|
| 40,684 |
|
| 4,358 |
|
| 76,579 |
|
Shares redeemed and automatic conversion of shares |
|
| (291,473 | ) |
| (6,258,575 | ) |
| (536,251 | ) |
| (9,307,567 | ) |
|
|
|
| ||||||||||
Net decrease |
|
| (289,642 | ) | $ | (6,217,891 | ) |
| (531,893 | ) | $ | (9,230,988 | ) |
|
|
|
| ||||||||||
Investor C |
|
|
|
|
|
|
|
|
|
|
|
|
|
Shares sold |
|
| — |
|
| — |
|
| 18,953 |
| $ | 338,118 |
|
Shares issued to shareholders in reinvestment of dividends |
|
| 28,998 |
| $ | 640,616 |
|
| 22,459 |
|
| 399,946 |
|
|
|
|
| ||||||||||
Total issued |
|
| 28,998 |
|
| 640,616 |
|
| 41,412 |
|
| 738,064 |
|
Shares redeemed |
|
| (603,974 | ) |
| (12,955,974 | ) |
| (722,781 | ) |
| (12,739,307 | ) |
|
|
|
| ||||||||||
Net decrease |
|
| (574,976 | ) | $ | (12,315,358 | ) |
| (681,369 | ) | $ | (12,001,243 | ) |
|
|
|
| ||||||||||
5. Subsequent Events:
Management has evaluated the impact of all subsequent events on the Portfolio through the date the financial statements were issued and has determined that there were no subsequent events requiring adjustment or additional disclosure in the financial statements.
|
|
|
18 | BLACKROCK INDEX EQUITY PORTFOLIO | DECEMBER 31, 2010 |
To the Shareholders and Board of Trustees of BlackRock FundsSM:
We have audited the accompanying statement of assets and liabilities of BlackRock Index Equity Portfolio, one of the portfolios constituting BlackRock FundsSM, (the “Fund”) as of December 31, 2010, and the related statement of operations for the year then ended, the statements of changes in net assets for each of the two years in the period then ended, and the financial highlights for each of the periods presented. These financial statements and financial highlights are the responsibility of the Fund’s management. Our responsibility is to express an opinion on these financial statements and financial highlights based on our audits.
We conducted our audits in accordance with the standards of the Public Company Accounting Oversight Board (United States). Those standards require that we plan and perform the audit to obtain reasonable assurance about whether the financial statements and financial highlights are free of material misstatement. The Fund is not required to have, nor were we engaged to perform, an audit of its internal control over financial reporting. Our audits included consideration of internal control over financial reporting as a basis for designing audit procedures that are appropriate in the circumstances, but not for the purpose of expressing an opinion on the effectiveness of the Fund’s internal control over financial reporting. Accordingly, we express no such opinion. An audit also includes examining, on a test basis, evidence supporting the amounts and disclosures in the financial statements, assessing the accounting principles used and significant estimates made by management, as well as evaluating the overall financial statement presentation. We believe that our audits provide a reasonable basis for our opinion.
In our opinion, the financial statements and financial highlights referred to above present fairly, in all material respects, the financial position of BlackRock Index Equity Portfolio of BlackRock FundsSM as of December 31, 2010, the results of its operations for the year then ended, the changes in its net assets for each of the two years in the period then ended, and the financial highlights for each of the periods presented, in conformity with accounting principles generally accepted in the United States of America.
Deloitte & Touche LLP
Princeton, New Jersey
February 28, 2011
All of the ordinary income distributions paid by the BlackRock Index Equity Portfolio of BlackRock FundsSM during the fiscal year ended December 31, 2010 qualify for the dividends received deduction for corporations and consist entirely of qualified dividend income for individuals.
|
|
|
BLACKROCK INDEX EQUITY PORTFOLIO | DECEMBER 31, 2010 | 19 |
|
As of December 31, 2010 |
|
|
|
|
|
|
|
Ten Largest Holdings |
| Percent of |
| |||
Exxon Mobil Corp. |
|
|
| 3 | % |
|
Apple, Inc. |
|
|
| 3 |
|
|
Microsoft Corp. |
|
|
| 2 |
|
|
General Electric Co. |
|
|
| 2 |
|
|
Chevron Corp. |
|
|
| 2 |
|
|
International Business Machines Corp. |
|
|
| 2 |
|
|
The Procter & Gamble Co. |
|
|
| 2 |
|
|
AT&T Inc. |
|
|
| 2 |
|
|
Johnson & Johnson |
|
|
| 1 |
|
|
JPMorgan Chase & Co. |
|
|
| 1 |
|
|
|
|
|
|
|
|
|
Sector Allocations |
| Percent of |
| |||
Information Technology |
|
|
| 19 | % |
|
Financials |
|
|
| 16 |
|
|
Energy |
|
|
| 12 |
|
|
Industrials |
|
|
| 11 |
|
|
Health Care |
|
|
| 11 |
|
|
Consumer Discretionary |
|
|
| 11 |
|
|
Consumer Staples |
|
|
| 10 |
|
|
Materials |
|
|
| 4 |
|
|
Utilities |
|
|
| 3 |
|
|
Telecommunication Services |
|
|
| 3 |
|
|
|
|
| For Series compliance purposes, the Series’ sector classifications refer to any one or more of the industry sub-classifications used by one or more widely recognized market indexes or ratings group indexes, and/or as defined by Series management. This definition may not apply for purposes of this report, which may combine sector sub-classifications for reporting ease. |
|
|
|
20 | BLACKROCK INDEX EQUITY PORTFOLIO | DECEMBER 31, 2010 |
|
|
|
|
Master S&P 500 Index Series | |
| (Percentages shown are based on Net Assets) |
|
|
|
|
|
|
|
|
Common Stocks |
| Shares |
| Value |
| ||
Aerospace & Defense — 2.6% |
|
|
|
|
|
|
|
Boeing Co. |
|
| 151,675 |
| $ | 9,898,310 |
|
General Dynamics Corp. |
|
| 78,109 |
|
| 5,542,615 |
|
Goodrich Corp. |
|
| 25,954 |
|
| 2,285,769 |
|
Honeywell International, Inc. |
|
| 161,317 |
|
| 8,575,612 |
|
ITT Corp. |
|
| 38,016 |
|
| 1,981,014 |
|
L-3 Communications Holdings, Inc. |
|
| 23,171 |
|
| 1,633,324 |
|
Lockheed Martin Corp. |
|
| 60,990 |
|
| 4,263,811 |
|
Northrop Grumman Corp. |
|
| 60,271 |
|
| 3,904,355 |
|
Precision Castparts Corp. |
|
| 29,448 |
|
| 4,099,456 |
|
Raytheon Co. |
|
| 75,184 |
|
| 3,484,026 |
|
Rockwell Collins, Inc. |
|
| 32,481 |
|
| 1,892,343 |
|
United Technologies Corp. |
|
| 190,899 |
|
| 15,027,569 |
|
|
|
|
|
| |||
|
|
|
|
|
| 62,588,204 |
|
Air Freight & Logistics — 1.1% |
|
|
|
|
|
|
|
C.H. Robinson Worldwide, Inc. (a) |
|
| 34,178 |
|
| 2,740,734 |
|
Expeditors International Washington, Inc. |
|
| 43,955 |
|
| 2,399,943 |
|
FedEx Corp. |
|
| 65,088 |
|
| 6,053,835 |
|
United Parcel Service, Inc., Class B |
|
| 204,446 |
|
| 14,838,690 |
|
|
|
|
|
| |||
|
|
|
|
|
| 26,033,202 |
|
Airlines — 0.1% |
|
|
|
|
|
|
|
Southwest Airlines Co. |
|
| 154,690 |
|
| 2,007,876 |
|
Auto Components — 0.2% |
|
|
|
|
|
|
|
The Goodyear Tire & Rubber Co. (b) |
|
| 50,673 |
|
| 600,475 |
|
Johnson Controls, Inc. |
|
| 139,433 |
|
| 5,326,341 |
|
|
|
|
|
| |||
|
|
|
|
|
| 5,926,816 |
|
Automobiles — 0.6% |
|
|
|
|
|
|
|
Ford Motor Co. (a)(b) |
|
| 774,585 |
|
| 13,005,282 |
|
Harley-Davidson, Inc. |
|
| 48,785 |
|
| 1,691,376 |
|
|
|
|
|
| |||
|
|
|
|
|
| 14,696,658 |
|
Beverages — 2.6% |
|
|
|
|
|
|
|
Brown-Forman Corp., Class B |
|
| 21,502 |
|
| 1,496,969 |
|
The Coca-Cola Co. |
|
| 479,981 |
|
| 31,568,351 |
|
Coca-Cola Enterprises Inc. |
|
| 69,636 |
|
| 1,742,989 |
|
Constellation Brands, Inc., Class A (b) |
|
| 37,188 |
|
| 823,714 |
|
Dr. Pepper Snapple Group, Inc. |
|
| 46,530 |
|
| 1,635,995 |
|
Molson Coors Brewing Co., Class B |
|
| 32,768 |
|
| 1,644,626 |
|
PepsiCo, Inc. |
|
| 327,616 |
|
| 21,403,153 |
|
|
|
|
|
| |||
|
|
|
|
|
| 60,315,797 |
|
Biotechnology — 1.3% |
|
|
|
|
|
|
|
Amgen, Inc. (b) |
|
| 195,341 |
|
| 10,724,221 |
|
Biogen Idec, Inc. (b) |
|
| 49,135 |
|
| 3,294,502 |
|
Celgene Corp. (b) |
|
| 97,333 |
|
| 5,756,273 |
|
Cephalon, Inc. (b) |
|
| 15,606 |
|
| 963,202 |
|
Genzyme Corp. (b) |
|
| 53,580 |
|
| 3,814,896 |
|
Gilead Sciences, Inc. (b) |
|
| 167,899 |
|
| 6,084,660 |
|
|
|
|
|
| |||
|
|
|
|
|
| 30,637,754 |
|
Building Products — 0.0% |
|
|
|
|
|
|
|
Masco Corp. (a) |
|
| 74,374 |
|
| 941,575 |
|
|
|
|
|
|
|
|
|
Common Stocks |
| Shares |
| Value |
| ||
Capital Markets — 2.5% |
|
|
|
|
|
|
|
Ameriprise Financial, Inc. |
|
| 51,070 |
| $ | 2,939,078 |
|
The Bank of New York Mellon Corp. |
|
| 256,503 |
|
| 7,746,390 |
|
The Charles Schwab Corp. |
|
| 204,556 |
|
| 3,499,953 |
|
E*Trade Financial Corp. (b) |
|
| 41,543 |
|
| 664,688 |
|
Federated Investors, Inc., Class B (a) |
|
| 19,041 |
|
| 498,303 |
|
Franklin Resources, Inc. |
|
| 30,036 |
|
| 3,340,303 |
|
The Goldman Sachs Group, Inc. |
|
| 105,687 |
|
| 17,772,326 |
|
Invesco Ltd. |
|
| 94,924 |
|
| 2,283,871 |
|
Janus Capital Group, Inc. |
|
| 38,242 |
|
| 495,999 |
|
Legg Mason, Inc. |
|
| 31,121 |
|
| 1,128,759 |
|
Morgan Stanley |
|
| 312,822 |
|
| 8,511,887 |
|
Northern Trust Corp. |
|
| 50,124 |
|
| 2,777,371 |
|
State Street Corp. |
|
| 103,740 |
|
| 4,807,312 |
|
T. Rowe Price Group, Inc. |
|
| 52,881 |
|
| 3,412,940 |
|
|
|
|
|
| |||
|
|
|
|
|
| 59,879,180 |
|
Chemicals — 2.1% |
|
|
|
|
|
|
|
Air Products & Chemicals, Inc. |
|
| 44,327 |
|
| 4,031,541 |
|
Airgas, Inc. |
|
| 15,494 |
|
| 967,755 |
|
CF Industries Holdings, Inc. |
|
| 14,730 |
|
| 1,990,759 |
|
The Dow Chemical Co. (a) |
|
| 240,007 |
|
| 8,193,839 |
|
E.I. du Pont de Nemours & Co. |
|
| 188,753 |
|
| 9,415,000 |
|
Eastman Chemical Co. |
|
| 14,952 |
|
| 1,257,164 |
|
Ecolab, Inc. |
|
| 47,731 |
|
| 2,406,597 |
|
FMC Corp. |
|
| 15,037 |
|
| 1,201,306 |
|
International Flavors & Fragrances, Inc. |
|
| 16,565 |
|
| 920,848 |
|
Monsanto Co. |
|
| 110,855 |
|
| 7,719,942 |
|
PPG Industries, Inc. |
|
| 33,570 |
|
| 2,822,230 |
|
Praxair, Inc. |
|
| 63,374 |
|
| 6,050,316 |
|
The Sherwin-Williams Co. |
|
| 18,316 |
|
| 1,533,965 |
|
Sigma-Aldrich Corp. |
|
| 25,125 |
|
| 1,672,320 |
|
|
|
|
|
| |||
|
|
|
|
|
| 50,183,582 |
|
Commercial Banks — 3.0% |
|
|
|
|
|
|
|
BB&T Corp. |
|
| 143,174 |
|
| 3,764,044 |
|
Comerica, Inc. |
|
| 36,563 |
|
| 1,544,421 |
|
Fifth Third Bancorp |
|
| 164,832 |
|
| 2,419,734 |
|
First Horizon National Corp. (b) |
|
| 49,501 |
|
| 583,123 |
|
Huntington Bancshares, Inc. |
|
| 178,404 |
|
| 1,225,636 |
|
KeyCorp |
|
| 182,406 |
|
| 1,614,293 |
|
M&T Bank Corp. |
|
| 24,716 |
|
| 2,151,528 |
|
Marshall & Ilsley Corp. |
|
| 109,305 |
|
| 756,391 |
|
The PNC Financial Services Group, Inc. (c) |
|
| 108,792 |
|
| 6,605,850 |
|
Regions Financial Corp. |
|
| 260,175 |
|
| 1,821,225 |
|
SunTrust Banks, Inc. |
|
| 102,928 |
|
| 3,037,405 |
|
U.S. Bancorp |
|
| 396,619 |
|
| 10,696,814 |
|
Wells Fargo & Co. |
|
| 1,084,948 |
|
| 33,622,539 |
|
Zions Bancorporation |
|
| 36,309 |
|
| 879,767 |
|
|
|
|
|
| |||
|
|
|
|
|
| 70,722,770 |
|
Commercial Services & Supplies — 0.5% |
|
|
|
|
|
|
|
Avery Dennison Corp. |
|
| 21,863 |
|
| 925,680 |
|
Cintas Corp. |
|
| 25,446 |
|
| 711,470 |
|
Iron Mountain, Inc. (a) |
|
| 41,509 |
|
| 1,038,140 |
|
Pitney Bowes, Inc. |
|
| 41,267 |
|
| 997,836 |
|
R.R. Donnelley & Sons Co. |
|
| 42,729 |
|
| 746,476 |
|
Republic Services, Inc., Class A |
|
| 63,655 |
|
| 1,900,738 |
|
Stericycle, Inc. (b) |
|
| 17,723 |
|
| 1,434,145 |
|
Waste Management, Inc. (a) |
|
| 98,163 |
|
| 3,619,270 |
|
|
|
|
|
| |||
|
|
|
|
|
| 11,373,755 |
|
|
|
|
|
See Notes to Financial Statements. |
|
| |
| BLACKROCK INDEX EQUITY PORTFOLIO | DECEMBER 31, 2010 | 21 |
|
|
|
|
Schedule of Investments (continued) | Master S&P 500 Index Series |
| (Percentages shown are based on Net Assets) |
|
|
|
|
|
|
|
|
Common Stocks |
| Shares |
| Value |
| ||
Communications Equipment — 2.2% |
|
|
|
|
|
|
|
Cisco Systems, Inc. (b) |
|
| 1,145,783 |
| $ | 23,179,190 |
|
F5 Networks, Inc. (b) |
|
| 16,720 |
|
| 2,176,275 |
|
Harris Corp. |
|
| 26,592 |
|
| 1,204,618 |
|
JDS Uniphase Corp. (b) |
|
| 46,293 |
|
| 670,323 |
|
Juniper Networks, Inc. (b) |
|
| 108,234 |
|
| 3,995,999 |
|
Motorola, Inc. (b) |
|
| 485,981 |
|
| 4,407,848 |
|
QUALCOMM, Inc. |
|
| 334,427 |
|
| 16,550,792 |
|
Tellabs, Inc. |
|
| 76,789 |
|
| 520,629 |
|
|
|
|
|
| |||
|
|
|
|
|
| 52,705,674 |
|
Computers & Peripherals — 4.4% |
|
|
|
|
|
|
|
Apple, Inc. (b) |
|
| 189,604 |
|
| 61,158,666 |
|
Dell, Inc. (b) |
|
| 346,991 |
|
| 4,701,728 |
|
EMC Corp. (b) |
|
| 426,008 |
|
| 9,755,583 |
|
Hewlett-Packard Co. |
|
| 468,791 |
|
| 19,736,101 |
|
Lexmark International, Inc., Class A (b) |
|
| 16,260 |
|
| 566,173 |
|
NetApp, Inc. (b) |
|
| 74,849 |
|
| 4,113,701 |
|
QLogic Corp. (b) |
|
| 22,042 |
|
| 375,155 |
|
SanDisk Corp. (b) |
|
| 48,538 |
|
| 2,420,105 |
|
Western Digital Corp. (b) |
|
| 47,604 |
|
| 1,613,776 |
|
|
|
|
|
| |||
|
|
|
|
|
| 104,440,988 |
|
Construction & Engineering — 0.2% |
|
|
|
|
|
|
|
Fluor Corp. |
|
| 37,009 |
|
| 2,452,217 |
|
Jacobs Engineering Group, Inc. (b) |
|
| 26,119 |
|
| 1,197,556 |
|
Quanta Services, Inc. (b) | �� |
| 44,234 |
|
| 881,141 |
|
|
|
|
|
| |||
|
|
|
|
|
| 4,530,914 |
|
Construction Materials — 0.0% |
|
|
|
|
|
|
|
Vulcan Materials Co. (a) |
|
| 26,582 |
|
| 1,179,177 |
|
Consumer Finance — 0.7% |
|
|
|
|
|
|
|
American Express Co. |
|
| 216,538 |
|
| 9,293,811 |
|
Capital One Financial Corp. |
|
| 94,327 |
|
| 4,014,557 |
|
Discover Financial Services, Inc. |
|
| 112,757 |
|
| 2,089,387 |
|
SLM Corp. (b) |
|
| 100,643 |
|
| 1,267,096 |
|
|
|
|
|
| |||
|
|
|
|
|
| 16,664,851 |
|
Containers & Packaging — 0.2% |
|
|
|
|
|
|
|
Ball Corp. |
|
| 18,000 |
|
| 1,224,900 |
|
Bemis Co. |
|
| 22,471 |
|
| 733,903 |
|
Owens-Illinois, Inc. (b) |
|
| 33,923 |
|
| 1,041,436 |
|
Sealed Air Corp. |
|
| 33,123 |
|
| 842,980 |
|
|
|
|
|
|
| ||
|
|
|
|
|
| 3,843,219 |
|
Distributors — 0.1% |
|
|
|
|
|
|
|
Genuine Parts Co. |
|
| 32,631 |
|
| 1,675,276 |
|
Diversified Consumer Services — 0.1% |
|
|
|
|
|
|
|
Apollo Group, Inc., Class A (b) |
|
| 26,277 |
|
| 1,037,678 |
|
DeVry, Inc. |
|
| 12,963 |
|
| 621,965 |
|
H&R Block, Inc. |
|
| 63,869 |
|
| 760,680 |
|
|
|
|
|
| |||
|
|
|
|
|
| 2,420,323 |
|
Diversified Financial Services — 4.3% |
|
|
|
|
|
|
|
Bank of America Corp. |
|
| 2,084,712 |
|
| 27,810,058 |
|
CME Group, Inc. |
|
| 13,844 |
|
| 4,454,307 |
|
Citigroup, Inc. (b) |
|
| 6,004,952 |
|
| 28,403,423 |
|
IntercontinentalExchange, Inc. (b) |
|
| 14,993 |
|
| 1,786,416 |
|
JPMorgan Chase & Co. |
|
| 808,051 |
|
| 34,277,523 |
|
Leucadia National Corp. |
|
| 40,842 |
|
| 1,191,770 |
|
|
|
|
|
|
|
|
|
Common Stocks |
| Shares |
| Value |
| ||
Diversified Financial Services (concluded) |
|
|
|
|
|
|
|
Moody’s Corp. (a) |
|
| 42,251 |
| $ | 1,121,341 |
|
The NASDAQ Stock Market, Inc. (b) |
|
| 29,183 |
|
| 691,929 |
|
NYSE Euronext |
|
| 54,066 |
|
| 1,620,899 |
|
|
|
|
|
| |||
|
|
|
|
|
| 101,357,666 |
|
Diversified Telecommunication Services — 2.8% |
|
|
|
|
|
|
|
AT&T Inc. |
|
| 1,221,623 |
|
| 35,891,284 |
|
CenturyLink, Inc. (a) |
|
| 62,754 |
|
| 2,897,352 |
|
Frontier Communications Corp. |
|
| 205,802 |
|
| 2,002,454 |
|
Qwest Communications International, Inc. |
|
| 358,795 |
|
| 2,730,430 |
|
Verizon Communications, Inc. (a) |
|
| 584,353 |
|
| 20,908,150 |
|
Windstream Corp. |
|
| 100,229 |
|
| 1,397,192 |
|
|
|
|
|
| |||
|
|
|
|
|
| 65,826,862 |
|
Electric Utilities — 1.8% |
|
|
|
|
|
|
|
Allegheny Energy, Inc. |
|
| 35,126 |
|
| 851,454 |
|
American Electric Power Co., Inc. |
|
| 99,366 |
|
| 3,575,189 |
|
Duke Energy Corp. |
|
| 273,736 |
|
| 4,875,238 |
|
Edison International |
|
| 67,433 |
|
| 2,602,914 |
|
Entergy Corp. |
|
| 37,239 |
|
| 2,637,638 |
|
Exelon Corp. |
|
| 136,782 |
|
| 5,695,603 |
|
FirstEnergy Corp. (a) |
|
| 63,103 |
|
| 2,336,073 |
|
NextEra Energy, Inc. |
|
| 85,898 |
|
| 4,465,837 |
|
Northeast Utilities, Inc. |
|
| 36,556 |
|
| 1,165,405 |
|
PPL Corp. |
|
| 100,027 |
|
| 2,632,711 |
|
Pepco Holdings, Inc. |
|
| 46,600 |
|
| 850,450 |
|
Pinnacle West Capital Corp. |
|
| 22,440 |
|
| 930,138 |
|
Progress Energy, Inc. |
|
| 60,298 |
|
| 2,621,757 |
|
The Southern Co. |
|
| 173,434 |
|
| 6,630,382 |
|
|
|
|
|
| |||
|
|
|
|
|
| 41,870,789 |
|
Electrical Equipment — 0.5% |
|
|
|
|
|
|
|
Emerson Electric Co. |
|
| 155,624 |
|
| 8,897,024 |
|
Rockwell Automation, Inc. |
|
| 29,356 |
|
| 2,105,119 |
|
Roper Industries, Inc. |
|
| 19,614 |
|
| 1,499,098 |
|
|
|
|
|
| |||
|
|
|
|
|
| 12,501,241 |
|
Electronic Equipment, Instruments & Components — 0.6% |
|
|
|
|
|
|
|
Agilent Technologies, Inc. (b) |
|
| 71,324 |
|
| 2,954,954 |
|
Amphenol Corp., Class A |
|
| 36,158 |
|
| 1,908,419 |
|
Corning, Inc. |
|
| 323,306 |
|
| 6,246,272 |
|
Flir Systems, Inc. (b) |
|
| 32,784 |
|
| 975,324 |
|
Jabil Circuit, Inc. |
|
| 40,448 |
|
| 812,600 |
|
Molex, Inc. (a) |
|
| 28,546 |
|
| 648,565 |
|
|
|
|
|
| |||
|
|
|
|
|
| 13,546,134 |
|
Energy Equipment & Services — 2.2% |
|
|
|
|
|
|
|
Baker Hughes, Inc. |
|
| 89,136 |
|
| 5,095,905 |
|
Cameron International Corp. (b) |
|
| 50,206 |
|
| 2,546,950 |
|
Diamond Offshore Drilling, Inc. |
|
| 14,415 |
|
| 963,931 |
|
FMC Technologies, Inc. (b) |
|
| 24,588 |
|
| 2,186,119 |
|
Halliburton Co. |
|
| 188,045 |
|
| 7,677,877 |
|
Helmerich & Payne, Inc. |
|
| 21,980 |
|
| 1,065,591 |
|
Nabors Industries Ltd. (b) |
|
| 59,148 |
|
| 1,387,612 |
|
National Oilwell Varco, Inc. |
|
| 86,769 |
|
| 5,835,215 |
|
Rowan Cos., Inc. (b) |
|
| 26,191 |
|
| 914,328 |
|
Schlumberger Ltd. |
|
| 282,039 |
|
| 23,550,257 |
|
|
|
|
|
| |||
|
|
|
|
|
| 51,223,785 |
|
|
|
|
See Notes to Financial Statements. |
| |
22 | BLACKROCK INDEX EQUITY PORTFOLIO | DECEMBER 31, 2010 |
|
|
|
|
Schedule of Investments (continued) | Master S&P 500 Index Series |
| (Percentages shown are based on Net Assets) |
|
|
|
|
|
|
|
|
Common Stocks |
| Shares |
| Value |
| ||
Food & Staples Retailing — 2.4% |
|
|
|
|
|
|
|
CVS Caremark Corp. |
|
| 280,947 |
| $ | 9,768,527 |
|
Costco Wholesale Corp. |
|
| 89,406 |
|
| 6,456,007 |
|
The Kroger Co. |
|
| 131,345 |
|
| 2,936,874 |
|
SUPERVALU, Inc. |
|
| 44,171 |
|
| 425,367 |
|
SYSCO Corp. |
|
| 120,704 |
|
| 3,548,698 |
|
Safeway, Inc. |
|
| 76,314 |
|
| 1,716,302 |
|
Wal-Mart Stores, Inc. (a) |
|
| 404,980 |
|
| 21,840,571 |
|
Walgreen Co. |
|
| 191,439 |
|
| 7,458,463 |
|
Whole Foods Market, Inc. (b) |
|
| 30,408 |
|
| 1,538,341 |
|
|
|
|
|
| |||
|
|
|
|
|
| 55,689,150 |
|
Food Products — 1.7% |
|
|
|
|
|
|
|
Archer-Daniels-Midland Co. |
|
| 131,905 |
|
| 3,967,702 |
|
Campbell Soup Co. |
|
| 39,102 |
|
| 1,358,794 |
|
ConAgra Foods, Inc. |
|
| 91,045 |
|
| 2,055,796 |
|
Dean Foods Co. (b) |
|
| 38,158 |
|
| 337,317 |
|
General Mills, Inc. |
|
| 132,328 |
|
| 4,709,554 |
|
H.J. Heinz Co. |
|
| 66,366 |
|
| 3,282,462 |
|
The Hershey Co. |
|
| 32,045 |
|
| 1,510,922 |
|
Hormel Foods Corp. |
|
| 14,383 |
|
| 737,273 |
|
The J.M. Smucker Co. |
|
| 24,755 |
|
| 1,625,166 |
|
Kellogg Co. |
|
| 52,305 |
|
| 2,671,739 |
|
Kraft Foods, Inc. |
|
| 361,143 |
|
| 11,379,616 |
|
McCormick & Co., Inc. |
|
| 27,554 |
|
| 1,282,088 |
|
Mead Johnson Nutrition Co. |
|
| 42,341 |
|
| 2,635,727 |
|
Sara Lee Corp. |
|
| 131,311 |
|
| 2,299,256 |
|
Tyson Foods, Inc., Class A |
|
| 61,801 |
|
| 1,064,213 |
|
|
|
|
|
| |||
|
|
|
|
|
| 40,917,625 |
|
Gas Utilities — 0.1% |
|
|
|
|
|
|
|
Nicor, Inc. |
|
| 9,532 |
|
| 475,837 |
|
Oneok, Inc. |
|
| 22,042 |
|
| 1,222,670 |
|
|
|
|
|
| |||
|
|
|
|
|
| 1,698,507 |
|
Health Care Equipment & Supplies — 1.7% |
|
|
|
|
|
|
|
Baxter International, Inc. |
|
| 120,563 |
|
| 6,102,899 |
|
Becton Dickinson & Co. |
|
| 47,475 |
|
| 4,012,587 |
|
Boston Scientific Corp. (b) |
|
| 314,637 |
|
| 2,381,802 |
|
C.R. Bard, Inc. |
|
| 19,038 |
|
| 1,747,117 |
|
CareFusion Corp. (b) |
|
| 46,202 |
|
| 1,187,392 |
|
Dentsply International, Inc. |
|
| 28,818 |
|
| 984,711 |
|
Hospira, Inc. (b) |
|
| 34,283 |
|
| 1,909,220 |
|
Intuitive Surgical, Inc. (b) |
|
| 8,069 |
|
| 2,079,785 |
|
Medtronic, Inc. |
|
| 223,293 |
|
| 8,281,937 |
|
St. Jude Medical, Inc. (b) |
|
| 70,944 |
|
| 3,032,856 |
|
Stryker Corp. |
|
| 70,488 |
|
| 3,785,206 |
|
Varian Medical Systems, Inc. (b) |
|
| 24,368 |
|
| 1,688,215 |
|
Zimmer Holdings, Inc. (b) |
|
| 40,568 |
|
| 2,177,690 |
|
|
|
|
|
| |||
|
|
|
|
|
| 39,371,417 |
|
Health Care Providers & Services — 1.9% |
|
|
|
|
|
|
|
Aetna, Inc. |
|
| 82,814 |
|
| 2,526,655 |
|
AmerisourceBergen Corp. |
|
| 56,666 |
|
| 1,933,444 |
|
Cardinal Health, Inc. |
|
| 71,839 |
|
| 2,752,152 |
|
Cigna Corp. |
|
| 55,628 |
|
| 2,039,323 |
|
Coventry Health Care, Inc. (b) |
|
| 30,746 |
|
| 811,694 |
|
DaVita, Inc. (b) |
|
| 19,856 |
|
| 1,379,793 |
|
|
|
|
|
|
|
|
|
Common Stocks |
| Shares |
| Value |
| ||
Health Care Providers & Services (concluded) |
|
|
|
|
|
|
|
Express Scripts, Inc. (b) |
|
| 108,998 |
| $ | 5,891,342 |
|
Humana, Inc. (b) |
|
| 34,527 |
|
| 1,890,008 |
|
Laboratory Corp. of America Holdings (b) |
|
| 20,851 |
|
| 1,833,220 |
|
McKesson Corp. |
|
| 52,356 |
|
| 3,684,815 |
|
Medco Health Solutions, Inc. (b) |
|
| 87,776 |
|
| 5,378,036 |
|
Patterson Cos., Inc. |
|
| 19,954 |
|
| 611,191 |
|
Quest Diagnostics, Inc. |
|
| 28,931 |
|
| 1,561,406 |
|
Tenet Healthcare Corp. (b) |
|
| 100,884 |
|
| 674,914 |
|
UnitedHealth Group, Inc. |
|
| 227,442 |
|
| 8,212,931 |
|
WellPoint, Inc. (b) |
|
| 81,326 |
|
| 4,624,196 |
|
|
|
|
|
| |||
|
|
|
|
|
| 45,805,120 |
|
Health Care Technology — 0.1% |
|
|
|
|
|
|
|
Cerner Corp. (b) |
|
| 14,765 |
|
| 1,398,836 |
|
Hotels, Restaurants & Leisure — 1.7% |
|
|
|
|
|
|
|
Carnival Corp. |
|
| 88,882 |
|
| 4,098,349 |
|
Darden Restaurants, Inc. |
|
| 28,684 |
|
| 1,332,085 |
|
International Game Technology |
|
| 61,842 |
|
| 1,093,985 |
|
Marriott International, Inc., Class A (a) |
|
| 59,560 |
|
| 2,474,123 |
|
McDonald’s Corp. |
|
| 218,410 |
|
| 16,765,152 |
|
Starbucks Corp. |
|
| 153,170 |
|
| 4,921,352 |
|
Starwood Hotels & Resorts Worldwide, Inc. |
|
| 39,462 |
|
| 2,398,500 |
|
Wyndham Worldwide Corp. |
|
| 35,542 |
|
| 1,064,838 |
|
Wynn Resorts Ltd. |
|
| 15,661 |
|
| 1,626,238 |
|
Yum! Brands, Inc. |
|
| 96,837 |
|
| 4,749,855 |
|
|
|
|
|
| |||
|
|
|
|
|
| 40,524,477 |
|
Household Durables — 0.4% |
|
|
|
|
|
|
|
D.R. Horton, Inc. |
|
| 58,692 |
|
| 700,196 |
|
Fortune Brands, Inc. |
|
| 31,596 |
|
| 1,903,659 |
|
Harman International Industries, Inc. (b) |
|
| 14,504 |
|
| 671,535 |
|
Leggett & Platt, Inc. |
|
| 30,343 |
|
| 690,607 |
|
Lennar Corp., Class A |
|
| 33,071 |
|
| 620,081 |
|
Newell Rubbermaid, Inc. |
|
| 58,974 |
|
| 1,072,147 |
|
Pulte Group, Inc. (b) |
|
| 69,363 |
|
| 521,610 |
|
Stanley Black & Decker, Inc. |
|
| 34,090 |
|
| 2,279,598 |
|
Whirlpool Corp. |
|
| 15,753 |
|
| 1,399,339 |
|
|
|
|
|
| |||
|
|
|
|
|
| 9,858,772 |
|
Household Products — 2.2% |
|
|
|
|
|
|
|
Clorox Co. |
|
| 28,878 |
|
| 1,827,400 |
|
Colgate-Palmolive Co. |
|
| 99,808 |
|
| 8,021,569 |
|
Kimberly-Clark Corp. |
|
| 84,309 |
|
| 5,314,839 |
|
The Procter & Gamble Co. |
|
| 578,603 |
|
| 37,221,531 |
|
|
|
|
|
| |||
|
|
|
|
|
| 52,385,339 |
|
IT Services — 3.0% |
|
|
|
|
|
|
|
Automatic Data Processing, Inc. |
|
| 101,923 |
|
| 4,716,996 |
|
Cognizant Technology Solutions Corp. (b) |
|
| 62,775 |
|
| 4,600,780 |
|
Computer Sciences Corp. |
|
| 32,005 |
|
| 1,587,448 |
|
Fidelity National Information Services, Inc. |
|
| 54,873 |
|
| 1,502,971 |
|
Fiserv, Inc. (b) |
|
| 30,493 |
|
| 1,785,670 |
|
International Business Machines Corp. (a) |
|
| 256,801 |
|
| 37,688,115 |
|
MasterCard, Inc., Class A |
|
| 20,019 |
|
| 4,486,458 |
|
Paychex, Inc. |
|
| 66,647 |
|
| 2,060,059 |
|
SAIC, Inc. (b) |
|
| 60,920 |
|
| 966,191 |
|
Teradata Corp. (b) |
|
| 34,704 |
|
| 1,428,417 |
|
Total System Services, Inc. |
|
| 33,977 |
|
| 522,566 |
|
Visa, Inc., Class A |
|
| 100,771 |
|
| 7,092,263 |
|
The Western Union Co. |
|
| 134,940 |
|
| 2,505,836 |
|
|
|
|
|
| |||
|
|
|
|
|
| 70,943,770 |
|
|
|
|
|
See Notes to Financial Statements. |
|
| |
| BLACKROCK INDEX EQUITY PORTFOLIO | DECEMBER 31, 2010 | 23 |
|
|
|
|
Schedule of Investments (continued) | Master S&P 500 Index Series |
| (Percentages shown are based on Net Assets) |
|
|
|
|
|
|
|
|
Common Stocks |
| Shares |
| Value |
| ||
Independent Power Producers & Energy |
|
|
|
|
|
|
|
Traders — 0.2% |
|
|
|
|
|
|
|
The AES Corp. (b) |
|
| 135,393 |
| $ | 1,649,087 |
|
Constellation Energy Group, Inc. |
|
| 41,419 |
|
| 1,268,664 |
|
NRG Energy, Inc. (b) |
|
| 50,075 |
|
| 978,465 |
|
|
|
|
|
| |||
|
|
|
|
|
| 3,896,216 |
|
Industrial Conglomerates — 2.5% |
|
|
|
|
|
|
|
3M Co. |
|
| 147,791 |
|
| 12,754,363 |
|
General Electric Co. |
|
| 2,202,357 |
|
| 40,281,110 |
|
Textron, Inc. |
|
| 56,972 |
|
| 1,346,818 |
|
Tyco International Ltd. |
|
| 101,084 |
|
| 4,188,921 |
|
|
|
|
|
| |||
|
|
|
|
|
| 58,571,212 |
|
Insurance — 3.9% |
|
|
|
|
|
|
|
ACE Ltd. |
|
| 70,096 |
|
| 4,363,476 |
|
Aflac, Inc. |
|
| 97,442 |
|
| 5,498,652 |
|
The Allstate Corp. |
|
| 111,005 |
|
| 3,538,839 |
|
American International Group, Inc. (b) |
|
| 29,007 |
|
| 1,671,383 |
|
Aon Corp. |
|
| 68,267 |
|
| 3,140,965 |
|
Assurant, Inc. |
|
| 22,071 |
|
| 850,175 |
|
Berkshire Hathaway, Inc. (b) |
|
| 357,694 |
|
| 28,654,866 |
|
Chubb Corp. |
|
| 63,086 |
|
| 3,762,449 |
|
Cincinnati Financial Corp. |
|
| 33,749 |
|
| 1,069,506 |
|
Genworth Financial, Inc., Class A (b) |
|
| 101,470 |
|
| 1,333,316 |
|
Hartford Financial Services Group, Inc. |
|
| 92,013 |
|
| 2,437,424 |
|
Lincoln National Corp. |
|
| 65,596 |
|
| 1,824,225 |
|
Loews Corp. |
|
| 65,083 |
|
| 2,532,380 |
|
Marsh & McLennan Cos., Inc. |
|
| 112,456 |
|
| 3,074,547 |
|
MetLife, Inc. (a) |
|
| 187,396 |
|
| 8,327,878 |
|
Principal Financial Group, Inc. |
|
| 66,322 |
|
| 2,159,444 |
|
The Progressive Corp. |
|
| 136,606 |
|
| 2,714,361 |
|
Prudential Financial, Inc. |
|
| 100,375 |
|
| 5,893,016 |
|
Torchmark Corp. |
|
| 16,606 |
|
| 992,043 |
|
The Travelers Cos., Inc. |
|
| 94,942 |
|
| 5,289,219 |
|
Unum Group |
|
| 64,879 |
|
| 1,571,369 |
|
XL Group Plc |
|
| 66,008 |
|
| 1,440,295 |
|
|
|
|
|
| |||
|
|
|
|
|
| 92,139,828 |
|
Internet & Catalog Retail — 0.8% |
|
|
|
|
|
|
|
Amazon.com, Inc. (b) |
|
| 73,306 |
|
| 13,195,080 |
|
Expedia, Inc. |
|
| 41,094 |
|
| 1,031,048 |
|
NetFlix, Inc. (b) |
|
| 8,956 |
|
| 1,573,569 |
|
Priceline.com, Inc. (b) |
|
| 10,141 |
|
| 4,051,837 |
|
|
|
|
|
| |||
|
|
|
|
|
| 19,851,534 |
|
Internet Software & |
|
|
|
|
|
|
|
Services — 1.9% |
|
|
|
|
|
|
|
Akamai Technologies, Inc. (b) |
|
| 37,759 |
|
| 1,776,561 |
|
eBay, Inc. (b) |
|
| 237,132 |
|
| 6,599,384 |
|
Google, Inc., Class A (b) |
|
| 51,558 |
|
| 30,623,905 |
|
Monster Worldwide, Inc. (b) |
|
| 27,134 |
|
| 641,176 |
|
VeriSign, Inc. |
|
| 35,031 |
|
| 1,144,463 |
|
Yahoo! Inc. (b) |
|
| 269,631 |
|
| 4,483,963 |
|
|
|
|
|
| |||
|
|
|
|
|
| 45,269,452 |
|
Leisure Equipment & Products — 0.1% |
|
|
|
|
|
|
|
Hasbro, Inc. |
|
| 27,804 |
|
| 1,311,793 |
|
Mattel, Inc. |
|
| 73,595 |
|
| 1,871,521 |
|
|
|
|
|
| |||
|
|
|
|
|
| 3,183,314 |
|
|
|
|
|
|
|
|
|
Common Stocks |
| Shares |
| Value |
| ||
Life Sciences Tools & Services — 0.4% |
|
|
|
|
|
|
|
Life Technologies Corp. (b) |
|
| 38,420 |
| $ | 2,132,310 |
|
PerkinElmer, Inc. |
|
| 24,537 |
|
| 633,546 |
|
Thermo Fisher Scientific, Inc. (b) |
|
| 82,217 |
|
| 4,551,533 |
|
Waters Corp. (b) |
|
| 18,672 |
|
| 1,451,001 |
|
|
|
|
|
| |||
|
|
|
|
|
| 8,768,390 |
|
Machinery — 2.3% |
|
|
|
|
|
|
|
Caterpillar, Inc. (a) |
|
| 131,221 |
|
| 12,290,159 |
|
Cummins, Inc. |
|
| 40,864 |
|
| 4,495,449 |
|
Danaher Corp. |
|
| 110,852 |
|
| 5,228,889 |
|
Deere & Co. |
|
| 87,617 |
|
| 7,276,592 |
|
Dover Corp. |
|
| 38,670 |
|
| 2,260,261 |
|
Eaton Corp. |
|
| 34,820 |
|
| 3,534,578 |
|
Flowserve Corp. |
|
| 11,571 |
|
| 1,379,495 |
|
Illinois Tool Works, Inc. |
|
| 102,569 |
|
| 5,477,185 |
|
Ingersoll-Rand Plc |
|
| 67,045 |
|
| 3,157,149 |
|
PACCAR, Inc. |
|
| 75,328 |
|
| 4,325,334 |
|
Pall Corp. |
|
| 23,449 |
|
| 1,162,601 |
|
Parker Hannifin Corp. |
|
| 33,387 |
|
| 2,881,298 |
|
Snap-On, Inc. |
|
| 12,114 |
|
| 685,410 |
|
|
|
|
|
| |||
|
|
|
|
|
| 54,154,400 |
|
Media — 3.1% |
|
|
|
|
|
|
|
CBS Corp., Class B |
|
| 140,088 |
|
| 2,668,676 |
|
Cablevision Systems Corp., Class A |
|
| 49,580 |
|
| 1,677,787 |
|
Comcast Corp., Class A |
|
| 576,833 |
|
| 12,673,021 |
|
DIRECTV, Class A (b) |
|
| 172,409 |
|
| 6,884,291 |
|
Discovery Communications, Inc., Class A (a)(b) |
|
| 58,485 |
|
| 2,438,825 |
|
Gannett Co., Inc. |
|
| 49,456 |
|
| 746,291 |
|
Interpublic Group of Cos., Inc. (b) |
|
| 101,346 |
|
| 1,076,295 |
|
The McGraw-Hill Cos., Inc. |
|
| 63,113 |
|
| 2,297,944 |
|
Meredith Corp. |
|
| 7,512 |
|
| 260,291 |
|
News Corp., Class A |
|
| 471,931 |
|
| 6,871,315 |
|
Omnicom Group, Inc. |
|
| 62,051 |
|
| 2,841,936 |
|
Scripps Networks Interactive |
|
| 18,637 |
|
| 964,465 |
|
Time Warner Cable, Inc. |
|
| 73,512 |
|
| 4,853,997 |
|
Time Warner, Inc. |
|
| 229,387 |
|
| 7,379,380 |
|
Viacom, Inc., Class B |
|
| 124,938 |
|
| 4,948,794 |
|
Walt Disney Co. (a) |
|
| 391,470 |
|
| 14,684,040 |
|
The Washington Post Co., Class B |
|
| 1,085 |
|
| 476,858 |
|
|
|
|
|
| |||
|
|
|
|
|
| 73,744,206 |
|
Metals & Mining — 1.3% |
|
|
|
|
|
|
|
AK Steel Holding Corp. |
|
| 23,183 |
|
| 379,506 |
|
Alcoa, Inc. |
|
| 210,449 |
|
| 3,238,810 |
|
Allegheny Technologies, Inc. (a) |
|
| 20,439 |
|
| 1,127,824 |
|
Cliffs Natural Resources, Inc. |
|
| 28,043 |
|
| 2,187,634 |
|
Freeport-McMoRan Copper & Gold, Inc., Class B |
|
| 97,354 |
|
| 11,691,242 |
|
Newmont Mining Corp. |
|
| 102,008 |
|
| 6,266,352 |
|
Nucor Corp. |
|
| 65,337 |
|
| 2,863,067 |
|
Titanium Metals Corp. (b) |
|
| 19,062 |
|
| 327,485 |
|
United States Steel Corp. (a) |
|
| 29,744 |
|
| 1,737,645 |
|
|
|
|
|
| |||
|
|
|
|
|
| 29,819,565 |
|
Multi-Utilities — 1.3% |
|
|
|
|
|
|
|
Ameren Corp. |
|
| 49,691 |
|
| 1,400,789 |
|
CMS Energy Corp. |
|
| 50,714 |
|
| 943,280 |
|
CenterPoint Energy, Inc. |
|
| 87,694 |
|
| 1,378,550 |
|
Consolidated Edison, Inc. |
|
| 60,122 |
|
| 2,980,247 |
|
|
|
|
See Notes to Financial Statements. |
| |
24 | BLACKROCK INDEX EQUITY PORTFOLIO | DECEMBER 31, 2010 |
|
|
|
|
Schedule of Investments (continued) | Master S&P 500 Index Series |
| (Percentages shown are based on Net Assets) |
|
|
|
|
|
|
|
|
Common Stocks |
| Shares |
| Value |
| ||
Multi-Utilities (concluded) |
|
|
|
|
|
|
|
DTE Energy Co. |
|
| 35,034 |
| $ | 1,587,741 |
|
Dominion Resources, Inc. |
|
| 120,066 |
|
| 5,129,219 |
|
Integrys Energy Group, Inc. |
|
| 16,126 |
|
| 782,272 |
|
NiSource, Inc. |
|
| 57,730 |
|
| 1,017,203 |
|
PG&E Corp. |
|
| 81,109 |
|
| 3,880,255 |
|
Public Service Enterprise Group, Inc. |
|
| 104,318 |
|
| 3,318,356 |
|
SCANA Corp. |
|
| 23,562 |
|
| 956,617 |
|
Sempra Energy |
|
| 49,400 |
|
| 2,592,512 |
|
TECO Energy, Inc. |
|
| 44,576 |
|
| 793,453 |
|
Wisconsin Energy Corp. |
|
| 24,222 |
|
| 1,425,707 |
|
Xcel Energy, Inc. |
|
| 95,252 |
|
| 2,243,185 |
|
|
|
|
|
| |||
|
|
|
|
|
| 30,429,386 |
|
Multiline Retail — 0.8% |
|
|
|
|
|
|
|
Big Lots, Inc. (b) |
|
| 15,758 |
|
| 479,989 |
|
Family Dollar Stores, Inc. |
|
| 25,669 |
|
| 1,276,006 |
|
JCPenney Co., Inc. |
|
| 48,977 |
|
| 1,582,447 |
|
Kohl’s Corp. (b) |
|
| 63,525 |
|
| 3,451,948 |
|
Macy’s, Inc. |
|
| 87,665 |
|
| 2,217,924 |
|
Nordstrom, Inc. |
|
| 34,873 |
|
| 1,477,918 |
|
Sears Holdings Corp. (a)(b) |
|
| 9,109 |
|
| 671,789 |
|
Target Corp. |
|
| 146,410 |
|
| 8,803,633 |
|
|
|
|
|
| |||
|
|
|
|
|
| 19,961,654 |
|
Office Electronics — 0.1% |
|
|
|
|
|
|
|
Xerox Corp. |
|
| 287,016 |
|
| 3,306,424 |
|
Oil, Gas & Consumable Fuels — 9.9% |
|
|
|
|
|
|
|
Anadarko Petroleum Corp. |
|
| 102,425 |
|
| 7,800,688 |
|
Apache Corp. |
|
| 79,019 |
|
| 9,421,435 |
|
Cabot Oil & Gas Corp., Class A |
|
| 21,580 |
|
| 816,803 |
|
Chesapeake Energy Corp. |
|
| 134,805 |
|
| 3,492,798 |
|
Chevron Corp. |
|
| 415,976 |
|
| 37,957,810 |
|
ConocoPhillips |
|
| 303,719 |
|
| 20,683,264 |
|
Consol Energy, Inc. |
|
| 46,758 |
|
| 2,278,985 |
|
Denbury Resources, Inc. (b) |
|
| 82,794 |
|
| 1,580,538 |
|
Devon Energy Corp. |
|
| 89,373 |
|
| 7,016,674 |
|
EOG Resources, Inc. |
|
| 52,492 |
|
| 4,798,294 |
|
EQT Corp. |
|
| 30,906 |
|
| 1,385,825 |
|
El Paso Corp. |
|
| 145,801 |
|
| 2,006,222 |
|
Exxon Mobil Corp. (d) |
|
| 1,042,262 |
|
| 76,210,197 |
|
Hess Corp. |
|
| 62,058 |
|
| 4,749,919 |
|
Marathon Oil Corp. |
|
| 146,756 |
|
| 5,434,375 |
|
Massey Energy Co. |
|
| 21,177 |
|
| 1,136,146 |
|
Murphy Oil Corp. |
|
| 39,809 |
|
| 2,967,761 |
|
Newfield Exploration Co. (b) |
|
| 27,671 |
|
| 1,995,356 |
|
Noble Energy, Inc. |
|
| 36,079 |
|
| 3,105,680 |
|
Occidental Petroleum Corp. |
|
| 167,986 |
|
| 16,479,427 |
|
Peabody Energy Corp. |
|
| 55,609 |
|
| 3,557,864 |
|
Pioneer Natural Resources Co. |
|
| 24,037 |
|
| 2,086,892 |
|
QEP Resources, Inc. |
|
| 36,395 |
|
| 1,321,502 |
|
Range Resources Corp. |
|
| 33,166 |
|
| 1,491,807 |
|
Southwestern Energy Co. (b) |
|
| 71,777 |
|
| 2,686,613 |
|
Spectra Energy Corp. |
|
| 133,662 |
|
| 3,340,213 |
|
Sunoco, Inc. |
|
| 25,005 |
|
| 1,007,952 |
|
Tesoro Corp. |
|
| 29,967 |
|
| 555,588 |
|
Valero Energy Corp. |
|
| 116,475 |
|
| 2,692,902 |
|
Williams Cos., Inc. |
|
| 120,453 |
|
| 2,977,598 |
|
|
|
|
|
| |||
|
|
|
|
|
| 233,037,128 |
|
|
|
|
|
|
|
|
|
Common Stocks |
| Shares |
| Value |
| ||
Paper & Forest Products — 0.1% |
|
|
|
|
|
|
|
International Paper Co. |
|
| 90,550 |
| $ | 2,466,582 |
|
MeadWestvaco Corp. |
|
| 34,916 |
|
| 913,403 |
|
|
|
|
|
| |||
|
|
|
|
|
| 3,379,985 |
|
Personal Products — 0.2% |
|
|
|
|
|
|
|
Avon Products, Inc. |
|
| 88,830 |
|
| 2,581,400 |
|
The Estée Lauder Cos., Inc., Class A |
|
| 23,284 |
|
| 1,879,019 |
|
|
|
|
|
| |||
|
|
|
|
|
| 4,460,419 |
|
Pharmaceuticals — 5.5% |
|
|
|
|
|
|
|
Abbott Laboratories |
|
| 319,570 |
|
| 15,310,599 |
|
Allergan, Inc. |
|
| 63,528 |
|
| 4,362,468 |
|
Bristol-Myers Squibb Co. (a) |
|
| 353,915 |
|
| 9,371,669 |
|
Eli Lilly & Co. |
|
| 209,784 |
|
| 7,350,831 |
|
Forest Laboratories, Inc. (b) |
|
| 59,144 |
|
| 1,891,425 |
|
Johnson & Johnson |
|
| 567,663 |
|
| 35,109,957 |
|
King Pharmaceuticals, Inc. (b) |
|
| 52,022 |
|
| 730,909 |
|
Merck & Co, Inc. |
|
| 636,867 |
|
| 22,952,687 |
|
Mylan, Inc. (b) |
|
| 90,124 |
|
| 1,904,320 |
|
Pfizer, Inc. |
|
| 1,655,732 |
|
| 28,991,867 |
|
Watson Pharmaceuticals, Inc. (b) |
|
| 25,970 |
|
| 1,341,350 |
|
|
|
|
|
| |||
|
|
|
|
|
| 129,318,082 |
|
Professional Services — 0.1% |
|
|
|
|
|
|
|
Dun & Bradstreet Corp. |
|
| 10,320 |
|
| 847,169 |
|
Equifax, Inc. |
|
| 25,607 |
|
| 911,609 |
|
Robert Half International, Inc. |
|
| 30,532 |
|
| 934,279 |
|
|
|
|
|
| |||
|
|
|
|
|
| 2,693,057 |
|
Real Estate Investment Trusts (REITs) — 1.5% |
|
|
|
|
|
|
|
Apartment Investment & Management Co., Class A |
|
| 24,413 |
|
| 630,832 |
|
AvalonBay Communities, Inc. |
|
| 17,660 |
|
| 1,987,633 |
|
Boston Properties, Inc. |
|
| 29,000 |
|
| 2,496,900 |
|
Equity Residential |
|
| 58,862 |
|
| 3,057,881 |
|
HCP, Inc. |
|
| 75,302 |
|
| 2,770,361 |
|
Health Care REIT, Inc. |
|
| 29,929 |
|
| 1,425,818 |
|
Host Marriott Corp. |
|
| 137,758 |
|
| 2,461,735 |
|
Kimco Realty Corp. |
|
| 84,112 |
|
| 1,517,381 |
|
Plum Creek Timber Co., Inc. (a) |
|
| 33,501 |
|
| 1,254,612 |
|
ProLogis |
|
| 116,686 |
|
| 1,684,946 |
|
Public Storage |
|
| 28,767 |
|
| 2,917,549 |
|
Simon Property Group, Inc. |
|
| 60,581 |
|
| 6,027,204 |
|
Ventas, Inc. |
|
| 32,540 |
|
| 1,707,699 |
|
Vornado Realty Trust |
|
| 33,646 |
|
| 2,803,721 |
|
Weyerhaeuser Co. (a) |
|
| 110,968 |
|
| 2,100,624 |
|
|
|
|
|
| |||
|
|
|
|
|
| 34,844,896 |
|
Real Estate Management & |
|
|
|
|
|
|
|
Development — 0.1% |
|
|
|
|
|
|
|
CB Richard Ellis Group, Inc. (b) |
|
| 60,188 |
|
| 1,232,650 |
|
Road & Rail — 0.8% |
|
|
|
|
|
|
|
CSX Corp. |
|
| 77,337 |
|
| 4,996,744 |
|
Norfolk Southern Corp. |
|
| 75,088 |
|
| 4,717,028 |
|
Ryder System, Inc. |
|
| 10,764 |
|
| 566,617 |
|
Union Pacific Corp. |
|
| 101,965 |
|
| 9,448,077 |
|
|
|
|
|
| |||
|
|
|
|
|
| 19,728,466 |
|
|
|
|
|
See Notes to Financial Statements. |
|
| |
| BLACKROCK INDEX EQUITY PORTFOLIO | DECEMBER 31, 2010 | 25 |
|
|
|
|
Schedule of Investments (continued) | Master S&P 500 Index Series |
| (Percentages shown are based on Net Assets) |
|
|
|
|
|
|
|
|
Common Stocks |
| Shares |
| Value |
| ||
Semiconductors & Semiconductor |
|
|
|
|
|
|
|
Advanced Micro Devices, Inc. (b) |
|
| 119,254 |
| $ | 975,498 |
|
Altera Corp. |
|
| 64,429 |
|
| 2,292,384 |
|
Analog Devices, Inc. |
|
| 61,822 |
|
| 2,328,835 |
|
Applied Materials, Inc. |
|
| 275,690 |
|
| 3,873,445 |
|
Broadcom Corp., Class A |
|
| 94,209 |
|
| 4,102,802 |
|
First Solar, Inc. (b) |
|
| 11,189 |
|
| 1,456,136 |
|
Intel Corp. |
|
| 1,153,052 |
|
| 24,248,684 |
|
KLA-Tencor Corp. |
|
| 34,621 |
|
| 1,337,755 |
|
LSI Corp. (b) |
|
| 124,085 |
|
| 743,269 |
|
Linear Technology Corp. |
|
| 46,653 |
|
| 1,613,727 |
|
MEMC Electronic Materials, Inc. (b) |
|
| 47,463 |
|
| 534,433 |
|
Microchip Technology, Inc. |
|
| 38,648 |
|
| 1,322,148 |
|
Micron Technology, Inc. (b) |
|
| 177,527 |
|
| 1,423,767 |
|
National Semiconductor Corp. |
|
| 49,674 |
|
| 683,514 |
|
Novellus Systems, Inc. (b) |
|
| 18,693 |
|
| 604,158 |
|
Nvidia Corp. (b) |
|
| 120,226 |
|
| 1,851,480 |
|
Teradyne, Inc. (b) |
|
| 37,748 |
|
| 529,982 |
|
Texas Instruments, Inc. |
|
| 242,791 |
|
| 7,890,708 |
|
Xilinx, Inc. |
|
| 53,683 |
|
| 1,555,733 |
|
|
|
|
|
| |||
|
|
|
|
|
| 59,368,458 |
|
Software — 4.0% |
|
|
|
|
|
|
|
Adobe Systems, Inc. (b) |
|
| 104,803 |
|
| 3,225,836 |
|
Autodesk, Inc. (b) |
|
| 47,090 |
|
| 1,798,838 |
|
BMC Software, Inc. (b) |
|
| 36,410 |
|
| 1,716,367 |
|
CA, Inc. |
|
| 78,730 |
|
| 1,924,161 |
|
Citrix Systems, Inc. (b) |
|
| 38,862 |
|
| 2,658,550 |
|
Compuware Corp. (b) |
|
| 43,470 |
|
| 507,295 |
|
Electronic Arts, Inc. (b) |
|
| 68,813 |
|
| 1,127,157 |
|
Intuit, Inc. (b) |
|
| 57,567 |
|
| 2,838,053 |
|
McAfee, Inc. (b) |
|
| 31,830 |
|
| 1,474,047 |
|
Microsoft Corp. |
|
| 1,556,219 |
|
| 43,449,635 |
|
Novell, Inc. (b) |
|
| 73,955 |
|
| 437,814 |
|
Oracle Corp. |
|
| 800,160 |
|
| 25,045,008 |
|
Red Hat, Inc. (b) |
|
| 39,368 |
|
| 1,797,149 |
|
Salesforce.com, Inc. (b) |
|
| 24,490 |
|
| 3,232,680 |
|
Symantec Corp. (b) |
|
| 159,842 |
|
| 2,675,755 |
|
|
|
|
|
| |||
|
|
|
|
|
| 93,908,345 |
|
Specialty Retail — 2.0% |
|
|
|
|
|
|
|
Abercrombie & Fitch Co., Class A |
|
| 18,219 |
|
| 1,049,961 |
|
AutoNation, Inc. (a)(b) |
|
| 13,147 |
|
| 370,745 |
|
AutoZone, Inc. (b) |
|
| 5,565 |
|
| 1,516,963 |
|
Bed Bath & Beyond, Inc. (b) |
|
| 53,318 |
|
| 2,620,580 |
|
Best Buy Co., Inc. |
|
| 68,357 |
|
| 2,343,962 |
|
CarMax, Inc. (b) |
|
| 46,583 |
|
| 1,485,066 |
|
GameStop Corp., Class A (b) |
|
| 31,494 |
|
| 720,583 |
|
The Gap, Inc. |
|
| 90,990 |
|
| 2,014,519 |
|
Home Depot, Inc. |
|
| 338,821 |
|
| 11,879,064 |
|
Limited Brands, Inc. |
|
| 54,781 |
|
| 1,683,420 |
|
Lowe’s Cos., Inc. |
|
| 285,365 |
|
| 7,156,954 |
|
O’Reilly Automotive Inc. (b) |
|
| 28,919 |
|
| 1,747,286 |
|
RadioShack Corp. |
|
| 22,363 |
|
| 413,492 |
|
Ross Stores, Inc. |
|
| 24,954 |
|
| 1,578,340 |
|
Staples, Inc. |
|
| 149,146 |
|
| 3,396,054 |
|
TJX Cos., Inc. |
|
| 81,664 |
|
| 3,625,065 |
|
Tiffany & Co. |
|
| 26,180 |
|
| 1,630,229 |
|
Urban Outfitters, Inc. (b) |
|
| 26,707 |
|
| 956,378 |
|
|
|
|
|
| |||
|
|
|
|
|
| 46,188,661 |
|
|
|
|
|
|
|
|
|
Common Stocks |
| Shares |
| Value |
| ||
Textiles, Apparel & Luxury Goods — 0.6% |
|
|
|
|
|
|
|
Coach, Inc. |
|
| 61,144 |
| $ | 3,381,874 |
|
Nike, Inc., Class B |
|
| 79,054 |
|
| 6,752,793 |
|
Polo Ralph Lauren Corp. |
|
| 13,216 |
|
| 1,465,919 |
|
VF Corp. |
|
| 17,975 |
|
| 1,549,085 |
|
|
|
|
|
| |||
|
|
|
|
|
| 13,149,671 |
|
Thrifts & Mortgage Finance — 0.1% |
|
|
|
|
|
|
|
Hudson City Bancorp, Inc. |
|
| 109,126 |
|
| 1,390,265 |
|
People’s United Financial, Inc. |
|
| 76,521 |
|
| 1,072,059 |
|
|
|
|
|
| |||
|
|
|
|
|
| 2,462,324 |
|
Tobacco — 1.6% |
|
|
|
|
|
|
|
Altria Group, Inc. |
|
| 431,663 |
|
| 10,627,543 |
|
Lorillard, Inc. |
|
| 30,785 |
|
| 2,526,217 |
|
Philip Morris International, Inc. |
|
| 375,067 |
|
| 21,952,672 |
|
Reynolds American, Inc. |
|
| 70,005 |
|
| 2,283,563 |
|
|
|
|
|
| |||
|
|
|
|
|
| 37,389,995 |
|
Trading Companies & Distributors — 0.1% |
|
|
|
|
|
|
|
Fastenal Co. (a) |
|
| 30,532 |
|
| 1,829,172 |
|
W.W. Grainger, Inc. |
|
| 11,875 |
|
| 1,640,056 |
|
|
|
|
|
| |||
|
|
|
|
|
| 3,469,228 |
|
Wireless Telecommunication Services — 0.3% |
|
|
|
|
|
|
|
American Tower Corp., Class A (b) |
|
| 82,410 |
|
| 4,255,653 |
|
MetroPCS Communications, Inc. (b) |
|
| 54,743 |
|
| 691,404 |
|
Sprint Nextel Corp. (b) |
|
| 614,797 |
|
| 2,600,591 |
|
|
|
|
|
| |||
|
|
|
|
|
| 7,547,648 |
|
Total Long-Term Investments |
|
|
|
|
| 2,362,961,675 |
|
|
|
|
|
|
|
|
|
|
|
|
|
|
|
|
|
Short-Term Securities |
|
|
|
|
|
|
|
BlackRock Liquidity Funds, TempFund, |
|
| 11,774,805 |
|
| 11,774,805 |
|
|
|
|
|
|
|
|
|
|
| Beneficial |
|
|
|
| |
BlackRock Liquidity Series, LLC |
| $ | 135,285 |
|
| 135,284,520 |
|
Total Short-Term Securities |
|
|
|
|
| 147,059,325 |
|
Total Investments (Cost — $2,078,189,416*) — 106.2% |
|
|
|
|
| 2,510,021,000 |
|
Liabilities in Excess of Other Assets — (6.2)% |
|
|
|
|
| (146,037,154 | ) |
|
|
|
|
| |||
Net Assets — 100.0% |
|
|
|
| $ | 2,363,983,846 |
|
|
|
|
|
| |||
|
|
* | The cost and unrealized appreciation (depreciation) of investments as of December 31, 2010, as computed for federal income tax purposes were as follows: |
|
|
|
|
|
Aggregate cost |
| $ | 1,666,714,580 |
|
|
| |||
Gross unrealized appreciation |
| $ | 978,592,780 |
|
Gross unrealized depreciation |
|
| (135,286,360 | ) |
|
| |||
Net unrealized appreciation |
| $ | 843,306,420 |
|
|
|
|
|
(a) | Security, or a portion of security, is on loan. |
|
|
(b) | Non-income producing security. |
|
|
|
See Notes to Financial Statements. |
| |
26 | BLACKROCK INDEX EQUITY PORTFOLIO | DECEMBER 31, 2010 |
|
|
|
|
Schedule of Investments (concluded) | Master S&P 500 Index Series |
|
|
(c) | Investments in companies considered to be an affiliate of the Series during the year, for purposes of Section 2(a)(3) of the Investment Company Act of 1940, as amended, were as follows: |
|
|
|
|
|
|
|
|
|
|
|
|
|
|
|
|
|
|
|
|
|
|
|
Affiliate |
| Beneficial Interest/ |
| Shares |
| Beneficial |
| Beneficial Interest/ |
| Value |
| Realized |
| Income |
| |||||||
BlackRock Liquidity Funds, TempFund, Institutional Class |
|
| 4,444,194 |
|
| 7,330,611 | 1 |
| — |
|
| 11,774,805 |
| $ | 11,774,805 |
|
| — |
| $ | 24,343 |
|
BlackRock Liquidity Series, LLC Money Market Series |
| $ | 270,313,884 |
|
| — |
| $ | (135,029,364 | )2 | $ | 135,284,520 |
| $ | 135,284,520 |
|
| — |
| $ | 203,433 |
|
The PNC Financial Services Group, Inc. |
|
| 105,339 |
|
| 13,906 |
|
| (10,453 | ) |
| 108,792 |
| $ | 6,605,850 |
| $ | (184,655 | ) | $ | 44,573 |
|
|
|
|
| 1 | Represents net shares purchased. |
|
|
|
| 2 | Represents beneficial interest sold. |
|
|
(d) | All or a portion of security held as collateral in connection with open financial futures contracts. |
|
|
(e) | Represents the current yield as of report date. |
|
|
(f) | Security was purchased with the cash collateral from loaned securities. |
|
|
• | For Series compliance purposes, the Series’ industry classifications refer to any one or more of the industry sub-classifications used by one or more widely recognized market indexes or rating group indexes, and/or as defined by Series’ management. This definition may not apply for purposes of this report, which may combine such industry sub-classifications for reporting ease. |
|
|
• | Financial futures contracts purchased as of December 31, 2010 were as follows: |
|
|
|
|
|
|
|
|
|
|
|
|
|
|
Contracts |
| Issue |
| Exchange |
| Expiration |
|
| Notional |
|
| Unrealized |
|
249 |
| S&P 500 |
| Chicago |
| March 2011 |
| $ | 15,589,197 |
| $ | 10,653 |
|
|
|
|
• | Fair Value Measurements — Various inputs are used in determining the fair value of investments and derivatives, which are as follows: | |
|
|
|
| • | Level 1 — price quotations in active markets/exchanges for identical assets and liabilities |
|
|
|
| • | Level 2 — other observable inputs (including, but not limited to: quoted prices for similar assets or liabilities in markets that are active, quoted prices for identical or similar assets or liabilities in markets that are not active, inputs other than quoted prices that are observable for the assets or liabilities (such as interest rates, yield curves, volatilities, prepayment speeds, loss severities, credit risks and default rates) or other market-corroborated inputs) |
|
|
|
| • | Level 3 — unobservable inputs based on the best information available in the circumstances, to the extent observable inputs are not available (including the Series’ own assumptions used in determining the fair value of investments and derivatives) |
The inputs or methodologies used for valuing securities are not necessarily an indication of the risk associated with investing in those securities. For information about the Series’ policy regarding valuation of investments and derivatives and other significant accounting policies, please refer to Note 1 of the Series’ Notes to Financial Statements.
The following tables summarize the inputs used as of December 31, 2010 in determining the fair valuation of the Series’ investments and derivatives:
|
|
|
|
|
|
|
|
|
|
|
|
|
|
Valuation Inputs |
| Level 1 |
| Level 2 |
| Level 3 |
| Total |
| ||||
Assets: |
|
|
|
|
|
|
|
|
|
|
|
|
|
Investments in |
|
|
|
|
|
|
|
|
|
|
|
|
|
Long-Term |
| $ | 2,362,961,675 |
|
| — |
|
| — |
| $ | 2,362,961,675 |
|
Short-Term |
|
| 11,774,805 |
| $ | 135,284,520 |
|
| — |
|
| 147,059,325 |
|
|
| ||||||||||||
Total |
| $ | 2,374,736,480 |
| $ | 135,284,520 |
|
| — |
| $ | 2,510,021,000 |
|
|
| ||||||||||||
|
|
|
| 3 | See above Schedule of Investments for values in each industry. |
|
|
|
|
|
|
|
|
|
|
|
|
|
|
|
| Derivative Financial Instruments4 |
| ||||||||||
Valuation Inputs |
| Level 1 |
| Level 2 |
| Level 3 |
| Total |
| ||||
Assets: |
|
|
|
|
|
|
|
|
|
|
|
|
|
Equity contracts |
| $ | 10,653 |
|
| — |
|
| — |
| $ | 10,653 |
|
|
| ||||||||||||
|
|
|
| 4 | Derivative financial instruments are financial futures contracts, which are shown at the unrealized appreciation/depreciation on the instrument. |
|
|
|
|
See Notes to Financial Statements. |
|
| |
| BLACKROCK INDEX EQUITY PORTFOLIO | DECEMBER 31, 2010 | 27 |
|
|
|
|
|
December 31, 2010 |
|
|
| |
Assets |
|
|
|
|
Investments at value — unaffiliated (including securities loaned of $131,753,539) (cost — $1,926,387,682) |
| $ | 2,356,355,825 |
|
Investments at value — affiliated (cost — $151,801,734) |
|
| 153,665,175 |
|
Cash |
|
| 20,105 |
|
Dividends receivable |
|
| 2,857,376 |
|
Securities lending income receivable — affiliated |
|
| 41,390 |
|
Prepaid expenses |
|
| 56,982 |
|
Other assets |
|
| 37,949 |
|
|
| |||
Total assets |
|
| 2,513,034,802 |
|
|
| |||
|
|
|
|
|
Liabilities |
|
|
|
|
Collateral on securities loaned at value |
|
| 135,284,520 |
|
Withdrawals payable to investors |
|
| 13,477,003 |
|
Margin variation payable |
|
| 19,095 |
|
Other affiliates payable |
|
| 10,515 |
|
Investment advisory fees payable |
|
| 9,023 |
|
Directors’ fees payable |
|
| 754 |
|
Other accrued expenses payable |
|
| 217,474 |
|
Other liabilities |
|
| 32,572 |
|
|
| |||
Total liabilities |
|
| 149,050,956 |
|
|
| |||
Net Assets |
| $ | 2,363,983,846 |
|
|
| |||
|
|
|
|
|
Net Assets Consist of |
|
|
|
|
Investors’ capital |
| $ | 1,932,141,609 |
|
Net unrealized appreciation/depreciation |
|
| 431,842,237 |
|
|
| |||
Net Assets |
| $ | 2,363,983,846 |
|
|
| |||
|
|
|
See Notes to Financial Statements. | ||
28 | BLACKROCK INDEX EQUITY PORTFOLIO | DECEMBER 31, 2010 |
|
|
|
|
|
Year Ended December 31, 2010 |
|
|
| |
Investment Income |
|
|
|
|
Dividends — unaffiliated |
| $ | 46,623,203 |
|
Securities lending — affiliated |
|
| 203,433 |
|
Dividends — affiliated |
|
| 68,916 |
|
|
| |||
Total income |
|
| 46,895,552 |
|
|
| |||
|
|
|
|
|
Expenses |
|
|
|
|
Investment advisory |
|
| 226,584 |
|
Accounting services |
|
| 402,876 |
|
Custodian |
|
| 135,613 |
|
Professional |
|
| 86,602 |
|
Directors |
|
| 56,921 |
|
Registration |
|
| 20,000 |
|
Printing |
|
| 5,404 |
|
Miscellaneous |
|
| 49,454 |
|
|
| |||
Total expenses |
|
| 983,454 |
|
Less fees waived by advisor |
|
| (123,313 | ) |
|
| |||
Total expenses after fees waived |
|
| 860,141 |
|
|
| |||
Net investment income |
|
| 46,035,411 |
|
|
| |||
|
|
|
|
|
Realized and Unrealized Gain (Loss) |
|
|
|
|
Net realized gain (loss) from: |
|
|
|
|
Investments — unaffiliated |
|
| (6,041,348 | ) |
Investments — affiliated |
|
| (184,665 | ) |
Financial futures contracts |
|
| 1,035,859 |
|
|
| |||
|
|
| (5,190,154 | ) |
|
| |||
Net change in unrealized appreciation/depreciation on: |
|
|
|
|
Investments |
|
| 279,513,831 |
|
Financial futures contracts |
|
| 15,292 |
|
|
| |||
|
|
| 279,529,123 |
|
|
| |||
Total realized and unrealized gain |
|
| 274,338,969 |
|
|
| |||
Net Increase in Net Assets Resulting from Operations |
| $ | 320,374,380 |
|
|
| |||
|
|
|
|
See Notes to Financial Statements. | |||
| BLACKROCK INDEX EQUITY PORTFOLIO | DECEMBER 31, 2010 | 29 |
|
|
|
|
|
|
|
|
|
| Year Ended |
| ||||
|
|
| |||||
Increase (Decrease) in Net Assets: |
| 2010 |
| 2009 |
| ||
Operations |
|
|
|
|
|
|
|
Net investment income |
| $ | 46,035,411 |
| $ | 46,606,117 |
|
Net realized loss |
|
| (5,190,154 | ) |
| (60,806,194 | ) |
Net change in unrealized appreciation/depreciation |
|
| 279,529,123 |
|
| 510,710,328 |
|
|
| ||||||
Net increase in net assets resulting from operations |
|
| 320,374,380 |
|
| 496,510,251 |
|
|
| ||||||
|
|
|
|
|
|
|
|
Capital Transactions |
|
|
|
|
|
|
|
Proceeds from contributions |
|
| 601,567,988 |
|
| 667,013,781 |
|
Value of withdrawals |
|
| (836,617,134 | ) |
| (838,713,754 | ) |
|
| ||||||
Net decrease in net assets derived from capital transactions |
|
| (235,049,146 | ) |
| (171,699,973 | ) |
|
| ||||||
|
|
|
|
|
|
|
|
Net Assets |
|
|
|
|
|
|
|
Total increase in net assets |
|
| 85,325,234 |
|
| 324,810,278 |
|
Beginning of year |
|
| 2,278,658,612 |
|
| 1,953,848,334 |
|
|
| ||||||
End of year |
| $ | 2,363,983,846 |
| $ | 2,278,658,612 |
|
|
| ||||||
|
|
|
|
|
|
|
|
|
|
|
|
|
|
|
|
|
|
| Year Ended December 31, |
| |||||||||||||
|
|
| ||||||||||||||
|
| 2010 |
| 2009 |
| 2008 |
| 2007 |
| 2006 |
| |||||
Total Investment Return |
|
|
|
|
|
|
|
|
|
|
|
|
|
|
|
|
Total investment return |
|
| 15.11 | % |
| 26.61 | % |
| (36.92 | )% |
| 5.56 | % |
| 15.85 | % |
|
| |||||||||||||||
|
|
|
|
|
|
|
|
|
|
|
|
|
|
|
|
|
Ratios to Average Net Assets |
|
|
|
|
|
|
|
|
|
|
|
|
|
|
|
|
Total expenses |
|
| 0.04 | % |
| 0.05 | % |
| 0.04 | % |
| 0.04 | % |
| 0.04 | % |
|
| |||||||||||||||
Total expenses after fees waived and paid indirectly |
|
| 0.04 | % |
| 0.04 | % |
| 0.04 | % |
| 0.03 | % |
| 0.04 | % |
|
| |||||||||||||||
Net investment income |
|
| 2.03 | % |
| 2.32 | % |
| 2.31 | % |
| 1.95 | % |
| 1.92 | % |
|
| |||||||||||||||
|
|
|
|
|
|
|
|
|
|
|
|
|
|
|
|
|
Supplemental Data |
|
|
|
|
|
|
|
|
|
|
|
|
|
|
|
|
Net assets, end of year (000) |
| $ | 2,363,984 |
| $ | 2,278,659 |
| $ | 1,953,848 |
| $ | 3,721,171 |
| $ | 2,810,633 |
|
|
| |||||||||||||||
Portfolio turnover |
|
| 5 | % |
| 7 | % |
| 8 | % |
| 4 | % |
| 4 | % |
|
| |||||||||||||||
|
|
|
See Notes to Financial Statements. |
|
|
30 | BLACKROCK INDEX EQUITY PORTFOLIO | DECEMBER 31, 2010 |
1. Organization and Significant Accounting Policies:
Master S&P 500 Index Series (the “Series”), a non-diversified, open-end management investment company, is a series of Quantitative Master Series LLC (the “Master LLC”).The Master LLC is registered as an investment company under the Investment Company Act of 1940, as amended (the “1940 Act”), and is organized as a Delaware limited liability company. The Master LLC’s Limited Liability Company Agreement permits the Board of Directors of the Master LLC (the “Board”) to issue non-transferable interests, subject to certain limitations. The Series’ financial statements are prepared in conformity with accounting principles generally accepted in the United States of America, which may require management to make estimates and assumptions that affect the reported amounts and disclosures in the financial statements. Actual results could differ from those estimates.
The following is a summary of significant accounting policies followed by the Series:
Valuation: The Series fair values its financial instruments at market value using independent dealers or pricing services under policies approved by the Board. Equity investments traded on a recognized securities exchange or the NASDAQ Global Market System (“NASDAQ”) are valued at the last reported sale price that day or the NASDAQ official closing price, if applicable. For equity investments traded on more than one exchange, the last reported sale price on the exchange where the stock is primarily traded is used. Equity investments traded on a recognized exchange for which there were no sales on that day are valued at the last available bid price. If no bid price is available, the prior day’s price will be used, unless it is determined that such prior day’s price no longer reflects the fair value of the security. Financial futures contracts traded on exchanges are valued at their last sale price. Investments in open-end registered investment companies are valued at net asset value each business day. Short-term securities with remaining maturities of 60 days or less may be valued at amortized cost, which approximates fair value.
The Series values its investments in BlackRock Liquidity Series, LLC Money Market Series (the “Money Market Series”) at fair value, which is ordinarily based upon its pro rata ownership in the net assets of the underlying fund. The Money Market Series seeks current income consistent with maintaining liquidity and preserving capital. Although the Money Market Series is not registered under the 1940 Act, its investments will follow the parameters of investments by a money market fund that is subject to Rule 2a-7 promulgated by the Securities and Exchange Commission (“SEC”) under the 1940 Act. The Series may withdraw up to 25% of its investment daily, although the manager of the Money Market Series, in its sole discretion, may permit an investor to withdraw more than 25% on any one day.
In the event that application of these methods of valuation results in a price for an investment which is deemed not to be representative of the market value of such investment or is not available, the investment will be valued in accordance with a policy approved by the Board as reflecting fair value (“Fair Value Assets”). When determining the price for Fair Value Assets, the investment advisor and/or the sub-advisor seeks to determine the price that the Series might reasonably expect to receive from the current sale of that asset in an arm’s-length transaction. Fair value determinations shall be based upon all available factors that the investment advisor and/or sub-advisor deems relevant. The pricing of all Fair Value Assets is subsequently reported to the Board or a committee thereof.
Segregation and Collateralization: In cases in which the 1940 Act and the interpretive positions of the SEC require that the Series either delivers collateral or segregates assets in connection with certain investments (e.g., financial futures contracts) the Series will, consistent with SEC rules and/or certain interpretive letters issued by the SEC, segregate collateral or designate on its books and records cash or other liquid securities having a market value at least equal to the amount that would otherwise be required to be physically segregated. Furthermore, based on requirements and agreements with certain exchanges and third party broker-dealers, each party has requirements to deliver/deposit securities as collateral for certain investments.
Investment Transactions and Investment Income: For financial reporting purposes, investment transactions are recorded on the dates the transactions are entered into (the trade dates). Realized gains and losses on investment transactions are determined on the identified cost basis. Dividend income is recorded on the ex-dividend dates. Upon notification from issuers, some of the dividend income received from a real estate investment trust may be redesignated as a reduction of cost of the related investment and/or realized gain. Interest income, including amortization and accretion of premiums and discounts on debt securities, is recognized on the accrual basis.
Securities Lending: The Series may lend securities to financial institutions that provide cash as collateral, which will be maintained at all times in an amount equal to at least 100% of the current market value of the loaned securities. The market value of the loaned securities is determined at the close of business of the Series and any additional required collateral is delivered to the Series on the next business day. Securities lending income, as disclosed in the Statement of Operations, represents the income earned from the investment of the cash collateral, net of rebates paid to, or fees paid by, borrowers and less the fees paid to the securities lending agent. During the term of the loan, the Series earns dividends and
|
|
|
|
See Notes to Financial Statements. | |||
| BLACKROCK INDEX EQUITY PORTFOLIO | DECEMBER 31, 2010 | 31 |
|
|
|
|
Notes to Financial Statements (continued) | Master S&P 500 Index Series |
interest on the securities loaned. Loans of securities are terminable at any time and the borrower, after notice, is required to return borrowed securities within the standard time period for settlement of securities transactions. In the event that the borrower defaults on its obligation to return borrowed securities because of insolvency or for any other reason, the Series could experience delays and costs in gaining access to the collateral. The Series also could suffer a loss if the value of an investment purchased with cash collateral falls below the market value of loaned securities or if the value of an investment purchased with cash collateral falls below the value of the original cash collateral received.
Income Taxes: The Series is classified as a partnership for federal income tax purposes. As such, each investor in the Series is treated as the owner of its proportionate share of the net assets, income, expenses and realized and unrealized gains and losses of the Series. Therefore, no federal income tax provision is required. It is intended that the Series’ assets will be managed so an investor in the Series can satisfy the requirements of Subchapter M of the Internal Revenue Code of 1986, as amended.
The Series files US federal and various state and local tax returns. No income tax returns are currently under examination. The statute of limitations on the Series’ US federal tax returns remains open for each of the four years ended December 31, 2010. The statutes of limitations on the Series’ state and local tax returns may remain open for an additional year depending upon the jurisdiction. Management does not believe there are any uncertain tax positions that require recognition of a tax liability.
Other: Expenses directly related to the Series are charged to that Series. Other operating expenses shared by several funds are pro rated among those funds on the basis of relative net assets or other appropriate methods. The Series has an arrangement with the custodian whereby fees may be reduced by credits earned on uninvested cash balances, which if applicable are shown as fees paid indirectly in the Statement of Operations. The custodian imposes fees on overdrawn cash balances, which can be offset by accumulated credits earned or may result in additional custody charges.
2. Derivative Financial Instruments:
The Series engages in various portfolio investment strategies using derivative contracts both to increase the return of the Series and to economically hedge, or protect, its exposure to certain risks such as equity risk. These contracts may be transacted on an exchange.
Losses may arise if the value of the contract decreases due to an unfavorable change in the market rates or values of the underlying instrument or if the counterparty does not perform under the contract. Counterparty risk related to exchange-traded financial futures contracts is deemed to be minimal due to the protection against defaults provided by the exchanges on which these contracts trade.
Financial Futures Contracts: The Series purchases or sells financial futures contracts and options on financial futures contracts to gain exposure to, or economically hedge against, changes in the value of equity securities (equity risk). Financial futures contracts are agreements between the Series and counterparty to buy or sell a specific quantity of an underlying instrument at a specified price and at a specified date. Depending on the terms of the particular contract, futures contracts are settled either through physical delivery of the underlying instrument on the settlement date or by payment of a cash settlement amount on settlement date. Pursuant to the contract, the Series agrees to receive from or pay to the broker an amount of cash equal to the daily fluctuation in value of the contract. Such receipts or payments are known as margin variation and are recorded by the Series as unrealized gains or losses. When the contract is closed, the Series records a realized gain or loss equal to the difference between the value of the contract at the time it was opened and the value at the time it was closed. The use of financial futures transactions involves the risk of an imperfect correlation in the movements in the price of financial futures contracts, interest rates and the underlying assets.
|
|
|
|
|
|
|
|
Derivative Instruments Categorized by Risk Exposure: |
|
|
|
|
|
|
|
Fair Value of Derivative Instruments as of December 31, 2010 | |||||||
| |||||||
|
| Asset Derivatives |
| ||||
|
|
| |||||
|
| Statement of |
| Value |
| ||
Equity contracts |
|
| Net |
| $ | 10,653 |
|
|
|
* | Includes cumulative appreciation/depreciation of financial futures contracts as reported in the Schedule of Investments. Only current day’s margin variation is reported within the Statement of Assets and Liabilities. |
|
|
|
|
|
The Effect of Derivative Instruments in the Statement of Operations | ||||
Year Ended December 31, 2010 | ||||
| ||||
|
| Net Realized Gain From |
| |
|
| |||
|
| Financial Futures Contracts |
| |
|
| |||
Equity contracts |
| $ | 1,035,859 |
|
|
| Net Change in Unrealized |
| |
|
| |||
|
| Financial Futures Contracts |
| |
|
| |||
Equity contracts |
| $ | 15,292 |
|
|
|
|
32 | BLACKROCK INDEX EQUITY PORTFOLIO | DECEMBER 31, 2010 |
|
|
|
|
Notes to Financial Statements (continued) | Master S&P 500 Index Series |
For the year ended December 31, 2010, the average quarterly balances of outstanding derivative financial instruments were as follows:
|
|
|
|
|
Financial futures contracts: |
|
|
|
|
Average number of contracts purchased |
|
| 280 |
|
Average notional value of contracts purchased |
| $ | 18,105,990 |
|
3. Investment Management Agreement and Other Transactions with Affiliates:
The PNC Financial Services Group, Inc. (“PNC”), Bank of America Corporation (“BAC”) and Barclays Bank PLC (“Barclays”) are the largest stockholders of BlackRock, Inc. (“BlackRock”). Due to the ownership structure, PNC is an affiliate of the Series for 1940 Act purposes, but BAC and Barclays are not.
The Master LLC, on behalf of the Series, entered into an Investment Management Agreement with BlackRock Advisors, LLC (the “Manager”), the Series’ investment advisor, an indirect, wholly owned subsidiary of BlackRock, to provide investment advisory and administration services.
The Manager is responsible for the management of the Series’ portfolio and provides the necessary personnel, facilities, equipment and certain other services necessary to the operations of the Series. For such services, the Series pays the Manager a monthly fee at an annual rate of 0.01% of the average daily value of the Series’ net assets.
Effective June 1, 2010, the Manager contractually agreed to waive its investment advisory fee by 0.005% of the average daily value of the Series’ net assets. The Manager has agreed not to reduce or discontinue this contractual waiver until May 1, 2011 unless approved by the Board, including a majority of the non-interested Directors. Prior to June 1, 2010, the Manager had entered into an agreement which provided that the investment advisory fee for the Series, when combined with the administrative fee of BlackRock S&P 500 Index Fund would not exceed 0.25% of average daily net assets. As a result, the Series paid a monthly fee at an annual rate of 0.005% of the average daily value of the Series’ net assets. For the year ended December 31, 2010, the Manager waived $113,292, which is included in fees waived by advisor in the Statement of Operations.
The Manager voluntarily agreed to waive its investment advisory fees by the amount of investment advisory fees the Series pays to the Manager indirectly through its investment in affiliated money market funds, however the Manager does not waive its investment advisory fees by the amount of investment advisory fees paid through the Series’ investment in other affiliated investment companies, if any. For the year ended December 31, 2010, the Series waived $10,021, which is or included in fees waived by advisor in the Statement of Operations.
The Manager entered into a sub-advisory agreement with BlackRock Investment Management, LLC (“BIM”), an affiliate of the Manager. The Manager pays BIM for services it provides, a monthly fee that is a percentage of the investment advisory fees paid by the Series to the Manager.
For the year ended December 31, 2010, the Series reimbursed the Manager $42,260 for certain accounting services, which are included in accounting services in the Statement of Operations.
The Master LLC, on behalf of the Series, received an exemptive order from the SEC permitting it, among other things, to pay an affiliated securities lending agent a fee based on a share of the income derived from the securities lending activities and has retained BIM as the securities lending agent. BIM may, on behalf of the Series, invest cash collateral received by the Series for such loans, among other things, in a private investment company managed by the Manager or in registered money market funds advised by the Manager or its affiliates. The market value of securities on loan and the value of the related collateral, if applicable are shown in the Statement of Assets and Liabilities as securities loaned and collateral on securities loaned at value, respectively. The cash collateral invested by BIM is disclosed in the Schedule of Investments. The share of income earned by the Series on such investments is shown as securities lending — affiliated in the Statement of Operations. For the year ended December 31, 2010, BIM received $50,457 in securities lending agent fees related to securities lending activities for the Series.
Certain officers and/or directors of the Master LLC are officers and/or directors of BlackRock or its affiliates.
4. Investments:
Purchases and sales of investments, excluding short-term securities for the year ended December 31, 2010, were $104,823,718 and $280,419,809, respectively.
5. Borrowings:
The Master LLC, on behalf of the Series, along with certain other funds managed by the Manager and its affiliates, is a party to a $500 million credit agreement with a group of lenders, which expired in November 2010. The Series may borrow under the credit agreement to fund investor withdrawals. Effective November 2009, the credit agreement had the following terms: 0.02% upfront fee on the aggregate commitment amount which was allocated to the Series based on its net assets as of October 31, 2009, a commitment fee of 0.10% per annum based on the Series’ pro rata share of the unused portion of the credit agreement and interest at a rate equal to the higher of (a) the one-month LIBOR plus 1.25% per annum and (b) the Fed Funds rate plus 1.25% per annum on amounts borrowed. In addition, the Series paid administration and
|
|
|
|
| BLACKROCK INDEX EQUITY PORTFOLIO | DECEMBER 31, 2010 | 33 |
|
|
|
|
Notes to Financial Statements (concluded) | Master S&P 500 Index Series |
arrangement fees which were allocated to the Series based on its net assets as of October 31, 2009. Effective November 2010, the credit agreement was renewed until November 2011 with the following terms: a commitment fee of 0.08% per annum based on the Series’ pro rata share of the unused portion of the credit agreement and interest at a rate equal to the higher of (a) the one-month LIBOR plus 1.00% per annum and (b) the Fed Funds rate plus 1.00% per annum on amounts borrowed. In addition, the Series paid administration and arrangement fees which were allocated to the Series based on its net assets as of October 31, 2010. The Series did not borrow under the credit agreement during the year ended December 31, 2010.
6. Market and Credit Risk:
In the normal course of business, the Series invests in securities and enters into transactions where risks exist due to fluctuations in the market (market risk) or failure of the issuer of a security to meet all its obligations (issuer credit risk). The value of securities held by the Series may decline in response to certain events, including those directly involving the issuers whose securities are owned by the Series; conditions affecting the general economy; overall market changes; local, regional or global political, social or economic instability; and currency and interest rate and price fluctuations. Similar to issuer credit risk, the Series may be exposed to counter-party credit risk, or the risk that an entity with which the Series has unsettled or open transactions may fail to or be unable to perform on its commitments. The Series manages counterparty credit risk by entering into transactions only with counterparties that it believes have the financial resources to honor their obligations and by monitoring the financial stability of those counterparties. Financial assets, which potentially expose the Series to market, issuer and counterparty credit risks, consist principally of financial instruments and receivables due from counterparties. The extent of the Series’ exposure to market, issuer and counterparty credit risks with respect to these financial assets is generally approximated by their value recorded in the Series’ Statement of Assets and Liabilities, less any collateral held by the Series.
7. Subsequent Events:
Management has evaluated the impact of all subsequent events on the Series through the date the financial statements were issued and has determined that there were no subsequent events requiring adjustment or additional disclosure in the financial statements.
|
|
|
34 | BLACKROCK INDEX EQUITY PORTFOLIO | DECEMBER 31, 2010 |
To the Investors and Board of Directors of Quantitative Master Series LLC:
We have audited the accompanying statement of assets and liabilities, including the schedule of investments, of Master S&P 500 Index Series, one of the portfolios constituting Quantitative Master Series LLC, (the “Master LLC”) as of December 31, 2010, and the related statement of operations for the year then ended, the statements of changes in net assets for each of the two years in the period then ended, and the financial highlights for each of the five years in the period then ended. These financial statements and financial highlights are the responsibility of the Master LLC’s management. Our responsibility is to express an opinion on these financial statements and financial highlights based on our audits.
We conducted our audits in accordance with the standards of the Public Company Accounting Oversight Board (United States). Those standards require that we plan and perform the audit to obtain reasonable assurance about whether the financial statements and financial highlights are free of material misstatement. The Master LLC is not required to have, nor were we engaged to perform, an audit of its internal control over financial reporting. Our audits included consideration of internal control over financial reporting as a basis for designing audit procedures that are appropriate in the circumstances, but not for the purpose of expressing an opinion on the effectiveness of the Master LLC’s internal control over financial reporting. Accordingly, we express no such opinion. An audit also includes examining, on a test basis, evidence supporting the amounts and disclosures in the financial statements, assessing the accounting principles used and significant estimates made by management, as well as evaluating the overall financial statement presentation. Our procedures included confirmation of securities owned as of December 31, 2010, by correspondence with the custodian and brokers; where replies were not received from brokers, we performed other auditing procedures. We believe that our audits provide a reasonable basis for our opinion.
In our opinion, the financial statements and financial highlights referred to above present fairly, in all material respects, the financial position of Master S&P 500 Index Series of Quantitative Master Series LLC as of December 31, 2010, the results of its operations for the year then ended, the changes in its net assets for each of the two years in the period then ended, and the financial highlights for each of the five years in the period then ended, in conformity with accounting principles generally accepted in the United States of America.
Deloitte & Touche LLP
Princeton, New Jersey
February 28, 2011
|
|
|
|
| BLACKROCK INDEX EQUITY PORTFOLIO | DECEMBER 31, 2010 | 35 |
|
|
|
|
|
|
|
|
|
|
|
Name, Address |
| Position(s) |
| Length |
| Principal Occupation(s) During Past Five Years |
| Number of BlackRock- |
| Public |
Non-Interested Directors1 |
|
|
|
|
|
| ||||
Ronald W. Forbes |
| Co-Chair of the Board and Director |
| Since |
| Professor Emeritus of Finance, School of Business, State University of New York at Albany since 2000. |
| 36 RICs consisting of 95 Portfolios |
| None |
Rodney D. Johnson |
| Co-Chair of the Board and Director |
| Since |
| President, Fairmount Capital Advisors, Inc. since 1987; Director, Fox Chase Cancer Center since 2004; Member of the Archdiocesan Investment Committee of the Archdiocese of Philadelphia since 2004; Director, The Committee of Seventy (civic) since 2006. |
| 36 RICs consisting of 95 Portfolios |
| None |
David O. Beim |
| Director |
| Since |
| Professor of Finance and Economics at the Columbia University Graduate School of Business since 1991; Trustee, Phillips Exeter Academy since 2002; Chairman, Wave Hill, Inc. (public garden and cultural center) from 1990 to 2006. |
| 36 RICs consisting of 95 Portfolios |
| None |
Dr. Matina S. Horner |
| Director |
| Since |
| Executive Vice President of Teachers Insurance and Annuity Association and College Retirement Equities Fund from 1989 to 2003. |
| 36 RICs consisting of 95 Portfolios |
| NSTAR (electric and gas utility) |
Herbert I. London |
| Director and Member of the Audit Committee |
| Since |
| Professor Emeritus, New York University since 2005; John M. Olin Professor of Humanities, New York University from 1993 to 2005 and Professor thereof from 1980 to 2005; President, Hudson Institute (policy research organization) since 1997 and Trustee thereof since 1980; Chairman of the Board of Trustees for Grantham University since 2006; Director, InnoCentive, Inc. (strategic solutions company) since 2005; Director, Cerego, LLC (software development and design) since 2005. |
| 36 RICs consisting of 95 Portfolios |
| AIMS Worldwide, Inc. (marketing) |
Cynthia A. Montgomery |
| Director |
| Since |
| Professor, Harvard Business School since 1989; Director, Harvard Business School Publishing since 2005; Director, McLean Hospital since 2005. |
| 36 RICs consisting of 95 Portfolios |
| Newell Rubbermaid, Inc. (manufacturing) |
Joseph P. Platt |
| Director |
| Since |
| Director, The West Penn Allegheny Health System (a not-for-profit health system) since 2008; Director, Jones and Brown (Canadian insurance broker) since 1998; General Partner, Thorn Partners, LP (private investment) since 1998; Partner, Amarna Corporation, LLC (private investment company) from 2002 to 2008. |
| 36 RICs consisting of 95 Portfolios |
| Greenlight Capital Re, Ltd. (reinsurance company); WQED Multi-Media (public broadcasting not-for-profit) |
Robert C. Robb, Jr. |
| Director |
| Since |
| Partner, Lewis, Eckert, Robb and Company (management and financial consulting firm) since 1981. |
| 36 RICs consisting of 95 Portfolios |
| None |
Toby Rosenblatt |
| Director |
| Since |
| President, Founders Investments Ltd. (private investments) since 1999; Director, College Access Foundation of California (philanthropic foundation) since 2009; Director, Forward Management, LLC since 2007; Director, The James Irvine Foundation (philanthropic foundation) from 1998 to 2008. |
| 36 RICs consisting of 95 Portfolios |
| A.P. Pharma, Inc. (specialty pharmaceuticals) |
|
|
|
36 | BLACKROCK INDEX EQUITY PORTFOLIO | DECEMBER 31, 2010 |
|
|
Officers and Directors (continued) |
|
|
|
|
|
|
|
|
|
|
|
|
Name, Address |
| Position(s) |
| Length |
| Principal Occupation(s) During Past Five Years |
| Number of BlackRock- |
| Public | |
Non-Interested Directors1 (concluded) |
|
| |||||||||
Kenneth L. Urish |
| Chair of the Audit Committee and Director |
| Since |
| Managing Partner, Urish Popeck & Co., LLC (certified public accountants and consultants) since 1976; Chairman Elect of the Professional Ethics Committee of the Pennsylvania Institute of Certified Public Accountants and Committee Member thereof since 2007; Member of External Advisory Board, The Pennsylvania State University Accounting Department since 2001; Trustee, The Holy Family Foundation from 2001 to 2009; President and Trustee, Pittsburgh Catholic Publishing Associates from 2003 to 2008; Director, Inter-Tel from 2006 to 2007. |
| 36 RICs consisting of 95 Portfolios |
| None | |
Frederick W. Winter |
| Director and Member of the Audit Committee |
| Since |
| Professor and Dean Emeritus of the Joseph M. Katz School of Business, University of Pittsburgh since 2005 and Dean thereof from 1997 to 2005; Director, Alkon Corporation (pneumatics) since 1992; Director, Tippman Sports (recreation) since 2005; Director, Indotronix International (IT services) from 2004 to 2008. |
| 36 RICs consisting of 95 Portfolios |
| None | |
|
| ||||||||||
|
| 1 | Directors serve until their resignation, removal or death, or until December 31 of the year in which they turn 72. The Board has approved one-year extensions in terms of Directors who turn 72 prior to December 31, 2013. | ||||||||
|
|
|
|
|
|
|
|
|
|
|
|
|
| 2 | Date shown is the earliest date a person has served as a director for the Fund/Master LLC covered by this annual report. Following the combination of Merrill Lynch Investment Managers, L.P. (“MLIM”) and BlackRock, Inc. (“BlackRock”) in September 2006, the various legacy MLIM and legacy BlackRock Fund boards were realigned and consolidated into three new Fund boards in 2007. As a result, although the chart shows certain directors as joining the Fund/Master LLC board in 2007, each director first became a member of the board of other legacy MLIM or legacy BlackRock Funds as follows: David O. Beim, 1998; Ronald W. Forbes, 1977; Dr. Matina S. Horner, 2004; Rodney D. Johnson, 1995; Herbert I. London, 1987; Cynthia A. Montgomery, 1994; Joseph P. Platt, 1999; Robert C. Robb, Jr., 1998; Toby Rosenblatt, 2005; Kenneth L. Urish, 1999; and Frederick W. Winter, 1999. | ||||||||
|
|
|
|
|
|
|
|
|
|
|
|
Interested Directors3 | |||||||||||
Richard S. Davis |
| Director |
| Since |
| Managing Director, BlackRock, Inc. since 2005; Chief Executive Officer, State Street Research & Management Company from 2000 to 2005; Chairman of the Board of Directors, State Street Research Mutual Funds from 2000 to 2005. |
| 169 RICs consisting of 289 Portfolios |
| None | |
Henry Gabbay |
| Director |
| Since |
| Consultant, BlackRock, Inc. from 2007 to 2008; Managing Director, BlackRock, Inc. from 1989 to 2007; Chief Administrative Officer, BlackRock Advisors, LLC from 1998 to 2007; President of BlackRock Funds and BlackRock Bond Allocation Target Shares from 2005 to 2007 and Treasurer of certain closed-end funds in the BlackRock fund complex from 1989 to 2006. |
| 169 RICs consisting of 289 Portfolios |
| None | |
|
| ||||||||||
|
| 3 | Mr. Davis is an “interested person” as defined in the 1940 Act, of the Fund/Master LLC based on his position with BlackRock, Inc. and its affiliates. Mr. Gabbay is an “interested person” of the Fund/Master LLC based on his former positions with BlackRock, Inc. and its affiliates as well as his ownership of BlackRock, Inc. and The PNC Financial Services Group, Inc. securities. Directors serve until their resignation, removal or death, or until December 31 of the year in which they turn 72. | ||||||||
|
|
|
BLACKROCK INDEX EQUITY PORTFOLIO | DECEMBER 31, 2010 | 37 |
|
|
Officers and Directors (continued) |
|
|
|
|
|
|
|
|
|
|
|
Name, Address |
| Position(s) |
| Length |
| Principal Occupation(s) During Past Five Years | ||||
Officers1 | ||||||||||
John M. Perlowski |
| President and Chief Executive Officer |
| Since |
| Managing Director of BlackRock, Inc. since 2009; Global Head of BlackRock Fund Administration since 2009; Managing Director and Chief Operating Officer of the Global Product Group at Goldman Sachs Asset Management, L.P. from 2003 to 2009; Treasurer of Goldman Sachs Mutual Funds from 2003 to 2009 and Senior Vice President thereof from 2007 to 2009; Director of Goldman Sachs Offshore Funds from 2002 to 2009. | ||||
Richard Hoerner, CFA2 |
| Vice President |
| Since |
| Managing Director of BlackRock, Inc. since 2000; Co-head of BlackRock’s Cash Management Portfolio Management Group since 2002; Member of the Cash Management Group Executive Committee since 2005. | ||||
Brendan Kyne |
| Vice President |
| Since |
| Managing Director of BlackRock, Inc. since 2010; Director of BlackRock, Inc. from 2008 to 2009; Head of Product Development and Management for BlackRock’s U.S. Retail Group since 2009, Co-head thereof from 2007 to 2009; Vice President of BlackRock, Inc. from 2005 to 2008. | ||||
Simon Mendelson2 |
| Vice President |
| Since |
| Managing Director of BlackRock, Inc. since 2005; Co-head of the Global Cash and Securities Lending Group since 2010; Chief Operating Officer and Head of the Global Client Group for BlackRock’s Global Cash Management Business from 2007 to 2010; Head of BlackRock’s Strategy and Development Group from 2005 to 2007; Partner of McKinsey & Co. from 1997 to 2005. | ||||
Brian Schmidt |
| Vice President |
| Since |
| Managing Director of BlackRock, Inc. since 2004; Various positions with U.S. Trust Company from 1991 to 2003 including Director from 2001 to 2003 and Senior Vice President from 1998 to 2003; Vice President, Chief Financial Officer and Treasurer of Excelsior Funds, Inc., Excelsior Tax-Exempt Funds, Inc. and Excelsior Funds Trust from 2001 to 2003. | ||||
Christopher Stavrakos, |
| Vice President |
| Since |
| Managing Director of BlackRock, Inc. since 2006; Co-head of BlackRock’s Cash Management Portfolio Management Group since 2006; Senior Vice President, CIO, and Director of Liability Management for the Securities Lending Group at Mellon Bank from 1999 to 2006. | ||||
Neal Andrews |
| Chief Financial Officer |
| Since |
| Managing Director of BlackRock, Inc. since 2006; Senior Vice President and Line of Business Head of Fund Accounting and Administration at PNC Global Investment Servicing (U.S.) Inc. from 1992 to 2006. | ||||
Jay Fife |
| Treasurer |
| Since |
| Managing Director of BlackRock, Inc. since 2007; Director of BlackRock, Inc. in 2006; Assistant Treasurer of the Merrill Lynch Investment Managers, L.P. (“MLIM”) and Fund Asset Management, L.P.-advised funds from 2005 to 2006; Director of MLIM Fund Services Group from 2001 to 2006. | ||||
|
|
|
38 | BLACKROCK INDEX EQUITY PORTFOLIO | DECEMBER 31, 2010 |
|
|
Officers and Directors (concluded) |
|
|
|
|
|
|
|
|
|
|
|
|
Name, Address |
| Position(s) |
| Length |
| Principal Occupation(s) During Past Five Years | |||||
Officers1 (concluded) | |||||||||||
Brian Kindelan |
| Chief Compliance Officer |
| Since |
| Chief Compliance Officer of the BlackRock-advised funds since 2007; Managing Director and Senior Counsel of BlackRock, Inc. since 2005. | |||||
Ira Shapiro |
| Secretary |
| Since |
| Managing Director of BlackRock, Inc. since 2009; Managing Director and Associate General Counsel of Barclays Global Investors from 2008 to 2009 and Principal thereof from 2004 to 2008. | |||||
|
| ||||||||||
|
| 1 | Officers of the Fund/Master LLC serve at the pleasure of the Board of Directors. | ||||||||
|
| 2 | Vice President of the Fund only. | ||||||||
|
| ||||||||||
|
| Further information about the Fund’s/Master LLC’s Officers and Directors is available in the Fund’s/Master LLC’s Statement of Additional Information, which can be obtained without charge by calling (800) 441-7762. | |||||||||
Investment Advisor
BlackRock Advisors, LLC
Wilmington, DE 19809
Sub-Advisor
BlackRock Investment
Management, LLC
Plainsboro, NJ 08536
Custodian
PFPC Trust Company3
Philadelphia, PA 19153
State Street Bank
and Trust Company4
Boston, MA 02111
Transfer Agent
BNY Mellon Investment
Servicing (US) Inc.
Wilmington, DE 19809
Accounting Agent
State Street Bank
and Trust Company
Princeton, NJ 08540
Independent Registered
Public Accounting Firm
Deloitte & Touche LLP
Princeton, NJ 08540
Distributor
BlackRock
Investments, LLC
New York, NY 10022
Legal Counsel
Sidley Austin LLP
New York, NY 10019
Address of the Fund
100 Bellevue Parkway
Wilmington, DE 19809
|
|
3 | For BlackRock Index Equity Portfolio. |
|
|
4 | For Master S&P 500 Index Series. |
|
|
|
|
|
|
| Effective September 24, 2010, John M. Perlowski became President and Chief Executive Officer of the Fund and the Master LLC. |
|
|
|
|
| Effective November 16, 2010, Ira Shapiro became Secretary of the Fund and the Master LLC. |
|
|
|
|
|
|
|
BLACKROCK INDEX EQUITY PORTFOLIO | DECEMBER 31, 2010 | 39 |
|
General Information |
Electronic Delivery
Electronic copies of most financial reports and prospectuses are available on the Fund’s website or shareholders can sign up for e-mail notifications of quarterly statements, annual and semi-annual reports and prospectuses by enrolling in the Fund’s electronic delivery program.
To enroll:
Shareholders Who Hold Accounts with Investment Advisors, Banks or Brokerages:
Please contact your financial advisor. Please note that not all investment advisors, banks or brokerages may offer this service.
Shareholders Who Hold Accounts Directly with BlackRock:
1) Access the BlackRock website at
http://www.blackrock.com/edelivery
2) Select “eDelivery” under the “More Information” section
3) Log into your account
Householding
The Portfolio will mail only one copy of shareholder documents, including prospectuses, annual and semi-annual reports and proxy statements, to shareholders with multiple accounts at the same address. This practice is commonly called “householding” and is intended to reduce expenses and eliminate duplicate mailings of shareholder documents. Mailings of your shareholder documents may be householded indefinitely unless you instruct us otherwise. If you do not want the mailing of these documents to be combined with those for other members of your household, please call (800) 441-7762.
Availability of Quarterly Portfolio Schedule of Investments
The Portfolio/Series files its complete schedule of portfolio holdings with the Securities and Exchange Commission (the “SEC”) for the first and third quarters of its fiscal year on Form N-Q. The Portfolio’s/Series’ Forms N-Q are available on the SEC’s website at http://www.sec.gov and may also be reviewed and copied at the SEC’s Public Reference Room in Washington, D.C. Information on the operation of the Public Reference Room may be obtained by calling (800) SEC-0330. The Portfolio’s/Series’ Forms N-Q may also be obtained upon request and without charge by calling (800) 441-7762.
Availability of Proxy Voting Policies and Procedures
A description of the policies and procedures that the Portfolio/Series uses to determine how to vote proxies relating to portfolio securities is available (1) without charge, upon request, by calling (800) 441-7762; (2) at http://www.blackrock.com; and (3) on the SEC’s website at http://www.sec.gov.
Availability of Proxy Voting Record
Information on how the Portfolio/Series voted proxies relating to securities held in the portfolio during the most recent 12-month period ended June 30 is available upon request and without charge (1) at http://www.blackrock.com or by calling (800) 441-7762 and (2) on the SEC’s website at http://www.sec.gov.
|
|
|
40 | BLACKROCK INDEX EQUITY PORTFOLIO | DECEMBER 31, 2010 |
|
|
|
|
Additional Information (continued) |
|
|
Shareholder Privileges |
Account Information
Call us at (800) 441-7762 from 8:00 AM to 6:00 PM EST on any business day to get information about your account balances, recent transactions and share prices. You can also reach us on the Web at http://www.blackrock.com/funds.
Automatic Investment Plans
Investor Class shareholders who want to invest regularly can arrange to have $50 or more automatically deducted from their checking or savings account and invested in any of the BlackRock funds.
Systematic Withdrawal Plans
Investor Class shareholders can establish a systematic withdrawal plan and receive periodic payments of $50 or more from their BlackRock funds, as long as their account balance is at least $10,000.
Retirement Plans
Shareholders may make investments in conjunction with Traditional, Rollover, Roth, Coverdell, Simple IRAs, SEP IRAs and 403(b) Plans.
|
|
|
|
| |||
| BLACKROCK INDEX EQUITY PORTFOLIO | DECEMBER 31, 2010 | 41 |
|
|
|
|
Additional Information (concluded) |
|
|
BlackRock Privacy Principles |
BlackRock is committed to maintaining the privacy of its current and former fund investors and individual clients (collectively, “Clients”) and to safeguarding their non-public personal information. The following information is provided to help you understand what personal information BlackRock collects, how we protect that information and why in certain cases we share such information with select parties.
If you are located in a jurisdiction where specific laws, rules or regulations require BlackRock to provide you with additional or different privacy-related rights beyond what is set forth below, then BlackRock will comply with those specific laws, rules or regulations.
BlackRock obtains or verifies personal non-public information from and about you from different sources, including the following: (i) information we receive from you or, if applicable, your financial intermediary, on applications, forms or other documents; (ii) information about your transactions with us, our affiliates, or others; (iii) information we receive from a consumer reporting agency; and (iv) from visits to our websites.
BlackRock does not sell or disclose to non-affiliated third parties any non-public personal information about its Clients, except as permitted by law or as is necessary to respond to regulatory requests or to service Client accounts. These non-affiliated third parties are required to protect the confidentiality and security of this information and to use it only for its intended purpose.
We may share information with our affiliates to service your account or to provide you with information about other BlackRock products or services that may be of interest to you. In addition, BlackRock restricts access to non-public personal information about its Clients to those BlackRock employees with a legitimate business need for the information. BlackRock maintains physical, electronic and procedural safeguards that are designed to protect the non-public personal information of its Clients, including procedures relating to the proper storage and disposal of such information.
|
|
|
42 | BLACKROCK INDEX EQUITY PORTFOLIO | DECEMBER 31, 2010 |
BlackRock offers a diverse lineup of open-end mutual funds crossing all investment styles and managed by experts in equity, fixed income and tax-exempt investing.
|
Equity Funds |
|
BlackRock All-Cap Energy & Resources Portfolio |
BlackRock Asset Allocation Portfolio† |
BlackRock Balanced Capital Fund† |
BlackRock Basic Value Fund |
BlackRock Capital Appreciation Fund |
BlackRock Energy & Resources Portfolio |
BlackRock Equity Dividend Fund |
BlackRock EuroFund |
BlackRock Focus Growth Fund |
BlackRock Focus Value Fund |
BlackRock Global Allocation Fund† |
BlackRock Global Dynamic Equity Fund |
BlackRock Global Emerging Markets Fund |
BlackRock Global Financial Services Fund |
BlackRock Global Growth Fund |
BlackRock Global Opportunities Portfolio |
BlackRock Global SmallCap Fund |
BlackRock Health Sciences Opportunities Portfolio |
BlackRock Healthcare Fund |
BlackRock Index Equity Portfolio* |
BlackRock International Fund |
BlackRock International Index Fund |
BlackRock International Opportunities Portfolio |
BlackRock International Value Fund |
BlackRock Large Cap Core Fund |
BlackRock Large Cap Core Plus Fund |
BlackRock Large Cap Growth Fund |
BlackRock Large Cap Value Fund |
BlackRock Latin America Fund |
BlackRock Mid-Cap Growth Equity Portfolio |
BlackRock Mid-Cap Value Equity Portfolio |
BlackRock Mid Cap Value Opportunities Fund |
BlackRock Natural Resources Trust |
BlackRock Pacific Fund |
BlackRock Science & Technology Opportunities Portfolio |
BlackRock Small Cap Core Equity Portfolio |
BlackRock Small Cap Growth Equity Portfolio |
BlackRock Small Cap Growth Fund II |
BlackRock Small Cap Index Fund |
BlackRock Small/Mid-Cap Growth Portfolio |
BlackRock S&P 500 Index Fund |
BlackRock S&P 500 Stock Fund |
BlackRock U.S. Opportunities Portfolio |
BlackRock Utilities and Telecommunications Fund |
BlackRock Value Opportunities Fund |
BlackRock World Gold Fund |
|
Fixed Income Funds |
|
BlackRock Bond Index Fund |
BlackRock Bond Portfolio |
BlackRock Emerging Market Debt Portfolio |
BlackRock Floating Rate Income Portfolio |
BlackRock GNMA Portfolio |
BlackRock Global Dividend Income Portfolio† |
BlackRock Government Income Portfolio |
BlackRock High Income Fund |
BlackRock High Yield Bond Portfolio |
BlackRock Income Portfolio† |
BlackRock Inflation Protected Bond Portfolio |
BlackRock Intermediate Government Bond Portfolio |
BlackRock International Bond Portfolio |
BlackRock Long Duration Bond Portfolio |
BlackRock Low Duration Bond Portfolio |
BlackRock Managed Income Portfolio |
BlackRock Multi-Sector Bond Portfolio |
BlackRock Short-Term Bond Fund |
BlackRock Strategic Income Opportunities Portfolio |
BlackRock Total Return Fund |
BlackRock Total Return Portfolio II |
BlackRock World Income Fund |
|
Municipal Bond Funds |
BlackRock AMT-Free Municipal Bond Portfolio |
BlackRock California Municipal Bond Fund |
BlackRock High Yield Municipal Fund |
BlackRock Intermediate Municipal Fund |
BlackRock Kentucky Municipal Bond Portfolio |
BlackRock Municipal Fund |
BlackRock National Municipal Fund |
BlackRock New Jersey Municipal Bond Fund |
BlackRock New York Municipal Bond Fund |
BlackRock Ohio Municipal Bond Portfolio |
BlackRock Pennsylvania Municipal Bond Fund |
BlackRock Short-Term Municipal Fund |
|
Target Risk & Target Date Funds† |
BlackRock Prepared Portfolios |
Conservative Prepared Portfolio |
Moderate Prepared Portfolio |
Growth Prepared Portfolio |
Aggressive Growth Prepared Portfolio |
|
BlackRock Lifecycle Prepared Portfolios |
2015 |
BlackRock LifePath Portfolios |
Retirement |
|
|
|
| * | See the prospectus for information on specific limitations on investments in the fund. |
| † | Mixed asset fund. |
BlackRock mutual funds are currently distributed by BlackRock Investments, LLC. You should consider the investment objectives, risks, charges and expenses of the funds under consideration carefully before investing. Each fund’s prospectus contains this and other information and is available at www.blackrock.com or by calling (800) 441-7762 or from your financial advisor. The prospectus should be read carefully before investing.
|
|
|
|
| BLACKROCK INDEX EQUITY PORTFOLIO | DECEMBER 31, 2010 | 43 |
This report is transmitted to shareholders only. It is not authorized for use as an offer of sale or a solicitation of an offer to buy shares of the Portfolio unless accompanied or preceded by the Portfolio’s current prospectus. Past performance results shown in this report should not be considered a representation of future performance. Investment return and principal value of shares will fluctuate so that shares, when redeemed, may be worth more or less than their original cost. Statements and other information herein are as dated and are subject to change.
|
|
|
|
|
|
#IE-12/10 |
|


Item 2 – | Code of Ethics – The registrant (or the “Fund”) has adopted a code of ethics, as of the end of the period covered by this report, applicable to the registrant’s principal executive officer, principal financial officer and principal accounting officer, or persons performing similar functions. During the period covered by this report, there have been no amendments to or waivers granted under the code of ethics. A copy of the code of ethics is available without charge at www.blackrock.com. |
|
|
Item 3 – | Audit Committee Financial Expert – The registrant’s board of directors or trustees, as applicable (the “board of directors”), has determined that (i) the registrant has the following audit committee financial expert serving on its audit committee and (ii) each audit committee financial expert is independent: |
| Kenneth L. Urish |
|
|
| Under applicable securities laws, a person determined to be an audit committee financial expert will not be deemed an “expert” for any purpose, including without limitation for the purposes of Section 11 of the Securities Act of 1933, as a result of being designated or identified as an audit committee financial expert. The designation or identification as an audit committee financial expert does not impose on such person any duties, obligations, or liabilities greater than the duties, obligations, and liabilities imposed on such person as a member of the audit committee and board of directors in the absence of such designation or identification. |
|
|
Item 4 – | Principal Accountant Fees and Services |
| (a) Audit Fees | (b) Audit-Related Fees1 | (c) Tax Fees2 | (d) All Other Fees3 | ||||
Entity Name | Current Fiscal Year End | Previous Fiscal Year End | Current Fiscal Year End | Previous Fiscal Year End | Current Fiscal Year End | Previous Fiscal Year End | Current Fiscal Year End | Previous Fiscal Year End |
BlackRock Index Equity Portfolio of BlackRock Funds | $6,800 | $6,800 | $0 | $0 | $6,100 | $21,100 | $126 | $1,028 |
Master S&P 500 Index Series of Quantitative Master Series LLC | $33,500 | $33,500 | $0 | $0 | $17,000 | $17,000 | $0 | $0 |
1 The nature of the services include assurance and related services reasonably related to the performance of the audit of financial statements not included in Audit Fees.
2 The nature of the services include tax compliance, tax advice and tax planning.
3 The nature of the services include a review of compliance procedures and attestation thereto.
| (e)(1) Audit Committee Pre-Approval Policies and Procedures: |
|
|
| The registrant’s audit committee (the “Committee”) has adopted policies and procedures with regard to the pre-approval of services. Audit, audit-related and tax compliance services provided to the registrant on an annual basis require specific pre-approval by the Committee. The Committee also must approve other non-audit services provided to the registrant and those non-audit services provided to the registrant’s affiliated service providers that relate directly to the operations and the financial reporting of the registrant. Certain of these non-audit services that the Committee believes are a) consistent with the SEC’s auditor independence rules and b) routine and recurring services that will not impair the independence of the independent accountants may be approved by the Committee without consideration on a specific case-by-case basis (“general pre-approval”). The term of any general pre-approval is 12 months from the date of the pre-approval, unless the Committee provides for a different period. Tax or other non-audit services provided to the registrant which have a direct impact on the operation or financial reporting of the registrant will only be deemed pre-approved provided that any individual project does not exceed $10,000 attributable to the registrant or $50,000 per project. For this purpose, multiple projects will be aggregated to determine if they exceed the previously mentioned cost levels. |
| Any proposed services exceeding the pre-approved cost levels will require specific pre-approval by the Committee, as will any other services not subject to general pre-approval (e.g., unanticipated but permissible services). The Committee is informed of each service approved subject to general pre-approval at the next regularly scheduled in-person board meeting. At this meeting, an analysis of such services is presented to the Committee for ratification. The Committee may delegate to the Committee Chairman the authority to approve the provision of and fees for any specific engagement of permitted non-audit services, including services exceeding pre-approved cost levels. |
|
|
| (e)(2) None of the services described in each of Items 4(b) through (d) were approved by the audit committee pursuant to paragraph (c)(7)(i)(C) of Rule 2-01 of Regulation S-X. |
|
|
| (f) Not Applicable |
|
|
| (g) Affiliates’ Aggregate Non-Audit Fees: |
Entity Name | Current Fiscal Year End | Previous Fiscal Year End |
BlackRock Index Equity Portfolio of BlackRock Funds | $17,003 | $424,628 |
Master S&P 500 Index Series of Quantitative Master Series LLC | $27,777 | $419,500 |
| (h) The registrant’s audit committee has considered and determined that the provision of non-audit services that were rendered to the registrant’s investment adviser (not including any non-affiliated sub-adviser whose role is primarily portfolio management and is subcontracted with or overseen by the registrant’s investment adviser), and any entity controlling, controlled by, or under common control with the investment adviser that provides ongoing services to the registrant that were not pre-approved pursuant to paragraph (c)(7)(ii) of Rule 2-01 of Regulation S-X is compatible with maintaining the principal accountant’s independence. |
|
|
| Regulation S-X Rule 2-01(c)(7)(ii) – $10,777, 0% |
|
|
Item 5 – | Audit Committee of Listed Registrants – Not Applicable |
|
|
Item 6 – | Investments |
| (a) The registrant’s Schedule of Investments is included as part of the Report to Stockholders filed under Item 1 of this form. |
| (b) Not Applicable due to no such divestments during the semi-annual period covered since the previous Form N-CSR filing. |
|
|
Item 7 – | Disclosure of Proxy Voting Policies and Procedures for Closed-End Management Investment Companies – Not Applicable |
|
|
Item 8 – | Portfolio Managers of Closed-End Management Investment Companies – Not Applicable |
|
|
Item 9 – | Purchases of Equity Securities by Closed-End Management Investment Company and Affiliated Purchasers – Not Applicable |
Item 10 – | Submission of Matters to a Vote of Security Holders – The registrant’s Nominating and Governance Committee will consider nominees to the board of directors recommended by shareholders when a vacancy becomes available. Shareholders who wish to recommend a nominee should send nominations which include biographical information and set forth the qualifications of the proposed nominee to the registrant’s Secretary. There have been no material changes to these procedures. |
|
|
Item 11 – | Controls and Procedures |
|
|
11(a) – | The registrant’s principal executive and principal financial officers or persons performing similar functions have concluded that the registrant’s disclosure controls and procedures (as defined in Rule 30a-3(c) under the Investment Company Act of 1940, as amended (the “1940 Act”)) are effective as of a date within 90 days of the filing of this report based on the evaluation of these controls and procedures required by Rule 30a-3(b) under the 1940 Act and Rule 15d-15(b) under the Securities Exchange Act of 1934, as amended. |
|
|
11(b) – | There were no changes in the registrant’s internal control over financial reporting (as defined in Rule 30a-3(d) under the 1940 Act) that occurred during the second fiscal quarter of the period covered by this report that have materially affected, or are reasonably likely to materially affect, the registrant’s internal control over financial reporting. |
|
|
Item 12 – | Exhibits attached hereto |
|
|
12(a)(1) – | Code of Ethics – See Item 2 |
|
|
12(a)(2) – | Certifications – Attached hereto |
|
|
12(a)(3) – | Not Applicable |
|
|
12(b) – | Certifications – Attached hereto |
| Pursuant to the requirements of the Securities Exchange Act of 1934 and the Investment Company Act of 1940, the registrant has duly caused this report to be signed on its behalf by the undersigned, thereunto duly authorized. | ||
|
| ||
| BlackRock Index Equity Portfolio of BlackRock Funds and Master S&P 500 Index Series of Quantitative Master Series LLC | ||
| By: | /s/John M. Perlowski | ||
| John M. Perlowski | |||
| Chief Executive Officer of | |||
| BlackRock Index Equity Portfolio of BlackRock Funds and Master S&P 500 Index Series of Quantitative Master Series LLC | |||
| Date: March 4, 2011 | |||
| Pursuant to the requirements of the Securities Exchange Act of 1934 and the Investment Company Act of 1940, this report has been signed below by the following persons on behalf of the registrant and in the capacities and on the dates indicated. | |||
| By: | /s/ John M. Perlowski | ||
| John M. Perlowski | |||
| Chief Executive Officer (principal executive officer) of | |||
| BlackRock Index Equity Portfolio of BlackRock Funds and Master S&P 500 Index Series of Quantitative Master Series LLC | |||
| Date: March 4, 2011 | |||
| By: | /s/ Neal J. Andrews | ||
| Neal J. Andrews | |||
| Chief Financial Officer (principal financial officer) of | |||
| BlackRock Index Equity Portfolio of BlackRock Funds and Master S&P 500 Index Series of Quantitative Master Series LLC | |||
| Date: March 4, 2011 | |||