
American Securitization Forum
Las Vegas, Nevada
January 29 – February 1, 2006

Forward looking disclosure
Certain matters discussed in this presentation may constitute forward-looking statements within the meaning of
the federal securities laws that inherently include certain risks and uncertainties. Actual results and the timing
of certain events could differ materially from those projected in or contemplated by the forward-looking
statements due to a number of factors, including our ability to generate sufficient liquidity on favorable terms;
the size and frequency of our securitizations; interest rate fluctuations on our assets that differ from our
liabilities; increases in prepayment or default rates on our mortgage assets; changes in assumptions regarding
estimated loan losses and fair value amounts; changes in origination and resale pricing of mortgage loans; our
compliance with applicable local, state and federal laws and regulations and the impact of new local, state or
federal legislation or regulations or court decisions on our operations; the initiation of margin calls under our
credit facilities; the ability of our servicing operations to maintain high performance standards and maintain
appropriate ratings from rating agencies; our ability to expand origination volume while maintaining an
acceptable level of overhead; our ability to adapt to and implement technological changes; the stability of
residential property values; the outcome of litigation or regulatory actions pending against us; the impact of
general economic conditions; and other risk factors that are from time to time included in our filings with the
SEC, including our 2005 Quarterly Report on Form 10-Q. Other factors not presently identified may also cause
actual results to differ. Management continuously updates and revises these estimates and assumptions based
on actual conditions experienced. It is not practicable to publish all revisions and, as a result, no one should
assume that results projected in or contemplated by the forward-looking statements will continue to be accurate
in the future. This presentation contains statistics and other data that in some cases have been obtained from,
or compiled from, information made available by service providers or included in publicly filed reports of other
entities. Although we believe this information to be reliable, we are not able to independently verify t
he accuracy thereof.
2

Overview
Founded: June, 1996
IPO: October, 1997 (NYSE: NFI)
$1.0 billion market cap; $564 million of GAAP equity
Top 20 residential mortgage ABS issuer
Current production run rate of $700-$900 million per month
Cost to originate historically in the 2.00%-2.50% range
Servicer rating of “Strong” by S&P
Completed 31 ABS transactions, total issuance over $26 billion
Disciplined underwriting approval through automated system
manages to a 3.5-5.0% (pre- MI) loss under normal market
conditions.
3

9/30/2005 Subprime Market Rankings
(in millions)
1
Ameriquest
$63,670
1
Ameriquest
$40,181
2
New Century
$39,553
2
New Century
$27,556
3
Countrywide
$32,457
3
Lehman Bros
$27,306
4
Option One
$30,190
4
Countrywide
$25,351
5
Fremont
$26,616
5
Option One
$18,350
6
WAMU
$26,314
6
Bear Stearns
$15,421
7
Wells Fargo
$22,770
7
CSFB
$15,370
8
First Franklin
$22,278
8
RBS/Greenwich
$14,641
9
HSBC
$17,990
9
WAMU
$14,399
10
GMAC-RFC
$15,339
10
WMC
$14,269
11
CitiFinancial
$13,571
11
First Franklin
$14,246
20
NovaStar Mortgage
$7,085
17
NovaStar Mortgage
$6,428
Source: Inside B&C Lending
Source: Inside B&C Lending
Originations
MBS Issuers
4

NovaStar Organizational Structure
NovaStar Financial, Inc. (NFI)
REIT
NFI Holding Corp.
Taxable REIT Subsidiary
NovaStar Mortgage, Inc. (NMI)
NovaStar Capital, Inc. (NCI)
Mortgage Banking
Servicing
Warehouse Lending
5

NovaStar Operating Strategy
NovaStar is structured as a REIT
Parent company does not pay corporate taxes
Focus is on being a portfolio investor vs. pure mortgage banking
Originate high margin, non-conforming residential mortgages
Service our own collateral (no third party servicing)
Use technology to be an efficient originator and servicer
Create mortgage securities with good risk-adjusted returns
from our loans through securitization
Use capital markets to price and manage risks
Interest rate risks hedged with swaps / caps
Credit risk managed through the purchase of deep MI
6

Origination Strategy
Primarily an A- wholesale lender
Vertical integration
Originator and end investor
Whole loan portfolio exceeding $14 billion
Centralized origination operation
Strive to be a low cost producer - cost to originate 2.00%-2.25%
Better risk controls - over 40% appraisal reviews
Manage underwriting - 100% prefunding audits
Diversify credit risk - deep MI
Focus on developing competitive advantages in every
channel in which we choose to operate
7

Distribution Channels
Wholesale
Production centers located in Cleveland, OH and Lake Forest, CA
400 person inside & outside sales force located in 40 states call on a
customer base of over 16,400 independent retail brokers
Compete on service, primarily a price taker
Correspondent
Sales force dedicated solely to the sourcing of closed loans
Focus is on the development of correspondent flow relationships and
purchase of mini bulk pools ($1-$20 million)
Attempt to create competitive advantages by offering small warehouse
lines and private labeling our origination system
Current production run rate of approx. $150-$200 million per quarter
8

Distribution Channels - Continued
Retail
Offices located in Columbia, MD and Kansas City, MO focusing
primarily on retention of existing portfolio
Total of 104 loan officers
Secondary focus on new business using primarily purchased leads
Also maintain a chain local branch in a few select markets
Current production run rate of approx. $350-$400 million per quarter
9

Production Mix by Channel
2002
2003
2004
2005
Channel
Actual
Actual
Actual
Actual
Independent Brokers
79%
67%
65%
75%
Retail
19%
28%
25%
16%
Correspondent
2%
5%
10%
9%
Total Nonconforming Production
$2.50 B
$5.25 B
$8.42 B
$9.28 B
10

Securitization History
2002
2003
2004
2005
Actual
Actual
Actual
Actual
Production
$2.50 B
$5.25 B
$8.42 B
$9.28 B
Underlying Deals
3
4
4
4
Resecuritizations
1
1
3
1
11

Non-Conforming Production
$0
$500
$1,000
$1,500
$2,000
$2,500
$3,000
Quarter
0.00%
0.50%
1.00%
1.50%
2.00%
2.50%
3.00%
3.50%
4.00%
Principal Originated
Cost to Originate
12

NovaStar Origination Practices
100% Pre-funding Audit (100% DISSCO / 40% full QC audit)
Quality/Fraud procedures for new and existing brokers
Watch list / Do not take list for 3rd party vendors
Quality Control - Identifies negative trends / provides feedback
5%-10% random review of all files within 30-45 days of funding
100% Appraisal Review
60% cleared by underwriter using AVMs or on-line data sources
(SiteXdata)
40% referred to on staff licensed appraisers
15% of those reviewed by staff appraisers have their value reduced
Predatory Lending Issues
We do not originate high cost loans (HOEPA or State High Cost loans)
Net tangible benefit test automated and performed on all eligible loans
Adhere to the FNMA fee test (5% max) on all loans where NovaStar acts
as the lender
13

Risks and Risk Management
Interest rate/prepayment
Hedging - match duration using swaps and caps
Prepayment/convexity - prepayment penalties
Portfolio is hedged within maximum exposure of 10% of equity
up/down 100 bps
Credit
Geographic diversification
Lender paid deep MI to 50-55% LTV
Common sense U/W and strong quality control
Servicing
Liquidity
$3.65 billion of borrowing capacity from 5 separate lenders
14

Servicing Overview
$14 billion portfolio representing 99,000 accounts
17th largest sub-prime servicer (as of 6/30/05; Source: Mortgage Servicing News)
Total staff of 260
17 years average experience among Management/Supervisors
Approved FHA, VA, Fannie Mae and Freddie Mac
seller/servicer
Rated by all three rating agencies
S&P: Strong
Moody’s: SQ2
Fitch: RSP3+
15

Servicing
$0
$2,500
$5,000
$7,500
$10,000
$12,500
$15,000
Quarter
0.00%
0.10%
0.20%
0.30%
0.40%
0.50%
Principal Serviced
Cost to Service
16

Summary of 9/30/2005 YTD Results
GAAP earnings of $106 million; $3.64 / share
$4.20 dividend / share (common)
$264 million of cash and available liquidity
Completed three whole loan Sr./Sub securitizations and
one NIM resecuritization backed by $6.5 billion of
collateral
17

Collateral Performance
Pre-Mortgage Insurance
(All data as of December 31, 2005 unless stated otherwise)

Production Summary
Year
Average
Balance
WAC
LTV
CLTV
FICO
PPP
(% with)
PPP
Years
ARM
NON-FULL
DOC
NOO
CASH OUT
1997-98
$104,540
10.04%
79.6%
81.3%
604
70%
2.2
68%
35.1%
5.9%
52.8%
1999
$100,837
9.90%
81.6%
82.9%
615
90%
3.2
64%
39.8%
7.7%
49.5%
2000
$116,009
10.55%
82.5%
84.9%
616
90%
2.9
77%
41.4%
6.1%
42.9%
2001
$128,925
9.76%
82.7%
85.5%
613
84%
2.5
74%
39.1%
4.5%
49.4%
2002
$146,642
8.21%
81.0%
83.3%
627
82%
2.4
70%
45.4%
3.7%
56.9%
2003
$153,639
7.22%
80.0%
82.6%
637
78%
2.3
69%
50.3%
3.6%
62.0%
2004
$157,076
7.57%
82.1%
84.0%
621
73%
1.9
85%
50.0%
4.2%
60.8%
2005
$176,450
7.53%
81.0%
84.8%
630
66%
1.6
86%
53.2%
4.8%
60.9%
19

Actual Loss Severity
Production
Principal
Average
Loss
Year
Loans
Liquidated
Balance
Severity
1997-1998
2,045
$203,728,981
$99,623
42.2%
2000
569
$64,006,314
$112,489
35.4%
2001
848
$99,288,932
$117,086
34.9%
2002
657
$90,228,821
$137,335
30.9%
2003
509
$66,971,806
$131,575
29.0%
2004
429
$61,033,211
$142,269
26.3%
2000-2005
3,012
$381,529,082
$126,670
31.6%
20
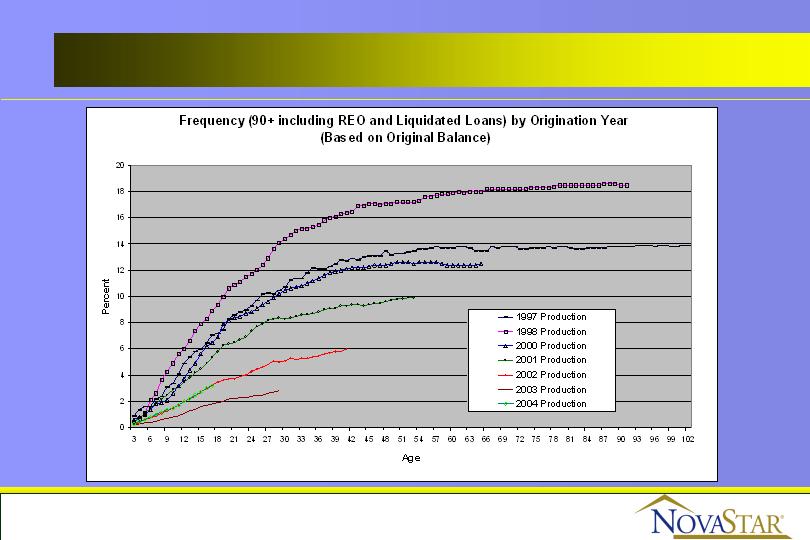
Production Performance
21

Production Performance
22

Early Performance Indicators
MBA method
OTS method
Early Payment
First Payment Default
First Payment Default
Default*
1997-1998
4.67%
2.05%
9.20%
2000
1.65%
0.80%
5.61%
2001
1.33%
0.66%
5.02%
2002
1.05%
0.45%
2.77%
2003
0.67%
0.25%
1.79%
2004
1.49%
0.54%
3.27%
2005
1.44%
0.49%
1.92%
2000-2005
1.26%
0.47%
2.64%
* Early payment default is defined as missing one payment in the first six payments.
23

Additional Data
Complete production and performance data can be found on
NovaStar’s websites:
http://www.novastarbondinvestors.com/
Static pool data
Offering documents
Bond remittance statements
http://www.novastarmortgage.com/corporate/
Monthly production reports
Mortgage insurance claim statistics
24