
American Securitization Forum
Las Vegas, Nevada
January 28-31, 2007

Forward looking disclosure
Certain matters discussed in this presentation constitute forward-looking statements within the meaning of the
federal securities laws. Forward-looking statements are those that predict or describe future events and that do
not relate solely to historical matters. Forward-looking statements are subject to risks and uncertainties and
certain factors can cause actual results to differ materially from those anticipated. Some important factors that
could cause actual results to differ materially from those anticipated include: our ability to generate sufficient
liquidity on favorable terms; the size, frequency and structure of our securitizations; interest rate fluctuations on
our assets that differ from our liabilities; increases in prepayment or default rates on our mortgage assets;
changes in assumptions regarding estimated loan losses and fair value amounts; changes in origination and
resale pricing of mortgage loans; our compliance with applicable local, state and federal laws and regulations
or opinions of counsel relating thereto and the impact of new local, state or federal legislation or regulations or
opinions of counsel relating thereto or court decisions on our operations; the initiation of margin calls under
our credit facilities; the ability of our servicing operations to maintain high performance standards and maintain
appropriate ratings from rating agencies; our ability to expand origination volume while maintaining an
acceptable level of overhead; our ability to adapt to and implement technological changes; the stability of
residual property values; the outcome of litigation or regulatory actions pending against us or other legal
contingencies; compliance with new accounting pronouncements; the impact of general economic conditions;
and the risks that are from time to time included in our filings with the SEC, including our Annual Report on
Form 10-K, for the year ended December 31, 2005 and our quarterly report on form 10-Q, for the period ending
September 30, 2006. Other factors not presently identified may also cause actual results to differ. This
document speaks only as of its date and we expressly disclaim any duty to update the information herein.
2

Overview
Founded: June, 1996
IPO: October, 1997 (NYSE: NFI)
$800 million market cap; $543 million of GAAP equity
Top 20 residential mortgage ABS issuer
Current production run rate of $850 million per month
Cost to originate in the 1.75%-2.00% range
Servicer rating of “Strong” by S&P
Completed 38 ABS transactions, total issuance $35 billion
Disciplined underwriting approval through automated system
manages to a 4.0-6.0% (pre-MI) loss under normal market
conditions
3
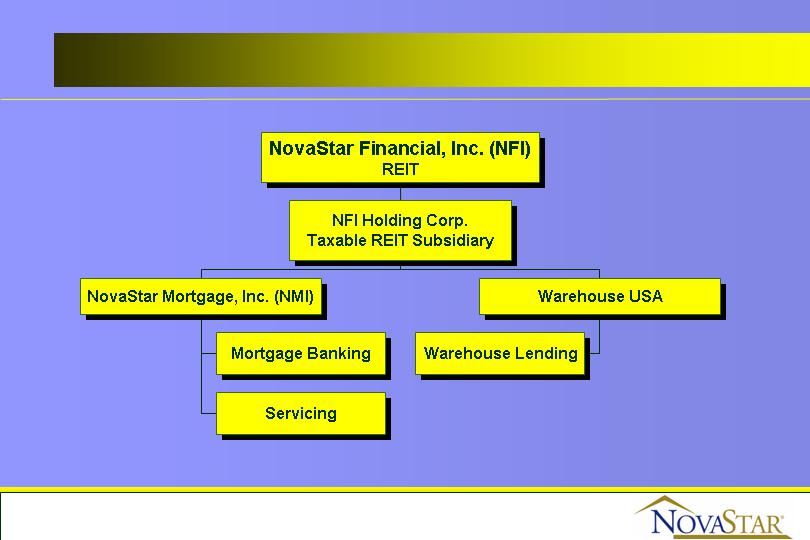
NovaStar Organizational Structure
4

NovaStar Operating Strategy
NovaStar is currently structured as a REIT
Parent company does not pay corporate taxes
Focus is on being a portfolio investor vs. pure mortgage banking
Originate high margin, non-conforming residential mortgages
Service our own collateral (no third party servicing)
Use technology to be an efficient originator and servicer
Create mortgage securities with good risk-adjusted returns
from our loans through securitization
Use capital markets to price and manage risks
Interest rate risks hedged with swaps / caps
Credit risk managed through the purchase of deep MI
5

Origination Strategy
Primarily an A- wholesale lender
Vertical integration
Originator and end investor
Whole loan portfolio exceeding $16 billion
Centralized origination operation
Strive to be a low cost producer - cost to originate below 2.00%
Better risk controls - over 25% appraisal reviews
Manage underwriting - 100% prefunding audits
Diversify credit risk - deep MI
Focus on developing competitive advantages in every
channel in which we choose to operate
6

Distribution Channels
Wholesale
Production centers located in Independence, OH; Richfield, OH
and Lake Forest, CA
Approx. 390 person inside & outside sales force located in 42 states
call on a customer base of over 16,400 independent retail brokers
Compete on service, primarily a price taker
Correspondent / Mini Bulk
Attempt to create competitive advantages by offering small
warehouse lines and private labeling our origination system
Current production run rate of approx. $50-$150 million per quarter
7

Distribution Channels - Continued
Retail
Call centers located in Columbia, MD and Kansas City, MO
focusing primarily on retention of existing portfolio
Approx. 120 loan officers
Secondary focus on new business using primarily purchased
leads
Current production run rate of $200-$300 million per quarter
Acquired certain assets from Oak Street Mortgage during Q4 ‘06
Added 19 traditional retail branch locations in 14 states
Expect acquisition to increase retail production by $50-$100
million per month
8

Historical Production
9
2006
2005
2004
2003
2002
Total Nonconforming Production
$10.23B
$9.28B
$8.42B
$5.25B
$2.50B
Wholesale
86%
75%
65%
67%
79%
Retail
9%
16%
25%
28%
19%
Correspondent / Mini Bulk
5%
9%
10%
5%
2%
Securitizations
7
4
4
4
3
Resecuritizations
0
1
3
1
1
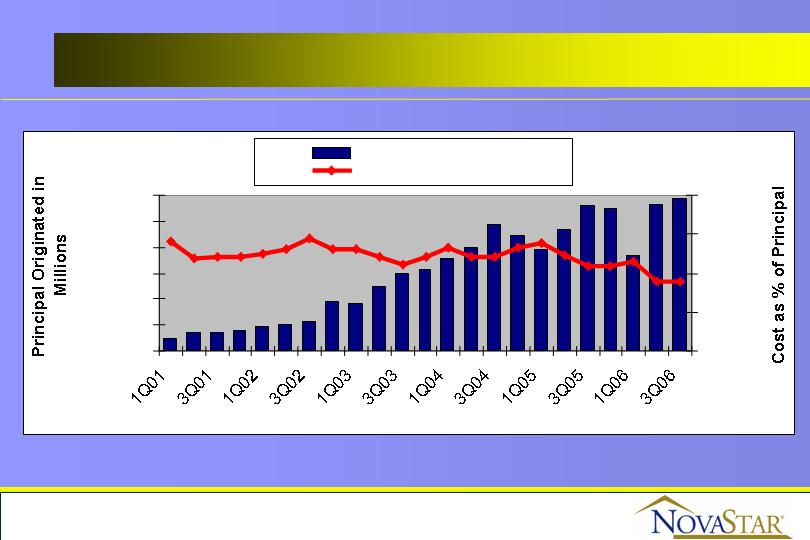
Non-Conforming Production
10
$0
$500
$1,000
$1,500
$2,000
$2,500
$3,000
Quarter
0.00%
1.00%
2.00%
3.00%
4.00%
Principal Originated
Cost to Originate

Origination Practices
100% Pre-funding Audit
Quality/Fraud procedures for new and existing brokers
Watch list / Do not take list for 3rd party vendors
Validation of borrower identity, employment, income, occupancy
100% Appraisal Review
All appraisals reviewed by underwriter as well as ran through risk
evaluator software (CoreLogic ™’s HistoryProReview™ )
70% cleared by underwriter with the help of additional on-line data
sources (SiteXdata.com ™, RealQuest®)
30% referred to on staff licensed appraisers
Review includes pulling additional comps, AVM’s, BPO’s, drive-bys
and/or full second appraisals
On average 15%-20% of those reviewed by staff appraisers have their
value reduced
11

Origination Practices - Continued
Post Funding Quality Control
Identifies negative trends / provides feedback
5%-10% random review of production within 45 days of funding
Results determine if additional biased sampling is needed
Predatory Lending Issues
We do not originate high cost loans (HOEPA or State High Cost
loans)
Net tangible benefit test automated and performed on all
eligible loans
Adhere to the FNMA fee test (5% max) on all loans where
NovaStar acts as the lender
12

Risks and Risk Management
Interest rate/prepayment
Hedging - match duration using swaps and caps
Prepayment/convexity - prepayment penalties
Portfolio is hedged within maximum exposure of 10% of equity
up/down 100 bps
Credit
Geographic diversification
Lender paid deep MI down to 50-55% LTV
Common sense U/W and strong quality control
Service our own collateral
Liquidity
$3.65 billion of committed borrowing capacity from 4 separate
lenders
13

Servicing Overview
$16 billion portfolio representing 105,000 accounts
22nd largest sub-prime servicer (as of 6/30/06; Source: Inside B&C Lending)
Total staff of approx. 250
17 years average experience among Management/Supervisors
Approved FHA, VA, Fannie Mae and Freddie Mac
seller/servicer
Rated by all three rating agencies
S&P: Strong
Moody’s: SQ2
Fitch: RSP2-
14
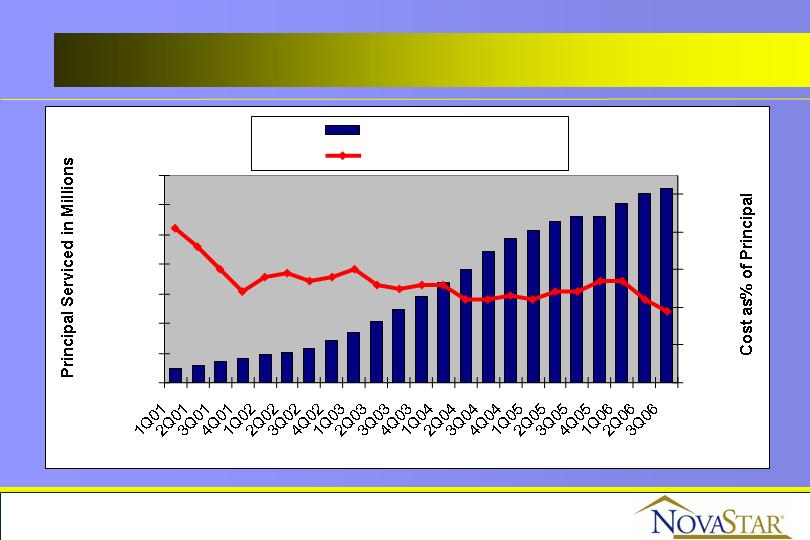
Servicing
15
$0
$2,500
$5,000
$7,500
$10,000
$12,500
$15,000
$17,500
Quarter
0.00%
0.10%
0.20%
0.30%
0.40%
0.50%
Principal Serviced
Cost to Service

Collateral Performance
Pre-Mortgage Insurance
(All data as of December 31, 2006 unless stated otherwise)

Production Summary
17
Year
Average
Balance
WAC
LTV
CLTV
FICO
PPP
(% with)
PPP
Years
ARM
NON-FULL
DOC
NOO
CASH OUT
1997-98
$104,857
10.03%
79.6%
81.2%
604
70%
2.2
68%
35.1%
5.9%
52.9%
1999
$100,903
9.91%
81.6%
82.9%
615
90%
3.2
64%
39.8%
7.7%
49.5%
2000
$116,458
10.57%
82.6%
85.0%
616
90%
2.9
77%
41.3%
6.1%
42.7%
2001
$132,426
9.86%
83.1%
85.9%
614
81%
2.4
72%
39.2%
4.4%
48.4%
2002
$150,614
8.34%
81.5%
83.9%
629
80%
2.4
68%
46.0%
3.6%
56.0%
2003
$157,801
7.32%
80.5%
83.1%
639
77%
2.3
67%
50.7%
3.5%
60.8%
2004
$159,896
7.62%
82.4%
84.3%
622
72%
1.9
83%
50.4%
4.1%
60.0%
2005
$184,179
7.72%
81.8%
85.5%
631
64%
1.5
82%
53.9%
4.6%
59.2%
2006
$207,021
8.96%
82.7%
87.0%
622
61%
1.5
79%
52.9%
5.1%
58.3%

Actual Loss Severity
18
Production Year
Loans
Principal
Liquidated
Average
Balance
Loss
Severity
1997-1998
2,101
$207,286,241
$98,661
42.5%
2000
609
$66,954,314
$109,941
36.3%
2001
945
$107,573,615
$113,835
35.8%
2002
907
$114,551,265
$126,297
33.7%
2003
1,045
$118,622,228
$113,514
34.7%
2004
1,484
$187,130,014
$126,098
35.2%
2005
466
$60,643,553
$130,136
32.8%
2000-2005
5,456
$655,474,989
$120,138
34.8%
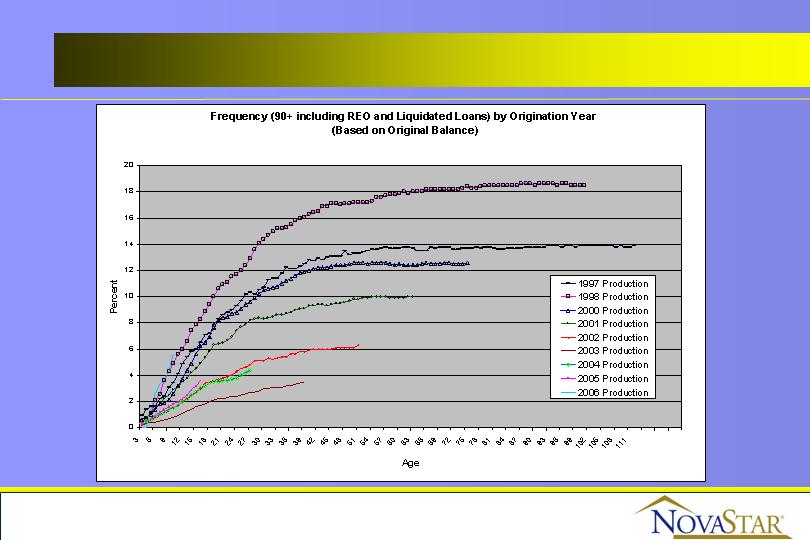
Production Performance
19
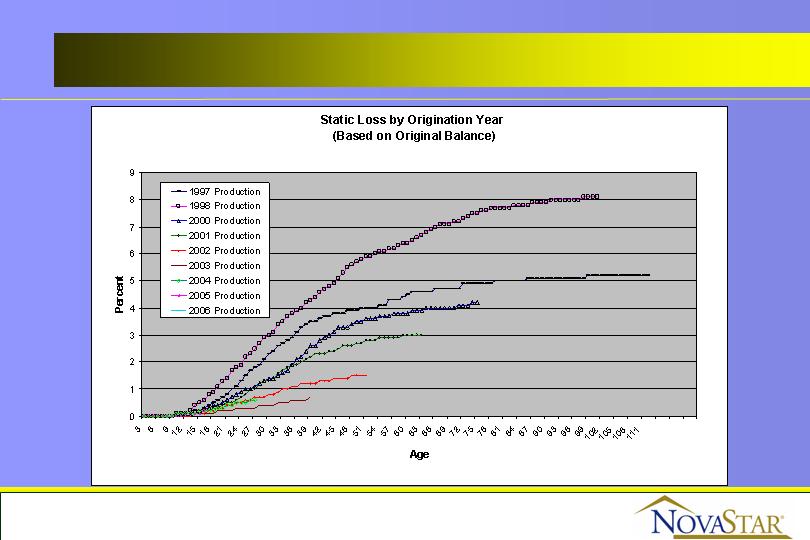
Production Performance
20

Early Performance Indicators
21
Year
First Payment Default
(MBA method)
First Payment Default
(OTS method)
Early Payment Default
(OTS method)
1997-1998
4.67%
2.05%
9.20%
2000
1.65%
0.80%
5.61%
2001
1.33%
0.66%
5.02%
2002
1.05%
0.45%
2.77%
2003
0.67%
0.25%
1.79%
2004
1.49%
0.54%
3.27%
1.73%
0.66%
3.56%
2006
2.41%
1.32%
8.19%
2000-2005
1.35%
0.52%
3.15%
Notes: 1) Early payment default is defined as missing one payment in the first six payments. 2) Numbers do not include data on loans sold to third parties.
3) 2006 numbers only include data through June 30, 2006.

Additional Data
Complete production and performance data can be found on
NovaStar’s websites:
http://www.novastarbondinvestors.com/
Static pool data
Offering documents
Bond remittance statements
http://www.novastarmortgage.com/corporate/
Monthly production reports
Mortgage insurance claim statistics
22