
Deutsche Bank Securitization Conference
New York, NY
April 19, 2007

Forward looking disclosure
Certain matters set forth in this presentation contain forward-looking statements within the meaning of Section 21E of the Securities
Exchange Act of 1934, as amended, regarding management's beliefs, estimates, projections, and assumptions with respect to, among other
things, our future operations, business plans and strategies, as well as industry and market conditions, all of which are subject to change at
any time without notice. Actual results and operations for any future period may vary materially from those discussed herein. Some
important factors that could cause actual results to differ materially from those anticipated include: our ability to generate and maintain
sufficient liquidity on favorable terms; the size, frequency and structure of our securitizations; our ability to sell loans we originate in the
marketplace; impairments on our mortgage assets; increases in prepayment or default rates on our mortgage assets; increases in loan
repurchase requests; inability of potential borrowers to meet our underwriting guidelines; changes in assumptions regarding estimated
loan losses and fair value amounts; finalization of the amount and terms of any severance provided to terminated employees; finalization
of the accounting impact of our previously-announced reduction in workforce; events impacting the subprime mortgage industry in
general, including events impacting our competitors and liquidity available to the industry; the initiation of margin calls under our credit
facilities; the ability of our servicing operations to maintain high performance standards and maintain appropriate ratings from rating
agencies; our ability to generate acceptable origination volume while maintaining an acceptable level of overhead; residential property
values; our continued status as a REIT; interest rate fluctuations on our assets that differ from our liabilities; the outcome of litigation or
regulatory actions pending against us or other legal contingencies; our compliance with applicable local, state and federal laws and
regulations or opinions of counsel relating thereto and the impact of new local, state or federal legislation or regulations or opinions of
counsel relating thereto or court decisions on our operations; our ability to adapt to and implement technological changes; compliance
with new accounting pronouncements; our ability to successfully integrate acquired businesses or assets with our existing business; the
impact of general economic conditions; and the risks that are from time to time included in our filings with the SEC, including our Annual
Report on Form 10-K for the year ended December 31, 2006. Other factors not presently identified may also cause actual results to differ.
Words such as "believe," "expect," "anticipate," "promise," "plan," and other expressions or words of similar meanings, as well as future
or conditional verbs such as "will," "would," "should," "could," or "may" are generally intended to identify forward-looking statements.
This presentation speaks only as of its date and we expressly disclaim any duty to update the information herein.
2

Overview
Founded: June, 1996
IPO: October, 1997 (NYSE: NFI)
NovaStar is currently structured as a REIT
Parent company does not pay corporate taxes
Focus is on being a portfolio investor vs. pure mortgage banking
Top 25 subprime residential mortgage originator, servicer and issuer
Wholesale & Retail originator with a combined current run rate of
approximately $300 million per month
Servicer rating of “Strong” by S&P
Completed 39 ABS transactions, total issuance $37 billion
Disciplined underwriting approval through automated system manages
to a 4.0-6.0% (pre-MI) loss under normal market conditions
3

Corporate update
Liquidity
Received a commitment for an additional $100 million of liquidity collateralized by
mortgage servicing rights and residuals
EPD repurchases from whole loan sales
All EPD buybacks have either already taken place or have been fully reserved for
Anticipate most of 2007 production will be securitized
Retained Deutsche Bank as a financial advisor to help explore and
evaluate strategic alternatives
4

2006 vintage
Tone of the market was being driven by irrational competitors
Too great of a focus on volume rather than profitability
Guidelines became outdated for changing housing market
Delinquencies
December appears to have been the peak
We have seen month over month improvement in early stage delinquencies throughout
the first quarter. Rat in snake?
Mortgage Insurance
Performing as expected even in a down market
No material change in rescissions
While its early, performance for NovaStar’s 2006 vintage appears to
be in line or better than most issuers on a pre-mi basis
5

Delinquency trends
6
Month to Month Change for All 2006 Securitizations
(excluding 2006-MTA1)
Status
Nov-Dec
Dec-Jan
Jan-Feb
Feb-Mar
1-29
1.39%
-1.15%
-0.22%
-0.45%
30-59
0.13%
0.16%
-0.34%
-0.21%
60-89
0.17%
0.01%
0.17%
-0.16%
90+
0.13%
0.15%
0.17%
0.23%
FC
0.61%
0.86%
0.45%
0.54%
REO
0.11%
0.31%
0.40%
0.54%

MI claims summary
7
Loan Resolutions/Liquidations insured by Radian, PMI or MGIC
Data thru 2/28/2007
Resolution Type
Loans
Original
Balance
% by #
% by $
Severity
before MI
Severity
after MI
MI Benefit
MI Paid
2,864
$314,098,398
76.4%
68.2%
39.1%
8.2%
30.9%
MI Acquired
328
$55,874,343
8.7%
12.1%
19.2%
3.2%
16.0%
Not Filed - no loss
265
$39,565,034
7.1%
8.6%
-1.3%
-1.3%
0.0%
Not Filed - other
42
$4,532,621
1.1%
1.0%
41.3%
41.3%
0.0%
Settlement
83
$14,062,467
2.2%
3.1%
43.5%
26.7%
16.8%
Rescinded
169
$32,299,089
4.5%
7.0%
45.8%
45.8%
0.0%
3,751
$460,431,952
100.0%
100.0%
33.9%
10.3%
23.5%
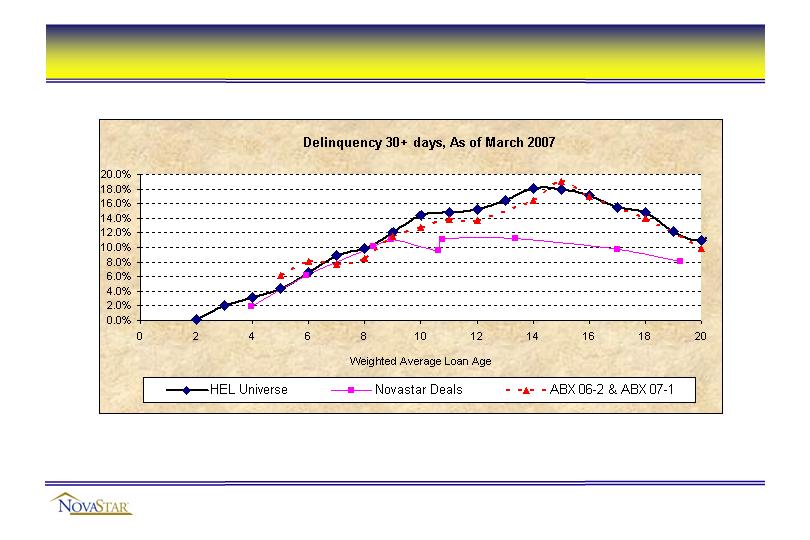
NovaStar securitizations vs. the industry
Notes:
1. Data source: NovaStar and Intex.
2. HEL Universe consists of 300+ deals for which NovaStar has loan level data and has deemed to be typical HEL transactions.
3. NovaStar Deals represent 2005-3 through 2007-1.
8

Changes to 2007 vintage
Screening for layered risk by moving the loss model to front end
Tighter guidelines
Eliminated 80/20’s
Increased minimum ficos in higher LTV buckets
Higher coupons
Less competition
Retail channel expected to represent a larger percent of production
Whole loan prices and ABS bond spreads need to readjust
CDO investors appear to be sitting on the sidelines
9

Recent production trends
10
1
2
1 Excludes MTA production. 2 OTS method. Month refers to first payment date, not origination date.
Oct '06
Nov '06
Dec '06
Jan '07
Feb '07
Mar '07
Production (000's)
$852,105
$872,895
$917,378
$739,226
$386,249
$314,741
WAC
8.91%
8.85%
8.74%
8.85%
8.81%
9.07%
FICO
624
626
626
624
617
618
LTV
82.7%
82.9%
82.7%
82.9%
81.6%
80.6%
CLTV
86.5%
86.6%
86.3%
86.6%
84.2%
83.2%
2nd Lien
4.4%
4.6%
4.8%
4.5%
3.1%
3.3%
ARMs
77.0%
75.7%
73.1%
75.0%
69.6%
67.3%
Interest Only
11.8%
11.2%
11.5%
12.4%
9.8%
8.4%
40/30
22.1%
23.8%
21.9%
23.7%
27.4%
29.1%
Non-Full Doc
52.3%
53.3%
50.9%
51.5%
45.2%
43.9%
NOO
6.7%
5.9%
5.5%
5.8%
4.9%
3.7%
Retail
9%
7%
10%
17%
28%
37%
Wholesale
91%
93%
90%
83%
72%
63%
FPD
2.85%
3.36%
2.76%
1.97%
1.70%
NA

Servicing
$16 billion portfolio
Total staff of approximately 250
Reduced average loans per collector metric from 225 to 150 (90 day bucket)
ARM conversion training
Modifications
Primarily rate adjustments which make it affordable for borrower to stay in the home
Running at about twice the rate of 2006
Geographically focused
LaunchPoint
Since inception have assisted in placing over 1,200 borrowers in new jobs
11

Additional data
Complete production and performance data can be found on
NovaStar’s websites:
http://www.novastarbondinvestors.com/
Static pool performance data
Offering documents
Bond remittance statements
http://www.novastarmortgage.com/corporate/
Monthly production reports
Mortgage insurance claim statistics
12