Exhibit 99.2

NovaStar Financial (NYSE-NFI) www.novastarmortgage.com
2005 Second Quarter Earnings Conference Call July 29, 2005

Safe Harbor Statement
Certain matters discussed in this presentation may constitute forward-looking statements within the meaning of the federal securities laws. Forward looking statements are those that predict or describe future events and that do not relate solely to historical matters. Forward looking statements are subject to risks and uncertainties and certain factors can cause actual results to differ materially from those anticipated. Some important factors that could cause actual results to differ materially from those anticipated include: our ability to generate sufficient liquidity on favorable terms; the size and frequency of our securitizations; interest rate fluctuations on our assets that differ from our liabilities; increases in prepayment or default rates on our mortgage assets; changes in assumptions regarding estimated loan losses and fair value amounts, changes in origination and resale pricing of mortgage loans; our compliance with applicable local, state and federal laws and regulations and the impact of new local, state or federal legislation or regulations or court decisions on our operations; the initiation of margin calls under our credit facilities; the ability of our servicing operations to maintain high performance standards and maintain appropriate ratings from rating agencies; our ability to expand origination volume while maintaining an acceptable level of overhead; our ability to adapt to and implement technological changes; the stability of residual property values; the outcome of litigation or regulatory actions pending against us; the impact of general economic conditions; and the risks that are from time to time included in our filings with the SEC, including our 2004 Annual Report on Form 10-K. Other factors not presently identified may also cause actual results to differ. This document speaks only as of its date and we expressly disclaim any duty to update the information herein.
2

Opening Comments
Scott Hartman, CEO
Key Performance Metrics
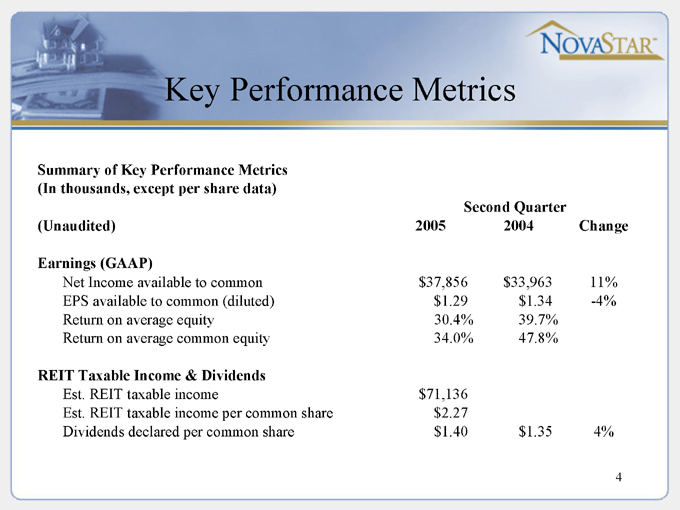
Summary of Key Performance Metrics (In thousands, except per share data) Second Quarter
(Unaudited) 2005 2004 Change
Earnings (GAAP)
Net Income available to common $37,856 $33,963 11%
EPS available to common (diluted) $1.29 $1.34 -4%
Return on average equity 30.4% 39.7%
Return on average common equity 34.0% 47.8%
REIT Taxable Income & Dividends
Est. REIT taxable income $71,136
Est. REIT taxable income per common share $2.27
Dividends declared per common share $1.40 $1.35 4%
4
Key Performance Metrics
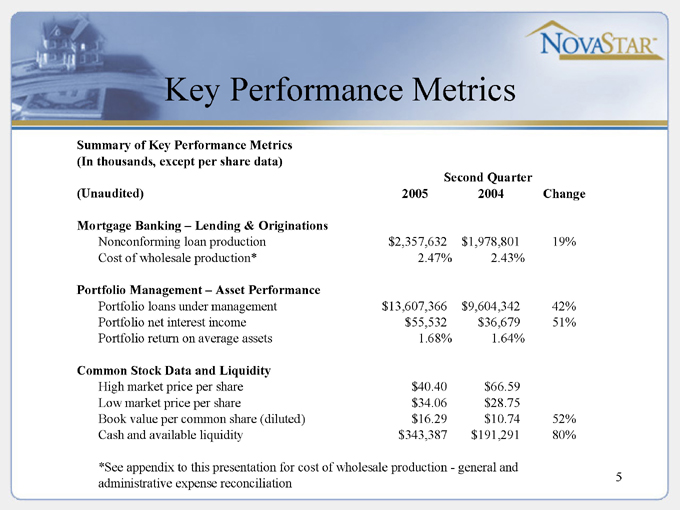
Summary of Key Performance Metrics
(In thousands, except per share data)
Second Quarter
(Unaudited) 2005 2004 Change
Mortgage Banking – Lending & Originations
Nonconforming loan production $2,357,632 $1,978,801 19%
Cost of wholesale production* 2.47% 2.43%
Portfolio Management – Asset Performance
Portfolio loans under management $13,607,366 $9,604,342 42%
Portfolio net interest income $55,532 $36,679 51%
Portfolio return on average assets 1.68% 1.64%
Common Stock Data and Liquidity
High market price per share $40.40 $66.59
Low market price per share $34.06 $28.75
Book value per common share (diluted) $16.29 $10.74 52%
Cash and available liquidity $343,387 $191,291 80%
*See appendix to this presentation for cost of wholesale production—general and administrative expense reconciliation
5

Mortgage Banking
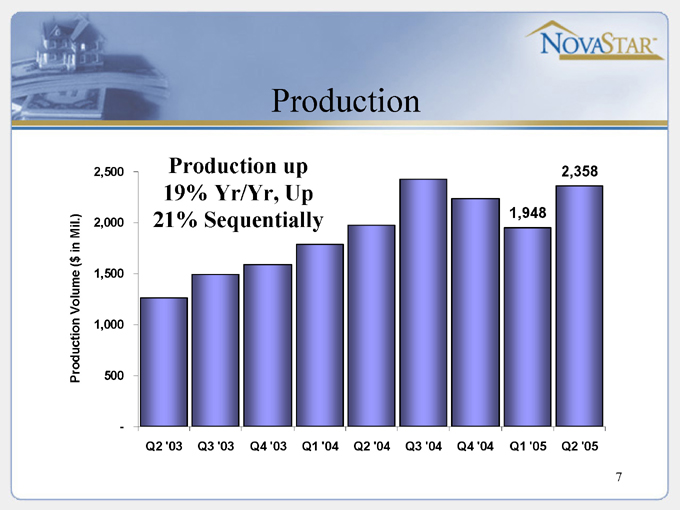
Production
Production Volume ($ in Mil.)
2,500 2,000 1,500 1,000 500 -
Q2 ‘03 Q3 ‘03 Q4 ‘03 Q1 ‘04 Q2 ‘04 Q3 ‘04 Q4 ‘04 Q1 ‘05 Q2 ‘05
Production up 19% Yr/Yr, Up 21% Sequentially
1,948
2,358 7

Production Credit Characteristics
Weighted Avg. FICO
655 650 645 640 635 630 625 620 615 610 605
Q2 ‘03
Q3’03
Q4 ‘03
Q1’04
Q2 ‘04
Q3 ‘04
Q4 ‘04
Q1 ‘05
Q2 ‘05
629
632
Weighted Avg. LTV
85.0 84.0 83.0 82.0 81.0 80.0 79.0 78.0 77.0 76.0 75.0
Q2’ 03 Q3 ‘03
Q4 ‘03
Q1 ‘04
Q2 ‘04
Q3 ‘04
Q4 ‘04
Q1 ‘05
Q2 ‘05
82.1
82.3
8
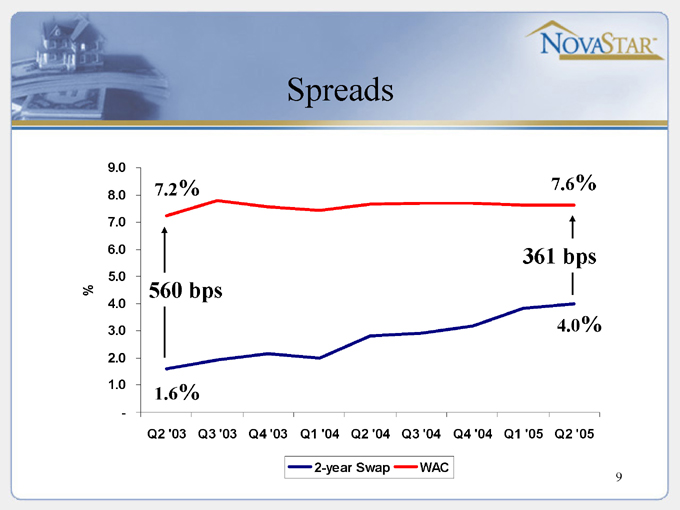
Spreads
%
9.0
8.0 7.0
6.0 5.0
4.0 3.0
2.0 1.0
-
Q2 ‘03 Q3 ‘03 Q4 ‘03 Q1 ‘04 Q2 ‘04 Q3 ‘04 Q4 ‘04 Q1 ‘05 Q2 ‘05
7.2%
560 bps
1.6%
7.6%
361 bps
4.0% 2-year Swap WAC 9
Mortgage Banking Segment Financials
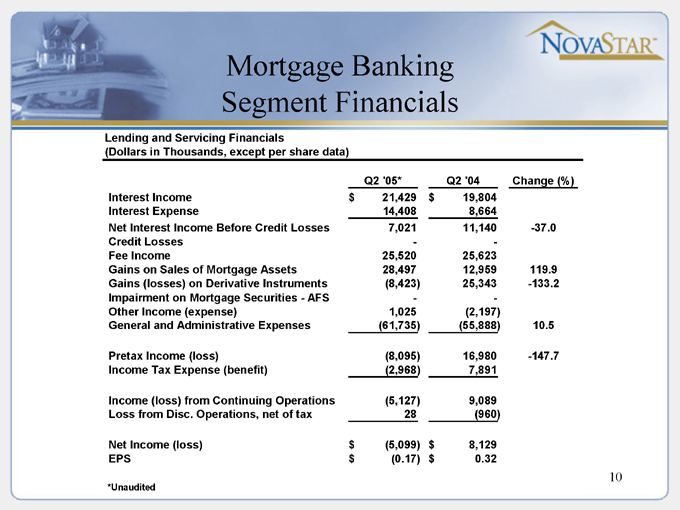
Lending and Servicing Financials
(Dollars in Thousands, except per share data)
Q2 ‘05* Q2 ‘04 Change (%)
Interest Income $21,429 $19,804
Interest Expense 14,408 8,664
Net Interest Income Before Credit Losses 7,021 11,140 -37.0
Credit Losses - - -
Fee Income 25,520 25,623
Gains on Sales of Mortgage Assets 28,497 12,959 119.9
Gains (losses) on Derivative Instruments (8,423) 25,343 -133.2
Impairment on Mortgage Securities—AFS - -
Other Income (expense) 1,025 (2,197)
General and Administrative Expenses (61,735) (55,888) 10.5
Pretax Income (loss) (8,095) 16,980 - -147.7
Income Tax Expense (benefit) (2,968) 7,891
Income (loss) from Continuing Operations (5,127) 9,089
Loss from Disc. Operations, net of tax 28 (960)
Net Income (loss) $(5,099) $8,129
EPS $(0.17) $0.32
*Unaudited
10
Mortgage Banking Environment
Origination activity continues to be robust
Spreads on newly originated loans are relatively thin
Whole-loan pricing continues to be strong, relative to recent spread tightening.
Cost containment measures continue to be a primary focus
11

Portfolio Management
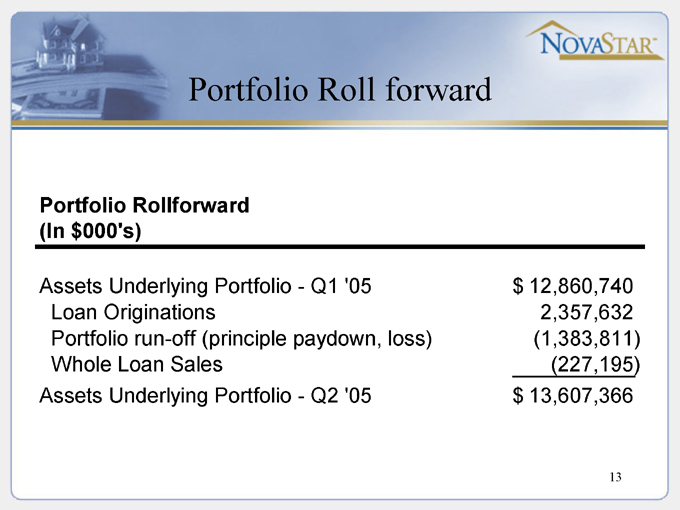
Portfolio Roll forward
Portfolio Rollforward (In $000’s)
Assets Underlying Portfolio—Q1 ‘05 $12,860,740
Loan Originations 2,357,632
Portfolio run-off (principle paydown, loss) (1,383,811)
Whole Loan Sales (227,195)
Assets Underlying Portfolio—Q2 ‘05 $13,607,366
13
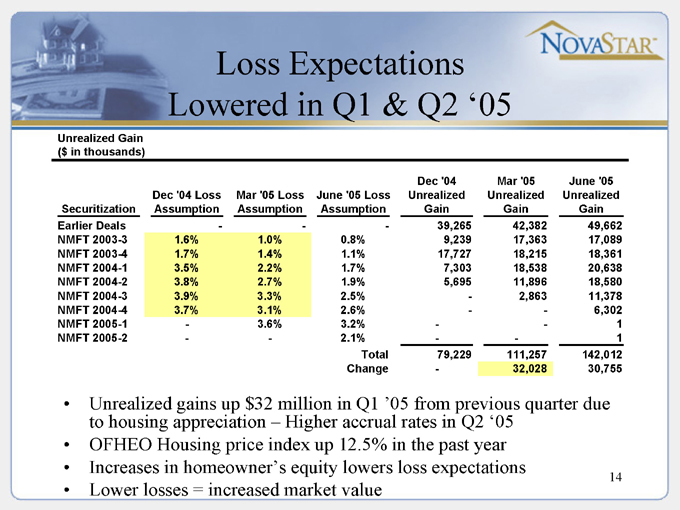
Loss Expectations Lowered in Q1 & Q2 ‘05
Unrealized Gain ($ in thousands)
Securitization Dec ‘04 Loss Assumption Mar ‘05 Loss Assumption June ‘05 Loss Assumption Dec ‘04 Unrealized Gain Mar ‘05 Unrealized Gain June ‘05 Unrealized Gain
Earlier Deals - - - 39,265 42,382 49,662
NMFT 2003-3 1.6% 1.0% 0.8% 9,239 17,363 17,089
NMFT 2003-4 1.7% 1.4% 1.1% 17,727 18,215 18,361
NMFT 2004-1 3.5% 2.2% 1.7% 7,303 18,538 20,638
NMFT 2004-2 3.8% 2.7% 1.9% 5,695 11,896 18,580
NMFT 2004-3 3.9% 3.3% 2.5% - 2,863 11,378
NMFT 2004-4 3.7% 3.1% 2.6% - - 6,302
NMFT 2005-1 - 3.6% 3.2% - - 1
NMFT 2005-2 - - 2.1% - - 1
Total 79,229 111,257 142,012
Change - 32,028 30,755
Unrealized gains up $32 million in Q1 ‘05 from previous quarter due to housing appreciation – Higher accrual rates in Q2 ‘05 OFHEO Housing price index up 12.5% in the past year Increases in homeowner’s equity lowers loss expectations Lower losses = increased market value
14
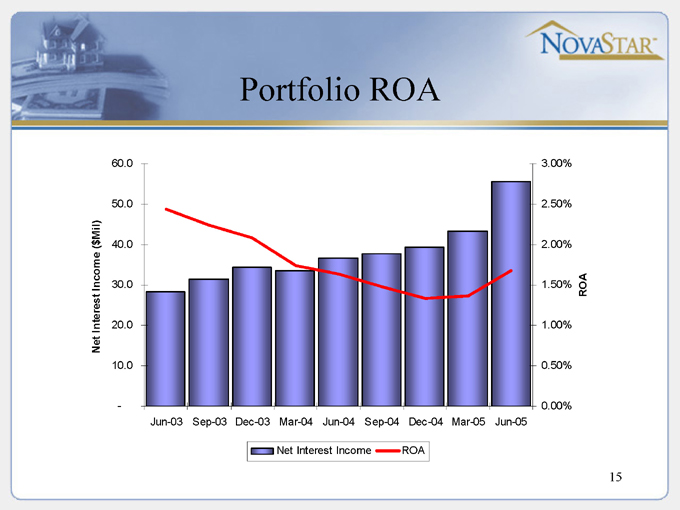
Portfolio ROA
Net Interest Income ($Mil)
60.0 50.0 40.0 30.0 20.0 10.0 -
Jun-03 Sep-03 Dec-03 Mar-04 Jun-04 Sep-04 Dec-04 Mar-05 Jun-05
3.00% 2.50% 2.00% 1.50% 1.00% 0.50% 0.00%
ROA
Net Interest Income
ROA
15
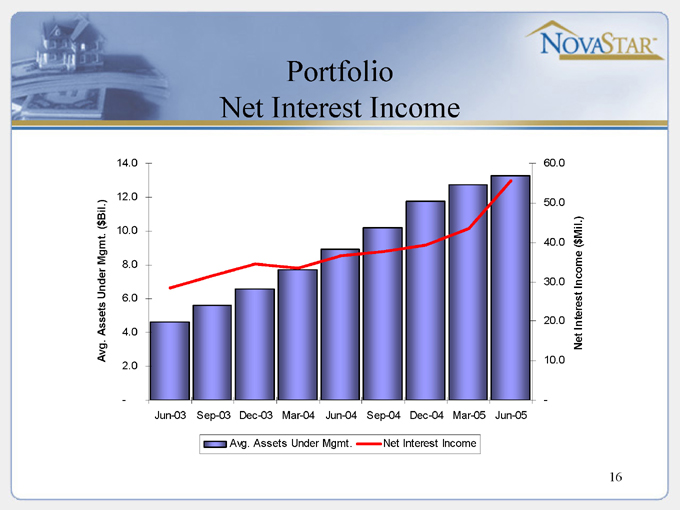
Portfolio Net Interest Income
Avg. Assets Under Mgmt. ($Bil.)
14.0 12.0 10.0 8.0 6.0 4.0 2.0 -
Jun-03 Sep-03 Dec-03 Mar-04 Jun-04 Sep-04 Dec-04 Mar-05 Jun-05
60.0 50.0 40.0 30.0 20.0 10.0 -
Net Interest Income ($Mil.)
Avg. Assets Under Mgmt.
Net Interest Income
16
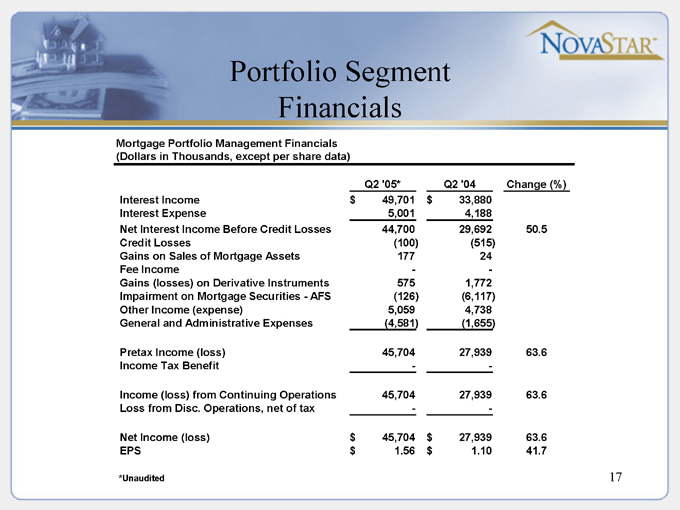
Portfolio Segment Financials
Mortgage Portfolio Management Financials (Dollars in Thousands, except per share data)
Q2 ‘05* Q2 ‘04 Change (%)
Interest Income $49,701 $33,880
Interest Expense 5,001 4,188
Net Interest Income Before Credit Losses 44,700 29,692 50.5
Credit Losses (100) (515)
Gains on Sales of Mortgage Assets 177 24
Fee Income - -
Gains (losses) on Derivative Instruments 575 1,772
Impairment on Mortgage Securities—AFS (126) (6,117)
Other Income (expense) 5,059 4,738
General and Administrative Expenses (4,581) (1,655)
Pretax Income (loss) 45,704 27,939 63.6
Income Tax Benefit - -
Income (loss) from Continuing Operations 45,704 27,939 63.6
Loss from Disc. Operations, net of tax - -
Net Income (loss) $45,704 $27,939 63.6
EPS $1.56 $1.10 41.7
*Unaudited
17

Portfolio trends
Better credit from strength of housing market Faster prepayments – borrowers looking to monetize increase in home value Spread on risks have tightened
Bond spreads have tightened
Spreads on investing in loans have tightened
Lower ROE’s on retained securities
Hold/sell asset decision becoming increasingly important
18
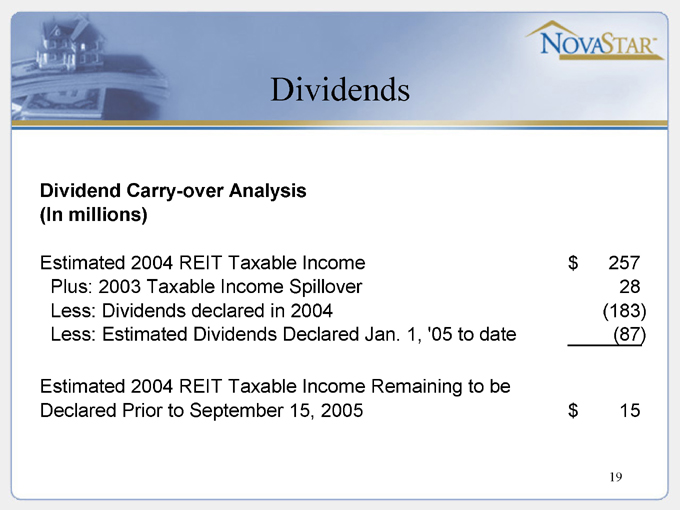
Dividends
Dividend Carry-over Analysis (In millions)
Estimated 2004 REIT Taxable Income $257
Plus: 2003 Taxable Income Spillover 28
Less: Dividends declared in 2004 (183)
Less: Estimated Dividends Declared Jan. 1, ‘05 to date (87)
Estimated 2004 REIT Taxable Income Remaining to be
Declared Prior to September 15, 2005 $15
19
Consolidated Financials
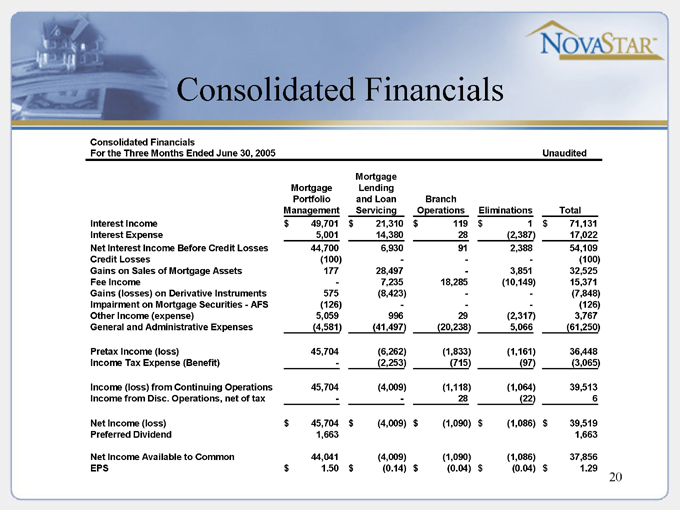
Consolidated Financials
For the Three Months Ended June 30, 2005 Unaudited
Mortgage Portfolio Management Mortgage Lending and Loan Servicing Branch Operations Eliminations Total
Interest Income $49,701 $21,310 $119 $1 $71,131
Interest Expense 5,001 14,380 28 (2,387) 17,022
Net Interest Income Before Credit Losses 44,700 6,930 91 2,388 54,109
Credit Losses (100) - - - (100)
Gains on Sales of Mortgage Assets 177 28,497 - 3,851 32,525
Fee Income - 7,235 18,285 (10,149) 15,371
Gains (losses) on Derivative Instruments 575 (8,423) - - (7,848)
Impairment on Mortgage Securities—AFS (126) - - - (126)
Other Income (expense) 5,059 996 29 (2,317) 3,767
General and Administrative Expenses (4,581) (41,497) (20,238) 5,066 (61,250)
Pretax Income (loss) 45,704 (6,262) (1,833) (1,161) 36,448
Income Tax Expense (Benefit) - (2,253) (715) (97) (3,065)
Income (loss) from Continuing Operations 45,704 (4,009) (1,118) (1,064) 39,513
Income from Disc. Operations, net of tax - - 28 (22) 6
Net Income (loss) $45,704 $(4,009) $(1,090) $(1,086) $39,519
Preferred Dividend 1,663 1,663
Net Income Available to Common 44,041 (4,009) (1,090) (1,086) 37,856
EPS $1.50 $(0.14) $(0.04) $(0.04) $1.29
20

Questions

Appendix
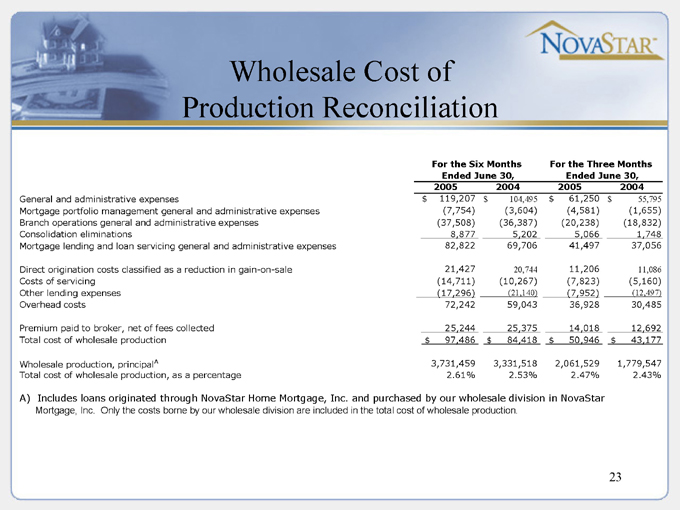
Wholesale Cost of Production Reconciliation
For the Six Months Ended June 30, For the Three Months Ended June 30,
2005 2004 2005 2004
General and administrative expenses $119,207 $104,495 $61,250 $55,795
Mortgage portfolio management general and administrative expenses (7,754) (3,604) (4,581) (1,655)
Branch operations general and administrative expenses (37,508) (36,387) (20,238) (18,832)
Consolidation eliminations 8,877 5,202 5,066 1,748
Mortgage lending and loan servicing general and administrative expenses 82,822 69,706 41,497 37,056
Direct origination costs classified as a reduction in gain-on-sale 21,427 20,744 11,206 11,086
Costs of servicing (14,711) (10,267) (7,823) (5,160)
Other lending expenses (17,296) (21,140) (7,952) (12,497)
Overhead costs 72,242 59,043 36,928 30,485
Premium paid to broker, net of fees collected 25,244 25,375 14,018 12,692
Total cost of wholesale production $97,486 $84,418 $50,946 $43,177
Wholesale production, principalA 3,731,459 3,331,518 2,061,529 1,779,547
Total cost of wholesale production, as a percentage 2.61% 2.53% 2.47% 2.43%
A) Includes loans originated through NovaStar Home Mortgage, Inc. and purchased by our wholesale division in NovaStar
Mortgage, Inc. Only the costs borne by our wholesale division are included in the total cost of wholesale production.
23