 NovaStar Financial (NYSE-NFI) www.novastarmortgage.com 2005 FBR Investor Conference November 30, 2005 Exhibit 99 |
 2 Safe Harbor Statement Certain matters discussed in this presentation may constitute forward-looking statements within the meaning of the federal securities laws. Forward looking statements are those that predict or describe future events and that do not relate solely to historical matters. Forward looking statements are subject to risks and uncertainties and certain factors can cause actual results to differ materially from those anticipated. Some important factors that could cause actual results to differ materially from those anticipated include: our ability to generate sufficient liquidity on favorable terms; the size and frequency of our securitizations; interest rate fluctuations on our assets that differ from our liabilities; increases in prepayment or default rates on our mortgage assets; changes in assumptions regarding estimated loan losses and fair value amounts, changes in origination and resale pricing of mortgage loans; our compliance with applicable local, state and federal laws and regulations and the impact of new local, state or federal legislation or regulations or court decisions on our operations; the initiation of margin calls under our credit facilities; the ability of our servicing operations to maintain high performance standards and maintain appropriate ratings from rating agencies; our ability to expand origination volume while maintaining an acceptable level of overhead; our ability to adapt to and implement technological changes; the stability of residual property values; the outcome of litigation or regulatory actions pending against us; the impact of losses resulting from natural disasters; the impact of general economic conditions; and the risks that are from time to time included in our filings with the SEC, including our 2004 Annual Report on Form 10-K. Other factors not presently identified may also cause actual results to differ. This document speaks only as of its date and we expressly disclaim any duty to update the information herein. |
 Mortgage Banking |
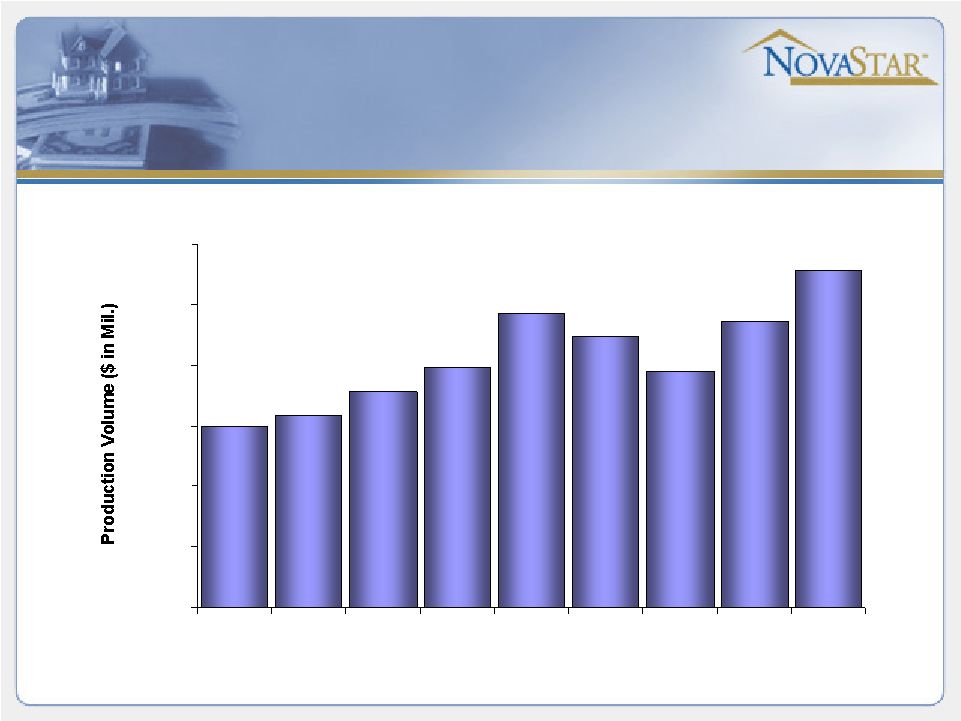 4 Production 2,358 2,779 1,948 - 500 1,000 1,500 2,000 2,500 3,000 Q3 '03 Q4 '03 Q1 '04 Q2 '04 Q3 '04 Q4 '04 Q1 '05 Q2 '05 Q3 '05 Production up 14% Yr/Yr, up 18% Sequentially |
 5 Cost of Production 2,779 - 500 1,000 1,500 2,000 2,500 3,000 Q3 '03 Q4 '03 Q1 '04 Q2 '04 Q3 '04 Q4 '04 Q1 '05 Q2 '05 Q3 '05 2.00% 2.10% 2.20% 2.30% 2.40% 2.50% 2.60% 2.70% 2.80% 2.90% Production COP |
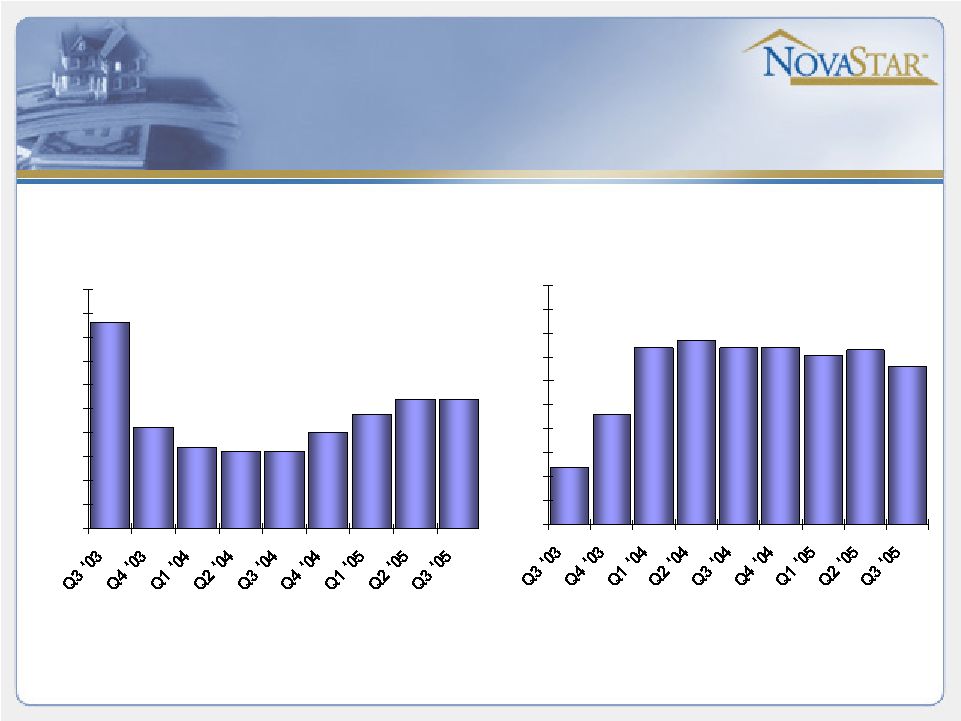 6 Production Credit Characteristics Weighted Avg. FICO 648 626 622 621 621 625 629 632 632 605 610 615 620 625 630 635 640 645 650 655 Weighted Avg. LTV 77.4 79.6 82.4 82.7 82.4 82.4 82.1 81.6 82.3 75.0 76.0 77.0 78.0 79.0 80.0 81.0 82.0 83.0 84.0 85.0 |
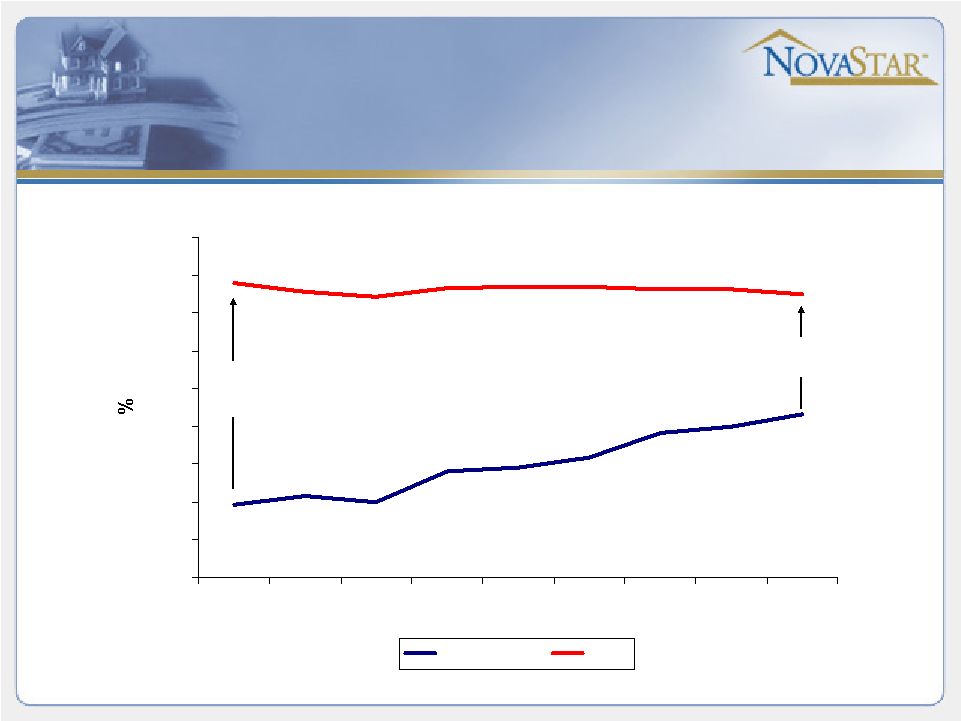 7 Spreads - 1.0 2.0 3.0 4.0 5.0 6.0 7.0 8.0 9.0 Q3 '03 Q4 '03 Q1 '04 Q2 '04 Q3 '04 Q4 '04 Q1 '05 Q2 '05 Q3 '05 2-year Swap WAC 7.8% 1.9% 7.6%* 4.3% 586 bps 326 bps *Excluding MTA |
 8 Mortgage Banking Environment • Origination activity has moderated since August peak as coupons have risen • Profit margins on newly originated loans are relatively thin • Increasing revenue and continued cost reduction will continue to be a primary focus in 2006 |
 Portfolio Management |
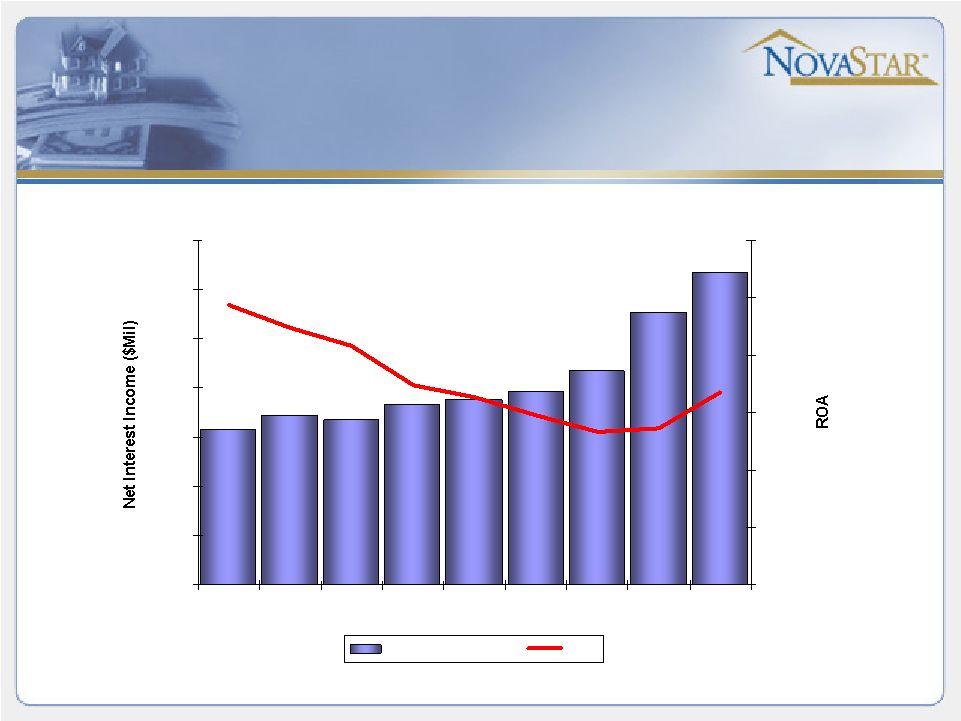 10 Portfolio ROA - 10.0 20.0 30.0 40.0 50.0 60.0 70.0 Sep-03 Dec-03 Mar-04 Jun-04 Sep-04 Dec-04 Mar-05 Jun-05 Sep-05 0.00% 0.50% 1.00% 1.50% 2.00% 2.50% 3.00% Net Interest Income ROA |
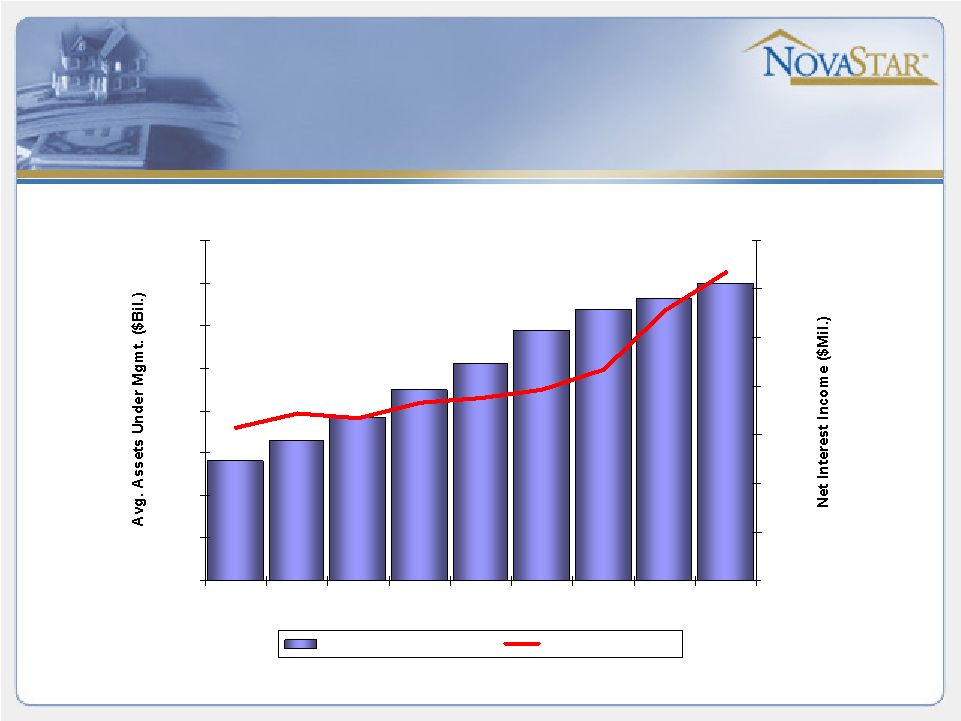 11 Portfolio Net Interest Income - 2.0 4.0 6.0 8.0 10.0 12.0 14.0 16.0 Sep-03 Dec-03 Mar-04 Jun-04 Sep-04 Dec-04 Mar-05 Jun-05 Sep-05 - 10.0 20.0 30.0 40.0 50.0 60.0 70.0 Avg. Assets Under Mgmt. Net Interest Income |
 12 Effect of HPA on Portfolio LTV* Loans with MI and Loans with Original LTV<= 60% Loans without MI and Original LTV >60% Remaining Loan Balance 7,922 6,143 Initial Average LTV after MI 55% 85% Average Age (years) 1.03 0.98 HPA Increase 10.8% 10.6% Estimated Current LTV after MI 44.2% 74.6% *Estimates for illustrative purposes only |
 13 Portfolio trends • Better credit from strength of housing market • Faster prepayments – borrowers looking to monetize increase in home value • Returns on investments in new loans remain relatively low at market prices |
 14 Dividends Dividend Carry-over Analysis (In millions) Estimated 2004 REIT taxable income through Sept. 30, 2005 229 $ Less: 2005 dividend declarations applied to 2005 taxable income (32) Estimated 2005 REIT taxable income remaining to be distributed 197 $ |
 Questions |
 Appendix |
 17 Cost of Wholesale Production Cost of Wholesale Production (dollars in thousands) 2005 2004 2005 2004 General and administrative expenses $ 172,685 $ 157,130 $ 55,887 $ 54,597 Mortgage portfolio management general and administrative expenses (11,928) (5,424) (4,174) (1,820) Branch operations general and administrative expenses (39,537) (53,255) (13,315) (19,112) Consolidation eliminations - 10,013 - 5,093 Mortgage lending and loan servicing general and administrative expenses 121,220 108,464 38,398 38,758 Direct origination costs classified as a reduction in gain-on-sale 33,214 33,674 11,787 12,930 Costs of servicing (25,185) (17,191) (8,531) (6,264) Other lending expenses (22,743) (31,717) (7,390) (11,237) Overhead costs 106,506 93,230 34,264 34,187 Premium paid to broker, net of fees collected 40,703 40,139 15,459 14,823 Total cost of wholesale production $ 147,209 $ 133,369 $ 49,723 $ 49,010 Wholesale production, principal A 6,032,713 5,366,646 2,301,254 2,035,128 Total cost of wholesale production, as a percentage 2.44% 2.49% 2.16% 2.41% A) Includes loans originated through NovaStar Home Mortgage, Inc. and purchased by our wholesale division in NovaStar Mortgage, Inc. Only the costs borne by our wholesale division are included in the total cost of wholesale production. For the Nine Months For the Three Months Ended Sept. 30, Ended Sept. 30, |