UNITED STATES
SECURITIES AND EXCHANGE COMMISSION
Washington, D.C. 20549
FORM N-CSR
CERTIFIED SHAREHOLDER REPORT OF REGISTERED MANAGEMENT INVESTMENT COMPANIES
Investment Company Act file number 811-07899 and 811-07885
Name of Fund: BlackRock Small Cap Index Fund of BlackRock Index Funds, Inc. and Master Small Cap Index Series of Quantitative Master Series LLC
Fund Address: 100 Bellevue Parkway, Wilmington, DE 19809
Name and address of agent for service: Anne F. Ackerley, Chief Executive Officer, BlackRock Small Cap Index Fund of BlackRock Index Funds, Inc. and Master Small Cap Index Series of Quantitative Master Series LLC, 55 East 52nd Street, New York, NY 10055.
Registrant’s telephone number, including area code: (800) 441-7762
Date of fiscal year end: 12/31/2009
Date of reporting period: 12/31/2009
Item 1 – Report to Stockholders
EQUITIES FIXED INCOME REAL ESTATE LIQUIDITY ALTERNATIVES BLACKROCK SOLUTIONS
|
|
BlackRock Small Cap |
|
OF BLACKROCK INDEX FUNDS, INC. | |
| |
ANNUAL REPORT | DECEMBER 31, 2009 |

NOT FDIC INSURED
MAY LOSE VALUE
NO BANK GUARANTEE
|
|
Table of Contents |
|
|
|
|
|
| Page |
|
|
|
|
|
| 3 |
| |
Annual Report: |
|
|
|
| 4 |
| |
| 6 |
| |
| 6 |
| |
Fund Financial Statements: |
|
|
|
| 7 |
| |
| 8 |
| |
| 9 |
| |
| 10 |
| |
| 11 |
| |
Fund Report of Independent Registered Public Accounting Firm |
| 14 |
|
| 14 |
| |
| 15 |
| |
Derivative Financial Instruments |
| 15 |
|
Series Financial Statements: |
|
|
|
| 16 |
| |
| 23 |
| |
| 24 |
| |
| 25 |
| |
| 25 |
| |
| 26 |
| |
Series Report of Independent Registered Public Accounting Firm |
| 29 |
|
| 30 |
| |
| 33 |
| |
| 35 |
|
|
|
|
2 | BLACKROCK SMALL CAP INDEX FUND | DECEMBER 31, 2009 |
|
In 2009, investors worldwide witnessed a seismic shift in market sentiment as the fear and pessimism that characterized 2008 were replaced by guarded optimism. The single most important reason for this change was the swing from a deep global recession to the beginnings of a global recovery.
At the outset of the year, markets were still reeling from 2008’s nearly unprecedented global financial and economic meltdown. The looming threat of further collapse in global markets prompted stimulus packages and central bank interventions on an extraordinary scale worldwide. Ultimately, these actions helped stabilize the financial system, and the economic contraction began to abate.
Stocks fell sharply to start 2009 as investor confidence remained low on fears of an economic depression. After touching their lows in March, stocks galloped higher as massive, coordinated global monetary and fiscal stimulus began to reflate world economies. Sidelined cash poured into the markets, triggering a dramatic and steep upward rerating of stocks and other risk assets. The financial sector and low-quality securities that had been battered most in the downturn enjoyed the sharpest recovery. The experience in international markets was similar to that seen in the United States. European stocks slightly edged out other developed markets for the year, but emerging markets were the clear winners in 2009. To some extent, this outperformance reflected the stronger recoveries in emerging economies and corporate earnings, but emerging market stocks also saw significant expansion in valuations.
The improvement in the economic backdrop was reflected in fixed income markets as well, where non-Treasury assets made a robust recovery. One of the major themes for 2009 was the reversal of the flight-to-quality trade seen in 2008. As investors grew more comfortable with risk, high yield finished the year as the strongest-performing fixed income sector in both the taxable and tax-exempt space. Overall, the municipal market made a strong showing, outpacing most taxable sectors. Despite fundamental challenges, the technical picture remained supportive of the asset class. Municipal fund inflows had a record-setting year; investor expectations of higher taxes boosted demand; and the Build America Bonds program was deemed a success, adding $65 billion of taxable supply to the municipal marketplace in 2009. Notably, the program has alleviated tax-exempt supply pressure and attracted the attention of a global audience.
All told, the rebound in sentiment and global market conditions propelled virtually every major benchmark index into positive territory for both the 6- and 12-month periods, with the notable exception of Treasury bonds, which were negatively affected by rising long-term rates.
|
|
|
|
|
|
|
|
Total Returns as of December 31, 2009 |
| 6-month |
| 12-month |
| ||
US equities (S&P 500 Index) |
|
| 22.59 | % |
| 26.46 | % |
Small cap US equities (Russell 2000 Index) |
|
| 23.90 |
|
| 27.17 |
|
International equities (MSCI Europe, Australasia, Far East Index) |
|
| 22.07 |
|
| 31.78 |
|
US Treasury securities (BofA Merrill Lynch 10-Year US Treasury Index) |
|
| (1.06 | ) |
| (9.71 | ) |
Taxable fixed income (Barclays Capital US Aggregate Bond Index) |
|
| 3.95 |
|
| 5.93 |
|
Tax-exempt fixed income (Barclays Capital Municipal Bond Index) |
|
| 6.10 |
|
| 12.91 |
|
High yield bonds (Barclays Capital US Corporate High Yield 2% Issuer Capped Index) |
|
| 21.27 |
|
| 58.76 |
|
Past performance is no guarantee of future results. Index performance shown for illustrative purposes only. You cannot invest directly in an index.
The market environment improved dramatically in the past year, but uncertainty and risk remain. Through periods of market turbulence, as ever, BlackRock’s full resources are dedicated to the management of our clients’ assets. For additional market perspective and investment insight, visit the most recent issue of our award-winning Shareholder® magazine at www.blackrock.com/shareholdermagazine. As always, we thank you for entrusting BlackRock with your investments, and we look forward to continuing to serve you in the new year and beyond.
Sincerely,

Rob Kapito
President, BlackRock Advisors, LLC
|
Announcement to Shareholders |
On December 1, 2009, BlackRock, Inc. and Barclays Global Investors, N.A. combined to form one of the world’s preeminent investment management firms. The new company, operating under the BlackRock name, manages $3.346 trillion in assets* and offers clients a full complement of worldwide active management, enhanced and index investment strategies and products, including individual and institutional separate accounts, mutual funds and other pooled investment vehicles, and the industry-leading iShares platform of exchange traded funds.
|
|
* | Data is as of December 31, 2009. |
|
|
|
| THIS PAGE NOT PART OF YOUR FUND REPORT | 3 |
|
|
|
BlackRock Small Cap Index Fund |
|
|
Portfolio Management Commentary | |
|
|
| How did the Fund perform? |
|
|
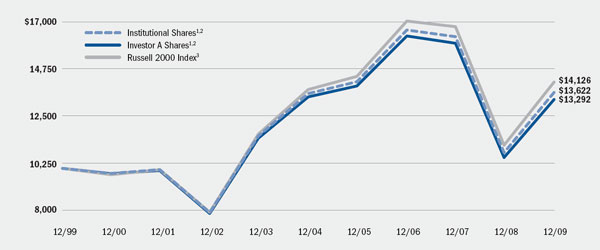
• | Through the Fund’s investment in Master Small Cap Index Series (the “Series”) of Quantitative Master Series LLC (the “Master LLC”), the Fund’s Institutional and Investor A Shares generated returns of 26.67% and 26.36%, respectively, for the 12 months ended December 31, 2009, underperforming its benchmark, the Russell 2000 Index, which returned 27.17%. The Russell 2000 Index is a market-weighted index composed of approximately 2,000 common stocks issued by small-capitalization US companies in a range of businesses. |
|
|
• | Returns for the Fund’s share classes differ from the benchmark based on individual share-class expenses. |
|
|
| Describe the market environment. |
|
|
• | Following a very difficult 2008, during which the world experienced an unprecedented global financial and economic meltdown, stocks entered 2009 by falling another 35% in the United States as fears of depression and financial system nationalization gripped investors. From the March 2009 lows, stocks galloped higher as those fears dissipated and massive global monetary and fiscal stimuli began to re-inflate economic activity. We have described it as a tug of war between the forces of debt-induced deflation and those of policy-induced reflation. While deleveraging and other deflationary forces did not leave the scene, consistent and aggressive policy ignited the reflationary process. 2009 produced negative real economic growth, weak nominal growth and significant earnings declines. Despite that backdrop, “risk” assets outperformed “safe” assets as cash on the sidelines (which was producing near-zero returns) moved back into the markets. Emerging markets handily beat developed markets. Inflation fell in most countries and widespread deflation was avoided. Treasury rates moved modestly higher as the yield curve steepened. Quality spreads narrowed, but ended the year with sharp gains. Financial stocks and low-quality securities led the way back, and materials was the standout sector performer. Government spending reached record proportions, and the year ended with cyclical stimulus leading the way while at the same time masking the structural problems that remain. |
|
|
• | On a total return basis, the Dow Jones Industrial Average gained 22.68%; the S&P 500 rose 26.46%; and the Nasdaq Composite advanced 45.32% (helped in large part by the exceptional performance of the technology sector). Small-cap stocks experienced similarly strong gains for the year, with the Russell 2000 Index climbing 27.17%. |
|
|
• | Within the benchmark Russell 2000 Index, nine of the ten sectors posted positive returns for the period. Materials, consumer discretionary and information technology emerged as the best performers, while financials was the only sector to post a negative return. |
|
|
| Describe recent portfolio activity. |
|
|
• | Throughout the 12-month period, as changes were made to the composition of the Russell 2000 Index, the Series purchased and sold securities to maintain its objective of replicating the risks and return of the benchmark. |
|
|
| Describe portfolio positioning at period end. |
|
|
• | The Series remains positioned to match the risk characteristics of its benchmark, irrespective of the market’s future direction. |
|
|
| The views expressed reflect the opinions of BlackRock as of the date of this report and are subject to change based on changes in market, economic or other conditions. These views are not intended to be a forecast of future events and are no guarantee of future results. |
|
|
Derivative Financial Instruments | |
|
|
| The Series may invest in various derivative instruments, including financial futures contracts, as specified in Note 2 of the Notes to Financial Statements, which constitute forms of economic leverage. Such instruments are used to obtain exposure to a market without owning or taking physical custody of securities or to hedge market and/or equity risks. Such derivative instruments involve risks, including the imperfect correlation between the value of a derivative instrument and the underlying asset, possible default of the counterparty to the transaction or illiquidity of the derivative instrument. The Series’ ability to successfully use a derivative instrument depends on the investment advisor’s ability to accurately predict pertinent market movements, which cannot be assured. The use of derivative instruments may result in losses greater than if they had not been used, may require the Series to sell or purchase portfolio securities at inopportune times or for distressed values, may limit the amount of appreciation the Series can realize on an investment or may cause the Series to hold a security that it might otherwise sell. The Series’ investments in these instruments are discussed in detail in the Notes to Financial Statements. |
|
|
|
4 | BLACKROCK SMALL CAP INDEX FUND | DECEMBER 31, 2009 |
|
|
Total Return Based on a $10,000 Investment |
|
|
1 | Assuming transaction costs and other operating expenses, including advisory fees and administration fees, if any. |
|
|
2 | The Fund invests all of its assets in Master Small Cap Index Series of Quantitative Master Series LLC. The Series may invest in a statistically selected sample of the stocks included in the Russell 2000 Index and other types of financial instruments. |
|
|
3 | This unmanaged index is a market-weighted index composed of approximately 2,000 common stocks issued by small-capitalization US companies in a range of businesses. |
|
|
|
|
|
|
|
|
|
|
|
|
|
|
Performance Summary for the Period Ended December 31, 2009 | |||||||||||||
|
|
|
|
|
|
|
|
|
|
|
|
|
|
|
| 6-Month |
| Average Annual Total Returns4 |
| ||||||||
|
|
| |||||||||||
|
|
|
| 1 Year |
|
| 5 Years |
|
| 10 Years |
| ||
Institutional |
|
| 23.62 | % |
| 26.67 | % |
| 0.07 | % |
| 3.14 | % |
Investor A |
|
| 23.48 |
|
| 26.36 |
|
| (0.19 | ) |
| 2.89 |
|
Russell 2000 Index |
|
| 23.90 |
|
| 27.17 |
|
| 0.51 |
|
| 3.51 |
|
|
|
4 | Average annual total returns reflect reductions for service fees. See “About Fund Performance” on page 6 for a detailed description of share classes, including any related fees. |
|
|
|
|
Past performance is not indicative of future results. | |||
| |||
| BLACKROCK SMALL CAP INDEX FUND | DECEMBER 31, 2009 | 5 |
|
|
|
|
• | Institutional Shares are not subject to any sales charge. Institutional Shares bear no ongoing distribution or service fees and are available only to eligible investors. |
|
|
• | Investor A Shares are not subject to any sales charge and bear no ongoing distribution fee. Investor A Shares are subject to an ongoing service fee of 0.25% per year. |
|
|
| Performance information reflects past performance and does not guarantee future results. Current performance may be lower or higher than the performance data quoted. Refer to www.blackrock.com/funds to obtain performance data current to the most recent month-end. Performance results do not reflect the deduction of taxes that a shareholder would pay on fund distributions or the redemption of fund shares. Figures shown in the performance tables on page 5 assume reinvestment of all dividends and capital gain distributions, if any, at net asset value on the ex-dividend date. Investment return and principal value of shares will fluctuate so that shares, when redeemed, may be worth more or less than their original cost. Dividends paid to each class of shares will vary because of the different levels of service and transfer agency fees applicable to each class, which are deducted from the income available to be paid to shareholders. |
|
|
Shareholders of this Fund may incur the following charges: (a) expenses related to transactions, redemption fees and exchange fees; and (b) operating expenses including advisory fees, service and distribution fees including 12b-1 fees and other Fund expenses. The expense example shown below (which is based on a hypothetical investment of $1,000 invested on July 1, 2009 and held through December 31, 2009) is intended to assist shareholders both in calculating expenses based on an investment in the Fund and in comparing these expenses with similar costs of investing in other mutual funds.
The table provides information about actual account values and actual expenses. In order to estimate the expenses a shareholder paid during the period covered by this report, shareholders can divide their account value by $1,000 and then multiply the result by the number corresponding to their share class under the heading entitled “Expenses Paid During the Period.”
The table also provides information about hypothetical account values and hypothetical expenses based on the Fund’s actual expense ratio and an assumed rate of return of 5% per year before expenses. In order to assist shareholders in comparing the ongoing expenses of investing in this Fund and other funds, compare the 5% hypothetical example with the 5% hypothetical examples that appear in other funds’ shareholder reports.
The expenses shown in the table are intended to highlight shareholders’ ongoing costs only and do not reflect any transactional expenses, such as sales charges, redemption fees or exchange fees. Therefore, the hypothetical example is useful in comparing ongoing expenses only, and will not help shareholders determine the relative total expenses of owning different funds. If these transactional expenses were included, shareholder expenses would have been higher.
|
Expense Example |
|
|
|
|
|
|
|
|
|
|
|
|
|
|
|
|
|
|
|
|
|
| Actual |
| Hypothetical2 |
| ||||||||||||||
|
|
| |||||||||||||||||
|
| Beginning |
| Ending |
| Expenses Paid |
| Beginning |
| Ending |
| Expenses Paid |
| ||||||
Institutional |
| $ | 1,000 |
| $ | 1,236.20 |
| $ | 3.04 |
| $ | 1,000 |
| $ | 1,022.48 |
| $ | 2.75 |
|
Investor A |
| $ | 1,000 |
| $ | 1,234.80 |
| $ | 4.51 |
| $ | 1,000 |
| $ | 1,021.17 |
| $ | 4.08 |
|
|
|
|
| 1 | For each class of the Fund, expenses are equal to the annualized expense ratio for the class (0.54% for Institutional and 0.80% for Investor A), multiplied by the average account value over the period, multiplied by 184/365 (to reflect the one-half year period shown). Because the Fund is a feeder fund, the expense table example reflects the expenses of both the feeder fund and the master portfolio in which it invests. |
|
|
|
| 2 | Hypothetical 5% annual return before expenses is calculated by pro rating the number of days in the most recent fiscal half year divided by 365. |
|
|
|
6 | BLACKROCK SMALL CAP INDEX FUND | DECEMBER 31, 2009 |
|
|
| |
BlackRock Small Cap Index Fund | |
|
|
|
|
|
December 31, 2009 |
|
|
|
|
Assets |
|
|
|
|
Investment at value — Master Small Cap Index Series (the “Series”) (cost — $90,898,434) |
| $ | 94,111,461 |
|
Withdrawals receivable from the Series |
|
| 1,221,682 |
|
Capital shares sold receivable |
|
| 138,227 |
|
Prepaid expenses |
|
| 14,889 |
|
|
| |||
Total assets |
|
| 95,486,259 |
|
|
| |||
|
|
|
|
|
Liabilities |
|
|
|
|
Capital shares redeemed payable |
|
| 1,359,908 |
|
Administration fees payable |
|
| 22,921 |
|
Distribution fees payable |
|
| 7,920 |
|
Other affiliates payable |
|
| 984 |
|
Officer’s fees payable |
|
| 11 |
|
Other accrued expenses payable |
|
| 11,093 |
|
|
| |||
Total liabilities |
|
| 1,402,837 |
|
|
| |||
Net Assets |
| $ | 94,083,422 |
|
|
| |||
|
|
|
|
|
Net Assets Consist of |
|
|
|
|
Paid-in capital |
| $ | 117,483,551 |
|
Undistributed net investment income |
|
| 41,874 |
|
Accumulated net realized loss allocated from the Series |
|
| (26,655,030 | ) |
Net unrealized appreciation/depreciation allocated from the Series |
|
| 3,213,027 |
|
|
| |||
Net Assets |
| $ | 94,083,422 |
|
|
| |||
|
|
|
|
|
Net Asset Value |
|
|
|
|
Institutional — Based on net assets of $55,743,667 and 5,743,881 shares outstanding, 125 million shares authorized, $0.0001 par value |
| $ | 9.70 |
|
|
| |||
Investor A — Based on net assets of $38,339,755 and 3,949,175 shares outstanding, 125 million shares authorized, $0.0001 par value |
| $ | 9.71 |
|
|
|
|
|
|
See Notes to Financial Statements. |
|
|
BLACKROCK SMALL CAP INDEX FUND | DECEMBER 31, 2009 | 7 |
|
|
|
|
BlackRock Small Cap Index Fund |
|
|
|
|
|
Year Ended December 31, 2009 |
|
|
|
|
Investment Income |
|
|
|
|
Net investment income allocated from the Series: |
|
|
|
|
Dividends |
| $ | 987,096 |
|
Foreign taxes withheld |
|
| (94 | ) |
Income — affiliated |
|
| 13,814 |
|
Securities lending — affiliated |
|
| 108,257 |
|
Expenses |
|
| (58,388 | ) |
|
| |||
Total income |
|
| 1,050,685 |
|
|
| |||
|
|
|
|
|
Expenses |
|
|
|
|
Administration |
|
| 228,962 |
|
Service — Investor A |
|
| 79,259 |
|
Printing |
|
| 54,810 |
|
Transfer agent — Institutional |
|
| 21,767 |
|
Transfer agent — Investor A |
|
| 18,588 |
|
Registration |
|
| 33,726 |
|
Professional |
|
| 20,533 |
|
Officer |
|
| 36 |
|
Miscellaneous |
|
| 8,437 |
|
|
| |||
Total expenses |
|
| 466,118 |
|
Less fees waived by administrator |
|
| (2,477 | ) |
|
| |||
Total expenses after fees waived |
|
| 463,641 |
|
|
| |||
Net investment income |
|
| 587,044 |
|
|
| |||
|
|
|
|
|
Realized and Unrealized Gain (Loss) Allocated from the Series |
|
|
|
|
Net realized loss from investments and financial futures contracts |
|
| (8,274,246 | ) |
Net change in unrealized appreciation/depreciation on investments and financial futures contracts |
|
| 27,253,654 |
|
|
| |||
Total realized and unrealized gain |
|
| 18,979,408 |
|
|
| |||
Net Increase in Net Assets Resulting from Operations |
| $ | 19,566,452 |
|
|
|
|
|
|
See Notes to Financial Statements. | ||
8 | BLACKROCK SMALL CAP INDEX FUND | DECEMBER 31, 2009 |
|
|
| |
BlackRock Small Cap Index Fund | |
|
|
|
|
|
|
|
|
|
| Year Ended |
| ||||
|
| ||||||
Increase (Decrease) in Net Assets: |
| 2009 |
| 2008 |
| ||
Operations |
|
|
|
|
|
|
|
Net investment income |
| $ | 587,044 |
| $ | 1,065,549 |
|
Net realized gain (loss) |
|
| (8,274,246 | ) |
| 6,307,919 |
|
Net change in unrealized appreciation/depreciation |
|
| 27,253,654 |
|
| (46,354,296 | ) |
|
| ||||||
Net increase (decrease) in net assets resulting from operations |
|
| 19,566,452 |
|
| (38,980,828 | ) |
|
| ||||||
|
|
|
|
|
|
|
|
Dividends and Distributions to Shareholders From |
|
|
|
|
|
|
|
Net investment income: |
|
|
|
|
|
|
|
Institutional |
|
| (376,750 | ) |
| (782,173 | ) |
Investor A |
|
| (174,904 | ) |
| (391,091 | ) |
Net realized gain: |
|
|
|
|
|
|
|
Institutional |
|
| — |
|
| (5,780,831 | ) |
Investor A |
|
| — |
|
| (3,674,574 | ) |
Tax return of capital: |
|
|
|
|
|
|
|
Institutional |
|
| — |
|
| (632,165 | ) |
Investor A |
|
| — |
|
| (400,501 | ) |
|
| ||||||
Decrease in net assets resulting from dividends and distributions to shareholders |
|
| (551,654 | ) |
| (11,661,335 | ) |
|
| ||||||
|
|
|
|
|
|
|
|
Capital Share Transactions |
|
|
|
|
|
|
|
Net increase (decrease) in net assets derived from capital share transactions |
|
| (1,003,872 | ) |
| 13,022,264 |
|
|
| ||||||
|
|
|
|
|
|
|
|
Redemption Fee |
|
|
|
|
|
|
|
Redemption fee |
|
| 864 |
|
| 2,145 |
|
|
| ||||||
|
|
|
|
|
|
|
|
Net Assets |
|
|
|
|
|
|
|
Total increase (decrease) in net assets |
|
| 18,011,790 |
|
| (37,617,754 | ) |
Beginning of year |
|
| 76,071,632 |
|
| 113,689,386 |
|
|
| ||||||
End of year |
| $ | 94,083,422 |
| $ | 76,071,632 |
|
|
| ||||||
Undistributed (distributions in excess of) net investment income |
| $ | 41,874 |
| $ | (185 | ) |
|
| ||||||
|
|
|
See Notes to Financial Statements. |
|
|
BLACKROCK SMALL CAP INDEX FUND | DECEMBER 31, 2009 | 9 |
|
|
|
|
BlackRock Small Cap Index Fund | |
|
|
|
|
|
|
|
|
|
|
|
|
|
|
|
|
|
|
|
|
|
|
|
|
|
|
|
|
|
|
|
|
|
| Institutional |
| Investor A |
| ||||||||||||||||||||||||||
|
| ||||||||||||||||||||||||||||||
|
| Year Ended December 31, |
| Year Ended December 31, |
| ||||||||||||||||||||||||||
|
| ||||||||||||||||||||||||||||||
|
| 2009 |
| 2008 |
| 2007 |
| 2006 |
| 2005 |
| 2009 |
| 2008 |
| 2007 |
| 2006 |
| 2005 |
| ||||||||||
Per Share Operating Performance |
|
|
|
|
|
|
|
|
|
|
|
|
|
|
|
|
|
|
|
|
|
|
|
|
|
|
|
|
|
|
|
Net asset value, beginning of year |
| $ | 7.71 |
| $ | 13.79 |
| $ | 15.48 |
| $ | 14.36 |
| $ | 14.10 |
| $ | 7.72 |
| $ | 13.79 |
| $ | 15.47 |
| $ | 14.36 |
| $ | 14.10 |
|
|
| ||||||||||||||||||||||||||||||
Net investment income1 |
|
| 0.07 |
|
| 0.14 |
|
| 0.20 |
|
| 0.17 |
|
| 0.10 |
|
| 0.05 |
|
| 0.11 |
|
| 0.15 |
|
| 0.13 |
|
| 0.06 |
|
Net realized and unrealized gain (loss)2 |
|
| 1.98 |
|
| (4.86 | ) |
| (0.50 | ) |
| 2.34 |
|
| 0.49 |
|
| 1.98 |
|
| (4.85 | ) |
| (0.48 | ) |
| 2.33 |
|
| 0.49 |
|
|
| ||||||||||||||||||||||||||||||
Net increase (decrease) from investment operations |
|
| 2.05 |
|
| (4.72 | ) |
| (0.30 | ) |
| 2.51 |
|
| 0.59 |
|
| 2.03 |
|
| (4.74 | ) |
| (0.33 | ) |
| 2.46 |
|
| 0.55 |
|
|
| ||||||||||||||||||||||||||||||
Dividends and distributions from: |
|
|
|
|
|
|
|
|
|
|
|
|
|
|
|
|
|
|
|
|
|
|
|
|
|
|
|
|
|
|
|
Net investment income |
|
| (0.06 | ) |
| (0.15 | ) |
| (0.20 | ) |
| (0.17 | ) |
| (0.11 | ) |
| (0.04 | ) |
| (0.12 | ) |
| (0.16 | ) |
| (0.13 | ) |
| (0.07 | ) |
Net realized gain |
|
| — |
|
| (1.09 | ) |
| (1.19 | ) |
| (1.22 | ) |
| (0.22 | ) |
| — |
|
| (1.09 | ) |
| (1.19 | ) |
| (1.22 | ) |
| (0.22 | ) |
Tax return of capital |
|
| — |
|
| (0.12 | ) |
| — |
|
| — |
|
| — |
|
| — |
|
| (0.12 | ) |
| — |
|
| — |
|
| — |
|
|
| ||||||||||||||||||||||||||||||
Total dividends and distributions |
|
| (0.06 | ) |
| (1.36 | ) |
| (1.39 | ) |
| (1.39 | ) |
| (0.33 | ) |
| (0.04 | ) |
| (1.33 | ) |
| (1.35 | ) |
| (1.35 | ) |
| (0.29 | ) |
|
| ||||||||||||||||||||||||||||||
Net asset value, end of year |
| $ | 9.70 |
| $ | 7.71 |
| $ | 13.79 |
| $ | 15.48 |
| $ | 14.36 |
| $ | 9.71 |
| $ | 7.72 |
| $ | 13.79 |
| $ | 15.47 |
| $ | 14.36 |
|
|
| ||||||||||||||||||||||||||||||
|
|
|
|
|
|
|
|
|
|
|
|
|
|
|
|
|
|
|
|
|
|
|
|
|
|
|
|
|
|
|
|
Total Investment Return3 |
|
|
|
|
|
|
|
|
|
|
|
|
|
|
|
|
|
|
|
|
|
|
|
|
|
|
|
|
|
|
|
Based on net asset value |
|
| 26.67 | % |
| (34.01 | )% |
| (1.91 | )% |
| 17.49 | % |
| 4.16 | % |
| 26.36 | % |
| (34.19 | )% |
| (2.12 | )% |
| 17.14 | % |
| 3.88 | % |
|
| ||||||||||||||||||||||||||||||
|
|
|
|
|
|
|
|
|
|
|
|
|
|
|
|
|
|
|
|
|
|
|
|
|
|
|
|
|
|
|
|
Ratios to Average Net Assets4 |
|
|
|
|
|
|
|
|
|
|
|
|
|
|
|
|
|
|
|
|
|
|
|
|
|
|
|
|
|
|
|
Total expenses |
|
| 0.56 | % |
| 0.53 | % |
| 0.48 | % |
| 0.49 | % |
| 0.54 | % |
| 0.82 | % |
| 0.80 | % |
| 0.73 | % |
| 0.74 | % |
| 0.80 | % |
|
| ||||||||||||||||||||||||||||||
Total expenses after fees waived |
|
| 0.56 | % |
| 0.52 | % |
| 0.48 | % |
| 0.49 | % |
| 0.53 | % |
| 0.82 | % |
| 0.79 | % |
| 0.73 | % |
| 0.74 | % |
| 0.79 | % |
|
| ||||||||||||||||||||||||||||||
Net investment income |
|
| 0.85 | % |
| 1.19 | % |
| 1.23 | % |
| 1.10 | % |
| 0.69 | % |
| 0.59 | % |
| 0.91 | % |
| 0.98 | % |
| 0.84 | % |
| 0.43 | % |
|
| ||||||||||||||||||||||||||||||
|
|
|
|
|
|
|
|
|
|
|
|
|
|
|
|
|
|
|
|
|
|
|
|
|
|
|
|
|
|
|
|
Supplemental Data |
|
|
|
|
|
|
|
|
|
|
|
|
|
|
|
|
|
|
|
|
|
|
|
|
|
|
|
|
|
|
|
Net assets, end of year (000) |
| $ | 55,744 |
| $ | 46,285 |
| $ | 66,085 |
| $ | 79,032 |
| $ | 63,671 |
| $ | 38,340 |
| $ | 29,787 |
| $ | 47,605 |
| $ | 54,083 |
| $ | 48,896 |
|
|
| ||||||||||||||||||||||||||||||
Portfolio turnover of the Series |
|
| 43 | % |
| 42 | % |
| 26 | % |
| 40 | % |
| 37 | % |
| 43 | % |
| 42 | % |
| 26 | % |
| 40 | % |
| 37 | % |
|
| ||||||||||||||||||||||||||||||
|
|
1 | Based on average shares outstanding. |
|
|
2 | Includes a redemption fee, which is less than $0.01 per share. |
|
|
3 | Where applicable, total investment returns include the reinvestment of dividends and distributions. |
|
|
4 | Includes the Fund’s share of the Series’ allocated expenses and/or net investment income. |
|
|
|
See Notes to Financial Statements. | ||
10 | BLACKROCK SMALL CAP INDEX FUND | DECEMBER 31, 2009 |
|
|
|
|
BlackRock Small Cap Index Fund |
1. Organization and Significant Accounting Policies:
BlackRock Small Cap Index Fund (the “Fund”), a series of BlackRock Index Funds, Inc. (the “Corporation”), is registered under the Investment Company Act of 1940, as amended (the “1940 Act”), as a non-diversified, open-end management investment company. The Corporation is organized as a Maryland corporation. The Fund seeks to achieve its investment objective by investing all of its assets in Master Small Cap Index Series (the “Series”) of Quantitative Master Series LLC (the “Master LLC”), which has the same investment objective and strategies as the Fund. The value of the Fund’s investment in the Series reflects the Fund’s proportionate interest in the net assets of the Series. The performance of the Fund is directly affected by the performance of the Series. The percentage of the Series owned by the Fund at December 31, 2009 was 41%. The financial statements of the Series, including the Summary Schedule of Investments, are included elsewhere in this report and should be read in conjunction with the Fund’s financial statements. The Fund’s financial statements are prepared in conformity with accounting principles generally accepted in the United States of America, which may require the use of management accruals and estimates. Actual results may differ from these estimates. The Fund offers two classes of shares. Institutional and Investor A Shares are generally sold without the imposition of a front-end or deferred sales charge. Both classes of shares have identical voting, dividend, liquidation and other rights and the same terms and conditions, except that Investor A Shares bear certain expenses related to the shareholder servicing of such shares and have exclusive voting rights with respect to matters relating to its shareholder servicing expenditures.
The following is a summary of significant accounting policies followed by the Fund:
Valuation: The Fund records its investment in the Series at fair value. Valuation of securities held by the Series is discussed in Note 1 of the Series’ Notes to Financial Statements, which are included elsewhere in this report.
Fair Value Measurements: Various inputs are used in determining the fair value of investments, which are as follows:
|
|
|
| • | Level 1 — price quotations in active markets/exchanges for identical assets and liabilities |
|
|
|
| • | Level 2 — other observable inputs (including, but not limited to: quoted prices for similar assets or liabilities in markets that are active, quoted prices for identical or similar assets or liabilities in markets that are not active, inputs other than quoted prices that are observable for the assets or liabilities (such as interest rates, yield curves, volatilities, prepayment speeds, loss severities, credit risks and default rates) or other market corroborated inputs) |
|
|
|
| • | Level 3 — unobservable inputs based on the best information available in the circumstances, to the extent observable inputs are not available (including the Fund’s own assumptions used in determining the fair value of investments) |
The inputs or methodology used for valuing securities are not necessarily an indication of the risk associated with investing in those securities.
As of December 31, 2009, the Fund’s investment in the Series was classified as Level 2. More relevant disclosure regarding fair value measurements relating to the Series which is disclosed in the Series’ Summary Schedule of Investments included elsewhere in this report.
Investment Transactions and Investment Income: For financial reporting purposes, investment transactions in the Series are accounted for on a trade date basis. The Fund records daily its proportionate share of the Series’ income, expenses and realized and unrealized gains and losses. In addition, the Fund accrues its own expenses. Income, realized and unrealized gains and losses are allocated daily to each class based on its relative net assets.
Dividends and Distributions to Shareholders: Dividends and distributions paid by the Fund are recorded on the ex-dividend dates.
Income Taxes: It is the Fund’s policy to comply with the requirements of the Internal Revenue Code applicable to regulated investment companies and to distribute substantially all of its taxable income to its shareholders. Therefore, no federal income tax provision is required.
The Fund files US federal and various state and local tax returns. No income tax returns are currently under examination. The statute of limitations on the Fund’s US federal tax returns remains open for each of the four years ended December 31, 2009. The statutes of limitations on the Fund’s state and local tax returns may remain open for an additional year depending upon the jurisdiction.
Recent Accounting Standards: In June 2009, amended guidance was issued by the Financial Accounting Standards Board (“FASB”) for transfers of financial assets. This guidance is intended to improve the relevance, representational faithfulness and comparability of the information that a reporting entity provides in its financial statements about a transfer of financial assets; the effects of a transfer on its financial position, financial performance, and cash flows; and a transferor’s continuing involvement, if any, in transferred financial assets. The amended guidance is effective for financial statements for fiscal years and interim periods beginning after November 15, 2009. Earlier application is prohibited. The recognition and measurement provisions of this guidance must be applied to transfers occurring on or after the effective date. Additionally, the enhanced disclosure provisions of the amended guidance should be applied to transfers
|
|
|
BLACKROCK SMALL CAP INDEX FUND | DECEMBER 31, 2009 | 11 |
|
|
|
|
Notes to Financial Statements (continued) | BlackRock Small Cap Index Fund |
that occurred both before and after the effective date of this guidance. The impact of this guidance on the Fund’s financial statements and disclosures, if any, is currently being assessed.
In January 2010, the FASB issued amended guidance for improving disclosure about fair value measurements that adds new disclosure requirements about transfers into and out of Levels 1 and 2 and separate disclosures about purchases, sales, issuances and settlements in the reconciliation for fair value measurements using significant unobservable inputs (Level 3). It also clarifies existing disclosure requirements relating to the levels of disaggregation for fair value measurement and inputs and valuation techniques used to measure fair value. The amended guidance is effective for financial statements for fiscal years and interim periods beginning after December 15, 2009 except for disclosures about purchases, sales, issuances and settlements in the rollforward of activity in Level 3 fair value measurements, which are effective for fiscal years beginning after December 15, 2010 and for interim periods within those fiscal years. The impact of this guidance on the Fund’s financial statements and disclosures, if any, is currently being assessed.
Other: Expenses directly related to the Fund or its classes are charged to that Fund or class. Other operating expenses shared by several funds are pro rated among those funds on the basis of relative net assets or other appropriate methods. Other expenses of the Fund are allocated daily to each class based on its relative net assets.
2. Administration Agreement and Other Transactions with Affiliates:
The PNC Financial Services Group, Inc. (“PNC”), Bank of America Corporation (“BAC”) and Barclays Bank PLC (“Barclays”) are the largest stockholders of BlackRock, Inc. (“BlackRock”). Due to the ownership structure, PNC is an affiliate for 1940 Act purposes, but BAC and Barclays are not.
The Corporation, on behalf of the Fund, has entered into an Administration Agreement with BlackRock Advisors, LLC (the “Administrator”), an indirect, wholly owned subsidiary of BlackRock, to provide administrative services (other than investment advice and related portfolio activities) necessary for the operation of the Fund. For such services, the Fund pays the Administrator a monthly fee at an annual rate of 0.29% of the Fund’s average daily net assets.
The Administrator has entered into a voluntary arrangement with the Fund under which the annual operating expenses (after contractual fee waivers) incurred by each class of shares of the Fund (excluding service fees) will not exceed 0.60% for Institutional Shares and 0.85% for Investor A Shares. This arrangement has a one-year term and is renewable. This amount is shown as fees waived by administrator in the Statement of Operations.
The Corporation, on behalf of the Fund, has entered into a Distribution Agreement and Distribution Plan with BlackRock Investments, LLC (“BRIL”), which is an affiliate of BlackRock.
Pursuant to the Distribution Plans adopted by the Corporation in accordance with Rule 12b-1 under the 1940 Act, the Fund pays BRIL an ongoing service fee with respect to Investor A Shares. The fee is accrued daily and paid monthly at an annual rate of 0.25% based upon the average daily net assets of Investor A Shares.
Pursuant to sub-agreements with BRIL, broker-dealers and BRIL provide shareholder servicing to the Fund. The ongoing service fee compensates BRIL and each broker-dealer for providing shareholder servicing to Investor A shareholders.
PNC Global Investment Servicing (U.S.) Inc., an indirect, wholly owned subsidiary of PNC and an affiliate of the Administrator, serves as transfer agent and dividend disbursing agent. Each class of the Fund bears the costs of transfer agent fees associated with such respective class. Transfer agency fees borne by each class of the Fund are comprised of those fees charged for all shareholder communications including mailing of shareholder reports, dividend and distribution notices, and proxy materials for shareholder meetings, as well as per account and per transaction fees related to servicing and maintenance of shareholder accounts, including the issuing, redeeming and transferring of shares of each class of the Fund, 12b-1 fee calculation, check writing, anti-money laundering services, and customer identification services.
Pursuant to written agreements, certain affiliates provide the Fund with sub-accounting, recordkeeping, sub-transfer agency and other administrative services with respect to sub-accounts they service. For these services, these affiliates receive an annual fee per shareholder account which will vary depending on share class. For the year ended December 31, 2009, the Fund paid $5,835 in return for these services, which are included in transfer agent in the Statement of Operations.
The Administrator maintains a call center, which is responsible for providing certain shareholder services to the Fund, such as responding to shareholder inquiries and processing transactions based upon instructions from shareholders with respect to the subscription and redemption of Fund shares. For the year ended December 31, 2009, the Fund reimbursed the Administrator for costs incurred running the call center, which are included in the transfer agent in the Statement of Operations.
|
|
|
|
|
|
|
|
| Call Center Fees |
| |||
Institutional |
|
| $ | 367 |
|
|
Investor A |
|
| $ | 1,056 |
|
|
Certain officers and/or directors of the Corporation are officers and/or directors of BlackRock or its affiliates. The Fund reimburses the Administrator for compensation paid to the Corporation’s Chief Compliance Officer.
|
|
|
12 | BLACKROCK SMALL CAP INDEX FUND | DECEMBER 31, 2009 |
|
|
|
|
Notes to Financial Statements (concluded) | BlackRock Small Cap Index Fund |
3. Income Tax Information:
Reclassifications: Accounting principles generally accepted in the United States of America require that certain components of net assets be adjusted to reflect permanent differences between financial and tax reporting. These reclassifications have no effect on net assets or net asset values per share. The following permanent differences as of December 31, 2009 attributable to the sale of stock of passive foreign investment companies, the classification of settlement proceeds and in-kind withdrawals were reclassified to the following accounts:
|
|
|
|
|
Undistributed net investment income |
| $ | 6,669 |
|
Accumulated net realized loss allocated from Series |
| $ | (13,179,619 | ) |
Paid-in capital |
| $ | 13,172,950 |
|
The tax character of distributions paid during the fiscal years ended December 31, 2009 and 2008 was as follows:
|
|
|
|
|
|
|
|
|
| 12/31/09 |
| 12/31/08 |
| ||
Distributions paid from: |
|
|
|
|
|
|
|
Ordinary income |
| $ | 551,654 |
| $ | 1,680,670 |
|
Long-term capital gains |
|
| — |
|
| 8,947,999 |
|
Tax return of capital |
|
| — |
|
| 1,032,666 |
|
|
| ||||||
Total distributions |
| $ | 551,654 |
| $ | 11,661,335 |
|
|
| ||||||
As of December 31, 2009 the tax components of accumulated net losses were as follows:
|
|
|
|
|
Undistributed ordinary income |
| $ | 39,363 |
|
Capital loss carryforwards |
|
| (24,323,969 | ) |
Net unrealized gains* |
|
| 884,477 |
|
|
| |||
Total |
| $ | (23,400,129 | ) |
|
|
|
|
|
| * | The differences between book-basis and tax-basis net unrealized gains were attributable primarily to the tax deferral of losses on wash sales, the realization for tax purposes of unrealized gains on investments in passive foreign investment companies, the treatment of certain security lending transactions, the realization for tax purposes of unrealized gains/(losses) on certain futures contracts, the classification of settlement proceeds and other temporary differences. |
As of December 31, 2009, the Fund had capital loss carryforwards in the amount of $24,323,969 available to offset future realized capital gains, which expires December 31, 2017.
4. Capital Share Transactions:
Transactions in capital shares for each class were as follows:
|
|
|
|
|
|
|
|
|
|
|
|
|
|
|
| Year Ended |
| Year Ended |
| ||||||||
|
|
| |||||||||||
|
|
| Shares |
|
| Amount |
|
| Shares |
|
| Amount |
|
Institutional |
|
|
|
|
|
|
|
|
|
|
|
|
|
Shares sold |
|
| 2,468,390 |
| $ | 19,948,606 |
|
| 2,634,785 |
| $ | 28,589,997 |
|
Shares issued to shareholders in reinvestment of dividends and distributions |
|
| 37,621 |
|
| 356,525 |
|
| 921,616 |
|
| 6,983,184 |
|
|
|
| |||||||||||
Total issued |
|
| 2,506,011 |
|
| 20,305,131 |
|
| 3,556,401 |
|
| 35,573,181 |
|
Shares redeemed |
|
| (2,765,597 | ) |
| (22,094,097 | ) |
| (2,343,736 | ) |
| (25,630,390 | ) |
|
|
| |||||||||||
Net increase (decrease) |
|
| (259,586 | ) | $ | (1,788,966 | ) |
| 1,212,665 |
| $ | 9,942,791 |
|
|
|
| |||||||||||
|
|
|
|
|
|
|
|
|
|
|
|
|
|
Investor A |
|
|
|
|
|
|
|
|
|
|
|
|
|
Shares sold |
|
| 913,818 |
| $ | 7,405,033 |
|
| 626,761 |
| $ | 7,412,916 |
|
Shares issued to shareholders in reinvestment of dividends and distributions |
|
| 16,832 |
|
| 159,562 |
|
| 525,666 |
|
| 3,995,432 |
|
|
|
| |||||||||||
Total issued |
|
| 930,650 |
|
| 7,564,595 |
|
| 1,152,427 |
|
| 11,408,348 |
|
Shares redeemed |
|
| (842,085 | ) |
| (6,779,501 | ) |
| (744,332 | ) |
| (8,328,875 | ) |
|
|
| |||||||||||
Net increase |
|
| 88,565 |
| $ | 785,094 |
|
| 408,095 |
| $ | 3,079,473 |
|
|
|
| |||||||||||
There is a 2% redemption fee on shares redeemed or exchanged that have been held for 30 days or less. The redemption fees are collected and retained by the Fund for the benefit of the remaining shareholders. The redemption fees are recorded as a credit to paid-in capital.
5. Subsequent Events:
Management has evaluated the impact of all subsequent events on the Fund through February 26, 2010, the date the financial statements were issued, and has determined that there were no subsequent events requiring adjustment or additional disclosure in the financial statements.
|
|
|
BLACKROCK SMALL CAP INDEX FUND | DECEMBER 31, 2009 | 13 |
|
|
|
|
BlackRock Small Cap Index Fund |
To the Shareholders and Board of Directors of BlackRock Index Funds, Inc.:
We have audited the accompanying statement of assets and liabilities, of BlackRock Small Cap Index Fund, one of the series constituting BlackRock Index Funds, Inc., (the “Fund”) as of December 31, 2009, and the related statement of operations for the year then ended, the statements of changes in net assets for each of the two years in the period then ended, and the financial highlights for each of the five years in the period then ended. These financial statements and financial highlights are the responsibility of the Fund’s management. Our responsibility is to express an opinion on these financial statements and financial highlights based on our audits.
We conducted our audits in accordance with the standards of the Public Company Accounting Oversight Board (United States). Those standards require that we plan and perform the audit to obtain reasonable assurance about whether the financial statements and financial highlights are free of material misstatement. The Fund is not required to have, nor were we engaged to perform, an audit of its internal control over financial reporting. Our audits included consideration of internal control over financial reporting as a basis for designing audit procedures that are appropriate in the circumstances, but not for the purpose of expressing an opinion on the effectiveness of the Fund’s internal control over financial reporting. Accordingly, we express no such opinion. An audit also includes examining, on a test basis, evidence supporting the amounts and disclosures in the financial statements, assessing the accounting principles used and significant estimates made by management, as well as evaluating the overall financial statement presentation. We believe that our audits provide a reasonable basis for our opinion.
In our opinion, the financial statements and financial highlights referred to above present fairly, in all material respects, the financial position of BlackRock Small Cap Index Fund of BlackRock Index Funds, Inc. as of December 31, 2009, the results of its operations for the year then ended, the changes in its net assets for each of the two years in the period then ended, and the financial highlights for each of the five years in the period then ended, in conformity with accounting principles generally accepted in the United States of America.
Deloitte & ToucheLLP
Princeton, New Jersey
February 26, 2010
|
The entire amount of the ordinary income distribution paid by BlackRock Small Cap Index Fund of BlackRock Index Funds, Inc., during the taxable year ended December 31, 2009 qualifies for the dividends received deduction for corporations and consists entirely of qualified dividend income for individuals.
|
|
|
14 | BLACKROCK SMALL CAP INDEX FUND | DECEMBER 31, 2009 |
|
|
|
|
Master Small Cap Index Series |
|
As of December 31, 2009 |
|
|
|
|
|
Ten Largest Holdings |
| Percent of | ||
Human Genome Sciences, Inc. |
|
| 0.6 | % |
Tupperware Corp. |
|
| 0.3 |
|
3Com Corp. |
|
| 0.3 |
|
E*Trade Financial Corp. |
|
| 0.3 |
|
Assured Guaranty Ltd. |
|
| 0.3 |
|
Solera Holdings, Inc. |
|
| 0.3 |
|
Highwoods Properties, Inc. |
|
| 0.3 |
|
Skyworks Solutions, Inc. |
|
| 0.2 |
|
Domtar Corp. |
|
| 0.2 |
|
J. Crew Group, Inc. |
|
| 0.2 |
|
|
|
|
|
|
Sector Allocation |
| Percent of | ||
Financial Services |
|
| 21 | % |
Technology |
|
| 16 |
|
Health Care |
|
| 14 |
|
Producer Durables |
|
| 14 |
|
Consumer Discretionary & Services |
|
| 12 |
|
Materials & Processing |
|
| 7 |
|
Energy |
|
| 5 |
|
Utilities |
|
| 4 |
|
Consumer Discretionary |
|
| 3 |
|
Consumer Staples |
|
| 3 |
|
Materials & Processing |
|
| 1 |
|
|
|
| For Series compliance purposes, the Series’ sector classifications refer to any one or more of the sector sub-classifications used by one or more widely recognized market indexes, and/or as defined by Series management. This definition may not apply for purposes of this report, which may combine sector sub-classifications for reporting ease. |
|
|
|
BLACKROCK SMALL CAP INDEX FUND | DECEMBER 31, 2009 | 15 |
|
|
|
|
Master Small Cap Index Series | |
| (Percentages shown are based on Net Assets) |
This summary schedule of investments is presented to help investors focus on the Series’ principal holdings. It includes the Series’ 50 largest holdings, each investment of any issuer that exceeds 1% of the Series’ net assets and affiliated issues. “Other Securities” represents all issues not required to be disclosed under the rules adopted by the Securities and Exchange Commission. A complete schedule of investments is available without charge, upon request, by calling (800) 441-7762 or on the Securities and Exchange Commission’s website at http://www.sec.gov.
|
|
|
|
|
|
|
|
|
|
|
|
|
Industry |
| Common Stocks |
|
| Shares |
| Value |
| Percent |
| ||
Advertising Agencies |
| Other Securities |
|
|
|
| $ | 1,209,229 |
| 0.5 | % |
|
Aerospace |
| Other Securities |
|
|
|
|
| 2,985,173 |
| 1.3 |
|
|
Agriculture, Fishing & Ranching |
| Other Securities |
|
|
|
|
| 923,904 |
| 0.4 |
|
|
Air Transport |
| UAL Corp. (a)(b) |
|
| 39,900 |
|
| 515,109 |
| 0.2 |
|
|
|
| Other Securities |
|
|
|
|
| 2,109,678 |
| 0.9 |
|
|
|
|
|
|
|
|
| ||||||
|
|
|
|
|
|
|
| 2,624,787 |
| 1.1 |
|
|
Alternative Energy |
| Other Securities |
|
|
|
|
| 543,253 |
| 0.2 |
|
|
Aluminum |
| Other Securities |
|
|
|
|
| 370,245 |
| 0.2 |
|
|
Asset Management & Custodian |
| Other Securities |
|
|
|
|
| 2,272,509 |
| 1.0 |
|
|
Auto Parts |
| Other Securities |
|
|
|
|
| 1,532,701 |
| 0.7 |
|
|
Auto Services |
| Other Securities |
|
|
|
|
| 280,700 |
| 0.1 |
|
|
Banks: Diversified |
| FirstMerit Corp. |
|
| 19,529 |
|
| 393,314 |
| 0.2 |
|
|
|
| Prosperity Bancshares, Inc. |
|
| 11,400 |
|
| 461,358 |
| 0.2 |
|
|
|
| SVB Financial Group (a) |
|
| 9,600 |
|
| 400,224 |
| 0.2 |
|
|
|
| Other Securities |
|
|
|
|
| 11,957,987 |
| 5.2 |
|
|
|
|
|
|
|
|
| ||||||
|
|
|
|
|
|
|
| 13,212,883 |
| 5.8 |
|
|
Banks: Savings, Thrift & Mortgage Lending |
| Other Securities |
|
|
|
|
| 2,354,824 |
| 1.0 |
|
|
Beverage: Brewers & Distillers |
| Other Securities |
|
|
|
|
| 88,540 |
| 0.0 |
|
|
Beverage: Soft Drinks |
| Other Securities |
|
|
|
|
| 326,398 |
| 0.1 |
|
|
Biotechnology |
| Human Genome Sciences, Inc. (a) |
|
| 43,600 |
|
| 1,334,160 |
| 0.6 |
|
|
|
| Onyx Pharmaceuticals, Inc. (a) |
|
| 14,820 |
|
| 434,819 |
| 0.2 |
|
|
|
| Other Securities |
|
|
|
|
| 7,183,001 |
| 3.1 |
|
|
|
|
|
|
|
|
| ||||||
|
|
|
|
|
|
|
| 8,951,980 |
| 3.9 |
|
|
Building Materials |
| Other Securities |
|
|
|
|
| 2,116,429 |
| 0.9 |
|
|
Building: Climate Control |
| Other Securities |
|
|
|
|
| 312,468 |
| 0.1 |
|
|
Building: Roofing, Wallboard & Plumbing |
| Other Securities |
|
|
|
|
| 162,400 |
| 0.1 |
|
|
Cable Television Services |
| Other Securities |
|
|
|
|
| 120,903 |
| 0.1 |
|
|
Casinos & Gambling |
| Bally Technologies, Inc. (a) |
|
| 12,800 |
|
| 528,512 |
| 0.2 |
|
|
|
| Other Securities |
|
|
|
|
| 481,517 |
| 0.2 |
|
|
|
|
|
|
|
|
| ||||||
|
|
|
|
|
|
|
| 1,010,029 |
| 0.4 |
|
|
Cement |
| Other Securities |
|
|
|
|
| 7,644 |
| 0.0 |
|
|
Chemicals: Diversified |
| W.R. Grace & Co. (a) |
|
| 17,300 |
|
| 438,555 |
| 0.2 |
|
|
|
| Other Securities |
|
|
|
|
| 2,517,683 |
| 1.1 |
|
|
|
|
|
|
|
|
| ||||||
|
|
|
|
|
|
|
| 2,956,238 |
| 1.3 |
|
|
Chemicals: Specialty |
| Other Securities |
|
|
|
|
| 1,040,752 |
| 0.5 |
|
|
Coal |
| Other Securities |
|
|
|
|
| 588,134 |
| 0.3 |
|
|
Commercial Finance & Mortgage Companies |
| Other Securities |
|
|
|
|
| 232,499 |
| 0.1 |
|
|
Commercial Services |
| Watson Wyatt Worldwide, Inc. (a) |
|
| 9,915 |
|
| 471,161 |
| 0.2 |
|
|
|
| Other Securities |
|
|
|
|
| 5,434,300 |
| 2.4 |
|
|
|
|
|
|
|
|
| ||||||
|
|
|
|
|
|
|
| 5,905,461 |
| 2.6 |
|
|
Commercial Services: Rental & Leasing |
| Other Securities |
|
|
|
|
| 1,030,724 |
| 0.4 |
|
|
|
|
|
See Notes to Financial Statements. |
| |
16 | BLACKROCK SMALL CAP INDEX FUND | DECEMBER 31, 2009 |
|
|
|
|
|
|
|
Summary Schedule of Investments (continued) | Master Small Cap Index Series |
| (Percentages shown are based on Net Assets) |
|
|
|
|
|
|
|
|
|
|
|
|
|
Industry |
| Common Stocks |
| Shares |
| Value |
| Percent |
| |||
Commercial Vehicles & Parts |
| Other Securities |
|
|
|
| $ | 391,538 |
| 0.2 | % |
|
Communications Technology |
| 3Com Corp. (a) |
|
| 93,000 |
|
| 697,500 |
| 0.3 |
|
|
|
| Polycom, Inc. (a) |
|
| 19,600 |
|
| 489,412 |
| 0.2 |
|
|
|
| Other Securities |
|
|
|
|
| 5,462,788 |
| 2.4 |
|
|
|
|
|
|
|
|
| ||||||
|
|
|
|
|
|
|
| 6,649,700 |
| 2.9 |
|
|
Computer Services Software & Systems |
| Concur Technologies, Inc. (a) |
|
| 9,800 |
|
| 418,950 |
| 0.2 |
|
|
|
| Informatica Corp. (a) |
|
| 20,800 |
|
| 537,888 |
| 0.2 |
|
|
|
| Parametric Technology Corp. (a) |
|
| 28,160 |
|
| 460,134 |
| 0.2 |
|
|
|
| Solera Holdings, Inc. |
|
| 16,900 |
|
| 608,569 |
| 0.3 |
|
|
|
| Other Securities |
|
|
|
|
| 13,236,890 |
| 5.8 |
|
|
|
|
|
|
|
|
| ||||||
|
|
|
|
|
|
|
| 15,262,431 |
| 6.7 |
|
|
Computer Technology |
| Other Securities |
|
|
|
|
| 1,972,245 |
| 0.9 |
|
|
Construction |
| EMCOR Group, Inc. (a) |
|
| 16,172 |
|
| 435,027 |
| 0.2 |
|
|
|
| Other Securities |
|
|
|
|
| 874,632 |
| 0.4 |
|
|
|
|
|
|
|
|
| ||||||
|
|
|
|
|
|
|
| 1,309,659 |
| 0.6 |
|
|
Consumer Electronics |
| Other Securities |
|
|
|
|
| 371,101 |
| 0.2 |
|
|
Consumer Lending |
| Other Securities |
|
|
|
|
| 1,553,633 |
| 0.7 |
|
|
Consumer Services: Miscellaneous |
| Other Securities |
|
|
|
|
| 1,581,684 |
| 0.7 |
|
|
Containers & Packaging |
| Rock-Tenn Co., Class A |
|
| 9,180 |
|
| 462,764 |
| 0.2 |
|
|
|
| Other Securities |
|
|
|
|
| 607,852 |
| 0.3 |
|
|
|
|
|
|
|
|
| ||||||
|
|
|
|
|
|
|
| 1,070,616 |
| 0.5 |
|
|
Cosmetics |
| Other Securities |
|
|
|
|
| 409,526 |
| 0.2 |
|
|
Diversified Financial Services |
| Stifel Financial Corp. (a) |
|
| 7,149 |
|
| 423,507 |
| 0.2 |
|
|
|
| Other Securities |
|
|
|
|
| 635,907 |
| 0.3 |
|
|
|
|
|
|
|
|
| ||||||
|
|
|
|
|
|
|
| 1,059,414 |
| 0.5 |
|
|
Diversified Manufacturing Operations |
| Other Securities |
|
|
|
|
| 540,315 |
| 0.2 |
|
|
Diversified Materials & Processing |
| Clarcor, Inc. |
|
| 12,610 |
|
| 409,068 |
| 0.2 |
|
|
|
| Other Securities |
|
|
|
|
| 1,455,413 |
| 0.6 |
|
|
|
|
|
|
|
|
| ||||||
|
|
|
|
|
|
|
| 1,864,481 |
| 0.8 |
|
|
Diversified Media |
| Other Securities |
|
|
|
|
| 180,998 |
| 0.1 |
|
|
Diversified Retail |
| Other Securities |
|
|
|
|
| 1,300,468 |
| 0.6 |
|
|
Drug & Grocery Store Chains |
| Other Securities |
|
|
|
|
| 1,532,603 |
| 0.7 |
|
|
Education Services |
| Other Securities |
|
|
|
|
| 1,394,633 |
| 0.6 |
|
|
Electronic Components |
| Other Securities |
|
|
|
|
| 1,267,286 |
| 0.5 |
|
|
Electronic Entertainment |
| Other Securities |
|
|
|
|
| 404,948 |
| 0.2 |
|
|
Electronics |
| Other Securities |
|
|
|
|
| 1,115,376 |
| 0.5 |
|
|
Energy Equipment |
| Other Securities |
|
|
|
|
| 391,344 |
| 0.2 |
|
|
Engineering & Contracting Services |
| Other Securities |
|
|
|
|
| 1,048,636 |
| 0.5 |
|
|
Entertainment |
| Other Securities |
|
|
|
|
| 636,831 |
| 0.3 |
|
|
Financial Data & Systems |
| Jack Henry & Associates, Inc. |
|
| 20,100 |
|
| 464,712 |
| 0.2 |
|
|
|
| Other Securities |
|
|
|
|
| 1,992,463 |
| 0.9 |
|
|
|
|
|
|
|
|
| ||||||
|
|
|
|
|
|
|
| 2,457,175 |
| 1.1 |
|
|
Foods |
| Other Securities |
|
|
|
|
| 2,646,795 |
| 1.2 |
|
|
Forest Products |
| Other Securities |
|
|
|
|
| 295,680 |
| 0.1 |
|
|
Forms & Bulk Printing Services |
| Other Securities |
|
|
|
|
| 684,581 |
| 0.3 |
|
|
Funeral Parlors & Cemeteries |
| Other Securities |
|
|
|
|
| 366,924 |
| 0.2 |
|
|
Gas Pipeline |
| Other Securities |
|
|
|
|
| 55,660 |
| 0.0 |
|
|
Glass |
| Other Securities |
|
|
|
|
| 99,400 |
| 0.0 |
|
|
|
|
|
See Notes to Financial Statements. |
|
|
BLACKROCK SMALL CAP INDEX FUND | DECEMBER 31, 2009 | 17 |
|
|
| |
Summary Schedule of Investments (continued) | Master Small Cap Index Series |
| (Percentages shown are based on Net Assets) |
|
|
|
|
|
|
|
|
|
|
|
|
|
Industry |
| Common Stocks |
| Shares |
| Value |
| Percent |
| |||
Gold |
| Other Securities |
|
|
|
| $ | 561,406 |
| 0.2 | % |
|
Health Care Facilities |
| Other Securities |
|
|
|
|
| 1,326,509 |
| 0.6 |
|
|
Health Care Management Services |
| Other Securities |
|
|
|
|
| 2,369,614 |
| 1.0 |
|
|
Health Care Services |
| HealthSouth Corp. (a) |
|
| 22,000 |
|
| 412,940 |
| 0.2 |
|
|
|
| Other Securities |
|
|
|
|
| 4,237,718 |
| 1.8 |
|
|
|
|
|
|
|
|
| ||||||
|
|
|
|
|
|
|
| 4,650,658 |
| 2.0 |
|
|
Health Care: Miscellaneous |
| Other Securities |
|
|
|
|
| 255,258 |
| 0.1 |
|
|
Home Building |
| Other Securities |
|
|
|
|
| 585,005 |
| 0.3 |
|
|
Hotel/Motel |
| Other Securities |
|
|
|
|
| 482,322 |
| 0.2 |
|
|
Household Appliances |
| Other Securities |
|
|
|
|
| 114,692 |
| 0.0 |
|
|
Household Equipment & Products |
| Tupperware Corp. |
|
| 15,174 |
|
| 706,653 |
| 0.3 |
|
|
|
| Other Securities |
|
|
|
|
| 627,409 |
| 0.3 |
|
|
|
|
|
|
|
|
| ||||||
|
|
|
|
|
|
|
| 1,334,062 |
| 0.6 |
|
|
Household Furnishings |
| Tempur-Pedic International, Inc. (a) |
|
| 17,900 |
|
| 422,977 |
| 0.2 |
|
|
|
| Other Securities |
|
|
|
|
| 435,564 |
| 0.2 |
|
|
|
|
|
|
|
|
| ||||||
|
|
|
|
|
|
|
| 858,541 |
| 0.4 |
|
|
Insurance: Life |
| Other Securities |
|
|
|
|
| 978,894 |
| 0.4 |
|
|
Insurance: Multi-Line |
| Assured Guaranty Ltd. |
|
| 29,200 |
|
| 635,392 |
| 0.3 |
|
|
|
| Platinum Underwriters Holdings Ltd. |
|
| 11,900 |
|
| 455,651 |
| 0.2 |
|
|
|
| Other Securities |
|
|
|
|
| 967,655 |
| 0.4 |
|
|
|
|
|
|
|
|
| ||||||
|
|
|
|
|
|
|
| 2,058,698 |
| 0.9 |
|
|
Insurance: Property-Casualty |
| ProAssurance Corp. (a) |
|
| 8,023 |
|
| 430,915 |
| 0.2 |
|
|
|
| Other Securities |
|
|
|
|
| 3,906,752 |
| 1.7 |
|
|
|
|
|
|
|
|
| ||||||
|
|
|
|
|
|
|
| 4,337,667 |
| 1.9 |
|
|
Leisure Time |
| Other Securities |
|
|
|
|
| 1,406,368 |
| 0.6 |
|
|
Luxury Items |
| Other Securities |
|
|
|
|
| 476,641 |
| 0.2 |
|
|
Machinery: Agricultural |
| Other Securities |
|
|
|
|
| 225,750 |
| 0.1 |
|
|
Machinery: Construction & Handling |
| Other Securities |
|
|
|
|
| 190,761 |
| 0.1 |
|
|
Machinery: Engines |
| Other Securities |
|
|
|
|
| 279,205 |
| 0.1 |
|
|
Machinery: Industrial |
| Nordson Corp. |
|
| 8,210 |
|
| 502,288 |
| 0.2 |
|
|
|
| Other Securities |
|
|
|
|
| 2,208,199 |
| 1.0 |
|
|
|
|
|
|
|
|
| ||||||
|
|
|
|
|
|
|
| 2,710,487 |
| 1.2 |
|
|
Machinery: Specialty |
| Other Securities |
|
|
|
|
| 315,396 |
| 0.1 |
|
|
Manufactured Housing |
| Other Securities |
|
|
|
|
| 88,770 |
| 0.0 |
|
|
Medical & Dental Instruments & Supplies |
| Owens & Minor, Inc. |
|
| 9,698 |
|
| 416,335 |
| 0.2 |
|
|
|
| Other Securities |
|
|
|
|
| 5,839,090 |
| 2.5 |
|
|
|
|
|
|
|
|
| ||||||
|
|
|
|
|
|
|
| 6,255,425 |
| 2.7 |
|
|
Medical Equipment |
| Other Securities |
|
|
|
|
| 3,879,084 |
| 1.7 |
|
|
Medical Services |
| Other Securities |
|
|
|
|
| 789,054 |
| 0.3 |
|
|
Metal Fabricating |
| Other Securities |
|
|
|
|
| 1,623,438 |
| 0.7 |
|
|
Metals & Minerals: Diversified |
| Other Securities |
|
|
|
|
| 952,111 |
| 0.4 |
|
|
Office Supplies & Equipment |
| Other Securities |
|
|
|
|
| 1,420,954 |
| 0.6 |
|
|
Offshore Drilling & Other Services |
| Other Securities |
|
|
|
|
| 148,551 |
| 0.1 |
|
|
Oil Well Equipment & Services |
| Dril-Quip, Inc. (a) |
|
| 7,076 |
|
| 399,652 |
| 0.2 |
|
|
|
| Other Securities |
|
|
|
|
| 2,912,232 |
| 1.2 |
|
|
|
|
|
|
|
|
| ||||||
|
|
|
|
|
|
|
| 3,311,884 |
| 1.4 |
|
|
|
|
|
See Notes to Financial Statements. | ||
18 | BLACKROCK SMALL CAP INDEX FUND | DECEMBER 31, 2009 |
|
|
| |
Summary Schedule of Investments (continued) | Master Small Cap Index Series |
| (Percentages shown are based on Net Assets) |
|
|
|
|
|
|
|
|
|
|
|
|
|
Industry |
| Common Stocks |
| Shares |
| Value |
| Percent |
| |||
Oil: Crude Producers |
| Arena Resources, Inc. (a) |
|
| 9,300 |
| $ | 401,016 |
| 0.2 | % |
|
|
| Atlas Energy, Inc. |
|
| 16,087 |
|
| 485,345 |
| 0.2 |
|
|
|
| Other Securities |
|
|
|
|
| 4,362,795 |
| 1.9 |
|
|
|
|
|
|
|
|
| ||||||
|
|
|
|
|
|
|
| 5,249,156 |
| 2.3 |
|
|
Oil: Integrated |
| Other Securities |
|
|
|
|
| 115,125 |
| 0.0 |
|
|
Paints & Coatings |
| Other Securities |
|
|
|
|
| 469,513 |
| 0.2 |
|
|
Paper |
| Domtar Corp. (a) |
|
| 10,100 |
|
| 559,641 |
| 0.3 |
|
|
|
| Other Securities |
|
|
|
|
| 950,550 |
| 0.4 |
|
|
|
|
|
|
|
|
| ||||||
|
|
|
|
|
|
|
| 1,510,191 |
| 0.7 |
|
|
Personal Care |
| Chattem, Inc. (a) |
|
| 4,600 |
|
| 429,180 |
| 0.2 |
|
|
|
| Other Securities |
|
|
|
|
| 240,111 |
| 0.1 |
|
|
|
|
|
|
|
|
| ||||||
|
|
|
|
|
|
|
| 669,291 |
| 0.3 |
|
|
Pharmaceuticals |
| Other Securities |
|
|
|
|
| 3,849,853 |
| 1.7 |
|
|
Photography |
| Other Securities |
|
|
|
|
| 293,256 |
| 0.1 |
|
|
Plastics |
| Other Securities |
|
|
|
|
| 78,530 |
| 0.0 |
|
|
Power Transmission Equipment |
| Regal-Beloit Corp. |
|
| 8,551 |
|
| 444,139 |
| 0.2 |
|
|
|
| Other Securities |
|
|
|
|
| 329,228 |
| 0.1 |
|
|
|
|
|
|
|
|
| ||||||
|
|
|
|
|
|
|
| 773,367 |
| 0.3 |
|
|
Precious Metals & Minerals |
| Other Securities |
|
|
|
|
| 222,907 |
| 0.1 |
|
|
Printing & Copying Services |
| Other Securities |
|
|
|
|
| 105,875 |
| 0.0 |
|
|
Producer Durables: Miscellaneous |
| Other Securities |
|
|
|
|
| 144,315 |
| 0.1 |
|
|
Production Technology Equipment |
| Other Securities |
|
|
|
|
| 2,369,944 |
| 1.0 |
|
|
Publishing |
| Other Securities |
|
|
|
|
| 368,511 |
| 0.2 |
|
|
Radio & TV Broadcasters |
| Other Securities |
|
|
|
|
| 128,827 |
| 0.1 |
|
|
Railroad Equipment |
| Other Securities |
|
|
|
|
| 135,620 |
| 0.1 |
|
|
Railroads |
| Other Securities |
|
|
|
|
| 343,360 |
| 0.1 |
|
|
Real Estate |
| Other Securities |
|
|
|
|
| 409,562 |
| 0.2 |
|
|
Real Estate Investment Trusts (REITs) |
| Highwoods Properties, Inc. |
|
| 17,300 |
|
| 576,955 |
| 0.2 |
|
|
|
| MFA Financial, Inc. |
|
| 67,700 |
|
| 497,595 |
| 0.2 |
|
|
|
| National Retail Properties, Inc. |
|
| 19,675 |
|
| 417,504 |
| 0.2 |
|
|
|
| Omega Healthcare Investors, Inc. |
|
| 20,400 |
|
| 396,780 |
| 0.2 |
|
|
|
| Washington REIT |
|
| 14,365 |
|
| 395,756 |
| 0.2 |
|
|
|
| Other Securities |
|
|
|
|
| 11,846,327 |
| 5.2 |
|
|
|
|
|
|
|
|
| ||||||
|
|
|
|
|
|
|
| 14,130,917 |
| 6.2 |
|
|
Recreational Vehicles & Boats |
| Other Securities |
|
|
|
|
| 800,568 |
| 0.3 |
|
|
Rental & Leasing Services: Consumer |
| Other Securities |
|
|
|
|
| 857,321 |
| 0.4 |
|
|
Restaurants |
| Other Securities |
|
|
|
|
| 2,972,811 |
| 1.3 |
|
|
Scientific Instruments: Control & Filter |
| Other Securities |
|
|
|
|
| 1,816,142 |
| 0.8 |
|
|
Scientific Instruments: Electrical |
| American Superconductor Corp. (a)(b) |
|
| 10,200 |
|
| 417,180 |
| 0.2 |
|
|
|
| GrafTech International Ltd. (a) |
|
| 29,444 |
|
| 457,854 |
| 0.2 |
|
|
|
| Other Securities |
|
|
|
|
| 1,592,022 |
| 0.7 |
|
|
|
|
|
|
|
|
| ||||||
|
|
|
|
|
|
|
| 2,467,056 |
| 1.1 |
|
|
Scientific Instruments: Gauges & Meters |
| Other Securities |
|
|
|
|
| 304,296 |
| 0.1 |
|
|
Scientific Instruments: Pollution Control |
| Other Securities |
|
|
|
|
| 995,650 |
| 0.4 |
|
|
Securities Brokerage & Services |
| E*Trade Financial Corp. (a) |
|
| 372,500 |
|
| 651,875 |
| 0.3 |
|
|
|
| Other Securities |
|
|
|
|
| 1,436,560 |
| 0.6 |
|
|
|
|
|
|
|
|
| ||||||
|
|
|
|
|
|
|
| 2,088,435 |
| 0.9 |
|
|
|
|
|
See Notes to Financial Statements. |
|
|
BLACKROCK SMALL CAP INDEX FUND | DECEMBER 31, 2009 | 19 |
|
|
| |
Summary Schedule of Investments (continued) | Master Small Cap Index Series |
| (Percentages shown are based on Net Assets) |
|
|
|
|
|
|
|
|
|
|
|
|
|
Industry |
| Common Stocks |
| Shares |
| Value |
| Percent |
| |||
Semiconductors & Components |
| Atheros Communications, Inc. (a) |
|
| 15,370 |
| $ | 526,269 |
| 0.2 | % |
|
|
| Skyworks Solutions, Inc. (a) |
|
| 40,033 |
|
| 568,068 |
| 0.2 |
|
|
|
| Other Securities |
|
|
|
|
| 4,737,920 |
| 2.1 |
|
|
|
|
|
|
|
|
| ||||||
|
|
|
|
|
|
|
| 5,832,257 |
| 2.5 |
|
|
Shipping |
| Other Securities |
|
|
|
|
| 1,297,636 |
| 0.6 |
|
|
Specialty Retail |
| Tractor Supply Co. (a) |
|
| 8,700 |
|
| 460,752 |
| 0.2 |
|
|
|
| Other Securities |
|
|
|
|
| 6,833,688 |
| 3.0 |
|
|
|
|
|
|
|
|
| ||||||
|
|
|
|
|
|
|
| 7,294,440 |
| 3.2 |
|
|
Steel |
| Other Securities |
|
|
|
|
| 132,021 |
| 0.1 |
|
|
Sugar |
| Other Securities |
|
|
|
|
| 43,600 |
| 0.0 |
|
|
Synthetic Fibers & Chemicals |
| Other Securities |
|
|
|
|
| 65,550 |
| 0.0 |
|
|
Technology: Miscellaneous |
| Other Securities |
|
|
|
|
| 781,324 |
| 0.3 |
|
|
Telecommunications Equipment |
| Other Securities |
|
|
|
|
| 1,017,303 |
| 0.4 |
|
|
Textile Products |
| Other Securities |
|
|
|
|
| 146,785 |
| 0.1 |
|
|
Textiles Apparel & Shoes |
| J. Crew Group, Inc. (a) |
|
| 12,070 |
|
| 540,012 |
| 0.2 |
|
|
|
| The Warnaco Group, Inc. (a) |
|
| 10,700 |
|
| 451,433 |
| 0.2 |
|
|
|
| Other Securities |
|
|
|
|
| 3,725,932 |
| 1.6 |
|
|
|
|
|
|
|
|
| ||||||
|
|
|
|
|
|
|
| 4,717,377 |
| 2.0 |
|
|
Tobacco |
| Other Securities |
|
|
|
|
| 510,131 |
| 0.2 |
|
|
Toys |
| Other Securities |
|
|
|
|
| 175,888 |
| 0.1 |
|
|
Transportation: Miscellaneous |
| Other Securities |
|
|
|
|
| 396,281 |
| 0.2 |
|
|
Truckers |
| Other Securities |
|
|
|
|
| 1,459,630 |
| 0.6 |
|
|
Utilities: Electrical |
| Cleco Corp. |
|
| 14,667 |
|
| 400,849 |
| 0.2 |
|
|
|
| Other Securities |
|
|
|
|
| 3,544,144 |
| 1.5 |
|
|
|
|
|
|
|
|
| ||||||
|
|
|
|
|
|
|
| 3,944,993 |
| 1.7 |
|
|
Utilities: Gas Distributors |
| Nicor, Inc. (c) |
|
| 10,600 |
|
| 446,260 |
| 0.2 |
|
|
|
| Piedmont Natural Gas Co. |
|
| 18,000 |
|
| 481,500 |
| 0.2 |
|
|
|
| Other Securities |
|
|
|
|
| 1,856,979 |
| 0.8 |
|
|
|
|
|
|
|
|
| ||||||
|
|
|
|
|
|
|
| 2,784,739 |
| 1.2 |
|
|
Utilities: Telecommunications |
| Other Securities |
|
|
|
|
| 2,096,170 |
| 0.9 |
|
|
Utilities: Water |
| Other Securities |
|
|
|
|
| 708,530 |
| 0.3 |
|
|
|
| Total Common Stocks |
|
|
|
|
| 224,138,747 |
| 97.6 |
|
|
|
|
|
|
|
|
|
|
|
|
|
|
|
|
|
|
|
|
|
|
|
|
|
|
|
|
|
| Investment Companies |
|
|
|
|
|
|
|
|
|
|
|
| BlackRock Kelso Capital Corp. (d) |
|
| 3,100 |
|
| 26,412 |
| 0.0 |
|
|
|
| Other Securities |
|
|
|
|
| 382,714 |
| 0.2 |
|
|
|
| Total Investment Companies |
|
|
|
|
| 409,126 |
| 0.2 |
|
|
|
|
|
|
|
|
|
|
|
|
|
|
|
|
|
|
|
|
|
|
|
|
|
|
|
|
|
| Rights |
|
|
|
|
|
|
|
|
|
|
Banks: Savings, Thrift & Mortgage Lending |
| Other Securities |
|
|
|
|
| — |
| 0.0 |
|
|
Building Materials |
| Other Securities |
|
|
|
|
| 1,577 |
| 0.0 |
|
|
|
| Total Rights |
|
|
|
|
| 1,577 |
| 0.0 |
|
|
|
|
|
See Notes to Financial Statements. | ||
20 | BLACKROCK SMALL CAP INDEX FUND | DECEMBER 31, 2009 |
|
|
| |
Summary Schedule of Investments (continued) | Master Small Cap Index Series |
| (Percentages shown are based on Net Assets) |
|
|
|
|
|
|
|
|
|
|
|
|
|
Industry |
| Warrants (e) |
| Shares |
| Value |
| Percent |
| |||
Alternative Energy |
| GreenHunter Energy, Inc. (Expires 8/27/11) (b)(f) |
|
| 180 |
|
| — |
| 0.0 | % |
|
Communications Technology |
| Other Securities |
|
|
|
|
| — |
| 0.0 |
|
|
|
| Total Warrants |
|
|
|
|
| — |
| 0.0 |
|
|
|
| Total Long-Term Investments (Cost — $190,334,906) |
|
|
|
| $ | 224,549,450 |
| 97.8 |
|
|
|
|
|
|
|
|
|
|
|
|
|
|
|
|
|
|
|
|
|
|
|
|
|
|
|
|
|
| Short-Term Securities |
|
|
|
|
|
|
|
|
|
|
|
| BlackRock Liquidity Funds, TempFund, Institutional Class, 0.11% (d)(g) |
|
| 9,452,117 |
|
| 9,452,117 |
| 4.1 |
|
|
|
|
|
|
|
|
|
|
|
|
|
|
|
|
|
|
|
|
|
|
|
|
|
|
|
|
|
|
|
|
| Beneficial |
|
|
|
|
|
|
|
|
| BlackRock Liquidity Series, LLC Money Market Series, 0.29% (d)(g)(h) |
| $ | 17,387 |
| $ | 17,386,620 |
| 7.6 |
|
|
|
| Total Short-Term Securities (Cost — $26,838,737) |
|
|
|
|
| 26,838,737 |
| 11.7 |
|
|
|
| Total Investments (Cost — $217,173,643*) |
|
|
|
|
| 251,388,187 |
| 109.5 |
|
|
|
| Liabilities in Excess of Other Assets |
|
|
|
|
| (21,751,491 | ) | (9.5 | ) |
|
|
|
|
|
|
|
| ||||||
|
| Net Assets |
|
|
|
| $ | 229,636,696 |
| 100.0 | % |
|
|
|
|
|
|
|
| ||||||
|
|
* | The cost and unrealized appreciation (depreciation) of investments as of December 31, 2009, as computed for federal income tax purposes, were as follows: |
|
|
|
|
|
Aggregate cost |
| $ | 229,753,769 |
|
|
| |||
Gross unrealized appreciation |
| $ | 48,267,727 |
|
Gross unrealized depreciation |
|
| (26,633,309 | ) |
|
| |||
Net unrealized appreciation |
| $ | 21,634,418 |
|
|
|
|
|
(a) | Non-income producing security. |
|
|
(b) | Security, or a portion of security, is on loan. |
|
|
(c) | All or a portion of security has been pledged as collateral in connection with open financial futures contracts. |
|
|
(d) | Investments in companies considered to be an affiliate of the Series, for purposes of Section 2(a)(3) of the Investment Company Act of 1940, were as follows: |
|
|
|
|
|
|
|
|
|
|
|
|
|
|
Affiliate |
| Purchase |
| Sale |
| Realized |
| Income |
| ||||
Anthracite Capital, Inc. |
| $ | 16,102 |
| $ | 239,668 |
| $ | (221,996 | ) |
| — |
|
BlackRock Kelso Capital Corp. |
| $ | 11,712 |
| $ | 42,960 |
| $ | (13,276 | ) | $ | 992 |
|
BlackRock Liquidity Funds, TempFund, Institutional Class |
| $ | 9,452,117 | 1 |
| — |
|
| — |
| $ | 26,184 |
|
BlackRock Liquidity Series, LLC, Cash Sweep Series |
|
| — |
| $ | 33,514,609 | 2 |
| — |
| $ | 37,173 |
|
BlackRock Liquidity Series, LLC, Money Market Series |
|
| — |
| $ | 7,257,582 | 2 |
| — |
| $ | 451,286 |
|
|
|
|
| 1 | Represents net purchase cost. |
|
|
|
| 2 | Represents net sale cost. |
|
|
|
|
|
|
(e) | Warrants entitle the Series to purchase a predetermined number of shares of common stock and are non-income producing. The purchase price and number of shares are subject to adjustment under certain conditions until the expiration date. | |
|
| |
(f) | Restricted security as to resale, representing 0.0% of net assets was as follows: | |
|
|
|
|
|
|
|
|
|
|
Issue |
| Acquisition |
| Cost |
| Value |
| ||
GreenHunter Energy, Inc. |
| 6/27/08 |
| $ | — |
| $ | — |
|
|
|
(g) | Represents the current yield as of report date. |
|
|
(h) | Security was purchased with the cash collateral from securities loans. |
|
|
|
See Notes to Financial Statements. |
|
|
BLACKROCK SMALL CAP INDEX FUND | DECEMBER 31, 2009 | 21 |
|
|
|
|
Summary Schedule of Investments (concluded) | Master Small Cap Index Series |
|
|
• | For Series compliance purposes, the Series’ industry classifications refer to any one or more of the industry sub-classifications used by one or more widely recognized market indexes or ratings group indexes, and/or as defined by Series management. This definition may not apply for purposes of this report, which may combine industry sub-classifications for reporting ease. |
|
|
• | Financial futures contracts purchased as of December 31, 2009 were as follows: |
|
|
|
|
|
|
|
|
|
|
|
|
Contracts |
| Issue |
| Expiration |
| Notional |
| Unrealized |
| ||
72 |
| Russell 2000 MINI |
| March 2010 |
| $ | 4,403,447 |
| $ | 88,573 |
|
|
|
|
• | Fair Value Measurements — Various inputs are used in determining the fair value of investments, which are as follows: | |
|
|
|
| • | Level 1 — price quotations in active markets/exchanges for identical assets and liabilities |
|
|
|
| • | Level 2 — other observable inputs (including, but not limited to: quoted prices for similar assets or liabilities in markets that are active, quoted prices for identical or similar assets or liabilities in markets that are not active, inputs other than quoted prices that are observable for the assets or liabilities (such as interest rates, yield curves, volatilities, prepayment speeds, loss severities, credit risks and default rates) or other market-corroborated inputs) |
|
|
|
| • | Level 3 — unobservable inputs based on the best information available in the circumstances, to the extent observable inputs are not available (including the Series’ own assumptions used in determining the fair value of investments) |
|
|
|
| The inputs or methodology used for valuing securities are not necessarily an indication of the risk associated with investing in those securities. For information about the Series’ policy regarding valuation of investments and other significant accounting policies, please refer to Note 1 of the Notes to Financial Statements. | |
|
| |
| The following table summarizes the inputs used as of December 31, 2009 in determining the fair valuation of the Series’ investments: | |
|
|
|
|
|
Valuation Inputs |
| Investments in |
| |
|
| Assets |
| |
|
| |||
Level 1 |
|
|
|
|
Long-Term Investments1 |
| $ | 224,549,450 |
|
Short-Term Securities |
|
| 9,452,117 |
|
|
| |||
Total Level 1 |
|
| 234,001,567 |
|
|
| |||
Level 2 — Short-Term Securities |
|
| 17,386,620 |
|
Level 3 |
|
| — |
|
|
| |||
Total |
| $ | 251,388,187 |
|
|
| |||
|
|
|
| 1 | See above Schedule of Investments for values in each industry. |
|
|
|
|
|
Valuation Inputs |
| Other Financial |
| |
|
| Assets |
| |
|
| |||
Level 1 |
| $ | 88,573 |
|
Level 2 |
|
| — |
|
Level 3 |
|
| — |
|
|
| |||
Total |
| $ | 88,573 |
|
|
| |||
|
|
|
| 2 | Other financial instruments are financial futures contracts which are shown at the unrealized appreciation/depreciation on the instrument. |
|
|
|
See Notes to Financial Statements. | ||
22 | BLACKROCK SMALL CAP INDEX FUND | DECEMBER 31, 2009 |
|
|
|
|
Master Small Cap Index Series | |
|
|
|
|
|
December 31, 2009 |
|
|
|
|
Assets |
|
|
|
|
Investments at value — unaffiliated (including securities loaned of $16,357,904) (cost — $190,311,919) |
| $ | 224,523,038 |
|
Investments at value — affiliated (cost — $26,861,724) |
|
| 26,865,149 |
|
Cash on deposit for financial futures contracts |
|
| 780,000 |
|
Dividends receivable |
|
| 271,553 |
|
Securities lending income receivable — affiliated |
|
| 27,404 |
|
Investment advisor receivable |
|
| 15,720 |
|
Investments sold receivable |
|
| 12,300 |
|
Prepaid expenses |
|
| 54,144 |
|
|
| |||
Total assets |
|
| 252,549,308 |
|
|
| |||
|
|
|
|
|
Liabilities |
|
|
|
|
Collateral on securities loaned, at value |
|
| 17,386,620 |
|
Withdrawals payable to investors |
|
| 5,379,905 |
|
Margin variation payable |
|
| 130,554 |
|
Other affiliates payable |
|
| 1,270 |
|
Directors’ fees payable |
|
| 257 |
|
Other accrued expenses payable |
|
| 14,006 |
|
|
| |||
Total liabilities |
|
| 22,912,612 |
|
|
| |||
Net Assets |
| $ | 229,636,696 |
|
|
| |||
|
|
|
|
|
Net Assets Consist of |
|
|
|
|
Investors’ capital |
| $ | 195,333,579 |
|
Net unrealized appreciation/depreciation |
|
| 34,303,117 |
|
|
| |||
Net Assets |
| $ | 229,636,696 |
|
|
|
|
|
|
See Notes to Financial Statements. |
|
|
BLACKROCK SMALL CAP INDEX FUND | DECEMBER 31, 2009 | 23 |
|
|
|
|
Master Small Cap Index Series | |
|
|
|
|
|
Year Ended December 31, 2009 |
|
|
|
|
Investment Income |
|
|
|
|
Dividends |
| $ | 3,969,783 |
|
Foreign taxes withheld |
|
| (449 | ) |
Income — affiliated |
|
| 64,349 |
|
Securities lending — affiliated |
|
| 451,286 |
|
|
| |||
Total income |
|
| 4,484,969 |
|
|
| |||
|
|
|
|
|
Expenses |
|
|
|
|
Professional |
|
| 83,163 |
|
Accounting services |
|
| 80,196 |
|
Custodian |
|
| 71,403 |
|
Investment advisory |
|
| 33,405 |
|
Directors |
|
| 20,977 |
|
Printing |
|
| 1,416 |
|
Other |
|
| 11,486 |
|
|
| |||
Total expenses |
|
| 302,046 |
|
Less fees paid indirectly |
|
| (111 | ) |
Less fees waived by advisor |
|
| (60,386 | ) |
|
| |||
Total expenses after fees waived and paid indirectly |
|
| 241,549 |
|
|
| |||
Net investment income |
|
| 4,243,420 |
|
|
| |||
|
|
|
|
|
Realized and Unrealized Gain (Loss) |
|
|
|
|
Net realized gain (loss) from: |
|
|
|
|
Investments — unaffiliated |
|
| (66,098,465 | ) |
Investments — affiliated |
|
| (235,272 | ) |
In-kind redemption |
|
| 32,836,315 |
|
Financial futures contracts |
|
| 2,630,142 |
|
|
| |||
|
|
| (30,867,280 | ) |
|
| |||
|
|
|
|
|
Net change in unrealized appreciation/depreciation on: |
|
|
|
|
Investments |
|
| 126,875,161 |
|
Financial futures contracts |
|
| (2,286,369 | ) |
|
| |||
|
|
| 124,588,792 |
|
|
| |||
Total realized and unrealized gain |
|
| 93,721,512 |
|
|
| |||
Net Increase in Net Assets Resulting from Operations |
| $ | 97,964,932 |
|
|
|
|
|
|
24 | BLACKROCK SMALL CAP INDEX FUND | DECEMBER 31, 2009 |
|
|
|
|
Master Small Cap Index Series | |
|
|
|
|
|
|
|
|
|
| Year Ended |
| ||||
|
| ||||||
Increase (Decrease) in Net Assets: |
| 2009 |
| 2008 |
| ||
Operations |
|
|
|
|
|
|
|
|
|
|
|
|
|
|
|
Net investment income |
| $ | 4,243,420 |
| $ | 7,541,773 |
|
Net realized loss |
|
| (30,867,280 | ) |
| (28,428,998 | ) |
Net change in unrealized appreciation/depreciation |
|
| 124,588,792 |
|
| (153,156,287 | ) |
|
| ||||||
Net increase (decrease) in net assets resulting from operations |
|
| 97,964,932 |
|
| (174,043,512 | ) |
|
| ||||||
|
|
|
|
|
|
|
|
Capital Transactions |
|
|
|
|
|
|
|
Proceeds from contributions |
|
| 171,416,855 |
|
| 277,100,847 |
|
Fair value of withdrawals |
|
| (384,465,211 | ) |
| (388,731,499 | ) |
|
| ||||||
Net decrease in net assets derived from capital transactions |
|
| (213,048,356 | ) |
| (111,630,652 | ) |
|
| ||||||
|
|
|
|
|
|
|
|
Net Assets |
|
|
|
|
|
|
|
Total decrease in net assets |
|
| (115,083,424 | ) |
| (285,674,164 | ) |
Beginning of year |
|
| 344,720,120 |
|
| 630,394,284 |
|
|
| ||||||
End of year |
| $ | 229,636,696 |
| $ | 344,720,120 |
|
|
| ||||||
|
|
|
|
|
|
|
|
|
|
|
|
Master Small Cap Index Series | |
|
|
|
|
|
|
|
|
|
|
|
|
|
|
|
|
|
|
| Year Ended December 31, |
| |||||||||||||
|
| |||||||||||||||
|
| 2009 |
| 2008 |
| 2007 |
| 2006 |
| 2005 |
| |||||
Total Investment Return |
|
|
|
|
|
|
|
|
|
|
|
|
|
|
|
|
Total investment return |
|
| 27.37 | % |
| (33.57 | )% |
| (1.46 | )% |
| 18.13 | % |
| 4.63 | % |
|
| |||||||||||||||
|
|
|
|
|
|
|
|
|
|
|
|
|
|
|
|
|
Ratios to Average Net Assets |
|
|
|
|
|
|
|
|
|
|
|
|
|
|
|
|
|
|
|
|
|
|
|
|
|
|
|
|
|
|
|
|
|
Total expenses |
|
| 0.09 | % |
| 0.08 | % |
| 0.06 | % |
| 0.07 | % |
| 0.08 | % |
|
| |||||||||||||||
Total expenses after fees waived and paid indirectly |
|
| 0.07 | % |
| 0.07 | % |
| 0.06 | % |
| 0.07 | % |
| 0.07 | % |
|
| |||||||||||||||
Net investment income |
|
| 1.27 | % |
| 1.60 | % |
| 1.69 | % |
| 1.55 | % |
| 1.17 | % |
|
| |||||||||||||||
|
|
|
|
|
|
|
|
|
|
|
|
|
|
|
|
|
Supplemental Data |
|
|
|
|
|
|
|
|
|
|
|
|
|
|
|
|
Net assets, end of year (000) |
| $ | 229,637 |
| $ | 344,720 |
| $ | 630,394 |
| $ | 561,373 |
| $ | 370,145 |
|
|
| |||||||||||||||
Portfolio turnover |
|
| 43 | % |
| 42 | % |
| 26 | % |
| 40 | % |
| 37 | % |
|
| |||||||||||||||
|
|
|
BLACKROCK SMALL CAP INDEX FUND | DECEMBER 31, 2009 | 25 |
|
|
|
|
Master Small Cap Index Series | |
1. Organization and Significant Accounting Policies:
Master Small Cap Index Series (the “Series”), a non-diversified, open-end management investment company, is a series of Quantitative Master Series LLC (the “Master LLC”). The Master LLC is registered as an investment company under the Investment Company Act of 1940, as amended (the “1940 Act”), and is organized as a Delaware limited liability company. The Master LLC’s Limited Liability Company Agreement permits the Board of Directors (the “Board”) to issue nontransferable interests, subject to certain limitations. The Series’ financial statements are prepared in conformity with accounting principles generally accepted in the United States of America, which may require the use of management accruals and estimates. Actual results may differ from these estimates.
The following is a summary of significant accounting policies followed by the Series:
Valuation: The Series’ policy is to value instruments at fair value. Equity investments traded on a recognized securities exchange or the NASDAQ Global Market System are valued at the last reported sale price that day or the NASDAQ official closing price, if applicable. For equity investments traded on more than one exchange, the last reported sale price on the exchange where the stock is primarily traded is used. Equity investments traded on a recognized exchange for which there were no sales on that day are valued at the last available bid price. If no bid price is available, the prior day’s price will be used, unless it is determined that such prior day’s price no longer reflects the fair value of the security. Financial futures contracts traded on exchanges are valued at their last sale price. Investments in open-end investment companies are valued at net asset value each business day. Short-term securities with maturities less than 60 days may be valued at amortized cost, which approximates fair value.
The Series values its investment in BlackRock Liquidity Series, LLC Money Market Series (the “Money Market Series”) at fair value, which is ordinarily based upon its pro rata ownership in the net assets of the underlying fund. The Money Market Series seeks current income consistent with maintaining liquidity and preserving capital. The Money Market Series’ investments will follow the parameters of investments by a money market fund that is subject to Rule 2a-7 promulgated by the Securities and Exchange Commission (“SEC”) under the 1940 Act. The Series may withdraw up to 25% of its investment daily, although the manager of the Money Market Series, in its sole discretion, may permit an investor to withdraw more than 25% on any one day.
In the event that application of these methods of valuation results in a price for an investment which is deemed not to be representative of the market value of such investment, or is not available, the investment will be valued by a method approved by the Board as reflecting fair value (“Fair Value Assets”). When determining the price for Fair Value Assets, the investment advisor and/or sub-advisor seeks to determine the price that the Series might reasonably expect to receive from the current sale of that asset in an arm’s-length transaction. Fair value determinations shall be based upon all available factors that the investment advisor and/or sub-advisor deems relevant.
Segregation and Collateralization: In cases in which the 1940 Act and the interpretive positions of the SEC require that the Series either delivers collateral or segregates assets in connection with certain investments (e.g., financial futures contracts), the Series will, consistent with SEC rules and/or certain interpretive letters issued by the SEC, segregate collateral or designate on its books and records cash or other liquid securities having a market value at least equal to the amount that would otherwise be required to be physically segregated. Furthermore, based on requirements and agreements with certain exchanges and third party broker-dealers, each party has requirements to deliver/deposit securities as collateral for certain investments.
Investment Transactions and Investment Income: For financial reporting purposes, investment transactions are recorded on the dates the transactions are entered into (the trade dates). Realized gains and losses on investment transactions are determined on the identified cost basis. Dividend income is recorded on the ex-dividend dates. Upon notification from issuers, some of the dividend income received from a real estate investment trust may be redesignated as a reduction of cost of the related investment and/or realized gain. Interest income is recognized on the accrual basis.
Securities Lending: The Series may lend securities to financial institutions that provide cash as collateral, which will be maintained at all times in an amount equal to at least 100% of the current market value of the loaned securities. The market value of the loaned securities is determined at the close of business of the Series and any additional required collateral is delivered to the Series on the next business day. The Series typically receives income on the loaned securities but does not receive the income on the collateral. The Series may invest the cash collateral and retain the amount earned on such investment, net of any amount rebated to the borrower. Loans of securities are terminable at any time and the borrower, after notice, is required to return borrowed securities within the standard time period for settlement of securities transactions. The Series may pay reasonable lending agent, administrative and custodial fees in connection with its loans. In the event that the borrower defaults on its obligation to return borrowed securities because of insolvency or for any other reason, the Series could experience delays and costs in gaining access to the collateral. The Series also could suffer a loss if the value of an investment purchased with cash collateral falls below the market value of loaned securities or if the value of an investment purchased with cash collateral falls below the original value of the cash collateral received.
Income Taxes: The Series is classified as a partnership for federal income tax purposes. As such, each investor in the Series is treated as owner of its proportionate share of the net assets, income, expenses and realized and unrealized gains and losses of the Series. Therefore, no federal income tax
|
|
|
26 | BLACKROCK SMALL CAP INDEX FUND | DECEMBER 31, 2009 |
|
|
|
|
Notes to Financial Statements (continued) | Master Small Cap Index Series |
provision is required. It is intended that the Master LLC’s assets will be managed so an investor in the Master LLC can satisfy the requirements of Subchapter M of the Internal Revenue Code. Under applicable foreign tax laws, a withholding tax may be imposed on interest, dividends and capital gains at various rates.
The Series files US federal and various state and local tax returns. No income tax returns are currently under examination. The statute of limitations on the Series’ US federal tax returns remain open for each of the four years ended December 31, 2009. The statute of limitations on the Series’ state and local tax returns may remain open for an additional year depending upon the jurisdiction.
Recent Accounting Standards: In June 2009, amended guidance was issued by the Financial Accounting Standards Board (“FASB”) for transfers of financial assets. This guidance is intended to improve the relevance, representational faithfulness and comparability of the information that a reporting entity provides in its financial statements about a transfer of financial assets; the effects of a transfer on its financial position, financial performance, and cash flows; and a transferor’s continuing involvement, if any, in transferred financial assets. The amended guidance is effective for financial statements for fiscal years and interim periods beginning after November 15, 2009. Earlier application is prohibited. The recognition and measurement provisions of this guidance must be applied to transfers occurring on or after the effective date. Additionally, the enhanced disclosure provisions of the amended guidance should be applied to transfers that occurred both before and after the effective date of this guidance. The impact of this guidance on the Series’ financial statements and disclosures, if any, is currently being assessed.
In January 2010, the FASB issued amended guidance for improving disclosure about fair value measurements that adds new disclosure requirements about transfers into and out of Levels 1 and 2 and separate disclosures about purchases, sales, issuances and settlements in the reconciliation for fair value measurements using significant unobservable inputs (Level 3). It also clarifies existing disclosure requirements relating to the levels of disaggregation for fair value measurement and inputs and valuation techniques used to measure fair value. The amended guidance is effective for financial statements for fiscal years and interim periods beginning after December 15, 2009 except for disclosures about purchases, sales, issuances and settlements in the rollforward of activity in Level 3 fair value measurements, which are effective for fiscal years beginning after December 15, 2010 and for interim periods within those fiscal years. The impact of this guidance on the Series’ financial statements and disclosures, if any, is currently being assessed.
Other: Expenses directly related to the Series are charged to that Series. Other operating expenses shared by several funds are pro rated among those funds on the basis of relative net assets or other appropriate methods.
2. Derivative Financial Instruments:
The Series may engage in various portfolio investment strategies both to increase the returns of the Series and to economically hedge, or protect, its exposure to certain risks, such as equity risk. Losses may arise if the value of the contract decreases due to an unfavorable change in the price of the underlying instruments or if the counterparty does not perform under the contract. To the extent amounts due to the Series from its counterparty are not fully collateralized contractually or otherwise, the Series bears the risk of loss from counterparty non-performance. See Note 1 “Segregation and Collateralization” for information with respect to collateral practices. Counterparty risk related to exchange-traded financial futures contracts and options is minimal because of the protection against defaults provided by the exchange on which they trade.
Financial Futures Contracts: The Series may purchase or sell financial futures contracts and options on financial futures contracts to gain exposure to, or economically hedge against, changes in the value of equity securities (equity risk). Financial futures contracts are contracts for delayed delivery of securities at a specific future date and at a specific price or yield. Pursuant to the contract, the Series agrees to receive from or pay to the broker an amount of cash equal to the daily fluctuation in value of the contract. Such receipts or payments are known as margin variation and are recognized by the Series as unrealized gains or losses. When the contract is closed, the Series records a realized gain or loss equal to the difference between the value of the contract at the time it was opened and the value at the time it was closed. The use of financial futures transactions involves the risk of an imperfect correlation in the movements in the price of financial futures contracts, interest rates and the underlying assets.
Derivative Instruments Categorized by Risk Exposure:
|
|
|
|
|
|
|
|
Value of Derivative Instruments as of December 31, 2009 | |||||||
|
| Asset Derivatives |
| ||||
|
| ||||||
|
| Statement of |
| Value |
| ||
Equity contracts* |
|
| Net unrealized |
| $ | 88,573 |
|
|
|
|
| * | Includes cumulative appreciation/depreciation of financial futures contracts as reported in the Schedule of Investments. Only current day’s margin variation is reported within the Statement of Assets and Liabilities. |
|
|
|
|
|
The Effect of Derivative Instruments on the Statement of Operations | ||||
Net Realized Gain (Loss) from | ||||
|
| Financial | ||
Equity contracts |
| $2,630,142 | ||
|
|
|
BLACKROCK SMALL CAP INDEX FUND | DECEMBER 31, 2009 | 27 |
|
|
|
|
Notes to Financial Statements (continued) | Master Small Cap Index Series |
|
|
|
|
|
Net Change in Unrealized Appreciation/Depreciation on | ||||
|
| Financial | ||
Equity contracts |
| $(2,286,369) | ||
|
|
|
|
|
For the year ended December 31, 2009, the average derivative activity was as follows: | ||||
|
|
|
|
|
Futures: |
|
|
|
|
Average number of contracts |
|
| 141 |
|
Average value |
| $ | 206,787 |
|
3. Investment Advisory Agreement and Other Transactions with Affiliates:
The PNC Financial Services Group, Inc. (“PNC”), Bank of America Corporation (“BAC”) and Barclays Bank PLC (“Barclays”) are the largest stockholders of BlackRock, Inc. (“BlackRock”). Due to the ownership structure, PNC is an affiliate for 1940 Act purposes, but BAC and Barclays are not.
The Master LLC, on behalf of the Series, entered into an Investment Advisory Agreement with BlackRock Advisors, LLC (the “Manager”), the Series’ investment advisor, an indirect, wholly owned subsidiary of BlackRock, to provide investment advisory and administration services.
The Manager is responsible for the management of the Series’ portfolio and provides the necessary personnel, facilities, equipment and certain other services necessary to the operation of the Series. For such services, the Series pays the Manager a monthly fee at an annual rate of 0.01% of the average daily value of the Series’ net assets.
The Manager has entered into a contract with the Master LLC, on behalf of the Series, that provides that the advisory fee for the Series, when combined with the administration fees of a certain feeder fund, will not exceed a specified amount. No fees are currently being waived for the Series. This arrangement has a one-year term and is renewable.
The Manager has entered into a contractual arrangement with the Master LLC with respect to the Series under which the Manager will waive its fees or reimburse expenses so that the total operating expenses incurred by the Series will not exceed 0.08% of the Series’ average daily net assets. This arrangement has a one-year term and is renewable. For the year ended December 31, 2009, the Manager waived $55,314, which is included in fees waived by advisor in the Statement of Operations.
The Manager has agreed to waive its advisory fee by the amount of investment advisory fees the Series pays to the Manager indirectly through is investment in affiliated money market funds. For the year ended December 31, 2009, the Manager waived advisory fees in the amount of $5,072, which is included in fees waived by advisor in the Statement of Operations.
The Manager has entered into a separate sub-advisory agreement with BlackRock Investment Management, LLC (“BIM”), an affiliate of the Manager, under which the Manager pays the sub-advisor for services it provides, a monthly fee that is a percentage of the investment advisory fee paid by the Series to the Manager.
For the year ended December 31, 2009, the Series reimbursed the Manager $6,369 for certain accounting services, which is included in accounting services in the Statement of Operations.
The Master LLC, on behalf of the Series, has received an exemptive order from the SEC permitting it, among other things, to pay an affiliated securities lending agent a fee based on a share of the income derived from the securities lending activities and has retained BIM as the securities lending agent. BIM may, on behalf of the Master LLC and the Series, invest cash collateral received by the Series for such loans, among other things, in a private investment company managed by the Manager or in registered money market funds advised by the Manager or its affiliates. The share of income earned by the Series on such investments is shown as securities lending — affiliated in the Statement of Operations. For the year ended December 31, 2009, BIM received $110,435 in securities lending agent fees.
Certain officers and/or directors of the Master LLC are officers and/or directors of BlackRock or its affiliates.
4. Investments:
Purchases and sales of investments, excluding short-term securities, for the year ended December 31, 2009 were $133,781,657 and $313,588,744, respectively.
5. Borrowings:
The Master LLC, on behalf of the Series, along with certain other funds managed by the Manager and its affiliates, is a party to a $500 million credit agreement with a group of lenders, which was renewed until November 2010. The Series may borrow under the credit agreement to fund shareholder redemptions and for other lawful purposes other than for leverage. The Series may borrow up to the maximum amount allowable under the Series’ current Prospectus and Statement of Additional Information, subject to various other legal, regulatory or contractual limits. Prior to its renewal, the credit agreement had the following terms: 0.02% upfront fee on the aggregate commitment amount which was allocated to the Series based on its net assets as of October 31, 2008; a commitment fee of 0.08% per annum based on the Series’ pro rata share of the unused portion of the credit agreement, which is included in miscellaneous in the Statement of Operations, and interest at a rate equal to the higher of the (a) federal funds effective rate and (b) reserve adjusted one-month LIBOR, plus, in each case, the higher of (i) 1.50% and (ii) 50% of the CDX Index (as defined in the credit agreement) on amounts borrowed. Effective November 2009, the credit agreement was renewed with the following terms: 0.02% upfront fee on the aggregate commitment amount which was allocated to the Series based on its net assets as of October 31, 2009, a commitment fee of 0.10% per annum based on the Series’ pro
|
|
|
28 | BLACKROCK SMALL CAP INDEX FUND | DECEMBER 31, 2009 |
|
|
|
|
Notes to Financial Statements (concluded) | Master Small Cap Index Series |
rata share of the unused portion of the credit agreement and interest at a rate equal to the higher of (a) the one-month LIBOR plus 1.25% per annum and (b) the Fed Funds rate plus 1.25% per annum on amounts borrowed. The Series did not borrow under the credit agreement during the year ended December 31, 2009.
6. Concentration, Market and Credit Risk:
In the normal course of business, the Series invests in securities and enters into transactions where risks exist due to fluctuations in the market (market risk) or failure of the issuer of a security to meet all its obligations (credit risk). The value of securities held by the Series may decline in response to certain events, including those directly involving the issuers whose securities are owned by the Series; conditions affecting the general economy; overall market changes; local, regional or global political, social or economic instability; and currency and interest rate and price fluctuations. Similar to credit risk, the Series may be exposed to counterparty risk, or the risk that an entity with which the Series has unsettled or open transactions may default. Financial assets, which potentially expose the Series to credit and counterparty risks, consist principally of investments and cash due from counterparties. The extent of the Series’ exposure to credit and counterparty risks with respect to these financial assets is generally approximated by their value recorded in the Series’ Statement of Assets and Liabilities, less any collateral held by the Series.
The Series invests a significant portion of its assets in the financial services sector. Changes in economic conditions affecting the financial services sector would have a greater impact on the Series, and could affect the value, income and/or liquidity of positions in such securities.
7. Subsequent Events:
Management has evaluated the impact of all subsequent events on the Series through February 24, 2010, the date the financial statements were issued, and has determined that there were no subsequent events requiring adjustment or additional disclosure in the financial statements.
|
|
|
|
Master Small Cap Index Series | |
To the Investors and Board of Directors of Quantitative Master Series LLC:
We have audited the accompanying statement of assets and liabilities, including the summary schedule of investments, of Master Small Cap Index Series, one of the portfolios constituting Quantitative Master Series LLC, (the “Master LLC”) as of December 31, 2009, and the related statement of operations for the year then ended, the statements of changes in net assets for each of the two years in the period then ended, and the financial highlights for each of the five years in the period then ended. These financial statements and financial highlights are the responsibility of the Master LLC’s management. Our responsibility is to express an opinion on these financial statements and financial highlights based on our audits.
We conducted our audits in accordance with the standards of the Public Company Accounting Oversight Board (United States). Those standards require that we plan and perform the audit to obtain reasonable assurance about whether the financial statements and financial highlights are free of material misstatement. The Master LLC is not required to have, nor were we engaged to perform, an audit of its internal control over financial reporting. Our audits included consideration of internal control over financial reporting as a basis for designing audit procedures that are appropriate in the circumstances, but not for the purpose of expressing an opinion on the effectiveness of the Master LLC’s internal control over financial reporting. Accordingly, we express no such opinion. An audit also includes examining, on a test basis, evidence supporting the amounts and disclosures in the financial statements, assessing the accounting principles used and significant estimates made by management, as well as evaluating the overall financial statement presentation. Our procedures included confirmation of securities owned as of December 31, 2009, by correspondence with the custodian and brokers; where replies were not received from brokers, we performed other auditing procedures. We believe that our audits provide a reasonable basis for our opinion.
In our opinion, the financial statements and financial highlights referred to above present fairly, in all material respects, the financial position of Master Small Cap Index Series of Quantitative Master Series LLC as of December 31, 2009, the results of its operations for the year then ended, the changes in its net assets for each of the two years in the period then ended, and the financial highlights for each of the five years in the period then ended, in conformity with accounting principles generally accepted in the United States of America.
Deloitte & ToucheLLP
Princeton, New Jersey
February 24, 2010
|
|
|
BLACKROCK SMALL CAP INDEX FUND | DECEMBER 31, 2009 | 29 |
|
|
|
|
|
|
|
|
|
|
|
|
|
Name, Address |
| Position(s) |
| Length |
| Principal Occupation(s) During Past Five Years |
| Number of BlackRock- |
| Public |
Non-Interested Directors1 |
|
|
|
|
|
|
|
| ||
Ronald W. Forbes |
| Co-Chair of the Board and Director |
| Since |
| Professor Emeritus of Finance, School of Business, State University of New York at Albany since 2000. |
| 36 RICs consisting of 106 Portfolios |
| None |
Rodney D. Johnson |
| Co-Chair of the Board and Director |
| Since |
| President, Fairmount Capital Advisors, Inc. since 1987; Director, Fox Chase Cancer Center since 2004; Member of the Archdiocesan Investment Committee of the Archdiocese of Philadelphia since 2004; Director, The Committee of Seventy (civic) since 2006. |
| 36 RICs consisting of 106 Portfolios |
| None |
David O. Beim |
| Director |
| Since |
| Professor of Finance and Economics at the Columbia University Graduate School of Business since 1991; Trustee, Phillips Exeter Academy since 2002; Chairman, Wave Hill, Inc. (public garden and cultural center) from 1990 to 2006. |
| 36 RICs consisting of 106 Portfolios |
| None |
Dr. Matina Horner |
| Director |
| Since |
| Executive Vice President of Teachers Insurance and Annuity Association and College Retirement Equities Fund from 1989 to 2003. |
| 36 RICs consisting of 106 Portfolios |
| NSTAR (electric and gas utility) |
Herbert I. London |
| Director and Member of the Audit Committee |
| Since |
| Professor Emeritus, New York University since 2005; John M. Olin Professor of Humanities, New York University from 1993 to 2005 and Professor thereof from 1980 to 2005; President, Hudson Institute (policy research organization) since 1997 and Trustee thereof since 1980; Chairman of the Board of Trustees for Grantham University since 2006; Director, InnoCentive, Inc. (strategic solutions company) since 2005; Director, Cerego, LLC (software development and design) since 2005. |
| 36 RICs consisting of 106 Portfolios |
| AIMS Worldwide, Inc. |
Cynthia A. Montgomery |
| Director |
| Since |
| Professor, Harvard Business School since 1989; Director, Harvard Business School Publishing since 2005; Director, McLean Hospital since 2005. |
| 36 RICs consisting of 106 Portfolios |
| Newell Rubbermaid, Inc. (manufacturing) |
Joseph P. Platt, Jr. |
| Director |
| Since |
| Director, The West Penn Allegheny Health System (a not-for-profit health system) since 2008; Director, Jones and Brown (Canadian insurance broker) since 1998; General Partner, Thorn Partners, LP (private investment) since 1998; Partner, Amarna Corporation, LLC (private investment company) from 2002 to 2008. |
| 36 RICs consisting of 106 Portfolios |
| Greenlight Capital Re, Ltd. (reinsurance company) |
Robert C. Robb, Jr. |
| Director |
| Since |
| Partner, Lewis, Eckert, Robb and Company (management and financial consulting firm) since 1981. |
| 36 RICs consisting of 106 Portfolios |
| None |
Toby Rosenblatt |
| Director |
| Since |
| President, Founders Investments Ltd. (private investments) since 1999; Director, College Access Foundation of California (philanthropic foundation) since 2009; Director, Forward Management, LLC since 2007; Director, The James Irvine Foundation (philanthropic foundation) from 1998 to 2008. |
| 36 RICs consisting of 106 Portfolios |
| A. P. Pharma, Inc. (specialty pharmaceuticals) |
|
|
|
30 | BLACKROCK SMALL CAP INDEX FUND | DECEMBER 31, 2009 |
|
|
Officers and Directors (continued) |
|
|
|
|
|
|
|
|
|
|
|
Name, Address |
| Position(s) |
| Length |
| Principal Occupation(s) During Past Five Years |
| Number of BlackRock- |
| Public |
Non-Interested Directors1 (concluded) |
|
|
|
|
|
|
|
| ||
Kenneth L. Urish |
| Chair of the Audit Committee and Director |
| Since |
| Managing Partner, Urish Popeck & Co., LLC (certified public accountants and consultants) since 1976; Member of External Advisory Board, The Pennsylvania State University Accounting Department since 2001; Trustee, The Holy Family Foundation since 2001; Committee Member, Professional Ethics Committee of the Pennsylvania Institute of Certified Public Accountants from 2007 to 2010; President and Trustee, Pittsburgh Catholic Publishing Associates from 2003 to 2008; Director, Inter-Tel from 2006 to 2007. |
| 36 RICs consisting of 106 Portfolios |
| None |
Frederick W. Winter |
| Director and Member of the Audit Committee |
| Since |
| Professor and Dean Emeritus of the Joseph M. Katz School of Business, University of Pittsburgh since 2005 and Dean thereof from 1997 to 2005; Director, Alkon Corporation (pneumatics) since 1992; Director, Tippman Sports (recreation) since 2005; Director, Indotronix International (IT services) from 2004 to 2008. |
| 36 RICs consisting of 106 Portfolios |
| None |
|
|
| |
| |
1 | Directors serve until their resignation, removal or death, or until December 31 of the year in which they turn 72. The Board has approved one-year extensions in terms of Directors who turn 72 prior to December 31, 2013. |
|
|
2 | Date shown is the earliest date a person has served as a director for the Corporation/Master LLC covered by this annual report. Following the combination of Merrill Lynch Investment Managers, L.P. (“MLIM”) and BlackRock, Inc. (“BlackRock”) in September 2006, the various legacy MLIM and legacy BlackRock Fund boards were realigned and consolidated into three new Fund boards in 2007. As a result, although the chart shows directors as joining the Corporation/Master LLC board in 2007, each director first became a member of the board of other legacy MLIM or legacy BlackRock Funds as follows: David O. Beim, 1998; Ronald W. Forbes, 1977; Matina Horner, 2004; Rodney D. Johnson, 1995; Herbert I. London, 1987; Cynthia A. Montgomery, 1994; Joseph P. Platt, Jr., 1999; Robert C. Robb, Jr., 1998; Toby Rosenblatt, 2005; Kenneth L. Urish, 1999 and Frederick W. Winter, 1999. |
|
|
|
|
|
|
|
|
|
|
|
Interested Directors3 |
|
|
|
|
|
|
|
| ||
Richard S. Davis |
| Director |
| Since |
| Managing Director, BlackRock, Inc. since 2005; Chief Executive Officer, State Street Research & Management Company from 2000 to 2005; Chairman of the Board of Directors, State Street Research Mutual Funds from 2000 to 2005; Chairman, SSR Realty from 2000 to 2004. |
| 173 RICs consisting of 304 Portfolios |
| None |
Henry Gabbay |
| Director |
| Since |
| Consultant, BlackRock, Inc. from 2007 to 2008; Managing Director, BlackRock, Inc. from 1989 to 2007; Chief Administrative Officer, BlackRock Advisors, LLC from 1998 to 2007; President of BlackRock Funds and BlackRock Bond Allocation Target Shares from 2005 to 2007 and Treasurer of certain closed-end funds in the BlackRock fund complex from 1989 to 2006. |
| 173 RICs consisting of 304 Portfolios |
| None |
|
|
| |
| |
3 | Mr. Davis is an “interested person” as defined in the Investment Company Act of 1940, of the Corporation/Master LLC based on his position with BlackRock, Inc. and its affiliates. Mr. Gabbay is an “interested person” of the Corporation/Master LLC based on his former positions with BlackRock, Inc. and its affiliates as well as his ownership of BlackRock, Inc. and PNC securities. Directors serve until their resignation, removal or death, or until December 31 of the year in which they turn 72. The Board has approved one-year extensions in terms of Directors who turn 72 prior to December 31, 2013. |
|
|
|
BLACKROCK SMALL CAP INDEX FUND | DECEMBER 31, 2009 | 31 |
|
|
Officers and Directors (concluded) |
|
|
|
|
|
|
|
Name, Address |
| Position(s) |
| Length |
| Principal Occupation(s) During Past Five Years |
Corporation/Master LLC Officers1 |
|
| ||||
Anne F. Ackerley |
| President and Chief Executive Officer |
| Since |
| Managing Director of BlackRock, Inc. since 2000; Vice President of the BlackRock-advised funds from 2007 to 2009; Chief Operating Officer of BlackRock’s Global Client Group (GCG) since 2009; Chief Operating Officer of BlackRock’s U.S. Retail Group from 2006 to 2009; Head of BlackRock’s Mutual Fund Group from 2000 to 2006. |
Jeffrey Holland, CFA |
| Vice President |
| Since |
| Managing Director of BlackRock, Inc. since 2010; Director of BlackRock, Inc. from 2006 to 2009; Chief Operating Officer of BlackRock’s U.S. Retail Group since 2009; Co-head of Product Development and Management for BlackRock’s U.S. Retail Group from 2007 to 2009; Product Manager of Raymond James & Associates from 2003 to 2006. |
Brendan Kyne |
| Vice President |
| Since |
| Managing Director of BlackRock, Inc. since 2010; Director of BlackRock, Inc. from 2008 to 2009; Head of Product Development and Management for BlackRock’s U.S. Retail Group since 2009, Co-head thereof from 2007 to 2009; Vice President of BlackRock, Inc. from 2005 to 2008. |
Brian Schmidt |
| Vice President |
| Since |
| Managing Director of BlackRock, Inc. since 2004; Various positions with U.S. Trust Company from 1991 to 2003 including Director from 2001 to 2003 and Senior Vice President from 1998 to 2003; Vice President, Chief Financial Officer and Treasurer of Excelsior Funds, Inc., Excelsior Tax-Exempt Funds, Inc. and Excelsior Funds Trust from 2001 to 2003. |
Neal J. Andrews |
| Chief Financial Officer |
| Since |
| Managing Director of BlackRock, Inc. since 2006; Senior Vice President and Line of Business Head of Fund Accounting and Administration at PNC Global Investment Servicing (U.S.) Inc. from 1992 to 2006. |
Jay M. Fife |
| Treasurer |
| Since |
| Managing Director of BlackRock, Inc. since 2007 and Director in 2006; Assistant Treasurer of the Merrill Lynch Investment Managers, L.P. (“MLIM”) and Fund Asset Management, L.P. advised funds from 2005 to 2006; Director of MLIM Fund Services Group from 2001 to 2006. |
Brian P. Kindelan |
| Chief Compliance Officer |
| Since |
| Chief Compliance Officer of the BlackRock-advised funds since 2007; Managing Director and Senior Counsel of BlackRock, Inc. since 2005. |
Howard B. Surloff |
| Secretary |
| Since |
| Managing Director and General Counsel of U.S. Funds at BlackRock, Inc. since 2006; General Counsel (U.S.) of Goldman Sachs Asset Management, L.P. from 1993 to 2006. |
|
|
1 | Officers of the Corporation/Master LLC serve at the pleasure of the Board of Directors. |
Further information about the Corporation/Master LLC’s Officers and Directors is available in the Corporation/Master LLC’s Statement of Additional Information, which can be obtained without charge by calling (800) 441-7762. | |
Investment Advisor
BlackRock Advisors, LLC
Wilmington, DE 19809
Sub-Advisor
BlackRock Investment
Management, LLC
Plainsboro, NJ 08536
Custodian
State Street Bank
and Trust Company
North Quincy,
MA 02171
Transfer Agent
PNC Global Investment
Servicing (U.S.) Inc.
Wilmington, DE 19809
Accounting Agent
State Street Bank
and Trust Company
Princeton, NJ 08540
Distributor
BlackRock
Investments, LLC
New York, NY 10022
Legal Counsel
Sidley Austin LLP
New York, NY 10019
Independent Registered Public Accounting Firm
Deloitte & Touche LLP
Princeton, NJ 08540
Address of the Fund
100 Bellevue Parkway
Wilmington, DE 19809
|
|
|
32 | BLACKROCK SMALL CAP INDEX FUND | DECEMBER 31, 2009 |
|
|
|
General Information |
|
Electronic Delivery |
Electronic copies of most financial reports and prospectuses are available on the Fund’s website or shareholders can sign up for e-mail notifications of quarterly statements, annual and semi-annual reports and prospectuses by enrolling in the Fund’s electronic delivery program.
To enroll:
Shareholders Who Hold Accounts with Investment Advisors, Banks or Brokerages:
Please contact your financial advisor. Please note that not all investment advisors, banks or brokerages may offer this service.
Shareholders Who Hold Accounts Directly with BlackRock:
|
|
1) | Access the BlackRock website at |
|
|
2) | Click on the applicable link and follow the steps to sign up |
|
|
3) | Log into your account |
Householding
The Fund will mail only one copy of shareholder documents, including prospectuses, annual and semi-annual reports and proxy statements, to shareholders with multiple accounts at the same address. This practice is commonly called “householding” and it is intended to reduce expenses and eliminate duplicate mailings of shareholder documents. Mailings of your shareholder documents may be householded indefinitely unless you instruct us otherwise. If you do not want the mailing of these documents to be combined with those for other members of your household, please contact the Fund at (800) 441-7762.
Availability of Proxy Voting Policies and Procedures
A description of the policies and procedures that the Fund/Series uses to determine how to vote proxies relating to portfolio securities is available (1) without charge, upon request, by calling (800) 441-7762; (2) at www.blackrock.com; and (3) on the Securities and Exchange Commission’s (the “SEC”) website at http://www.sec.gov.
Availability of Proxy Voting Record
Information on how the Fund/Series voted proxies relating to securities held in the Fund’s/Series’ portfolio during the most recent 12-month period ended June 30 is available upon request and without charge (1) at www.blackrock.com or by calling (800) 441-7762 and (2) on the SEC’s website at http://www.sec.gov.
Availability of Quarterly Portfolio Schedule
The Fund/Series file their complete schedule of portfolio holdings with the SEC for the first and third quarters of each fiscal year on Form N-Q. The Fund’s/Series’ Forms N-Q are available on the SEC’s website at http://www.sec.gov and may also be reviewed and copied at the SEC’s Public Reference Room in Washington, D.C. Information on the operation of the Public Reference Room may be obtained by calling (202) 551-8090. The Fund’s/Series’ Forms N-Q may also be obtained upon request and without charge by calling (800) 441-7762.
|
|
|
BLACKROCK SMALL CAP INDEX FUND | DECEMBER 31, 2009 | 33 |
|
|
|
|
Additional Information (concluded) | |
| |
Shareholder Privileges |
|
Account Information
Call us at (800) 441-7762 from 8:00 AM to 6:00 PM EST on any business day to get information about your account balances, recent transactions and share prices. You can also reach us on the Web at www.blackrock.com/funds.
Automatic Investment Plans
Investor Class shareholders who want to invest regularly can arrange to have $50 or more automatically deducted from their checking or savings account and invested in any of the BlackRock funds.
Systematic Withdrawal Plans
Investor Class shareholders can establish a systematic withdrawal plan and receive periodic payments of $50 or more from their BlackRock funds, as long as their account balance is at least $10,000.
Retirement Plans
Shareholders may make investments in conjunction with Traditional, Rollover, Roth, Coverdell, Simple IRAs, SEP IRAs and 403(b) Plans.
|
BlackRock Privacy Principles |
BlackRock is committed to maintaining the privacy of its current and former fund investors and individual clients (collectively, “Clients”) and to safeguarding their non-public personal information. The following information is provided to help you understand what personal information BlackRock collects, how we protect that information and why in certain cases we share such information with select parties.
If you are located in a jurisdiction where specific laws, rules or regulations require BlackRock to provide you with additional or different privacy-related rights beyond what is set forth below, then BlackRock will comply with those specific laws, rules or regulations.
BlackRock obtains or verifies personal non-public information from and about you from different sources, including the following: (i) information we receive from you or, if applicable, your financial intermediary, on applications, forms or other documents; (ii) information about your transactions with us, our affiliates, or others; (iii) information we receive from a consumer reporting agency; and (iv) from visits to our websites.
BlackRock does not sell or disclose to non-affiliated third parties any non-public personal information about its Clients, except as permitted by law or as is necessary to respond to regulatory requests or to service Client accounts. These non-affiliated third parties are required to protect the confidentiality and security of this information and to use it only for its intended purpose.
We may share information with our affiliates to service your account or to provide you with information about other BlackRock products or services that may be of interest to you. In addition, BlackRock restricts access to non-public personal information about its Clients to those BlackRock employees with a legitimate business need for the information. BlackRock maintains physical, electronic and procedural safeguards that are designed to protect the non-public personal information of its Clients, including procedures relating to the proper storage and disposal of such information.
|
|
|
34 | BLACKROCK SMALL CAP INDEX FUND | DECEMBER 31, 2009 |
|
|
BlackRock offers a diverse lineup of open-end mutual funds crossing all investment styles and managed by experts in equity, fixed income and tax-exempt investing.
|
Equity Funds |
|
BlackRock All-Cap Energy & Resources Portfolio |
BlackRock Asset Allocation Portfolio† |
BlackRock Aurora Portfolio |
BlackRock Balanced Capital Fund† |
BlackRock Basic Value Fund |
BlackRock Capital Appreciation Portfolio |
BlackRock Energy & Resources Portfolio |
BlackRock Equity Dividend Fund |
BlackRock EuroFund |
BlackRock Focus Growth Fund |
BlackRock Focus Value Fund |
BlackRock Fundamental Growth Fund |
BlackRock Global Allocation Fund† |
BlackRock Global Dynamic Equity Fund |
BlackRock Global Emerging Markets Fund |
BlackRock Global Financial Services Fund |
BlackRock Global Growth Fund |
BlackRock Global Opportunities Portfolio |
BlackRock Global SmallCap Fund |
BlackRock Health Sciences Opportunities Portfolio |
BlackRock Healthcare Fund |
BlackRock Index Equity Portfolio* |
BlackRock International Fund |
BlackRock International Index Fund |
BlackRock International Opportunities Portfolio |
BlackRock International Value Fund |
BlackRock Large Cap Core Fund |
BlackRock Large Cap Core Plus Fund |
BlackRock Large Cap Growth Fund |
BlackRock Large Cap Value Fund |
BlackRock Latin America Fund |
BlackRock Mid-Cap Growth Equity Portfolio |
BlackRock Mid-Cap Value Equity Portfolio |
BlackRock Mid Cap Value Opportunities Fund |
BlackRock Natural Resources Trust |
BlackRock Pacific Fund |
BlackRock Science & Technology Opportunities Portfolio |
BlackRock Small Cap Core Equity Portfolio |
BlackRock Small Cap Growth Equity Portfolio |
BlackRock Small Cap Growth Fund II |
BlackRock Small Cap Index Fund |
BlackRock Small/Mid-Cap Growth Portfolio |
BlackRock S&P 500 Index Fund |
BlackRock U.S. Opportunities Portfolio |
BlackRock Utilities and Telecommunications Fund |
BlackRock Value Opportunities Fund |
|
Fixed Income Funds |
|
BlackRock Bond Portfolio |
BlackRock Emerging Market Debt Portfolio |
BlackRock GNMA Portfolio |
BlackRock Government Income Portfolio |
BlackRock High Income Fund |
BlackRock High Yield Bond Portfolio |
BlackRock Income Portfolio† |
BlackRock Income Builder Portfolio† |
BlackRock Inflation Protected Bond Portfolio |
BlackRock Intermediate Government Bond Portfolio |
BlackRock International Bond Portfolio |
BlackRock Long Duration Bond Portfolio |
BlackRock Low Duration Bond Portfolio |
BlackRock Managed Income Portfolio |
BlackRock Short-Term Bond Fund |
BlackRock Strategic Income Portfolio |
BlackRock Total Return Fund |
BlackRock Total Return Portfolio II |
BlackRock World Income Fund |
|
Municipal Bond Funds |
|
BlackRock AMT-Free Municipal Bond Portfolio |
BlackRock California Municipal Bond Fund |
BlackRock High Yield Municipal Fund |
BlackRock Intermediate Municipal Fund |
BlackRock Kentucky Municipal Bond Portfolio |
BlackRock Municipal Insured Fund |
BlackRock National Municipal Fund |
BlackRock New Jersey Municipal Bond Fund |
BlackRock New York Municipal Bond Fund |
BlackRock Ohio Municipal Bond Portfolio |
BlackRock Pennsylvania Municipal Bond Fund |
BlackRock Short-Term Municipal Fund |
|
Target Risk & Target Date Funds |
|
BlackRock Prepared Portfolios |
Conservative Prepared Portfolio |
Moderate Prepared Portfolio |
Growth Prepared Portfolio |
Aggressive Growth Prepared Portfolio |
BlackRock Lifecycle Prepared Portfolios |
Prepared Portfolio 2010 |
Prepared Portfolio 2015 |
Prepared Portfolio 2020 |
Prepared Portfolio 2025 |
Prepared Portfolio 2030 |
Prepared Portfolio 2035 |
Prepared Portfolio 2040 |
Prepared Portfolio 2045 |
Prepared Portfolio 2050 |
|
|
* | See the prospectus for information on specific limitations on investments in the fund. |
|
|
† | Mixed asset fund. |
BlackRock mutual funds are currently distributed by BlackRock Investments, LLC. You should consider the investment objectives, risks, charges and expenses of the funds under consideration carefully before investing. Each fund’s prospectus contains this and other information and is available at www.blackrock.com or by calling (800) 441-7762 or from your financial advisor. The prospectus should be read carefully before investing.
|
|
|
BLACKROCK SMALL CAP INDEX FUND | DECEMBER 31, 2009 | 35 |

This report is transmitted to shareholders only. It is not authorized for use as an offer of sale or a solicitation of an offer to buy shares of the Fund unless accompanied or preceded by the Fund’s current prospectus. Past performance results shown in this report should not be considered a representation of future performance. Investment returns and principal value of shares will fluctuate so that shares, when redeemed, may be worth more or less than their original cost. Statements and other information herein are as dated and are subject to change.

#Index 3-12/09
Item 2 – | Code of Ethics – The registrant (or the “Fund”) has adopted a code of ethics, as of the end of the period covered by this report, applicable to the registrant’s principal executive officer, principal financial officer and principal accounting officer, or persons performing similar functions. During the period covered by this report, there have been no amendments to or waivers granted under the code of ethics. A copy of the code of ethics is available without charge at www.blackrock.com. |
Item 3 – | Audit Committee Financial Expert – The registrant’s board of directors or trustees, as applicable (the “board of directors”) has determined that (i) the registrant has the following audit committee financial expert serving on its audit committee and (ii) each audit committee financial expert is independent: |
| Kenneth L. Urish |
| Under applicable securities laws, a person determined to be an audit committee financial expert will not be deemed an “expert” for any purpose, including without limitation for the purposes of Section 11 of the Securities Act of 1933, as a result of being designated or identified as an audit committee financial expert. The designation or identification as an audit committee financial expert does not impose on such person any duties, obligations, or liabilities greater than the duties, obligations, and liabilities imposed on such person as a member of the audit committee and board of directors in the absence of such designation or identification. |
|
|
Item 4 – | Principal Accountant Fees and Services |
| (a) Audit Fees | (b) Audit-Related Fees1 | (c) Tax Fees2 | (d) All Other Fees3 | ||||
Entity Name | Current Fiscal Year End | Previous Fiscal Year End | Current Fiscal Year End | Previous Fiscal Year End | Current Fiscal Year End | Previous Fiscal Year End | Current Fiscal Year End | Previous Fiscal Year End |
BlackRock Small Cap Index Fund of BlackRock Index Funds, Inc. | $6,800 | $6,800 | $0 | $0 | $6,100 | $6,100 | $1,028 | $1,049 |
Master Small Cap Index Series of Quantitative Master Series LLC | $39,200 | $39,000 | $0 | $0 | $17,000 | $17,000 | $0 | $0 |
1 The nature of the services include assurance and related services reasonably related to the performance of the audit of financial statements not included in Audit Fees.
2 The nature of the services include tax compliance, tax advice and tax planning.
3 The nature of the services include a review of compliance procedures and attestation thereto.
| (e)(1) Audit Committee Pre-Approval Policies and Procedures: |
| The registrant’s audit committee (the “Committee”) has adopted policies and procedures with regard to the pre-approval of services. Audit, audit-related and tax compliance services provided to the registrant on an annual basis require specific pre-approval by the Committee. The Committee also must approve other non-audit services provided to the registrant and those non-audit services provided to the registrant’s affiliated service providers that relate directly to the operations and the financial reporting of the registrant. Certain of these non-audit services that the Committee believes are a) consistent with the SEC’s auditor independence rules and b) routine and recurring services that will not impair the independence of the independent accountants may be approved by the Committee without consideration on a specific case-by-case basis (“general pre-approval”). The term of any general pre-approval is 12 months from the date of the pre-approval, unless the Committee provides for a different period. Tax or other non-audit services provided to the registrant which have a direct impact on the operation or financial reporting of the registrant will only be deemed pre-approved provided that any individual project does not exceed $10,000 attributable to the registrant or $50,000 for all of the registrants the Committee oversees. For this purpose, multiple projects will be aggregated to determine if they exceed the previously mentioned cost levels. |
| Any proposed services exceeding the pre-approved cost levels will require specific pre-approval by the Committee, as will any other services not subject to general pre-approval (e.g., unanticipated but permissible services). The Committee is informed of each service approved subject to general pre-approval at the next regularly scheduled in-person board meeting. At this meeting, an analysis of such services is presented to the Committee for ratification. The Committee may delegate to one or more of its members the authority to approve the provision of and fees for any specific engagement of permitted non-audit services, including services exceeding pre-approved cost levels. |
|
|
| (e)(2) None of the services described in each of Items 4(b) through (d) were approved by the audit committee pursuant to paragraph (c)(7)(i)(C) of Rule 2-01 of Regulation S-X. |
|
|
| (f) Not Applicable |
|
|
| (g) Affiliates’ Aggregate Non-Audit Fees: |
Entity Name | Current Fiscal Year End | Previous Fiscal Year End |
BlackRock Small Cap Index Fund of BlackRock Index Funds, Inc. | $414,628 | $412,149 |
Master Small Cap Index Series of Quantitative Master Series LLC | $424,500 | $422,000 |
| (h) The registrant’s audit committee has considered and determined that the provision of non-audit services that were rendered to the registrant’s investment adviser (not including any non-affiliated sub-adviser whose role is primarily portfolio management and is subcontracted with or overseen by the registrant’s investment adviser), and any entity controlling, controlled by, or under common control with the investment adviser that provides ongoing services to the registrant that were not pre-approved pursuant to paragraph (c)(7)(ii) of Rule 2-01 of Regulation S-X is compatible with maintaining the principal accountant’s independence. |
|
|
| Regulation S-X Rule 2-01(c)(7)(ii) – $407,500, 0% |
Item 5 – | Audit Committee of Listed Registrants – Not Applicable |
Item 6 – | Investments |
| (a) Master Small Cap Index Series - Schedule of Investments |
|
|
Master Small Cap Index Series of Quantitative Master Series LLC |
|
Schedule of Investments December 31, 2009 | (Percentages shown are based on Net Assets) |
|
|
|
|
|
|
|
|
|
|
Industry |
| Common Stocks |
| Shares |
| Value |
| ||
Advertising Agencies - 0.5% |
| AMREP Corp. (a) |
|
| 300 |
| $ | 4,110 |
|
|
| Arbitron, Inc. |
|
| 5,858 |
|
| 137,194 |
|
|
| Constant Contact, Inc. (a) |
|
| 5,200 |
|
| 83,200 |
|
|
| DG FastChannel, Inc. (a) |
|
| 4,700 |
|
| 131,271 |
|
|
| Harte-Hanks, Inc. |
|
| 9,200 |
|
| 99,176 |
|
|
| Marchex, Inc., Class B |
|
| 5,000 |
|
| 25,400 |
|
|
| National CineMedia, Inc. |
|
| 10,570 |
|
| 175,145 |
|
|
| Travelzoo, Inc. (a) |
|
| 1,700 |
|
| 20,893 |
|
|
| Valassis Communications, Inc. (a) |
|
| 11,900 |
|
| 217,294 |
|
|
| ValueClick, Inc. (a) |
|
| 20,580 |
|
| 208,270 |
|
|
| Viad Corp. |
|
| 5,200 |
|
| 107,276 |
|
|
|
|
|
|
|
| |||
|
|
|
|
|
|
|
| 1,209,229 |
|
Aerospace - 1.3% |
| AAR Corp. (a) |
|
| 8,868 |
|
| 203,787 |
|
|
| AeroVironment, Inc. (a) |
|
| 3,200 |
|
| 93,056 |
|
|
| Argon ST, Inc. (a) |
|
| 3,300 |
|
| 71,676 |
|
|
| Astronics Corp. (a) |
|
| 2,100 |
|
| 17,955 |
|
|
| Ceradyne, Inc. (a) |
|
| 6,350 |
|
| 121,984 |
|
|
| Cubic Corp. |
|
| 3,852 |
|
| 143,680 |
|
|
| Curtiss-Wright Corp. |
|
| 11,268 |
|
| 352,914 |
|
|
| Ducommun, Inc. |
|
| 2,600 |
|
| 48,646 |
|
|
| Esterline Technologies Corp. (a) |
|
| 6,941 |
|
| 282,985 |
|
|
| GenCorp, Inc. (a) |
|
| 12,371 |
|
| 86,597 |
|
|
| Global Defense Technology & Systems, Inc. (a) |
|
| 500 |
|
| 8,230 |
|
|
| Heico Corp. |
|
| 5,226 |
|
| 231,669 |
|
|
| Herley Industries, Inc. (a) |
|
| 3,300 |
|
| 45,837 |
|
|
| Kaman Corp., Class A |
|
| 6,394 |
|
| 147,637 |
|
|
| LMI Aerospace, Inc. (a) |
|
| 2,100 |
|
| 27,930 |
|
|
| Ladish Co., Inc. (a) |
|
| 4,000 |
|
| 60,320 |
|
|
| Moog, Inc., Class A (a) |
|
| 10,813 |
|
| 316,064 |
|
|
| Orbital Sciences Corp. (a) |
|
| 12,735 |
|
| 194,336 |
|
|
| Teledyne Technologies, Inc. (a) |
|
| 8,934 |
|
| 342,708 |
|
|
| Triumph Group, Inc. |
|
| 3,879 |
|
| 187,162 |
|
|
|
|
|
|
|
| |||
|
|
|
|
|
|
|
| 2,985,173 |
|
Agriculture, Fishing & Ranching - 0.4% |
| AgFeed Industries, Inc. (a)(b) |
|
| 7,400 |
|
| 37,000 |
|
|
| Alico, Inc. |
|
| 900 |
|
| 25,614 |
|
|
| The Andersons, Inc. |
|
| 4,300 |
|
| 111,026 |
|
|
| Cadiz, Inc. (a) |
|
| 2,800 |
|
| 33,516 |
|
|
| Cal-Maine Foods, Inc. |
|
| 3,100 |
|
| 105,648 |
|
|
| Calavo Growers, Inc. |
|
| 2,600 |
|
| 44,200 |
|
|
| China Green Agriculture, Inc. (a) |
|
| 1,800 |
|
| 26,460 |
|
|
| Fresh Del Monte Produce, Inc. (a) |
|
| 10,100 |
|
| 223,210 |
|
|
| HQ Sustainable Maritime Industries, Inc. (a) |
|
| 2,100 |
|
| 14,784 |
|
|
| Sanderson Farms, Inc. |
|
| 4,550 |
|
| 191,828 |
|
|
| Seaboard Corp. |
|
| 82 |
|
| 110,618 |
|
|
|
|
|
|
|
| |||
|
|
|
|
|
|
|
| 923,904 |
|
Air Transport - 1.1% |
| Air Transport Services Group, Inc. (a) |
|
| 13,000 |
|
| 34,320 |
|
|
| AirTran Holdings, Inc. (a) |
|
| 31,220 |
|
| 162,968 |
|
|
| Alaska Air Group, Inc. (a) |
|
| 8,498 |
|
| 293,691 |
|
|
| Allegiant Travel Co. (a) |
|
| 3,400 |
|
| 160,378 |
|
|
| Atlas Air Worldwide Holdings, Inc. (a) |
|
| 4,800 |
|
| 178,800 |
|
1
|
|
Master Small Cap Index Series of Quantitative Master Series LLC |
|
Schedule of Investments December 31, 2009 | (Percentages shown are based on Net Assets) |
|
|
|
|
|
|
|
|
|
|
Industry |
| Common Stocks |
| Shares |
| Value |
| ||
|
| Bristow Group, Inc. (a) |
|
| 8,285 |
| $ | 318,558 |
|
|
| Hawaiian Holdings, Inc. (a) |
|
| 12,900 |
|
| 90,300 |
|
|
| JetBlue Airways Corp. (a) |
|
| 60,200 |
|
| 328,090 |
|
|
| PHI, Inc. (a) |
|
| 3,300 |
|
| 68,310 |
|
|
| Republic Airways Holdings, Inc. (a) |
|
| 7,300 |
|
| 53,947 |
|
|
| SkyWest, Inc. |
|
| 14,000 |
|
| 236,880 |
|
|
| UAL Corp. (a)(b) |
|
| 39,900 |
|
| 515,109 |
|
|
| US Airways Group, Inc. (a) |
|
| 37,900 |
|
| 183,436 |
|
|
|
|
|
|
|
| |||
|
|
|
|
|
|
|
| 2,624,787 |
|
Alternative Energy - 0.2% |
| Clean Energy Fuels Corp. (a) |
|
| 8,200 |
|
| 126,362 |
|
|
| Comverge, Inc. (a)(b) |
|
| 4,500 |
|
| 50,580 |
|
|
| EnerNOC, Inc. (a)(b) |
|
| 3,100 |
|
| 94,209 |
|
|
| Evergreen Energy, Inc. (a)(b) |
|
| 30,600 |
|
| 10,496 |
|
|
| Green Plains Renewable Energy (a) |
|
| 2,800 |
|
| 41,636 |
|
|
| Rex Stores Corp. (a) |
|
| 1,800 |
|
| 25,308 |
|
|
| Syntroleum Corp. (a) |
|
| 17,200 |
|
| 45,752 |
|
|
| TGC Industries Inc. (a) |
|
| 3,800 |
|
| 14,858 |
|
|
| US Geothermal, Inc. (a) |
|
| 15,500 |
|
| 23,715 |
|
|
| USEC, Inc. (a) |
|
| 28,659 |
|
| 110,337 |
|
|
|
|
|
|
|
| |||
|
|
|
|
|
|
|
| 543,253 |
|
Aluminum - 0.2% |
| Century Aluminum Co. (a) |
|
| 13,100 |
|
| 212,089 |
|
|
| Kaiser Aluminum Corp. |
|
| 3,800 |
|
| 158,156 |
|
|
|
|
|
|
|
| |||
|
|
|
|
|
|
|
| 370,245 |
|
Asset Management & Custodian - 1.0% |
| Allied Capital Corp. |
|
| 44,300 |
|
| 159,923 |
|
|
| American Capital Ltd. (a)(b) |
|
| 69,600 |
|
| 169,824 |
|
|
| Ampal-American Israel Corp., Class A (a) |
|
| 4,401 |
|
| 11,883 |
|
|
| Apollo Investment Corp. (b) |
|
| 38,846 |
|
| 370,202 |
|
|
| Ares Capital Corp. |
|
| 25,372 |
|
| 315,881 |
|
|
| Artio Global Investors, Inc. (a) |
|
| 6,200 |
|
| 158,038 |
|
|
| Calamos Asset Management, Inc., Class A |
|
| 5,100 |
|
| 58,803 |
|
|
| Capital Southwest Corp. |
|
| 700 |
|
| 55,160 |
|
|
| Cohen & Steers, Inc. (b) |
|
| 4,300 |
|
| 98,212 |
|
|
| Cowen Group, Inc., Class A (a) |
|
| 4,000 |
|
| 23,680 |
|
|
| Diamond Hill Investments Group |
|
| 600 |
|
| 38,538 |
|
|
| Epoch Holding Corp. |
|
| 2,500 |
|
| 26,125 |
|
|
| Fifth Street Finance Corp. |
|
| 7,100 |
|
| 76,254 |
|
|
| GAMCO Investors, Inc., Class A |
|
| 1,896 |
|
| 91,558 |
|
|
| Harris & Harris Group, Inc. (a) |
|
| 6,400 |
|
| 29,248 |
|
|
| JMP Group, Inc. |
|
| 4,100 |
|
| 39,852 |
|
|
| Kohlberg Capital Corp. |
|
| 4,300 |
|
| 19,608 |
|
|
| MCG Capital Corp. (a) |
|
| 17,400 |
|
| 75,168 |
|
|
| MVC Capital, Inc. |
|
| 5,500 |
|
| 64,900 |
|
|
| NGP Capital Resources Co. |
|
| 5,423 |
|
| 44,089 |
|
|
| National Financial Partners Corp. (a) |
|
| 9,900 |
|
| 80,091 |
|
|
| Oppenheimer Holdings, Inc. |
|
| 2,500 |
|
| 83,050 |
|
|
| Pzena Investment Management, Inc., |
|
| 1,900 |
|
| 15,466 |
|
|
| Resource America, Inc., Class A |
|
| 2,549 |
|
| 10,298 |
|
|
| TICC Capital Corp. |
|
| 7,400 |
|
| 44,770 |
|
|
| Teton Advisors, Inc. |
|
| 53 |
|
| 847 |
|
|
| U.S. Global Investors, Inc. |
|
| 3,200 |
|
| 39,392 |
|
2
|
|
Master Small Cap Index Series of Quantitative Master Series LLC |
|
Schedule of Investments December 31, 2009 | (Percentages shown are based on Net Assets) |
|
|
|
|
|
|
|
|
|
|
Industry |
| Common Stocks |
| Shares |
| Value |
| ||
|
| Virtus Investment Partners, Inc. (a) |
|
| 1,535 |
| $ | 24,407 |
|
|
| Westwood Holdings Group, Inc. |
|
| 1,300 |
|
| 47,242 |
|
|
|
|
|
|
|
| |||
|
|
|
|
|
|
|
| 2,272,509 |
|
Auto Parts - 0.7% |
| ATC Technology Corp. (a) |
|
| 5,143 |
|
| 122,661 |
|
|
| American Axle & Manufacturing Holdings, |
|
| 9,600 |
|
| 76,992 |
|
|
| Amerigon, Inc. (a) |
|
| 5,300 |
|
| 42,082 |
|
|
| ArvinMeritor, Inc. (a) |
|
| 18,400 |
|
| 205,712 |
|
|
| China Automotive Systems. Inc. (a) |
|
| 1,600 |
|
| 29,936 |
|
|
| Dana Holding Corp. (a) |
|
| 32,800 |
|
| 355,552 |
|
|
| Dorman Products, Inc. (a) |
|
| 2,600 |
|
| 40,716 |
|
|
| Exide Technologies (a) |
|
| 11,700 |
|
| 83,187 |
|
|
| Fuel Systems Solutions, Inc. (a) |
|
| 3,200 |
|
| 131,968 |
|
|
| Standard Motor Products, Inc. |
|
| 4,300 |
|
| 36,636 |
|
|
| Stoneridge, Inc. (a) |
|
| 3,800 |
|
| 34,238 |
|
|
| Superior Industries International, Inc. |
|
| 4,899 |
|
| 74,955 |
|
|
| Tenneco, Inc. (a) |
|
| 13,800 |
|
| 244,674 |
|
|
| U.S. Auto Parts Network, Inc. (a) |
|
| 1,900 |
|
| 9,880 |
|
|
| Wonder Auto Technology, Inc. (a) |
|
| 3,700 |
|
| 43,512 |
|
|
|
|
|
|
|
| |||
|
|
|
|
|
|
|
| 1,532,701 |
|
Auto Services - 0.1% |
| Cooper Tire & Rubber Co. |
|
| 14,000 |
|
| 280,700 |
|
Banks: Diversified - 5.8% |
| 1st Source Corp. |
|
| 3,684 |
|
| 59,276 |
|
|
| Alliance Financial Corp. |
|
| 1,200 |
|
| 32,580 |
|
|
| American National Bankshares, Inc. |
|
| 1,400 |
|
| 30,660 |
|
|
| Ameris Bancorp |
|
| 3,461 |
|
| 24,784 |
|
|
| Ames National Corp. |
|
| 1,600 |
|
| 33,776 |
|
|
| Arrow Financial Corp. |
|
| 2,290 |
|
| 57,250 |
|
|
| Auburn National Bancorporation |
|
| 500 |
|
| 9,845 |
|
|
| BancFirst Corp. |
|
| 1,590 |
|
| 58,894 |
|
|
| Banco Latinoamericana de Comercio |
|
| 6,800 |
|
| 94,520 |
|
|
| Bancorp Rhode Island, Inc. |
|
| 900 |
|
| 23,112 |
|
|
| The Bancorp, Inc. (a) |
|
| 3,800 |
|
| 26,068 |
|
|
| Bank of Kentucky Financial Corp. |
|
| 700 |
|
| 13,146 |
|
|
| Bank of Marin Bancorp |
|
| 1,500 |
|
| 48,840 |
|
|
| Bank of the Ozarks, Inc. (b) |
|
| 3,100 |
|
| 90,737 |
|
|
| Banner Corp. |
|
| 3,913 |
|
| 10,487 |
|
|
| Bar Harbor Bankshares |
|
| 900 |
|
| 24,705 |
|
|
| Boston Private Financial Holdings, Inc. |
|
| 17,533 |
|
| 101,165 |
|
|
| Bridge Bancorp, Inc. |
|
| 1,700 |
|
| 40,868 |
|
|
| Bryn Mawr Bank Corp. |
|
| 1,600 |
|
| 24,144 |
|
|
| CNB Financial Corporation |
|
| 2,100 |
|
| 33,579 |
|
|
| CVB Financial Corp. (b) |
|
| 20,065 |
|
| 173,362 |
|
|
| California First National Bancorp |
|
| 300 |
|
| 3,918 |
|
|
| Camden National Corp. |
|
| 1,900 |
|
| 62,130 |
|
|
| Cape Bancorp, Inc. (a) |
|
| 2,700 |
|
| 18,144 |
|
|
| Capital City Bank Group, Inc. (b) |
|
| 2,921 |
|
| 40,427 |
|
|
| Cardinal Financial Corp. |
|
| 7,000 |
|
| 61,180 |
|
|
| Cathay General Bancorp |
|
| 13,844 |
|
| 104,522 |
|
|
| Center Bancorp, Inc. |
|
| 2,945 |
|
| 26,269 |
|
|
| Centerstate Banks, Inc. |
|
| 3,600 |
|
| 36,324 |
|
|
| Central Pacific Financial Corp. (b) |
|
| 7,048 |
|
| 9,233 |
|
3
|
|
Master Small Cap Index Series of Quantitative Master Series LLC | |
Schedule of Investments December 31, 2009 | (Percentages shown are based on Net Assets) |
|
|
|
|
|
|
|
|
|
|
Industry |
| Common Stocks |
| Shares |
| Value |
| ||
|
| Century Bancorp, Inc., Class A |
|
| 1,100 |
| $ | 24,233 |
|
|
| Chemical Financial Corp. |
|
| 5,048 |
|
| 119,032 |
|
|
| Chicopee Bancorp, Inc. (a) |
|
| 1,500 |
|
| 18,720 |
|
|
| Citizens & Northern Corp. |
|
| 2,200 |
|
| 20,988 |
|
|
| Citizens Banking Corp. (a) |
|
| 29,487 |
|
| 20,346 |
|
|
| Citizens Holding Co. |
|
| 1,100 |
|
| 24,629 |
|
|
| City Holding Co. |
|
| 3,993 |
|
| 129,094 |
|
|
| CoBiz Financial, Inc. |
|
| 5,826 |
|
| 27,673 |
|
|
| Columbia Banking System, Inc. |
|
| 6,441 |
|
| 104,215 |
|
|
| Community Bank System, Inc. |
|
| 8,200 |
|
| 158,342 |
|
|
| Community Trust Bancorp, Inc. |
|
| 3,823 |
|
| 93,472 |
|
|
| Danvers Bancorp, Inc. |
|
| 4,500 |
|
| 58,455 |
|
|
| Eagle Bancorp, Inc. (a) |
|
| 2,900 |
|
| 30,363 |
|
|
| East-West Bancorp, Inc. |
|
| 22,400 |
|
| 353,920 |
|
|
| Enterprise Bancorp, Inc. |
|
| 1,600 |
|
| 17,520 |
|
|
| Enterprise Financial Services Corp. |
|
| 2,700 |
|
| 20,817 |
|
|
| F.N.B. Corp. |
|
| 27,297 |
|
| 185,347 |
|
|
| Farmers Capital Bank Corp. |
|
| 1,600 |
|
| 16,352 |
|
|
| Financial Institutions, Inc. |
|
| 2,700 |
|
| 31,806 |
|
|
| First Bancorp, Inc. |
|
| 2,100 |
|
| 32,382 |
|
|
| First Bancorp, North Carolina |
|
| 3,536 |
|
| 49,398 |
|
|
| First BanCorp, Puerto Rico (b) |
|
| 20,700 |
|
| 47,610 |
|
|
| First Busey Corp. (b) |
|
| 9,314 |
|
| 36,231 |
|
|
| First Commonwealth Financial Corp. |
|
| 21,040 |
|
| 97,836 |
|
|
| First Community Bancshares, Inc. |
|
| 2,994 |
|
| 36,078 |
|
|
| First Financial Bancorp |
|
| 11,887 |
|
| 173,075 |
|
|
| First Financial Bankshares, Inc. |
|
| 5,253 |
|
| 284,870 |
|
|
| First Financial Corp. (b) |
|
| 3,044 |
|
| 92,903 |
|
|
| First Merchants Corp. |
|
| 5,246 |
|
| 31,161 |
|
|
| First Midwest Bancorp, Inc. |
|
| 12,500 |
|
| 136,125 |
|
|
| The First of Long Island Corp. |
|
| 1,600 |
|
| 40,400 |
|
|
| First South Bancorp, Inc. |
|
| 2,100 |
|
| 21,630 |
|
|
| FirstMerit Corp. |
|
| 19,529 |
|
| 393,314 |
|
|
| German American Bancorp, Inc. (b) |
|
| 3,100 |
|
| 50,375 |
|
|
| Glacier Bancorp, Inc. |
|
| 15,464 |
|
| 212,166 |
|
|
| Guaranty Bancorp (a) |
|
| 13,200 |
|
| 17,424 |
|
|
| Hampton Roads Bankshares, Inc. (b) |
|
| 4,400 |
|
| 7,612 |
|
|
| Hancock Holding Co. |
|
| 6,554 |
|
| 287,000 |
|
|
| Harleysville National Corp. |
|
| 10,736 |
|
| 69,140 |
|
�� |
| Heartland Financial USA, Inc. (b) |
|
| 3,200 |
|
| 45,920 |
|
|
| Home Bancshares, Inc. |
|
| 3,760 |
|
| 90,503 |
|
|
| IBERIABANK Corp. |
|
| 4,950 |
|
| 266,359 |
|
|
| Independent Bank Corp./MA |
|
| 5,045 |
|
| 105,390 |
|
|
| International Bancshares Corp. (b) |
|
| 13,210 |
|
| 250,065 |
|
|
| Investors Bancorp, Inc. (a) |
|
| 11,200 |
|
| 122,528 |
|
|
| Lakeland Bancorp, Inc. |
|
| 5,005 |
|
| 31,982 |
|
|
| Lakeland Financial Corp. |
|
| 3,100 |
|
| 53,475 |
|
|
| MB Financial, Inc. |
|
| 11,783 |
|
| 232,361 |
|
|
| MainSource Financial Group, Inc. |
|
| 5,019 |
|
| 23,991 |
|
|
| Merchants Bancshares, Inc. |
|
| 1,400 |
|
| 31,696 |
|
4
|
|
Master Small Cap Index Series of Quantitative Master Series LLC | |
Schedule of Investments December 31, 2009 | (Percentages shown are based on Net Assets) |
|
|
|
|
|
|
|
|
|
|
Industry |
| Common Stocks |
| Shares |
| Value |
| ||
|
| Meridian Interstate Bancorp, Inc. (a) |
|
| 2,200 |
| $ | 19,118 |
|
|
| Metro Bancorp, Inc. (a) |
|
| 1,700 |
|
| 21,369 |
|
|
| Midsouth Bancorp, Inc. |
|
| 1,400 |
|
| 19,460 |
|
|
| NASB Financial, Inc. |
|
| 900 |
|
| 20,961 |
|
|
| NBT Bancorp, Inc. |
|
| 8,513 |
|
| 173,410 |
|
|
| Nara Bancorp, Inc. |
|
| 7,200 |
|
| 81,648 |
|
|
| National Bankshares, Inc. |
|
| 1,900 |
|
| 53,751 |
|
|
| National Penn Bancshares, Inc. |
|
| 29,365 |
|
| 170,023 |
|
|
| Northeast Community Bancorp |
|
| 1,300 |
|
| 8,541 |
|
|
| Northrim Bancorp Inc. |
|
| 1,800 |
|
| 30,384 |
|
|
| Norwood Financial Corp. |
|
| 400 |
|
| 11,436 |
|
|
| Ohio Valley Banc Corp. |
|
| 1,000 |
|
| 22,030 |
|
|
| Old National Bancorp |
|
| 20,295 |
|
| 252,267 |
|
|
| Old Point Financial Corp. |
|
| 400 |
|
| 6,220 |
|
|
| Old Second Bancorp, Inc. (b) |
|
| 3,422 |
|
| 23,578 |
|
|
| Oriental Financial Group |
|
| 6,118 |
|
| 66,074 |
|
|
| Orrstown Financial Service, Inc. (b) |
|
| 1,400 |
|
| 48,832 |
|
|
| Pacific Capital Bancorp (b) |
|
| 8,862 |
|
| 8,508 |
|
|
| Pacific Continental Corp. |
|
| 3,500 |
|
| 40,040 |
|
|
| PacWest Bancorp |
|
| 6,011 |
|
| 121,122 |
|
|
| Park National Corp. (b) |
|
| 2,715 |
|
| 159,859 |
|
|
| Peapack-Gladstone Financial Corp. |
|
| 2,120 |
|
| 26,882 |
|
|
| Penns Woods Bancorp, Inc. |
|
| 900 |
|
| 29,196 |
|
|
| Peoples Bancorp, Inc. |
|
| 2,610 |
|
| 25,265 |
|
|
| Peoples Financial Corp. |
|
| 1,300 |
|
| 26,416 |
|
|
| Pinnacle Financial Partners, Inc. (a) |
|
| 7,800 |
|
| 110,916 |
|
|
| Porter Bancorp, Inc. |
|
| 1,050 |
|
| 15,792 |
|
|
| PremierWest Bancorp |
|
| 5,065 |
|
| 7,192 |
|
|
| PrivateBancorp, Inc. |
|
| 11,896 |
|
| 106,707 |
|
|
| Prosperity Bancshares, Inc. |
|
| 11,400 |
|
| 461,358 |
|
|
| Provident Financial Services, Inc. |
|
| 14,958 |
|
| 159,303 |
|
|
| Renasant Corp. |
|
| 5,298 |
|
| 72,053 |
|
|
| Republic Bancorp, Inc., Class A |
|
| 2,254 |
|
| 46,432 |
|
|
| Republic First Bancorp, Inc. (a) |
|
| 2,200 |
|
| 9,394 |
|
|
| Rockville Financial, Inc. |
|
| 2,100 |
|
| 22,050 |
|
|
| Roma Financial Corp. |
|
| 2,000 |
|
| 24,720 |
|
|
| S&T Bancorp, Inc. (b) |
|
| 5,863 |
|
| 99,730 |
|
|
| SCBT Financial Corp. |
|
| 2,863 |
|
| 79,276 |
|
|
| SVB Financial Group (a) |
|
| 9,600 |
|
| 400,224 |
|
|
| SY Bancorp, Inc. |
|
| 2,730 |
|
| 58,286 |
|
|
| Sandy Spring Bancorp, Inc. |
|
| 4,114 |
|
| 36,573 |
|
|
| Santander BanCorp (a) |
|
| 903 |
|
| 11,089 |
|
|
| Shore Bancshares, Inc. |
|
| 2,100 |
|
| 30,366 |
|
|
| Sierra Bancorp |
|
| 1,800 |
|
| 13,734 |
|
|
| Signature Bank (a) |
|
| 9,600 |
|
| 306,240 |
|
|
| Simmons First National Corp., Class A |
|
| 3,500 |
|
| 97,300 |
|
|
| Smithtown Bancorp, Inc. |
|
| 3,500 |
|
| 20,825 |
|
|
| The South Financial Group, Inc. |
|
| 38,100 |
|
| 24,563 |
|
|
| Southside Bancshares, Inc. |
|
| 3,066 |
|
| 60,155 |
|
|
| Southwest Bancorp, Inc. |
|
| 3,600 |
|
| 24,984 |
|
5
|
|
Master Small Cap Index Series of Quantitative Master Series LLC | |
Schedule of Investments December 31, 2009 | (Percentages shown are based on Net Assets) |
|
|
|
|
|
|
|
|
|
|
Industry |
| Common Stocks |
| Shares |
| Value |
| ||
|
| State Bancorp, Inc. |
|
| 3,600 |
| $ | 25,596 |
|
|
| StellarOne Corp. |
|
| 5,700 |
|
| 56,772 |
|
|
| Sterling Bancorp |
|
| 4,516 |
|
| 32,244 |
|
|
| Sterling Bancshares, Inc. |
|
| 17,914 |
|
| 91,899 |
|
|
| Sterling Financial Corp. (a)(b) |
|
| 13,143 |
|
| 8,149 |
|
|
| Suffolk Bancorp |
|
| 2,400 |
|
| 71,280 |
|
|
| Sun Bancorp, Inc. (a) |
|
| 3,414 |
|
| 12,803 |
|
|
| Susquehanna Bancshares, Inc. |
|
| 21,556 |
|
| 126,965 |
|
|
| Texas Capital Bancshares, Inc. (a) |
|
| 9,161 |
|
| 127,888 |
|
|
| Tompkins Trustco, Inc. |
|
| 2,140 |
|
| 86,670 |
|
|
| Tower Bancorp, Inc. |
|
| 800 |
|
| 18,280 |
|
|
| Towne Bank (b) |
|
| 5,300 |
|
| 61,904 |
|
|
| Trico Bancshares |
|
| 3,378 |
|
| 56,244 |
|
|
| TrustCo Bank Corp. NY |
|
| 19,161 |
|
| 120,714 |
|
|
| Trustmark Corp. (b) |
|
| 14,727 |
|
| 331,947 |
|
|
| UMB Financial Corp. |
|
| 8,052 |
|
| 316,846 |
|
|
| Umpqua Holdings Corp. |
|
| 20,380 |
|
| 273,296 |
|
|
| Union Bankshares Corp. |
|
| 3,750 |
|
| 46,463 |
|
|
| United Bankshares, Inc. (b) |
|
| 9,800 |
|
| 195,706 |
|
|
| United Community Banks, Inc. (a)(b) |
|
| 21,678 |
|
| 73,488 |
|
|
| United Security Bancshares (b) |
|
| 1,700 |
|
| 29,138 |
|
|
| Univest Corp. of Pennsylvania |
|
| 3,550 |
|
| 62,232 |
|
|
| Washington Banking Co. |
|
| 2,800 |
|
| 33,432 |
|
|
| Washington Trust Bancorp, Inc. |
|
| 3,500 |
|
| 54,530 |
|
|
| Webster Financial Corp. |
|
| 16,300 |
|
| 193,481 |
|
|
| WesBanco, Inc. |
|
| 5,563 |
|
| 68,647 |
|
|
| West Bancorp, Inc. |
|
| 4,100 |
|
| 20,213 |
|
|
| Westamerica Bancorp (b) |
|
| 6,783 |
|
| 375,575 |
|
|
| Western Alliance Bancorp (a) |
|
| 11,900 |
|
| 44,982 |
|
|
| Wilber Corp. |
|
| 1,300 |
|
| 9,360 |
|
|
| Wilshire Bancorp, Inc. |
|
| 4,800 |
|
| 39,312 |
|
|
| Wintrust Financial Corp. |
|
| 5,400 |
|
| 166,266 |
|
|
| Yardkin Valley Financial Corp. |
|
| 4,000 |
|
| 14,640 |
|
|
|
|
|
|
|
| |||
|
|
|
|
|
|
|
| 13,212,883 |
|
Banks: Savings, Thrift & Mortgage Lending - 1.0% |
| Abington Bancorp, Inc. |
|
| 5,480 |
|
| 37,757 |
|
|
| Astoria Financial Corp. |
|
| 21,500 |
|
| 267,245 |
|
|
| Bank Mutual Corp. |
|
| 11,838 |
|
| 81,919 |
|
|
| BankFinancial Corp. |
|
| 5,000 |
|
| 49,500 |
|
|
| Beneficial Mutual Bancorp, Inc. (a) |
|
| 8,100 |
|
| 79,704 |
|
|
| Berkshire Hills Bancorp, Inc. |
|
| 3,300 |
|
| 68,244 |
|
|
| Brookline Bancorp, Inc. |
|
| 15,287 |
|
| 151,494 |
|
|
| Brooklyn Federal Bancorp, Inc. |
|
| 1,100 |
|
| 11,044 |
|
|
| Clifton Savings Bancorp, Inc. |
|
| 2,100 |
|
| 19,677 |
|
|
| Dime Community Bancshares, Inc. |
|
| 6,949 |
|
| 81,442 |
|
|
| Doral Financial Corp. (a) |
|
| 1,400 |
|
| 5,082 |
|
|
| ESB Financial Corp. |
|
| 2,100 |
|
| 27,762 |
|
|
| ESSA Bancorp, Inc. |
|
| 3,800 |
|
| 44,460 |
|
|
| First Defiance Financial Corp. |
|
| 2,300 |
|
| 25,967 |
|
|
| First Financial Holdings, Inc. |
|
| 3,326 |
|
| 43,205 |
|
|
| First Financial Northwest, Inc. |
|
| 5,000 |
|
| 32,750 |
|
6
|
|
Master Small Cap Index Series of Quantitative Master Series LLC | |
Schedule of Investments December 31, 2009 | (Percentages shown are based on Net Assets) |
|
|
|
|
|
|
|
|
|
|
Industry |
| Common Stocks |
| Shares |
| Value |
| ||
|
| First Financial Service Corp. |
|
| 1,300 |
| $ | 11,778 |
|
|
| Flagstar Bancorp, Inc. (a) |
|
| 16,750 |
|
| 10,050 |
|
|
| Flushing Financial Corp. |
|
| 6,475 |
|
| 72,908 |
|
|
| Fox Chase Bancorp, Inc. (a) |
|
| 1,400 |
|
| 13,328 |
|
|
| Great Southern Bancorp, Inc. |
|
| 2,400 |
|
| 51,264 |
|
|
| Heritage Financial Corp. |
|
| 1,700 |
|
| 23,426 |
|
|
| Heritage Financial Group |
|
| 1,000 |
|
| 7,250 |
|
|
| Home Bancorp, Inc. (a) |
|
| 2,100 |
|
| 25,599 |
|
|
| Home Federal Bancorp, Inc. |
|
| 4,000 |
|
| 53,240 |
|
|
| K Fed Bancorp |
|
| 800 |
|
| 7,032 |
|
|
| Kearny Financial Corp. |
|
| 4,100 |
|
| 41,328 |
|
|
| Kentucky First Federal Banco |
|
| 1,200 |
|
| 13,200 |
|
|
| Legacy Bancorp, Inc./MA |
|
| 1,700 |
|
| 16,762 |
|
|
| NewAlliance Bancshares, Inc. |
|
| 25,000 |
|
| 300,250 |
|
|
| Northfield Bancorp, Inc. |
|
| 4,500 |
|
| 60,840 |
|
|
| Northwest Bancshares, Inc. |
|
| 9,375 |
|
| 106,125 |
|
|
| OceanFirst Financial Corp. |
|
| 2,300 |
|
| 25,990 |
|
|
| Ocwen Financial Corp. (a) |
|
| 13,265 |
|
| 126,946 |
|
|
| Oritani Financial Corp. |
|
| 2,100 |
|
| 28,833 |
|
|
| Provident New York Bancorp |
|
| 8,089 |
|
| 68,271 |
|
|
| Prudential Bancorp, Inc. of Pennsylvania |
|
| 1,400 |
|
| 13,328 |
|
|
| Territorial BanCorp, Inc. (a) |
|
| 2,800 |
|
| 50,540 |
|
|
| United Financial Bancorp, Inc. |
|
| 4,300 |
|
| 56,373 |
|
|
| ViewPoint Financial Group |
|
| 2,416 |
|
| 34,815 |
|
|
| WSFS Financial Corp. |
|
| 1,591 |
|
| 40,777 |
|
|
| Waterstone Financial, Inc. (a) |
|
| 1,400 |
|
| 2,870 |
|
|
| Westfield Financial, Inc. |
|
| 7,812 |
|
| 64,449 |
|
|
|
|
|
|
|
| |||
|
|
|
|
|
|
|
| 2,354,824 |
|
Beverage: Brewers & Distillers - 0.0% |
| Boston Beer Co., Inc., Class A (a) |
|
| 1,900 |
|
| 88,540 |
|
Beverage: Soft Drinks - 0.1% |
| Coca-Cola Bottling Co. Consolidated |
|
| 1,087 |
|
| 58,720 |
|
|
| Diedrich Coffee, Inc. (a) |
|
| 700 |
|
| 24,395 |
|
|
| Farmer Bros. Co. |
|
| 1,520 |
|
| 30,005 |
|
|
| Heckmann Corp. (a) |
|
| 20,800 |
|
| 103,792 |
|
|
| National Beverage Corp. |
|
| 2,128 |
|
| 29,494 |
|
|
| Peet’s Coffee & Tea, Inc. (a) |
|
| 2,400 |
|
| 79,992 |
|
|
|
|
|
|
|
| |||
|
|
|
|
|
|
|
| 326,398 |
|
Biotechnology - 3.9% |
| AMAG Pharmaceuticals, Inc. (a) |
|
| 3,960 |
|
| 150,599 |
|
|
| ARYx Therapeutics, Inc. (a) |
|
| 4,800 |
|
| 15,408 |
|
|
| AVI BioPharma, Inc. (a)(b) |
|
| 21,200 |
|
| 30,952 |
|
|
| Accelrys, Inc. (a) |
|
| 6,700 |
|
| 38,391 |
|
|
| Acorda Therapeutics, Inc. (a) |
|
| 9,400 |
|
| 237,068 |
|
|
| Affymax, Inc. (a) |
|
| 3,800 |
|
| 94,012 |
|
|
| Albany Molecular Research, Inc. (a) |
|
| 5,787 |
|
| 52,546 |
|
|
| Allos Therapeutics, Inc. (a) |
|
| 16,200 |
|
| 106,434 |
|
|
| Alnylam Pharmaceuticals, Inc. (a)(b) |
|
| 9,000 |
|
| 158,580 |
|
|
| Amicus Therapeutics, Inc. (a) |
|
| 4,100 |
|
| 16,277 |
|
|
| Arena Pharmaceuticals, Inc. (a)(b) |
|
| 21,000 |
|
| 74,550 |
|
|
| Ariad Pharmaceuticals, Inc. (a) |
|
| 23,719 |
|
| 54,079 |
|
|
| Arqule, Inc. (a) |
|
| 10,100 |
|
| 37,269 |
|
|
| Array Biopharma, Inc. (a) |
|
| 11,800 |
|
| 33,158 |
|
7
|
|
Master Small Cap Index Series of Quantitative Master Series LLC |
|
Schedule of Investments December 31, 2009 | (Percentages shown are based on Net Assets) |
|
|
|
|
|
|
|
|
|
|
Industry |
| Common Stocks |
| Shares |
| Value |
| ||
|
| BioDelivery Sciences International, Inc. (a) |
|
| 2,800 |
| $ | 11,004 |
|
|
| BioMimetic Therapeutics, Inc. (a) |
|
| 3,022 |
|
| 36,052 |
|
|
| Biodel, Inc. (a) |
|
| 4,000 |
|
| 17,360 |
|
|
| Cardium Therapeutics, Inc. (a) |
|
| 9,500 |
|
| 6,460 |
|
|
| Celera Corp. (a) |
|
| 20,200 |
|
| 139,582 |
|
|
| Cell Therapeutics, Inc. (a)(b) |
|
| 130,900 |
|
| 149,226 |
|
|
| Celldex Therapeutics, Inc. (a) |
|
| 5,900 |
|
| 27,612 |
|
|
| Cepheid, Inc. (a) |
|
| 14,500 |
|
| 180,960 |
|
|
| Chelsea Therapeutics International, Inc. (a) |
|
| 6,500 |
|
| 17,550 |
|
|
| Clinical Data, Inc. (a) |
|
| 2,798 |
|
| 51,091 |
|
|
| Cornerstone Therapeutics, Inc. (a) |
|
| 1,500 |
|
| 9,150 |
|
|
| Cubist Pharmaceuticals, Inc. (a) |
|
| 13,967 |
|
| 264,954 |
|
|
| Curis, Inc. (a) |
|
| 14,500 |
|
| 47,125 |
|
|
| Cypress Bioscience, Inc. (a) |
|
| 9,500 |
|
| 54,720 |
|
|
| Cytokinetics, Inc. (a) |
|
| 9,400 |
|
| 27,354 |
|
|
| Cytori Therapeutics, Inc. (a)(b) |
|
| 6,700 |
|
| 40,870 |
|
|
| Discovery Laboratories, Inc. (a)(b) |
|
| 22,800 |
|
| 14,330 |
|
|
| Dyax Corp. (a) |
|
| 15,500 |
|
| 52,545 |
|
|
| Emergent Biosolutions, Inc. (a) |
|
| 4,300 |
|
| 58,437 |
|
|
| Enzo Biochem, Inc. (a) |
|
| 7,895 |
|
| 42,475 |
|
|
| Enzon Pharmaceuticals, Inc. (a)(b) |
|
| 11,100 |
|
| 116,883 |
|
|
| Exelixis, Inc. (a) |
|
| 26,618 |
|
| 196,175 |
|
|
| Facet Biotech Corp. (a) |
|
| 5,780 |
|
| 101,612 |
|
|
| GTx, Inc. (a)(b) |
|
| 4,600 |
|
| 19,320 |
|
|
| Genomic Health, Inc. (a) |
|
| 3,400 |
|
| 66,504 |
|
|
| Geron Corp. (a)(b) |
|
| 22,329 |
|
| 123,926 |
|
|
| Halozyme Therapeutics, Inc. (a) |
|
| 16,000 |
|
| 93,920 |
|
|
| Harvard Bioscience, Inc. (a) |
|
| 7,000 |
|
| 24,990 |
|
|
| Hemispherx Biopharma, Inc. (a)(b) |
|
| 28,900 |
|
| 16,184 |
|
|
| Human Genome Sciences, Inc. (a) |
|
| 43,600 |
|
| 1,334,160 |
|
|
| Idenix Pharmaceuticals, Inc. (a) |
|
| 6,200 |
|
| 13,330 |
|
|
| Idera Pharmaceuticals, Inc. (a) |
|
| 5,400 |
|
| 27,918 |
|
|
| ImmunoGen, Inc. (a) |
|
| 13,100 |
|
| 102,966 |
|
|
| Immunomedics, Inc. (a) |
|
| 15,000 |
|
| 48,150 |
|
|
| Incyte Corp. (a) |
|
| 20,124 |
|
| 183,330 |
|
|
| Insmed, Inc. (a) |
|
| 30,600 |
|
| 23,562 |
|
|
| InterMune, Inc. (a) |
|
| 9,414 |
|
| 122,759 |
|
|
| Kensey Nash Corp. (a) |
|
| 2,000 |
|
| 51,000 |
|
|
| Lexicon Genetics, Inc. (a) |
|
| 21,200 |
|
| 36,040 |
|
|
| Ligand Pharmaceuticals, Inc., Class B (a) |
|
| 29,400 |
|
| 63,798 |
|
|
| MannKind Corp. (a)(b) |
|
| 13,450 |
|
| 117,822 |
|
|
| Martek Biosciences Corp. (a) |
|
| 7,400 |
|
| 140,156 |
|
|
| Maxygen, Inc. (a) |
|
| 6,201 |
|
| 37,764 |
|
|
| Medivation, Inc. (a) |
|
| 6,600 |
|
| 248,490 |
|
|
| Metabolix, Inc. (a) |
|
| 4,700 |
|
| 52,029 |
|
|
| Micromet, Inc. (a)(b) |
|
| 13,200 |
|
| 87,912 |
|
|
| Molecular Insight Pharmaceuticals, Inc. (a) |
|
| 4,300 |
|
| 9,675 |
|
|
| Momenta Pharmaceuticals, Inc. (a) |
|
| 9,100 |
|
| 114,751 |
|
|
| Myriad Pharmaceuticals, Inc. (a) |
|
| 4,675 |
|
| 23,515 |
|
|
| NPS Pharmaceuticals, Inc. (a) |
|
| 11,900 |
|
| 40,460 |
|
8
|
|
Master Small Cap Index Series of Quantitative Master Series LLC |
|
Schedule of Investments December 31, 2009 | (Percentages shown are based on Net Assets) |
|
|
|
|
|
|
|
|
|
|
Industry |
| Common Stocks |
| Shares |
| Value |
| ||
|
| Nabi Biopharmaceuticals (a) |
|
| 12,854 |
| $ | 62,985 |
|
|
| Nanosphere, Inc. (a) |
|
| 2,600 |
|
| 16,744 |
|
|
| Nektar Therapeutics (a) |
|
| 23,100 |
|
| 215,292 |
|
|
| Neurocrine Biosciences, Inc. (a) |
|
| 9,800 |
|
| 26,656 |
|
|
| Neurogesx, Inc. (a) |
|
| 3,000 |
|
| 23,130 |
|
|
| Novavax, Inc. (a)(b) |
|
| 14,700 |
|
| 39,102 |
|
|
| Omeros Corp. (a) |
|
| 700 |
|
| 4,914 |
|
|
| OncoGenex Pharmaceutical, Inc. (a) |
|
| 1,000 |
|
| 22,280 |
|
|
| Onyx Pharmaceuticals, Inc. (a) |
|
| 14,820 |
|
| 434,819 |
|
|
| Opko Health, Inc. (a) |
|
| 10,700 |
|
| 19,581 |
|
|
| Orexigen Therapeutics, Inc. (a) |
|
| 5,800 |
|
| 43,152 |
|
|
| Osiris Therapeutics, Inc. (a) |
|
| 4,100 |
|
| 29,274 |
|
|
| OxiGene, Inc. (a)(b) |
|
| 8,200 |
|
| 9,348 |
|
|
| PDL BioPharma, Inc. |
|
| 27,200 |
|
| 186,592 |
|
|
| Pharmasset, Inc. (a) |
|
| 5,000 |
|
| 103,500 |
|
|
| Poniard Pharmaceuticals, Inc. (a)(b) |
|
| 6,400 |
|
| 11,712 |
|
|
| Progenics Pharmaceuticals, Inc. (a) |
|
| 6,700 |
|
| 29,748 |
|
|
| Protalix BioTherapeutics, Inc. (a)(b) |
|
| 9,260 |
|
| 61,301 |
|
|
| RTI Biologics, Inc. (a) |
|
| 13,200 |
|
| 50,688 |
|
|
| Regeneron Pharmaceuticals, Inc. (a) |
|
| 15,519 |
|
| 375,249 |
|
|
| Repligen Corp. (a) |
|
| 7,700 |
|
| 31,647 |
|
|
| Repros Therapeutics, Inc. (a) |
|
| 2,100 |
|
| 1,673 |
|
|
| Rigel Pharmaceuticals, Inc. (a) |
|
| 12,170 |
|
| 115,737 |
|
|
| Sangamo Biosciences, Inc. (a) |
|
| 10,300 |
|
| 60,976 |
|
|
| Savient Pharmaceuticals, Inc. (a) |
|
| 15,328 |
|
| 208,614 |
|
|
| Seattle Genetics, Inc. (a) |
|
| 19,800 |
|
| 201,168 |
|
|
| Sequenom, Inc. (a)(b) |
|
| 12,800 |
|
| 52,992 |
|
|
| StemCells, Inc. (a)(b) |
|
| 21,700 |
|
| 27,342 |
|
|
| Sucampo Pharmaceuticals, Inc., Class A (a) |
|
| 2,300 |
|
| 9,292 |
|
|
| Synta Pharmaceuticals Corp. (a) |
|
| 4,100 |
|
| 20,746 |
|
|
| Theravance, Inc. (a) |
|
| 13,300 |
|
| 173,831 |
|
|
| Vanda Pharmaceuticals, Inc. (a) |
|
| 6,500 |
|
| 73,060 |
|
|
| ViroPharma, Inc. (a) |
|
| 19,400 |
|
| 162,766 |
|
|
| ZymoGenetics, Inc. (a) |
|
| 9,200 |
|
| 58,788 |
|
|
|
|
|
|
|
| |||
|
|
|
|
|
|
|
| 8,951,980 |
|
Building Materials - 0.9% |
| Acuity Brands, Inc. |
|
| 9,960 |
|
| 354,974 |
|
|
| Ameron International Corp. |
|
| 2,100 |
|
| 133,266 |
|
|
| BlueLinx Holdings, Inc. (a) |
|
| 2,600 |
|
| 7,202 |
|
|
| Builders FirstSource, Inc. (a)(b) |
|
| 4,000 |
|
| 15,400 |
|
|
| Gibraltar Industries, Inc. |
|
| 6,734 |
|
| 105,926 |
|
|
| Griffon Corp. (a) |
|
| 10,455 |
|
| 127,760 |
|
|
| Headwaters, Inc. (a) |
|
| 13,146 |
|
| 85,712 |
|
|
| LSI Industries, Inc. |
|
| 4,712 |
|
| 37,131 |
|
|
| Louisiana-Pacific Corp. (a) |
|
| 29,400 |
|
| 205,212 |
|
|
| NCI Building Systems, Inc. (a) |
|
| 18,568 |
|
| 33,608 |
|
|
| Orion Energy Systems, Inc. (a) |
|
| 4,100 |
|
| 17,999 |
|
|
| Quanex Building Products Corp. |
|
| 9,410 |
|
| 159,688 |
|
|
| Simpson Manufacturing Co., Inc. (b) |
|
| 9,532 |
|
| 256,315 |
|
|
| Texas Industries, Inc. |
|
| 5,705 |
|
| 199,618 |
|
|
| Trex Co., Inc. (a) |
|
| 3,809 |
|
| 74,656 |
|
9
|
|
Master Small Cap Index Series of Quantitative Master Series LLC |
|
Schedule of Investments December 31, 2009 | (Percentages shown are based on Net Assets) |
|
|
|
|
|
|
|
|
|
|
Industry |
| Common Stocks |
| Shares |
| Value |
| ||
|
| Watsco, Inc. |
|
| 6,165 |
| $ | 301,962 |
|
|
|
|
|
|
|
| |||
|
|
|
|
|
|
|
| 2,116,429 |
|
Building: Climate Control - 0.1% |
| Aaon, Inc. |
|
| 2,650 |
|
| 51,649 |
|
|
| Comfort Systems USA, Inc. |
|
| 9,800 |
|
| 120,932 |
|
|
| Interline Brands, Inc. (a) |
|
| 8,100 |
|
| 139,887 |
|
|
|
|
|
|
|
| |||
|
|
|
|
|
|
|
| 312,468 |
|
Building: Roofing, Wallboard & Plumbing - 0.1% |
| Beacon Roofing Supply, Inc. (a) |
|
| 10,150 |
|
| 162,400 |
|
Cable Television Services - 0.1% |
| Knology, Inc. (a) |
|
| 7,000 |
|
| 76,650 |
|
|
| Mediacom Communications Corp., Class A (a) |
|
| 9,900 |
|
| 44,253 |
|
|
|
|
|
|
|
| |||
|
|
|
|
|
|
|
| 120,903 |
|
Casinos & Gambling - 0.4% |
| Ameristar Casinos, Inc. |
|
| 6,400 |
|
| 97,472 |
|
|
| Bally Technologies, Inc. (a) |
|
| 12,800 |
|
| 528,512 |
|
|
| Dover Downs Gaming & Entertainment, Inc. |
|
| 3,605 |
|
| 13,627 |
|
|
| Isle of Capri Casinos, Inc. (a) |
|
| 3,975 |
|
| 29,733 |
|
|
| Lakes Entertainment, Inc. (a) |
|
| 5,300 |
|
| 13,303 |
|
|
| Monarch Casino & Resort, Inc. (a) |
|
| 2,200 |
|
| 17,820 |
|
|
| Multimedia Games, Inc. (a) |
|
| 7,300 |
|
| 43,873 |
|
|
| Pinnacle Entertainment, Inc. (a) |
|
| 14,994 |
|
| 134,646 |
|
|
| Shuffle Master, Inc. (a) |
|
| 13,500 |
|
| 111,240 |
|
|
| Youbet.com, Inc. (a) |
|
| 6,900 |
|
| 19,803 |
|
|
|
|
|
|
|
| |||
|
|
|
|
|
|
|
| 1,010,029 |
|
Cement - 0.0% |
| U.S. Concrete, Inc. (a) |
|
| 8,400 |
|
| 7,644 |
|
Chemicals: Diversified - 1.2% |
| Aceto Corp. |
|
| 6,200 |
|
| 31,930 |
|
|
| American Vanguard Corp. |
|
| 4,733 |
|
| 39,284 |
|
|
| Arch Chemicals, Inc. |
|
| 6,356 |
|
| 196,273 |
|
|
| Hawkins, Inc. |
|
| 1,700 |
|
| 37,111 |
|
|
| Innophos Holdings, Inc. |
|
| 4,290 |
|
| 98,627 |
|
|
| LSB Industries, Inc. (a) |
|
| 4,300 |
|
| 60,630 |
|
|
| Landec Corp. (a) |
|
| 7,000 |
|
| 43,680 |
|
|
| OM Group, Inc. (a) |
|
| 7,200 |
|
| 226,008 |
|
|
| Olin Corp. |
|
| 18,514 |
|
| 324,365 |
|
|
| Omnova Solutions, Inc. (a) |
|
| 9,800 |
|
| 60,074 |
|
|
| PolyOne Corp. (a) |
|
| 23,167 |
|
| 173,057 |
|
|
| Rockwood Holdings, Inc. (a) |
|
| 12,200 |
|
| 287,432 |
|
|
| Schulman A, Inc. |
|
| 5,106 |
|
| 103,039 |
|
|
| Sensient Technologies Corp. |
|
| 11,857 |
|
| 311,839 |
|
|
| ShengdaTech, Inc. (a) |
|
| 7,000 |
|
| 42,910 |
|
|
| Solutia, Inc. (a) |
|
| 28,485 |
|
| 361,760 |
|
|
| W.R. Grace & Co. (a) |
|
| 17,300 |
|
| 438,555 |
|
|
| Westlake Chemical Corp. |
|
| 4,800 |
|
| 119,664 |
|
|
|
|
|
|
|
| |||
|
|
|
|
|
|
|
| 2,956,238 |
|
Chemicals: Specialty - 0.5% |
| Balchem Corp. |
|
| 4,600 |
|
| 154,146 |
|
|
| Calgon Carbon Corp. (a) |
|
| 12,601 |
|
| 175,154 |
|
|
| ICO, Inc. |
|
| 5,600 |
|
| 40,936 |
|
|
| Innospec, Inc. |
|
| 5,900 |
|
| 59,531 |
|
|
| NewMarket Corp. |
|
| 2,300 |
|
| 263,971 |
|
|
| Polypore International, Inc. (a) |
|
| 6,000 |
|
| 71,400 |
|
|
| Quaker Chemical Corp. |
|
| 2,700 |
|
| 55,728 |
|
|
| Stepan Co. |
|
| 1,955 |
|
| 126,704 |
|
10
|
|
Master Small Cap Index Series of Quantitative Master Series LLC |
|
Schedule of Investments December 31, 2009 | (Percentages shown are based on Net Assets) |
|
|
|
|
|
|
|
|
|
|
Industry |
| Common Stocks |
| Shares |
| Value |
| ||
|
| Zep, Inc. |
|
| 5,380 |
| $ | 93,182 |
|
|
|
|
|
|
|
| |||
|
|
|
|
|
|
|
| 1,040,752 |
|
Coal - 0.3% |
| Cloud Peak Energy, Inc. (a) |
|
| 6,700 |
|
| 97,552 |
|
|
| International Coal Group, Inc. (a) |
|
| 21,700 |
|
| 83,762 |
|
|
| James River Coal Co. (a) |
|
| 6,200 |
|
| 114,886 |
|
|
| Patriot Coal Corp. (a) |
|
| 17,500 |
|
| 270,550 |
|
|
| Westmoreland Coal Co. (a) |
|
| 2,400 |
|
| 21,384 |
|
|
|
|
|
|
|
| |||
|
|
|
|
|
|
|
| 588,134 |
|
Commercial Finance & Mortgage Companies - 0.1% |
| Financial Federal Corp. |
|
| 6,500 |
|
| 178,750 |
|
|
| Medallion Financial Corp. |
|
| 3,700 |
|
| 30,229 |
|
|
| NewStar Financial, Inc. (a) |
|
| 6,000 |
|
| 23,520 |
|
|
|
|
|
|
|
| |||
|
|
|
|
|
|
|
| 232,499 |
|
Commercial Services - 2.6% |
| ABM Industries, Inc. |
|
| 11,370 |
|
| 234,904 |
|
|
| APAC Customer Services, Inc. (a) |
|
| 6,900 |
|
| 41,124 |
|
|
| Administaff, Inc. |
|
| 5,061 |
|
| 119,389 |
|
|
| The Advisory Board Co. (a) |
|
| 3,900 |
|
| 119,574 |
|
|
| Barrett Business Services, Inc. |
|
| 1,800 |
|
| 22,122 |
|
|
| CBIZ, Inc. (a) |
|
| 10,953 |
|
| 84,338 |
|
|
| CDI Corp. |
|
| 3,101 |
|
| 40,158 |
|
|
| CRA International, Inc. (a) |
|
| 2,400 |
|
| 63,960 |
|
|
| CoStar Group, Inc. (a) |
|
| 4,450 |
|
| 185,876 |
|
|
| Compass Diversified Holdings |
|
| 5,800 |
|
| 74,008 |
|
|
| Cornell Cos., Inc. (a) |
|
| 2,500 |
|
| 56,750 |
|
|
| Corporate Executive Board Co. |
|
| 8,100 |
|
| 184,842 |
|
|
| Diamond Management & Technology Consultants, Inc. |
|
| 5,500 |
|
| 40,535 |
|
|
| Dice Holdings, Inc. (a) |
|
| 3,600 |
|
| 23,580 |
|
|
| DynCorp. International, Inc. (a) |
|
| 6,100 |
|
| 87,535 |
|
|
| ExlService Holdings, Inc. (a) |
|
| 3,800 |
|
| 69,008 |
|
|
| Forrester Research, Inc. (a) |
|
| 3,281 |
|
| 85,142 |
|
|
| G&K Services, Inc., Class A |
|
| 4,677 |
|
| 117,533 |
|
|
| GP Strategies Corp. (a) |
|
| 3,600 |
|
| 27,108 |
|
|
| The Geo Group, Inc. (a) |
|
| 12,100 |
|
| 264,748 |
|
|
| Global Sources Ltd. (a) |
|
| 3,997 |
|
| 24,981 |
|
|
| The Hackett Group, Inc. (a) |
|
| 9,600 |
|
| 26,688 |
|
|
| Healthcare Services Group, Inc. |
|
| 10,537 |
|
| 226,124 |
|
|
| Heidrick & Struggles International, Inc. |
|
| 3,758 |
|
| 117,400 |
|
|
| Huron Consulting Group, Inc. (a) |
|
| 5,000 |
|
| 115,200 |
|
|
| ICF International, Inc. (a) |
|
| 1,700 |
|
| 45,560 |
|
|
| ICT Group, Inc. (a) |
|
| 2,100 |
|
| 34,293 |
|
|
| Innodata Corp. (a) |
|
| 4,300 |
|
| 23,822 |
|
|
| Kelly Services, Inc., Class A |
|
| 6,468 |
|
| 77,163 |
|
|
| Kforce, Inc. (a) |
|
| 7,400 |
|
| 92,500 |
|
|
| Korn/Ferry International (a) |
|
| 10,168 |
|
| 167,772 |
|
|
| Liquidity Services, Inc. (a) |
|
| 3,600 |
|
| 36,252 |
|
|
| LoopNet, Inc. (a) |
|
| 4,700 |
|
| 46,718 |
|
|
| MAXIMUS, Inc. |
|
| 4,004 |
|
| 200,200 |
|
|
| MPS Group, Inc. (a) |
|
| 22,805 |
|
| 313,341 |
|
|
| Mac-Gray Corp. (a) |
|
| 3,100 |
|
| 31,930 |
|
|
| Navigant Consulting, Inc. (a) |
|
| 12,323 |
|
| 183,120 |
|
11
|
|
Master Small Cap Index Series of Quantitative Master Series LLC |
|
Schedule of Investments December 31, 2009 | (Percentages shown are based on Net Assets) |
|
|
|
|
|
|
|
|
|
|
Industry |
| Common Stocks |
| Shares |
| Value |
| ||
|
| On Assignment, Inc. (a) |
|
| 8,900 |
| $ | 63,635 |
|
|
| Resources Connection, Inc. (a) |
|
| 11,232 |
|
| 238,343 |
|
|
| Rollins, Inc. |
|
| 10,953 |
|
| 211,174 |
|
|
| SYKES Enterprises, Inc. (a) |
|
| 8,161 |
|
| 207,861 |
|
|
| Spherion Corp. (a) |
|
| 12,929 |
|
| 72,661 |
|
|
| Standard Parking Corp. (a) |
|
| 1,600 |
|
| 25,408 |
|
|
| Startek, Inc. (a) |
|
| 3,300 |
|
| 24,684 |
|
|
| TeleTech Holdings, Inc. (a) |
|
| 7,789 |
|
| 156,014 |
|
|
| TrueBlue, Inc. (a) |
|
| 10,922 |
|
| 161,755 |
|
|
| Unifirst Corp. |
|
| 3,500 |
|
| 168,385 |
|
|
| Volt Information Sciences, Inc. (a) |
|
| 2,938 |
|
| 29,380 |
|
|
| Watson Wyatt Worldwide, Inc. (a) |
|
| 9,915 |
|
| 471,161 |
|
|
| World Fuel Services Corp. |
|
| 13,800 |
|
| 369,702 |
|
|
|
|
|
|
|
| |||
|
|
|
|
|
|
|
| 5,905,461 |
|
Commercial Services: Rental & Leasing - 0.4% |
| Aircastle Ltd. |
|
| 11,800 |
|
| 116,230 |
|
|
| CAI International, Inc. (a) |
|
| 2,200 |
|
| 19,866 |
|
|
| Electro Rent Corp. |
|
| 4,453 |
|
| 51,388 |
|
|
| H&E Equipment Services, Inc. (a) |
|
| 6,600 |
|
| 69,234 |
|
|
| McGrath RentCorp |
|
| 6,010 |
|
| 134,384 |
|
|
| Mobile Mini, Inc. (a) |
|
| 9,142 |
|
| 128,811 |
|
|
| PHH Corp. (a)(b) |
|
| 13,064 |
|
| 210,461 |
|
|
| RSC Holdings, Inc. (a) |
|
| 11,800 |
|
| 83,072 |
|
|
| TAL International Group, Inc. |
|
| 3,600 |
|
| 47,628 |
|
|
| United Rentals, Inc. (a) |
|
| 15,000 |
|
| 147,150 |
|
|
| Willis Lease Finance Corp. (a) |
|
| 1,500 |
|
| 22,500 |
|
|
|
|
|
|
|
| |||
|
|
|
|
|
|
|
| 1,030,724 |
|
Commercial Vehicles & Parts - 0.2% |
| Force Protection, Inc. (a) |
|
| 17,500 |
|
| 91,175 |
|
|
| Miller Industries, Inc. (a) |
|
| 2,700 |
|
| 30,645 |
|
|
| Modine Manufacturing Co. |
|
| 10,694 |
|
| 126,617 |
|
|
| Rush Enterprises, Inc., Class A (a) |
|
| 8,200 |
|
| 97,498 |
|
|
| Spartan Motors, Inc. |
|
| 8,100 |
|
| 45,603 |
|
|
|
|
|
|
|
| |||
|
|
|
|
|
|
|
| 391,538 |
|
Communications Technology - 2.9% |
| 3Com Corp. (a) |
|
| 93,000 |
|
| 697,500 |
|
|
| AboveNet, Inc. (a) |
|
| 3,000 |
|
| 195,120 |
|
|
| Acme Packet, Inc. (a) |
|
| 10,100 |
|
| 111,100 |
|
|
| Adtran, Inc. |
|
| 12,700 |
|
| 286,385 |
|
|
| Airvana, Inc. (a) |
|
| 5,300 |
|
| 40,280 |
|
|
| Anaren, Inc. (a) |
|
| 3,022 |
|
| 45,481 |
|
|
| Anixter International, Inc. (a) |
|
| 6,872 |
|
| 323,671 |
|
|
| Aruba Networks, Inc. (a) |
|
| 14,900 |
|
| 158,834 |
|
|
| Bel Fuse, Inc. |
|
| 2,559 |
|
| 54,993 |
|
|
| BigBand Networks, Inc. (a) |
|
| 8,200 |
|
| 28,208 |
|
|
| Black Box Corp. |
|
| 4,088 |
|
| 115,854 |
|
|
| Comtech Telecommunications Corp. (a) |
|
| 6,425 |
|
| 225,196 |
|
|
| Digi International, Inc. (a) |
|
| 6,200 |
|
| 56,544 |
|
|
| DigitalGlobe, Inc. (a) |
|
| 3,800 |
|
| 91,960 |
|
|
| EMS Technologies, Inc. (a) |
|
| 3,800 |
|
| 55,100 |
|
|
| Echelon Corp. (a)(b) |
|
| 8,413 |
|
| 97,254 |
|
|
| Emulex Corp. (a) |
|
| 19,000 |
|
| 207,100 |
|
|
| Extreme Networks, Inc. (a) |
|
| 22,300 |
|
| 64,001 |
|
12
|
|
Master Small Cap Index Series of Quantitative Master Series LLC |
|
Schedule of Investments December 31, 2009 | (Percentages shown are based on Net Assets) |
|
|
|
|
|
|
|
|
|
|
Industry |
| Common Stocks |
| Shares |
| Value |
| ||
|
| GSI Technology, Inc. (a) |
|
| 4,100 |
| $ | 18,368 |
|
|
| GeoEye, Inc. (a) |
|
| 4,100 |
|
| 114,308 |
|
|
| Globecomm Systems, Inc. (a) |
|
| 5,200 |
|
| 40,664 |
|
|
| Harmonic, Inc. (a) |
|
| 23,996 |
|
| 151,895 |
|
|
| Harris Stratex Networks, Inc., Class A (a) |
|
| 13,450 |
|
| 92,939 |
|
|
| Hughes Communications, Inc. (a) |
|
| 2,100 |
|
| 54,663 |
|
|
| Infinera Corp. (a) |
|
| 20,600 |
|
| 182,722 |
|
|
| InterDigital, Inc. (a)(b) |
|
| 10,200 |
|
| 270,708 |
|
|
| Ixia (a) |
|
| 7,229 |
|
| 53,784 |
|
|
| KVH Industries, Inc. (a) |
|
| 2,700 |
|
| 39,825 |
|
|
| Loral Space & Communications Ltd. (a) |
|
| 2,700 |
|
| 85,347 |
|
|
| NETGEAR, Inc. (a) |
|
| 8,100 |
|
| 175,689 |
|
|
| Network Equipment Technologies, Inc. (a) |
|
| 8,100 |
|
| 32,805 |
|
|
| Novatel Wireless, Inc. (a) |
|
| 6,300 |
|
| 50,211 |
|
|
| Oplink Communications, Inc. (a) |
|
| 4,402 |
|
| 72,149 |
|
|
| PC-Tel, Inc. (a) |
|
| 4,800 |
|
| 28,416 |
|
|
| Plantronics, Inc. |
|
| 12,099 |
|
| 314,332 |
|
|
| Polycom, Inc. (a) |
|
| 19,600 |
|
| 489,412 |
|
|
| Power-One, Inc. (a) |
|
| 19,200 |
|
| 83,520 |
|
|
| Riverbed Technology, Inc. (a) |
|
| 13,000 |
|
| 298,610 |
|
|
| SeaChange International, Inc. (a) |
|
| 7,500 |
|
| 49,275 |
|
|
| Shoretel, Inc. (a) |
|
| 10,309 |
|
| 59,586 |
|
|
| Sonus Networks, Inc. (a) |
|
| 51,600 |
|
| 108,876 |
|
|
| Switch and Data Facilities Co., Inc. (a) |
|
| 5,000 |
|
| 101,050 |
|
|
| Sycamore Networks, Inc. |
|
| 4,940 |
|
| 103,295 |
|
|
| Syniverse Holdings, Inc. (a) |
|
| 16,600 |
|
| 290,168 |
|
|
| Tekelec (a) |
|
| 15,200 |
|
| 232,256 |
|
|
| Viasat, Inc. (a) |
|
| 6,301 |
|
| 200,246 |
|
|
|
|
|
|
|
| |||
|
|
|
|
|
|
|
| 6,649,700 |
|
Computer Services Software & Systems - 6.7% |
| 3PAR, Inc. (a) |
|
| 6,700 |
|
| 79,395 |
|
|
| ACI Worldwide, Inc. (a)(c) |
|
| 8,685 |
|
| 148,948 |
|
|
| AMICAS, Inc. (a) |
|
| 8,100 |
|
| 44,064 |
|
|
| ActivIdentity Corp. (a) |
|
| 12,900 |
|
| 30,315 |
|
|
| Actuate Corp. (a) |
|
| 11,200 |
|
| 47,936 |
|
|
| Acxiom Corp. (a) |
|
| 16,900 |
|
| 226,798 |
|
|
| American Reprographics Co. (a) |
|
| 9,100 |
|
| 63,791 |
|
|
| American Software, Class A |
|
| 5,700 |
|
| 34,200 |
|
|
| ArcSight, Inc. (a) |
|
| 4,100 |
|
| 104,878 |
|
|
| Ariba, Inc. (a) |
|
| 21,480 |
|
| 268,930 |
|
|
| Art Technology Group, Inc. (a) |
|
| 31,700 |
|
| 142,967 |
|
|
| AsiaInfo Holdings, Inc. (a) |
|
| 7,200 |
|
| 219,384 |
|
|
| Avid Technology, Inc. (a) |
|
| 7,400 |
|
| 94,424 |
|
|
| Blackbaud, Inc. |
|
| 10,926 |
|
| 258,181 |
|
|
| Blackboard, Inc. (a) |
|
| 7,800 |
|
| 354,042 |
|
|
| Blue Coat Systems, Inc. (a) |
|
| 9,600 |
|
| 273,984 |
|
|
| Bottomline Technologies, Inc. (a) |
|
| 6,500 |
|
| 114,205 |
|
|
| CACI International, Inc., Class A (a) |
|
| 6,900 |
|
| 337,065 |
|
|
| COMSYS IT Partners, Inc. (a) |
|
| 3,600 |
|
| 32,004 |
|
|
| CSG Systems International, Inc. (a) |
|
| 8,500 |
|
| 162,265 |
|
|
| Callidus Software, Inc. (a) |
|
| 7,300 |
|
| 22,046 |
|
13
|
|
Master Small Cap Index Series of Quantitative Master Series LLC |
|
Schedule of Investments December 31, 2009 | (Percentages shown are based on Net Assets) |
|
|
|
|
|
|
|
|
|
|
Industry |
| Common Stocks |
| Shares |
| Value |
| ||
|
| China Information Security Technology, |
|
| 6,700 |
| $ | 41,272 |
|
|
| China Transinfo Technology (a) |
|
| 2,100 |
|
| 17,157 |
|
|
| Chordiant Software, Inc. (a) |
|
| 7,540 |
|
| 20,735 |
|
|
| Ciber, Inc. (a) |
|
| 18,202 |
|
| 62,797 |
|
|
| ComScore, Inc. (a) |
|
| 5,600 |
|
| 98,280 |
|
|
| CommVault Systems, Inc. (a) |
|
| 10,100 |
|
| 239,269 |
|
|
| Compellent Technologies, Inc. (a) |
|
| 4,100 |
|
| 92,988 |
|
|
| Computer Task Group, Inc. (a) |
|
| 4,300 |
|
| 34,443 |
|
|
| Concur Technologies, Inc. (a) |
|
| 9,800 |
|
| 418,950 |
|
|
| DealerTrack Holdings, Inc. (a) |
|
| 9,600 |
|
| 180,384 |
|
|
| Delrek, Inc. (a) |
|
| 3,529 |
|
| 27,456 |
|
|
| DemandTec, Inc. (a) |
|
| 5,000 |
|
| 43,850 |
|
|
| Digital River, Inc. (a) |
|
| 8,800 |
|
| 237,512 |
|
|
| DivX, Inc. (a) |
|
| 8,700 |
|
| 49,068 |
|
|
| Double-Take Software, Inc. (a) |
|
| 4,300 |
|
| 42,957 |
|
|
| EarthLink, Inc. |
|
| 23,900 |
|
| 198,609 |
|
|
| Ebix, Inc. (a) |
|
| 1,600 |
|
| 78,128 |
|
|
| eLoyalty Corp. (a) |
|
| 2,100 |
|
| 14,427 |
|
|
| Epicor Software Corp. (a) |
|
| 11,200 |
|
| 85,344 |
|
|
| EPIQ Systems, Inc. (a) |
|
| 7,817 |
|
| 109,360 |
|
|
| ePlus, Inc. (a) |
|
| 800 |
|
| 13,208 |
|
|
| FalconStor Software, Inc. (a) |
|
| 8,909 |
|
| 36,171 |
|
|
| Fortinet, Inc. (a) |
|
| 2,400 |
|
| 42,168 |
|
|
| GSE Systems, Inc. (a) |
|
| 4,300 |
|
| 23,564 |
|
|
| Gartner, Inc., Class A (a) |
|
| 14,879 |
|
| 268,417 |
|
|
| i2 Technologies, Inc. (a) |
|
| 3,800 |
|
| 72,656 |
|
|
| iGate Corp. |
|
| 5,500 |
|
| 55,000 |
|
|
| Imergent, Inc. |
|
| 1,600 |
|
| 9,712 |
|
|
| infoGROUP, Inc. |
|
| 8,061 |
|
| 64,649 |
|
|
| Informatica Corp. (a) |
|
| 20,800 |
|
| 537,888 |
|
|
| Infospace, Inc. (a) |
|
| 8,700 |
|
| 74,559 |
|
|
| Integral Systems, Inc. (a) |
|
| 3,182 |
|
| 27,556 |
|
|
| Interactive Intelligence, Inc. (a) |
|
| 3,100 |
|
| 57,164 |
|
|
| Internap Network Services Corp. (a) |
|
| 12,690 |
|
| 59,643 |
|
|
| Internet Brands, Inc., Class A (a) |
|
| 7,300 |
|
| 57,159 |
|
|
| Internet Capital Group, Inc. (a) |
|
| 9,200 |
|
| 61,180 |
|
|
| JDA Software Group, Inc. (a) |
|
| 6,608 |
|
| 168,306 |
|
|
| Kenexa Corp. (a) |
|
| 5,600 |
|
| 73,080 |
|
|
| Keynote Systems, Inc. |
|
| 3,100 |
|
| 33,821 |
|
|
| Lawson Software, Inc. (a) |
|
| 34,000 |
|
| 226,100 |
|
|
| Limelight Networks, Inc. (a) |
|
| 7,100 |
|
| 27,903 |
|
|
| Lionbridge Technologies, Inc. (a) |
|
| 16,100 |
|
| 37,030 |
|
|
| LivePerson, Inc. (a) |
|
| 9,800 |
|
| 68,306 |
|
|
| LogMeIn, Inc. (a) |
|
| 1,700 |
|
| 33,915 |
|
|
| Manhattan Associates, Inc. (a) |
|
| 5,639 |
|
| 135,505 |
|
|
| Mantech International Corp., Class A (a) |
|
| 5,100 |
|
| 246,228 |
|
|
| Mentor Graphics Corp. (a) |
|
| 23,600 |
|
| 208,388 |
|
|
| Mercury Computer Systems, Inc. (a) |
|
| 5,756 |
|
| 63,374 |
|
|
| MicroStrategy, Inc., Class A (a) |
|
| 2,000 |
|
| 188,040 |
|
|
| Moduslink Global Solutions, Inc. (a) |
|
| 11,480 |
|
| 108,027 |
|
14
|
|
Master Small Cap Index Series of Quantitative Master Series LLC | |
Schedule of Investments December 31, 2009 | (Percentages shown are based on Net Assets) |
|
|
|
|
|
|
|
|
|
|
Industry |
| Common Stocks |
| Shares |
| Value |
| ||
|
| Monotype Imaging Holdings, Inc. (a) |
|
| 5,900 |
| $ | 53,277 |
|
|
| NCI, Inc., Class A (a) |
|
| 1,200 |
|
| 33,180 |
|
|
| NIC, Inc. |
|
| 13,100 |
|
| 119,734 |
|
|
| Ness Technologies, Inc. (a) |
|
| 9,700 |
|
| 47,530 |
|
|
| NetScout Systems, Inc. (a) |
|
| 5,800 |
|
| 84,912 |
|
|
| NetSuite, Inc. (a) |
|
| 4,000 |
|
| 63,920 |
|
|
| OpenTable, Inc. (a) |
|
| 700 |
|
| 17,822 |
|
|
| Openwave Systems, Inc. (a) |
|
| 22,100 |
|
| 50,388 |
|
|
| Opnet Technologies, Inc. |
|
| 3,022 |
|
| 36,838 |
|
|
| PAR Technology Corp. (a) |
|
| 2,000 |
|
| 11,560 |
|
|
| PROS Holdings, Inc. (a) |
|
| 4,500 |
|
| 46,575 |
|
|
| Parametric Technology Corp. (a) |
|
| 28,160 |
|
| 460,134 |
|
|
| Pegasystems, Inc. |
|
| 3,400 |
|
| 115,600 |
|
|
| Perficient, Inc. (a) |
|
| 7,200 |
|
| 60,696 |
|
|
| Pervasive Software Inc. (a) |
|
| 3,500 |
|
| 16,870 |
|
|
| Phoenix Technologies Ltd. (a) |
|
| 7,300 |
|
| 20,075 |
|
|
| Progress Software Corp. (a) |
|
| 10,008 |
|
| 292,334 |
|
|
| QAD, Inc. |
|
| 2,900 |
|
| 17,719 |
|
|
| Quest Software, Inc. (a) |
|
| 14,300 |
|
| 263,120 |
|
|
| Rackspace Hosting, Inc. (a) |
|
| 16,200 |
|
| 337,770 |
|
|
| Radiant Systems, Inc. (a) |
|
| 6,900 |
|
| 71,760 |
|
|
| RealNetworks, Inc. (a) |
|
| 21,100 |
|
| 78,281 |
|
|
| RightNow Technologies, Inc. (a) |
|
| 5,200 |
|
| 90,324 |
|
|
| SAVVIS, Inc. (a) |
|
| 9,180 |
|
| 128,979 |
|
|
| SRA International, Inc., Class A (a) |
|
| 10,400 |
|
| 198,640 |
|
|
| SYNNEX Corp. (a) |
|
| 4,200 |
|
| 128,772 |
|
|
| Saba Software, Inc. (a) |
|
| 5,600 |
|
| 23,184 |
|
|
| Sapient Corp. (a) |
|
| 21,492 |
|
| 177,739 |
|
|
| Smith Micro Software, Inc. (a) |
|
| 6,700 |
|
| 61,238 |
|
|
| SolarWinds, Inc. (a) |
|
| 2,900 |
|
| 66,729 |
|
|
| Solera Holdings, Inc. |
|
| 16,900 |
|
| 608,569 |
|
|
| SonicWALL, Inc. (a) |
|
| 13,441 |
|
| 102,286 |
|
|
| Sourcefire, Inc. (a) |
|
| 5,585 |
|
| 149,399 |
|
|
| Stanley, Inc. (a) |
|
| 3,000 |
|
| 82,230 |
|
|
| SuccessFactors, Inc. (a) |
|
| 10,700 |
|
| 177,406 |
|
|
| Support.com, Inc. (a) |
|
| 11,600 |
|
| 30,624 |
|
|
| Synchronoss Technologies, Inc. (a) |
|
| 5,000 |
|
| 79,050 |
|
|
| Syntel, Inc. |
|
| 3,183 |
|
| 121,049 |
|
|
| TIBCO Software, Inc. (a) |
|
| 40,700 |
|
| 391,941 |
|
|
| TNS, Inc. (a) |
|
| 6,100 |
|
| 156,709 |
|
|
| Taleo Corp., Class A (a) |
|
| 9,000 |
|
| 211,680 |
|
|
| TechTarget, Inc. (a) |
|
| 2,900 |
|
| 16,327 |
|
|
| TeleCommunication Systems, Inc., Class A (a) |
|
| 9,400 |
|
| 90,992 |
|
|
| Terremark Worldwide, Inc. (a) |
|
| 13,460 |
|
| 92,066 |
|
|
| Tier Technologies, Inc., Class B (a) |
|
| 4,100 |
|
| 32,800 |
|
|
| Tyler Technologies, Inc. (a) |
|
| 7,500 |
|
| 149,325 |
|
|
| Ultimate Software Group, Inc. (a) |
|
| 6,100 |
|
| 179,157 |
|
|
| Unica Corp. (a) |
|
| 3,100 |
|
| 24,025 |
|
|
| Unisys Corp. (a) |
|
| 10,010 |
|
| 385,986 |
|
|
| United Online, Inc. |
|
| 20,628 |
|
| 148,315 |
|
15
|
|
Master Small Cap Index Series of Quantitative Master Series LLC |
|
Schedule of Investments December 31, 2009 | (Percentages shown are based on Net Assets) |
|
|
|
|
|
|
|
|
|
|
Industry |
| Common Stocks |
| Shares |
| Value |
| ||
|
| VASCO Data Security International, Inc. (a) |
|
| 6,700 |
| $ | 42,009 |
|
|
| VeriFone Holdings, Inc. (a) |
|
| 17,800 |
|
| 291,564 |
|
|
| Virtusa Corp. (a) |
|
| 3,000 |
|
| 27,180 |
|
|
| Web.Com Group, Inc. (a) |
|
| 7,000 |
|
| 45,710 |
|
|
| Websense, Inc. (a) |
|
| 11,102 |
|
| 193,841 |
|
|
| Zix Corp. (a) |
|
| 14,600 |
|
| 24,966 |
|
|
|
|
|
|
|
| |||
|
|
|
|
|
|
|
| 15,262,431 |
|
Computer Technology - 0.9% |
| Adaptec, Inc. (a) |
|
| 26,000 |
|
| 87,100 |
|
|
| Cray, Inc. (a) |
|
| 8,300 |
|
| 53,286 |
|
|
| Dynamics Research Corp. (a) |
|
| 2,000 |
|
| 21,220 |
|
|
| Imation Corp. |
|
| 6,100 |
|
| 53,192 |
|
|
| Immersion Corp. (a) |
|
| 7,000 |
|
| 31,990 |
|
|
| Insight Enterprises, Inc. (a) |
|
| 11,598 |
|
| 132,449 |
|
|
| Intermec, Inc. (a) |
|
| 15,509 |
|
| 199,446 |
|
|
| Isilon Systems, Inc. (a) |
|
| 6,100 |
|
| 41,846 |
|
|
| Netezza Corp. (a) |
|
| 12,100 |
|
| 117,370 |
|
|
| PC Connection, Inc. (a) |
|
| 2,100 |
|
| 14,175 |
|
|
| PC Mall, Inc. (a) |
|
| 2,800 |
|
| 14,616 |
|
|
| Palm, Inc. (a)(b) |
|
| 38,988 |
|
| 391,440 |
|
|
| Quantum Corp. (a) |
|
| 48,600 |
|
| 142,398 |
|
|
| Radisys Corp. (a) |
|
| 5,842 |
|
| 55,791 |
|
|
| Rimage Corp. (a) |
|
| 2,300 |
|
| 39,882 |
|
|
| STEC, Inc. (a)(b) |
|
| 5,400 |
|
| 88,236 |
|
|
| Safeguard Scientifics, Inc. (a) |
|
| 4,533 |
|
| 46,735 |
|
|
| Silicon Graphics International Corp. (a) |
|
| 7,400 |
|
| 51,874 |
|
|
| Stratasys, Inc. (a) |
|
| 5,100 |
|
| 88,128 |
|
|
| Super Micro Computer, Inc. (a) |
|
| 5,300 |
|
| 58,936 |
|
|
| Synaptics, Inc. (a)(b) |
|
| 7,900 |
|
| 242,135 |
|
|
|
|
|
|
|
| |||
|
|
|
|
|
|
|
| 1,972,245 |
|
Construction - 0.6% |
| EMCOR Group, Inc. (a) |
|
| 16,172 |
|
| 435,027 |
|
|
| Granite Construction, Inc. |
|
| 7,837 |
|
| 263,793 |
|
|
| Great Lakes Dredge & Dock Corp. |
|
| 9,200 |
|
| 59,616 |
|
|
| Insituform Technologies, Inc., Class A (a) |
|
| 9,738 |
|
| 221,247 |
|
|
| Orion Marine Group, Inc. (a) |
|
| 6,300 |
|
| 132,678 |
|
|
| Primoris Services Corp. |
|
| 1,800 |
|
| 14,346 |
|
|
| Sterling Construction Co., Inc. (a) |
|
| 3,600 |
|
| 69,048 |
|
|
| Tutor Perini Corp. (a) |
|
| 6,300 |
|
| 113,904 |
|
|
|
|
|
|
|
| |||
|
|
|
|
|
|
|
| 1,309,659 |
|
Consumer Electronics - 0.2% |
| Audiovox Corp., Class A (a) |
|
| 4,285 |
|
| 30,381 |
|
|
| Ipass, Inc. |
|
| 11,400 |
|
| 11,856 |
|
|
| TiVo, Inc. (a) |
|
| 25,494 |
|
| 259,529 |
|
|
| Universal Electronics, Inc. (a) |
|
| 2,986 |
|
| 69,335 |
|
|
|
|
|
|
|
| |||
|
|
|
|
|
|
|
| 371,101 |
|
Consumer Lending - 0.7% |
| Advance America, Cash Advance Centers, Inc. |
|
| 10,600 |
|
| 58,936 |
|
|
| Asset Acceptance Capital Corp. (a) |
|
| 3,700 |
|
| 25,086 |
|
|
| Cash America International, Inc. |
|
| 6,919 |
|
| 241,888 |
|
|
| Credit Acceptance Corp. (a)(b) |
|
| 1,562 |
|
| 65,760 |
|
|
| Dollar Financial Corp. (a) |
|
| 6,000 |
|
| 141,960 |
|
|
| Encore Capital Group, Inc. (a) |
|
| 3,300 |
|
| 57,420 |
|
|
| Ezcorp, Inc. (a) |
|
| 11,000 |
|
| 189,310 |
|
|
|
|
|
|
|
|
|
|
|
16
|
|
Master Small Cap Index Series of Quantitative Master Series LLC | |
Schedule of Investments December 31, 2009 | (Percentages shown are based on Net Assets) |
|
|
|
|
|
|
|
|
|
|
Industry |
| Common Stocks |
| Shares |
| Value |
| ||
|
| First Cash Financial Services, Inc. (a) |
|
| 5,000 |
| $ | 110,950 |
|
|
| The First Marblehead Corp. (a) |
|
| 15,500 |
|
| 33,015 |
|
|
| MGIC Investment Corp. (a)(b) |
|
| 28,600 |
|
| 165,308 |
|
|
| MoneyGram International, Inc. (a) |
|
| 19,400 |
|
| 55,872 |
|
|
| Nelnet, Inc., Class A |
|
| 4,700 |
|
| 80,981 |
|
|
| Portfolio Recovery Associates, Inc. (a)(b) |
|
| 3,900 |
|
| 175,032 |
|
|
| QC Holdings, Inc. |
|
| 1,400 |
|
| 6,734 |
|
|
| Tree.com, Inc. (a) |
|
| 1,400 |
|
| 12,810 |
|
|
| World Acceptance Corp. (a)(b) |
|
| 3,700 |
|
| 132,571 |
|
|
|
|
|
|
|
| |||
|
|
|
|
|
|
|
| 1,553,633 |
|
Consumer Services: Miscellaneous - 0.7% |
| Ancestry.com, Inc. (a) |
|
| 1,200 |
|
| 16,812 |
|
|
| Coinstar, Inc. (a) |
|
| 6,892 |
|
| 191,460 |
|
|
| Core-Mark Holdings Co., Inc. (a) |
|
| 2,300 |
|
| 75,808 |
|
|
| Jackson Hewitt Tax Service, Inc. |
|
| 5,500 |
|
| 24,200 |
|
|
| The Knot, Inc. (a) |
|
| 7,400 |
|
| 74,518 |
|
|
| Mercadolibre, Inc. (a) |
|
| 6,300 |
|
| 326,781 |
|
|
| Move, Inc. (a) |
|
| 40,000 |
|
| 66,400 |
|
|
| Nutrisystem, Inc. (b) |
|
| 7,100 |
|
| 221,307 |
|
|
| Pre-Paid Legal Services, Inc. (a) |
|
| 1,760 |
|
| 72,301 |
|
|
| Sotheby’s Holdings, Inc., Class A (b) |
|
| 16,236 |
|
| 364,985 |
|
|
| Steiner Leisure Ltd. (a) |
|
| 3,700 |
|
| 147,112 |
|
|
|
|
|
|
|
| |||
|
|
|
|
|
|
|
| 1,581,684 |
|
Containers & Packaging - 0.5% |
| AEP Industries, Inc. (a) |
|
| 1,300 |
|
| 49,764 |
|
|
| Bway Holding Co. (a) |
|
| 1,900 |
|
| 36,518 |
|
|
| Graphic Packaging Holding Co. (a) |
|
| 26,300 |
|
| 91,261 |
|
|
| Myers Industries, Inc. |
|
| 7,852 |
|
| 71,453 |
|
|
| Rock-Tenn Co., Class A |
|
| 9,180 |
|
| 462,764 |
|
|
| Silgan Holdings, Inc. |
|
| 6,200 |
|
| 358,856 |
|
|
|
|
|
|
|
| |||
|
|
|
|
|
|
|
| 1,070,616 |
|
Cosmetics - 0.2% |
| Bare Escentuals, Inc. (a) |
|
| 16,500 |
|
| 201,795 |
|
|
| Elizabeth Arden, Inc. (a) |
|
| 6,093 |
|
| 87,983 |
|
|
| Inter Parfums, Inc. |
|
| 3,550 |
|
| 43,203 |
|
|
| Revlon, Inc., Class A (a) |
|
| 4,500 |
|
| 76,545 |
|
|
|
|
|
|
|
| |||
|
|
|
|
|
|
|
| 409,526 |
|
Diversified Financial Services - 0.5% |
| American Physicians Service Group, Inc. |
|
| 1,500 |
|
| 34,605 |
|
|
| Broadpoint Gleacher Securities, Inc. (a) |
|
| 11,800 |
|
| 52,628 |
|
|
| Cheviot Financial Corp. |
|
| 500 |
|
| 3,695 |
|
|
| Duff & Phelps Corp. |
|
| 4,200 |
|
| 76,692 |
|
|
| Evercore Partners, Inc., Class A |
|
| 3,200 |
|
| 97,280 |
|
|
| FBR Capital Markets Corp. (a) |
|
| 3,600 |
|
| 22,248 |
|
|
| First California Financial Group (a) |
|
| 1,100 |
|
| 3,014 |
|
|
| Main Street Capital Corp. |
|
| 1,600 |
|
| 25,792 |
|
|
| Piper Jaffray Cos. (a) |
|
| 4,500 |
|
| 227,745 |
|
|
| Rewards Network, Inc. |
|
| 1,833 |
|
| 23,169 |
|
|
| Sanders Morris Harris Group, Inc. |
|
| 4,500 |
|
| 24,750 |
|
|
| Stifel Financial Corp. (a) |
|
| 7,149 |
|
| 423,507 |
|
|
| Thomas Weisel Partners Group, Inc. (a) |
|
| 5,000 |
|
| 18,900 |
|
|
| Triangle Capital Corp. |
|
| 2,100 |
|
| 25,389 |
|
|
|
|
|
|
|
| |||
|
|
|
|
|
|
|
| 1,059,414 |
|
17
|
|
Master Small Cap Index Series of Quantitative Master Series LLC | |
Schedule of Investments December 31, 2009 | (Percentages shown are based on Net Assets) |
|
|
|
|
|
|
|
|
|
|
Industry |
| Common Stocks |
| Shares |
| Value |
| ||
Diversified Manufacturing Operations - 0.2% |
| A.M. Castle & Co. |
|
| 4,100 |
| $ | 56,129 |
|
|
| Barnes Group, Inc. |
|
| 11,714 |
|
| 197,967 |
|
|
| Federal Signal Corp. |
|
| 12,159 |
|
| 73,197 |
|
|
| Raven Industries, Inc. |
|
| 4,000 |
|
| 127,080 |
|
|
| Standex International Corp. |
|
| 3,031 |
|
| 60,893 |
|
|
| Trimas Corp. (a) |
|
| 3,700 |
|
| 25,049 |
|
|
|
|
|
|
|
| |||
|
|
|
|
|
|
|
| 540,315 |
|
Diversified Materials & Processing - 0.8% |
| Belden, Inc. |
|
| 11,561 |
|
| 253,417 |
|
|
| Cabot Microelectronics Corp. (a) |
|
| 5,800 |
|
| 191,168 |
|
|
| Clarcor, Inc. |
|
| 12,610 |
|
| 409,068 |
|
|
| Encore Wire Corp. (b) |
|
| 4,450 |
|
| 93,761 |
|
|
| Fushi Copperweld, Inc. (a) |
|
| 3,800 |
|
| 38,456 |
|
|
| Harbinger Group, Inc. (a) |
|
| 2,100 |
|
| 14,742 |
|
|
| Hexcel Corp. (a) |
|
| 23,962 |
|
| 311,027 |
|
|
| Insteel Industries, Inc. |
|
| 4,400 |
|
| 57,200 |
|
|
| Koppers Holdings, Inc. |
|
| 5,000 |
|
| 152,200 |
|
|
| NL Industries, Inc. |
|
| 1,734 |
|
| 12,034 |
|
|
| Rogers Corp. (a) |
|
| 4,055 |
|
| 122,907 |
|
|
| Symyx Technologies, Inc. (a) |
|
| 8,479 |
|
| 46,635 |
|
|
| Tredegar Corp. |
|
| 7,245 |
|
| 114,616 |
|
|
| Uranium Energy Corp. (a) |
|
| 12,500 |
|
| 47,250 |
|
|
|
|
|
|
|
| |||
|
|
|
|
|
|
|
| 1,864,481 |
|
Diversified Media - 0.1% |
| Belo Corp., Class A |
|
| 22,100 |
|
| 120,224 |
|
|
| EW Scripps Co. (a) |
|
| 6,200 |
|
| 43,152 |
|
|
| Playboy Enterprises, Inc., Class B (a) |
|
| 5,507 |
|
| 17,622 |
|
|
|
|
|
|
|
| |||
|
|
|
|
|
|
|
| 180,998 |
|
Diversified Retail - 0.6% |
| 99 Cents Only Stores (a) |
|
| 11,500 |
|
| 150,305 |
|
|
| Dillard’s, Inc., Class A |
|
| 11,800 |
|
| 217,710 |
|
|
| Fred’s, Inc. |
|
| 8,535 |
|
| 87,057 |
|
|
| GSI Commerce, Inc. (a) |
|
| 6,900 |
|
| 175,191 |
|
|
| Gaiam, Inc. (a) |
|
| 4,467 |
|
| 34,351 |
|
|
| HSN, Inc. (a) |
|
| 9,800 |
|
| 197,862 |
|
|
| Lumber Liquidators, Inc. (a) |
|
| 3,200 |
|
| 85,760 |
|
|
| Overstock.com, Inc. (a) |
|
| 3,900 |
|
| 52,884 |
|
|
| PriceSmart, Inc. |
|
| 4,200 |
|
| 85,848 |
|
|
| Saks, Inc. (a)(b) |
|
| 29,600 |
|
| 194,176 |
|
|
| Tuesday Morning Corp. (a) |
|
| 7,490 |
|
| 19,324 |
|
|
|
|
|
|
|
| |||
|
|
|
|
|
|
|
| 1,300,468 |
|
Drug & Grocery Store Chains - 0.7% |
| Arden Group, Inc., Class A |
|
| 232 |
|
| 22,184 |
|
|
| Casey’s General Stores, Inc. |
|
| 12,107 |
|
| 386,455 |
|
|
| drugstore.com, Inc. (a) |
|
| 21,500 |
|
| 66,435 |
|
|
| The Great Atlantic & Pacific Tea Co., Inc. (a) |
|
| 8,427 |
|
| 99,354 |
|
|
| Ingles Markets, Inc., Class A |
|
| 3,164 |
|
| 47,871 |
|
|
| Nash Finch Co. |
|
| 3,277 |
|
| 121,544 |
|
|
| The Pantry, Inc. (a) |
|
| 4,600 |
|
| 62,514 |
|
|
| PetMed Express, Inc. (b) |
|
| 5,500 |
|
| 96,965 |
|
|
| Ruddick Corp. |
|
| 9,869 |
|
| 253,929 |
|
|
| Spartan Stores, Inc. |
|
| 5,500 |
|
| 78,595 |
|
|
| Susser Holdings Corp. (a) |
|
| 1,900 |
|
| 16,321 |
|
|
| Village Super Market, Inc., Class A |
|
| 1,600 |
|
| 43,712 |
|
18
|
|
Master Small Cap Index Series of Quantitative Master Series LLC | |
Schedule of Investments December 31, 2009 | (Percentages shown are based on Net Assets) |
|
|
|
|
|
|
|
|
|
|
Industry |
| Common Stocks |
| Shares |
| Value |
| ||
|
| Weis Markets, Inc. |
|
| 2,700 |
| $ | 98,172 |
|
|
| Winn-Dixie Stores, Inc. (a) |
|
| 13,800 |
|
| 138,552 |
|
|
|
|
|
|
|
| |||
|
|
|
|
|
|
|
| 1,532,603 |
|
Education Services - 0.6% |
| Ambassadors Group, Inc. |
|
| 4,700 |
|
| 62,463 |
|
|
| American Public Education, Inc. (a) |
|
| 4,000 |
|
| 137,440 |
|
|
| Archipelago Learning, Inc. (a) |
|
| 1,300 |
|
| 26,910 |
|
|
| Bridgepoint Education, Inc. (a) |
|
| 3,600 |
|
| 54,072 |
|
|
| Capella Education Co. (a) |
|
| 3,300 |
|
| 248,490 |
|
|
| Chinacast Education Corp. (a) |
|
| 7,800 |
|
| 58,968 |
|
|
| Corinthian Colleges, Inc. (a)(b) |
|
| 18,400 |
|
| 253,368 |
|
|
| Franklin Covey Co. (a) |
|
| 3,700 |
|
| 23,310 |
|
|
| Grand Canyon Education, Inc. (a) |
|
| 3,800 |
|
| 72,238 |
|
|
| K12, Inc. (a) |
|
| 5,300 |
|
| 107,431 |
|
|
| Learning Tree International, Inc. (a) |
|
| 2,100 |
|
| 25,074 |
|
|
| Lincoln Educational Services Corp. (a) |
|
| 1,800 |
|
| 39,006 |
|
|
| Nobel Learning Communities, Inc. (a) |
|
| 1,400 |
|
| 10,626 |
|
|
| The Princeton Review, Inc. (a) |
|
| 3,600 |
|
| 14,616 |
|
|
| Renaissance Learning, Inc. |
|
| 1,249 |
|
| 14,189 |
|
|
| Rosetta Stone, Inc. (a) |
|
| 1,700 |
|
| 30,515 |
|
|
| School Specialty, Inc. (a) |
|
| 4,654 |
|
| 108,857 |
|
|
| Universal Technical Institute, Inc. (a) |
|
| 5,300 |
|
| 107,060 |
|
|
|
|
|
|
|
| |||
|
|
|
|
|
|
|
| 1,394,633 |
|
Electronic Components - 0.5% |
| 3D Systems Corp. (a) |
|
| 4,400 |
|
| 49,720 |
|
|
| Acacia Research - Acacia Technologies (a) |
|
| 7,700 |
|
| 70,147 |
|
|
| Checkpoint Systems, Inc. (a) |
|
| 9,823 |
|
| 149,801 |
|
|
| Cogent, Inc. (a) |
|
| 9,000 |
|
| 93,510 |
|
|
| DDi Corp. (a) |
|
| 4,300 |
|
| 21,027 |
|
|
| Methode Electronics, Inc. |
|
| 9,480 |
|
| 82,286 |
|
|
| Microvision, Inc. (a)(b) |
|
| 18,900 |
|
| 59,913 |
|
|
| Multi-Fineline Electronix, Inc. (a) |
|
| 2,400 |
|
| 68,088 |
|
|
| NVE Corp. (a) |
|
| 1,000 |
|
| 41,310 |
|
|
| Park Electrochemical Corp. |
|
| 5,149 |
|
| 142,318 |
|
|
| ScanSource, Inc. (a) |
|
| 6,500 |
|
| 173,550 |
|
|
| Smart Modular Technologies WWH, Inc. (a) |
|
| 9,200 |
|
| 57,868 |
|
|
| TTM Technologies, Inc. (a) |
|
| 10,800 |
|
| 124,524 |
|
|
| Technitrol, Inc. |
|
| 10,361 |
|
| 45,381 |
|
|
| Universal Display Corp. (a)(b) |
|
| 7,107 |
|
| 87,843 |
|
|
|
|
|
|
|
| |||
|
|
|
|
|
|
|
| 1,267,286 |
|
Electronic Entertainment - 0.2% |
| DTS, Inc. (a) |
|
| 3,800 |
|
| 129,998 |
|
|
| Memsic, Inc. (a) |
|
| 4,800 |
|
| 15,744 |
|
|
| THQ, Inc. (a)(b) |
|
| 15,537 |
|
| 78,306 |
|
|
| Take-Two Interactive Software, Inc. (a)(b) |
|
| 18,000 |
|
| 180,900 |
|
|
|
|
|
|
|
| |||
|
|
|
|
|
|
|
| 404,948 |
|
Electronics - 0.5% |
| Agilysys, Inc. |
|
| 3,163 |
|
| 28,783 |
|
|
| American Science & Engineering, Inc. |
|
| 2,000 |
|
| 151,680 |
|
|
| CPI International, Inc. (a) |
|
| 1,800 |
|
| 23,832 |
|
|
| Coherent, Inc. (a) |
|
| 5,300 |
|
| 157,569 |
|
|
| Daktronics, Inc. (b) |
|
| 8,398 |
|
| 77,346 |
|
|
| II-VI, Inc. (a) |
|
| 6,220 |
|
| 197,796 |
|
|
| IPG Photonics Corp. (a) |
|
| 5,600 |
|
| 93,744 |
|
19
|
|
Master Small Cap Index Series of Quantitative Master Series LLC | |
Schedule of Investments December 31, 2009 | (Percentages shown are based on Net Assets) |
|
|
|
|
|
|
|
|
|
|
Industry |
| Common Stocks |
| Shares |
| Value |
| ||
|
| iRobot Corp. (a) |
|
| 4,700 |
| $ | 82,720 |
|
|
| Newport Corp. (a) |
|
| 9,035 |
|
| 83,032 |
|
|
| Rofin-Sinar Technologies, Inc. (a) |
|
| 7,300 |
|
| 172,353 |
|
|
| SRS Labs Inc. (a) |
|
| 2,600 |
|
| 19,058 |
|
|
| Spectrum Control, Inc. (a) |
|
| 2,900 |
|
| 27,463 |
|
|
|
|
|
|
|
| |||
|
|
|
|
|
|
|
| 1,115,376 |
|
Energy Equipment - 0.2% |
| Ascent Solar Technologies, Inc. (a) |
|
| 3,600 |
|
| 19,080 |
|
|
| Energy Conversion Devices, Inc. (a)(b) |
|
| 10,564 |
|
| 111,661 |
|
|
| Evergreen Solar, Inc. (a)(b) |
|
| 48,300 |
|
| 72,933 |
|
|
| FuelCell Energy, Inc. (a) |
|
| 16,926 |
|
| 63,642 |
|
|
| GT Solar International, Inc. (a)(b) |
|
| 7,400 |
|
| 41,144 |
|
|
| PowerSecure International, Inc. (a) |
|
| 4,300 |
|
| 31,003 |
|
|
| Raser Technologies, Inc. (a)(b) |
|
| 12,700 |
|
| 15,748 |
|
|
| STR Holdings, Inc. (a) |
|
| 2,300 |
|
| 36,133 |
|
|
|
|
|
|
|
| |||
|
|
|
|
|
|
|
| 391,344 |
|
Engineering & Contracting Services - 0.5% |
| Argan, Inc. (a) |
|
| 2,100 |
|
| 30,219 |
|
|
| Dycom Industries, Inc. (a) |
|
| 9,902 |
|
| 79,513 |
|
|
| ENGlobal Corp. (a) |
|
| 4,100 |
|
| 12,833 |
|
|
| Exponent, Inc. (a) |
|
| 3,404 |
|
| 94,767 |
|
|
| Furmamite Corp. (a) |
|
| 9,000 |
|
| 34,290 |
|
|
| Hill International, Inc. (a) |
|
| 6,200 |
|
| 38,688 |
|
|
| Integrated Electrical Services, Inc. (a) |
|
| 1,800 |
|
| 10,530 |
|
|
| Layne Christensen Co. (a) |
|
| 4,900 |
|
| 140,679 |
|
|
| MYR Group, Inc. (a) |
|
| 3,700 |
|
| 66,896 |
|
|
| Michael Baker Corp. (a) |
|
| 1,900 |
|
| 78,660 |
|
|
| Mistras Group, Inc. (a) |
|
| 1,800 |
|
| 27,108 |
|
|
| Tetra Tech, Inc. (a) |
|
| 14,331 |
|
| 389,373 |
|
|
| VSE Corp. |
|
| 1,000 |
|
| 45,080 |
|
|
|
|
|
|
|
| |||
|
|
|
|
|
|
|
| 1,048,636 |
|
Entertainment - 0.3% |
| Ascent Media Corp., Class A (a) |
|
| 3,500 |
|
| 89,355 |
|
|
| CKX, Inc. (a) |
|
| 14,900 |
|
| 78,523 |
|
|
| Carmike Cinemas, Inc. (a) |
|
| 2,500 |
|
| 18,900 |
|
|
| Cinemark Holdings, Inc. |
|
| 8,400 |
|
| 120,708 |
|
|
| Live Nation, Inc. (a) |
|
| 20,600 |
|
| 175,306 |
|
|
| LodgeNet Interactive Corp. (a) |
|
| 4,700 |
|
| 25,991 |
|
|
| Reading International, Inc., Class A (a) |
|
| 5,000 |
|
| 20,250 |
|
|
| Rentrak Corp. (a) |
|
| 2,200 |
|
| 38,874 |
|
|
| World Wrestling Entertainment, Inc. |
|
| 4,496 |
|
| 68,924 |
|
|
|
|
|
|
|
| |||
|
|
|
|
|
|
|
| 636,831 |
|
Financial Data & Systems - 1.1% |
| Advent Software, Inc. (a) |
|
| 4,000 |
|
| 162,920 |
|
|
| Cardtronics, Inc. (a) |
|
| 3,200 |
|
| 35,424 |
|
|
| Cass Information Systems, Inc. |
|
| 2,115 |
|
| 64,296 |
|
|
| CompuCredit Holdings Corp. (b) |
|
| 4,089 |
|
| 13,616 |
|
|
| CyberSource Corp. (a) |
|
| 16,764 |
|
| 337,124 |
|
|
| Euronet Worldwide, Inc. (a)(b) |
|
| 12,050 |
|
| 264,497 |
|
|
| Fair Isaac Corp. |
|
| 11,200 |
|
| 238,672 |
|
|
| Global Cash Access, Inc. (a) |
|
| 9,900 |
|
| 74,151 |
|
|
| Heartland Payment Systems, Inc. |
|
| 9,700 |
|
| 127,361 |
|
|
| Information Services Group, Inc. (a) |
|
| 5,500 |
|
| 17,435 |
|
|
| Jack Henry & Associates, Inc. |
|
| 20,100 |
|
| 464,712 |
|
20
|
|
Master Small Cap Index Series of Quantitative Master Series LLC | |
Schedule of Investments December 31, 2009 | (Percentages shown are based on Net Assets) |
|
|
|
|
|
|
|
|
|
|
Industry |
| Common Stocks |
| Shares |
| Value |
| ||
|
| Net 1 UEPS Technologies, Inc. (a) |
|
| 7,600 |
| $ | 147,592 |
|
|
| Online Resources Corp. (a) |
|
| 6,400 |
|
| 33,664 |
|
|
| RiskMetrics Group, Inc. (a) |
|
| 5,300 |
|
| 84,323 |
|
|
| S1 Corp. (a) |
|
| 13,222 |
|
| 86,207 |
|
|
| Value Line, Inc. |
|
| 100 |
|
| 2,511 |
|
|
| Wright Express Corp. (a) |
|
| 9,500 |
|
| 302,670 |
|
|
|
|
|
|
|
| |||
|
|
|
|
|
|
|
| 2,457,175 |
|
Foods - 1.2% |
| American Dairy, Inc. (a)(b) |
|
| 2,100 |
|
| 45,528 |
|
|
| American Italian Pasta Co., Class A (a) |
|
| 4,700 |
|
| 163,513 |
|
|
| B&G Foods, Inc., Class A |
|
| 6,100 |
|
| 55,998 |
|
|
| China Biotics, Inc. (a) |
|
| 1,800 |
|
| 27,846 |
|
|
| Chiquita Brands International, Inc. (a) |
|
| 11,100 |
|
| 200,244 |
|
|
| Diamond Foods, Inc. |
|
| 4,000 |
|
| 142,160 |
|
|
| Dole Food Co., Inc. (a) |
|
| 7,600 |
|
| 94,316 |
|
|
| Hain Celestial Group, Inc. (a) |
|
| 9,057 |
|
| 154,060 |
|
|
| J&J Snack Foods Corp. |
|
| 3,500 |
|
| 139,860 |
|
|
| Lancaster Colony Corp. |
|
| 4,499 |
|
| 223,600 |
|
|
| Lance, Inc. |
|
| 7,100 |
|
| 186,730 |
|
|
| Lifeway Foods, Inc. (a) |
|
| 1,000 |
|
| 11,880 |
|
|
| Medifast, Inc. (a) |
|
| 2,900 |
|
| 88,682 |
|
|
| Nutraceutical International Corp. (a) |
|
| 2,500 |
|
| 30,925 |
|
|
| Omega Protein Corp. (a) |
|
| 4,700 |
|
| 20,492 |
|
|
| Overhill Farms, Inc. (a) |
|
| 4,500 |
|
| 21,870 |
|
|
| Schiff Nutrition International, Inc. |
|
| 1,500 |
|
| 11,730 |
|
|
| Seneca Foods Corp. (a) |
|
| 2,000 |
|
| 47,740 |
|
|
| Smart Balance, Inc. (a) |
|
| 15,700 |
|
| 94,200 |
|
|
| Synutra International, Inc. (a)(b) |
|
| 4,800 |
|
| 64,848 |
|
|
| Tootsie Roll Industries, Inc. (b) |
|
| 6,157 |
|
| 168,579 |
|
|
| TreeHouse Foods, Inc. (a) |
|
| 7,300 |
|
| 283,678 |
|
|
| United Natural Foods, Inc. (a) |
|
| 10,680 |
|
| 285,583 |
|
|
| Zhongpin, Inc. (a) |
|
| 5,300 |
|
| 82,733 |
|
|
|
|
|
|
|
| |||
|
|
|
|
|
|
|
| 2,646,795 |
|
Forest Products - 0.1% |
| Deltic Timber Corp. |
|
| 2,709 |
|
| 125,102 |
|
|
| Universal Forest Products, Inc. |
|
| 4,634 |
|
| 170,578 |
|
|
|
|
|
|
|
| |||
|
|
|
|
|
|
|
| 295,680 |
|
Forms & Bulk Printing Services - 0.3% |
| Bowne & Co., Inc. |
|
| 8,503 |
|
| 56,800 |
|
|
| Consolidated Graphics, Inc. (a) |
|
| 2,400 |
|
| 84,048 |
|
|
| Deluxe Corp. |
|
| 12,800 |
|
| 189,312 |
|
|
| Ennis, Inc. |
|
| 6,400 |
|
| 107,456 |
|
|
| Innerworkings, Inc. (a) |
|
| 5,700 |
|
| 33,630 |
|
|
| M&F Worldwide Corp. (a) |
|
| 2,800 |
|
| 110,600 |
|
|
| Multi-Color Corp. |
|
| 2,450 |
|
| 29,915 |
|
|
| Schawk, Inc. |
|
| 3,800 |
|
| 51,680 |
|
|
| The Standard Register Co. |
|
| 4,145 |
|
| 21,140 |
|
|
|
|
|
|
|
| |||
|
|
|
|
|
|
|
| 684,581 |
|
Funeral Parlors & Cemeteries - 0.2% |
| Matthews International Corp., Class A |
|
| 7,373 |
|
| 261,225 |
|
|
| Stewart Enterprises, Inc., Class A |
|
| 20,524 |
|
| 105,699 |
|
|
|
|
|
|
|
| |||
|
|
|
|
|
|
|
| 366,924 |
|
Gas Pipeline - 0.0% |
| Crosstex Energy, Inc. |
|
| 9,200 |
|
| 55,660 |
|
Glass - 0.0% |
| Apogee Enterprises, Inc. (b) |
|
| 7,100 |
|
| 99,400 |
|
21
|
|
Master Small Cap Index Series of Quantitative Master Series LLC | |
Schedule of Investments December 31, 2009 | (Percentages shown are based on Net Assets) |
|
|
|
|
|
|
|
|
|
|
Industry |
| Common Stocks |
| Shares |
| Value |
| ||
Gold - 0.2% |
| Allied Nevada Gold Corp. (a)(b) |
|
| 12,700 |
| $ | 191,516 |
|
|
| Coeur d’Alene Mines Corp. (a) |
|
| 17,570 |
|
| 317,314 |
|
|
| US Gold Corp. (a) |
|
| 21,200 |
|
| 52,576 |
|
|
|
|
|
|
|
| |||
|
|
|
|
|
|
|
| 561,406 |
|
Health Care Facilities - 0.6% |
| Amsurg Corp. (a) |
|
| 7,700 |
|
| 169,554 |
|
|
| Assisted Living Concepts, Inc. (a) |
|
| 2,440 |
|
| 64,343 |
|
|
| Capital Senior Living Corp. (a) |
|
| 5,300 |
|
| 26,606 |
|
|
| Emeritus Corp. (a) |
|
| 5,000 |
|
| 93,750 |
|
|
| The Ensign Group, Inc. |
|
| 2,531 |
|
| 38,901 |
|
|
| Hanger Orthopedic Group, Inc. (a) |
|
| 6,100 |
|
| 84,363 |
|
|
| Kindred Healthcare, Inc. (a) |
|
| 8,790 |
|
| 162,263 |
|
|
| LCA-Vision, Inc. (a) |
|
| 4,900 |
|
| 25,088 |
|
|
| MedCath Corp. (a) |
|
| 3,700 |
|
| 29,267 |
|
|
| National Healthcare Corp. |
|
| 1,900 |
|
| 68,609 |
|
|
| Psychiatric Solutions, Inc. (a) |
|
| 13,000 |
|
| 274,820 |
|
|
| Select Medical Holdings Corp. (a) |
|
| 7,100 |
|
| 75,402 |
|
|
| Skilled Healthcare Group, Inc., Class A (a) |
|
| 3,600 |
|
| 26,820 |
|
|
| Sun Healthcare Group, Inc. (a) |
|
| 10,900 |
|
| 99,953 |
|
|
| Sunrise Senior Living, Inc. (a) |
|
| 11,174 |
|
| 35,980 |
|
|
| US Physical Therapy, Inc. (a) |
|
| 3,000 |
|
| 50,790 |
|
|
|
|
|
|
|
| |||
|
|
|
|
|
|
|
| 1,326,509 |
|
Health Care Management Services - 1.0% |
| AMERIGROUP Corp. (a) |
|
| 12,200 |
|
| 328,912 |
|
|
| American Caresource Holdings, Inc. (a) |
|
| 2,500 |
|
| 6,000 |
|
|
| American Dental Partners, Inc. (a) |
|
| 3,200 |
|
| 41,280 |
|
|
| Bioscript, Inc. (a) |
|
| 10,200 |
|
| 85,272 |
|
|
| Catalyst Health Solutions, Inc. (a) |
|
| 8,900 |
|
| 324,583 |
|
|
| Centene Corp. (a) |
|
| 9,800 |
|
| 207,466 |
|
|
| Computer Programs & Systems, Inc. |
|
| 2,100 |
|
| 96,705 |
|
|
| Contiucare Corp. (a) |
|
| 6,500 |
|
| 28,405 |
|
|
| HealthSpring, Inc. (a) |
|
| 12,200 |
|
| 214,842 |
|
|
| Magellan Health Services, Inc. (a) |
|
| 8,400 |
|
| 342,132 |
|
|
| MedQuist Inc. |
|
| 1,900 |
|
| 12,711 |
|
|
| Metropolitan Health Networks, Inc. (a) |
|
| 11,600 |
|
| 23,084 |
|
|
| Molina Healthcare, Inc. (a) |
|
| 3,200 |
|
| 73,184 |
|
|
| National Research Corp. |
|
| 300 |
|
| 6,210 |
|
|
| Transcend Services, Inc. (a) |
|
| 1,500 |
|
| 32,040 |
|
|
| Triple-S Management Corp. (a) |
|
| 5,300 |
|
| 93,280 |
|
|
| Universal American Financial Corp. (a) |
|
| 6,400 |
|
| 74,880 |
|
|
| WellCare Health Plans, Inc. (a) |
|
| 10,300 |
|
| 378,628 |
|
|
|
|
|
|
|
| |||
|
|
|
|
|
|
|
| 2,369,614 |
|
Health Care Services - 2.0% |
| AMN Healthcare Services, Inc. (a) |
|
| 8,405 |
|
| 76,149 |
|
|
| Air Methods Corp. (a) |
|
| 2,400 |
|
| 80,688 |
|
|
| Alliance Healthcare Services, Inc. (a) |
|
| 5,800 |
|
| 33,118 |
|
|
| Allied Healthcare International, Inc. (a) |
|
| 12,700 |
|
| 36,957 |
|
|
| Almost Family, Inc. (a) |
|
| 1,700 |
|
| 67,201 |
|
|
| Amedisys, Inc. (a)(b) |
|
| 6,366 |
|
| 309,133 |
|
|
| athenahealth, Inc. (a) |
|
| 8,200 |
|
| 370,968 |
|
|
| CardioNet, Inc. (a) |
|
| 4,500 |
|
| 26,730 |
|
|
| Chemed Corp. |
|
| 5,472 |
|
| 262,492 |
|
|
| Chindex International, Inc. (a) |
|
| 3,300 |
|
| 46,629 |
|
22
|
|
Master Small Cap Index Series of Quantitative Master Series LLC | |
Schedule of Investments December 31, 2009 | (Percentages shown are based on Net Assets) |
|
|
|
|
|
|
|
|
|
|
Industry |
| Common Stocks |
| Shares |
| Value |
| ||
|
| Corvel Corp. (a) |
|
| 1,885 |
| $ | 63,223 |
|
|
| Cross Country Healthcare, Inc. (a) |
|
| 7,700 |
|
| 76,307 |
|
|
| Eclipsys Corp. (a) |
|
| 14,031 |
|
| 259,854 |
|
|
| Emergency Medical Services Corp. (a) |
|
| 6,700 |
|
| 362,805 |
|
|
| Gentiva Health Services, Inc. (a) |
|
| 6,912 |
|
| 186,693 |
|
|
| HMS Holdings Corp. (a) |
|
| 5,900 |
|
| 287,271 |
|
|
| Health Grades, Inc. (a) |
|
| 5,500 |
|
| 23,595 |
|
|
| HealthSouth Corp. (a) |
|
| 22,000 |
|
| 412,940 |
|
|
| Healthways, Inc. (a) |
|
| 8,600 |
|
| 157,724 |
|
|
| IPC The Hospitalist Co., Inc. (a) |
|
| 4,000 |
|
| 133,000 |
|
|
| LHC Group, Inc. (a) |
|
| 3,400 |
|
| 114,274 |
|
|
| MWI Veterinary Supply, Inc. (a) |
|
| 2,800 |
|
| 105,560 |
|
|
| Medidata Solutions, Inc. (a) |
|
| 1,600 |
|
| 24,960 |
|
|
| NovaMed Eyecare, Inc. (a)(b) |
|
| 4,400 |
|
| 17,072 |
|
|
| Odyssey HealthCare, Inc. (a) |
|
| 8,200 |
|
| 127,756 |
|
|
| Omnicell, Inc. (a) |
|
| 7,900 |
|
| 92,351 |
|
|
| PharMerica Corp. (a) |
|
| 7,569 |
|
| 120,196 |
|
|
| Phase Forward, Inc. (a) |
|
| 10,900 |
|
| 167,315 |
|
|
| Quality Systems, Inc. |
|
| 5,500 |
|
| 345,345 |
|
|
| RehabCare Group, Inc. (a) |
|
| 5,595 |
|
| 170,256 |
|
|
| Res-Care, Inc. (a) |
|
| 6,400 |
|
| 71,680 |
|
|
| Virtual Radiologic Corp. (a) |
|
| 1,600 |
|
| 20,416 |
|
|
|
|
|
|
|
| |||
|
|
|
|
|
|
|
| 4,650,658 |
|
Health Care: Miscellaneous - 0.1% |
| MedAssets, Inc. (a) |
|
| 9,800 |
|
| 207,858 |
|
|
| The Providence Service Corp. (a) |
|
| 3,000 |
|
| 47,400 |
|
|
|
|
|
|
|
| |||
|
|
|
|
|
|
|
| 255,258 |
|
Home Building - 0.3% |
| Beazer Homes USA, Inc. (a)(b) |
|
| 8,300 |
|
| 40,172 |
|
|
| Brookfield Homes Corp. (a)(b) |
|
| 2,451 |
|
| 19,608 |
|
|
| Hovnanian Enterprises, Inc., Class A (a)(b) |
|
| 11,600 |
|
| 44,544 |
|
|
| M/I Homes, Inc. (a) |
|
| 4,100 |
|
| 42,599 |
|
|
| Meritage Homes Corp. (a) |
|
| 7,800 |
|
| 150,774 |
|
|
| Ryland Group, Inc. |
|
| 9,800 |
|
| 193,060 |
|
|
| Standard-Pacific Corp. (a) |
|
| 25,200 |
|
| 94,248 |
|
|
|
|
|
|
|
| |||
|
|
|
|
|
|
|
| 585,005 |
|
Hotel/Motel - 0.2% |
| Gaylord Entertainment Co. (a)(b) |
|
| 9,155 |
|
| 180,811 |
|
|
| Marcus Corp. |
|
| 4,979 |
|
| 63,831 |
|
|
| Morgans Hotel Group Co. (a) |
|
| 5,800 |
|
| 26,274 |
|
|
| Orient Express Hotels Ltd., Class A (b) |
|
| 18,900 |
|
| 191,646 |
|
|
| Red Lion Hotels Corp. (a) |
|
| 4,000 |
|
| 19,760 |
|
|
|
|
|
|
|
| |||
|
|
|
|
|
|
|
| 482,322 |
|
Household Appliances - 0.0% |
| National Presto Industries, Inc. |
|
| 1,050 |
|
| 114,692 |
|
Household Equipment & Products - 0.6% |
| American Greetings Corp., Class A |
|
| 9,300 |
|
| 202,647 |
|
|
| Blyth, Inc. |
|
| 1,525 |
|
| 51,423 |
|
|
| CSS Industries, Inc. |
|
| 1,891 |
|
| 36,761 |
|
|
| Central Garden & Pet Co., Class A (a) |
|
| 15,534 |
|
| 154,408 |
|
|
| Helen of Troy Ltd. (a) |
|
| 7,300 |
|
| 178,558 |
|
|
| Nivs Intellimedia Technology (a) |
|
| 1,400 |
|
| 3,612 |
|
|
| Tupperware Corp. |
|
| 15,174 |
|
| 706,653 |
|
|
|
|
|
|
|
| |||
|
|
|
|
|
|
|
| 1,334,062 |
|
Household Furnishings - 0.4% |
| American Woodmark Corp. |
|
| 2,600 |
|
| 51,168 |
|
23
|
|
Master Small Cap Index Series of Quantitative Master Series LLC | |
Schedule of Investments December 31, 2009 | (Percentages shown are based on Net Assets) |
|
|
|
|
|
|
|
|
|
|
Industry |
| Common Stocks |
| Shares |
| Value |
| ||
|
| Ethan Allen Interiors, Inc. (b) |
|
| 5,200 |
| $ | 69,784 |
|
|
| Furniture Brands International, Inc. (a) |
|
| 10,400 |
|
| 56,784 |
|
|
| Hooker Furniture Corp. |
|
| 2,500 |
|
| 30,925 |
|
|
| Kirkland’s, Inc. (a) |
|
| 2,600 |
|
| 45,162 |
|
|
| La-Z-Boy, Inc. (b) |
|
| 12,900 |
|
| 122,937 |
|
|
| Sealy Corp. (a)(b) |
|
| 10,900 |
|
| 34,444 |
|
|
| Stanley Furniture Co., Inc. |
|
| 2,400 |
|
| 24,360 |
|
|
| Tempur-Pedic International, Inc. (a) |
|
| 17,900 |
|
| 422,977 |
|
|
|
|
|
|
|
| |||
|
|
|
|
|
|
|
| 858,541 |
|
Insurance: Life - 0.4% |
| American Equity Investment Life Holding Co. |
| 13,500 |
|
| 100,440 |
| |
|
| Citizens, Inc. (a) |
|
| 7,800 |
|
| 50,934 |
|
|
| Conseco, Inc. (a) |
|
| 46,900 |
|
| 234,500 |
|
|
| Delphi Financial Group, Inc., Class A |
|
| 10,905 |
|
| 243,945 |
|
|
| FBL Financial Group, Inc., Class A |
|
| 3,225 |
|
| 59,727 |
|
|
| Independence Holding Co. |
|
| 740 |
|
| 4,292 |
|
|
| Kansas City Life Insurance Co. |
|
| 1,042 |
|
| 30,999 |
|
|
| Life Partners Holdings, Inc. (b) |
|
| 1,400 |
|
| 29,666 |
|
|
| National Western Life Insurance Co., Class A |
| 556 |
|
| 96,533 |
| |
|
| The Phoenix Cos., Inc. (a) |
|
| 28,900 |
|
| 80,342 |
|
|
| Presidential Life Corp. |
|
| 5,193 |
|
| 47,516 |
|
|
|
|
|
|
|
| |||
|
|
|
|
|
|
|
| 978,894 |
|
Insurance: Multi-Line - 0.9% |
| AMBAC Financial Group, Inc. (a)(b) |
|
| 66,900 |
|
| 55,527 |
|
|
| Assured Guaranty Ltd. |
|
| 29,200 |
|
| 635,392 |
|
|
| Crawford & Co., Class B (a) |
|
| 5,909 |
|
| 23,281 |
|
|
| Eastern Insurance Holdings, Inc. |
|
| 2,200 |
|
| 18,964 |
|
|
| eHealth, Inc. (a) |
|
| 6,200 |
|
| 101,866 |
|
|
| Flagstone Reinsurance Holdings Ltd. |
|
| 10,300 |
|
| 112,682 |
|
|
| Horace Mann Educators Corp. |
|
| 9,968 |
|
| 124,600 |
|
|
| Maiden Holdings Ltd. |
|
| 12,200 |
|
| 89,304 |
|
|
| Max Capital Group Ltd. |
|
| 11,200 |
|
| 249,760 |
|
|
| Pico Holdings, Inc. (a) |
|
| 5,297 |
|
| 173,371 |
|
|
| Platinum Underwriters Holdings Ltd. |
|
| 11,900 |
|
| 455,651 |
|
|
| Primus Guaranty Ltd. (a) |
|
| 6,000 |
|
| 18,300 |
|
|
|
|
|
|
|
| |||
|
|
|
|
|
|
|
| 2,058,698 |
|
Insurance: Property-Casualty - 1.9% |
| American Physicians Capital, Inc. |
|
| 1,674 |
|
| 50,756 |
|
|
| American Safety Insurance Holdings Ltd. (a) |
|
| 2,100 |
|
| 30,345 |
|
|
| Amerisafe, Inc. (a) |
|
| 4,300 |
|
| 77,271 |
|
|
| AmTrust Financial Services, Inc. |
|
| 5,500 |
|
| 65,010 |
|
|
| Argo Group International Holdings Ltd. (a) |
|
| 7,479 |
|
| 217,938 |
|
|
| Baldwin & Lyons, Inc., Class B |
|
| 2,032 |
|
| 50,008 |
|
|
| CNA Surety Corp. (a) |
|
| 4,086 |
|
| 60,841 |
|
|
| Donegal Group, Inc., Class A |
|
| 2,744 |
|
| 42,642 |
|
|
| EMC Insurance Group, Inc. |
|
| 1,300 |
|
| 27,963 |
|
|
| Employers Holdings, Inc. |
|
| 11,380 |
|
| 174,569 |
|
|
| Enstar Group Ltd. (a) |
|
| 1,600 |
|
| 116,832 |
|
|
| FPIC Insurance Group, Inc. (a) |
|
| 1,400 |
|
| 54,068 |
|
|
| First Acceptance Corp. (a) |
|
| 3,877 |
|
| 7,560 |
|
|
| First Mercury Financial Corp. |
|
| 3,600 |
|
| 49,356 |
|
|
| Greenlight Capital Re Ltd. (a) |
|
| 7,000 |
|
| 164,990 |
|
|
| Hallmark Financial Services, Inc. (a) |
|
| 2,100 |
|
| 16,716 |
|
24
|
|
Master Small Cap Index Series of Quantitative Master Series LLC | |
Schedule of Investments December 31, 2009 | (Percentages shown are based on Net Assets) |
|
|
|
|
|
|
|
|
|
|
Industry |
| Common Stocks |
| Shares |
| Value |
| ||
|
| Harleysville Group, Inc. |
|
| 3,462 |
| $ | 110,057 |
|
|
| Hilltop Holdings, Inc. (a) |
|
| 9,572 |
|
| 111,418 |
|
|
| Infinity Property & Casualty Corp. |
|
| 3,400 |
|
| 138,176 |
|
|
| Meadowbrook Insurance Group, Inc. |
|
| 14,952 |
|
| 110,645 |
|
|
| Mercer Insurance Group, Inc. |
|
| 1,300 |
|
| 23,621 |
|
|
| Montpelier Re Holdings Ltd. |
|
| 21,000 |
|
| 363,720 |
|
|
| NYMAGIC, Inc. |
|
| 1,100 |
|
| 18,249 |
|
|
| National Interstate Corp. |
|
| 1,600 |
|
| 27,136 |
|
|
| Navigators Group, Inc. (a) |
|
| 3,100 |
|
| 146,041 |
|
|
| PMA Capital Corp., Class A (a) |
|
| 7,806 |
|
| 49,178 |
|
|
| The PMI Group, Inc. |
|
| 15,600 |
|
| 39,312 |
|
|
| ProAssurance Corp. (a) |
|
| 8,023 |
|
| 430,915 |
|
|
| RLI Corp. |
|
| 4,564 |
|
| 243,033 |
|
|
| Radian Group, Inc. |
|
| 18,500 |
|
| 135,235 |
|
|
| Safety Insurance Group, Inc. |
|
| 2,900 |
|
| 105,067 |
|
|
| SeaBright Insurance Holdings, Inc. (a) |
|
| 4,200 |
|
| 48,258 |
|
|
| Selective Insurance Group, Inc. |
|
| 13,208 |
|
| 217,272 |
|
|
| State Auto Financial Corp. |
|
| 3,512 |
|
| 64,972 |
|
|
| Stewart Information Services Corp. |
|
| 4,022 |
|
| 45,368 |
|
|
| Tower Group, Inc. |
|
| 10,786 |
|
| 252,500 |
|
|
| United America Indemnity, Ltd. (a) |
|
| 8,741 |
|
| 69,229 |
|
|
| United Fire & Casualty Co. |
|
| 5,500 |
|
| 100,265 |
|
|
| Universal Insurance Holdings, Inc. |
|
| 3,000 |
|
| 17,610 |
|
|
| Zenith National Insurance Corp. |
|
| 8,855 |
|
| 263,525 |
|
|
|
|
|
|
|
| |||
|
|
|
|
|
|
|
| 4,337,667 |
|
Leisure Time - 0.6% |
| Bluegreen Corp. (a) |
|
| 3,500 |
|
| 8,470 |
|
|
| Callaway Golf Co. |
|
| 14,100 |
|
| 106,314 |
|
|
| Churchill Downs, Inc. |
|
| 2,332 |
|
| 87,100 |
|
|
| Great Wolf Resorts, Inc. (a) |
|
| 6,700 |
|
| 15,879 |
|
|
| Interval Leisure Group, Inc. (a) |
|
| 9,700 |
|
| 120,959 |
|
|
| Life Time Fitness, Inc. (a)(b) |
|
| 10,000 |
|
| 249,300 |
|
|
| Orbitz Worldwide, Inc. (a) |
|
| 8,400 |
|
| 61,656 |
|
|
| Pool Corp. (b) |
|
| 11,600 |
|
| 221,328 |
|
|
| Smith & Wesson Holding Corp. (a) |
|
| 12,300 |
|
| 50,307 |
|
|
| Speedway Motorsports, Inc. |
|
| 3,255 |
|
| 57,353 |
|
|
| Sport Supply Group, Inc. |
|
| 2,100 |
|
| 26,439 |
|
|
| Steinway Musical Instruments, Inc. (a) |
|
| 1,700 |
|
| 27,047 |
|
|
| Sturm Ruger & Co., Inc. (b) |
|
| 3,600 |
|
| 34,920 |
|
|
| Town Sports International Holdings, Inc. (a) |
|
| 4,900 |
|
| 11,417 |
|
|
| Universal Travel Group (a) |
|
| 2,400 |
|
| 24,336 |
|
|
| Vail Resorts, Inc. (a)(b) |
|
| 7,156 |
|
| 270,497 |
|
|
| West Marine, Inc. (a) |
|
| 4,100 |
|
| 33,046 |
|
|
|
|
|
|
|
| |||
|
|
|
|
|
|
|
| 1,406,368 |
|
Luxury Items - 0.2% |
| Fossil, Inc. (a) |
|
| 11,600 |
|
| 389,296 |
|
|
| Fuqi International, Inc. (a)(b) |
|
| 2,700 |
|
| 48,465 |
|
|
| Movado Group, Inc. |
|
| 4,000 |
|
| 38,880 |
|
|
|
|
|
|
|
| |||
|
|
|
|
|
|
|
| 476,641 |
|
Machinery: Agricultural - 0.1% |
| Alamo Group, Inc. |
|
| 1,600 |
|
| 27,440 |
|
|
| Lindsay Manufacturing Co. (b) |
|
| 2,713 |
|
| 108,113 |
|
|
| Titan International, Inc. (b) |
|
| 7,849 |
|
| 63,655 |
|
25
|
|
Master Small Cap Index Series of Quantitative Master Series LLC | |
Schedule of Investments December 31, 2009 | (Percentages shown are based on Net Assets) |
|
|
|
|
|
|
|
|
|
|
Industry |
| Common Stocks |
| Shares |
| Value |
| ||
|
| Titan Machinery, Inc. (a) |
|
| 2,300 |
| $ | 26,542 |
|
|
|
|
|
|
|
| |||
|
|
|
|
|
|
|
| 225,750 |
|
Machinery: Construction & Handling - 0.1% |
| Astec Industries, Inc. (a) |
|
| 4,517 |
|
| 121,688 |
|
|
| NACCO Industries, Inc., Class A |
|
| 1,387 |
|
| 69,073 |
|
|
|
|
|
|
|
| |||
|
|
|
|
|
|
|
| 190,761 |
|
Machinery: Engines - 0.1% |
| Briggs & Stratton Corp. (b) |
|
| 11,300 |
|
| 211,423 |
|
|
| Harbin Electric, Inc. (a) |
|
| 3,300 |
|
| 67,782 |
|
|
|
|
|
|
|
| |||
|
|
|
|
|
|
|
| 279,205 |
|
Machinery: Industrial - 1.2% |
| Actuant Corp., Class A |
|
| 16,300 |
|
| 302,039 |
|
|
| Altra Holdings, Inc. (a) |
|
| 6,700 |
|
| 82,745 |
|
|
| Applied Industrial Technologies, Inc. |
|
| 10,690 |
|
| 235,928 |
|
|
| Chart Industries, Inc. (a) |
|
| 6,700 |
|
| 110,885 |
|
|
| Colfax Corp. (a) |
|
| 6,000 |
|
| 72,240 |
|
|
| Columbus McKinnon Corp. (a) |
|
| 4,736 |
|
| 64,694 |
|
|
| DXP Enterprises, Inc. (a) |
|
| 1,900 |
|
| 24,833 |
|
|
| EnPro Industries, Inc. (a) |
|
| 5,000 |
|
| 132,050 |
|
|
| Flow International Corp. (a) |
|
| 9,400 |
|
| 28,952 |
|
|
| Graham Corp. |
|
| 2,400 |
|
| 49,680 |
|
|
| John Bean Technologies Corp. |
|
| 7,100 |
|
| 120,771 |
|
|
| Kadant, Inc. (a) |
|
| 3,170 |
|
| 50,593 |
|
|
| MTS Systems Corp. |
|
| 4,300 |
|
| 123,582 |
|
|
| Middleby Corp. (a) |
|
| 4,017 |
|
| 196,913 |
|
|
| Nordson Corp. |
|
| 8,210 |
|
| 502,288 |
|
|
| Sauer-Danfoss, Inc. |
|
| 2,773 |
|
| 33,304 |
|
|
| Tecumseh Products Co., Class A (a) |
|
| 4,428 |
|
| 51,763 |
|
|
| Tennant Co. |
|
| 4,674 |
|
| 122,412 |
|
|
| Twin Disc, Inc. |
|
| 2,100 |
|
| 21,924 |
|
|
| Woodward Governor Co. |
|
| 14,858 |
|
| 382,891 |
|
|
|
|
|
|
|
| |||
|
|
|
|
|
|
|
| 2,710,487 |
|
Machinery: Specialty - 0.1% |
| Albany International Corp., Class A |
|
| 6,874 |
|
| 154,390 |
|
|
| Cascade Corp. |
|
| 2,300 |
|
| 63,227 |
|
|
| Duoyuan Printing, Inc. (a) |
|
| 1,100 |
|
| 8,855 |
|
|
| Hurco Companies, Inc. (a) |
|
| 1,600 |
|
| 23,680 |
|
|
| K-Tron International, Inc. (a) |
|
| 600 |
|
| 65,244 |
|
|
|
|
|
|
|
| |||
|
|
|
|
|
|
|
| 315,396 |
|
Manufactured Housing - 0.0% |
| Cavco Industries, Inc. (a) |
|
| 1,600 |
|
| 57,472 |
|
|
| Skyline Corp. |
|
| 1,701 |
|
| 31,298 |
|
|
|
|
|
|
|
| |||
|
|
|
|
|
|
|
| 88,770 |
|
Medical & Dental Instruments & Supplies - 2.7% |
| AGA Medical Holdings, Inc. (a) |
|
| 2,700 |
|
| 39,879 |
|
|
| ATS Medical, Inc. (a) |
|
| 12,900 |
|
| 41,667 |
|
|
| Abiomed, Inc. (a) |
|
| 7,700 |
|
| 67,298 |
|
|
| Align Technology, Inc. (a) |
|
| 14,500 |
|
| 258,390 |
|
|
| Alphatec Holdings, Inc. (a) |
|
| 6,700 |
|
| 35,778 |
|
|
| American Medical Systems Holdings, Inc. (a) |
|
| 18,300 |
|
| 353,007 |
|
|
| AngioDynamics, Inc. (a) |
|
| 6,100 |
|
| 98,088 |
|
|
| Atrion Corp. |
|
| 300 |
|
| 46,716 |
|
|
| Bovie Medical Corp. (a) |
|
| 4,700 |
|
| 36,707 |
|
|
| CONMED Corp. (a) |
|
| 7,228 |
|
| 164,798 |
|
|
| Cantel Medical Corp. |
|
| 2,500 |
|
| 50,450 |
|
|
| Cardiovascular Systems, Inc. (a) |
|
| 2,700 |
|
| 12,393 |
|
26
|
|
Master Small Cap Index Series of Quantitative Master Series LLC | |
Schedule of Investments December 31, 2009 | (Percentages shown are based on Net Assets) |
|
|
|
|
|
|
|
|
|
|
Industry |
| Common Stocks |
| Shares |
| Value |
| ||
|
| Conceptus, Inc. (a) |
|
| 7,600 |
| $ | 142,576 |
|
|
| CryoLife, Inc. (a) |
|
| 6,100 |
|
| 39,162 |
|
|
| Cutera, Inc. (a) |
|
| 3,100 |
|
| 26,381 |
|
|
| Delcath Systems, Inc. (a) |
|
| 6,400 |
|
| 32,896 |
|
|
| Endologix, Inc. (a) |
|
| 12,000 |
|
| 63,360 |
|
|
| ev3, Inc. (a) |
|
| 17,732 |
|
| 236,545 |
|
|
| Exactech, Inc. (a) |
|
| 1,900 |
|
| 32,889 |
|
|
| Hansen Medical, Inc. (a) |
|
| 5,500 |
|
| 16,665 |
|
|
| Heartware International, Inc. (a) |
|
| 1,200 |
|
| 42,564 |
|
|
| Home Diagnostics, Inc. (a) |
|
| 2,600 |
|
| 15,860 |
|
|
| ICU Medical, Inc. (a) |
|
| 2,750 |
|
| 100,210 |
|
|
| Immucor, Inc. (a) |
|
| 17,143 |
|
| 346,974 |
|
|
| Insulet Corp. (a) |
|
| 7,900 |
|
| 112,812 |
|
|
| Integra LifeSciences Holdings Corp. (a) |
|
| 4,600 |
|
| 169,188 |
|
|
| Invacare Corp. |
|
| 6,922 |
|
| 172,635 |
|
|
| Landauer, Inc. |
|
| 2,278 |
|
| 139,869 |
|
|
| MAKO Surgical Corp. (a) |
|
| 3,600 |
|
| 39,960 |
|
|
| Matrixx Initiatives, Inc. (a) |
|
| 600 |
|
| 2,532 |
|
|
| Medical Action Industries, Inc. (a) |
|
| 3,550 |
|
| 57,013 |
|
|
| Meridian Bioscience, Inc. |
|
| 10,200 |
|
| 219,810 |
|
|
| Merit Medical Systems, Inc. (a) |
|
| 6,810 |
|
| 131,365 |
|
|
| Micrus Endovascular Corp. (a) |
|
| 3,900 |
|
| 58,539 |
|
|
| Neogen Corp. (a) |
|
| 5,150 |
|
| 121,592 |
|
|
| NuVasive, Inc. (a) |
|
| 8,400 |
|
| 268,632 |
|
|
| OraSure Technologies, Inc. (a) |
|
| 11,559 |
|
| 58,720 |
|
|
| Orthofix International NV (a) |
|
| 4,300 |
|
| 133,171 |
|
|
| Orthovita, Inc. (a) |
|
| 15,800 |
|
| 55,458 |
|
|
| Owens & Minor, Inc. |
|
| 9,698 |
|
| 416,335 |
|
|
| PSS World Medical, Inc. (a) |
|
| 13,673 |
|
| 308,600 |
|
|
| Quidel Corp. (a) |
|
| 6,300 |
|
| 86,814 |
|
|
| Rochester Medical Corp. (a) |
|
| 2,300 |
|
| 25,599 |
|
|
| Rockwell Medical Technologies, Inc. (a) |
|
| 3,300 |
|
| 25,377 |
|
|
| Steris Corp. |
|
| 13,600 |
|
| 380,392 |
|
|
| SurModics, Inc. (a)(b) |
|
| 3,783 |
|
| 85,723 |
|
|
| Symmetry Medical, Inc. (a) |
|
| 9,000 |
|
| 72,540 |
|
|
| Synovis Life Technologies, Inc. (a) |
|
| 2,200 |
|
| 28,402 |
|
|
| Trans1, Inc. (a) |
|
| 3,100 |
|
| 12,245 |
|
|
| Utah Medical Products, Inc. |
|
| 700 |
|
| 20,524 |
|
|
| Vascular Solutions, Inc. (a) |
|
| 4,300 |
|
| 36,077 |
|
|
| Volcano Corp. (a) |
|
| 12,000 |
|
| 208,560 |
|
|
| West Pharmaceutical Services, Inc. |
|
| 7,776 |
|
| 304,819 |
|
|
| Wright Medical Group, Inc. (a) |
|
| 8,900 |
|
| 168,655 |
|
|
| Young Innovations, Inc. |
|
| 1,300 |
|
| 32,214 |
|
|
|
|
|
|
|
| |||
|
|
|
|
|
|
|
| 6,255,425 |
|
Medical Equipment - 1.7% |
| Abaxis, Inc. (a) |
|
| 5,100 |
|
| 130,305 |
|
|
| Accuray, Inc. (a)(b) |
|
| 10,400 |
|
| 58,344 |
|
|
| Affymetrix, Inc. (a) |
|
| 17,700 |
|
| 103,368 |
|
|
| Analogic Corp. |
|
| 3,272 |
|
| 126,005 |
|
|
| Bruker BioSciences Corp. (a) |
|
| 12,387 |
|
| 149,387 |
|
|
| Cardiac Science Corp. (a) |
|
| 4,800 |
|
| 10,704 |
|
27
|
|
Master Small Cap Index Series of Quantitative Master Series LLC | |
Schedule of Investments December 31, 2009 | (Percentages shown are based on Net Assets) |
|
|
|
|
|
|
|
|
|
|
Industry |
| Common Stocks |
| Shares |
| Value |
| ||
|
| Cyberonics, Inc. (a) |
|
| 6,769 |
| $ | 138,358 |
|
|
| Cynosure, Inc., Class A (a) |
|
| 2,400 |
|
| 27,576 |
|
|
| DexCom, Inc. (a) |
|
| 12,000 |
|
| 96,960 |
|
|
| Dionex Corp. (a) |
|
| 4,431 |
|
| 327,318 |
|
|
| Electro-Optical Sciences, Inc. (a)(b) |
|
| 4,800 |
|
| 49,728 |
|
|
| Enteromedics, Inc. (a)(b) |
|
| 4,700 |
|
| 2,632 |
|
|
| Greatbatch, Inc. (a) |
|
| 5,800 |
|
| 111,534 |
|
|
| Haemonetics Corp. (a) |
|
| 5,972 |
|
| 329,356 |
|
|
| IRIS International, Inc. (a) |
|
| 4,500 |
|
| 55,620 |
|
|
| Luminex Corp. (a) |
|
| 10,651 |
|
| 159,019 |
|
|
| Masimo Corp. (a) |
|
| 12,600 |
|
| 383,292 |
|
|
| Merge Healthcare, Inc. (a) |
|
| 6,100 |
|
| 20,496 |
|
|
| Natus Medical, Inc. (a) |
|
| 6,800 |
|
| 100,572 |
|
|
| NxStage Medical, Inc. (a) |
|
| 5,700 |
|
| 47,595 |
|
|
| OSI Systems, Inc. (a) |
|
| 3,800 |
|
| 103,664 |
|
|
| Palomar Medical Technologies, Inc. (a) |
|
| 4,500 |
|
| 45,360 |
|
|
| Sirona Dental Systems, Inc. (a) |
|
| 4,300 |
|
| 136,482 |
|
|
| Somanetics Corp. (a) |
|
| 2,400 |
|
| 42,120 |
|
|
| SonoSite, Inc. (a) |
|
| 4,315 |
|
| 101,963 |
|
|
| Spectranetic Corp. (a) |
|
| 8,100 |
|
| 56,376 |
|
|
| Stereotaxis, Inc. (a) |
|
| 6,500 |
|
| 25,545 |
|
|
| Thoratec Corp. (a) |
|
| 13,147 |
|
| 353,917 |
|
|
| Tomotherapy, Inc. (a) |
|
| 10,300 |
|
| 40,170 |
|
|
| Varian, Inc. (a) |
|
| 6,935 |
|
| 357,430 |
|
|
| Vital Images, Inc. (a) |
|
| 3,600 |
|
| 45,684 |
|
|
| Zoll Medical Corp. (a) |
|
| 5,322 |
|
| 142,204 |
|
|
|
|
|
|
|
| |||
|
|
|
|
|
|
|
| 3,879,084 |
|
Medical Services - 0.3% |
| America Service Group, Inc. |
|
| 2,200 |
|
| 34,914 |
|
|
| Bio-Reference Labs, Inc. (a) |
|
| 2,600 |
|
| 101,894 |
|
|
| Clarient, Inc. (a) |
|
| 8,300 |
|
| 21,995 |
|
|
| eResearch Technology, Inc. (a) |
|
| 10,650 |
|
| 64,007 |
|
|
| Genoptix, Inc. (a) |
|
| 3,800 |
|
| 135,014 |
|
|
| inVentiv Health, Inc. (a) |
|
| 8,400 |
|
| 135,828 |
|
|
| Kendle International, Inc. (a) |
|
| 3,200 |
|
| 58,592 |
|
|
| Nighthawk Radiology Holdings, Inc. (a) |
|
| 5,300 |
|
| 24,009 |
|
|
| Parexel International Corp. (a) |
|
| 14,094 |
|
| 198,725 |
|
|
| RadNet, Inc. (a) |
|
| 6,900 |
|
| 14,076 |
|
|
|
|
|
|
|
| |||
|
|
|
|
|
|
|
| 789,054 |
|
Metal Fabricating - 0.7% |
| Ampco-Pittsburgh Corp. |
|
| 2,100 |
|
| 66,213 |
|
|
| Dynamic Materials Corp. |
|
| 3,200 |
|
| 64,160 |
|
|
| The Eastern Co. |
|
| 1,700 |
|
| 22,831 |
|
|
| Hawk Corp., Class A (a) |
|
| 1,300 |
|
| 22,893 |
|
|
| Haynes International, Inc. |
|
| 3,000 |
|
| 98,910 |
|
|
| Kaydon Corp. |
|
| 7,626 |
|
| 272,706 |
|
|
| L.B. Foster Co., Class A (a) |
|
| 2,500 |
|
| 74,525 |
|
|
| Lawson Products, Inc. |
|
| 988 |
|
| 17,438 |
|
|
| Mueller Industries, Inc. |
|
| 9,382 |
|
| 233,049 |
|
|
| Mueller Water Products, Inc., Series A |
|
| 36,260 |
|
| 188,552 |
|
|
| Northwest Pipe Co. (a) |
|
| 2,000 |
|
| 53,720 |
|
|
| Omega Flex, Inc. |
|
| 600 |
|
| 8,400 |
|
28
|
|
Master Small Cap Index Series of Quantitative Master Series LLC |
|
Schedule of Investments December 31, 2009 | (Percentages shown are based on Net Assets) |
|
|
|
|
|
|
|
|
|
|
Industry |
| Common Stocks |
| Shares |
| Value |
| ||
|
| RBC Bearings, Inc. (a) |
|
| 5,500 |
| $ | 133,815 |
|
|
| RTI International Metals, Inc. (a) |
|
| 6,813 |
|
| 171,483 |
|
|
| Worthington Industries, Inc. |
|
| 14,900 |
|
| 194,743 |
|
|
|
|
|
|
|
| |||
|
|
|
|
|
|
|
| 1,623,438 |
|
Metals & Minerals: Diversified - 0.4% |
| AMCOL International Corp. |
|
| 5,773 |
|
| 164,069 |
|
|
| Brush Engineered Materials, Inc. (a) |
|
| 5,011 |
|
| 92,904 |
|
|
| General Moly, Inc. (a) |
|
| 15,600 |
|
| 32,448 |
|
|
| Hecla Mining Co. (a)(b) |
|
| 55,800 |
|
| 344,844 |
|
|
| Minerals Technologies, Inc. |
|
| 4,653 |
|
| 253,449 |
|
|
| Oil-Dri Corp. of America |
|
| 800 |
|
| 12,400 |
|
|
| Paramount Gold and Silver Corp. (a) |
|
| 14,500 |
|
| 21,025 |
|
|
| United States Lime & Minerals, Inc. (a) |
|
| 400 |
|
| 13,812 |
|
|
| Uranerz Energy Corp. (a) |
|
| 13,200 |
|
| 17,160 |
|
|
|
|
|
|
|
| |||
|
|
|
|
|
|
|
| 952,111 |
|
Office Supplies & Equipment - 0.6% |
| ACCO Brands Corp. (a) |
|
| 13,500 |
|
| 98,280 |
|
|
| Electronics for Imaging, Inc. (a) |
|
| 12,639 |
|
| 164,433 |
|
|
| HNI Corp. |
|
| 11,100 |
|
| 306,693 |
|
|
| Herman Miller, Inc. |
|
| 13,500 |
|
| 215,730 |
|
|
| Kimball International, Inc., Class B |
|
| 7,974 |
|
| 67,938 |
|
|
| Knoll, Inc. |
|
| 11,900 |
|
| 122,927 |
|
|
| Steelcase, Inc., Class A |
|
| 17,500 |
|
| 111,300 |
|
|
| United Stationers, Inc. (a) |
|
| 5,869 |
|
| 333,653 |
|
|
|
|
|
|
|
| |||
|
|
|
|
|
|
|
| 1,420,954 |
|
Offshore Drilling & Other Services - 0.1% |
| Hercules Offshore, Inc. (a) |
|
| 26,800 |
|
| 128,104 |
|
|
| Vantage Drilling Co. (a) |
|
| 12,700 |
|
| 20,447 |
|
|
|
|
|
|
|
| |||
|
|
|
|
|
|
|
| 148,551 |
|
Oil Well Equipment & Services - 1.4% |
| Allis-Chalmers Energy, Inc. (a)(b) |
|
| 12,700 |
|
| 47,879 |
|
|
| Basic Energy Services, Inc. (a) |
|
| 5,300 |
|
| 47,170 |
|
|
| Bolt Technology Corp. (a) |
|
| 2,100 |
|
| 23,142 |
|
|
| Boots & Coots, Inc. (a) |
|
| 21,700 |
|
| 35,805 |
|
|
| Bronco Drilling Co., Inc. (a) |
|
| 4,700 |
|
| 23,829 |
|
|
| CARBO Ceramics, Inc. (b) |
|
| 4,402 |
|
| 300,084 |
|
|
| Cal Dive International, Inc. (a) |
|
| 10,974 |
|
| 82,963 |
|
|
| Complete Production Services, Inc. (a) |
|
| 14,600 |
|
| 189,800 |
|
|
| Dawson Geophysical Co. (a) |
|
| 1,500 |
|
| 34,665 |
|
|
| Dril-Quip, Inc. (a) |
|
| 7,076 |
|
| 399,652 |
|
|
| Geokinetics, Inc. (a) |
|
| 1,300 |
|
| 12,506 |
|
|
| Global Industries Ltd. (a) |
|
| 25,000 |
|
| 178,250 |
|
|
| Gulf Island Fabrication, Inc. |
|
| 3,017 |
|
| 63,448 |
|
|
| Hornbeck Offshore Services, Inc. (a) |
|
| 5,040 |
|
| 117,331 |
|
|
| ION Geophysical Corp. (a) |
|
| 24,246 |
|
| 143,536 |
|
|
| Key Energy Services, Inc. (a) |
|
| 30,600 |
|
| 268,974 |
|
|
| Lufkin Industries, Inc. |
|
| 3,400 |
|
| 248,880 |
|
|
| Matrix Service Co. (a) |
|
| 6,500 |
|
| 69,225 |
|
|
| Natural Gas Services Group (a) |
|
| 3,000 |
|
| 56,550 |
|
|
| Newpark Resources, Inc. (a) |
|
| 22,220 |
|
| 93,991 |
|
|
| OYO Geospace Corp. (a) |
|
| 1,000 |
|
| 42,890 |
|
|
| Parker Drilling Co. (a) |
|
| 29,681 |
|
| 146,921 |
|
|
| Pioneer Drilling Co. (a) |
|
| 10,100 |
|
| 79,790 |
|
|
| RPC, Inc. |
|
| 7,100 |
|
| 73,840 |
|
29
|
|
Master Small Cap Index Series of Quantitative Master Series LLC |
|
Schedule of Investments December 31, 2009 | (Percentages shown are based on Net Assets) |
|
|
|
|
|
|
|
|
|
|
Industry |
| Common Stocks |
| Shares |
| Value |
| ||
|
| Sulphco, Inc. (a)(b) |
|
| 12,200 |
| $ | 8,174 |
|
|
| Superior Well Services, Inc. (a) |
|
| 3,800 |
|
| 54,188 |
|
|
| T-3 Energy Services, Inc. (a) |
|
| 3,100 |
|
| 79,050 |
|
|
| Tetra Technologies, Inc. (a) |
|
| 18,600 |
|
| 206,088 |
|
|
| Union Drilling, Inc. (a) |
|
| 2,600 |
|
| 16,250 |
|
|
| Willbros Group, Inc. (a) |
|
| 9,900 |
|
| 167,013 |
|
|
|
|
|
|
|
| |||
|
|
|
|
|
|
|
| 3,311,884 |
|
Oil: Crude Producers - 2.3% |
| ATP Oil & Gas Corp. (a)(b) |
|
| 9,300 |
|
| 170,004 |
|
|
| Apco Oil and Gas International, Inc. |
|
| 2,100 |
|
| 46,410 |
|
|
| Approach Resources, Inc. (a) |
|
| 3,500 |
|
| 27,020 |
|
|
| Arena Resources, Inc. (a) |
|
| 9,300 |
|
| 401,016 |
|
|
| Atlas Energy, Inc. |
|
| 16,087 |
|
| 485,345 |
|
|
| BPZ Resources, Inc. (a)(b) |
|
| 22,200 |
|
| 210,900 |
|
|
| Berry Petroleum Co., Class A |
|
| 10,602 |
|
| 309,048 |
|
|
| Bill Barrett Corp. (a) |
|
| 9,600 |
|
| 298,656 |
|
|
| Brigham Exploration Co. (a) |
|
| 23,200 |
|
| 314,360 |
|
|
| CREDO Petroleum Corp. (a) |
|
| 1,600 |
|
| 14,880 |
|
|
| Carrizo Oil & Gas, Inc. (a) |
|
| 6,900 |
|
| 182,781 |
|
|
| Cheniere Energy, Inc. (a) |
|
| 13,100 |
|
| 31,702 |
|
|
| Clayton Williams Energy, Inc. (a) |
|
| 1,500 |
|
| 52,560 |
|
|
| Contango Oil & Gas Co. (a) |
|
| 3,000 |
|
| 141,030 |
|
|
| Cubic Energy, Inc. (a) |
|
| 5,300 |
|
| 7,897 |
|
|
| Delta Petroleum Corp. (a)(b) |
|
| 45,900 |
|
| 47,736 |
|
|
| Endeavour International Corp. (a) |
|
| 28,500 |
|
| 30,780 |
|
|
| FX Energy, Inc. (a)(b) |
|
| 10,500 |
|
| 29,925 |
|
|
| GMX Resources, Inc. (a) |
|
| 7,100 |
|
| 97,554 |
|
|
| GeoResources, Inc. (a) |
|
| 1,800 |
|
| 24,588 |
|
|
| Goodrich Petroleum Corp. (a) |
|
| 5,500 |
|
| 133,925 |
|
|
| Gran Tierra Energy, Inc. (a) |
|
| 50,100 |
|
| 287,073 |
|
|
| Gulfport Energy Corp. (a) |
|
| 6,500 |
|
| 74,425 |
|
|
| Harvest Natural Resources, Inc. (a) |
|
| 8,200 |
|
| 43,378 |
|
|
| Isramco, Inc. (a) |
|
| 200 |
|
| 14,300 |
|
|
| McMoRan Exploration Co. (a)(b) |
|
| 17,900 |
|
| 143,558 |
|
|
| Northern Oil And Gas, Inc. (a) |
|
| 7,800 |
|
| 92,352 |
|
|
| Oilsands Quest, Inc. (a) |
|
| 48,600 |
|
| 55,890 |
|
|
| Panhandle Oil & Gas, Inc. |
|
| 1,800 |
|
| 46,620 |
|
|
| Penn Virginia Corp. |
|
| 10,616 |
|
| 226,015 |
|
|
| Petroleum Development Corp. (a) |
|
| 4,300 |
|
| 78,303 |
|
|
| Petroquest Energy, Inc. (a)(b) |
|
| 11,400 |
|
| 69,882 |
|
|
| PrimeEnergy Corp. (a) |
|
| 100 |
|
| 3,639 |
|
|
| Rex Energy Corp. (a) |
|
| 6,700 |
|
| 80,400 |
|
|
| Rosetta Resources, Inc. (a) |
|
| 12,800 |
|
| 255,104 |
|
|
| Stone Energy Corp. (a) |
|
| 9,798 |
|
| 176,854 |
|
|
| Swift Energy Co. (a) |
|
| 8,917 |
|
| 213,651 |
|
|
| Toreador Resources Corp. (b) |
|
| 5,500 |
|
| 54,450 |
|
|
| Vaalco Energy, Inc. |
|
| 14,600 |
|
| 66,430 |
|
|
| Venoco, Inc. (a) |
|
| 4,500 |
|
| 58,680 |
|
|
| W&T Offshore, Inc. |
|
| 8,300 |
|
| 97,110 |
|
|
| Warren Resources, Inc. (a) |
|
| 15,100 |
|
| 36,995 |
|
30
|
|
Master Small Cap Index Series of Quantitative Master Series LLC |
|
Schedule of Investments December 31, 2009 | (Percentages shown are based on Net Assets) |
|
|
|
|
|
|
|
|
|
|
Industry |
| Common Stocks |
| Shares |
| Value |
| ||
|
| Zion Oil & Gas, Inc. (a) |
|
| 2,228 |
| $ | 15,930 |
|
|
|
|
|
|
|
| |||
|
|
|
|
|
|
|
| 5,249,156 |
|
Oil: Integrated - 0.0% |
| Alon USA Energy, Inc. |
|
| 1,800 |
|
| 12,312 |
|
|
| CVR Energy, Inc. (a) |
|
| 5,700 |
|
| 39,102 |
|
|
| Delek US Holdings, Inc. |
|
| 3,200 |
|
| 21,792 |
|
|
| Western Refining, Inc. (a)(b) |
|
| 8,900 |
|
| 41,919 |
|
|
|
|
|
|
|
| |||
|
|
|
|
|
|
|
| 115,125 |
|
Paints & Coatings - 0.2% |
| Chase Corp. |
|
| 1,800 |
|
| 21,258 |
|
|
| Ferro Corp. |
|
| 19,676 |
|
| 162,130 |
|
|
| H.B. Fuller Co. |
|
| 11,980 |
|
| 272,545 |
|
|
| North American Galvanizing & Coatings (a) |
|
| 2,800 |
|
| 13,580 |
|
|
|
|
|
|
|
| |||
|
|
|
|
|
|
|
| 469,513 |
|
Paper - 0.7% |
| Boise, Inc. (a) |
|
| 7,000 |
|
| 37,170 |
|
|
| Buckeye Technologies, Inc. (a) |
|
| 9,698 |
|
| 94,652 |
|
|
| Clearwater Paper Corp. (a) |
|
| 2,599 |
|
| 142,867 |
|
|
| Domtar Corp. (a) |
|
| 10,100 |
|
| 559,641 |
|
|
| Kapstone Paper and Packaging Corp. (a) |
|
| 7,100 |
|
| 69,935 |
|
|
| Neenah Paper, Inc. |
|
| 3,800 |
|
| 53,010 |
|
|
| P.H. Glatfelter Co. |
|
| 11,301 |
|
| 137,307 |
|
|
| Schweitzer-Mauduit International, Inc. |
|
| 4,120 |
|
| 289,842 |
|
|
| Wausau Paper Corp. |
|
| 10,842 |
|
| 125,767 |
|
|
|
|
|
|
|
| |||
|
|
|
|
|
|
|
| 1,510,191 |
|
Personal Care - 0.3% |
| Chattem, Inc. (a) |
|
| 4,600 |
|
| 429,180 |
|
|
| Female Health Co. (a) |
|
| 3,500 |
|
| 16,555 |
|
|
| Mannatech, Inc. |
|
| 3,900 |
|
| 12,168 |
|
|
| Orchids Paper Products Co. (a) |
|
| 1,400 |
|
| 28,028 |
|
|
| USANA Health Sciences, Inc. (a) |
|
| 1,600 |
|
| 51,040 |
|
|
| WD-40 Co. |
|
| 4,089 |
|
| 132,320 |
|
|
|
|
|
|
|
| |||
|
|
|
|
|
|
|
| 669,291 |
|
Pharmaceuticals - 1.7% |
| Acura Pharmaceuticals, Inc. (a) |
|
| 2,100 |
|
| 11,193 |
|
|
| Adolor Corp. (a) |
|
| 11,600 |
|
| 16,936 |
|
|
| Akorn, Inc. (a) |
|
| 13,100 |
|
| 23,449 |
|
|
| Alkermes, Inc. (a) |
|
| 23,600 |
|
| 222,076 |
|
|
| Allion Healthcare, Inc. (a) |
|
| 4,700 |
|
| 30,832 |
|
|
| American Oriental Bioengineering, Inc. (a) |
|
| 15,500 |
|
| 72,075 |
|
|
| Ardea Biosciences, Inc. (a) |
|
| 3,300 |
|
| 46,200 |
|
|
| Auxilium Pharmaceuticals, Inc. (a) |
|
| 11,000 |
|
| 329,780 |
|
|
| Avanir Pharmaceuticals, Inc. (a)(b) |
|
| 16,700 |
|
| 31,730 |
|
|
| BMP Sunstone Corp. (a) |
|
| 8,800 |
|
| 50,072 |
|
|
| BioCryst Pharmaceuticals, Inc. (a)(b) |
|
| 5,800 |
|
| 37,468 |
|
|
| Biospecifics Technologies (a) |
|
| 800 |
|
| 23,480 |
|
|
| Cadence Pharmaceuticals, Inc. (a)(b) |
|
| 6,000 |
|
| 58,020 |
|
|
| Cambrex Corp. (a) |
|
| 7,285 |
|
| 40,650 |
|
|
| Caraco Pharmaceutical Laboratories Ltd. (a) |
|
| 2,600 |
|
| 15,704 |
|
|
| China Sky One Medical, Inc. (a)(b) |
|
| 2,800 |
|
| 63,700 |
|
|
| Cumberland Pharmaceuticals, Inc. (a) |
|
| 1,800 |
|
| 24,462 |
|
|
| Depomed, Inc. (a) |
|
| 12,800 |
|
| 42,880 |
|
|
| Durect Corp. (a) |
|
| 20,100 |
|
| 49,647 |
|
|
| Hi-Tech Pharmacal Co., Inc. (a) |
|
| 1,800 |
|
| 50,490 |
|
|
| Impax Laboratories, Inc. (a) |
|
| 15,200 |
|
| 206,720 |
|
31
|
|
Master Small Cap Index Series of Quantitative Master Series LLC | |
Schedule of Investments December 31, 2009 | (Percentages shown are based on Net Assets) |
|
|
|
|
|
|
|
|
|
|
Industry |
| Common Stocks |
| Shares |
| Value |
| ||
|
| Infinity Pharmaceuticals, Inc. (a) |
|
| 5,000 |
| $ | 30,900 |
|
|
| Inspire Pharmaceuticals, Inc. (a) |
|
| 14,100 |
|
| 77,832 |
|
|
| Isis Pharmaceuticals, Inc. (a) |
|
| 23,089 |
|
| 256,288 |
|
|
| Ista Pharmaceuticals, Inc. (a) |
|
| 9,100 |
|
| 41,496 |
|
|
| Javelin Pharmaceuticals, Inc. (a) |
|
| 12,600 |
|
| 16,380 |
|
|
| K-V Pharmaceutical Co., Class A (a) |
|
| 8,700 |
|
| 31,929 |
|
|
| Lannett Co., Inc. (a) |
|
| 2,100 |
|
| 12,411 |
|
|
| MAP Pharmaceuticals, Inc. (a) |
|
| 1,800 |
|
| 17,154 |
|
|
| Medicines Co. (a) |
|
| 13,227 |
|
| 110,313 |
|
|
| Medicis Pharmaceutical Corp., Class A |
|
| 13,700 |
|
| 370,585 |
|
|
| MiddleBrook Pharmaceuticals, Inc. (a) |
|
| 9,100 |
|
| 4,641 |
|
|
| Obagi Medical Products, Inc. (a) |
|
| 4,300 |
|
| 51,600 |
|
|
| Optimer Pharmaceuticals, Inc. (a)(b) |
|
| 7,200 |
|
| 81,216 |
|
|
| Pain Therapeutics, Inc. (a) |
|
| 8,700 |
|
| 46,632 |
|
|
| Par Pharmaceutical Cos., Inc. (a) |
|
| 8,000 |
|
| 216,480 |
|
|
| Pozen, Inc. (a) |
|
| 6,400 |
|
| 38,336 |
|
|
| Prestige Brands Holdings, Inc. (a) |
|
| 8,300 |
|
| 65,238 |
|
|
| Questcor Pharmaceuticals, Inc. (a) |
|
| 14,400 |
|
| 68,400 |
|
|
| SIGA Technologies, Inc. (a) |
|
| 6,900 |
|
| 40,020 |
|
|
| Salix Pharmaceuticals Ltd. (a) |
|
| 13,000 |
|
| 330,200 |
|
|
| Santarus, Inc. (a) |
|
| 12,300 |
|
| 56,826 |
|
|
| Sciclone Pharmaceuticals, Inc. (a) |
|
| 10,300 |
|
| 23,999 |
|
|
| Spectrum Pharmaceuticals, Inc. (a) |
|
| 9,500 |
|
| 42,180 |
|
|
| SuperGen, Inc. (a) |
|
| 13,800 |
|
| 36,156 |
|
|
| Vical, Inc. (a) |
|
| 9,000 |
|
| 29,610 |
|
|
| Vivus, Inc. (a)(b) |
|
| 18,900 |
|
| 173,691 |
|
|
| Xenoport, Inc. (a) |
|
| 7,100 |
|
| 131,776 |
|
|
|
|
|
|
|
| |||
|
|
|
|
|
|
|
| 3,849,853 |
|
Photography - 0.1% |
| CPI Corp. |
|
| 1,200 |
|
| 14,736 |
|
|
| Eastman Kodak Co. (b) |
|
| 66,000 |
|
| 278,520 |
|
|
|
|
|
|
|
| |||
|
|
|
|
|
|
|
| 293,256 |
|
Plastics - 0.0% |
| Spartech Corp. |
|
| 7,654 |
|
| 78,530 |
|
Power Transmission Equipment - 0.3% |
| Advanced Energy Industries, Inc. (a) |
|
| 8,212 |
|
| 123,837 |
|
|
| Maxwell Technologies, Inc. (a) |
|
| 5,600 |
|
| 99,904 |
|
|
| Powell Industries, Inc. (a) |
|
| 1,931 |
|
| 60,884 |
|
|
| Regal-Beloit Corp. |
|
| 8,551 |
|
| 444,139 |
|
|
| Vicor Corp. (a) |
|
| 4,796 |
|
| 44,603 |
|
|
|
|
|
|
|
| |||
|
|
|
|
|
|
|
| 773,367 |
|
Precious Metals & Minerals - 0.1% |
| Horsehead Holding Corp. (a) |
|
| 10,000 |
|
| 127,500 |
|
|
| Stillwater Mining Co. (a) |
|
| 10,064 |
|
| 95,407 |
|
|
|
|
|
|
|
| |||
|
|
|
|
|
|
|
| 222,907 |
|
Printing & Copying Services - 0.0% |
| Cenveo, Inc. (a) |
|
| 12,100 |
|
| 105,875 |
|
Producer Durables: Miscellaneous - 0.1% |
| Blount International, Inc. (a) |
|
| 9,600 |
|
| 96,960 |
|
|
| China Fire & Security Group, Inc. (a)(b) |
|
| 3,500 |
|
| 47,355 |
|
|
|
|
|
|
|
| |||
|
|
|
|
|
|
|
| 144,315 |
|
Production Technology Equipment - 1.0% |
| ATMI, Inc. (a)(c) |
|
| 7,857 |
|
| 146,297 |
|
|
| Brooks Automation, Inc. (a) |
|
| 16,078 |
|
| 137,949 |
|
|
| Cognex Corp. |
|
| 9,956 |
|
| 176,420 |
|
|
| Cohu, Inc. |
|
| 5,818 |
|
| 81,161 |
|
|
| Cymer, Inc. (a) |
|
| 7,000 |
|
| 268,660 |
|
32
|
|
Master Small Cap Index Series of Quantitative Master Series LLC | |
Schedule of Investments December 31, 2009 | (Percentages shown are based on Net Assets) |
|
|
|
|
|
|
|
|
|
|
Industry |
| Common Stocks |
| Shares |
| Value |
| ||
|
| Electro Scientific Industries, Inc. (a) |
|
| 6,761 |
| $ | 73,154 |
|
|
| Entegris, Inc. (a) |
|
| 30,292 |
|
| 159,942 |
|
|
| FEI Co. (a) |
|
| 9,455 |
|
| 220,869 |
|
|
| Intevac, Inc. (a) |
|
| 5,500 |
|
| 63,085 |
|
|
| Kulicke & Soffa Industries, Inc. (a) |
|
| 15,656 |
|
| 84,386 |
|
|
| MKS Instruments, Inc. (a) |
|
| 12,300 |
|
| 214,143 |
|
|
| Photronics, Inc. (a) |
|
| 11,079 |
|
| 49,302 |
|
|
| Rudolph Technologies, Inc. (a) |
|
| 7,573 |
|
| 50,891 |
|
|
| Tessera Technologies, Inc. (a) |
|
| 11,800 |
|
| 274,586 |
|
|
| Ultratech, Inc. (a) |
|
| 4,990 |
|
| 74,151 |
|
|
| Veeco Instruments, Inc. (a) |
|
| 8,927 |
|
| 294,948 |
|
|
|
|
|
|
|
| |||
|
|
|
|
|
|
|
| 2,369,944 |
|
Publishing - 0.2% |
| Courier Corp. |
|
| 2,450 |
|
| 34,912 |
|
|
| Dolan Media Co. (a) |
|
| 6,500 |
|
| 66,365 |
|
|
| Journal Communications, Inc., Class A |
|
| 9,800 |
|
| 38,122 |
|
|
| Martha Stewart Living Omnimedia, Inc., |
|
| 6,682 |
|
| 33,009 |
|
|
| Primedia, Inc. |
|
| 5,900 |
|
| 21,299 |
|
|
| Scholastic Corp. |
|
| 5,860 |
|
| 174,804 |
|
|
|
|
|
|
|
| |||
|
|
|
|
|
|
|
| 368,511 |
|
Radio & TV Broadcasters - 0.1% |
| Crown Media Holdings, Inc., Class A (a) |
|
| 2,698 |
|
| 3,912 |
|
|
| Fisher Communications, Inc. (a) |
|
| 1,500 |
|
| 24,375 |
|
|
| Lin TV Corp., Class A (a) |
|
| 6,700 |
|
| 29,882 |
|
|
| Outdoor Channel Holdings, Inc. (a) |
|
| 3,800 |
|
| 22,040 |
|
|
| Sinclair Broadcast Group, Inc., Class A |
|
| 12,064 |
|
| 48,618 |
|
|
|
|
|
|
|
| |||
|
|
|
|
|
|
|
| 128,827 |
|
Railroad Equipment - 0.1% |
| American Railcar Industries, Inc. |
|
| 2,300 |
|
| 25,346 |
|
|
| Freightcar America, Inc. |
|
| 2,500 |
|
| 49,575 |
|
|
| Greenbrier Cos., Inc. |
|
| 4,300 |
|
| 44,634 |
|
|
| Portec Rail Products, Inc. |
|
| 1,500 |
|
| 16,065 |
|
|
|
|
|
|
|
| |||
|
|
|
|
|
|
|
| 135,620 |
|
Railroads - 0.1% |
| Genesee & Wyoming, Inc., Class A (a) |
|
| 8,875 |
|
| 289,680 |
|
|
| RailAmerica, Inc. (a) |
|
| 4,400 |
|
| 53,680 |
|
|
|
|
|
|
|
| |||
|
|
|
|
|
|
|
| 343,360 |
|
Real Estate - 0.2% |
| American Realty Investors, Inc. (a) |
|
| 400 |
|
| 4,900 |
|
|
| Avatar Holdings, Inc. (a) |
|
| 1,500 |
|
| 25,515 |
|
|
| China Housing & Land Development (a)(b) |
|
| 7,100 |
|
| 29,323 |
|
|
| Consolidated-Tomoka Land Co. |
|
| 1,400 |
|
| 48,916 |
|
|
| Forestar Group, Inc. (a)(b) |
|
| 8,828 |
|
| 194,039 |
|
|
| Griffin Land & Nurseries, Inc. |
|
| 700 |
|
| 20,391 |
|
|
| Tejon Ranch Co. (a) |
|
| 2,715 |
|
| 79,332 |
|
|
| United Capital Corp. (a) |
|
| 300 |
|
| 7,146 |
|
|
|
|
|
|
|
| |||
|
|
|
|
|
|
|
| 409,562 |
|
Real Estate Investment Trusts (REITs) - 6.2% |
| Acadia Realty Trust |
|
| 9,913 |
|
| 167,232 |
|
|
| Agree Realty Corp. |
|
| 1,900 |
|
| 44,251 |
|
|
| Alexander’s, Inc. (a) |
|
| 467 |
|
| 142,164 |
|
|
| American Campus Communities, Inc. |
|
| 12,903 |
|
| 362,574 |
|
|
| American Capital Agency Corp. |
|
| 3,500 |
|
| 92,890 |
|
|
| Anworth Mortgage Asset Corp. |
|
| 25,500 |
|
| 178,500 |
|
|
| Apollo Commercial Real Estate Finance, |
|
| 1,800 |
|
| 32,382 |
|
33
|
|
Master Small Cap Index Series of Quantitative Master Series LLC | |
Schedule of Investments December 31, 2009 | (Percentages shown are based on Net Assets) |
|
|
|
|
|
|
|
|
|
|
Industry |
| Common Stocks |
| Shares |
| Value |
| ||
|
| Ashford Hospitality Trust, Inc. (a) |
|
| 14,080 |
| $ | 65,331 |
|
|
| Associated Estates Realty Corp. |
|
| 3,600 |
|
| 40,572 |
|
|
| BioMed Realty Trust, Inc. |
|
| 24,220 |
|
| 382,192 |
|
|
| CBL & Associates Properties, Inc. |
|
| 33,800 |
|
| 326,846 |
|
|
| CapLease, Inc. |
|
| 11,100 |
|
| 48,618 |
|
|
| Capstead Mortgage Corp. |
|
| 15,800 |
|
| 215,670 |
|
|
| Care Investment Trust, Inc. |
|
| 2,900 |
|
| 22,562 |
|
|
| Cedar Shopping Centers, Inc. |
|
| 9,800 |
|
| 66,640 |
|
|
| Cogdell Spencer, Inc. |
|
| 6,900 |
|
| 39,054 |
|
|
| Colonial Properties Trust |
|
| 15,300 |
|
| 179,469 |
|
|
| Colony Financial, Inc. |
|
| 2,900 |
|
| 59,073 |
|
|
| Cousins Properties, Inc. |
|
| 16,809 |
|
| 128,253 |
|
|
| CreXus Investment Corp. (a) |
|
| 2,500 |
|
| 34,900 |
|
|
| Cypress Sharpridge Investments, Inc. |
|
| 3,800 |
|
| 51,338 |
|
|
| DCT Industrial Trust, Inc. |
|
| 48,310 |
|
| 242,516 |
|
|
| Developers Diversified Realty Corp. |
|
| 37,700 |
|
| 349,102 |
|
|
| DiamondRock Hospitality Co. |
|
| 27,380 |
|
| 231,909 |
|
|
| DuPont Fabros Technology, Inc. |
|
| 6,900 |
|
| 124,131 |
|
|
| Dynex Capital Corp. |
|
| 2,600 |
|
| 22,698 |
|
|
| EastGroup Properties, Inc. |
|
| 6,227 |
|
| 238,370 |
|
|
| Education Realty Trust, Inc. |
|
| 12,400 |
|
| 60,016 |
|
|
| Entertainment Properties Trust |
|
| 9,680 |
|
| 341,414 |
|
|
| Equity Lifestyle Properties, Inc. |
|
| 6,094 |
|
| 307,564 |
|
|
| Equity One, Inc. (b) |
|
| 7,800 |
|
| 126,126 |
|
|
| Extra Space Storage, Inc. |
|
| 21,550 |
|
| 248,903 |
|
|
| FelCor Lodging Trust, Inc. (a) |
|
| 16,170 |
|
| 58,212 |
|
|
| First Industrial Realty Trust, Inc. |
|
| 11,400 |
|
| 59,622 |
|
|
| First Potomac Realty Trust |
|
| 6,900 |
|
| 86,733 |
|
|
| Franklin Street Properties Corp. |
|
| 15,500 |
|
| 226,455 |
|
|
| Getty Realty Corp. |
|
| 4,300 |
|
| 101,179 |
|
|
| Gladstone Commercial Corp. |
|
| 2,400 |
|
| 32,184 |
|
|
| Glimcher Realty Trust |
|
| 12,556 |
|
| 33,901 |
|
|
| Government Properties Income Trust |
|
| 2,700 |
|
| 62,046 |
|
|
| Gramercy Capital Corp. (a) |
|
| 10,702 |
|
| 27,718 |
|
|
| Hatteras Financial Corp. |
|
| 8,300 |
|
| 232,068 |
|
|
| Healthcare Realty Trust, Inc. |
|
| 14,100 |
|
| 302,586 |
|
|
| Hersha Hospitality Trust |
|
| 10,700 |
|
| 33,598 |
|
|
| Highwoods Properties, Inc. |
|
| 17,300 |
|
| 576,955 |
|
|
| Home Properties, Inc. |
|
| 8,120 |
|
| 387,405 |
|
|
| Inland Real Estate Corp. |
|
| 16,900 |
|
| 137,735 |
|
|
| Invesco Mortgage Capital, Inc. |
|
| 2,100 |
|
| 47,796 |
|
|
| Investors Real Estate Trust |
|
| 16,400 |
|
| 147,600 |
|
|
| iStar Financial, Inc. (a)(b) |
|
| 26,000 |
|
| 66,560 |
|
|
| Kilroy Realty Corp. (b) |
|
| 10,200 |
|
| 312,834 |
|
|
| Kite Realty Group Trust |
|
| 9,740 |
|
| 39,642 |
|
|
| LTC Properties, Inc. |
|
| 5,800 |
|
| 155,150 |
|
|
| LaSalle Hotel Properties |
|
| 15,420 |
|
| 327,367 |
|
|
| Lexington Corporate Properties Trust |
|
| 22,643 |
|
| 137,669 |
|
|
| MFA Financial, Inc. |
|
| 67,700 |
|
| 497,595 |
|
|
| Medical Properties Trust, Inc. |
|
| 20,100 |
|
| 201,000 |
|
34
|
|
Master Small Cap Index Series of Quantitative Master Series LLC | |
Schedule of Investments December 31, 2009 | (Percentages shown are based on Net Assets) |
|
|
|
|
|
|
|
|
|
|
Industry |
| Common Stocks |
| Shares |
| Value |
| ||
|
| Mid-America Apartment Communities, Inc. |
|
| 6,529 |
| $ | 315,220 |
|
|
| Mission West Properties, Inc. |
|
| 3,800 |
|
| 27,322 |
|
|
| Monmouth Real Estate Investment Corp., |
|
| 4,900 |
|
| 36,456 |
|
|
| National Health Investors, Inc. |
|
| 6,429 |
|
| 237,809 |
|
|
| National Retail Properties, Inc. |
|
| 19,675 |
|
| 417,504 |
|
|
| NorthStar Realty Finance Corp. (b) |
|
| 14,963 |
|
| 51,323 |
|
|
| Omega Healthcare Investors, Inc. |
|
| 20,400 |
|
| 396,780 |
|
|
| PS Business Parks, Inc. |
|
| 4,208 |
|
| 210,610 |
|
|
| Parkway Properties, Inc. |
|
| 5,504 |
|
| 114,593 |
|
|
| Pennsylvania Real Estate Investment Trust (b) |
|
| 8,932 |
|
| 75,565 |
|
|
| PennyMac Mortgage Investment Trust (a) |
|
| 3,500 |
|
| 60,130 |
|
|
| Post Properties, Inc. |
|
| 11,086 |
|
| 217,286 |
|
|
| Potlatch Corp. |
|
| 9,947 |
|
| 317,110 |
|
|
| RAIT Investment Trust (b) |
|
| 16,210 |
|
| 21,235 |
|
|
| Ramco-Gershenson Properties Trust |
|
| 5,400 |
|
| 51,516 |
|
|
| Redwood Trust, Inc. |
|
| 19,195 |
|
| 277,560 |
|
|
| Resource Capital Corp. |
|
| 5,200 |
|
| 25,584 |
|
|
| Saul Centers, Inc. |
|
| 1,522 |
|
| 49,861 |
|
|
| Sovran Self Storage, Inc. |
|
| 6,280 |
|
| 224,384 |
|
|
| Starwood Property Trust, Inc. |
|
| 10,500 |
|
| 198,345 |
|
|
| Strategic Hotel Capital, Inc. (a)(b) |
|
| 19,850 |
|
| 36,921 |
|
|
| Sun Communities, Inc. |
|
| 4,143 |
|
| 81,824 |
|
|
| Sunstone Hotel Investors, Inc. |
|
| 24,521 |
|
| 217,746 |
|
|
| Tanger Factory Outlet Centers, Inc. |
|
| 9,622 |
|
| 375,162 |
|
|
| Transcontinental Realty Investors, Inc. (a) |
|
| 700 |
|
| 8,337 |
|
|
| U-Store-It Trust |
|
| 18,670 |
|
| 136,664 |
|
|
| UMH Properties, Inc. |
|
| 2,000 |
|
| 16,960 |
|
|
| Universal Health Realty Income Trust |
|
| 2,927 |
|
| 93,752 |
|
|
| Urstadt Biddle Properties, Inc., Class A |
|
| 5,100 |
|
| 77,877 |
|
|
| Walter Investment Management Corp. |
|
| 4,900 |
|
| 70,217 |
|
|
| Washington REIT |
|
| 14,365 |
|
| 395,756 |
|
|
| Winthrop Realty Trust |
|
| 2,637 |
|
| 28,638 |
|
|
|
|
|
|
|
| |||
|
|
|
|
|
|
|
| 14,130,917 |
|
Recreational Vehicles & Boats - 0.3% |
| Brunswick Corp. |
|
| 21,800 |
|
| 277,078 |
|
|
| Drew Industries, Inc. (a) |
|
| 4,700 |
|
| 97,055 |
|
|
| Marine Products Corp. |
|
| 2,331 |
|
| 11,492 |
|
|
| Polaris Industries, Inc. (b) |
|
| 7,500 |
|
| 327,225 |
|
|
| Winnebago Industries, Inc. (a) |
|
| 7,190 |
|
| 87,718 |
|
|
|
|
|
|
|
| |||
|
|
|
|
|
|
|
| 800,568 |
|
Rental & Leasing Services: Consumer - 0.4% |
| Amerco, Inc. (a) |
|
| 2,200 |
|
| 109,384 |
|
|
| Avis Budget Group, Inc. (a) |
|
| 23,800 |
|
| 312,256 |
|
|
| Dollar Thrifty Automotive Group, Inc. (a) |
|
| 6,495 |
|
| 166,337 |
|
|
| Rent-A-Center, Inc. (a) |
|
| 15,200 |
|
| 269,344 |
|
|
|
|
|
|
|
| |||
|
|
|
|
|
|
|
| 857,321 |
|
Restaurants - 1.3% |
| AFC Enterprises, Inc. (a) |
|
| 6,200 |
|
| 50,592 |
|
|
| BJ’s Restaurants, Inc. (a) |
|
| 4,800 |
|
| 90,336 |
|
|
| Benihana, Inc., Class A (a) |
|
| 3,700 |
|
| 14,023 |
|
|
| Bob Evans Farms, Inc. |
|
| 7,680 |
|
| 222,336 |
|
|
| Buffalo Wild Wings, Inc. (a)(b) |
|
| 4,050 |
|
| 163,093 |
|
|
| CEC Entertainment, Inc. (a) |
|
| 5,550 |
|
| 177,156 |
|
35
|
|
Master Small Cap Index Series of Quantitative Master Series LLC | |
Schedule of Investments December 31, 2009 | (Percentages shown are based on Net Assets) |
|
|
|
|
|
|
|
|
|
|
Industry |
| Common Stocks |
| Shares |
| Value |
| ||
|
| CKE Restaurants, Inc. |
|
| 12,800 |
| $ | 108,288 |
|
|
| California Pizza Kitchen, Inc. (a) |
|
| 5,150 |
|
| 69,267 |
|
|
| Caribou Coffee Co., Inc. (a) |
|
| 1,400 |
|
| 10,808 |
|
|
| Carrols Restaurant Group, Inc. (a) |
|
| 2,500 |
|
| 17,675 |
|
|
| The Cheesecake Factory, Inc. (a) |
|
| 13,800 |
|
| 297,942 |
|
|
| Cracker Barrel Old Country Store, Inc. |
|
| 5,100 |
|
| 193,749 |
|
|
| Denny’s Corp. (a)(b) |
|
| 24,000 |
|
| 52,560 |
|
|
| DineEquity, Inc. (a)(b) |
|
| 4,448 |
|
| 108,042 |
|
|
| Domino’s Pizza, Inc. (a) |
|
| 9,650 |
|
| 80,867 |
|
|
| Einstein Noah Restaurant Group, Inc. (a) |
|
| 1,000 |
|
| 9,830 |
|
|
| Frisch’s Restaurants, Inc. |
|
| 600 |
|
| 14,310 |
|
|
| Jack in the Box, Inc. (a) |
|
| 13,536 |
|
| 266,253 |
|
|
| Krispy Kreme Doughnuts, Inc. (a) |
|
| 14,600 |
|
| 43,070 |
|
|
| Landry’s Restaurants, Inc. (a) |
|
| 1,596 |
|
| 33,979 |
|
|
| Luby’s, Inc. (a) |
|
| 4,800 |
|
| 17,664 |
|
|
| McCormick & Schmick’s Seafood Restaurants, |
|
| 3,400 |
|
| 23,664 |
|
|
| O’Charleys, Inc. (a) |
|
| 4,684 |
|
| 30,680 |
|
|
| P.F. Chang’s China Bistro, Inc. (a) |
|
| 5,408 |
|
| 205,017 |
|
|
| Papa John’s International, Inc. (a) |
|
| 4,796 |
|
| 112,035 |
|
|
| Red Robin Gourmet Burgers, Inc. (a) |
|
| 3,200 |
|
| 57,280 |
|
|
| Ruby Tuesday, Inc. (a) |
|
| 15,300 |
|
| 110,160 |
|
|
| Ruth’s Hospitality Group, Inc. (a) |
|
| 5,000 |
|
| 10,450 |
|
|
| Sonic Corp. (a) |
|
| 14,820 |
|
| 149,237 |
|
|
| The Steak N Shake Co. (a) |
|
| 291 |
|
| 94,319 |
|
|
| Texas Roadhouse, Inc., Class A (a) |
|
| 12,300 |
|
| 138,129 |
|
|
|
|
|
|
|
| |||
|
|
|
|
|
|
|
| 2,972,811 |
|
Scientific Instruments: Control & Filter - 0.8% |
| Brady Corp. |
|
| 11,694 |
|
| 350,937 |
|
|
| CIRCOR International, Inc. |
|
| 4,300 |
|
| 108,274 |
|
|
| China Security & Surveillance Technology, |
|
| 9,500 |
|
| 72,580 |
|
|
| ESCO Technologies, Inc. |
|
| 6,532 |
|
| 234,172 |
|
|
| Energy Recovery, Inc. (a)(b) |
|
| 8,900 |
|
| 61,232 |
|
|
| Flanders Corp. (a) |
|
| 3,800 |
|
| 16,948 |
|
|
| The Gorman-Rupp Co. |
|
| 3,597 |
|
| 99,421 |
|
|
| ICx Technologies, Inc. (a) |
|
| 2,800 |
|
| 26,656 |
|
|
| L-1 Identity Solutions, Inc. (a) |
|
| 18,428 |
|
| 138,026 |
|
|
| Mine Safety Appliances Co. |
|
| 6,526 |
|
| 173,135 |
|
|
| PMFG, Inc. (a) |
|
| 3,300 |
|
| 53,493 |
|
|
| RAE Systems, Inc. (a) |
|
| 12,500 |
|
| 13,750 |
|
|
| Robbins & Myers, Inc. |
|
| 6,424 |
|
| 151,092 |
|
|
| Sun Hydraulics, Inc. |
|
| 2,850 |
|
| 74,813 |
|
|
| Watts Water Technologies, Inc., Class A |
|
| 7,236 |
|
| 223,737 |
|
|
| X-Rite, Inc. (a) |
|
| 8,200 |
|
| 17,876 |
|
|
|
|
|
|
|
| |||
|
|
|
|
|
|
|
| 1,816,142 |
|
Scientific Instruments: Electrical - 1.1% |
| A.O. Smith Corp. |
|
| 5,081 |
|
| 220,465 |
|
|
| AZZ, Inc. (a) |
|
| 2,600 |
|
| 85,020 |
|
|
| Advanced Battery Technologies, Inc. (a)(b) |
|
| 11,700 |
|
| 46,800 |
|
|
| American Superconductor Corp. (a)(b) |
|
| 10,200 |
|
| 417,180 |
|
|
| Baldor Electric Co. |
|
| 11,501 |
|
| 323,063 |
|
|
| Broadwind Energy, Inc. (a)(b) |
|
| 7,600 |
|
| 61,484 |
|
36
|
|
Master Small Cap Index Series of Quantitative Master Series LLC | |
Schedule of Investments December 31, 2009 | (Percentages shown are based on Net Assets) |
|
|
|
|
|
|
|
|
|
|
Industry |
| Common Stocks |
| Shares |
| Value |
| ||
|
| China BAK Battery, Inc. (a) |
|
| 9,400 |
| $ | 26,132 |
|
|
| Ener1, Inc. (a)(b) |
|
| 11,600 |
|
| 73,544 |
|
|
| EnerSys (a) |
|
| 9,200 |
|
| 201,204 |
|
|
| Franklin Electric Co., Inc. |
|
| 5,860 |
|
| 170,409 |
|
|
| GrafTech International Ltd. (a) |
|
| 29,444 |
|
| 457,854 |
|
|
| Houston Wire & Cable Co. |
|
| 4,400 |
|
| 52,360 |
|
|
| Littelfuse, Inc. (a) |
|
| 5,460 |
|
| 175,539 |
|
|
| Preformed Line Products Co. |
|
| 500 |
|
| 21,900 |
|
|
| SatCon Technology Corp. (a) |
|
| 14,600 |
|
| 41,172 |
|
|
| Taser International, Inc. (a) |
|
| 15,500 |
|
| 67,890 |
|
|
| Ultralife Batteries, Inc. (a) |
|
| 3,100 |
|
| 13,392 |
|
|
| Valence Technology, Inc. (a) |
|
| 12,800 |
|
| 11,648 |
|
|
|
|
|
|
|
| |||
|
|
|
|
|
|
|
| 2,467,056 |
|
Scientific Instruments: Gauges & Meters - 0.1% |
| Badger Meter, Inc. |
|
| 3,300 |
|
| 131,406 |
|
|
| Faro Technologies, Inc. (a) |
|
| 4,100 |
|
| 87,904 |
|
|
| Measurement Specialties, Inc. (a) |
|
| 3,600 |
|
| 36,180 |
|
|
| Smartheat, Inc. (a) |
|
| 1,600 |
|
| 23,232 |
|
|
| Zygo Corp. (a) |
|
| 3,800 |
|
| 25,574 |
|
|
|
|
|
|
|
| |||
|
|
|
|
|
|
|
| 304,296 |
|
Scientific Instruments: Pollution Control - 0.4% |
| American Ecology Corp. |
|
| 4,700 |
|
| 80,088 |
|
|
| Clean Harbors, Inc. (a) |
|
| 5,100 |
|
| 304,011 |
|
|
| Darling International, Inc. (a) |
|
| 20,900 |
|
| 175,142 |
|
|
| EnergySolutions, Inc. |
|
| 19,100 |
|
| 162,159 |
|
|
| Fuel Tech, Inc. (a) |
|
| 4,700 |
|
| 38,399 |
|
|
| Heritage Crystal Clean, Inc. (a) |
|
| 1,000 |
|
| 10,460 |
|
|
| Met-Pro Corp. |
|
| 3,600 |
|
| 38,232 |
|
|
| Metalico, Inc. (a) |
|
| 6,700 |
|
| 32,964 |
|
|
| Perma-Fix Environmental Services (a) |
|
| 14,000 |
|
| 31,780 |
|
|
| Team, Inc. (a) |
|
| 4,700 |
|
| 88,407 |
|
|
| Waste Services, Inc. (a) |
|
| 3,733 |
|
| 34,008 |
|
|
|
|
|
|
|
| |||
|
|
|
|
|
|
|
| 995,650 |
|
Securities Brokerage & Services - 0.9% |
| BGC Partners, Inc. |
|
| 12,323 |
|
| 56,932 |
|
|
| E*Trade Financial Corp. (a) |
|
| 372,500 |
|
| 651,875 |
|
|
| GFI Group, Inc. |
|
| 16,200 |
|
| 74,034 |
|
|
| Gladstone Investment Corp. |
|
| 5,500 |
|
| 25,080 |
|
|
| International Assets Holding Corp., Inc. (a) |
|
| 3,155 |
|
| 45,874 |
|
|
| KBW, Inc. (a) |
|
| 8,700 |
|
| 238,032 |
|
|
| Knight Capital Group, Inc., Class A (a) |
|
| 21,600 |
|
| 332,640 |
|
|
| LaBranche & Co., Inc. (a) |
|
| 14,600 |
|
| 41,464 |
|
|
| MF Global Ltd. (a) |
|
| 23,600 |
|
| 164,020 |
|
|
| MarketAxess Holdings, Inc. |
|
| 7,900 |
|
| 109,810 |
|
|
| optionsXpress Holdings, Inc. |
|
| 10,600 |
|
| 163,770 |
|
|
| Penson Worldwide, Inc. (a)(b) |
|
| 5,200 |
|
| 47,112 |
|
|
| SWS Group, Inc. |
|
| 6,106 |
|
| 73,883 |
|
|
| TradeStation Group, Inc. (a) |
|
| 8,100 |
|
| 63,909 |
|
|
|
|
|
|
|
| |||
|
|
|
|
|
|
|
| 2,088,435 |
|
Semiconductors & Components - - 2.5% |
| Actel Corp. (a) |
|
| 6,516 |
|
| 77,410 |
|
|
| Advanced Analogic Technologies, Inc. (a) |
|
| 10,700 |
|
| 42,158 |
|
|
| Amkor Technology, Inc. (a) |
|
| 27,400 |
|
| 196,184 |
|
|
| Anadigics, Inc. (a) |
|
| 15,800 |
|
| 66,676 |
|
37
|
|
Master Small Cap Index Series of Quantitative Master Series LLC | |
Schedule of Investments December 31, 2009 | (Percentages shown are based on Net Assets) |
|
|
|
|
|
|
|
|
|
|
Industry |
| Common Stocks |
| Shares |
| Value |
| ||
|
| Applied Micro Circuits Corp. (a) |
|
| 16,400 |
| $ | 122,508 |
|
|
| Atheros Communications, Inc. (a) |
|
| 15,370 |
|
| 526,269 |
|
|
| Cavium Networks, Inc. (a) |
|
| 8,800 |
|
| 209,704 |
|
|
| Ceva, Inc. (a) |
|
| 5,000 |
|
| 64,300 |
|
|
| Cirrus Logic, Inc. (a) |
|
| 14,300 |
|
| 97,526 |
|
|
| DSP Group, Inc. (a) |
|
| 5,783 |
|
| 32,558 |
|
|
| Diodes, Inc. (a) |
|
| 7,812 |
|
| 159,755 |
|
|
| Emcore Corp. (a) |
|
| 18,900 |
|
| 20,223 |
|
|
| Entropic Communications, Inc. (a) |
|
| 14,500 |
|
| 44,515 |
|
|
| Exar Corp. (a) |
|
| 9,227 |
|
| 65,604 |
|
|
| FormFactor, Inc. (a) |
|
| 11,300 |
|
| 245,888 |
|
|
| Hittite Microwave Corp. (a) |
|
| 5,200 |
|
| 211,900 |
|
|
| IXYS Corp. (a) |
|
| 5,737 |
|
| 42,569 |
|
|
| Kopin Corp. (a) |
|
| 16,900 |
|
| 70,642 |
|
|
| Lattice Semiconductor Corp. (a) |
|
| 23,700 |
|
| 63,990 |
|
|
| MIPS Technologies, Inc. (a) |
|
| 11,000 |
|
| 48,070 |
|
|
| Micrel, Inc. |
|
| 11,300 |
|
| 92,660 |
|
|
| Microsemi Corp. (a) |
|
| 19,290 |
|
| 342,397 |
|
|
| Microtune, Inc. (a) |
|
| 12,500 |
|
| 28,250 |
|
|
| Monolithic Power Systems, Inc. (a) |
|
| 8,200 |
|
| 196,554 |
|
|
| NetLogic Microsystems, Inc. (a) |
|
| 4,100 |
|
| 189,666 |
|
|
| Omnivision Technologies, Inc. (a) |
|
| 11,200 |
|
| 162,736 |
|
|
| PLX Technology, Inc. (a) |
|
| 8,400 |
|
| 27,132 |
|
|
| ParkerVision, Inc. (a)(b) |
|
| 7,300 |
|
| 13,359 |
|
|
| Pericom Semiconductor Corp. (a) |
|
| 6,693 |
|
| 77,170 |
|
|
| Power Integrations, Inc. |
|
| 5,400 |
|
| 196,344 |
|
|
| RF Micro Devices, Inc. (a) |
|
| 65,284 |
|
| 311,405 |
|
|
| Rubicon Technology, Inc. (a)(b) |
|
| 3,100 |
|
| 62,961 |
|
|
| Semtech Corp. (a) |
|
| 14,800 |
|
| 251,748 |
|
|
| Sigma Designs, Inc. (a) |
|
| 6,500 |
|
| 69,550 |
|
|
| Silicon Image, Inc. (a) |
|
| 18,676 |
|
| 48,184 |
|
|
| Silicon Storage Technology, Inc. (a) |
|
| 19,858 |
|
| 50,836 |
|
|
| Skyworks Solutions, Inc. (a) |
|
| 40,033 |
|
| 568,068 |
|
|
| Standard Microsystems Corp. (a) |
|
| 5,510 |
|
| 114,498 |
|
|
| Supertex, Inc. (a) |
|
| 2,267 |
|
| 67,557 |
|
|
| Techwell, Inc. (a) |
|
| 3,600 |
|
| 47,520 |
|
|
| Trident Microsystems, Inc. (a) |
|
| 15,800 |
|
| 29,388 |
|
|
| TriQuint Semiconductor, Inc. (a) |
|
| 33,836 |
|
| 203,016 |
|
|
| Virage Logic Corp. (a) |
|
| 4,800 |
|
| 26,400 |
|
|
| Volterra Semiconductor Corp. (a) |
|
| 5,000 |
|
| 95,600 |
|
|
| White Electronic Designs Corp. (a) |
|
| 5,300 |
|
| 24,751 |
|
|
| Zoran Corp. (a) |
|
| 11,408 |
|
| 126,058 |
|
|
|
|
|
|
|
| |||
|
|
|
|
|
|
|
| 5,832,257 |
|
Shipping - 0.6% |
| American Commercial Lines, Inc. (a) |
|
| 2,250 |
|
| 41,242 |
|
|
| DHT Maritime, Inc. |
|
| 10,100 |
|
| 37,168 |
|
|
| Eagle Bulk Shipping, Inc. (a)(b) |
|
| 13,700 |
|
| 67,815 |
|
|
| Genco Shipping & Trading Ltd. (b) |
|
| 5,900 |
|
| 132,042 |
|
|
| General Maritime Corp. |
|
| 12,140 |
|
| 84,859 |
|
|
| Golar LNG Ltd. |
|
| 8,600 |
|
| 110,252 |
|
|
| Gulfmark Offshore, Inc. (a) |
|
| 5,500 |
|
| 155,705 |
|
38
|
|
Master Small Cap Index Series of Quantitative Master Series LLC | |
Schedule of Investments December 31, 2009 | (Percentages shown are based on Net Assets) |
|
|
|
|
|
|
|
|
|
|
Industry |
| Common Stocks |
| Shares |
| Value |
| ||
|
| Horizon Lines, Inc., Class A |
|
| 7,500 |
| $ | 41,775 |
|
|
| International Shipholding Corp. |
|
| 1,400 |
|
| 43,498 |
|
|
| Knightsbridge Tankers Ltd. |
|
| 4,200 |
|
| 55,692 |
|
|
| Nordic American Tanker Shipping Ltd. (b) |
|
| 10,500 |
|
| 315,000 |
|
|
| Ship Finance International Ltd. |
|
| 11,200 |
|
| 152,656 |
|
|
| TBS International Ltd. (a) |
|
| 2,800 |
|
| 20,580 |
|
|
| Teekay Tankers Ltd., Class A |
|
| 1,600 |
|
| 13,648 |
|
|
| Ultrapetrol Bahamas Ltd. (a) |
|
| 5,400 |
|
| 25,704 |
|
|
|
|
|
|
|
| |||
|
|
|
|
|
|
|
| 1,297,636 |
|
Specialty Retail - 3.2% |
| 1-800-FLOWERS.COM, Inc., Class A (a) |
|
| 6,524 |
|
| 17,289 |
|
|
| America’s Car Mart, Inc. (a) |
|
| 2,300 |
|
| 60,559 |
|
|
| AnnTaylor Stores Corp. (a) |
|
| 13,500 |
|
| 184,140 |
|
|
| Asbury Automotive Group, Inc. (a) |
|
| 7,900 |
|
| 91,087 |
|
|
| bebe Stores, Inc. |
|
| 5,500 |
|
| 34,485 |
|
|
| Big 5 Sporting Goods Corp. |
|
| 5,500 |
|
| 94,490 |
|
|
| Blue Nile, Inc. (a) |
|
| 3,200 |
|
| 202,656 |
|
|
| Books-A-Million, Inc. |
|
| 1,500 |
|
| 10,080 |
|
|
| Borders Group, Inc. (a) |
|
| 11,200 |
|
| 13,216 |
|
|
| Brown Shoe Co., Inc. |
|
| 10,527 |
|
| 103,901 |
|
|
| The Buckle, Inc. (b) |
|
| 6,009 |
|
| 175,944 |
|
|
| Build-A-Bear Workshop, Inc. (a) |
|
| 4,100 |
|
| 20,049 |
|
|
| Cabela’s, Inc., Class A (a)(b) |
|
| 8,900 |
|
| 126,914 |
|
|
| The Cato Corp., Class A |
|
| 6,295 |
|
| 126,278 |
|
|
| Charming Shoppes, Inc. (a) |
|
| 28,840 |
|
| 186,595 |
|
|
| The Children’s Place Retail Stores, Inc. (a) |
|
| 4,985 |
|
| 164,555 |
|
|
| Christopher & Banks Corp. |
|
| 8,928 |
|
| 68,031 |
|
|
| Citi Trends, Inc. (a) |
|
| 3,700 |
|
| 102,194 |
|
|
| Coldwater Creek, Inc. (a) |
|
| 14,300 |
|
| 63,778 |
|
|
| Collective Brands, Inc. (a) |
|
| 14,900 |
|
| 339,273 |
|
|
| Conn’s, Inc. (a)(b) |
|
| 2,400 |
|
| 14,016 |
|
|
| DSW, Inc., Class A (a) |
|
| 2,600 |
|
| 67,288 |
|
|
| Destination Maternity Corp. (a) |
|
| 1,400 |
|
| 26,600 |
|
|
| Dress Barn, Inc. (a) |
|
| 13,982 |
|
| 322,984 |
|
|
| The Finish Line, Inc., Class A |
|
| 10,580 |
|
| 132,779 |
|
|
| Gander Mountain Co. (a) |
|
| 1,000 |
|
| 5,100 |
|
|
| Genesco, Inc. (a) |
|
| 5,238 |
|
| 143,835 |
|
|
| Group 1 Automotive, Inc. |
|
| 5,432 |
|
| 153,997 |
|
|
| Gymboree Corp. (a) |
|
| 6,758 |
|
| 293,905 |
|
|
| Haverty Furniture Cos., Inc. |
|
| 4,436 |
|
| 60,906 |
|
|
| hhgregg, Inc. (a) |
|
| 2,800 |
|
| 61,684 |
|
|
| Hibbett Sports, Inc. (a) |
|
| 6,275 |
|
| 137,987 |
|
|
| Hot Topic, Inc. (a) |
|
| 9,181 |
|
| 58,391 |
|
|
| Jo-Ann Stores, Inc. (a) |
|
| 6,105 |
|
| 221,245 |
|
|
| Jos. A. Bank Clothiers, Inc. (a) |
|
| 4,133 |
|
| 174,371 |
|
|
| Lithia Motors, Inc., Class A (b) |
|
| 4,500 |
|
| 36,990 |
|
|
| Men’s Wearhouse, Inc. |
|
| 12,900 |
|
| 271,674 |
|
|
| Midas, Inc. (a) |
|
| 3,542 |
|
| 29,930 |
|
|
| Monro Muffler, Inc. |
|
| 3,650 |
|
| 122,056 |
|
|
| New York & Co. (a) |
|
| 5,800 |
|
| 24,882 |
|
|
| Nu Skin Enterprises, Inc., Class A |
|
| 11,426 |
|
| 307,017 |
|
39
|
|
Master Small Cap Index Series of Quantitative Master Series LLC |
|
Schedule of Investments December 31, 2009 | (Percentages shown are based on Net Assets) |
|
|
|
|
|
|
|
|
|
|
Industry |
| Common Stocks |
| Shares |
| Value |
| ||
|
| OfficeMax, Inc. (a) |
|
| 18,800 |
| $ | 238,572 |
|
|
| Pacific Sunwear of California, Inc. (a) |
|
| 16,600 |
|
| 66,068 |
|
|
| The Pep Boys - Manny, Moe & Jack |
|
| 11,966 |
|
| 101,232 |
|
|
| Pier 1 Imports, Inc. (a) |
|
| 26,299 |
|
| 133,862 |
|
|
| Regis Corp. |
|
| 13,100 |
|
| 203,967 |
|
|
| Retail Ventures, Inc. (a) |
|
| 6,200 |
|
| 55,118 |
|
|
| Rue21, Inc. (a) |
|
| 1,300 |
|
| 36,517 |
|
|
| Sally Beauty Co., Inc. (a) |
|
| 23,500 |
|
| 179,775 |
|
|
| Shoe Carnival, Inc. (a) |
|
| 2,100 |
|
| 42,987 |
|
|
| Shutterfly, Inc. (a) |
|
| 4,400 |
|
| 78,364 |
|
|
| Sonic Automotive, Inc. |
|
| 6,900 |
|
| 71,691 |
|
|
| Stage Stores, Inc. |
|
| 9,550 |
|
| 118,038 |
|
|
| Stamps.com, Inc. (a) |
|
| 3,403 |
|
| 30,627 |
|
|
| Stein Mart, Inc. (a) |
|
| 6,324 |
|
| 67,414 |
|
|
| Syms Corp. (a) |
|
| 1,600 |
|
| 11,568 |
|
|
| Systemax, Inc. |
|
| 2,400 |
|
| 37,704 |
|
|
| The Talbots, Inc. (b) |
|
| 6,100 |
|
| 54,351 |
|
|
| Ticketmaster Entertainment (a) |
|
| 9,200 |
|
| 112,424 |
|
|
| Tractor Supply Co. (a) |
|
| 8,700 |
|
| 460,752 |
|
|
| Ulta Salon Cosmetics & Fragrance, Inc. (a) |
|
| 6,900 |
|
| 125,304 |
|
|
| Vitacost.com, Inc. (a) |
|
| 1,900 |
|
| 19,798 |
|
|
| Vitamin Shoppe, Inc. (a) |
|
| 1,700 |
|
| 37,808 |
|
|
| The Wet Seal, Inc., Class A (a) |
|
| 23,600 |
|
| 81,420 |
|
|
| Zale Corp. (a)(b) |
|
| 5,000 |
|
| 13,600 |
|
|
| Zumiez, Inc. (a) |
|
| 4,900 |
|
| 62,328 |
|
|
|
|
|
|
|
| |||
|
|
|
|
|
|
|
| 7,294,440 |
|
Steel - 0.1% |
| China Precision Steel, Inc. (a)(b) |
|
| 9,000 |
|
| 18,450 |
|
|
| General Steel Holdings, Inc. (a) |
|
| 3,300 |
|
| 14,553 |
|
|
| Olympic Steel, Inc. |
|
| 1,900 |
|
| 61,902 |
|
|
| Sutor Technology Group Ltd. (a) |
|
| 1,900 |
|
| 5,054 |
|
|
| Universal Stainless & Alloy Products, Inc. (a) |
|
| 1,700 |
|
| 32,062 |
|
|
|
|
|
|
|
| |||
|
|
|
|
|
|
|
| 132,021 |
|
Sugar - 0.0% |
| Imperial Sugar Co., New Shares |
|
| 2,500 |
|
| 43,600 |
|
Synthetic Fibers & Chemicals - 0.0% |
| Zoltek Cos., Inc. (a)(b) |
|
| 6,900 |
|
| 65,550 |
|
Technology: Miscellaneous - 0.3% |
| Benchmark Electronics, Inc. (a) |
|
| 16,329 |
|
| 308,781 |
|
|
| CTS Corp. |
|
| 8,368 |
|
| 80,500 |
|
|
| LaBarge, Inc. (a) |
|
| 3,000 |
|
| 36,150 |
|
|
| Plexus Corp. (a) |
|
| 9,898 |
|
| 282,093 |
|
|
| Vocus, Inc. (a) |
|
| 4,100 |
|
| 73,800 |
|
|
|
|
|
|
|
| |||
|
|
|
|
|
|
|
| 781,324 |
|
Telecommunications Equipment - 0.4% |
| ADC Telecommunications, Inc. (a) |
|
| 22,000 |
|
| 136,620 |
|
|
| Applied Signal Technology, Inc. |
|
| 2,600 |
|
| 50,154 |
|
|
| Arris Group, Inc. (a) |
|
| 30,500 |
|
| 348,615 |
|
|
| Brightpoint, Inc. (a) |
|
| 12,530 |
|
| 92,095 |
|
|
| Cogo Group, Inc. (a) |
|
| 5,800 |
|
| 42,746 |
|
|
| Communications System, Inc. |
|
| 1,300 |
|
| 16,172 |
|
|
| Mastec, Inc. (a) |
|
| 12,900 |
|
| 161,250 |
|
|
| OpNext, Inc. (a) |
|
| 6,700 |
|
| 12,730 |
|
|
| Powerwave Technologies, Inc. (a) |
|
| 30,977 |
|
| 39,031 |
|
|
| Symmetricom, Inc. (a) |
|
| 11,300 |
|
| 58,760 |
|
40
|
|
Master Small Cap Index Series of Quantitative Master Series LLC |
|
Schedule of Investments December 31, 2009 | (Percentages shown are based on Net Assets) |
|
|
|
|
|
|
|
|
|
|
Industry |
| Common Stocks |
| Shares |
| Value |
| ||
|
| UTStarcom, Inc. (a)(b) |
|
| 27,000 |
| $ | 59,130 |
|
|
|
|
|
|
|
| |||
|
|
|
|
|
|
|
| 1,017,303 |
|
Textile Products - 0.1% |
| Interface, Inc., Class A |
|
| 12,621 |
|
| 104,881 |
|
|
| Unifi, Inc. (a) |
|
| 10,800 |
|
| 41,904 |
|
|
|
|
|
|
|
| |||
|
|
|
|
|
|
|
| 146,785 |
|
Textiles Apparel & Shoes - 2.1% |
| American Apparel, Inc. (a) |
|
| 8,500 |
|
| 26,350 |
|
|
| Carter’s, Inc. (a) |
|
| 13,200 |
|
| 346,500 |
|
|
| Cherokee, Inc. |
|
| 1,900 |
|
| 33,858 |
|
|
| Columbia Sportswear Co. (b) |
|
| 2,800 |
|
| 109,312 |
|
|
| Crocs, Inc. (a) |
|
| 20,900 |
|
| 120,175 |
|
|
| Deckers Outdoor Corp. (a) |
|
| 3,000 |
|
| 305,160 |
|
|
| FGX International Holdings Ltd. (a) |
|
| 3,400 |
|
| 66,606 |
|
|
| G-III Apparel Group, Ltd. (a) |
|
| 3,300 |
|
| 71,511 |
|
|
| Iconix Brand Group, Inc. (a) |
|
| 17,300 |
|
| 218,845 |
|
|
| J. Crew Group, Inc. (a) |
|
| 12,070 |
|
| 540,012 |
|
|
| Jones Apparel Group, Inc. |
|
| 20,900 |
|
| 335,654 |
|
|
| K-Swiss, Inc., Class A |
|
| 6,496 |
|
| 64,570 |
|
|
| Kenneth Cole Productions, Inc., Class A |
|
| 1,092 |
|
| 10,538 |
|
|
| Liz Claiborne, Inc. (a)(b) |
|
| 24,100 |
|
| 135,683 |
|
|
| lululemon athletica, Inc. (a) |
|
| 10,000 |
|
| 301,000 |
|
|
| Maidenform Brands, Inc. (a) |
|
| 4,400 |
|
| 73,436 |
|
|
| Oxford Industries, Inc. |
|
| 3,342 |
|
| 69,113 |
|
|
| Perry Ellis International, Inc. (a) |
|
| 1,850 |
|
| 27,861 |
|
|
| Quiksilver, Inc. (a) |
|
| 32,000 |
|
| 64,640 |
|
|
| Skechers U.S.A., Inc., Class A (a) |
|
| 7,655 |
|
| 225,134 |
|
|
| Steven Madden Ltd. (a) |
|
| 3,568 |
|
| 147,144 |
|
|
| Timberland Co., Class A (a) |
|
| 10,700 |
|
| 191,851 |
|
|
| True Religion Apparel, Inc. (a) |
|
| 6,200 |
|
| 114,638 |
|
|
| Under Armour, Inc., Class A (a) |
|
| 8,300 |
|
| 226,341 |
|
|
| Volcom, Inc. (a) |
|
| 4,500 |
|
| 75,330 |
|
|
| The Warnaco Group, Inc. (a) |
|
| 10,700 |
|
| 451,433 |
|
|
| Weyco Group, Inc. |
|
| 1,600 |
|
| 37,824 |
|
|
| Wolverine World Wide, Inc. |
|
| 12,008 |
|
| 326,858 |
|
|
|
|
|
|
|
| |||
|
|
|
|
|
|
|
| 4,717,377 |
|
Tobacco - 0.2% |
| Alliance One International, Inc. (a) |
|
| 19,955 |
|
| 97,380 |
|
|
| Star Scientific, Inc. (a) |
|
| 18,100 |
|
| 12,670 |
|
|
| Universal Corp. |
|
| 5,756 |
|
| 262,531 |
|
|
| Vector Group Ltd. |
|
| 9,825 |
|
| 137,550 |
|
|
|
|
|
|
|
| |||
|
|
|
|
|
|
|
| 510,131 |
|
Toys - 0.1% |
| Jakks Pacific, Inc. (a) |
|
| 5,930 |
|
| 71,872 |
|
|
| Leapfrog Enterprises, Inc. (a) |
|
| 8,446 |
|
| 33,024 |
|
|
| RC2 Corp. (a) |
|
| 4,813 |
|
| 70,992 |
|
|
|
|
|
|
|
| |||
|
|
|
|
|
|
|
| 175,888 |
|
Transportation Miscellaneous - 0.2% |
| Dynamex, Inc. (a) |
|
| 2,100 |
|
| 38,010 |
|
|
| Echo Global Logistics, Inc. (a) |
|
| 500 |
|
| 6,345 |
|
|
| HUB Group, Inc., Class A (a) |
|
| 9,200 |
|
| 246,836 |
|
|
| Odyssey Marine Exploration, Inc. (a) |
|
| 12,900 |
|
| 18,189 |
|
|
| Pacer International, Inc. |
|
| 6,900 |
|
| 21,804 |
|
|
| Textainer Group Holdings Ltd. |
|
| 2,166 |
|
| 36,605 |
|
41
|
|
Master Small Cap Index Series of Quantitative Master Series LLC | |
Schedule of Investments December 31, 2009 | (Percentages shown are based on Net Assets) |
|
|
|
|
|
|
|
|
|
|
Industry |
| Common Stocks |
| Shares |
| Value |
| ||
|
| Todd Shipyards Corp. |
|
| 1,700 |
| $ | 28,492 |
|
|
|
|
|
|
|
| |||
|
|
|
|
|
|
|
| 396,281 |
|
Truckers - 0.6% |
| Arkansas Best Corp. |
|
| 5,741 |
|
| 168,958 |
|
|
| Celadon Group, Inc. (a) |
|
| 5,500 |
|
| 59,675 |
|
|
| Forward Air Corp. |
|
| 7,232 |
|
| 181,162 |
|
|
| Heartland Express, Inc. |
|
| 12,273 |
|
| 187,409 |
|
|
| Knight Transportation, Inc. |
|
| 14,262 |
|
| 275,114 |
|
|
| Marten Transport Ltd. (a) |
|
| 3,850 |
|
| 69,107 |
|
|
| Old Dominion Freight Line, Inc. (a) |
|
| 6,325 |
|
| 194,178 |
|
|
| Patriot Transportation Holding, Inc. (a) |
|
| 300 |
|
| 28,338 |
|
|
| Saia, Inc. (a) |
|
| 3,281 |
|
| 48,624 |
|
|
| USA Truck, Inc. (a) |
|
| 2,200 |
|
| 27,544 |
|
|
| Universal Truckload Services, Inc. |
|
| 1,321 |
|
| 23,910 |
|
|
| Werner Enterprises, Inc. |
|
| 9,600 |
|
| 189,984 |
|
|
| YRC Worldwide, Inc. (a)(b) |
|
| 6,700 |
|
| 5,627 |
|
|
|
|
|
|
|
| |||
|
|
|
|
|
|
|
| 1,459,630 |
|
Utilities: Electrical - 1.7% |
| Allete, Inc. |
|
| 6,966 |
|
| 227,649 |
|
|
| Avista Corp. |
|
| 13,275 |
|
| 286,607 |
|
|
| Black Hills Corp. |
|
| 9,300 |
|
| 247,659 |
|
|
| CH Energy Group, Inc. |
|
| 3,989 |
|
| 169,612 |
|
|
| Central Vermont Public Service Corp. |
|
| 2,800 |
|
| 58,240 |
|
|
| Cleco Corp. |
|
| 14,667 |
|
| 400,849 |
|
|
| El Paso Electric Co. (a) |
|
| 10,908 |
|
| 221,214 |
|
|
| The Empire District Electric Co. |
|
| 7,968 |
|
| 149,241 |
|
|
| IDACORP, Inc. |
|
| 11,500 |
|
| 367,425 |
|
|
| MGE Energy, Inc. |
|
| 5,745 |
|
| 205,326 |
|
|
| NorthWestern Corp. |
|
| 8,200 |
|
| 213,364 |
|
|
| Otter Tail Corp. |
|
| 8,986 |
|
| 222,853 |
|
|
| PNM Resources, Inc. |
|
| 19,800 |
|
| 250,470 |
|
|
| Pike Electric Corp. (a) |
|
| 4,100 |
|
| 38,048 |
|
|
| Portland General Electric Co. |
|
| 17,400 |
|
| 355,134 |
|
|
| UIL Holdings Corp. |
|
| 7,167 |
|
| 201,249 |
|
|
| Unisource Energy Corp. |
|
| 8,183 |
|
| 263,411 |
|
|
| Unitil Corp. |
|
| 2,900 |
|
| 66,642 |
|
|
|
|
|
|
|
| |||
|
|
|
|
|
|
|
| 3,944,993 |
|
Utilities: Gas Distributors - 1.2% |
| Chesapeake Utilities Corp. |
|
| 2,267 |
|
| 72,657 |
|
|
| The Laclede Group, Inc. |
|
| 4,948 |
|
| 167,094 |
|
|
| New Jersey Resources Corp. |
|
| 9,761 |
|
| 365,061 |
|
|
| Nicor, Inc. (c) |
|
| 10,600 |
|
| 446,260 |
|
|
| Northwest Natural Gas Co. |
|
| 6,399 |
|
| 288,211 |
|
|
| Piedmont Natural Gas Co. |
|
| 18,000 |
|
| 481,500 |
|
|
| South Jersey Industries, Inc. |
|
| 6,832 |
|
| 260,846 |
|
|
| Southwest Gas Corp. |
|
| 10,890 |
|
| 310,692 |
|
|
| WGL Holdings, Inc. |
|
| 11,700 |
|
| 392,418 |
|
|
|
|
|
|
|
| |||
|
|
|
|
|
|
|
| 2,784,739 |
|
Utilities: Telecommunications - 0.9% |
| Alaska Communications Systems Group, Inc. |
|
| 11,000 |
|
| 87,780 |
|
|
| Atlantic Tele-Network, Inc. |
|
| 2,200 |
|
| 121,022 |
|
|
| Cbeyond Communications, Inc. (a) |
|
| 5,700 |
|
| 89,775 |
|
|
| Cincinnati Bell, Inc. (a) |
|
| 51,600 |
|
| 178,020 |
|
|
| Cogent Communications Group, Inc. (a) |
|
| 11,100 |
|
| 109,446 |
|
42
|
|
Master Small Cap Index Series of Quantitative Master Series LLC | |
Schedule of Investments December 31, 2009 | (Percentages shown are based on Net Assets) |
|
|
|
|
|
|
|
|
|
|
Industry |
| Common Stocks |
| Shares |
| Value |
| ||
|
| Consolidated Communications Holdings, Inc. |
|
| 5,835 |
| $ | 102,112 |
|
|
| General Communication, Inc., Class A (a) |
|
| 11,139 |
|
| 71,067 |
|
|
| Global Crossing Ltd. (a) |
|
| 7,300 |
|
| 104,025 |
|
|
| HickoryTech Corp. |
|
| 3,000 |
|
| 26,490 |
|
|
| Incontact, Inc. (a) |
|
| 6,100 |
|
| 17,873 |
|
|
| Iowa Telecommunications Services, Inc. |
|
| 7,100 |
|
| 118,996 |
|
|
| j2 Global Communications, Inc. (a) |
|
| 10,500 |
|
| 213,675 |
|
|
| NTELOS Holdings Corp. |
|
| 7,500 |
|
| 133,650 |
|
|
| Neutral Tandem, Inc. (a) |
|
| 7,300 |
|
| 166,075 |
|
|
| PAETEC Holding Corp. (a) |
|
| 30,520 |
|
| 126,658 |
|
|
| Premiere Global Services, Inc. (a) |
|
| 15,200 |
|
| 125,400 |
|
|
| RCN Corp. (a) |
|
| 9,100 |
|
| 98,735 |
|
|
| Shenandoah Telecom Co. |
|
| 5,900 |
|
| 120,065 |
|
|
| SureWest Communications (a) |
|
| 3,900 |
|
| 38,844 |
|
|
| USA Mobility, Inc. |
|
| 4,220 |
|
| 46,462 |
|
|
|
|
|
|
|
| |||
|
|
|
|
|
|
|
| 2,096,170 |
|
Utilities: Water - 0.3% |
| American States Water Co. |
|
| 4,485 |
|
| 158,814 |
|
|
| Artesian Resources Corp., Class A |
|
| 1,900 |
|
| 34,789 |
|
|
| California Water Service Group |
|
| 4,796 |
|
| 176,589 |
|
|
| Connecticut Water Service, Inc. |
|
| 2,100 |
|
| 52,017 |
|
|
| Consolidated Water Co., Inc. |
|
| 3,600 |
|
| 51,444 |
|
|
| Middlesex Water Co. |
|
| 3,300 |
|
| 58,179 |
|
|
| Pennichuck Corp. |
|
| 1,000 |
|
| 21,130 |
|
|
| SJW Corp. |
|
| 3,248 |
|
| 73,307 |
|
|
| Southwest Water Co. |
|
| 6,083 |
|
| 35,829 |
|
|
| York Water Co. |
|
| 3,200 |
|
| 46,432 |
|
|
|
|
|
|
|
| |||
|
|
|
|
|
|
|
| 708,530 |
|
|
| Total Common Stocks - 97.6% |
|
|
|
|
| 224,138,747 |
|
|
| Investment Companies |
|
|
|
|
|
|
|
|
| BlackRock Kelso Capital Corp. (d) |
|
| 3,100 |
|
| 26,412 |
|
|
| Gladstone Capital Corp. |
|
| 5,200 |
|
| 40,040 |
|
|
| Hercules Technology Growth Capital, Inc. |
|
| 8,562 |
|
| 88,959 |
|
|
| Kayne Anderson Energy Development Co. |
|
| 2,500 |
|
| 36,375 |
|
|
| Pennantpark Investment Corp. |
|
| 5,300 |
|
| 47,276 |
|
|
| Prospect Capital Corp. (b) |
|
| 14,400 |
|
| 170,064 |
|
|
| Total Investment Companies - 0.2% |
|
|
|
|
| 409,126 |
|
|
| Rights |
|
|
|
|
|
|
|
Banks: Savings, Thrift & Mortgage Lending - 0.0% |
| Flagstar Bancorp, Inc. (Expires 1/25/10) |
|
| 25,125 |
|
| — |
|
Building Materials - 0.0% |
| Builders FirstSource, Inc. (Expires 1/14/10) |
|
| 6,444 |
|
| 1,577 |
|
|
| Total Rights - 0.0% |
|
|
|
|
| 1,577 |
|
|
| Warrants (e) |
|
|
|
|
|
|
|
Alternative Energy - 0.0% |
| GreenHunter Energy, Inc. (Expires 8/27/11) |
|
| 180 |
|
| — |
|
Communications Technology - 0.0% |
| Lantronix, Inc. (Expires 2/09/11) (a)(f) |
|
| 138 |
|
| — |
|
|
| Total Warrants - 0.0% |
|
|
|
|
| — |
|
|
| Total Long-Term Investments |
|
|
|
|
| 224,549,450 |
|
43
|
|
Master Small Cap Index Series of Quantitative Master Series LLC | |
Schedule of Investments December 31, 2009 | (Percentages shown are based on Net Assets) |
|
|
|
|
|
|
|
|
|
|
|
| Short-Term Securities |
| Shares |
| Value |
| ||
|
| BlackRock Liquidity Funds, TempFund, Institutional Class, 0.11% (d)(g) |
|
| 9,452,117 |
| $ | 9,452,117 |
|
| |||||||||
|
|
|
| Beneficial |
|
|
|
| |
|
| BlackRock Liquidity Series, LLC Money Market Series, 0.29% (d)(g)(h) |
| $ | 17,387 |
| $ | 17,386,620 |
|
|
| Total Short-Term Securities |
|
|
|
|
| 26,838,737 |
|
|
| Total Investments |
|
|
|
|
| 251,388,187 |
|
|
| Liabilities in Excess of Other Assets - (9.5)% |
|
|
|
|
| (21,751,491 | ) |
|
|
|
|
|
|
| |||
|
| Net Assets - 100.0% |
|
|
|
| $ | 229,636,696 |
|
|
|
|
|
|
|
| |||
|
|
* | The cost and unrealized appreciation (depreciation) of investments as December 31, 2009, as computed for federal income tax purposes, were as follows: |
|
|
|
|
|
Aggregate cost |
| $ | 229,753,769 |
|
|
| |||
Gross unrealized appreciation |
| $ | 48,267,727 |
|
Gross unrealized depreciation |
|
| (26,633,309 | ) |
|
| |||
Net unrealized appreciation |
| $ | 21,634,418 |
|
|
|
|
|
(a) | Non-income producing security. |
|
|
(b) | Security, or a portion of security, is on loan. |
|
|
(c) | All or a portion of security has been pledged as collateral in connection with open financial futures contracts. (d) Investments in companies considered to be an affiliate of the Series, for purposes of Section 2(a)(3) of the Investment Company Act of 1940, were as follows: |
|
|
|
|
|
|
|
|
|
|
|
|
|
|
Affiliate |
| Purchase Cost |
| Sale Cost |
| Realized Loss |
| Income |
| ||||
Anthracite Capital, Inc. |
| $ | 16,102 |
| $ | 239,668 |
| $ | (221,996 | ) |
| — |
|
BlackRock Kelso Capital Corp. |
| $ | 11,712 |
| $ | 42,960 |
| $ | (13,276 | ) | $ | 992 |
|
BlackRock Liquidity Funds, TempFund, Institutional Class |
| $ | 9,452,117 | 1 |
| — |
|
| — |
| $ | 26,184 |
|
BlackRock Liquidity Series, LLC Cash Sweep Series |
|
| — |
| $ | 33,514,609 | 2 |
| — |
| $ | 37,173 |
|
BlackRock Liquidity Series, LLC Money Market Series |
|
| — |
| $ | 7,257,582 | 2 |
| — |
| $ | 451,286 |
|
|
|
|
| 1 | Represents net purchase cost. |
|
|
|
| 2 | Represents net sale cost. |
|
|
|
(e) | Warrants entitle the Series to purchase a predetermined number of shares of common stock and are non-income producing. The purchase price and number of shares are subject to adjustment under certain conditions until the expiration date. | |
|
| |
(f) | Restricted security as to resale, representing 0.0% of net assets was as follows: | |
|
|
|
|
|
|
|
|
|
|
|
Issue |
| Acquisition Date |
| Cost |
| Value |
| |||
GreenHunter Energy, Inc. |
|
| 6/27/08 |
| $ | — |
| $ | — |
|
|
|
(g) | Represents the current yield as of report date. |
|
|
(h) | Security was purchased with the cash collateral from securities loans. |
|
|
• | For Series compliance purposes, the Series’ industry classifications refer to any one or more of the industry sub-classifications used by one or more widely recognized market indexes or ratings group indexes, and/or as defined by Series management. This definition may not apply for purposes of this report, which may combine industry sub-classifications for reporting ease. |
44
|
Master Small Cap Index Series of Quantitative Master Series LLC |
Schedule of Investments December 31, 2009 |
|
|
|
• | Financial futures contracts purchased as of December 31, 2009 were as follows: |
|
|
|
|
|
|
|
|
|
|
|
|
Contracts |
| Issue |
| Expiration Date |
| Notional Value |
| Unrealized |
| ||
72 |
| Russell 2000 MINI |
| March 2010 |
| $ | 4,403,447 |
| $ | 88,573 |
|
|
|
|
|
• | Fair Value Measurements - Various inputs are used in determining the fair value of investments, which are as follows: | ||
|
| ||
|
| • | Level 1 - price quotations in active markets/exchanges for identical asset and liabilities |
|
|
|
|
|
| • | Level 2 - other observable inputs (including, but not limited to: quoted prices for similar assets or liabilities in markets that are active, quoted prices for identical or similar assets or liabilities in markets that are not active, inputs other than quoted prices that are observable for the assets or liabilities (such as interest rates, yield curves, volatilities, prepayment speeds, loss severities, credit risks and default rates) or other market-corroborated inputs) |
|
|
|
|
|
| • | Level 3 - unobservable inputs based on the best information available in the circumstances, to the extent observable inputs are not available (including the Series’ own assumptions used in determining the fair value of investments) |
|
|
|
|
| The inputs or methodology used for valuing securities are not necessarily an indication of the risk associated with investing in those securities. For information about the Series’ policy regarding valuation of investments and other significant accounting policies, please refer to Note 1 of the Notes to Financial Statements. | ||
|
| ||
| The following table summarizes the inputs used as of December 31, 2009 in determining the fair valuation of the Series’ investments: | ||
|
|
|
|
|
Valuation Inputs |
| Investments in |
| |
|
| Assets |
| |
|
| |||
Level 1 - Long-Term Investments1 |
| $ | 224,549,450 |
|
Short-Term Securities |
|
| 9,452,117 |
|
|
| |||
Total Level 1 |
|
| 234,001,567 |
|
|
| |||
Level 2 - Short-Term Securities |
|
| 17,386,620 |
|
Level 3 |
|
| — |
|
Total |
| $ | 251,388,187 |
|
|
| |||
|
|
1 | See above Schedule of Investments for values in each industry. |
|
|
|
|
|
Valuation Inputs |
| Other Financial |
| |
|
| Assets |
| |
|
| |||
Level 1 |
| $ | 88,573 |
|
Level 2 |
|
| — |
|
Level 3 |
|
| — |
|
Total |
| $ | 88,573 |
|
|
| |||
|
|
2 | Other financial instruments are financial futures contracts which are shown at the unrealized appreciation/depreciation on the instrument. |
45
REPORT OF INDEPENDENT REGISTERED PUBLIC ACCOUNTING FIRM ON DETAILED
SCHEDULE OF INVESTMENTS
To the Investors and Board of Directors of
Quantitative Master Series LLC:
We have audited, in accordance with the standards of the Public Company Accounting Oversight Board (United States), the financial statements of Master Small Cap Index Series, one of the portfolios constituting Quantitative Master Series LLC, (the “Master LLC”) as of December 31, 2009, and for the year then ended and have issued our report thereon dated February 24, 2010 which report and financial statements are included in Item 1 of this Certified Shareholder Report on Form N-CSR. Our audit also included the Master LLC’s Schedule of Investments (the “Schedule”) as of December 31, 2009 appearing in Item 6 of this Form N-CSR. This Schedule is the responsibility of the Master LLC’s management. Our responsibility is to express an opinion based on our audit. In our opinion, the Schedule referred to above, when considered in relation to the basic financial statements taken as a whole of the Master LLC referred to above, presents fairly, in all material respects, the information set forth therein.
DELOITTE & TOUCHE LLP
February 24, 2010
Princeton, New Jersey
46
| (b) Not Applicable due to no such divestments during the semi-annual period covered since the previous Form N-CSR filing. |
Item 7 – | Disclosure of Proxy Voting Policies and Procedures for Closed-End Management Investment Companies – Not Applicable |
Item 8 – | Portfolio Managers of Closed-End Management Investment Companies – Not Applicable |
Item 9 – | Purchases of Equity Securities by Closed-End Management Investment Company and Affiliated Purchasers – Not Applicable |
Item 10 – | Submission of Matters to a Vote of Security Holders – The registrant’s Nominating and Governance Committee will consider nominees to the board of directors recommended by shareholders when a vacancy becomes available. Shareholders who wish to recommend a nominee should send nominations which include biographical information and set forth the qualifications of the proposed nominee to the registrant’s Secretary. There have been no material changes to these procedures. |
Item 11 – | Controls and Procedures |
11(a) – | The registrant’s principal executive and principal financial officers or persons performing similar functions have concluded that the registrant’s disclosure controls and procedures (as defined in Rule 30a-3(c) under the Investment Company Act of 1940, as amended (the “1940 Act”)) are effective as of a date within 90 days of the filing of this report based on the evaluation of these controls and procedures required by Rule 30a-3(b) under the 1940 Act and Rule 15(d)-15(b) under the Securities Exchange Act of 1934, as amended. |
11(b) – | There were no changes in the registrant’s internal control over financial reporting (as defined in Rule 30a-3(d) under the 1940 Act) that occurred during the second fiscal quarter of the period covered by this report that have materially affected, or are reasonably likely to materially affect, the registrant’s internal control over financial reporting. |
Item 12 – | Exhibits attached hereto |
12(a)(1) – | Code of Ethics – See Item 2 |
12(a)(2) – | Certifications – Attached hereto |
12(a)(3) – | Not Applicable |
12(b) – | Certifications – Attached hereto |
| Pursuant to the requirements of the Securities Exchange Act of 1934 and the Investment Company Act of 1940, the registrant has duly caused this report to be signed on its behalf by the undersigned, thereunto duly authorized. | ||
|
| ||
| BlackRock Small Cap Index Fund of BlackRock Index Funds, Inc. and Master Small Cap Index Series of Quantitative Master Series LLC | ||
| By: | /s/ Anne F. Ackerley | ||
| Anne F. Ackerley | |||
| Chief Executive Officer of | |||
| BlackRock Small Cap Index Fund of BlackRock Index Funds, Inc. and Master Small Cap Index Series of Quantitative Master Series LLC | |||
| Date: February 23, 2010 | |||
| Pursuant to the requirements of the Securities Exchange Act of 1934 and the Investment Company Act of 1940, this report has been signed below by the following persons on behalf of the registrant and in the capacities and on the dates indicated. | |||
| By: | /s/ Anne F. Ackerley | ||
| Anne F. Ackerley | |||
| Chief Executive Officer (principal executive officer) of | |||
| BlackRock Small Cap Index Fund of BlackRock Index Funds, Inc. and Master Small Cap Index Series of Quantitative Master Series LLC | |||
| Date: February 23, 2010 | |||
| By: | /s/ Neal J. Andrews | ||
| Neal J. Andrews | |||
| Chief Financial Officer (principal financial officer) of | |||
| BlackRock Small Cap Index Fund of BlackRock Index Funds, Inc. and Master Small Cap Index Series of Quantitative Master Series LLC | |||
| Date: February 23, 2010 | |||