UNITED STATES
SECURITIES AND EXCHANGE COMMISSION
Washington, D.C. 20549
FORM N-CSR
CERTIFIED SHAREHOLDER REPORT OF REGISTERED MANAGEMENT INVESTMENT COMPANIES
Investment Company Act file number: 811-07899 and 811-07885
Name of Fund: BlackRock Index Funds, Inc.
BlackRock International Index Fund
BlackRock Small Cap Index Fund
Quantitative Master Series LLC
Master International Index Series
Master Small Cap Index Series
Fund Address: 100 Bellevue Parkway, Wilmington, DE 19809
Name and address of agent for service: John M. Perlowski, Chief Executive Officer, BlackRock Index Funds, Inc.
and Quantitative Master Series LLC, 55 East 52nd Street, New York, NY 10055
Registrants’ telephone number, including area code: (800) 441-7762
Date of fiscal year end: 12/31/2015
Date of reporting period: 06/30/2015
Item 1 – Report to Stockholders
JUNE 30, 2015
| | | | |
SEMI-ANNUAL REPORT (UNAUDITED) | | | |  |
BlackRock Index Funds, Inc.
| Ø | BlackRock International Index Fund |
| Ø | BlackRock Small Cap Index Fund |
|
| Not FDIC Insured • May Lose Value • No Bank Guarantee |

| | | | | | |
| | | | | | | |
| 2 | | BLACKROCK INDEX FUNDS, INC. | | JUNE 30, 2015 | | |
Dear Shareholder,
During the 12-month period ended June 30, 2015, market volatility increased from the remarkably low levels seen in recent years, although it remained below the historical average. In the middle of 2014, geopolitical tensions intensified in Ukraine and the Middle East and oil prices became highly volatile, stoking worries about economic growth outside the United States. The U.S. economy, however, was showing improvement, which made investors concerned that the U.S. Federal Reserve (the “Fed”) would raise short-term rates sooner than previously anticipated. The U.S. dollar appreciated and global credit markets tightened, ultimately putting a strain on investor flows.
In the fourth quarter, U.S. growth picked up considerably while the broader global economy showed more signs of slowing. This, combined with rising global risks, drove investors to the relative stability of U.S. assets. International markets continued to struggle even as the European Central Bank (“ECB”) and the Bank of Japan eased monetary policy. Oil prices plummeted due to a global supply-and-demand imbalance, sparking a selloff in energy-related assets and putting stress on emerging markets. Fixed income investors piled into U.S. Treasuries despite their persistently low yields, which had become attractive as compared to the even lower yields on international sovereign debt.
Equity markets reversed in early 2015, with international markets outperforming the United States as global risks abated. Investors had held high expectations for the U.S. economy, but a harsh winter and west coast port strike brought disappointing first-quarter data and high valuations took their toll on U.S. stocks, while bond yields fell to extreme lows. (Bond prices rise as yields fall.) In contrast, economic reports in Europe and Asia easily beat investors’ very low expectations, and accommodative policies from central banks in those regions helped international equities rebound. Oil prices stabilized, providing some relief for emerging market stocks, although a stronger U.S. dollar continued to be a headwind for the asset class.
U.S. economic data regained momentum in the second quarter, helping U.S. stocks resume an upward path. However, meaningful strength in the labor market underscored the likelihood that the Fed would raise short-term rates before the end of 2015 and bond yields moved swiftly higher. The period ended on a downbeat, but temporary, note as Greece’s long-brewing debt troubles came to an impasse. As the drama unfolded around the tumultuous negotiations between Greece and its creditors, investors feared the possibility of Greece leaving the euro zone and the impact such an event might have on global markets. Most asset classes broadly sold off, especially in Europe, even while macroeconomic and company fundamentals continued to improve.
At BlackRock, we believe investors need to think globally, extend their scope across a broad array of asset classes and be prepared to move freely as market conditions change over time. We encourage you to talk with your financial advisor and visit blackrock.com for further insight about investing in today’s markets.
Sincerely,

Rob Kapito
President, BlackRock Advisors, LLC

Rob Kapito
President, BlackRock Advisors, LLC
| | | | | | | | |
| Total Returns as of June 30, 2015 | |
| | | 6-month | | | 12-month | |
U.S. large cap equities
(S&P 500® Index) | | | 1.23 | % | | | 7.42 | % |
U.S. small cap equities
(Russell 2000® Index) | | | 4.75 | | | | 6.49 | |
International equities
(MSCI Europe, Australasia,
Far East Index) | | | 5.52 | | | | (4.22 | ) |
Emerging market equities
(MSCI Emerging Markets
Index) | | | 2.95 | | | | (5.12 | ) |
3-month Treasury bills
(BofA Merrill Lynch
3-Month U.S. Treasury
Bill Index) | | | 0.01 | | | | 0.02 | |
U.S. Treasury securities
(BofA Merrill Lynch
10-Year U.S. Treasury Index) | | | (0.51 | ) | | | 3.79 | |
U.S. investment-grade bonds
(Barclays U.S.
Aggregate Bond Index) | | | (0.10 | ) | | | 1.86 | |
Tax-exempt municipal
bonds (S&P Municipal
Bond Index) | | | 0.01 | | | | 3.00 | |
U.S. high yield bonds
(Barclays U.S. Corporate
High Yield 2% Issuer
Capped Index) | | | 2.53 | | | | (0.39 | ) |
| Past performance is no guarantee of future results. Index performance is shown for illustrative purposes only. You cannot invest directly in an index. | |
| | | | | | |
| | | | | | | |
| | THIS PAGE NOT PART OF YOUR FUND REPORT | | | | 3 |
| | | | |
| Fund Summary as of June 30, 2015 | | BlackRock International Index Fund |
BlackRock International Index Fund’s (the “Fund”) investment objective is to match the performance of the MSCI EAFE Index (Europe, Australasia, Far East) (the “MSCI EAFE Index”) in U.S. dollars with net dividends as closely as possible before the deduction of Fund expenses.
| | |
| Portfolio Management Commentary | | |
How did the Fund perform?
| • | | For the six months ended June 30, 2015, the Fund’s Institutional Shares returned 6.27%, Investor A Shares returned 6.15% and Class K Shares returned 6.27%. The benchmark MSCI EAFE Index returned 5.52% for the same period. |
| • | | Returns for the Fund’s respective share classes differ from the benchmark index due to individual share-class expenses. The Fund invests all of its assets in Master International Index Series (the “Series”), a series of Quantitative Master Series LLC. |
Describe the market environment.
| • | | Japanese stocks experienced a powerful rally during the period, driven largely by increased domestic demand. Japan’s finance leaders effectively encouraged retail investors to take more risk with the introduction of new tax-efficient investment vehicles. In the institutional arena, the Government Pension Investment Fund has been shifting away from Japanese government bonds toward equities and foreign bonds. A weak yen and optimism around the reform of corporate governance policies has also helped stock prices move higher. |
| • | | In Europe, the economic landscape and company fundamentals broadly continued to improve with the support of the European Central Bank’s large asset purchase program. A strong rally in European equity markets in the earlier part of the period was interrupted as the severity of Greece’s debt troubles dominated headlines. European assets came under pressure as the Greek government’s negotiations with the Troika (i.e., the European Commission, European Central Bank and International Monetary Fund) became increasingly erratic leading up to the June 30 expiration of the most recent bailout package. Market volatility spiked when failure to strike a deal resulted in the Greek government putting the Troika’s proposal to a public vote. For the six-month period as a whole, European equities broadly produced positive results, with the strongest performance coming from markets in Denmark, Ireland, Italy and Portugal. |
Describe recent portfolio activity.
| • | | During the period, as changes were made to the composition of the MSCI EAFE Index, the Series purchased and sold securities to maintain its objective of replicating the risks and return of the benchmark index. |
Describe portfolio positioning at period end.
| • | | The Series remains positioned to match the risk characteristics of its benchmark index, irrespective of the future direction of international markets. |
The views expressed reflect the opinions of BlackRock as of the date of this report and are subject to change based on changes in market, economic or other conditions. These views are not intended to be a forecast of future events and are no guarantee of future results.
| | | | | | |
| | | | | | | |
| 4 | | BLACKROCK INDEX FUNDS, INC. | | JUNE 30, 2015 | | |
| | |
| | | BlackRock International Index Fund |
| | |
| Total Return Based on a $10,000 Investment |
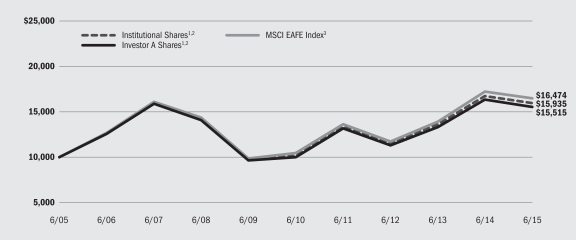
| | 1 | | Assuming transaction costs and other operating expenses, including administration fees, if any. |
| | 2 | | The Fund invests all of its assets in the Series. The Series invests in a statistically selected sample of equity securities included in the MSCI EAFE Index and in derivative instruments linked to the MSCI EAFE Index. |
| | 3 | | A free-float adjusted, market-capitalization weighted index designed to measure equity performance of developed markets, excluding the United States and Canada. |
| | | | | | | | |
| Performance Summary for the Period Ended June 30, 2015 |
| | | | | | | | | | | | | | | | |
| | | 6-Month
Total Returns | | | Average Annual Total Returns4 | |
| | | | 1 Year | | | 5 Years | | | 10 Years | |
Institutional | | | 6.27 | % | | | (4.68 | )% | | | 9.44 | % | | | 4.77 | % |
Investor A | | | 6.15 | | | | (5.00 | ) | | | 9.16 | | | | 4.49 | |
Class K5 | | | 6.27 | | | | (4.75 | ) | | | 9.47 | | | | 4.81 | |
MSCI EAFE Index | | | 5.52 | | | | (4.22 | ) | | | 9.54 | | | | 5.12 | |
| | 4 | | Average annual total returns reflect reductions for service fees, if any. See “About Fund Performance” on page 8 for a detailed description of share classes, including any related fees. |
| | 5 | | Class K Shares commenced operations on March 31, 2011. |
| | | | Past performance is not indicative of future results. |
| | | | | | | | | | | | | | | | | | | | | | | | | | | | |
| | | Actual | | | Hypothetical7 | | | | |
| | | Beginning
Account Value
January 1, 2015 | | | Ending
Account Value
June 30, 2015 | | | Expenses Paid
During the Period6 | | | Beginning
Account Value
January 1, 2015 | | | Ending
Account Value
June 30, 2015 | | | Expenses Paid
During the Period6 | | | Annualized
Expense Ratio | |
Institutional | | $ | 1,000.00 | | | $ | 1,062.70 | | | $ | 0.46 | | | $ | 1,000.00 | | | $ | 1,024.35 | | | $ | 0.45 | | | | 0.09 | % |
Investor A | | $ | 1,000.00 | | | $ | 1,061.50 | | | $ | 1.94 | | | $ | 1,000.00 | | | $ | 1,022.91 | | | $ | 1.91 | | | | 0.38 | % |
Class K | | $ | 1,000.00 | | | $ | 1,062.70 | | | $ | 0.41 | | | $ | 1,000.00 | | | $ | 1,024.40 | | | $ | 0.40 | | | | 0.08 | % |
| | 6 | | For each class of the Fund, expenses are equal to the annualized net expense ratio for the class, multiplied by the average account value over the period, multiplied by 181/365 (to reflect the one-half year period shown). Because the Fund invests all of its assets in the Series, the expense example reflects the net expenses of both the Fund and the Series. |
| | 7 | | Hypothetical 5% return before expenses is calculated by prorating the number of days in the most recent fiscal half year divided by 365. |
| | | | See “Disclosure of Expenses” on page 8 for further information on how expenses were calculated. |
| | | | | | |
| | | | | | | |
| | BLACKROCK INDEX FUNDS, INC. | | JUNE 30, 2015 | | 5 |
| | |
| Fund Summary as of June 30, 2015 | | BlackRock Small Cap Index Fund |
BlackRock Small Cap Index Fund’s (the “Fund”) investment objective is to match the performance of the Russell 2000® Index as closely as possible before the deduction of Fund expenses.
| | |
| Portfolio Management Commentary | | |
How did the Fund perform?
| • | | For the six months ended June 30, 2015, the Fund’s Institutional Shares returned 4.88%, Investor A Shares returned 4.76% and Class K Shares returned 4.93%. The benchmark Russell 2000® Index returned 4.75% for the same period. |
| • | | Returns for the Fund’s respective share classes differ from the benchmark index due to individual share-class expenses. The Fund invests all of its assets in Master Small Cap Index Series (the “Series”), a series of Quantitative Master Series LLC. |
Describe the market environment.
| • | | The year started with U.S. stock prices falling as lower oil prices punished the energy sector and the negative impact of a stronger dollar began to show in the earnings of large global exporting companies. High valuations in U.S. stocks drove equity investors toward more appealing opportunities overseas. U.S. stocks rebounded in February due to increased merger and acquisition activity and strong earnings reports from cyclical technology companies. However, stock prices came under pressure again in March as an improving labor market furthered the appreciation of the U.S. dollar and raised investors’ focus on the timing of an expected Federal Reserve move toward tightening policy. U.S. equities came back into favor in April, after a powerful rally in European equities left valuations in the United States looking more appealing by comparison. U.S. stocks continued to outperform international markets in the following months as increasing turmoil around Greece’s debt troubles drove investors to the relative stability of U.S. markets. |
| • | | A clear sign of strength has yet to emerge from the blurry U.S. economic picture, as uptrends in the housing and labor markets stand in contrast with consumer caution and productivity languor. This economic unevenness together with still stagnant inflation has kept the Federal Reserve tentative on when to start raising short-term interest rates. However, hiring strength and a modest but concrete pickup in wage growth point to a possible acceleration in the second half of 2015. More investors are now penciling in an autumn rate hike — a significant event that could push market volatility beyond the unusually low levels of the past few years, but the investment advisor expects most of the ups and downs will be short-lived for stocks. |
Describe recent portfolio activity.
| • | | During the period, as changes were made to the composition of the Russell 2000® Index, the Series purchased and sold securities to maintain its objective of replicating the risks and return of the benchmark index. |
Describe portfolio positioning at period end.
| • | | The investment advisor believes that the Series remains positioned to seek to match the risk characteristics of its benchmark index, irrespective of the market’s future direction. |
The views expressed reflect the opinions of BlackRock as of the date of this report and are subject to change based on changes in market, economic or other conditions. These views are not intended to be a forecast of future events and are no guarantee of future results.
| | | | | | |
| | | | | | | |
| 6 | | BLACKROCK INDEX FUNDS, INC. | | JUNE 30, 2015 | | |
| | |
| | | BlackRock Small Cap Index Fund |
| | |
| Total Return Based on a $10,000 Investment | | |
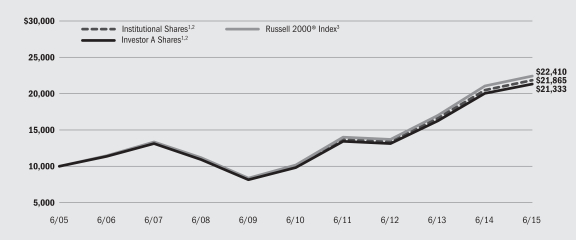
| | 1 | | Assuming transaction costs and other operating expenses, including administration fees, if any. |
| | 2 | | The Fund invests all of its assets in the Series. The Series may invest in a statistically selected sample of the stocks included in the Russell 2000® Index and in derivative instruments linked to the Russell 2000® Index. |
| | 3 | | An unmanaged index that is a subset of the Russell 3000® Index representing approximately 10% of the total market capitalization of that index. It includes approximately 2000 of the smallest securities based on a combination of their market cap and current index membership. |
| | |
| Performance Summary for the Period Ended June 30, 2015 | | |
| | | | | | | | | | | | | | | | |
| | | 6-Month Total Returns | | | Average Annual Total Returns4 | |
| | | | 1 Year | | | 5 Years | | | 10 Years | |
Institutional | | | 4.88 | % | | | 6.64 | % | | | 17.00 | % | | | 8.14 | % |
Investor A | | | 4.76 | | | | 6.36 | | | | 16.73 | | | | 7.87 | |
Class K5 | | | 4.93 | | | | 6.75 | | | | 17.09 | | | | 8.20 | |
Russell 2000® Index | | | 4.75 | | | | 6.49 | | | | 17.08 | | | | 8.40 | |
| | 4 | | Average annual total returns reflect reductions for service fees, if any. See “About Fund Performance” on page 8 for a detailed description of share classes, including related fees, if any. |
| | 5 | | Class K commenced operations on March 31, 2011. |
| | Past | | performance is not indicative of future results. |
| | | | | | | | | | | | | | | | | | | | | | | | | | | | |
| | | Actual | | | Hypothetical7 | | | | |
| | | Beginning Account Value January 1, 2015 | | | Ending
Account Value June 30, 2015 | | | Expenses Paid
During the Period6 | | | Beginning
Account Value
January 1, 2015 | | | Ending
Account Value
June 30, 2015 | | | Expenses Paid
During the Period6 | | | Annualized
Expense Ratio | |
Institutional | | $ | 1,000.00 | | | $ | 1,048.80 | | | $ | 0.86 | | | $ | 1,000.00 | | | $ | 1,023.95 | | | $ | 0.85 | | | | 0.17 | % |
Investor A | | $ | 1,000.00 | | | $ | 1,047.60 | | | $ | 2.23 | | | $ | 1,000.00 | | | $ | 1,022.61 | | | $ | 2.21 | | | | 0.44 | % |
Class K | | $ | 1,000.00 | | | $ | 1,049.30 | | | $ | 0.76 | | | $ | 1,000.00 | | | $ | 1,024.05 | | | $ | 0.75 | | | | 0.15 | % |
| | 6 | | For each class of the Fund, expenses are equal to the annualized net expense ratio for the class, multiplied by the average account value over the period, multiplied by 181/365 (to reflect the one-half year period shown). Because the Fund invests all of its assets in the Series, the expense example reflects the net expenses of both the Fund and the Series. |
| | 7 | | Hypothetical 5% annual return before expenses is calculated by prorating the number of days in the most recent fiscal half year divided by 365. |
| | See | | “Disclosure of Expenses” on page 8 for further information on how expenses were calculated. |
| | | | | | |
| | | | | | | |
| | BLACKROCK INDEX FUNDS, INC. | | JUNE 30, 2015 | | 7 |
| • | | Institutional and Class K Shares are not subject to any sales charge. These shares bear no ongoing distribution or service fees and are available only to certain eligible investors. Prior to March 31, 2011, Class K Shares’ performance results are those of Institutional Shares restated to reflect Class K Shares’ fees. |
| • | | Investor A Shares are not subject to any sales charge and bear no ongoing distribution fee. These shares are subject to an ongoing service fee of 0.25% per year. These shares are generally available through financial intermediaries. |
Performance information reflects past performance and does not guarantee future results. Current performance may be lower or higher than the performance data quoted. Refer to www.blackrock.com/funds to obtain performance data current to the most recent month end. Performance results do not reflect the deduction of taxes that a shareholder would pay on fund distributions or the redemption of fund shares. Figures shown in the performance tables on the previous pages assume reinvestment of all distributions, if any, at net asset value (“NAV”) on the ex-dividend date. Investment return and principal value of shares will fluctuate so that shares, when redeemed, may be worth more or less than their original cost. Distributions paid to each class of shares will vary because of the different levels of service, distribution and transfer agency fees applicable to each class, which are deducted from the income available to be paid to shareholders.
BlackRock Advisors, LLC (the “Administrator”), the Funds’ administrator, has contractually agreed to waive and/or reimburse a portion of the Funds’ expenses. Without such waiver and/or reimbursement, the Funds’ performance would have been lower. The Administrator is under no obligation to continue waiving and/or reimbursing its fees after the applicable termination date of such agreement. See Note 3 of the Notes to Financial Statements for additional information on waivers and/or reimbursements.
Shareholders of these Funds may incur the following charges: (a) transactional expenses, such as sales charges; and (b) operating expenses, including administration fees, service fees, including 12b-1 fees, acquired Fund fees and expenses and other Fund expenses. The expense examples on the previous pages (which are based on a hypothetical investment of $1,000 invested on January 1, 2015 and held through June 30, 2015) are intended to assist shareholders both in calculating expenses based on an investment in each Fund and in comparing these expenses with similar costs of investing in other mutual funds.
The expense examples provide information about actual account values and actual expenses. In order to estimate the expenses a shareholder paid during the period covered by this report, shareholders can divide their account value by $1,000 and then multiply the result by the number corresponding to their Fund and share class under the heading entitled “Expenses Paid During the Period.”
The expense examples also provide information about hypothetical account values and hypothetical expenses based on a Fund’s actual expense ratio and an assumed rate of return of 5% per year before expenses. In order to assist shareholders in comparing the ongoing expenses of investing in these Funds and other funds, compare the 5% hypothetical examples with the 5% hypothetical examples that appear in other funds’ shareholder reports.
The expenses shown in the expense examples are intended to highlight shareholders’ ongoing costs only and do not reflect any transactional expenses, such as sales charges, if any. Therefore, the hypothetical examples are useful in comparing ongoing expenses only, and will not help shareholders determine the relative total expenses of owning different funds. If these transactional expenses were included, shareholder expenses would have been higher.
|
| Derivative Financial Instruments |
The Series may invest in various derivative financial instruments. Derivative financial instruments are used to obtain exposure to a security, index and/or market without owning or taking physical custody of securities or to manage market, equity, credit, interest rate, foreign currency exchange rate, commodity and/or other risks. Derivative financial instruments may give rise to a form of economic leverage. Derivative financial instruments also involve risks, including the imperfect correlation between the value of a derivative financial instrument and the underlying asset, possible default of the counterparty to the transaction or illiquidity of the derivative financial instrument. The Series’ ability to use a derivative financial instrument successfully depends on the investment advisor’s ability to predict pertinent market movements accurately, which cannot be assured. The use of derivative financial instruments may result in losses greater than if they had not been used, may limit the amount of appreciation a Series can realize on an investment and/or may result in lower distributions paid to shareholders. The Series’ investments in these instruments are discussed in detail in the Notes to Financial Statements.
| | | | | | |
| | | | | | | |
| 8 | | BLACKROCK INDEX FUNDS, INC. | | JUNE 30, 2015 | | |
| | |
| Statements of Assets and Liabilities | | |
| | | | | | | | |
| June 30, 2015 (Unaudited) | | BlackRock
International
Index Fund | | | BlackRock
Small Cap
Index Fund | |
| | | | | | | | |
| Assets | | | | | | | | |
Investments at value — from Master International Index Series and Master Small Cap Index Series (each, a “Series”), respectively1 | | $ | 3,080,744,427 | | | $ | 203,416,053 | |
| Receivables: | | | | | | | | |
Capital shares sold | | | 9,322,960 | | | | 13,913,448 | |
From the administrator | | | 12,906 | | | | 8,248 | |
Prepaid expenses | | | 330,959 | | | | 28,340 | |
| | | | | | | | |
Total assets | | | 3,090,411,252 | | | | 217,366,089 | |
| | | | | | | | |
| | | | | | | | |
| Liabilities | | | | | | | | |
| Payables: | | | | | | | | |
Contributions to the Series | | | 5,464,639 | | | | 13,864,639 | |
Capital shares redeemed | | | 3,858,321 | | | | 48,809 | |
Service fees | | | 61,724 | | | | 20,028 | |
Officer’s fees | | | 232 | | | | 56 | |
Other accrued expenses | | | 122,500 | | | | 58,573 | |
| | | | | | | | |
Total liabilities | | | 9,507,416 | | | | 13,992,105 | |
| | | | | | | | |
Net Assets | | $ | 3,080,903,836 | | | $ | 203,373,984 | |
| | | | | | | | |
| | | | | | | | |
| Net Assets Consist of | | | | | | | | |
Paid-in capital | | $ | 3,040,019,448 | | | $ | 161,990,009 | |
Undistributed net investment income | | | 45,522,588 | | | | 758,831 | |
Undistributed net realized gain (accumulated net realized loss) | | | (66,721,260 | ) | | | 3,888,554 | |
Net unrealized appreciation (depreciation) | | | 62,083,060 | | | | 36,736,590 | |
| | | | | | | | |
Net Assets | | $ | 3,080,903,836 | | | $ | 203,373,984 | |
| | | | | | | | |
1 Investments at cost | | $ | 3,013,227,775 | | | $ | 166,679,463 | |
| | | | | | | | |
| Net Asset Value | | | | | | | | |
| Institutional | | | | | | | | |
Net assets | | $ | 2,758,755,568 | | | $ | 100,766,671 | |
| | | | |
Shares outstanding2 | | | 212,744,939 | | | | 5,787,681 | |
| | | | |
Net asset value | | $ | 12.97 | | | $ | 17.41 | |
| | | | |
| Investor A | | | | | | | | |
Net assets | | $ | 292,717,296 | | | $ | 97,315,880 | |
| | | | |
Shares outstanding3 | | | 22,763,284 | | | | 5,592,425 | |
| | | | |
Net asset value | | $ | 12.86 | | | $ | 17.40 | |
| | | | |
| Class K | | | | | | | | |
Net assets | | $ | 29,430,972 | | | $ | 5,291,433 | |
| | | | |
Shares outstanding3 | | | 2,268,495 | | | | 303,480 | |
| | | | |
Net asset value | | $ | 12.97 | | | $ | 17.44 | |
| | | | |
2 1,208 million shares authorized, $ 0.0001 par value. | |
3 208 million shares authorized, $ 0.0001 par value. | |
| | | | | | |
| See Notes to Financial Statements. | | | | |
| | | | | | | |
| | BLACKROCK INDEX FUNDS, INC. | | JUNE 30, 2015 | | 9 |
| | | | | | | | |
| Six Months Ended June 30, 2015 (Unaudited) | | BlackRock
International
Index Fund | | | BlackRock
Small Cap
Index Fund | |
| | | | | | | | |
| Investment Income | | | | | | | | |
| Net investment income allocated from the Series: | | | | | | | | |
Dividends — unaffiliated | | $ | 57,408,432 | | | $ | 963,735 | |
Securities lending — affiliated — net | | | 111,691 | | | | 167,561 | |
Dividends — affiliated | | | 5,328 | | | | 6,310 | |
Foreign taxes withheld | | | (7,021,523 | ) | | | (844 | ) |
Expenses | | | (654,057 | ) | | | (58,534 | ) |
Fees waived | | | 4,143 | | | | 2,433 | |
| | | | |
Total income | | | 49,854,014 | | | | 1,080,661 | |
| | | | |
| | | | | | | | |
| Fund Expenses | | | | | | | | |
Administration | | | 277,022 | | | | 55,838 | |
Service — Investor A | | | 396,332 | | | | 118,412 | |
Transfer agent — Institutional | | | 79,832 | | | | 9,874 | |
Transfer agent — Investor A | | | 162,548 | | | | 26,929 | |
Transfer agent — Class K | | | 327 | | | | 240 | |
Registration | | | 312,444 | | | | 25,624 | |
Professional | | | 57,559 | | | | 29,865 | |
Printing | | | 27,281 | | | | 16,008 | |
Officer | | | 163 | | | | 36 | |
Miscellaneous | | | 6,537 | | | | 5,723 | |
| | | | |
Total expenses | | | 1,320,045 | | | | 288,549 | |
Less administration fees waived | | | (262,794 | ) | | | (51,953 | ) |
Less transfer agent fees waived and/or reimbursed — class specific | | | (83,613 | ) | | | (4,853 | ) |
Less other expenses reimbursed | | | (24,048 | ) | | | (12,353 | ) |
| | | | |
Total expenses after fees waived and/or reimbursed | | | 949,590 | | | | 219,390 | |
| | | | |
Net investment income | | | 48,904,424 | | | | 861,271 | |
| | | | |
| | | | | | | | |
| Realized and Unrealized Gain (Loss) Allocation from the Series | | | | | | | | |
Net realized gain (loss) from investments, financial futures contracts and foreign currency transactions | | | (10,103,355 | ) | | | 5,892,143 | |
Net change in unrealized appreciation (depreciation) on investments, financial futures contracts and foreign currency translations | | | 70,152,266 | | | | 1,267,850 | |
| | | | |
Net realized and unrealized gain | | | 60,048,911 | | | | 7,159,993 | |
| | | | |
Net Increase in Net Assets Resulting from Operations | | $ | 108,953,335 | | | $ | 8,021,264 | |
| | | | |
| | | | | | |
| See Notes to Financial Statements. | | | | |
| | | | | | | |
| 10 | | BLACKROCK INDEX FUNDS, INC. | | JUNE 30, 2015 | | |
| | |
| Statements of Changes in Net Assets | | |
| | | | | | | | |
| | | BlackRock International Index Fund | |
| Increase (Decrease) in Net Assets: | | Six Months Ended
June 30,
2015
(Unaudited) | | | Year Ended
December 31,
2014 | |
| | | | | | | | |
| Operations | | | | | | | | |
Net investment income | | $ | 48,904,424 | | | $ | 15,644,947 | |
Net realized loss | | | (10,103,355 | ) | | | (6,707,171 | ) |
Net change in unrealized appreciation (depreciation) | | | 70,152,266 | | | | (99,989,047 | ) |
| | | | |
Net increase (decrease) in net assets resulting from operations | | | 108,953,335 | | | | (91,051,271 | ) |
| | | | |
| | | | | | | | |
| Distributions to Shareholders From1 | | | | | | | | |
| Net investment income: | | | | | | | | |
Institutional | | | (667,442 | ) | | | (12,556,660 | ) |
Investor A | | | (126,624 | ) | | | (1,638,076 | ) |
Class K | | | (6,054 | ) | | | (119,038 | ) |
| | | | |
Decrease in net assets resulting from distributions to shareholders | | | (800,120 | ) | | | (14,313,774 | ) |
| | | | |
| | | | | | | | |
| Capital Share Transactions | | | | | | | | |
Net increase in net assets derived from capital share transactions | | | 859,467,549 | | | | 1,835,861,523 | |
| | | | |
| | | | | | | | |
| Net Assets | | | | | | | | |
Total increase in net assets | | | 967,620,764 | | | | 1,730,496,478 | |
Beginning of period | | | 2,113,283,072 | | | | 382,786,594 | |
| | | | |
End of period | | $ | 3,080,903,836 | | | $ | 2,113,283,072 | |
| | | | |
Undistributed (distributions in excess of) net investment income, end of period | | $ | 45,522,588 | | | $ | (2,581,716 | ) |
| | | | |
1 Distributions for annual periods determined in accordance with federal income tax regulations. | | | | | | | | |
| | | | | | |
| See Notes to Financial Statements. | | | | |
| | | | | | | |
| | BLACKROCK INDEX FUNDS, INC. | | JUNE 30, 2015 | | 11 |
| | |
| Statements of Changes in Net Assets | | |
| | | | | | | | |
| | | BlackRock Small Cap Index Fund | |
| Increase (Decrease) in Net Assets: | | Six Months Ended
June 30,
2015
(Unaudited) | | | Year Ended
December 31,
2014 | |
| | | | | | | | |
| Operations | | | | | | | | |
Net investment income | | $ | 861,271 | | | $ | 1,480,935 | |
Net realized gain | | | 5,892,143 | | | | 11,431,686 | |
Net change in unrealized appreciation (depreciation) | | | 1,267,850 | | | | (7,088,981 | ) |
| | | | |
Net increase in net assets resulting from operations | | | 8,021,264 | | | | 5,823,640 | |
| | | | |
| | | | | | | | |
| Distributions to Shareholders From1 | | | | | | | | |
| Net investment income: | | | | | | | | |
Institutional | | | — | | | | (712,508 | ) |
Investor A | | | — | | | | (1,007,255 | ) |
Class K | | | — | | | | (40,628 | ) |
| Net realized gain: | | | | | | | | |
Institutional | | | — | | | | (3,858,445 | ) |
Investor A | | | — | | | | (6,546,880 | ) |
Class K | | | — | | | | (212,248 | ) |
| | | | |
Decrease in net assets resulting from distributions to shareholders | | | — | | | | (12,377,964 | ) |
| | | | |
| | | | | | | | |
| Capital Share Transactions | | | | | | | | |
Net increase (decrease) in net assets derived from capital share transactions | | | 61,889,663 | | | | (5,003,618 | ) |
| | | | |
| | | | | | | | |
| Net Assets | | | | | | | | |
Total increase (decrease) in net assets | | | 69,910,927 | | | | (11,557,942 | ) |
Beginning of period | | | 133,463,057 | | | | 145,020,999 | |
| | | | |
End of period | | $ | 203,373,984 | | | $ | 133,463,057 | |
| | | | |
Undistributed (distribution in excess of) net investment income, end of period | | $ | 758,831 | | | $ | (102,440 | ) |
| | | | |
| | 1 | | Distributions for annual periods determined in accordance with federal income tax regulations. |
| | | | | | |
| See Notes to Financial Statements. | | | | |
| | | | | | | |
| 12 | | BLACKROCK INDEX FUNDS, INC. | | JUNE 30, 2015 | | |
| | |
| Financial Highlights | | BlackRock International Index Fund |
| | | | | | | | | | | | | | | | | | | | | | | | |
| | | Institutional | |
| | | Six Months Ended
June 30,
2015
(Unaudited) | | | Year Ended December 31, | |
| | | | 2014 | | | 2013 | | | 2012 | | | 2011 | | | 2010 | |
| | | | | | | | | | | | | | | | | | | | | | | | |
| Per Share Operating Performance | | | | | | | | | | | | | | | | | | | | | | | | |
Net asset value, beginning of period | | $ | 12.21 | | | $ | 13.11 | | | $ | 11.06 | | | $ | 9.63 | | | $ | 11.42 | | | $ | 10.97 | |
| | | | |
Net investment income1 | | | 0.25 | | | | 0.24 | | | | 0.32 | | | | 0.33 | | | | 0.35 | | | | 0.25 | |
Net realized and unrealized gain (loss) | | | 0.51 | | | | (1.04 | ) | | | 2.04 | | | | 1.45 | | | | (1.79 | )2 | | | 0.53 | 2 |
| | | | |
Net increase (decrease) from investment operations | | | 0.76 | | | | (0.80 | ) | | | 2.36 | | | | 1.78 | | | | (1.44 | ) | | | 0.78 | |
| | | | |
| Distributions from net investment income3 | | | (0.00 | )4 | | | (0.10 | ) | | | (0.31 | ) | | | (0.35 | ) | | | (0.35 | ) | | | (0.33 | ) |
| | | | |
Net asset value, end of period | | $ | 12.97 | | | $ | 12.21 | | | $ | 13.11 | | | $ | 11.06 | | | $ | 9.63 | | | $ | 11.42 | |
| | | | |
| | | | | | | | | | | | | | | | | | | | | | | | |
| Total Return5 | | | | | | | | | | | | | | | | | | | | | | | | |
Based on net asset value | | | 6.27% | 6 | | | (6.13)% | | | | 21.52% | | | | 18.58% | | | | (12.55)% | | | | 7.26% | |
| | | | |
| | | | | | | | | | | | | | | | | | | | | | | | |
| Ratios to Average Net Assets7 | | | | | | | | | | | | | | | | | | | | | | | | |
Total expenses | | | 0.11% | 8,9 | | | 0.16% | 8 | | | 0.40% | 8 | | | 0.42% | 8 | | | 0.44% | 8 | | | 0.47% | |
| | | | |
Total expenses after fees waived and/or reimbursed | | | 0.09% | 8,9 | | | 0.11% | 8 | | | 0.35% | 8 | | | 0.34% | 8 | | | 0.35% | 8 | | | 0.46% | |
| | | | |
Net investment income | | | 3.90% | 8,9 | | | 1.91% | 8 | | | 2.64% | 8 | | | 3.22% | 8 | | | 3.14% | 8 | | | 2.35% | |
| | | | |
| | | | | | | | | | | | | | | | | | | | | | | | |
| Supplemental Data | | | | | | | | | | | | | | | | | | | | | | | | |
Net assets, end of period (000) | | $ | 2,758,756 | | | $ | 1,764,794 | | | $ | 71,826 | | | $ | 52,589 | | | $ | 70,169 | | | $ | 112,145 | |
| | | | |
Portfolio turnover rate of the Series | | | 4% | | | | 6% | | | | 8% | | | | 21% | | | | 6% | | | | 8% | |
| | | | |
| | 1 | | Based on average shares outstanding. |
| | 2 | | Includes a redemption fee, which is less than $0.005 per share. |
| | 3 | | Distributions for annual periods determined in accordance with federal income tax regulations. |
| | 4 | | Amount is greater than $(0.005) per share. |
| | 5 | | Where applicable, assumes the reinvestment of distributions. |
| | 6 | | Aggregate total return. |
| | 7 | | Includes the Fund’s share of the Series’ allocated expenses and/or net investment income. |
| | 8 | | Includes the Fund’s share of the Series’ allocated fees waived of less than 0.01%. |
| | | | | | |
| See Notes to Financial Statements. | | | | |
| | | | | | | |
| | BLACKROCK INDEX FUNDS, INC. | | JUNE 30, 2015 | | 13 |
| | |
| Financial Highlights (continued) | | BlackRock International Index Fund |
| | | | | | | | | | | | | | | | | | | | | | | | |
| | | Investor A | |
| | | Six Months Ended
June 30,
2015
(Unaudited) | | | Year Ended December 31, | |
| | | | 2014 | | | 2013 | | | 2012 | | | 2011 | | | 2010 | |
| | | | | | | | | | | | | | | | | | | | | | | | |
| Per Share Operating Performance | | | | | | | | | | | | | | | | | | | | | | | | |
Net asset value, beginning of period | | $ | 12.12 | | | $ | 13.02 | | | $ | 10.99 | | | $ | 9.57 | | | $ | 11.36 | | | $ | 10.91 | |
| | | | |
Net investment income1 | | | 0.21 | | | | 0.41 | | | | 0.29 | | | | 0.30 | | | | 0.31 | | | | 0.23 | |
Net realized and unrealized gain (loss) | | | 0.53 | | | | (1.25 | ) | | | 2.02 | | | | 1.45 | | | | (1.77 | )2 | | | 0.52 | 2 |
| | | | |
Net increase (decrease) from investment operations | | | 0.74 | | | | (0.84 | ) | | | 2.31 | | | | 1.75 | | | | (1.46 | ) | | | 0.75 | |
| | | | |
| Distributions from net investment income3 | | | (0.00 | )4 | | | (0.06 | ) | | | (0.28 | ) | | | (0.33 | ) | | | (0.33 | ) | | | (0.30 | ) |
| | | | |
Net asset value, end of period | | $ | 12.86 | | | $ | 12.12 | | | $ | 13.02 | | | $ | 10.99 | | | $ | 9.57 | | | $ | 11.36 | |
| | | | |
| | | | | | | | | | | | | | | | | | | | | | | | |
| Total Return5 | | | | | | | | | | | | | | | | | | | | | | | | |
Based on net asset value | | | 6.15% | 6 | | | (6.45)% | | | | 21.20% | | | | 18.33% | | | | (12.84)% | | | | 7.02% | |
| | | | |
| | | | | | | | | | | | | | | | | | | | | | | | |
| Ratios to Average Net Assets7 | | | | | | | | | | | | | | | | | | | | | | | | |
Total expenses | | | 0.46% | 8,9 | | | 0.52% | 8 | | | 0.69% | 8 | | | 0.69% | 8 | | | 0.70% | 8 | | | 0.74% | |
| | | | |
Total expenses after fees waived and/or reimbursed | | | 0.38% | 8,9 | | | 0.43% | 8 | | | 0.60% | 8 | | | 0.60% | 8 | | | 0.60% | 8 | | | 0.73% | |
| | | | |
Net investment income | | | 3.32% | 8,9 | | | 3.13% | 8 | | | 2.41% | 8 | | | 2.90% | 8 | | | 2.84% | 8 | | | 2.16% | |
| | | | |
| | | | | | | | | | | | | | | | | | | | | | | | |
| Supplemental Data | | | | | | | | | | | | | | | | | | | | | | | | |
Net assets, end of period (000) | | $ | 292,717 | | | $ | 332,475 | | | $ | 308,624 | | | $ | 223,754 | | | $ | 168,266 | | | $ | 163,033 | |
| | | | |
Portfolio turnover rate of the Series | | | 4% | | | | 6% | | | | 8% | | | | 21% | | | | 6% | | | | 8% | |
| | | | |
| | 1 | | Based on average shares outstanding. |
| | 2 | | Includes a redemption fee, which is less than $0.005 per share. |
| | 3 | | Distributions for annual periods determined in accordance with federal income tax regulations. |
| | 4 | | Amount is greater than $(0.005) per share. |
| | 5 | | Where applicable, assumes the reinvestment of distributions. |
| | 6 | | Aggregate total return. |
| | 7 | | Includes the Fund’s share of the Series’ allocated expenses and/or net investment income. |
| | 8 | | Includes the Fund’s share of the Series’ allocated fees waived of less than 0.01%. |
| | | | | | |
| See Notes to Financial Statements. | | | | |
| | | | | | | |
| 14 | | BLACKROCK INDEX FUNDS, INC. | | JUNE 30, 2015 | | |
| | |
| Financial Highlights (concluded) | | BlackRock International Index Fund |
| | | | | | | | | | | | | | | | | | | | |
| | | Class K | |
| | | Six Months Ended
June 30,
2015
(Unaudited) | | | Year Ended December 31, | | | Period
March 31, 20111
to December 31,
2011 | |
| | | | 2014 | | | 2013 | | | 2012 | | |
| | | | | | | | | | | | | | | | | | | | |
| Per Share Operating Performance | | | | | | | | | | | | | | | | | | | | |
Net asset value, beginning of period | | $ | 12.21 | | | $ | 13.11 | | | $ | 11.06 | | | $ | 9.63 | | | $ | 11.80 | |
| | | | |
Net investment income2 | | | 0.25 | | | | 0.34 | | | | 0.28 | | | | 0.22 | | | | 0.26 | |
Net realized and unrealized gain (loss) | | | 0.51 | | | | (1.14 | ) | | | 2.09 | | | | 1.57 | | | | (2.08 | ) |
| | | | |
Net increase (decrease) from investment operations | | | 0.76 | | | | (0.80 | ) | | | 2.37 | | | | 1.79 | | | | (1.82 | ) |
| | | | |
| Distributions from net investment income3 | | | (0.00 | )4 | | | (0.10 | ) | | | (0.32 | ) | | | (0.36 | ) | | | (0.35 | ) |
| | | | |
Net asset value, end of period | | $ | 12.97 | | | $ | 12.21 | | | $ | 13.11 | | | $ | 11.06 | | | $ | 9.63 | |
| | | | |
| | | | | | | | | | | | | | | | | | | | |
| Total Return5 | | | | | | | | | | | | | | | | | | | | |
Based on net asset value | | | 6.27% | 6 | | | (6.12)% | | | | 21.57% | | | | 18.65% | | | | (15.38)% | 6 |
| | | | |
| | | | | | | | | | | | | | | | | | | | |
| Ratios to Average Net Assets7,8 | | | | | | | | | | | | | | | | | | | | |
Total expenses | | | 0.11% | 9 | | | 0.15% | | | | 0.36% | | | | 0.33% | | | | 0.48% | 9 |
| | | | |
Total expenses after fees waived and/or reimbursed | | | 0.08% | 9 | | | 0.11% | | | | 0.30% | | | | 0.29% | | | | 0.30% | 9 |
| | | | |
Net investment income | | | 3.93% | 9 | | | 2.65% | | | | 2.29% | | | | 2.11% | | | | 3.27% | 9 |
| | | | |
| | | | | | | | | | | | | | | | | | | | |
| Supplemental Data | | | | | | | | | | | | | | | | | | | | |
Net assets, end of period (000) | | $ | 29,431 | | | $ | 16,014 | | | $ | 2,336 | | | $ | 710 | | | $ | 20 | |
| | | | |
Portfolio turnover rate of the Series | | | 4% | | | | 6% | | | | 8% | | | | 21% | | | | 6% | |
| | | | |
| | 1 | | Commencement of operations. |
| | 2 | | Based on average shares outstanding. |
| | 3 | | Distributions for annual periods determined in accordance with federal income tax regulations. |
| | 4 | | Amount is greater than $(0.005) per share. |
| | 5 | | Where applicable, assumes the reinvestment of distributions. |
| | 6 | | Aggregate total return. |
| | 7 | | Includes the Fund’s share of the Series’ allocated expenses and/or net investment income. |
| | 8 | | Includes the Fund’s share of the Series’ allocated fees waived of less than 0.01%. |
| | | | | | |
| See Notes to Financial Statements. | | | | |
| | | | | | | |
| | BLACKROCK INDEX FUNDS, INC. | | JUNE 30, 2015 | | 15 |
| | |
| Financial Highlights | | BlackRock Small Cap Index Fund |
| | | | | | | | | | | | | | | | | | | | | | | | |
| | | Institutional | |
| | | Six Months Ended
June 30,
2015
(Unaudited) | | | Year Ended December 31, | |
| | | | 2014 | | | 2013 | | | 2012 | | | 2011 | | | 2010 | |
| | | | | | | | | | | | | | | | | | | | | | | | |
| Per Share Operating Performance | | | | | | | | | | | | | | | | | | | | | | | | |
Net asset value, beginning of period | | $ | 16.60 | | | $ | 17.51 | | | $ | 12.99 | | | $ | 11.51 | | | $ | 12.21 | | | $ | 9.70 | |
| | | | |
Net investment income1 | | | 0.10 | | | | 0.20 | | | | 0.22 | | | | 0.24 | | | | 0.14 | | | | 0.08 | |
Net realized and unrealized gain (loss) | | | 0.71 | | | | 0.56 | | | | 4.83 | | | | 1.61 | | | | (0.69 | )2 | | | 2.51 | 2 |
| | | | |
Net increase (decrease) from investment operations | | | 0.81 | | | | 0.76 | | | | 5.05 | | | | 1.85 | | | | (0.55 | ) | | | 2.59 | |
| | | | |
| Distributions from:3 | | | | | | | | | | | | | | | | | | | | | | | | |
Net investment income | | | — | | | | (0.26 | ) | | | (0.19 | ) | | | (0.37 | ) | | | (0.15 | ) | | | (0.08 | ) |
Net realized gain | | | — | | | | (1.41 | ) | | | (0.34 | ) | | | — | | | | — | | | | — | |
| | | | |
Total distributions | | | — | | | | (1.67 | ) | | | (0.53 | ) | | | (0.37 | ) | | | (0.15 | ) | | | (0.08 | ) |
| | | | |
Net asset value, end of period | | $ | 17.41 | | | $ | 16.60 | | | $ | 17.51 | | | $ | 12.99 | | | $ | 11.51 | | | $ | 12.21 | |
| | | | |
| | | | | | | | | | | | | | | | | | | | | | | | |
| Total Return4 | | | | | | | | | | | | | | | | | | | | | | | | |
Based on net asset value | | | 4.88% | 5 | | | 4.81% | | | | 39.14% | | | | 16.10% | | | | (4.49)% | | | | 26.77% | |
| | | | |
| | | | | | | | | | | | | | | | | | | | | | | | |
| Ratios to Average Net Assets6 | | | | | | | | | | | | | | | | | | | | | | | | |
Total expenses | | | 0.25% | 7,8,9 | | | 0.35% | 7 | | | 0.51% | 7 | | | 0.60% | 7 | | | 0.61% | 7 | | | 0.57% | |
| | | | |
Total expenses after fees waived and/or reimbursed | | | 0.17% | 7,8,9 | | | 0.23% | 7 | | | 0.29% | 7 | | | 0.28% | 7 | | | 0.30% | 7 | | | 0.52% | |
| | | | |
Net investment income | | | 1.16% | 7,8,9 | | | 1.17% | 7 | | | 1.45% | 7 | | | 1.88% | 7 | | | 1.14% | 7 | | | 0.80% | |
| | | | |
| | | | | | | | | | | | | | | | | | | | | | | | |
| Supplemental Data | | | | | | | | | | | | | | | | | | | | | | | | |
Net assets, end of period (000) | | $ | 100,767 | | | $ | 46,988 | | | $ | 60,707 | | | $ | 44,328 | | | $ | 49,829 | | | $ | 71,443 | |
| | | | |
Portfolio turnover rate of the Series | | | 17% | | | | 21% | | | | 22% | | | | 68% | | | | 31% | | | | 42% | |
| | | | |
| | 1 | | Based on average shares outstanding. |
| | 2 | | Includes redemption fees which are less than $0.005 per share. |
| | 3 | | Distributions for annual periods determined in accordance with federal income tax regulations. |
| | 4 | | Where applicable, assumes the reinvestment of distributions. |
| | 5 | | Aggregate total return. |
| | 6 | | Includes the Fund’s share of the Series’ allocated expenses and/or net investment income. |
| | 7 | | Includes the Fund’s share of the Series’ allocated fees waived of less than 0.01%. |
| | 9 | | Ratios do not include expenses incurred indirectly as a result of investments in underlying funds of approximately 0.01%. |
| | | | | | |
| See Notes to Financial Statements. | | | | |
| | | | | | | |
| 16 | | BLACKROCK INDEX FUNDS, INC. | | JUNE 30, 2015 | | |
| | |
| Financial Highlights (continued) | | BlackRock Small Cap Index Fund |
| | | | | | | | | | | | | | | | | | | | | | | | |
| | | Investor A | |
| | | Six Months Ended
June 30,
2015
(Unaudited) | | | Year Ended December 31, | |
| | | | 2014 | | | 2013 | | | 2012 | | | 2011 | | | 2010 | |
| | | | | | | | | | | | | | | | | | | | | | | | |
| Per Share Operating Performance | | | | | | | | | | | | | | | | | | | | | | | | |
Net asset value, beginning of period | | $ | 16.61 | | | $ | 17.52 | | | $ | 13.01 | | | $ | 11.51 | | | $ | 12.21 | | | $ | 9.71 | |
| | | | |
Net investment income1 | | | 0.07 | | | | 0.16 | | | | 0.19 | | | | 0.21 | | | | 0.11 | | | | 0.06 | |
Net realized and unrealized gain (loss) | | | 0.72 | | | | 0.56 | | | | 4.82 | | | | 1.62 | | | | (0.70 | ) | | | 2.50 | 2 |
| | | | |
Net increase (decrease) from investment operations | | | 0.79 | | | | 0.72 | | | | 5.01 | | | | 1.83 | | | | (0.59 | ) | | | 2.56 | |
| | | | |
| Distributions from:3 | | | | | | | | | | | | | | | | | | | | | | | | |
Net investment income | | | — | | | | (0.22 | ) | | | (0.16 | ) | | | (0.33 | ) | | | (0.11 | ) | | | (0.06 | ) |
Net realized gain | | | — | | | | (1.41 | ) | | | (0.34 | ) | | | — | | | | — | | | | — | |
| | | | |
Total distributions | | | — | | | | (1.63 | ) | | | (0.50 | ) | | | (0.33 | ) | | | (0.11 | ) | | | (0.06 | ) |
| | | | |
Net asset value, end of period | | $ | 17.40 | | | $ | 16.61 | | | $ | 17.52 | | | $ | 13.01 | | | $ | 11.51 | | | $ | 12.21 | |
| | | | |
| | | | | | | | | | | | | | | | | | | | | | | | |
| Total Return4 | | | | | | | | | | | | | | | | | | | | | | | | |
Based on net asset value | | | 4.76% | 5 | | | 4.54% | | | | 38.72% | | | | 15.96% | | | | (4.76)% | | | | 26.35% | |
| | | | |
| | | | | | | | | | | | | | | | | | | | | | | | |
| Ratios to Average Net Assets6 | | | | | | | | | | | | | | | | | | | | | | | | |
Total expenses | | | 0.53% | 7,8,9 | | | 0.63% | 7 | | | 0.77% | 7 | | | 0.88% | 7 | | | 0.88% | 7 | | | 0.80% | |
| | | | |
Total expenses after fees waived and/or reimbursed | | | 0.44% | 7,8,9 | | | 0.48% | 7 | | | 0.55% | 7 | | | 0.55% | 7 | | | 0.55% | 7 | | | 0.78% | |
| | | | |
Net investment income | | | 0.87% | 7,8,9 | | | 0.95% | 7 | | | 1.20% | 7 | | | 1.64% | 7 | | | 0.88% | 7 | | | 0.53% | |
| | | | |
| | | | | | | | | | | | | | | | | | | | | | | | |
| Supplemental Data | | | | | | | | | | | | | | | | | | | | | | | | |
Net assets, end of period (000) | | $ | 97,316 | | | $ | 83,859 | | | $ | 83,118 | | | $ | 49,303 | | | $ | 45,263 | | | $ | 47,252 | |
| | | | |
Portfolio turnover rate of the Series | | | 17% | | | | 21% | | | | 22% | | | | 68% | | | | 31% | | | | 42% | |
| | | | |
| | 1 | | Based on average shares outstanding. |
| | 2 | | Includes redemption fees which are less than $0.005 per share. |
| | 3 | | Distributions for annual periods determined in accordance with federal income tax regulations. |
| | 4 | | Where applicable, assumes the reinvestment of distributions. |
| | 5 | | Aggregate total return. |
| | 6 | | Includes the Fund’s share of the Series’ allocated expenses and/or net investment income. |
| | 7 | | Includes the Fund’s share of the Series’ allocated fees waived of less than 0.01%. |
| | 9 | | Ratios do not include expenses incurred indirectly as a result of investments in underlying funds of approximately 0.01%. |
| | | | | | |
| See Notes to Financial Statements. | | | | |
| | | | | | | |
| | BLACKROCK INDEX FUNDS, INC. | | JUNE 30, 2015 | | 17 |
| | |
| Financial Highlights (concluded) | | BlackRock Small Cap Index Fund |
| | | | | | | | | | | | | | | | | | | | |
| | | Class K | |
| | | Six Months Ended
June 30,
2015
(Unaudited) | | | Year Ended December 31, | | | Period
March 31, 20111
to December 31,
2011 | |
| | | | 2014 | | | 2013 | | | 2012 | | |
| | | | | | | | | | | | | | | | | | | | |
| Per Share Operating Performance | | | | | | | | | | | | | | | | | | | | |
Net asset value, beginning of period | | $ | 16.62 | | | $ | 17.53 | | | $ | 13.01 | | | $ | 11.51 | | | $ | 13.17 | |
| | | | |
Net investment income2 | | | 0.10 | | | | 0.23 | | | | 0.25 | | | | 0.25 | | | | 0.11 | |
Net realized and unrealized gain (loss) | | | 0.72 | | | | 0.54 | | | | 4.81 | | | | 1.62 | | | | (1.62 | ) |
| | | | |
Net increase (decrease) from investment operations | | | 0.82 | | | | 0.77 | | | | 5.06 | | | | 1.87 | | | | (1.51 | ) |
| | | | |
| Distributions from:3 | | | | | | | | | | | | | | | | | | | | |
Net investment income | | | — | | | | (0.27 | ) | | | (0.20 | ) | | | (0.37 | ) | | | (0.15 | ) |
Net realized gain | | | — | | | | (1.41 | ) | | | (0.34 | ) | | | — | | | | — | |
| | | | |
Total distributions | | | — | | | | (1.68 | ) | | | (0.54 | ) | | | (0.37 | ) | | | (0.15 | ) |
| | | | |
Net asset value, end of period | | $ | 17.44 | | | $ | 16.62 | | | $ | 17.53 | | | $ | 13.01 | | | $ | 11.51 | |
| | | | |
| | | | | | | | | | | | | | | | | | | | |
| Total Return4 | | | | | | | | | | | | | | | | | | | | |
Based on net asset value | | | 4.93% | 5 | | | 4.87% | | | | 39.14% | | | | 16.30% | | | | (11.42)% | 5 |
| | | | |
| | | | | | | | | | | | | | | | | | | | |
| Ratios to Average Net Assets6,7 | | | | | | | | | | | | | | | | | | | | |
Total expenses | | | 0.23% | 8,9 | | | 0.32% | | | | 0.49% | | | | 0.68% | | | | 0.68% | 8 |
| | | | |
Total expenses after fees waived and/or reimbursed | | | 0.15% | 8,9 | | | 0.18% | | | | 0.25% | | | | 0.25% | | | | 0.25% | 8 |
| | | | |
Net investment income | | | 1.20% | 8,9 | | | 1.35% | | | | 1.57% | | | | 1.99% | | | | 1.28% | 8 |
| | | | |
| | | | | | | | | | | | | | | | | | | | |
| Supplemental Data | | | | | | | | | | | | | | | | | | | | |
Net assets, end of period (000) | | $ | 5,291 | | | $ | 2,617 | | | $ | 1,196 | | | $ | 40 | | | $ | 22 | |
| | | | |
Portfolio turnover rate of the Series | | | 17% | | | | 21% | | | | 22% | | | | 68% | | | | 31% | |
| | | | |
| | 1 | | Commencement of operations. |
| | 2 | | Based on average shares outstanding. |
| | 3 | | Distributions for annual periods determined in accordance with federal income tax regulations. |
| | 4 | | Where applicable, assumes the reinvestment of distributions. |
| | 5 | | Aggregate total return. |
| | 6 | | Includes the Fund’s share of the Series’ allocated expenses and/or net investment income. |
| | 7 | | Includes the Fund’s share of the Series’ allocated fees waived of less than 0.01%. |
| | 9 | | Ratios do not include expenses incurred indirectly as a result of investments in underlying funds of approximately 0.01%. |
| | | | | | |
| See Notes to Financial Statements. | | | | |
| | | | | | | |
| 18 | | BLACKROCK INDEX FUNDS, INC. | | JUNE 30, 2015 | | |
| | | | |
| Notes to Financial Statements (Unaudited) | | BlackRock Index Funds, Inc. |
1. Organization:
BlackRock International Index Fund and BlackRock Small Cap Index Fund are each a series of BlackRock Index Funds, Inc. (the “Corporation”), which is registered under the Investment Company Act of 1940, as amended (the “1940 Act”), as an open end management investment company. The Corporation is organized as a Maryland corporation. The following are referred to herein collectively as the “Funds” or individually, a “Fund”:
| | | | |
| Fund Name | | Herein Referred To As | | Diversification
Classification |
BlackRock International Index Fund | | International Index | | Diversified |
| BlackRock Small Cap Index Fund | | Small Cap Index | | Diversified |
The Funds seek to achieve their investment objectives by investing all of their assets in Master International Index Series (“Master International Index”) and Master Small Cap Index Series (“Master Small Cap Index”), respectively (collectively, the “Series” or individually, a “Series”), of Quantitative Master Series LLC (the “Master LLC”), an affiliate of the Funds, each of which has the same investment objective and strategies as the corresponding Fund. The value of each Fund’s investment in the respective Series reflects each Fund’s proportionate interest in the net assets of the respective Series. The performance of each Fund is directly affected by the performance of the respective Series. At June 30, 2015, the percentages of Master International Index and Master Small Cap Index owned by International Index and Small Cap Index were 83.68%% and 20.25%, respectively. The financial statements of the Series, including the Schedules of Investments, are included elsewhere in this report and should be read in conjunction with the Funds’ financial statements.
The Funds offer multiple classes of shares. Institutional and Class K Shares are sold without a sales charge and only to certain eligible investors. Investor A Shares are generally sold without a front-end sales charge, and may be subject to a CDSC for certain redemptions where no initial sales charge was paid at the time of purchase. All classes of shares have identical voting, dividend, liquidation and other rights and are subject to the same terms and conditions except that Investor A Shares bear certain expenses related to the shareholder servicing of such shares. Each class has exclusive voting rights with respect to matters relating to its shareholder servicing and distribution expenditures.
2. Significant Accounting Policies:
The Funds’ financial statements are prepared in conformity with accounting principles generally accepted in the United States of America (“U.S. GAAP”), which may require management to make estimates and assumptions that affect the reported amounts of assets and liabilities in the financial statements and the reported amounts of increases and decreases in net assets from operations during the reporting period. Actual results could differ from those estimates. Each Fund is considered an investment company under U.S. GAAP and follows the accounting and reporting guidance applicable to investment companies. The following is a summary of significant accounting policies followed by the Funds:
Valuation: The Funds’ investments are valued at fair value as of the close of trading on the New York Stock Exchange (“NYSE”) (generally 4:00 p.m., Eastern time). U.S. GAAP defines fair value as the price the Funds would receive to sell an asset or pay to transfer a liability in an orderly transaction between market participants at the measurement date. The Funds determine the fair values of their financial instruments at market value using independent dealers or pricing services under policies approved by the Board of Directors of each Fund (the “Board”). The BlackRock Global Valuation Methodologies Committee (the “Global Valuation Committee”) is the committee formed by management to develop global pricing policies and procedures and to provide oversight of the pricing function for the Funds for all financial instruments.
Each Fund’s policy is to fair value its financial instruments at market value. The Funds record their investment in the Series at fair value based on each Fund’s proportionate interest in the net assets of the respective Series. Valuation of securities held by the Series is discussed in Note 2 of the Series’s Notes to Financial Statements, which are included elsewhere in this report.
Investment Transactions and Investment Income: For financial reporting purposes, contributions to and withdrawals from the Series are accounted on a trade date basis. The Funds record daily their proportionate share of the Series income, expenses and realized and unrealized gains and losses. In addition, the Funds accrue their own expenses. Income, expenses and realized and unrealized gains and losses are allocated daily to each class based on its relative net assets.
Distributions: Distributions paid by the Funds are recorded on the ex-dividend date. The character and timing of distributions are determined in accordance with federal income tax regulations, which may differ from U.S. GAAP.
Other: Expenses directly related to a Fund are charged to that Fund. Other operating expenses shared by several funds are prorated among those funds on the basis of relative net assets or other appropriate methods. Expenses directly related to the Funds and other shared expenses prorated to the Funds are allocated daily to each class based on its relative net assets or other appropriate methods.
3. Administration Agreement and Other Transactions with Affiliates:
The PNC Financial Services Group, Inc. is the largest stockholder and an affiliate of BlackRock Inc. (“BlackRock”) for 1940 Act purposes.
| | | | | | |
| | | | | | | |
| | BLACKROCK INDEX FUNDS, INC. | | JUNE 30, 2015 | | 19 |
| | |
| Notes to Financial Statements (continued) | | BlackRock Index Funds, Inc. |
The Corporation, on behalf of the Funds, entered into an Administration Agreement with BlackRock Advisors, LLC (the “Administrator”), an indirect, wholly owned subsidiary of BlackRock, to provide administrative services (other than investment advice and related portfolio activities). For such services, International Index and Small Cap Index pay the Administrator a monthly fee at an annual rate of 0.01% and 0.04%, respectively, of the average daily value of the Funds’ net assets. The Funds do not pay an investment advisory fee or investment management fee. Prior to April 30, 2015, the Funds paid the Administrator a monthly fee at an annual rate of 0.03% and 0.08%, respectively, of the average daily value of the Funds’ net assets.
The Administrator contractually agreed to waive and/or reimburse fees or expenses. In order to limit expenses, excluding interest expense, dividend expense, acquired fund fees and expenses and certain other fund expenses, which constitute extraordinary expenses not incurred in the ordinary course of each Fund’s business. The expense limitations as a percentage of average daily net assets are as follows:
| | | | | | | | |
| | | International Index | | | Small Cap Index | |
Institutional | | | 0.12% | | | | 0.17% | |
Investor A | | | 0.37% | | | | 0.42% | |
Class K | | | 0.07% | | | | 0.12% | |
Prior to April 30, 2015, the expense limitations as a percentage of average daily net assets were as follows:
| | | | | | | | |
| | | International Index | | | Small Cap Index | |
Institutional | | | 0.14% | | | | 0.21% | |
Investor A | | | 0.39% | | | | 0.46% | |
Class K | | | 0.09% | | | | 0.16% | |
The Administrator has agreed not to reduce or discontinue this contractual waiver or reimbursement prior to May 1, 2016 unless approved by the Corporation’s Board, including a majority of the Independent Directors. These amounts are shown as administration fees waived and transfer agent fees waived and/or reimbursed — class specific, respectively, in the Statements of Operations.
For the six months ended June 30, 2015, the amounts shown as transfer agent fees waived and/or reimbursed — class specific were as follows:
| | | | | | | | |
| | | International Index | | | Small Cap Index | |
Institutional | | | — | | | $ | 44 | |
Investor A | | $ | 83,286 | | | $ | 4,570 | |
Class K | | $ | 327 | | | $ | 239 | |
The Corporation, on behalf of the Funds, entered into a Distribution Agreement and a Distribution and Service Plan with BlackRock Investments, LLC (“BRIL”), an affiliate of BlackRock. Pursuant to the Distribution and Service Plan and in accordance with Rule 12b-1 under the 1940 Act, each Fund pays BRIL ongoing service and distribution fees with respect to Investor A Shares. The fees are accrued daily and paid monthly at the annual rate of 0.25% based upon the average daily net assets.
Pursuant to sub-agreements with BRIL, broker-dealers and BRIL provide shareholder servicing to the Funds. The ongoing service fee compensates BRIL and each broker-dealer for providing shareholder servicing related services to Investor A shareholders.
Pursuant to written agreements, certain financial intermediaries, some of which may be affiliates, provide the Funds with sub-accounting, recordkeeping, sub-transfer agency and other administrative services with respect to sub-accounts they service. For these services, these entities receive an asset-based fee or an annual fee per shareholder account, which will vary depending on share class and/or net assets. For the six months ended June 30, 2015, the Funds paid the following amounts to affiliates of BlackRock in return for these services, which are included in transfer agent — class specific in the Statements of Operations:
| | | | | | | | |
| | | International Index | | | Small Cap Index | |
Investor A | | $ | 3 | | | $ | 25 | |
The Administrator maintains a call center, which is responsible for providing certain shareholder services to the Funds, such as responding to shareholder inquiries and processing transactions based upon instructions from shareholders with respect to the subscription and redemption of Fund shares. For the six months ended June 30, 2015, each Fund reimbursed the Administrator the following amounts for costs incurred in running the call center, which are included in transfer agent — class specific in the Statements of Operations:
| | | | | | | | |
| | | International Index | | | Small Cap Index | |
Institutional | | $ | 428 | | | $ | 188 | |
Investor A | | $ | 2,388 | | | $ | 1,197 | |
Class K | | $ | 12 | | | | — | |
Certain officers and/or directors of the Corporation are officers and/or directors of BlackRock or its affiliates. The Funds reimburse the Administrator for compensation paid to the Corporation’s Chief Compliance Officer, which is included in officer and directors in the Statements of Operations.
| | | | | | |
| | | | | | | |
| 20 | | BLACKROCK INDEX FUNDS, INC. | | JUNE 30, 2015 | | |
| | | | |
| Notes to Financial Statements (continued) | | BlackRock Index Funds, Inc. |
4. Income Tax Information:
It is the Funds’ policy to comply with the requirements of the Internal Revenue Code of 1986, as amended, applicable to regulated investment companies, and to distribute substantially all of their taxable income to their shareholders. Therefore, no federal income tax provision is required.
The Funds file U.S. federal and various state and local tax returns. No income tax returns are currently under examination. The statute of limitations on the Funds’ U.S. federal tax returns remains open for each of the four years ended December 31, 2014. The statutes of limitations on the Funds’ state and local tax returns may remain open for an additional year depending upon the jurisdiction.
Management has analyzed tax laws and regulations and their application to the Funds’ as of June 30, 2015, inclusive of the open tax return years, and does not believe that there are any uncertain tax positions that require recognition of a tax liability in the Funds’ financial statements.
As of December 31, 2014, International Index had capital loss carryforwards available to offset future realized capital gains through the indicated expiration dates as follows:
| | | | |
| Expires December 31, | | International Index | |
2016 | | $ | 4,270,741 | |
2017 | | | 6,596,186 | |
No expiration date1 | | | 32,111,624 | |
| | | | |
Total | | $ | 42,978,551 | |
| | | | |
| | 1 | | Must be utilized prior to losses subject to expiration. |
5. Capital Share Transactions:
Transactions in capital shares for each class were as follows:
| | | | | | | | | | | | | | | | | | |
| | | Six Months Ended
June 30, 2015 | | | | | Year Ended
December 31, 2014 | |
| International Index | | Shares | | | Amount | | | | | Shares | | | Amount | |
| Institutional | | | | | | | | | | | | | | | | | | |
Shares sold | | | 88,739,063 | | | $ | 1,177,199,409 | | | | | | 144,662,721 | | | $ | 1,845,029,543 | |
Shares issued to shareholders in reinvestment of distributions | | | 54,780 | | | | 666,668 | | | | | | 1,030,829 | | | | 12,541,117 | |
Shares redeemed | | | (20,610,649 | ) | | | (269,315,307 | ) | | | | | (6,610,394 | ) | | | (84,894,321 | ) |
| | | | | | | | | | |
Net increase | | | 68,183,194 | | | $ | 908,550,770 | | | | | | 139,083,156 | | | $ | 1,772,676,339 | |
| | | | | | | | | | |
| | | | | | | | | | | | | | | | | | |
| Investor A | | | | | | | | | | | | | | | | | | |
Shares sold | | | 4,638,766 | | | $ | 59,469,146 | | | | | | 11,606,455 | | | $ | 151,854,021 | |
Shares issued to shareholders in reinvestment of distributions | | | 10,428 | | | | 125,968 | | | | | | 132,973 | | | | 1,629,568 | |
Shares redeemed | | | (9,311,469 | ) | | | (120,852,532 | ) | | | | | (8,019,713 | ) | | | (105,018,790 | ) |
| | | | | | | | | | |
Net increase (decrease) | | | (4,662,275 | ) | | $ | (61,257,418 | ) | | | | | 3,719,715 | | | $ | 48,464,799 | |
| | | | | | | | | | |
| | | | | | | | | | | | | | | | | | |
| Class K | | | | | | | | | | | | | | | | | | |
Shares sold | | | 1,264,426 | | | $ | 16,126,165 | | | | | | 1,344,085 | | | $ | 17,426,754 | |
Shares issued to shareholders in reinvestment of distributions | | | 497 | | | | 6,054 | | | | | | 9,743 | | | | 119,038 | |
Shares redeemed | | | (307,677 | ) | | | (3,958,022 | ) | | | | | (220,728 | ) | | | (2,825,407 | ) |
| | | | | | | | | | |
Net increase | | | 957,246 | | | $ | 12,174,197 | | | | | | 1,133,100 | | | $ | 14,720,385 | |
| | | | | | | | | | |
Total Net Increase | | | 64,478,165 | | | $ | 859,467,549 | | | | | | 143,935,971 | | | $ | 1,835,861,523 | |
| | | | | | | | | | |
| | | | | | | | | | | | | | | | | | |
| | | Six Months Ended
June 30, 2015 | | | | | Year Ended
December 31, 2014 | |
| Small Cap Index | | Shares | | | Amount | | | | | Shares | | | Amount | |
| Institutional | | | | | | | | | | | | | | | | | | |
Shares sold | | | 4,250,100 | | | $ | 72,817,155 | | | | | | 1,065,529 | | | $ | 18,355,091 | |
Shares issued to shareholders in reinvestment of distributions | | | — | | | | — | | | | | | 272,582 | | | | 4,364,658 | |
Shares redeemed | | | (1,292,583 | ) | | | (22,305,841 | ) | | | | | (1,975,628 | ) | | | (33,823,911 | ) |
| | | | | | | | | | |
Net increase (decrease) | | | 2,957,517 | | | $ | 50,511,314 | | | | | | (637,517 | ) | | $ | (11,104,162 | ) |
| | | | | | | | | | |
| | | | | | |
| | | | | | | |
| | BLACKROCK INDEX FUNDS, INC. | | JUNE 30, 2015 | | 21 |
| | |
| Notes to Financial Statements (concluded) | | BlackRock Index Funds, Inc. |
| | | | | | | | | | | | | | | | | | |
| | | Six Months Ended
June 30, 2015 | | | | | Year Ended
December 31, 2014 | |
| Small Cap Index (concluded) | | Shares | | | Amount | | | | | Shares | | | Amount | |
| Investor A | | | | | | | | | | | | | | | | | | |
Shares sold and automatic conversion of shares | | | 1,342,117 | | | $ | 22,526,175 | | | | | | 1,065,381 | | | $ | 18,374,630 | |
Shares issued to shareholders in reinvestment of distributions | | | — | | | | — | | | | | | 451,129 | | | | 7,219,938 | |
Shares redeemed | | | (796,946 | ) | | | (13,618,571 | ) | | | | | (1,213,790 | ) | | | (21,038,490 | ) |
| | | | | | | | | | |
Net increase | | | 545,171 | | | $ | 8,907,604 | | | | | | 302,720 | | | $ | 4,556,078 | |
| | | | | | | | | | |
| | | | | | | | | | | | | | | | | | |
| Class K | | | | | | | | | | | | | | | | | | |
Shares sold | | | 179,972 | | | $ | 3,042,023 | | | | | | 125,184 | | | $ | 2,169,394 | |
Shares issued to shareholders in reinvestment of distributions | | | — | | | | — | | | | | | 15,634 | | | | 249,688 | |
Shares redeemed | | | (33,905 | ) | | | (571,278 | ) | | | | | (51,667 | ) | | | (874,616 | ) |
| | | | | | | | | | |
Net increase | | | 146,067 | | | $ | 2,470,745 | | | | | | 89,151 | | | $ | 1,544,466 | |
| | | | | | | | | | |
Total Net Increase (Decrease) | | | 3,648,755 | | | $ | 61,889,663 | | | | | | (245,646 | ) | | $ | (5,003,618 | ) |
| | | | | | | | | | |
6. Subsequent Events:
Management has evaluated the impact of all subsequent events on the Funds through the date the financial statements were issued and has determined that there were no subsequent events requiring adjustment or additional disclosure in the financial statements.
| | | | | | |
| | | | | | | |
| 22 | | BLACKROCK INDEX FUNDS, INC. | | JUNE 30, 2015 | | |
| | |
| Series Portfolio Information as of June 30, 2015 | | Quantitative Master Series LLC |
|
| Master International Index Series |
|
| Master Small Cap Index Series |
| | |
| Ten Largest Holdings | | Percent of
Long-Term Investments |
| | | | |
Nestlé SA, Registered Shares | | | 2 | % |
Novartis AG, Registered Shares | | | 2 | |
Roche Holding AG | | | 2 | |
Toyota Motor Corp. | | | 1 | |
HSBC Holdings PLC | | | 1 | |
BP PLC | | | 1 | |
Sanofi | | | 1 | |
Bayer AG, Registered Shares | | | 1 | |
Royal Dutch Shell PLC, Class A | | | 1 | |
Commonwealth Bank of Australia | | | 1 | |
| | |
| Geographic Allocation | | Percent of
Long-Term Investments |
| | | | |
Japan | | | 23 | % |
United Kingdom | | | 18 | |
France | | | 10 | |
Switzerland | | | 10 | |
Germany | | | 9 | |
Australia | | | 7 | |
Netherlands | | | 4 | |
Spain | | | 3 | |
Hong Kong | | | 3 | |
Sweden | | | 3 | |
Italy | | | 2 | |
Denmark | | | 2 | |
Other1 | | | 6 | |
| | 1 | | Includes holdings within countries that are 1% or less of long-term investments. Please refer to the Schedule of Investments for such countries. |
| | |
| Ten Largest Holdings | | Percent of
Long-Term Investments |
| | | | |
Team Health Holdings, Inc. | | | 0.2 | % |
Manhattan Associates, Inc. | | | 0.2 | |
Cepheid, Inc. | | | 0.2 | |
Tyler Technologies, Inc. | | | 0.2 | |
MAXIMUS, Inc. | | | 0.2 | |
Investors Bancorp, Inc. | | | 0.2 | |
HealthSouth Corp. | | | 0.2 | |
West Pharmaceutical Services, Inc. | | | 0.2 | |
Neurocrine Biosciences, Inc. | | | 0.2 | |
Prosperity Bancshares, Inc. | | | 0.2 | |
| | |
| Sector Allocation | | Percent of
Long-Term Investments |
| | | | |
Financial | | | 24 | % |
Information Technology | | | 17 | |
Health Care | | | 16 | |
Consumer Discretionary | | | 15 | |
Industrials | | | 13 | |
Materials | | | 4 | |
Energy | | | 4 | |
Utilities | | | 3 | |
Consumer Staples | | | 3 | |
Telecommunication Services | | | 1 | |
For Series compliance purposes, the Series’ sector classifications refer to any one or more of the sector sub-classifications used by one or more widely recognized market indexes, and/or as defined by the investment advisor. These definitions may not apply for purposes of this report, which may combine such sector sub-classifications for reporting ease.
| | | | | | |
| | | | | | | |
| | BLACKROCK INDEX FUNDS, INC. | | JUNE 30, 2015 | | 23 |
| | |
Schedule of Investments June 30, 2015 (Unaudited) | | Master International Index Series (Percentages shown are based on Net Assets) |
| | | | | | | | |
| Common Stocks | | Shares | | | Value | |
Australia — 6.7% | | | | | | | | |
AGL Energy Ltd. | | | 187,477 | | | $ | 2,245,768 | |
Alumina Ltd. | | | 849,453 | | | | 999,891 | |
Amcor Ltd. | | | 350,674 | | | | 3,705,745 | |
AMP Ltd. | | | 800,702 | | | | 3,715,505 | |
APA Group | | | 304,683 | | | | 1,935,210 | |
Aristocrat Leisure Ltd. | | | 144,821 | | | | 853,993 | |
Asciano Ltd. | | | 273,320 | | | | 1,400,562 | |
ASX Ltd. | | | 52,552 | | | | 1,616,204 | |
Aurizon Holdings Ltd. | | | 592,941 | | | | 2,342,301 | |
AusNet Services | | | 449,402 | | | | 483,432 | |
Australia & New Zealand Banking Group Ltd. | | | 772,641 | | | | 19,174,754 | |
Bank of Queensland Ltd. | | | 120,072 | | | | 1,181,443 | |
Bendigo & Adelaide Bank Ltd. | | | 143,888 | | | | 1,360,557 | |
BGP Holdings PLC (a) | | | 783,183 | | | | 9 | |
BHP Billiton Ltd. | | | 878,671 | | | | 17,923,854 | |
Boral Ltd. | | | 228,900 | | | | 1,031,163 | |
Brambles Ltd. | | | 421,993 | | | | 3,442,499 | |
Caltex Australia Ltd. | | | 73,627 | | | | 1,807,404 | |
CIMIC Group, Ltd. | | | 23,200 | | | | 388,651 | |
Coca-Cola Amatil Ltd. | | | 184,314 | | | | 1,300,139 | |
Cochlear Ltd. | | | 16,471 | | | | 1,017,882 | |
Commonwealth Bank of Australia | | | 451,442 | | | | 29,604,170 | |
Computershare Ltd. | | | 119,489 | | | | 1,076,173 | |
Crown Resorts Ltd. | | | 98,617 | | | | 926,604 | |
CSL Ltd. | | | 130,178 | | | | 8,678,495 | |
Dexus Property Group | | | 297,376 | | | | 1,673,336 | |
Federation Centres Ltd. | | | 848,556 | | | | 1,909,343 | |
Flight Centre Travel Group Ltd. | | | 16,412 | | | | 431,354 | |
Fortescue Metals Group Ltd. (b) | | | 431,377 | | | | 635,312 | |
Goodman Group | | | 475,031 | | | | 2,294,248 | |
GPT Group | | | 489,158 | | | | 1,612,588 | |
Harvey Norman Holdings Ltd. | | | 162,714 | | | | 565,011 | |
Healthscope Ltd. | | | 321,481 | | | | 673,168 | |
Iluka Resources Ltd. | | | 126,019 | | | | 745,239 | |
Incitec Pivot Ltd. | | | 473,370 | | | | 1,403,419 | |
Insurance Australia Group Ltd. | | | 652,219 | | | | 2,804,133 | |
Lend Lease Group | | | 148,842 | | | | 1,720,948 | |
Macquarie Group Ltd. | | | 81,772 | | | | 5,123,457 | |
Medibank Pvt, Ltd. (a) | | | 766,647 | | | | 1,187,928 | |
Mirvac Group | | | 1,147,530 | | | | 1,634,863 | |
National Australia Bank Ltd. | | | 730,618 | | | | 18,765,242 | |
Newcrest Mining Ltd. (a) | | | 213,655 | | | | 2,151,322 | |
Orica Ltd. | | | 98,184 | | | | 1,611,677 | |
Origin Energy Ltd. | | | 296,792 | | | | 2,739,178 | |
Platinum Asset Management Ltd. | | | 75,974 | | | | 437,840 | |
Qantas Airways Ltd. | | | 176,948 | | | | 429,981 | |
QBE Insurance Group Ltd. | | | 367,953 | | | | 3,874,581 | |
Ramsay Health Care Ltd. | | | 39,359 | | | | 1,864,353 | |
REA Group Ltd. | | | 14,420 | | | | 434,954 | |
Rio Tinto Ltd. | | | 124,963 | | | | 5,169,311 | |
Santos Ltd. | | | 301,300 | | | | 1,819,153 | |
Scentre Group | | | 1,425,761 | | | | 4,118,606 | |
Seek Ltd. | | | 82,747 | | | | 896,706 | |
Sonic Healthcare Ltd. | | | 99,676 | | | | 1,641,332 | |
South32, Ltd. | | | 1,427,620 | | | | 1,971,650 | |
Stockland | | | 657,046 | | | | 2,074,768 | |
Suncorp Group Ltd. | | | 349,570 | | | | 3,616,674 | |
Sydney Airport | | | 299,518 | | | | 1,149,305 | |
Tabcorp Holdings Ltd. | | | 235,938 | | | | 827,020 | |
| Common Stocks | | Shares | | | Value | |
Australia (concluded) | | | | | | | | |
Tatts Group Ltd. | | | 383,922 | | | | 1,100,802 | |
Telstra Corp. Ltd. | | | 1,184,804 | | | | 5,607,141 | |
TPG Telecom Ltd. | | | 63,778 | | | | 440,528 | |
Transurban Group | | | 529,183 | | | | 3,794,033 | |
Treasury Wine Estates Ltd. | | | 187,715 | | | | 720,885 | |
Wesfarmers Ltd. | | | 307,202 | | | | 9,238,526 | |
Westfield Corp. | | | 530,568 | | | | 3,726,567 | |
Westpac Banking Corp. | | | 870,646 | | | | 21,541,532 | |
Woodside Petroleum Ltd. | | | 211,960 | | | | 5,592,916 | |
Woolworths Ltd. | | | 346,104 | | | | 7,191,783 | |
WorleyParsons Ltd. | | | 58,158 | | | | 466,937 | |
| | | | | | | | |
| | | | | | | | 247,642,058 | |
Austria — 0.2% | | | | | | | | |
Andritz AG | | | 20,805 | | | | 1,152,098 | |
Erste Group Bank AG (a) | | | 83,596 | | | | 2,381,769 | |
OMV AG | | | 38,454 | | | | 1,058,627 | |
Raiffeisen Bank International AG | | | 44,493 | | | | 647,427 | |
Strabag SE | | | 30,711 | | | | 1 | |
Voestalpine AG | | | 28,418 | | | | 1,184,387 | |
| | | | | | | | |
| | | | | | | | 6,424,309 | |
Belgium — 1.3% | | | | | | | | |
Ageas | | | 58,773 | | | | 2,267,656 | |
Anheuser-Busch InBev NV | | | 219,659 | | | | 26,433,838 | |
Belgacom SA | | | 47,252 | | | | 1,672,102 | |
Colruyt SA | | | 20,019 | | | | 898,012 | |
Delhaize Group | | | 28,029 | | | | 2,279,802 | |
Groupe Bruxelles Lambert SA | | | 22,956 | | | | 1,851,096 | |
KBC Groep NV (a) | | | 69,680 | | | | 4,671,216 | |
Solvay SA | | | 16,199 | | | | 2,231,660 | |
Telenet Group Holding NV (a) | | | 15,436 | | | | 839,833 | |
UCB SA | | | 37,518 | | | | 2,697,739 | |
Umicore SA | | | 27,318 | | | | 1,297,237 | |
| | | | | | | | |
| | | | | | | | 47,140,191 | |
Denmark — 1.6% | | | | | | | | |
A.P. Moeller — Maersk A/S, Class A | | | 1,008 | | | | 1,767,835 | |
A.P. Moeller — Maersk A/S, Class B | | | 2,015 | | | | 3,643,202 | |
Carlsberg A/S, Class B | | | 30,039 | | | | 2,721,703 | |
Coloplast A/S, Class B | | | 30,257 | | | | 1,984,350 | |
Danske Bank A/S | | | 194,227 | | | | 5,709,688 | |
DSV A/S | | | 46,960 | | | | 1,520,608 | |
ISS A/S (a) | | | 41,481 | | | | 1,366,196 | |
Novo Nordisk A/S, Class B | | | 520,529 | | | | 28,563,958 | |
Novozymes A/S, Class B | | | 66,360 | | | | 3,152,806 | |
Pandora A/S | | | 31,102 | | | | 3,337,375 | |
TDC A/S | | | 225,902 | | | | 1,655,940 | |
Tryg A/S | | | 34,120 | | | | 711,401 | |
Vestas Wind Systems A/S | | | 60,488 | | | | 3,014,934 | |
William Demant Holding A/S (a) | | | 7,188 | | | | 548,346 | |
| | | | | | | | |
| | | | | | | | 59,698,342 | |
Finland — 0.8% | | | | | | | | |
Elisa OYJ | | | 40,139 | | | | 1,271,725 | |
Fortum OYJ | | | 125,915 | | | | 2,236,873 | |
Kone OYJ, Class B | | | 85,130 | | | | 3,455,428 | |
Metso OYJ | | | 32,769 | | | | 900,624 | |
Neste Oil OYJ | | | 37,195 | | | | 948,846 | |
| | |
| CVA | | Certificaten Van Aandelen (Dutch Certificate) |
| CVR | | Contingent Value Rights |
| FTSE | | Financial Times Stock Exchange |
| REIT | | Real Estate Investment Trust |
| USD | | U.S. Dollar |
See Notes to Financial Statements.
| | | | | | |
| | | | | | | |
| 24 | | BLACKROCK INDEX FUNDS, INC. | | JUNE 30, 2015 | | |
| | |
Schedule of Investments (continued) | | Master International Index Series (Percentages shown are based on Net Assets) |
| | | | | | | | |
| Common Stocks | | Shares | | | Value | |
Finland (concluded) | | | | | | | | |
Nokia OYJ | | | 1,043,539 | | | $ | 7,113,761 | |
Nokian Renkaat OYJ | | | 33,098 | | | | 1,036,973 | |
Orion OYJ, Class B | | | 28,540 | | | | 999,709 | |
Sampo OYJ, Class A | | | 127,571 | | | | 6,012,030 | |
Stora Enso OYJ, Class R | | | 152,508 | | | | 1,571,631 | |
UPM-Kymmene OYJ | | | 148,967 | | | | 2,636,105 | |
Wartsila OYJ | | | 40,461 | | | | 1,895,881 | |
| | | | | | | | |
| | | | | | | | 30,079,586 | |
France — 9.5% | | | | | | | | |
Accor SA | | | 58,011 | | | | 2,935,942 | |
Aeroports de Paris | | | 7,309 | | | | 825,630 | |
Air Liquide SA | | | 96,867 | | | | 12,291,501 | |
Airbus Group NV | | | 161,455 | | | | 10,516,742 | |
Alcatel-Lucent (a) | | | 826,816 | | | | 3,015,588 | |
Alstom SA | | | 57,744 | | | | 1,640,175 | |
ArcelorMittal | | | 277,874 | | | | 2,698,602 | |
Arkema | | | 20,662 | | | | 1,493,605 | |
AtoS | | | 23,662 | | | | 1,768,102 | |
AXA SA | | | 531,107 | | | | 13,464,537 | |
BNP Paribas SA | | | 288,881 | | | | 17,530,085 | |
Bollore SA | | | 272,969 | | | | 1,460,226 | |
Bouygues SA | | | 55,276 | | | | 2,066,575 | |
Bureau Veritas SA | | | 73,521 | | | | 1,694,803 | |
Cap Gemini SA | | | 42,725 | | | | 3,790,411 | |
Carrefour SA | | | 158,099 | | | | 5,080,273 | |
Casino Guichard-Perrachon SA | | | 15,584 | | | | 1,182,863 | |
Christian Dior SA | | | 14,325 | | | | 2,804,389 | |
Cie Generale des Etablissements Michelin | | | 51,115 | | | | 5,378,512 | |
CNP Assurances | | | 44,564 | | | | 745,856 | |
Compagnie de Saint-Gobain | | | 130,303 | | | | 5,882,057 | |
Credit Agricole SA | | | 285,990 | | | | 4,269,815 | |
Danone SA | | | 157,865 | | | | 10,225,608 | |
Dassault Systemes SA | | | 34,428 | | | | 2,499,272 | |
Edenred | | | 54,814 | | | | 1,354,385 | |
EDF | | | 74,847 | | | | 1,674,223 | |
Essilor International SA | | | 56,076 | | | | 6,717,928 | |
Eurazeo | | | 11,658 | | | | 774,329 | |
Eutelsat Communications SA | | | 47,382 | | | | 1,530,590 | |
Fonciere Des Regions | | | 7,047 | | | | 599,556 | |
GDF Suez | | | 413,787 | | | | 7,704,029 | |
Gecina SA | | | 9,068 | | | | 1,117,600 | |
Groupe Eurotunnel SA, Registered Shares | | | 128,891 | | | | 1,868,817 | |
Hermes International | | | 7,012 | | | | 2,618,136 | |
ICADE | | | 9,872 | | | | 706,130 | |
Iliad SA | | | 7,306 | | | | 1,619,651 | |
Imerys SA | | | 8,311 | | | | 637,562 | |
JCDecaux SA | | | 21,415 | | | | 895,539 | |
Kering | | | 20,515 | | | | 3,667,816 | |
Klepierre | | | 46,200 | | | | 2,036,931 | |
L’Oreal SA | | | 70,878 | | | | 12,681,553 | |
Lafarge SA | | | 50,799 | | | | 3,358,681 | |
Lagardere SCA | | | 32,521 | | | | 951,591 | |
Legrand SA | | | 71,280 | | | | 4,011,773 | |
LVMH Moet Hennessy Louis Vuitton SA | | | 76,138 | | | | 13,385,839 | |
Natixis | | | 255,735 | | | | 1,845,726 | |
Numericable-SFR | | | 26,086 | | | | 1,382,702 | |
Orange SA | | | 505,945 | | | | 7,819,049 | |
Pernod Ricard SA | | | 57,891 | | | | 6,692,337 | |
Peugeot SA | | | 118,735 | | | | 2,448,532 | |
Publicis Groupe SA | | | 50,742 | | | | 3,761,145 | |
Remy Cointreau SA | | | 5,536 | | | | 399,953 | |
Renault SA | | | 52,873 | | | | 5,543,594 | |
Rexel SA | | | 81,619 | | | | 1,317,055 | |
Safran SA | | | 80,161 | | | | 5,447,691 | |
Sanofi | | | 330,392 | | | | 32,685,630 | |
Schneider Electric SE | | | 151,281 | | | | 10,474,544 | |
| Common Stocks | | Shares | | | Value | |
France (concluded) | | | | | | | | |
SCOR SE | | | 42,527 | | | | 1,503,816 | |
SES SA | | | 89,612 | | | | 3,012,573 | |
Societe BIC SA | | | 8,051 | | | | 1,283,519 | |
Societe Generale SA | | | 197,811 | | | | 9,282,037 | |
Sodexo | | | 25,173 | | | | 2,396,412 | |
Suez Environnement Co. | | | 81,913 | | | | 1,529,233 | |
Technip SA | | | 27,674 | | | | 1,715,072 | |
Thales SA | | | 28,042 | | | | 1,694,324 | |
Total SA | | | 595,918 | | | | 29,230,340 | |
Unibail-Rodamco SE | | | 26,704 | | | | 6,773,034 | |
Valeo SA | | | 21,843 | | | | 3,455,190 | |
Vallourec SA | | | 26,693 | | | | 545,328 | |
Veolia Environnement SA | | | 126,845 | | | | 2,597,086 | |
Vinci SA | | | 129,016 | | | | 7,487,793 | |
Vivendi SA (a) | | | 326,038 | | | | 8,267,207 | |
Wendel SA | | | 8,940 | | | | 1,098,541 | |
Zodiac Aerospace | | | 56,038 | | | | 1,825,368 | |
| | | | | | | | |
| | | | | 348,688,659 | |
Germany — 8.7% | | | | | | | | |
adidas AG | | | 58,135 | | | | 4,448,159 | |
Allianz SE, Registered Shares | | | 124,732 | | | | 19,452,080 | |
Axel Springer AG | | | 12,585 | | | | 660,960 | |
BASF SE | | | 251,078 | | | | 22,093,085 | |
Bayer AG, Registered Shares | | | 225,929 | | | | 31,639,108 | |
Bayerische Motoren Werke AG | | | 90,975 | | | | 9,963,071 | |
Bayerische Motoren Werke AG, Preference Shares | | | 17,170 | | | | 1,453,835 | |
Beiersdorf AG | | | 27,426 | | | | 2,298,031 | |
Brenntag AG | | | 45,855 | | | | 2,631,223 | |
Commerzbank AG | | | 296,688 | | | | 3,792,742 | |
Continental AG | | | 31,216 | | | | 7,391,241 | |
Daimler AG, Registered Shares | | | 268,390 | | | | 24,449,147 | |
Deutsche Annington Immobilien SE | | | 123,349 | | | | 3,480,658 | |
Deutsche Bank AG, Registered Shares | | | 378,392 | | | | 11,376,991 | |
Deutsche Boerse AG | | | 59,186 | | | | 4,902,233 | |
Deutsche Lufthansa AG, Registered Shares (a) | | | 66,433 | | | | 857,120 | |
Deutsche Post AG, Registered Shares | | | 265,277 | | | | 7,751,202 | |
Deutsche Telekom AG, Registered Shares | | | 868,378 | | | | 14,971,088 | |
Deutsche Wohnen AG, Bearer Shares | | | 81,704 | | | | 1,873,138 | |
E.ON SE | | | 550,696 | | | | 7,343,231 | |
Evonik Industries AG | | | 24,664 | | | | 941,752 | |
Fraport AG Frankfurt Airport Services Worldwide | | | 9,794 | | | | 615,183 | |
Fresenius Medical Care AG & Co. KGaA | | | 60,290 | | | | 4,991,181 | |
Fresenius SE & Co. KGaA | | | 104,317 | | | | 6,697,815 | |
Fuchs Petrolub SE, Preference Shares | | | 19,203 | | | | 811,956 | |
GEA Group AG | | | 54,586 | | | | 2,435,242 | |
Hannover Rueck SE | | | 15,900 | | | | 1,538,907 | |
HeidelbergCement AG | | | 37,790 | | | | 2,995,115 | |
Henkel AG & Co. KGaA | | | 28,956 | | | | 2,761,124 | |
Henkel AG & Co. KGaA, Preference Shares | | | 48,255 | | | | 5,414,983 | |
Hugo Boss AG | | | 18,081 | | | | 2,021,385 | |
Infineon Technologies AG | | | 326,240 | | | | 4,048,505 | |
K+S AG, Registered Shares | | | 53,068 | | | | 2,237,761 | |
Kabel Deutschland Holding AG (a) | | | 7,482 | | | | 1,001,205 | |
Lanxess AG | | | 26,135 | | | | 1,542,019 | |
Linde AG | | | 52,343 | | | | 9,919,696 | |
MAN SE | | | 11,536 | | | | 1,188,503 | |
Merck KGaA | | | 34,779 | | | | 3,467,125 | |
Metro AG | | | 45,697 | | | | 1,443,300 | |
Muenchener Rueckversicherungs AG, Registered Shares | | | 47,267 | | | | 8,380,166 | |
Osram Licht AG | | | 28,431 | | | | 1,360,159 | |
Porsche Automobil Holding SE, Preference Shares | | | 41,372 | | | | 3,488,342 | |
ProSiebenSat.1 Media AG, Registered Shares | | | 59,231 | | | | 2,925,662 | |
RWE AG | | | 134,371 | | | | 2,890,101 | |
SAP AG | | | 268,590 | | | | 18,821,788 | |
Siemens AG, Registered Shares | | | 221,155 | | | | 22,374,554 | |
See Notes to Financial Statements.
| | | | | | |
| | | | | | | |
| | BLACKROCK INDEX FUNDS, INC. | | JUNE 30, 2015 | | 25 |
| | |
Schedule of Investments (continued) | | Master International Index Series (Percentages shown are based on Net Assets) |
| | | | | | | | |
| Common Stocks | | Shares | | | Value | |
Germany (concluded) | | | | | | | | |
Symrise AG | | | 33,201 | | | $ | 2,061,951 | |
Telefonica Deutschland Holding AG (a) | | | 150,330 | | | | 866,015 | |
ThyssenKrupp AG | | | 105,339 | | | | 2,740,333 | |
TUI AG | | | 136,027 | | | | 2,200,953 | |
United Internet AG, Registered Shares | | | 32,539 | | | | 1,446,197 | |
Volkswagen AG | | | 10,576 | | | | 2,448,835 | |
Volkswagen AG, Preference Shares | | | 45,901 | | | | 10,652,641 | |
| | | | | | | | |
| | | | | | | | 321,558,797 | |
Hong Kong — 3.2% | | | | | | | | |
AIA Group Ltd. | | | 3,360,800 | | | | 21,975,122 | |
ASM Pacific Technology Ltd. | | | 85,004 | | | | 841,227 | |
Bank of East Asia Ltd. | | | 314,532 | | | | 1,374,125 | |
BOC Hong Kong Holdings Ltd. | | | 1,068,400 | | | | 4,446,734 | |
Cathay Pacific Airways Ltd. | | | 327,263 | | | | 804,055 | |
Cheung Kong Infrastructure Holdings Ltd. | | | 197,500 | | | | 1,533,074 | |
Cheung Kong Property Holdings, Ltd. | | | 737,439 | | | | 6,117,141 | |
CK Hutchison Holdings Ltd. | | | 737,439 | | | | 10,841,810 | |
CLP Holdings Ltd. | | | 556,187 | | | | 4,727,062 | |
First Pacific Co. Ltd. | | | 663,250 | | | | 559,585 | |
Galaxy Entertainment Group Ltd. | | | 633,000 | | | | 2,518,685 | |
Hang Lung Properties Ltd. | | | 607,000 | | | | 1,803,956 | |
Hang Seng Bank Ltd. | | | 210,053 | | | | 4,102,535 | |
Henderson Land Development Co. Ltd. | | | 315,220 | | | | 2,154,824 | |
HKT Trust & HKT Ltd. | | | 755,560 | | | | 888,946 | |
Hong Kong & China Gas Co. Ltd. | | | 2,009,511 | | | | 4,210,638 | |
Hong Kong Exchanges & Clearing Ltd. | | | 302,727 | | | | 10,666,446 | |
Hysan Development Co. Ltd. | | | 154,791 | | | | 670,319 | |
Kerry Properties Ltd. | | | 168,500 | | | | 660,488 | |
Li & Fung Ltd. | | | 1,661,980 | | | | 1,317,571 | |
The Link REIT | | | 623,914 | | | | 3,651,102 | |
MGM China Holdings Ltd. | | | 313,600 | | | | 512,067 | |
MTR Corp. | | | 402,500 | | | | 1,872,661 | |
New World Development Co. Ltd. | | | 1,448,968 | | | | 1,893,290 | |
NWS Holdings Ltd. | | | 375,824 | | | | 543,271 | |
PCCW Ltd. | | | 1,417,000 | | | | 845,180 | |
Power Assets Holdings Ltd. | | | 403,000 | | | | 3,674,312 | |
Sands China Ltd. | | | 675,000 | | | | 2,268,539 | |
Shangri-La Asia Ltd. | | | 339,905 | | | | 473,911 | |
Sino Land Co. Ltd. | | | 841,263 | | | | 1,404,166 | |
SJM Holdings Ltd. | | | 610,000 | | | | 659,564 | |
Sun Hung Kai Properties Ltd. | | | 474,324 | | | | 7,675,880 | |
Swire Pacific Ltd., Class A | | | 170,077 | | | | 2,135,652 | |
Swire Properties Ltd. | | | 303,800 | | | | 968,966 | |
Techtronic Industries Co. | | | 386,000 | | | | 1,262,075 | |
WH Group Ltd. (a)(c) | | | 1,635,500 | | | | 1,113,138 | |
Wharf Holdings Ltd. | | | 413,357 | | | | 2,746,982 | |
Wheelock & Co. Ltd. | | | 241,000 | | | | 1,229,742 | |
Wynn Macau Ltd. | | | 440,000 | | | | 733,156 | |
Yue Yuen Industrial Holdings Ltd. | | | 182,785 | | | | 611,399 | |
| | | | | | | | |
| | | | | | | | 118,489,396 | |
Ireland — 0.9% | | | | | | | | |
Bank of Ireland (a) | | | 7,606,420 | | | | 3,079,051 | |
CRH PLC | | | 219,312 | | | | 6,183,048 | |
Experian PLC | | | 283,808 | | | | 5,162,009 | |
James Hardie Industries SE | | | 126,500 | | | | 1,683,740 | |
Kerry Group PLC, Class A | | | 41,276 | | | | 3,061,885 | |
Ryanair Holdings PLC | | | 10,891 | | | | 144,022 | |
Shire PLC | | | 165,540 | | | | 13,301,064 | |
| | | | | | | | |
| | | | | | | | 32,614,819 | |
Israel — 0.6% | | | | | | | | |
Azrieli Group | | | 8,578 | | | | 342,368 | |
Bank Hapoalim BM | | | 294,700 | | | | 1,586,061 | |
Bank Leumi Le-Israel BM (a) | | | 387,888 | | | | 1,639,021 | |
Bezeq The Israeli Telecommunication Corp. Ltd. | | | 559,653 | | | | 953,074 | |
| Common Stocks | | Shares | | | Value | |
Israel (concluded) | | | | | | | | |
Delek Group Ltd. | | | 1,219 | | | | 359,407 | |
Israel Chemicals Ltd. | | | 138,102 | | | | 964,565 | |
The Israel Corp. Ltd. | | | 1,111 | | | | 392,122 | |
Mizrahi Tefahot Bank Ltd. (a) | | | 35,985 | | | | 445,968 | |
NICE Systems Ltd. | | | 14,847 | | | | 942,960 | |
Teva Pharmaceutical Industries Ltd. | | | 234,998 | | | | 13,906,698 | |
| | | | | | | | |
| | | | | | | | 21,532,244 | |
Italy — 2.2% | | | | | | | | |
Assicurazioni Generali SpA | | | 328,275 | | | | 5,916,753 | |
Atlantia SpA | | | 114,332 | | | | 2,824,899 | |
Banca Monte dei Paschi di Siena SpA (a) | | | 683,804 | | | | 1,332,409 | |
Banco Popolare SC (a) | | | 72,344 | | | | 1,191,186 | |
Enel Green Power SpA | | | 509,317 | | | | 995,615 | |
Enel SpA | | | 1,991,527 | | | | 9,026,183 | |
Eni SpA | | | 704,041 | | | | 12,504,901 | |
Exor SpA | | | 29,849 | | | | 1,425,883 | |
Finmeccanica SpA (a) | | | 113,326 | | | | 1,425,538 | |
Intesa Sanpaolo SpA | | | 3,727,080 | | | | 13,396,925 | |
Luxottica Group SpA | | | 47,734 | | | | 3,175,164 | |
Mediobanca SpA | | | 156,133 | | | | 1,530,829 | |
Pirelli & C SpA | | | 78,836 | | | | 1,330,526 | |
Prysmian SpA | | | 52,578 | | | | 1,136,544 | |
Saipem SpA (a) | | | 76,040 | | | | 803,521 | |
Snam SpA | | | 630,990 | | | | 3,002,894 | |
Telecom Italia SpA | | | 2,833,610 | | | | 3,600,981 | |
Telecom Italia SpA, Non-Convertible Savings Shares | | | 1,844,048 | | | | 1,880,490 | |
Tenaris SA | | | 127,199 | | | | 1,715,693 | |
Terna — Rete Elettrica Nazionale SpA | | | 470,887 | | | | 2,082,141 | |
UniCredit SpA | | | 1,179,525 | | | | 7,927,435 | |
Unione di Banche Italiane SCpA | | | 236,831 | | | | 1,900,371 | |
UnipolSai SpA | | | 211,988 | | | | 525,171 | |
| | | | | | | | |
| | | | | | | | 80,652,052 | |
Japan — 22.4% | | | | | | | | |
ABC-Mart, Inc. | | | 7,400 | | | | 452,898 | |
Acom Co. Ltd. (a) | | | 116,300 | | | | 445,823 | |
Advantest Corp. | | | 44,400 | | | | 461,652 | |
Aeon Co. Ltd. | | | 194,800 | | | | 2,764,229 | |
AEON Financial Service Co. Ltd. | | | 32,700 | | | | 907,246 | |
Aeon Mall Co. Ltd. | | | 31,250 | | | | 585,180 | |
Air Water, Inc. | | | 36,000 | | | | 658,163 | |
Aisin Seiki Co. Ltd. | | | 51,100 | | | | 2,172,733 | |
Ajinomoto Co., Inc. | | | 156,000 | | | | 3,373,541 | |
Alfresa Holdings Corp. | | | 48,100 | | | | 748,491 | |
Amada Co. Ltd. | | | 100,700 | | | | 1,062,899 | |
ANA Holdings, Inc. | | | 299,000 | | | | 810,687 | |
Aozora Bank Ltd. | | | 329,000 | | | | 1,241,321 | |
Asahi Glass Co. Ltd. | | | 273,100 | | | | 1,639,566 | |
Asahi Group Holdings Ltd. | | | 104,600 | | | | 3,321,904 | |
Asahi Kasei Corp. | | | 349,000 | | | | 2,862,701 | |
Asics Corp. | | | 45,200 | | | | 1,167,660 | |
Astellas Pharma, Inc. | | | 589,500 | | | | 8,397,922 | |
The Bank of Kyoto Ltd. | | | 96,000 | | | | 1,104,301 | |
The Bank of Yokohama Ltd. | | | 315,000 | | | | 1,929,051 | |
Benesse Holdings, Inc. | | | 15,300 | | | | 383,562 | |
Bridgestone Corp. | | | 179,100 | | | | 6,619,998 | |
Brother Industries Ltd. | | | 58,100 | | | | 821,914 | |
Calbee, Inc. | | | 24,700 | | | | 1,040,562 | |
Canon, Inc. | | | 298,600 | | | | 9,686,100 | |
Casio Computer Co. Ltd. (b) | | | 54,600 | | | | 1,076,969 | |
Central Japan Railway Co. | | | 38,800 | | | | 7,001,636 | |
The Chiba Bank Ltd. | | | 199,000 | | | | 1,515,344 | |
Chiyoda Corp. | | | 48,000 | | | | 424,843 | |
Chubu Electric Power Co., Inc. | | | 181,800 | | | | 2,709,574 | |
Chugai Pharmaceutical Co. Ltd. | | | 62,000 | | | | 2,138,587 | |
See Notes to Financial Statements.
| | | | | | |
| | | | | | | |
| 26 | | BLACKROCK INDEX FUNDS, INC. | | JUNE 30, 2015 | | |
| | |
Schedule of Investments (continued) | | Master International Index Series (Percentages shown are based on Net Assets) |
| | | | | | | | |
| Common Stocks | | Shares | | | Value | |
Japan (continued) | | | | | | | | |
The Chugoku Bank Ltd. | | | 56,600 | | | $ | 892,119 | |
The Chugoku Electric Power Co., Inc. | | | 85,100 | | | | 1,241,392 | |
Citizen Holdings Co. Ltd. | | | 73,200 | | | | 510,698 | |
COLOPL, Inc. (b) | | | 13,400 | | | | 270,767 | |
Credit Saison Co. Ltd. | | | 38,500 | | | | 824,311 | |
Dai Nippon Printing Co. Ltd. | | | 144,000 | | | | 1,485,915 | |
The Dai-ichi Life Insurance Co. Ltd. | | | 298,800 | | | | 5,867,691 | |
Daicel Corp. | | | 82,400 | | | | 1,057,372 | |
Daihatsu Motor Co. Ltd. | | | 44,100 | | | | 627,683 | |
Daiichi Sankyo Co. Ltd. | | | 172,700 | | | | 3,191,592 | |
Daikin Industries Ltd. | | | 63,500 | | | | 4,564,912 | |
Daito Trust Construction Co. Ltd. | | | 20,000 | | | | 2,069,905 | |
Daiwa House Industry Co. Ltd. | | | 161,800 | | | | 3,769,608 | |
Daiwa Securities Group, Inc. | | | 458,000 | | | | 3,426,163 | |
Denso Corp. | | | 133,900 | | | | 6,661,939 | |
Dentsu, Inc. | | | 60,213 | | | | 3,114,972 | |
Don Quijote Co. Ltd. | | | 31,600 | | | | 1,344,547 | |
East Japan Railway Co. | | | 92,049 | | | | 8,275,133 | |
Eisai Co. Ltd. | | | 68,000 | | | | 4,559,033 | |
Electric Power Development Co. Ltd. | | | 39,700 | | | | 1,402,438 | |
FamilyMart Co. Ltd. | | | 20,400 | | | | 938,096 | |
FANUC Corp. | | | 55,700 | | | | 11,397,088 | |
Fast Retailing Co. Ltd. | | | 14,400 | | | | 6,529,983 | |
Fuji Electric Co. Ltd. | | | 132,800 | | | | 571,166 | |
Fuji Heavy Industries Ltd. | | | 158,200 | | | | 5,817,138 | |
FUJIFILM Holdings Corp. | | | 125,400 | | | | 4,475,278 | |
Fujitsu Ltd. | | | 513,000 | | | | 2,866,308 | |
Fukuoka Financial Group, Inc. | | | 209,000 | | | | 1,083,269 | |
GungHo Online Entertainment, Inc. | | | 158,200 | | | | 615,647 | |
The Gunma Bank Ltd. | | | 95,000 | | | | 700,944 | |
The Hachijuni Bank Ltd. | | | 114,000 | | | | 859,564 | |
Hakuhodo DY Holdings, Inc. | | | 67,000 | | | | 716,526 | |
Hamamatsu Photonics KK | | | 41,000 | | | | 1,208,971 | |
Hankyu Hanshin Holdings, Inc. | | | 288,000 | | | | 1,700,054 | |
Hikari Tsushin, Inc. | | | 5,000 | | | | 336,990 | |
Hino Motors Ltd. | | | 64,600 | | | | 798,601 | |
Hirose Electric Co. Ltd. | | | 7,400 | | | | 1,060,262 | |
The Hiroshima Bank Ltd. | | | 142,000 | | | | 847,916 | |
Hisamitsu Pharmaceutical Co., Inc. | | | 16,000 | | | | 621,126 | |
Hitachi Chemical Co. Ltd. | | | 29,800 | | | | 536,728 | |
Hitachi Construction Machinery Co. Ltd. | | | 31,200 | | | | 546,171 | |
Hitachi High-Technologies Corp. | | | 15,400 | | | | 432,921 | |
Hitachi Ltd. | | | 1,328,000 | | | | 8,748,260 | |
Hitachi Metals Ltd. | | | 62,000 | | | | 953,154 | |
Hokuhoku Financial Group, Inc. | | | 358,000 | | | | 844,609 | |
Hokuriku Electric Power Co. | | | 44,100 | | | | 656,901 | |
Honda Motor Co. Ltd. | | | 445,700 | | | | 14,404,949 | |
Hoya Corp. | | | 115,400 | | | | 4,621,737 | |
Hulic Co. Ltd. | | | 82,400 | | | | 730,241 | |
Ibiden Co. Ltd. | | | 28,300 | | | | 478,593 | |
Idemitsu Kosan Co. Ltd. | | | 22,100 | | | | 433,556 | |
IHI Corp. | | | 424,000 | | | | 1,974,217 | |
Iida Group Holdings Co. Ltd. | | | 43,000 | | | | 683,585 | |
Inpex Corp. | | | 262,600 | | | | 2,980,759 | |
Isetan Mitsukoshi Holdings Ltd. | | | 94,305 | | | | 1,684,824 | |
Isuzu Motors Ltd. | | | 162,000 | | | | 2,125,368 | |
ITOCHU Corp. | | | 450,700 | | | | 5,952,490 | |
Itochu Techno-Solutions Corp. | | | 17,200 | | | | 428,343 | |
The Iyo Bank Ltd. | | | 65,500 | | | | 804,140 | |
J. Front Retailing Co. Ltd. | | | 66,400 | | | | 1,249,733 | |
Japan Airlines Co. Ltd. | | | 34,580 | | | | 1,205,092 | |
Japan Airport Terminal Co. Ltd. | | | 11,600 | | | | 631,336 | |
Japan Display, Inc. (a) | | | 96,900 | | | | 365,758 | |
Japan Exchange Group, Inc. | | | 76,600 | | | | 2,483,302 | |
Japan Prime Realty Investment Corp. | | | 287 | | | | 891,094 | |
Japan Real Estate Investment Corp. | | | 324 | | | | 1,470,401 | |
Japan Retail Fund Investment Corp. | | | 676 | | | | 1,351,789 | |
| Common Stocks | | Shares | | | Value | |
Japan (continued) | | | | | | | | |
Japan Tobacco, Inc. | | | 309,500 | | | | 11,002,500 | |
JFE Holdings, Inc. | | | 131,300 | | | | 2,909,068 | |
JGC Corp. | | | 58,000 | | | | 1,094,875 | |
The Joyo Bank Ltd. | | | 183,000 | | | | 1,024,694 | |
JSR Corp. | | | 47,900 | | | | 845,593 | |
JTEKT Corp. | | | 58,700 | | | | 1,110,042 | |
JX Holdings, Inc. | | | 608,360 | | | | 2,622,852 | |
Kajima Corp. | | | 208,800 | | | | 980,687 | |
Kakaku.com, Inc. | | | 52,700 | | | | 762,498 | |
Kamigumi Co. Ltd. | | | 62,000 | | | | 581,985 | |
Kaneka Corp. | | | 78,000 | | | | 569,629 | |
The Kansai Electric Power Co., Inc. | | | 211,500 | | | | 2,341,417 | |
Kansai Paint Co. Ltd. | | | 75,000 | | | | 1,161,990 | |
Kao Corp. | | | 139,200 | | | | 6,473,768 | |
Kawasaki Heavy Industries Ltd. | | | 396,000 | | | | 1,845,832 | |
KDDI Corp. | | | 479,100 | | | | 11,561,617 | |
Keihan Electric Railway Co. Ltd. | | | 142,000 | | | | 826,917 | |
Keikyu Corp. | | | 118,000 | | | | 890,118 | |
Keio Corp. | | | 144,000 | | | | 1,030,009 | |
Keisei Electric Railway Co. Ltd. | | | 76,000 | | | | 903,595 | |
Keyence Corp. | | | 12,392 | | | | 6,678,996 | |
Kikkoman Corp. | | | 47,000 | | | | 1,467,510 | |
Kintetsu Corp. | | | 501,000 | | | | 1,706,098 | |
Kirin Holdings Co. Ltd. | | | 240,900 | | | | 3,318,195 | |
Kobe Steel Ltd. | | | 861,000 | | | | 1,448,556 | |
Koito Manufacturing Co. Ltd. | | | 29,000 | | | | 1,129,178 | |
Komatsu Ltd. | | | 251,600 | | | | 5,047,927 | |
Konami Corp. | | | 28,900 | | | | 537,193 | |
Konica Minolta, Inc. | | | 120,600 | | | | 1,405,612 | |
Kubota Corp. | | | 304,000 | | | | 4,820,336 | |
Kuraray Co. Ltd. | | | 97,300 | | | | 1,188,554 | |
Kurita Water Industries Ltd. | | | 37,600 | | | | 875,850 | |
Kyocera Corp. | | | 87,300 | | | | 4,538,940 | |
Kyowa Hakko Kirin Co. Ltd. | | | 65,000 | | | | 849,411 | |
Kyushu Electric Power Co., Inc. | | | 121,400 | | | | 1,407,501 | |
Lawson, Inc. | | | 20,800 | | | | 1,423,368 | |
LIXIL Group Corp. | | | 66,500 | | | | 1,319,070 | |
M3, Inc. | | | 52,100 | | | | 1,047,285 | |
Mabuchi Motor Co. Ltd. | | | 12,800 | | | | 809,631 | |
Makita Corp. | | | 32,700 | | | | 1,770,992 | |
Marubeni Corp. | | | 489,000 | | | | 2,806,199 | |
Marui Group Co. Ltd. | | | 58,700 | | | | 793,069 | |
Maruichi Steel Tube Ltd. | | | 14,000 | | | | 347,484 | |
Mazda Motor Corp. | | | 146,980 | | | | 2,876,220 | |
McDonald’s Holdings Co. Japan Ltd. (b) | | | 15,400 | | | | 325,242 | |
Medipal Holdings Corp. | | | 33,100 | | | | 539,119 | |
Meiji Holdings Co. Ltd. | | | 18,393 | | | | 2,373,250 | |
Minebea Co. Ltd. | | | 85,000 | | | | 1,403,211 | |
Miraca Holdings, Inc. | | | 15,000 | | | | 749,463 | |
Mitsubishi Chemical Holdings Corp. | | | 367,200 | | | | 2,308,450 | |
Mitsubishi Corp. | | | 390,300 | | | | 8,580,354 | |
Mitsubishi Electric Corp. | | | 549,000 | | | | 7,089,068 | |
Mitsubishi Estate Co. Ltd. | | | 344,000 | | | | 7,409,101 | |
Mitsubishi Gas Chemical Co., Inc. | | | 96,000 | | | | 537,528 | |
Mitsubishi Heavy Industries Ltd. | | | 820,200 | | | | 4,985,956 | |
Mitsubishi Logistics Corp. | | | 35,000 | | | | 459,359 | |
Mitsubishi Materials Corp. | | | 284,000 | | | | 1,090,480 | |
Mitsubishi Motors Corp. | | | 163,200 | | | | 1,387,857 | |
Mitsubishi Tanabe Pharma Corp. | | | 62,800 | | | | 940,858 | |
Mitsubishi UFJ Financial Group, Inc. | | | 3,490,874 | | | | 25,114,958 | |
Mitsubishi UFJ Lease & Finance Co. Ltd. | | | 213,700 | | | | 1,168,608 | |
Mitsui & Co. Ltd. | | | 458,600 | | | | 6,230,596 | |
Mitsui Chemicals, Inc. | | | 209,000 | | | | 776,492 | |
Mitsui Fudosan Co. Ltd. | | | 259,000 | | | | 7,247,570 | |
Mitsui OSK Lines Ltd. | | | 298,000 | | | | 953,895 | |
Mixi, Inc. | | | 15,200 | | | | 754,116 | |
Mizuho Financial Group, Inc. | | | 6,381,364 | | | | 13,807,565 | |
See Notes to Financial Statements.
| | | | | | |
| | | | | | | |
| | BLACKROCK INDEX FUNDS, INC. | | JUNE 30, 2015 | | 27 |
| | |
Schedule of Investments (continued) | | Master International Index Series (Percentages shown are based on Net Assets) |
| | | | | | | | |
| Common Stocks | | Shares | | | Value | |
Japan (continued) | | | | | | | | |
MS&AD Insurance Group Holdings, Inc. | | | 146,170 | | | $ | 4,550,019 | |
Murata Manufacturing Co. Ltd. | | | 55,700 | | | | 9,720,503 | |
Nabtesco Corp. | | | 29,400 | | | | 737,461 | |
Nagoya Railroad Co. Ltd. | | | 221,000 | | | | 826,330 | |
Namco Bandai Holdings, Inc. | | | 43,700 | | | | 844,483 | |
NEC Corp. | | | 720,000 | | | | 2,178,827 | |
Nexon Co. Ltd. | | | 40,300 | | | | 554,830 | |
NGK Insulators Ltd. | | | 74,000 | | | | 1,904,097 | |
NGK Spark Plug Co. Ltd. | | | 50,200 | | | | 1,390,247 | |
NH Foods Ltd. | | | 51,000 | | | | 1,163,038 | |
NHK Spring Co. Ltd. | | | 42,700 | | | | 470,143 | |
Nidec Corp. | | | 59,100 | | | | 4,422,914 | |
Nikon Corp. | | | 97,000 | | | | 1,120,999 | |
Nintendo Co. Ltd. | | | 28,700 | | | | 4,787,950 | |
Nippon Building Fund, Inc. | | | 356 | | | | 1,558,041 | |
Nippon Electric Glass Co. Ltd. | �� | | 101,500 | | | | 513,284 | |
Nippon Express Co. Ltd. | | | 237,000 | | | | 1,164,481 | |
Nippon Paint Co. Ltd. | | | 41,300 | | | | 1,163,858 | |
Nippon Prologis REIT, Inc. | | | 420 | | | | 772,859 | |
Nippon Steel & Sumitomo Metal | | | 2,083,265 | | | | 5,401,601 | |
Nippon Telegraph & Telephone Corp. | | | 205,352 | | | | 7,436,974 | |
Nippon Yusen KK | | | 454,000 | | | | 1,263,961 | |
Nissan Motor Co. Ltd. | | | 680,700 | | | | 7,111,237 | |
Nisshin Seifun Group, Inc. | | | 54,540 | | | | 724,907 | |
Nissin Foods Holdings Co. Ltd. | | | 15,800 | | | | 692,249 | |
Nitori Holdings Co. Ltd. | | | 19,400 | | | | 1,581,653 | |
Nitto Denko Corp. | | | 45,710 | | | | 3,753,813 | |
NOK Corp. | | | 23,500 | | | | 728,119 | |
Nomura Holdings, Inc. | | | 991,600 | | | | 6,695,132 | |
Nomura Real Estate Holdings, Inc. | | | 43,200 | | | | 906,709 | |
Nomura Research Institute Ltd. | | | 30,100 | | | | 1,177,027 | |
NSK Ltd. | | | 131,600 | | | | 2,029,168 | |
NTT Data Corp. | | | 36,000 | | | | 1,572,144 | |
NTT DoCoMo, Inc. | | | 418,200 | | | | 8,028,831 | |
NTT Urban Development Corp. | | | 39,100 | | | | 388,374 | |
Obayashi Corp. | | | 183,000 | | | | 1,334,462 | |
Odakyu Electric Railway Co. Ltd. | | | 166,000 | | | | 1,548,819 | |
Oji Holdings Corp. | | | 207,000 | | | | 899,586 | |
Olympus Corp. (a) | | | 71,500 | | | | 2,468,538 | |
Omron Corp. | | | 55,900 | | | | 2,428,198 | |
Ono Pharmaceutical Co. Ltd. | | | 22,300 | | | | 2,433,931 | |
Oracle Corp. Japan | | | 14,800 | | | | 618,724 | |
Oriental Land Co. Ltd. | | | 54,200 | | | | 3,457,371 | |
ORIX Corp. | | | 358,700 | | | | 5,326,505 | |
Osaka Gas Co. Ltd. | | | 522,000 | | | | 2,060,229 | |
Otsuka Corp. | | | 14,400 | | | | 672,215 | |
Otsuka Holdings Co. Ltd. | | | 106,700 | | | | 3,399,803 | |
Panasonic Corp. | | | 606,500 | | | | 8,306,748 | |
Park24 Co. Ltd. | | | 26,700 | | | | 457,090 | |
Rakuten, Inc. | | | 215,600 | | | | 3,480,674 | |
Recruit Holdings Co. Ltd. | | | 40,100 | | | | 1,222,819 | |
Resona Holdings, Inc. | | | 595,556 | | | | 3,248,238 | |
Ricoh Co. Ltd. | | | 196,400 | | | | 2,034,500 | |
Rinnai Corp. | | | 9,000 | | | | 708,706 | |
Rohm Co. Ltd. | | | 26,700 | | | | 1,788,875 | |
Sankyo Co. Ltd. | | | 11,200 | | | | 396,522 | |
Sanrio Co. Ltd. (b) | | | 20,200 | | | | 548,843 | |
Santen Pharmaceutical Co. Ltd. | | | 116,000 | | | | 1,641,251 | |
SBI Holdings, Inc. | | | 60,940 | | | | 837,768 | |
Secom Co. Ltd. | | | 60,900 | | | | 3,956,401 | |
Sega Sammy Holdings, Inc. | | | 43,932 | | | | 574,424 | |
Seibu Holdings, Inc. | | | 35,200 | | | | 815,142 | |
Seiko Epson Corp. | | | 73,100 | | | | 1,295,363 | |
Sekisui Chemical Co. Ltd. | | | 118,000 | | | | 1,448,571 | |
Sekisui House Ltd. | | | 165,800 | | | | 2,633,061 | |
Seven & I Holdings Co. Ltd. | | | 212,900 | | | | 9,138,863 | |
Seven Bank Ltd. | | | 146,500 | | | | 678,179 | |
| Common Stocks | | Shares | | | Value | |
Japan (continued) | | | | | | | | |
Sharp Corp. (a)(b) | | | 403,000 | | | | 489,691 | |
Shikoku Electric Power Co., Inc. | | | 56,100 | | | | 839,809 | |
Shimadzu Corp. | | | 71,000 | | | | 963,623 | |
Shimamura Co. Ltd. | | | 6,100 | | | | 640,434 | |
Shimano, Inc. | | | 21,900 | | | | 2,988,482 | |
Shimizu Corp. | | | 163,000 | | | | 1,371,733 | |
Shin-Etsu Chemical Co. Ltd. | | | 111,100 | | | | 6,889,412 | |
Shinsei Bank Ltd. | | | 448,000 | | | | 902,838 | |
Shionogi & Co. Ltd. | | | 82,800 | | | | 3,208,766 | |
Shiseido Co. Ltd. | | | 98,800 | | | | 2,240,912 | |
The Shizuoka Bank Ltd. | | | 165,000 | | | | 1,722,388 | |
Showa Shell Sekiyu KK | | | 48,300 | | | | 422,024 | |
SMC Corp. | | | 15,500 | | | | 4,664,246 | |
Softbank Corp. | | | 262,900 | | | | 15,485,594 | |
Sompo Japan Nipponkoa Holdings, Inc. | | | 96,975 | | | | 3,550,859 | |
Sony Corp. (a) | | | 320,700 | | | | 9,106,872 | |
Sony Financial Holdings, Inc. | | | 59,200 | | | | 1,036,520 | |
Stanley Electric Co. Ltd. | | | 34,900 | | | | 726,856 | |
Sumitomo Chemical Co. Ltd. | | | 416,000 | | | | 2,499,495 | |
Sumitomo Corp. | | | 327,300 | | | | 3,809,581 | |
Sumitomo Dainippon Pharma Co. Ltd. | | | 48,400 | | | | 533,383 | |
Sumitomo Electric Industries Ltd. | | | 209,400 | | | | 3,240,955 | |
Sumitomo Heavy Industries Ltd. | | | 155,000 | | | | 902,774 | |
Sumitomo Metal Mining Co. Ltd. | | | 133,000 | | | | 2,022,793 | |
Sumitomo Mitsui Financial Group, Inc. | | | 348,650 | | | | 15,521,614 | |
Sumitomo Mitsui Trust Holdings, Inc. | | | 958,820 | | | | 4,386,217 | |
Sumitomo Realty & Development Co. Ltd. | | | 104,000 | | | | 3,644,878 | |
Sumitomo Rubber Industries Ltd. | | | 42,300 | | | | 655,240 | |
Suntory Beverage & Food Ltd. | | | 38,400 | | | | 1,528,741 | |
Suruga Bank Ltd. | | | 47,300 | | | | 1,013,220 | |
Suzuken Co. Ltd. | | | 21,700 | | | | 694,248 | |
Suzuki Motor Corp. | | | 98,700 | | | | 3,331,071 | |
Sysmex Corp. | | | 39,800 | | | | 2,370,387 | |
T&D Holdings, Inc. | | | 172,600 | | | | 2,573,037 | |
Taiheiyo Cement Corp. | | | 301,000 | | | | 880,239 | |
Taisei Corp. | | | 317,000 | | | | 1,819,894 | |
Taisho Pharmaceutical Holdings Co. Ltd. | | | 9,500 | | | | 641,745 | |
Taiyo Nippon Sanso Corp. | | | 40,900 | | | | 494,961 | |
Takashimaya Co. Ltd. | | | 74,000 | | | | 670,765 | |
Takeda Pharmaceutical Co. Ltd. | | | 216,500 | | | | 10,450,163 | |
TDK Corp. | | | 36,300 | | | | 2,779,580 | |
Teijin Ltd. | | | 254,000 | | | | 985,636 | |
Terumo Corp. | | | 79,200 | | | | 1,899,233 | |
THK Co. Ltd. | | | 33,000 | | | | 712,147 | |
Tobu Railway Co. Ltd. | | | 325,000 | | | | 1,396,030 | |
Toho Co. Ltd. | | | 29,100 | | | | 723,576 | |
Toho Gas Co. Ltd. | | | 112,000 | | | | 663,054 | |
Tohoku Electric Power Co., Inc. | | | 138,700 | | | | 1,877,927 | |
Tokio Marine Holdings, Inc. | | | 196,200 | | | | 8,159,777 | |
The Tokyo Electric Power Co., Inc. | | | 398,200 | | | | 2,169,354 | |
Tokyo Electron Ltd. | | | 47,800 | | | | 3,038,027 | |
Tokyo Gas Co. Ltd. | | | 636,000 | | | | 3,376,318 | |
Tokyo Tatemono Co. Ltd. | | | 54,500 | | | | 756,441 | |
Tokyu Corp. | | | 313,000 | | | | 2,094,799 | |
Tokyu Fudosan Holdings Corp. | | | 141,500 | | | | 1,090,555 | |
TonenGeneral Sekiyu KK | | | 70,000 | | | | 651,138 | |
Toppan Printing Co. Ltd. | | | 148,000 | | | | 1,237,272 | |
Toray Industries, Inc. | | | 402,700 | | | | 3,403,897 | |
Toshiba Corp. | | | 1,168,000 | | | | 4,005,419 | |
Toto Ltd. | | | 89,000 | | | | 1,604,125 | |
Toyo Seikan Kaisha Ltd. | | | 43,000 | | | | 689,866 | |
Toyo Suisan Kaisha Ltd. | | | 29,800 | | | | 1,085,818 | |
Toyoda Gosei Co. Ltd. | | | 17,900 | | | | 431,466 | |
Toyota Industries Corp. | | | 43,700 | | | | 2,488,557 | |
Toyota Motor Corp. | | | 747,400 | | | | 50,013,968 | |
Toyota Tsusho Corp. | | | 58,900 | | | | 1,580,473 | |
Trend Micro, Inc. | | | 29,800 | | | | 1,019,359 | |
See Notes to Financial Statements.
| | | | | | |
| | | | | | | |
| 28 | | BLACKROCK INDEX FUNDS, INC. | | JUNE 30, 2015 | | |
| | |
Schedule of Investments (continued) | | Master International Index Series (Percentages shown are based on Net Assets) |
| | | | | | | | |
| Common Stocks | | Shares | | | Value | |
Japan (concluded) | | | | | | | | |
Unicharm Corp. | | | 100,800 | | | $ | 2,394,455 | |
United Urban Investment Corp. | | | 701 | | | | 989,935 | |
USS Co. Ltd. | | | 60,000 | | | | 1,082,106 | |
West Japan Railway Co. | | | 46,100 | | | | 2,949,436 | |
Yahoo! Japan Corp. | | | 439,700 | | | | 1,774,650 | |
Yakult Honsha Co. Ltd. | | | 24,500 | | | | 1,451,125 | |
Yamada Denki Co. Ltd. | | | 231,900 | | | | 927,665 | |
Yamaguchi Financial Group, Inc. | | | 55,000 | | | | 684,875 | |
Yamaha Corp. | | | 42,300 | | | | 852,539 | |
Yamaha Motor Co. Ltd. | | | 72,800 | | | | 1,590,656 | |
Yamato Holdings Co. Ltd. | | | 93,200 | | | | 1,802,081 | |
Yamazaki Baking Co. Ltd. | | | 30,000 | | | | 499,531 | |
Yaskawa Electric Corp. | | | 63,300 | | | | 809,636 | |
Yokogawa Electric Corp. | | | 58,700 | | | | 756,009 | |
The Yokohama Rubber Co. Ltd. | | | 31,500 | | | | 632,067 | |
| | | | | | | | |
| | | | | | | | 825,149,902 | |
Luxembourg — 0.1% | |
Altice SA (a) | | | 25,369 | | | | 3,494,317 | |
RTL Group SA (a) | | | 10,877 | | | | 983,281 | |
| | | | | | | | |
| | | | | | | | 4,477,598 | |
Netherlands — 4.1% | |
Aegon NV | | | 491,067 | | | | 3,623,186 | |
Akzo Nobel NV | | | 67,998 | | | | 4,964,469 | |
ASML Holding NV | | | 96,028 | | | | 9,988,581 | |
CNH Industrial NV | | | 266,002 | | | | 2,427,253 | |
Delta Lloyd NV | | | 61,661 | | | | 1,012,237 | |
Gemalto NV | | | 23,828 | | | | 2,127,815 | |
Heineken Holding NV | | | 27,301 | | | | 1,913,512 | |
Heineken NV | | | 63,432 | | | | 4,822,568 | |
ING Groep NV CVA (a) | | | 1,078,628 | | | | 17,911,011 | |
Koninklijke Ahold NV | | | 247,089 | | | | 4,638,514 | |
Koninklijke Boskalis Westminster NV | | | 22,091 | | | | 1,084,395 | |
Koninklijke DSM NV | | | 50,004 | | | | 2,903,241 | |
Koninklijke KPN NV | | | 861,095 | | | | 3,301,298 | |
Koninklijke Philips Electronics NV | | | 256,792 | | | | 6,553,962 | |
Koninklijke Vopak NV | | | 23,059 | | | | 1,166,261 | |
NN Group NV (a) | | | 40,174 | | | | 1,131,391 | |
OCI NV (a) | | | 29,547 | | | | 837,409 | |
QIAGEN NV (a) | | | 62,014 | | | | 1,524,100 | |
Randstad Holding NV | | | 34,592 | | | | 2,250,813 | |
Reed Elsevier NV | | | 190,736 | | | | 4,536,787 | |
Royal Dutch Shell PLC, Class A | | | 1,083,977 | | | | 30,648,520 | |
Royal Dutch Shell PLC, Class B | | | 681,526 | | | | 19,403,391 | |
TNT Express NV | | | 137,210 | | | | 1,165,290 | |
Unilever NV CVA | | | 445,316 | | | | 18,618,271 | |
Wolters Kluwer NV | | | 85,267 | | | | 2,537,865 | |
| | | | | | | | |
| | | | | | | | 151,092,140 | |
New Zealand — 0.1% | |
Auckland International Airport Ltd. | | | 260,005 | | | | 870,207 | |
Contact Energy Ltd. | | | 102,592 | | | | 348,303 | |
Fletcher Building Ltd. | | | 223,352 | | | | 1,229,041 | |
Meridian Energy Ltd. | | | 390,387 | | | | 571,419 | |
Mighty River Power Ltd. | | | 241,178 | | | | 455,982 | |
Ryman Healthcare Ltd. | | | 138,281 | | | | 742,158 | |
Spark New Zealand Ltd. | | | 466,008 | | | | 882,047 | |
| | | | | | | | |
| | | | | | | | 5,099,157 | |
Norway — 0.6% | |
DnB NOR ASA | | | 271,720 | | | | 4,525,118 | |
Gjensidige Forsikring ASA | | | 51,954 | | | | 836,552 | |
Norsk Hydro ASA | | | 413,546 | | | | 1,735,623 | |
Orkla ASA | | | 225,464 | | | | 1,769,014 | |
Seadrill Ltd. | | | 98,134 | | | | 1,019,176 | |
Statoil ASA | | | 307,554 | | | | 5,499,990 | |
Subsea 7 SA | | | 67,352 | | | | 658,790 | |
| Common Stocks | | Shares | | | Value | |
Norway (concluded) | |
Telenor ASA | | | 208,366 | | | | 4,568,393 | |
Yara International ASA | | | 48,521 | | | | 2,528,338 | |
| | | | | | | | |
| | | | | | | | 23,140,994 | |
Portugal — 0.2% | |
Banco Comercial Portugues SA (a) | | | 11,308,691 | | | | 988,503 | |
EDP — Energias de Portugal SA | | | 531,905 | | | | 2,026,555 | |
Galp Energia SGPS SA | | | 113,713 | | | | 1,338,546 | |
Jeronimo Martins SGPS SA | | | 69,401 | | | | 894,852 | |
| | | | | | | | |
| | | | | | | | 5,248,456 | |
Singapore — 1.4% | |
Ascendas Real Estate Investment Trust | | | 619,762 | | | | 1,131,516 | |
CapitaCommercial Trust | | | 623,100 | | | | 721,163 | |
CapitaLand Ltd. | | | 721,249 | | | | 1,872,914 | |
CapitaMall Trust | | | 721,400 | | | | 1,150,693 | |
City Developments Ltd. | | | 118,135 | | | | 857,251 | |
ComfortDelGro Corp. Ltd. | | | 634,516 | | | | 1,473,567 | |
DBS Group Holdings Ltd. | | | 476,007 | | | | 7,303,681 | |
Genting Singapore PLC | | | 1,738,327 | | | | 1,154,149 | |
Global Logistic Properties Ltd. | | | 968,000 | | | | 1,817,195 | |
Golden Agri-Resources Ltd. | | | 2,240,451 | | | | 682,198 | |
Hutchison Port Holdings Trust | | | 1,602,400 | | | | 1,009,268 | |
Jardine Cycle & Carriage Ltd. | | | 30,021 | | | | 737,028 | |
Keppel Corp. Ltd. | | | 393,777 | | | | 2,400,119 | |
Noble Group Ltd. | | | 1,259,840 | | | | 709,777 | |
Oversea-Chinese Banking Corp. Ltd. | | | 802,698 | | | | 6,061,943 | |
SembCorp Industries Ltd. | | | 255,090 | | | | 736,246 | |
SembCorp Marine Ltd. (b) | | | 220,197 | | | | 463,917 | |
Singapore Airlines Ltd. | | | 167,209 | | | | 1,331,321 | |
Singapore Exchange Ltd. | | | 215,400 | | | | 1,251,290 | |
Singapore Press Holdings Ltd. | | | 99,985 | | | | 302,725 | |
Singapore Technologies Engineering Ltd. | | | 425,813 | | | | 1,042,565 | |
Singapore Telecommunications Ltd. | | | 2,238,632 | | | | 6,986,136 | |
StarHub Ltd. | | | 174,257 | | | | 510,830 | |
Suntec Real Estate Investment Trust | | | 802,800 | | | | 1,028,275 | |
United Overseas Bank Ltd. | | | 346,147 | | | | 5,922,218 | |
UOL Group Ltd. | | | 148,899 | | | | 764,265 | |
Wilmar International Ltd. | | | 558,570 | | | | 1,359,495 | |
Yangzijiang Shipbuilding Holdings Ltd. | | | 582,383 | | | | 611,686 | |
| | | | | | | | |
| | | | | | | | 51,393,431 | |
Spain — 3.4% | |
Abertis Infraestructuras SA | | | 135,120 | | | | 2,218,956 | |
ACS Actividades de Construccion y Servicios SA | | | 56,450 | | | | 1,820,848 | |
Aena SA | | | 19,000 | | | | 1,982,030 | |
Amadeus IT Holding SA, Class A | | | 126,785 | | | | 5,061,283 | |
Banco Bilbao Vizcaya Argentaria SA | | | 1,750,753 | | | | 17,251,835 | |
Banco de Sabadell SA | | | 1,372,293 | | | | 3,323,945 | |
Banco de Sabadell SA, International Shares | | | 23,160 | | | | 55,900 | |
Banco Popular Espanol SA | | | 485,586 | | | | 2,362,675 | |
Banco Santander SA | | | 4,000,295 | | | | 28,138,122 | |
Bankia SA (a) | | | 1,289,149 | | | | 1,641,250 | |
Bankinter SA | | | 198,958 | | | | 1,475,653 | |
CaixaBank SA | | | 757,315 | | | | 3,524,012 | |
Distribuidora Internacional de Alimentacion SA | | | 185,863 | | | | 1,424,375 | |
Enagas SA | | | 13,781 | | | | 375,152 | |
Endesa SA | | | 76,846 | | | | 1,471,727 | |
Ferrovial SA | | | 132,758 | | | | 2,884,355 | |
Gas Natural SDG SA | | | 108,425 | | | | 2,462,033 | |
Grifols SA | | | 39,780 | | | | 1,606,389 | |
Iberdrola SA | | | 1,477,635 | | | | 9,976,314 | |
Inditex SA | | | 303,283 | | | | 9,892,272 | |
International Consolidated Airlines Group SA (a) | | | 231,541 | | | | 1,806,369 | |
Mapfre SA | | | 352,463 | | | | 1,218,148 | |
Red Electrica Corp. SA | | | 7,322 | | | | 587,955 | |
Repsol SA | | | 289,152 | | | | 5,096,484 | |
Telefonica SA | | | 1,244,812 | | | | 17,732,832 | |
See Notes to Financial Statements.
| | | | | | |
| | | | | | | |
| | BLACKROCK INDEX FUNDS, INC. | | JUNE 30, 2015 | | 29 |
| | |
Schedule of Investments (continued) | | Master International Index Series (Percentages shown are based on Net Assets) |
| | | | | | | | |
| Common Stocks | | Shares | | | Value | |
Spain (concluded) | |
Zardoya Otis SA | | | 47,968 | | | $ | 523,528 | |
| | | | | | | | |
| | | | | | | | 125,914,442 | |
Sweden — 2.9% | | | | | | | | |
Alfa Laval AB | | | 91,556 | | | | 1,611,474 | |
Assa Abloy AB | | | 277,254 | | | | 5,219,527 | |
Atlas Copco AB, A Shares | | | 187,619 | | | | 5,249,262 | |
Atlas Copco AB, B Shares | | | 102,155 | | | | 2,544,745 | |
Boliden AB | | | 75,335 | | | | 1,373,410 | |
Electrolux AB, Class B | | | 64,756 | | | | 2,029,009 | |
Elekta AB, B Shares (b) | | | 131,745 | | | | 826,401 | |
Getinge AB, Class B | | | 56,831 | | | | 1,368,264 | |
Hennes & Mauritz AB, Class B | | | 267,285 | | | | 10,287,454 | |
Hexagon AB, Class B | | | 75,968 | | | | 2,751,601 | |
Husqvarna AB, Class B | | | 119,187 | | | | 897,793 | |
ICA Gruppen AB | | | 20,946 | | | | 743,104 | |
Industrivarden AB, Class C | | | 42,032 | | | | 792,115 | |
Investment AB Kinnevik, Class B | | | 64,063 | | | | 2,026,303 | |
Investor AB, Class B | | | 128,093 | | | | 4,776,036 | |
Lundin Petroleum AB (a) | | | 65,556 | | | | 1,124,714 | |
Millicom International Cellular SA | | | 17,970 | | | | 1,325,645 | |
Nordea Bank AB | | | 824,045 | | | | 10,277,283 | |
Sandvik AB | | | 290,899 | | | | 3,215,973 | |
Securitas AB, Class B | | | 88,325 | | | | 1,166,501 | |
Skandinaviska Enskilda Banken AB, Class A | | | 419,034 | | | | 5,360,005 | |
Skanska AB, Class B | | | 101,940 | | | | 2,065,717 | |
SKF AB, Class B | | | 111,448 | | | | 2,543,021 | |
Svenska Cellulosa AB, Class B | | | 169,854 | | | | 4,319,078 | |
Svenska Handelsbanken AB, Class A | | | 426,556 | | | | 6,226,971 | |
Swedbank AB, Class A | | | 249,122 | | | | 5,808,132 | |
Swedish Match AB | | | 55,921 | | | | 1,589,869 | |
Tele2 AB, Class B | | | 81,638 | | | | 950,704 | |
Telefonaktiebolaget LM Ericsson, Class B | | | 859,209 | | | | 8,948,776 | |
TeliaSonera AB | | | 696,716 | | | | 4,106,259 | |
Volvo AB, Class B | | | 423,306 | | | | 5,256,412 | |
| | | | | | | | |
| | | | | | | | 106,781,558 | |
Switzerland — 9.5% | | | | | | | | |
ABB Ltd., Registered Shares (a) | | | 601,224 | | | | 12,600,643 | |
Actelion Ltd., Registered Shares (a) | | | 29,680 | | | | 4,346,678 | |
Adecco SA, Registered Shares (a) | | | 49,318 | | | | 4,002,522 | |
Aryzta AG (a) | | | 24,274 | | | | 1,194,361 | |
Baloise Holding AG, Registered Shares | | | 13,568 | | | | 1,654,357 | |
Barry Callebaut AG, Registered Shares (a) | | | 771 | | | | 878,245 | |
Cie Financiere Richemont SA, Registered Shares | | | 142,667 | | | | 11,595,660 | |
Coca-Cola HBC AG (a) | | | 55,055 | | | | 1,181,543 | |
Credit Suisse Group AG, Registered Shares (a) | | | 418,410 | | | | 11,542,873 | |
Dufry AG (a) | | | 8,732 | | | | 1,216,737 | |
EMS-Chemie Holding AG, Registered Shares | | | 2,064 | | | | 872,028 | |
Geberit AG, Registered Shares | | | 10,283 | | | | 3,428,295 | |
Givaudan SA, Registered Shares (a) | | | 2,495 | | | | 4,319,608 | |
Glencore PLC (a) | | | 3,038,021 | | | | 12,183,074 | |
Holcim Ltd., Registered Shares (a) | | | 65,794 | | | | 4,854,646 | |
Julius Baer Group Ltd. (a) | | | 61,670 | | | | 3,460,548 | |
Kuehne & Nagel International AG, Registered Shares | | | 15,101 | | | | 2,005,157 | |
Lindt & Spruengli AG | | | 281 | | | | 1,486,314 | |
Lindt & Spruengli AG, Registered Shares | | | 28 | | | | 1,752,533 | |
Lonza Group AG, Registered Shares (a) | | | 14,520 | | | | 1,940,817 | |
Nestle SA, Registered Shares | | | 894,857 | | | | 64,564,471 | |
Novartis AG, Registered Shares | | | 638,358 | | | | 62,789,182 | |
Pargesa Holding SA, Bearer Shares | | | 7,631 | | | | 513,828 | |
Partners Group Holding AG | | | 4,823 | | | | 1,441,535 | |
Roche Holding AG | | | 194,289 | | | | 54,476,969 | |
Schindler Holding AG, Participation Certificates | | | 12,180 | | | | 1,992,052 | |
Schindler Holding AG, Registered Shares | | | 5,413 | | | | 884,018 | |
SGS SA, Registered Shares | | | 1,438 | | | | 2,622,329 | |
| Common Stocks | | Shares | | | Value | |
Switzerland (concluded) | | | | | | | | |
Sika AG — Bearer Shares | | | 603 | | | | 2,126,710 | |
Sonova Holding AG, Registered Shares | | | 14,900 | | | | 2,014,848 | |
STMicroelectronics NV | | | 183,025 | | | | 1,498,412 | |
Sulzer AG, Registered Shares | | | 6,863 | | | | 705,940 | |
The Swatch Group AG, Bearer Shares | | | 8,369 | | | | 3,261,215 | |
The Swatch Group AG, Registered Shares | | | 13,126 | | | | 985,962 | |
Swiss Life Holding AG, Registered Shares (a) | | | 8,631 | | | | 1,976,332 | |
Swiss Prime Site AG, Registered Shares (a) | | | 16,088 | | | | 1,220,861 | |
Swiss Re AG | | | 95,726 | | | | 8,473,926 | |
Swisscom AG, Registered Shares | | | 7,493 | | | | 4,199,426 | |
Syngenta AG, Registered Shares | | | 25,393 | | | | 10,360,901 | |
Transocean Ltd. | | | 98,143 | | | | 1,591,077 | |
UBS Group AG (a) | | | 1,000,147 | | | | 21,219,596 | |
Zurich Insurance Group AG (a) | | | 40,753 | | | | 12,406,420 | |
| | | | | | | | |
| | | | | | | | 347,842,649 | |
United Kingdom — 17.7% | | | | | | | | |
3i Group PLC | | | 265,666 | | | | 2,155,662 | |
Aberdeen Asset Management PLC | | | 258,157 | | | | 1,637,499 | |
Admiral Group PLC | | | 57,580 | | | | 1,254,685 | |
Aggreko PLC | | | 71,476 | | | | 1,614,449 | |
AMEC PLC | | | 103,200 | | | | 1,325,416 | |
Anglo American PLC | | | 383,539 | | | | 5,540,770 | |
Antofagasta PLC | | | 101,747 | | | | 1,101,293 | |
ARM Holdings PLC | | | 387,241 | | | | 6,336,763 | |
Ashtead Group PLC | | | 137,201 | | | | 2,364,629 | |
Associated British Foods PLC | | | 95,803 | | | | 4,317,092 | |
AstraZeneca PLC | | | 352,379 | | | | 22,302,151 | |
Aviva PLC | | | 1,093,704 | | | | 8,471,150 | |
Babcock International Group PLC | | | 80,137 | | | | 1,357,716 | |
BAE Systems PLC | | | 865,660 | | | | 6,133,568 | |
Barclays PLC | | | 4,505,012 | | | | 18,464,457 | |
Barratt Developments PLC | | | 293,807 | | | | 2,833,864 | |
BG Group PLC | | | 955,575 | | | | 15,914,910 | |
BHP Billiton PLC | | | 577,497 | | | | 11,354,554 | |
BP PLC | | | 5,075,080 | | | | 33,681,649 | |
British American Tobacco PLC | | | 508,043 | | | | 27,354,305 | |
British Land Co. PLC | | | 255,889 | | | | 3,187,378 | |
BT Group PLC | | | 2,341,646 | | | | 16,581,996 | |
Bunzl PLC | | | 89,423 | | | | 2,439,408 | |
Burberry Group PLC | | | 130,174 | | | | 3,211,440 | |
Capita PLC | | | 192,637 | | | | 3,743,056 | |
Carnival PLC | | | 54,523 | | | | 2,787,745 | |
Centrica PLC | | | 1,375,475 | | | | 5,707,505 | |
Cobham PLC | | | 316,308 | | | | 1,306,353 | |
Compass Group PLC | | | 457,159 | | | | 7,561,016 | |
Croda International PLC | | | 36,145 | | | | 1,562,878 | |
Diageo PLC | | | 685,944 | | | | 19,864,782 | |
Direct Line Insurance Group PLC | | | 372,020 | | | | 1,962,873 | |
Dixons Carphone PLC | | | 271,648 | | | | 1,931,661 | |
easyJet PLC | | | 44,947 | | | | 1,092,595 | |
Fiat Chrysler Automobiles NV | | | 243,821 | | | | 3,576,889 | |
Fresnillo PLC | | | 63,568 | | | | 693,196 | |
G4S PLC | | | 421,410 | | | | 1,776,887 | |
GKN PLC | | | 488,566 | | | | 2,566,839 | |
GlaxoSmithKline PLC | | | 1,354,804 | | | | 28,168,997 | |
Hammerson PLC | | | 202,712 | | | | 1,959,070 | |
Hargreaves Lansdown PLC | | | 73,652 | | | | 1,334,428 | |
HSBC Holdings PLC | | | 5,241,605 | | | | 46,935,465 | |
ICAP PLC | | | 145,924 | | | | 1,213,793 | |
IMI PLC | | | 75,968 | | | | 1,342,923 | |
Imperial Tobacco Group PLC | | | 261,318 | | | | 12,585,647 | |
Inmarsat PLC | | | 124,522 | | | | 1,790,066 | |
InterContinental Hotels Group PLC | | | 69,707 | | | | 2,810,359 | |
Intertek Group PLC | | | 44,920 | | | | 1,727,173 | |
Intu Properties PLC | | | 229,167 | | | | 1,107,027 | |
Investec PLC | | | 155,291 | | | | 1,395,286 | |
See Notes to Financial Statements.
| | | | | | |
| | | | | | | |
| 30 | | BLACKROCK INDEX FUNDS, INC. | | JUNE 30, 2015 | | |
| | |
Schedule of Investments (continued) | | Master International Index Series (Percentages shown are based on Net Assets) |
| | | | | | | | |
| Common Stocks | | Shares | | | Value | |
United Kingdom (continued) | | | | | | | | |
ITV PLC | | | 1,033,069 | | | $ | 4,274,257 | |
J. Sainsbury PLC | | | 364,838 | | | | 1,518,721 | |
Johnson Matthey PLC | | | 56,591 | | | | 2,698,719 | |
Kingfisher PLC | | | 644,290 | | | | 3,514,273 | |
Land Securities Group PLC | | | 212,961 | | | | 4,026,894 | |
Legal & General Group PLC | | | 1,628,231 | | | | 6,366,484 | |
Lloyds Banking Group PLC (a) | | | 15,586,835 | | | | 20,920,616 | |
London Stock Exchange Group PLC | | | 96,147 | | | | 3,576,730 | |
Marks & Spencer Group PLC | | | 452,256 | | | | 3,815,200 | |
Meggitt PLC | | | 222,702 | | | | 1,630,786 | |
Melrose Industries PLC | | | 321,549 | | | | 1,249,775 | |
Merlin Entertainments PLC (c) | | | 222,998 | | | | 1,495,615 | |
Mondi PLC | | | 100,295 | | | | 2,159,277 | |
National Grid PLC | | | 1,048,533 | | | | 13,495,486 | |
Next PLC | | | 40,835 | | | | 4,779,404 | |
Old Mutual PLC | | | 1,353,895 | | | | 4,285,554 | |
Pearson PLC | | | 220,430 | | | | 4,173,721 | |
Persimmon PLC (a) | | | 90,811 | | | | 2,817,497 | |
Petrofac Ltd. | | | 64,792 | | | | 942,769 | |
Prudential PLC | | | 701,047 | | | | 16,894,906 | |
Randgold Resources Ltd. | | | 28,368 | | | | 1,902,819 | |
Reckitt Benckiser Group PLC | | | 176,121 | | | | 15,187,662 | |
Reed Elsevier PLC | | | 323,830 | | | | 5,262,457 | |
Rexam PLC | | | 196,009 | | | | 1,699,994 | |
Rio Tinto PLC | | | 347,403 | | | | 14,289,718 | |
Rolls-Royce Holdings PLC (a) | | | 505,655 | | | | 6,906,862 | |
Royal Bank of Scotland Group PLC (a) | | | 737,730 | | | | 4,079,285 | |
Royal Mail PLC | | | 171,624 | | | | 1,387,496 | |
RSA Insurance Group PLC | | | 309,686 | | | | 1,931,138 | |
SABMiller PLC | | | 264,350 | | | | 13,706,652 | |
The Sage Group PLC | | | 290,467 | | | | 2,338,121 | |
Schroders PLC | | | 36,209 | | | | 1,806,712 | |
Segro PLC | | | 196,012 | | | | 1,248,871 | |
Severn Trent PLC | | | 66,588 | | | | 2,175,853 | |
Sky PLC | | | 287,065 | | | | 4,675,610 | |
Smith & Nephew PLC | | | 258,535 | | | | 4,373,708 | |
Smiths Group PLC | | | 105,487 | | | | 1,869,825 | |
Sports Direct International PLC (a) | | | 78,087 | | | | 880,422 | |
SSE PLC | | | 280,660 | | | | 6,773,560 | |
Standard Chartered PLC | | | 675,391 | | | | 10,815,980 | |
Standard Life PLC | | | 530,824 | | | | 3,701,455 | |
Tate & Lyle PLC | | | 125,348 | | | | 1,023,171 | |
Taylor Wimpey PLC | | | 963,284 | | | | 2,809,202 | |
Tesco PLC | | | 2,218,493 | | | | 7,391,528 | |
Travis Perkins PLC | | | 65,947 | | | | 2,184,148 | |
Tullow Oil PLC | | | 235,864 | | | | 1,260,522 | |
Unilever PLC | | | 350,260 | | | | 15,039,860 | |
| Common Stocks | | Shares | | | Value | |
United Kingdom (concluded) | | | | | | | | |
United Utilities Group PLC | | | 191,640 | | | $ | 2,684,180 | |
Vodafone Group PLC | | | 7,385,860 | | | | 26,942,822 | |
The Weir Group PLC | | | 59,739 | | | | 1,592,177 | |
Whitbread PLC | | | 52,581 | | | | 4,084,977 | |
William Hill PLC | | | 243,637 | | | | 1,543,298 | |
WM Morrison Supermarkets PLC | | | 605,897 | | | | 1,720,005 | |
Wolseley PLC | | | 70,159 | | | | 4,474,342 | |
WPP PLC | | | 362,052 | | | | 8,126,682 | |
| | | | | | | | |
| | | | | | | | 651,969,111 | |
| Total Common Stocks — 98.1% | | | | 3,612,629,891 | |
| | | | | | | | |
| | | | | | | | | |
| | |
| Rights | | | | | | |
Singapore — 0.0% | |
Jardine Cycle & Carriage, Ltd.
(Expires 07/20/15) (a) | | | 3,336 | | | | 17,584 | |
Spain — 0.0% | |
Abertis Infraestructuras SA
(Expires 07/17/15) (a) | | | 135,120 | | | | 111,472 | |
Repsol SA (Expires 07/03/15) (a) | | | 289,152 | | | | 149,898 | |
Zardoya Otis SA (Expires 07/31/15) (a) | | | 47,968 | | | | 20,910 | |
| | | | | | | | |
| | | | | | | | 282,280 | |
| Total Rights — 0.0% | | | | | | | 299,864 | |
Total Long-Term Investments
(Cost — $3,367,954,960) — 98.1% | | | | | | | 3,612,929,755 | |
| | | | | | | | |
| | | | | | | | | |
| | |
| Short-Term Securities | | | | | | |
BlackRock Liquidity Funds,
TempFund, Institutional Class, 0.07% (d)(e) | | | 10,072,077 | | | | 10,072,077 | |
| | |
| | | Beneficial Interest (000) | | | | |
BlackRock Liquidity Series, LLC,
Money Market Series, 0.23% (d)(e)(f) | | $ | 3,524 | | | | 3,524,062 | |
Total Short-Term Securities
(Cost — $13,596,139) — 0.4% | | | | | | | 13,596,139 | |
| Total Investments (Cost — $3,381,551,099) — 98.5% | | | | 3,626,525,894 | |
| Other Assets Less Liabilities — 1.5% | | | | | | | 54,973,454 | |
| | | | | | | | |
Net Assets — 100.0% | | | | | | $ | 3,681,499,348 | |
| | | | | | | | |
|
| Notes to Schedule of Investments |
| (a) | | Non-income producing security. |
| (b) | | Security, or a portion of security, is on loan. |
| (c) | | Security exempt from registration pursuant to Rule 144A under the Securities Act of 1933, as amended. These securities may be resold in transactions exempt from registration to qualified institutional investors. |
| (d) | | During the six months ended June 30, 2015, investments in issuers considered to be affiliates of the Series for purposes of Section 2(a)(3) of the 1940 Act were as follows: |
| | | | | | | | | | | | | | | | |
| Affiliate | | Shares/Beneficial
Interest Held at
December 31,
2014 | | | Net
Activity | | | Shares/Beneficial
Interest Held at
June 30,
2015 | | | Income | |
BlackRock Liquidity Funds, TempFund, Institutional Class | | | 3,872,785 | | | | 6,199,292 | 1 | | | 10,072,077 | | | $ | 6,524 | |
BlackRock Liquidity Series, LLC, Money Market Series | | $ | 4,107,347 | | | $ | (583,285 | )2 | | $ | 3,524,062 | | | $ | 138,285 | 3 |
1 Represents net shares purchased. | |
2 Represents net beneifical interest sold. | |
3 Represents securities lending income earned from reinvestment of cash collateral from loaned securities, net of fees, and other payments to and from borrowers of securities, and less the collateral investment expenses. | |
See Notes to Financial Statements.
| | | | | | |
| | | | | | | |
| | BLACKROCK INDEX FUNDS, INC. | | JUNE 30, 2015 | | 31 |
| | |
Schedule of Investments (continued) | | Master International Index Series |
| (e) | | Represents the current yield as of report date. |
| (f) | | Security was purchased with the cash collateral from loaned securities. The Series may withdraw up to 25% of its investment daily, although the manager of the BlackRock Liquidity Series, LLC, Money Market Series, in its sole discretion, may permit an investor to withdraw more than 25% on any one day. |
| • | | As of June 30, 2015, financial futures contracts outstanding were as follows: |
| | | | | | | | | | | | | | | | | | | | |
Contracts
Long | | | Issue | | Exchange | | Expiration | | Notional Value | | | Unrealized
Appreciation
(Depreciation) | |
| | 589 | | | Euro Stoxx 50 Index | | Eurex Mercantile | | September 2015 | | | USD | | | | 22,562,370 | | | $ | 120,725 | |
| | 205 | | | FTSE 100 Index | | Euronext Life | | September 2015 | | | USD | | | | 20,917,579 | | | | (475,893 | ) |
| | 208 | | | Nikkei 225 Index | | Singapore Exchange | | September 2015 | | | USD | | | | 17,241,982 | | | | 4,093 | |
| | 91 | | | SPI 200 Index | | Australian Securities Exchange | | September 2015 | | | USD | | | | 9,473,228 | | | | (174,350 | ) |
| | Total | | | | | | | | | | | | | | | | | $ | (525,425 | ) |
| | | | | | | | | | | | | | | | | | | | |
| • | | Fair Value Measurements — Various inputs are used in determining the fair value of investments and derivative financial instruments. These inputs to valuation techniques are categorized into a disclosure hierarchy consisting of three broad levels for financial statement purposes. The hierarchy gives the highest priority to unadjusted quoted prices in active markets for identical assets or liabilities (Level 1 measurements) and the lowest priority to unobservable inputs (Level 3 measurements). Accordingly, the degree of judgment exercised in determining fair value is greatest for instruments categorized in Level 3. The inputs used to measure fair value may fall into different levels of the fair value hierarchy. In such cases, for disclosure purposes, the fair value hierarchy classification is determined based on the lowest level input that is significant to the fair value measurement in its entirety. The categorization of a value determined for investments and derivative financial instruments is based on the pricing transparency of the investment and derivative financial instrument and is not necessarily an indication of the risks associated with investing in those securities. The three levels of the fair value hierarchy are as follows: |
| | • | | Level 1 — unadjusted quoted prices in active markets/exchanges for identical assets or liabilities that the Series has the ability to access |
| | • | | Level 2 — other observable inputs (including, but not limited to, quoted prices for similar assets or liabilities in markets that are active, quoted prices for identical or similar assets or liabilities in markets that are not active, inputs other than quoted prices that are observable for the assets or liabilities (such as interest rates, yield curves, volatilities, prepayment speeds, loss severities, credit risks and default rates) or other market-corroborated inputs) |
| | • | | Level 3 — unobservable inputs based on the best information available in the circumstances, to the extent observable inputs are not available (including the Series’ own assumptions used in determining the fair value of investments and derivative financial instruments) |
Changes in valuation techniques may result in transfers into or out of an assigned level within the disclosure hierarchy. In accordance with the Series’ policy, transfers between different levels of the fair value disclosure hierarchy are deemed to have occurred as of the beginning of the reporting period. For information about the Series’ policy regarding valuation of investments and derivative financial instruments, refer to Note 2 of the Notes to Financial Statements.
As of June 30, 2015, the following tables summarize the Series’ investments and derivative financial instruments categorized in the disclosure hierarchy:
| | | | | | | | | | | | | | | | |
| | | Level 1 | | | Level 2 | | | Level 3 | | | Total | |
Assets: | | | | | | | | | | | | | | | | |
| Investments: | | | | | | | | | | | | | | | | |
| Common Stocks: | | | | | | | | | | | | | |
Australia | | $ | 1,971,650 | | | $ | 245,670,399 | | | $ | 9 | | | $ | 247,642,058 | |
Austria | | | — | | | | 6,424,308 | | | | 1 | | | | 6,424,309 | |
Belgium | | | — | | | | 47,140,191 | | | | — | | | | 47,140,191 | |
Denmark | | | 548,346 | | | | 59,149,996 | | | | — | | | | 59,698,342 | |
Finland | | | — | | | | 30,079,586 | | | | — | | | | 30,079,586 | |
France | | | 7,470,047 | | | | 341,218,612 | | | | — | | | | 348,688,659 | |
Germany | | | — | | | | 321,558,797 | | | | — | | | | 321,558,797 | |
Hong Kong | | | 7,565,672 | | | | 110,923,724 | | | | — | | | | 118,489,396 | |
Ireland | | | — | | | | 32,614,819 | | | | — | | | | 32,614,819 | |
Israel | | | — | | | | 21,532,244 | | | | — | | | | 21,532,244 | |
Italy | | | — | | | | 80,652,052 | | | | — | | | | 80,652,052 | |
Japan | | | — | | | | 825,149,902 | | | | — | | | | 825,149,902 | |
Luxembourg | | | 3,494,317 | | | | 983,281 | | | | — | | | | 4,477,598 | |
Netherlands | | | 1,012,237 | | | | 150,079,903 | | | | — | | | | 151,092,140 | |
New Zealand | | | 1,375,704 | | | | 3,723,453 | | | | — | | | | 5,099,157 | |
Norway | | | — | | | | 23,140,994 | | | | — | | | | 23,140,994 | |
Portugal | | | — | | | | 5,248,456 | | | | — | | | | 5,248,456 | |
Singapore | | | — | | | | 51,393,431 | | | | — | | | | 51,393,431 | |
Spain | | | — | | | | 125,914,442 | | | | — | | | | 125,914,442 | |
Sweden | | | 1,569,505 | | | | 105,212,053 | | | | — | | | | 106,781,558 | |
Switzerland | | | 2,099,106 | | | | 345,743,543 | | | | — | | | | 347,842,649 | |
United Kingdom | | | 9,759,604 | | | | 642,209,507 | | | | — | | | | 651,969,111 | |
Rights | | | 170,807 | | | | 129,057 | | | | — | | | | 299,864 | |
Short-Term Securities | | | 10,072,077 | | | | 3,524,062 | | | | — | | | | 13,596,139 | |
| | | | | | | | | | | | | | | | |
Total | | $ | 47,109,072 | | | $ | 3,579,416,812 | | | $ | 10 | | | $ | 3,626,525,894 | |
| | | | | | | | | | | | | | | | |
See Notes to Financial Statements.
| | | | | | |
| | | | | | | |
| 32 | | BLACKROCK INDEX FUNDS, INC. | | JUNE 30, 2015 | | |
| | |
Schedule of Investments (concluded) | | Master International Index Series |
| | | | | | | | | | | | | | | | |
| | | Level 1 | | | Level 2 | | | Level 3 | | | Total | |
| Derivative Financial Instruments1 | | | | | |
Assets: | | | | | | | | | | | | | | | | |
Equity contracts | | $ | 124,818 | | | | — | | | | — | | | $ | 124,818 | |
Liabilities: | | | | | | | | | | | | | | | | |
Equity contracts | | $ | (650,243 | ) | | | — | | | | — | | | $ | (650,243 | ) |
| | | | | | | | | | | | | | | | |
Total | | $ | (525,425 | ) | | | — | | | | — | | | $ | (525,425 | ) |
| | | | | | | | | | | | | | | | |
1 Derivative financial instruments are financial futures contracts, which are valued at the unrealized appreciation (depreciation) on the instrument. | | | | | |
The Series may hold assets and/or liabilities in which the fair value approximates the carrying amount for financial statement purposes. As of June 30, 2015, such assets and/or liabilities are categorized within the disclosure hierarchy as follows:
| | | | | | | | | | | | | | | | |
| | | Level 1 | | | Level 2 | | | Level 3 | | | Total | |
Assets: | | | | | | | | | | | | | | | | |
Cash pledged for financial futures contracts | | | $3,548,560 | | | | — | | | | — | | | $ | 3,548,560 | |
Foreign currency at value | | | 72,427,156 | | | | — | | | | — | | | | 72,427,156 | |
Liabilities: | | | | | | | | | | | | | | | | |
Collateral on securities loaned at value | | | — | | | $ | (3,524,062 | ) | | | — | | | | (3,524,062 | ) |
| | | | | | | | | | | | | | | | |
Total | | $ | 75,975,716 | | | $ | (3,524,062 | ) | | | — | | | $ | 72,451,654 | |
| | | | | | | | | | | | | | | | |
During the six months ended June 20, 2015, there were no transfers between levels.
See Notes to Financial Statements.
| | | | | | |
| | | | | | | |
| | BLACKROCK INDEX FUNDS, INC. | | JUNE 30, 2015 | | 33 |
| | |
Schedule of Investments June 30, 2015 (Unaudited) | | Master Small Cap Index Series (Percentages shown are based on Net Assets) |
| | | | | | | | |
| Common Stocks | | Shares | | | Value | |
Advertising Agencies — 0.3% | | | | | | | | |
Constant Contact, Inc. (a) | | | 16,243 | | | $ | 467,149 | |
Harte-Hanks, Inc. | | | 25,932 | | | | 154,555 | |
Marchex, Inc., Class B | | | 17,264 | | | | 85,457 | |
Marin Software, Inc. (a) | | | 15,012 | | | | 101,181 | |
Marketo, Inc. (a) | | | 17,459 | | | | 489,899 | |
MDC Partners, Inc., Class A | | | 22,009 | | | | 433,577 | |
National CineMedia, Inc. | | | 31,201 | | | | 497,968 | |
QuinStreet, Inc. (a) | | | 18,339 | | | | 118,287 | |
Sizmek, Inc. (a) | | | 10,376 | | | | 73,670 | |
TubeMogul, Inc. (a) | | | 6,991 | | | | 99,901 | |
Viad Corp. | | | 10,321 | | | | 279,802 | |
| | | | | | | | |
| | | | | | | | 2,801,446 | |
Aerospace — 1.3% | | | | | | | | |
AAR Corp. | | | 17,910 | | | | 570,792 | |
Aerojet Rocketdyne Holdings, Inc. (a) | | | 31,734 | | | | 654,038 | |
Aerovironment, Inc. (a) | | | 9,884 | | | | 257,775 | |
Astronics Corp. (a) | | | 9,666 | | | | 685,223 | |
Cubic Corp. | | | 10,901 | | | | 518,669 | |
Curtiss-Wright Corp. | | | 23,949 | | | | 1,734,865 | |
Ducommun, Inc. (a) | | | 5,861 | | | | 150,452 | |
Esterline Technologies Corp. (a) | | | 15,674 | | | | 1,494,359 | |
HEICO Corp. | | | 9,690 | | | | 564,927 | |
HEICO Corp., Class A | | | 20,106 | | | | 1,020,782 | |
Kaman Corp. | | | 13,473 | | | | 565,058 | |
KLX, Inc. (a) | | | 26,531 | | | | 1,170,813 | |
Kratos Defense & Security Solutions, Inc. (a) | | | 23,388 | | | | 147,344 | |
Moog, Inc., Class A (a) | | | 19,534 | | | | 1,380,663 | |
Teledyne Technologies, Inc. (a) | | | 17,830 | | | | 1,881,243 | |
| | | | | | | | |
| | | | | | | | 12,797,003 | |
Agriculture, Fishing & Ranching — 0.4% | | | | | | | | |
Alico, Inc. | | | 1,893 | | | | 85,867 | |
The Andersons, Inc. | | | 14,327 | | | | 558,753 | |
Arcadia Biosciences, Inc. (a) | | | 3,831 | | | | 24,403 | |
Cal-Maine Foods, Inc. | | | 15,876 | | | | 828,727 | |
Calavo Growers, Inc. | | | 7,424 | | | | 385,528 | |
Fresh Del Monte Produce, Inc. | | | 16,787 | | | | 648,985 | |
Limoneira Co. | | | 5,618 | | | | 124,888 | |
Sanderson Farms, Inc. | | | 11,378 | | | | 855,171 | |
Seaboard Corp. (a) | | | 133 | | | | 478,667 | |
| | | | | | | | |
| | | | | | | | 3,990,989 | |
Air Transport — 0.5% | | | | | | | | |
Air Transport Services Group, Inc. (a) | | | 26,770 | | | | 280,817 | |
Allegiant Travel Co. | | | 6,746 | | | | 1,199,978 | |
Atlas Air Worldwide Holdings, Inc. (a) | | | 12,676 | | | | 696,673 | |
Bristow Group, Inc. | | | 17,569 | | | | 936,428 | |
Era Group, Inc. (a) | | | 10,104 | | | | 206,930 | |
Hawaiian Holdings, Inc. (a) | | | 24,292 | | | | 576,935 | |
PHI, Inc. (a) | | | 6,221 | | | | 186,754 | |
Republic Airways Holdings, Inc. (a) | | | 26,639 | | | | 244,546 | |
SkyWest, Inc. | | | 26,150 | | | | 393,296 | |
Virgin America, Inc. (a) | | | 12,714 | | | | 349,381 | |
| | | | | | | | |
| | | | | | | | 5,071,738 | |
Alternative Energy — 0.2% | | | | | | | | |
Abengoa Yield PLC | | | 24,544 | | | | 768,718 | |
Ameresco, Inc., Class A (a) | | | 10,588 | | | | 80,998 | |
EnerNOC, Inc. (a) | | | 13,586 | | | | 131,784 | |
Green Brick Partners, Inc. (a) | | | 7,138 | | | | 78,161 | |
Green Plains Renewable Energy, Inc. | | | 19,183 | | | | 528,492 | |
REX American Resources Corp. (a) | | | 3,437 | | | | 218,731 | |
Solazyme, Inc. (a)(b) | | | 41,674 | | | | 130,857 | |
Vivint Solar, Inc. (a)(b) | | | 10,343 | | | | 125,874 | |
| | | | | | | | |
| | | | | | | | 2,063,615 | |
| Common Stocks | | Shares | | | Value | |
Aluminum — 0.1% | | | | | | | | |
Century Aluminum Co. (a) | | | 25,123 | | | | 262,033 | |
Kaiser Aluminum Corp. | | | 8,551 | | | | 710,417 | |
| | | | | | | | |
| | | | | | | | 972,450 | |
Asset Management & Custodian — 0.6% | | | | | | | | |
Arlington Asset Investment Corp. | | | 8,623 | | | | 168,666 | |
Ashford, Inc. (a) | | | 510 | | | | 44,508 | |
Calamos Asset Management, Inc., Class A | | | 8,959 | | | | 109,748 | |
CIFC Corp. | | | 3,012 | | | | 23,885 | |
Cohen & Steers, Inc. | | | 10,248 | | | | 349,252 | |
Cowen Group, Inc., Class A (a) | | | 57,245 | | | | 366,368 | |
Diamond Hill Investment Group, Inc. | | | 1,513 | | | | 302,086 | |
Fifth Street Asset Management, Inc. | | | 2,870 | | | | 29,504 | |
Financial Engines, Inc. | | | 26,173 | | | | 1,111,829 | |
GAMCO Investors, Inc., Class A | | | 3,195 | | | | 219,528 | |
KCG Holdings, Inc., Class A (a) | | | 22,497 | | | | 277,388 | |
Medley Management, Inc. | | | 3,817 | | | | 45,193 | |
OM Asset Management PLC | | | 12,461 | | | | 221,681 | |
Oppenheimer Holdings, Inc., Class A | | | 5,178 | | | | 136,078 | |
Pzena Investment Management, Inc., Class A | | | 6,495 | | | | 71,770 | |
RCS Capital Corp., Class A (a) | | | 24,493 | | | | 187,616 | |
Resource America, Inc., Class A | | | 8,345 | | | | 70,181 | |
Virtus Investment Partners, Inc. | | | 3,465 | | | | 458,246 | |
Westwood Holdings Group, Inc. | | | 3,828 | | | | 228,034 | |
WisdomTree Investments, Inc. | | | 57,570 | | | | 1,264,525 | |
ZAIS Group Holdings, Inc. (a) | | | 1,748 | | | | 19,053 | |
| | | | | | | | |
| | | | | | | | 5,705,139 | |
Auto Parts — 0.8% | | | | | | | | |
American Axle & Manufacturing Holdings, Inc. (a) | | | 38,556 | | | | 806,206 | |
Dana Holding Corp. | | | 82,418 | | | | 1,696,162 | |
Dorman Products, Inc. (a) | | | 13,382 | | | | 637,786 | |
Federal-Mogul Corp. (a) | | | 15,138 | | | | 171,816 | |
Fenix Parts, Inc. (a) | | | 6,805 | | | | 68,186 | |
Fox Factory Holding Corp. (a) | | | 8,063 | | | | 129,653 | |
Gentherm, Inc. (a) | | | 18,080 | | | | 992,773 | |
Meritor, Inc. (a) | | | 49,483 | | | | 649,217 | |
Metaldyne Performance Group, Inc. | | | 5,712 | | | | 103,673 | |
Remy International, Inc. | | | 14,205 | | | | 314,072 | |
Standard Motor Products, Inc. | | | 9,995 | | | | 351,024 | |
Stoneridge, Inc. (a) | | | 14,046 | | | | 164,479 | |
Superior Industries International, Inc. | | | 11,360 | | | | 208,002 | |
Tenneco, Inc. (a) | | | 30,913 | | | | 1,775,643 | |
Tower International, Inc. (a) | | | 10,796 | | | | 281,236 | |
| | | | | | | | |
| | | | | | | | 8,349,928 | |
Auto Services — 0.1% | | | | | | | | |
Cooper Tire & Rubber Co. | | | 29,148 | | | | 986,077 | |
Back Office Support, HR & Consulting — 1.9% | | | | | | | | |
6D Global Technologies, Inc. (a) | | | 9,572 | | | | 62,601 | |
The Advisory Board Co. (a) | | | 21,464 | | | | 1,173,437 | |
Angie’s List, Inc. (a) | | | 22,416 | | | | 138,082 | |
Arrowhead Research Corp. (a)(b) | | | 29,993 | | | | 214,450 | |
Barrett Business Services, Inc. | | | 3,579 | | | | 129,989 | |
CBIZ, Inc. (a) | | | 25,269 | | | | 243,593 | |
CDI Corp. | | | 7,357 | | | | 95,641 | |
CEB, Inc. | | | 16,975 | | | | 1,477,843 | |
Convergys Corp. | | | 50,208 | | | | 1,279,802 | |
CRA International, Inc. (a) | | | 4,807 | | | | 133,971 | |
DHI Group, Inc. (a) | | | 22,366 | | | | 198,834 | |
ExlService Holdings, Inc. (a) | | | 16,897 | | | | 584,298 | |
Forrester Research, Inc. | | | 5,129 | | | | 184,747 | |
FTI Consulting, Inc. (a) | | | 21,110 | | | | 870,576 | |
GP Strategies Corp. (a) | | | 6,581 | | | | 218,752 | |
The Hackett Group, Inc. | | | 12,423 | | | | 166,841 | |
Heidrick & Struggles International, Inc. | | | 9,434 | | | | 246,039 | |
Huron Consulting Group, Inc. (a) | | | 11,746 | | | | 823,277 | |
See Notes to Financial Statements.
| | | | | | |
| | | | | | | |
| 34 | | BLACKROCK INDEX FUNDS, INC. | | JUNE 30, 2015 | | |
| | |
Schedule of Investments (continued) | | Master Small Cap Index Series (Percentages shown are based on Net Assets) |
| | | | | | | | |
| Common Stocks | | Shares | | | Value | |
Back Office Support, HR & Consulting (concluded) | | | | | | | | |
ICF International, Inc. (a) | | | 10,044 | | | $ | 350,134 | |
Insperity, Inc. | | | 9,793 | | | | 498,464 | |
Kelly Services, Inc., Class A | | | 14,881 | | | | 228,423 | |
Kforce, Inc. | | | 12,476 | | | | 285,326 | |
Korn/Ferry International | | | 25,475 | | | | 885,766 | |
Liquidity Services, Inc. (a) | | | 12,470 | | | | 120,086 | |
MAXIMUS, Inc. | | | 33,379 | | | | 2,194,002 | |
Monster Worldwide, Inc. (a) | | | 45,774 | | | | 299,362 | |
Navigant Consulting, Inc. (a) | | | 24,598 | | | | 365,772 | |
NV5 Holdings, Inc. (a) | | | 2,603 | | | | 63,149 | |
On Assignment, Inc. (a) | | | 26,146 | | | | 1,027,015 | |
Patriot National, Inc. (a) | | | 4,601 | | | | 73,616 | |
Paylocity Holding Corp. (a) | | | 7,848 | | | | 281,351 | |
PFSweb, Inc. (a) | | | 5,860 | | | | 81,220 | |
Resources Connection, Inc. | | | 19,293 | | | | 310,424 | |
RPX Corp. (a) | | | 27,640 | | | | 467,116 | |
ServiceSource International, Inc. (a) | | | 29,988 | | | | 164,034 | |
Sykes Enterprises, Inc. (a) | | | 19,864 | | | | 481,702 | |
TeleTech Holdings, Inc. | | | 8,371 | | | | 226,687 | |
TriNet Group, Inc. (a) | | | 20,816 | | | | 527,686 | |
TrueBlue, Inc. (a) | | | 21,187 | | | | 633,491 | |
Volt Information Sciences, Inc. (a) | | | 4,484 | | | | 43,540 | |
WageWorks, Inc. (a) | | | 18,057 | | | | 730,406 | |
| | | | | | | | |
| | | | | | | | 18,581,545 | |
Banks: Diversified — 7.9% | | | | | | | | |
1st Source Corp. | | | 7,379 | | | | 251,771 | |
Access National Corp. | | | 3,359 | | | | 65,299 | |
Ambac Financial Group, Inc. (a) | | | 17,555 | | | | 292,115 | |
American National Bankshares, Inc. | | | 4,432 | | | | 105,526 | |
Ameris Bancorp | | | 16,111 | | | | 407,447 | |
Ames National Corp. | | | 4,424 | | | | 111,042 | |
Anchor BanCorp Wisconsin, Inc. (a) | | | 3,801 | | | | 144,362 | |
Arrow Financial Corp. | | | 5,405 | | | | 146,097 | |
Bancfirst Corp. | | | 3,490 | | | | 228,421 | |
Banco Latinoamericano de Comercio Exterior SA | | | 15,396 | | | | 495,443 | |
The Bancorp, Inc. (a) | | | 17,098 | | | | 158,669 | |
BancorpSouth, Inc. | | | 49,078 | | | | 1,264,249 | |
Bank of Marin Bancorp | | | 3,037 | | | | 154,492 | |
Bank of the Ozarks, Inc. | | | 39,443 | | | | 1,804,517 | |
Banner Corp. | | | 10,658 | | | | 510,838 | |
Bar Harbor Bankshares | | | 2,662 | | | | 94,315 | |
BBCN Bancorp, Inc. | | | 40,315 | | | | 596,259 | |
BBX Capital Corp. (a) | | | 1,551 | | | | 25,188 | |
Beneficial Bancorp, Inc. (a) | | | 41,254 | | | | 515,262 | |
BNC Bancorp | | | 11,965 | | | | 231,283 | |
Boston Private Financial Holdings, Inc. | | | 41,703 | | | | 559,237 | |
Bridge Bancorp, Inc. | | | 5,957 | | | | 158,992 | |
Bridge Capital Holdings (a) | | | 4,971 | | | | 148,136 | |
Bryn Mawr Bank Corp. | | | 8,448 | | | | 254,792 | |
Camden National Corp. | | | 3,721 | | | | 144,003 | |
Capital City Bank Group, Inc. | | | 5,174 | | | | 79,007 | |
Capitol Federal Financial, Inc. | | | 71,197 | | | | 857,212 | |
Cardinal Financial Corp. | | | 16,265 | | | | 354,414 | |
Cascade Bancorp (a) | | | 14,544 | | | | 75,338 | |
Cathay General Bancorp | | | 40,443 | | | | 1,312,375 | |
Centerstate Banks, Inc. | | | 22,357 | | | | 302,043 | |
Central Pacific Financial Corp. | | | 11,614 | | | | 275,833 | |
Century Bancorp, Inc., Class A | | | 1,790 | | | | 72,781 | |
Charter Financial Corp. | | | 8,275 | | | | 102,693 | |
Chemical Financial Corp. | | | 16,921 | | | | 559,408 | |
Citizens & Northern Corp. | | | 5,955 | | | | 122,375 | |
City Holding Co. | | | 7,590 | | | | 373,807 | |
CNB Financial Corp. | | | 7,463 | | | | 137,319 | |
CoBiz Financial, Inc. | | | 18,716 | | | | 244,618 | |
Columbia Banking System, Inc. | | | 29,223 | | | | 950,916 | |
Community Bank System, Inc. | | | 20,621 | | | | 778,855 | |
| Common Stocks | | Shares | | | Value | |
Banks: Diversified (continued) | | | | | | | | |
Community Trust Bancorp, Inc. | | | 7,795 | | | | 271,812 | |
CommunityOne Bancorp (a) | | | 5,682 | | | | 61,195 | |
ConnectOne Bancorp, Inc. | | | 14,364 | | | | 309,257 | |
CU Bancorp (a) | | | 8,054 | | | | 178,477 | |
Customers Bancorp, Inc. (a) | | | 13,822 | | | | 371,674 | |
CVB Financial Corp. | | | 53,849 | | | | 948,281 | |
Eagle Bancorp, Inc. (a) | | | 15,056 | | | | 661,862 | |
Enterprise Bancorp, Inc. | | | 3,640 | | | | 85,322 | |
Enterprise Financial Services Corp. | | | 10,274 | | | | 233,939 | |
EverBank Financial Corp. | | | 48,366 | | | | 950,392 | |
Farmers Capital Bank Corp. (a) | | | 3,646 | | | | 103,656 | |
Fidelity Southern Corp. | | | 8,829 | | | | 153,978 | |
Financial Institutions, Inc. | | | 7,316 | | | | 181,729 | |
First Bancorp, Inc. | | | 4,908 | | | | 95,412 | |
First Bancorp, North Carolina | | | 10,354 | | | | 172,705 | |
First BanCorp, Puerto Rico (a) | | | 59,021 | | | | 284,481 | |
First Busey Corp. | | | 35,704 | | | | 234,575 | |
First Business Financial Services, Inc. | | | 2,135 | | | | 100,089 | |
First Citizens BancShares, Inc., Class A | | | 3,915 | | | | 1,029,802 | |
First Commonwealth Financial Corp. | | | 45,826 | | | | 439,471 | |
First Community Bancshares, Inc. | | | 8,380 | | | | 152,684 | |
First Connecticut Bancorp, Inc. | | | 8,288 | | | | 131,531 | |
First Financial Bancorp | | | 30,536 | | | | 547,816 | |
First Financial Bankshares, Inc. | | | 32,349 | | | | 1,120,569 | |
First Financial Corp. | | | 5,544 | | | | 198,253 | |
First Interstate Bancsystem, Inc. | | | 9,693 | | | | 268,884 | |
First Merchants Corp. | | | 19,014 | | | | 469,646 | |
First Midwest Bancorp, Inc. | | | 39,698 | | | | 753,071 | |
First NBC Bank Holding Co. (a) | | | 7,758 | | | | 279,288 | |
The First of Long Island Corp. | | | 6,443 | | | | 178,600 | |
FirstMerit Corp. | | | 84,101 | | | | 1,751,824 | |
Flagstar Bancorp, Inc. (a) | | | 10,661 | | | | 197,015 | |
FNB Corp. | | | 89,022 | | | | 1,274,795 | |
Franklin Financial Network, Inc. (a) | | | 2,739 | | | | 62,833 | |
Fulton Financial Corp. | | | 87,759 | | | | 1,146,133 | |
German American Bancorp, Inc. | | | 6,735 | | | | 198,346 | |
Glacier Bancorp, Inc. | | | 38,201 | | | | 1,123,873 | |
Great Western Bancorp, Inc. | | | 20,691 | | | | 498,860 | |
Guaranty Bancorp | | | 7,702 | | | | 127,160 | |
Hampton Roads Bankshares, Inc. (a) | | | 19,070 | | | | 39,666 | |
Hancock Holding Co. | | | 39,321 | | | | 1,254,733 | |
Hanmi Financial Corp. | | | 16,076 | | | | 399,328 | |
Heartland Financial USA, Inc. | | | 8,969 | | | | 333,826 | |
Heritage Commerce Corp. | | | 11,043 | | | | 106,123 | |
Heritage Oaks Bancorp | | | 12,105 | | | | 95,266 | |
Home BancShares, Inc. | | | 28,746 | | | | 1,050,954 | |
Horizon Bancorp | | | 4,687 | | | | 116,988 | |
Hudson Valley Holding Corp. | | | 7,806 | | | | 220,207 | |
Iberiabank Corp. | | | 19,167 | | | | 1,307,764 | |
Independent Bank Corp./MA | | | 13,126 | | | | 615,478 | |
Independent Bank Corp./MI | | | 8,253 | | | | 111,911 | |
Independent Bank Group, Inc. | | | 4,906 | | | | 210,467 | |
International Bancshares Corp. | | | 27,499 | | | | 738,898 | |
Janus Capital Group, Inc. | | | 74,557 | | | | 1,276,416 | |
Lakeland Bancorp, Inc. | | | 19,759 | | | | 234,935 | |
Lakeland Financial Corp. | | | 8,306 | | | | 360,231 | |
MainSource Financial Group, Inc. | | | 10,723 | | | | 235,370 | |
MB Financial, Inc. | | | 37,834 | | | | 1,303,003 | |
Mercantile Bank Corp. | | | 8,585 | | | | 183,805 | |
Merchants Bancshares, Inc. | | | 2,406 | | | | 79,566 | |
Metro Bancorp, Inc. | | | 6,190 | | | | 161,807 | |
National Bank Holdings Corp., Class A | | | 18,688 | | | | 389,271 | |
National Bankshares, Inc. | | | 3,352 | | | | 98,080 | |
National Commerce Corp. (a) | | | 2,876 | | | | 74,201 | |
National Penn Bancshares, Inc. | | | 70,809 | | | | 798,726 | |
NBT Bancorp, Inc. | | | 22,034 | | | | 576,630 | |
NewBridge Bancorp | | | 17,592 | | | | 157,097 | |
See Notes to Financial Statements.
| | | | | | |
| | | | | | | |
| | BLACKROCK INDEX FUNDS, INC. | | JUNE 30, 2015 | | 35 |
| | |
Schedule of Investments (continued) | | Master Small Cap Index Series (Percentages shown are based on Net Assets) |
| | | | | | | | |
| Common Stocks | | Shares | | | Value | |
Banks: Diversified (concluded) | | | | | | | | |
OFG Bancorp | | | 22,898 | | | $ | 244,322 | |
Old National Bancorp | | | 59,492 | | | | 860,254 | |
Old Second Bancorp, Inc. (a) | | | 10,762 | | | | 71,029 | |
Opus Bank | | | 5,121 | | | | 185,278 | |
Pacific Continental Corp. | | | 10,119 | | | | 136,910 | |
Pacific Premier Bancorp, Inc. (a) | | | 11,130 | | | | 188,765 | |
Palmetto Bancshares, Inc. | | | 2,178 | | | | 43,059 | |
Park National Corp. | | | 6,425 | | | | 561,352 | |
Park Sterling Corp. | | | 24,207 | | | | 174,290 | |
Peapack Gladstone Financial Corp. | | | 7,935 | | | | 176,316 | |
Penns Woods Bancorp, Inc. | | | 2,435 | | | | 107,359 | |
Peoples Bancorp, Inc. | | | 8,958 | | | | 209,080 | |
Peoples Financial Services Corp. | | | 3,833 | | | | 151,825 | |
Pinnacle Financial Partners, Inc. | | | 18,201 | | | | 989,588 | |
Preferred Bank | | | 5,956 | | | | 178,978 | |
PrivateBancorp, Inc. | | | 39,743 | | | | 1,582,566 | |
Prosperity Bancshares, Inc. | | | 35,416 | | | | 2,044,920 | |
Provident Financial Services, Inc. | | | 33,046 | | | | 627,544 | |
QCR Holdings, Inc. | | | 5,735 | | | | 124,794 | |
Renasant Corp. | | | 15,829 | | | | 516,025 | |
Republic Bancorp, Inc., Class A | | | 5,165 | | | | 132,741 | |
S&T Bancorp, Inc. | | | 17,201 | | | | 508,978 | |
Sandy Spring Bancorp, Inc. | | | 12,485 | | | | 349,330 | |
Seacoast Banking Corp. of Florida (a) | | | 11,339 | | | | 179,156 | |
ServisFirst Bancshares, Inc. | | | 10,811 | | | | 406,169 | |
Sierra Bancorp | | | 6,314 | | | | 109,295 | |
Simmons First National Corp., Class A | | | 14,732 | | | | 687,690 | |
South State Corp. | | | 12,258 | | | | 931,485 | |
Southside Bancshares, Inc. | | | 12,781 | | | | 373,589 | |
Southwest Bancorp, Inc. | | | 9,836 | | | | 183,048 | |
Square 1 Financial, Inc. (a) | | | 8,513 | | | | 232,831 | |
State Bank Financial Corp. | | | 18,161 | | | | 394,094 | |
Stock Yards Bancorp, Inc. | | | 7,464 | | | | 282,065 | |
Stonegate Bank | | | 5,294 | | | | 157,073 | |
Suffolk Bancorp | | | 5,953 | | | | 152,754 | |
Susquehanna Bancshares, Inc. | | | 93,061 | | | | 1,314,021 | |
Talmer Bancorp, Inc., Class A | | | 27,312 | | | | 457,476 | |
Texas Capital Bancshares, Inc. (a) | | | 23,156 | | | | 1,441,229 | |
Tompkins Financial Corp. | | | 7,514 | | | | 403,652 | |
TowneBank | | | 22,780 | | | | 371,086 | |
Trico Bancshares | | | 11,549 | | | | 277,753 | |
Tristate Capital Holdings, Inc. (a) | | | 11,077 | | | | 143,226 | |
Triumph Bancorp, Inc. (a) | | | 7,395 | | | | 97,244 | |
TrustCo Bank Corp. NY | | | 47,795 | | | | 335,999 | |
Trustmark Corp. | | | 34,091 | | | | 851,593 | |
UMB Financial Corp. | | | 19,827 | | | | 1,130,536 | |
Umpqua Holdings Corp. | | | 111,132 | | | | 1,999,265 | |
Union Bankshares Corp. | | | 22,661 | | | | 526,642 | |
United Bankshares, Inc. | | | 34,996 | | | | 1,407,889 | |
United Community Banks, Inc. | | | 24,997 | | | | 521,687 | |
United Community Financial Corp. | | | 25,932 | | | | 138,736 | |
Univest Corp. of Pennsylvania | | | 9,221 | | | | 187,740 | |
Valley National Bancorp | | | 118,133 | | | | 1,217,951 | |
Washington Trust Bancorp, Inc. | | | 7,363 | | | | 290,691 | |
Webster Financial Corp. | | | 46,152 | | | | 1,825,312 | |
WesBanco, Inc. | | | 18,937 | | | | 644,237 | |
West BanCorp., Inc. | | | 8,410 | | | | 166,854 | |
Westamerica BanCorp | | | 12,796 | | | | 648,117 | |
Western Alliance Bancorp (a) | | | 39,575 | | | | 1,336,052 | |
Wilshire Bancorp, Inc. | | | 36,162 | | | | 456,726 | |
Wintrust Financial Corp. | | | 24,014 | | | | 1,281,867 | |
Yadkin Financial Corp. (a) | | | 12,433 | | | | 260,471 | |
| | | | | | | | |
| | | | | | | | 79,335,390 | |
Banks: Savings, Thrift & Mortgage Lending — 1.4% | |
Apollo Residential Mortgage, Inc. | | | 16,286 | | | | 239,241 | |
Astoria Financial Corp. | | | 45,663 | | | | 629,693 | |
| Common Stocks | | Shares | | | Value | |
Banks: Savings, Thrift & Mortgage Lending (concluded) | |
Banc of California, Inc. | | | 18,343 | | | | 252,216 | |
Bank Mutual Corp. | | | 24,291 | | | | 186,312 | |
BankFinancial Corp. | | | 9,713 | | | | 114,419 | |
Bear State Financial, Inc. (a) | | | 5,997 | | | | 56,012 | |
Berkshire Hills Bancorp, Inc. | | | 14,985 | | | | 426,773 | |
BofI Holding, Inc. (a) | | | 7,815 | | | | 826,124 | |
Brookline Bancorp, Inc. | | | 35,931 | | | | 405,661 | |
BSB Bancorp, Inc. (a) | | | 3,755 | | | | 83,023 | |
Clifton Bancorp, Inc. | | | 13,165 | | | | 184,178 | |
Dime Community Bancshares, Inc. | | | 15,835 | | | | 268,245 | |
First Defiance Financial Corp. | | | 4,712 | | | | 176,841 | |
Flushing Financial Corp. | | | 15,112 | | | | 317,503 | |
Fox Chase Bancorp, Inc. | | | 5,656 | | | | 95,700 | |
Great Southern Bancorp, Inc. | | | 5,422 | | | | 228,483 | |
Heritage Financial Corp. | | | 15,615 | | | | 279,040 | |
Heritage Financial Group, Inc. | | | 4,554 | | | | 137,440 | |
Hingham Institution for Savings | | | 589 | | | | 67,800 | |
HomeStreet, Inc. (a) | | | 11,276 | | | | 257,318 | |
Investors Bancorp, Inc. | | | 176,125 | | | | 2,166,337 | |
Kearny Financial Corp. (a) | | | 46,708 | | | | 521,261 | |
Ladder Capital Corp., Class A | | | 19,552 | | | | 339,227 | |
LegacyTexas Financial Group, Inc. | | | 23,845 | | | | 720,119 | |
Meridian Bancorp, Inc. (a) | | | 27,343 | | | | 366,670 | |
Northfield Bancorp, Inc. | | | 23,682 | | | | 356,414 | |
Northwest Bancshares, Inc. | | | 47,663 | | | | 611,040 | |
OceanFirst Financial Corp. | | | 6,798 | | | | 126,783 | |
Ocwen Financial Corp. (a) | | | 54,124 | | | | 552,065 | |
Oritani Financial Corp. | | | 22,181 | | | | 356,005 | |
Sterling Bancorp | | | 46,375 | | | | 681,713 | |
Territorial Bancorp, Inc. | | | 4,134 | | | | 100,291 | |
United Financial Bancorp, Inc. | | | 25,253 | | | | 339,653 | |
Washington Federal, Inc. | | | 47,930 | | | | 1,119,165 | |
Waterstone Financial, Inc. | | | 15,622 | | | | 206,210 | |
WSFS Financial Corp. | | | 14,241 | | | | 389,491 | |
| | | | | | | | |
| | | | | | | | 14,184,466 | |
Beverage: Brewers & Distillers — 0.1% | |
The Boston Beer Co., Inc., Class A (a) | | | 4,579 | | | | 1,062,282 | |
Castle Brands, Inc. (a) | | | 30,835 | | | | 42,861 | |
Craft Brew Alliance, Inc. (a) | | | 5,710 | | | | 63,152 | |
| | | | | | | | |
| | | | | | | | 1,168,295 | |
Beverage: Soft Drinks — 0.1% | |
Coca-Cola Bottling Co. Consolidated | | | 2,340 | | | | 353,504 | |
Farmer Bros Co. (a) | | | 3,848 | | | | 90,428 | |
National Beverage Corp. (a) | | | 5,703 | | | | 128,260 | |
| | | | | | | | |
| | | | | | | | 572,192 | |
Biotechnology — 5.6% | |
Acceleron Pharma, Inc. (a) | | | 10,932 | | | | 345,888 | |
Acorda Therapeutics, Inc. (a) | | | 21,606 | | | | 720,128 | |
Aduro Biotech, Inc. (a) | | | 4,226 | | | | 128,175 | |
Advaxis, Inc. (a) | | | 15,296 | | | | 310,968 | |
Aegerion Pharmaceuticals, Inc. (a) | | | 12,744 | | | | 241,754 | |
Affimed NV (a) | | | 7,693 | | | | 103,625 | |
Agenus, Inc. (a) | | | 38,485 | | | | 332,126 | |
Akebia Therapeutics, Inc. (a) | | | 11,821 | | | | 121,638 | |
Albany Molecular Research, Inc. (a) | | | 12,364 | | | | 250,000 | |
Alder Biopharmaceuticals, Inc. (a) | | | 10,398 | | | | 550,782 | |
Alimera Sciences, Inc. (a) | | | 15,058 | | | | 69,417 | |
AMAG Pharmaceuticals, Inc. (a) | | | 8,505 | | | | 587,355 | |
Amicus Therapeutics, Inc. (a) | | | 48,563 | | | | 687,166 | |
ANI Pharmaceuticals, Inc. (a) | | | 3,985 | | | | 247,269 | |
Anthera Pharmaceuticals, Inc. (a) | | | 18,083 | | | | 155,875 | |
Applied Genetic Technologies Corp. (a) | | | 4,257 | | | | 65,302 | |
Ardelyx, Inc. (a) | | | 6,055 | | | | 96,698 | |
Arena Pharmaceuticals, Inc. (a) | | | 122,028 | | | | 566,210 | |
See Notes to Financial Statements.
| | | | | | |
| | | | | | | |
| 36 | | BLACKROCK INDEX FUNDS, INC. | | JUNE 30, 2015 | | |
| | |
Schedule of Investments (continued) | | Master Small Cap Index Series (Percentages shown are based on Net Assets) |
| | | | | | | | |
| Common Stocks | | Shares | | | Value | |
Biotechnology (continued) | |
Ariad Pharmaceuticals, Inc. (a) | | | 84,530 | | | $ | 699,063 | |
Array BioPharma, Inc. (a) | | | 71,338 | | | | 514,347 | |
Assembly Biosciences, Inc. (a) | | | 7,055 | | | | 135,879 | |
Asterias Biotherapeutics, Inc. (a) | | | 5,229 | | | | 24,053 | |
Atara Biotherapeutics, Inc. (a) | | | 7,284 | | | | 384,304 | |
aTyr Pharma, Inc. (a) | | | 3,061 | | | | 56,690 | |
Avalanche Biotechnologies, Inc. (a) | | | 9,857 | | | | 160,078 | |
Bellicum Pharmaceuticals, Inc. (a) | | | 4,289 | | | | 91,227 | |
BioCryst Pharmaceuticals, Inc. (a) | | | 36,565 | | | | 545,915 | |
BioDelivery Sciences International, Inc. (a) | | | 23,530 | | | | 187,299 | |
BioTelemetry, Inc. (a) | | | 14,600 | | | | 137,678 | |
Biotime, Inc. (a)(b) | | | 27,703 | | | | 100,562 | |
Blueprint Medicines Corp. (a) | | | 4,719 | | | | 125,006 | |
Calithera Biosciences, Inc. (a)(b) | | | 5,615 | | | | 40,091 | |
Carbylan Therapeutics, Inc. (a) | | | 6,127 | | | | 43,808 | |
Catalyst Pharmaceutical Partners, Inc. (a) | | | 37,692 | | | | 155,668 | |
Celldex Therapeutics, Inc. (a) | | | 49,729 | | | | 1,254,165 | |
Cellular Biomedicine Group, Inc. (a) | | | 4,974 | | | | 186,575 | |
Cepheid, Inc. (a) | | | 36,294 | | | | 2,219,378 | |
ChemoCentryx, Inc. (a) | | | 14,743 | | | | 121,335 | |
Cidara Therapeutics, Inc. (a) | | | 2,410 | | | | 33,788 | |
Clovis Oncology, Inc. (a) | | | 12,566 | | | | 1,104,300 | |
Coherus Biosciences, Inc. (a) | | | 11,834 | | | | 342,003 | |
Collegium Pharmaceutical, Inc. (a) | | | 3,371 | | | | 60,139 | |
Corium International, Inc. (a) | | | 4,199 | | | | 57,484 | |
CTI BioPharma Corp. (a) | | | 81,214 | | | | 158,367 | |
Curis, Inc. (a) | | | 55,689 | | | | 184,331 | |
Cytokinetics, Inc. (a) | | | 18,010 | | | | 121,027 | |
CytRx Corp. (a)(b) | | | 28,762 | | | | 106,995 | |
Dermira, Inc. (a) | | | 6,254 | | | | 109,758 | |
Dyax Corp. (a) | | | 73,492 | | | | 1,947,538 | |
Dynavax Technologies Corp. (a) | | | 14,804 | | | | 346,784 | |
Emergent Biosolutions, Inc. (a) | | | 15,201 | | | | 500,873 | |
Epizyme, Inc. (a) | | | 14,577 | | | | 349,848 | |
Exact Sciences Corp. (a) | | | 44,825 | | | | 1,333,095 | |
Exelixis, Inc. (a)(b) | | | 99,069 | | | | 372,499 | |
Fibrocell Science, Inc. (a) | | | 12,133 | | | | 63,941 | |
FibroGen, Inc. (a) | | | 24,102 | | | | 566,397 | |
Five Prime Therapeutics, Inc. (a) | | | 10,782 | | | | 267,825 | |
Flex Pharma, Inc. (a) | | | 2,873 | | | | 49,416 | |
Foundation Medicine, Inc. (a)(b) | | | 6,057 | | | | 204,969 | |
Galena Biopharma, Inc. (a) | | | 83,479 | | | | 141,914 | |
GenMark Diagnostics, Inc. (a) | | | 21,045 | | | | 190,668 | |
Genocea Biosciences, Inc. (a) | | | 9,171 | | | | 125,918 | |
Genomic Health, Inc. (a) | | | 8,829 | | | | 245,358 | |
Geron Corp. (a) | | | 80,021 | | | | 342,490 | |
Halozyme Therapeutics, Inc. (a) | | | 53,551 | | | | 1,209,182 | |
Harvard Bioscience, Inc. (a) | | | 15,343 | | | | 87,455 | |
Heron Therapeutics, Inc. (a) | | | 12,437 | | | | 387,537 | |
Idera Pharmaceuticals, Inc. (a)(b) | | | 44,732 | | | | 165,956 | |
IGI Laboratories, Inc. (a)(b) | | | 21,049 | | | | 132,609 | |
Ignyta, Inc. (a) | | | 9,170 | | | | 138,375 | |
Immunogen, Inc. (a) | | | 43,486 | | | | 625,329 | |
Immunomedics, Inc. (a) | | | 48,339 | | | | 196,256 | |
INC Research Holdings, Inc., Class A (a) | | | 6,559 | | | | 263,147 | |
Inovio Pharmaceuticals, Inc. (a) | | | 36,330 | | | | 296,453 | |
Insmed, Inc. (a) | | | 30,919 | | | | 755,042 | |
Insys Therapeutics, Inc. (a) | | | 11,931 | | | | 428,562 | |
Invitae Corp. (a) | | | 3,830 | | | | 56,990 | |
Karyopharm Therapeutics, Inc. (a) | | | 11,561 | | | | 314,575 | |
Keryx Biopharmaceuticals, Inc. (a)(b) | | | 52,236 | | | | 521,315 | |
Lexicon Pharmaceuticals, Inc. (a) | | | 20,432 | | | | 164,478 | |
Ligand Pharmaceuticals, Inc., Class B (a) | | | 8,875 | | | | 895,488 | |
Lion Biotechnologies, Inc. (a) | | | 22,559 | | | | 206,866 | |
Loxo Oncology, Inc. (a) | | | 3,845 | | | | 69,325 | |
MacroGenics, Inc. (a) | | | 14,185 | | | | 538,604 | |
MannKind Corp. (a)(b) | | | 124,370 | | | | 707,665 | |
| Common Stocks | | Shares | | | Value | |
Biotechnology (concluded) | |
Medgenics, Inc. (a) | | | 8,070 | | | | 49,469 | |
Merrimack Pharmaceuticals, Inc. (a) | | | 55,465 | | | | 685,825 | |
Mirati Therapeutics, Inc. (a) | | | 4,977 | | | | 156,626 | |
Momenta Pharmaceuticals, Inc. (a) | | | 30,789 | | | | 702,297 | |
Myriad Genetics, Inc. (a) | | | 34,825 | | | | 1,183,702 | |
Nektar Therapeutics (a) | | | 66,359 | | | | 830,151 | |
Neurocrine Biosciences, Inc. (a) | | | 43,110 | | | | 2,058,934 | |
NewLink Genetics Corp. (a) | | | 10,476 | | | | 463,773 | |
Northwest Biotherapeutics, Inc. (a)(b) | | | 23,095 | | | | 229,333 | |
Novavax, Inc. (a) | | | 135,247 | | | | 1,506,652 | |
Ocata Therapeutics, Inc. (a) | | | 17,444 | | | | 91,930 | |
Omeros Corp. (a) | | | 19,102 | | | | 343,645 | |
OncoMed Pharmaceuticals, Inc. (a) | | | 8,532 | | | | 191,970 | |
Oncothyreon, Inc. (a) | | | 51,318 | | | | 191,929 | |
Ophthotech Corp. (a) | | | 11,907 | | | | 619,878 | |
Orexigen Therapeutics, Inc. (a) | | | 51,972 | | | | 257,261 | |
Organovo Holdings, Inc. (a)(b) | | | 40,878 | | | | 154,110 | |
Osiris Therapeutics, Inc. (a) | | | 9,712 | | | | 188,996 | |
Pacific Biosciences of California, Inc. (a) | | | 30,573 | | | | 176,100 | |
PDL BioPharma, Inc. | | | 83,638 | | | | 537,792 | |
Peregrine Pharmaceuticals, Inc. (a) | | | 92,875 | | | | 121,666 | |
Pfenex, Inc. (a) | | | 8,184 | | | | 158,770 | |
PRA Health Sciences, Inc. (a) | | | 10,183 | | | | 369,948 | |
Progenics Pharmaceuticals, Inc. (a) | | | 35,226 | | | | 262,786 | |
Proteon Therapeutics, Inc. (a) | | | 3,720 | | | | 66,439 | |
Prothena Corp. PLC (a) | | | 15,793 | | | | 831,817 | |
PTC Therapeutics, Inc. (a) | | | 17,067 | | | | 821,435 | |
RadNet, Inc. (a) | | | 16,937 | | | | 113,309 | |
Raptor Pharmaceutical Corp. (a) | | | 40,578 | | | | 640,727 | |
Regulus Therapeutics, Inc. (a) | | | 14,277 | | | | 156,476 | |
Repligen Corp. (a) | | | 16,578 | | | | 684,174 | |
Retrophin, Inc. (a) | | | 17,653 | | | | 585,197 | |
Rigel Pharmaceuticals, Inc. (a) | | | 43,340 | | | | 139,121 | |
Rockwell Medical, Inc. (a)(b) | | | 25,024 | | | | 403,387 | |
RTI Surgical, Inc. (a) | | | 29,054 | | | | 187,689 | |
Sage Therapeutics, Inc. (a) | | | 6,950 | | | | 507,350 | |
Sangamo Biosciences, Inc. (a) | | | 35,027 | | | | 388,449 | |
Sarepta Therapeutics, Inc. (a) | | | 20,924 | | | | 636,717 | |
Sequenom, Inc. (a) | | | 58,892 | | | | 179,032 | |
Sorrento Therapeutics, Inc. (a) | | | 14,306 | | | | 252,072 | |
Spark Therapeutics, Inc. (a) | | | 4,077 | | | | 245,721 | |
Stemline Therapeutics, Inc. (a) | | | 7,911 | | | | 93,112 | |
Sucampo Pharmaceuticals, Inc., Class A (a) | | | 12,631 | | | | 207,527 | |
Synergy Pharmaceuticals, Inc. (a)(b) | | | 50,398 | | | | 418,303 | |
Synta Pharmaceuticals Corp. (a) | | | 45,785 | | | | 102,101 | |
TESARO, Inc. (a) | | | 11,738 | | | | 690,077 | |
Theravance, Inc. (b) | | | 42,929 | | | | 775,727 | |
Threshold Pharmaceuticals, Inc. (a) | | | 30,993 | | | | 125,212 | |
Tobira Therapeutics, Inc. (a) | | | 1,239 | | | | 21,373 | |
Tokai Pharmaceuticals, Inc. (a)(b) | | | 4,736 | | | | 62,989 | |
Trevena, Inc. (a) | | | 11,999 | | | | 75,114 | |
Trovagene, Inc. (a) | | | 12,287 | | | | 124,713 | |
Vanda Pharmaceuticals, Inc. (a) | | | 21,023 | | | | 266,782 | |
Veracyte, Inc. (a) | | | 6,683 | | | | 74,449 | |
Verastem, Inc. (a) | | | 16,460 | | | | 124,108 | |
Versartis, Inc. (a) | | | 11,235 | | | | 170,997 | |
Vitae Pharmaceuticals, Inc. (a) | | | 6,631 | | | | 95,486 | |
Vital Therapies, Inc. (a)(b) | | | 8,337 | | | | 175,911 | |
West Pharmaceutical Services, Inc. | | | 36,447 | | | | 2,116,842 | |
Wright Medical Group, Inc. (a) | | | 26,057 | | | | 684,257 | |
XBiotech, Inc. (a) | | | 2,031 | | | | 36,720 | |
Xencor Inc. (a) | | | 14,310 | | | | 314,391 | |
XOMA Corp. (a) | | | 46,399 | | | | 180,028 | |
ZIOPHARM Oncology, Inc. (a)(b) | | | 57,860 | | | | 694,320 | |
| | | | | | | | |
| | | | | | | | 56,255,625 | |
See Notes to Financial Statements.
| | | | | | |
| | | | | | | |
| | BLACKROCK INDEX FUNDS, INC. | | JUNE 30, 2015 | | 37 |
| | |
Schedule of Investments (continued) | | Master Small Cap Index Series (Percentages shown are based on Net Assets) |
| | | | | | | | |
| Common Stocks | | Shares | | | Value | |
Building Materials — 0.7% | |
Builders FirstSource, Inc. (a) | | | 23,473 | | | $ | 301,393 | |
Continental Building Products, Inc. (a) | | | 16,053 | | | | 340,163 | |
Gibraltar Industries, Inc. (a) | | | 15,603 | | | | 317,833 | |
Griffon Corp. | | | 17,457 | | | | 277,916 | |
Headwaters, Inc. (a) | | | 37,365 | | | | 680,790 | |
Louisiana-Pacific Corp. (a) | | | 72,289 | | | | 1,231,082 | |
LSI Industries, Inc. | | | 11,362 | | | | 106,121 | |
Masonite International Corp. (a) | | | 15,234 | | | | 1,068,056 | |
NCI Building Systems, Inc. (a) | | | 13,799 | | | | 207,951 | |
Patrick Industries, Inc. (a) | | | 6,582 | | | | 250,445 | |
PGT, Inc. (a) | | | 24,431 | | | | 354,494 | |
Quanex Building Products Corp. | | | 17,246 | | | | 369,582 | |
Simpson Manufacturing Co., Inc. | | | 21,165 | | | | 719,610 | |
Stock Building Supply Holdings, Inc. (a) | | | 7,378 | | | | 144,240 | |
Summit Materials, Inc., Class A (a) | | | 12,918 | | | | 329,409 | |
Trex Co., Inc. (a) | | | 16,301 | | | | 805,758 | |
| | | | | | | | |
| | | | | | | | 7,504,843 | |
Building: Climate Control — 0.1% | |
AAON, Inc. | | | 20,582 | | | | 463,507 | |
Comfort Systems USA, Inc. | | | 18,935 | | | | 434,558 | |
Nortek, Inc. (a) | | | 4,818 | | | | 400,520 | |
| | | | | | | | |
| | | | | | | | 1,298,585 | |
Building: Roofing, Wallboard & Plumbing — 0.1% | |
Beacon Roofing Supply, Inc. (a) | | | 25,113 | | | | 834,254 | |
Casinos & Gambling — 0.3% | |
Boyd Gaming Corp. (a) | | | 41,582 | | | | 621,651 | |
Caesars Acquisition Co., Class A (a) | | | 24,430 | | | | 168,078 | |
Caesars Entertainment Corp. (a)(b) | | | 28,153 | | | | 172,296 | |
Eldorado Resorts, Inc. (a) | | | 14,774 | | | | 115,533 | |
Empire Resorts, Inc. (a)(b) | | | 7,240 | | | | 36,852 | |
Isle of Capri Casinos, Inc. (a) | | | 11,825 | | | | 214,624 | |
Monarch Casino & Resort, Inc. (a) | | | 5,650 | | | | 116,164 | |
Penn National Gaming, Inc. (a) | | | 41,155 | | | | 755,194 | |
Pinnacle Entertainment, Inc. (a) | | | 23,194 | | | | 864,672 | |
Scientific Games Corp., Class A (a)(b) | | | 25,420 | | | | 395,027 | |
| | | | | | | | |
| | | | | | | | 3,460,091 | |
Cement — 0.0% | |
US Concrete, Inc. (a) | | | 7,512 | | | | 284,630 | |
Chemicals: Diversified — 1.0% | |
Aceto Corp. | | | 14,758 | | | | 363,490 | |
American Vanguard Corp. | | | 14,810 | | | | 204,378 | |
Axiall Corp. | | | 35,489 | | | | 1,279,378 | |
Chemtura Corp. (a) | | | 34,058 | | | | 964,182 | |
Hawkins, Inc. | | | 5,287 | | | | 213,542 | |
Innophos Holdings, Inc. | | | 10,456 | | | | 550,404 | |
KMG Chemicals, Inc. | | | 5,021 | | | | 127,734 | |
Landec Corp. (a) | | | 13,567 | | | | 195,772 | |
LSB Industries, Inc. (a) | | | 9,964 | | | | 406,930 | |
Olin Corp. | | | 39,211 | | | | 1,056,736 | |
OM Group, Inc. | | | 15,230 | | | | 511,728 | |
OMNOVA Solutions, Inc. (a) | | | 23,430 | | | | 175,491 | |
PolyOne Corp. | | | 44,983 | | | | 1,761,984 | |
Rayonier Advanced Materials, Inc. | | | 20,489 | | | | 333,151 | |
Sensient Technologies Corp. | | | 23,548 | | | | 1,609,270 | |
Tronox Ltd., Class A | | | 32,012 | | | | 468,336 | |
| | | | | | | | |
| | | | | | | | 10,222,506 | |
Chemicals: Specialty — 0.5% | | | | | | | | |
Balchem Corp. | | | 15,670 | | | | 873,133 | |
Calgon Carbon Corp. | | | 26,476 | | | | 513,105 | |
FutureFuel Corp. | | | 11,997 | | | | 154,401 | |
Innospec, Inc. | | | 12,156 | | | | 547,506 | |
Kraton Performance Polymers, Inc. (a) | | | 15,897 | | | | 379,620 | |
Polypore International, Inc. (a) | | | 22,712 | | | | 1,359,995 | |
| Common Stocks | | Shares | | | Value | |
Chemicals: Specialty (concluded) | | | | | | | | |
Quaker Chemical Corp. | | | 6,710 | | | | 596,116 | |
Stepan Co. | | | 9,746 | | | | 527,356 | |
Valhi, Inc. | | | 8,132 | | | | 46,027 | |
| | | | | | | | |
| | | | | | | | 4,997,259 | |
Coal — 0.1% | | | | | | | | |
Cloud Peak Energy, Inc. (a) | | | 31,288 | | | | 145,802 | |
Hallador Energy Co. | | | 4,864 | | | | 40,566 | |
Peabody Energy Corp. | | | 139,672 | | | | 305,882 | |
Westmoreland Coal Co. (a) | | | 8,907 | | | | 185,087 | |
| | | | | | | | |
| | | | | | | | 677,337 | |
Commercial Banks — 0.1% | | | | | | | | |
Blue Hills Bancorp, Inc. (a) | | | 14,285 | | | | 199,990 | |
C1 Financial, Inc. (a)(b) | | | 2,832 | | | | 54,884 | |
Green Bancorp, Inc. (a) | | | 4,969 | | | | 76,324 | |
HomeTrust Bancshares, Inc. (a) | | | 10,600 | | | | 177,656 | |
Sun Bancorp, Inc. (a) | | | 4,107 | | | | 79,060 | |
| | | | | | | | |
| | | | | | | | 587,914 | |
Commercial Finance & Mortgage Companies — 0.2% | |
Capital Bank Financial Corp., Class A (a) | | | 11,463 | | | | 333,229 | |
Federal Agricultural Mortgage Corp., Class C | | | 5,486 | | | | 159,423 | |
Impac Mortgage Holdings, Inc. (a) | | | 4,418 | | | | 84,561 | |
Meta Financial Group, Inc. | | | 3,366 | | | | 144,469 | |
Nationstar Mortgage Holdings, Inc. (a) | | | 19,934 | | | | 334,891 | |
NewStar Financial, Inc. (a) | | | 12,319 | | | | 135,509 | |
On Deck Capital, Inc. (a)(b) | | | 5,542 | | | | 64,176 | |
PennyMac Financial Services, Inc. (a)(c) | | | 5,912 | | | | 107,125 | |
RE/MAX Holdings, Inc., Class A | | | 5,997 | | | | 212,954 | |
Stonegate Mortgage Corp. (a) | | | 7,665 | | | | 77,187 | |
Walker & Dunlop, Inc. (a) | | | 13,372 | | | | 357,567 | |
| | | | | | | | |
| | | | | | | | 2,011,091 | |
Commercial Services & Supplies — 0.1% | | | | | | | | |
ARC Document Solutions, Inc. (a) | | | 21,370 | | | | 162,626 | |
Civeo Corp. | | | 53,588 | | | | 164,515 | |
Collectors Universe, Inc. | | | 3,723 | | | | 74,237 | |
Hill International, Inc. (a) | | | 19,052 | | | | 100,213 | |
LifeLock, Inc. (a) | | | 47,489 | | | | 778,819 | |
National Research Corp. | | | 5,122 | | | | 72,784 | |
National Research Corp., Class B | | | 262 | | | | 8,853 | |
Weight Watchers International, Inc. (a)(b) | | | 13,867 | | | | 67,255 | |
| | | | | | | | |
| | | | | | | | 1,429,302 | |
Commercial Services: Rental & Leasing — 0.4% | | | | | | | | |
Aircastle Ltd. | | | 31,570 | | | | 715,692 | |
CAI International, Inc. (a) | | | 8,986 | | | | 185,022 | |
Electro Rent Corp. | | | 8,402 | | | | 91,246 | |
H&E Equipment Services, Inc. | | | 15,764 | | | | 314,807 | |
Marlin Business Services Corp. | | | 4,328 | | | | 73,057 | |
McGrath RentCorp | | | 13,078 | | | | 397,963 | |
Mobile Mini, Inc. | | | 23,083 | | | | 970,409 | |
Neff Corp., Class A (a) | | | 6,007 | | | | 60,611 | |
PHH Corp. (a) | | | 25,201 | | | | 655,982 | |
TAL International Group, Inc. (a) | | | 16,849 | | | | 532,428 | |
| | | | | | | | |
| | | | | | | | 3,997,217 | |
Commercial Vehicles & Parts — 0.3% | | | | | | | | |
Accuride Corp. (a) | | | 19,665 | | | | 75,710 | |
Blue Bird Corp. (a) | | | 2,361 | | | | 30,669 | |
Commercial Vehicle Group, Inc. (a) | | | 15,733 | | | | 113,435 | |
Cooper-Standard Holding, Inc. (a) | | | 6,810 | | | | 418,611 | |
Miller Industries, Inc. | | | 5,742 | | | | 114,553 | |
Modine Manufacturing Co. (a) | | | 24,107 | | | | 258,668 | |
Motorcar Parts of America, Inc. (a) | | | 9,037 | | | | 271,923 | |
Navistar International Corp. (a) | | | 25,720 | | | | 582,044 | |
Rush Enterprises, Inc., Class A (a) | | | 17,817 | | | | 466,984 | |
See Notes to Financial Statements.
| | | | | | |
| | | | | | | |
| 38 | | BLACKROCK INDEX FUNDS, INC. | | JUNE 30, 2015 | | |
| | |
Schedule of Investments (continued) | | Master Small Cap Index Series (Percentages shown are based on Net Assets) |
| | | | | | | | |
| Common Stocks | | Shares | | | Value | |
Commercial Vehicles & Parts (concluded) | | | | | | | | |
Strattec Security Corp. | | | 1,873 | | | $ | 128,675 | |
Wabash National Corp. (a) | | | 34,478 | | | | 432,354 | |
| | | | | | | | |
| | | | | | | | 2,893,626 | |
Communications Equipment — 0.1% | | | | | | | | |
Aerohive Networks, Inc. (a) | | | 11,398 | | | | 79,558 | |
Polycom, Inc. (a) | | | 68,156 | | | | 779,705 | |
Ruckus Wireless, Inc. (a) | | | 37,918 | | | | 392,072 | |
| | | | | | | | |
| | | | | | | | 1,251,335 | |
Communications Technology — 1.5% | | | | | | | | |
ADTRAN, Inc. | | | 26,932 | | | | 437,645 | |
Alliance Fiber Optic Products, Inc. | | | 7,453 | | | | 138,253 | |
Anixter International, Inc. (a) | | | 14,391 | | | | 937,574 | |
Bel Fuse, Inc., Class B | | | 5,357 | | | | 109,926 | |
Black Box Corp. | | | 7,559 | | | | 151,180 | |
Calix, Inc. (a) | | | 22,402 | | | | 170,479 | |
Ciena Corp. (a) | | | 59,372 | | | | 1,405,929 | |
Comtech Telecommunications Corp. | | | 8,225 | | | | 238,936 | |
Cyan, Inc. (a) | | | 14,835 | | | | 77,735 | |
Datalink Corp. (a) | | | 10,854 | | | | 97,035 | |
Digi International, Inc. (a) | | | 12,505 | | | | 119,423 | |
DigitalGlobe, Inc. (a) | | | 36,631 | | | | 1,017,976 | |
Extreme Networks, Inc. (a) | | | 49,069 | | | | 131,996 | |
Finisar Corp. (a) | | | 52,485 | | | | 937,907 | |
General Cable Corp. | | | 24,701 | | | | 487,351 | |
Harmonic, Inc. (a) | | | 44,739 | | | | 305,567 | |
Infinera Corp. (a) | | | 65,477 | | | | 1,373,707 | |
Intelsat SA (a)(b) | | | 14,297 | | | | 141,826 | |
InterDigital, Inc. | | | 18,188 | | | | 1,034,715 | |
Ixia (a) | | | 30,457 | | | | 378,885 | |
KVH Industries, Inc. (a) | | | 8,279 | | | | 111,353 | |
Loral Space & Communications, Inc. (a) | | | 6,516 | | | | 411,290 | |
NeoPhotonics Corp. (a) | | | 14,220 | | | | 129,829 | |
NETGEAR, Inc. (a) | | | 17,395 | | | | 522,198 | |
Novatel Wireless, Inc. (a) | | | 18,913 | | | | 61,467 | |
Pacific DataVision, Inc. (a) | | | 6,488 | | | | 273,339 | |
Plantronics, Inc. | | | 19,743 | | | | 1,111,728 | |
QLogic Corp. (a) | | | 44,114 | | | | 625,978 | |
RingCentral, Inc., Class A (a) | | | 26,923 | | | | 497,806 | |
Seachange International, Inc. (a) | | | 16,626 | | | | 116,548 | |
ShoreTel, Inc. (a) | | | 32,477 | | | | 220,194 | |
Sonus Networks, Inc. (a) | | | 25,009 | | | | 173,062 | |
TeleNav, Inc. (a) | | | 14,084 | | | | 113,376 | |
ViaSat, Inc. (a) | | | 21,529 | | | | 1,297,338 | |
| | | | | | | | |
| | | | | | | | 15,359,551 | |
Computer Services Software & Systems — 5.8% | | | | | | | | |
A10 Networks, Inc. (a) | | | 16,730 | | | | 107,741 | |
ACI Worldwide, Inc. (a) | | | 58,865 | | | | 1,446,313 | |
Acxiom Corp. (a) | | | 39,553 | | | | 695,342 | |
American Software, Inc., Class A | | | 12,436 | | | | 118,142 | |
Apigee Corp. (a) | | | 2,319 | | | | 23,028 | |
Aspen Technology, Inc. (a) | | | 43,083 | | | | 1,962,431 | |
AVG Technologies NV (a) | | | 20,674 | | | | 562,540 | |
Avid Technology, Inc. (a) | | | 16,190 | | | | 215,975 | |
Bankrate, Inc. (a) | | | 33,792 | | | | 354,478 | |
Barracuda Networks, Inc. (a) | | | 4,044 | | | | 160,223 | |
Bazaarvoice, Inc. (a) | | | 30,563 | | | | 180,016 | |
Benefitfocus, Inc. (a) | | | 3,981 | | | | 174,567 | |
Blackbaud, Inc. | | | 23,656 | | | | 1,347,209 | |
Blucora, Inc. (a) | | | 20,720 | | | | 334,628 | |
Bottomline Technologies, Inc. (a) | | | 20,544 | | | | 571,329 | |
Box, Inc., Class A (a)(b) | | | 6,425 | | | | 119,762 | |
Brightcove, Inc. (a) | | | 16,147 | | | | 110,768 | |
BroadSoft, Inc. (a) | | | 14,704 | | | | 508,317 | |
CACI International, Inc., Class A (a) | | | 12,340 | | | | 998,183 | |
| Common Stocks | | Shares | | | Value | |
Computer Services Software & Systems (continued) | | | | | | | | |
Callidus Software, Inc. (a) | | | 27,861 | | | | 434,074 | |
CIBER, Inc. (a) | | | 41,383 | | | | 142,771 | |
Code Rebel Corp. (a) | | | 557 | | | | 18,030 | |
CommVault Systems, Inc. (a) | | | 22,778 | | | | 966,015 | |
ComScore, Inc. (a) | | | 17,368 | | | | 925,020 | |
Connecture, Inc. (a) | | | 3,751 | | | | 39,611 | |
Cornerstone OnDemand, Inc. (a) | | | 27,184 | | | | 946,003 | |
CSG Systems International, Inc. | | | 16,704 | | | | 528,849 | |
Cvent, Inc. (a) | | | 11,791 | | | | 303,972 | |
DealerTrack Holdings, Inc. (a) | | | 27,634 | | | | 1,735,139 | |
Demandware, Inc. (a) | | | 16,828 | | | | 1,196,134 | |
Digimarc Corp. (a) | | | 3,864 | | | | 174,421 | |
Digital Turbine, Inc. (a) | | | 23,391 | | | | 70,641 | |
Dot Hill Systems Corp. (a) | | | 30,616 | | | | 187,370 | |
EarthLink Holdings Corp. | | | 51,720 | | | | 387,383 | |
Ebix, Inc. (b) | | | 13,604 | | | | 443,626 | |
Endurance International Group Holdings, Inc. (a) | | | 29,587 | | | | 611,267 | |
Envestnet, Inc. (a) | | | 17,920 | | | | 724,506 | |
EPAM Systems, Inc. (a) | | | 24,663 | | | | 1,756,745 | |
EPIQ Systems, Inc. | | | 16,366 | | | | 276,258 | |
ePlus, Inc. (a) | | | 2,799 | | | | 214,543 | |
Guidance Software, Inc. (a) | | | 9,996 | | | | 84,666 | |
Guidewire Software, Inc. (a) | | | 35,386 | | | | 1,872,981 | |
Hortonworks, Inc. (a)(b) | | | 3,736 | | | | 94,596 | |
HubSpot, Inc. (a) | | | 9,469 | | | | 469,473 | |
iGATE Corp. (a) | | | 18,342 | | | | 874,730 | |
Imperva, Inc. (a) | | | 13,422 | | | | 908,669 | |
Infoblox, Inc. (a) | | | 28,773 | | | | 754,140 | |
Interactive Intelligence Group, Inc. (a) | | | 8,698 | | | | 386,800 | |
Internap Network Services Corp. (a) | | | 28,530 | | | | 263,902 | |
IntraLinks Holdings, Inc. (a) | | | 20,332 | | | | 242,154 | |
Jive Software, Inc. (a) | | | 23,159 | | | | 121,585 | |
The KEYW Holding Corp. (a)(b) | | | 16,813 | | | | 156,697 | |
Limelight Networks, Inc. (a) | | | 31,045 | | | | 122,317 | |
Lionbridge Technologies, Inc. (a) | | | 34,016 | | | | 209,879 | |
LivePerson, Inc. (a) | | | 28,117 | | | | 275,828 | |
LogMeIn, Inc. (a) | | | 12,424 | | | | 801,224 | |
Luxoft Holding, Inc. (a) | | | 9,259 | | | | 523,596 | |
Manhattan Associates, Inc. (a) | | | 37,220 | | | | 2,220,173 | |
Mantech International Corp., Class A | | | 12,314 | | | | 357,106 | |
MaxPoint Interactive, Inc. (a) | | | 3,335 | | | | 26,947 | |
Mentor Graphics Corp. | | | 50,473 | | | | 1,334,001 | |
Mercury Systems, Inc. (a) | | | 17,518 | | | | 256,464 | |
MicroStrategy, Inc., Class A (a) | | | 4,680 | | | | 795,974 | |
Millennial Media, Inc. (a) | | | 58,768 | | | | 95,204 | |
ModusLink Global Solutions, Inc. (a) | | | 17,640 | | | | 59,976 | |
Monotype Imaging Holdings, Inc. | | | 20,115 | | | | 484,973 | |
Netscout Systems, Inc. (a) | | | 18,847 | | | | 691,119 | |
New Relic, Inc. (a) | | | 2,916 | | | | 102,614 | |
NIC, Inc. | | | 33,064 | | | | 604,410 | |
Nimble Storage, Inc. (a) | | | 25,515 | | | | 715,951 | |
PDF Solutions, Inc. (a) | | | 13,736 | | | | 219,776 | |
Pegasystems, Inc. | | | 18,005 | | | | 412,134 | |
Perficient, Inc. (a) | | | 17,834 | | | | 343,126 | |
Progress Software Corp. (a) | | | 25,539 | | | | 702,322 | |
Proofpoint, Inc. (a) | | | 19,932 | | | | 1,269,070 | |
PROS Holdings, Inc. (a) | | | 12,074 | | | | 254,882 | |
Q2 Holdings, Inc. (a) | | | 9,812 | | | | 277,189 | |
QAD, Inc., Class A | | | 5,040 | | | | 133,207 | |
QLIK Technologies, Inc. (a) | | | 46,069 | | | | 1,610,572 | |
RealNetworks, Inc. (a) | | | 10,991 | | | | 59,461 | |
RealPage, Inc. (a) | | | 26,615 | | | | 507,548 | |
Reis, Inc. | | | 4,602 | | | | 102,072 | |
Rocket Fuel, Inc. (a)(b) | | | 13,084 | | | | 107,289 | |
Rovi Corp. (a) | | | 44,584 | | | | 711,115 | |
Sapiens International Corp. NV | | | 11,800 | | | | 122,484 | |
See Notes to Financial Statements.
| | | | | | |
| | | | | | | |
| | BLACKROCK INDEX FUNDS, INC. | | JUNE 30, 2015 | | 39 |
| | |
Schedule of Investments (continued) | | Master Small Cap Index Series (Percentages shown are based on Net Assets) |
| | | | | | | | |
| Common Stocks | | Shares | | | Value | |
Computer Services Software & Systems (concluded) | |
Science Applications International Corp. | | | 23,316 | | | $ | 1,232,251 | |
SciQuest, Inc. (a) | | | 13,637 | | | | 201,964 | |
Shutterstock, Inc. (a) | | | 9,882 | | | | 579,480 | |
SPS Commerce, Inc. (a) | | | 8,377 | | | | 551,207 | |
Synchronoss Technologies, Inc. (a) | | | 19,548 | | | | 893,930 | |
SYNNEX Corp. | | | 14,516 | | | | 1,062,426 | |
Syntel, Inc. (a) | | | 15,974 | | | | 758,446 | |
Tangoe, Inc. (a)(b) | | | 20,114 | | | | 253,034 | |
TechTarget, Inc. (a) | | | 10,003 | | | | 89,327 | |
TeleCommunication Systems, Inc., Class A (a) | | | 24,534 | | | | 81,208 | |
Textura Corp. (a) | | | 10,016 | | | | 278,745 | |
Travelzoo, Inc. (a) | | | 3,425 | | | | 38,634 | |
Tyler Technologies, Inc. (a) | | | 16,978 | | | | 2,196,614 | |
Unisys Corp. (a) | | | 25,491 | | | | 509,565 | |
United Online, Inc. (a) | | | 7,350 | | | | 115,175 | |
Varonis Systems, Inc. (a) | | | 4,511 | | | | 99,648 | |
VASCO Data Security International, Inc. (a)(b) | | | 14,862 | | | | 448,684 | |
Verint Systems, Inc. (a) | | | 30,923 | | | | 1,878,418 | |
VirnetX Holding Corp. (a)(b) | | | 22,763 | | | | 95,605 | |
Virtusa Corp. (a) | | | 14,963 | | | | 769,098 | |
Web.com Group, Inc. (a) | | | 22,166 | | | | 536,861 | |
Wix.com Ltd. (a) | | | 9,409 | | | | 222,241 | |
Workiva, Inc. (a) | | | 3,340 | | | | 46,192 | |
Yodlee, Inc. (a) | | | 9,036 | | | | 130,480 | |
Zix Corp. (a) | | | 29,308 | | | | 151,522 | |
| | | | | | | | |
| | | | | | | | 58,034,521 | |
Computer Technology — 0.6% | | | | | | | | |
Cray, Inc. (a) | | | 20,692 | | | | 610,621 | |
Diebold, Inc. | | | 32,557 | | | | 1,139,495 | |
Imation Corp. (a) | | | 16,041 | | | | 65,126 | |
Immersion Corp. (a) | | | 13,943 | | | | 176,658 | |
Insight Enterprises, Inc. (a) | | | 19,494 | | | | 583,066 | |
PC Connection, Inc. | | | 5,352 | | | | 132,409 | |
Quantum Corp. (a) | | | 109,250 | | | | 183,540 | |
Safeguard Scientifics, Inc. (a) | | | 10,205 | | | | 198,589 | |
Silicon Graphics International Corp. (a) | | | 17,845 | | | | 115,457 | |
Stratasys Ltd. (a) | | | 25,640 | | | | 895,605 | |
Super Micro Computer, Inc. (a) | | | 18,619 | | | | 550,750 | |
Synaptics, Inc. (a) | | | 18,602 | | | | 1,613,445 | |
Violin Memory, Inc. (a) | | | 46,361 | | | | 113,584 | |
| | | | | | | | |
| | | | | | | | 6,378,345 | |
Construction — 0.4% | | | | | | | | |
Aegion Corp. (a) | | | 18,562 | | | | 351,564 | |
EMCOR Group, Inc. | | | 31,713 | | | | 1,514,930 | |
Granite Construction, Inc. | | | 19,915 | | | | 707,182 | |
Great Lakes Dredge & Dock Corp. (a) | | | 29,990 | | | | 178,740 | |
Orion Marine Group, Inc. (a) | | | 15,084 | | | | 108,907 | |
Primoris Services Corp. | | | 19,604 | | | | 388,159 | |
Tutor Perini Corp. (a) | | | 19,113 | | | | 412,459 | |
| | | | | | | | |
| | | | | | | | 3,661,941 | |
Consumer Electronics — 0.2% | | | | | | | | |
RealD, Inc. (a) | | | 20,774 | | | | 256,143 | |
Skullcandy, Inc. (a) | | | 10,985 | | | | 84,255 | |
TiVo, Inc. (a) | | | 49,154 | | | | 498,422 | |
Universal Electronics, Inc. (a) | | | 7,992 | | | | 398,321 | |
VOXX International Corp. (a) | | | 10,507 | | | | 86,998 | |
XO Group, Inc. (a) | | | 13,302 | | | | 217,488 | |
Zagg, Inc. (a) | | | 14,864 | | | | 117,723 | |
| | | | | | | | |
| | | | | | | | 1,659,350 | |
Consumer Lending — 0.7% | | | | | | | | |
Cash America International, Inc. | | | 13,875 | | | | 363,386 | |
Encore Capital Group, Inc. (a) | | | 13,190 | | | | 563,741 | |
Enova International, Inc. (a) | | | 13,331 | | | | 249,023 | |
Ezcorp, Inc., Class A (a) | | | 26,096 | | | | 193,893 | |
| Common Stocks | | Shares | | | Value | |
Consumer Lending (concluded) | | | | | | | | |
First Cash Financial Services, Inc. (a) | | | 14,169 | | | | 645,965 | |
LendingTree, Inc. (a) | | | 2,954 | | | | 232,214 | |
Marcus & Millichap, Inc. (a) | | | 6,903 | | | | 318,504 | |
MGIC Investment Corp. (a) | | | 171,882 | | | | 1,956,017 | |
MoneyGram International, Inc. (a) | | | 14,814 | | | | 136,141 | |
Nelnet, Inc., Class A | | | 12,032 | | | | 521,106 | |
PRA Group, Inc. (a) | | | 24,390 | | | | 1,519,741 | |
Regional Management Corp. (a) | | | 5,744 | | | | 102,588 | |
World Acceptance Corp. (a) | | | 3,849 | | | | 236,752 | |
| | | | | | | | |
| | | | | | | | 7,039,071 | |
Consumer Services: Miscellaneous — 0.3% | | | | | | | | |
Chuy’s Holdings, Inc. (a) | | | 8,309 | | | | 222,598 | |
Core-Mark Holding Co., Inc. | | | 11,669 | | | | 691,388 | |
Del Frisco’s Restaurant Group, Inc. (a) | | | 11,759 | | | | 219,070 | |
Nutrisystem, Inc. | | | 14,578 | | | | 362,701 | |
Sotheby’s | | | 31,361 | | | | 1,418,772 | |
Steiner Leisure Ltd. (a) | | | 6,437 | | | | 346,182 | |
| | | | | | | | |
| | | | | | | | 3,260,711 | |
Containers & Packaging — 0.3% | | | | | | | | |
AEP Industries, Inc. (a) | | | 1,966 | | | | 108,523 | |
Berry Plastics Group, Inc. (a) | | | 60,349 | | | | 1,955,308 | |
Greif, Inc., Class A | | | 15,418 | | | | 552,735 | |
Myers Industries, Inc. | | | 12,321 | | | | 234,099 | |
Veritiv Corp. (a) | | | 4,128 | | | | 150,507 | |
| | | | | | | | |
| | | | | | | | 3,001,172 | |
Cosmetics — 0.1% | | | | | | | | |
Elizabeth Arden, Inc. (a)(b) | | | 13,405 | | | | 191,155 | |
Inter Parfums, Inc. | | | 8,570 | | | | 290,780 | |
Revlon, Inc., Class A (a) | | | 5,805 | | | | 213,102 | |
| | | | | | | | |
| | | | | | | | 695,037 | |
Diversified Financial Services — 0.9% | | | | | | | | |
Altisource Asset Management Corp. (a) | | | 463 | | | | 66,806 | |
Altisource Portfolio Solutions SA (a)(b) | | | 7,297 | | | | 224,675 | |
Blackhawk Network Holdings, Inc. (a) | | | 27,452 | | | | 1,131,022 | |
Evercore Partners, Inc., Class A | | | 17,424 | | | | 940,199 | |
FCB Financial Holdings, Inc., Class A (a) | | | 14,018 | | | | 445,772 | |
FNFV Group (a) | | | 40,112 | | | | 616,923 | |
Greenhill & Co., Inc. | | | 14,865 | | | | 614,371 | |
Hannon Armstrong Sustainable Infrastructure Capital, Inc. | | | 16,344 | | | | 327,697 | |
HRG Group, Inc. (a) | | | 39,850 | | | | 518,050 | |
JG Wentworth Co (a) | | | 7,836 | | | | 72,091 | |
Liberty Tax, Inc. | | | 2,775 | | | | 68,681 | |
MBIA, Inc. (a) | | | 79,406 | | | | 477,230 | |
MidWestOne Financial Group, Inc. | | | 3,684 | | | | 121,277 | |
Moelis & Co., Class A | | | 8,606 | | | | 247,078 | |
Outerwall, Inc. | | | 9,353 | | | | 711,857 | |
Piper Jaffray Cos. (a) | | | 8,191 | | | | 357,455 | |
Real Industry, Inc. (a) | | | 12,307 | | | | 139,685 | |
Stifel Financial Corp. (a) | | | 34,324 | | | | 1,981,868 | |
Tiptree Financial, Inc. A REIT | | | 13,406 | | | | 97,194 | |
| | | | | | | | |
| | | | | | | | 9,159,931 | |
Diversified Manufacturing Operations — 0.5% | | | | | | | | |
Barnes Group, Inc. | | | 27,652 | | | | 1,078,151 | |
Federal Signal Corp. | | | 31,671 | | | | 472,215 | |
Harsco Corp. | | | 40,366 | | | | 666,039 | |
Lydall, Inc. (a) | | | 8,589 | | | | 253,891 | |
OSI Systems, Inc. (a) | | | 10,026 | | | | 709,741 | |
Raven Industries, Inc. | | | 18,800 | | | | 382,204 | |
Standex International Corp. | | | 6,424 | | | | 513,470 | |
TriMas Corp. (a) | | | 22,895 | | | | 677,692 | |
| | | | | | | | |
| | | | | | | | 4,753,403 | |
See Notes to Financial Statements.
| | | | | | |
| | | | | | | |
| 40 | | BLACKROCK INDEX FUNDS, INC. | | JUNE 30, 2015 | | |
| | |
Schedule of Investments (continued) | | Master Small Cap Index Series (Percentages shown are based on Net Assets) |
| | | | | | | | |
| Common Stocks | | Shares | | | Value | |
Diversified Materials & Processing — 0.5% | | | | | | | | |
Belden, Inc. | | | 21,518 | | | $ | 1,747,907 | |
Cabot Microelectronics Corp. (a) | | | 12,370 | | | | 582,751 | |
CLARCOR, Inc. | | | 25,233 | | | | 1,570,502 | |
Encore Wire Corp. | | | 10,460 | | | | 463,273 | |
Insteel Industries, Inc. | | | 9,672 | | | | 180,866 | |
Koppers Holdings, Inc. | | | 10,372 | | | | 256,396 | |
NL Industries, Inc. (a) | | | 3,493 | | | | 25,883 | |
Tredegar Corp. | | | 12,691 | | | | 280,598 | |
Uranium Energy Corp. (a) | | | 46,438 | | | | 73,837 | |
| | | | | | | | |
| | | | | | | | 5,182,013 | |
Diversified Media — 0.1% | | | | | | | | |
EW Scripps Co. | | | 29,810 | | | | 681,158 | |
Hemisphere Media Group, Inc. (a) | | | 5,395 | | | | 64,201 | |
| | | | | | | | |
| | | | | | | | 745,359 | |
Diversified Retail — 0.5% | | | | | | | | |
Big Lots, Inc. | | | 27,185 | | | | 1,223,053 | |
Etsy, Inc. (a) | | | 10,094 | | | | 141,821 | |
EVINE Live, Inc. (a) | | | 25,199 | | | | 67,785 | |
Fred’s, Inc., Class A | | | 18,600 | | | | 358,794 | |
HSN, Inc. | | | 16,356 | | | | 1,148,028 | |
Overstock.com, Inc. (a) | | | 6,269 | | | | 141,303 | |
Pricesmart, Inc. | | | 9,726 | | | | 887,400 | |
Tuesday Morning Corp. (a) | | | 22,215 | | | | 250,252 | |
Winmark Corp. | | | 1,114 | | | | 109,729 | |
zulily, Inc., Class A (a) | | | 32,994 | | | | 430,242 | |
| | | | | | | | |
| | | | | | | | 4,758,407 | |
Drug & Grocery Store Chains — 0.5% | | | | | | | | |
Casey’s General Stores, Inc. | | | 19,582 | | | | 1,874,781 | |
Diplomat Pharmacy, Inc. (a) | | | 18,215 | | | | 815,121 | |
Ingles Markets, Inc., Class A | | | 6,767 | | | | 323,260 | |
PetMed Express, Inc. | | | 10,074 | | | | 173,978 | |
Smart & Final Stores, Inc. (a) | | | 12,205 | | | | 218,103 | |
Supervalu, Inc. (a) | | | 132,245 | | | | 1,069,862 | |
Village Super Market, Inc., Class A | | | 3,476 | | | | 110,155 | |
Weis Markets, Inc. | | | 5,468 | | | | 230,476 | |
| | | | | | | | |
| | | | | | | | 4,815,736 | |
Education Services — 0.8% | | | | | | | | |
2U, Inc. (a) | | | 12,016 | | | | 386,795 | |
American Public Education, Inc. (a) | | | 8,682 | | | | 223,301 | |
Apollo Education Group, Inc. (a) | | | 47,534 | | | | 612,238 | |
Bridgepoint Education, Inc. (a) | | | 8,632 | | | | 82,522 | |
Bright Horizons Family Solutions, Inc. (a) | | | 18,815 | | | | 1,087,507 | |
Cambium Learning Group, Inc. (a) | | | 6,336 | | | | 27,055 | |
Capella Education Co. | | | 6,133 | | | | 329,158 | |
Career Education Corp. (a) | | | 34,818 | | | | 114,900 | |
Chegg, Inc. (a) | | | 38,045 | | | | 298,273 | |
DeVry Education Group, Inc. | | | 32,088 | | | | 961,998 | |
Franklin Covey Co. (a) | | | 6,053 | | | | 122,815 | |
Grand Canyon Education, Inc. (a) | | | 23,748 | | | | 1,006,915 | |
HealthStream, Inc. (a) | | | 12,615 | | | | 383,748 | |
Houghton Mifflin Harcourt Co. (a) | | | 68,891 | | | | 1,736,053 | |
K12, Inc. (a) | | | 17,134 | | | | 216,745 | |
Strayer Education, Inc. (a) | | | 5,578 | | | | 240,412 | |
Universal Technical Institute, Inc. | | | 10,246 | | | | 88,116 | |
| | | | | | | | |
| | | | | | | | 7,918,551 | |
Electronic Components — 0.7% | | | | | | | | |
Acacia Research Corp. | | | 26,254 | | | | 230,248 | |
AVX Corp. | | | 22,264 | | | | 299,673 | |
Checkpoint Systems, Inc. | | | 21,722 | | | | 221,130 | |
InvenSense, Inc. (a) | | | 39,099 | | | | 590,395 | |
Methode Electronics, Inc. | | | 19,421 | | | | 533,106 | |
Multi-Fineline Electronix, Inc. (a) | | | 4,835 | | | | 105,693 | |
NVE Corp. | | | 2,332 | | | | 182,829 | |
| Common Stocks | | Shares | | | Value | |
Electronic Components (concluded) | | | | | | | | |
Park Electrochemical Corp. | | | 10,211 | | | | 195,643 | |
Rogers Corp. (a) | | | 9,381 | | | | 620,459 | |
Sanmina Corp. (a) | | | 41,844 | | | | 843,575 | |
ScanSource, Inc. (a) | | | 14,379 | | | | 547,265 | |
Sparton Corp. (a) | | | 4,998 | | | | 136,545 | |
Tech Data Corp. (a) | | | 18,375 | | | | 1,057,665 | |
TTM Technologies, Inc. (a) | | | 29,837 | | | | 298,072 | |
Universal Display Corp. (a) | | | 20,293 | | | | 1,049,757 | |
| | | | | | | | |
| | | | | | | | 6,912,055 | |
Electronic Entertainment — 0.2% | | | | | | | | |
DTS, Inc. (a) | | | 9,024 | | | | 275,142 | |
Glu Mobile, Inc. (a) | | | 60,738 | | | | 377,183 | |
Take-Two Interactive Software, Inc. (a) | | | 42,703 | | | | 1,177,321 | |
| | | | | | | | |
| | | | | | | | 1,829,646 | |
Electronics — 0.3% | | | | | | | | |
Agilysys, Inc. (a) | | | 7,618 | | | | 69,933 | |
American Science & Engineering, Inc. | | | 3,641 | | | | 159,512 | |
Coherent, Inc. (a) | | | 12,003 | | | | 761,951 | |
Control4 Corp. (a) | | | 10,369 | | | | 92,180 | |
Daktronics, Inc. | | | 19,944 | | | | 236,536 | |
II-VI, Inc. (a) | | | 26,427 | | | | 501,585 | |
Imprivata, Inc. (a) | | | 4,604 | | | | 75,321 | |
iRobot Corp. (a) | | | 15,049 | | | | 479,762 | |
Newport Corp. (a) | | | 20,091 | | | | 380,925 | |
Rofin-Sinar Technologies, Inc. (a) | | | 14,185 | | | | 391,506 | |
| | | | | | | | |
| | | | | | | | 3,149,211 | |
Energy Equipment — 0.3% | | | | | | | | |
Dynegy, Inc. (a) | | | 64,656 | | | | 1,891,188 | |
Enphase Energy, Inc. (a) | | | 13,910 | | | | 105,855 | |
FuelCell Energy, Inc. (a)(b) | | | 120,115 | | | | 117,341 | |
Matador Resources Co. (a) | | | 36,907 | | | | 922,675 | |
PowerSecure International, Inc. (a) | | | 11,624 | | | | 171,570 | |
Silver Spring Networks, Inc. (a) | | | 18,137 | | | | 225,080 | |
| | | | | | | | |
| | | | | | | | 3,433,709 | |
Energy Equipment & Services — 0.0% | | | | | | | | |
Geospace Technologies Corp. (a) | | | 6,457 | | | | 148,834 | |
Pioneer Energy Services Corp. (a) | | | 31,913 | | | | 202,328 | |
| | | | | | | | |
| | | | | | | | 351,162 | |
Engineering & Contracting Services — 0.5% | | | | | | | | |
Argan, Inc. | | | 6,553 | | | | 264,283 | |
Dycom Industries, Inc. (a) | | | 17,239 | | | | 1,014,515 | |
Engility Holdings, Inc. | | | 9,171 | | | | 230,742 | |
Exponent, Inc. | | | 13,182 | | | | 590,290 | |
Furmanite Corp. (a) | | | 18,882 | | | | 153,322 | |
HC2 Holdings, Inc. (a) | | | 9,851 | | | | 88,166 | |
MasTec, Inc. (a) | | | 33,823 | | | | 672,063 | |
Mistras Group, Inc. (a) | | | 8,358 | | | | 158,635 | |
MYR Group, Inc. (a) | | | 10,641 | | | | 329,445 | |
Power Solutions International, Inc. (a) | | | 2,383 | | | | 128,730 | |
Tetra Tech, Inc. | | | 30,344 | | | | 778,020 | |
VSE Corp. | | | 2,192 | | | �� | 117,294 | |
| | | | | | | | |
| | | | | | | | 4,525,505 | |
Entertainment — 0.4% | | | | | | | | |
AMC Entertainment Holdings, Inc., Class A | | | 10,988 | | | | 337,112 | |
Ascent Capital Group, Inc., Class A (a) | | | 6,630 | | | | 283,366 | |
Carmike Cinemas, Inc. (a) | | | 12,396 | | | | 328,990 | |
DreamWorks Animation SKG, Inc., Class A (a) | | | 38,239 | | | | 1,008,745 | |
IMAX Corp. (a) | | | 30,384 | | | | 1,223,564 | |
Reading International, Inc., Class A (a) | | | 8,327 | | | | 115,329 | |
Rentrak Corp. (a) | | | 6,408 | | | | 447,278 | |
World Wrestling Entertainment, Inc. (b) | | | 15,096 | | | | 249,084 | |
| | | | | | | | |
| | | | | | | | 3,993,468 | |
See Notes to Financial Statements.
| | | | | | |
| | | | | | | |
| | BLACKROCK INDEX FUNDS, INC. | | JUNE 30, 2015 | | 41 |
| | |
Schedule of Investments (continued) | | Master Small Cap Index Series (Percentages shown are based on Net Assets) |
| | | | | | | | |
| Common Stocks | | Shares | | | Value | |
Environmental, Maintenance, & Security Service — 0.5% | | | | | |
ABM Industries, Inc. | | | 28,264 | | | $ | 929,038 | |
The Brink’s Co. | | | 24,580 | | | | 723,389 | |
G&K Services, Inc., Class A | | | 10,037 | | | | 693,958 | |
Healthcare Services Group, Inc. | | | 35,894 | | | | 1,186,297 | |
MSA Safety, Inc. | | | 14,897 | | | | 722,653 | |
SP Plus Corp. (a) | | | 8,554 | | | | 223,345 | |
UniFirst Corp. | | | 7,496 | | | | 838,428 | |
| | | | | | | | |
| | | | | | | | 5,317,108 | |
Fertilizers — 0.0% | | | | | | | | |
Intrepid Potash, Inc. (a) | | | 28,319 | | | | 338,129 | |
Rentech, Inc. (a) | | | 83,520 | | | | 89,366 | |
| | | | | | | | |
| | | | | | | | 427,495 | |
Financial Data & Systems — 0.8% | | | | | | | | |
Advent Software, Inc. | | | 26,627 | | | | 1,177,180 | |
Cardtronics, Inc. (a) | | | 22,826 | | | | 845,703 | |
Cass Information Systems, Inc. | | | 5,838 | | | | 328,212 | |
Euronet Worldwide, Inc. (a) | | | 26,243 | | | | 1,619,193 | |
EVERTEC, Inc. | | | 33,133 | | | | 703,745 | |
Fair Isaac Corp. | | | 15,778 | | | | 1,432,327 | |
Global Cash Access Holdings, Inc. (a) | | | 33,500 | | | | 259,290 | |
Green Dot Corp., Class A (a) | | | 23,128 | | | | 442,207 | |
Heartland Payment Systems, Inc. | | | 18,572 | | | | 1,003,817 | |
Xoom Corp. (a) | | | 16,066 | | | | 338,270 | |
| | | | | | | | |
| | | | | | | | 8,149,944 | |
Food & Staples Retailing — 0.0% | | | | | | | | |
Fairway Group Holdings Corp. (a)(b) | | | 11,330 | | | | 40,335 | |
Natural Grocers by Vitamin Cottage, Inc. (a) | | | 4,688 | | | | 115,418 | |
| | | | | | | | |
| | | | | | | | 155,753 | |
Foods — 1.3% | | | | | | | | |
B&G Foods, Inc. | | | 29,115 | | | | 830,651 | |
Boulder Brands, Inc. (a) | | | 27,467 | | | | 190,621 | |
The Chefs’ Warehouse, Inc. (a) | | | 9,360 | | | | 198,806 | |
Dean Foods Co. | | | 47,680 | | | | 770,986 | |
Diamond Foods, Inc. (a) | | | 13,137 | | | | 412,239 | |
The Fresh Market, Inc. (a) | | | 21,767 | | | | 699,591 | |
Freshpet, Inc. (a)(b) | | | 10,288 | | | | 191,357 | |
Inventure Foods, Inc. (a) | | | 9,730 | | | | 98,760 | |
J&J Snack Foods Corp. | | | 7,459 | | | | 825,488 | |
John B Sanfilippo & Son, Inc. | | | 4,336 | | | | 225,039 | |
Lancaster Colony Corp. | | | 9,251 | | | | 840,453 | |
Lifeway Foods, Inc. (a) | | | 2,337 | | | | 44,847 | |
Medifast, Inc. (a) | | | 5,679 | | | | 183,545 | |
Natural Health Trends Corp. | | | 4,016 | | | | 166,503 | |
Nature’s Sunshine Products, Inc. | | | 5,208 | | | | 71,610 | |
Nutraceutical International Corp. (a) | | | 4,096 | | | | 101,335 | |
Omega Protein Corp. (a) | | | 11,252 | | | | 154,715 | |
Post Holdings, Inc. (a) | | | 27,696 | | | | 1,493,645 | |
Seneca Foods Corp., Class A (a) | | | 4,094 | | | | 113,690 | |
Senomyx, Inc. (a) | | | 21,732 | | | | 116,484 | |
Snyders-Lance, Inc. | | | 24,540 | | | | 791,906 | |
SpartanNash Co. | | | 18,967 | | | | 617,186 | |
Synutra International, Inc. (a) | | | 10,871 | | | | 77,728 | |
Tootsie Roll Industries, Inc. | | | 9,349 | | | | 302,066 | |
TreeHouse Foods, Inc. (a) | | | 21,630 | | | | 1,752,679 | |
United Natural Foods, Inc. (a) | | | 25,234 | | | | 1,606,901 | |
| | | | | | | | |
| | | | | | | | 12,878,831 | |
Forest Products — 0.2% | | | | | | | | |
Boise Cascade Co. (a) | | | 20,196 | | | | 740,789 | |
Deltic Timber Corp. | | | 5,603 | | | | 378,987 | |
Universal Forest Products, Inc. | | | 10,223 | | | | 531,903 | |
| | | | | | | | |
| | | | | | | | 1,651,679 | |
| Common Stocks | | Shares | | | Value | |
Forms & Bulk Printing Services — 0.3% | | | | | | | | |
Deluxe Corp. | | | 25,211 | | | | 1,563,082 | |
Ennis, Inc. | | | 12,955 | | | | 240,833 | |
InnerWorkings, Inc. (a) | | | 18,256 | | | | 121,768 | |
Multi-Color Corp. | | | 6,396 | | | | 408,576 | |
Quad/Graphics, Inc. | | | 14,390 | | | | 266,359 | |
| | | | | | | | |
| | | | | | | | 2,600,618 | |
Fruit & Grain Processing — 0.0% | | | | | | | | |
MGP Ingredients, Inc. | | | 5,374 | | | | 90,391 | |
Funeral Parlors & Cemeteries — 0.2% | | | | | | | | |
Carriage Services, Inc. | | | 8,440 | | | | 201,547 | |
Hillenbrand, Inc. | | | 31,745 | | | | 974,572 | |
Matthews International Corp., Class A | | | 16,567 | | | | 880,370 | |
| | | | | | | | |
| | | | | | | | 2,056,489 | |
Gas Pipeline — 0.2% | | | | | | | | |
SemGroup Corp., Class A | | | 22,146 | | | | 1,760,164 | |
Glass — 0.1% | | | | | | | | |
Apogee Enterprises, Inc. | | | 14,725 | | | | 775,124 | |
Gold — 0.0% | | | | | | | | |
Coeur Mining, Inc. (a) | | | 68,594 | | | | 391,672 | |
Health Care Equipment & Supplies — 0.0% | | | | | | | | |
Inogen, Inc. (a) | | | 7,980 | | | | 355,908 | |
Health Care Facilities — 0.9% | | | | | | | | |
AAC Holdings, Inc. (a)(b) | | | 4,017 | | | | 174,981 | |
Adeptus Health, Inc., Class A (a) | | | 3,150 | | | | 299,219 | |
Amsurg Corp. (a) | | | 24,418 | | | | 1,708,039 | |
Capital Senior Living Corp. (a) | | | 14,900 | | | | 365,050 | |
The Ensign Group, Inc. | | | 12,796 | | | | 653,364 | |
Five Star Quality Care, Inc. (a) | | | 21,077 | | | | 101,170 | |
Genesis Healthcare, Inc. (a) | | | 18,165 | | | | 119,889 | |
Hanger, Inc. (a) | | | 18,019 | | | | 422,365 | |
HealthSouth Corp. | | | 46,145 | | | | 2,125,439 | |
Kindred Healthcare, Inc. | | | 42,150 | | | | 855,223 | |
National Healthcare Corp. | | | 5,055 | | | | 328,524 | |
Select Medical Holdings Corp. | | | 52,956 | | | | 857,887 | |
Surgical Care Affiliates, Inc. (a) | | | 10,789 | | | | 414,082 | |
U.S. Physical Therapy, Inc. | | | 6,178 | | | | 338,307 | |
| | | | | | | | |
| | | | | | | | 8,763,539 | |
Health Care Management Services — 0.5% | | | | | | | | |
BioScrip, Inc. (a)(b) | | | 33,637 | | | | 122,102 | |
Computer Programs & Systems, Inc. | | | 5,622 | | | | 300,327 | |
Magellan Health Services, Inc. (a) | | | 13,790 | | | | 966,265 | |
Molina Healthcare, Inc. (a) | | | 17,828 | | | | 1,253,308 | |
Triple-S Management Corp., Class B (a) | | | 12,310 | | | | 315,875 | |
Universal American Corp. (a) | | | 24,839 | | | | 251,371 | |
WellCare Health Plans, Inc. (a) | | | 22,236 | | | | 1,886,280 | |
| | | | | | | | |
| | | | | | | | 5,095,528 | |
Health Care Services — 2.0% | | | | | | | | |
Accelerate Diagnostics, Inc. (a)(b) | | | 10,948 | | | | 282,568 | |
Addus HomeCare Corp. (a) | | | 3,333 | | | | 92,857 | |
Air Methods Corp. (a) | | | 19,828 | | | | 819,690 | |
Alliance HealthCare Services, Inc. (a) | | | 2,417 | | | | 45,174 | |
Almost Family, Inc. (a) | | | 3,693 | | | | 147,388 | |
Amedisys, Inc. (a) | | | 14,192 | | | | 563,848 | |
AMN Healthcare Services, Inc. (a) | | | 24,053 | | | | 759,834 | |
Cara Therapeutics, Inc. (a) | | | 8,238 | | | | 100,092 | |
Care.com, Inc. (a) | | | 9,282 | | | | 54,949 | |
Catalent, Inc. (a) | | | 42,215 | | | | 1,238,166 | |
Chemed Corp. | | | 8,633 | | | | 1,131,786 | |
Civitas Solutions, Inc. (a) | | | 5,970 | | | | 127,340 | |
Corvel Corp. (a) | | | 4,319 | | | | 138,294 | |
Cross Country Healthcare, Inc. (a) | | | 16,586 | | | | 210,310 | |
ExamWorks Group, Inc. (a) | | | 20,865 | | | | 815,821 | |
See Notes to Financial Statements.
| | | | | | |
| | | | | | | |
| 42 | | BLACKROCK INDEX FUNDS, INC. | | JUNE 30, 2015 | | |
| | |
Schedule of Investments (continued) | | Master Small Cap Index Series (Percentages shown are based on Net Assets) |
| | | | | | | | |
| Common Stocks | | Shares | | | Value | |
Health Care Services (concluded) | | | | | | | | |
Flexion Therapeutics, Inc. (a) | | | 6,972 | | | $ | 152,617 | |
Globus Medical, Inc., Class A (a) | | | 35,001 | | | | 898,476 | |
HealthEquity, Inc. (a) | | | 18,212 | | | | 583,695 | |
Healthways, Inc. (a) | | | 15,761 | | | | 188,817 | |
HMS Holdings Corp. (a) | | | 44,885 | | | | 770,675 | |
IPC The Hospitalist Co., Inc. (a) | | | 8,759 | | | | 485,161 | |
LHC Group, Inc. (a) | | | 6,526 | | | | 249,620 | |
Medidata Solutions, Inc. (a) | | | 27,898 | | | | 1,515,419 | |
MiMedx Group, Inc. (a) | | | 54,797 | | | | 635,097 | |
NeoGenomics, Inc. (a) | | | 26,425 | | | | 142,959 | |
Nobilis Health Corp. (a) | | | 15,632 | | | | 106,298 | |
Omnicell, Inc. (a) | | | 18,184 | | | | 685,719 | |
OvaScience, Inc. (a) | | | 11,874 | | | | 343,515 | |
PharMerica Corp. (a) | | | 15,382 | | | | 512,221 | |
Phibro Animal Health Corp., Class A | | | 8,877 | | | | 345,670 | |
Press Ganey Holdings, Inc. (a) | | | 5,256 | | | | 150,690 | |
Quality Systems, Inc. | | | 25,050 | | | | 415,078 | |
Ryman Hospitality Properties | | | 22,130 | | | | 1,175,324 | |
T2 Biosystems, Inc. (a)(b) | | | 4,481 | | | | 72,727 | |
Team Health Holdings, Inc. (a) | | | 36,337 | | | | 2,373,896 | |
Tetraphase Pharmaceuticals, Inc. (a) | | | 18,227 | | | | 864,689 | |
WebMD Health Corp. (a) | | | 19,096 | | | | 845,571 | |
| | | | | | | | |
| | | | | | | | 20,042,051 | |
Health Care: Miscellaneous — 0.1% | | | | | | | | |
MedAssets, Inc. (a) | | | 30,752 | | | | 678,389 | |
The Providence Service Corp. (a) | | | 6,900 | | | | 305,532 | |
| | | | | | | | |
| | | | | | | | 983,921 | |
Home Building — 0.8% | | | | | | | | |
Beazer Homes USA, Inc. (a) | | | 14,371 | | | | 286,701 | |
Century Communities, Inc. (a) | | | 7,764 | | | | 156,289 | |
Hovnanian Enterprises, Inc., Class A (a) | | | 61,577 | | | | 163,795 | |
Installed Building Products, Inc. (a) | | | 10,100 | | | | 247,248 | |
KB Home | | | 41,715 | | | | 692,469 | |
LGI Homes, Inc. (a) | | | 7,278 | | | | 143,959 | |
M/I Homes, Inc. (a) | | | 12,688 | | | | 313,013 | |
MDC Holdings, Inc. | | | 20,057 | | | | 601,108 | |
Meritage Homes Corp. (a) | | | 20,186 | | | | 950,559 | |
The New Home Co., Inc. (a) | | | 4,542 | | | | 78,259 | |
The Ryland Group, Inc. | | | 23,798 | | | | 1,103,513 | |
Standard Pacific Corp. (a) | | | 75,031 | | | | 668,526 | |
Taylor Morrison Home Corp., Class A (a) | | | 16,565 | | | | 337,263 | |
Tile Shop Holdings, Inc. (a) | | | 13,826 | | | | 196,191 | |
TRI Pointe Homes, Inc. (a) | | | 81,785 | | | | 1,251,311 | |
WCI Communities, Inc. (a) | | | 7,909 | | | | 192,901 | |
William Lyon Homes, Class A (a) | | | 10,049 | | | | 257,958 | |
| | | | | | | | |
| | | | | | | | 7,641,063 | |
Hotel/Motel — 0.3% | | | | | | | | |
Belmond Ltd., Class A (a) | | | 49,824 | | | | 622,302 | |
Bloomin’ Brands, Inc. | | | 62,486 | | | | 1,334,076 | |
Intrawest Resorts Holdings, Inc. (a) | | | 8,878 | | | | 103,162 | |
La Quinta Holdings, Inc. (a) | | | 48,102 | | | | 1,099,131 | |
The Marcus Corp. | | | 9,552 | | | | 183,207 | |
Morgans Hotel Group Co. (a) | | | 15,169 | | | | 102,239 | |
| | | | | | | | |
| | | | | | | | 3,444,117 | |
Household Appliances — 0.0% | | | | | | | | |
National Presto Industries, Inc. | | | 2,417 | | | | 194,133 | |
Household Equipment & Products — 0.2% | | | | | | | | |
Central Garden and Pet Co., Class A (a) | | | 21,446 | | | | 244,699 | |
CSS Industries, Inc. | | | 4,754 | | | | 143,808 | |
Helen of Troy Ltd. (a) | | | 14,346 | | | | 1,398,592 | |
Libbey, Inc. | | | 11,072 | | | | 457,606 | |
| | | | | | | | |
| | | | | | | | 2,244,705 | |
| Common Stocks | | Shares | | | Value | |
Household Furnishings — 0.3% | | | | | | | | |
American Woodmark Corp. (a) | | | 6,582 | | | | 361,023 | |
Bassett Furniture Industries, Inc. | | | 5,356 | | | | 152,164 | |
Ethan Allen Interiors, Inc. | | | 12,905 | | | | 339,918 | |
Flexsteel Industries, Inc. | | | 2,845 | | | | 122,591 | |
Hooker Furniture Corp. | | | 5,286 | | | | 132,731 | |
Kirkland’s, Inc. | | | 8,694 | | | | 242,302 | |
La-Z-Boy, Inc. | | | 25,837 | | | | 680,547 | |
Lifetime Brands, Inc. | | | 5,683 | | | | 83,938 | |
Select Comfort Corp. (a) | | | 26,450 | | | | 795,351 | |
| | | | | | | | |
| | | | | | | | 2,910,565 | |
Insurance: Life — 0.7% | | | | | | | | |
American Equity Investment Life Holding Co. | | | 39,284 | | | | 1,059,882 | |
Citizens, Inc. (a)(b) | | | 23,875 | | | | 178,108 | |
CNO Financial Group, Inc. | | | 99,805 | | | | 1,831,422 | |
FBL Financial Group, Inc., Class A | | | 4,831 | | | | 278,845 | |
Fidelity & Guaranty Life | | | 5,714 | | | | 135,022 | |
Independence Holding Co. | | | 3,763 | | | | 49,634 | |
Kansas City Life Insurance Co. | | | 1,689 | | | | 77,204 | |
National Western Life Insurance Co., Class A | | | 1,168 | | | | 279,724 | |
Primerica, Inc. | | | 25,957 | | | | 1,185,975 | |
Symetra Financial Corp. | | | 37,909 | | | | 916,261 | |
Third Point Reinsurance Ltd. (a) | | | 42,394 | | | | 625,312 | |
Trupanion, Inc. (a)(b) | | | 7,663 | | | | 63,143 | |
| | | | | | | | |
| | | | | | | | 6,680,532 | |
Insurance: Multi-Line — 0.3% | | | | | | | | |
Atlas Financial Holdings, Inc. (a) | | | 5,540 | | | | 109,858 | |
Crawford & Co., Class B | | | 14,312 | | | | 120,650 | |
eHealth, Inc. (a) | | | 8,809 | | | | 111,786 | |
Horace Mann Educators Corp. | | | 20,750 | | | | 754,885 | |
James River Group Holdings, Ltd. | | | 5,672 | | | | 146,735 | |
Kemper Corp. | | | 21,938 | | | | 845,710 | |
Maiden Holdings Ltd. | | | 25,832 | | | | 407,629 | |
PICO Holdings, Inc. (a) | | | 11,508 | | | | 169,398 | |
| | | | | | | | |
| | | | | | | | 2,666,651 | |
Insurance: Property-Casualty — 1.6% | | | | | | | | |
Amerisafe, Inc. | | | 9,562 | | | | 449,988 | |
Argo Group International Holdings Ltd. | | | 14,087 | | | | 784,646 | |
Baldwin & Lyons, Inc., Class B | | | 4,830 | | | | 111,187 | |
Donegal Group, Inc., Class A | | | 3,937 | | | | 59,961 | |
EMC Insurance Group, Inc. | | | 3,868 | | | | 96,971 | |
Employers Holdings, Inc. | | | 16,150 | | | | 367,897 | |
Enstar Group Ltd. (a) | | | 4,482 | | | | 694,486 | |
Essent Group Ltd. (a) | | | 28,043 | | | | 766,976 | |
Federated National Holding Co. | | | 7,395 | | | | 178,959 | |
First American Financial Corp. | | | 54,850 | | | | 2,040,968 | |
Global Indemnity PLC (a) | | | 4,182 | | | | 117,431 | |
Greenlight Capital Re Ltd. (a) | | | 14,730 | | | | 429,674 | |
Hallmark Financial Services, Inc. (a) | | | 7,397 | | | | 84,178 | |
HCI Group, Inc. | | | 4,591 | | | | 202,968 | |
Heritage Insurance Holdings, Inc. (a) | | | 12,590 | | | | 289,444 | |
Hilltop Holdings, Inc. (a) | | | 38,538 | | | | 928,380 | |
Infinity Property & Casualty Corp. | | | 5,767 | | | | 437,369 | |
Meadowbrook Insurance Group, Inc. | | | 26,419 | | | | 227,203 | |
Montpelier Re Holdings Ltd. | | | 18,375 | | | | 725,813 | |
National General Holdings Corp. | | | 18,094 | | | | 376,898 | |
National Interstate Corp. | | | 3,452 | | | | 94,309 | |
The Navigators Group, Inc. (a) | | | 5,315 | | | | 412,231 | |
NMI Holdings, Inc., Class A (a) | | | 24,790 | | | | 198,816 | |
OneBeacon Insurance Group Ltd. | | | 11,422 | | | | 165,733 | |
Radian Group, Inc. | | | 97,024 | | | | 1,820,170 | |
RLI Corp. | | | 21,806 | | | | 1,120,610 | |
Safety Insurance Group, Inc. | | | 7,286 | | | | 420,475 | |
Selective Insurance Group, Inc. | | | 28,951 | | | | 812,076 | |
State Auto Financial Corp. | | | 7,494 | | | | 179,481 | |
See Notes to Financial Statements.
| | | | | | |
| | | | | | | |
| | BLACKROCK INDEX FUNDS, INC. | | JUNE 30, 2015 | | 43 |
| | |
Schedule of Investments (continued) | | Master Small Cap Index Series (Percentages shown are based on Net Assets) |
| | | | | | | | |
| Common Stocks | | Shares | | | Value | |
Insurance: Property-Casualty (concluded) | | | | | | | | |
State National Cos., Inc. | | | 15,337 | | | $ | 166,100 | |
Stewart Information Services Corp. | | | 11,509 | | | | 458,058 | |
United Fire Group, Inc. | | | 10,257 | | | | 336,019 | |
United Insurance Holdings Corp. | | | 8,785 | | | | 136,519 | |
Universal Insurance Holdings, Inc. | | | 16,642 | | | | 402,736 | |
| | | | | | | | |
| | | | | | | | 16,094,730 | |
International Trade & Diversified Logistic — 0.0% | | | | | | | | |
Radiant Logistics, Inc. (a) | | | 12,815 | | | | 93,678 | |
Vectrus, Inc. (a) | | | 5,393 | | | | 134,124 | |
| | | | | | | | |
| | | | | | | | 227,802 | |
Internet Software & Services — 0.4% | | | | | | | | |
Amber Road, Inc. (a) | | | 8,515 | | | | 59,775 | |
ChannelAdvisor Corp. (a) | | | 10,650 | | | | 127,268 | |
Coupons.com, Inc. (a)(b) | | | 30,608 | | | | 330,260 | |
Everyday Health, Inc. (a) | | | 10,769 | | | | 137,628 | |
Global Eagle Entertainment, Inc. (a) | | | 23,293 | | | | 303,275 | |
Gogo, Inc. (a) | | | 28,337 | | | | 607,262 | |
GrubHub, Inc. (a) | | | 37,916 | | | | 1,291,798 | |
OPOWER, Inc. (a)(b) | | | 13,096 | | | | 150,735 | |
TrueCar, Inc. (a) | | | 24,670 | | | | 295,793 | |
Zendesk, Inc. (a) | | | 27,069 | | | | 601,203 | |
| | | | | | | | |
| | | | | | | | 3,904,997 | |
Leisure Time — 1.3% | | | | | | | | |
Black Diamond, Inc. (a) | | | 11,480 | | | | 106,075 | |
Callaway Golf Co. | | | 39,626 | | | | 354,257 | |
Churchill Downs, Inc. | | | 6,916 | | | | 864,846 | |
ClubCorp Holdings, Inc. | | | 22,085 | | | | 527,390 | |
Escalade, Inc. | | | 5,267 | | | | 96,860 | |
International Speedway Corp., Class A | | | 14,029 | | | | 514,443 | |
Interval Leisure Group, Inc. | | | 19,766 | | | | 451,653 | |
Johnson Outdoors, Inc. | | | 2,558 | | | | 60,241 | |
Liberty TripAdvisor Holdings, Inc., Series A (a) | | | 37,635 | | | | 1,212,600 | |
Marriott Vacations Worldwide Corp. | | | 13,365 | | | | 1,226,239 | |
Nautilus, Inc. (a) | | | 16,044 | | | | 345,106 | |
Orbitz Worldwide, Inc. (a) | | | 56,395 | | | | 644,031 | |
Pool Corp. | | | 21,921 | | | | 1,538,416 | |
SeaWorld Entertainment, Inc. | | | 34,381 | | | | 633,986 | |
SFX Entertainment, Inc. (a) | | | 23,327 | | | | 104,738 | |
Smith & Wesson Holding Corp. (a) | | | 27,304 | | | | 452,973 | |
Speedway Motorsports, Inc. | | | 5,963 | | | | 135,062 | |
Sturm Ruger & Co., Inc. | | | 9,463 | | | | 543,649 | |
Travelport Worldwide, Ltd. | | | 53,100 | | | | 731,718 | |
Vail Resorts, Inc. | | | 18,365 | | | | 2,005,458 | |
West Marine, Inc. (a) | | | 9,077 | | | | 87,502 | |
| | | | | | | | |
| | | | | | | | 12,637,243 | |
Luxury Items — 0.0% | | | | | | | | |
Movado Group, Inc. | | | 8,187 | | | | 222,359 | |
Machinery: Agricultural — 0.1% | | | | | | | | |
Alamo Group, Inc. | | | 4,863 | | | | 265,714 | |
Lindsay Corp. (b) | | | 5,927 | | | | 521,043 | |
Titan International, Inc. | | | 21,933 | | | | 235,560 | |
Titan Machinery, Inc. (a) | | | 8,644 | | | | 127,326 | |
| | | | | | | | |
| | | | | | | | 1,149,643 | |
Machinery: Construction & Handling — 0.1% | | | | | | | | |
Astec Industries, Inc. | | | 9,492 | | | | 396,955 | |
Douglas Dynamics, Inc. | | | 11,342 | | | | 243,626 | |
NACCO Industries, Inc., Class A | | | 2,123 | | | | 128,994 | |
| | | | | | | | |
| | | | | | | | 769,575 | |
Machinery: Engines — 0.0% | | | | | | | | |
Briggs & Stratton Corp. | | | 22,477 | | | | 432,907 | |
| Common Stocks | | Shares | | | Value | |
Machinery: Industrial — 0.9% | | | | | | | | |
Actuant Corp., Class A | | | 30,184 | | | | 696,948 | |
Altra Industrial Motion Corp. | | | 13,268 | | | | 360,624 | |
Applied Industrial Technologies, Inc. | | | 20,252 | | | | 802,992 | |
Chart Industries, Inc. (a) | | | 15,424 | | | | 551,408 | |
Columbus McKinnon Corp. | | | 10,142 | | | | 253,550 | |
DXP Enterprises, Inc. (a) | | | 6,382 | | | | 296,763 | |
EnPro Industries, Inc. | | | 11,553 | | | | 661,063 | |
The ExOne Co. (a)(b) | | | 5,368 | | | | 59,585 | |
Graham Corp. | | | 5,169 | | | | 105,913 | |
Hyster-Yale Materials Handling, Inc. | | | 4,764 | | | | 330,050 | |
John Bean Technologies Corp. | | | 14,697 | | | | 552,460 | |
Kadant, Inc. | | | 5,539 | | | | 261,441 | |
MTS Systems Corp. | | | 7,447 | | | | 513,471 | |
Omega Flex, Inc. | | | 1,603 | | | | 60,369 | |
Proto Labs, Inc. (a) | | | 11,746 | | | | 792,620 | |
Tennant Co. | | | 9,211 | | | | 601,847 | |
Twin Disc, Inc. | | | 4,060 | | | | 75,678 | |
Woodward, Inc. | | | 32,894 | | | | 1,808,841 | |
| | | | | | | | |
| | | | | | | | 8,785,623 | |
Machinery: Specialty — 0.1% | | | | | | | | |
Albany International Corp., Class A | | | 14,254 | | | | 567,309 | |
Hurco Cos., Inc. | | | 3,407 | | | | 117,950 | |
Xerium Technologies, Inc. (a) | | | 5,882 | | | | 107,053 | |
| | | | | | | | |
| | | | | | | | 792,312 | |
Manufactured Housing — 0.0% | | | | | | | | |
Cavco Industries, Inc. (a) | | | 4,480 | | | | 337,971 | |
Medical & Dental Instruments & Supplies — 2.1% | | | | | | | | |
ABIOMED, Inc. (a) | | | 21,084 | | | | 1,385,851 | |
AngioDynamics, Inc. (a) | | | 12,988 | | | | 213,003 | |
Anika Therapeutics, Inc. (a) | | | 7,386 | | | | 243,960 | |
Antares Pharma, Inc. (a) | | | 78,893 | | | | 164,097 | |
AtriCure, Inc. (a) | | | 14,373 | | | | 354,151 | |
Atrion Corp. | | | 731 | | | | 286,779 | |
Cantel Medical Corp. | | | 17,518 | | | | 940,191 | |
Cardiovascular Systems, Inc. (a) | | | 15,890 | | | | 420,290 | |
Cerus Corp. (a)(b) | | | 48,327 | | | | 250,817 | |
CONMED Corp. | | | 14,015 | | | | 816,654 | |
CryoLife, Inc. | | | 13,449 | | | | 151,705 | |
Cutera, Inc. (a) | | | 7,241 | | | | 112,091 | |
Endologix, Inc. (a) | | | 34,147 | | | | 523,815 | |
Entellus Medical, Inc. (a) | | | 2,877 | | | | 74,428 | |
Exactech, Inc. (a) | | | 5,314 | | | | 110,691 | |
Halyard Health, Inc. (a) | | | 23,580 | | | | 954,990 | |
HeartWare International, Inc. (a) | | | 8,786 | | | | 638,654 | |
ICU Medical, Inc. (a) | | | 7,205 | | | | 689,230 | |
Insulet Corp. (a) | | | 28,752 | | | | 890,881 | |
Integra LifeSciences Holdings Corp. (a) | | | 13,034 | | | | 878,101 | |
Intersect ENT, Inc. (a) | | | 7,019 | | | | 200,954 | |
Invacare Corp. | | | 16,510 | | | | 357,111 | |
InVivo Therapeutics Holdings Corp. (a) | | | 13,461 | | | | 217,395 | |
K2M Group Holdings, Inc. (a) | | | 8,873 | | | | 213,129 | |
Landauer, Inc. | | | 4,746 | | | | 169,147 | |
LDR Holding Corp. (a) | | | 11,791 | | | | 509,961 | |
LeMaitre Vascular, Inc. | | | 5,810 | | | | 70,069 | |
Meridian Bioscience, Inc. | | | 21,091 | | | | 393,136 | |
Merit Medical Systems, Inc. (a) | | | 22,353 | | | | 481,484 | |
NanoString Technologies, Inc. (a) | | | 6,373 | | | | 98,272 | |
Navidea Biopharmaceuticals, Inc. (a)(b) | | | 75,861 | | | | 122,136 | |
Neogen Corp. (a) | | | 18,658 | | | | 885,136 | |
NuVasive, Inc. (a) | | | 24,682 | | | | 1,169,433 | |
Ocular Therapeutix, Inc. (a) | | | 6,591 | | | | 138,609 | |
OraSure Technologies, Inc. (a) | | | 29,024 | | | | 156,439 | |
Orthofix International NV (a) | | | 9,601 | | | | 317,985 | |
Owens & Minor, Inc. | | | 32,237 | | | | 1,096,058 | |
Quidel Corp. (a) | | | 14,730 | | | | 338,054 | |
See Notes to Financial Statements.
| | | | | | |
| | | | | | | |
| 44 | | BLACKROCK INDEX FUNDS, INC. | | JUNE 30, 2015 | | |
| | |
Schedule of Investments (continued) | | Master Small Cap Index Series (Percentages shown are based on Net Assets) |
| | | | | | | | |
| Common Stocks | | Shares | | | Value | |
Medical & Dental Instruments & Supplies (concluded) | |
Second Sight Medical Products, Inc. (a)(b) | | | 6,032 | | | $ | 82,096 | |
Sientra, Inc. (a) | | | 3,611 | | | | 91,106 | |
Staar Surgical Co. (a) | | | 19,415 | | | | 187,549 | |
STERIS Corp. | | | 30,371 | | | | 1,957,107 | |
SurModics, Inc. (a) | | | 6,790 | | | | 159,022 | |
Tornier NV (a) | | | 18,399 | | | | 459,791 | |
TransEnterix, Inc. (a) | | | 17,684 | | | | 53,052 | |
Unilife Corp. (a)(b) | | | 59,582 | | | | 128,101 | |
Utah Medical Products, Inc. | | | 1,996 | | | | 119,021 | |
Vascular Solutions, Inc. (a) | | | 9,059 | | | | 314,528 | |
| | | | | | | | |
| | | | | | | | 20,586,260 | |
Medical Equipment — 1.1% | | | | | | | | |
Abaxis, Inc. | | | 11,436 | | | | 588,725 | |
Accuray, Inc. (a) | | | 39,784 | | | | 268,144 | |
Affymetrix, Inc. (a) | | | 39,044 | | | | 426,360 | |
Analogic Corp. | | | 6,341 | | | | 500,305 | |
Corindus Vascular Robotics, Inc. (a) | | | 11,369 | | | | 39,905 | |
Cyberonics, Inc. (a) | | | 13,286 | | | | 789,986 | |
Cynosure, Inc., Class A (a) | | | 11,409 | | | | 440,159 | |
Fluidigm Corp. (a) | | | 14,506 | | | | 351,045 | |
Greatbatch, Inc. (a) | | | 13,031 | | | | 702,632 | |
Haemonetics Corp. (a) | | | 26,370 | | | | 1,090,663 | |
iRadimed Corp. (a) | | | 1,428 | | | | 33,230 | |
Luminex Corp. (a) | | | 21,350 | | | | 368,501 | |
Masimo Corp. (a) | | | 22,307 | | | | 864,173 | |
Merge Healthcare, Inc. (a) | | | 34,916 | | | | 167,597 | |
Natus Medical, Inc. (a) | | | 16,779 | | | | 714,114 | |
Nevro Corp. (a) | | | 7,666 | | | | 412,047 | |
NxStage Medical, Inc. (a) | | | 31,908 | | | | 455,806 | |
Oxford Immunotec Global PLC (a) | | | 10,112 | | | | 140,051 | |
Spectranetics Corp. (a) | | | 21,553 | | | | 495,935 | |
Tandem Diabetes Care, Inc. (a) | | | 8,882 | | | | 96,281 | |
Thoratec Corp. (a) | | | 27,521 | | | | 1,226,611 | |
Zeltiq Aesthetics, Inc. (a) | | | 16,325 | | | | 481,098 | |
| | | | | | | | |
| | | | | | | | 10,653,368 | |
Medical Services — 0.2% | | | | | | | | |
Bio-Reference Laboratories, Inc. (a) | | | 12,447 | | | | 513,439 | |
PAREXEL International Corp. (a) | | | 27,892 | | | | 1,793,734 | |
| | | | | | | | |
| | | | | | | | 2,307,173 | |
Metal Fabricating — 0.7% | | | | | | | | |
Advanced Drainage Systems, Inc. | | | 16,998 | | | | 498,551 | |
Global Brass & Copper Holdings, Inc. | | | 10,997 | | | | 187,059 | |
Haynes International, Inc. | | | 6,179 | | | | 304,748 | |
Lawson Products, Inc. (a) | | | 2,646 | | | | 62,128 | |
LB Foster Co., Class A | | | 5,364 | | | | 185,648 | |
MRC Global, Inc. (a) | | | 51,907 | | | | 801,444 | |
Mueller Industries, Inc. | | | 28,792 | | | | 999,658 | |
Mueller Water Products, Inc., Series A | | | 81,198 | | | | 738,902 | |
NN, Inc. | | | 9,663 | | | | 246,600 | |
Northwest Pipe Co. (a) | | | 4,954 | | | | 100,913 | |
RBC Bearings, Inc. (a) | | | 11,772 | | | | 844,759 | |
Rexnord Corp. (a) | | | 51,218 | | | | 1,224,622 | |
RTI International Metals, Inc. (a) | | | 15,598 | | | | 491,649 | |
Worthington Industries, Inc. | | | 24,264 | | | | 729,376 | |
| | | | | | | | |
| | | | | | | | 7,416,057 | |
Metals & Minerals: Diversified — 0.5% | | | | | | | | |
Cliffs Natural Resources, Inc. | | | 77,274 | | | | 334,596 | |
Commercial Metals Co. | | | 58,733 | | | | 944,427 | |
Energy Fuels, Inc. (a) | | | 20,681 | | | | 92,030 | |
Globe Specialty Metals, Inc. | | | 32,723 | | | | 579,197 | |
Hecla Mining Co. | | | 186,754 | | | | 491,163 | |
Materion Corp. | | | 10,180 | | | | 358,845 | |
Minerals Technologies, Inc. | | | 17,550 | | | | 1,195,682 | |
Oil-Dri Corp. of America | | | 2,507 | | | | 76,163 | |
| Common Stocks | | Shares | | | Value | |
Metals & Minerals: Diversified (concluded) | | | | | | | | |
Ring Energy, Inc. (a) | | | 10,135 | | | | 113,411 | |
SunCoke Energy, Inc. | | | 32,957 | | | | 428,441 | |
U.S. Silica Holdings, Inc. (b) | | | 26,943 | | | | 791,046 | |
United States Lime & Minerals, Inc. | | | 890 | | | | 51,727 | |
| | | | | | | | |
| | | | | | | | 5,456,728 | |
Office Supplies & Equipment — 0.6% | | | | | | | | |
ACCO Brands Corp. (a) | | | 55,881 | | | | 434,195 | |
Eastman Kodak Co. (a) | | | 8,717 | | | | 146,446 | |
Electronics for Imaging, Inc. (a) | | | 23,589 | | | | 1,026,357 | |
Essendant, Inc. | | | 19,371 | | | | 760,312 | |
Herman Miller, Inc. | | | 30,038 | | | | 868,999 | |
HNI Corp. | | | 22,464 | | | | 1,149,034 | |
Kimball International, Inc., Class B | | | 17,323 | | | | 210,648 | |
Knoll, Inc. | | | 24,637 | | | | 616,664 | |
Steelcase, Inc., Class A | | | 41,953 | | | | 793,331 | |
| | | | | | | | |
| | | | | | | | 6,005,986 | |
Offshore Drilling & Other Services — 0.1% | | | | | | | | |
Atwood Oceanics, Inc. | | | 32,692 | | | | 864,376 | |
North Atlantic Drilling, Ltd. (b) | | | 31,845 | | | | 37,896 | |
| | | | | | | | |
| | | | | | | | 902,272 | |
Oil Well Equipment & Services — 0.8% | | | | | | | | |
Basic Energy Services, Inc. (a) | | | 21,305 | | | | 160,853 | |
C&J Energy Services, Ltd. (a) | | | 28,322 | | | | 373,850 | |
Exterran Holdings, Inc. | | | 34,967 | | | | 1,141,673 | |
Flotek Industries, Inc. (a) | | | 27,147 | | | | 340,152 | |
FMSA Holdings, Inc. (a)(b) | | | 32,268 | | | | 264,275 | |
Forum Energy Technologies, Inc. (a) | | | 29,949 | | | | 607,366 | |
Helix Energy Solutions Group, Inc. (a) | | | 53,537 | | | | 676,172 | |
Hornbeck Offshore Services, Inc. (a) | | | 16,334 | | | | 335,337 | |
Independence Contract Drilling, Inc. (a) | | | 7,954 | | | | 70,552 | |
ION Geophysical Corp. (a) | | | 69,466 | | | | 74,329 | |
Key Energy Services, Inc. (a) | | | 65,166 | | | | 117,299 | |
Matrix Service Co. (a) | | | 13,526 | | | | 247,255 | |
McDermott International, Inc. (a) | | | 120,551 | | | | 643,742 | |
Natural Gas Services Group, Inc. (a) | | | 6,489 | | | | 148,079 | |
Newpark Resources, Inc. (a) | | | 42,748 | | | | 347,541 | |
Oil States International, Inc. (a) | | | 25,983 | | | | 967,347 | |
Parker Drilling Co. (a) | | | 62,992 | | | | 209,133 | |
RigNet, Inc. (a) | | | 5,995 | | | | 183,267 | |
SEACOR Holdings, Inc. (a) | | | 9,211 | | | | 653,428 | |
Seventy Seven Energy, Inc. (a) | | | 28,150 | | | | 120,764 | |
Tesco Corp. | | | 19,286 | | | | 210,217 | |
TETRA Technologies, Inc. (a) | | | 40,912 | | | | 261,019 | |
| | | | | | | | |
| | | | | | | | 8,153,650 | |
Oil, Gas & Consumable Fuels — 0.3% | | | | | | | | |
Ardmore Shipping Corp. | | | 8,853 | | | | 107,210 | |
CARBO Ceramics, Inc. | | | 9,867 | | | | 410,763 | |
DHT Holdings, Inc. | | | 47,135 | | | | 366,239 | |
Dorian LPG, Ltd. (a) | | | 12,481 | | | | 208,183 | |
EXCO Resources, Inc. (b) | | | 82,713 | | | | 97,601 | |
Gastar Exploration, Inc. (a) | | | 40,950 | | | | 126,536 | |
Navios Maritime Acq Corp. | | | 42,424 | | | | 152,302 | |
Pacific Ethanol, Inc. (a) | | | 12,821 | | | | 132,313 | |
Parsley Energy, Inc., Class A (a) | | | 41,984 | | | | 731,361 | |
Plug Power, Inc. (a)(b) | | | 86,846 | | | | 212,773 | |
RSP Permian, Inc. (a) | | | 27,506 | | | | 773,194 | |
TransAtlantic Petroleum, Ltd. (a) | | | 12,247 | | | | 62,582 | |
| | | | | | | | |
| | | | | | | | 3,381,057 | |
Oil: Crude Producers — 1.2% | | | | | | | | |
Abraxas Petroleum Corp. (a) | | | 48,961 | | | | 144,435 | |
Approach Resources, Inc. (a)(b) | | | 18,399 | | | | 126,033 | |
Bill Barrett Corp. (a) | | | 25,000 | | | | 214,750 | |
Bonanza Creek Energy, Inc. (a) | | | 25,029 | | | | 456,779 | |
See Notes to Financial Statements.
| | | | | | |
| | | | | | | |
| | BLACKROCK INDEX FUNDS, INC. | | JUNE 30, 2015 | | 45 |
| | |
Schedule of Investments (continued) | | Master Small Cap Index Series (Percentages shown are based on Net Assets) |
| | | | | | | | |
| Common Stocks | | Shares | | | Value | |
Oil: Crude Producers (concluded) | | | | | | | | |
Callon Petroleum Co. (a) | | | 33,498 | | | $ | 278,703 | |
Carrizo Oil & Gas, Inc. (a) | | | 25,970 | | | | 1,278,763 | |
Clayton Williams Energy, Inc. (a) | | | 2,984 | | | | 196,198 | |
Contango Oil & Gas Co. (a) | | | 9,059 | | | | 111,154 | |
Earthstone Energy, Inc. (a) | | | 522 | | | | 10,195 | |
Eclipse Resources Corp. (a) | | | 23,641 | | | | 124,352 | |
Energy XXI Bermuda Ltd. (b) | | | 46,331 | | | | 121,850 | |
Erin Energy Corp. (a) | | | 6,870 | | | | 26,862 | |
Evolution Petroleum Corp. | | | 11,718 | | | | 77,222 | |
Halcon Resources Corp. (a)(b) | | | 184,622 | | | | 214,161 | |
Isramco, Inc. (a) | | | 423 | | | | 58,382 | |
Jones Energy, Inc., Class A (a) | | | 14,507 | | | | 131,288 | |
Magnum Hunter Resources Corp. (a)(b) | | | 103,524 | | | | 193,590 | |
Northern Oil and Gas, Inc. (a)(b) | | | 30,961 | | | | 209,606 | |
Oasis Petroleum, Inc. (a) | | | 70,130 | | | | 1,111,560 | |
ONE Gas, Inc. | | | 26,522 | | | | 1,128,776 | |
Panhandle Oil and Gas, Inc. | | | 8,194 | | | | 169,534 | |
PDC Energy, Inc. (a) | | | 20,233 | | | | 1,085,298 | |
Penn Virginia Corp. (a) | | | 35,187 | | | | 154,119 | |
Rex Energy Corp. (a)(b) | | | 25,023 | | | | 139,879 | |
Rosetta Resources, Inc. (a) | | | 38,135 | | | | 882,444 | |
Sanchez Energy Corp. (a)(b) | | | 26,337 | | | | 258,103 | |
SandRidge Energy, Inc. (a) | | | 216,280 | | | | 189,678 | |
Stone Energy Corp. (a) | | | 28,859 | | | | 363,335 | |
Synergy Resources Corp. (a) | | | 52,340 | | | | 598,246 | |
Triangle Petroleum Corp. (a)(b) | | | 24,052 | | | | 120,741 | |
Ultra Petroleum Corp. (a) | | | 77,245 | | | | 967,107 | |
Unit Corp. (a) | | | 25,266 | | | | 685,214 | |
W&T Offshore, Inc. (b) | | | 17,460 | | | | 95,681 | |
| | | | | | | | |
| | | | | | | | 11,924,038 | |
Oil: Refining & Marketing — 0.4% | | | | | | | | |
Adams Resources & Energy, Inc. | | | 1,047 | | | | 46,696 | |
Alon USA Energy, Inc. | | | 15,803 | | | | 298,677 | |
Clean Energy Fuels Corp. (a)(b) | | | 35,418 | | | | 199,049 | |
Delek U.S. Holdings, Inc. | | | 29,031 | | | | 1,068,921 | |
Par Petroleum Corp. (a) | | | 7,858 | | | | 147,102 | |
Renewable Energy Group, Inc. (a) | | | 22,243 | | | | 257,129 | |
Trecora Resources (a) | | | 10,200 | | | | 154,020 | |
Western Refining, Inc. | | | 35,905 | | | | 1,566,176 | |
| | | | | | | | |
| | | | | | �� | | 3,737,770 | |
Paints & Coatings — 0.2% | | | | | | | | |
Chase Corp. | | | 3,622 | | | | 143,974 | |
Ferro Corp. (a) | | | 36,806 | | | | 617,605 | |
HB Fuller Co. | | | 25,433 | | | | 1,033,088 | |
Kronos Worldwide, Inc. | | | 10,761 | | | | 117,941 | |
| | | | | | | | |
| | | | | | | | 1,912,608 | |
Paper — 0.3% | | | | | | | | |
Clearwater Paper Corp. (a) | | | 9,680 | | | | 554,664 | |
KapStone Paper and Packaging Corp. | | | 43,252 | | | | 999,986 | |
Neenah Paper, Inc. | | | 8,574 | | | | 505,523 | |
PH Glatfelter Co. | | | 22,070 | | | | 485,319 | |
Schweitzer-Mauduit International, Inc. | | | 15,501 | | | | 618,180 | |
Wausau Paper Corp. | | | 21,172 | | | | 194,359 | |
| | | | | | | | |
| | | | | | | | 3,358,031 | |
Personal Care — 0.1% | | | | | | | | |
Orchids Paper Products Co. | | | 4,656 | | | | 112,070 | |
USANA Health Sciences, Inc. (a) | | | 2,890 | | | | 394,947 | |
WD-40 Co. | | | 7,290 | | | | 635,397 | |
| | | | | | | | |
| | | | | | | | 1,142,414 | |
Pharmaceuticals — 2.7% | | | | | | | | |
Abeona Therapeutics, Inc. (a) | | | 5,115 | | | | 25,882 | |
ACADIA Pharmaceuticals, Inc. (a) | | | 40,208 | | | | 1,683,911 | |
Achillion Pharmaceuticals, Inc. (a) | | | 59,245 | | | | 524,911 | |
| Common Stocks | | Shares | | | Value | |
Pharmaceuticals (concluded) | | | | | | | | |
Adamas Pharmaceuticals, Inc. (a) | | | 5,107 | | | | 133,906 | |
Aerie Pharmaceuticals, Inc. (a) | | | 10,372 | | | | 183,066 | |
Agile Therapeutics, Inc. (a) | | | 5,082 | | | | 43,654 | |
Amphastar Pharmaceuticals, Inc. (a) | | | 15,947 | | | | 280,348 | |
Anacor Pharmaceuticals, Inc. (a) | | | 20,683 | | | | 1,601,485 | |
Aratana Therapeutics, Inc. (a) | | | 14,918 | | | | 225,560 | |
Biospecifics Technologies Corp. (a) | | | 2,477 | | | | 127,813 | |
Cambrex Corp. (a) | | | 15,865 | | | | 697,108 | |
Cempra, Inc. (a) | | | 16,127 | | | | 554,124 | |
Chimerix, Inc. (a) | | | 20,814 | | | | 961,607 | |
Concert Pharmaceuticals, Inc. (a) | | | 7,744 | | | | 115,308 | |
Corcept Therapeutics, Inc. (a) | | | 31,181 | | | | 187,398 | |
CorMedix, Inc. (a) | | | 15,797 | | | | 61,292 | |
Depomed, Inc. (a) | | | 30,340 | | | | 651,096 | |
Dicerna Pharmaceuticals, Inc. (a) | | | 7,570 | | | | 105,602 | |
Durect Corp. (a) | | | 56,290 | | | | 134,533 | |
Eagle Pharmaceuticals, Inc. (a) | | | 4,344 | | | | 351,256 | |
Enanta Pharmaceuticals, Inc. (a) | | | 8,061 | | | | 362,664 | |
Endocyte, Inc. (a) | | | 18,683 | | | | 96,965 | |
Esperion Therapeutics, Inc. (a) | | | 6,641 | | | | 542,968 | |
Foamix Pharmaceuticals, Ltd. (a) | | | 11,294 | | | | 115,764 | |
Furiex Pharamceuticals, Inc. | | | 3,003 | | | | 30,030 | |
Heska Corp. (a) | | | 2,831 | | | | 84,052 | |
Immune Design Corp. (a) | | | 5,653 | | | | 116,734 | |
Impax Laboratories, Inc. (a) | | | 36,196 | | | | 1,662,120 | |
Infinity Pharmaceuticals, Inc. (a) | | | 24,731 | | | | 270,804 | |
Intra-Cellular Therapies, Inc. (a) | | | 10,951 | | | | 349,884 | |
Ironwood Pharmaceuticals, Inc. (a) | | | 63,038 | | | | 760,238 | |
Kite Pharma, Inc. (a)(b) | | | 14,550 | | | | 887,113 | |
La Jolla Pharmaceutical Co. (a) | | | 5,774 | | | | 141,521 | |
Lannett Co., Inc. (a) | | | 13,431 | | | | 798,339 | |
The Medicines Co. (a) | | | 33,470 | | | | 957,577 | |
Otonomy, Inc. (a) | | | 7,411 | | | | 170,379 | |
Pacira Pharmaceuticals, Inc. (a) | | | 18,380 | | | | 1,299,834 | |
Paratek Pharmaceuticals, Inc. | | | 6,034 | | | | 155,496 | |
Pernix Therapeutics Holdings (a) | | | 22,249 | | | | 131,714 | |
Portola Pharmaceuticals, Inc. (a) | | | 23,285 | | | | 1,060,632 | |
Pozen, Inc. (a) | | | 15,228 | | | | 157,001 | |
Prestige Brands Holdings, Inc. (a) | | | 26,425 | | | | 1,221,892 | |
Radius Health, Inc. (a) | | | 14,749 | | | | 998,507 | |
Relypsa, Inc. (a) | | | 16,416 | | | | 543,205 | |
Revance Therapeutics, Inc. (a) | | | 7,820 | | | | 250,084 | |
Sagent Pharmaceuticals, Inc. (a) | | | 11,067 | | | | 269,039 | |
Sciclone Pharmaceuticals, Inc. (a) | | | 25,294 | | | | 248,387 | |
Spectrum Pharmaceuticals, Inc. (a) | | | 34,547 | | | | 236,301 | |
Supernus Pharmaceuticals, Inc. (a) | | | 17,337 | | | | 294,382 | |
TG Therapeutics, Inc. (a) | | | 17,847 | | | | 296,082 | |
TherapeuticsMD, Inc. (a) | | | 64,170 | | | | 504,376 | |
Theravance Biopharma, Inc. (a) | | | 12,778 | | | | 166,370 | |
Ultragenyx Pharmaceutical, Inc. (a) | | | 18,084 | | | | 1,851,621 | |
Vivus, Inc. (a) | | | 53,157 | | | | 125,451 | |
XenoPort, Inc. (a) | | | 29,153 | | | | 178,708 | |
Zafgen, Inc. (a) | | | 8,270 | | | | 286,390 | |
Zogenix, Inc. (a) | | | 77,706 | | | | 130,546 | |
ZS Pharma, Inc. (a) | | | 9,141 | | | | 478,897 | |
| | | | | | | | |
| | | | | | | | 26,881,927 | |
Plastics — 0.1% | | | | | | | | |
A. Schulman, Inc. | | | 14,746 | | | | 644,695 | |
Core Molding Technologies, Inc. (a) | | | 3,900 | | | | 89,076 | |
Ply Gem Holdings, Inc. (a) | | | 11,372 | | | | 134,076 | |
Trinseo SA (a) | | | 5,885 | | | | 157,953 | |
| | | | | | | | |
| | | | | | | | 1,025,800 | |
Power Transmission Equipment — 0.2% | | | | | | | | |
Advanced Energy Industries, Inc. (a) | | | 20,708 | | | | 569,263 | |
Generac Holdings, Inc. (a) | | | 34,965 | | | | 1,389,859 | |
See Notes to Financial Statements.
| | | | | | |
| | | | | | | |
| 46 | | BLACKROCK INDEX FUNDS, INC. | | JUNE 30, 2015 | | |
| | |
Schedule of Investments (continued) | | Master Small Cap Index Series (Percentages shown are based on Net Assets) |
| | | | | | | | |
| Common Stocks | | Shares | | | Value | |
Power Transmission Equipment (concluded) | | | | | | | | |
Powell Industries, Inc. | | | 4,558 | | | $ | 160,305 | |
Vicor Corp. (a) | | | 8,613 | | | | 104,992 | |
| | | | | | | | |
| | | | | | | | 2,224,419 | |
Precious Metals & Minerals — 0.1% | | | | | | | | |
Horsehead Holding Corp. (a) | | | 28,563 | | | | 334,759 | |
Stillwater Mining Co. (a) | | | 61,119 | | | | 708,369 | |
| | | | | | | | |
| | | | | | | | 1,043,128 | |
Printing & Copying Services — 0.2% | | | | | | | | |
Casella Waste Systems, Inc. (a) | | | 19,940 | | | | 111,864 | |
Cimpress NV (a) | | | 16,558 | | | | 1,393,521 | |
| | | | | | | | |
| | | | | | | | 1,505,385 | |
Producer Durables: Miscellaneous — 0.1% | | | | | | | | |
Blount International, Inc. (a) | | | 24,706 | | | | 269,790 | |
Park-Ohio Holdings Corp. | | | 4,451 | | | | 215,695 | |
| | | | | | | | |
| | | | | | | | 485,485 | |
Production Technology Equipment — 0.8% | | | | | | | | |
Axcelis Technologies, Inc. (a) | | | 56,296 | | | | 166,636 | |
Brooks Automation, Inc. | | | 34,117 | | | | 390,640 | |
Cohu, Inc. | | | 12,782 | | | | 169,106 | |
Entegris, Inc. (a) | | | 70,632 | | | | 1,029,108 | |
FEI Co. | | | 20,908 | | | | 1,733,900 | |
GSI Group, Inc. (a) | | | 17,126 | | | | 257,404 | |
Mattson Technology, Inc. (a) | | | 37,511 | | | | 125,662 | |
MKS Instruments, Inc. | | | 26,921 | | | | 1,021,383 | |
Nanometrics, Inc. (a) | | | 12,021 | | | | 193,779 | |
Photronics, Inc. (a) | | | 33,432 | | | | 317,938 | |
Rudolph Technologies, Inc. (a) | | | 16,254 | | | | 195,211 | |
Tessera Technologies, Inc. | | | 26,607 | | | | 1,010,534 | |
Ultra Clean Holdings, Inc. (a) | | | 16,532 | | | | 102,994 | |
Ultratech, Inc. (a) | | | 13,931 | | | | 258,559 | |
Veeco Instruments, Inc. (a) | | | 20,348 | | | | 584,801 | |
| | | | | | | | |
| | | | | | | | 7,557,655 | |
Publishing — 0.6% | | | | | | | | |
Daily Journal Corp. (a) | | | 553 | | | | 108,670 | |
Eros International PLC (a) | | | 14,187 | | | | 356,377 | |
Journal Media Group, Inc. | | | 12,144 | | | | 100,674 | |
Martha Stewart Living Omnimedia, Class A (a) | | | 15,328 | | | | 95,647 | |
Media General, Inc. (a) | | | 48,441 | | | | 800,245 | |
Meredith Corp. | | | 18,536 | | | | 966,652 | |
New Media Investment Group, Inc. | | | 22,728 | | | | 407,513 | |
The New York Times Co., Class A | | | 69,511 | | | | 948,825 | |
Scholastic Corp. | | | 13,441 | | | | 593,151 | |
Time, Inc. | | | 55,364 | | | | 1,273,926 | |
Tribune Publishing Co. | | | 9,951 | | | | 154,639 | |
| | | | | | | | |
| | | | | | | | 5,806,319 | |
Radio & TV Broadcasters — 0.3% | | | | | | | | |
Central European Media Enterprises Ltd. (a) | | | 36,951 | | | | 80,553 | |
Crown Media Holdings, Inc., Class A (a) | | | 16,618 | | | | 75,113 | |
Cumulus Media, Inc., Class A (a) | | | 71,457 | | | | 145,058 | |
Entercom Communications Corp., Class A (a) | | | 13,402 | | | | 153,051 | |
Entravision Communications Corp., Class A | | | 32,657 | | | | 268,767 | |
Gray Television, Inc. (a) | | | 32,299 | | | | 506,448 | |
Nexstar Broadcasting Group, Inc., Class A | | | 15,817 | | | | 885,752 | |
Saga Communications, Inc., Class A | | | 1,880 | | | | 71,158 | |
Sinclair Broadcast Group, Inc., Class A | | | 33,537 | | | | 936,018 | |
Townsquare Media, Inc. (a) | | | 3,693 | | | | 50,151 | |
| | | | | | | | |
| | | | | | | | 3,172,069 | |
Railroad Equipment — 0.1% | | | | | | | | |
American Railcar Industries, Inc. | | | 4,779 | | | | 232,451 | |
FreightCar America, Inc. | | | 6,444 | | | | 134,551 | |
The Greenbrier Cos., Inc. | | | 13,384 | | | | 627,040 | |
| | | | | | | | |
| | | | | | | | 994,042 | |
| Common Stocks | | Shares | | | Value | |
Real Estate — 0.3% | | | | | | | | |
AV Homes, Inc. (a) | | | 5,788 | | | | 83,174 | |
Consolidated-Tomoka Land Co. | | | 2,227 | | | | 128,364 | |
Forestar Group, Inc. (a) | | | 17,064 | | | | 224,562 | |
HFF, Inc., Class A | | | 19,017 | | | | 793,579 | |
Kennedy-Wilson Holdings, Inc. | | | 46,768 | | | | 1,150,025 | |
The St. Joe Co. (a) | | | 16,367 | | | | 254,180 | |
Tejon Ranch Co. (a) | | | 6,769 | | | | 174,031 | |
| | | | | | | | |
| | | | | | | | 2,807,915 | |
Real Estate Investment Trusts (REITs) — 8.1% | | | | | | | | |
Acadia Realty Trust | | | 34,925 | | | | 1,016,667 | |
AG Mortgage Investment Trust, Inc. | | | 15,052 | | | | 260,099 | |
Agree Realty Corp. | | | 8,964 | | | | 261,480 | |
Alexander & Baldwin, Inc. | | | 24,835 | | | | 978,499 | |
Alexander’s, Inc. | | | 1,055 | | | | 432,550 | |
Altisource Residential Corp. | | | 29,235 | | | | 492,610 | |
American Assets Trust, Inc. | | | 13,915 | | | | 545,607 | |
American Capital Mortgage Investment Corp. | | | 26,300 | | | | 420,537 | |
American Residential Properties, Inc. | | | 16,221 | | | | 300,088 | |
Anworth Mortgage Asset Corp. | | | 54,221 | | | | 267,310 | |
Apollo Commercial Real Estate Finance, Inc. | | | 30,131 | | | | 495,052 | |
Ares Commercial Real Estate Corp. | | | 14,445 | | | | 164,529 | |
Armada Hoffler Properties, Inc. | | | 13,803 | | | | 137,892 | |
ARMOUR Residential REIT, Inc. | | | 179,376 | | | | 504,047 | |
Ashford Hospitality Prime, Inc. | | | 12,670 | | | | 190,303 | |
Ashford Hospitality Trust, Inc. | | | 41,667 | | | | 352,503 | |
Associated Estates Realty Corp. | | | 29,542 | | | | 845,787 | |
Bluerock Residential Growth REIT, Inc. | | | 9,293 | | | | 117,649 | |
Campus Crest Communities, Inc. | | | 32,653 | | | | 180,898 | |
Capstead Mortgage Corp. | | | 48,953 | | | | 543,378 | |
CareTrust REIT, Inc. | | | 15,655 | | | | 198,349 | |
Catchmark Timber Trust, Inc. | | | 19,264 | | | | 222,884 | |
Cedar Realty Trust, Inc. | | | 43,319 | | | | 277,242 | |
Chambers Street Properties | | | 120,539 | | | | 958,285 | |
Chatham Lodging Trust | | | 19,622 | | | | 519,394 | |
Chesapeake Lodging Trust | | | 30,291 | | | | 923,270 | |
Colony Financial, Inc. | | | 57,316 | | | | 1,298,207 | |
CorEnergy Infrastructure Trust, Inc. | | | 23,686 | | | | 149,695 | |
Coresite Realty Corp. | | | 12,394 | | | | 563,183 | |
Cousins Properties, Inc. | | | 109,781 | | | | 1,139,527 | |
CubeSmart | | | 84,284 | | | | 1,952,017 | |
CyrusOne, Inc. | | | 26,916 | | | | 792,676 | |
CYS Investments, Inc. | | | 83,814 | | | | 647,882 | |
DCT Industrial Trust, Inc. | | | 44,985 | | | | 1,414,328 | |
DiamondRock Hospitality Co. | | | 102,034 | | | | 1,307,056 | |
DuPont Fabros Technology, Inc. | | | 32,189 | | | | 947,966 | |
Dynex Capital, Inc. | | | 28,921 | | | | 220,378 | |
Easterly Government Properties, Inc. | | | 7,143 | | | | 113,717 | |
EastGroup Properties, Inc. | | | 16,296 | | | | 916,324 | |
Education Realty Trust, Inc. | | | 24,502 | | | | 768,383 | |
EPR Properties | | | 28,923 | | | | 1,584,402 | |
Equity One, Inc. | | | 36,763 | | | | 858,048 | |
Excel Trust, Inc. | | | 32,518 | | | | 512,809 | |
FelCor Lodging Trust, Inc. | | | 72,650 | | | | 717,782 | |
First Industrial Realty Trust, Inc. | | | 55,925 | | | | 1,047,475 | |
First Potomac Realty Trust | | | 29,812 | | | | 307,064 | |
Franklin Street Properties Corp. | | | 44,899 | | | | 507,808 | |
Geo Group, Inc. | | | 37,575 | | | | 1,283,562 | |
Getty Realty Corp. | | | 12,937 | | | | 211,649 | |
Gladstone Commercial Corp. | | | 10,203 | | | | 168,962 | |
Government Properties Income Trust | | | 29,574 | | | | 548,598 | |
Gramercy Property Trust, Inc. | | | 28,979 | | | | 677,239 | |
Great Ajax Corp. | | | 2,564 | | | | 36,358 | |
Hatteras Financial Corp. | | | 49,455 | | | | 806,116 | |
Healthcare Realty Trust, Inc. | | | 50,997 | | | | 1,186,190 | |
Hersha Hospitality Trust | | | 24,901 | | | | 638,462 | |
Highwoods Properties, Inc. | | | 47,514 | | | | 1,898,184 | |
See Notes to Financial Statements.
| | | | | | |
| | | | | | | |
| | BLACKROCK INDEX FUNDS, INC. | | JUNE 30, 2015 | | 47 |
| | |
Schedule of Investments (continued) | | Master Small Cap Index Series (Percentages shown are based on Net Assets) |
| | | | | | | | |
| Common Stocks | | Shares | | | Value | |
Real Estate Investment Trusts (REITs) (concluded) | | | | | | | | |
Hudson Pacific Properties, Inc. | | | 37,852 | | | $ | 1,073,861 | |
Independence Realty Trust, Inc. | | | 10,869 | | | | 81,844 | |
InfraREIT, Inc. | | | 11,135 | | | | 315,789 | |
Inland Real Estate Corp. | | | 43,934 | | | | 413,858 | |
Invesco Mortgage Capital, Inc. | | | 63,258 | | | | 905,855 | |
Investors Real Estate Trust | | | 59,657 | | | | 425,951 | |
iStar Financial, Inc. (a) | | | 43,156 | | | | 574,838 | |
Kite Realty Group Trust | | | 42,073 | | | | 1,029,526 | |
KYTHERA Biopharmaceuticals, Inc. (a) | | | 12,976 | | | | 977,223 | |
LaSalle Hotel Properties | | | 57,289 | | | | 2,031,468 | |
Lexington Realty Trust | | | 104,634 | | | | 887,296 | |
LTC Properties, Inc. | | | 18,101 | | | | 753,002 | |
Mack-Cali Realty Corp. | | | 45,280 | | | | 834,510 | |
Medical Properties Trust, Inc. | | | 106,405 | | | | 1,394,970 | |
Monmouth Real Estate Investment Corp., Class A | | | 29,558 | | | | 287,304 | |
Monogram Residential Trust, Inc. | | | 83,929 | | | | 757,040 | |
National Health Investors, Inc. | | | 19,023 | | | | 1,185,133 | |
National Storage Affiliates Trust | | | 11,684 | | | | 144,882 | |
New Residential Investment Corp. | | | 101,338 | | | | 1,544,391 | |
New Senior Investment Group, Inc. | | | 33,136 | | | | 443,028 | |
New York Mortgage Trust, Inc. | | | 57,400 | | | | 429,352 | |
New York REIT, Inc. | | | 82,531 | | | | 821,183 | |
NexPoint Residential Trust, Inc. | | | 9,522 | | | | 127,880 | |
One Liberty Properties, Inc. | | | 6,735 | | | | 143,321 | |
Orchid Island Capital, Inc. | | | 9,240 | | | | 103,580 | |
Parkway Properties, Inc. | | | 42,744 | | | | 745,455 | |
Pebblebrook Hotel Trust | | | 36,398 | | | | 1,560,746 | |
Pennsylvania Real Estate Investment Trust | | | 35,130 | | | | 749,674 | |
PennyMac Mortgage Investment Trust (c) | | | 28,817 | | | | 502,280 | |
Physicians Realty Trust | | | 35,723 | | | | 548,705 | |
Potlatch Corp. | | | 20,581 | | | | 726,921 | |
Preferred Apartment Communities, Inc. | | | 10,638 | | | | 105,848 | |
PS Business Parks, Inc. | | | 9,857 | | | | 711,183 | |
QTS Realty Trust, Inc., Class A | | | 12,069 | | | | 439,915 | |
RAIT Financial Trust | | | 38,843 | | | | 237,331 | |
Ramco-Gershenson Properties Trust | | | 40,339 | | | | 658,332 | |
Redwood Trust, Inc. | | | 43,404 | | | | 681,443 | |
Resource Capital Corp. | | | 69,897 | | | | 270,501 | |
Retail Opportunity Investments Corp. | | | 46,969 | | | | 733,656 | |
Rexford Industrial Realty, Inc. | | | 28,271 | | | | 412,191 | |
RLJ Lodging Trust | | | 67,108 | | | | 1,998,476 | |
Rouse Properties, Inc. | | | 18,374 | | | | 300,415 | |
Sabra Health Care REIT, Inc. | | | 30,051 | | | | 773,513 | |
Saul Centers, Inc. | | | 4,925 | | | | 242,261 | |
Select Income REIT | | | 31,389 | | | | 647,869 | |
Silver Bay Realty Trust Corp. | | | 18,202 | | | | 296,511 | |
Sovran Self Storage, Inc. | | | 18,036 | | | | 1,567,509 | |
STAG Industrial, Inc. | | | 32,752 | | | | 655,040 | |
Starwood Waypoint Residential Trust | | | 19,278 | | | | 458,045 | |
STORE Capital Corp. | | | 17,271 | | | | 347,147 | |
Strategic Hotels & Resorts, Inc. (a) | | | 139,552 | | | | 1,691,370 | |
Summit Hotel Properties, Inc. | | | 45,468 | | | | 591,539 | |
Sun Communities, Inc. | | | 23,572 | | | | 1,457,457 | |
Sunstone Hotel Investors, Inc. | | | 105,974 | | | | 1,590,670 | |
Terreno Realty Corp. | | | 21,801 | | | | 429,480 | |
Trade Street Residential, Inc. | | | 8,842 | | | | 58,888 | |
UMH Properties, Inc. | | | 11,555 | | | | 113,239 | |
United Development Funding IV | | | 15,103 | | | | 264,000 | |
Universal Health Realty Income Trust | | | 4,736 | | | | 220,035 | |
Urban Edge Properties | | | 30,396 | | | | 631,933 | |
Urstadt Biddle Properties, Inc., Class A | | | 12,676 | | | | 236,788 | |
Walter Investment Management Corp. (a)(b) | | | 19,281 | | | | 440,956 | |
Washington Real Estate Investment Trust | | | 34,541 | | | | 896,339 | |
Western Asset Mortgage Capital Corp. (b) | | | 22,003 | | | | 324,984 | |
Whitestone REIT | | | 11,742 | | | | 152,881 | |
Xenia Hotels & Resorts, Inc. | | | 56,345 | | | | 1,224,940 | |
| | | | | | | | |
| | | | | | | | 81,212,507 | |
| Common Stocks | | Shares | | | Value | |
Recreational Vehicles & Boats — 0.1% | | | | | | | | |
Arctic Cat, Inc. | | | 6,448 | | | | 214,138 | |
Drew Industries, Inc. | | | 12,132 | | | | 703,899 | |
Malibu Boats, Inc. (a) | | | 8,851 | | | | 177,816 | |
Marine Products Corp. | | | 5,203 | | | | 32,467 | |
Winnebago Industries, Inc. | | | 13,657 | | | | 322,169 | |
| | | | | | | | |
| | | | | | | | 1,450,489 | |
Rental & Leasing Services: Consumer — 0.1% | | | | | | | | |
Rent-A-Center, Inc. | | | 26,759 | | | | 758,618 | |
Restaurants — 1.9% | | | | | | | | |
Biglari Holdings, Inc. (a) | | | 836 | | | | 345,895 | |
BJ’s Restaurants, Inc. (a) | | | 10,806 | | | | 523,551 | |
Bob Evans Farms, Inc. | | | 11,918 | | | | 608,414 | |
Bojangles’, Inc. (a) | | | 4,098 | | | | 97,778 | |
Bravo Brio Restaurant Group, Inc. (a) | | | 8,003 | | | | 108,441 | |
Buffalo Wild Wings, Inc. (a) | | | 9,581 | | | | 1,501,247 | |
Carrols Restaurant Group, Inc. (a) | | | 17,760 | | | | 184,704 | |
The Cheesecake Factory, Inc. | | | 24,537 | | | | 1,338,125 | |
Cracker Barrel Old Country Store, Inc. | | | 9,672 | | | | 1,442,676 | |
Dave & Buster’s Entertainment, Inc. (a) | | | 11,442 | | | | 412,942 | |
Denny’s Corp. (a) | | | 42,834 | | | | 497,303 | |
Diamond Resorts International, Inc. (a) | | | 21,411 | | | | 675,517 | |
DineEquity, Inc. | | | 8,563 | | | | 848,508 | |
El Pollo Loco Holdings, Inc. (a)(b) | | | 6,803 | | | | 140,890 | |
Ellie Mae, Inc. (a) | | | 14,867 | | | | 1,037,568 | |
Fiesta Restaurant Group, Inc. (a) | | | 13,561 | | | | 678,050 | |
The Habit Restaurants, Inc. (a) | | | 5,731 | | | | 179,323 | |
Jack in the Box, Inc. | | | 18,871 | | | | 1,663,667 | |
Jamba, Inc. (a) | | | 7,105 | | | | 110,056 | |
Kona Grill, Inc. (a) | | | 4,111 | | | | 79,794 | |
Krispy Kreme Doughnuts, Inc. (a) | | | 32,780 | | | | 631,343 | |
Noodles & Co. (a)(b) | | | 6,315 | | | | 92,199 | |
Papa John’s International, Inc. | | | 14,621 | | | | 1,105,494 | |
Papa Murphy’s Holdings, Inc. (a)(b) | | | 4,595 | | | | 95,208 | |
Popeyes Louisiana Kitchen, Inc. (a) | | | 11,647 | | | | 698,704 | |
Potbelly Corp. (a) | | | 10,843 | | | | 132,827 | |
Red Robin Gourmet Burgers, Inc. (a) | | | 7,126 | | | | 611,553 | |
Ruby Tuesday, Inc. (a) | | | 31,798 | | | | 199,373 | |
Ruth’s Hospitality Group, Inc. | | | 17,613 | | | | 283,922 | |
Shake Shack, Inc., Class A (a)(b) | | | 2,905 | | | | 175,084 | |
Sonic Corp. | | | 26,340 | | | | 758,592 | |
Texas Roadhouse, Inc. | | | 35,261 | | | | 1,319,819 | |
Zoe’s Kitchen, Inc. (a) | | | 9,704 | | | | 397,282 | |
| | | | | | | | |
| | | | | | | | 18,975,849 | |
Scientific Instruments: Control & Filter — 0.3% | | | | | | | | |
Brady Corp., Class A | | | 24,105 | | | | 596,358 | |
CIRCOR International, Inc. | | | 8,612 | | | | 469,612 | |
ESCO Technologies, Inc. | | | 13,033 | | | | 487,565 | |
The Gorman-Rupp Co. | | | 9,441 | | | | 265,103 | |
Sun Hydraulics Corp. | | | 11,318 | | | | 431,329 | |
Thermon Group Holdings, Inc. (a) | | | 16,174 | | | | 389,308 | |
Watts Water Technologies, Inc., Class A | | | 14,159 | | | | 734,144 | |
| | | | | | | | |
| | | | | | | | 3,373,419 | |
Scientific Instruments: Electrical — 0.5% | | | | | | | | |
Allied Motion Technologies, Inc. | | | 3,211 | | | | 72,119 | |
AZZ, Inc. | | | 13,028 | | | | 674,850 | |
EnerSys, Inc. | | | 22,420 | | | | 1,575,902 | |
Franklin Electric Co., Inc. | | | 23,879 | | | | 772,008 | |
GrafTech International Ltd. (a) | | | 60,881 | | | | 301,970 | |
Littelfuse, Inc. | | | 11,339 | | | | 1,075,958 | |
Preformed Line Products Co. | | | 1,464 | | | | 55,222 | |
Taser International, Inc. (a) | | | 27,020 | | | | 900,036 | |
| | | | | | | | |
| | | | | | | | 5,428,065 | |
See Notes to Financial Statements.
| | | | | | |
| | | | | | | |
| 48 | | BLACKROCK INDEX FUNDS, INC. | | JUNE 30, 2015 | | |
| | |
Schedule of Investments (continued) | | Master Small Cap Index Series (Percentages shown are based on Net Assets) |
| | | | | | | | |
| Common Stocks | | Shares | | | Value | |
Scientific Instruments: Gauges & Meters — 0.2% | | | | | | | | |
Badger Meter, Inc. | | | 7,222 | | | $ | 458,525 | |
FARO Technologies, Inc. (a) | | | 8,755 | | | | 408,859 | |
Itron, Inc. (a) | | | 19,350 | | | | 666,414 | |
Mesa Laboratories, Inc. | | | 1,491 | | | | 132,550 | |
Vishay Precision Group, Inc. (a) | | | 6,507 | | | | 97,995 | |
| | | | | | | | |
| | | | | | | | 1,764,343 | |
Scientific Instruments: Pollution Control — 0.2% | | | | | | | | |
Ceco Environmental Corp. | | | 10,878 | | | | 123,248 | |
Darling International, Inc. (a) | | | 83,414 | | | | 1,222,849 | |
Heritage-Crystal Clean, Inc. (a) | | | 6,324 | | | | 92,963 | |
Team, Inc. (a) | | | 10,438 | | | | 420,130 | |
TRC Cos., Inc. (a) | | | 8,602 | | | | 87,310 | |
U.S. Ecology, Inc. | | | 10,899 | | | | 530,999 | |
| | | | | | | | |
| | | | | | | | 2,477,499 | |
Securities Brokerage & Services — 0.4% | | | | | | | | |
BGC Partners, Inc., Class A | | | 91,794 | | | | 803,198 | |
Gain Capital Holdings, Inc. | | | 16,204 | | | | 154,910 | |
INTL FCStone, Inc. (a) | | | 7,688 | | | | 255,549 | |
Investment Technology Group, Inc. | | | 17,454 | | | | 432,859 | |
Ladenburg Thalmann Financial Services, Inc. (a) | | | 52,307 | | | | 183,075 | |
MarketAxess Holdings, Inc. | | | 18,825 | | | | 1,746,395 | |
Virtu Financial, Inc., Class A (a) | | | 9,471 | | | | 222,379 | |
| | | | | | | | |
| | | | | | | | 3,798,365 | |
Semiconductors & Components — 2.0% | |
Advanced Micro Devices, Inc. (a) | | | 319,927 | | | | 767,825 | |
Alpha & Omega Semiconductor Ltd. (a) | | | 10,991 | | | | 96,061 | |
Amkor Technology, Inc. (a) | | | 49,872 | | | | 298,235 | |
Applied Micro Circuits Corp. (a) | | | 40,636 | | | | 274,293 | |
Cavium, Inc. (a) | | | 27,898 | | | | 1,919,661 | |
Ceva, Inc. (a) | | | 10,357 | | | | 201,236 | |
Cirrus Logic, Inc. (a) | | | 32,063 | | | | 1,091,104 | |
Diodes, Inc. (a) | | | 18,764 | | | | 452,400 | |
DSP Group, Inc. (a) | | | 11,363 | | | | 117,380 | |
Emcore Corp. (a) | | | 11,880 | | | | 71,518 | |
Exar Corp. (a) | | | 19,689 | | | | 192,558 | |
Fairchild Semiconductor International, Inc. (a) | | | 58,798 | | | | 1,021,909 | |
FormFactor, Inc. (a) | | | 28,639 | | | | 263,479 | |
Inphi Corp. (a) | | | 19,333 | | | | 441,952 | |
Integrated Device Technology, Inc. (a) | | | 74,791 | | | | 1,622,965 | |
Integrated Silicon Solution, Inc. | | | 16,023 | | | | 354,749 | |
Intersil Corp., Class A | | | 66,325 | | | | 829,726 | |
IXYS Corp. | | | 12,577 | | | | 192,428 | |
Kopin Corp. (a) | | | 33,991 | | | | 117,269 | |
Lattice Semiconductor Corp. (a) | | | 59,005 | | | | 347,539 | |
MA-COM Technology Solutions Holdings, Inc. (a) | | | 11,843 | | | | 452,995 | |
MaxLinear, Inc., Class A (a) | | | 26,257 | | | | 317,710 | |
Micrel, Inc. | | | 22,314 | | | | 310,165 | |
Microsemi Corp. (a) | | | 48,021 | | | | 1,678,334 | |
Monolithic Power Systems, Inc. | | | 19,856 | | | | 1,006,898 | |
OmniVision Technologies, Inc. (a) | | | 29,269 | | | | 766,701 | |
Pericom Semiconductor Corp. | | | 11,235 | | | | 147,740 | |
PMC—Sierra, Inc. (a) | | | 88,112 | | | | 754,239 | |
Power Integrations, Inc. | | | 14,794 | | | | 668,393 | |
Rambus, Inc. (a) | | | 58,295 | | | | 844,694 | |
Semtech Corp. (a) | | | 33,514 | | | | 665,253 | |
Sigma Designs, Inc. (a) | | | 17,633 | | | | 210,362 | |
Silicon Laboratories, Inc. (a) | | | 21,496 | | | | 1,160,999 | |
Vishay Intertechnology, Inc. | | | 67,929 | | | | 793,411 | |
| | | | | | | | |
| | | | | | | | 20,452,181 | |
Semiconductors & Semiconductor Equipment — 0.2% | |
Ambarella, Inc. (a)(b) | | | 15,812 | | | | 1,623,734 | |
Cascade Microtech, Inc. (a) | | | 6,955 | | | | 105,890 | |
Xcerra Corp. (a) | | | 27,612 | | | | 209,023 | |
| | | | | | | | |
| | | | | | | | 1,938,647 | |
| Common Stocks | | Shares | | | Value | |
Shipping — 0.5% | |
Eagle Bulk Shipping, Inc. (a) | | | 10,549 | | | | 73,527 | |
Frontline Ltd. (a) | | | 54,540 | | | | 133,078 | |
GasLog Ltd. | | | 20,983 | | | | 418,611 | |
Golden Ocean Group, Ltd. (b) | | | 33,501 | | | | 128,979 | |
Gulfmark Offshore, Inc., Class A | | | 12,637 | | | | 146,589 | |
Matson, Inc. | | | 21,956 | | | | 923,030 | |
Navios Maritime Holdings, Inc. | | | 40,129 | | | | 149,280 | |
Nordic American Offshore Ltd. (b) | | | 9,448 | | | | 76,907 | |
Nordic American Tankers Ltd. | | | 45,041 | | | | 640,933 | |
Safe Bulkers, Inc. | | | 20,456 | | | | 65,868 | |
Scorpio Tankers, Inc. | | | 90,215 | | | | 910,269 | |
Ship Finance International Ltd. | | | 29,788 | | | | 486,140 | |
Teekay Tankers Ltd., Class A | | | 42,715 | | | | 282,346 | |
Tidewater, Inc. | | | 23,684 | | | | 538,337 | |
Ultrapetrol Bahamas Ltd. (a) | | | 9,205 | | | | 10,402 | |
UTI Worldwide, Inc. (a) | | | 46,442 | | | | 463,956 | |
| | | | | | | | |
| | | | | | | | 5,448,252 | |
Software — 0.4% | |
Actua Corp. (a) | | | 20,424 | | | | 291,246 | |
Castlight Health, Inc. (a)(b) | | | 16,824 | | | | 136,947 | |
Comverse, Inc. (a) | | | 11,210 | | | | 225,097 | |
Five9, Inc. (a) | | | 11,451 | | | | 59,889 | |
FleetMatics Group PLC (a) | | | 19,315 | | | | 904,522 | |
Gigamon, Inc. (a) | | | 13,859 | | | | 457,208 | |
Globant SA (a) | | | 7,676 | | | | 233,581 | |
MobileIron, Inc. (a) | | | 19,195 | | | | 113,442 | |
Model N, Inc. (a) | | | 10,497 | | | | 125,019 | |
Park City Group, Inc. (a)(b) | | | 5,314 | | | | 65,841 | |
Paycom Software, Inc. (a) | | | 16,016 | | | | 546,946 | |
Qualys, Inc. (a) | | | 12,565 | | | | 506,998 | |
Rally Software Development Corp. (a) | | | 13,080 | | | | 254,406 | |
The Rubicon Project, Inc. (a) | | | 13,046 | | | | 195,168 | |
| | | | | | | | |
| | | | | | | | 4,116,310 | |
Specialty Retail — 3.4% | |
1-800-Flowers.com, Inc., Class A (a) | | | 12,822 | | | | 134,118 | |
Abercrombie & Fitch Co., Class A | | | 34,965 | | | | 752,097 | |
America’s Car-Mart, Inc. (a) | | | 4,252 | | | | 209,709 | |
American Eagle Outfitters, Inc. | | | 98,770 | | | | 1,700,819 | |
ANN, Inc. (a) | | | 23,202 | | | | 1,120,425 | |
Asbury Automotive Group, Inc. (a) | | | 13,753 | | | | 1,246,297 | |
Ascena Retail Group, Inc. (a) | | | 70,576 | | | | 1,175,443 | |
Barnes & Noble, Inc. (a) | | | 25,497 | | | | 661,902 | |
bebe Stores, Inc. | | | 14,016 | | | | 28,032 | |
Big 5 Sporting Goods Corp. | | | 9,573 | | | | 136,032 | |
Blue Nile, Inc. (a) | | | 5,983 | | | | 181,823 | |
Boot Barn Holdings, Inc. (a) | | | 6,014 | | | | 192,448 | |
The Buckle, Inc. (b) | | | 14,272 | | | | 653,229 | |
Build-A-Bear Workshop, Inc. (a) | | | 7,363 | | | | 117,734 | |
Burlington Stores, Inc. (a) | | | 38,116 | | | | 1,951,539 | |
Caleres, Inc. | | | 22,156 | | | | 704,118 | |
The Cato Corp., Class A | | | 13,275 | | | | 514,539 | |
Chico’s FAS, Inc. | | | 71,974 | | | | 1,196,928 | |
The Children’s Place Retail Stores, Inc. | | | 10,417 | | | | 681,376 | |
Christopher & Banks Corp. (a) | | | 18,731 | | | | 75,111 | |
Citi Trends, Inc. (a) | | | 7,836 | | | | 189,631 | |
Conn’s, Inc. (a) | | | 13,844 | | | | 549,607 | |
The Container Store Group, Inc. (a)(b) | | | 8,125 | | | | 137,069 | |
Destination XL Group, Inc. (a) | | | 16,937 | | | | 84,854 | |
Express, Inc. (a) | | | 42,834 | | | | 775,724 | |
The Finish Line, Inc., Class A | | | 23,225 | | | | 646,119 | |
Five Below, Inc. (a) | | | 27,444 | | | | 1,084,861 | |
Francesca’s Holdings Corp. (a) | | | 21,498 | | | | 289,578 | |
FTD Cos., Inc. (a) | | | 9,228 | | | | 260,137 | |
Genesco, Inc. (a) | | | 12,121 | | | | 800,350 | |
Group 1 Automotive, Inc. | | | 11,791 | | | | 1,070,977 | |
See Notes to Financial Statements.
| | | | | | |
| | | | | | | |
| | BLACKROCK INDEX FUNDS, INC. | | JUNE 30, 2015 | | 49 |
| | |
Schedule of Investments (continued) | | Master Small Cap Index Series (Percentages shown are based on Net Assets) |
| | | | | | | | |
| Common Stocks | | Shares | | | Value | |
Specialty Retail (concluded) | |
Guess?, Inc. | | | 31,250 | | | $ | 599,063 | |
Haverty Furniture Cos., Inc. | | | 10,437 | | | | 225,648 | |
Hibbett Sports, Inc. (a) | | | 12,566 | | | | 585,324 | |
Lands’ End, Inc. (a) | | | 8,535 | | | | 211,924 | |
Lithia Motors, Inc., Class A | | | 11,484 | | | | 1,299,529 | |
Lumber Liquidators Holdings, Inc. (a)(b) | | | 13,714 | | | | 284,017 | |
MarineMax, Inc. (a) | | | 12,903 | | | | 303,350 | |
Mattress Firm Holding Corp. (a) | | | 10,338 | | | | 630,101 | |
The Men’s Wearhouse, Inc. | | | 24,379 | | | | 1,561,963 | |
Monro Muffler Brake, Inc. | | | 16,029 | | | | 996,363 | |
Party City Holdco, Inc. (a) | | | 12,665 | | | | 256,720 | |
The Pep Boys-Manny Moe & Jack (a) | | | 26,777 | | | | 328,554 | |
Performance Sports Group Ltd. (a) | | | 22,593 | | | | 406,674 | |
Pier 1 Imports, Inc. | | | 45,570 | | | | 575,549 | |
Regis Corp. (a) | | | 20,516 | | | | 323,332 | |
Restoration Hardware Holdings, Inc. (a) | | | 16,836 | | | | 1,643,699 | |
RetailMeNot, Inc. (a) | | | 19,413 | | | | 346,134 | |
Shoe Carnival, Inc. | | | 7,551 | | | | 217,922 | |
Shutterfly, Inc. (a) | | | 18,931 | | | | 905,091 | |
Sonic Automotive, Inc., Class A | | | 16,630 | | | | 396,293 | |
Sportsman’s Warehouse Holdings, Inc. (a) | | | 9,172 | | | | 104,286 | |
Stage Stores, Inc. | | | 16,225 | | | | 284,424 | |
Stamps.com, Inc. (a) | | | 7,216 | | | | 530,881 | |
Stein Mart, Inc. | | | 14,777 | | | | 154,715 | |
Systemax, Inc. (a) | | | 5,534 | | | | 47,814 | |
Tilly’s, Inc., Class A (a) | | | 5,419 | | | | 52,402 | |
Vitamin Shoppe, Inc. (a) | | | 15,038 | | | | 560,466 | |
Wayfair, Inc., Class A (a) | | | 10,085 | | | | 379,599 | |
Zumiez, Inc. (a) | | | 10,968 | | | | 292,078 | |
| | | | | | | | |
| | | | | | | | 33,826,541 | |
Steel — 0.2% | |
AK Steel Holding Corp. (a) | | | 89,867 | | | | 347,785 | |
Carbonite, Inc. (a) | | | 8,912 | | | | 105,251 | |
Carpenter Technology Corp. | | | 25,286 | | | | 978,063 | |
Handy & Harman Ltd. (a) | | | 1,379 | | | | 47,782 | |
Olympic Steel, Inc. | | | 4,453 | | | | 77,660 | |
Ryerson Holding Corp. (a) | | | 5,393 | | | | 49,076 | |
Schnitzer Steel Industries, Inc., Class A | | | 13,217 | | | | 230,901 | |
TimkenSteel Corp. | | | 20,008 | | | | 540,016 | |
| | | | | | | | |
| | | | | | | | 2,376,534 | |
Technology: Miscellaneous — 0.2% | |
Benchmark Electronics, Inc. (a) | | | 26,387 | | | | 574,709 | |
CTS Corp. | | | 16,741 | | | | 322,599 | |
Fabrinet (a) | | | 17,858 | | | | 334,481 | |
Kimball Electronics, Inc. (a) | | | 14,602 | | | | 213,043 | |
Pendrell Corp. (a) | | | 84,978 | | | | 116,420 | |
Plexus Corp. (a) | | | 16,931 | | | | 742,932 | |
| | | | | | | | |
| | | | | | | | 2,304,184 | |
Telecommunications Equipment — 0.2% | |
Applied Optoelectronics, Inc. (a) | | | 7,624 | | | | 132,353 | |
CalAmp Corp. (a) | | | 18,352 | | | | 335,107 | |
Clearfield, Inc. (a)(b) | | | 5,995 | | | | 95,380 | |
Inteliquent, Inc. | | | 16,985 | | | | 312,524 | |
Knowles Corp. (a) | | | 42,671 | | | | 772,345 | |
Oclaro, Inc. (a) | | | 50,410 | | | | 113,927 | |
Ubiquiti Networks, Inc. | | | 15,422 | | | | 492,193 | |
Vocera Communications, Inc. (a) | | | 13,157 | | | | 150,648 | |
| | | | | | | | |
| | | | | | | | 2,404,477 | |
Textile Products — 0.1% | |
Culp, Inc. | | | 5,145 | | | | 159,495 | |
Interface, Inc. | | | 33,294 | | | | 834,015 | |
Unifi, Inc. (a) | | | 7,579 | | | | 253,896 | |
| | | | | | | | |
| | | | | | | | 1,247,406 | |
| Common Stocks | | Shares | | | Value | |
Textiles Apparel & Shoes — 0.9% | |
Cherokee, Inc. | | | 4,164 | | | | 117,342 | |
Columbia Sportswear Co. | | | 14,373 | | | | 868,992 | |
Crocs, Inc. (a) | | | 38,851 | | | | 571,498 | |
Deckers Outdoor Corp. (a) | | | 17,420 | | | | 1,253,717 | |
G-III Apparel Group Ltd. (a) | | | 20,063 | | | | 1,411,432 | |
Iconix Brand Group, Inc. (a) | | | 24,184 | | | | 603,874 | |
Oxford Industries, Inc. | | | 7,395 | | | | 646,693 | |
Perry Ellis International, Inc. (a) | | | 6,165 | | | | 146,542 | |
Quiksilver, Inc. (a)(b) | | | 68,459 | | | | 45,375 | |
Sequential Brands Group, Inc. (a) | | | 12,619 | | | | 192,944 | |
Steven Madden Ltd. (a) | | | 28,369 | | | | 1,213,626 | |
Superior Uniform Group, Inc. | | | 3,539 | | | | 58,535 | |
Tumi Holdings, Inc. (a) | | | 28,277 | | | | 580,244 | |
Vera Bradley, Inc. (a) | | | 10,708 | | | | 120,679 | |
Vince Holding Corp. (a) | | | 7,702 | | | | 92,270 | |
Weyco Group, Inc. | | | 3,141 | | | | 93,665 | |
Wolverine World Wide, Inc. | | | 52,111 | | | | 1,484,121 | |
| | | | | | | | |
| | | | | | | | 9,501,549 | |
Tobacco — 0.2% | |
Universal Corp. | | | 11,431 | | | | 655,225 | |
Vector Group Ltd. | | | 40,810 | | | | 957,403 | |
| | | | | | | | |
| | | | | | | | 1,612,628 | |
Toys — 0.0% | |
JAKKS Pacific, Inc. (a)(b) | | | 10,261 | | | | 101,481 | |
Transportation Miscellaneous — 0.4% | |
Echo Global Logistics, Inc. (a) | | | 15,083 | | | | 492,611 | |
Hub Group, Inc., Class A (a) | | | 18,145 | | | | 731,969 | |
Scorpio Bulkers, Inc. (a) | | | 89,967 | �� | | | 146,646 | |
Textainer Group Holdings Ltd. | | | 11,158 | | | | 290,220 | |
Wesco Aircraft Holdings, Inc. (a) | | | 30,741 | | | | 465,726 | |
XPO Logistics, Inc. (a) | | | 36,060 | | | | 1,629,191 | |
| | | | | | | | |
| | | | | | | | 3,756,363 | |
Truckers — 0.8% | |
ArcBest Corp. | | | 13,218 | | | | 420,332 | |
Celadon Group, Inc. | | | 13,803 | | | | 285,446 | |
Con-way, Inc. | | | 29,037 | | | | 1,114,150 | |
Covenant Transportation Group, Inc., Class A (a) | | | 5,967 | | | | 149,533 | |
Forward Air Corp. | | | 15,557 | | | | 813,009 | |
FRP Holdings, Inc. (a) | | | 3,336 | | | | 108,187 | |
Heartland Express, Inc. | | | 25,301 | | | | 511,839 | |
Knight Transportation, Inc. | | | 31,484 | | | | 841,882 | |
Marten Transport Ltd. | | | 11,722 | | | | 254,367 | |
PAM Transportation Services, Inc. (a) | | | 1,577 | | | | 91,545 | |
Quality Distribution, Inc. (a) | | | 14,147 | | | | 218,713 | |
Roadrunner Transportation Systems, Inc. (a) | | | 14,344 | | | | 370,075 | |
Saia, Inc. (a) | | | 12,718 | | | | 499,690 | |
Swift Transportation Co. (a) | | | 44,675 | | | | 1,012,782 | |
Universal Truckload Services, Inc. | | | 4,085 | | | | 89,707 | |
USA Truck, Inc. (a) | | | 4,904 | | | | 104,112 | |
Werner Enterprises, Inc. | | | 22,384 | | | | 587,580 | |
YRC Worldwide, Inc. (a) | | | 16,361 | | | | 212,366 | |
| | | | | | | | |
| | | | | | | | 7,685,315 | |
Utilities: Electrical — 1.6% | |
ALLETE, Inc. | | | 24,588 | | | | 1,140,637 | |
Atlantic Power Corp. | | | 61,001 | | | | 187,883 | |
Avista Corp. | | | 31,475 | | | | 964,709 | |
Black Hills Corp. | | | 22,593 | | | | 986,184 | |
Cleco Corp. | | | 30,410 | | | | 1,637,579 | |
El Paso Electric Co. | | | 20,312 | | | | 704,014 | |
The Empire District Electric Co. | | | 21,774 | | | | 474,673 | |
Genie Energy Ltd. (a) | | | 6,177 | | | | 64,673 | |
IDACORP, Inc. | | | 25,382 | | | | 1,424,946 | |
MGE Energy, Inc. | | | 17,393 | | | | 673,631 | |
See Notes to Financial Statements.
| | | | | | |
| | | | | | | |
| 50 | | BLACKROCK INDEX FUNDS, INC. | | JUNE 30, 2015 | | |
| | |
Schedule of Investments (continued) | | Master Small Cap Index Series (Percentages shown are based on Net Assets) |
| | | | | | | | |
| Common Stocks | | Shares | | | Value | |
Utilities: Electrical (concluded) | |
NorthWestern Corp. | | | 23,705 | | | $ | 1,155,619 | |
NRG Yield, Inc., Class A | | | 17,852 | | | | 392,566 | |
NRG Yield, Inc., Class C | | | 16,972 | | | | 371,517 | |
Otter Tail Corp. | | | 18,744 | | | | 498,590 | |
Pattern Energy Group, Inc. | | | 25,792 | | | | 731,977 | |
PNM Resources, Inc. | | | 40,340 | | | | 992,364 | |
Portland General Electric Co. | | | 39,757 | | | | 1,318,342 | |
Spark Energy, Inc., Class A | | | 1,500 | | | | 23,640 | |
Talen Energy Corp. (a) | | | 41,773 | | | | 716,825 | |
UIL Holdings Corp. | | | 28,637 | | | | 1,312,147 | |
Unitil Corp. | | | 6,871 | | | | 226,880 | |
| | | | | | | | |
| | | | | | | | 15,999,396 | |
Utilities: Gas Distributors — 0.8% | |
Chesapeake Utilities Corp. | | | 7,660 | | | | 412,491 | |
The Laclede Group, Inc. | | | 21,932 | | | | 1,141,780 | |
New Jersey Resources Corp. | | | 43,227 | | | | 1,190,904 | |
Northwest Natural Gas Co. | | | 13,463 | | | | 567,869 | |
Piedmont Natural Gas Co., Inc. | | | 39,560 | | | | 1,396,864 | |
South Jersey Industries, Inc. | | | 34,515 | | | | 853,556 | |
Southwest Gas Corp. | | | 23,663 | | | | 1,259,108 | |
WGL Holdings, Inc. | | | 25,184 | | | | 1,367,239 | |
| | | | | | | | |
| | | | | | | | 8,189,811 | |
Utilities: Miscellaneous — 0.1% | |
Ormat Technologies, Inc. | | | 18,729 | | | | 705,709 | |
Utilities: Telecommunications — 1.0% | |
8x8, Inc. (a) | | | 44,425 | | | | 398,048 | |
Atlantic Tele-Network, Inc. | | | 5,110 | | | | 352,999 | |
Boingo Wireless, Inc. (a) | | | 18,280 | | | | 150,993 | |
Cincinnati Bell, Inc. (a) | | | 106,871 | | | | 408,247 | |
Cogent Communications Group, Inc. | | | 23,125 | | | | 782,550 | |
Consolidated Communications Holdings, Inc. | | | 25,390 | | | | 533,444 | |
Fairpoint Communications, Inc. (a) | | | 10,382 | | | | 189,160 | |
General Communication, Inc., Class A (a) | | | 17,845 | | | | 303,543 | |
Globalstar, Inc. (a)(b) | | | 239,059 | | | | 504,414 | |
GTT Communications, Inc. (a) | | | 12,402 | | | | 296,036 | |
Hawaiian Telcom Holdco, Inc. (a) | | | 5,377 | | | | 140,340 | |
IDT Corp., Class B | | | 8,472 | | | | 153,174 | |
inContact, Inc. (a) | | | 31,193 | | | | 307,875 | |
Iridium Communications, Inc. (a) | | | 41,893 | | | | 380,807 | |
j2 Global, Inc. | | | 24,305 | | | | 1,651,282 | |
Lumos Networks Corp. | | | 11,340 | | | | 167,719 | |
NeuStar, Inc., Class A (a) | | | 9,676 | | | | 282,636 | |
NTELOS Holdings Corp. (a) | | | 8,432 | | | | 38,956 | |
ORBCOMM, Inc. (a) | | | 30,248 | | | | 204,174 | |
Premiere Global Services, Inc. (a) | | | 23,525 | | | | 242,072 | |
Shenandoah Telecommunications Co. | | | 12,205 | | | | 417,777 | |
Spok Holdings, Inc. | | | 11,299 | | | | 190,275 | |
Straight Path Communications, Inc., Class B (a) | | | 4,762 | | | | 156,146 | |
Vonage Holdings Corp. (a) | | | 94,096 | | | | 462,011 | |
West Corp. | | | 26,271 | | | | 790,757 | |
Windstream Holdings, Inc. | | | 50,608 | | | | 322,879 | |
| | | | | | | | |
| | | | | | | | 9,828,314 | |
| Common Stocks | | Shares | | | Value | |
Utilities: Water — 0.2% | |
American States Water Co. | | | 19,133 | | | | 715,383 | |
Artesian Resources Corp., Class A | | | 3,795 | | | | 80,036 | |
California Water Service Group | | | 24,052 | | | | 549,588 | |
Connecticut Water Service, Inc. | | | 5,618 | | | | 191,911 | |
Consolidated Water Co. Ltd. | | | 7,061 | | | | 88,969 | |
Middlesex Water Co. | | | 7,960 | | | | 179,578 | |
SJW Corp. | | | 8,005 | | | | 245,673 | |
York Water Co. | | | 6,555 | | | | 136,737 | |
| | | | | | | | |
| | | | | | | | 2,187,875 | |
| Total Common Stocks — 94.7% | | | | | | | 950,900,569 | |
| | | | | | | | |
| | | | | | | | | |
| | |
| Other Interests (d) — 0.0% | | Beneficial
Interest
(000) | | | | |
Gerber Scientific, Inc. | | $ | 13 | | | | 128 | |
| | | | | | | | |
| | | | | | | | | |
| | |
| Rights | | Shares | | | | |
Health Care Management Services — 0.0% | | | | | | | | |
Bioscrip, Inc. (a) | | | 105 | | | | — | |
Utilities: Telecommunications — 0.0% | | | | | | | | |
Leap Wireless, CVR (a) | | | 28,200 | | | | 71,064 | |
| Total Rights — 0.0% | | | | | | | 71,064 | |
| | | | | | | | |
| | | | | | | | | |
| | |
| Warrants (e) — 0.0% | | | | | | |
Magnum Hunter Resources Corp., (Issued 10/15/13, 1 Share for 10 Warrant, Expires 4/15/16, Strike Price $8.50) | | | 7,791 | | | | — | |
Total Long-Term Investments
(Cost — $677,252,650) — 94.7% | | | | | | | 950,971,761 | |
| | | | | | | | |
| | | | | | | | | |
| | |
| Short-Term Securities | | | | | | |
BlackRock Liquidity Funds, TempFund, Institutional Class, 0.07% (c)(f) | | | 43,745,299 | | | | 43,745,299 | |
| | |
| | | Beneficial
Interest
(000) | | | | |
BlackRock Liquidity Series, LLC, Money Market Series, 0.23% (c)(f)(g) | | $ | 16,414 | | | | 16,414,073 | |
Total Short-Term Securities
(Cost — $60,159,372) — 6.0% | | | | | | | 60,159,372 | |
| Total Investments (Cost — $737,412,022) — 100.7% | | | | 1,011,131,133 | |
| Liabilities in Excess of Other Assets — (0.7)% | | | | | | | (6,749,880 | ) |
| | | | | | | | |
Net Assets — 100.0% | | | | | | $ | 1,004,381,253 | |
| | | | | | | | |
| | |
| Notes to Schedule of Investments |
| (a) | | Non-income producing security. |
| (b) | | Security, or a portion of security, is on loan. |
See Notes to Financial Statements.
| | | | | | |
| | | | | | | |
| | BLACKROCK INDEX FUNDS, INC. | | JUNE 30, 2015 | | 51 |
| | |
Schedule of Investments (continued) | | Master Small Cap Index Series |
| (c) | | During the six months ended June 30, 2015, investments in issuers considered to be affiliates of the Series for purposes of Section 2(a)(3) of the 1940 Act were as follows: |
| | | | | | | | | | | | | | | | | | | | | | | | |
| Affiliate | | Shares/
Beneficial
Interest Held at
December 31, 2014 | | | Shares/
Beneficial
Interest
Purchased | | | Shares/
Beneficial
Interest
Sold | | | Shares/
Beneficial
Interest Held at
June 30, 2015 | | | Value at
June 30, 2015 | | | Income | |
BlackRock Liquidity Funds,TempFund, Institutional Class | | | 14,055,813 | | | | 29,689,486 | 1 | | | — | | | | 43,745,299 | | | $ | 43,745,299 | | | $ | 14,517 | |
BlackRock Liquidity Series, LLC, Money Market Series | | $ | 18,352,402 | | | | — | | | $ | (1,938,329 | )2 | | $ | 16,414,073 | | | $ | 16,414,073 | | | $ | 880,900 | 3 |
PennyMac Financial Services, Inc. | | | 5,912 | | | | — | | | | — | | | | 5,912 | | | $ | 107,125 | | | | — | |
PennyMac Mortgage Investment Trust | | | 28,817 | | | | — | | | | — | | | | 28,817 | | | $ | 502,280 | | | $ | 17,578 | |
1 Represents net shares purchased. | |
2 Represents beneficial interest sold. | |
3 Represents securities lending income earned from reinvestment of cash collateral from loaned securities, net of fees, and other payments to and from borrowers of securities, and less the collateral investment expenses. | |
| (d) | | Other interests represent beneficial interests in liquidation trusts and other reorganization or private entities. |
| (e) | | Warrants entitle the Series to purchase a predetermined number of shares of common stock and are non-income producing. The purchase price and number of shares are subject to adjustment under certain conditions until the expiration date, if any. |
| (f) | | Represents the current yield as of report date. |
| (g) | | Security was purchased with the cash collateral from loaned securities. The Series may withdraw up to 25% of its investment daily, although the manager of the BlackRock Liquidity Series, LLC, Money Market Series, in its sole discretion, may permit an investor to withdraw more than 25% on any one day. |
| • | | As of June 30, 2015, financial futures contracts outstanding were as follows: |
| | | | | | | | | | | | | | | | |
Contracts
Long | | | Issue | | Exchange | | Expiration | | Notional
Value | | | Unrealized
Depreciation | |
| | 319 | | | Russell 2000 Mini Index | | ICE Futures U.S. Indicies | | September 2015 | | $ | 39,887,760 | | | $ | (419,342 | ) |
| • | | Fair Value Measurements — Various inputs are used in determining the fair value of investments and derivative financial instruments. These inputs to valuation techniques are categorized into a disclosure hierarchy consisting of three broad levels for financial statement purposes. The hierarchy gives the highest priority to unadjusted quoted prices in active markets for identical assets or liabilities (Level 1 measurements) and the lowest priority to unobservable inputs (Level 3 measurements). Accordingly, the degree of judgment exercised in determining fair value is greatest for instruments categorized in Level 3. The inputs used to measure fair value may fall into different levels of the fair value hierarchy. In such cases, for disclosure purposes, the fair value hierarchy classification is determined based on the lowest level input that is significant to the fair value measurement in its entirety. The categorization of a value determined for investments and derivative financial instruments is based on the pricing transparency of the investment and derivative financial instruments and is not necessarily an indication of the risks associated with investing in those securities. The three levels of the fair value hierarchy are as follows: |
| | • | | Level 1 — unadjusted quoted prices in active markets/exchanges for identical assets or liabilities that the Series has the ability to access |
| | • | | Level 2 — other observable inputs (including, but not limited to, quoted prices for similar assets or liabilities in markets that are active, quoted prices for identical or similar assets or liabilities in markets that are not active, inputs other than quoted prices that are observable for the assets or liabilities (such as interest rates, yield curves, volatilities, prepayment speeds, loss severities, credit risks and default rates) or other market-corroborated inputs) |
| | • | | Level 3 — unobservable inputs based on the best information available in the circumstances, to the extent observable inputs are not available (including the Series’ own assumptions used in determining the fair value of investments and derivative financial instruments) |
Changes in valuation techniques may result in transfers into or out of an assigned level within the disclosure hierarchy. In accordance with the Series’ policy, transfers between different levels of the fair value disclosure hierarchy are deemed to have occurred as of the beginning of the reporting period. For information about the Series’ policy regarding valuation of investments and derivative financial instruments, refer to Note 2 of the Notes to Financial Statements.
As of June 30, 2015, the following tables summarize the Series’ investments and derivative financial instruments categorized in the disclosure hierarchy:
| | | | | | | | | | | | | | | | |
| | | Level 1 | | | Level 2 | | | Level 3 | | | Total | |
Assets: | | | | | | | | | | | | | | | | |
| Investments: | | | | | | | | | | | | | | | | |
Long-Term Investments4 | | | | | | | | | | | | | | | | |
Common Stocks | | $ | 950,796,702 | | | $ | 73,837 | | | $ | 30,030 | | | $ | 950,900,569 | |
Other Interests | | | — | | | | — | | | | 128 | | | | 128 | |
Rights | | | — | | | | — | | | | 71,064 | | | | 71,064 | |
Short-Term Securities | | | 43,745,299 | | | | 16,414,073 | | | | — | | | | 60,159,372 | |
| | | | |
Total | | $ | 994,542,001 | | | $ | 16,487,910 | | | $ | 101,222 | | | $ | 1,011,131,133 | |
| | | | |
4 See above Schedule of Investments for values in each sector. | |
| | | Level 1 | | | Level 2 | | | Level 3 | | | Total | |
| Derivative Financial Instruments 5 | | | | | | | | | | | | | | | | |
Liabilities: | | | | | | | | | | | | | | | | |
Equity contracts | | $ | (419,342 | ) | | | — | | | | — | | | $ | (419,342 | ) |
5 Derivative financial instruments are financial futures contracts, which are valued at the unrealized appreciation (depreciation) on the instrument. | |
See Notes to Financial Statements.
| | | | | | |
| | | | | | | |
| 52 | | BLACKROCK INDEX FUNDS, INC. | | JUNE 30, 2015 | | |
| | |
Schedule of Investments (concluded) | | Master Small Cap Index Series |
| | | | | | | | | | | | | | | | |
The Series may hold assets and/or liabilities in which the fair value approximates the carrying amount for financial statement purposes. As of June 30, 2015, such assets and/or liabilities are categorized within the disclosure hierarchy as follows: | |
| | | Level 1 | | | Level 2 | | | Level 3 | | | Total | |
Assets: | | | | | | | | | | | | | | | | |
Cash pledged for financial futures contracts | | $ | 1,937,400 | | | | — | | | | — | | | | 1,937,400 | |
Liabilities: | | | | | | | | | | | | | | | | |
Bank overdraft | | | — | | | $ | (1,404,470 | ) | | | — | | | $ | (1,404,470 | ) |
Collateral on securities loaned at value | | | — | | | | (16,414,073 | ) | | | — | | | | (16,414,073 | ) |
| | | | |
Total | | $ | 1,937,400 | | | $ | (17,818,543 | ) | | | — | | | $ | (15,881,143 | ) |
| | | | |
During the six months ended June 30, 2015, there were no transfers between levels.
See Notes to Financial Statements.
| | | | | | |
| | | | | | | |
| | BLACKROCK INDEX FUNDS, INC. | | JUNE 30, 2015 | | 53 |
| | |
| Statements of Assets and Liabilities | | |
| | | | | | | | |
| June 30, 2015 (Unaudited) | | Master
International
Index Series | | | Master
Small Cap
Index Series | |
| | | | | | | | |
| Assets | | | | | | | | |
Investments at value — unaffiliated1,2 | | $ | 3,612,929,755 | | | $ | 950,362,356 | |
Investments at value — affiliated3 | | | 13,596,139 | | | | 60,768,777 | |
Cash pledged for financial futures contracts | | | 3,548,560 | | | | 1,937,400 | |
Foreign currency at value4 | | | 72,427,156 | | | | — | |
| Receivables: | | | | | | | | |
Dividends | | | 11,015,106 | | | | 1,095,966 | |
Contributions from investors | | | 5,464,639 | | | | 13,864,639 | |
Investments sold | | | 88,732 | | | | 102,361,846 | |
Securities lending income — affiliated | | | 11,834 | | | | 163,170 | |
Variation margin receivable on financial futures contracts | | | — | | | | 191,247 | |
Prepaid expenses | | | 2,170 | | | | 1,506 | |
| | | | |
Total assets | | | 3,719,084,091 | | | | 1,130,746,907 | |
| | | | |
| | | | | | | | |
| Liabilities | | | | | | | | |
Bank overdraft | | | — | | | | 1,404,470 | |
| Payables: | | | | | | | | |
Investments purchased | | | 20,205,622 | | | | 98,792,961 | |
Withdrawals to investors | | | 10,884,541 | | | | 9,552,965 | |
Investment advisory fees | | | 30,582 | | | | 6,253 | |
Other affiliates | | | 5,991 | | | | 3,980 | |
Directors’ fees | | | 4,662 | | | | 2,463 | |
Collateral on securities loaned at value | | | 3,524,062 | | | | 16,414,073 | |
Variation margin payable on financial futures contracts | | | 2,280,281 | | | | — | |
Other accrued expenses | | | 649,002 | | | | 188,489 | |
| | | | |
Total liabilities | | | 37,584,743 | | | | 126,365,654 | |
| | | | |
Net Assets | | $ | 3,681,499,348 | | | $ | 1,004,381,253 | |
| | | | |
| | | | | | | | |
| Net Assets Consist of | | | | | | | | |
Investors’ capital | | $ | 3,437,048,886 | | | $ | 731,081,484 | |
Net unrealized appreciation (depreciation) | | | 244,450,462 | | | | 273,299,769 | |
| | | | |
Net Assets | | $ | 3,681,499,348 | | | $ | 1,004,381,253 | |
| | | | |
1 Investments at cost — unaffiliated | | $ | 3,367,954,960 | | | $ | 676,566,112 | |
2 Securities loaned at value | | $ | 3,270,116 | | | $ | 13,307,033 | |
3 Investments at cost — affiliated | | $ | 13,596,139 | | | $ | 60,845,910 | |
4 Foreign currency at cost | | $ | 72,347,724 | | | | — | |
| | | | | | |
| See Notes to Financial Statements. | | | | |
| | | | | | | |
| 54 | | BLACKROCK INDEX FUNDS, INC. | | JUNE 30, 2015 | | |
| | | | | | | | |
| Six Months Ended June 30, 2015 (Unaudited) | | Master
International
Index Series | | | Master
Small Cap
Index Series | |
| | | | | | | | |
| Investment Income | | | | | | | | |
Dividends — unaffiliated | | $ | 70,421,219 | | | $ | 5,117,141 | |
Securities lending — affiliated — net | | | 138,285 | | | | 880,900 | |
Dividends — affiliated | | | 6,524 | | | | 32,095 | |
Foreign taxes withheld | | | (8,644,069 | ) | | | (4,373 | ) |
| | | | |
Total income | | | 61,921,959 | | | | 6,025,763 | |
| | | | |
| | | | | | | | |
| Expenses | | | | | | | | |
Investment advisory | | | 157,412 | | | | 45,135 | |
Accounting services | | | 274,378 | | | | 82,071 | |
Custodian | | | 241,446 | | | | 100,783 | |
Professional | | | 47,155 | | | | 35,659 | |
Directors | | | 35,545 | | | | 12,226 | |
Printing | | | 10,871 | | | | 10,057 | |
Miscellaneous | | | 41,142 | | | | 22,407 | |
| | | | |
Total expenses | | | 807,949 | | | | 308,338 | |
Less fees waived and/or reimbursed by the Manager | | | (5,074 | ) | | | (12,825 | ) |
| | | | |
Total expenses after fees waived and/or reimbursed | | | 802,875 | | | | 295,513 | |
| | | | |
Net investment income | | | 61,119,084 | | | | 5,730,250 | |
| | | | |
| | | | | | | | |
| Realized and Unrealized Gain (Loss) | | | | | | | | |
Net realized gain (loss) from: | | | | | | | | |
Investments | | | (16,346,476 | ) | | | 29,806,312 | |
Financial futures contracts | | | 6,393,154 | | | | 1,394,002 | |
Foreign currency transactions | | | (2,596,801 | ) | | | (22 | ) |
| | | | |
| | | (12,550,123 | ) | | | 31,200,292 | |
| | | | |
Net change in unrealized appreciation (depreciation) on: | | | | | | | | |
Investments — unaffiliated | | | 97,457,255 | | | | 8,560,375 | |
Investments — affiliated | | | — | | | | (100,624 | ) |
Financial futures contracts | | | (2,186,124 | ) | | | (759,905 | ) |
Foreign currency translations | | | 478,850 | | | | — | |
| | | | |
| | | 95,749,981 | | | | 7,699,846 | |
| | | | |
Net realized and unrealized gain | | | 83,199,858 | | | | 38,900,138 | |
| | | | |
Net Increase in Net Assets Resulting from Operations | | $ | 144,318,942 | | | $ | 44,630,388 | |
| | | | |
| | | | | | |
| See Notes to Financial Statements. | | | | |
| | | | | | | |
| | BLACKROCK INDEX FUNDS, INC. | | JUNE 30, 2015 | | 55 |
| | |
| Statements of Changes in Net Assets | | |
| | | | | | | | |
| | | Master International Index Series | |
| Increase (Decrease) in Net Assets: | | Six Months Ended
June 30,
2015
(Unaudited) | | | Year Ended
December 31,
2014 | |
| | | | | | | | |
| Operations | | | | | | | | |
Net investment income | | $ | 61,119,084 | | | $ | 39,593,185 | |
Net realized loss | | | (12,550,123 | ) | | | (10,016,117 | ) |
Net change in unrealized appreciation (depreciation) | | | 95,749,981 | | | | (154,439,873 | ) |
| | | | |
Net increase (decrease) in net assets resulting from operations | | | 144,318,942 | | | | (124,862,805 | ) |
| | | | |
| | | | | | | | |
| Capital Transactions | | | | | | | | |
Proceeds from contributions | | | 1,297,775,878 | | | | 2,104,755,672 | |
Value of withdrawals | | | (430,956,711 | ) | | | (322,345,637 | ) |
| | | | |
Net increase in net assets derived from capital transactions | | | 866,819,167 | | | | 1,782,410,035 | |
| | | | |
| | | | | | | | |
| Net Assets | | | | | | | | |
Total increase in net assets | | | 1,011,138,109 | | | | 1,657,547,230 | |
Beginning of period | | | 2,670,361,239 | | | | 1,012,814,009 | |
| | | | |
End of period | | $ | 3,681,499,348 | | | $ | 2,670,361,239 | |
| | | | |
| |
| | | Master Small Cap Index Series | |
| Increase (Decrease) in Net Assets: | | Six Months Ended June 30,
2015
(Unaudited) | | | Year Ended
December 31,
2014 | |
| | | | | | | | |
| Operations | | | | | | | | |
Net investment income | | $ | 5,730,250 | | | $ | 10,354,007 | |
Net realized gain | | | 31,200,292 | | | | 53,378,759 | |
Net change in unrealized appreciation (depreciation) | | | 7,699,846 | | | | (29,791,650 | ) |
| | | | | | | | |
Net increase in net assets resulting from operations | | | 44,630,388 | | | | 33,941,116 | |
| | | | | | | | |
| | | | | | | | |
| Capital Transactions | | | | | | | | |
Proceeds from contributions | | | 353,987,925 | | | | 181,052,489 | |
Value of withdrawals | | | (95,171,966 | ) | | | (373,456,979 | ) |
| | | | | | | | |
Net increase (decrease) in net assets derived from capital transactions | | | 258,815,959 | | | | (192,404,490 | ) |
| | | | | | | | |
| | | | | | | | |
| Net Assets | | | | | | | | |
Total increase (decrease) in net assets | | | 303,446,347 | | | | (158,463,374 | ) |
Beginning of period | | | 700,934,906 | | | | 859,398,280 | |
| | | | | | | | |
End of period | | $ | 1,004,381,253 | | | $ | 700,934,906 | |
| | | | | | | | |
| | | | | | |
| See Notes to Financial Statements. | | | | |
| | | | | | | |
| 56 | | BLACKROCK INDEX FUNDS, INC. | | JUNE 30, 2015 | | |
| | |
| Financial Highlights | | Master International Index Series |
| | | | | | | | | | | | | | | | | | | | | | | | |
| | | Six Months Ended
June 30,
2015
(Unaudited) | | | Year Ended December 31, | |
| | | | 2014 | | | 2013 | | | 2012 | | | 2011 | | | 2010 | |
| | | | | | | | | | | | | | | | | | | | | | | | |
| Total Return | | | | | | | | | | | | | | | | | | | | | | | | |
Total Return | | | 6.34%1 | | | | (6.02)% | | | | 21.94% | | | | 19.01% | | | | (12.34)% | | | | 7.66% | |
| | | | |
| | | | | | | | | | | | | | | | | | | | | | | | |
| Ratios to Average Net Assets | | | | | | | | | | | | | | | | | | | | | | | | |
Total expenses | | | 0.05%2 | | | | 0.07% | | | | 0.07% | | | | 0.06% | | | | 0.08% | | | | 0.11% | |
| | | | |
Total expenses after fees waived and/or reimbursed and paid indirectly | | | 0.05%2 | | | | 0.07% | | | | 0.07% | | | | 0.06% | | | | 0.08% | | | | 0.10% | |
| | | | |
Net investment income | | | 3.88%2 | | | | 3.20% | | | | 2.97% | | | | 3.36% | | | | 3.38% | | | | 2.73% | |
| | | | |
| | | | | | | | | | | | | | | | | | | | | | | | |
| Supplemental Data | | | | | | | | | | | | | | | | | | | | | | | | |
Net assets, end of period (000) | | | $3,684,194 | | | | $2,670,361 | | | | $1,012,814 | | | | $758,144 | | | | $855,781 | | | | $922,700 | |
| | | | |
Portfolio turnover rate | | | 4% | | | | 6% | | | | 8% | | | | 21% | | | | 6% | | | | 8% | |
| | | | |
Master Small Cap Index Series
| | | | | | | | | | | | | | | | | | | | | | | | |
| | | Six Months Ended
June 30,
2015
(Unaudited) | | | Year Ended December 31, | |
| | | | 2014 | | | 2013 | | | 2012 | | | 2011 | | | 2010 | |
| | | | | | | | | | | | | | | | | | | | | | | | |
| Total Return | | | | | | | | | | | | | | | | | | | | | | | | |
Total Return | | | 4.96%1 | | | | 5.05% | | | | 39.11% | | | | 16.52% | | | | (4.30)% | | | | 27.19% | |
| | | | |
| | | | | | | | | | | | | | | | | | | | | | | | |
| Ratios to Average Net Assets | | | | | | | | | | | | | | | | | | | | | | | | |
Total expenses | | | 0.07%2 | | | | 0.09% | | | | 0.07% | | | | 0.14% | | | | 0.09% | | | | 0.12% | |
| | | | | | | | | | | | | | | | | | | | | | | | |
Total expenses after fees waived and/or reimbursed and paid indirectly | | | 0.07%2 | | | | 0.08% | | | | 0.06% | | | | 0.08% | | | | 0.07% | | | | 0.08% | |
| | | | |
Net investment income | | | 1.27%2 | | | | 1.45% | | | | 1.46% | | | | 2.13% | | | | 1.46% | | | | 1.27% | |
| | | | |
| | | | | | | | | | | | | | | | | | | | | | | | |
| Supplemental Data | | | | | | | | | | | | | | | | | | | | | | | | |
Net assets, end of period (000) | | | $ 1,004,381 | | | | $ 700,935 | | | | $ 859,398 | | | | $ 581,771 | | | | $ 529,054 | | | | $ 338,172 | |
| | | | |
Portfolio turnover rate | | | 17% | | | | 21% | | | | 22% | | | | 68% | | | | 31% | | | | 42% | |
| | | | |
| | 1 | | Aggregate total return. |
| | | | | | |
| See Notes to Financial Statements. | | | | |
| | | | | | | |
| | BLACKROCK INDEX FUNDS, INC. | | JUNE 30, 2015 | | 57 |
| | |
| Notes to Financial Statements (Unaudited) | | Quantitative Master Series LLC |
1. Organization:
Master International Index Series (“Master International Index”) and Master Small Cap Index Series (“Master Small Cap Index”) (collectively, the “Series”, or individually, a “Series”) are a series of Quantitative Master Series LLC (the “Master LLC”) which is registered under the Investment Company Act of 1940, as amended (the “1940 Act”), as an open-end management investment company. The Master LLC’s Limited Liability Company Agreement permits the Board of Directors of the Master LLC (the “Board”) to issue non-transferable interests, subject to certain limitations.
2. Significant Accounting Policies:
The Series’ financial statements are prepared in conformity with accounting principles generally accepted in the United States of America (“U.S. GAAP”), which may require management to make estimates and assumptions that affect the reported amounts of assets and liabilities in the financial statements and the reported amounts of increases and decreases in net assets from operations during the reporting period. Actual results could differ from those estimates. The Series is considered an investment company under U.S. GAAP and follows the accounting and reporting guidance applicable to investment companies. The following is a summary of significant accounting policies followed by the Series:
Valuation: The Series’ investments are valued at fair value as of the close of trading on the New York Stock Exchange (“NYSE”) (generally 4:00 p.m., Eastern time). U.S. GAAP defines fair value as the price the Series would receive to sell an asset or pay to transfer a liability in an orderly transaction between market participants at the measurement date. The Series determine the fair values of their financial instruments at market value using independent dealers or pricing services under policies approved by the Board of Directors of the Series (the “Board”). The BlackRock Global Valuation Methodologies Committee (the “Global Valuation Committee”) is the committee formed by management to develop global pricing policies and procedures and to provide oversight of the pricing function for the Series for all financial instruments.
Equity investments traded on a recognized securities exchange are valued at the official close price each day, if available. For equity investments traded on more than one exchange, the official close price on the exchange where the stock is primarily traded is used. Equity investments traded on a recognized exchange for which there were no sales on that day may be valued at the last available bid (long positions) or ask (short positions) price. Financial futures contracts traded on exchanges are valued at their last sale price.
Securities and other assets and liabilities denominated in foreign currencies are translated into U.S. dollars using exchange rates determined as of the close of business on the NYSE. Forward foreign currency exchange contracts are valued at the mean between the bid and ask prices and are determined as of the close of business on the NYSE. Interpolated values are derived when the settlement date of the contract is an interim date for which quotations are not available.
The Series value their investments in BlackRock Liquidity Series, LLC, Money Market Series (the “Money Market Series”) at fair value, which is ordinarily based upon its pro rata ownership in the underlying fund’s net assets. The Money Market Series seeks current income consistent with maintaining liquidity and preserving capital. Although the Money Market Series is not registered under the 1940 Act, its investments will follow the parameters of investments by a money market fund that is subject to Rule 2a-7 under the 1940 Act. The Series may withdraw up to 25% of its investment daily, although the Manager of the Money Market Series, in its sole discretion, may permit an investor to withdraw more than 25% on any one day.
In the event that the application of these methods of valuation results in a price for an investment that is deemed not to be representative of the market value of such investment, or if a price is not available, the investment will be valued by the Global Valuation Committee, or its delegate, in accordance with a policy approved by the Board as reflecting fair value (“Fair Value Investments”). When determining the price for Fair Value Investments, the Global Valuation Committee, or its delegate, seeks to determine the price that each Series might reasonably expect to receive or pay from the current sale or purchase of that asset or liability in an arm’s-length transaction. Fair value determinations shall be based upon all available factors that the Global Valuation Committee, or its delegate, deems relevant consistent with the principles of fair value measurement, which include the market approach, income approach and/or in the case of recent investments, the cost approach, as appropriate. The market approach generally consists of using comparable market transactions. The income approach generally is used to discount future cash flows to present value and is adjusted for liquidity as appropriate. These factors include but are not limited to: (i) attributes specific to the investment or asset; (ii) the principal market for the investment or asset; (iii) the customary participants in the principal market for the investment or asset; (iv) data assumptions by market participants for the investment or asset, if reasonably available; (v) quoted prices for similar investments or assets in active markets; and (vi) other factors, such as future cash flows, interest rates, yield curves, volatilities, prepayment speeds, loss severities, credit risks, recovery rates, liquidation amounts and/or default rates. Due to the inherent uncertainty of valuations of such investments, the fair values may differ from the values that would have been used had an active market existed. The Global Valuation Committee, or its delegate, employs various methods for calibrating valuation approaches for investments where an active market does not exist, including regular due diligence of the Series’ pricing vendors, regular reviews of key inputs and assumptions, transactional back-testing or disposition analysis to compare unrealized gains and losses to realized gains and losses, reviews of missing or stale prices and large movements in market values and reviews of any market related activity. The pricing of all Fair Value Investments is subsequently reported to the Board or a committee thereof on a quarterly basis.
Generally, trading in foreign instruments is substantially completed each day at various times prior to the close of business on the NYSE. Occasionally, events affecting the values of such instruments may occur between the foreign market close and the close of business on the NYSE that may not be
| | | | | | |
| | | | | | | |
| 58 | | BLACKROCK INDEX FUNDS, INC. | | JUNE 30, 2015 | | |
| | |
| Notes to Financial Statements (continued) | | Quantitative Master Series LLC |
reflected in the computation of the Series’ net assets. If events (e.g., a company announcement, market volatility or a natural disaster) occur during such periods that are expected to materially affect the value of such instruments, those instruments may be Fair Value Investments and be valued at their fair value, as determined in good faith by the Global Valuation Committee, or its delegate, using a pricing service and/or policies approved by the Board. Each business day, the Series uses a pricing service to assist with the valuation of certain foreign exchange-traded equity securities and foreign exchange-traded and OTC options (the “Systematic Fair Value Price”). Using current market factors, the Systematic Fair Value Price is designed to value such foreign securities and foreign options at fair value as of the close of business on the NYSE, which follows the close of the local markets.
Foreign Currency: The Series’ books and records are maintained in U.S. dollars. Purchases and sales of investment securities are recorded at the rates of exchange prevailing on the respective dates of such transactions. Generally, when the U.S. dollar rises in value against a foreign currency, the Series investments denominated in that currency will lose value because that currency is worth fewer U.S. dollars; the opposite effect occurs if the U.S. dollar falls in relative value.
The Series does not isolate the portion of the results of operations arising as a result of changes in the foreign exchange rates from the changes in the market prices of investments held or sold for financial reporting purposes. Accordingly, the effects of changes in foreign currency exchange rates on investments are not segregated in the Statements of Operations from the effects of changes in market prices of those investments, but are included as a component of net realized and unrealized gain (loss) from investments. The Series reports realized currency gains (losses) on foreign currency related transactions as components of net realized gain (loss) for financial reporting purposes, whereas such components are generally treated as ordinary income for federal income tax purposes.
Segregation and Collateralization: In cases where a Series enters into certain investments (e.g., financial futures contracts and forward foreign currency exchange contracts), that would be “senior securities” for 1940 Act purposes, the Series may segregate or designate on their books and records cash or liquid securities having a market value at least equal to the amount of the Series’ future obligations under such investments. Doing so allows the investment to be excluded from treatment as a “senior security.” Furthermore, if required by an exchange or counterparty agreement, the Series may be required to deliver/deposit cash and/or securities to/with an exchange, or broker-dealer or custodian as collateral for certain investments or obligations.
Investment Transactions and Investment Income: For financial reporting purposes, investment transactions are recorded on the dates the transactions are entered into (the trade dates). Realized gains and losses on investment transactions are determined on the identified cost basis. Dividend income is recorded on the ex-dividend date. Dividends from foreign securities where the ex-dividend date may have passed are subsequently recorded when the Series is informed of the ex-dividend date. Under the applicable foreign tax laws, a withholding tax at various rates may be imposed on capital gains, dividends and interest. Upon notification from issuers, some of the dividend income received from a real estate investment trust may be redesignated as a reduction of cost of the related investment and/or realized gain.
Other: Expenses directly related to a Series are charged to that Series. Other operating expenses shared by several funds are prorated among those funds on the basis of relative net assets or other appropriate methods.
The Series have an arrangement with their custodian whereby fees may be reduced by credits earned on uninvested cash balances, which, if applicable, are shown as fees paid indirectly in the Statements of Operations. The custodian imposes fees on overdrawn cash balances, which can be offset by accumulated credits earned or may result in additional custody charges.
3. Securities and Other Investments:
Preferred Stock: The Series may invest in preferred stock. Preferred stock has a preference over common stock in liquidation (and generally in receiving dividends as well) but is subordinated to the liabilities of the issuer in all respects. As a general rule, the market value of preferred stock with a fixed dividend rate and no conversion element varies inversely with interest rates and perceived credit risk, while the market price of convertible preferred stock generally also reflects some element of conversion value. Because preferred stock is junior to debt securities and other obligations of the issuer, deterioration in the credit quality of the issuer will cause greater changes in the value of a preferred stock than in a more senior debt security with similar stated yield characteristics. Unlike interest payments on debt securities, preferred stock dividends are payable only if declared by the issuer’s board of directors. Preferred stock also may be subject to optional or mandatory redemption provisions.
Securities Lending: The Series may lend their securities to approved borrowers, such as brokers, dealers and other financial institutions. The borrower pledges and maintains with the Series collateral consisting of cash, an irrevocable letter of credit issued by a bank, or securities issued or guaranteed by the U.S. Government. The initial collateral received by each Series is required to have a value of at least 102% of the current value of the loaned securities for securities traded on U.S. exchanges and a value of at least 105% for all other securities. The collateral is maintained thereafter at a value equal to at least 100% of the current market value of the securities on loan. The market value of the loaned securities is determined at the close of each business day of the Series and any additional required collateral is delivered to the Series, or excess collateral returned by the Series, on the next business day. During the term of the loan, the Series are entitled to all distributions made on or in respect of the loaned securities. Loans of securities are terminable at any time and the borrower, after notice, is required to return borrowed securities within the standard time period for settlement of securities transactions.
| | | | | | |
| | | | | | | |
| | BLACKROCK INDEX FUNDS, INC. | | JUNE 30, 2015 | | 59 |
| | |
| Notes to Financial Statements (continued) | | Quantitative Master Series LLC |
The market value of securities on loan, all of which were classified as common stocks in the Series’ Schedules of Investments, and the value of the related collateral are shown separately in the Statements of Assets and Liabilities as a component of investments at value-unaffiliated, and collateral on securities loaned at value, respectively. As of June 30, 2015, any securities on loan were collateralized by cash. The cash collateral invested by the securities lending agent, BlackRock Investment Management, LLC (“BIM”), if any, is disclosed in the Schedules of Investments.
Securities lending transactions are entered into by the Series under Master Securities Lending Agreements (each, an “MSLA”) which provide the right, in the event of default (including bankruptcy or insolvency), for the non-defaulting party to liquidate the collateral and calculate a net exposure to the defaulting party or request additional collateral. In the event that a borrower defaults, the Series, as lender, would offset the market value of the collateral received against the market value of the securities loaned. When the value of the collateral is greater than that of the market value of the securities loaned, the lender is left with a net amount payable to the defaulting party. However, bankruptcy or insolvency laws of a particular jurisdiction may impose restrictions on or prohibitions against such a right of offset in the event of an MSLA counterparty’s bankruptcy or insolvency. Under the MSLA, the borrower can resell or re-pledge the loaned securities, and the Series can reinvest cash collateral, or, upon an event of default, resell or re-pledge the collateral.
As of June 30, 2015, the following table is a summary of the Series’ securities lending agreements by counterparty, which are subject to offset under an MSLA:
| | | | | | | | | | | | |
| Master International Index | | | | | | | | | |
| Counterparty | | Securities
Loaned at
Value | | | Cash
Collateral
Received1 | | | Net
Amount | |
Barclays Capital Inc. | | $ | 295,674 | | | $ | (295,674 | ) | | | — | |
Credit Suisse Securities (USA) LLC | | | 210,683 | | | | (210,683 | ) | | | — | |
Deutsche Bank Securities, Inc. | | | 151,889 | | | | (151,889 | ) | | | — | |
JP Morgan Clearing Corp. | | | 1,905,342 | | | | (1,905,342 | ) | | | — | |
Merrill Lynch, Pierce, Fenner & Smith, Inc. | | | 583,268 | | | | (583,268 | ) | | | — | |
Morgan Stanley & Co. LLC | | | 123,260 | | | | (123,260 | ) | | | — | |
| | | | |
Total | | $ | 3,270,116 | | | $ | (3,270,116 | ) | | | — | |
| | | | | | | | | | | | |
| | 1 | | Collateral with a value of $3,524,062 has been received in connection with securities lending agreements. Excess of collateral received from the individual counterparty is not shown for financial reporting purposes. |
| | | | | | | | | | | | |
| Master Small Cap Index | | | | | | | | | |
| Counterparty | | Securities
Loaned at
Value | | | Cash
Collateral
Received2 | | | Net
Amount | |
Barclays Capital, Inc. | | $ | 1,073,132 | | | $ | (1,073,132 | ) | | | — | |
BNP Paribas Prime Brokerage, Inc. | | | 164,138 | | | | (164,138 | ) | | | — | |
Citigroup Global Markets, Inc. | | | 865,449 | | | | (865,449 | ) | | | — | |
Credit Suisse Securities (USA) LLC | | | 30,574 | | | | (30,574 | ) | �� | | — | |
Deutsche Bank Securities, Inc. | | | 1,177,812 | | | | (1,177,812 | ) | | | — | |
Goldman Sachs & Co. | | | 2,915,027 | | | | (2,915,027 | ) | | | — | |
JP Morgan Clearing Corp. | | | 1,922,767 | | | | (1,922,767 | ) | | | — | |
Merrill Lynch, Pierce, Fenner & Smith, Inc. | | | 295,593 | | | | (295,593 | ) | | | — | |
Morgan Stanley & Co. LLC | | | 3,521,443 | | | | (3,521,443 | ) | | | — | |
National Financial Services LLC | | | 641,095 | | | | (641,095 | ) | | | — | |
Nomura Securities International, Inc. | | | 13,068 | | | | (13,068 | ) | | | — | |
UBS Securities LLC | | | 686,935 | | | | (686,935 | ) | | | — | |
| | | | |
Total | | $ | 13,307,033 | | | $ | (13,307,033 | ) | | | — | |
| | | | |
| | 2 | | Collateral with a value of $16,414,073 has been received in connection with securities lending agreements. Excess of collateral received from the individual counterparty is not shown for financial reporting purposes. |
The risks of securities lending include the risk that the borrower may not provide additional collateral when required or may not return the securities when due. To mitigate these risks, the Series benefit from a borrower default indemnity provided by BIM. BIM’s indemnity allows for full replacement of the securities loaned if the collateral received does not cover the value on the securities loaned in the event of borrower default. The Series could suffer a loss if the value of an investment purchased with cash collateral falls below the market value of loaned securities or if the value of an investment purchased with cash collateral falls below the value of the original cash collateral received.
4. Derivative Financial Instruments:
The Series engage in various portfolio investment strategies using derivative contracts both to increase the returns of the Series and/or to manage economically their exposure to certain risks such as equity risk, and foreign currency exchange rate risk. These contracts may be transacted on an exchange or over-the-counter (“OTC”).
| | | | | | |
| | | | | | | |
| 60 | | BLACKROCK INDEX FUNDS, INC. | | JUNE 30, 2015 | | |
| | |
| Notes to Financial Statements (continued) | | Quantitative Master Series LLC |
Financial Futures Contracts: The Series invest in long and/or short positions in financial futures contracts and options on financial futures contracts to gain exposure to, or economically hedge against, changes in interest rates (interest rate risk), changes in the value of equity securities (equity risk) or foreign currencies (foreign currency exchange rate risk). Financial futures contracts are agreements between the Series and a counterparty to buy or sell a specific quantity of an underlying instrument at a specified price and at a specified date. Depending on the terms of the particular contract, financial futures contracts are settled either through physical delivery of the underlying instrument on the settlement date or by payment of a cash settlement amount on the settlement date.
Upon entering into a financial futures contract, the Series are required to deposit initial margin with the broker in the form of cash or securities in an amount that varies depending on a contract’s size and risk profile. The initial margin deposit must then be maintained at an established level over the life of the contract. Securities deposited as initial margin are designated on the Schedules of Investments and cash deposited, if any, is recorded on the Statements of Assets and Liabilities as cash pledged for financial futures contracts. Pursuant to the contract, the Series agree to receive from or pay to the broker an amount of cash equal to the daily fluctuation in value of the contract. Such receipts or payments are known as variation margin. Variation margin is recorded by the Series as unrealized appreciation (depreciation) and, if applicable, as a receivable or payable for variation margin in the Statements of Assets and Liabilities.
When the contract is closed, the Series record a realized gain or loss equal to the difference between the value of the contract at the time it was opened and the value at the time it was closed. The use of financial futures contracts involves the risk of an imperfect correlation in the movements in the price of financial futures contracts, interest or foreign currency exchange rates and the underlying assets.
The following is a summary of the Series’ derivative financial instruments categorized by risk exposure:
| | | | | | | | | | | | | | | | | | |
| Fair Values of Derivative Financial Instrument Six Months Ended June 30, 2015 | |
| | | | | Value | |
| | | | | Master
International Index | | | Master
Small Cap Index | |
| | | Statement of Assets and Liabilities Location | | Derivative
Assets | | | Derivative
Liabilities | | | Derivative
Assets | | | Derivative
Liabilities | |
Equity contracts | | Net unrealized appreciation (depreciation)1 | | $ | 124,818 | | | $ | (650,243 | ) | | | — | | | $ | (419,342 | ) |
| | 1 | | Includes cumulative appreciation (depreciation) on financial futures contracts as reported in the Schedule of Investments. Only current day’s variation margin is reported within the Statement of Assets and Liabilities. |
| | | | | | | | | | | | | | | | | | |
The Effect of Derivative Financial Instruments in the Statements of Operations
Six Months Ended June 30, 2015 | |
| | | Net Realized Gain From | | | | | Net Change in Unrealized
Appreciation (Depreciation) on | |
| | | Master
International Index | | | Master
Small Cap Index | | | | | Master
International Index | | | Master
Small Cap Index | |
| Equity Contracts: | | | | | | | | | | | | | | | | | | |
Financial futures contracts | | $ | 6,393,154 | | | $ | 1,394,002 | | | | | $ | (2,186,124 | ) | | $ | (759,905 | ) |
| | | | |
For the six months ended June 30, 2015, the average quarterly balances of outstanding derivative financial instruments were as follows:
| | | | | | | | | | |
| | | | | Master
International Index | | | Master
Small Cap Index | |
| Financial futures contracts: | | | | | | | | | | |
Average notional value of contracts purchased | | | | $ | 49,428,316 | | | $ | 48,668,580 | |
| | | | | | |
Counterparty Credit Risk: A derivative contract may suffer a mark-to-market loss if the value of the contract decreases due to an unfavorable change in the market rates or values of the underlying instrument. Losses can also occur if the counterparty does not perform under the contract.
With exchange-traded futures, there is less counterparty credit risk to the Series since the exchange or clearinghouse, as counterparty to such instruments, guarantees against a possible default. The clearinghouse stands between the buyer and the seller of the contract; therefore, credit risk is limited to failure of the clearinghouse. While offset rights may exist under applicable law, a Series does not have a contractual right of offset against a clearing broker or clearinghouse in the event of a default (including the bankruptcy or insolvency) of the clearing broker or clearinghouse. Additionally, credit risk exists in exchange-traded futures with respect to initial and variation margin that is held in a clearing broker’s customer accounts. While clearing brokers are required to segregate customer margin from their own assets, in the event that a clearing broker becomes insolvent or goes into bankruptcy and at that time there is a shortfall in the aggregate amount of margin held by the clearing broker for all its clients, typically the shortfall would be allocated on a pro rata basis across all the clearing broker’s customers, potentially resulting in losses to the Series.
| | | | | | |
| | | | | | | |
| | BLACKROCK INDEX FUNDS, INC. | | JUNE 30, 2015 | | 61 |
| | |
| Notes to Financial Statements (continued) | | Quantitative Master Series LLC |
5. Investment Advisory Agreement and Other Transactions with Affiliates:
The PNC Financial Services Group, Inc. is the largest stockholder and an affiliate of BlackRock, Inc. (“BlackRock”) for 1940 Act purposes.
The Master LLC, on behalf of the Series, entered into an Investment Advisory Agreement with the BlackRock Advisors, LLC (the “Manager”), the Series’ investment advisor, an indirect, wholly owned subsidiary of BlackRock, to provide investment advisory and administration services. The Manager is responsible for each management of the Series’ portfolio and provides the necessary personnel, facilities, equipment and certain other services to the operations of each Series. For such services, each Series pays the Manager a monthly fee at an annual rate of 0.01% of each Series’ average daily net assets.
The Manager contractually agreed to waive and/or reimburse fees or expenses in order to limit expenses, excluding interest expense, dividend expense, acquired fund fees and expenses, and certain other fund expenses, which constitute extraordinary expenses not incurred in the ordinary course of the Series’ business. The expense limitations as a percentage of average daily net assets are as follows: 0.07% for Master International Index and 0.08% for Master Small Cap Index. Prior to April 30, 2015, the expense limitation as a percentage of average daily net assets for Master International Index was 0.12%.
The Manager has agreed not to reduce or discontinue this contractual waiver or reimbursement prior to May 1, 2016, unless approved by the Board, including a majority of the Independent Directors. For the year ended June 30, 2015, the Manager waived $490 with respect to Master Small Cap Index, which is included in fees waived and/or reimbursed by the Manager in the Statements of Operations.
The Manager voluntarily agreed to waive its investment advisory fees by the amount of investment advisory fees each Series pays to the Manager indirectly through its investment in affiliated money market funds. These amounts are included in fees waived and/or reimbursed by the Manager in the Statements of Operations. However, the Manager does not waive its investment advisory fees by the amount of investment advisory fees paid in connection with each Series’ investments in other affiliated investment companies, if any. For the six months ended June 30, 2015 the amounts waived for Master International Index and Master Small Cap Index were $5,074 and $12,335, respectively.
For the six months ended June 30, 2015, each Series reimbursed the Manager for certain accounting services, which is included in accounting services in the Statements of Operations.
The U.S. Securities and Exchange Commission has issued an exemptive order which permits BIM, an affiliate of the Manager, to serve as securities lending agent for each Series, subject to applicable conditions. As securities lending agent, BIM bears all operational costs directly related to securities lending. The Series are responsible for expenses in connection with the investment of cash collateral received for securities on loan (the “collateral investment expenses”). The cash collateral is invested in a private investment company managed by the Manager or its affiliates. However, BIM has agreed to cap the collateral investment expenses of the private investment company to an annual rate of 0.04%. The investment advisor to the private investment company will not charge any advisory fees with respect to shares purchased by the Series.
Securities lending income is equal to the total of income earned from the reinvestment of cash collateral, net of fees and other payments to and from borrowers of securities, and less the collateral investment expenses. Each Series retains a portion of securities lending income and remits a remaining portion to BIM as compensation for its services as securities lending agent. Pursuant to a securities lending agreement, BIM may lend securities only when the difference between the borrower rebate rate and the risk free rate exceeds a certain level (such securities, the “specials only securities”).
Pursuant to such agreement, each Series retains 80% of securities lending income. In addition, commencing the business day following the date that the aggregate securities lending income earned across certain funds in the Equity-Liquidity Complex in a calendar year exceeds a specified threshold, each Series, pursuant to the securities lending agreement, will retain for the remainder of the calendar year securities lending income in an amount equal to 85% of securities lending income.
The share of securities lending income earned by each Series is shown as securities lending — affiliated — net in the Statements of Operations. For the six months ended June 30, 2015, each Series paid BIM the following amounts for securities lending agent services:
| | | | |
Master International Index | | $ | 34,571 | |
Master Small Cap Index | | $ | 220,225 | |
Certain officers and/or directors of the Master LLC are officers and/or directors of BlackRock or its affiliates.
The Series may purchase securities from, or sell securities to, an affiliated fund provided the affiliation is due solely to having a common investment advisor, common officers, or common trustees. For the six months ended June 30, 2015, the purchase and sale transactions with an affiliated fund in compliance with Rule 17a-7 under the 1940 Act were as follows:
| | | | | | | | |
| | | Purchases | | | Sales | |
Master Small Cap Index | | $ | 17,773,833 | | | $ | 31,528,501 | |
| | | | | | |
| | | | | | | |
| 62 | | BLACKROCK INDEX FUNDS, INC. | | JUNE 30, 2015 | | |
| | |
| Notes to Financial Statements (continued) | | Quantitative Master Series LLC |
6. Purchases and Sales:
For the six months ended June 30, 2015, purchases and sales of investments, excluding short-term securities, were as follows:
| | | | | | | | |
| | | Purchases | | | Sales | |
Master International Index | | $ | 1,045,119,755 | | | $ | 118,015,034 | |
Master Small Cap Index | | $ | 374,115,551 | | | $ | 144,577,720 | |
7. Income Tax Information:
The Series are classified as partnerships for federal income tax purposes. As such, each investor in the Series is treated as the owner of its proportionate share of net assets, income, expenses and realized and unrealized gains and losses of the Series. Therefore, no federal income tax provision is required. It is intended that the Series’ assets will be managed so an investor in the Series can satisfy the requirements of Subchapter M of the Internal Revenue Code of 1986, as amended.
The Series file U.S. federal and various state and local tax returns. No income tax returns are currently under examination. The statute of limitations on the Series’ U.S. federal tax returns remains open for each of the four years ended December 31, 2014. The statutes of limitations on the Funds’ state and local tax returns may remain open for an additional year depending upon the jurisdiction.
Management has analyzed tax laws and regulations and their application to the Series as of June 30, 2015, inclusive of the open tax return years, and does not believe there are any uncertain tax positions that require recognition of a tax liability in the Series’ financial statements.
As of June 30, 2015, gross unrealized appreciation and depreciation based on cost for federal income tax purposes were as follows:
| | | | | | | | |
| | | Master
International
Index | | | Master
Small Cap
Index | |
Tax cost | | $ | 3,426,386,686 | | | $ | 755,434,638 | |
| | | | | | | | |
Gross unrealized appreciation | | $ | 341,243,277 | | | $ | 300,568,491 | |
Gross unrealized depreciation | | | (141,104,069 | ) | | | (44,871,996 | ) |
| | | | | | | | |
Net unrealized appreciation | | $ | 200,139,208 | | | $ | 255,696,495 | |
| | | | | | | | |
8. Bank Borrowings:
The Master LLC, on behalf of the Series, along with certain other funds managed by the Manager and its affiliates (“Participating Funds”), is a party to a 364-day, $2.1 billion credit agreement with a group of lenders, under which the Series may borrow to fund shareholder redemptions. Excluding commitments designated for certain individual funds, the Participating Funds, including the Series, can borrow up to an aggregate commitment amount of $1.6 billion, subject to asset coverage and other limitations as specified in the agreement. The credit agreement has the following terms: a fee of 0.06% per annum on unused commitment amounts and interest at a rate equal to the higher of (a) one-month LIBOR (but, in any event, not less than 0.00%) on the date the loan is made plus 0.80% per annum or (b) the Fed Funds rate (but, in any event, not less than 0.00%) in effect from time to time plus 0.80% per annum on amounts borrowed. The agreement expires in April 2016 unless extended or renewed. Participating Funds paid administration, legal and arrangement fees, which are included in miscellaneous expenses in the Statements of Operations, and along with commitment fees, were allocated among such funds based upon portions of the aggregate commitment available to them and relative net assets of Participating Funds. During the six months ended June 30, 2015, the Series did not borrow under the credit agreement.
9. Principal Risks:
In the normal course of business, the Series invest in securities and enter into transactions where risks exist due to fluctuations in the market (market risk) or failure of the issuer of a security to meet all its obligations, including to pay principal and interest when due (issuer credit risk). The value of securities held by the Series may decline in response to certain events, including those directly involving the issuers whose securities are owned by the Series; conditions affecting the general economy; overall market changes; local, regional or global political, social or economic instability; and currency, interest rate and price fluctuations. Similar to issuer credit risk, the Series may be exposed to counterparty credit risk, or the risk that an entity with which the Series have unsettled or open transactions may fail to or be unable to perform on their commitments. The Series manage counterparty credit risk by entering into transactions only with counterparties that the Manager believes have the financial resources to honor their obligations and by monitoring the financial stability of those counterparties. Financial assets, which potentially expose the Series to market, issuer and counterparty credit risks, consist principally of financial instruments and receivables due from counterparties. The extent of the Series’ exposure to market, issuer and counterparty credit risks with respect to these financial assets is generally approximated by their value recorded in the Statements of Assets and Liabilities, less any collateral held by the Series.
Master International Index invests a substantial amount of its assets in issuers located in a single country or a limited number of countries. When the Series concentrates its investments in this manner, it assumes the risk that economic, political and social conditions in those countries may have a
| | | | | | |
| | | | | | | |
| | BLACKROCK INDEX FUNDS, INC. | | JUNE 30, 2015 | | 63 |
| | |
| Notes to Financial Statements (concluded) | | Quantitative Master Series LLC |
significant impact on their investment performance. Foreign issuers may not be subject to the same uniform accounting, auditing and financial reporting standards and practices as used in the United States. Foreign securities markets may also be less liquid, more volatile, and less subject to governmental supervision not typically associated with investing in U.S. securities. Investment percentages in specific countries are presented in the Schedules of Investments.
Master International Index invests a significant portion of its assets in securities of issuers located in Europe or with significant exposure to European issuers or countries. The European financial markets have recently experienced volatility and adverse trends due to concerns about economic downturns in, or rising government debt levels of, several European countries. These events may spread to other countries in Europe and may affect the value and liquidity of certain of the Master International Index’s investments.
As of June 30, 2015, Master Small Cap Index invested a significant portion of its assets in securities in the financial sector. Changes in economic conditions affecting such sectors would have a greater impact on the Master Small Cap Index and could affect the value, income and/or liquidity of positions in such securities.
As of June 30, 2015, the Series investments had the following industry classifications:
| | |
| Master International Index |
| | |
| Industry | | Percent of
Long-Term Investments |
| | | | |
Banks | | | 15 | % |
Pharmaceuticals | | | 10 | |
Telecommunications | | | 6 | |
Insurance | | | 6 | |
Food | | | 5 | |
Oil & Gas | | | 5 | |
Others | | | 53 | |
| | |
| Industry | | Percent of
Long-Term Investments |
| | | | |
Real Estate Investment Trusts | | | 8 | % |
Banks | | | 8 | |
Retail | | | 6 | |
Commercial Services | | | 5 | |
Pharmaceuticals | | | 5 | |
Software | | | 5 | |
Others | | | 63 | |
10. Subsequent Events:
Management has evaluated the impact of all subsequent events on the Series through the date the financial statements were issued and has determined that there were no subsequent events requiring adjustment or additional disclosure in the financial statements.
| | | | | | |
| | | | | | | |
| 64 | | BLACKROCK INDEX FUNDS, INC. | | JUNE 30, 2015 | | |
| | | | |
| Disclosure of Investment Advisory Agreement | | |
The Board of Directors of Quantitative Master Series LLC (the “Master LLC”) met in person on April 21, 2015 (the “April Meeting”) and May 18-20, 2015 (the “May Meeting”) to consider the approval of the investment advisory agreement (the “Agreement”) between the Master LLC, on behalf of Master International Index Series and Master Small Cap Index Series (each, a “Master Portfolio” and collectively, the “Master Portfolios”), each a series of the Master LLC, and BlackRock Advisors, LLC (the “Manager” or “BlackRock”), the Master LLC’s investment advisor. Each of BlackRock International Index Fund and BlackRock Small Cap Index Fund (each, a “Fund” and collectively, the “Funds”), each a series of BlackRock Index Funds, Inc. (the “Corporation”), is a “feeder” fund that invests all of its investable assets in the corresponding Master Portfolio. Accordingly, the Board of Directors of the Corporation also considered the approval of the Agreement with respect to each Master Portfolio. For simplicity: (a) the Board of Directors of the Master LLC and the Board of Directors of the Corporation are referred to herein collectively as the “Board,” and the members are referred to as “Board Members;” and (b) the shareholders of each Fund and the interest holders of each Master Portfolio are referred to as “shareholders.”
Activities and Composition of the Board
On the date of the May Meeting, the Board consisted of fourteen individuals, thirteen of whom were not “interested persons” of the Master LLC or the Corporation as defined in the Investment Company Act of 1940, as amended (the “1940 Act”) (the “Independent Board Members”). The Board Members are responsible for the oversight of the operations of the Master LLC or the Corporation, as pertinent, and perform the various duties imposed on the directors of investment companies by the 1940 Act. The Independent Board Members have retained independent legal counsel to assist them in connection with their duties. The Chair of the Board is an Independent Board Member. The Board has established five standing committees: an Audit Committee, a Governance and Nominating Committee, a Compliance Committee, a Performance Oversight and Contract Committee and an Executive Committee, each of which is chaired by an Independent Board Member and composed of Independent Board Members (except for the Executive Committee, which also has one interested Board Member).
The Agreement
Pursuant to the 1940 Act, the Board is required to consider the continuation of the Agreement on an annual basis. The Board has four quarterly meetings per year, each extending over two days, a fifth one-day meeting to consider specific information surrounding the consideration of renewing the Agreement, and additional in-person and telephonic meetings as needed. In connection with this year-long deliberative process, the Board assessed, among other things, the nature, extent and quality of the services provided to the Master Portfolios and the Funds by BlackRock, BlackRock’s personnel and affiliates, including (as applicable) investment management services; administrative and shareholder services; the oversight of fund service providers; marketing services; risk oversight; compliance; and ability to meet applicable legal and regulatory requirements.
The Board, acting directly and through its committees, considers at each of its meetings, and from time to time as appropriate, factors that are relevant to its annual consideration of the renewal of the Agreement, including the services and support provided by BlackRock to the Master Portfolios, the Funds and their shareholders. Among the matters the Board considered were: (a) investment performance for one-year, three-year, five-year and/or since inception periods, as applicable, against peer funds, applicable benchmark, and performance metrics, as applicable, as well as senior management’s and portfolio managers’ analysis of the reasons for any over performance or underperformance relative to its peers, benchmark, and other performance metrics, as applicable; (b) fees, including advisory, administration, if applicable, and other amounts paid to BlackRock and its affiliates by the Master Portfolios and/or the Funds for services, such as marketing and distribution, call center and fund accounting; (c) the Master Portfolios’ and /or the Funds’ operating expenses and how BlackRock allocates expenses to the Master Portfolios and the Funds; (d) the resources devoted to, risk oversight of, and compliance reports relating to, implementation of each Master Portfolio’s and Fund’s investment objective(s), policies and restrictions, and meeting new regulatory requirements; (e) the Master LLC’s and the Corporation’s compliance with its respective compliance policies and procedures; (f) the nature, cost and character of non-investment management services provided by BlackRock and its affiliates; (g) BlackRock’s and other service providers’ internal controls and risk and compliance oversight mechanisms; (h) BlackRock’s implementation of the proxy voting policies approved by the Board; (i) the use of brokerage commissions and execution quality of portfolio transactions; (j) BlackRock’s implementation of the Master LLC’s and/or the Corporation’s valuation and liquidity procedures; (k) an analysis of management fees for products with similar investment mandates across the open-end fund, exchange-traded fund (“ETF”), closed-end fund and institutional account product channels, as applicable, and the similarities and differences between these products and the services provided as compared to the Master Portfolios and/or the Funds; (l) BlackRock’s compensation methodology for its investment professionals and the incentives it creates, along with investment professionals’ investments in the fund(s) they manage; and (m) periodic updates on BlackRock’s business.
The Board has engaged in an ongoing strategic review with BlackRock of opportunities to consolidate funds and of BlackRock’s commitment to investment performance. BlackRock also furnished information to the Board in response to specific questions. These questions covered issues such as: BlackRock’s profitability; investment performance; sub-advisory and advisory relationships with other clients (including mutual funds sponsored by third parties); the viability of specific funds; fund size and manager capacity; BlackRock’s research capabilities; portfolio managers’ investments in funds they manage; funds’ portfolio risk targets; and management fee levels and breakpoints. The Board further discussed with BlackRock: BlackRock’s management structure; portfolio turnover, execution quality and use of soft dollars; BlackRock’s portfolio manager compensation and performance accountability; marketing support for the funds; services provided to the funds by BlackRock affiliates; and BlackRock’s oversight of relationships with third party service providers.
| | | | | | |
| | | | | | | |
| | BLACKROCK INDEX FUNDS, INC. | | JUNE 30, 2015 | | 65 |
| | |
| Disclosure of Investment Advisory Agreement (continued) |
Board Considerations in Approving the Agreement
The Approval Process: Prior to the April Meeting, the Board requested and received materials specifically relating to the Agreement. The Board is continuously engaged in a process with its independent legal counsel and BlackRock to review the nature and scope of the information provided to better assist its deliberations. The materials provided in connection with the April Meeting included (a) information independently compiled and prepared by Lipper, Inc. (“Lipper”) on fees and expenses of each Master Portfolio and Fund, as applicable, as compared with a peer group of funds as determined by Lipper (“Expense Peers”) and the investment performance of each Fund as compared with a peer group of funds as determined by Lipper1, as well as the gross investment performance of each Fund as compared with its benchmark; (b) information on the profits realized by BlackRock and its affiliates pursuant to the Agreement and a discussion of fall-out benefits to BlackRock and its affiliates; (c) a general analysis provided by BlackRock concerning investment management fees charged to other clients, such as institutional clients, sub-advised mutual funds, ETFs and closed-end funds, under similar investment mandates, as well as the performance of such other clients, as applicable; (d) review of non-management fees; (e) the existence, impact and sharing of potential economies of scale; (f) a summary of aggregate amounts paid by each Master Portfolio and/or Fund to BlackRock; (g) sales and redemption data regarding each Fund’s shares; and (h) if applicable, a comparison of management fees to similar BlackRock open-end funds, as classified by Lipper.
At the April Meeting, the Board reviewed materials relating to its consideration of the Agreement. As a result of the discussions that occurred during the April Meeting, and as a culmination of the Board’s year-long deliberative process, the Board presented BlackRock with questions and requests for additional information. BlackRock responded to these requests with additional written information in advance of the May Meeting.
At the May Meeting, the Board of the Master LLC, including the Independent Board Members, approved the continuation of the Agreement between the Manager and the Master LLC with respect to each Master Portfolio for a one-year term ending June 30, 2016. The Board of the Corporation, including the Independent Board Members, also considered the continuation of the Agreement with respect to each Master Portfolio and found the Agreement to be satisfactory. In approving the continuation of the Agreement, the Board of the Master LLC considered: (a) the nature, extent and quality of the services provided by BlackRock; (b) the investment performance of each Master Portfolio, each Fund and BlackRock; (c) the advisory fee and the cost of the services and profits to be realized by BlackRock and its affiliates from their relationship with the Master Portfolios and the Funds; (d) each Fund’s costs to investors compared to the costs of Expense Peers and performance compared to the relevant performance comparison as previously discussed; (e) the sharing of potential economies of scale; (f) fall-out benefits to BlackRock and its affiliates as a result of its relationship with the Master Portfolios and the Funds; and (g) other factors deemed relevant by the Board Members.
The Board also considered other matters it deemed important to the approval process, such as payments made to BlackRock or its affiliates relating to the distribution of Fund shares, securities lending and cash management, services related to the valuation and pricing of portfolio holdings of each Master Portfolio, direct and indirect benefits to BlackRock and its affiliates from their relationship with the Master Portfolios and the Funds and advice from independent legal counsel with respect to the review process and materials submitted for the Board’s review. The Board noted the willingness of BlackRock personnel to engage in open, candid discussions with the Board. The Board did not identify any particular information as determinative, and each Board Member may have attributed different weights to the various items considered.
A. Nature, Extent and Quality of the Services Provided by BlackRock: The Board, including the Independent Board Members, reviewed the nature, extent and quality of services provided by BlackRock, including the investment advisory services and the resulting performance of each Fund. Throughout the year, the Board compared each Fund’s performance to the performance of a comparable group of mutual funds, relevant benchmark, and performance metrics, as applicable. The Board met with BlackRock’s senior management personnel responsible for investment activities, including the senior investment officers. The Board also reviewed the materials provided by each Master Portfolio’s portfolio management team discussing Master Portfolio performance and the Master Portfolio’s investment objective(s), strategies and outlook.
The Board considered, among other factors, with respect to BlackRock: the number, education and experience of investment personnel generally and each Master Portfolio’s portfolio management team; BlackRock’s research capabilities; investments by portfolio managers in the funds they manage; portfolio trading capabilities; use of technology; commitment to compliance; credit analysis capabilities; risk analysis and oversight capabilities; and the approach to training and retaining portfolio managers and other research, advisory and management personnel. The Board engaged in a review of BlackRock’s compensation structure with respect to each Master Portfolio’s portfolio management team and BlackRock’s ability to attract and retain high-quality talent and create performance incentives.
In addition to advisory services, the Board considered the quality of the administrative and other non-investment advisory services provided to each Master Portfolio and Fund. BlackRock and its affiliates provide the Master Portfolios and the Funds with certain administrative, shareholder and other services (in addition to any such services provided to the Master Portfolios and the Funds by third parties) and officers and other personnel as are necessary for the operations of the Master Portfolios and the Funds. In particular, BlackRock and its affiliates provide the Master Portfolios and the Funds with the following administrative services, including, among others: (i) preparing disclosure documents, such as the prospectus, the summary prospectus (as applicable), the statement of additional information and periodic shareholder reports; (ii) oversight of daily accounting and pricing; (iii) overseeing and coordinating the
| 1 | | Funds are ranked by Lipper in quartiles, ranging from first to fourth, where first is the most desirable quartile position and fourth is the least desirable. |
| | | | | | |
| | | | | | | |
| 66 | | BLACKROCK INDEX FUNDS, INC. | | JUNE 30, 2015 | | |
| | |
| Disclosure of Investment Advisory Agreement (continued) |
activities of other service providers; (iv) organizing Board meetings and preparing the materials for such Board meetings; (v) providing legal and compliance support; (vi) furnishing analytical and other support to assist the Board in its consideration of strategic issues such as the merger, consolidation or repurposing of certain open-end funds; and (vii) performing other administrative functions necessary for the operation of the Master Portfolios and the Funds, such as tax reporting, fulfilling regulatory filing requirements and call center services. The Board reviewed the structure and duties of BlackRock’s fund administration, shareholder services, legal and compliance departments and considered BlackRock’s policies and procedures for assuring compliance with applicable laws and regulations.
B. The Investment Performance of the Master Portfolios, the Funds and BlackRock: The Board, including the Independent Board Members, also reviewed and considered the performance history of each Master Portfolio and Fund, as applicable. The Board noted that each Fund’s investment results correspond directly to the investment results of the applicable Master Portfolio. In preparation for the April Meeting, the Board worked with its independent legal counsel, BlackRock and Lipper to develop a template for, and was provided with, reports independently prepared by Lipper, which included a comprehensive analysis of each Fund’s performance. The Board also reviewed a narrative and statistical analysis of the Lipper data that was prepared by BlackRock. In connection with its review, the Board received and reviewed information regarding the investment performance of each Fund as compared to other funds in its applicable Lipper category and the gross investment performance of each Fund as compared with its benchmark. The Board was provided with a description of the methodology used by Lipper to select peer funds and periodically meets with Lipper representatives to review its methodology. The Board and its Performance Oversight and Contract Committee regularly review, and meet with Master Portfolio management to discuss, the performance of each Master Portfolio and Fund, as applicable, throughout the year.
In evaluating performance, the Board recognized that the performance data reflects a snapshot of a period or as of a particular date and that selecting a different performance period could produce significantly different results. Further, the Board recognized that it is possible that long-term performance can be adversely affected by even one period of significant underperformance so that a single investment decision or theme has the ability to affect long-term performance disproportionately.
BlackRock believes that gross performance relative to the benchmark is an appropriate performance metric for each Fund.
The Board noted that for the one-, three- and five-year periods reported, BlackRock International Index Fund’s gross performance (before expenses and fees), as agreed upon by the Board, was out of tolerance of its benchmark, underperformed its benchmark and underperformed its benchmark, respectively. The Board and BlackRock reviewed and discussed the reasons for BlackRock International Index Fund’s out of tolerance performance during the one-year period. The Board was informed that, underperformance for the one-year period was due in part to large flows into the Fund.
The Board noted that for the one-, three- and five-year periods reported, BlackRock Small Cap Index Fund’s gross performance (before expenses and fees), as agreed upon by the Board, was within tolerance, out of tolerance and out of tolerance of its benchmark, respectively. The Board noted BlackRock Small Cap Index Fund’s improved performance during the one-year period. The Board and BlackRock reviewed and discussed the reasons for the Fund’s out of tolerance performance during the three- and five-year periods. The Board was informed that, among other things, one of the factors which caused the Fund to exceed the benchmark, by an out of tolerance amount, in the three- and five-year periods was the result of securities lending.
The Board and BlackRock also discussed BlackRock’s strategy for improving the performance of each Master Portfolio/Fund and BlackRock’s commitment to providing the resources necessary to assist the portfolio managers of each Master Portfolio in seeking to do so.
C. Consideration of the Advisory/Management Fees and the Cost of the Services and Profits to be Realized by BlackRock and its Affiliates from their Relationship with the Master Portfolios and the Funds: The Board, including the Independent Board Members, reviewed each Master Portfolio’s/Fund’s contractual management fee rate compared with the other funds in the relevant Fund’s Lipper category. The contractual management fee rate represents a combination of the advisory fee and any administrative fees, before taking into account any reimbursements or fee waivers. The Board also compared each Fund’s total expense ratio, as well as each Master Portfolio’s/Fund’s actual management fee rate, to those of other funds in the relevant Fund’s Lipper category. The total expense ratio represents a fund’s total net operating expenses, including any 12b-1 or non-12b-1 service fees. The total expense ratio gives effect to any expense reimbursements or fee waivers that benefit a fund, and the actual management fee rate gives effect to any management fee reimbursements or waivers that benefit a fund. The Board considered the services provided and the fees charged by BlackRock and its affiliates to other types of clients with similar investment mandates, as applicable, including institutional accounts and sub-advised mutual funds.
The Board received and reviewed statements relating to BlackRock’s financial condition. The Board reviewed BlackRock’s profitability methodology and was also provided with a profitability analysis that detailed the revenues earned and the expenses incurred by BlackRock for services provided to the Master Portfolios and the Funds. The Board reviewed BlackRock’s profitability with respect to each Master Portfolio and Fund, as applicable, and other funds the Board currently oversees for the year ended December 31, 2014 compared to available aggregate profitability data provided for the two prior years. The Board reviewed BlackRock’s profitability with respect to certain other U.S. fund complexes managed by the Manager and/or its affiliates. The Board reviewed BlackRock’s assumptions and methodology of allocating expenses in the profitability analysis, noting the inherent limitations in allocating costs among various advisory products. The Board recognized that profitability may be affected by numerous factors including, among other things, fee waivers and expense reimbursements by the Manager, the types of funds managed, precision of expense allocations and business mix. As a result, calculating and comparing profitability at individual fund levels is difficult.
| | | | | | |
| | | | | | | |
| | BLACKROCK INDEX FUNDS, INC. | | JUNE 30, 2015 | | 67 |
| | |
| Disclosure of Investment Advisory Agreement (concluded) |
The Board noted that, in general, individual fund or product line profitability of other advisors is not publicly available. The Board reviewed BlackRock’s overall operating margin, in general, compared to that of certain other publicly-traded asset management firms. The Board considered the differences between BlackRock and these other firms, including the contribution of technology at BlackRock, BlackRock’s expense management, and the relative product mix.
In addition, the Board considered the cost of the services provided to the Master Portfolios and the Funds by BlackRock, and BlackRock’s and its affiliates’ profits relating to the management and distribution of the Master Portfolios and the Funds and the other funds advised by BlackRock and its affiliates. As part of its analysis, the Board reviewed BlackRock’s methodology in allocating its costs to the management of the Master Portfolios and the Funds. The Board also considered whether BlackRock has the financial resources necessary to attract and retain high quality investment management personnel to perform its obligations under the Agreement and to continue to provide the high quality of services that is expected by the Board. The Board further considered factors including but not limited to BlackRock’s commitment of time, assumption of risk and liability profile in servicing the Master Portfolios and the Funds in contrast to what is required of BlackRock with respect to other products with similar investment mandates across the open-end fund, ETF, closed-end fund, sub-advised mutual fund and institutional account product channels, as applicable.
The Board noted that with respect to each Master Portfolio/Fund, the Master Portfolio’s/Fund’s contractual management fee rate ranked in the first quartile, and the actual management fee rate and the corresponding Fund’s total expense ratio ranked in the first and second quartiles, respectively, relative to the Fund’s Expense Peers. The Board also noted that BlackRock has contractually agreed to a cap on each Master Portfolio’s total expenses as a percentage of the Master Portfolio’s average daily net assets and has contractually agreed to a cap on each Fund’s total expenses as a percentage of the Fund’s average daily net assets on a class-by-class basis. The Board noted that BlackRock proposed, and the Board agreed to, a lower contractual expense cap on Master International Index Series and a lower contractual expense cap on each Fund on a class-by-class basis. These expense cap reductions were implemented on April 30, 2015. The Board also noted that BlackRock proposed, and the Board agreed to, a contractual reduction of each Fund’s administration fee. This administration fee reduction was implemented on April 30, 2015.
D. Economies of Scale: The Board, including the Independent Board Members, considered the extent to which economies of scale might be realized as the assets of the Master Portfolios and the Funds increase, as well as the existence of expense caps, as applicable. The Board also considered the extent to which the Master Portfolios and the Funds benefit from such economies and whether there should be changes in the advisory fee rate or breakpoint structure in order to enable the Master Portfolios and the Funds to participate in these economies of scale, for example through the use of breakpoints in the advisory fee based upon the asset level of the Master Portfolios. In their consideration, the Board Members took into account the existence of any expense caps and further considered the continuation and/or implementation, as applicable, of such caps.
E. Other Factors Deemed Relevant by the Board Members: The Board, including the Independent Board Members, also took into account other ancillary or “fall-out” benefits that BlackRock or its affiliates may derive from their respective relationships with the Master Portfolios and the Funds, both tangible and intangible, such as BlackRock’s ability to leverage its investment professionals who manage other portfolios and risk management personnel, an increase in BlackRock’s profile in the investment advisory community, and the engagement of BlackRock’s affiliates as service providers to the Master Portfolios and the Funds, including for administrative, distribution, securities lending and cash management services. The Board also considered BlackRock’s overall operations and its efforts to expand the scale of, and improve the quality of, its operations. The Board also noted that BlackRock may use and benefit from third party research obtained by soft dollars generated by certain registered fund transactions to assist in managing all or a number of its other client accounts. The Board further noted that it had considered the investment by BlackRock’s funds in affiliated ETFs without any offset against the management fees payable by the funds to BlackRock.
In connection with its consideration of the Agreement, the Board also received information regarding BlackRock’s brokerage and soft dollar practices. The Board received reports from BlackRock which included information on brokerage commissions and trade execution practices throughout the year.
The Board noted the competitive nature of the open-end fund marketplace, and that shareholders are able to redeem their Fund shares if they believe that the pertinent Fund’s and/or Master Portfolio’s fees and expenses are too high or if they are dissatisfied with the performance of the Fund.
Conclusion
The Board of the Master LLC, including the Independent Board Members, approved the continuation of the Agreement between the Manager and the Master LLC, with respect to each Master Portfolio, for a one-year term ending June 30, 2016. Based upon its evaluation of all of the aforementioned factors in their totality, the Board of the Master LLC, including the Independent Board Members, was satisfied that the terms of the Agreement were fair and reasonable and in the best interest of each Master Portfolio and its shareholders. The Board of the Corporation, including the Independent Board Members, also considered the continuation of the Agreement with respect to each Master Portfolio and found the Agreement to be satisfactory. In arriving at its decision to approve the Agreement, the Board of the Master LLC did not identify any single factor or group of factors as all-important or controlling, but considered all factors together, and different Board Members may have attributed different weights to the various factors considered. The Independent Board Members were also assisted by the advice of independent legal counsel in making this determination. The contractual fee arrangements for the Master Portfolios reflect the results of several years of review by the Board Members and predecessor Board Members, and discussions between such Board Members (and predecessor Board Members) and BlackRock. As a result, the Board Members’ conclusions may be based in part on their consideration of these arrangements in prior years.
| | | | | | |
| | | | | | | |
| 68 | | BLACKROCK INDEX FUNDS, INC. | | JUNE 30, 2015 | | |
Rodney D. Johnson, Chair of the Board and Director
David O. Beim, Director
Collette Chilton, Director
Frank J. Fabozzi, Director
Dr. Matina S. Horner, Director
Herbert I. London, Director
Cynthia A. Montgomery, Director
Barbara G. Novick, Director
Joseph P. Platt, Director
Robert C. Robb, Jr., Director
Toby Rosenblatt, Director
Mark Stalnecker, Director
Kenneth L. Urish, Director
Frederick W. Winter, Director
John M. Perlowski, President and Chief Executive Officer
Jennifer McGovern, Vice President
Neal Andrews, Chief Financial Officer
Jay Fife, Treasurer
Charles Park, Chief Compliance Officer
Fernanda Piedra, Anti-Money Laundering Compliance Officer
Benjamin Archibald, Secretary
Effective March 1, 2015, Charles Park resigned as Anti-Money Laundering Compliance Officer of the Corporation/Master LLC and Fernanda Piedra became Anti-Money Laundering Compliance Officer of the Corporation/Master LLC.
Effective May 18, 2015, Ian MacKinnon resigned as a Director of the Corporation/Master LLC.
| | | | | | | | |
| | | | | |
Investment Advisor BlackRock Advisors, LLC Wilmington, DE 19809 | | Custodian State Street Bank and
Trust Company
Boston, MA 02110 | | Accounting Agent State Street Bank and Trust Company Boston, MA 02110 | | Distributor BlackRock Investments, LLC New York, NY 10022 | | Address of the Funds 100 Bellevue Parkway Wilmington, DE 19809 |
| | | | |
| | Transfer Agent BNY Mellon Investment Servicing (US) Inc. Wilmington, DE 19809 | | Independent Registered Public Accounting Firm
Deloitte & Touche LLP Boston, MA 02116 | | Legal Counsel Sidley Austin LLP New York, NY 10019 | | |
| | | | | | |
| | | | | | | |
| | BLACKROCK INDEX FUNDS, INC. | | JUNE 30, 2015 | | 69 |
Householding
The Funds will mail only one copy of shareholder documents, including prospectuses, annual and semi-annual reports and proxy statements, to shareholders with multiple accounts at the same address. This practice is commonly called “householding” and is intended to reduce expenses and eliminate duplicate mailings of shareholder documents. Mailings of your shareholder documents may be householded indefinitely unless you instruct us otherwise. If you do not want the mailing of these documents to be combined with those for other members of your household, please call the Funds at (800) 441-7762.
Availability of Quarterly Schedule of Investments
The Funds/Series file their complete schedule of portfolio holdings with the SEC for the first and third quarters of each fiscal year on Form N-Q. The Funds’/Series’ Forms N-Q are available on the SEC’s website at http://www.sec.gov and may also be reviewed and copied at the SEC’s Public Reference Room in Washington, DC. Information on how to access documents on the SEC’s website without charge may be obtained by calling (800) SEC-0330. The Funds’/Series’ Forms N-Q may also be obtained upon request and without charge by calling (800) 441-7762.
Availability of Proxy Voting Policies and Procedures
A description of the policies and procedures that the Funds/Series use to determine how to vote proxies relating to portfolio securities is available upon request and without charge (1) by calling (800) 441-7762; (2) at http://www.blackrock.com; and (3) on the SEC’s website at http://www.sec.gov.
Availability of Proxy Voting Record
Information about how the Funds/Series voted proxies relating to securities held in the Funds’/Series’ portfolio during the most recent 12-month period ended June 30 is available upon request and without charge (1) at http://www.blackrock.com or by calling (800) 441-7762 and (2) on the SEC’s website at http://www.sec.gov.
BlackRock’s Mutual Fund Family
BlackRock offers a diverse lineup of open-end mutual funds crossing all investment styles and managed by experts in equity, fixed income and tax-exempt investing. Visit http://www.blackrock.com for more information.
| | | | | | |
| | | | | | | |
| 70 | | BLACKROCK INDEX FUNDS, INC. | | JUNE 30, 2015 | | |
| | |
| Additional Information (concluded) | | |
Account Information
Call us at (800) 441-7762 from 8:00 AM to 6:00 PM EST on any business day to get information about your account balances, recent transactions and share prices. You can also reach us on the Web at http://www.blackrock.com/funds.
Automatic Investment Plans
Investor Class shareholders who want to invest regularly can arrange to have $50 or more automatically deducted from their checking or savings account and invested in any of the BlackRock funds.
Systematic Withdrawal Plans
Investor Class shareholders can establish a systematic withdrawal plan and receive periodic payments of $50 or more from their BlackRock funds, as long as their account balance is at least $10,000.
Retirement Plans
Shareholders may make investments in conjunction with Traditional, Rollover, Roth, Coverdell, Simple IRAs, SEP IRAs and 403(b) Plans.
| | |
| BlackRock Privacy Principles | | |
BlackRock is committed to maintaining the privacy of its current and former fund investors and individual clients (collectively, “Clients”) and to safeguarding their non-public personal information. The following information is provided to help you understand what personal information BlackRock collects, how we protect that information and why in certain cases we share such information with select parties.
If you are located in a jurisdiction where specific laws, rules or regulations require BlackRock to provide you with additional or different privacy-related rights beyond what is set forth below, then BlackRock will comply with those specific laws, rules or regulations.
BlackRock obtains or verifies personal non-public information from and about you from different sources, including the following: (i) information we receive from you or, if applicable, your financial intermediary, on applications, forms or other documents; (ii) information about your transactions with us, our affiliates, or others; (iii) information we receive from a consumer reporting agency; and (iv) from visits to our websites.
BlackRock does not sell or disclose to non-affiliated third parties any non-public personal information about its Clients, except as permitted by law or as is necessary to respond to regulatory requests or to service Client accounts. These non-affiliated third parties are required to protect the confidentiality and security of this information and to use it only for its intended purpose.
We may share information with our affiliates to service your account or to provide you with information about other BlackRock products or services that may be of interest to you. In addition, BlackRock restricts access to non-public personal information about its Clients to those BlackRock employees with a legitimate business need for the information. BlackRock maintains physical, electronic and procedural safeguards that are designed to protect the non-public personal information of its Clients, including procedures relating to the proper storage and disposal of such information.
| | | | | | |
| | | | | | | |
| | BLACKROCK INDEX FUNDS, INC. | | JUNE 30, 2015 | | 71 |
This report is intended for current holders. It is not authorized for use as an offer of sale or a solicitation of an offer to buy shares of the Funds unless preceded or accompanied by the Funds’ current prospectus. Past performance results shown in this report should not be considered a representation of future performance. Investment returns and principal value of shares will fluctuate so that shares, when redeemed, may be worth more or less than their original cost. Statements and other information herein are as dated and are subject to change.

| | |
| Index2-6/15-SAR | |  |
| | |
| Item 2 – | | Code of Ethics – Not Applicable to this semi-annual report |
| |
| Item 3 – | | Audit Committee Financial Expert – Not Applicable to this semi-annual report |
| |
| Item 4 – | | Principal Accountant Fees and Services – Not Applicable to this semi-annual report |
| |
| Item 5 – | | Audit Committee of Listed Registrants – Not Applicable |
| |
| Item 6 – | | Investments |
| | (a) The registrants’ Schedule of Investments is included as part of the Report to Stockholders filed under Item 1 of this Form. |
| | (b) Not Applicable due to no such divestments during the semi-annual period covered since the previous Form N-CSR filing. |
| |
| Item 7 – | | Disclosure of Proxy Voting Policies and Procedures for Closed-End Management Investment Companies – Not Applicable |
| |
| Item 8 – | | Portfolio Managers of Closed-End Management Investment Companies – Not Applicable |
| |
| Item 9 – | | Purchases of Equity Securities by Closed-End Management Investment Company and Affiliated Purchasers – Not Applicable |
| |
| Item 10 – | | Submission of Matters to a Vote of Security Holders –There have been no material changes to these procedures. |
| |
| Item 11 – | | Controls and Procedures |
| |
| | (a) – The registrants’ principal executive and principal financial officers, or persons performing similar functions, have concluded that the registrants’ disclosure controls and procedures (as defined in Rule 30a-3(c) under the Investment Company Act of 1940, as amended (the “1940 Act”)) are effective as of a date within 90 days of the filing of this report based on the evaluation of these controls and procedures required by Rule 30a-3(b) under the 1940 Act and Rule 15d-15(b) under the Securities Exchange Act of 1934, as amended. |
| |
| | (b) – There were no changes in the registrants’ internal control over financial reporting (as defined in Rule 30a-3(d) under the 1940 Act) that occurred during the second fiscal quarter of the period covered by this report that have materially affected, or are reasonably likely to materially affect, the registrants’ internal control over financial reporting. |
| |
| Item 12 – | | Exhibits attached hereto |
| |
| | (a)(1) – Code of Ethics – Not Applicable to this semi-annual report |
| |
| | (a)(2) – Certifications – Attached hereto |
| |
| | (a)(3) – Not Applicable |
| |
| | (b) – Certifications – Attached hereto |
2
Pursuant to the requirements of the Securities Exchange Act of 1934 and the Investment Company Act of 1940, each registrant has duly caused this report to be signed on its behalf by the undersigned, thereunto duly authorized.
| | |
| BlackRock Index Funds, Inc. and Quantitative Master Series LLC |
| |
| By: | | /s/ John M. Perlowski |
| | John M. Perlowski |
| | Chief Executive Officer (principal executive officer) of |
| | BlackRock Index Funds, Inc. and Quantitative Master Series LLC |
|
| Date: September 3, 2015 |
Pursuant to the requirements of the Securities Exchange Act of 1934 and the Investment Company Act of 1940, this report has been signed below by the following persons on behalf of each registrant and in the capacities and on the dates indicated.
| | |
| By: | | /s/ John M. Perlowski |
| | John M. Perlowski |
| | Chief Executive Officer (principal executive officer) of |
| | BlackRock Index Funds, Inc. and Quantitative Master Series LLC |
|
| Date: September 3, 2015 |
| |
| By: | | /s/ Neal J. Andrews |
| | Neal J. Andrews |
| | Chief Financial Officer (principal financial officer) of |
| | BlackRock Index Funds, Inc. and Quantitative Master Series LLC |
|
Date: September 3, 2015 |
3