Exhibit 99.1
Freddie Mac Reports Full-Year 2018 Net Income of $9.2 Billion and
Comprehensive Income of $8.6 Billion
The Company's Transformed Business Model Continues to Produce Solid Financial and Business Results Full-Year 2018 Financial Results
| |
| • | Solid business revenues, strong credit quality and a higher guarantee portfolio balance delivered $8.6 billion of comprehensive income. |
| |
| • | GAAP comprehensive income increased 55% over the prior year; comprehensive income, excluding significant items, was $8.4 billion, an increase of approximately 4% over the same period. |
| |
| • | Although markets exhibited significant interest rate and spread volatility, especially during the fourth quarter of 2018, full-year market-related losses were limited to $0.5 billion. |
Fourth Quarter 2018 Financial Results
| |
| • | $1.5 billion in comprehensive income that included $0.6 billion in market-related losses will result in a $1.5 billion dividend requirement to the U.S. Treasury in March 2019; cumulative payments to date total $116.5 billion. |
|
|
| |
“Ten years after the financial crisis, Freddie Mac’s transformed business model continues to produce solid financial and business performance, with $8.6 billion of profits this year. We delivered almost $400 billion of liquidity to the U.S. mortgage markets - with a very strong focus on first-time homebuyers and affordable rentals. And we did it while transferring ever greater amounts of credit risk to the private capital markets and away from taxpayers. We’re serving our customers better every year and delivering good value to the taxpayers who support us during conservatorship. It’s a true success story.”
|
Donald H. Layton Chief Executive Officer |
| |
2018 Business Highlights
Producing Solid Results through Strong Business Fundamentals
| |
| • | Robust guarantee book growth over the prior year: Total guarantee portfolio grew 5% to $2.1 trillion. Single-family guarantee portfolio grew 4% as new business volume, net of lower single-family refinance volume, was accretive. Multifamily guarantee portfolio grew 17% as new business volume increased 7% to a record $78 billion. |
| |
| • | Strong credit quality: The single-family serious delinquency rate decreased to 0.69%, the lowest level since 2007, while the multifamily delinquency rate remained near zero, at 0.01%. |
| |
| • | Continued good return on conservatorship capital (ROCC)(1): The company's aggregate measure, while in conservatorship, of return-versus-risk continues to be above 10% for the year. |
Reducing Taxpayer Exposure to the Company's Risks(1)(2)
| |
| • | Risk as measured by conservatorship capital was significantly reduced: Declined $11 billion, or 16%, from the prior year, as less conservatorship capital was needed due to home price appreciation plus management actions, primarily the disposition of legacy assets and the transfer of credit risk. |
| |
| • | Risk reduction of new guarantees, after a securitization period, reflects the company's CRT-intensive business model: |
| |
| ▪ | Single-family: Reduced conservatorship capital needed for credit risk by approximately 60% on new business activity in the twelve months ended December 31, 2017. |
| |
| ▪ | Multifamily: Reduced conservatorship capital needed for credit risk by approximately 90% on new business activity in the twelve months ended December 31, 2017. |
Expanding Opportunities for U.S. Homebuyers and Renters
| |
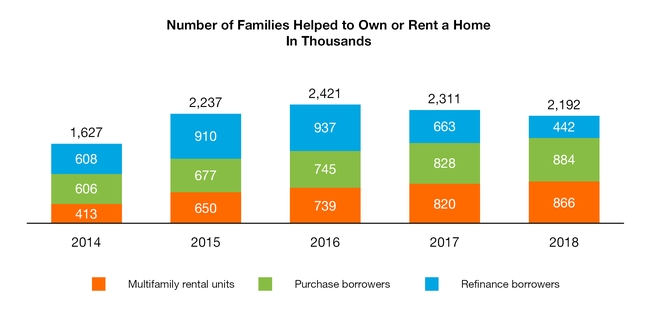
| • | Helped over 2 million families to own or rent a home in 2018; provided approximately $396 billion in liquidity to the mortgage market. |
| |
| • | Fulfilled the company's mission: First-time homebuyers represented nearly 46% of new purchase loans, while approximately 93% of the eligible multifamily rental units financed were affordable to families earning at or below 120% of area median incomes. |
|
| | | | | | | | | | | | | | | | | | |
| Amounts may not add due to rounding | | Full-Year | | Three Months Ended |
| (Dollars in billions) | | 2018 | | 2017 | | Change | | 12/31/2018 | | 9/30/2018 | | Change |
| GAAP comprehensive income | | $8.6 | | $5.6 | | $3.0 | | $1.5 | | $2.6 | | $(1.1) |
Total significant items(3) | | (0.2) | | 2.5 | | (2.7) | | — |
| | — |
| | — |
|
Comprehensive income, excluding significant items(3) | | $8.4 | | $8.1 | | $0.3 | | $1.5 | | $2.6 | | $(1.1) |
Conservatorship capital (average during the period)(1) | | $56.6 | | $67.6 | | $(11.0) | | $54.4 | | $56.5 | | $(2.1) |
ROCC, based on GAAP comprehensive income(1) | | 15.2 | % | | 8.2 | % | | 7.0 | % | | 10.9 | % | | 18.1 | % | | (7.2 | )% |
Adjusted ROCC, based on comprehensive income, excluding significant items(1)(3) | | 14.8 | % | | 11.9 | % | | 2.9 | % | | 10.9 | % | | 18.1 | % | | (7.2 | )% |
(1) See page 7 for additional information on FHFA's Conservatorship Capital Framework (CCF) and the Return on Conservatorship Capital.
(2) See pages 9-10 for information related to the reduction in conservatorship capital needed for credit risk.
(3) See pages 16-17 of this press release for additional details regarding Non-GAAP Financial Measures and reconciliations to the comparable amounts under GAAP.
Freddie Mac Fourth Quarter 2018 Financial Results
February 14, 2019
Page 2
McLean, VA — Freddie Mac (OTCQB: FMCC) today reported net income of $9.2 billion for the full-year 2018, compared to net income of $5.6 billion for the full-year 2017. The company also reported comprehensive income of $8.6 billion for the full-year 2018, compared to comprehensive income of $5.6 billion for the full-year 2017.
Summary of Consolidated Statements of Comprehensive Income (Loss)
|
| | | | | | | | | | | | |
| | | Full-Year | | Three Months Ended |
| (Dollars in millions) | | 2018 | | 2017 | | Change | | 12/31/2018 | | 9/30/2018 | | Change |
| Net interest income | | $12,021 | | $14,164 | | $(2,143) | | $2,743 | | $3,257 | | $(514) |
| Benefit (provision) for credit losses | | 736 | | 84 | | 652 | | 359 | | 380 | | (21) |
| Net interest income after benefit (provision) for credit losses | | 12,757 | | 14,248 | | (1,491) | | 3,102 | | 3,637 | | (535) |
| Non-interest income (loss): | | | | | | | | | | | |
|
| Guarantee fee income | | 811 | | 662 | | 149 | | 208 | | 209 | | (1) |
| Mortgage loans gains (losses) | | 724 | | 2,026 | | (1,302) | | 491 | | 94 | | 397 |
| Investment securities gains (losses) | | (695) | | 1,036 | | (1,731) | | 329 | | (443) | | 772 |
| Debt gains (losses) | | 720 | | 151 | | 569 | | 275 | | 158 | | 117 |
| Derivative gains (losses) | | 1,270 | | (1,988) | | 3,258 | | (1,704) | | 728 | | (2,432) |
| Other income (loss) | | 714 | | 4,982 | | (4,268) | | 66 | | 79 | | (13) |
| Total non-interest income (loss) | | 3,544 | | 6,869 | | (3,325) | | (335) | | 825 | | (1,160) |
| Non-interest expense: | | | | | | | | | | | |
|
| Administrative expense | | (2,293) | | (2,106) | | (187) | | (646) | | (569) | | (77) |
| Real estate owned operations expense | | (169) | | (189) | | 20 | | (82) | | (38) | | (44) |
| Temporary Payroll Tax Cut Continuation Act of 2011 expense | | (1,484) | | (1,340) | | (144) | | (384) | | (375) | | (9) |
| Other expense | | (881) | | (648) | | (233) | | (262) | | (218) | | (44) |
| Total non-interest expense | | (4,827) | | (4,283) | | (544) | | (1,374) | | (1,200) | | (174) |
| Income before income tax (expense) benefit | | 11,474 | | 16,834 | | (5,360) | | 1,393 | | 3,262 | | (1,869) |
| Income tax (expense) benefit | | (2,239) | | (11,209) | | 8,970 | | (293) | | (556) | | 263 |
| Net income (loss) | | 9,235 | | 5,625 | | 3,610 | | 1,100 | | 2,706 | | (1,606) |
| Total other comprehensive income (loss), net of taxes and reclassification adjustments | | (613) | | (67) | | (546) | | 378 | | (147) | | 525 |
| Comprehensive income (loss) | | $8,622 | | $5,558 | | $3,064 | | $1,478 | | $2,559 | | $(1,081) |
Financial Results Discussion
Full-Year 2018 Financial Results – Freddie Mac’s full-year 2018 net income of $9.2 billion and comprehensive income of $8.6 billion increased $3.6 billion and $3.1 billion, respectively, from the full-year 2017. The improved results in 2018 primarily reflect two significant items in 2017, a $5.4 billion write-down of the company's net deferred tax asset resulting from tax reform legislation, partially offset by a $4.5 billion, or $2.9 billion after-tax, benefit from a litigation settlement related to non-agency mortgage-related securities, combined with lower income tax expense due to the reduction in the statutory corporate income tax rate in 2018.
| |
| • | Market-related losses of approximately $0.5 billion, after-tax, for 2018 resulted almost entirely from interest rate impacts(1). |
Fourth Quarter 2018 Financial Results – The company’s fourth quarter 2018 net income of $1.1 billion and comprehensive income of $1.5 billion decreased $1.6 billion and $1.1 billion, respectively, from the third quarter of 2018, driven primarily by market-related losses.
| |
| • | Significant interest rate and spread volatility in the fourth quarter of 2018 produced market-related losses of approximately $0.6 billion, after-tax, with approximately half from interest rate impacts(1) and half from market spread impacts. |
(1) Net of hedge accounting amortization.
Freddie Mac Fourth Quarter 2018 Financial Results
February 14, 2019
Page 3
Selected Financial Measures
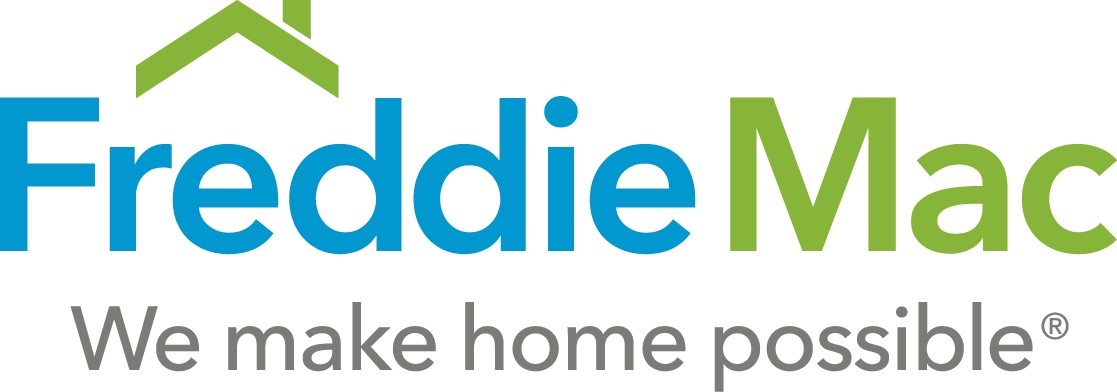
Net Interest Income
$ Billions
Full-Year 2018
| |
| • | Net interest income decreased $2.2 billion from the full-year 2017 driven by a reduction in the balances of the mortgage-related investments portfolio and the other investments portfolio, combined with $0.9 billion in hedge accounting impacts for the full-year 2018 due to the adoption of amended hedge accounting guidance in the fourth quarter of 2017. |
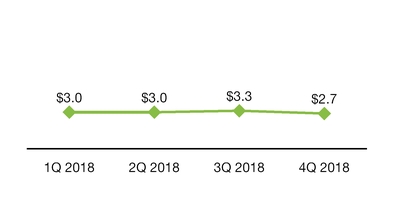
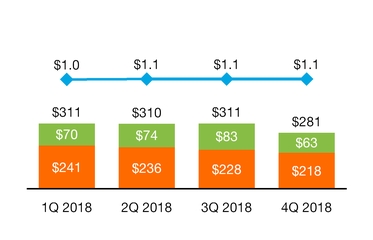
Guarantee Fee Income(1) and Multifamily Guarantee Portfolio
|
| | | | |
| | | | | Guarantee Fee Income ($M) |
| | | | |
| | | | |
| | | | | Multifamily Guarantee Portfolio ($B) |
(1) Guarantee fee income on a GAAP basis is primarily from the company’s multifamily business.
Full-Year 2018
| |
| • | Guarantee fee income increased $149 million from the full-year 2017 primarily due to continued growth in the multifamily guarantee portfolio. |
Freddie Mac Fourth Quarter 2018 Financial Results
February 14, 2019
Page 4
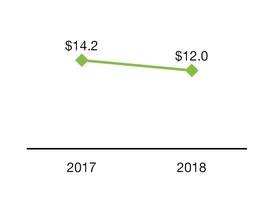
Benefit (Provision) for Credit Losses
$ Millions
Full-Year 2018
| |
| • | Benefit for credit losses increased $652 million during 2018, primarily driven by estimated losses from the hurricanes in 2017. |
Non-GAAP Financial Measure Highlights
In addition to analyzing the company’s results on a GAAP basis, management reviews net interest income and guarantee fee income on an “adjusted,” or non-GAAP, basis. These adjusted financial measures are calculated by reclassifying certain credit guarantee-related activities and investment-related activities between various line items on the company’s GAAP consolidated statements of comprehensive income. Management believes these non-GAAP financial measures are useful because they more clearly reflect the company’s sources of revenue.
The company also considers whether certain significant items occurred during the quarter that are not indicative of ongoing operations. If so, the company presents a non-GAAP financial measure for comprehensive income that is calculated by excluding these significant items from GAAP comprehensive income. The company also presents a non-GAAP financial measure, adjusted return on conservatorship capital, that is calculated based on comprehensive income, excluding significant items. Management believes that both of these non-GAAP financial measures are useful because they allow users to better understand the drivers of the company's on-going financial results.
For additional information about the company's non-GAAP financial measures and reconciliations to the comparable amounts under GAAP, see pages 16 - 17 of this press release.
The graphs that follow show the company's non-GAAP financial measures for adjusted net interest income and adjusted guarantee fee income.
Freddie Mac Fourth Quarter 2018 Financial Results
February 14, 2019
Page 5
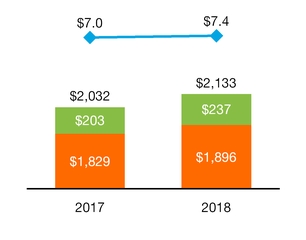
Adjusted Net Interest Income(1) and Investments Portfolio
$ Billions
|
| | | | |
| | | | | Adjusted Net Interest Income |
| | | | |
| | | | |
| | | | | Other Investments Portfolio |
| | | | | |
| | | | | Mortgage-related Investments Portfolio |
| |
| (1) | Non-GAAP financial measure. For reconciliations to the comparable amounts under GAAP, see page 15 of this press release. |
Note: Amounts may not add due to rounding.
Full-Year 2018
| |
| • | Adjusted net interest income decreased $0.2 billion from the full-year 2017, which primarily reflected a decline in the company’s investments portfolio, partially offset by higher net interest yield on both mortgage-related securities and other investments. |
| |
| • | The mortgage-related investments portfolio declined $35 billion, or 14%, from the prior year, ending 2018 at $218 billion, below the 2018 year-end Purchase Agreement cap of $250 billion. |
| |
| ▪ | The balances of liquid assets and securitization pipeline assets at December 31, 2018 were $120 billion and $32 billion, respectively, together representing approximately 70% of the mortgage-related investments portfolio. |
| |
| ▪ | The balance of less liquid assets declined $22 billion, or 25%, from year-end 2017 to $66 billion at December 31, 2018 primarily due to repayments and active dispositions, such as sales and securitization of single-family reperforming loans and sales of single-family non-agency mortgage-related securities. |
| |
| – | The balance of non-agency mortgage-related securities was $2 billion at year-end 2018, a decline of $3 billion, or 59%, from year-end 2017. |
Freddie Mac Fourth Quarter 2018 Financial Results
February 14, 2019
Page 6
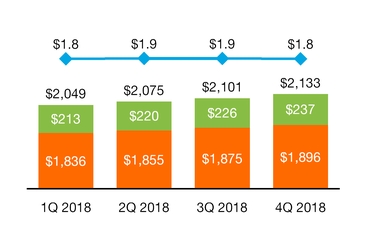
Adjusted Guarantee Fee Income(1) and Total Guarantee Portfolio
$ Billions
|
| | | | |
| | | | | Adjusted Guarantee Fee Income |
| | | | |
| | | | |
| | | | | Multifamily Guarantee Portfolio |
| | | | | |
| | | | | Single-family Credit Guarantee Portfolio |
| |
| (1) | Non-GAAP financial measure. For reconciliations to the comparable amounts under GAAP, see page 15 of this press release. |
Note: Amounts may not add due to rounding.
Full-Year 2018
| |
| • | Continued growth of the total guarantee portfolio drove a $0.4 billion increase in adjusted guarantee fee income from the full-year 2017. |
| |
| ▪ | The total guarantee portfolio grew $101 billion, or 5%, in 2018, driven by a 4% increase in the single-family credit guarantee portfolio and a 17% increase in the multifamily guarantee portfolio. |
Freddie Mac Fourth Quarter 2018 Financial Results
February 14, 2019
Page 7
Return on Conservatorship Capital
In May 2017, FHFA, as Conservator, issued guidance to Freddie Mac to evaluate and manage its financial risk and to make economic business decisions, while in conservatorship, utilizing a newly-developed risk-based Conservatorship Capital Framework (CCF). This framework focuses on the profits earned versus an estimated cost of equity capital needed to support the risk assumed to generate those profits. Management uses this framework in its decision-making. The company refers to the capital needed under the CCF for analysis of transactions and businesses as "conservatorship capital."
The table below provides the ROCC, calculated as (1) annualized comprehensive income for the period divided by (2) average conservatorship capital during the period. If significant items were identified during the period, the company also calculates the return using both (1) GAAP comprehensive income and (2) comprehensive income, excluding significant items(1). All modeled conservatorship capital figures presented below are based on the CCF as of December 31, 2018.
The ROCC shown in the table below is not based on the company's total equity and does not reflect actual returns on total equity. The company does not believe that returns on total equity are meaningful because of the current $3.0 billion limit on the amount of total equity that it is able to permanently retain under the Purchase Agreement. In addition, the company believes that returns post-conservatorship would likely be lower than the levels calculated below, assuming the same portfolio of risk assets, as it expects that it would hold capital above the minimum required regulatory capital levels and that it may be required to pay fees for federal government support, thereby reducing its total comprehensive income.
Returns on Conservatorship Capital
|
| | | | | | | | | | | | | | | | | | |
| | | Full-Year | | Three Months Ended |
| (Dollars in billions) | | 2018 | | 2017 | | Change | | 12/31/2018 | | 9/30/2018 | | Change |
| GAAP comprehensive income | | $8.6 | | $5.6 | | $3.0 | | $1.5 | | $2.6 | | $(1.1) |
| Significant items: | | | | | | | | | | | | |
Non-agency mortgage-related securities settlement and judgment(1) | | (0.3) | | (4.5) | | 4.2 | | — |
| | — |
| | — |
|
Tax effect related to settlement and judgment(1) | | 0.1 | | 1.6 | | (1.5) | | — |
| | — |
| | — |
|
Write-down of net deferred tax asset(1) | | — |
| | 5.4 | | (5.4) | | — |
| | — |
| | — |
|
Total significant items(2) | | (0.2) | | 2.5 | | (2.7) | | — |
| | — |
| | — |
|
Comprehensive income, excluding significant items(1)(2) | | $8.4 | | $8.1 | | $0.3 | | $1.5 | | $2.6 | | $(1.1) |
Conservatorship capital (average during the period)(3) | | $56.6 | | $67.6 | | $(11.0) | | $54.4 | | $56.5 | | $(2.1) |
ROCC, based on GAAP comprehensive income(1)(3) | | 15.2 | % | | 8.2 | % | | 7.0 | % | | 10.9 | % | | 18.1 | % | | (7.2 | )% |
Adjusted ROCC, based on comprehensive income, excluding significant items(1)(2)(3) | | 14.8 | % | | 11.9 | % | | 2.9 | % | | 10.9 | % | | 18.1 | % | | (7.2 | )% |
(1) See pages 16-17 of this press release for additional details regarding Non-GAAP Financial Measures and reconciliations to the comparable amounts under GAAP.
(2) No significant items were identified for the third or fourth quarter of 2018. Numbers for the third and fourth quarter of 2018 are included for comparison purposes only.
(3) Prior period conservatorship capital results have been revised to include capital for deferred tax assets.
Note: Amounts may not add due to rounding.
The company's 2018 ROCC, based on GAAP comprehensive income, increased compared to the 2017 return, partially driven by the increase in GAAP comprehensive income in 2018. The increase in comprehensive income primarily reflected the two significant items in 2017 in the table above. In addition, both 2018 ROCC and 2018 Adjusted ROCC increased compared to the 2017 returns due to the lower level of conservatorship capital needed in 2018, resulting from home price appreciation, the efficient disposition of legacy assets, and the increasing credit risk transfer activity in both the Single-family Guarantee and Multifamily segments.
For additional information on the Conservatorship Capital Framework and the Return on Conservatorship Capital, see the company’s Annual Report on Form 10-K for the year ended December 31, 2018. For additional information about the company's non-GAAP financial measure of comprehensive income, excluding significant items, and reconciliations to the comparable amount under GAAP, see pages 16 - 17 of this press release.
Freddie Mac Fourth Quarter 2018 Financial Results
February 14, 2019
Page 8
Segment Financial Results and Business Highlights
Freddie Mac’s operations consist of three reportable segments, which are based on the types of business activities they perform – Single-family Guarantee, Multifamily and Capital Markets. The company presents Segment Earnings for each reportable segment by reclassifying certain credit guarantee-related activities and investment-related activities between various line items on its GAAP consolidated statements of comprehensive income and allocating certain revenues and expenses, including funding costs and administrative expenses, to its three reportable segments.
During the fourth quarter of 2018, the company changed how it calculates certain components of its Segment Earnings for the Single-family Guarantee and Capital Markets segments. The purpose of this change is to more closely align Segment Earnings results relative to business operations and to better reflect how management evaluates the Single-family Guarantee and Capital Markets segments. Prior period results have been revised to conform to the current period presentation.
For more information about Segment Earnings, see Note 13 to the financial statements included in the company’s Annual Report on Form 10-K for the year ended December 31, 2018.
Single-family Guarantee Segment
Providing liquidity to the market while transforming U.S. housing finance
Financial Results(1) |
| | | | | | | | | | | | | |
| | | Full-Year | | Three Months Ended |
| (Dollars in millions) | | 2018 | | 2017 | | Change | | 12/31/2018 | | 9/30/2018 | | Change |
| Guarantee fee income | | $6,570 | | $6,350 | | $220 | | $1,637 | | $1,675 | | $(38) |
| Benefit (provision) for credit losses | | 522 | | (770) | | 1,292 | | 156 | | 206 | | (50) |
Financial instrument gains (losses)(2) | | 174 | | (245) | | 419 | | 132 | | (6) | | 138 |
| Other non-interest income (loss) | | 905 | | 1,838 | | (933) | | 312 | | 388 | | (76) |
| Administrative expense | | (1,491) | | (1,381) | | (110) | | (420) | | (372) | | (48) |
| REO operations income (expense) | | (189) | | (203) | | 14 | | (88) | | (42) | | (46) |
| Other non-interest expense | | (1,639) | | (1,382) | | (257) | | (447) | | (412) | | (35) |
| Segment Earnings before income tax expense | | 4,852 | | 4,207 | | 645 | | 1,282 | | 1,437 | | (155) |
| Income tax expense | | (944) | | (1,448) | | $504 | | (258) | | (254) | | (4) |
| Segment Earnings, net of taxes | | $3,908 | | $2,759 | | $1,149 | | $1,024 | | $1,183 | | $(159) |
| Total other comprehensive income (loss), net of tax | | (3) | | 40 | | (43 | ) | | 6 | | (2) | | 8 |
| Total comprehensive income (loss) | | $3,905 | | $2,799 | | $1,106 | | $1,030 | | $1,181 | | $(151) |
(1) The financial performance of the company’s Single-family Guarantee segment is measured based on its contribution to GAAP net income (loss).
(2) Consists of fair value gains and losses on debt for which the company has elected the fair value option and derivatives.
| |
| • | Segment earnings increased $1.1 billion from the full-year 2017 due to the increased benefit for credit losses during 2018, primarily driven by estimated losses from the hurricanes in 2017. |
Business Highlights
| |
| • | New business activity was $308 billion for the full-year 2018, a decrease of $36 billion, or 10%, from the full-year 2017. |
| |
| ▪ | Home purchase volume increased 8% while refinance volume decreased 35%. |
| |
| • | Single-family credit guarantee portfolio increased 4% from the prior year to $1,896 billion at December 31, 2018. |
| |
| ▪ | Core loan portfolio (loans purchased after 2008 and excluding HARP and other relief refinance loans) continued to grow and was 82% of the single-family credit guarantee portfolio at December 31, 2018. |
| |
| • | Average guarantee fees charged on new acquisitions were 41 basis points (net of the legislated 10 basis point guarantee fee remitted to Treasury as part of the Temporary Payroll Tax Cut Continuation Act of 2011) for the full-year 2018, substantially unchanged from the full-year 2017. |
Freddie Mac Fourth Quarter 2018 Financial Results
February 14, 2019
Page 9
| |
| ▪ | Average guarantee fees on the single-family credit guarantee portfolio were 35 basis points for the full-year 2018, down from 36 basis points for the prior year. |
| |
| • | As of December 31, 2018, the company had cumulatively transferred a portion of credit risk on nearly $1.2 trillion of single-family mortgages, based upon the UPB at issuance of the CRT transactions. |
| |
| ▪ | Conservatorship capital needed for credit risk was reduced by approximately 60%(1) through CRT transactions on new business activity in the twelve months ended December 31, 2017. |
| |
| ▪ | In September 2018, the company modified its primary CRT structure to reduce conservatorship capital needed for credit risk by approximately 80% on related new business activity. This modified structure sells more of the first loss position and extends the maturity from 12.5 to 30 years. |
| |
| • | Provided funding for more than 1.3 million single-family homes, more than 884 thousand of which were home purchase loans, in the year ended December 31, 2018. |
(1) The reduction in the amount of conservatorship capital needed for credit risk on new business activity is calculated as conservatorship credit capital released from CRT transactions (primarily STACR and ACIS) divided by total conservatorship credit capital on new business activity at the time of purchase.
Multifamily Segment
Leading through innovation
Financial Results(1)
|
| | | | | | | | | | | | |
| | | Full-Year | | Three Months Ended |
| (Dollars in millions) | | 2018 | | 2017 | | Change | | 12/31/2018 | | 9/30/2018 | | Change |
| Net interest income | | $1,096 | | $1,206 | | $(110) | | $250 | | $281 | | $(31) |
| Guarantee fee income | | 817 | | 676 | | 141 | | 209 | | 210 | | (1) |
| Benefit (provision) for credit losses | | 24 | | (13) | | 37 | | 3 | | 2 | | 1 |
Financial instrument gains (losses)(2) | | (1) | | 1,504 | | (1,505) | | (691) | | 266 | | (957) |
| Administrative expense | | (437) | | (395) | | (42) | | (123) | | (108) | | (15) |
| Other non-interest income (expense) | | 139 | | 96 | | 43 | | 43 | | 11 | | 32 |
| Segment Earnings before income tax expense | | 1,638 | | 3,074 | | (1,436) | | (309) | | 662 | | (971) |
| Income tax expense | | (319) | | (1,060) | | 741 | | 56 | | (113) | | 169 |
| Segment Earnings, net of taxes | | 1,319 | | 2,014 | | (695) | | (253) | | 549 | | (802) |
| Total other comprehensive income (loss), net of tax | | (83) | | (77) | | (6) | | 54 | | (44) | | 98 |
| Total comprehensive income (loss) | | $1,236 | | $1,937 | | $(701) | | $(199) | | $505 | | $(704) |
(1) The financial performance of the company’s Multifamily segment is measured based on its contribution to GAAP comprehensive income (loss).
(2) Consists of fair value gains and losses on loan purchase commitments, mortgage loans and debt for which the company has elected the fair value option, investment securities and derivatives.
| |
| • | Comprehensive income decreased $0.7 billion from the full-year 2017 primarily driven by spread widening during 2018 which resulted in fair value losses on mortgage loans and commitments and mortgage-related securities. |
Business Highlights
| |
| • | New business activity was a record $78 billion for the full-year 2018, an increase of approximately 7% from the full-year 2017, while outstanding purchase commitments increased 29% to nearly $19 billion, primarily reflecting continued strong demand for multifamily loan products and continued competitive pricing efforts. |
| |
| ▪ | Capped multifamily new business activity was nearly $33 billion for the full-year 2018, while uncapped new business activity was nearly $45 billion in the same period. |
| |
| ◦ | The 2018 FHFA Conservatorship Scorecard goal was to maintain the dollar volume of annual capped multifamily new business activity at or below $35 billion. |
| |
| • | Multifamily guarantee portfolio increased 17% from the prior year to $237 billion at December 31, 2018 driven by strong new business activity. |
Freddie Mac Fourth Quarter 2018 Financial Results
February 14, 2019
Page 10
| |
| • | As of December 31, 2018, the company had cumulatively transferred the large majority of credit risk on the multifamily guarantee portfolio. |
| |
| ▪ | Conservatorship capital needed for credit risk was reduced by approximately 90%(1) through CRT transactions on new business activity in the twelve months ended December 31, 2017; the company plans similar risk reduction transactions for this year's new business activity. |
| |
| ▪ | The company executed CRT transactions, primarily via K Certificates and SB Certificates, on a record $70 billion in UPB for the full-year 2018 and on nearly $319 billion in UPB since 2009. |
| |
| ▪ | In addition to transferring a large majority of the expected and stress credit risk, nearly all of the company's risk transfer securitization activities also shifted substantially all the interest-rate and liquidity risk associated with the underlying collateral away from Freddie Mac to third-party investors. |
| |
| • | The company provided funding for approximately 866 thousand rental units in the year ended December 31, 2018. |
| |
| ▪ | Approximately 93% of the eligible units financed in the full-year 2018 were affordable to families earning at or below 120% of area median incomes. |
(1) The reduction in the amount of conservatorship capital needed for credit risk on new business activity is calculated as conservatorship credit capital released from CRT transactions (primarily through K Certificates and SB Certificates) divided by total conservatorship credit capital on new business activity.
Capital Markets Segment
Enhancing the liquidity of the company’s securities, reducing less liquid assets and funding the company's business activities
Financial Results(1)
|
| | | | | | | | | | | | | |
| | | Full-Year | | Three Months Ended |
| (Dollars in millions) | | 2018 | | 2017 | | Change | | 12/31/2018 | | 9/30/2018 | | Change |
| Net interest income | | $3,217 | | $3,279 | | $(62) | | $807 | | $845 | | $(38) |
| Investment securities gains (losses) | | (102) | | 1,048 | | (1,150 | ) | | 422 | | (336) | | 758 |
| Debt gains (losses) | | 531 | | 437 | | 94 |
| | 164 | | 137 | | 27 |
| Derivative gains (losses) | | 1,314 | | (587) | | 1,901 |
| | (725) | | 427 | | (1,152) |
| Other non-interest income (expense) | | 389 | | 5,706 | | (5,317 | ) | | (145) | | 180 | | (325) |
| Administrative expense | | (365) | | (330) | | (35 | ) | | (103) | | (89) | | (14) |
| Segment Earnings before income tax expense | | 4,984 | | 9,553 | | (4,569) | | 420 | | 1,164 | | (744) |
| Income tax expense | | (976) | | (3,296) | | 2,320 | | (91) | | (189) | | 98 |
| Segment Earnings, net of taxes | | 4,008 | | 6,257 | | (2,249) | | 329 | | 975 | | (646) |
| Total other comprehensive income (loss), net of tax | | (527) | | (30) | | (497) | | 319 | | (101) | | 420 |
| Total comprehensive income (loss) | | $3,481 | | $6,227 | | $(2,746) | | $648 | | $874 | | $(226) |
(1) The financial performance of the company’s Capital Markets segment is measured based on its contribution to GAAP comprehensive income (loss).
| |
| • | Comprehensive income decreased $2.7 billion from the full-year 2017 reflecting proceeds of $4.5 billion, $2.9 billion after-tax, from a litigation settlement with the Royal Bank of Scotland plc related to non-agency mortgage-related securities received in 2017. |
Business Highlights
| |
| • | The company continued to maintain a presence in the agency mortgage-related securities market to strategically support the guarantee business. |
| |
| ▪ | Liquid assets held by the Capital Markets segment were 68% of the portfolio, or $114 billion, at year-end 2018, compared to 66% of the portfolio, or $130 billion, at year-end 2017. |
| |
| ▪ | The overall liquidity of the mortgage investments portfolio continued to improve as less liquid assets decreased at a faster pace than the overall decline of the mortgage investments portfolio. |
| |
| • | The company continued to responsibly reduce the balance of the mortgage-related investments portfolio with a focus on reducing less liquid assets. |
Freddie Mac Fourth Quarter 2018 Financial Results
February 14, 2019
Page 11
| |
| ▪ | Less liquid assets were $45 billion at year-end 2018, down $11 billion, or 20%, from year-end 2017, primarily due to repayments, sales and securitizations of less liquid assets. |
| |
| ▪ | During 2018, sales of less liquid assets included $2.6 billion in UPB of non-agency mortgage-related securities and $9.5 billion in UPB of reperforming loans. During 2018, $1.6 billion in UPB of single-family reperforming loans were securitized through PC securitization. |
Housing Market Support
Freddie Mac supports the U.S. housing market by executing its charter mission to ensure credit availability for new and refinanced mortgages as well as rental housing and helping struggling homeowners avoid foreclosure.
Affordable Housing Goals – In December 2018, FHFA informed Freddie Mac that it achieved three of its five single-family housing goals and all three of its multifamily housing goals for 2017. At this time, based on preliminary information, the company believes it met all five of its single-family housing goals and its three multifamily housing goals for 2018. FHFA may not make a final determination on the company's 2018 performance until the release of market data in late 2019.
Preventing Foreclosures – Freddie Mac continued to help struggling borrowers retain their homes or otherwise avoid foreclosure, completing approximately 87 thousand single-family loan workouts in the full-year 2018.
Mortgage Funding – Freddie Mac provided approximately $396 billion in liquidity to the market in 2018, funding:
| |
| • | More than 1.3 million single-family homes, approximately 884 thousand of which were home purchase loans; and |
| |
| • | Approximately 866 thousand multifamily rental units. |
Freddie Mac Fourth Quarter 2018 Financial Results
February 14, 2019
Page 12
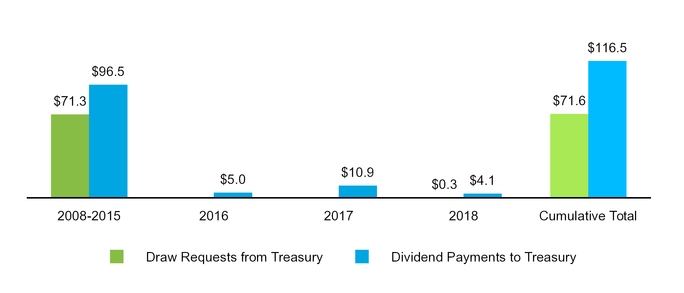
About Freddie Mac’s Conservatorship
Since September 2008, Freddie Mac has been operating under conservatorship with FHFA as Conservator. The support provided by Treasury pursuant to the Purchase Agreement enables the company to maintain access to the debt markets and have adequate liquidity to conduct its normal business operations.
Treasury Draw Requests(1) and Dividend Payments
$ Billions
| |
| (1) | Excludes the initial $1 billion liquidation preference of senior preferred stock issued to Treasury in September 2008 as consideration for Treasury’s funding commitment and the $3 billion increase in the aggregate liquidation preference of the senior preferred stock pursuant to the December 21, 2017 Letter Agreement. The company received no cash proceeds as a result of issuing the initial $1 billion liquidation preference of senior preferred stock or the $3.0 billion increase on December 31, 2017. |
Note: Amounts may not add due to rounding.
| |
| • | $1.5 billion dividend requirement to the U.S. Treasury in March 2019 based on the company's Net Worth Amount at December 31, 2018 of $4.5 billion less the applicable Capital Reserve Amount of $3.0 billion. |
| |
| • | The amount of funding available to Freddie Mac under the Purchase Agreement was $140.2 billion at December 31, 2018. |
| |
| • | Through December 31, 2018, aggregate cash dividends paid to Treasury were $44.9 billion more than cumulative cash draws received from Treasury. |
| |
| ▪ | The payment of dividends does not reduce the outstanding liquidation preference under the Purchase Agreement. |
| |
| • | The aggregate liquidation preference of the senior preferred stock was $75.6 billion at December 31, 2018. |
| |
| ▪ | The aggregate liquidation preference of the senior preferred stock includes the initial $1.0 billion liquidation preference plus amounts funded by Treasury under the Purchase Agreement, as well as $3.0 billion added pursuant to the Letter Agreement. |
Freddie Mac Fourth Quarter 2018 Financial Results
February 14, 2019
Page 13
Additional Information
For more information, including information related to Freddie Mac’s financial results, conservatorship and related matters, see the company’s Annual Report on Form 10-K for the year ended December 31, 2018 and the company’s Financial Results Supplement. These documents are available on the Investor Relations page of the company’s website at www.FreddieMac.com/investors.
Additional information about Freddie Mac and its business is also set forth in the company’s other filings with the SEC, which are available on the Investor Relations page of the company’s website at www.FreddieMac.com/investors and the SEC’s website at www.sec.gov. Freddie Mac encourages all investors and interested members of the public to review these materials for a more complete understanding of the company’s financial results and related disclosures.
Webcast Announcement
Management will host a conference call at 9 a.m. Eastern Time on February 14, 2019 to discuss the company’s results with the media. The conference call will be concurrently webcast. To access the live audio webcast, use the following link: https://edge.media-server.com/m6/p/25h7k5vo. The replay will be available on the company’s website at www.FreddieMac.com/investors for approximately 30 days. All materials related to the call will be available on the Investor Relations page of the company’s website at www.FreddieMac.com/investors.
|
| | |
| | | |
| Media Contact: Frederick Solomon (703) 903-3861 | | Investor Contact: Laurie Garthune (571) 382-4732 |
| | | |
* * * *
This press release contains forward-looking statements, which may include statements pertaining to the conservatorship, the company’s current expectations and objectives for its Single-Family Guarantee, Multifamily and Capital Markets segments, its efforts to assist the housing market, liquidity and capital management, economic and market conditions and trends, market share, the effect of legislative and regulatory developments and new accounting guidance, credit quality of loans the company owns or guarantees, the costs and benefits of the company’s credit risk transfer transactions, and results of operations and financial condition on a GAAP, Segment Earnings, non-GAAP and fair value basis. Forward-looking statements involve known and unknown risks and uncertainties, some of which are beyond the company’s control. Management’s expectations for the company’s future necessarily involve a number of assumptions, judgments and estimates, and various factors, including changes in market conditions, liquidity, mortgage spreads, credit outlook, actions by the U.S. government (including FHFA, Treasury and Congress), and the impacts of legislation or regulations and new or amended accounting guidance, could cause actual results to differ materially from these expectations. These assumptions, judgments, estimates and factors are discussed in the company’s Annual Report on Form 10-K for the year ended December 31, 2018, which is available on the Investor Relations page of the company’s website at www.FreddieMac.com/investors and the SEC’s website at www.sec.gov. The company undertakes no obligation to update forward-looking statements it makes to reflect events or circumstances occurring after the date of this press release.
Freddie Mac makes home possible for millions of families and individuals by providing mortgage capital to lenders. Since its creation by Congress in 1970, the company has made housing more accessible and affordable for homebuyers and renters in communities nationwide. The company is building a better housing finance system for homebuyers, renters, lenders and taxpayers. Learn more at FreddieMac.com, Twitter @FreddieMac and Freddie Mac’s blog FreddieMac.com/blog.
Freddie Mac Fourth Quarter 2018 Financial Results
February 14, 2019
Page 14
FREDDIE MAC
Consolidated Statements of Comprehensive Income (Loss)
|
| | | | | | | | |
| | | Twelve Months Ended | | Three Months Ended |
(in millions, except share-related amounts) | | December 31, 2018 | | December 31, 2017 | | December 31, 2018 | | September 30, 2018 |
| Interest income | | | | | | | | |
| Mortgage loans | | $66,037 | | $63,735 | | $16,955 | | $16,787 |
| Investments in securities | | 3,035 | | 3,415 | | 740 | | 755 |
| Other | | 982 | | 657 | | 279 | | 261 |
| Total interest income | | 70,054 | | 67,807 | | 17,974 | | 17,803 |
| Interest expense | | (58,033) | | (53,643) | | (15,231) | | (14,546) |
| Net interest income | | 12,021 | | 14,164 | | 2,743 | | 3,257 |
| Benefit (provision) for credit losses | | 736 | | 84 | | 359 | | 380 |
| Net interest income after benefit (provision) for credit losses | | 12,757 | | 14,248 | | 3,102 | | 3,637 |
| Non-interest income (loss) | | | | | | | | |
| Guarantee fee income | | 811 | | 662 | | 208 | | 209 |
| Mortgage loans gains (losses) | | 724 | | 2,026 | | 491 | | 94 |
| Investment securities gains (losses) | | (695) | | 1,036 | | 329 | | (443) |
| Debt gains (losses) | | 720 | | 151 | | 275 | | 158 |
| Derivative gains (losses) | | 1,270 | | (1,988) | | (1,704) | | 728 |
| Other income (loss) | | 714 | | 4,982 | | 66 | | 79 |
| Non-interest income (loss) | | 3,544 | | 6,869 | | (335) | | 825 |
| Non-interest expense | | | | | | | | |
| Salaries and employee benefits | | (1,227) | | (1,098) | | (337) | | (301) |
| Professional services | | (486) | | (452) | | (151) | | (120) |
| Other administrative expense | | (580) | | (556) | | (158) | | (148) |
| Total administrative expense | | (2,293) | | (2,106) | | (646) | | (569) |
| Real estate owned operations expense | | (169) | | (189) | | (82) | | (38) |
| Temporary Payroll Tax Cut Continuation Act of 2011 expense | | (1,484) | | (1,340) | | (384) | | (375) |
| Other expense | | (881) | | (648) | | (262) | | (218) |
| Non-interest expense | | (4,827) | | (4,283) | | (1,374) | | (1,200) |
| Income (loss) before income tax expense | | 11,474 | | 16,834 | | 1,393 | | 3,262 |
| Income tax (expense) benefit | | (2,239) | | (11,209) | | (293) | | (556) |
| Net income (loss) | | 9,235 | | 5,625 | | 1,100 | | 2,706 |
| Other comprehensive income (loss), net of taxes and reclassification adjustments: | | | | | | | | |
| Changes in unrealized gains (losses) related to available-for-sale securities | | (722) | | (253) | | 343 | | (169) |
| Changes in unrealized gains (losses) related to cash flow hedge relationships | | 114 | | 124 | | 27 | | 25 |
| Changes in defined benefit plans | | (5) | | 62 | | 8 | | (3) |
| Total other comprehensive income (loss), net of taxes and reclassification adjustments | | (613) | | (67) | | 378 | | (147) |
| Comprehensive income (loss) | | $8,622 | | $5,558 | | $1,478 | | $2,559 |
| Net income (loss) | | $9,235 | | $5,625 | | $1,100 | | $2,706 |
| Undistributed net worth sweep and senior preferred stock dividends | | (5,623) | | (8,869) | | (1,479) | | (2,559) |
| Net income (loss) attributable to common stockholders | | $3,612 | | $(3,244) | | $(379) | | $147 |
| Net income (loss) per common share — basic and diluted | | $1.12 | | $(1.00) | | $(0.12) | | $0.05 |
| Weighted average common shares outstanding (in millions) — basic and diluted | | 3,234 | | 3,234 | | 3,234 | | 3,234 |
Freddie Mac Fourth Quarter 2018 Financial Results
February 14, 2019
Page 15
FREDDIE MAC
Consolidated Balance Sheets
|
| | | | | | |
| | | As of December 31, |
(in millions, except share-related amounts)
| | 2018 | | 2017 |
| Assets | | | | |
| Cash and cash equivalents (include $596 and $2,963 of restricted cash and cash equivalents) | | $7,273 | | $9,811 |
| Securities purchased under agreements to resell | | 34,771 |
| | 55,903 |
|
| Investments in securities, at fair value | | 69,111 |
| | 84,318 |
|
| Mortgage loans held-for-sale (includes $23,106 and $20,054 at fair value) | | 41,622 |
| | 34,763 |
|
| Mortgage loans held-for-investment (net of allowance for loan losses of $6,139 and $8,966) | | 1,885,356 |
| | 1,836,454 |
|
| Accrued interest receivable | | 6,728 |
| | 6,355 |
|
| Derivative assets, net | | 335 |
| | 375 |
|
| Deferred tax assets, net | | 6,888 |
| | 8,107 |
|
| Other assets (includes $3,929 and $3,353 at fair value) | | 10,976 |
| | 13,690 |
|
| Total assets | | $2,063,060 | | $2,049,776 |
| Liabilities and equity | | | | |
| Liabilities | | | | |
| Accrued interest payable | | $6,652 | | $6,221 |
| Debt, net (includes $5,112 and $5,799 at fair value) | | 2,044,950 |
| | 2,034,630 |
|
| Derivative liabilities, net | | 583 |
| | 269 |
|
| Other liabilities | | 6,398 |
| | 8,968 |
|
| Total liabilities | | 2,058,583 |
| | 2,050,088 |
|
| Commitments and contingencies | | | | |
| Equity | | | | |
| Senior preferred stock (redemption value of $75,648 and $75,336) | | 72,648 |
| | 72,336 |
|
| Preferred stock, at redemption value | | 14,109 |
| | 14,109 |
|
| Common stock, $0.00 par value, 4,000,000,000 shares authorized, 725,863,886 shares issued and 650,058,775 shares and 650,054,731 shares outstanding | | — |
| | — |
|
| Additional paid-in capital | | — |
| | — |
|
| Retained earnings (accumulated deficit) | | (78,260 | ) | | (83,261 | ) |
| AOCI, net of taxes, related to: | | | | |
| Available-for-sale securities (includes $221 and $593, related to net unrealized gains on securities for which other-than-temporary impairment has been recognized in earnings) | | 83 |
| | 662 |
|
| Cash flow hedge relationships | | (315 | ) | | (356 | ) |
| Defined benefit plans | | 97 |
| | 83 |
|
| Total AOCI, net of taxes | | (135 | ) | | 389 |
|
| Treasury stock, at cost, 75,805,111 shares and 75,809,155 shares | | (3,885 | ) | | (3,885 | ) |
| Total equity | | 4,477 |
| | (312 | ) |
| Total liabilities and equity | | $2,063,060 | | $2,049,776 |
| The table below presents the carrying value and classification of the assets and liabilities of consolidated variable-interest entities (VIEs) on the company's consolidated balance sheets. |
| | | | | |
| | | As of December 31, |
(in millions)
| | 2018 | | 2017 |
| Consolidated Balance Sheet Line Item | | | | |
| Assets: | | | | |
| Mortgage loans held-for-investment | | 1,842,850 | | 1,774,286 |
| All other assets | | 20,237 | | 25,753 |
| Total assets of consolidated VIEs | | $1,863,087 | | $1,800,039 |
| Liabilities: | | | | |
| Debt, net | | 1,792,677 | | 1,720,996 |
| All other liabilities | | 5,335 | | 5,030 |
| Total liabilities of consolidated VIEs | | $1,798,012 | | $1,726,026 |
Freddie Mac Fourth Quarter 2018 Financial Results
February 14, 2019
Page 16
FREDDIE MAC
Non-GAAP Reconciliations
|
| | | | | | | | | | | | | | | | | | |
| The company’s GAAP net interest income includes the spread earned on its investments activities plus the guarantee fees earned by its single-family business. Adjusted net interest income is the net spread earned on the company’s investment activities, including the cost of funds associated with using derivatives. |
| Reconciliation of GAAP Net Interest Income to Adjusted Net Interest Income (pre-tax) |
| (Dollars in millions) | | 1Q 2018 | | 2Q 2018 | | 3Q 2018 | | 4Q 2018 | | 2017 | | 2018 |
| GAAP net interest income | | $3,018 | | $3,003 | | $3,257 | | $2,743 | | $14,164 | | $12,021 |
| Reclassifications: | | | | | | | | | | | | |
Guarantee fee income reclassified to adjusted guarantee fee income (1) (2) | | (1,950 | ) | | (2,037 | ) | | (2,051 | ) | | (2,022 | ) | | (7,704 | ) | | (8,060 | ) |
Accrual of periodic cash settlements reclassified from derivative gain (loss) (3) | | (145 | ) | | (43 | ) | | 27 |
| | 20 |
| | (1,590 | ) | | (141 | ) |
Hedge accounting impact (4) | | 373 |
| | 214 |
| | 34 |
| | 310 |
| | (7 | ) | | 931 |
|
Other reclassifications (5) | | (254 | ) | | (49 | ) | | (141 | ) | | 6 |
| | (378 | ) | | (438 | ) |
| Total reclassifications | | (1,976 | ) | | (1,915 | ) | | (2,131 | ) | | (1,686 | ) | | (9,679 | ) | | (7,708 | ) |
| Adjusted net interest income | | $1,042 | | $1,088 | | $1,126 | | $1,057 | | $4,485 | | $4,313 |
| GAAP guarantee fees are primarily those generated by the company's multifamily business. Adjusted guarantee fee income consists of the revenues from guarantee fees from both the single-family and multifamily businesses, net of the 10 basis point guarantee fee remitted to Treasury as part of the Temporary Payroll Tax Cut Continuation Act of 2011. |
| Reconciliation of GAAP Guarantee Fee Income to Adjusted Guarantee Fee Income (pre-tax) |
| (Dollars in millions) | | 1Q 2018 | | 2Q 2018 | | 3Q 2018 | | 4Q 2018 | | 2017 | | 2018 |
| GAAP guarantee fee income | | $194 | | $200 | | $209 | | $208 | | $662 | | $811 |
| Reclassifications: | | | | | | | | | | | | |
Guarantee fee income reclassified from net interest income (1) (2) | | 1,950 | | 2,037 | | 2,051 | | 2,022 | | 7,704 | | 8,060 |
Temporary Payroll Tax Cut Continuation Act of 2011 expense reclassified from other non-interest expense (6) | | (359) | | (366) | | (375) | | (384) | | (1,340) | | (1,484) |
| Total reclassifications | | 1,591 | | 1,671 | | 1,676 | | 1,638 | | 6,364 | | 6,576 |
| Adjusted guarantee fee income | | $1,785 | | $1,871 | | $1,885 | | $1,846 | | $7,026 | | $7,387 |
| The company also considers whether certain significant items were identified during the period that are not indicative of ongoing operations. If so, the company presents a non-GAAP financial measure for comprehensive income that is calculated by excluding these significant items from GAAP comprehensive income. |
| Reconciliation of GAAP Comprehensive Income to Comprehensive Income, excluding Significant Items |
| (Dollars in millions) | | 1Q 2018 | | 2Q 2018 | | 3Q 2018 | | 4Q 2018 | | 2017 | | 2018 |
| GAAP comprehensive income | | $2,150 | | $2,435 | | $2,559 | | $1,478 | | $5,558 | | $8,622 |
| Exclusions: | | | | | | | | | | | | |
Non-agency mortgage-related securities settlement and judgment (7) | | — |
| | (334) | | — |
| | — |
| | (4,525) | | (334) |
Tax effect related to litigation settlement and judgment(7) | | — |
| | 70 | | — |
| | — |
| | 1,584 | | 70 |
Write-down of net deferred tax asset (8) | | — |
| | — |
| | — |
| | — |
| | 5,405 | | — |
|
| Total exclusions | | — |
| | (264) | | — |
| | — |
| | 2,464 | | (264) |
| Comprehensive income, excluding significant items | | $2,150 | | $2,171 | | $2,559 | | $1,478 | | $8,022 | | $8,358 |
Note: Columns may not add due to rounding.
For notes on reclassifications, see page 17 of this press release.
Freddie Mac Fourth Quarter 2018 Financial Results
February 14, 2019
Page 17
During the fourth quarter of 2018, the company changed how it calculates certain components of its Segment Earnings for the Single-family Guarantee and Capital Markets segments, which affected its reported adjusted net interest income and adjusted guarantee fee income. For more information about these changes, see Note 13 to the financial statements included in the company’s Annual Report on Form 10-K for the year ended December 31, 2018. Prior period results have been revised to conform to the current period presentation.
Notes on Significant Reclassifications
(1) Net guarantee fees, including upfront fee amortization and implied guarantee fee income related to unsecuritized loans held in the mortgage-related investments portfolio, are reclassified from GAAP net interest income to adjusted guarantee fee income.
(2) Short-term returns on cash received related to certain upfront fees on single-family loans are reclassified from GAAP net interest income to adjusted guarantee fee income.
(3) The accrual of periodic cash settlements of derivatives is reclassified from GAAP derivative gains (losses) to adjusted net interest income to fully reflect the periodic cost associated with the protection provided by these contracts.
(4) Hedge accounting impact consists of removing the effects of hedge accounting including deferred gains and losses on closed cash flow hedges related to forecasted debt issuances.
(5) Other reclassifications primarily relate to items reclassified out of GAAP net interest income, including the amortization related to derivative commitment basis adjustments associated with mortgage-related and non-mortgage-related securities, amortization related to accretion of other-than-temporary impairments on available-for-sale securities, amortization of discounts on loans purchased with deteriorated credit quality that are on accrual status, amortization related to premiums and discounts, including non-cash premiums and discounts, on single-family loans in trusts and on the associated consolidated PCs, amortization related to premiums and discounts associated with PCs issued by consolidated trusts that were previously held and subsequently transferred to third parties, costs associated with STACR debt note expenses and internally allocated costs associated with the refinancing of debt related to Multifamily segment held-for-investment loans which were securitized.
(6) The expense related to the Temporary Payroll Tax Cut Continuation Act of 2011 is reclassified from GAAP other non-interest expense to adjusted guarantee fee income. As a result of the reclassification, the revenue and expense related to the legislated 10 basis point increase are netted within adjusted guarantee fee income.
(7) The 2017 GAAP results included a benefit of $4.5 billion (pre-tax) from a litigation settlement with the Royal Bank of Scotland plc related to non-agency mortgage-related securities. The tax effect related to this settlement was $(1.6) billion. The second quarter and full-year 2018 GAAP results included a gain of $334 million (pre-tax) from a final judgment against Nomura Holding America, Inc. in litigation involving certain non-agency mortgage-related securities. The tax effect related to this judgment was $(70) million. Comprehensive income, excluding significant items, excludes from GAAP comprehensive income the litigation settlement and the related tax effect in the third quarter of 2017 and the benefit from the final judgment and the related tax effect in the second quarter of 2018 as they related to non-agency mortgage-related securities in which the company no longer invests.
(8) The Tax Cuts and Jobs Act of 2017 enacted in December 2017 reduced the statutory corporate income tax rate from 35% to 21%. Although not effective until January 1, 2018, accounting rules require that the company measure its net deferred tax asset using the reduced rate in the period in which the legislation was enacted. Therefore, the company reduced its net deferred tax asset by $5.4 billion, with a corresponding charge to deferred income tax expense. This resulted in a decrease in both net income and comprehensive income in the fourth quarter of 2017. Comprehensive income, excluding significant items, excludes from GAAP comprehensive income the write-down of the net deferred tax asset in the fourth quarter of 2017 as the impact of the tax reform legislation is considered a one-time event.