Exhibit 99.1
Freddie Mac Reports Net Income of $7.3 Billion and
Comprehensive Income of $7.5 Billion for Full-Year 2020
Full-Year 2020 Financial Results
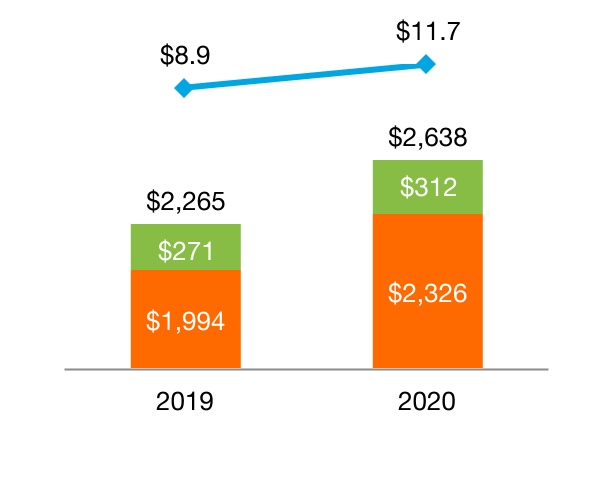
•Net income of $7.3 billion, up $0.1 billion, and comprehensive income of $7.5 billion, down $0.3 billion, from 2019, primarily driven by higher net revenues, partially offset by higher provision for credit losses.
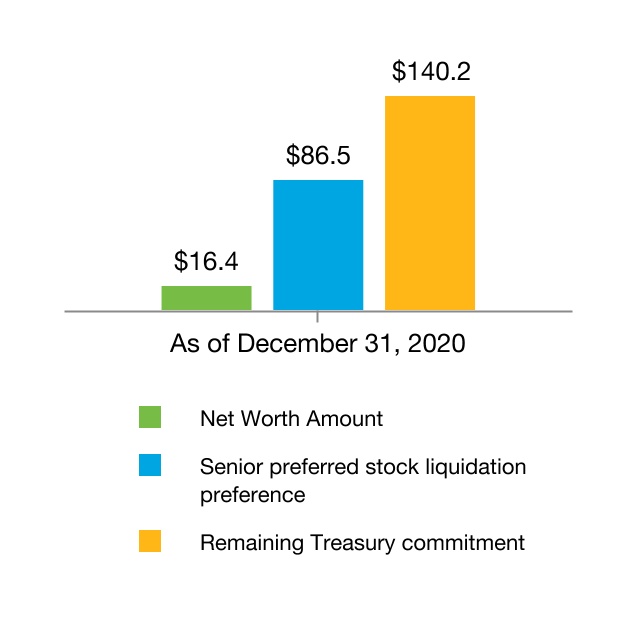
•Total equity/net worth(1) increased to $16.4 billion, from $9.1 billion at December 31, 2019.
Fourth Quarter 2020 Financial Results
•Net income of $2.9 billion and comprehensive income of $2.5 billion, up $0.4 billion and $0.1 billion, respectively, from the prior quarter, driven by a reserve release due primarily to realized house price growth during 4Q 2020.
| | |
|
"In 2020, Freddie Mac continued to serve the important role for which it was founded: supporting the housing market in all economic conditions. In the face of extraordinary economic uncertainty caused by COVID-19, we provided record liquidity, enabling millions of borrowers to purchase or refinance homes at historically low interest rates. We also helped hundreds of thousands of homeowners and renters affected by the pandemic avoid foreclosure and eviction. Our efforts are a testament to our people, our operating platform, our Conservator, and our many partners across the industry."
|
Christian M. Lown Chief Financial Officer |
|
•On January 14, 2021, FHFA, as Conservator, acting on behalf of Freddie Mac, entered into an agreement with Treasury that, among other items, allows Freddie Mac to continue to build capital by retaining earnings until it meets certain requirements in the Enterprise Regulatory Capital Framework (ERCF) and places additional restrictions on certain of its business activities.(2)
Providing Stability to the Housing Market, While Fulfilling Affordable Housing Mission(3)
•Continued to provide mortgage-relief options for borrowers affected by the COVID-19 pandemic, including forbearance programs for both single-family and multifamily borrowers.
•Extended moratorium on foreclosures and evictions until at least March 31, 2021.
•Extended temporary measures designed to provide flexibility to homeowners, sellers, and appraisers to expedite loan closings during the COVID-19 pandemic.
Executing on Business Fundamentals
•Single-Family new business activity of $1.1 trillion, up 141% from the prior year, reflecting higher home purchase and refinance activity.
•Multifamily new business activity of $83 billion, up 6% from the prior year.
•Single-Family and Multifamily guarantee portfolios grew 17% and 15%, respectively, year over year.
•Serious delinquency rate for Single-Family increased to 2.64%, from 0.63% at the end of the prior year, driven by loans in forbearance due to the COVID-19 pandemic.
•Multifamily delinquency rate, which does not include loans in forbearance, increased to 0.16% from 0.08% at the end of the prior year.
Managing Risk
•Completed nearly 426,000 single-family workouts, including forbearance agreements and payment deferrals, versus 47,000 workouts in the prior year.
•2.70% and 2.01% of the loans in the Single-Family guarantee portfolio and the Multifamily mortgage portfolio, respectively, were in forbearance as of December 31, 2020.
•51% and 88% of the loans in the Single-Family guarantee portfolio and the Multifamily mortgage portfolio, respectively, were covered by credit enhancements as of December 31, 2020.
(1) See page 12 for additional information about the company's net worth and increases in the aggregate liquidation preference of the senior preferred stock resulting from increases in the company's net worth pursuant to the September 2019 and January 2021 Letter Agreements.
(2) For additional information on the January 2021 Letter Agreement and ERCF, see the company's Annual Report on Form 10-K for the year ended December 31, 2020.
(3) See the company's Annual Report on Form 10-K for the year ended December 31, 2020 for additional information on the company's response efforts related to the COVID-19 pandemic and its outlook for 2021.
Freddie Mac Full-Year and Fourth Quarter 2020 Financial Results
February 11, 2021
Page 2
McLean, VA — Freddie Mac (OTCQB: FMCC) today reported net income of $7.3 billion for full-year 2020, an increase of 2% compared to net income of $7.2 billion for full-year 2019. The company also reported comprehensive income of $7.5 billion for full-year 2020, a decrease of 3% compared to comprehensive income of $7.8 billion for full-year 2019.
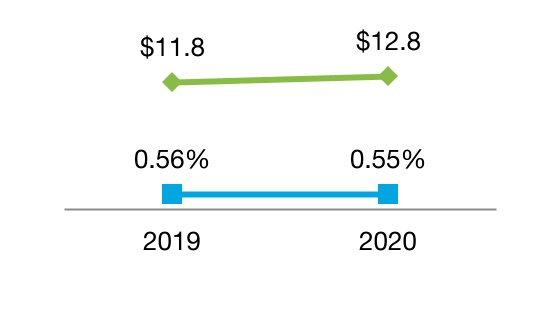
Net revenues were $16.7 billion, an increase of 18% compared to $14.1 billion for the prior year. Net interest income increased 8% to $12.8 billion, primarily driven by growth in the Single-Family guarantee portfolio and higher deferred fee income recognition due to faster loan prepayments as a result of the low mortgage interest rate environment. Investment gains, net increased 122% to $1.8 billion, primarily driven by higher margins on Multifamily loan commitments.
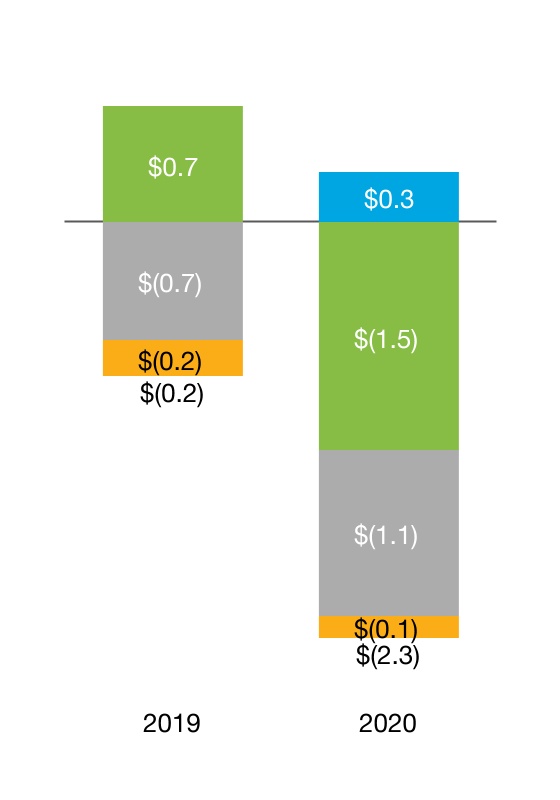
Credit-related expense increased to $2.3 billion from $0.2 billion in the prior year. Benefit (provision) for credit losses shifted to a provision for full-year 2020 due to portfolio growth and higher expected credit losses as a result of the COVID-19 pandemic, partially offset by growth in realized and forecasted house prices during 2020 and a higher benefit for credit enhancement recoveries.
Fourth Quarter 2020 Financial Results
Freddie Mac reported net income of $2.9 billion for the fourth quarter of 2020, an increase of 18% compared to net income of $2.5 billion for the third quarter of 2020. The company also reported comprehensive income of $2.5 billion for the fourth quarter of 2020, an increase of 3% compared to comprehensive income of $2.4 billion for the third quarter of 2020.
Net revenues were $5.0 billion, relatively unchanged from the third quarter of 2020.
Credit-related benefit was $0.1 billion, compared to credit-related expense of $0.6 billion in the prior quarter, driven by realized house price growth in the fourth quarter of 2020, partially offset by a decrease in credit enhancement recoveries.
Summary of Consolidated Statements of Comprehensive Income (Loss)
| | | | | | | | | | | | | | | | | | | | | | | | | | | | | | | | | | | | | | |
| | | Full-Year | | Three Months Ended |
| (In millions) | | 2020 | | 2019 | | Change | | 12/31/2020 | | 9/30/2020 | | Change |
| Net interest income | | $12,771 | | $11,848 | | $923 | | $3,653 | | $3,457 | | $196 |
| Guarantee fee income | | 1,442 | | 1,089 | | 353 | | 281 | | 315 | | (34) |
| Investment gains (losses), net | | 1,813 | | 818 | | 995 | | 856 | | 1,122 | | (266) |
| Other income (loss) | | 633 | | 323 | | 310 | | 232 | | 172 | | 60 |
| Net revenues | | 16,659 | | 14,078 | | 2,581 | | 5,022 | | 5,066 | | (44) |
| Benefit (provision) for credit losses | | (1,452) | | 746 | | (2,198) | | 813 | | (327) | | 1,140 |
| Credit enhancement expense | | (1,058) | | (749) | | (309) | | (327) | | (267) | | (60) |
| Benefit for (decrease in) credit enhancement recoveries | | 323 | | 41 | | 282 | | (385) | | 20 | | (405) |
| Real estate owned (REO) operations expense | | (149) | | (229) | | 80 | | (10) | | (40) | | 30 |
| Credit-related benefit (expense) | | (2,336) | | (191) | | (2,145) | | 91 | | (614) | | 705 |
| Administrative expense | | (2,535) | | (2,564) | | 29 | | (706) | | (641) | | (65) |
| Temporary Payroll Tax Cut Continuation Act of 2011 expense | | (1,836) | | (1,617) | | (219) | | (495) | | (467) | | (28) |
| Other expense | | (723) | | (657) | | (66) | | (243) | | (237) | | (6) |
| Operating expense | | (5,094) | | (4,838) | | (256) | | (1,444) | | (1,345) | | (99) |
| Income (loss) before income tax (expense) benefit | | 9,229 | | 9,049 | | 180 | | 3,669 | | 3,107 | | 562 |
| Income tax (expense) benefit | | (1,903) | | (1,835) | | (68) | | (756) | | (644) | | (112) |
| Net income (loss) | | 7,326 | | 7,214 | | 112 | | 2,913 | | 2,463 | | 450 |
| Total other comprehensive income (loss), net of taxes and reclassification adjustments | | 205 | | 573 | | (368) | | (391) | | (14) | | (377) |
| Comprehensive income (loss) | | $7,531 | | $7,787 | | $(256) | | $2,522 | | $2,449 | | $73 |
Freddie Mac Full-Year and Fourth Quarter 2020 Financial Results
February 11, 2021
Page 3
Selected Financial Measures
Net Interest Income and Net Interest Yield
(Dollars in billions)
| | | | | | | | | | | | | | |
| | | | Net Interest Income |
| | | |
| | | |
| | | | Net Interest Yield |
| | | |
| | | |
Full-Year 2020
•Net interest income increased from the prior year, primarily driven by higher guarantee portfolio net interest income, which was largely attributable to portfolio growth, higher contractual guarantee fee rates, and higher deferred fee income recognition due to faster loan prepayments as a result of the low mortgage rate environment.
Fourth Quarter 2020
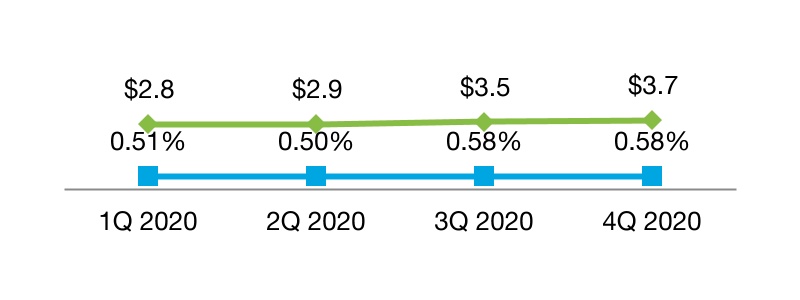
•Net interest income increased from the prior quarter, primarily driven by higher guarantee portfolio net interest income, which was largely attributable to portfolio growth and higher contractual guarantee fee rates.
Guarantee Fee Income(1) and
Multifamily Guarantee Portfolio
| | | | | | | | | | | | | | |
| | | | |
| | | |
| | | |
| | | | Multifamily Guarantee Portfolio ($B) |
| | | | |
| | | | Guarantee Fee Income ($M) |
| | | |
| | | |
(1) Guarantee fee income on a GAAP basis is primarily from the company’s multifamily business.
Full-Year 2020
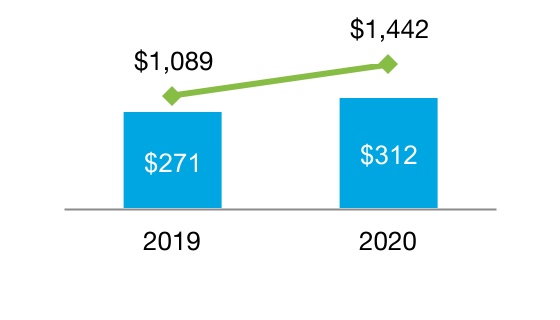
•Guarantee fee income increased from the prior year, primarily driven by portfolio growth and lower fair value losses on Multifamily guarantee assets due to a decline in interest rates from the prior year.
Freddie Mac Full-Year and Fourth Quarter 2020 Financial Results
February 11, 2021
Page 4
Fourth Quarter 2020
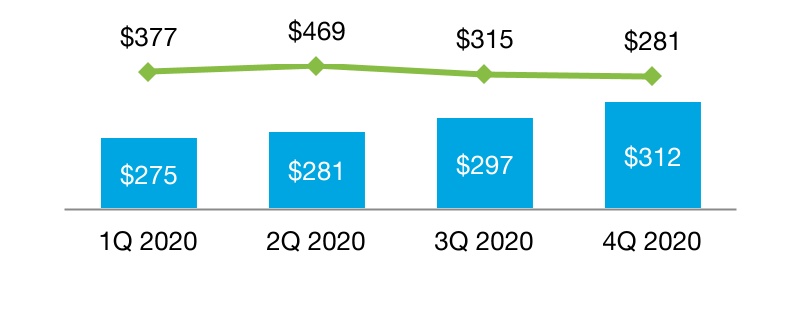
•Guarantee fee income decreased from the prior quarter, primarily due to higher fair value losses on Multifamily guarantee assets as a result of an increase in interest rates from the prior quarter. Because most multifamily loans are not prepayable without penalty, increases in interest rates generally result in lower Multifamily guarantee asset fair values.
Credit-Related Benefit (Expense)
(In billions)
| | | | | | | | | | | | | | | | | | | | | | | | | | | | | | | | |
| | | | | | | | | | |
| | | | | | | | | |
| | | | | | | | | |
| | | | Benefit (Provision) for Credit Losses | | | | | | Credit Enhancement Expense |
| | | | | | | | | | |
| | | | Benefit for (Decrease in) Credit Enhancement Recoveries | | | | | | |
| | | | | | | | | REO Operations Expense |
| | | | | | | | | |
Amounts may not add due to rounding.
Full-Year 2020
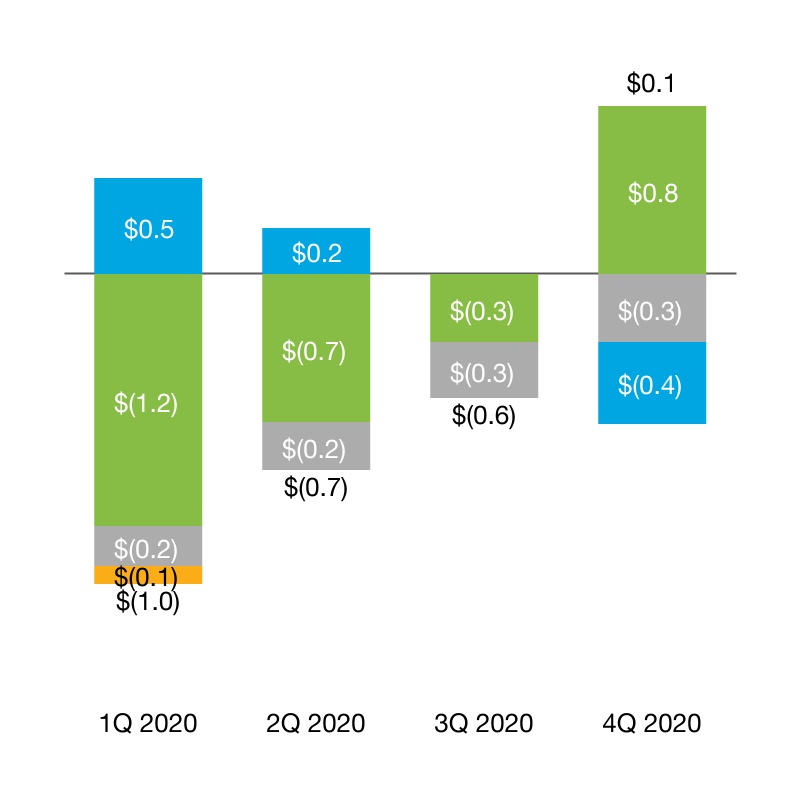
•Credit-related expense increased to $2.3 billion from $0.2 billion in the prior year. Benefit (provision) for credit losses shifted to a provision for full-year 2020 due to portfolio growth and higher expected credit losses as a result of the COVID-19 pandemic, partially offset by growth in realized and forecasted house prices during 2020 and a higher benefit for credit enhancement recoveries.
Fourth Quarter 2020
•Credit-related benefit was $0.1 billion, compared to credit-related expense of $0.6 billion in the prior quarter, driven by realized house price growth in the fourth quarter of 2020, partially offset by a decrease in credit enhancement recoveries.
Freddie Mac Full-Year and Fourth Quarter 2020 Financial Results
February 11, 2021
Page 5
Non-GAAP Financial Measure Highlights
In addition to analyzing the company’s results on a GAAP basis, management reviews net interest income and guarantee fee income on an “adjusted,” or non-GAAP, basis. These adjusted financial measures are calculated by reclassifying certain credit guarantee-related activities and investment-related activities between various line items on the company’s GAAP consolidated statements of comprehensive income. The company also presents one additional non-GAAP financial measure, adjusted net interest yield, that is calculated based on adjusted net interest income. Management believes that these non-GAAP financial measures are useful because they more clearly reflect the company’s sources of revenue and return.
For additional information about the company's non-GAAP financial measures and reconciliations to the comparable amounts under GAAP, see pages 16-17 of this press release.
Adjusted Net Interest Income(1), Adjusted Net Interest Yield(1), and
Investments Portfolio
(Dollars in billions)
| | | | | | | | | | | | | | |
| | | | Mortgage-related Investments Portfolio |
| | | | |
| | | | Other Investments Portfolio |
| | | | |
| | | | Adjusted Net Interest Yield |
| | | |
| | | |
| | | | Adjusted Net Interest Income |
| | | |
| | | |
(1)Non-GAAP financial measure. For reconciliations to the comparable amounts under GAAP, see pages 16-17 of this press release.
Amounts may not add due to rounding.
Full-Year 2020
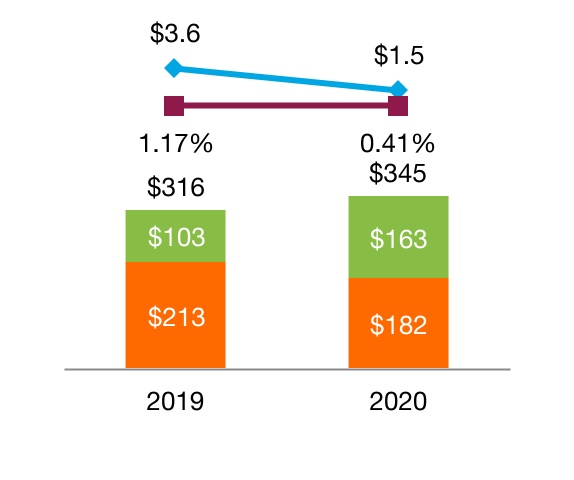
•Adjusted net interest income and adjusted net interest yield decreased from the prior year, primarily driven by higher loan prepayments that resulted in an increase in amortization expense, combined with a change in investment mix as the lower-yielding other investments portfolio represented a larger percentage of the total investments portfolio. In addition, the company's custodial trust account balance increased due to higher prepayments but earned a minimal yield due to the low interest rate environment.
•The mortgage-related investments portfolio was $182 billion, down $31 billion, or 15%, from the prior year. The other investments portfolio was $163 billion, up $60 billion, or 58%, as the company transitions to comply with minimum liquidity requirements established by FHFA.
Fourth Quarter 2020
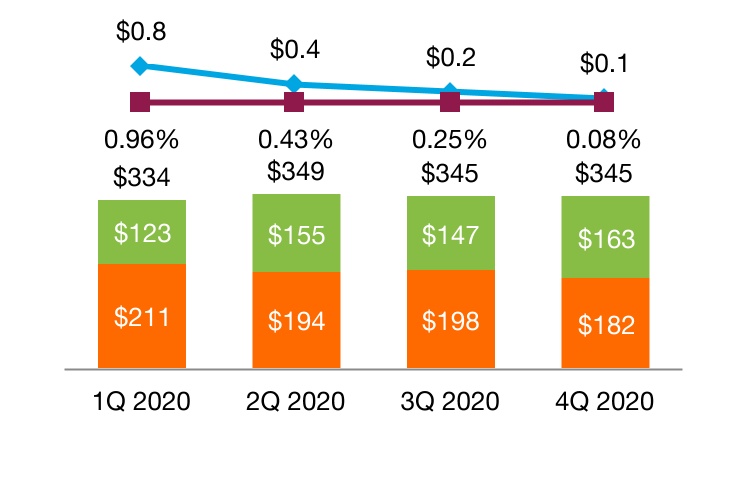
•Adjusted net interest income and adjusted net interest yield decreased from the prior quarter, primarily driven by higher loan prepayments that resulted in an increase in amortization expense, combined with a change in investment mix as the lower-yielding other investments portfolio represented a larger percentage of the total investments portfolio.
Freddie Mac Full-Year and Fourth Quarter 2020 Financial Results
February 11, 2021
Page 6
Adjusted Guarantee Fee Income(1) and
Total Guarantee Portfolio
(In billions)
| | | | | | | | | | | | | | |
| | | | |
| | | |
| | | |
| | | | Single-Family Credit Guarantee Portfolio |
| | | | |
| | | | Multifamily Guarantee Portfolio |
| | | | |
| | | | Adjusted Guarantee Fee Income |
| | | |
| | | |
(1)Non-GAAP financial measure. For reconciliations to the comparable amounts under GAAP, see pages 16-17 of this press release.
Amounts may not add due to rounding.
Full-Year 2020 and Fourth Quarter 2020
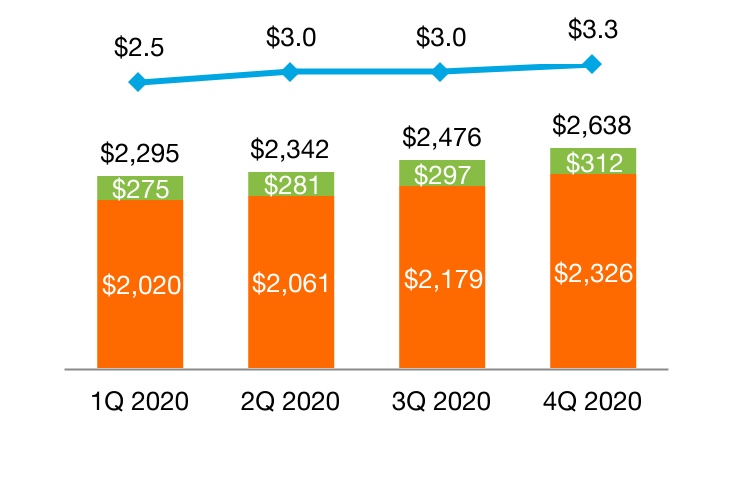
•Adjusted guarantee fee income increased from the prior year and prior quarter, primarily due to higher Single-Family guarantee fee income driven by portfolio growth, higher deferred fee income recognition, and higher contractual guarantee fee rates.
•The total guarantee portfolio grew $373 billion, or 16%, from the prior year, driven by increases in both the Single-Family and Multifamily guarantee portfolios.
Segment Financial Results and Business Highlights
Freddie Mac’s operations in 2020 consisted of three reportable segments, which are based on the types of business activities they perform – Single-Family Guarantee, Multifamily, and Capital Markets. The company presents Segment Earnings for each reportable segment by reclassifying certain credit guarantee-related activities and investment-related activities between various line items on its GAAP consolidated statements of comprehensive income and allocating certain revenues and expenses, including funding costs and administrative expenses, to its three reportable segments.
For more information about Segment Earnings, see Note 17 to the financial statements included in the company’s Annual Report on Form 10-K for the year ended December 31, 2020.
Freddie Mac Full-Year and Fourth Quarter 2020 Financial Results
February 11, 2021
Page 7
Single-Family Guarantee Segment
Financial Results(1) | | | | | | | | | | | | | | | | | | | | | | | | | | | | | | | | | | | | | | |
| | | Full-Year | | Three Months Ended |
| (In millions) | | 2020 | | 2019 | | Change | | 12/31/2020 | | 9/30/2020 | | Change |
| Guarantee fee income | | $10,292 | | $7,773 | | $2,519 | | $2,988 | | $2,683 | | $305 |
| Investment gains (losses), net | | 956 | | 964 | | (8) | | 89 | | 409 | | (320) |
| Other income (loss) | | 241 | | 391 | | (150) | | 185 | | 124 | | 61 |
| Net revenues | | 11,489 | | 9,128 | | 2,361 | | 3,262 | | 3,216 | | 46 |
| Benefit (provision) for credit losses | | (1,680) | | 418 | | (2,098) | | 720 | | (426) | | 1,146 |
| Credit enhancement expense | | (1,696) | | (1,434) | | (262) | | (470) | | (416) | | (54) |
| Benefit for (decrease in) credit enhancement recoveries | | 305 | | 41 | | 264 | | (379) | | 26 | | (405) |
| REO operations expense | | (152) | | (245) | | 93 | | (10) | | (41) | | 31 |
| Credit-related expense | | (3,223) | | (1,220) | | (2,003) | | (139) | | (857) | | 718 |
| Administrative expense | | (1,609) | | (1,647) | | 38 | | (449) | | (409) | | (40) |
| Other expense | | (943) | | (786) | | (157) | | (301) | | (296) | | (5) |
| Operating expense | | (2,552) | | (2,433) | | (119) | | (750) | | (705) | | (45) |
| Segment Earnings (Losses) before income tax (expense) benefit | | 5,714 | | 5,475 | | 239 | | 2,373 | | 1,654 | | 719 |
| Income tax (expense) benefit | | (1,178) | | (1,110) | | (68) | | (489) | | (343) | | (146) |
| Segment Earnings (Losses), net of taxes | | 4,536 | | 4,365 | | 171 | | 1,884 | | 1,311 | | 573 |
| Total other comprehensive income (loss), net of tax | | (16) | | (22) | | 6 | | | (9) | | (3) | | (6) |
| Total comprehensive income (loss) | | $4,520 | | $4,343 | | $177 | | $1,875 | | $1,308 | | $567 |
(1) The financial performance of the company’s Single-Family Guarantee segment is measured based on its contribution to GAAP net income (loss).
Key Drivers - 2020 vs. 2019
Comprehensive income increased from the prior year, primarily driven by:
•Higher guarantee fee income primarily due to portfolio growth, higher deferred fee income recognition driven by faster loan prepayments as a result of the low mortgage interest rate environment, and higher contractual guarantee fee rates.
•Higher credit-related expense driven by a shift to a provision for credit losses as a result of the COVID-19 pandemic and portfolio growth, partially offset by a higher benefit for credit enhancement recoveries.
2020 Business Highlights
•New business activity of $1.1 trillion, an increase of $637 billion, or 141%, from the prior year, driven by higher refinance and purchase activity resulting from the low mortgage interest rate environment.
▪The weighted average original loan-to-value (LTV) ratio of new business activity improved to 71% from 77% for the prior year, while the weighted average original credit score was 759, up from 751 for the prior year.
▪The average guarantee fee rate charged on new acquisitions was 47 basis points, up from 45 basis points for the prior year.
▪First-time homebuyers represented 46% of new single-family purchase loans.
▪The company provided funding for nearly 3.8 million single-family homes, approximately 2.7 million of which were refinance loans.
•The Single-Family guarantee portfolio increased 17% from the prior year to $2.3 trillion at December 31, 2020, driven by an increase in U.S. single-family mortgage debt outstanding and higher new business activity.
Freddie Mac Full-Year and Fourth Quarter 2020 Financial Results
February 11, 2021
Page 8
▪The average guarantee fee rate on the Single-Family guarantee portfolio was 49 basis points, up from 40 basis points for the prior year.
•The Single-Family serious delinquency rate increased to 2.64%, from 0.63% at the end of the prior year, driven by loans in forbearance due to the COVID-19 pandemic.
▪Single-Family loans in forbearance are reported as delinquent during the forbearance period to the extent that payments are past due based upon the loans' original contractual terms.
•Single-Family loan workout activity increased to nearly 426,000, from 47,000 in the prior year, driven by completed forbearance agreements and payment deferrals primarily related to the COVID-19 pandemic.
•2.70% of loans in the Single-Family guarantee portfolio, based on loan count, were in forbearance as of December 31, 2020.
•Credit enhancement coverage of the Single-Family guarantee portfolio decreased to 51% from 56% in the prior year, driven by the high volume of new business activity, which has not been included in credit risk transfer (CRT) transactions but may be included in future periods.
Multifamily Segment
Financial Results(1)
| | | | | | | | | | | | | | | | | | | | | | | | | | | | | | | | | | | | | | |
| | | Full-Year | | Three Months Ended |
| (In millions) | | 2020 | | 2019 | | Change | | 12/31/2020 | | 9/30/2020 | | Change |
| Net interest income | | $943 | | $1,069 | | $(126) | | $236 | | $210 | | $26 |
| Guarantee fee income | | 1,444 | | 1,101 | | 343 | | 286 | | 303 | | (17) |
| Investment gains (losses), net | | 2,047 | | 576 | | 1,471 | | 1,046 | | 1,091 | | (45) |
| Other income (loss) | | 176 | | 108 | | 68 | | 45 | | 43 | | 2 |
| Net revenues | | 4,610 | | 2,854 | | 1,756 | | 1,613 | | 1,647 | | (34) |
| Credit-related expense | | (136) | | (18) | | (118) | | 11 | | (20) | | 31 |
| Administrative expense | | (514) | | (503) | | (11) | | (142) | | (128) | | (14) |
| Other expense | | (37) | | (41) | | 4 | | (14) | | (9) | | (5) |
| Operating expense | | (551) | | (544) | | (7) | | (156) | | (137) | | (19) |
| Segment Earnings (Losses) before income tax (expense) benefit | | 3,923 | | 2,292 | | 1,631 | | 1,468 | | 1,490 | | (22) |
| Income tax (expense) benefit | | (809) | | (465) | | (344) | | (302) | | (309) | | 7 |
| Segment Earnings (Losses), net of taxes | | 3,114 | | 1,827 | | 1,287 | | 1,166 | | 1,181 | | (15) |
| Total other comprehensive income (loss), net of tax | | 101 | | 101 | | 0 | | (17) | | (4) | | (13) |
| Total comprehensive income (loss) | | $3,215 | | $1,928 | | $1,287 | | $1,149 | | $1,177 | | $(28) |
| | | | | | | | | | | | |
| | | | | | | | | | | | |
| | | | | | | | | | | | |
| | | | | | | | | | | | |
| | | | | | | | | | | | |
| | | | | | | | | | | | |
| | | | | | | | | | | | |
| | | | | | | | | | | | |
| | | | | | | | | | | | |
| | | | | | | | | | | | |
| | | | | | | | | | | | |
| | | | | | | | | | | | |
| | | | | | | | | | | | |
| | | | | | | | | | | | |
| | | | | | | | | | | | |
| | | | | | | | | | | | |
| | | | | | | | | | | | |
| | | | | | | | | | | | |
| | | | | | | | | | | | |
| | | | | | | | | | | | |
| | | | | | | | | | | | |
| | | | | | | | | | | | |
(1) The financial performance of the company’s Multifamily segment is measured based on its contribution to GAAP comprehensive income (loss).
Key Drivers - 2020 vs. 2019
Comprehensive income increased from the prior year, mainly driven by:
•Higher investment gains primarily driven by higher margins on Multifamily loan commitments.
•Higher guarantee fee income driven by portfolio growth and lower fair value losses on guarantee assets due to a decline in interest rates from the prior year.
Freddie Mac Full-Year and Fourth Quarter 2020 Financial Results
February 11, 2021
Page 9
2020 Business Highlights
•New business activity of $83 billion, up 6% from $78 billion in the prior year.
▪The weighted average original LTV ratio of new business activity was 69%, up from 68% for the prior year.
▪The company provided financing for nearly 803,000 multifamily rental units.
▪96% of the eligible multifamily rental units financed were affordable to families earning at or below 120% of area median income.
•The Multifamily guarantee portfolio increased 15% from December 31, 2019, to $312 billion, driven by new securitization activity.
•The Multifamily delinquency rate, which does not include loans in forbearance, increased to 0.16% from 0.08% at December 31, 2019.
•As of December 31, 2020, 2.01% of the loans in the Multifamily mortgage portfolio, based on UPB, were in a forbearance program, approximately 95% of which were in the repayment period. Approximately 82% of the total loans in a Multifamily forbearance program are included in securitizations with first loss credit protection provided by subordination.
▪A multifamily loan in forbearance is reported as current as long as the borrower is in compliance with the forbearance agreement, including the agreed upon repayment plan. A loan in forbearance is therefore not included in the Multifamily delinquency rate if the borrower is in compliance with the forbearance agreement.
•While credit enhancement coverage of the Multifamily mortgage portfolio decreased to 88% from 89% in the prior year, the company continued to successfully transfer multifamily credit risk during 2020.
•As of December 31, 2020, the company had cumulatively transferred a substantial amount of the expected and stress credit risk on the Multifamily guarantee portfolio, primarily through subordination in its securitizations.
▪In addition, nearly all of the company's securitization activities shifted substantially all the interest-rate and liquidity risk associated with the underlying collateral away from Freddie Mac to third-party investors.
Freddie Mac Full-Year and Fourth Quarter 2020 Financial Results
February 11, 2021
Page 10
Capital Markets Segment
Financial Results(1)
| | | | | | | | | | | | | | | | | | | | | | | | | | | | | | | | | | | | | | |
| | | Full-Year | | Three Months Ended |
| (In millions) | | 2020 | | 2019 | | Change | | 12/31/2020 | | 9/30/2020 | | Change |
| Net interest income | | $522 | | $2,486 | | $(1,964) | | $(159) | | $20 | | $(179) |
| Investment gains (losses), net | | (231) | | (36) | | (195) | | | (25) | | 15 | | (40) |
| Other income (loss) | | (266) | | (700) | | 434 | | | 132 | | 37 | | 95 |
| Net revenues | | 25 | | 1,750 | | (1,725) | | | (52) | | 72 | | (124) |
| Administrative expense | | (412) | | (414) | | 2 | | | (115) | | (104) | | (11) |
| Other expense | | (21) | | (54) | | 33 | | | (5) | | (5) | | 0 |
| Operating expense | | (433) | | (468) | | 35 | | | (120) | | (109) | | (11) |
| Segment Earnings (Losses) before income tax (expense) benefit | | (408) | | 1,282 | | (1,690) | | (172) | | (37) | | (135) |
| Income tax (expense) benefit | | 84 | | (260) | | 344 | | 35 | | 8 | | | 27 |
| Segment Earnings (Losses), net of taxes | | (324) | | 1,022 | | (1,346) | | (137) | | (29) | | (108) |
| Total other comprehensive income (loss), net of tax | | 120 | | 494 | | (374) | | (365) | | (7) | | (358) |
| Total comprehensive income (loss) | | $(204) | | $1,516 | | $(1,720) | | $(502) | | $(36) | | $(466) |
| | | | | | | | | | | | |
| | | | | | | | | | | | |
| | | | | | | | | | | | |
| | | | | | | | | | | | |
| | | | | | | | | | | | |
| | | | | | | | | | | | |
| | | | | | | | | | | | |
| | | | | | | | | | | | |
| | | | | | | | | | | | |
| | | | | | | | | | | | |
(1) The financial performance of the company’s Capital Markets segment is measured based on its contribution to GAAP comprehensive income (loss).
Key Drivers - 2020 vs. 2019
•Comprehensive loss compared to comprehensive income in the prior year, primarily due to lower net interest income, driven by an increase in amortization expense due to higher loan prepayments, coupled with additional expense due to payments to security holders of the full monthly coupon rate when loans pay off mid-month. In addition, the company's custodial trust account balance increased due to higher prepayments but earned a minimal yield due to the low interest rate environment.
2020 Business Highlights
•Freddie Mac continued to maintain a presence in the agency mortgage-related securities market to strategically support the guarantee business.
•FHFA has instructed the company to maintain loans in COVID-19 payment forbearance plans in mortgage-backed security pools for at least the duration of the forbearance plan. The company's less liquid assets are likely to increase in future periods as it will likely purchase a higher amount of delinquent and modified loans from securities after borrowers exit forbearance plans.
Freddie Mac Full-Year and Fourth Quarter 2020 Financial Results
February 11, 2021
Page 11
Market Liquidity
Freddie Mac supports the U.S. housing market by executing its Charter Mission to provide liquidity and help maintain credit availability for new and refinanced single-family mortgages as well as for rental housing. Despite the significant challenges presented by the COVID-19 pandemic, the company continues to provide funding and stability to the housing market.
Freddie Mac provided approximately $1.2 trillion in liquidity to the market in 2020 funding:
•Nearly 3.8 million single-family homes, approximately 2.7 million of which were refinance loans; and
•Approximately 803,000 multifamily rental units.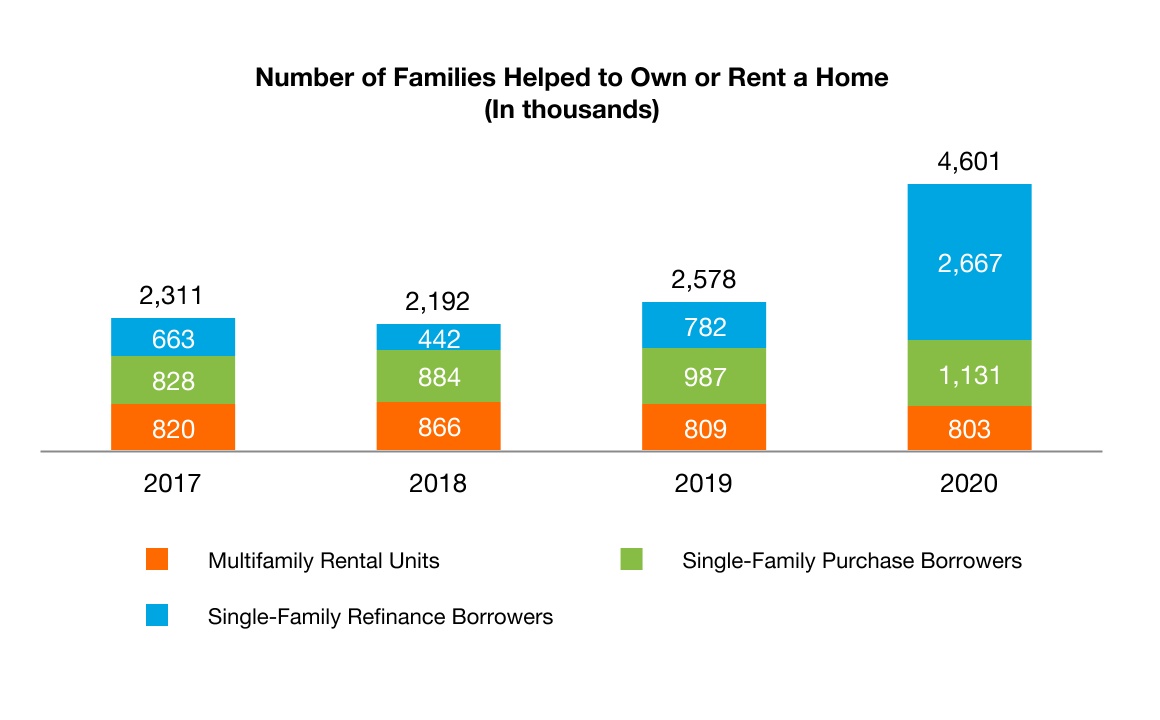
Freddie Mac Full-Year and Fourth Quarter 2020 Financial Results
February 11, 2021
Page 12
About Freddie Mac’s Conservatorship
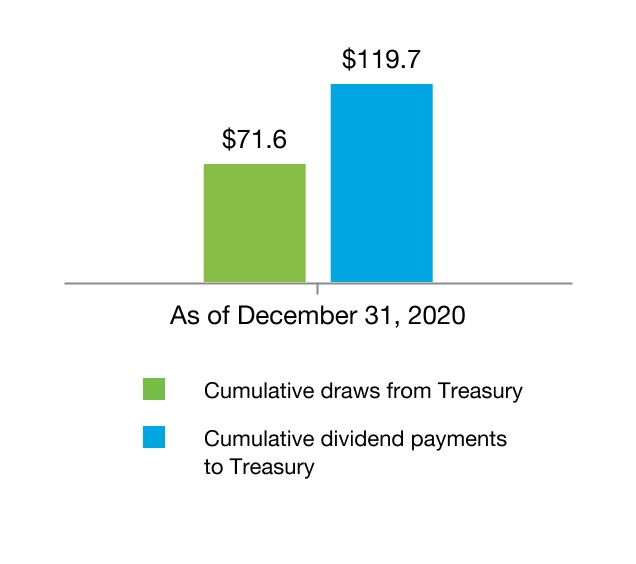
Since September 2008, Freddie Mac has been operating under conservatorship with FHFA as Conservator. The support provided by Treasury pursuant to the Purchase Agreement enables the company to maintain access to the debt markets and have adequate liquidity to conduct its normal business operations.
Net Worth Amount, Liquidation Preference, and Dividend Payments and Draws Treasury Commitment
(In billions) (In billions)
As a result of increases to the Capital Reserve Amount pursuant to the September 2019 and January 2021 Letter Agreements, the company was not required to pay a dividend to Treasury on the senior preferred stock in December 2020, and it will not be required to pay a dividend to Treasury until it has built sufficient capital to meet the capital requirements and buffers set forth in the ERCF.
The quarterly increases in the company's Net Worth Amount as the company builds capital during this period will continue to be added to the aggregate liquidation preference of the senior preferred stock. As a result, the liquidation preference of the senior preferred stock increased from $84.1 billion on September 30, 2020 to $86.5 billion on December 31, 2020 based on the $2.4 billion increase in the Net Worth Amount during the third quarter of 2020, and will increase to $89.1 billion on March 31, 2021 based on the $2.5 billion increase in the Net Worth Amount during the fourth quarter of 2020.
The remaining Treasury commitment available to Freddie Mac under the Purchase Agreement was $140.2 billion at December 31, 2020.
For additional information on the Purchase Agreement, January 2021 Letter Agreement, senior preferred stock, and ERCF, see the company’s Annual Report on Form 10-K for the year ended December 31, 2020.
Freddie Mac Full-Year and Fourth Quarter 2020 Financial Results
February 11, 2021
Page 13
Additional Information
For more information, including information related to Freddie Mac’s financial results, conservatorship, and related matters, see the company’s Annual Report on Form 10-K for the year ended December 31, 2020 and the company’s Financial Results Supplement. These documents are available on the Investor Relations page of the company’s website at www.FreddieMac.com/investors.
Additional information about Freddie Mac and its business is also set forth in the company’s other filings with the SEC, which are available on the Investor Relations page of the company’s website at www.FreddieMac.com/investors and the SEC’s website at www.sec.gov. Freddie Mac encourages all investors and interested members of the public to review these materials for a more complete understanding of the company’s financial results and related disclosures.
Webcast Announcement
Management will host a conference call at 9 a.m. Eastern Time on February 11, 2021 to share the company’s results with the media. The call will be concurrently webcast. To access the audio webcast, use the following link: https://edge.media-server.com/mmc/p/s5quqmi4. The replay will be available on the company’s website at www.FreddieMac.com/investors for approximately 30 days. All materials related to the call will be available on the Investor Relations page of the company’s website at www.FreddieMac.com/investors.
| | | | | | | | |
| | |
| Media Contact: Frederick Solomon (703) 903-3861 | | Investor Contact: Laurie Garthune (571) 382-4732 |
| | |
* * * *
This press release contains forward-looking statements, which may include statements pertaining to the conservatorship, the company’s current expectations and objectives for its Single-Family Guarantee, Multifamily, and Capital Markets segments, its efforts to assist the housing market, liquidity and capital management, economic and market conditions and trends, the effects of the COVID-19 pandemic and actions taken in response thereto on its business, financial condition, and liquidity, its market share, the effect of legislative and regulatory developments and new accounting guidance, credit quality of loans the company owns or guarantees, the costs and benefits of the company’s CRT transactions, and results of operations and financial condition on a GAAP, Segment Earnings, non-GAAP, and fair value basis. Forward-looking statements involve known and unknown risks and uncertainties, some of which are beyond the company’s control. Management’s expectations for the company’s future necessarily involve a number of assumptions, judgments, and estimates, and various factors, including changes in market conditions, liquidity, mortgage spreads, credit outlook, uncertainty about the duration, severity, and effects of the COVID-19 pandemic and actions taken in response thereto, by the U.S. government (including FHFA, Treasury, and Congress) and state and local governments, and the impacts of legislation or regulations and new or amended accounting guidance, could cause actual results to differ materially from these expectations. These assumptions, judgments, estimates, and factors are discussed in the company’s Annual Report on Form 10-K for the year ended December 31, 2020, which is available on the Investor Relations page of the company’s website at www.FreddieMac.com/investors and the SEC’s website at www.sec.gov. The company undertakes no obligation to update forward-looking statements it makes to reflect events or circumstances occurring after the date of this press release.
Freddie Mac makes home possible for millions of families and individuals by providing mortgage capital to lenders. Since its creation by Congress in 1970, the company has made housing more accessible and affordable for homebuyers and renters in communities nationwide. The company is building a better housing finance system for homebuyers, renters, lenders, and taxpayers. Learn more at FreddieMac.com, Twitter @FreddieMac and Freddie Mac’s blog FreddieMac.com/blog.
Freddie Mac Full-Year and Fourth Quarter 2020 Financial Results
February 11, 2021
Page 14
FREDDIE MAC
Consolidated Statements of Comprehensive Income (Loss)
| | | | | | | | | | | | | | | | | | | | | | | | | | | |
| | | Twelve Months Ended | | Three Months Ended | |
(In millions, except share-related amounts) | | December 31,
2020 | | December 31,
2019 | | December 31,
2020 | | September 30,
2020 | |
| Net interest income | | | | | | | | | |
| Interest income | | $62,340 | | $72,895 | | $14,183 | | $14,849 | |
| Interest expense | | (49,569) | | (61,047) | | (10,530) | | (11,392) | |
| Net interest income | | 12,771 | | 11,848 | | 3,653 | | 3,457 | |
| | | | | | | | | |
| Non-interest income (loss) | | | | | | | | | |
| Guarantee fee income | | 1,442 | | 1,089 | | 281 | | 315 | |
| Investment gains (losses), net | | 1,813 | | 818 | | 856 | | 1,122 | |
| Other income (loss) | | 633 | | 323 | | 232 | | 172 | |
| Non-interest income (loss) | | 3,888 | | 2,230 | | 1,369 | | 1,609 | |
| Net revenues | | 16,659 | | 14,078 | | 5,022 | | 5,066 | |
| | | | | | | | | |
| Benefit (provision) for credit losses | | (1,452) | | 746 | | 813 | | (327) | |
| | | | | | | | | |
| Non-interest expense | | | | | | | | | |
| Salaries and employee benefits | | (1,344) | | (1,434) | | (342) | | (334) | |
| Professional services | | (398) | | (445) | | (129) | | (105) | |
| Other administrative expense | | (793) | | (685) | | (235) | | (202) | |
| Total administrative expense | | (2,535) | | (2,564) | | (706) | | (641) | |
| Credit enhancement expense | | (1,058) | | (749) | | (327) | | (267) | |
| Benefit for (decrease in) credit enhancement recoveries | | 323 | | 41 | | (385) | | 20 | |
| REO operations expense | | (149) | | (229) | | (10) | | (40) | |
| Temporary Payroll Tax Cut Continuation Act of 2011 expense | | (1,836) | | (1,617) | | (495) | | (467) | |
| Other expense | | (723) | | (657) | | (243) | | (237) | |
| Non-interest expense | | (5,978) | | (5,775) | | (2,166) | | (1,632) | |
| | | | | | | | | |
| Income (loss) before income tax (expense) benefit | | 9,229 | | 9,049 | | 3,669 | | 3,107 | |
| Income tax (expense) benefit | | (1,903) | | (1,835) | | (756) | | (644) | |
| Net income (loss) | | 7,326 | | 7,214 | | 2,913 | | 2,463 | |
| | | | | | | | | |
| Other comprehensive income (loss), net of taxes and reclassification adjustments | | | | | | | | | |
| Changes in unrealized gains (losses) related to available-for-sale securities | | 192 | | 535 | | (384) | | (16) | |
| Changes in unrealized gains (losses) related to cash flow hedge relationships | | 38 | | 71 | | 8 | | 6 | |
| Changes in defined benefit plans | | (25) | | (33) | | (15) | | (4) | |
| Total other comprehensive income (loss), net of taxes and reclassification adjustments | | 205 | | 573 | | (391) | | (14) | |
| Comprehensive income (loss) | | $7,531 | | $7,787 | | $2,522 | | $2,449 | |
| | | | | | | | | |
| Net income (loss) | | $7,326 | | $7,214 | | $2,913 | | $2,463 | |
| Undistributed net worth sweep, senior preferred stock dividends, or future increase in senior preferred stock liquidation preference | | (7,291) | | (7,787) | | (2,522) | | (2,449) | |
| Net income (loss) attributable to common stockholders | | $35 | | $(573) | | $391 | | $14 | |
| Net income (loss) per common share — basic and diluted | | $0.01 | | $(0.18) | | $0.12 | | $0.00 | |
| Weighted average common shares outstanding (in millions) — basic and diluted | | 3,234 | | 3,234 | | 3,234 | | 3,234 | |
Freddie Mac Full-Year and Fourth Quarter 2020 Financial Results
February 11, 2021
Page 15
FREDDIE MAC
Consolidated Balance Sheets
| | | | | | | | | | | | | | |
| | December 31, |
(In millions, except share-related amounts)
| | 2020 | | 2019 |
| Assets | | | | |
| Cash and cash equivalents (include $17,379 and $991 of restricted cash and cash equivalents) | | $23,889 | | $5,189 |
| Securities purchased under agreements to resell | | 105,003 | | | 56,271 | |
| Investment securities, at fair value | | 59,825 | | | 75,711 | |
| Mortgage loans held-for-sale (includes $14,199 and $15,035 at fair value) | | 33,652 | | | 35,288 | |
| Mortgage loans held-for-investment (net of allowance for loan losses of $5,732 and $4,234) | | 2,350,236 | | | 1,984,912 | |
| Accrued interest receivable (net of allowance of $140 and $0) | | 7,754 | | | 6,848 | |
| Derivative assets, net | | 1,205 | | | 844 | |
| Deferred tax assets, net | | 6,557 | | | 5,918 | |
| Other assets (includes $5,775 and $4,627 at fair value) | | 39,294 | | | 22,799 | |
| Total assets | | $2,627,415 | | $2,193,780 |
| Liabilities and equity | | | | |
| Liabilities | | | | |
| Accrued interest payable | | $6,210 | | $6,559 |
| Debt (includes $2,592 and $3,938 at fair value) | | 2,592,546 | | | 2,169,685 | |
| Derivative liabilities, net | | 954 | | | 372 | |
| Other liabilities | | 11,292 | | | 8,042 | |
| Total liabilities | | 2,611,002 | | | 2,184,658 | |
| Commitments and contingencies | | | | |
| Equity | | | | |
| Senior preferred stock (liquidation preference of $86,539 and $79,322) | | 72,648 | | | 72,648 | |
| Preferred stock, at redemption value | | 14,109 | | | 14,109 | |
| Common stock, $0.00 par value, 4,000,000,000 shares authorized, 725,863,886 shares issued and 650,059,292 shares and 650,059,033 shares outstanding | | — | | | — | |
| Additional paid-in capital | | — | | | — | |
| Retained earnings (accumulated deficit) | | (67,102) | | | (74,188) | |
| AOCI, net of taxes, related to: | | | | |
| Available-for-sale securities | | 810 | | | 618 | |
| Cash flow hedge relationships | | (206) | | | (244) | |
| Defined benefit plans | | 39 | | | 64 | |
| Total AOCI, net of taxes | | 643 | | | 438 | |
| Treasury stock, at cost, 75,804,594 shares and 75,804,853 shares | | (3,885) | | | (3,885) | |
| Total equity | | 16,413 | | | 9,122 | |
| Total liabilities and equity | | $2,627,415 | | $2,193,780 |
| The table below presents the carrying value and classification of the assets and liabilities of consolidated variable-interest entities (VIEs) on the company's consolidated balance sheets. |
| | | | |
| | December 31, |
(In millions)
| | 2020 | | 2019 |
| Consolidated Balance Sheet Line Item | | | | |
| Assets: | | | | |
| Mortgage loans held-for-investment | | $2,273,347 | | $1,940,523 |
| All other assets | | 83,982 | | 40,598 |
| Total assets of consolidated VIEs | | $2,357,329 | | $1,981,121 |
| Liabilities: | | | | |
| Debt | | $2,308,176 | | $1,898,355 |
| All other liabilities | | 5,610 | | 5,537 |
| Total liabilities of consolidated VIEs | | $2,313,786 | | $1,903,892 |
Freddie Mac Full-Year and Fourth Quarter 2020 Financial Results
February 11, 2021
Page 16
FREDDIE MAC
Non-GAAP Reconciliations
| | | | | | | | | | | | | | | | | | | | | | | | | | | | | | | | | | | | | | |
| The company’s GAAP net interest income includes the spread earned on its investments activities plus the guarantee fees earned by its Single-Family business. Adjusted net interest income is the net spread earned on the company’s investment activities, including the cost of funds associated with using derivatives. Net interest yield, GAAP and adjusted, is calculated as annualized quarterly GAAP or adjusted net interest income divided by the average balance of the underlying assets and liabilities. |
| Reconciliation of GAAP Net Interest Income to Adjusted Net Interest Income (pre-tax) |
| (In millions) | | 1Q 2020 | | 2Q 2020 | | 3Q 2020 | | 4Q 2020 | | 2019 | | 2020 |
| GAAP net interest income | | $2,785 | | $2,876 | | $3,457 | | $3,653 | | $11,848 | | $12,771 |
| Reclassifications: | | | | | | | | | | | | |
Guarantee fee income reclassified to adjusted guarantee fee income (1) (2) | | (2,561) | | | (2,943) | | | (3,138) | | | (3,488) | | | (9,402) | | | (12,130) | |
Accrual of periodic cash settlements reclassified from derivative gain (loss) (3) | | (176) | | | (329) | | | (540) | | | (531) | | | (272) | | | (1,576) | |
Hedge accounting impact (4) | | 350 | | | 475 | | | 690 | | | 717 | | | 252 | | | 2,232 | |
| | | | | | | | | | | | |
Other reclassifications (5) | | 380 | | | 301 | | | (239) | | | (274) | | | 1,129 | | | 168 | |
| Total reclassifications | | (2,007) | | | (2,496) | | | (3,227) | | | (3,576) | | | (8,293) | | | (11,306) | |
| Adjusted net interest income | | $778 | | $380 | | $230 | | $77 | | $3,555 | | $1,465 |
| Average balance of assets and liabilities, GAAP (in billions) | | $2,205 | | $2,274 | | $2,376 | | $2,526 | | $2,108 | | $2,345 |
| Average balance of assets and liabilities, adjusted (in billions) | | $324 | | $352 | | $364 | | $379 | | $307 | | $355 |
| The company's GAAP guarantee fees are primarily those generated by the company's Multifamily business. Adjusted guarantee fee income consists of the revenues from guarantee fees from both the Single-Family and Multifamily businesses, net of the 10 basis point guarantee fee remitted to Treasury as part of the Temporary Payroll Tax Cut Continuation Act of 2011. |
| Reconciliation of GAAP Guarantee Fee Income to Adjusted Guarantee Fee Income (pre-tax) |
| (In millions) | | 1Q 2020 | | 2Q 2020 | | 3Q 2020 | | 4Q 2020 | | 2019 | | 2020 |
| GAAP guarantee fee income | | $377 | | $469 | | $315 | | $281 | | $1,089 | | $1,442 |
| Reclassifications: | | | | | | | | | | | | |
Guarantee fee income reclassified from net interest income (1) (2) | | 2,561 | | 2,943 | | 3,138 | | 3,488 | | 9,402 | | 12,130 |
Temporary Payroll Tax Cut Continuation Act of 2011 expense reclassified from other non-interest expense (6) | | (432) | | (442) | | (467) | | (495) | | (1,617) | | (1,836) |
| | | | | | | | | | | | |
| Total reclassifications | | 2,129 | | 2,501 | | 2,671 | | 2,993 | | 7,785 | | 10,294 |
| Adjusted guarantee fee income | | $2,506 | | $2,970 | | $2,986 | | $3,274 | | $8,874 | | $11,736 |
| | | | | | | | | | | | |
| | | | | | | | | | | | |
Columns may not add due to rounding.
For notes on reclassifications, see page 17 of this press release.
Freddie Mac Full-Year and Fourth Quarter 2020 Financial Results
February 11, 2021
Page 17
Notes on Significant Reclassifications
(1) Net guarantee fees, including certain fees and related hedge amortization and implied guarantee fee income related to unsecuritized loans held in the mortgage-related investments portfolio, are reclassified from GAAP net interest income to adjusted guarantee fee income.
(2) Short-term returns on cash received related to certain upfront fees on single-family loans are reclassified from GAAP net interest income to adjusted guarantee fee income.
(3) The accrual of periodic cash settlements of derivatives is reclassified from GAAP investment gains (losses) to adjusted net interest income to fully reflect the periodic cost associated with the protection provided by these contracts.
(4) Hedge accounting impact consists of removing the effects of hedge accounting including deferred gains and losses on closed cash flow hedges related to forecasted debt issuances.
(5) Other reclassifications primarily relate to items reclassified out of GAAP net interest income, including the amortization related to derivative commitment basis adjustments associated with mortgage-related and non-mortgage- related securities, amortization related to accretion of other-than-temporary impairments on available-for-sale securities, amortization of discounts on loans purchased with deteriorated credit quality that are on accrual status, amortization related to premiums and discounts, including non-cash premiums and discounts, on single-family loans in trusts and on the associated consolidated securities, amortization related to premiums and discounts associated with securities issued by consolidated trusts that were previously held and subsequently transferred to third parties, and costs associated with STACR debt note expenses.
(6) The expense related to the Temporary Payroll Tax Cut Continuation Act of 2011 is reclassified from GAAP other non-interest expense to adjusted guarantee fee income. As a result of the reclassification, the revenue and expense related to the legislated 10 basis point increase are netted within adjusted guarantee fee income.