Freddie Mac Reports Net Income of $3.7 Billion and
Comprehensive Income of $3.6 Billion for Second Quarter 2021
Providing Stability to the Housing Market While Serving Freddie Mac's Affordable Housing Mission
•Continued to provide mortgage-relief options for borrowers affected by the COVID-19 pandemic, including forbearance programs for both single-family and multifamily borrowers.
•Extended moratoriums on foreclosures and evictions through July 31, 2021.
Second Quarter 2021 Financial Results
| | | | | | | | | | | | | | | | | | | | |
Market Liquidity Provided - $306 Billion | | Homes and Rental Units Financed - 1.2 Million | |
Net Worth - $22.4 Billion
| | Total Mortgage Portfolio - $3.0 Trillion |
| | | | | | | | | | | | | | |
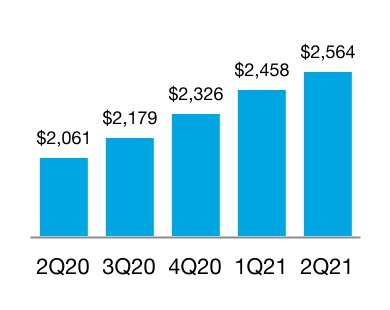
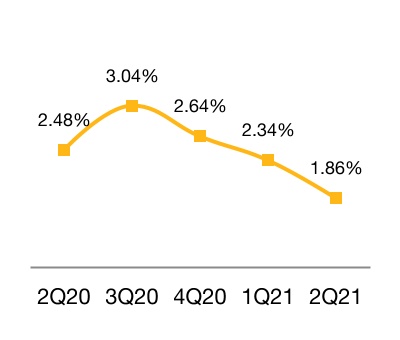
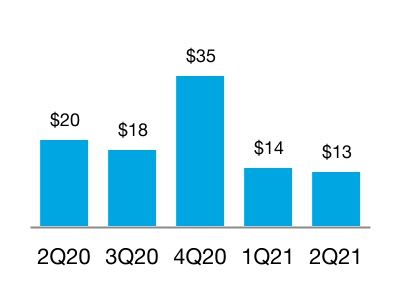
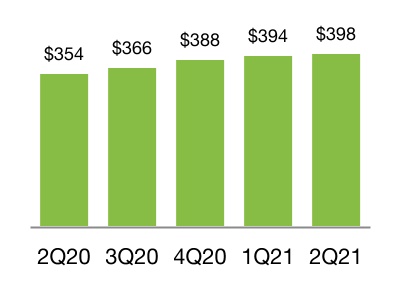
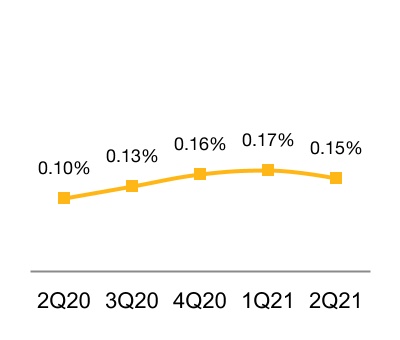
| Consolidated | | •Net income increased $1.9 billion year-over-year, driven by higher net revenues and a credit reserve release •Net revenues increased $1.7 billion year-over-year, driven by mortgage portfolio growth, higher average guarantee fee rates, and higher deferred fee income recognition •Benefit for credit losses of $0.7 billion, driven by a credit reserve release due to realized house price appreciation and improving economic conditions •New business activity of $288 billion, up 24% year-over-year, reflecting strong home purchase and refinance activity •Mortgage portfolio of $2,564 billion, up 24% year-over-year, driven by strong new business activity •Serious delinquency rate of 1.86%, down from 2.34% at March 31, 2021 and 2.48% at June 30, 2020, driven by a decline in loans in forbearance •Completed approximately 88,000 loan workouts •49% of mortgage portfolio covered by credit enhancements •New business activity of $13 billion, down 35% year-over-year, driven by increased competition and a reduced loan purchase cap. Year-to-date activity of $27 billion, down 10% year-over-year •Mortgage portfolio of $398 billion, up 12% year-over-year, driven by ongoing loan purchase and securitization activity •Delinquency rate, which does not include loans in forbearance, of 0.15%, down from 0.17% at March 31, 2021, and up from 0.10% at June 30, 2020 •94% of mortgage portfolio covered by credit enhancements | | “In the second quarter, we provided critical support for the housing market, delivered a strong financial performance, and continued to manage our risks well. I’m very proud that during the quarter, we continued to advance our mission by providing liquidity, stability, and affordability to the market and by helping families keep their homes during the pandemic.”
Michael J. DeVito Chief Executive Officer |
| |
Net Revenues $5.9 Billion Net Income $3.7 Billion Comprehensive Income $3.6 Billion | | |
| | |
| Single-Family | | |
| |
Net Revenues $4.7 Billion Net Income $2.9 Billion Comprehensive Income $2.8 Billion | | |
| | |
| Multifamily | | |
| |
Net Revenues $1.2 Billion Net Income $0.8 Billion Comprehensive Income $0.8 Billion | | |
Freddie Mac Second Quarter 2021 Financial Results
July 29, 2021
Page 2
McLean, VA — Freddie Mac (OTCQB: FMCC) today reported net income of $3.7 billion for the second quarter of 2021, an increase of 107% year-over-year, primarily driven by higher net revenues and a credit reserve release, primarily in the Single-Family segment. The company also reported comprehensive income of $3.6 billion for the second quarter of 2021, an increase of 86% year-over-year.
Net revenues increased 41% year-over-year to $5.9 billion, primarily driven by higher net interest income. Net interest income increased 66% year-over-year to $4.8 billion, primarily driven by continued growth in the Single-Family mortgage portfolio, higher average guarantee fee rates on the Single-Family mortgage portfolio, and higher deferred fee income recognition.
Credit-related income was $0.2 billion for the second quarter of 2021, compared to credit-related expense of $0.7 billion for the second quarter of 2020, driven by a reserve release due to realized house price appreciation and improving economic conditions. Credit-related expense in the second quarter of 2020 was primarily driven by the negative economic effects of the COVID-19 pandemic.
Summary of Condensed Consolidated Statements of Comprehensive Income (Loss)
| | | | | | | | | | | | | | | | | | | | | | | | | | | | | | | | | | | |
| (Dollars in millions) | | 2Q 2021 | | 1Q 2021 | | Change | | 2Q 2020 | | | Change |
| Net interest income | | $4,767 | | $3,639 | | $1,128 | | $2,876 | | | $1,891 |
| Guarantee income | | 356 | | 248 | | | 108 | | 469 | | | | (113) |
| Investment gains (losses), net | | 636 | | 1,208 | | | (572) | | 670 | | | | (34) |
| Other income (loss) | | 107 | | 178 | | | (71) | | 134 | | | | (27) |
| Net revenues | | 5,866 | | 5,273 | | | 593 | | 4,149 | | | | 1,717 |
| Benefit (provision) for credit losses | | 740 | | 196 | | | 544 | | (705) | | | | 1,445 |
| Credit enhancement expense | | (369) | | (335) | | | (34) | | (233) | | | | (136) |
| Benefit for (decrease in) credit enhancement recoveries | | (193) | | (257) | | | 64 | | 221 | | | | (414) |
| Real estate owned (REO) operations expense | | (7) | | (8) | | | 1 | | (14) | | | | 7 |
| Credit-related income (expense) | | 171 | | (404) | | | 575 | | (731) | | | | 902 |
| Administrative expense | | (651) | | (639) | | | (12) | | (601) | | | | (50) |
| Temporary Payroll Tax Cut Continuation Act of 2011 expense | | (570) | | (534) | | | (36) | | (442) | | | | (128) |
| Other expense | | (179) | | (215) | | | 36 | | (140) | | | | (39) |
| Operating expense | | (1,400) | | (1,388) | | | (12) | | (1,183) | | | | (217) |
| Income (loss) before income tax (expense) benefit | | 4,637 | | 3,481 | | | 1,156 | | 2,235 | | | | 2,402 |
| Income tax (expense) benefit | | (958) | | (714) | | | (244) | | (458) | | | | (500) |
| Net income (loss) | | 3,679 | | 2,767 | | 912 | | 1,777 | | | 1,902 |
| Total other comprehensive income (loss), net of taxes and reclassification adjustments | | (68) | | (389) | | | 321 | | 161 | | | | (229) |
| Comprehensive income (loss) | | $3,611 | | $2,378 | | $1,233 | | $1,938 | | | $1,673 |
| Conservatorship metrics (in billions) | | | | | | | | | | | |
| Net worth | | $22.4 | | $18.8 | | $3.6 | | $11.4 | | | $11.0 |
| Senior preferred stock liquidation preference | | 91.4 | | 89.1 | | 2.4 | | 82.2 | | | 9.2 |
| Remaining Treasury funding commitment | | 140.2 | | 140.2 | | — | | 140.2 | | | — |
| Cumulative dividend payments to Treasury | | 119.7 | | 119.7 | | — | | 119.7 | | | — |
| Cumulative draws from Treasury | | 71.6 | | 71.6 | | — | | 71.6 | | | — |
| | | | | | | | | | | |
| | | | | | | | | | | |
| | | | | | | | | | | |
| | | | | | | | | | | |
| | | | | | | | | | | |
| | | | | | | | | | | |
| | | | | | | | | | | |
| | | | | | | | | | | |
| | | | | | | | | | | |
| | | | | | | | | | | |
| | | | | | | | | | | |
| | | | | | | | | | | |
| | | | | | | | | | | |
| | | | | | | | | | | |
| | | | | | | | | | | |
| | | | | | | | | | | |
| | | | | | | | | | | |
| | | | | | | | | | | |
| | | | | | | | | | | |
| | | | | | | | | | | |
Totals may not add due to rounding.
Freddie Mac Second Quarter 2021 Financial Results
July 29, 2021
Page 3
| | |
| Single-Family Segment |
| Financial Results |
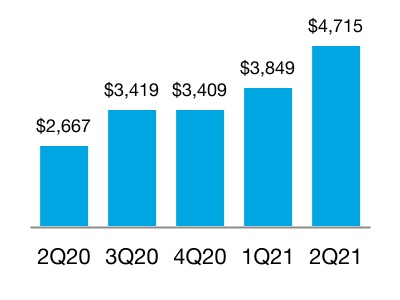
Net Revenues
(In millions)
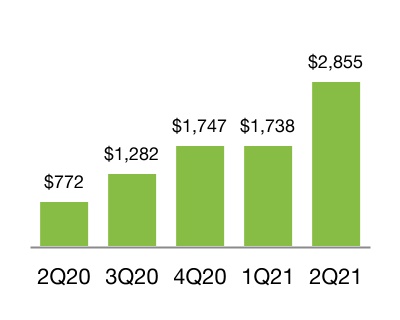
Comprehensive Income
(In millions)
| | | | | | | | | | | | | | | | | | | | | | | | | | | | | | | | |
| (Dollars in millions) | | 2Q 2021 | | 1Q 2021 | | Change | | 2Q 2020 | | Change |
| Net interest income | | $4,460 | | $3,308 | | $1,152 | | $2,590 | | $1,870 |
| | | | | | | | | | |
| | | | | | | | | | |
| | | | | | | | | | |
| Non-interest income | | 255 | | 541 | | (286) | | 77 | | 178 |
| Net revenues | | 4,715 | | 3,849 | | 866 | | 2,667 | | 2,048 |
| | | | | | | | | | |
| | | | | | | | | | |
| | | | | | | | | | |
| | | | | | | | | | |
| Credit-related income (expense) | | 128 | | (432) | | 560 | | (647) | | 775 |
| | | | | | | | | | |
| | | | | | | | | | |
| | | | | | | | | | |
| Operating expense | | (1,245) | | (1,231) | | (14) | | (1,050) | | (195) |
| Income (loss) before income tax (expense) benefit | | 3,598 | | 2,186 | | 1,412 | | 970 | | 2,628 |
| Income tax (expense) benefit | | (743) | | (448) | | (295) | | (198) | | (545) |
| Net income (loss) | | 2,855 | | 1,738 | | 1,117 | | 772 | | 2,083 |
| Total other comprehensive income (loss), net of taxes and reclassification adjustments | | (74) | | (328) | | 254 | | 103 | | (177) | |
| Comprehensive income (loss) | | $2,781 | | $1,410 | | $1,371 | | $875 | | $1,906 |
Key Drivers
Net income and comprehensive income increased year-over-year, mainly driven by:
•Higher net interest income primarily due to continued mortgage portfolio growth, higher average guarantee fee rates, and higher deferred fee income recognition.
•Credit-related income in the second quarter of 2021 compared to credit-related expense in the second quarter of 2020, primarily driven by a benefit for credit losses as a result of a credit reserve release due to realized house price appreciation and improving economic conditions. This was partially offset by a decrease in credit enhancement recoveries. Credit-related expense in the second quarter of 2020 was primarily driven by the negative economic effects of the COVID-19 pandemic.
Freddie Mac Second Quarter 2021 Financial Results
July 29, 2021
Page 4
| | |
| Single-Family Segment |
| Business Results |
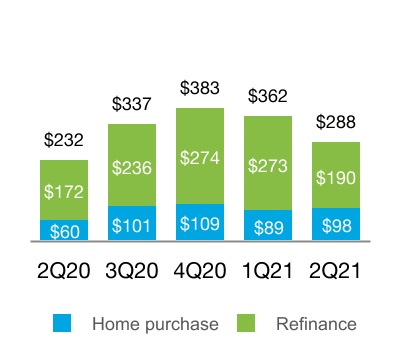
New Business Activity
(UPB in billions)
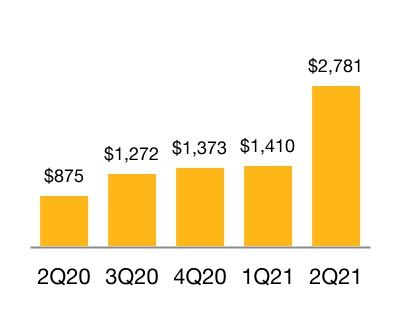
Mortgage Portfolio
(UPB in billions)
| | | | | | | | | | | | | | | | | | | | | | | | | | | | | | | | |
| | 2Q 2021 | | 1Q 2021 | | Change | | 2Q 2020 | | Change |
| New Business Statistics: | | | | | | | | | | |
| | | | | | | | | | |
| | | | | | | | | | |
| | | | | | | | | | |
| Average guarantee fee rate charged (bps) | | 49 | | | 50 | | (1) | | 48 | | 1 |
| Weighted average original loan-to-value (LTV) (%) | | 71 | | | 69 | | | 2 | | | 72 | | | (1) | |
| Weighted average original credit score | | 754 | | | 759 | | (5) | | 758 | | (4) |
| First-time homebuyers (% of home purchase loans) | | 47 | | | 46 | | | 1 | | | 48 | | | (1) | |
| Single-Family homes funded (in thousands) | | 1,023 | | | 1,231 | | (208) | | 827 | | 196 |
| Purchase borrowers (in thousands) | | 315 | | | 291 | | 24 | | 218 | | 97 |
| Refinance borrowers (in thousands) | | 708 | | | 940 | | (232) | | 609 | | 99 |
| UPB covered by new CRT issuance (in billions) | | $174 | | $245 | | $(71) | | $1 | | $173 |
| Portfolio Statistics: | | | | | | | | | | |
| Average guarantee fee rate charged (bps) | | 46 | | 45 | | 1 | | 42 | | 4 |
| Weighted average current LTV (%) | | 56 | | | 58 | | | (2) | | | 59 | | | (3) | |
| Weighted average current credit score | | 756 | | 754 | | 2 | | 751 | | 5 |
| Loan count (in millions) | | 12.5 | | 12.3 | | 0.2 | | 11.4 | | 1.1 |
| Credit-Related Statistics: | | | | | | | | | | |
| | | | | | | | | | |
| | | | | | | | | | |
| | | | | | | | | | |
| Loan workout activity (in thousands) | | 88 | | 94 | | (6) | | 89 | | (1) |
| Loans in forbearance, based on loan count (%) | | 1.67 | | | 2.19 | | | (0.52) | | | 3.75 | | | (2.08) | |
| Current (%) | | 0.26 | | | 0.32 | | | (0.06) | | | N/A | | N/A |
| Past due (%) | | 1.41 | | | 1.87 | | | (0.46) | | | 3.75 | | | (2.34) | |
| | | | | | | | | | |
| | | | | | | | | | |
| | | | | | | | | | |
| | | | | | | | | | |
| Credit enhancement coverage (%) | | 49 | | | 50 | | | (1) | | | 52 | | | (3) | |
Business Highlights
•The company provided funding for approximately 1.0 million single-family homes, more than 708,000 of which were refinance loans. First-time homebuyers represented 47% of new single-family purchase loans.
•Single-Family loan workout activity decreased to 88,000, from 89,000 in the second quarter of 2020.
•1.67% of loans in the Single-Family mortgage portfolio, based on loan count, were in forbearance as of June 30, 2021.
•Credit enhancement coverage of the Single-Family mortgage portfolio decreased to 49%, from 52% in the second quarter of 2020, primarily due to a higher proportion of recently acquired loans with lower LTV ratios and the high volume of new business activity which has not been included in credit risk transfer (CRT) transactions, but may be included in future periods.
Freddie Mac Second Quarter 2021 Financial Results
July 29, 2021
Page 5
| | |
| Multifamily Segment |
| Financial Results |
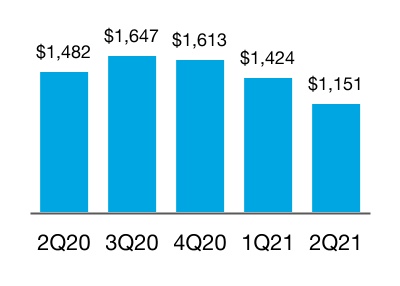
Net Revenues
(In millions)
Net Income
(In millions)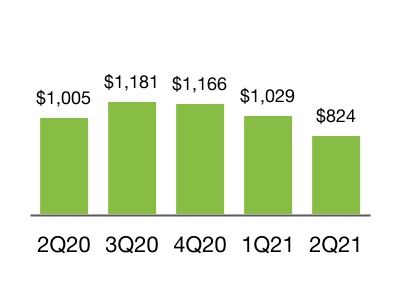
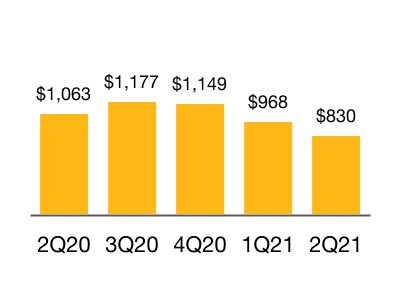
Comprehensive Income
(In millions)
| | | | | | | | | | | | | | | | | | | | | | | | | | | | | | | | |
| (Dollars in millions) | | 2Q 2021 | | 1Q 2021 | | Change | | 2Q 2020 | | Change |
| Net interest income | | $307 | | $331 | | $(24) | | $286 | | $21 |
| Guarantee income | | 346 | | 159 | | 187 | | 414 | | | (68) |
| Investment gains (losses), net | | 499 | | 908 | | (409) | | 731 | | | (232) |
| Other income (loss) | | (1) | | 26 | | (27) | | 51 | | | (52) |
| Net revenues | | 1,151 | | 1,424 | | (273) | | 1,482 | | | (331) |
| Credit-related income (expense) | | 43 | | 28 | | 15 | | (84) | | | 127 |
| | | | | | | | | | |
| | | | | | | | | | |
| Operating expense | | (155) | | (157) | | 2 | | (133) | | | (22) |
| Income (loss) before income tax (expense) benefit | | 1,039 | | 1,295 | | (256) | | 1,265 | | | (226) |
| Income tax (expense) benefit | | (215) | | (266) | | 51 | | (260) | | | 45 |
| Net income (loss) | | 824 | | 1,029 | | (205) | | 1,005 | | | (181) |
| Total other comprehensive income (loss), net of taxes and reclassification adjustments | | 6 | | (61) | | 67 | | 58 | | | (52) |
| Comprehensive income (loss) | | $830 | | $968 | | $(138) | | $1,063 | | $(233) |
Key Drivers
•Net income and comprehensive income decreased year-over-year, mainly driven by lower net investment gains primarily due to less K Certificate spread tightening, lower net impacts from index lock activity, and a smaller volume of fixed-rate held-for-sale loan commitments, partially offset by higher floating-rate loan securitization volume.
Freddie Mac Second Quarter 2021 Financial Results
July 29, 2021
Page 6
| | |
| Multifamily Segment |
| Business Results |
New Business Activity
(UPB in billions)
Mortgage Portfolio
(UPB in billions)
| | | | | | | | | | | | | | | | | | | | | | | | | | | | | | | | |
| | 2Q 2021 | | 1Q 2021 | | Change | | 2Q 2020 | | Change |
| New Business Statistics: | | | | | | | | | | |
| | | | | | | | | | |
| Weighted average original LTV (%) | | 68 | | | 69 | | | (1) | | | 69 | | (1) | |
| Weighted average original debt service coverage ratio | | 1.38 | | 1.38 | | — | | 1.36 | | 0.02 |
| Number of rental units financed (in thousands) | | 137 | | 134 | | 3 | | 201 | | (64) |
| Affordable ≤ 80% of AMI (% of eligible units acquired) | | 77 | | | 77 | | | — | | | 71 | | | 6 | |
| Affordable ≤ 120% of AMI (% of eligible units acquired) | | 97 | | | 97 | | | — | | | 95 | | | 2 | |
| Guarantee Activity Statistics: | | | | | | | | | | |
| Average guarantee fee rate charged (bps) | | 54 | | 49 | | 5 | | 58 | | (4) |
| | | | | | | | | | |
| Guaranteed UPB (in billions) | | $18 | | $21 | | $(3) | | $12 | | $6 |
| | | | | | | | | | |
| Portfolio Statistics: | | | | | | | | | | |
| | | | | | | | | | |
| Average guarantee fee rate charged (bps) | | 41 | | 41 | | — | | 37 | | 4 |
| Loan count (in thousands) | | 30 | | 30 | | — | | 28 | | 2 |
| Unit count (in thousands) | | 4,627 | | 4,613 | | 14 | | 4,371 | | 256 |
| Credit-Related Statistics: | | | | | | | | | | |
| | | | | | | | | | |
| Loans in forbearance, based on UPB (%) | | 1.28 | | | 1.88 | | | (0.60) | | | 2.41 | | | (1.13) | |
| Loans in forbearance period (%) | | 0.02 | | | 0.06 | | | (0.04) | | | 2.41 | | | (2.39) | |
| Loans in repayment period (%) | | 1.26 | | | 1.82 | | | (0.56) | | | — | | 1.26 | |
| Credit enhancement coverage (%) | | 94 | | | 92 | | | 2 | | | 89 | | | 5 | |
Business Highlights
•The company provided financing for more than 137,000 multifamily rental units. 77% of the eligible multifamily rental units financed were affordable to families earning at or below 80% of area median income (AMI).
•As of June 30, 2021, 1.28% of the loans in the Multifamily mortgage portfolio, based on UPB, were in a forbearance program, and approximately 99% of these loans were in the repayment period. Approximately 82% of the total loans in a Multifamily forbearance program were included in securitizations with credit enhancement provided by subordination.
•Credit enhancement coverage of the Multifamily mortgage portfolio increased to 94% from 89% in the second quarter of 2020.
Freddie Mac Second Quarter 2021 Financial Results
July 29, 2021
Page 7
About Freddie Mac’s Conservatorship
Since September 2008, Freddie Mac has been operating under conservatorship with FHFA as Conservator. The support provided by Treasury pursuant to the Purchase Agreement enables the company to maintain access to the debt markets and have adequate liquidity to conduct its normal business operations. The amount of funding available to Freddie Mac under the Purchase Agreement was $140.2 billion at June 30, 2021.
Due to changes to the terms of the senior preferred stock pursuant to the January 2021 Letter Agreement, the company will not be required to pay a dividend to Treasury until it has built sufficient capital to meet the capital requirements and buffers set forth in the Enterprise Regulatory Capital Framework (ERCF). As a result, the company was not required to pay a dividend to Treasury on the senior preferred stock in June 2021. As the company builds capital during this period, the quarterly increases in its Net Worth Amount have been, or will be, added to the aggregate liquidation preference of the senior preferred stock. The liquidation preference of the senior preferred stock increased to $91.4 billion on June 30, 2021 based on the $2.4 billion increase in the Net Worth Amount during the first quarter of 2021, and will increase to $95.0 billion on September 30, 2021 based on the $3.6 billion increase in the Net Worth Amount during the second quarter of 2021.
On June 23, 2021, the U.S. Supreme Court decided in Collins v. Yellen that the “for cause” removal provision for the director of FHFA in the Housing and Economic Recovery Act was unconstitutional. As a result, the President has the power to remove the FHFA Director at will. In this decision, the U.S. Supreme Court also noted that “the Recovery Act authorizes the agency to act in what it determines is ‘in the best interests of the regulated entity or the Agency,’" further providing that “when the FHFA acts as a conservator, it may aim to rehabilitate the regulated entity in a way that, while not in the best interests of the regulated entity, is beneficial to the Agency and, by extension, the public it serves.”
For additional information on the company's conservatorship, Purchase Agreement, January 2021 Letter Agreement, senior preferred stock, ERCF, regulation and supervision, and the Collins case, see the company's Quarterly Report on Form 10-Q for the quarter ended June 30, 2021.
Additional Information
For more information, including information related to Freddie Mac’s financial results, conservatorship, and related matters, see the company’s Quarterly Report on Form 10-Q for the quarter ended June 30, 2021 and the company’s Second Quarter 2021 Financial Results Supplement. These documents are available on the Investor Relations page of the company’s website at www.FreddieMac.com.
Additional information about Freddie Mac and its business is also set forth in the company’s other filings with the SEC, which are available on the Investor Relations page of the company’s website at www.FreddieMac.com and the SEC’s website at www.sec.gov. Freddie Mac encourages all investors and interested members of the public to review these materials for a more complete understanding of the company’s financial results and related disclosures.
Webcast Announcement
Management will host a conference call at 9 a.m. Eastern Time on July 29, 2021 to share the company’s results with the media. The conference call will be concurrently webcast. To access the audio webcast, use the following link: https://edge.media-server.com/mmc/p/zz8gh5fd. The replay will be available on the company’s website at www.FreddieMac.com for approximately 30 days. All materials related to the call will be available on the Investor Relations page of the company’s website at www.FreddieMac.com.
| | | | | |
| |
| Media Contact: Frederick Solomon (703) 903-3861 | Investor Contact: Laurie Garthune (571) 382-4732 |
| |
* * * *
This press release contains forward-looking statements, which may include statements pertaining to the conservatorship, the company’s current expectations and objectives for its Single-Family and Multifamily segments, its efforts to assist the housing market, liquidity and capital management, economic and market conditions and trends, the effects of the COVID-19 pandemic and actions taken in response thereto on its business, financial condition, and liquidity, its market share, the effect of legislative and regulatory developments and new accounting guidance, credit quality of loans the company owns or guarantees, the costs and benefits of
Freddie Mac Second Quarter 2021 Financial Results
July 29, 2021
Page 8
the company’s CRT transactions, and results of operations and financial condition. Forward-looking statements involve known and unknown risks and uncertainties, some of which are beyond the company’s control. Management’s expectations for the company’s future necessarily involve a number of assumptions, judgments, and estimates, and various factors, including changes in market conditions, liquidity, mortgage spreads, credit outlook, uncertainty about the duration, severity, and effects of the COVID-19 pandemic and actions taken in response thereto, actions by the U.S. government (including FHFA, Treasury, and Congress) and state and local governments, and the impacts of legislation or regulations and new or amended accounting guidance, could cause actual results to differ materially from these expectations. These assumptions, judgments, estimates, and factors are discussed in the company’s Annual Report on Form 10-K for the year ended December 31, 2020, Quarterly Reports on Form 10-Q for the quarters ended March 31, 2021 and June 30, 2021, and Current Reports on Form 8-K, which are available on the Investor Relations page of the company’s website at www.FreddieMac.com and the SEC’s website at www.sec.gov. The company undertakes no obligation to update forward-looking statements it makes to reflect events or circumstances occurring after the date of this press release.
Freddie Mac makes home possible for millions of families and individuals by providing mortgage capital to lenders. Since its creation by Congress in 1970, the company has made housing more accessible and affordable for homebuyers and renters in communities nationwide. The company is building a better housing finance system for homebuyers, renters, lenders, and taxpayers. Learn more at FreddieMac.com, Twitter @FreddieMac and Freddie Mac’s blog FreddieMac.com/blog.
Freddie Mac Second Quarter 2021 Financial Results
July 29, 2021
Page 9
FREDDIE MAC
Condensed Consolidated Statements of Comprehensive Income (Loss) (Unaudited)
| | | | | | | | | | | | | | | | | | | | |
| | |
(In millions, except share-related amounts) | | 2Q 2021 | | 1Q 2021 | | 2Q 2020 |
| Net interest income | | | | | | |
| Interest income | | $15,230 | | $13,902 | | $15,716 |
| Interest expense | | (10,463) | | | (10,263) | | | (12,840) | |
| Net interest income | | 4,767 | | | 3,639 | | | 2,876 | |
| Non-interest income (loss) | | | | | | |
| Guarantee income | | 356 | | | 248 | | | 469 | |
| Investment gains (losses), net | | 636 | | | 1,208 | | | 670 | |
| Other income (loss) | | 107 | | | 178 | | | 134 | |
| Non-interest income (loss) | | 1,099 | | | 1,634 | | | 1,273 | |
| Net revenues | | 5,866 | | | 5,273 | | | 4,149 | |
| Benefit (provision) for credit losses | | 740 | | | 196 | | | (705) | |
| Non-interest expense | | | | | | |
| Salaries and employee benefits | | (346) | | | (344) | | | (327) | |
| Professional services | | (97) | | | (87) | | | (88) | |
| Other administrative expense | | (208) | | | (208) | | | (186) | |
| Total administrative expense | | (651) | | | (639) | | | (601) | |
| Credit enhancement expense | | (369) | | | (335) | | | (233) | |
| Benefit for (decrease in) credit enhancement recoveries | | (193) | | | (257) | | | 221 | |
| REO operations expense | | (7) | | | (8) | | | (14) | |
| Temporary Payroll Tax Cut Continuation Act of 2011 expense | | (570) | | | (534) | | | (442) | |
| Other expense | | (179) | | | (215) | | | (140) | |
| Non-interest expense | | (1,969) | | | (1,988) | | | (1,209) | |
| Income (loss) before income tax (expense) benefit | | 4,637 | | | 3,481 | | | 2,235 | |
| Income tax (expense) benefit | | (958) | | | (714) | | | (458) | |
| Net income (loss) | | 3,679 | | | 2,767 | | | 1,777 | |
| Other comprehensive income (loss), net of taxes and reclassification adjustments | | | | | | |
| Changes in unrealized gains (losses) related to available-for-sale securities | | (73) | | | (395) | | | 154 | |
| Changes in unrealized gains (losses) related to cash flow hedge relationships | | 8 | | | 10 | | | 11 | |
| Changes in defined benefit plans | | (3) | | | (4) | | | (4) | |
| Total other comprehensive income (loss), net of taxes and reclassification adjustments | | (68) | | | (389) | | | 161 | |
| Comprehensive income (loss) | | $3,611 | | $2,378 | | $1,938 |
| Net income (loss) | | $3,679 | | $2,767 | | $1,777 |
| Future increase in senior preferred stock liquidation preference | | (3,611) | | (2,378) | | (1,938) |
| Net income (loss) attributable to common stockholders | | $68 | | $389 | | $(161) |
| Net income (loss) per common share — basic and diluted | | $0.02 | | $0.12 | | $(0.05) |
| Weighted average common shares outstanding (in millions) — basic and diluted | | 3,234 | | | 3,234 | | | 3,234 | |
Freddie Mac Second Quarter 2021 Financial Results
July 29, 2021
Page 10
FREDDIE MAC
Condensed Consolidated Balance Sheets (Unaudited) | | | | | | | | | | | | | | |
| | June 30, | | December 31, |
(In millions, except share-related amounts) | | 2021 | | 2020 |
| Assets | | | | |
| Cash and cash equivalents (includes $3,954 and $17,379 of restricted cash and cash equivalents) | | $11,171 | | $23,889 |
| Securities purchased under agreements to resell | | 113,697 | | | 105,003 | |
| Investment securities, at fair value | | 59,558 | | | 59,825 | |
| Mortgage loans held-for-sale (includes $6,811 and $14,199 at fair value) | | 17,508 | | | 33,652 | |
| Mortgage loans held-for-investment (net of allowance for credit losses of $4,648 and $5,732) | | 2,590,715 | | | 2,350,236 | |
| Accrued interest receivable (net of allowance of $168 and $140) | | 7,637 | | | 7,754 | |
| Derivative assets, net | | 756 | | | 1,205 | |
| Deferred tax assets, net | | 6,494 | | | 6,557 | |
| Other assets (includes $6,080 and $5,775 at fair value) | | 34,606 | | | 39,294 | |
| Total assets | | $2,842,142 | | $2,627,415 |
| Liabilities and equity | | | | |
| Liabilities | | | | |
| Accrued interest payable | | $6,122 | | $6,210 |
Debt (includes $2,073 and $2,592 at fair value) | | 2,802,755 | | | 2,592,546 | |
| Derivative liabilities, net | | 507 | | | 954 | |
| Other liabilities | | 10,356 | | | 11,292 | |
| Total liabilities | | 2,819,740 | | | 2,611,002 | |
| Commitments and contingencies | | | | |
| Equity | | | | |
Senior preferred stock (liquidation preference of $91,439 and $86,539) | | 72,648 | | | 72,648 | |
| Preferred stock, at redemption value | | 14,109 | | | 14,109 | |
| Common stock, $0.00 par value, 4,000,000,000 shares authorized, 725,863,886 shares issued and 650,059,553 shares and 650,059,292 shares outstanding | | — | | | — | |
| Additional paid-in capital | | — | | | — | |
| Retained earnings (accumulated deficit) | | (60,656) | | | (67,102) | |
| AOCI, net of taxes, related to: | | | | |
| Available-for-sale securities | | 342 | | | 810 | |
| Cash flow hedge relationships | | (188) | | | (206) | |
| Defined benefit plans | | 32 | | | 39 | |
| Total AOCI, net of taxes | | 186 | | | 643 | |
| Treasury stock, at cost, 75,804,333 shares and 75,804,594 shares | | (3,885) | | | (3,885) | |
| Total equity | | 22,402 | | | 16,413 | |
| Total liabilities and equity | | $2,842,142 | | $2,627,415 |
| The table below presents the carrying value and classification of the assets and liabilities of consolidated variable interest entities (VIEs) on the company's condensed consolidated balance sheets. |
| | June 30, | | December 31, |
| (In millions) | | 2021 | | 2020 |
| Condensed Consolidated Balance Sheet Line Item | | | | |
| Assets: | | | | |
| Mortgage loans held-for-investment | | $2,543,467 | | $2,273,347 |
| | | | |
| | | | |
| | | | |
| | | | |
| | | | |
| All other assets | | 67,620 | | | 83,982 | |
| Total assets of consolidated VIEs | | $2,611,087 | | $2,357,329 |
| Liabilities: | | | | |
| Debt | | $2,575,653 | | $2,308,176 |
| | | | |
| | | | |
| All other liabilities | | 5,631 | | | 5,610 | |
| Total liabilities of consolidated VIEs | | $2,581,284 | | $2,313,786 |