Exhibit 99.1
| | |
 | | News Release |
FOR IMMEDIATE RELEASE
August 7, 2013
MEDIA CONTACT: Lisa Gagnon
703-903-3385
INVESTOR CONTACT: Robin Phillips
571-382-4732
FREDDIE MAC REPORTS NET INCOME OF $5.0 BILLION FOR
SECOND QUARTER 2013, COMPREHENSIVE INCOME OF $4.4 BILLION
Second Quarter 2013 Financial Results
| | — | | Second quarter 2013 net income was $5.0 billion, compared to $4.6 billion in the first quarter of 2013 – the seventh consecutive quarter of profitability and second largest in company history |
| | — | | Second quarter 2013 comprehensive income was $4.4 billion, compared to $7.0 billion in the first quarter of 2013 |
| | — | | Valuation allowance on the company’s deferred tax assets was $28.6 billion at June 30, 2013 |
Treasury Draws and Dividend Payments at June 30, 2013
| | — | | No additional Treasury draw required for the second quarter of 2013 |
| | — | | Based on net worth of $7.4 billion, the company’s dividend obligation to Treasury will be $4.4 billion in September 2013. Including the September obligation, the company’s aggregate cash dividends paid to Treasury will total approximately $41 billion |
| | — | | Senior preferred stock outstanding and held by Treasury remained $72.3 billion, as dividend payments do not reduce prior Treasury draws |
Housing Market Support Since January 1, 2009
| | — | | Provided $2.0 trillion of liquidity to the mortgage market that funded: |
¡ 7.2 million refinancings (includes over 1.0 million in the first half of 2013)
¡ 1.8 million home purchases
¡ 1.4 million units of multifamily rental housing
| | — | | Helped approximately 872,000 borrowers to avoid foreclosure (including 87,000 in the first half of 2013) |
| | — | | In July 2013, Freddie Mac executed a $500 million transaction (STACRSM) that lays off a portion of the credit risk on single-family mortgages to private investors, thus reducing taxpayer risk |
Credit Quality at June 30, 2013
| | — | | Post-2008 book of business grew to 70 percent of single-family credit guarantee portfolio during second quarter – 20 percent of the single-family credit guarantee portfolio were relief refinance loans (including HARP loans) |
| | — | | Delinquency rates continued to decline and remained below industry benchmarks |
¡ Single-family serious delinquency rate was 2.79 percent, down from 3.03 percent at March 31, 2013
¡ Multifamily delinquency rate was 0.09 percent, down from 0.16 percent at March 31, 2013
Freddie Mac Second Quarter 2013 Financial Results
August 7, 2013
Page 2
McLean, VA — Freddie Mac (OTCQB: FMCC) today reported net income of $5.0 billion for the second quarter of 2013, compared to $4.6 billion for the first quarter of 2013. The company also reported comprehensive income of $4.4 billion for the second quarter of 2013, compared to $7.0 billion for the first quarter of 2013.
Summary Financial Results(1)
| | | | | | | | | | | | | | |
| | | | | Three Months Ended | |
| | | | | March 31, | | | June 30, | | | | |
| ($ Billions) | | 2013 | | | 2013 | | | Change | |
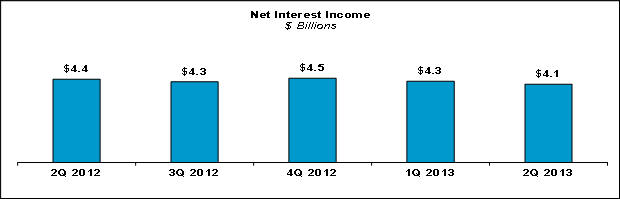
| 1 | | Net interest income | | $ | 4.3 | | | $ | 4.1 | | | $ | (0.1 | ) |
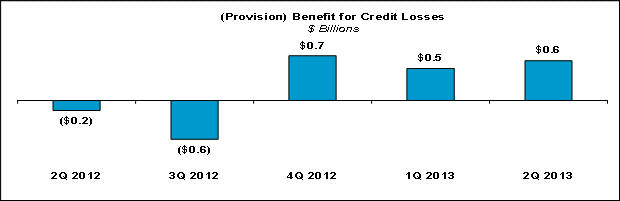
| 2 | | (Provision) benefit for credit losses | | | 0.5 | | | | 0.6 | | | | 0.1 | |
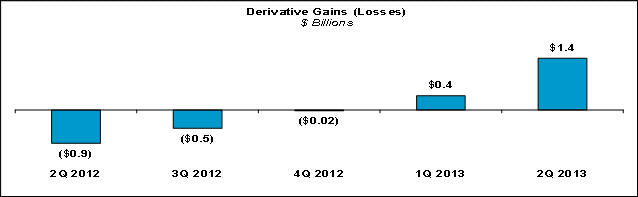
| 3 | | Derivative gains (losses) | | | 0.4 | | | | 1.4 | | | | 1.0 | |
| 4 | | Net impairment | | | (0.0 | ) | | | (0.0 | ) | | | (0.0 | ) |
| 5 | | Other non-interest income (loss) | | | 0.1 | | | | (0.6 | ) | | | (0.7 | ) |
| 6 | | Non-interest expense | | | (0.6 | ) | | | (0.5 | ) | | | 0.1 | |
| 7 | | Income tax benefit | | | 0.0 | | | | 0.0 | | | | 0.0 | |
| | | | | | | | | | | | | | |
| 8 | | Net income | | $ | 4.6 | | | $ | 5.0 | | | $ | 0.4 | |
| 9 | | Total other comprehensive income (loss) | | | 2.4 | | | | (0.6 | ) | | | (3.0 | ) |
| | | | | | | | | | | | | | |
| 10 | | Comprehensive income | | $ | 7.0 | | | $ | 4.4 | | | $ | (2.6 | ) |
| | | | | | | | | | | | | | |
| | | | | | | | | | | | | | | |
| (1) | Columns may not add due to rounding. See “Appendix — Financial Results Discussion” section for additional information about the company’s financial results for the second quarter of 2013. |
Net Income –Freddie Mac’s net income was $5.0 billion for the second quarter of 2013, up $407 million from the first quarter of 2013. The increase primarily reflects higher derivative gains that were partially offset by higher losses on mortgage loans recorded at fair value.
Comprehensive Income –Freddie Mac’s comprehensive income was $4.4 billion for the second quarter of 2013, down $2.6 billion from the first quarter of 2013. The decrease primarily reflects changes in the fair values on the company’s non-agency available-for-sale (AFS) securities. The fair value of Freddie Mac’s AFS securities may fluctuate considerably from quarter to quarter due to market conditions, which can lead to variability in the company’s comprehensive income results.
Deferred Tax Asset Valuation Allowance –On a quarterly basis, the company determines whether a valuation allowance is necessary on its net deferred tax assets. After evaluating all available evidence, Freddie Mac continued to record a valuation allowance on its net deferred tax assets as of June 30, 2013. The valuation allowance as of June 30, 2013, was $28.6 billion. If the housing market continues to improve, the company’s positive trend in book and taxable income continues, and the company retains its positive outlook for book and taxable income, then Freddie Mac may release its valuation allowance in 2013. Any release of the valuation allowance would be recognized in income and the company would expect to report a significant tax benefit and a corresponding increase in net worth in that period. The increase in net worth would result in an increased dividend obligation to Treasury. See “MD&A — CONSOLIDATED BALANCE SHEETS ANALYSIS — Deferred Tax Assets and Liabilities” in the company’s Quarterly Report on Form 10-Q for the quarter ended June 30, 2013 for additional information.
Freddie Mac Second Quarter 2013 Financial Results
August 7, 2013
Page 3
About Freddie Mac’s Conservatorship
Freddie Mac has been operating under conservatorship, with the Federal Housing Finance Agency (FHFA) as Conservator, since September 6, 2008. The support provided by Treasury pursuant to the Purchase Agreement enables the company to maintain access to the debt markets and have adequate liquidity to conduct its normal business operations. Through June 30, 2013, Freddie Mac has requested cumulative draws totaling $71.3 billion. Under the Purchase Agreement, the payment of dividends cannot be used to reduce prior Treasury draws. Accordingly, while Freddie Mac has paid aggregate cash dividends to Treasury of $36.6 billion through June 30, 2013 (and has an obligation to pay an additional $4.4 billion in September 2013), Treasury still maintains a liquidation preference of $72.3 billion on the company’s senior preferred stock as of June 30, 2013.
Treasury Draws and Dividend Payments
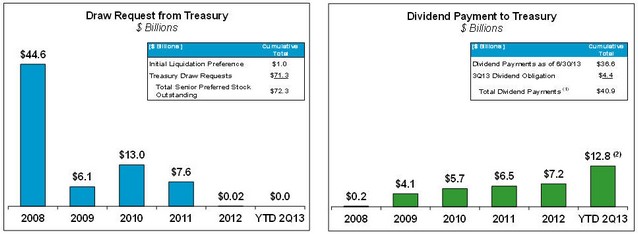
| (1) | Amounts may not add due to rounding. |
| (2) | Amount does not include the September 2013 dividend obligation of $4.4 billion. |
In August 2012, the terms governing the company’s dividend obligations on the senior preferred stock were amended. The amended Purchase Agreement does not allow the company to build a capital reserve over the long term. Beginning in 2013, the required senior preferred stock dividends each quarter equal the amount, if any, by which the company’s net worth as of the end of the preceding quarter exceeds an applicable capital reserve amount. The applicable capital reserve amount is $3.0 billion for each quarter of 2013 and will be reduced by $600 million annually thereafter until it reaches zero in 2018.
The amount of remaining funding available to Freddie Mac under the Purchase Agreement with Treasury is currently $140.5 billion, and will be reduced by any future draws.
Freddie Mac is not permitted to redeem the senior preferred stock prior to the termination of Treasury’s funding commitment under the Purchase Agreement. The limited circumstances under which Treasury’s funding commitment will terminate are described in “BUSINESS — Treasury Agreements” in the company’s Annual Report onForm 10-K for the year ended December 31, 2012.
Freddie Mac Second Quarter 2013 Financial Results
August 7, 2013
Page 4
Housing Market Support
Freddie Mac continues to support the U.S. housing market by ensuring credit availability for new and refinanced mortgages as well as rental housing. The company also continues helping struggling homeowners avoid foreclosure and stabilizing communities nationwide. Since the beginning of 2009, Freddie Mac has helped 10.3 million American families own or rent a home and approximately 872,000 avoid foreclosure. At the same time, the company is working with FHFA, the company’s customers and the industry to build a stronger housing finance system for the nation.
Number of Families Helped
| | | | | | | | | | | | | | | | | | | | | | | | | | |
| (Thousands) | | 2009 | | | 2010 | | | 2011 | | | 2012 | | | YTD
6/30/2013 | | | Cumulative
Total | |
| 1 | | Number of families helped to own or rent a home | | | 2,480 | | | | 2,089 | | | | 1,830 | | | | 2,472 | | | | 1,466 | | | | 10,337 | |
| 2 | | Relief refinance borrowers (includes HARP)(1) | | | 169 | | | | 533 | | | | 453 | | | | 687 | | | | 396 | | | | 2,238 | |
| 3 | | Other refinance borrowers(1) | | | 1,595 | | | | 947 | | | | 740 | | | | 996 | | | | 651 | | | | 4,929 | |
| 4 | | Purchase borrowers(1) | | | 460 | | | | 378 | | | | 326 | | | | 353 | | | | 234 | | | | 1,751 | |
| 5 | | Multifamily rental units | | | 256 | | | | 231 | | | | 311 | | | | 436 | | | | 185 | | | | 1,419 | |
| 6 | | Number of single families helped to avoid foreclosure(2) | | | 133 | | | | 275 | | | | 208 | | | | 169 | | | | 87 | | | | 872 | |
| 7 | | Loan modifications | | | 65 | | | | 170 | | | | 109 | | | | 70 | | | | 40 | | | | 454 | |
| 8 | | Repayment plans | | | 34 | | | | 31 | | | | 33 | | | | 33 | | | | 15 | | | | 146 | |
| 9 | | Forbearance agreements | | | 15 | | | | 35 | | | | 20 | | | | 13 | | | | 6 | | | | 89 | |
| 10 | | Short sales & deed-in-lieu of foreclosure
transactions | | | 19 | | | | 39 | | | | 46 | | | | 53 | | | | 26 | | | | 183 | |
| 11 | | Total (lines 1 + 6) | | | 2,613 | | | | 2,364 | | | | 2,038 | | | | 2,641 | | | | 1,553 | | | | 11,209 | |
| (1) | For the periods presented, a borrower may be counted more than once if the company purchased more than one loan (purchase or refinance mortgage) relating to the same borrower. |
| (2) | These categories are not mutually exclusive and a borrower in one category may also be included within another category in the same period. For the periods presented, a borrower may subsequently go into foreclosure. |
Providing Liquidity – Freddie Mac continues to provide access to affordable financing for new and refinanced mortgages and rental housing. Since the beginning of 2009, the company has provided $2.0 trillion in liquidity to the market through its purchases of loans and issuances of mortgage-related securities, including $276.0 billion during the first half of 2013.
Freddie Mac Second Quarter 2013 Financial Results
August 7, 2013
Page 5
Market Liquidity Provided(1)
| | | | | | | | | | | | | | | | | | | | | | | | | | |
| ($ Billions) | | 2009 | | | 2010 | | | 2011 | | | 2012 | | | YTD
6/30/2013 | | | Cumulative
Total | |
| 1 | | Single-family purchases or issuances(1) | | $ | 483 | | | $ | 390 | | | $ | 321 | | | $ | 427 | | | $ | 262 | | | $ | 1,883 | |
| 2 | | Relief refinance mortgages (includes HARP) | | | 35 | | | | 106 | | | | 82 | | | | 123 | | | | 65 | | | | 411 | |
| 3 | | Other refinance mortgages | | | 345 | | | | 200 | | | | 168 | | | | 228 | | | | 146 | | | | 1,087 | |
| 4 | | Purchase mortgages | | | 94 | | | | 78 | | | | 71 | | | | 76 | | | | 51 | | | | 370 | |
| 5 | | Other(2) | | | 9 | | | | 6 | | | | — | | | | — | | | | — | | | | 15 | |
| 6 | | Multifamily loan purchases or guarantees(1)(3) | | $ | 17 | | | $ | 16 | | | $ | 20 | | | $ | 29 | | | $ | 13 | | | $ | 95 | |
| 7 | | Other(4) | | $ | 46 | | | $ | — | | | $ | 8 | | | $ | — | | | $ | 1 | | | $ | 55 | |
| 8 | | Total (lines 1+6+7) | | $ | 546 | | | $ | 406 | | | $ | 349 | | | $ | 456 | | | $ | 276 | | | $ | 2,033 | |
| (1) | Based on unpaid principal balance (UPB). |
| (2) | Includes Ginnie Mae Certificates, HFA initiative-related guarantees, and Other Guarantee Transactions for which loan level data is not available. |
| (3) | In the first quarter of 2013, Freddie Mac made certain changes to more closely align the presentation of the company’s single-family and multifamily securitization activities. As a result, Multifamily issuances of K Certificates are no longer included in line 6. All periods presented above have been revised. |
| (4) | Consists of non-Freddie Mac mortgage-related securities purchased for the company’s mortgage-related investments portfolio. |
Enabling Refinance Activity– Through purchasing refinance mortgages, Freddie Mac continues to help borrowers lower their payments and/or improve their mortgage terms. Refinance purchases of $211.0 billion accounted for 81 percent of the company’s single-family mortgage purchase volume during the first half of 2013. The company estimates that the homeowners who refinanced during the second quarter will reduce their mortgage payments by an average of $3,700 during the first 12 months. Since the beginning of 2009, the company has purchased or guaranteed $1.5 trillion of refinance mortgages, helping nearly 7.2 million homeowners.
Freddie Mac continues to help borrowers refinance through its streamlined relief refinance initiative, which includes the Home Affordable Refinance Program (HARP) for loans with loan-to-value (LTV) ratios above 80 percent. During the first half of 2013, Freddie Mac purchased approximately 223,000 HARP loans - helping underwater homeowners nationwide and especially in areas significantly affected by the housing crisis. Since the beginning of 2009, Freddie Mac has funded 2.2 million relief refinance mortgages, including 1.1 million HARP loans. The company continues to work to increase lender participation in the HARP program, and has stepped up its marketing efforts to raise awareness about the program’s benefits and eligibility requirements among homeowners.
Preventing Foreclosures – Freddie Mac continues to help struggling borrowers retain their homes or otherwise avoid foreclosure. During the first half of 2013, the company completed approximately 87,000 single-family loan workouts, including about 40,000 loan modifications. This brings the total number of homeowners the company has helped avoid foreclosure to approximately 872,000 since the beginning of 2009. The company recently announced that two loan modification programs – HAMP and its streamlined modification – will be extended through year-end 2015, providing additional opportunities to assist struggling homeowners.
In addition, when foreclosure is unavoidable, Freddie Mac has further helped to stabilize communities by focusing its real estate owned (REO) home sales on owner-occupants, who made up approximately two–
Freddie Mac Second Quarter 2013 Financial Results
August 7, 2013
Page 6
thirds of its purchasers since the beginning of 2009, and by promoting industry-leading standards for property preservation.
Building a Stronger Mortgage Market – Working with FHFA and the industry, Freddie Mac continues to devote resources to help develop and build a stronger, more efficient mortgage market. As part of this effort, the company is focused on developing new ways to share credit risk and bring private capital back to the housing finance market. In July 2013, Freddie Mac closed a single-family transaction – issuance of $500 million of Structured Agency Credit Risk (STACR) debt notes - through which the company is laying off a portion of the credit risk associated with recently acquired, single-family conforming loans to private investors. Payments on the STACR debt notes are based on a reference pool of single-family loans totaling $22.5 billion in UPB. A majority of this UPB is designed to qualify toward the 2013 Conservatorship Scorecard goal of completing risk transfer transactions with at least $30 billion in aggregate UPB. Through STACR, Freddie Mac’s intent is to create a risk-sharing product that is repeatable and scalable over time.
In addition, the company continues to work with FHFA and Fannie Mae to independently execute the conservatorship goal of building a common securitization platform that would function as a market utility as well as other initiatives to create a sustainable housing finance system.
Credit Quality
Post-2008 Single-Family Books of Business – Since 2008, Freddie Mac has enhanced its credit and underwriting policies, purchased fewer loans with higher-risk characteristics and seen positive changes in the underwriting practices of lenders and mortgage insurers. These factors have contributed to the improved credit quality of loans purchased since 2008 (excluding relief refinance mortgages).
Credit Quality of Single-Family Credit Guarantee Portfolio Purchases
| | | | | | | | | | |
| | | 2009 | | 2010 | | 2011 | | 2012 | | YTD
6/30/2013 |
Weighted Average Original LTV Ratio: | | | | | | | | | | |
Relief refinance (includes HARP) | | 80% | | 77% | | 77% | | 97% | | 92% |
All other | | 66% | | 67% | | 67% | | 68% | | 69% |
Total purchases | | 67% | | 70% | | 70% | | 76% | | 75% |
Weighted Average Credit Score: | | | | | | | | | | |
Relief refinance (includes HARP) | | 738 | | 747 | | 744 | | 740 | | 730 |
All other | | 757 | | 758 | | 759 | | 762 | | 758 |
Total purchases | | 756 | | 755 | | 755 | | 756 | | 751 |
At June 30, 2013, loans originated after 2008 accounted for 70 percent of the UPB of Freddie Mac’s single-family credit guarantee portfolio, and HARP loans represented 12 percent of the single-family credit guarantee portfolio. HARP loans generally reflect many of the credit risk attributes of the original loans, and thus generally present higher risk to the company than other refinance loans the company has purchased since 2009. However, in many cases, the borrower’s payments are reduced through HARP refinancing, thereby strengthening the borrower’s potential to make their mortgage payments.
Freddie Mac Second Quarter 2013 Financial Results
August 7, 2013
Page 7
Single-Family Credit Guarantee Portfolio – Concentration of Credit Risk
| | | | | | | | |
| | | As of 6/30/2013 | | | | YTD 6/30/2013 |
| | | % of Portfolio | | Serious Delinquency
Rate | | | | % of Credit Losses |
Loans originated in 2009 - 2013 | | 70% | | 0.37% | | | | 6.3% |
HARP | | 12 | | 0.90% | | | | 4.1 |
Other relief refinance | | 8 | | 0.32% | | | | 0.4 |
All other loans | | 50 | | 0.25% | | | | 1.8 |
Loans originated in 2005 - 2008 | | 19 | | 9.39% | | | | 84.1 |
Loans originated in 2004 and prior | | 11 | | 3.26% | | | | 9.6 |
Total | | 100% | | 2.79% | | | | 100.0% |
2005 to 2008 Single-Family Books of Business – Loans originated in 2005 through 2008 account for the majority of the nearly $75 billion in provision for credit losses the company has recorded since the beginning of 2008. These loans continued to represent a declining portion of the company’s single-family credit guarantee portfolio. At June 30, 2013, loans originated in 2005 through 2008 represented 19 percent of the company’s single-family credit guarantee portfolio (based on UPB), compared to 22 percent at March 31, 2013.
Single-family serious delinquency rate was 2.79 percent at June 30, 2013, compared to 3.03 percent at March 31, 2013. While the company’s single-family serious delinquency rate remains higher than the rate in years prior to 2009, it is substantially below the rate for the entire U.S. mortgage market. According to the Mortgage Bankers Association’s National Delinquency Survey, the serious delinquency rate on first-lien single-family loans in the U.S. mortgage market was 6.39 percent at March 31, 2013, which is the most recent date for which data is available.
Multifamily delinquency rate(based on loans 60 days or more past due or in the process of foreclosure) was 0.09 percent at June 30, 2013, compared to 0.16 percent at March 31, 2013, reflecting continued positive multifamily market fundamentals.
Additional Information
For more information, including that related to Freddie Mac’s financial results, conservatorship and related matters, see the company’s Quarterly Report on Form 10-Q for the quarter ended June 30, 2013, and the company’s Consolidated Financial Statements and Financial Results Supplement. These documents are available on the Investor Relations page of the company’s Web site at www.FreddieMac.com/investors.
Additional information about Freddie Mac and its business is also set forth in the company’s filings with the SEC, which are available on the Investor Relations page of the company’s Web site at www.FreddieMac.com/investors and the SEC’s Web site at www.sec.gov. Freddie Mac encourages all investors and interested members of the public to review these materials for a more complete understanding of the company’s financial results and related disclosures.
Freddie Mac Second Quarter 2013 Financial Results
August 7, 2013
Page 8
* * * *
This press release contains forward-looking statements, which may include statements pertaining to the conservatorship, the company’s current expectations and objectives for its efforts under the Making Home Affordable program, the servicing alignment initiative and other programs to assist the U.S. residential mortgage market, future business plans, liquidity, capital management, economic and market conditions and trends, market share, the effect of legislative and regulatory developments, implementation of new accounting guidance, credit losses, internal control remediation efforts, and results of operations and financial condition on a GAAP, Segment Earnings and fair value basis. Forward-looking statements involve known and unknown risks and uncertainties, some of which are beyond the company’s control. Management’s expectations for the company’s future necessarily involve a number of assumptions, judgments and estimates, and various factors, including changes in market conditions, liquidity, mortgage-to-debt option-adjusted spread, credit outlook, actions by FHFA, Treasury, the Federal Reserve, the SEC, HUD, other federal agencies, the Administration and Congress, and the impacts of legislation or regulations and new or amended accounting guidance, could cause actual results to differ materially from these expectations. These assumptions, judgments, estimates and factors are discussed in the company’s Annual Report onForm 10-K for the year ended December 31, 2012, Quarterly Reports onForm 10-Q for the quarters ended March 31, 2013 and June 30, 2013 and Current Reports onForm 8-K, which are available on the Investor Relations page of the company’s Web site at www.FreddieMac.com/investors and the SEC’s Web site at www.sec.gov. The company undertakes no obligation to update forward-looking statements it makes to reflect events or circumstances after the date of this press release.
Freddie Mac was established by Congress in 1970 to provide liquidity, stability and affordability to the nation’s residential mortgage markets. Freddie Mac supports communities across the nation by providing mortgage capital to lenders. Today Freddie Mac is making home possible for one in four home borrowers and is one of the largest sources of financing for multifamily housing. For more information, visit www.FreddieMac.com.
# # #
Freddie Mac Second Quarter 2013 Financial Results
August 7, 2013
Page 9
Appendix - Financial Results Discussion
Summary Consolidated Statements of Comprehensive Income(1)
| | | | | | | | | | | | | | |
| | | | | Three Months Ended | |
| ($ Millions) | | March 31,
2013 | | | June 30,
2013 | | | Change | |
| 1 | | Net interest income | | $ | 4,265 | | | $ | 4,144 | | | $ | (121 | ) |
| 2 | | (Provision) benefit for credit losses | | | 503 | | | | 623 | | | | 120 | |
| 3 | | Derivative gains (losses) | | | 375 | | | | 1,362 | | | | 987 | |
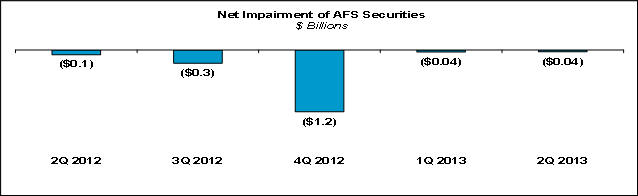
| 4 | | Net impairments of AFS securities recognized in earnings | | | (43 | ) | | | (44 | ) | | | (1 | ) |
| 5 | | Other non-interest income (loss) | | | 70 | | | | (640 | ) | | | (710 | ) |
| | | | | | | | | | | | | | |
| 6 | | Non-interest income (loss) | | | 402 | | | | 678 | | | | 276 | |
| 7 | | Administrative expenses | | | (432 | ) | | | (444 | ) | | | (12 | ) |
| 8 | | REO operations income (expense) | | | (6 | ) | | | 110 | | | | 116 | |
| 9 | | Other non-interest expense | | | (186 | ) | | | (164 | ) | | | 22 | |
| | | | | | | | | | | | | | |
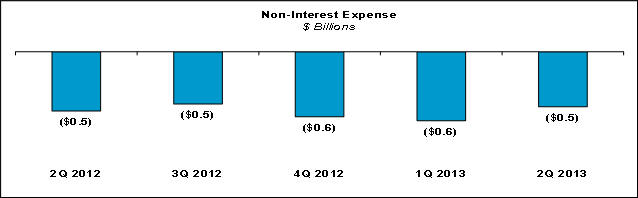
| 10 | | Non-interest expense | | | (624 | ) | | | (498 | ) | | | 126 | |
| 11 | | Income tax benefit | | | 35 | | | | 41 | | | | 6 | |
| | | | | | | | | | | | | | |
| 12 | | Net income | | $ | 4,581 | | | $ | 4,988 | | | $ | 407 | |
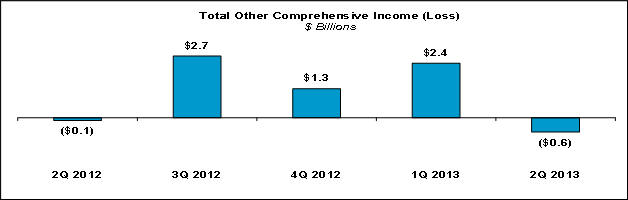
| 13 | | Total other comprehensive income (loss) | | | 2,390 | | | | (631 | ) | | | (3,021 | ) |
| | | | | | | | | | | | | | |
| 14 | | Comprehensive income | | $ | 6,971 | | | $ | 4,357 | | | $ | (2,614 | ) |
| | | | | | | | | | | | | | |
| | | | | | | | | | | | | | | |
| (1) | Columns may not add due to rounding. |
Net interest income was $4.1 billion for the second quarter of 2013, compared to $4.3 billion for the first quarter of 2013. Net interest yield was 83 basis points for the second quarter of 2013, compared to 85 basis points for the first quarter of 2013. The decreases in both net interest income and net interest yield primarily reflect a decline in the balance of higher-yielding mortgage-related assets due to continued liquidations.
(Provision) benefit for credit losses was a benefit of $623 million for the second quarter of 2013, compared to a benefit of $503 million for the first quarter of 2013. The benefit for credit losses for the second quarter of 2013 was driven by continued improvement in national home prices combined with a further decrease in the volume of newly delinquent single-family loans.
Freddie Mac Second Quarter 2013 Financial Results
August 7, 2013
Page 10
The company’s loan loss reserves were $26.4 billion as of June 30, 2013, compared to $28.6 billion as of March 31, 2013.
Derivative gainswas $1.4 billion for the second quarter of 2013, compared to $375 million for the first quarter of 2013. The increase was primarily driven by higher gains on the net pay-fixed swap portfolio as long-term interest rates increased more in the second quarter as compared to the first quarter.
Net impairment of AFS securities recognized in earnings was $44 million for the second quarter of 2013, compared to $43 million for the first quarter of 2013. Second quarter 2013 result reflects continued improvement in forecasted house prices.
In the fourth quarter of 2012, Freddie Mac recognized $1.2 billion of net impairment expense mainly due to the implementation of a third-party model to project cash flows on the company’s single-family non-agency mortgage-related securities.
Freddie Mac Second Quarter 2013 Financial Results
August 7, 2013
Page 11
Non-interest expense was $498 million for the second quarter of 2013, compared to $624 million for the first quarter of 2013. The decrease in non-interest expense was primarily driven by higher disposition gains and lower REO holding period write-downs as REO fair values increased during the second quarter of 2013.
Total other comprehensive income (loss)was a loss of $631 million for the second quarter of 2013, compared to income of $2.4 billion for the first quarter of 2013. The shift to a loss in the second quarter of 2013 mainly reflects that first quarter results benefited from significant spread tightening on non-agency AFS securities whereas spreads on commercial mortgage-backed securities (CMBS) widened during the second quarter.
Segment Financial Results – Freddie Mac’s operations consist of three reportable segments, which are based on the type of business activities each performs — Investments, Single-family Guarantee and
Freddie Mac Second Quarter 2013 Financial Results
August 7, 2013
Page 12
Multifamily. Certain activities that are not part of a reportable segment are included in the All Other category.
Summary of Segment Earnings (Loss) and Comprehensive Income (Loss) (1)
| | | | | | | | | | | | | | |
| | | | | Three Months Ended | |
| ($ Billions) | | March 31,
2013 | | | June 30,
2013 | | | Change | |
| | Segment Earnings (loss), net of taxes | | | | | | | | | | | | |
| 1 | | Investments | | $ | 2.8 | | | $ | 3.3 | | | $ | 0.4 | |
| 2 | | Single-family Guarantee | | | 1.2 | | | | 1.3 | | | | 0.2 | |
| 3 | | Multifamily | | | 0.6 | | | | 0.4 | | | | (0.2 | ) |
| 4 | | All Other | | | (0.0 | ) | | | — | | | | 0.0 | |
| | | | | | | | | | | | | | |
| 5 | | Total Segment Earnings (loss), net of taxes | | $ | 4.6 | | | $ | 5.0 | | | $ | 0.4 | |
| | | | | | | | | | | | | | |
| | Comprehensive income (loss) of segments | | | | | | | | | | | | |
| 6 | | Investments | | $ | 4.8 | | | $ | 2.9 | | | $ | (1.9 | ) |
| 7 | | Single-family Guarantee | | | 1.2 | | | | 1.3 | | | | 0.1 | |
| 8 | | Multifamily | | | 1.0 | | | | 0.1 | | | | (0.9 | ) |
| 9 | | All Other | | | (0.0 | ) | | | — | | | | 0.0 | |
| | | | | | | | | | | | | | |
| 10 | | Comprehensive income (loss) of segments | | $ | 7.0 | | | $ | 4.4 | | | $ | (2.6 | ) |
| | | | | | | | | | | | | | |
| | | | | | | | | | | | | | | |
| (1) | Columns may not add due to rounding. |
Investments segment earned $3.3 billion for the second quarter of 2013, compared to $2.8 billion for the first quarter of 2013. The increase was primarily driven by higher derivative gains. Comprehensive income for the Investments segment was $2.9 billion for the second quarter of 2013, compared to $4.8 billion for the first quarter of 2013. The decrease mainly reflects that first quarter results benefited from significant spread tightening on the company’s non-agency AFS securities.
Single-family Guarantee segment earned $1.3 billion for the second quarter of 2013, compared to $1.2 billion for the first quarter of 2013. The increase is primarily attributable to higher REO operations income and higher benefit for credit losses. Comprehensive income for the Single-family Guarantee segment approximated segment earnings for both the first and second quarter of 2013.
Multifamily segment earned $393 million for the second quarter of 2013, compared to $585 million for the first quarter of 2013. The decrease in segment earnings primarily reflects higher losses on mortgage loans recorded at fair value due to spread widening. Comprehensive income for the Multifamily segment was $128 million for the second quarter of 2013, compared to $1.0 billion for the first quarter of 2013. The decrease primarily reflects the unfavorable impact of spread widening on CMBS, as well as lower segment earnings during the second quarter of 2013.