 Fourth Quarter 2013 Financial Results Supplement February 27, 2014 Exhibit 99.2 |
 2 Table of contents Business Results Credit Supplement 3 - Quarterly Financial Results 21 - National Home Prices 4 - Annual Financial Results 22 - State-by-State Home Prices: June 2006 to December 2013 5 - Comprehensive Income 23 - State-by-State Home Prices: December 2012 to December 2013 6 - Senior Preferred Stock Purchase Agreement with Treasury 24 - Mortgage Market and Freddie Mac Serious Delinquency Rates 7 - Treasury Draw Requests and Dividend Payments 25 - 8 - Total Equity and Senior Preferred Stock Activity 26 - 9 - Single-Family Guarantee Fees Charged on New Acquisitions 27 - 10 - Loan Loss Reserves 28 - 11 - 29 - 12 - 30 - 13 - 31 - 14 - 32 - 15 - 33 - Multifamily Portfolio Composition 16 - 34 - Multifamily Securitization Volume 17 - 35 - Multifamily New Business Volume by State 18 - 36 - Multifamily Mortgage Portfolio UPB Concentration by State 19 - 37 - Multifamily Mortgage Portfolio by Attribute 38 - Multifamily Mortgage Portfolio by Attribute, Continued 39 - Multifamily Market and Freddie Mac Delinquency Rates Loan Purpose of Single-Family Credit Guarantee Portfolio Purchases Credit Quality of Single-Family Credit Guarantee Portfolio Purchases Single-Family Credit Guarantee Portfolio Characteristics Single-Family 4Q 2013 Credit Losses and REO by Region and State Single-Family Credit Profile by Book Year and Product Feature Single-Family Serious Delinquency Rates by State and Region Aging of Single-Family Seriously Delinquent Loans by Judicial and Non-Judicial States Real Estate Owned Single-Family Cumulative Foreclosure Transfer and Short Sale Rates by Book Year Market Liquidity Provided Single-Family Refinance Activity Performance of Single-Family Modified Loans Single-Family Loan Modifications Single-Family Loan Workouts Administrative Expenses Repurchase Requests Purchase Agreement Portfolio Limits |
 3 Quarterly financial results Line 2: Lower benefit for credit losses driven by moderation in home-price growth during 4Q13. Line 3: A shift from derivative losses in 3Q13 to derivative gains in 4Q13 driven by higher fair value gains on the net pay- fixed swap portfolio due to an increase in longer-term interest rates. Line 4: Higher net impairment of available-for-sale (AFS) securities primarily due to the 4Q13 implementation of enhanced model assumptions used to project cash flows on certain modified loans collateralizing non-agency mortgage-related securities. Line 5: Higher other non-interest income driven by a $4.3 billion increase in settlement proceeds related to private label securities (PLS) litigation in 4Q13. Line 12: A shift from income tax benefit in 3Q13 to income tax expense in 4Q13 primarily due to the release of the deferred tax asset valuation allowance. Line 14: A shift from total other comprehensive loss in 3Q13 to total other comprehensive income in 4Q13 reflects improved fair values on non-agency AFS securities due to spread tightening, as well as the recognition in earnings of other-than temporary impairments on the company’s non-agency mortgage-related securities in 4Q13. Note: Columns may not add due to rounding. ($ Billions) 4Q 2013 vs 3Q 2013 4Q 2013 3Q 2013 1 Net interest income 2 Benefit for credit losses 3 Derivative gains (losses) 4 Net impairment of available-for-sale securities recognized in earnings 5 Other non-interest income 6 Non-interest income 7 Total administrative expenses 8 Real estate owned operations income (expense) 9 Other non-interest expense 10 Non-interest expense 11 Pre-tax income 12 Income tax benefit (expense) 13 Net income 14 Total other comprehensive income (loss), net of taxes 15 Comprehensive income $4.3 1.1 (0.1) (0.1) 1.9 1.7 (0.5) 0.1 (0.2) (0.6) 6.5 24.0 30.5 (0.0) $30.4 $3.8 0.2 1.0 (1.3) 6.1 5.8 (0.5) (0.0) 0.1 (0.4) 9.3 (0.7) 8.6 1.2 $9.8 ($0.5) (0.9) 1.0 (1.2) 4.2 4.1 (0.0) (0.1) 0.3 0.2 2.8 (24.7) (21.9) 1.3 ($20.6) |
 4 Annual financial results Line 2: A shift from a provision for credit losses in 2012 to a benefit in 2013 due to a decrease in the volume of newly delinquent loans, increases in national home prices and approximately $1.7 billion in recoveries from representation and warranty settlements in 2013. Line 3: A shift from derivative losses in 2012 to derivative gains in 2013 driven by an increase in longer-term interest rates during 2013, compared to a decrease in longer-term interest rates during 2012, coupled with a change in the mix of the company’s derivative portfolio. Line 5: Higher other non-interest income driven primarily by settlement proceeds of $5.5 billion related to PLS litigation during 2013. Line 12: Higher income tax benefit primarily driven by the release of the deferred tax asset valuation allowance. Line 14: Lower total other comprehensive income reflects the unfavorable impact of higher interest rates, partially offset by higher fair value gains due to spread tightening on non-agency securities. Note: Columns may not add due to rounding. ($ Billions) 2013 vs 2012 2013 2012 1 Net interest income 2 (Provision) benefit for credit losses 3 Derivative gains (losses) 4 Net impairment of available-for-sale securities recognized in earnings 5 Other non-interest income 6 Non-interest income (loss) 7 Total administrative expenses 8 Real estate owned operations income (expense) 9 Other non-interest expense 10 Non-interest expense 11 Pre-tax income 12 Income tax benefit 13 Net income 14 Total other comprehensive income, net of taxes 15 Comprehensive income $17.6 (1.9) (2.4) (2.2) 0.5 (4.1) (1.6) (0.1) (0.6) (2.2) 9.4 1.5 11.0 5.1 $16.0 $16.5 2.5 2.6 (1.5) 7.4 8.5 (1.8) 0.1 (0.4) (2.1) 25.4 23.3 48.7 2.9 $51.6 ($1.1) 4.4 5.1 0.7 6.9 12.6 (0.2) 0.2 0.1 0.1 15.9 21.8 37.7 (2.1) $35.6 |
 5 Comprehensive income 1 Net income and Comprehensive income include $23.9 billion non-cash benefit from releasing the valuation allowance on deferred tax assets. 2 Consists of the after-tax changes in: (a) the unrealized gains and losses on available-for-sale securities; (b) the effective portion of derivatives previously designated as cash flow hedges; and (c) defined benefit plans. A B C = A + B 1 $ Billions $1.5 $1.8 $2.9 $5.6 $5.7 $7.0 $4.4 $30.4 $9.8 4Q 2011 1Q 2012 2Q 2012 3Q 2012 4Q 2012 1Q 2013 2Q 2013 3Q 2013 4Q 2013 Net income Comprehensive income Total other comprehensive income (loss), net of taxes 2 |
 Senior Preferred Stock Purchase Agreement with Treasury Senior preferred stock outstanding and held by Treasury remained $72.3 billion at December 31, 2013. 1 » Dividend payments do not reduce prior Treasury draws. » Any future draws will increase the balance of senior preferred stock outstanding. Since entering conservatorship in September 2008, Freddie Mac has: » Received cumulative draws of $71.3 billion from Treasury. No draws have been requested for the past seven quarters; last draw request was $19 million for first quarter 2012. Freddie Mac’s net worth was $12.8 billion at December 31, 2013. » Capital reserve amount decreased from $3.0 billion in 2013 to $2.4 billion for quarterly payments in 2014. » Dividend obligation to Treasury will be $10.4 billion in March 2014. » Aggregate cash dividends paid to Treasury will total $81.8 billion including the March dividend obligation, versus cumulative cash draws of $71.3 billion received from Treasury through December 31, 2013. The amount of remaining Treasury funding currently available to Freddie Mac under the Purchase Agreement is $140.5 billion. Any future draws will reduce this amount. 1 Senior preferred stock outstanding of $72.3 billion at December 31, 2013 includes cumulative draws of $71.3 billion plus the initial liquidation preference of $1 billion. 6 |
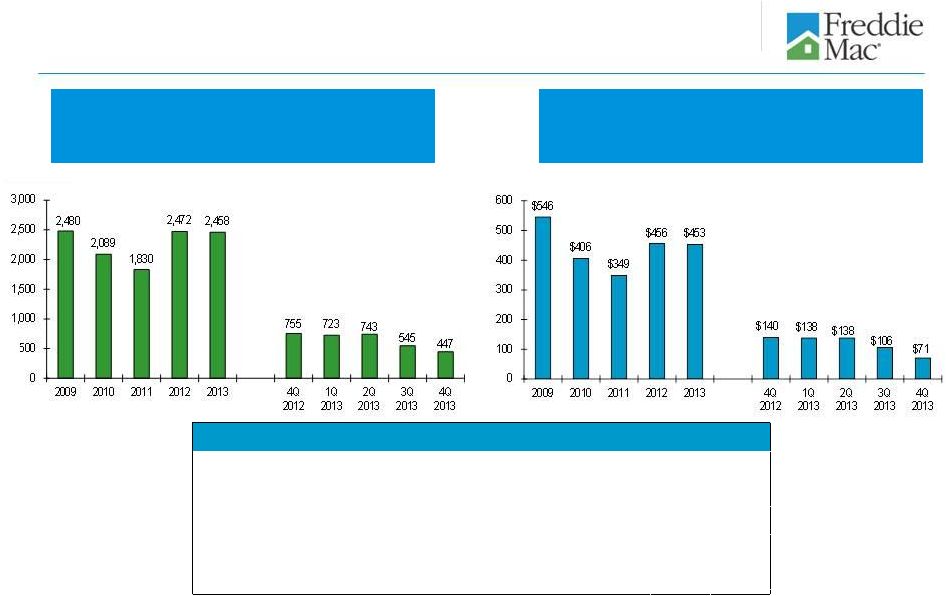
 Dividend Payments to Treasury Draw Requests from Treasury 7 Treasury draw requests and dividend payments 1 The initial $1 billion liquidation preference of senior preferred stock was issued to Treasury in September 2008 as consideration for Treasury’s funding commitment. The company received no cash proceeds as a result of issuing this initial $1 billion liquidation preference of senior preferred stock. 2 Amounts may not add due to rounding. 3 Annual amounts represent the total draws requested based on Freddie Mac’s quarterly net deficits for the periods presented. Draw requests are funded in the subsequent quarter (e.g., $19 million draw request for 1Q 2012 was funded in 2Q 2012). 4 Represents quarterly cash dividends paid by Freddie Mac to Treasury during the periods presented. Through December 31, 2012, Treasury was entitled to receive cumulative quarterly cash dividends at the annual rate of 10% per year on the liquidation preference of the senior preferred stock. However, the fixed dividend rate was replaced with a net worth sweep dividend payment beginning in the first quarter of 2013. See the company’s Annual Report on Form 10-K for the year ended December 31, 2013 for more information. $ Billions 4 3 Draws From Treasury Dividend Payments to Treasury ($ Billions) Cumulative Total Initial Liquidation Preference 1 $1.0 Treasury Draws $71.3 Total Senior Preferred Stock Outstanding $72.3 ($ Billions) Cumulative Total Dividend Payments as of 12/31/13 $71.3 1Q 2014 Dividend Obligation $10.4 Total Dividend Payments 2 $81.8 |
 8 Total equity and Senior Preferred Stock activity 1 See the company’s Annual Report on Form 10-K for the year ended December 31, 2013 for a description of the company’s dividend obligation to Treasury. 2 Includes the initial liquidation preference of Freddie Mac’s senior preferred stock of $1.0 billion. Note: Columns may not add due to rounding. ($ Billions) 4Q 2012 1Q 2013 2Q 2013 3Q 2013 4Q 2013 1 Beginning balance - Total equity / GAAP net worth $4.9 $8.8 $10.0 $7.4 $33.4 2 Capital draw funded by Treasury - - - - - 3 Net income 4.5 4.6 5.0 30.5 8.6 4 Total other comprehensive income (loss), net of taxes 1.3 2.4 (0.6) (0.0) 1.2 5 Comprehensive income 5.7 7.0 4.4 30.4 9.8 6 Dividends paid to Treasury (1.8) (5.8) (7.0) (4.4) (30.4) 7 Other - - - - - 8 Ending balance - Total equity / GAAP net worth 1 $8.8 $10.0 $7.4 $33.4 $12.8 9 $72.3 $72.3 $72.3 $72.3 $72.3 10 Remaining senior preferred stock funding beginning in 2013 N/A $140.5 $140.5 $140.5 $140.5 Aggregate liquidation preference of the senior preferred stock 2 |
 9 Single-family guarantee fees charged on new acquisitions Quarterly In Basis Points, Annualized Annual In Basis Points 1 Legislated 10 Basis Point Guarantee Fee Remitted to Treasury 1 Single-Family Guarantee Fee Charged on New Acquisitions (excluding amounts remitted to Treasury) 2 1 Effective April 1, 2012, guarantee fees charged on single-family loans sold to Freddie Mac were increased by 10 basis points. Under the Temporary Payroll Tax Cut Continuation Act of 2011, Freddie Mac is required to remit the proceeds from this increase to Treasury. Given the April 1, 2012 effective date, the impact of the increase on average guarantee fees for full-year 2012 was 7.5 basis points. Represents the estimated rate of management and guarantee fees for new acquisitions during the period assuming amortization of delivery fees using the estimated life of the related loans rather than the original contractual maturity date of the related loans. Also includes the effect of pricing adjustments that are based on the relative performance of our PCs compared to comparable Fannie Mae securities. 2 |
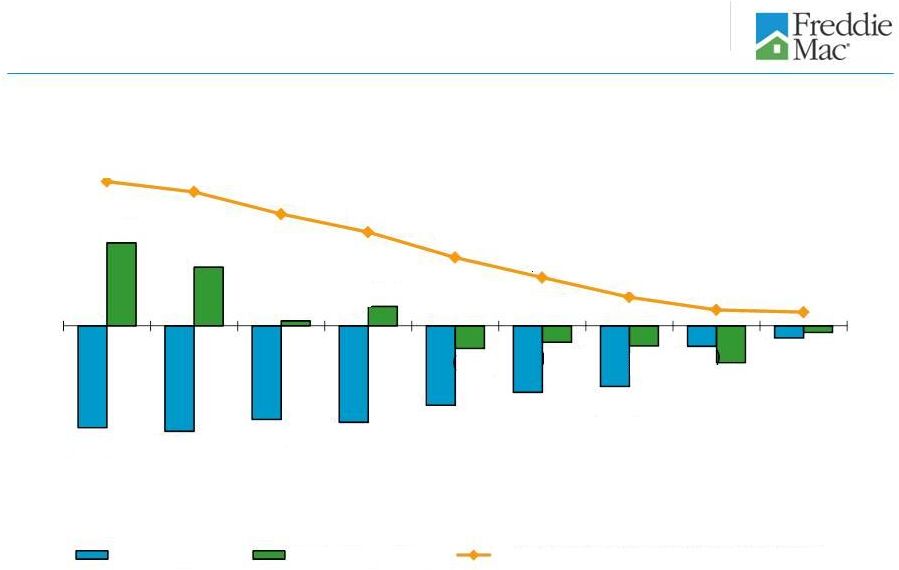 10 Loan loss reserves 1 Includes amounts related to certain loans purchased under financial guarantees and reflected within other expenses on the company’s consolidated statements of comprehensive income. 2 Consists of the allowance for loan losses and the reserve for guarantee losses. $ Billions ($3.2) ($3.3) ($2.9) ($3.0) ($2.5) ($2.1) ($1.9) ($0.6) ($0.4) $2.6 $1.8 $0.2 ($0.7) ($0.5) ($0.6) ($1.1) ($0.2) $39.5 $38.3 $35.8 $33.8 $30.9 $28.6 $26.4 $25.0 $24.7 4Q 2011 1Q 2012 2Q 2012 3Q 2012 4Q 2012 1Q 2013 2Q 2013 3Q 2013 4Q 2013 Net Charge-offs 1 Provision (Benefit) Loan Loss Reserves (Period End Balances) 2 $0.6 |
 1 Includes single-family and multifamily REO. Multifamily ending property inventory was 6 properties and 1 property as of December 31, 2012 and 2013, respectively. 11 Real estate owned 1 Property Inventory 2013 Activity Geographic Distribution 2 Based on Number of Properties in Inventory Historical Trend Ending Property Inventory ((Number of Properties) In 2013, REO inventory declined primarily due to lower single-family foreclosure activity as a result of Freddie Mac’s loss mitigation efforts and a declining amount of delinquent loans. Freddie Mac experienced an increase in REO acquisitions during 2013 compared to 2012 in the Northeast region and REO acquisitions remained high in the Southeast region. High REO acquisition volumes in these regions were primarily due to higher foreclosure volume in Maryland, Pennsylvania and Florida. ((Number of Properties) ((Number of Properties) 49,077 47,308 70,685 (72,454) 12/31/12 Inventory Acquisitions Dispositions 12/31/13 Inventory 5k 11k 21k 5k 6k 8k 14k 16k 4k 5k Northeast Southeast North Central Southwest West 12/31/2012 12/31/2013 61k 47k 59k 53k 51k 49k 48k 45k 47k 4Q 2011 1Q 2012 2Q 2012 3Q 2012 4Q 2012 1Q 2013 2Q 2013 3Q 2013 4Q 2013 The North Central region comprised 33 percent of our REO property inventory as of December 31, 2013. This region generally has experienced more challenging economic conditions, and includes a number of states with longer foreclosure timelines due to the local laws and foreclosure process for single- family mortgage loans. Seven of the nine states in the North Central region require a judicial foreclosure process. 2 Region designation: West (AK, AZ, CA, GU, HI, ID, MT, NV, OR, UT, WA); Northeast (CT, DE, DC, MA, ME, MD, NH, NJ, NY, PA, RI, VT, VA, WV); Southeast (AL, FL, GA, KY, MS, NC, PR, SC, TN, VI); North Central (IL, IN, IA, MI, MN, ND, OH, SD, WI); and Southwest (AR, CO, KS, LA, MO, NE, NM, OK, TX, WY). |
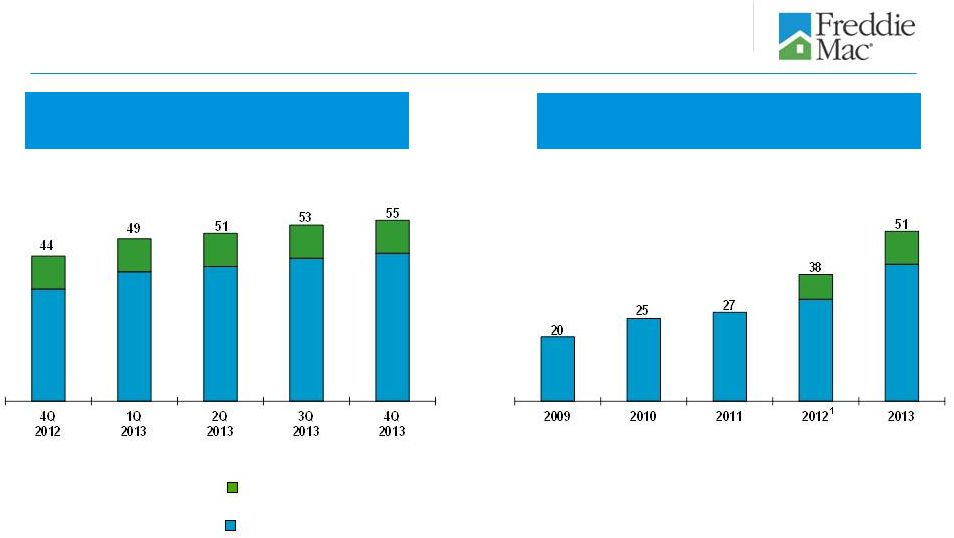
 12 Market liquidity provided 1 For the periods presented, a borrower may be counted more than once if the company purchased more than one loan (purchase or refinance mortgage) relating to the same borrower. 2 Includes cash purchases of single-family and multifamily mortgage loans, issuances of Freddie Mac mortgage-related securities through the company’s guarantor swap program, issuances of other guarantee commitments, issuance of other structured securities and purchases of non-Freddie Mac mortgage-related securities. 3 In the first quarter of 2013, Freddie Mac made certain changes to more closely align the presentation of the company’s single-family and multifamily securitization activities. As a result, the purchase and issuance volumes for all prior periods have been revised to conform with the current period presentation. Number of Families Freddie Mac Helped to Own or Rent a Home 1 (In Thousands) Refinance borrowers (includes HARP) Purchase borrowers Multifamily rental units Freddie Mac Purchase and Issuance Volume 2 Cumulative Totals Since 2009 11,329 $2.2 Trillion 7,675 2,032 1,622 Number of Families Freddie Mac Helped to Own or Rent a Home In Thousands Purchase and Issuance Volume (Single-Family and Multifamily) $ Billions 2,3 1 |
 13 Single-family refinance activity 1 2009 2010 2011 2012 2013 Cumulative Total Number of Borrowers 2 (In Thousands) Other Refinance 1,595 947 740 996 944 5,222 Relief Refinance - LTV 80% 83 324 268 253 270 1,198 Relief Refinance - LTV > 80% to 100% (HARP) 3 72 166 126 191 168 723 Relief Refinance - LTV > 100% to 125% (HARP) 3 14 43 59 144 110 370 Relief Refinance - LTV > 125% (HARP) 3 0 0 0 99 63 162 Total Number of Borrowers 1,764 1,480 1,193 1,683 1,555 7,675 $ Volume (In Billions) Other Refinance $345 $200 $168 $228 $210 $1,151 Relief Refinance - LTV 80% $15 $58 $42 $36 $37 $188 Relief Refinance - LTV > 80% to 100% (HARP) 3 $17 $38 $27 $37 $30 $149 Relief Refinance - LTV > 100% to 125% (HARP) 3 $3 $10 $13 $30 $21 $77 Relief Refinance - LTV > 125% (HARP) 3 $0 $0 $0 $20 $11 $31 Total $ Volume $380 $306 $250 $351 $309 $1,596 Consists of all single-family refinance mortgage loans that the company either purchased or guaranteed during the period, including those associated with other guarantee commitments and Other Guarantee Transactions. Some loans have multiple borrowers, but the company has counted them as one borrower for this purpose. For the periods presented, a borrower may be counted The relief refinance mortgage initiative is Freddie Mac’s implementation of the Home Affordable Refinance Program (HARP). Under the program, the company allows eligible borrowers who have mortgages with high current LTV ratios to refinance their mortgages without obtaining new mortgage insurance in excess of what was already in place. HARP is targeted at borrowers with current LTV ratios above 80%; however, Freddie Mac’s program also allows borrowers with LTV ratios at or below 80% to participate. 1 2 3 more than once if the company purchased more than one refinance loan relating to the same borrower. |
 Repayment plans 14 Loan modifications Forbearance agreements Short sales and deed-in-lieu of foreclosure transactions Single-family loan workouts 1 Home Retention Actions 2 Foreclosure Alternatives 2 133 275 43 208 46 41 1 Consists of both home retention actions and foreclosure alternatives. 2 41 169 40 168 2009 2010 2011 2012 2013 4Q 2012 1Q 2013 2Q 2013 3Q 2013 4Q 2013 300 250 200 150 100 50 0 60 30 0 Number of Loans (000) Number of Loans (000) Cumulative Totals Since 2009 (In Thousands) Families Retaining Homes 953 8 out of every 10 These categories are not mutually exclusive and a borrower in one category may also be included within another category in the same or another period. For example, a borrower helped through a home retention action in one period may subsequently lose his or her home through a foreclosure or a short sale or deed-in-lieu transaction in a later period. Number of Families Avoiding Foreclosure 1 |
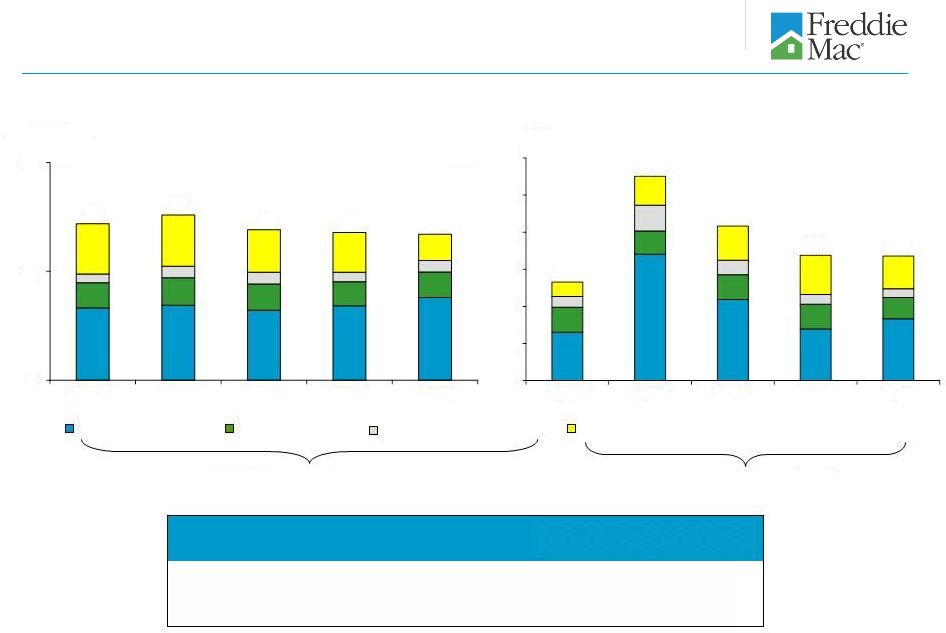
 15 Single-family loan modifications 1 2 Principal forbearance is a change to a loan’s terms to designate a portion of the principal as non-interest bearing and non-amortizing. Note: Totals may not recalculate due to rounding. Single-family Loan Modifications (HAMP and non-HAMP) 1 2 65 170 109 20 21 19 70 21 23 83 0 10 20 30 4Q 2012 1Q 2013 2Q 2013 3Q 2013 4Q 2013 Number of Loans (000) 0 40 80 120 160 200 2009 2010 2011 2012 2013 Number of Loans (000) No change in terms Term extension Change in interest rate, and in certain cases, term extension Change in interest rate, term extension and principal forbearance Includes completed loan modifications under HAMP and under the company’s other modification programs. Excludes those loan modification activities for which the borrower has started the required process, but the modification has not been made permanent or effective, such as loans in a modification trial period. |
 16 Quarterly Percentages of Modified Single-Family Loans (HAMP and non-HAMP) 1 Performance of single-family modified loans Time Since Modification 4Q 2011 1Q 2012 2Q 2012 3Q 2012 4Q 2012 1Q 2013 2Q 2013 3Q 2013 3 to 5 months 86% 85% 87% 84% 85% 86% 85% 84% 6 to 8 months 80% 80% 83% 82% 81% 81% 79% N/A 9 to 11 months 75% 77% 81% 78% 78% 78% N/A N/A 12 to 14 months 73% 76% 78% 76% 75% N/A N/A N/A 15 to 17 months 73% 74% 77% 73% N/A N/A N/A N/A 18 to 20 months 71% 73% 75% N/A N/A N/A N/A N/A 21 to 23 months 70% 71% N/A N/A N/A N/A N/A N/A 24 to 26 months 68% N/A N/A N/A N/A N/A N/A N/A % Current and Performing Quarter of Loan Modification Completion 2 Represents the percentage of loans that are current and performing (no payment is 30 days or more past due) or have been paid in full. Excludes loans in modification trial periods. Loan modifications are recognized as completed in the quarterly period in which the servicer has reported the modification as effective and the agreement has been accepted by the company. For loans that have been remodified (e.g., where a borrower has received a new modification after defaulting on the prior modification) the rates reflect the status of each modification separately. For example, in the case of a remodified loan where the borrower is performing, the previous modification would be presented as being in default in the applicable period. 1 2 |
 17 Repurchase requests 1,2 Trend in Repurchase Requests Outstanding 2013 Repurchase Request Activity 5 3 $ Billions 4 6 $ Billions $3.6 $4.2 $3.8 $2.7 $3.0 $2.2 20% 20% 34% 39% 41% 27% 12/31/2008 12/31/2009 12/31/2010 12/31/2011 12/31/2012 Outstanding repurchase requests Requests outstanding more than 4 months $3.0 $2.2 $10.8 ($5.6) ($6.0) UPB at 12/31/2012 Issuances Collections Cancellations and other UPB at 12/31/2013 1 2 3 4 5 6 12/31/2013 Amounts are based on the UPB of the loans associated with the repurchase requests. The balance as of December 31, 2013 includes: (a) $1.6 billion in UPB related to repurchase claims for violations of seller representations and warranties and (b) $0.6 billion in UPB related to repurchase claims for violations of servicing guidelines. The balance as of December 31, 2013 excludes $0.3 billion in UPB related to notices of defect related to servicing violations. The amount the company expects to collect on outstanding requests is significantly less than the unpaid principal balance (UPB) of the loans primarily because many of these are likely to be satisfied by reimbursement of the company’s realized credit losses by seller/servicers, or rescinded in the course of the contractual appeals proces Based on historical loss experience and the fact that many of these loans are covered by credit enhancements (e.g., mortgage insurance), Freddie Mac expects the actual credit losses experienced by the company should it fail to collect to also be less than the UPB of the loans. Approximately $0.2 billion of the total amount of repurchase requests outstanding at December 31, 2013 were issued due to mortgage insurance rescission or mortgage insurance claim denial. Repurchase requests outstanding more than four months include repurchase requests for which appeals were pending. Requests collected are based on the UPB of the loans associated with the repurchase requests, which in many cases is more than the amount of payments received for reimbursement of losses for requests associated with foreclosed mortgage loans, negotiated agreements and other alternative remedies. Includes $2.1 billion in 2013 related to settlement agreements with certain seller/servicers to release specified loans from certain repurchase obligations in exchange for one-time cash payments. Consists primarily of those requests that were resolved by the servicer providing missing documentation or rescinded through a successful appeal of the request. Also includes other items that affect the UPB of the loan while the repurchase request is outstanding, such as payments made on the loan. |
 18 Administrative expenses Annual Quarterly $422 $432 $444 $455 $474 0 200 400 600 4Q 2012 1Q 2013 2Q 2013 3Q 2013 4Q 2013 $ Millions $1,685 $1,597 $1,506 $1,561 $1,805 400 600 800 1,000 1,200 1,400 1,600 1,800 2,000 2009 2010 2011 2012 2013 $ Millions |
 Mortgage-related investments portfolio ending balance Mortgage-related investments portfolio limit 19 Purchase Agreement portfolio limits Indebtedness 1, 3 ($ Billions) Mortgage Assets 1, 2 ($ Billions) Indebtedness limit Total debt outstanding 4 4 4 4 4 $558 $534 $521 $498 $461 $650 $650 $650 $650 $553 $470 12/31/12 03/31/13 06/30/13 09/30/13 12/31/13 12/31/14 $552 $535 $526 $520 $511 $874.8 $780 $780 $780 $780 $663 12/31/12 03/31/13 06/30/13 09/30/13 12/31/13 01/01/14 Represents the unpaid principal balance (UPB) of the company’s mortgage-related investments portfolio. The company discloses its mortgage assets on this basis monthly in its Monthly Volume Summary reports, which are available on its Web site and in Current Reports on Form 8-K filed with the Securities and Exchange Commission (SEC). Represents the par value of the company’s unsecured short-term and long-term debt securities issued to third parties to fund its business activities. The company discloses its indebtedness on this basis monthly in its Monthly Volume Summary reports, which are available on its Web site and in Current Reports on Form 8-K filed with the SEC. Limit under the Purchase Agreement, as amended on August 17, 2012. The company’s Purchase Agreement with Treasury limits the amount of mortgage assets the company can own and indebtedness it can incur. Under the Purchase Agreement, mortgage assets and indebtedness are calculated without giving effect to the January 1, 2010 change in the accounting guidance related to the transfer of financial assets and consolidation of variable interest entities (VIEs). See the company’s Annual Report on Form 10-K for the year ended December 31, 2013 for more information. 1 2 3 4 |
 20 Credit Supplement |
 21 National home prices have experienced a cumulative (6) (4) (2) 0 2 4 6 1Q 2004 4Q 2004 3Q 2005 2Q 2006 1Q 2007 4Q 2007 3Q 2008 2Q 2009 1Q 2010 4Q 2010 3Q 2011 2Q 2012 1Q 2013 4Q 2013 Percent (%) (0.7) (1.6) (2.1) (4.2) (3.1) (0.8) (2.8) (5.3) (2.7) (1.6) (0.3) (2.5) (2.8) (1.2) (1.1) (2.1) (0.4) 2.5 5.2 2.4 1.3 2.9 4.7 2.6 0.4 1.3 2.2 0.8 0.8 1.2 0.0 0.7 1.1 0.4 4.1 1.1 0.2 2.7 5.3 1.5 decline of 15% since June 2006 ¹ National home prices use the Freddie Mac House Price Index for the U.S., which is a value-weighted average of the state indexes where the value weights are based on Freddie Mac’s single-family credit guarantee portfolio. Other indices of home prices may have different results, as they are determined using different pools of mortgage loans and calculated under different conventions than Freddie Mac’s. The Freddie Mac House Price Index for the U.S. is a non-seasonally adjusted monthly series; quarterly growth rates are calculated as a 3-month change based on the final month of each quarter. Seasonal factors typically result in stronger house-price appreciation during the second and third quarters. Historical quarterly growth rates change as new data becomes available. Values for the most recent periods typically see the largest changes. Cumulative decline calculated as the percent Source: Freddie Mac. 1 change from June 2006 to December 2013. |
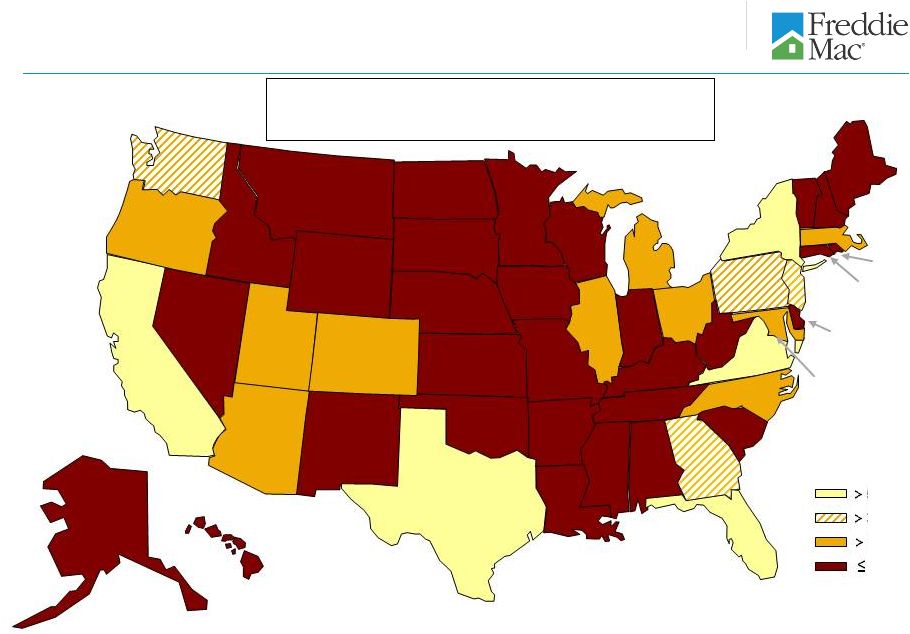
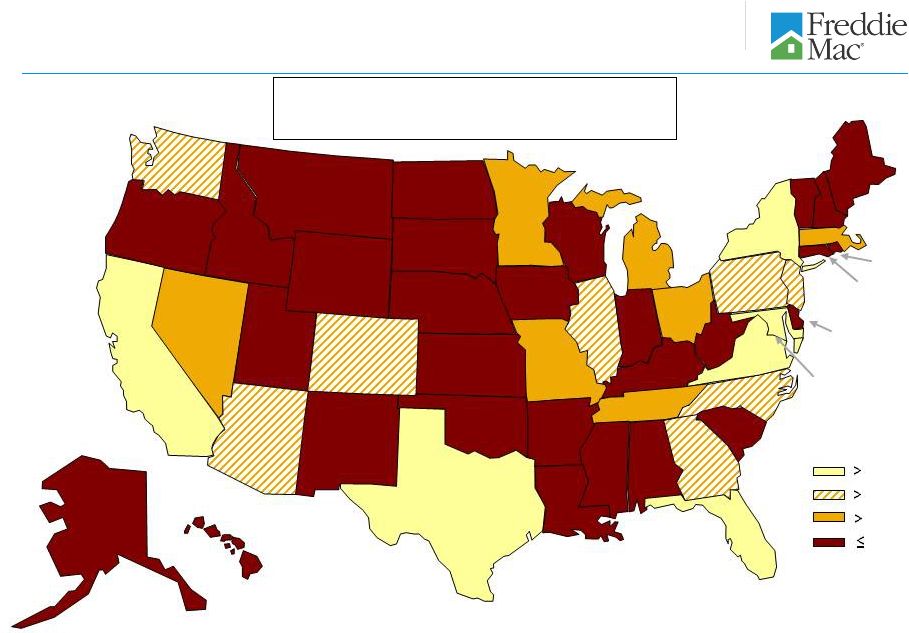
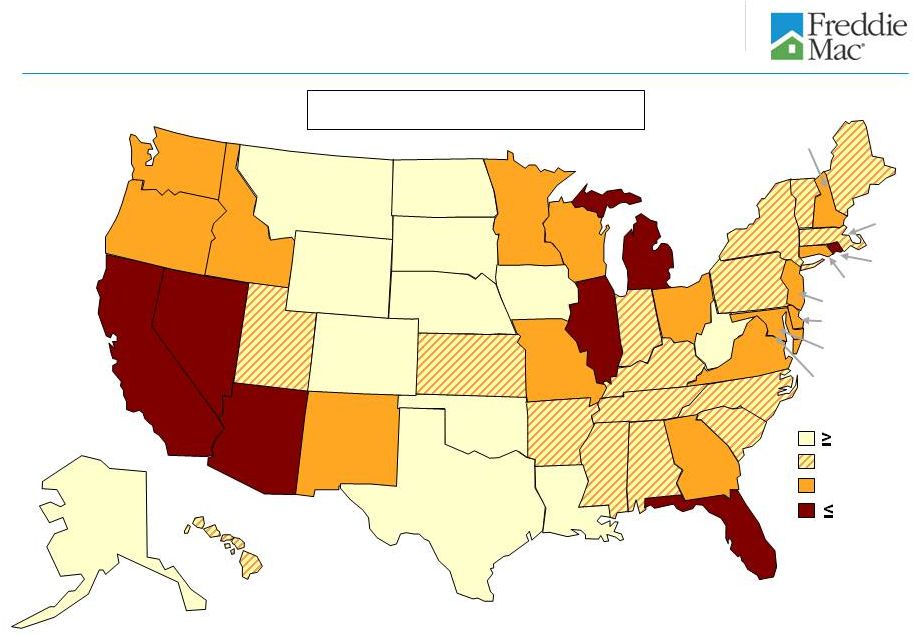 -11% AL 4% AK 0% -11 to -1% -22% -21 to -12% -5% AR -30% AZ -23% CA 4% CO CT -21% DC 25% DE -18% -34% FL -15% GA -2% HI 3% IA -16% ID -24% IL -5% IN -1% KS KY -1% 3% LA -11% -21% -11% ME -22% MI -16% MN -13% MO -8% MS 1% MT NC -6% 41% ND 2% NE -14% NM -42% NV -11% NY -16% OH 6% OK -13% OR -7% PA RI -28% -9% SC 11% SD TN -1% 15% TX -1% UT -16% VA -15% WA -15% WI 3% WV 8% WY -19% NH MA MD NJ -21% Home price performance by state June 2006 to December 2013 1 1 Source: Freddie Mac 22 -2% VT United States -15% The Freddie Mac House Price Index for the U.S. is a value-weighted average of the state indexes where the value weights are based on Freddie Mac’s single-family credit guarantee portfolio. Other indices of home prices may have different results, as they are determined using different pools of mortgage loans and calculated under different conventions. The Freddie Mac House Price Index for the U.S. is a non-seasonally adjusted monthly series. |
 2% AL 3% AK 10% 6 to 9% 0 to 2% 3 to 5% 1% AR 14% AZ 19% CA 8% CO CT 2% DC 13% DE 3% 15% FL 15% GA 8% HI 6% IA 9% ID 8% IL 4% IN 4% KS KY 4% 5% LA 6% 1% ME 12% MI 10% MN 5% MO 2% MS 5% MT NC 6% 10% ND 5% NE NJ 5% 1% NM 25% NV 3% NY 4% OH 3% OK 12% OR 3% PA RI 3% 6% SC 5% SD TN 6% 9% TX 11% UT 3% VA 9% WA 6% WI 4% WV 6% WY 6% 4% VT 8% MD MA NH 1 Source: Freddie Mac 23 United States 9% The Freddie Mac House Price Index for the U.S. is a value-weighted average of the state indexes where the value weights are based on Freddie Mac’s single-family credit guarantee portfolio. Other indices of home prices may have different results, as they are determined using different pools of mortgage loans and calculated under different conventions. The Freddie Mac House Price Index for the U.S. is a non-seasonally adjusted monthly series. Home price performance by state December 2012 to December 2013 1 |
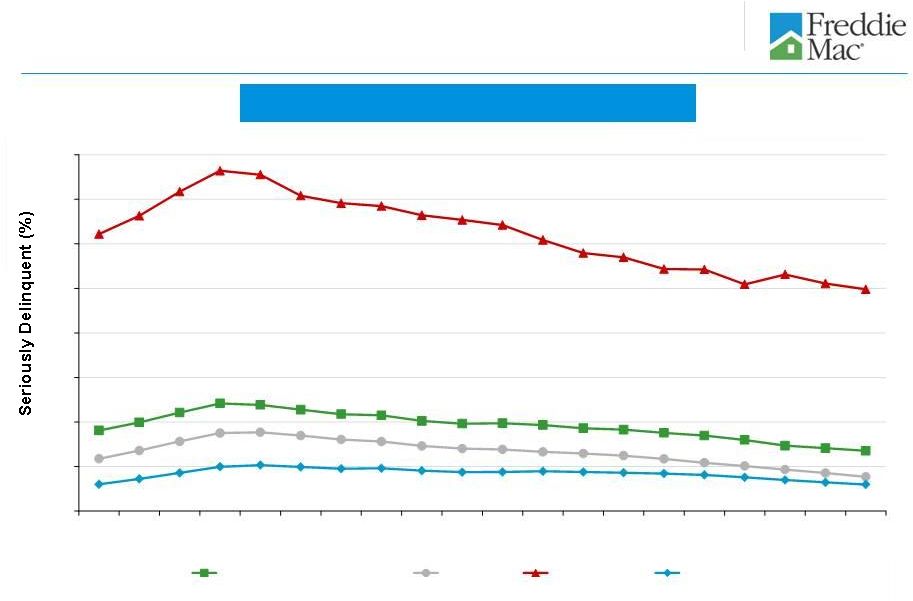 24 1 2 1 1 1 19.92% 5.41% 3.08% 2.39% Single-family Serious Delinquency Rates Mortgage market and Freddie Mac serious delinquency rates 2 0 4 8 12 16 20 24 28 32 Mar- 09 Jun- 09 Sep- 09 Dec- 09 Mar- 10 Jun- 10 Sep- 10 Dec- 10 Mar- 11 Jun- 11 Sep- 11 Dec- 11 Mar- 12 Jun- 12 Sep- 12 Dec- 12 Mar- 13 Jun- 13 Sep- 13 Dec- 13 Total Mortgage Market Prime Subprime Freddie Mac Source: National Delinquency Survey from the Mortgage Bankers Association. Categories represent first lien single-family loans. See “MD&A – RISK MANAGEMENT – Credit Risk – Mortgage Credit Risk – Single-Family Mortgage Credit Risk – Credit Performance – Delinquencies” in Freddie Mac’s Form 10-K for the year ended December 31, 2013, for information about the company’s reported delinquency rates. |
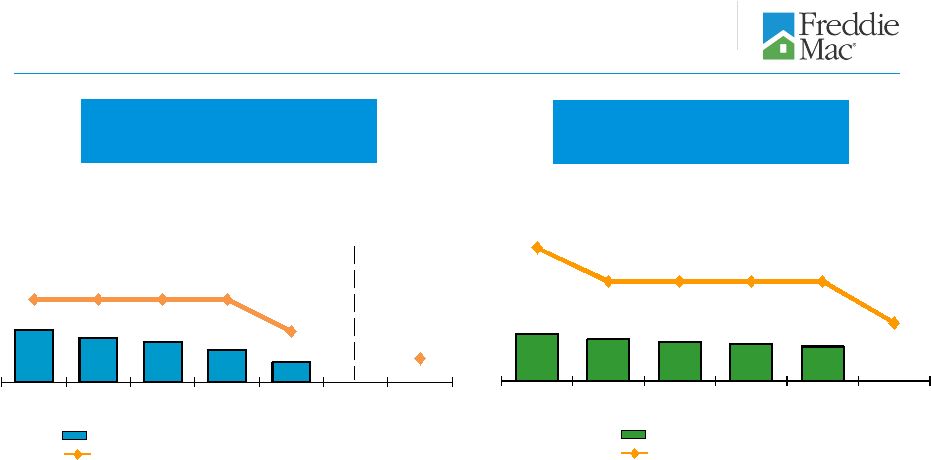
 25 Total Refinance Loans: 73% Loan purpose of single-family credit guarantee portfolio purchases 1 The relief refinance mortgage initiative is Freddie Mac’s implementation of the Home Affordable Refinance Program (HARP). Under the program, the company allows eligible borrowers who have mortgages with high current LTV ratios to refinance their mortgages without obtaining new mortgage insurance in excess of what was already in place. HARP is targeted at borrowers with current LTV ratios above 80%; however, Freddie Mac’s relief refinance initiative also allows borrowers with LTV ratios at or below 80% to participate. Percent (%) 44 53 47 41 20 20 22 18 27 56 47 53 59 73 52 52 53 50 4 12 12 20 15 3 16 14 9 8 2005 2006 2007 2008 2009 2010 2011 2012 2013 Purchase Other Refinance HARP ¹ Relief Refinance (Non-HARP) ¹ |
 26 Credit quality of single-family credit guarantee portfolio purchases 2009 2010 2011 2012 2013 Weighted Average Original LTV Ratio 1 Relief refinance (includes HARP) 80% 77% 77% 97% 91% All other 66% 67% 67% 68% 71% Total purchases 67% 70% 70% 76% 75% Weighted Average Credit Score 2 Relief refinance (includes HARP) 738 747 744 740 727 All other 757 758 759 762 756 Total purchases 756 755 755 756 749 2009 2010 2011 2012 2013 Purchase of Relief Refinance Mortgages > 80% LTV (HARP loans) 3 $ Billions $19.6 $47.9 $39.7 $86.9 $62.5 % of single-family credit guarantee portfolio purchases 4% 12% 12% 20% 15% Original LTV ratios are calculated as the unpaid principal balance (UPB) of the mortgage Freddie Mac guarantees including the credit-enhanced portion, divided by the lesser of the appraised value of the property at the time of mortgage origination or the mortgage borrower’s purchase price. Second liens not owned or guaranteed by Freddie Mac are excluded from the LTV ratio calculation. The existence of a second lien mortgage reduces the borrower’s equity in the home and, therefore, can increase the risk of default. Credit score data is based on FICO scores at the time of origination and may not be indicative of the borrowers’ creditworthiness at December 31, 2013. FICO scores can range between approximately 300 to 850 points. HARP is the portion of the company’s relief refinance initiative targeted at borrowers with current LTV ratios above 80%. In April 2013, HARP was extended to December 31, 2015. 1 2 3 |
 27 Single-family 4Q 2013 credit losses and REO by region and state ($ Billions) % of Total UPB 2 ($ Millions) % of Total Serious Delinquency Rate 3 (%) 4Q 2013 Acquisitions ($ Millions) REO Inventory ($ Millions) % of Total Inventory ($ Millions) % of Total Region 6 1 West $464 28% $8,842 20% 1.73% $456 $1,091 15% ($32) (8%) 2 Northeast 431 26 15,756 36 3.23% 492 1,480 20 146 37 3 North Central 291 18 5,631 13 1.81% 528 2,113 29 119 30 4 Southeast 273 16 10,624 25 3.42% 883 2,167 29 170 42 5 Southwest 194 12 2,463 6 1.36% 188 530 7 (5) (1) 6 Total $1,653 100% $43,316 100% 2.39% $2,547 $7,381 100% $398 100% State 7 Arizona, California, Florida & Nevada 7 $422 26% $12,839 30% 3.01% $880 $2,052 28% $93 23% 8 Illinois, Michigan & Ohio 8 176 11 4,113 9 2.11% 376 1,563 21 104 26 9 New York & New Jersey 9 145 9 9,088 21 5.11% 99 247 3 33 9 10 All other 910 54 17,276 40 1.88% 1,192 3,519 48 168 42 11 Total $1,653 100% $43,316 100% 2.39% $2,547 $7,381 100% $398 100% Total Portfolio UPB 1 Seriously Delinquent Loans REO Acquisitions & Balance 4 Credit Losses (Gains) 5 1 2 Based on the unpaid principal balance (UPB) of the single-family credit guarantee portfolio at December 31, 2013. UPB amounts exclude $408 million of Other Guarantee Transactions since these securities are backed by non-Freddie Mac issued securities for which loan characteristic data was not available. Based on the number of loans that are three monthly payments or more past due or in the process of foreclosure. Based on the UPB of loans at the time of REO acquisition. Consist of the aggregate amount of charge-offs, net of recoveries, and REO operations (income) expense for 4Q 2013. Region designation: West (AK, AZ, CA, GU, HI, ID, MT, NV, OR, UT, WA); Northeast (CT, DE, DC, MA, ME, MD, NH, NJ, NY, PA, RI, VT, VA, WV); Southeast (AL, FL, GA, KY, MS, NC, PR, SC, TN, VI); North Central (IL, IN, IA, MI, MN, ND, OH, SD, WI); and Southwest (AR, CO, KS, LA, MO, NE, NM, OK, TX, WY). Represents the four states that had the largest cumulative declines in home prices during the housing crisis that began in 2006, as measured using Freddie Mac’s home price index. Represents selected states in the North Central region that have experienced adverse economic conditions since 2006. Represents two states with a judicial foreclosure process in which there are a significant number of seriously delinquent loans within Freddie Mac’s single-family credit guarantee portfolio. 3 4 5 6 7 8 9 |
 1.3% Single-family serious delinquency rates by state and region 28 Single-family Serious Delinquency Rates By State 1,2 Single-family Serious Delinquency Rates By Region 1,3 1.4% 1.8% 1.7% 2.4% 3.2% 3.4% 6.4% 6.2% 2.4% 2.8% 4.4% |
 Aging of single-family seriously delinquent loans by judicial and non-judicial states 29 1 # of Seriously Delinquent Loans Percent # of Seriously Delinquent Loans Percent # of Seriously Delinquent Loans Percent Judicial Review States Less than or equal to 1 year 79,422 23% 60,943 22% 59,129 23% More than 1 year and less than or equal to 2 years 50,506 14% 33,756 12% 30,604 12% More than 2 years 77,766 22% 67,306 25% 65,154 26% Non-Judicial States Less than or equal to 1 year 87,641 25% 66,405 25% 60,175 24% More than 1 year and less than or equal to 2 years 30,435 9% 22,063 8% 17,968 7% More than 2 years 23,824 7% 22,998 8% 19,731 8% Combined Less than or equal to 1 year 167,063 48% 127,348 47% 119,304 47% More than 1 year and less than or equal to 2 years 80,941 23% 55,819 20% 48,572 19% More than 2 years 101,590 29% 90,304 33% 84,885 34% Total 349,594 100% 273,471 100% 252,761 100% As of 12/31/2012 As of 9/30/2013 As of 12/31/2013 Excludes loans underlying certain single-family Other Guarantee Transactions since the geographic information is not available to us for these loans. As of December 31, 2013, the states and territories classified as having a judicial foreclosure process consist of: CT, DE, FL, HI, IA, IL, IN, KS, KY, LA, ME, ND, NE, NJ, NM, NY, OH, OK, OR, PA, PR, SC, SD, VI, VT and WI. All other states are classified as having a non-judicial foreclosure process. Judicial foreclosures are those conducted under the supervision of a court. 1 1 1 |
 30 Single-family credit guarantee portfolio characteristics 1 1 Portfolio characteristics are based on the unpaid principal balance (UPB) of the single-family credit guarantee portfolio. Approximately $1 billion in UPB for Other Guarantee Transactions is included in total UPB and percentage seriously delinquent but not included in the calculation of other statistics since these securities are backed by non-Freddie Mac issued securities for which loan characteristic data was not available. 2 For a description of Alt-A, see the “Glossary” in the company’s Annual Report on Form 10-K for the year ended December 31, 2013. 3 Beginning September 1, 2010, the company fully discontinued purchases of interest-only loans. 4 Represents the FICO score of the borrower at loan origination. The company estimates that less than 1% of loans within the portfolio are missing origination FICO scores and as such are excluded. Indicates year of loan origination (except for HARP and other relief refinance loans). Calculated based on the loans remaining in the portfolio as of December 31, 2013, rather than all loans originally guaranteed by the company and originated in the respective year. Each Book Year category represents the percentage of loans referenced in line 1 of the same vertical column. Individual book years exclude HARP and other relief refinance loans originated in that year. See endnote (6). 6 HARP and other relief refinance loans are presented separately rather than in the year in which the refinancing occurred (from 2009 to 2013). All other refinance loans are presented within the year that the refinancing occurred. 7 Based on the number of loans that are three monthly payments or more past due or in the process of foreclosure. Note: Individual categories are not mutually exclusive, and therefore are not additive across columns. Option FICO FICO Original LTV FICO < 620 & Original Attribute Alt-A 2 Interest-only 3 ARM < 620 4 620 - 659 4 > 90% LTV > 90% 4 1 UPB $ Billions $1,653 $57 $35 $6 $48 $96 $258 $13 2 Percent of Total Portfolio 100% 3% 2% 0% 3% 6% 16% 1% 3 Average UPB per loan $154,632 $154,285 $225,114 $199,528 $126,197 $132,737 $169,694 $136,640 4 Fixed Rate (% of total portfolio) 94% 63% 18% 0% 95% 94% 98% 98% 5 Owner Occupied 90% 82% 81% 76% 95% 94% 91% 95% 6 Original Loan-to-Value (OLTV) 75% 73% 74% 71% 81% 80% 107% 107% 7 OLTV > 90% 16% 4% 3% 2% 27% 23% 100% 100% 8 Current Loan-to-Value (CLTV) 69% 87% 93% 86% 83% 80% 98% 102% 9 CLTV > 90% 17% 46% 53% 41% 37% 33% 61% 68% 10 CLTV > 100% 10% 33% 37% 29% 25% 22% 35% 49% 11 CLTV > 110% 6% 22% 23% 19% 16% 14% 22% 32% 12 Average FICO Score 4 739 711 717 711 585 643 725 582 13 FICO < 620 4 3% 5% 3% 4% 100% 0% 5% 100% Book Year 5 14 2013 16% 0% 0% 0% 1% 5% 10% 1% 15 2012 16% 0% 0% 0% 1% 4% 7% 0% 16 2011 8% 0% 0% 0% 1% 2% 2% 0% 17 2010 7% 0% 1% 0% 1% 3% 2% 0% 18 2009 7% 0% 1% 0% 2% 3% 2% 1% 19 New single-family book (2009 to 2013) 54% 0% 2% 0% 6% 17% 23% 2% 20 HARP and other relief refinance loans 6 21% 0% 0% 0% 29% 22% 60% 54% 21 2005 to 2008 Legacy single-family book 16% 84% 94% 71% 44% 41% 11% 28% 22 Pre-2005 Legacy single-family book 9% 16% 4% 29% 21% 20% 6% 16% 23 % of Loans with Credit Enhancement 13% 12% 9% 15% 22% 19% 49% 53% 24 % Seriously Delinquent 7 2.39% 10.06% 12.51% 12.30% 9.99% 7.18% 3.22% 9.60% Total Portfolio as of December 31, 2013 5 |
 31 Single-family credit profile by book year and product feature Attribute 2013 2012 2011 2010 2009 New single- family book (2009 to 2013) HARP and other relief refinance loans 3 2005 to 2008 Legacy single- family book Pre-2005 family book 1 UPB $ Billions $1,653 $270 $265 $120 $113 $120 $888 $342 $268 $155 2 Original Loan-to-Value (OLTV) 75% 71% 69% 69% 69% 69% 69% 89% 75% 72% 3 OLTV > 90% 16% 9% 7% 5% 4% 3% 7% 45% 11% 11% 4 Current Loan-to-Value (CLTV) 69% 69% 61% 58% 60% 62% 63% 81% 87% 50% 5 CLTV > 100% 10% 0% 0% 0% 0% 1% 0% 21% 29% 3% 6 CLTV > 110% 6% 0% 0% 0% 0% 0% 0% 13% 19% 1% 7 Average FICO Score 4 739 755 761 757 754 751 757 735 704 711 8 FICO < 620 4 3% 0% 0% 0% 0% 1% 0% 4% 8% 7% 9 Adjustable-rate 6% 5% 5% 9% 4% 1% 5% 1% 15% 11% 10 Interest-only 5 2% 0% 0% 0% 0% 0% 0% 0% 12% 1% 11 Investor 6% 5% 4% 5% 5% 3% 5% 9% 6% 5% 12 Condo 7% 6% 5% 5% 6% 7% 6% 9% 11% 8% Geography 13 Arizona, California, Florida & Nevada 6 26% 27% 26% 21% 19% 17% 23% 28% 31% 22% 14 Illinois, Michigan & Ohio 7 11% 10% 10% 10% 10% 9% 10% 13% 9% 14% 15 New York & New Jersey 8 9% 8% 7% 9% 9% 10% 8% 8% 10% 11% 16 All other states 54% 55% 57% 60% 62% 64% 59% 51% 50% 53% 17 % of Loans with Credit Enhancement 13% 18% 13% 11% 8% 8% 13% 12% 18% 11% 18 % Seriously Delinquent 9 2.39% 0.01% 0.04% 0.18% 0.39% 0.88% 0.24% 0.64% 8.77% 3.24% Total Portfolio as of December 31, 2013 Book Year 2 1 Portfolio characteristics are based on the unpaid principal balance (UPB) of the single-family credit guarantee portfolio. Approximately $1 billion in UPB for Other Guarantee Transactions is included in total UPB and percentage seriously delinquent but not included in the calculation of other statistics since these securities are backed by non-Freddie Mac issued securities for which loan characteristic data was not available. Indicates year of loan origination (except for HARP and other relief refinance loans). Calculated based on the loans remaining in the portfolio as of December 31, 2013, rather than all loans originally guaranteed by the company and originated in the respective year. Individual book years exclude HARP and other relief refinance loans originated in that year. See endnote (3). HARP and other relief refinance loans are presented separately rather than in the year in which the refinancing occurred (from 2009 to 2013). All other refinance loans are presented within the year that the refinancing occurred. Represents the average of the borrowers’ FICO scores at origination. The company estimates that less than 1% of loans within the portfolio are missing FICO scores and as such are excluded. Beginning September 1, 2010, the company fully discontinued purchases of interest-only loans. Represents the four states that had the largest cumulative declines in home prices during the housing crisis that began in 2006, as measured using Freddie Mac’s home price index. Represents selected states in the North Central region that have experienced adverse economic conditions since 2006. Represents two states with a judicial foreclosure process in which there are a significant number of seriously delinquent loans within Freddie Mac’s single-family credit guarantee portfolio. Based on the number of loans that are three monthly payments or more past due or in the process of foreclosure. 1 2 3 4 5 6 7 8 9 Legacy single- |
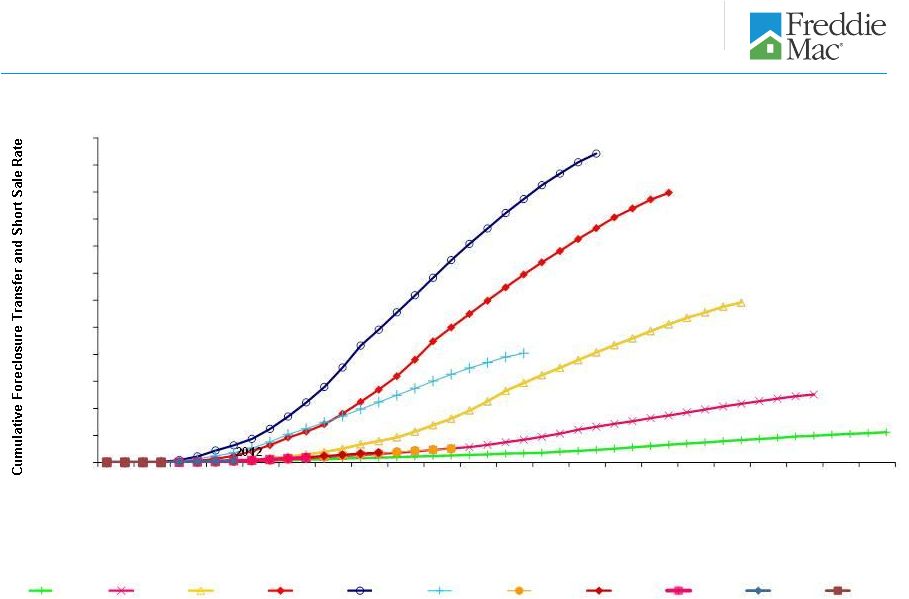 32 2007 2006 2005 2004 2003 2008 2009 2010 2011 2013 0.00% 1.00% 2.00% 3.00% 4.00% 5.00% 6.00% 7.00% 8.00% 9.00% 10.00% 11.00% 12.00% Yr1 Q1 Yr1 Q3 Yr2 Q1 Yr2 Q3 Yr3 Q1 Yr3 Q3 Yr4 Q1 Yr4 Q3 Yr5 Q1 Yr5 Q3 Yr6 Q1 Yr6 Q3 Yr7 Q1 Yr7 Q3 Yr8 Q1 Yr8 Q3 Yr9 Q1 Yr9 Q3 Yr10 Q1 Yr10 Q3 Yr11 Q1 Yr11 Q3 Quarter Post Origination 2003 2004 2005 2006 2007 2008 2009 2010 2011 2012 2013 Single-family cumulative foreclosure transfer and short sale rates by book year 1 1 Rates are calculated for each year of origination as the number of loans that have proceeded to foreclosure transfer or short sale and resulted in a credit loss, excluding any subsequent recoveries, divided by the number of loans originated in that year that were acquired in the company’s single-family credit guarantee portfolio. Includes Other Guarantee Transactions where loan characteristic data is available. |
 33 Total Multifamily (MF) Portfolio UPB $ Billions Multifamily portfolio composition $167 $135 $154 $164 $169 $177 $180 12/31/07 12/31/08 12/31/09 12/31/10 12/31/11 12/31/12 12/31/13 MF loan portfolio MF investment securities portfolio MF guarantee portfolio |
 34 Multifamily securitization volume 1 Total UPB represents the total collateral UPB of multifamily loans sold via Freddie Mac’s K Certificate transactions. $2.1 $6.4 $13.7 $21.2 $28.0 2009 2010 2011 2012 2013 UPB $ Billions K-Deal Securitization Volume ¹ |
 Multifamily new business volume by state 1 (%) AL 0.9% AK 0.0% 5% 3% - 5% 1% 1% - 3% MF New Business Volume $25.9B Twelve Months Ended December 31, 2013 AR 0.1% AZ 2.8% CA 16.8% CO 2.7% CT 0.8% DC 0.3% DE 0.4% FL 8.8% GA 5.0% HI 0.2% IA 0.2% ID 0.1% IL 2.8% IN 0.8% KS 0.4% KY 0.3% LA 0.8% MD 2.9% ME <0.1% MI 1.4% MN 0.6% MO 0.9% MS 0.1% MT 0.0% NC 2.4% ND <0.1% NE 0.4% NJ 4.2% NM 0.3% NV 0.8% NY 7.2% OH 2.3% OK 0.4% OR 1.3% PA 3.0% RI 0.3% SC 0.3% SD 0.0% TN 0.9% TX 14.1% UT 1.1% VA 5.6% VT 0.0% WA 3.3% WI 0.6% WV 0.0% WY <0.1% NH 0.1% 35 MA 1.2% Based on the unpaid principal balance (UPB) of the multifamily loan purchases and issuance of other guarantee commitments and other structured securities. Percentages shown above are rounded to the nearest tenth of a percent although classifications are based on unrounded figures. 1 |
 Multifamily mortgage portfolio UPB concentration by state AL 0.9% AK 0.0% MF Mortgage Portfolio $132.8B 2 As of December 31, 2013 AR 0.3% AZ 2.3% CA 16.7% CO 3.0% CT 0.9% DC 0.7% DE 0.2% FL 7.0% GA 4.4% HI 0.2% IA 0.2% ID 0.1% IL 2.5% IN 0.7% KS 0.8% KY 0.5% LA 0.8% MA 1.8% MD 5.1% ME <0.1% MI 1.0% MN 1.2% MO 1.1% MS 0.3% MT <0.1% NC 2.8% ND 0.1% NE 0.5% NJ 2.7% NM 0.3% NV 1.1% NY 8.5% OH 1.9% OK 0.5% OR 0.9% PA 2.5% RI 0.2% SC 1.0% SD 0.1% TN 1.4% TX 12.7% UT 0.6% VA 5.3% VT 0.0% WA 3.4% WI 0.7% WV 0.1% WY <0.1% NH 0.2% 36 Based on the unpaid principal balance (UPB) of unsecuritized mortgage loans, other guarantee commitments, and collateral underlying other structured securities and K Certificate transactions. Percentages shown above are rounded to the nearest tenth of a percent although classifications are based on unrounded figures. Consists of the UPB of unsecuritized multifamily loans, other guarantee commitments, and guaranteed Freddie Mac mortgage-related securities. Excludes the UPB associated with unguaranteed subordinated tranches in K Certificate transactions and other structured securities. 1 2 1 5% 2% - 5% 1% 1% - 2% |
 37 Multifamily mortgage portfolio by attribute 1 Year of Acquisition or Guarantee 3 1 2006 and prior $25.2 0.17% $21.2 0.01% $19.1 - % 2 2007 17.8 0.86 15.8 0.29 15.1 0.54 3 2008 16.6 0.30 14.1 0.15 13.2 0.18 4 2009 12.2 - 11.5 - 11.2 - 5 2010 12.0 - 11.4 - 10.9 0.13 6 2011 17.0 - 16.4 - 15.9 - 7 2012 26.6 - 24.1 - 23.7 - 8 2013 N/A N/A 17.6 - 23.7 - Total $127.4 0.19% $132.1 0.05% $132.8 0.09% Maturity Dates 9 2013 $3.3 0.86% $0.5 1.73% N/A N/A 10 2014 5.8 - 3.4 - $2.1 0.12% 11 2015 9.8 0.53 7.8 - 6.9 0.05 12 2016 13.0 0.05 11.9 0.04 11.2 - 13 2017 10.9 0.02 10.4 0.17 10.0 0.43 14 2018 17.3 - 17.1 - 17.0 - 15 Beyond 2018 67.3 0.24 81.0 0.05 85.6 0.08 Total $127.4 0.19% $132.1 0.05% $132.8 0.09% Geography 4 16 California $21.1 0.12% $21.9 - % $22.4 0.03% 17 Texas 15.9 0.13 16.3 0.04 16.7 0.02 18 New York 10.7 0.09 11.3 0.09 11.4 0.12 19 Florida 8.4 0.12 9.3 - 9.3 0.28 20 Virginia 6.6 - 7.1 - 7.0 0.37 21 Maryland 6.9 - 6.8 - 6.7 - 22 All other states 57.8 0.32 59.4 0.09 59.3 0.08 Total $127.4 0.19% $132.1 0.05% $132.8 0.09% UPB ($ Billions) December 31, 2013 UPB ($ Billions) Delinquency Rate 2 (%) September 30, 2013 Delinquency (%) December 31, 2012 Delinquency (%) UPB ($ Billions) Based on the unpaid principal balance (UPB) of the multifamily mortgage portfolio. Based on the UPB of mortgages two monthly payments or more past due or in the process of foreclosure. Based on either: (a) the year of acquisition, for loans recorded on the company’s consolidated balance sheets; or (b) the year that the company issued its guarantee, for the remaining loans in its multifamily mortgage portfolio. Presents the six states with the highest UPB at December 31, 2013. 1 2 4 3 Rate 2 Rate 2 |
 38 Multifamily mortgage portfolio by attribute, continued Current Loan Size 1 > $25M $48.5 0.06% $50.8 - % $50.6 0.05% 2 > $5M & <= $25M 70.0 0.26 72.4 0.07 73.2 0.11 3 > $3M & <= $5M 5.7 0.22 5.8 0.23 6.0 0.11 4 > $750K & <= $3M 3.0 0.65 2.9 0.23 2.8 0.17 5 <= $750K 0.2 0.37 0.2 0.45 0.2 0.46 6 Total $127.4 0.19% $132.1 0.05% $132.8 0.09% Legal Structure 7 Unsecuritized Loans $76.6 0.08% $64.9 0.05% $59.2 0.08% 8 K Certificates 37.2 0.07 54.1 0.01 59.8 0.07 9 Other Freddie Mac mortgage-related securities 4.2 3.20 4.0 0.75 4.8 0.59 10 Other guarantee commitments 9.4 0.13 9.1 - 9.0 - 11 Total $127.4 0.19% $132.1 0.05% $132.8 0.09% Credit Enhancement 12 Credit Enhanced $47.8 0.36% $64.1 0.06% $70.2 0.11% 13 Non-Credit Enhanced 79.6 0.10 68.0 0.05 62.6 0.07 14 Total $127.4 0.19% $132.1 0.05% $132.8 0.09% Other 15 Original LTV > 80% $5.8 2.31% $5.2 0.33% $5.6 0.19% 16 Original DSCR below 1.10 $2.3 2.97% $2.0 0.30% $2.2 - % December 31, 2013 UPB ($ Billions) Delinquency Rate (%) September 30, 2013 Delinquency Rate (%) December 31, 2012 Delinquency Rate (%) UPB ($ Billions) UPB ($ Billions) Based on the unpaid principal balance (UPB) of the multifamily mortgage portfolio. Based on the UPB of mortgages two monthly payments or more past due or in the process of foreclosure. DSCR – Debt Service Coverage Ratio – is an indicator of future credit performance for multifamily loans. DSCR estimates a multifamily borrower’s ability to service its mortgage obligation using the secured property’s cash flow, after deducting non-mortgage expenses from income. The higher the DSCR, the more likely a multifamily borrower will be able to continue servicing its mortgage obligation. 1 2 3 1 2 2 2 3 |
 Multifamily market and Freddie Mac delinquency rates Percent 39 0.00% 6.41% 0.96% 0.05% 0 2 4 6 8 10 12 14 3Q 2009 1Q 2010 3Q 2010 1Q 2011 3Q 2011 1Q 2012 3Q 2012 1Q 2013 3Q 2013 Freddie Mac (60+ day) FDIC Insured Institutions (90+ day) MF CMBS Market (60+ day) ACLI Investment Bulletin (60+ day) 1 1 See “MD&A – RISK MANAGEMENT – Credit Risk – Mortgage Credit Risk – Multifamily Mortgage Credit Risk ” in Freddie Mac’s Form 10-K for the year ended December 31, 2013, for information about the company’s reported multifamily delinquency rate. The multifamily delinquency rate at December 31, 2013 was 0.09%. Source: Freddie Mac, FDIC Quarterly Banking Profile, TREPP (CMBS multifamily 60+ delinquency rate, excluding REOs), American Council of Life Insurers (ACLI). Non-Freddie Mac data is not yet available for the fourth quarter of 2013. |
 40 Safe Harbor Statements Freddie Mac obligations Freddie Mac’s securities are obligations of Freddie Mac only. The securities, including any interest or return of discount on the securities, are not guaranteed by and are not debts or obligations of the United States or any federal agency or instrumentality other than Freddie Mac. No offer or solicitation of securities This presentation includes information related to, or referenced in the offering documentation for, certain Freddie Mac securities, including offering circulars and related supplements and agreements. Freddie Mac securities may not be eligible for offer or sale in certain jurisdictions or to certain persons. This information is provided for your general information only, is current only as of its specified date and does not constitute an offer to sell or a solicitation of an offer to buy securities. The information does not constitute a sufficient basis for making a decision with respect to the purchase or sale of any security. All information regarding or relating to Freddie Mac securities is qualified in its entirety by the relevant offering circular and any related supplements. Investors should review the relevant offering circular and any related supplements before making a decision with respect to the purchase or sale of any security. In addition, before purchasing any security, please consult your legal and financial advisors for information about and analysis of the security, its risks and its suitability as an investment in your particular circumstances. Forward-looking statements Freddie Mac's presentations may contain forward-looking statements, which may include statements pertaining to the conservatorship, the company’s current expectations and objectives for its single-family, multifamily and investment businesses, its loan workout initiatives and other efforts and other programs to assist the U.S. residential mortgage market, liquidity, capital management, economic and market conditions and trends, market share, the effect of legislative and regulatory developments, and new accounting guidance, credit quality of loans we guarantee, and results of operations and financial condition on a GAAP, Segment Earnings and fair value basis. Forward-looking statements involve known and unknown risks and uncertainties, some of which are beyond the company’s control. Management’s expectations for the company’s future necessarily involve a number of assumptions, judgments and estimates, and various factors, including changes in market conditions, liquidity, mortgage spreads, credit outlook, actions by the U.S. government (including FHFA, Treasury and Congress), and the impacts of legislation or regulations and new or amended accounting guidance, could cause actual results to differ materially from these expectations. These assumptions, judgments, estimates and factors are discussed in the company’s Annual Report on Form 10-K for the year ended December 31, 2013, which is available on the Investor Relations page of the company’s Web site at www.FreddieMac.com/investors and the SEC’s Web site at www.sec.gov. The company undertakes no obligation to update forward-looking statements it makes to reflect events or circumstances after the date of this presentation. |