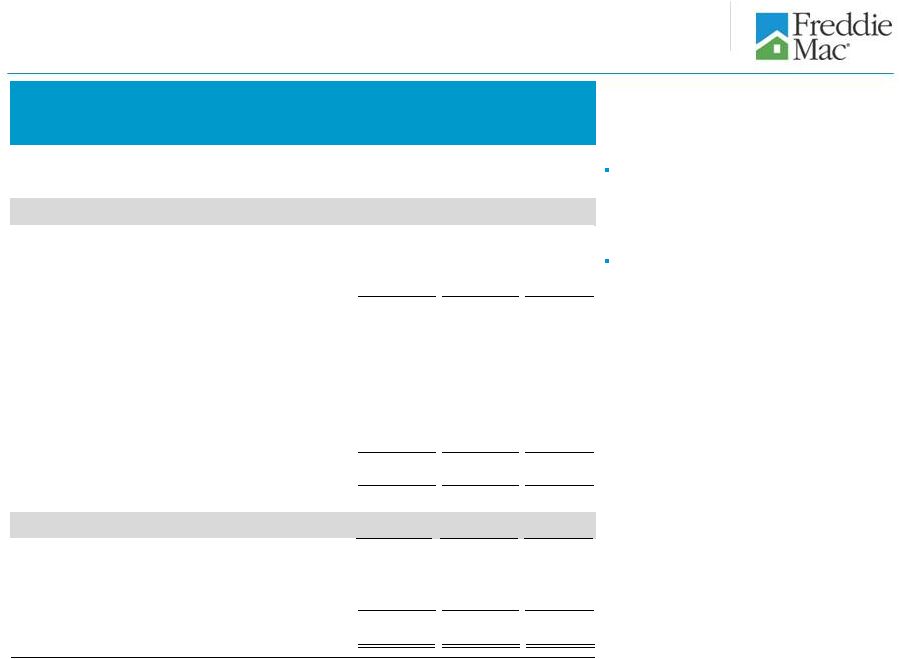
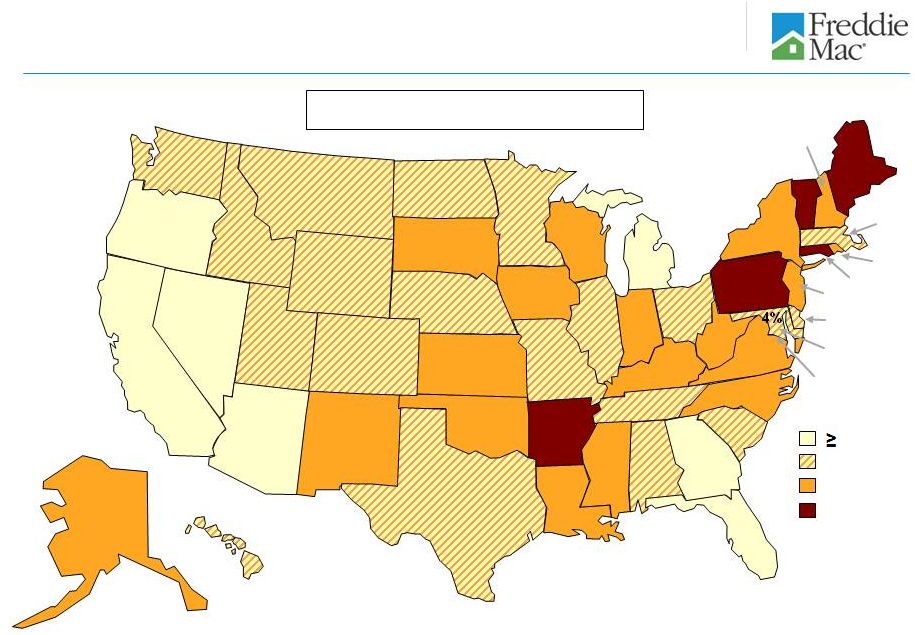
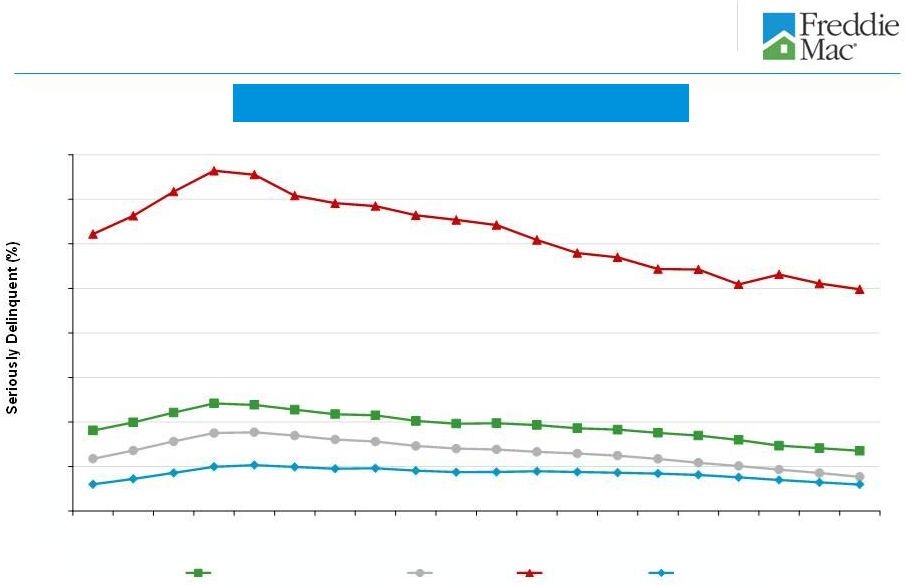
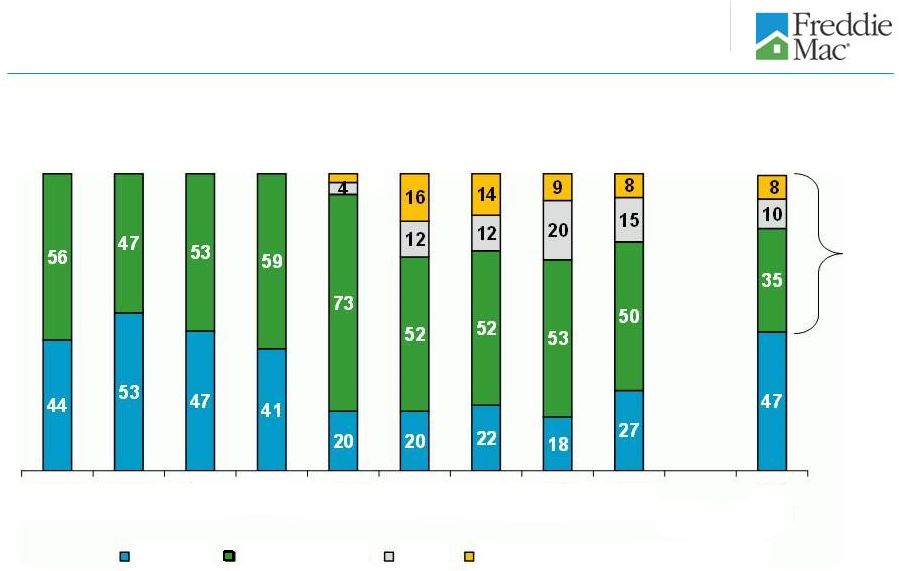
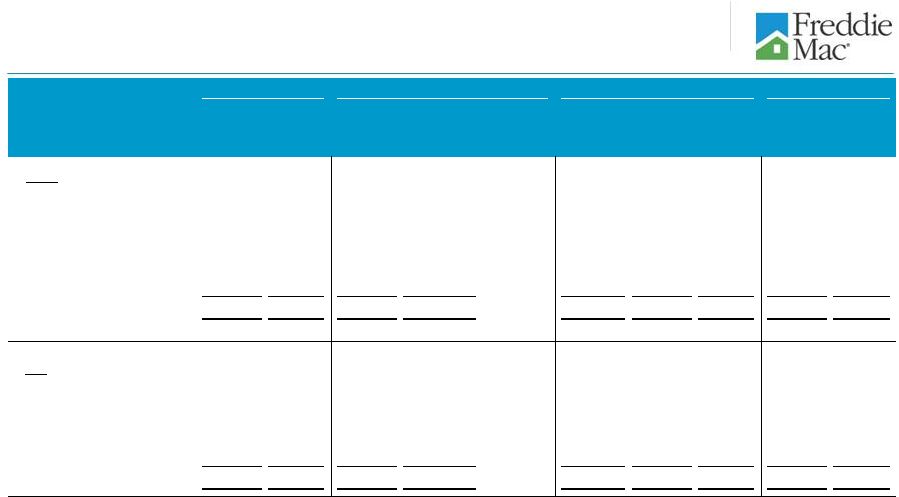
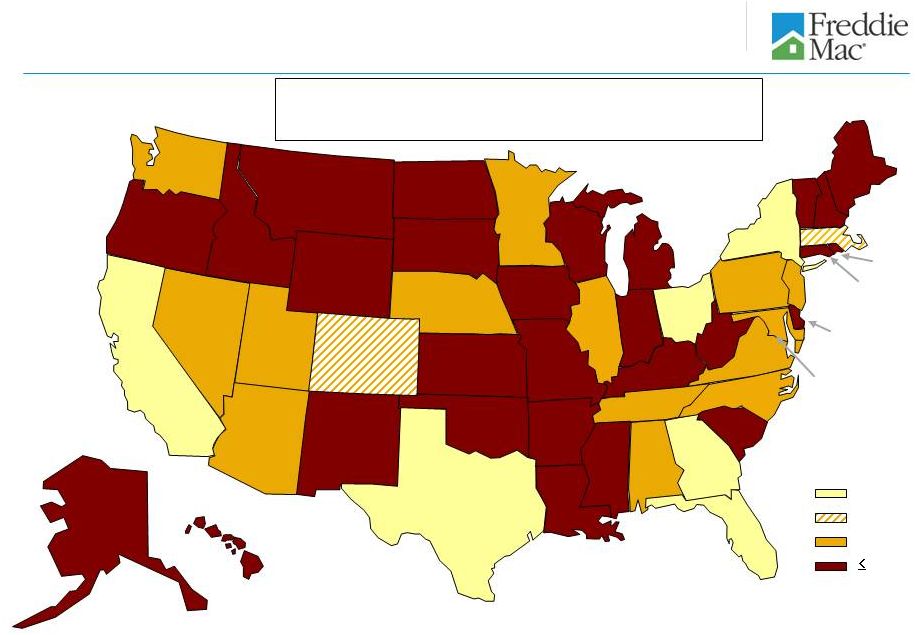
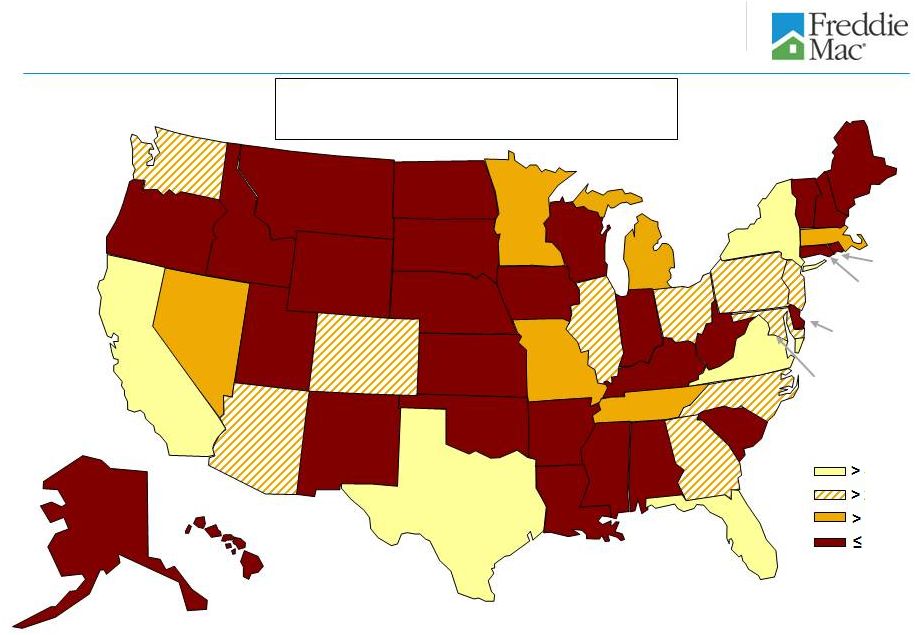
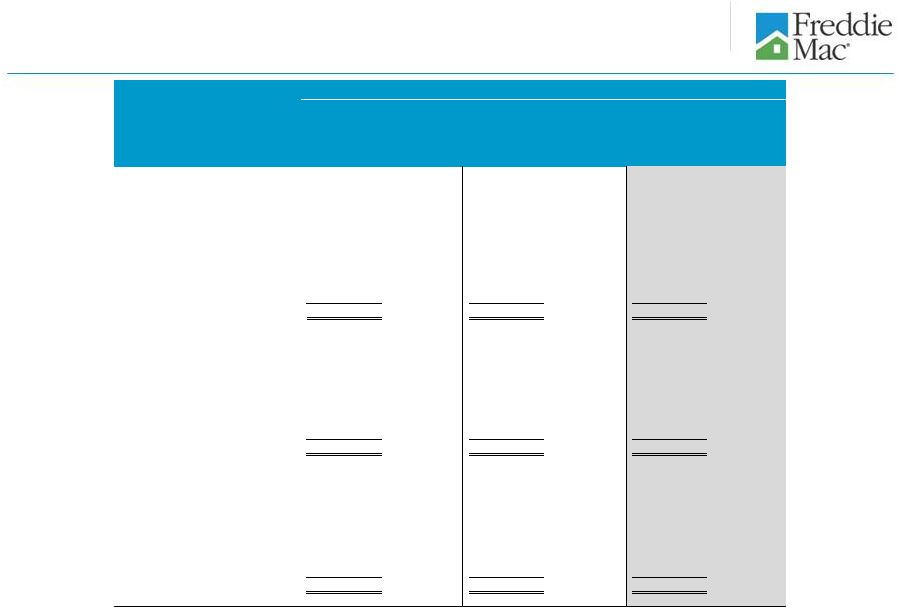
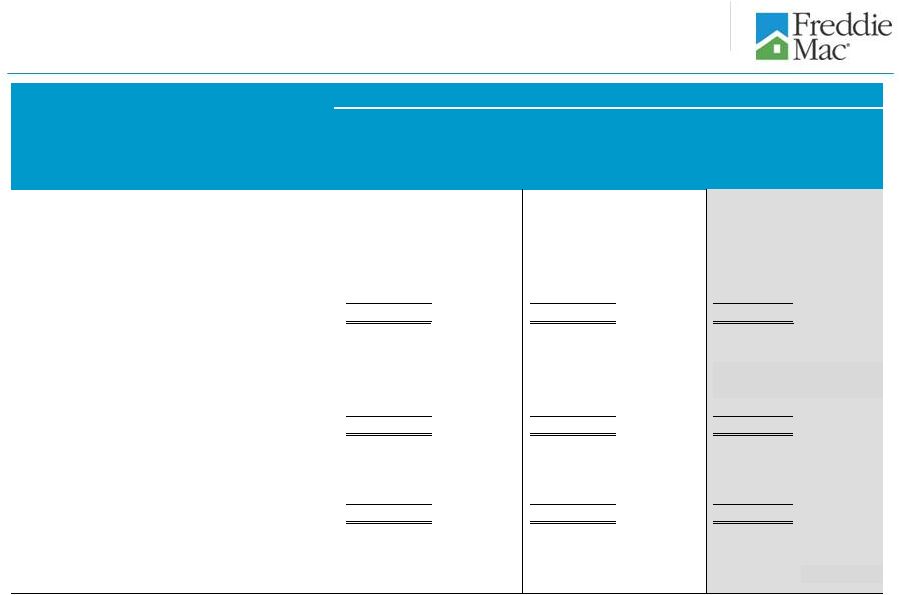
26 Single-family 1Q 2014 credit losses and REO by region and state ($ Billions) % of Total UPB 2 ($ Millions) % of Total Serious Delinquency Rate 3 (%) 1Q 2014 Acquisitions ($ Millions) REO Inventory ($ Millions) % of Total Inventory ($ Millions) % of Total Region 6 1 West $465 28% $7,896 20% 1.55% $423 $1,080 15% $79 8% 2 Northeast 430 26 15,014 38 3.10% 411 1,517 22 258 27 3 North Central 289 18 5,118 13 1.67% 422 1,778 26 228 23 4 Southeast 272 16 9,378 23 3.07% 810 2,125 30 356 37 5 Southwest 195 12 2,242 6 1.25% 151 461 7 46 5 6 Total $1,651 100% $39,648 100% 2.20% $2,217 $6,961 100% $967 100% State 7 Arizona, California, Florida & Nevada 7 $423 26% $11,204 28% 2.63% $861 $2,130 31% $310 32% 8 Illinois, Michigan & Ohio 8 174 10 3,732 10 1.95% 291 1,326 19 168 17 9 New York & New Jersey 9 145 9 8,759 22 4.98% 91 274 4 103 11 10 All other 909 55 15,953 40 1.72% 974 3,231 46 386 40 11 Total $1,651 100% $39,648 100% 2.20% $2,217 $6,961 100% $967 100% Total Portfolio UPB 1 Seriously Delinquent Loans REO Acquisitions & Balance 4 Credit Losses 5 Based on the unpaid principal balance (UPB) of the single-family credit guarantee portfolio at March 31, 2014. UPB amounts exclude $394 million of Other Guarantee Transactions since these securities are backed by non-Freddie Mac issued securities for which loan characteristic data was not available. Based on the number of loans that are three monthly payments or more past due or in the process of foreclosure. Based on the UPB of loans at the time of REO acquisition. Consist of the aggregate amount of charge-offs, net of recoveries, and REO operations (income) expense for 1Q 2014. Region designation: West (AK, AZ, CA, GU, HI, ID, MT, NV, OR, UT, WA); Northeast (CT, DE, DC, MA, ME, MD, NH, NJ, NY, PA, RI, VT, VA, WV); Southeast (AL, FL, GA, KY, MS, NC, PR, SC, TN, VI); North Central (IL, IN, IA, MI, MN, ND, OH, SD, WI); and Southwest (AR, CO, KS, LA, MO, NE, NM, OK, TX, WY). Represents the four states that had the largest cumulative declines in home prices during the housing crisis that began in 2006, as measured using Freddie Mac’s home price index. Represents selected states in the North Central region that have experienced adverse economic conditions since 2006. Represents two states with a judicial foreclosure process in which there are a significant number of seriously delinquent loans within Freddie Mac’s single-family credit guarantee portfolio. 1 2 3 4 5 6 7 8 9 |