Exhibit 99.1
| | |
 | | News Release |
FOR IMMEDIATE RELEASE
November 3, 2015
MEDIA CONTACT: Lisa Gagnon
703-903-3385
INVESTOR CONTACT: Robin Phillips
571-382-4732
FREDDIE MAC REPORTS THIRD QUARTER 2015 FINANCIAL RESULTS
$475 Million Net Loss and $501 Million Comprehensive Loss; No Draw Needed From U.S. Treasury
$4.2 Billion Year-to-Date Net Income and Comprehensive Income
$96.5 Billion Returned to Taxpayers To Date
Quarterly Results Negatively Impacted by Market-Related Items Totaling $2.1 Billion
| | ● | | $1.5 billion (after-tax), approximately, was driven by the fair value losses on derivatives used to hedge the company’s interest rate risk. However, significant GAAP earnings volatility can occur as the derivative instruments are measured at fair value each period while certain hedged assets and liabilities are not. (See page 3 for details.) |
| | ¡ | The hedging is designed to reduce the company’s economic exposure to interest rates to relatively low levels. In the second quarter of 2015, the comparable result was a $1.5 billion (after-tax) estimated fair value gain. |
| | ● | | $0.6 billion (after-tax), approximately, of the comprehensive loss was the result of credit spread changes on various assets and liabilities measured at fair value. |
| | ¡ | In the second quarter of 2015, the comparable result was an estimated $0.7 billion (after-tax) gain. |
Business Fundamentals Were Strong and Continued to Improve
| | ● | | Single-Family Guarantee Business |
| | ¡ | Year-to-date September 30, 2015 purchase volume rose approximately $90 billion, or nearly 50 percent compared to the same period a year ago. |
| | ¡ | Post-2008 book of business grew to 65 percent of single-family credit guarantee portfolio at September 30, 2015; HARP and other relief refinance loans represented an additional 18 percent. |
| | ¡ | Credit quality continued to improve, with the serious delinquency rate declining to 1.41 percent at September 30, 2015, compared to 1.53 percent at June 30, 2015; this is the lowest level since October 2008. |
| | ¡ | Year-to-date September 30, 2015 purchase volume increased approximately $20 billion, or more than double compared to the same period a year ago. |
| | ¡ | Credit quality remained strong, with the delinquency rate very low at one basis point at September 30, 2015, unchanged from June 30, 2015. |
Reduced Taxpayer Exposure by Transferring Credit Risk
| | ● | | A portion of the credit risk of new mortgage purchases is being transferred to the private markets as part of the company’s core business model. |
| | ¡ | Single-Family: Transferred a portion of single-family credit risk on approximately $130 billion of mortgages year-to-date September 30, 2015 through an increasing range of structured transactions. |
| | ¡ | Multifamily: Approximately 90 percent of multifamily mortgage loans purchased year-to-date September 30, 2015 have been designated for securitization. |
| | ● | | Transactions to actively reduce the credit risk of legacy mortgage assets continue. |
| | ¡ | Sold $12.5 billion of less liquid assets year-to-date September 30, 2015 and $45.8 billion since 2013. |
Strong Housing Market Support – Helping Families Buy, Rent or Keep Their Homes
| | ● | | Provided $2.8 trillion in liquidity to the mortgage market, funding 12.2 million single-family homes and 2.5 million multifamily rental units since 2009. |
| | ¡ | Helped over 1.1 million borrowers avoid foreclosure during that time. |
Net Worth of $1.3 Billion; No Draw Request or Dividend Obligation Under the Purchase Agreement
| | ● | | The company has returned $96.5 billion to taxpayers and drawn $71.3 billion from the Treasury. |
| | ● | | The amount of available funding remaining under the Purchase Agreement is unchanged at $140.5 billion. |
Freddie Mac Third Quarter 2015 Financial Results
November 3, 2015
Page 2
McLean, VA — Freddie Mac (OTCQB: FMCC) today reported a net loss of $475 million for the third quarter of 2015, compared to net income of $4.2 billion for the second quarter of 2015. The company also reported a comprehensive loss of $501 million for the third quarter of 2015, compared to comprehensive income of $3.9 billion for the second quarter of 2015.
“For the first time in four years, Freddie Mac had a net loss in the most recent quarter. This $0.5 billion loss was caused mainly by the accounting associated with our use of derivatives, whereby the derivatives are marked-to-market but many of the assets and liabilities being hedged are not. The resulting difference between GAAP reporting and the actual underlying economics, which has created significant GAAP income volatility in our quarterly financial statements, reduced the after tax earnings in the quarter by an estimated $1.5 billion as interest rates declined significantly” said Donald H. Layton, chief executive officer. “In the prior quarter, we had the opposite result with a $1.5 billion positive contribution to earnings as rates rose significantly.”
“Otherwise, the business had very strong fundamentals with growing volumes of guarantees and continued improving credit quality in the guarantee businesses. Partially offsetting these fundamentals were about $0.6 billion in losses caused by a large increase in credit spreads on our fair-valued assets, which are also volatile quarter-over-quarter. Last quarter such credit spread changes generated a gain of $0.7 billion.”
“Finally, as this loss was just a fraction of the $1.8 billion net worth reserve we have under the Preferred Stock Purchase Agreement, no U.S. Treasury draw was needed, so total dividends paid remains unchanged at $96.5 billion, $25 billion more than we have received.”
Financial Results Discussion
Summary Consolidated Statements of Comprehensive Income (Loss) (1)
| | | | | | | | | | | | | | |
| | | | | Three Months Ended | |
| ($ Millions) | | 9/30/15 | | | 6/30/15 | | | Change | |
1 | | Net interest income | | $ | 3,743 | | | $ | 3,969 | | | $ | (226 | ) |
2 | | Benefit for credit losses | | | 528 | | | | 857 | | | | (329 | ) |
3 | | Derivative gains (losses) | | | (4,172 | ) | | | 3,135 | | | | (7,307 | ) |
4 | | Other non-interest income (loss) | | | 331 | | | | (594 | ) | | | 925 | |
| | | | | | | | | | | | | | |
5 | | Non-interest income (loss) | | | (3,841 | ) | | | 2,541 | | | | (6,382 | ) |
6 | | Administrative expenses | | | (465 | ) | | | (501 | ) | | | 36 | |
7 | | REO operations expense | | | (116 | ) | | | (52 | ) | | | (64 | ) |
8 | | Other non-interest expense | | | (518 | ) | | | (736 | ) | | | 218 | |
| | | | | | | | | | | | | | |
9 | | Non-interest expense | | | (1,099 | ) | | | (1,289 | ) | | | 190 | |
10 | | Pre-tax income (loss) | | | (669 | ) | | | 6,078 | | | | (6,747 | ) |
11 | | Income tax benefit (expense) | | | 194 | | | | (1,909 | ) | | | 2,103 | |
| | | | | | | | | | | | | | |
12 | | Net income (loss) | | $ | (475 | ) | | $ | 4,169 | | | $ | (4,644 | ) |
13 | | Total other comprehensive income (loss) | | | (26 | ) | | | (256 | ) | | | 230 | |
| | | | | | | | | | | | | | |
14 | | Comprehensive income (loss) | | $ | (501 | ) | | $ | 3,913 | | | $ | (4,414 | ) |
| | | | | | | | | | | | | | |
| | | | | | | | | | | | | | | |
| (1) | Columns and rows may not add due to rounding. |
Freddie Mac Third Quarter 2015 Financial Results
November 3, 2015
Page 3
Third quarter 2015 net loss and comprehensive loss were $475 million and $501 million, respectively, a shift from net income of $4.2 billion and comprehensive income of $3.9 billion in the second quarter of 2015.
| | ● | | Third quarter results were driven by net interest income of $3.7 billion, offset by two market-related items. |
| | ¡ | Interest Rate Change Impact: |
| | - | Freddie Mac’s derivative losses for the third quarter were $4.2 billion and included $3.6 billion of fair value losses and $0.5 billion of negative interest carry. The company estimates that these derivative fair value losses were partially offset by an estimated $1.4 billion (pre-tax) of interest-rate related gains on the company’s fair value mortgage assets reflected in other non-interest income and other comprehensive income. The net effect was an estimated $2.2 billion (pre-tax), or $1.5 billion (after-tax), loss that relates to the economic hedging of assets and liabilities not similarly measured at fair value. |
| | o | In the second quarter of 2015, the comparable result was a $1.5 billion (after-tax) estimated fair value gain as interest rates increased and the yield curve steepened. |
| | | | | | | | | | | | | | |
| | | | | Three Months Ended | |
| ($ Billions) | | 9/30/15 | | | 6/30/15 | | | Change | |
Derivative gains / (losses) | | | | | | | | | | | | |
1 | | Derivative gains / (losses) | | $ | (4.2 | ) | | $ | 3.1 | | | $ | (7.3 | ) |
2 | | Derivative Interest Carry | | | (0.5 | ) | | | (0.5 | ) | | | (0.0 | ) |
3 | | Derivative Fair Value Changes | | | (3.6 | ) | | | 3.7 | | | | (7.3 | ) |
Net Interest Rate Impact | | | | | | | | | | | | |
4 | | Derivative Interest Rate Impact | | $ | (3.5 | ) | | $ | 3.4 | | | $ | (6.9 | ) |
5 | | Estimate of Offsetting Interest Rate Impact Due to Mortgage Assets at Fair Value | | | 1.4 | | | | (1.2 | ) | | | 2.7 | |
6 | | Income Tax Benefit (Expense) | | | 0.6 | | | | (0.7 | ) | | | 1.3 | |
| | | | | | | | | | | | | | |
7 | | Net Estimate of Remaining Interest Rate Impact (4+5+6) | | $ | (1.5 | ) | | $ | 1.5 | | | $ | (3.0 | ) |
| | | | | | | | | | | | | | |
| | | | | | | | | | | | | | | |
| | - | The third quarter comprehensive loss was also negatively affected by an estimated $0.6 billion (after-tax) due to the impact of credit spread widening on certain mortgage loans and mortgage-related securities measured at fair value. |
| | o | In the second quarter of 2015, the comparable result was an estimated $0.7 billion (after-tax) gain as credit spreads tightened. |
| | ● | | Additionally, Freddie Mac continues to sell non-performing single-family mortgage loans and reclassified $4.6 billion and $2.5 billion in unpaid principal balance (UPB) of such loans from held-for-investment to held-for-sale in the second and third quarters of 2015, respectively. The current reclassification of these loans and other related subsequent activity had minimal net earnings impact in the third quarter of 2015, but affected various financial statement line items. |
Freddie Mac Third Quarter 2015 Financial Results
November 3, 2015
Page 4
Selected Financial Highlights
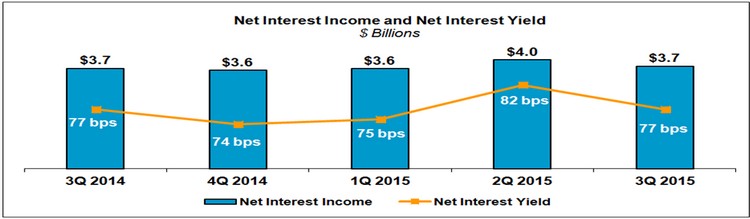
Net interest income was $3.7 billion for the third quarter of 2015, a decrease of $226 million from the second quarter of 2015. Net interest yield was 77 basis points for the third quarter of 2015, a decrease of 5 basis points from the second quarter of 2015.
| | ● | | The decreases in both net interest income and net interest yield primarily reflect a decline in the balance of higher-yielding mortgage-related assets due to continued liquidations, as well as lower prepayment income. |
| | ● | | The management and guarantee fee portion of Freddie Mac’s net interest income continues to increase as the size of the company’s mortgage-related investments portfolio continues to decline. Approximately 40 percent, or $1.5 billion of net interest income in the third quarter was derived from management and guarantee fees. |
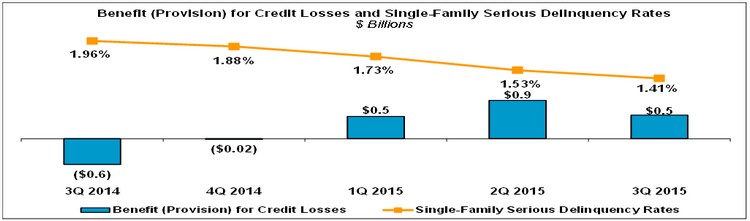
Benefit for credit losses was $528 million for the third quarter of 2015, a decrease of $329 million from the second quarter of 2015.
| | ● | | The decrease reflects a smaller reversal of loan loss reserves as the company reclassified fewer non-performing single-family mortgage loans from held-for-investment to held-for-sale in the third quarter versus the second quarter. Excluding the impact of the reversals, the provision for credit losses was relatively unchanged compared to the second quarter of 2015. |
| | ● | | Freddie Mac’s single-family serious delinquency rate has continued to decline since 2010, primarily due to lower volumes of newly delinquent loans, continued loss mitigation (including sales of non-performing single-family mortgage loans) and foreclosure activities for mortgage loans in the legacy single-family books. |
Freddie Mac Third Quarter 2015 Financial Results
November 3, 2015
Page 5
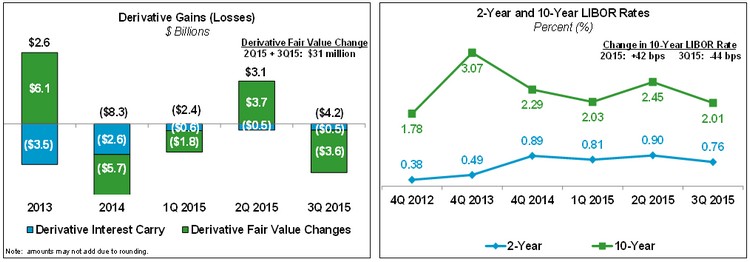
Derivative losses were $4.2 billion for the third quarter of 2015, a shift from derivative gains of $3.1 billion in the second quarter of 2015.
| | ● | | The losses in the third quarter were driven by a decline in interest rates and a flattening yield curve, reversing most of the gains observed during the second quarter. |
| | ● | | Derivative gains (losses) include both fair value changes and derivative interest carry (i.e., accrual of periodic settlements). |
| | ¡ | Fair value changes were a loss of $3.6 billion in the third quarter of 2015, a shift from a gain of $3.7 billion in the second quarter of 2015. |
| | ¡ | Derivative interest carry, which is economically equivalent to interest expense, has been fairly constant and was an expense of $536 million in the third quarter of 2015 compared to an expense of $532 million in the second quarter of 2015. |
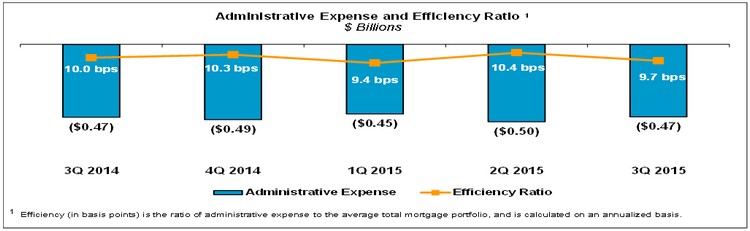
Administrative expense was $465 million (9.7 basis points) for the third quarter of 2015, a decrease of $36 million from the second quarter of 2015.
| | ● | | The decrease was mostly driven by a one-time expense associated with the company’s terminated pension plans in the second quarter of 2015. |
Freddie Mac Third Quarter 2015 Financial Results
November 3, 2015
Page 6
Variability of Earnings
Freddie Mac’s financial results are subject to significant earnings variability from period to period. This variability is primarily driven by:
| | ● | | Interest-Rate Volatility – Freddie Mac holds assets and liabilities that expose it to interest-rate risk. Through its use of derivatives, the company manages its exposure to interest-rate risk on an economic basis to a low level as measured by the company’s models. However, the way the company accounts for its financial assets and liabilities, including derivatives (i.e., some are measured at amortized cost, while others are measured at fair value), creates volatility in the company’s earnings when interest rates fluctuate. This volatility is not indicative of the underlying economics of its business. |
| | ● | | Spread Volatility – Spread volatility (i.e., credit spreads, liquidity spreads, risk premiums, etc.), or option-adjusted spreads, is the risk associated with changes in interest rates in excess of benchmark rates. Freddie Mac holds assets and liabilities that expose it to spread volatility. However, the company has limited ability to manage spread volatility. Changes in spreads may contribute to significant earnings volatility period to period. |
| | ● | | Non-Recurring Events – From time to time, Freddie Mac has experienced and will likely continue to experience significant earnings volatility from non-recurring events related to the financial crisis, including settlements with counterparties and changes in certain valuation allowances (i.e., allowance for loan losses and deferred tax asset). |
Segment Financial Results and Business Highlights
Freddie Mac’s operations consist of three reportable segments, which are based on the types of business activities they perform — Single-family Guarantee, Investments and Multifamily. Certain activities that are not part of a reportable segment are included in the All Other category.
Summary of Segment Earnings (Loss) and Comprehensive Income (Loss)(1)(2)
| | | | | | | | | | | | | | |
| | | | | Three Months Ended | |
| ($ Millions) | | 9/30/15 | | | 6/30/15 | | | Change | |
| | Segment Earnings (loss), net of taxes | | | | | | | | | | | | |
1 | | Single-family Guarantee | | $ | 591 | | | $ | 489 | | | $ | 102 | |
2 | | Investments | | | (963 | ) | | | 3,207 | | | | (4,170 | ) |
3 | | Multifamily | | | (103 | ) | | | 473 | | | | (576 | ) |
4 | | All Other | | | — | | | | — | | | | — | |
| | | | | | | | | | | | | | |
5 | | Total Segment Earnings (loss), net of taxes | | $ | (475 | ) | | $ | 4,169 | | | $ | (4,644 | ) |
| | | | | | | | | | | | | | |
| |
Comprehensive income (loss) of segments | | | | | | | | | | | | |
6 | | Single-family Guarantee | | $ | 591 | | | $ | 489 | | | $ | 102 | |
7 | | Investments | | | (1,008 | ) | | | 3,038 | | | | (4,046 | ) |
8 | | Multifamily | | | (84 | ) | | | 366 | | | | (450 | ) |
9 | | All Other | | | — | | | | 20 | | | | (20 | ) |
| | | | | | | | | | | | | | |
10 | | Comprehensive income (loss) of segments | | $ | (501 | ) | | $ | 3,913 | | | $ | (4,414 | ) |
| | | | | | | | | | | | | | |
| | | | | | | | | | | | | | | |
| (1) | Columns and rows may not add due to rounding. |
| (2) | The financial performance of the company’s Single-family Guarantee segment is measured based on its contribution to GAAP net income (loss). The financial performance of the company’s Investments segment and Multifamily segment are measured based on each segment’s contribution to GAAP comprehensive income (loss). |
Freddie Mac Third Quarter 2015 Financial Results
November 3, 2015
Page 7
Single-family Guarantee Segment
Providing liquidity to the U.S. housing market while continuing to transfer credit risk to the private market
| | ● | | Single-family Guarantee segment earnings were $591 million for the third quarter of 2015, an increase of $102 million from the second quarter of 2015. The increase was primarily driven by fewer non-performing single-family mortgage loans being reclassified from held-for-investment to held-for-sale in the third quarter versus the second quarter. |
| | ● | | New book of business continued to grow and was 65 percent of single-family credit guarantee portfolio at September 30, 2015. |
| | ¡ | HARP and other relief refinance loans were an additional 18 percent. |
| | ¡ | 2005-2008 legacy book declined to 11 percent. |
| | ● | | Average management and guarantee fees charged on new acquisitions were 44.0 basis points (net of legislated 10 basis point guarantee fee remitted to Treasury as part of the Temporary Payroll Tax Cut Continuation Act of 2011) in the third quarter of 2015, down from 45.1 basis points in the second quarter of 2015. |
| | ● | | Single-family serious delinquency rate continues to decline and was 1.41 percent at September 30, 2015, the lowest since October 2008. |
| | ● | | Completed sales of $640 million in UPB of non-performing unsecuritized single-family loans during the third quarter of 2015. The company subsequently announced two additional sales of such loans totaling up to $1.4 billion in UPB, which are expected to settle in the fourth quarter of 2015. |
| | ● | | Completed credit risk transfer transactions that, upon initial execution, covered $333.9 billion in principal of the mortgage loans in the company’s new single-family book from 2013 through September 30, 2015. |
| | ¡ | In the third quarter of 2015, the company completed two new credit risk transfer transactions: |
| | - | Whole loan security, which uses a senior/subordinated security structure. |
| | - | Seller indemnification, an agreement where the seller will absorb first losses on the related single-family mortgage loans based upon a predetermined percentage. |
| | ● | | Announced Loan Advisor Suite, a set of integrated software applications designed to give lenders a way to originate and deliver high quality mortgages to Freddie Mac and acquire insight into representation and warranty relief earlier in the loan production process. |
Investments Segment
Reducing less liquid assets using an economically sensible approach
| | ● | | Investments segment comprehensive loss was $1.0 billion for the third quarter of 2015, a shift from comprehensive income of $3.0 billion in the second quarter of 2015. The shift was primarily driven by derivative losses, as interest rates declined and the yield curve flattened in the third quarter of 2015. |
| | ● | | Continued to actively reduce the balance of the company’s mortgage-related investments portfolio, focusing on less liquid assets. Investments segment less liquid assets were $114.2 billion at September 30, 2015, down $10.1 billion, or 8 percent, from June 30, 2015 due to ongoing portfolio liquidations and: |
| | ¡ | Sales of $3.4 billion of private-label securities. |
| | ¡ | Securitization of $4.0 billion of single-family reperforming and modified loans. |
| | ● | | Continued to maintain a presence in the agency mortgage-related securities market. More liquid assets held by the Investments segment were $157.7 billion at September 30, 2015, down $510 million from June 30, 2015. |
| | ● | | Continued to manage the company’s interest-rate risk on an economic basis to a low level as duration gap averaged zero months for the third quarter of 2015. |
Freddie Mac Third Quarter 2015 Financial Results
November 3, 2015
Page 8
Multifamily Segment
Providing financing for workforce rental housing and transferring credit risk to private investors
| | ● | | Multifamily segment comprehensive loss was $84 million for the third quarter of 2015, a shift from comprehensive income of $366 million in the second quarter of 2015. The shift was primarily driven by spread widening in the commercial mortgage backed securities market. |
| | ● | | New purchase volume of $10.9 billion in the third quarter of 2015 and $34.1 billion year-to-date September 30, 2015. |
| | ¡ | The full year 2015 new multifamily business activity (excluding certain targeted loan types) is subject to a cap of $30.0 billion in UPB based on FHFA’s 2015 Conservatorship Scorecard. |
| | ¡ | Approximately 70 percent of the $34.1 billion in new business activity for the nine months ended September 30, 2015 counted towards the 2015 volume limit, while the remaining 30 percent was excluded. |
| | ¡ | Continued to provide workforce rental housing through new product offerings such as small balance and manufactured housing community loans. |
| | ● | | Continuing the company’s focus on transferring credit risk to private investors, approximately 90 percent of the new multifamily mortgage loans purchased in the nine months ended September 30, 2015 are intended to be securitized intoK-deals and other similar types of transactions. |
| | ¡ | Sold $6.0 billion of multifamily mortgage loans through five K-deal offerings and three small balance loan securitizations in the third quarter of 2015. |
| | ¡ | A total of $21.2 billion of multifamily mortgage loans were sold for securitization that transferred credit risk to third party investors during the nine months ended September 30, 2015. |
| | ● | | Multifamily delinquency rate remained very low at one basis point at September 30, 2015, reflecting continued strong portfolio performance. |
| | ● | | Provided financing for more than 167,000 rental units in the third quarter of 2015. Nearly 90 percent of the eligible units financed are affordable to families earning low to median incomes. |
Housing Market Support
Freddie Mac supports the U.S. housing market by executing its community mission to ensure credit availability for new and refinanced mortgages as well as rental housing and helping struggling homeowners avoid foreclosure. Since the beginning of 2009, Freddie Mac has helped nearly 14.7 million American families own or rent a home and over 1.1 million families avoid foreclosure.
Providing Liquidity – Freddie Mac provides access to financing for new and refinanced mortgages and rental housing. In the third quarter of 2015, the company:
| | ● | | Provided $107.1 billion in liquidity to the market mostly through its purchases of loans, funding approximately 432,000 single-family homes and more than 167,000 multifamily rental units. |
| | ● | | Purchased refinance loans of $46.1 billion which accounted for 49 percent of the company’s single-family mortgage purchase volume. |
Freddie Mac is working to responsibly expand access to affordable housing for America’s families. The company’s new three percent down mortgage offering, Home Possible AdvantageSM, continued to gain traction in the third quarter, funding thousands of mortgages for qualified borrowers since it was introduced in the first quarter of 2015. More recently, Freddie Mac entered into partnership with Quicken Loans to jointly develop products specially aimed at the housing needs of low- to moderate-income borrowers, first-time homebuyers and Millennials.
Freddie Mac Third Quarter 2015 Financial Results
November 3, 2015
Page 9
Market Liquidity Provided(1)
| | | | | | | | | | | | | | | | | | | | | | | | | | | | | | | | | | |
| ($ Billions) | | 2009 | | | 2010 | | | 2011 | | | 2012 | | | 2013 | | | 2014 | | | YTD
2015 | | | Cumulative
Total | |
1 | | Single-family purchases or issuances(1) | | $ | 483 | | | $ | 390 | | | $ | 321 | | | $ | 427 | | | $ | 423 | | | $ | 255 | | | $ | 275 | | | | $2,574 | |
2 | | Relief refinance mortgages (includes HARP) | | | 35 | | | | 106 | | | | 82 | | | | 123 | | | | 99 | | | | 27 | | | | 16 | | | | 488 | |
3 | | Other refinance mortgages | | | 345 | | | | 200 | | | | 168 | | | | 228 | | | | 210 | | | | 94 | | | | 144 | | | | 1,389 | |
4 | | Purchase mortgages | | | 94 | | | | 78 | | | | 71 | | | | 76 | | | | 114 | | | | 134 | | | | 115 | | | | 682 | |
5 | | Other(2) | | | 9 | | | | 6 | | | | - | | | | - | | | | - | | | | - | | | | - | | | | 15 | |
6 | | Multifamily loan purchases or guarantees(1)(3) | | $ | 17 | | | $ | 16 | | | $ | 20 | | | $ | 29 | | | $ | 26 | | | $ | 28 | | | $ | 34 | | | | $ 170 | |
7 | | Other(4) | | $ | 46 | | | $ | - | | | $ | 8 | | | $ | - | | | $ | 4 | | | $ | 8 | | | $ | 4 | | | | $ 70 | |
8 | | Total(lines 1+6+7) | | $ | 546 | | | $ | 406 | | | $ | 349 | | | $ | 456 | | | $ | 453 | | | $ | 291 | | | $ | 313 | | | | $2,814 | |
| (1) | Based on UPB and includes other guarantee commitments. |
| (2) | Includes Ginnie Mae Certificates, HFA initiative-related guarantees, and Other Guarantee Transactions. |
| (3) | Excludes Multifamily issuances of K-deals and the securitization of small balance loans. |
| (4) | Consists of non-Freddie Mac mortgage-related securities purchased for the company’s mortgage-related investments portfolio. |
Preventing Foreclosures – Freddie Mac helps struggling borrowers retain their homes or otherwise avoid foreclosure.
| | ● | | The company completed approximately 22,000 single-family loan workouts in the third quarter of 2015, bringing the total number of homeowners the company has helped to avoid foreclosure to over 1.1 million since the beginning of 2009. |
| | ● | | When foreclosure is unavoidable, Freddie Mac has helped to further stabilize communities by focusing its real estate owned home sales on owner-occupants, who have made up two–thirds of its purchasers since the beginning of 2009, and by promoting industry-leading standards for property preservation. |
Number of Families Helped
| | | | | | | | | | | | | | | | | | | | | | | | | | | | | | | | | | |
| (Thousands) | | 2009 | | | 2010 | | | 2011 | | | 2012 | | | 2013 | | | 2014 | | | YTD
2015 | | | Cumulative
Total | |
1 | | Number of families helped to own or rent a home | | | 2,480 | | | | 2,089 | | | | 1,830 | | | | 2,472 | | | | 2,458 | | | | 1,627 | | | | 1,715 | | | | 14,671 | |
2 | | Relief refinance borrowers (includes HARP)(1) | | | 169 | | | | 533 | | | | 453 | | | | 687 | | | | 611 | | | | 179 | | | | 105 | | | | 2,737 | |
3 | | Other refinance borrowers(1) | | | 1,595 | | | | 947 | | | | 740 | | | | 996 | | | | 944 | | | | 429 | | | | 623 | | | | 6,274 | |
4 | | Purchase borrowers(1) | | | 460 | | | | 378 | | | | 326 | | | | 353 | | | | 515 | | | | 606 | | | | 507 | | | | 3,145 | |
5 | | Multifamily rental units | | | 256 | | | | 231 | | | | 311 | | | | 436 | | | | 388 | | | | 413 | | | | 480 | | | | 2,515 | |
6 | | Number of families helped to avoid foreclosure(2) | | | 133 | | | | 275 | | | | 208 | | | | 169 | | | | 168 | | | | 120 | | | | 75 | | | | 1,148 | |
7 | | Loan modifications | | | 65 | | | | 170 | | | | 109 | | | | 70 | | | | 83 | | | | 67 | | | | 43 | | | | 607 | |
8 | | Repayment plans | | | 34 | | | | 31 | | | | 33 | | | | 33 | | | | 29 | | | | 25 | | | | 17 | | | | 202 | |
9 | | Forbearance agreements | | | 15 | | | | 35 | | | | 20 | | | | 13 | | | | 12 | | | | 9 | | | | 5 | | | | 109 | |
10 | | Short sales & deed-in-lieu of foreclosure transactions | | | 19 | | | | 39 | | | | 46 | | | | 53 | | | | 44 | | | | 19 | | | | 10 | | | | 230 | |
11 | | Total (lines 1+6) | | | 2,613 | | | | 2,364 | | | | 2,038 | | | | 2,641 | | | | 2,626 | | | | 1,747 | | | | 1,790 | | | | 15,819 | |
| (1) | For the periods presented, a borrower may be counted more than once if the company purchased more than one loan (purchase or refinance mortgage) relating to the same borrower. |
| (2) | Represents single-family loan workouts. These categories are not mutually exclusive and a borrower in one category may also be included in another category in the same period. For the periods presented, a borrower may subsequently go into foreclosure. |
Freddie Mac Third Quarter 2015 Financial Results
November 3, 2015
Page 10
About Freddie Mac’s Conservatorship
Since September 2008, Freddie Mac has been operating under conservatorship, with FHFA as Conservator. The support provided by Treasury pursuant to the Senior Preferred Stock Purchase Agreement (Purchase Agreement) enables the company to maintain access to the debt markets and have adequate liquidity to conduct its normal business operations.
Treasury Draw Requests and Dividend Payments
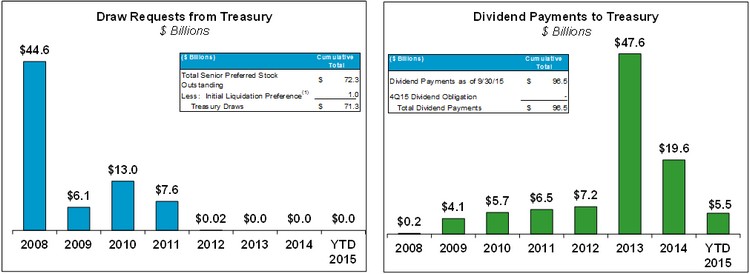
| (1) | The initial $1 billion liquidation preference of senior preferred stock was issued to Treasury in September 2008 as consideration for Treasury’s funding commitment. The company received no cash proceeds as a result of issuing this initial $1 billion liquidation preference of senior preferred stock. |
| | ● | | As a result of the company’s net loss in the third quarter of 2015, Freddie Mac’s total equity declined to $1.3 billion at September 30, 2015. Due to the positive total equity, the company will not request a draw from Treasury under the Purchase Agreement. |
| | ● | | The amount of remaining funding available to Freddie Mac under the Purchase Agreement with Treasury remains unchanged at $140.5 billion, and will be reduced by any future draws. |
| | ● | | Because the company’s net worth as of September 30, 2015 was less than the applicable capital reserve amount for 2015 of $1.8 billion, the company will not have a dividend obligation in December 2015. |
| | ● | | Aggregate cash dividends paid to Treasury totaled $96.5 billion as of September 30, 2015, $25.1 billion more than cumulative cash draws of $71.3 billion received from Treasury through September 30, 2015. |
| | ● | | Treasury still maintains a liquidation preference of $72.3 billion on the company’s senior preferred stock as of September 30, 2015. |
| | ¡ | The payment of dividends does not reduce the outstanding liquidation preference under the Purchase Agreement. |
| | ¡ | Freddie Mac is not permitted to redeem the senior preferred stock prior to the termination of Treasury’s funding commitment under the Purchase Agreement. |
| | - | The limited circumstances under which Treasury’s funding commitment will terminate are described in “NOTE 2: CONSERVATORSHIP AND RELATED MATTERS – Purchase Agreement and Warrant” in the company’s Annual Report onForm 10-K for the year ended December 31, 2014. |
| | ● | | The Purchase Agreement does not allow the company to retain capital in excess of the applicable capital reserve amount. |
| | ¡ | Beginning in 2013, the required quarterly senior preferred stock dividend equals the amount, if any, by which the company’s net worth as of the end of the preceding quarter exceeds the applicable capital reserve amount. |
| | ¡ | The applicable capital reserve amount is $1.8 billion for 2015. It will be reduced by $600 million each year thereafter until it reaches zero on January 1, 2018. |
Freddie Mac Third Quarter 2015 Financial Results
November 3, 2015
Page 11
Additional Information
For more information, including that related to Freddie Mac’s financial results, conservatorship and related matters, see the company’s Quarterly Report on Form 10-Q for the quarter ended September 30, 2015, and the company’s Financial Results Supplement. These documents are available on the Investor Relations page of the company’s Web site at www.FreddieMac.com/investors.
Additional information about Freddie Mac and its business is also set forth in the company’s filings with the SEC, which are available on the Investor Relations page of the company’s Web site at www.FreddieMac.com/investors and the SEC’s Web site at www.sec.gov. Freddie Mac encourages all investors and interested members of the public to review these materials for a more complete understanding of the company’s financial results and related disclosures.
Webcast Announcement
Management will host a conference call at 9 a.m. Eastern Time on November 3, 2015 to discuss the company’s results with the media. The conference call will be concurrently webcast. To access the live audio webcast, use the following link: http://www.visualwebcaster.com/event.asp?id=102915. The replay will be available on the company’s Web site at www.FreddieMac.com/investors for approximately 30 days. All materials related to the call will be available on the Investor Relations page of the company’s Web site at www.FreddieMac.com/investors.
* * * *
This press release contains forward-looking statements, which may include statements pertaining to the conservatorship, the company’s current expectations and objectives for its single-family, investment and multifamily businesses, its loan workout initiatives and other efforts to assist the U.S. residential mortgage market, liquidity, capital management, economic and market conditions and trends, market share, the effect of legislative and regulatory developments and new accounting guidance, credit quality of loans the company owns or guarantees, and results of operations and financial condition on a GAAP, Segment Earnings and fair value basis. Forward-looking statements involve known and unknown risks and uncertainties, some of which are beyond the company’s control. Management’s expectations for the company’s future necessarily involve a number of assumptions, judgments and estimates, and various factors, including changes in market conditions, liquidity, mortgage spreads, credit outlook, actions by the U.S. government (including FHFA, Treasury and Congress), and the impacts of legislation or regulations and new or amended accounting guidance, could cause actual results to differ materially from these expectations. These assumptions, judgments, estimates and factors are discussed in the company’s Annual Report onForm 10-K for the year ended December 31, 2014, Quarterly Reports onForm 10-Q for the quarters ended March 31, 2015, June 30, 2015 and September 30, 2015 and Current Reports onForm 8-K, which are available on the Investor Relations page of the company’s Web site at www.FreddieMac.com/investors and the SEC’s Web site at www.sec.gov. The company undertakes no obligation to update forward-looking statements it makes to reflect events or circumstances occurring after the date of this press release.
Freddie Mac was established by Congress in 1970 to provide liquidity, stability and affordability to the nation’s residential mortgage markets. Freddie Mac supports communities across the nation by providing mortgage capital to lenders. Today Freddie Mac is making home possible for approximately one in four home borrowers and is one of the largest sources of financing for multifamily housing. Additional information is available at FreddieMac.com, Twitter @FreddieMac and Freddie Mac’s blog FreddieMac.com/blog.
# # #
FREDDIE MAC
CONSOLIDATED STATEMENTS OF COMPREHENSIVE INCOME
(UNAUDITED)
| | | | | | | | |
| | | Three Months Ended | |
| | | September 30, 2015 | | | June 30, 2015 | |
| | | (in millions, except share-related amounts) | |
Interest income | | | | | | | | |
Mortgage loans: | | | | | | | | |
Held by consolidated trusts | | $ | 14,032 | | | $ | 13,730 | |
Unsecuritized | | | 1,563 | | | | 1,654 | |
| | | | | | | | |
Total mortgage loans | | | 15,595 | | | | 15,384 | |
Investments in securities | | | 1,145 | | | | 1,256 | |
Other | | | 19 | | | | 15 | |
| | | | | | | | |
Total interest income | | | 16,759 | | | | 16,655 | |
| | | | | | | | |
Interest expense | | | | | | | | |
Debt securities of consolidated trusts | | | (11,364 | ) | | | (11,005 | ) |
Other debt: | | | | | | | | |
Short-term debt | | | (40 | ) | | | (36 | ) |
Long-term debt | | | (1,559 | ) | | | (1,587 | ) |
| | | | | | | | |
Total interest expense | | | (12,963 | ) | | | (12,628 | ) |
Expense related to derivatives | | | (53 | ) | | | (58 | ) |
| | | | | | | | |
Net interest income | | | 3,743 | | | | 3,969 | |
Benefit for credit losses | | | 528 | | | | 857 | |
| | | | | | | | |
Net interest income after benefit for credit losses | | | 4,271 | | | | 4,826 | |
| | | | | | | | |
Non-interest income (loss) | | | | | | | | |
Gains (losses) on extinguishment of debt securities of consolidated trusts | | | (5 | ) | | | (54 | ) |
Gains (losses) on retirement of other debt | | | 9 | | | | (26 | ) |
Derivative gains (losses) | | | (4,172 | ) | | | 3,135 | |
Impairment of available-for-sale securities: | | | | | | | | |
Total other-than-temporary impairment of available-for-sale securities | | | (38 | ) | | | (77 | ) |
Portion of other-than-temporary impairment recognized in AOCI | | | (16 | ) | | | (21 | ) |
| | | | | | | | |
Net impairment of available-for-sale securities recognized in earnings | | | (54 | ) | | | (98 | ) |
Other gains (losses) on investment securities recognized in earnings | | | 256 | | | | 152 | |
Other income (loss) | | | 125 | | | | (568 | ) |
| | | | | | | | |
Non-interest income (loss) | | | (3,841 | ) | | | 2,541 | |
| | | | | | | | |
Non-interest expense | | | | | | | | |
Salaries and employee benefits | | | (231 | ) | | | (279 | ) |
Professional services | | | (130 | ) | | | (118 | ) |
Occupancy expense | | | (14 | ) | | | (14 | ) |
Other administrative expense | | | (90 | ) | | | (90 | ) |
| | | | | | | | |
Total administrative expense | | | (465 | ) | | | (501 | ) |
Real estate owned operations expense | | | (116 | ) | | | (52 | ) |
Temporary Payroll Tax Cut Continuation Act of 2011 expense | | | (248 | ) | | | (235 | ) |
Other expense | | | (270 | ) | | | (501 | ) |
| | | | | | | | |
Non-interest expense | | | (1,099 | ) | | | (1,289 | ) |
| | | | | | | | |
Income (loss) before income tax benefit (expense) | | | (669 | ) | | | 6,078 | |
Income tax benefit (expense) | | | 194 | | | | (1,909 | ) |
| | | | | | | | |
Net income (loss) | | | (475 | ) | | | 4,169 | |
| | | | | | | | |
Other comprehensive income (loss), net of taxes and reclassification adjustments: | | | | | | | | |
Changes in unrealized gains (losses) related to available-for-sale securities | | | (61 | ) | | | (314 | ) |
Changes in unrealized gains (losses) related to cash flow hedge relationships | | | 35 | | | | 38 | |
Changes in defined benefit plans | | | — | | | | 20 | |
| | | | | | | | |
Total other comprehensive income (loss), net of taxes and reclassification adjustments | | | (26 | ) | | | (256 | ) |
| | | | | | | | |
Comprehensive income (loss) | | $ | (501 | ) | | $ | 3,913 | |
| | | | | | | | |
Net income (loss) | | $ | (475 | ) | | $ | 4,169 | |
Undistributed net worth sweep and senior preferred stock dividends | | | — | | | | (3,913 | ) |
| | | | | | | | |
Net income (loss) attributable to common stockholders | | $ | (475 | ) | | $ | 256 | |
| | | | | | | | |
Net income (loss) per common share—basic and diluted | | $ | (0.15 | ) | | $ | 0.08 | |
Weighted average common shares outstanding (in millions)—basic and diluted | | | 3,234 | | | | 3,234 | |
FREDDIE MAC
CONSOLIDATED BALANCE SHEETS
(UNAUDITED)
| | | | | | | | |
| | | September 30, 2015 | | | December 31, 2014 | |
| | | (in millions, except share-related amounts) | |
Assets | | | | | | | | |
Cash and cash equivalents (includes $0 and $2, respectively, related to our consolidated VIEs) | | $ | 5,000 | | | $ | 10,928 | |
Restricted cash and cash equivalents (includes $15,104 and $8,532, respectively, related to our consolidated VIEs) | | | 15,108 | | | | 8,535 | |
Federal funds sold and securities purchased under agreements to resell (includes $11,815 and $13,500, respectively, related to our consolidated VIEs) | | | 38,738 | | | | 51,903 | |
Investments in securities: | | | | | | | | |
Available-for-sale, at fair value (includes $0 and $9, respectively, pledged as collateral that may be repledged) | | | 81,573 | | | | 106,550 | |
Trading, at fair value (includes $2,455 and $1,884, respectively, pledged as collateral that may be repledged) | | | 35,806 | | | | 30,437 | |
| | | | | | | | |
Total investments in securities | | | 117,379 | | | | 136,987 | |
Mortgage loans: | | | | | | | | |
Held-for-investment, at amortized cost: | | | | | | | | |
By consolidated trusts (net of allowances for loan losses of $3,051 and $2,884, respectively) | | | 1,615,291 | | | | 1,558,094 | |
Unsecuritized (net of allowances for loan losses of $13,368 and $18,877, respectively) | | | 106,723 | | | | 130,118 | |
| | | | | | | | |
Total held-for-investment mortgage loans, net | | | 1,722,014 | | | | 1,688,212 | |
Held-for-sale, at lower-of-cost-or-fair-value (includes $20,880 and $12,130 at fair value, respectively) | | | 27,853 | | | | 12,368 | |
| | | | | | | | |
Total mortgage loans, net | | | 1,749,867 | | | | 1,700,580 | |
Accrued interest receivable (includes $5,242 and $5,124, respectively, related to our consolidated VIEs) | | | 6,052 | | | | 6,034 | |
Derivative assets, net | | | 605 | | | | 822 | |
Real estate owned, net (includes $34 and $44, respectively, related to our consolidated VIEs) | | | 1,795 | | | | 2,558 | |
Deferred tax assets, net | | | 17,817 | | | | 19,498 | |
Other assets (includes $2,810 and $2,596, respectively, related to our consolidated VIEs) | | | 9,786 | | | | 7,694 | |
| | | | | | | | |
Total assets | | $ | 1,962,147 | | | $ | 1,945,539 | |
| | | | | | | | |
Liabilities and equity | | | | | | | | |
Liabilities | | | | | | | | |
Accrued interest payable (includes $4,743 and $4,702, respectively, related to our consolidated VIEs) | | $ | 6,135 | | | $ | 6,325 | |
Debt, net: | | | | | | | | |
Debt securities of consolidated trusts held by third parties (includes $131 and $42 at fair value, respectively) | | | 1,539,108 | | | | 1,479,473 | |
Other debt (includes $7,379 and $5,820 at fair value, respectively) | | | 408,281 | | | | 450,069 | |
| | | | | | | | |
Total debt, net | | | 1,947,389 | | | | 1,929,542 | |
Derivative liabilities, net | | | 1,670 | | | | 1,963 | |
Other liabilities (includes $15 and $1, respectively, related to our consolidated VIEs) | | | 5,654 | | | | 5,058 | |
| | | | | | | | |
Total liabilities | | | 1,960,848 | | | | 1,942,888 | |
| | | | | | | | |
Commitments and contingencies | | | | | | | | |
Equity | | | | | | | | |
Senior preferred stock, at redemption value | | | 72,336 | | | | 72,336 | |
Preferred stock, at redemption value | | | 14,109 | | | | 14,109 | |
Common stock, $0.00 par value, 4,000,000,000 shares authorized, 725,863,886 shares issued and 650,045,962 shares and 650,043,899 shares outstanding, respectively | | | — | | | | — | |
Additional paid-in capital | | | — | | | | — | |
Retained earnings (accumulated deficit) | | | (82,931 | ) | | | (81,639 | ) |
AOCI, net of taxes, related to: | | | | | | | | |
Available-for-sale securities (includes $813 and $839, respectively, related to net unrealized gains on securities for which other-than-temporary impairment has been recognized in earnings) | | | 2,328 | | | | 2,546 | |
Cash flow hedge relationships | | | (671 | ) | | | (803 | ) |
Defined benefit plans | | | 13 | | | | (13 | ) |
| | | | | | | | |
Total AOCI, net of taxes | | | 1,670 | | | | 1,730 | |
Treasury stock, at cost, 75,817,924 shares and 75,819,987 shares, respectively | | | (3,885 | ) | | | (3,885 | ) |
| | | | | | | | |
Total equity | | | 1,299 | | | | 2,651 | |
| | | | | | | | |
Total liabilities and equity | | $ | 1,962,147 | | | $ | 1,945,539 | |
| | | | | | | | |