Exhibit 99.1
| | | | |
| | News Release | | For Immediate Release //February 18, 2016 |
Freddie Mac Reports Net Income of $6.4 Billion for Full-Year 2015;
Comprehensive Income of $5.8 Billion
Company Returns an Additional $5.5 Billion to Taxpayers in 2015
| | | | |
| | | | | |
Full-Year and Fourth Quarter 2015 Results Full-Year: 2015 marks the fourth consecutive year of positive earnings, driven by solid net interest income of $14.9 billion, up 5 percent, despite mandated reduction in mortgage-related investments portfolio. • Approximately 45 percent of net interest income for the full-year 2015 was derived from management and guarantee fees. • Market-related items created quarterly volatility but had minimal effect on full-year 2015 results. Full-year interest rate movements resulted in a $0.2 billion (after-tax) estimated loss and spread widening resulted in a $0.1 billion (after-tax) estimated loss. Fourth Quarter: Positive comprehensive income of $1.6 billion driven by solid net interest income. | | | | Net Income 2015 = $6.4B / 4Q = $2.2B |
| | | |
| | | Comprehensive Income 2015 = $5.8B / 4Q = $1.6B |
| | | |
| | | Treasury Dividend 2015 = $5.5B / 1Q16 = $1.7B |
| | | |
| | | |
| | | |
| | | | |
2015 Business Highlights | | | | |
Business Fundamentals Were Strong and Continued to Improve Single-Family Guarantee Business • Purchase volume of $351 billion, up 38 percent from 2014 • Core (post-2008) book grew to 66 percent of credit guarantee portfolio; HARP and other relief refinance loans represented an additional 18 percent Multifamily Business • Purchase volume of $47.3 billion, up 67 percent from 2014 and consistent with the production cap Reduced Taxpayer Exposure by Transferring Credit Risk to the Private Markets Single-Family Guarantee Business • Transferred a portion of credit risk on approximately $180 billion of mortgages, up from nearly $150 billion in 2014 Multifamily Business • More than 90 percent of mortgage loans purchased were designated for securitization, comparable to 2014 Continued Reduction of Legacy Assets Single-Family Guarantee Business • Legacy book declined to 16 percent of credit guarantee portfolio from 20 percent in 2014 • Serious delinquency rate of 1.32 percent, down from 1.88 percent at the end of 2014 • Completed $2.9 billion of non-performing loan sales, up from $0.6 billion in 2014 Investments Business • Sold $11 billion of non-agency mortgage-related securities, compared to $14 billion in 2014 Strong Housing Market Support – Helping Families Buy, Rent or Keep Their Homes • Provided $402 billion in liquidity in 2015, $2.9 trillion since 2009 – funding 12.5 million single-family homes and 2.7 million multifamily rental units • Helped nearly 1.2 million borrowers avoid foreclosure since 2009 $98.2 Billion Returned to Taxpayers Through Dividend Payments, Including $1.7 Billion March 2016 Obligation • Senior preferred stock held by Treasury remains $72.3 billion • Available funding under the Purchase Agreement remains $140.5 billion | | | | “2015 marked another year of solid financial performance for Freddie Mac - our fourth straight year of profitability, although we did experience significant quarterly market-related earnings volatility. Our performance was driven by our progress in building a better Freddie Mac, as evidenced by continued growth in purchase volumes in the guarantee businesses, including a multifamily record for the company. We’re also building a better housing finance system by expanding credit risk transfer and efficiently disposing of legacy assets, and so reducing taxpayer exposure to mortgage risk. “The mortgage markets have strong momentum going into 2016, and we continue to focus on serving our customers better and fulfilling our mission to support the housing needs of owners and renters nationwide, including responsibly expanding access to mortgage credit.” Donald H. Layton Chief Executive Officer |
Freddie Mac Fourth Quarter 2015 Financial Results
February 18, 2016
Page 2
McLean, VA — Freddie Mac (OTCQB: FMCC) today reported net income of $6.4 billion for the full-year 2015, compared to net income of $7.7 billion for the full-year 2014. The company also reported comprehensive income of $5.8 billion for the full-year 2015, compared to comprehensive income of $9.4 billion for the full-year 2014.
Summary Consolidated Statements of Comprehensive Income (Loss) (1)
| | | | | | | | | | | | | | | | | | | | | | | | | | |
| | | | | Three Months Ended | | | Full-Year | |
| ($ Millions) | | 12/31/15 | | | 9/30/15 | | | Change | | | 2015 | | | 2014 | | | Change | |
1 | | Net interest income | | $ | 3,587 | | | $ | 3,743 | | | $ | (156 | ) | | $ | 14,946 | | | $ | 14,263 | | | $ | 683 | |
2 | | Benefit (provision) for credit losses | | | 781 | | | | 528 | | | | 253 | | | | 2,665 | | | | (58 | ) | | | 2,723 | |
3 | | Derivative gains (losses) | | | 744 | | | | (4,172 | ) | | | 4,916 | | | | (2,696 | ) | | | (8,291 | ) | | | 5,595 | |
4 | | Other non-interest income (loss) | | | (896 | ) | | | 331 | | | | (1,227 | ) | | | (903 | ) | | | 8,178 | | | | (9,081 | ) |
| | | | | | | | | | | | | | | | | | | | | | | | | | |
5 | | Non-interest income (loss) | | | (152 | ) | | | (3,841 | ) | | | 3,689 | | | | (3,599 | ) | | | (113 | ) | | | (3,486 | ) |
6 | | Administrative expenses | | | (510 | ) | | | (465 | ) | | | (45 | ) | | | (1,927 | ) | | | (1,881 | ) | | | (46 | ) |
7 | | REO operations expense | | | (95 | ) | | | (116 | ) | | | 21 | | | | (338 | ) | | | (196 | ) | | | (142 | ) |
8 | | Other non-interest expense | | | (534 | ) | | | (518 | ) | | | (16 | ) | | | (2,473 | ) | | | (1,013 | ) | | | (1,460 | ) |
| | | | | | | | | | | | | | | | | | | | | | | | | | |
9 | | Non-interest expense | | | (1,139 | ) | | | (1,099 | ) | | | (40 | ) | | | (4,738 | ) | | | (3,090 | ) | | | (1,648 | ) |
10 | | Pre-tax income (loss) | | | 3,077 | | | | (669 | ) | | | 3,746 | | | | 9,274 | | | | 11,002 | | | | (1,728 | ) |
11 | | Income tax (expense) benefit | | | (919 | ) | | | 194 | | | | (1,113 | ) | | | (2,898 | ) | | | (3,312 | ) | | | 414 | |
| | | | | | | | | | | | | | | | | | | | | | | | | | |
12 | | Net income (loss) | | $ | 2,158 | | | $ | (475 | ) | | $ | 2,633 | | | $ | 6,376 | | | $ | 7,690 | | | $ | (1,314 | ) |
13 | | Total other comprehensive income (loss) | | | (517 | ) | | | (26 | ) | | | (491 | ) | | | (577 | ) | | | 1,736 | | | | (2,313 | ) |
| | | | | | | | | | | | | | | | | | | | | | | | | | |
14 | | Comprehensive income (loss) | | $ | 1,641 | | | $ | (501 | ) | | $ | 2,142 | | | $ | 5,799 | | | $ | 9,426 | | | $ | (3,627 | ) |
| | | | | | | | | | | | | | | | | | | | | | | | | | |
| | | | | | | | | | | | | | | | | | | | | | | | | | | |
| (1) | Columns and rows may not add due to rounding. |
Financial Results Discussion
Full-Year 2015 Financial Results – Freddie Mac’s 2015 net income of $6.4 billion and comprehensive income of $5.8 billion declined $1.3 billion and $3.6 billion, respectively, from 2014. The decline in the company’s full-year 2015 results was primarily driven by lower settlement income from non-agency mortgage-related securities litigation in 2015. Two market-related items also continued to create volatility:
| | ● | | Net Interest Rate Effect: $0.2 billion (after-tax) estimated fair value loss for the full-year 2015, compared to a $2.3 billion (after-tax) estimated fair value loss for the full-year 2014 as interest rates declined less in 2015 compared to 2014. (SeeNet Interest Rate Effect table for additional details.) |
| | ● | | Spread Change Effect: $0.1 billion (after-tax) estimated loss for the full-year 2015 due to the impact of spread widening on certain mortgage loans and mortgage-related securities measured at fair value, compared to a $2.0 billion (after-tax) estimated gain for the full-year 2014 as spreads tightened. |
| | ● | | Additionally, Freddie Mac continues to sell non-performing single-family mortgage loans and reclassified $13.6 billion in unpaid principal balance (UPB) of loans from held-for-investment to held-for-sale in the full-year 2015. An insignificant number of loans were reclassified in 2014. |
| | ¡ | The reclassification of these loans and other related subsequent activity affected various financial statement line items and, on a net basis, had a minimal impact in the full-year 2014 and generated a pre-tax loss of $0.7 billion in the full-year 2015. The company believes these transactions, which reduce legacy risk, are economically beneficial. |
Fourth Quarter 2015 Financial Results – The company’s fourth quarter net income of $2.2 billion and comprehensive income of $1.6 billion increased $2.6 billion and $2.1 billion, respectively, from third quarter 2015. The increase in the company’s results was primarily driven by improvement in two market-related items:
| | ● | | Net Interest Rate Effect: $0.3 billion (after-tax) estimated fair value gain for the fourth quarter of 2015 as interest rates increased, compared to a $1.4 billion (after-tax) estimated fair value loss for the third quarter 2015 as interest rates decreased. (SeeNet Interest Rate Effect table for additional details.) |
Freddie Mac Fourth Quarter 2015 Financial Results
February 18, 2016
Page 3
| | ● | | Spread Change Effect: $0.3 billion (after-tax) estimated fourth quarter 2015 loss, compared to a $0.6 billion (after-tax) estimated loss for the third quarter of 2015, as spreads on certain mortgage loans and mortgage-related securities measured at fair value widened less in the fourth quarter than in the third quarter. |
| | ● | | Freddie Mac reclassified $2.5 billion and $3.0 billion in UPB of non-performing single-family mortgage loans from held-for-investment to held-for-sale in the third and fourth quarters of 2015, respectively. |
| | ¡ | The reclassification of these loans and other related subsequent activity affected various financial statement line items and, on a net basis, had a minimal impact on the third quarter of 2015 and generated a pre-tax loss of $0.3 billion in the fourth quarter of 2015. The company believes these transactions, which reduce legacy risk, are economically beneficial. |
Net Interest Rate Effect (1)
| | | | | | | | | | | | | | | | | | | | | | | | | | |
| | | | | Three Months Ended | | | Full-Year | |
| ($ Billions) | | 12/31/15 | | | 9/30/15 | | | Change | | | 2015 | | | 2014 | | | Change | |
Components of Derivative Gains (Losses) | | | | | | | | | | | | | | | | | | | | | | | | |
| 1 | | Derivative Gains (Losses) | | $ | 0.7 | | | $ | (4.2 | ) | | $ | 4.9 | | | $ | (2.7 | ) | | $ | (8.3 | ) | | $ | 5.6 | |
| 2 | | Less: Accrual of Periodic Cash Settlements | | | (0.6 | ) | | | (0.5 | ) | | | (0.0 | ) | | $ | (2.2 | ) | | | (2.6 | ) | | | 0.4 | |
| | | | | | | | | | | | | | | | | | | | | | | | | | |
| 3 | | Derivative Fair Value Changes | | $ | 1.3 | | | $ | (3.6 | ) | | $ | 4.9 | | | $ | (0.5 | ) | | $ | (5.7 | ) | | $ | 5.2 | |
| | | | | | | | | | | | | | | | | | | | | | | | | | |
Estimated Net Interest Rate Effect | | | | | | | | | | | | | | | | | | | | | | | | |
| 4 | | Interest Rate Effect on Derivative Fair Values | | $ | 1.3 | | | $ | (3.6 | ) | | $ | 4.9 | | | $ | (0.5 | ) | | $ | (5.5 | ) | | $ | 5.1 | |
| 5 | | Estimate of Offsetting Interest Rate Effect Related to Financial Instruments Measured at Fair Value | | | (0.9 | ) | | | 1.5 | | | | (2.3 | ) | | | 0.2 | | | | 2.0 | | | | (1.8 | ) |
| 6 | | Income Tax Benefit (Expense) - @ 35% | | | (0.1 | ) | | | 0.7 | | | | (0.9 | ) | | | 0.1 | | | | 1.2 | | | | (1.2 | ) |
| | | | | | | | | | | | | | | | | | | | | | | | | | |
| 7 | | Estimated Net Effect on Comprehensive Income (4+5+6) | | $ | 0.3 | | | $ | (1.4 | ) | | $ | 1.6 | | | $ | (0.2 | ) | | $ | (2.3 | ) | | $ | 2.1 | |
| | | | | | | | | | | | | | | | | | | | | | | | | | |
| | | | | | | | | | | | | | | | | | | | | | | | | | | |
| (1) | Columns and rows may not add due to rounding. |
Selected Financial Highlights
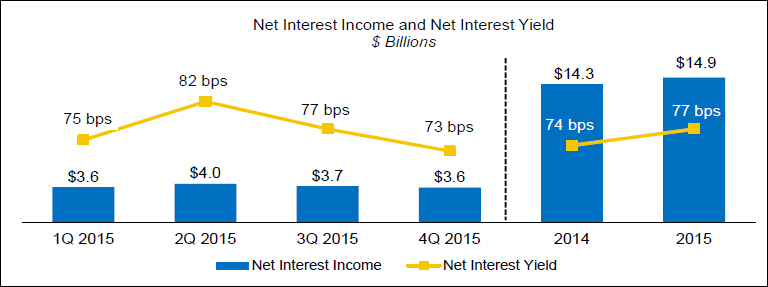
Net interest income was $14.9 billion for the full-year 2015, an increase of $683 million from the full-year 2014. Net interest yield was 77 basis points for the full-year 2015, an increase of 3 basis points from the full-year 2014.
Freddie Mac Fourth Quarter 2015 Financial Results
February 18, 2016
Page 4
| | ● | | The increases in both net interest income and net interest yield primarily reflect higher amortization income driven by increased prepayments during 2015. |
| | ● | | Approximately 45 percent, or $6.6 billion, of net interest income for the full-year 2015 was derived from management and guarantee fees, up from approximately 35 percent for the full-year 2014. |
Net interest income for the fourth quarter of 2015 was $3.6 billion, a decrease of $156 million from the third quarter of 2015. Net interest yield was 73 basis points for the fourth quarter of 2015, a decrease of 4 basis points from the third quarter of 2015.
| | ● | | The decreases in both net interest income and net interest yield primarily reflect lower amortization income due to lower prepayments during the fourth quarter and a decline in the balance of higher-yielding mortgage-related assets due to continued liquidations. |
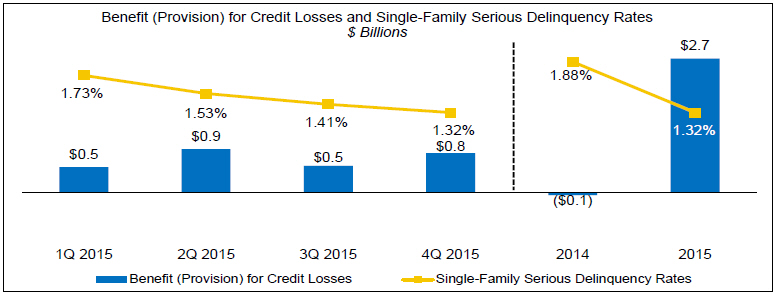
Benefit for credit losses was $2.7 billion for the full-year 2015, a shift from a provision for credit losses of $58 million for the full-year 2014.
| | ● | | The shift to a benefit was primarily due to the reclassification of certain seriously delinquent single-family loans from held-for-investment to held-for-sale. Freddie Mac reclassified $13.6 billion in UPB of such loans in 2015, while an insignificant number of loans were reclassified in 2014. |
| | ● | | Freddie Mac’s single-family serious delinquency rate continued to improve in 2015, primarily due to better performance of newly acquired loans in the Core single-family book, continued loss mitigation and foreclosure activities for loans in the Legacy single-family book and sales of certain non-performing loans. |
Benefit for credit losses was $781 million for the fourth quarter of 2015, an increase of $253 million from the third quarter of 2015.
| | ● | | The increase primarily reflects an improvement in loss severity and default probability. |
Freddie Mac Fourth Quarter 2015 Financial Results
February 18, 2016
Page 5
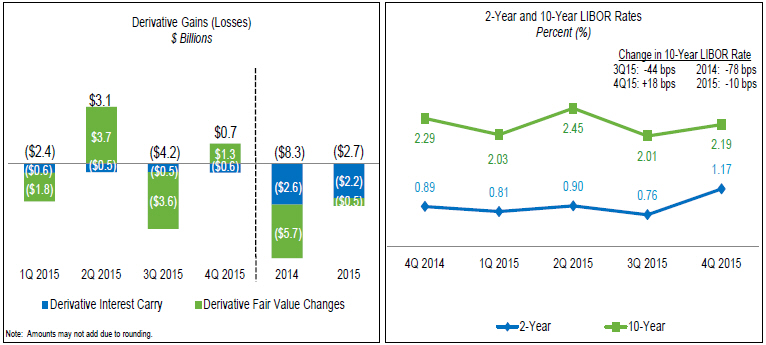
Derivative losses for the full-year 2015 were $2.7 billion, a decrease of $5.6 billion from the full-year 2014.
| | ● | | The decrease in derivative losses in the full-year 2015 was driven by a smaller decline in interest rates during 2015 versus 2014. |
| | ● | | Derivative gains (losses) include both fair value changes and derivative interest carry (i.e., accrual of periodic cash settlements). |
| | ¡ | Fair value changes were a loss of $498 million in the full-year 2015, a decrease in losses of $5.2 billion from the full-year 2014. |
| | ¡ | Derivative interest carry, which is economically equivalent to interest expense, was an expense of $2.2 billion for the full-year 2015, a decrease of $427 million from the full-year 2014. |
Derivative gains were $744 million for the fourth quarter of 2015, a shift from derivative losses of $4.2 billion in the third quarter of 2015.
| | ● | | The shift was primarily driven by an increase in long-term interest rates during the fourth quarter of 2015 versus a decrease in these rates during the third quarter of 2015. |
Freddie Mac Fourth Quarter 2015 Financial Results
February 18, 2016
Page 6
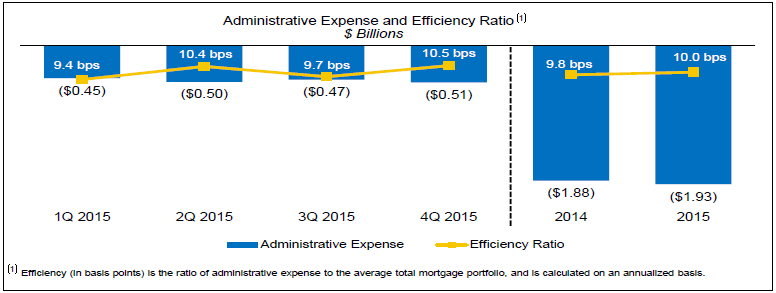
Administrative expense was $1.9 billion (10.0 basis points) for the full-year 2015, an increase of $46 million from the full-year 2014.
| | ● | | The increase was mostly driven by costs associated with the FHFA-mandated termination of the company’s pension plans in 2015. |
Variability of Earnings
Freddie Mac’s financial results are subject to significant earnings variability from period to period. This variability is primarily driven by:
| | ● | | Interest-Rate Volatility – Freddie Mac holds assets and liabilities that expose it to interest-rate risk. Through its use of derivatives, the company manages its exposure to interest-rate risk on an economic basis to a low level as measured by the company’s models. However, the way the company accounts for its financial assets and liabilities (i.e., some are measured at amortized cost, while others are measured at fair value), including derivatives, creates volatility in the company’s earnings when interest rates fluctuate. Based upon the composition of its financial assets and liabilities, including derivatives, at December 31, 2015, the company generally recognizes fair value losses in earnings when interest rates decline. This volatility generally is not indicative of the underlying economics of its business. This volatility and the declining capital reserve required under the terms of the Purchase Agreement (ultimately reaching zero in 2018) will increase the risk of the company having a negative net worth and being required to draw from Treasury. The company is exploring ways in which it can limit or manage its exposure to this volatility. |
| | ● | | Spread Volatility – Spread volatility (i.e., credit spreads, liquidity spreads, risk premiums, etc.), or option-adjusted spreads, is the risk associated with changes in interest rates in excess of benchmark rates. Freddie Mac holds assets and liabilities that expose it to spread volatility, which may contribute to significant earnings volatility. For financial assets and liabilities measured at fair value, the company generally recognizes fair value losses when spreads widen. However, the company may enter into transactions or take other steps to limit or manage its exposure to spread volatility. |
| | ● | | Non-Recurring Events – From time to time, Freddie Mac has experienced and will likely continue to experience significant earnings volatility from non-recurring events, including events such as settlements with counterparties and changes in certain valuation allowances. |
Segment Financial Results and Business Highlights
Freddie Mac’s operations consist of three reportable segments, which are based on the types of business activities they perform — Single-family Guarantee, Multifamily and Investments. Certain activities that are not part of a reportable segment are included in the All Other category.
Freddie Mac Fourth Quarter 2015 Financial Results
February 18, 2016
Page 7
Summary of Segment Earnings (Loss) and Comprehensive Income (Loss)(1)(2)
| | | | | | | | | | | | | | | | | | | | | | | | | | |
| | | | | Three Months Ended | | | Full-Year | |
| ($ Millions) | | 12/31/15 | | | 9/30/15 | | | Change | | | 2015 | | | 2014 | | | Change | |
| | Segment Earnings (loss), net of taxes | | | | | | | | | | | | | | | | | | | | | | | | |
1 | | Single-family Guarantee | | $ | 638 | | | $ | 591 | | | $ | 47 | | | $ | 1,778 | | | $ | 1,547 | | | $ | 231 | |
2 | | Multifamily | | | 173 | | | | (103 | ) | | | 276 | | | $ | 827 | | | $ | 1,636 | | | $ | (809 | ) |
3 | | Investments | | | 1,347 | | | | (963 | ) | | | 2,310 | | | $ | 3,771 | | | $ | 4,520 | | | $ | (749 | ) |
4 | | All Other | | | — | | | | — | | | | — | | | $ | — | | | $ | (13 | ) | | $ | 13 | |
| | | | | | | | | | | | | | | | | | | | | | | | | | |
5 | | Total Segment Earnings (loss), net of taxes | | $ | 2,158 | | | $ | (475 | ) | | $ | 2,633 | | | $ | 6,376 | | | $ | 7,690 | | | $ | (1,314 | ) |
| | | | | | | | | | | | | | | | | | | | | | | | | | |
| | Comprehensive income (loss) of segments | | | | | | | | | | | | | | | | | | | | | | | | |
6 | | Single-family Guarantee | | $ | 651 | | | $ | 591 | | | $ | 60 | | | $ | 1,790 | | | $ | 1,537 | | | $ | 253 | |
7 | | Multifamily | | | 20 | | | | (84 | ) | | | 104 | | | $ | 566 | | | $ | 1,459 | | | $ | (893 | ) |
8 | | Investments | | | 969 | | | | (1,008 | ) | | | 1,977 | | | $ | 3,415 | | | $ | 6,471 | | | $ | (3,056 | ) |
9 | | All Other | | | 1 | | | | — | | | | 1 | | | $ | 28 | | | $ | (41 | ) | | $ | 69 | |
| | | | | | | | | | | | | | | | | | | | | | | | | | |
10 | | Comprehensive income (loss) of segments | | $ | 1,641 | | | $ | (501 | ) | | $ | 2,142 | | | $ | 5,799 | | | $ | 9,426 | | | $ | (3,627 | ) |
| | | | | | | | | | | | | | | | | | | | | | | | | | |
| | | | | | | | | | | | | | | | | | | | | | | | | | | |
| (1) | Columns and rows may not add due to rounding. |
| (2) | The financial performance of the company’s Single-family Guarantee segment is measured based on its contribution to GAAP net income (loss). The financial performance of the company’s Investments segment and Multifamily segment are measured based on each segment’s contribution to GAAP comprehensive income (loss). |
Single-family Guarantee Segment
Providing liquidity to the U.S. housing market while continuing to transfer credit risk to the private market
| | ● | | Single-family Guarantee segment earnings were $1.8 billion for the full-year 2015, an increase of $231 million from the full-year 2014. The increase was primarily driven by higher management and guarantee fee income due to higher amortization of upfront fees resulting from higher loan liquidations and lower provision for credit losses due to decreases in newly-impaired single-family mortgage loans, partially offset by the net effect of mortgage loan reclassifications and other related subsequent activity in 2015. |
| | ● | | Core book continued to grow and was 66 percent of single-family credit guarantee portfolio at December 31, 2015. |
| | ¡ | HARP and other relief refinance loans were an additional 18 percent. |
| | ¡ | Legacy book declined to 16 percent. |
| | ● | | Average management and guarantee fees charged on new acquisitions were 44.2 basis points (net of legislated 10 basis point guarantee fee remitted to Treasury as part of the Temporary Payroll Tax Cut Continuation Act of 2011) in the full-year 2015, down from 47.4 basis points in the full-year 2014. |
| | ● | | Single-family serious delinquency rate continued to decline and was 1.32 percent at December 31, 2015, the lowest since September 2008. |
| | ● | | Completed sales of $2.9 billion in UPB of non-performing unsecuritized single-family loans during the full-year 2015, an increase of $2.3 billion from the full-year 2014. |
| | ● | | Completed credit risk transfer transactions during the full-year 2015 that, upon initial execution, covered $181.2 billion in principal of the mortgage loans in the Core book. |
Freddie Mac Fourth Quarter 2015 Financial Results
February 18, 2016
Page 8
Multifamily Segment
Providing financing for workforce housing and transferring credit risk to private investors
| | ● | | Multifamily segment comprehensive income was $566 million for the full-year 2015, a decrease of $893 million from the full-year 2014. The decrease was primarily driven by spread widening in the commercial mortgage backed securities market during 2015. |
| | ● | | New purchase volume of $47.3 billion in the full-year 2015, an increase of $19.0 billion from the full-year 2014. |
| | ¡ | The full year 2015 new multifamily business activity (excluding certain targeted loan types) was subject to a production cap of $30.0 billion in UPB based on FHFA’s 2015 Conservatorship Scorecard. |
| | - | In May 2015, FHFA expanded the affordable housing categories that were excluded from the 2015 production cap. |
| | ¡ | Approximately 63 percent of the $47.3 billion in new business activity for the full-year 2015 counted towards the 2015 production cap, while the remaining 37 percent was uncapped. |
| | ¡ | Provided workforce housing through new initiatives such as purchases of $2.6 billion of small balance loans and $1.0 billion of manufactured housing community loans. |
| | ● | | Continuing the company’s focus on transferring credit risk to private investors, more than 90 percent of the new multifamily mortgage loans purchased in the full-year 2015 were designated for subsequent securitization intoK-deals and other similar types of transactions. |
| | ¡ | Sold $36.1 billion of multifamily mortgage loans through 29K-deal offerings and nine small balance loan securitizations in the full-year 2015. |
| | ¡ | Resecuritized $3.4 billion of less liquid non-agency mortgage-related securities, transferring a portion of the credit risk to private investors. |
| | ● | | Multifamily delinquency rate remained very low at two basis points at December 31, 2015, reflecting continued strong portfolio performance. |
| | ● | | Provided financing for more than 650,000 rental units in the full-year 2015. Nearly 90 percent of the eligible units financed are affordable to families earning low to median incomes. |
Investments Segment
Reducing less liquid assets using an economically sensible approach
| | ● | | Investments segment comprehensive income was $3.4 billion for the full-year 2015, a decrease of $3.1 billion from the full-year 2014. The decrease was primarily driven by lower settlement income related to non-agency mortgage-related securities litigation and lower fair value gains on non-agency mortgage-related securities, partially offset by lower derivative losses as interest rates declined less in 2015 than in 2014. |
| | ● | | Continued to actively reduce the balance of the company’s mortgage-related investments portfolio, focusing on reducing the balance of less liquid assets. Investments segment less liquid assets were $100.9 billion at December 31, 2015, down $26.0 billion, or 21 percent, from December 31, 2014, due to ongoing portfolio liquidations and: |
| | ¡ | Sales of $11.4 billion of non-agency mortgage-related securities. |
| | ¡ | Securitization of $8.2 billion of single-family reperforming and modified loans. |
| | ● | | The Investments segment securitization pipeline assets, which represent the company’s performing single-family loans purchased for cash and held until securitized, were $10.0 billion at December 31, 2015, up $2.5 billion from December 31, 2014. |
| | ● | | Continued to maintain a presence in the agency mortgage-related securities market. Liquid assets held by the Investments segment were $148.8 billion at December 31, 2015, down $18.4 billion from December 31, 2014. |
| | ● | | Managed the company’s interest-rate risk on an economic basis to a low level as measured by its models. |
| | ¡ | Duration gap averaged near zero months for the full-year 2015. |
Freddie Mac Fourth Quarter 2015 Financial Results
February 18, 2016
Page 9
Housing Market Support
Freddie Mac supports the U.S. housing market by executing its community mission to ensure credit availability for new and refinanced mortgages as well as rental housing and helping struggling homeowners avoid foreclosure. Since the beginning of 2009, Freddie Mac has helped approximately 12.5 million American families own or rent a home and nearly 1.2 million families avoid foreclosure.
Providing Liquidity – Freddie Mac provides access to financing for new and refinanced mortgages and rental housing. In 2015, the company:
| | ● | | Provided $402.0 billion in liquidity to the market mostly through its purchases of loans, funding approximately 1.6 million single-family homes and more than 650,000 multifamily rental units. |
| | ● | | Purchased refinance loans of $197.7 billion which accounted for 56 percent of the company’s single-family mortgage purchase volume. |
Freddie Mac made significant progress on several fronts in 2015 to responsibly increase access to housing finance for America’s families. To reach more borrowers, the company expanded and diversified its lender base and introduced new product offerings to meet their needs – namely the company’s three percent down mortgage Home Possible AdvantageSM. The company also entered into partnerships with state housing finance agencies and expanded industry and lender alliances. For renters, the company significantly grew its Small Balance Loan program that funds smaller rental properties and introduced a new program to finance manufactured housing communities. Making housing more accessible and affordable for borrowers and renters continues to be a top priority for Freddie Mac in 2016.
Market Liquidity Provided(1)
| | | | | | | | | | | | | | | | | | | | | | | | | | | | | | | | | | |
| ($ Billions) | | 2009 | | | 2010 | | | 2011 | | | 2012 | | | 2013 | | | 2014 | | | 2015 | | | Cumulative
Total | |
1 | | Single-family purchases or issuances(1) | | $ | 483 | | | $ | 390 | | | $ | 321 | | | $ | 427 | | | $ | 423 | | | $ | 255 | | | $ | 351 | | | | $ 2,650 | |
2 | | Relief refinance mortgages (includes HARP) | | | 35 | | | | 106 | | | | 82 | | | | 123 | | | | 99 | | | | 27 | | | | 20 | | | | 492 | |
3 | | Other refinance mortgages | | | 345 | | | | 200 | | | | 168 | | | | 228 | | | | 210 | | | | 94 | | | | 178 | | | | 1,423 | |
4 | | Purchase mortgages | | | 94 | | | | 78 | | | | 71 | | | | 76 | | | | 114 | | | | 134 | | | | 153 | | | | 720 | |
5 | | Other(2) | | | 9 | | | | 6 | | | | — | | | | — | | | | — | | | | — | | | | — | | | | 15 | |
6 | | Multifamily loan purchases or guarantees(1)(3) | | $ | 17 | | | $ | 16 | | | $ | 20 | | | $ | 29 | | | $ | 26 | | | $ | 28 | | | $ | 47 | | | | $ 183 | |
7 | | Other(4) | | $ | 46 | | | $ | — | | | $ | 8 | | | $ | — | | | $ | 4 | | | $ | 8 | | | $ | 4 | | | | $ 70 | |
8 | | Total (lines 1+6+7) | | $ | 546 | | | $ | 406 | | | $ | 349 | | | $ | 456 | | | $ | 453 | | | $ | 291 | | | $ | 402 | | | | $ 2,903 | |
| (1) | Based on UPB and includes other guarantee commitments. |
| (2) | Includes Ginnie Mae Certificates, Housing Finance Agency initiative-related guarantees, and other securitization products. |
| (3) | Excludes Multifamily issuances of K-deals and the securitization of small balance loans. |
| (4) | Consists of non-Freddie Mac mortgage-related securities purchased for the company’s mortgage-related investments portfolio. |
Freddie Mac Fourth Quarter 2015 Financial Results
February 18, 2016
Page 10
Preventing Foreclosures – Freddie Mac helps struggling borrowers retain their homes or otherwise avoid foreclosure.
| | • | | The company completed approximately 94,000 single-family loan workouts in 2015, bringing the total number of homeowners the company has helped to avoid foreclosure to nearly 1.2 million since the beginning of 2009. |
| | • | | When foreclosure is unavoidable, Freddie Mac has helped to further stabilize communities by focusing its real estate owned home sales on owner-occupants, who have made up two–thirds of its purchasers since the beginning of 2009. |
Number of Families Helped
| | | | | | | | | | | | | | | | | | | | | | | | | | | | | | | | | | |
| (Thousands) | | 2009 | | | 2010 | | | 2011 | | | 2012 | | | 2013 | | | 2014 | | | 2015 | | | Cumulative
Total | |
| 1 | | Number of families helped to own or rent a home | | | 2,480 | | | | 2,089 | | | | 1,830 | | | | 2,472 | | | | 2,458 | | | | 1,627 | | | | 2,237 | | | | 15,193 | |
| 2 | | Relief refinance borrowers (includes HARP)(1) | | | 169 | | | | 533 | | | | 453 | | | | 687 | | | | 611 | | | | 179 | | | | 130 | | | | 2,762 | |
| 3 | | Other refinance borrowers(1) | | | 1,595 | | | | 947 | | | | 740 | | | | 996 | | | | 944 | | | | 429 | | | | 780 | | | | 6,431 | |
| 4 | | Purchase borrowers(1) | | | 460 | | | | 378 | | | | 326 | | | | 353 | | | | 515 | | | | 606 | | | | 677 | | | | 3,315 | |
| 5 | | Multifamily rental units | | | 256 | | | | 231 | | | | 311 | | | | 436 | | | | 388 | | | | 413 | | | | 650 | | | | 2,685 | |
| | | | | | | | | | | | | | | | | | | | | | | | | | | | | | | | | | | |
| | | | | | | | | | | | | | | | | | | | | | | | | | | | | | | | | | |
| 6 | | Number of families helped to avoid foreclosure(2) | | | 133 | | | | 275 | | | | 208 | | | | 169 | | | | 168 | | | | 120 | | | | 94 | | | | 1,167 | |
| 7 | | Loan modifications | | | 65 | | | | 170 | | | | 109 | | | | 70 | | | | 83 | | | | 67 | | | | 54 | | | | 618 | |
| 8 | | Repayment plans | | | 34 | | | | 31 | | | | 33 | | | | 33 | | | | 29 | | | | 25 | | | | 21 | | | | 206 | |
| 9 | | Forbearance agreements | | | 15 | | | | 35 | | | | 20 | | | | 13 | | | | 12 | | | | 9 | | | | 6 | | | | 110 | |
| 10 | | Short sales & deed-in-lieu of foreclosure transactions | | | 19 | | | | 39 | | | | 46 | | | | 53 | | | | 44 | | | | 19 | | | | 13 | | | | 233 | |
| 11 | | Total (lines 1+6) | | | 2,613 | | | | 2,364 | | | | 2,038 | | | | 2,641 | | | | 2,626 | | | | 1,747 | | | | 2,331 | | | | 16,360 | |
| (1) | For the periods presented, a borrower may be counted more than once if the company purchased more than one loan (purchase or refinance mortgage) relating to the same borrower. |
| (2) | Represents single-family loan workouts. These categories are not mutually exclusive and a borrower in one category may also be included in another category in the same period. For the periods presented, a borrower may subsequently go into foreclosure. |
About Freddie Mac’s Conservatorship
Since September 2008, Freddie Mac has been operating under conservatorship, with FHFA as Conservator. The support provided by Treasury pursuant to the Senior Preferred Stock Purchase Agreement (Purchase Agreement) enables the company to maintain access to the debt markets and have adequate liquidity to conduct its normal business operations.
Freddie Mac Fourth Quarter 2015 Financial Results
February 18, 2016
Page 11
Treasury Draw Requests and Dividend Payments
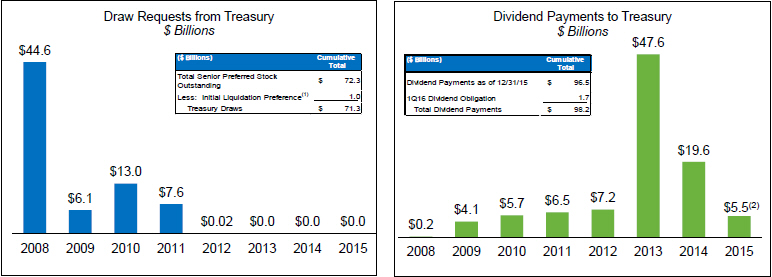
| (1) | The initial $1 billion liquidation preference of senior preferred stock was issued to Treasury in September 2008 as consideration for Treasury’s funding commitment. The company received no cash proceeds as a result of issuing this initial $1 billion liquidation preference of senior preferred stock. |
| (2) | Amount does not include the March 2016 dividend obligation of $1.7 billion. |
| | ● | | Dividend obligation to Treasury in March 2016 will be $1.7 billion, based on Freddie Mac’s net worth of $2.9 billion at December 31, 2015, less the 2016 capital reserve amount of $1.2 billion. |
| | ¡ | The applicable capital reserve amount is $1.2 billion for 2016, and will be $600 million for 2017 and zero beginning on January 1, 2018. |
| | ● | | Aggregate cash dividends paid to Treasury will total $98.2 billion (including the March 2016 dividend obligation), $26.9 billion more than cumulative cash draws of $71.3 billion received from Treasury through December 31, 2015. |
| | ● | | Treasury maintains a liquidation preference of $72.3 billion on the company’s senior preferred stock as of December 31, 2015. |
| | ¡ | The payment of dividends does not reduce the outstanding liquidation preference under the Purchase Agreement. |
| | ¡ | Freddie Mac is not permitted to redeem the senior preferred stock prior to the termination of Treasury’s funding commitment under the Purchase Agreement. |
| | ● | | The amount of remaining funding available to Freddie Mac under the Purchase Agreement with Treasury remains $140.5 billion, and will be reduced by any future draws. |
Additional Information
For more information, including that related to Freddie Mac’s financial results, conservatorship and related matters, see the company’s Annual Report onForm 10-K for the year ended December 31, 2015, and the company’s Financial Results Supplement. These documents are available on the Investor Relations page of the company’s Web site at www.FreddieMac.com/investors.
Additional information about Freddie Mac and its business is also set forth in the company’s filings with the SEC, which are available on the Investor Relations page of the company’s Web site at www.FreddieMac.com/investors and the SEC’s Web site at www.sec.gov. Freddie Mac encourages all investors and interested members of the public to review these materials for a more complete understanding of the company’s financial results and related disclosures.
Freddie Mac Fourth Quarter 2015 Financial Results
February 18, 2016
Page 12
Webcast Announcement
Management will host a conference call at 8 a.m. Eastern Time on February 18, 2016 to discuss the company’s results with the media. The conference call will be concurrently webcast. To access the live audio webcast, use the following link: https://www.webcaster4.com/Webcast/Page/1315/13193. The replay will be available on the company’s Web site at www.FreddieMac.com/investors for approximately 30 days. All materials related to the call will be available on the Investor Relations page of the company’s Web site at www.FreddieMac.com/investors.
| | |
| | |
| Media Contact: Lisa Gagnon(703) 903-3385 | | Investor Contact: Robin Phillips(571) 382-4732 |
| | |
* * * *
This press release contains forward-looking statements, which may include statements pertaining to the conservatorship, the company’s current expectations and objectives for its Single-family Guarantee, Multifamily and Investments segments, its efforts to assist the U.S. residential mortgage market, liquidity, capital management, economic and market conditions and trends, market share, the effect of legislative and regulatory developments and new accounting guidance, credit quality of loans the company owns or guarantees, and results of operations and financial condition on a GAAP, Segment Earnings and fair value basis. Forward-looking statements involve known and unknown risks and uncertainties, some of which are beyond the company’s control. Management’s expectations for the company’s future necessarily involve a number of assumptions, judgments and estimates, and various factors, including changes in market conditions, liquidity, mortgage spreads, credit outlook, actions by the U.S. government (including FHFA, Treasury and Congress), and the impacts of legislation or regulations and new or amended accounting guidance, could cause actual results to differ materially from these expectations. These assumptions, judgments, estimates and factors are discussed in the company’s Annual Report onForm 10-K for the year ended December 31, 2015, which is available on the Investor Relations page of the company’s Web site at www.FreddieMac.com/investors and the SEC’s Web site at www.sec.gov. The company undertakes no obligation to update forward-looking statements it makes to reflect events or circumstances occurring after the date of this press release.
Freddie Mac was established by Congress in 1970 to provide liquidity, stability and affordability to the nation’s residential mortgage markets. Freddie Mac supports communities across the nation by providing mortgage capital to lenders. Today Freddie Mac is making home possible for approximately one in four home borrowers and is the largest source of financing for multifamily housing. Additional information is available at FreddieMac.com, Twitter @FreddieMac and Freddie Mac’s blog FreddieMac.com/blog.
FREDDIE MAC
CONSOLIDATED STATEMENTS OF COMPREHENSIVE INCOME
| | | | | | | | | | | | | | | | |
| | | Three Months Ended | | | Twelve Months Ended | |
| | | December 31, 2015 | | | September 30, 2015 | | | December 31, 2015 | | | December 31, 2014 | |
| | | (in millions, except share-related
amounts) | | | (in millions, except share-related
amounts) | |
Interest income | | | | | | | | | | | | | | | | |
Mortgage loans | | $ | 15,793 | | | $ | 15,595 | | | $ | 62,226 | | | $ | 63,605 | |
Investments in securities | | | 1,058 | | | | 1,145 | | | | 4,794 | | | | 5,843 | |
Other | | | 25 | | | | 19 | | | | 70 | | | | 32 | |
| | | | | | | | | | | | | | | | |
Total interest income | | | 16,876 | | | | 16,759 | | | | 67,090 | | | | 69,480 | |
| | | | | | | | | | | | | | | | |
Interest expense | | | (13,237 | ) | | | (12,963 | ) | | | (51,916 | ) | | | (54,916 | ) |
Expense related to derivatives | | | (52 | ) | | | (53 | ) | | | (228 | ) | | | (301 | ) |
| | | | | | | | | | | | | | | | |
Net interest income | | | 3,587 | | | | 3,743 | | | | 14,946 | | | | 14,263 | |
Benefit (provision) for credit losses | | | 781 | | | | 528 | | | | 2,665 | | | | (58 | ) |
| | | | | | | | | | | | | | | | |
Net interest income after benefit (provision) for credit losses | | | 4,368 | | | | 4,271 | | | | 17,611 | | | | 14,205 | |
| | | | | | | | | | | | | | | | |
Non-interest income (loss) | | | | | | | | | | | | | | | | |
Gains (losses) on extinguishment of debt | | | (85 | ) | | | 4 | | | | (240 | ) | | | (422 | ) |
Derivative gains (losses) | | | 744 | | | | (4,172 | ) | | | (2,696 | ) | | | (8,291 | ) |
Impairment of available-for-sale securities: | | | | | | | | | | | | | | | | |
Total other-than-temporary impairment of available-for-sale securities | | | (37 | ) | | | (38 | ) | | | (241 | ) | | | (860 | ) |
Portion of other-than-temporary impairment recognized in AOCI | | | (10 | ) | | | (16 | ) | | | (51 | ) | | | (78 | ) |
| | | | | | | | | | | | | | | | |
Net impairment of available-for-sale securities recognized in earnings | | | (47 | ) | | | (54 | ) | | | (292 | ) | | | (938 | ) |
Other gains (losses) on investment securities recognized in earnings | | | (317 | ) | | | 256 | | | | 508 | | | | 1,494 | |
Other income (loss) | | | (447 | ) | | | 125 | | | | (879 | ) | | | 8,044 | |
| | | | | | | | | | | | | | | | |
Non-interest income (loss) | | | (152 | ) | | | (3,841 | ) | | | (3,599 | ) | | | (113 | ) |
| | | | | | | | | | | | | | | | |
Non-interest expense | | | | | | | | | | | | | | | | |
Salaries and employee benefits | | | (233 | ) | | | (231 | ) | | | (975 | ) | | | (914 | ) |
Professional services | | | (136 | ) | | | (130 | ) | | | (497 | ) | | | (527 | ) |
Occupancy expense | | | (16 | ) | | | (14 | ) | | | (56 | ) | | | (58 | ) |
Other administrative expense | | | (125 | ) | | | (90 | ) | | | (399 | ) | | | (382 | ) |
| | | | | | | | | | | | | | | | |
Total administrative expense | | | (510 | ) | | | (465 | ) | | | (1,927 | ) | | | (1,881 | ) |
Real estate owned operations (expense) income | | | (95 | ) | | | (116 | ) | | | (338 | ) | | | (196 | ) |
Temporary Payroll Tax Cut Continuation Act of 2011 expense | | | (262 | ) | | | (248 | ) | | | (967 | ) | | | (775 | ) |
Other (expense) income | | | (272 | ) | | | (270 | ) | | | (1,506 | ) | | | (238 | ) |
| | | | | | | | | | | | | | | | |
Non-interest expense | | | (1,139 | ) | | | (1,099 | ) | | | (4,738 | ) | | | (3,090 | ) |
| | | | | | | | | | | | | | | | |
Income before income tax (expense) benefit | | | 3,077 | | | | (669 | ) | | | 9,274 | | | | 11,002 | |
Income tax (expense) benefit | | | (919 | ) | | | 194 | | | | (2,898 | ) | | | (3,312 | ) |
| | | | | | | | | | | | | | | | |
Net income (loss) | | | 2,158 | | | | (475 | ) | | | 6,376 | | | | 7,690 | |
| | | | | | | | | | | | | | | | |
Other comprehensive income (loss), net of taxes and reclassification adjustments: | | | | | | | | | | | | | | | | |
Changes in unrealized gains (losses) related to available-for-sale securities | | | (588 | ) | | | (61 | ) | | | (806 | ) | | | 1,584 | |
Changes in unrealized gains (losses) related to cash flow hedge relationships | | | 50 | | | | 35 | | | | 182 | | | | 197 | |
Changes in defined benefit plans | | | 21 | | | | 0 | | | | 47 | | | | (45 | ) |
| | | | | | | | | | | | | | | | |
Total other comprehensive income (loss), net of taxes and reclassification adjustments | | | (517 | ) | | | (26 | ) | | | (577 | ) | | | 1,736 | |
| | | | | | | | | | | | | | | | |
Comprehensive income (loss) | | $ | 1,641 | | | $ | (501 | ) | | $ | 5,799 | | | $ | 9,426 | |
| | | | | | | | | | | | | | | | |
Net income (loss) | | $ | 2,158 | | | $ | (475 | ) | | $ | 6,376 | | | $ | 7,690 | |
Undistributed net worth sweep and senior preferred stock dividends | | | (1,740 | ) | | | 0 | | | | (6,399 | ) | | | (10,026 | ) |
| | | | | | | | | | | | | | | | |
Net income (loss) attributable to common stockholders | | $ | 418 | | | $ | (475 | ) | | $ | (23 | ) | | $ | (2,336 | ) |
| | | | | | | | | | | | | | | | |
Net income (loss) per common share — basic and diluted | | $ | 0.13 | | | $ | (0.15 | ) | | $ | (0.01 | ) | | $ | (0.72 | ) |
Weighted average common shares outstanding (in millions) — basic and diluted | | | 3,234 | | | | 3,234 | | | | 3,235 | | | | 3,236 | |
FREDDIE MAC
CONSOLIDATED BALANCE SHEETS
| | | | | | | | |
| | | December 31, 2015 | | | December 31, 2014 | |
| | | (in millions, except share-related amounts) | |
Assets | | | | | | | | |
Cash and cash equivalents | | $ | 5,595 | | | $ | 10,928 | |
Restricted cash and cash equivalents | | | 14,533 | | | | 8,535 | |
Securities purchased under agreements to resell | | | 63,644 | | | | 51,903 | |
Investments in securities, at fair value | | | 114,215 | | | | 136,987 | |
Mortgage loans held-for-sale (includes $17,660 and $12,130 at fair value) | | | 24,992 | | | | 12,368 | |
Mortgage loans held-for-investment (net of allowance for loan losses of $15,331 and $21,761) | | | 1,729,201 | | | | 1,688,212 | |
Accrued interest receivable | | | 6,074 | | | | 6,034 | |
Derivative assets, net | | | 395 | | | | 822 | |
Real estate owned, net | | | 1,725 | | | | 2,558 | |
Deferred tax assets, net | | | 18,205 | | | | 19,498 | |
Other assets | | | 7,471 | | | | 7,694 | |
| | | | | | | | |
Total assets | | $ | 1,986,050 | | | $ | 1,945,539 | |
| | | | | | | | |
Liabilities and equity | | | | | | | | |
Liabilities | | | | | | | | |
Accrued interest payable | | $ | 6,183 | | | $ | 6,325 | |
Debt, net (includes $7,184 and $5,862 at fair value) | | | 1,970,427 | | | | 1,929,542 | |
Derivative liabilities, net | | | 1,254 | | | | 1,963 | |
Other liabilities | | | 5,246 | | | | 5,058 | |
| | | | | | | | |
Total liabilities | | | 1,983,110 | | | | 1,942,888 | |
| | | | | | | | |
Commitments and contingencies | | | | | | | | |
Equity | | | | | | | | |
Senior preferred stock, at redemption value | | | 72,336 | | | | 72,336 | |
Preferred stock, at redemption value | | | 14,109 | | | | 14,109 | |
Common stock, $0.00 par value, 4,000,000,000 shares authorized, 725,863,886 shares issued and 650,045,962 shares and 650,043,899 shares outstanding | | | — | | | | — | |
Additional paid-in capital | | | — | | | | — | |
Retained earnings (accumulated deficit) | | | (80,773 | ) | | | (81,639 | ) |
AOCI, net of taxes, related to: | | | | | | | | |
Available-for-sale securities (includes $778 and $839, related to net unrealized gains on securities for which other-than-temporary impairment has been recognized in earnings) | | | 1,740 | | | | 2,546 | |
Cash flow hedge relationships | | | (621 | ) | | | (803 | ) |
Defined benefit plans | | | 34 | | | | (13 | ) |
| | | | | | | | |
Total AOCI, net of taxes | | | 1,153 | | | | 1,730 | |
Treasury stock, at cost, 75,817,924 shares and 75,819,987 shares | | | (3,885 | ) | | | (3,885 | ) |
| | | | | | | | |
Total equity | | | 2,940 | | | | 2,651 | |
| | | | | | | | |
Total liabilities and equity | | $ | 1,986,050 | | | $ | 1,945,539 | |
| | | | | | | | |