Exhibit 99.1
| | | | |
| | News Release | | For Immediate Release // August 2, 2016 |
Freddie Mac Reports Net Income of $1.0 Billion for Second Quarter 2016;
Comprehensive Income of $1.1 Billion
Company Will Return an Additional $933 Million to Taxpayers
| | | | |
Second Quarter 2016 Results Solid Business Results Partially Offset by Market-Related Losses Driven by Interest Rates • $3.4 billion of net interest income, unchanged from the first quarter of 2016. ¡ Single-family guarantee fee income increased; however, was offset by ¡ Decline in revenue from the investments portfolio. • $0.4 billion (after-tax) estimated fair value loss as interest rates declined late in the second quarter of 2016. • $0.8 billion benefit for credit losses driven by the reclassification of seriously delinquent loans from held-for-investment to held-for-sale. | | | | Net Income 2Q16 = $1.0 Billion |
| | | |
| | | Comprehensive Income 2Q16 = $1.1 Billion |
| | | |
| | | Available PSPA Funding 2Q16 = $140.5 Billion |
| | | |
| | | |
| | | |
| | | | |
| (See Financial Results Discussion, Selected Financial Measures and Non-GAAP Financial Measure Highlights onpages 2-7 for additional details.) |
Second Quarter 2016 Business Highlights | | | | |
Business Fundamentals Remain Strong Single-Family Guarantee Business • Core (post-2008) book, which excludes HARP and other relief refinance loans, grew to 69 percent of the credit guarantee portfolio, from 68 percent in the first quarter. • Purchase volume of $91 billion, up $22 billion from the first quarter primarily driven by lower mortgage interest rates. • Serious delinquency rate of 1.08 percent, down from 1.20 percent at March 31, 2016 and the lowest since August 2008. Multifamily Business • Purchase volume of $9 billion, bringing half-year volume to a record $27 billion. Reducing Taxpayer Exposure Through Credit Risk Transfer Programs Single-Family Guarantee Business • Transferred a significant portion of the credit risk on over $85 billion of loans, and have now transferred a significant portion of the credit risk on over $500 billion since the program’s inception in 2013. Multifamily Business • Transferred a large majority of the credit risk on a quarterly record $15 billion of loans, and have now transferred a large majority of the credit risk on over $150 billion of loans since the program’s inception in 2009. ActivelyReducing Legacy Assets • Sold $1.0 billion of seriously delinquent loans, and $5.3 billion since 2013. • Sold $3.6 billion of non-agency securities, and $32.4 billion since 2013. Delivering on Our Mission • Provided approximately $103 billion in liquidity to the mortgage market – funding nearly 392,000 single-family homes and more than 148,000 multifamily rental units. • Helped approximately 17,000 borrowers avoid foreclosure. $99.1 Billionin Cumulative Dividends Returned to Taxpayers Following Third Quarter Payment • Senior preferred stock held by Treasury remains at $72.3 billion. | | | | “We had both solid business and financial results this quarter, reflecting further improvement in our competitiveness and capabilities, highlighted by strong new guarantee business volumes. We also further reduced taxpayer risk through both the efficient disposition of legacy assets and our credit risk transfer transactions, which achieved a major milestone in having nowcumulativelytransferredasignificant portion of credit risk on over $650 billion of single-family and multifamily loans. “We continue to work together with our customers to make the housing finance system better for America’s homebuyers and renters. This includes improved accessible and affordable products andthe delivery of robust tools and expanded offerings to our Seller-Servicer customers.” Donald H. Layton Chief Executive Officer |
Freddie Mac Second Quarter 2016 Financial Results
August 2, 2016
Page 2
McLean, VA — Freddie Mac (OTCQB: FMCC) today reported net income of $993 million for the second quarter of 2016, compared to a net loss of $354 million for the first quarter of 2016. The company also reported comprehensive income of $1.1 billion for the second quarter of 2016, compared to a comprehensive loss of $200 million for the first quarter of 2016.
Summary Consolidated Statements of Comprehensive Income (Loss)
| | | | | | | | | | | | | | |
| | | | | Three Months Ended | |
| ($ Millions) | | 6/30/16 | | | 3/31/16 | | | Change | |
1 | | Net interest income | | $ | 3,443 | | | $ | 3,405 | | | $ | 38 | |
2 | | Benefit for credit losses | | | 775 | | | | 467 | | | | 308 | |
3 | | Derivative gains (losses) | | | (2,058 | ) | | | (4,561 | ) | | | 2,503 | |
4 | | Other non-interest income (loss)(1) | | | 234 | | | | 1,138 | | | | (904 | ) |
| | | | | | | | | | | | | | |
5 | | Non-interest income (loss) | | | (1,824 | ) | | | (3,423 | ) | | | 1,599 | |
6 | | Administrative expense | | | (475 | ) | | | (448 | ) | | | (27 | ) |
7 | | Other non-interest expense | | | (460 | ) | | | (509 | ) | | | 49 | |
| | | | | | | | | | | | | | |
8 | | Non-interest expense | | | (935 | ) | | | (957 | ) | | | 22 | |
9 | | Pre-tax income (loss) | | | 1,459 | | | | (508 | ) | | | 1,967 | |
10 | | Income tax (expense) benefit | | | (466 | ) | | | 154 | | | | (620 | ) |
| | | | | | | | | | | | | | |
11 | | Net income (loss) | | $ | 993 | | | $ | (354 | ) | | $ | 1,347 | |
12 | | Total other comprehensive income (loss) | | | 140 | | | | 154 | | | | (14 | ) |
| | | | | | | | | | | | | | |
13 | | Comprehensive income (loss) | | $ | 1,133 | | | $ | (200 | ) | | $ | 1,333 | |
| | | | | | | | | | | | | | |
| |
Memo Item | | | | | | | | | | | | |
14 | | Guarantee fee income(1) | | $ | 124 | | | $ | 110 | | | $ | 14 | |
| (1) | Guarantee fee income on a GAAP basis is primarily from the company’s multifamily business and is included in Other income (loss) on Freddie Mac’s consolidated statements of comprehensive income. |
Financial Results Discussion
Freddie Mac’s second quarter 2016 net income of $993 million and comprehensive income of $1.1 billion both increased $1.3 billion from the first quarter of 2016. The company’s second quarter 2016 results were significantly less affected by market-related items than results for the first quarter of 2016:
| | ● | | Net Interest Rate Effect: $0.4 billion (after-tax) estimated fair value loss for the second quarter of 2016 compared to a $1.4 billion (after-tax) estimated fair value loss for the first quarter of 2016, as interest rates decreased less in the second quarter than in the first quarter. (SeeNet Interest Rate Effect table for additional details.) |
| | ● | | Spread Change Effect: Minimal effect for the second quarter of 2016, compared to $0.6 billion (after-tax) estimated loss as spreads widened during the first quarter of 2016. |
Freddie Mac Second Quarter 2016 Financial Results
August 2, 2016
Page 3
Net Interest Rate Effect
| | | | | | | | | | | | | | |
| | | | | Three Months Ended | |
| ($ Billions) | | 6/30/16 | | | 3/31/16 | | | Change | |
Components of Derivative Gains (Losses) | | | | | | | | | | | | |
1 | | Derivative Gains (Losses) | | $ | (2.0 | ) | | $ | (4.6 | ) | | $ | 2.6 | |
2 | | Less: Accrual of Periodic Cash Settlements | | | (0.4 | ) | | | (0.5 | ) | | | 0.1 | |
| | | | | | | | | | | | | | |
3 | | Derivative Fair Value Changes | | $ | (1.6 | ) | | $ | (4.1 | ) | | $ | 2.5 | |
| | | | | | | | | | | | | | |
Estimated Net Interest Rate Effect | | | | | | | | | | | | |
4 | | Interest Rate Effect on Derivative Fair Values | | $ | (1.7 | ) | | $ | (4.0 | ) | | $ | 2.3 | |
5 | | Estimate of Offsetting Interest Rate Effect Related to Financial Instruments Measured at Fair Value | | | 1.0 | | | | 1.9 | | | | (0.9 | ) |
6 | | Income Tax Benefit -@ 35% | | | 0.3 | | | | 0.7 | | | | (0.4 | ) |
| | | | | | | | | | | | | | |
7 | | Estimated Net Effect on Comprehensive Income (4+5+6) | | $ | (0.4 | ) | | $ | (1.4 | ) | | $ | 1.0 | |
| | | | | | | | | | | | | | |
| | | | | | | | | | | | | | | |
Selected Financial Measures
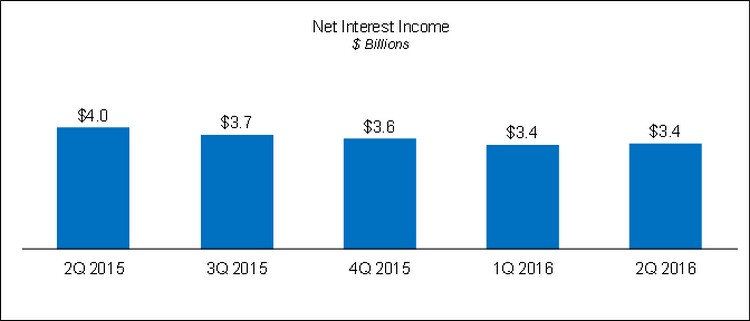
| | ● | | Net interest income was $3.4 billion for the second quarter of 2016, an increase of $38 million from the first quarter of 2016. |
| | ¡ | The quarterly increase in net interest income primarily reflects an increase in guarantee fee income for the single-family business due to higher amortization of upfront fees resulting from higher loan liquidations, mostly offset by a decline in the balance of the company’s investments portfolio. |
Freddie Mac Second Quarter 2016 Financial Results
August 2, 2016
Page 4
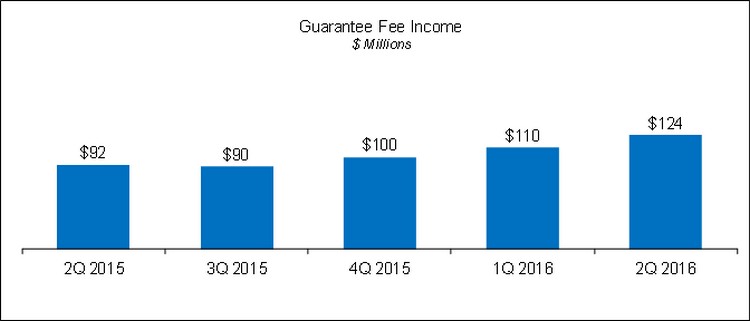
| | ● | | Guarantee fee income, primarily from the company’s multifamily business, was $124 million for the second quarter of 2016, $14 million higher than in the first quarter of 2016. |
| | ¡ | The quarterly increase in guarantee fee income primarily reflects higher average multifamily guarantee portfolio balances as a result of ongoing issuances ofK-Deals. |
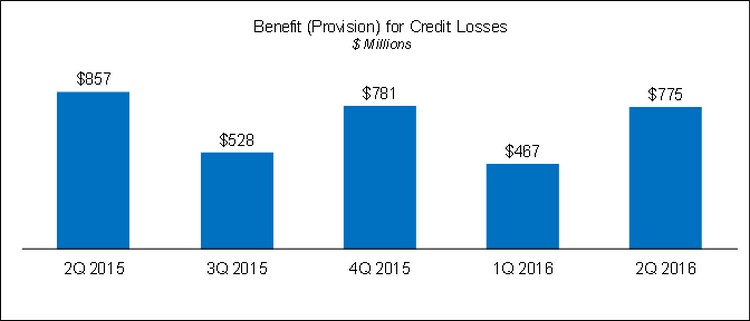
| | ● | | Benefit for credit losses was $775 million for the second quarter of 2016, an increase of $308 million from the first quarter of 2016. |
| | ¡ | The quarterly increase in benefit for credit losses primarily reflects the reclassification of certain seriously delinquent single-family loans from held-for-investment to held-for-sale to support the sale of such loans, as the company continues to focus on reducing the balance of less liquid assets in its mortgage-related investments portfolio. |
| | o | Freddie Mac reclassified $3.1 billion in unpaid principal balance (UPB) of such loans in the second quarter of 2016, while an insignificant amount was reclassified in the first quarter of 2016. |
Freddie Mac Second Quarter 2016 Financial Results
August 2, 2016
Page 5
Variability of Earnings
Freddie Mac’s financial results are subject to significant earnings variability from period to period. This variability is primarily driven by:
| | ● | | Interest-Rate Volatility – Freddie Mac holds assets and liabilities that expose it to interest-rate risk. Through its use of derivatives, the company manages its exposure to interest-rate risk on an economic basis to a low level as measured by the company’s models. However, the way the company accounts for its financial assets and liabilities (i.e., some are measured at amortized cost, while others are measured at fair value), including derivatives, creates volatility in the company’s GAAP earnings when interest rates fluctuate. Based upon the composition of its financial assets and liabilities, including derivatives, at June 30, 2016, the company generally recognizes fair value losses in earnings when interest rates decline. This volatility generally is not indicative of the underlying economics of its business. |
| | ● | | Spread Volatility – The volatility of spreads (i.e., credit spreads, liquidity spreads, risk premiums, etc.), or option-adjusted spreads, is the risk associated with changes in the excess of interest rates over benchmark rates. Freddie Mac holds assets and liabilities that expose it to spread volatility, which may contribute to significant earnings volatility. For financial assets measured at fair value, the company generally recognizes fair value losses when spreads widen. Conversely, for financial liabilities measured at fair value, the company generally recognizes fair value gains when spreads widen. |
The variability of earnings and the declining capital reserve required under the terms of the Purchase Agreement (ultimately reaching zero in 2018) increase the risk of Freddie Mac having a negative net worth and thus being required to draw from Treasury. The company currently faces a risk of a draw for a variety of reasons, including if it were to experience a large decrease in interest rates coupled with a large widening of spreads. In an effort to reduce the probability of a draw due to changes in interest rates, the company entered into certain structured transactions that have resulted in additional financial assets being recognized and measured at fair value. In addition, the company continues to explore other strategies and activities that may reduce the probability of a draw.
Non-GAAP Financial Measure Highlights
In addition to analyzing the company’s results on a GAAP basis, management reviews certain financial measures on an “adjusted”, or non-GAAP basis. The adjusted, or non-GAAP, financial measures are calculated by reclassifying certain credit guarantee-related activities and investment-related activities between various line items on the company’s GAAP consolidated statements of comprehensive income. Management believes the non-GAAP financial measures are useful because they more clearly explain the sources of revenue to the company.
| | ● | | The company’s GAAP net interest income includes the spread earned on its investment activities plus the guarantee fees earned by its single-family business. GAAP guarantee fees are primarily those generated by its multifamily business. |
| | ¡ | The adjusted guarantee fees are designed to show the revenues from both the single-family and multifamily businesses, net of the 10 basis point guarantee fee remitted to Treasury as part of the Temporary Payroll Tax Cut Act. |
| | ¡ | The adjusted net interest income is the net spread earned on the company’s investments activities, including the cost of funds associated with using derivatives. |
| | ● | | In addition, the adjusted benefit (provision) for credit losses reflects the company’s credit-related expenses after removing the effect of accounting-related reclassifications associated with the transfer of certain seriously delinquent single-family loans from held-for-investment to held-for-sale to support the sale of such loans. |
The company does not present adjusted measures for net income or comprehensive income. For a reconciliation of these measures to the comparable amounts under GAAP, see page 16 of this press release.
Freddie Mac Second Quarter 2016 Financial Results
August 2, 2016
Page 6
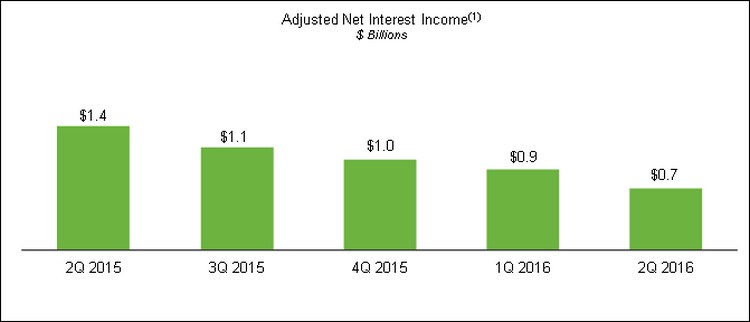
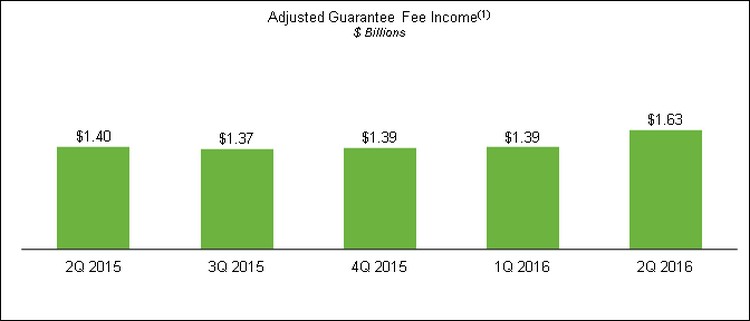
The graphs that follow show the company’s three non-GAAP financial measures – adjusted net interest income, adjusted guarantee fee income and adjusted benefit (provision) for credit losses.
| (1) | Non-GAAP financial measure. For reconciliations to the comparable amounts under GAAP, see page 16 of this press release. |
| | ● | | Adjusted net interest income was $671 million for the second quarter of 2016, a decrease of $211 million from the first quarter of 2016. |
| | ¡ | The quarterly decrease in adjusted net interest income reflects a decline in the balance of the company’s investments portfolio, as well as a decline in the net interest yield. |
| | ¡ | Adjusted net interest income is expected to decline over the long term, primarily as a result of the company’s ongoing reduction of its mortgage-related investments portfolio in accordance with the requirements of the Purchase Agreement and FHFA. |
| | o | The company is particularly focused on reducing the balance of less liquid assets in this portfolio. |
Freddie Mac Second Quarter 2016 Financial Results
August 2, 2016
Page 7
| (1) | Non-GAAP financial measure. For reconciliations to the comparable amounts under GAAP, see page 16 of this press release. |
| | ● | | Adjusted guarantee fee income was $1.6 billion for the second quarter of 2016, an increase of $232 million from the first quarter of 2016. |
| | ¡ | The quarterly increase in adjusted guarantee fee income primarily reflects higher amortization of upfront fees resulting from higher loan liquidations due to a decline in interest rates. |
| | ¡ | Adjusted guarantee fee income is expected to increase over the long term as guarantee fees on new business are higher than the fees received on older vintages that continue to run off. |
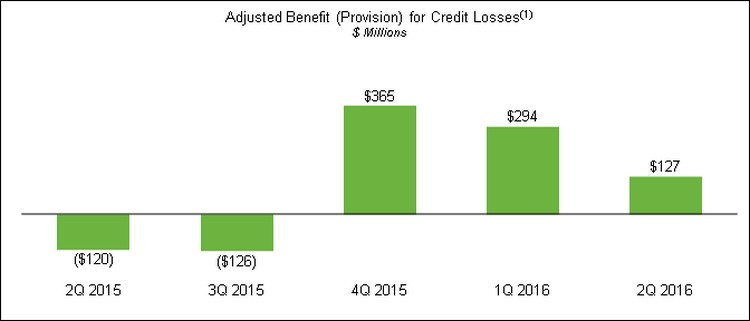
| (1) | Non-GAAP financial measure. For reconciliations to the comparable amounts under GAAP, see page 16 of this press release. |
| | ● | | Adjusted benefit for credit losses was $127 million for the second quarter of 2016, a decrease of $167 million from the first quarter of 2016. |
| | ¡ | The quarterly decrease in adjusted benefit for credit losses was primarily due to a decline in the benefits related to interest rate concessions on the company’s modified loan population. |
Freddie Mac Second Quarter 2016 Financial Results
August 2, 2016
Page 8
Segment Financial Results and Business Highlights
Freddie Mac’s operations consist of three reportable segments, which are based on the types of business activities they perform – Single-Family Guarantee, Multifamily and Investments. The company presents Segment Earnings for each segment by reclassifying certain credit guarantee-related and investment-related activities between various line items on its GAAP consolidated statements of comprehensive income and allocating certain revenue and expenses, including certain returns on assets and funding costs, and all administrative expenses to its three reportable segments. For more information about Segment Earnings, see Note 12 to the financial statements included in the company’s Annual Report onForm 10-K for the year ended December 31, 2015 and Note 11 to the financial statements included in its Quarterly Report onForm 10-Q for the three months ended March 31, 2016.
Segment Earnings and Comprehensive Income
| | | | | | | | | | | | | | |
| | | | | Three Months Ended | |
| ($ Millions) | | 6/30/16 | | | 3/31/16 | | | Change | |
| | Single-Family Guarantee Segment | | | | | | | | | | | | |
1 | | Guarantee fee income | | $ | 1,501 | | | $ | 1,285 | | | $ | 216 | |
2 | | Benefit for credit losses | | | 121 | | | | 289 | | | | (168 | ) |
3 | | Administrative expense | | | (314 | ) | | | (295 | ) | | | (19 | ) |
4 | | Other | | | (398 | ) | | | (115 | ) | | | (283 | ) |
5 | | Income tax (expense) benefit | | | (326 | ) | | | (354 | ) | | | 28 | |
| | | | | | | | | | | | | | |
6 | | Segment Earnings, net of taxes | | | 584 | | | | 810 | | | | (226 | ) |
7 | | Total other comprehensive income (loss), net of tax | | | (1 | ) | | | 1 | | | | (2 | ) |
| | | | | | | | | | | | | | |
8 | | Total comprehensive income | | $ | 583 | | | $ | 811 | | | $ | (228 | ) |
| | | | | | | | | | | | | | |
| | Multifamily Segment | | | | | | | | | | | | |
9 | | Net interest income | | $ | 216 | | | $ | 252 | | | $ | (36 | ) |
10 | | Guarantee fee income | | | 124 | | | | 108 | | | | 16 | |
11 | | Gains (losses) on loans and other non-interest income | | | 445 | | | | 737 | | | | (292 | ) |
12 | | Derivative gains (losses) | | | (296 | ) | | | (787 | ) | | | 491 | |
13 | | Administrative expense | | | (86 | ) | | | (80 | ) | | | (6 | ) |
14 | | Other | | | (3 | ) | | | (19 | ) | | | 16 | |
15 | | Income tax (expense) benefit | | | (136 | ) | | | (64 | ) | | | (72 | ) |
| | | | | | | | | | | | | | |
16 | | Segment Earnings, net of taxes | | | 264 | | | | 147 | | | | 117 | |
17 | | Total other comprehensive income (loss), net of tax | | | 7 | | | | 3 | | | | 4 | |
| | | | | | | | | | | | | | |
18 | | Total comprehensive income | | $ | 271 | | | $ | 150 | | | $ | 121 | |
| | | | | | | | | | | | | | |
| | Investments Segment | | | | | | | | | | | | |
19 | | Net interest income | | $ | 606 | | | $ | 748 | | | $ | (142 | ) |
20 | | Derivative gains (losses) | | | (1,003 | ) | | | (2,995 | ) | | | 1,992 | |
21 | | Other non-interest income | | | 622 | | | | 439 | | | | 183 | |
22 | | Administrative expense | | | (75 | ) | | | (73 | ) | | | (2 | ) |
23 | | Other | | | (1 | ) | | | (2 | ) | | | 1 | |
24 | | Income tax (expense) benefit | | | (4 | ) | | | 572 | | | | (576 | ) |
| | | | | | | | | | | | | | |
25 | | Segment Earnings, net of taxes | | | 145 | | | | (1,311 | ) | | | 1,456 | |
26 | | Total other comprehensive income (loss), net of tax | | | 134 | | | | 150 | | | | (16 | ) |
| | | | | | | | | | | | | | |
27 | | Total comprehensive income (loss) | | $ | 279 | | | $ | (1,161 | ) | | $ | 1,440 | |
| | | | | | | | | | | | | | |
| | | | | | | | | | | | | | | |
Freddie Mac Second Quarter 2016 Financial Results
August 2, 2016
Page 9
Single-Family Guarantee Segment
Providing liquidity to the U.S. housing market while continuing to transfer credit risk to the private market
Financial Results
| | ● | | Single-Family Guarantee segment earnings were $584 million for the second quarter of 2016, a decrease of $226 million from the first quarter of 2016. |
| | ¡ | The decrease in segment earnings was primarily driven by losses due to an increase in the amount of seriously delinquent single-family loans reclassified from held-for-investment to held-for-sale in the second quarter of 2016 and fair value losses on STACR debt notes as spreads between STACR yields and LIBOR tightened. |
| | ¡ | However, guarantee fee income increased primarily due to higher amortization of upfront fees resulting from higher loan liquidations due to a decline in interest rates. |
Business Highlights
| | ● | | Core book continued to grow and was 69 percent of the single-family credit guarantee portfolio at June 30, 2016. |
| | ¡ | HARP and other relief refinance loans represented 17 percent. |
| | ¡ | Legacy book declined to 14 percent. |
| | ● | | Average guarantee fees charged on new acquisitions were 46 basis points (net of the legislated 10 basis point guarantee fee remitted to Treasury as part of the Temporary Payroll Tax Cut Continuation Act of 2011) for the second quarter of 2016, relatively unchanged from the first quarter of 2016. |
| | ¡ | Average guarantee fees on the single-family guarantee portfolio were 35 basis points, an increase of five basis points from the first quarter of 2016 primarily due to higher amortization of upfront fees resulting from higher loan liquidations. |
| | ● | | Sold $1.0 billion in UPB of seriously delinquent single-family loans during the second quarter of 2016, and $5.3 billion since 2013. |
| | ● | | Transferred a portion of expected credit losses and transferred a significant portion of stress credit losses on over $85 billion in UPB of mortgage loans in the Core book during the second quarter of 2016. |
Multifamily Segment
Providing financing for workforce housing while continuing to transfer credit risk to the private market
Financial Results
| | ● | | Multifamily segment comprehensive income was $271 million for the second quarter of 2016, an increase of $121 million from the first quarter of 2016. |
| | ¡ | The increase in comprehensive income was primarily driven by fair value gains due to spread tightening on held-for-sale mortgage loans in the second quarter compared to spread widening in the first quarter. |
| | o | Derivative gains (losses) for the Multifamily segment are largely offset by fair value changes of the loans and investment securities being economically hedged. As a result, there is minimal net impact on total comprehensive income for the Multifamily segment from fair value changes related to interest-rate related derivatives. |
Business Highlights
| | ● | | New purchase volume of $9.4 billion in the second quarter of 2016, a decrease of $8.1 billion from record volume in the first quarter of 2016. |
| | ¡ | The 2016 Conservatorship Scorecard goal is to maintain the dollar volume of multifamily new business activity at or below a production cap of $35.0 billion. Business activity associated with certain targeted loan types is excluded from the production cap. |
| | ¡ | Approximately two-thirds of the $9.4 billion in new business activity for the second quarter of 2016 counted towards the 2016 production cap. |
Freddie Mac Second Quarter 2016 Financial Results
August 2, 2016
Page 10
| | ● | | Executed a record 14 K-Deal transactions that transferred a large majority of expected and stress credit losses associated with $14.4 billion in UPB of loans during the second quarter of 2016. |
| | ¡ | In addition, transferred a large majority of expected and stress credit losses associated with $1.0 billion of additional loans through other securitization products, such as small balance loan securitizations. |
| | ● | | Provided financing for more than 148,000 rental units in the second quarter of 2016. |
| | ¡ | Approximately 90 percent of the eligible units financed are affordable to families earning at or below area median incomes. |
Investments Segment
Enhancing the liquidity of the company’s securities in the secondary mortgage market while reducing less liquid assets using an economically sensible approach
Financial Results
| | ● | | Investments segment comprehensive income was $279 million for the second quarter of 2016, a shift from a comprehensive loss of $1.2 billion in the first quarter of 2016. |
| | ¡ | The shift to comprehensive income was primarily driven by lower derivative losses, as interest rates declined less in the second quarter of 2016 than in the first quarter of 2016. |
| | ¡ | However, the $142 million decrease in net interest income reflects a decline in the balance of the company’s investments portfolio, as well as a decline in the net interest yield. |
Business Highlights
| | ● | | Continued to actively reduce the balance of the company’s mortgage-related investments portfolio, focusing on reducing the balance of less liquid assets. Investments segment less liquid assets were $90.0 billion at June 30, 2016, down $4.8 billion, or 5 percent, from March 31, 2016, due to sales of $3.6 billion of non-agency mortgage-related securities and ongoing portfolio liquidations. |
| | ● | | The Investments segment securitization pipeline assets, which represent performing single-family loans purchased for cash and held until securitized, were $14.5 billion at June 30, 2016, up $3.9 billion from March 31, 2016. |
| | ● | | Continued to maintain a presence in the agency mortgage-related securities market. |
| | ¡ | Liquid assets held by the Investments segment were $143.8 billion at June 30, 2016, or 58 percent of the portfolio. |
Housing Market Support
Freddie Mac supports the U.S. housing market by executing its charter mission to ensure credit availability for new and refinanced mortgages as well as rental housing and helping struggling homeowners avoid foreclosure. A significant company-wide focus in 2016 is to responsibly make housing more accessible for borrowers and renters, especially for low- and moderate-income households and those in underserved markets.
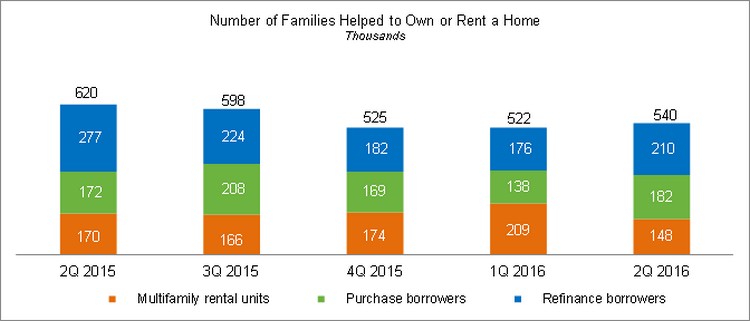
Mortgage Funding—Freddie Mac provided approximately $103 billion in liquidity to the market in the second quarter of 2016, funding:
| | ● | | Nearly 392,000 single-family homes, more than 210,000 of which were refinance loans. |
| | ● | | More than 148,000 multifamily rental units. |
Freddie Mac Second Quarter 2016 Financial Results
August 2, 2016
Page 11
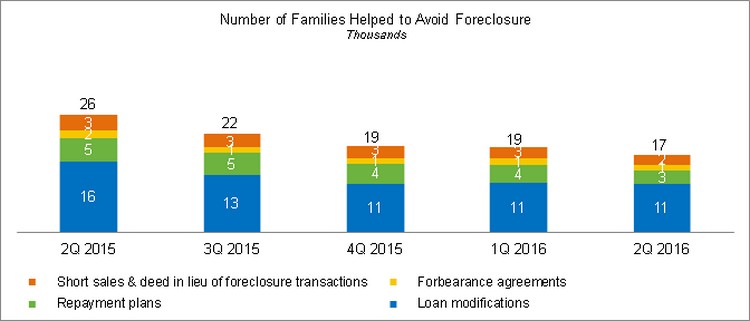
Preventing Foreclosures – Freddie Mac continued to help struggling borrowers retain their homes or otherwise avoid foreclosure in the second quarter.
| | ● | | The company completed approximately 17,000 single-family loan workouts. |
| | ● | | The declining trend over the past year in the company’s single-family workouts generally reflects rising house prices and improving economic conditions. |
| | ● | | When foreclosure is unavoidable, Freddie Mac has helped to further stabilize communities by focusing its real estate owned home sales on owner-occupants, who made up two-thirds of its purchasers in the second quarter. |
Freddie Mac Second Quarter 2016 Financial Results
August 2, 2016
Page 12
About Freddie Mac’s Conservatorship
Since September 2008, Freddie Mac has been operating under conservatorship, with FHFA as Conservator. The support provided by Treasury pursuant to the Senior Preferred Stock Purchase Agreement (Purchase Agreement) enables the company to maintain access to the debt markets and have adequate liquidity to conduct its normal business operations.
Treasury Draw Requests and Dividend Payments
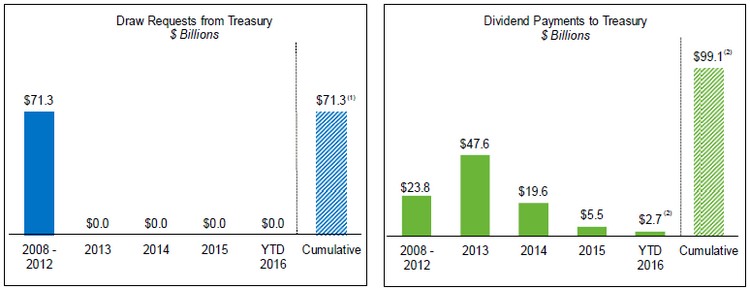
| (1) | Excludes the initial $1 billion liquidation preference of senior preferred stock issued to Treasury in September 2008 as consideration for Treasury’s funding commitment. The company received no cash proceeds as a result of issuing this initial $1 billion liquidation preference of senior preferred stock. |
| (2) | Includes the September 2016 dividend obligation of $933 million. |
| | ● | | Dividend obligation to Treasury in September 2016 will be $933 million, based on Freddie Mac’s net worth of $2.1 billion at June 30, 2016, less the 2016 capital reserve amount of $1.2 billion. |
| | ¡ | The applicable capital reserve amount is $1.2 billion for 2016, and will be $600 million for 2017 and zero beginning on January 1, 2018. |
| | ● | | Aggregate cash dividends paid to Treasury will total $99.1 billion (including the September 2016 dividend obligation), $27.8 billion more than cumulative cash draws of $71.3 billion received from Treasury through June 30, 2016. |
| | ● | | The amount of funding available to Freddie Mac under the Purchase Agreement remains unchanged at $140.5 billion, and will be reduced by any future draws. |
| | ● | | Treasury still maintains a liquidation preference of $72.3 billion on the company’s senior preferred stock as of June 30, 2016. |
| | ¡ | The payment of dividends does not reduce the outstanding liquidation preference under the Purchase Agreement. |
| | ¡ | Freddie Mac is not permitted to redeem the senior preferred stock prior to the termination of Treasury’s funding commitment under the Purchase Agreement. |
Additional Information
For more information, including that related to Freddie Mac’s financial results, conservatorship and related matters, see the company’s Quarterly Report onForm 10-Q for the quarter ended June 30, 2016, and the company’s Financial Results Supplement. These documents are available on the Investor Relations page of the company’s Web site at www.FreddieMac.com/investors.
Additional information about Freddie Mac and its business is also set forth in the company’s filings with the SEC, which are available on the Investor Relations page of the company’s Web site at www.FreddieMac.com/investors and
Freddie Mac Second Quarter 2016 Financial Results
August 2, 2016
Page 13
the SEC’s Web site at www.sec.gov. Freddie Mac encourages all investors and interested members of the public to review these materials for a more complete understanding of the company’s financial results and related disclosures.
Webcast Announcement
Management will host a conference call at 9 a.m. Eastern Time on August 2, 2016 to discuss the company’s results with the media. The conference call will be concurrently webcast. To access the live audio webcast, use the following link:http://edge.media-server.com/m/p/bwmyws9z. The replay will be available on the company’s Web site at www.FreddieMac.com/investors for approximately 30 days. All materials related to the call will be available on the Investor Relations page of the company’s Web site at www.FreddieMac.com/investors.
| | |
| | |
| Media Contact: Lisa Gagnon(703) 903-3385 | | Investor Contact: Robin Phillips(571) 382-4732 |
| | |
* * * *
This press release contains forward-looking statements, which may include statements pertaining to the conservatorship, the company’s current expectations and objectives for its Single-Family Guarantee, Multifamily and Investments segments, its efforts to assist the U.S. residential mortgage market, liquidity, capital management, economic and market conditions and trends, market share, the effect of legislative and regulatory developments and new accounting guidance, credit quality of loans the company owns or guarantees, and results of operations and financial condition on a GAAP, Segment Earnings, non-GAAP and fair value basis. Forward-looking statements involve known and unknown risks and uncertainties, some of which are beyond the company’s control. Management’s expectations for the company’s future necessarily involve a number of assumptions, judgments and estimates, and various factors, including changes in market conditions, liquidity, mortgage spreads, credit outlook, actions by the U.S. government (including FHFA, Treasury and Congress), and the impacts of legislation or regulations and new or amended accounting guidance, could cause actual results to differ materially from these expectations. These assumptions, judgments, estimates and factors are discussed in the company’s Annual Report onForm 10-K for the year ended December 31, 2015, Quarterly Reports onForm 10-Q for the quarters ended March 31, 2016 and June 30, 2016 and Current Reports onForm 8-K, which are available on the Investor Relations page of the company’s Web site at www.FreddieMac.com/investors and the SEC’s Web site at www.sec.gov. The company undertakes no obligation to update forward-looking statements it makes to reflect events or circumstances occurring after the date of this press release.
Freddie Mac was established by Congress in 1970 to provide liquidity, stability and affordability to the nation’s residential mortgage markets. Freddie Mac supports communities across the nation by providing mortgage capital to lenders. Today Freddie Mac is making home possible for approximately one in four home borrowers and is the largest source of financing for multifamily housing. Additional information is available at FreddieMac.com, Twitter @FreddieMac and Freddie Mac’s blog FreddieMac.com/blog.
FREDDIE MAC
CONDENSED CONSOLIDATED STATEMENTS OF COMPREHENSIVE INCOME (LOSS)
(UNAUDITED)
| | | | | | | | |
| | | Three Months Ended | |
| | | June 30, 2016 | | | March 31, 2016 | |
| | | (in millions, except share-related amounts) | |
Interest income | | | | | | | | |
Mortgage loans | | $ | 15,238 | | | $ | 15,818 | |
Investments in securities | | | 978 | | | | 969 | |
Other | | | 56 | | | | 57 | |
| | | | | | | | |
Total interest income | | | 16,272 | | | | 16,844 | |
| | | | | | | | |
Interest expense | | | (12,781 | ) | | | (13,388 | ) |
Expense related to derivatives | | | (48 | ) | | | (51 | ) |
| | | | | | | | |
Net interest income | | | 3,443 | | | | 3,405 | |
Benefit (provision) for credit losses | | | 775 | | | | 467 | |
| | | | | | | | |
Net interest income after benefit (provision) for credit losses | | | 4,218 | | | | 3,872 | |
| | | | | | | | |
Non-interest income (loss) | | | | | | | | |
Losses on extinguishment of debt | | | (119 | ) | | | (55 | ) |
Derivative gains (losses) | | | (2,058 | ) | | | (4,561 | ) |
Impairment of available-for-sale securities: | | | | | | | | |
Total other-than-temporary impairment of available-for-sale securities | | | (10 | ) | | | (52 | ) |
Portion of other-than-temporary impairment recognized in AOCI | | | (62 | ) | | | (5 | ) |
| | | | | | | | |
Net impairment of available-for-sale securities recognized in earnings | | | (72 | ) | | | (57 | ) |
Other gains on investment securities recognized in earnings | | | 450 | | | | 303 | |
Other income (loss) | | | (25 | ) | | | 947 | |
| | | | | | | | |
Non-interest income (loss) | | | (1,824 | ) | | | (3,423 | ) |
| | | | | | | | |
Non-interest expense | | | | | | | | |
Salaries and employee benefits | | | (240 | ) | | | (239 | ) |
Professional services | | | (117 | ) | | | (101 | ) |
Occupancy expense | | | (15 | ) | | | (13 | ) |
Other administrative expense | | | (103 | ) | | | (95 | ) |
| | | | | | | | |
Total administrative expense | | | (475 | ) | | | (448 | ) |
Real estate owned operations expense | | | (29 | ) | | | (84 | ) |
Temporary Payroll Tax Cut Continuation Act of 2011 expense | | | (280 | ) | | | (272 | ) |
Other expense | | | (151 | ) | | | (153 | ) |
| | | | | | | | |
Non-interest expense | | | (935 | ) | | | (957 | ) |
| | | | | | | | |
Income (loss) before income tax expense | | | 1,459 | | | | (508 | ) |
Income tax (expense) benefit | | | (466 | ) | | | 154 | |
| | | | | | | | |
Net income (loss) | | | 993 | | | | (354 | ) |
| | | | | | | | |
Other comprehensive income (loss), net of taxes and reclassification adjustments: | | | | | | | | |
Changes in unrealized gains (losses) related to available-for-sale securities | | | 109 | | | | 119 | |
Changes in unrealized gains (losses) related to cash flow hedge relationships | | | 32 | | | | 34 | |
Changes in defined benefit plans | | | (1 | ) | | | 1 | |
| | | | | | | | |
Total other comprehensive income (loss), net of taxes and reclassification adjustments | | | 140 | | | | 154 | |
| | | | | | | | |
Comprehensive income (loss) | | $ | 1,133 | | | $ | (200 | ) |
| | | | | | | | |
Net income (loss) | | $ | 993 | | | $ | (354 | ) |
Undistributed net worth sweep and senior preferred stock dividends | | | (933 | ) | | | — | |
| | | | | | | | |
Net income (loss) attributable to common stockholders | | $ | 60 | | | $ | (354 | ) |
| | | | | | | | |
Net loss per common share — basic and diluted | | $ | 0.02 | | | $ | (0.11 | ) |
Weighted average common shares outstanding (in millions) — basic and diluted | | | 3,234 | | | | 3,234 | |
Page 14
FREDDIE MAC
CONDENSED CONSOLIDATED BALANCE SHEETS
(UNAUDITED)
| | | | | | | | |
| | | June 30, 2016 | | | December 31, 2015 | |
| | | (in millions, except share-related amounts) | |
Assets | | | | | | | | |
Cash and cash equivalents | | $ | 8,140 | | | $ | 5,595 | |
Restricted cash and cash equivalents | | | 17,399 | | | | 14,533 | |
Securities purchased under agreements to resell | | | 48,989 | | | | 63,644 | |
Investments in securities, at fair value | | | 112,269 | | | | 114,215 | |
Mortgage loans held-for-sale (includes $14,905 and $17,660 at fair value) | | | 19,545 | | | | 24,992 | |
Mortgage loans held-for-investment (net of allowance for loan losses of $13,502 and $15,331) | | | 1,742,040 | | | | 1,729,201 | |
Accrued interest receivable | | | 6,060 | | | | 6,074 | |
Derivative assets, net | | | 1,479 | | | | 395 | |
Real estate owned, net | | | 1,381 | | | | 1,725 | |
Deferred tax assets, net | | | 18,671 | | | | 18,205 | |
Other assets | | | 10,464 | | | | 7,313 | |
| | | | | | | | |
Total assets | | $ | 1,986,437 | | | $ | 1,985,892 | |
| | | | | | | | |
Liabilities and equity | | | | | | | | |
Liabilities | | | | | | | | |
Accrued interest payable | | $ | 6,057 | | | $ | 6,183 | |
Debt, net (includes $6,744 and $7,184 at fair value) | | | 1,972,103 | | | | 1,970,269 | |
Derivative liabilities, net | | | 1,243 | | | | 1,254 | |
Other liabilities | | | 4,901 | | | | 5,246 | |
| | | | | | | | |
Total liabilities | | | 1,984,304 | | | | 1,982,952 | |
| | | | | | | | |
Commitments and contingencies | | | | | | | | |
Equity | | | | | | | | |
Senior preferred stock, at redemption value | | | 72,336 | | | | 72,336 | |
Preferred stock, at redemption value | | | 14,109 | | | | 14,109 | |
Common stock, $0.00 par value, 4,000,000,000 shares authorized, 725,863,886 shares issued and 650,046,828 shares and 650,045,962 shares outstanding | | | — | | | | — | |
Additional paid-in capital | | | — | | | | — | |
Retained earnings (accumulated deficit) | | | (81,874 | ) | | | (80,773 | ) |
AOCI, net of taxes, related to: | | | | | | | | |
Available-for-sale securities (includes $585 and $778, related to net unrealized gains on securities for which other-than-temporary impairment has been recognized in earnings) | | | 1,968 | | | | 1,740 | |
Cash flow hedge relationships | | | (555 | ) | | | (621 | ) |
Defined benefit plans | | | 34 | | | | 34 | |
| | | | | | | | |
Total AOCI, net of taxes | | | 1,447 | | | | 1,153 | |
Treasury stock, at cost, 75,817,058 shares and 75,817,924 shares | | | (3,885 | ) | | | (3,885 | ) |
| | | | | | | | |
Total equity | | | 2,133 | | | | 2,940 | |
| | | | | | | | |
Total liabilities and equity | | $ | 1,986,437 | | | $ | 1,985,892 | |
| | | | | | | | |
Page 15
Freddie Mac
Non-GAAP Reconciliations
$ Millions, Pre-Tax
| | | | | | | | | | | | | | | | | | | | | | |
| Reconciliation of GAAP Net Interest Income to Adjusted Net Interest Income | |
| | | | | 2Q
2015 | | | 3Q
2015 | | | 4Q
2015 | | | 1Q
2016 | | | 2Q
2016 | |
1 | | GAAP Net Interest Income | | $ | 3,969 | | | $ | 3,743 | | | $ | 3,587 | | | $ | 3,405 | | | $ | 3,443 | |
| | Reclassifications: | | | | | | | | | | | | | | | | | | | | |
2 | | Guarantee fee income reclassified out of net interest income(1), (2) | | | (1,547 | ) | | | (1,529 | ) | | | (1,550 | ) | | | (1,555 | ) | | | (1,781 | ) |
3 | | Accrual of periodic cash settlements reclassified into net interest income(3) | | | (532 | ) | | | (536 | ) | | | (559 | ) | | | (490 | ) | | | (420 | ) |
4 | | Amortization of options reclassified into net interest income (4) | | | (197 | ) | | | (186 | ) | | | (213 | ) | | | (281 | ) | | | (318 | ) |
5 | | Other reclassifications(5) | | | (339 | ) | | | (368 | ) | | | (284 | ) | | | (197 | ) | | | (253 | ) |
| | | | | | | | | | | | | | | | | | | | | | |
6 | | Total reclassifications | | $ | (2,615 | ) | | $ | (2,619 | ) | | $ | (2,606 | ) | | $ | (2,523 | ) | | $ | (2,772 | ) |
| | | | | | | | | | | | | | | | | | | | | | |
7 | | Adjusted Net Interest Income | | $ | 1,354 | | | $ | 1,124 | | | $ | 981 | | | $ | 882 | | | $ | 671 | |
| | | | | | | | | | | | | | | | | | | | | | |
Reconciliation of GAAP Guarantee Fee Income* to Adjusted Guarantee Fee Income | |
| | | | | 2Q
2015 | | | 3Q
2015 | | | 4Q
2015 | | | 1Q
2016 | | | 2Q
2016 | |
8 | | GAAP Guarantee Fee Income* | | $ | 92 | | | $ | 90 | | | $ | 100 | | | $ | 110 | | | $ | 124 | |
| | Reclassifications: | | | | | | | | | | | | | | | | | | | | |
9 | | Guarantee fee income reclassified from net interest income(1), (2) | | | 1,547 | | | | 1,529 | | | | 1,550 | | | | 1,555 | | | | 1,781 | |
10 | | Temporary Payroll Tax Cut Continuation Act of 2011 expense reclassified from other non-interest expense (6) | | | (235 | ) | | | (248 | ) | | | (262 | ) | | | (272 | ) | | | (280 | ) |
| | | | | | | | | | | | | | | | | | | | | | |
11 | | Total reclassifications | | | 1,312 | | | | 1,281 | | | | 1,288 | | | | 1,283 | | | | 1,501 | |
| | | | | | | | | | | | | | | | | | | | | | |
12 | | Adjusted Guarantee Fee Income | | $ | 1,404 | | | $ | 1,371 | | | $ | 1,388 | | | $ | 1,393 | | | $ | 1,625 | |
| | | | | | | | | | | | | | | | | | | | | | |
Reconciliation of GAAP Benefit (Provision) for Credit Losses to Adjusted Benefit (Provision) for Credit Losses | |
| | | | | 2Q
2015 | | | 3Q
2015 | | | 4Q
2015 | | | 1Q
2016 | | | 2Q
2016 | |
13 | | GAAP Benefit (Provision) for Credit Losses | | $ | 857 | | | $ | 528 | | | $ | 781 | | | $ | 467 | | | $ | 775 | |
| | Reclassifications: | | | | | | | | | | | | | | | | | | | | |
14 | | Mortgage loans reclassified from held-for-investment to held-for-sale(7) | | | (800 | ) | | | (485 | ) | | | (336 | ) | | | (64 | ) | | | (509 | ) |
15 | | Other reclassifications (8) | | | (177 | ) | | | (169 | ) | | | (80 | ) | | | (109 | ) | | | (139 | ) |
| | | | | | | | | | | | | | | | | | | | | | |
16 | | Total reclassifications | | | (977 | ) | | | (654 | ) | | | (416 | ) | | | (173 | ) | | | (648 | ) |
| | | | | | | | | | | | | | | | | | | | | | |
17 | | Adjusted Benefit (Provision) for Credit Losses | | $ | (120 | ) | | $ | (126 | ) | | $ | 365 | | | $ | 294 | | | $ | 127 | |
| | | | | | | | | | | | | | | | | | | | | | |
* Guarantee fee income on a GAAP basis is included in Other income (loss) on Freddie Mac’s consolidated statements of comprehensive income.
Note: Columns may not add due to rounding.
For notes on reclassifications, see page 17 of this press release.
Page 16
Freddie Mac
Notes on Non-GAAP Financial Measures
Second Quarter 2016 Financial Results
Notes on Significant Reclassifications
(1) Net guarantee fees are reclassified from GAAP net interest income to adjusted guarantee fee income.
(2) Implied guarantee fee income related to unsecuritized loans held in the mortgage investments portfolio is reclassified from GAAP net interest income to adjusted guarantee fee income.
(3) The accrual of periodic cash settlements of all derivatives is reclassified from GAAP derivative gains (losses) into adjusted net interest income to fully reflect the periodic cost associated with the protection provided by these contracts.
(4) Up-front cash paid or received upon the purchase or writing of option contracts is reclassified prospectively from GAAP derivative gains (losses) into adjusted net interest income over the contractual life of the instrument.
(5)Other reclassifications primarily relate to items reclassified out of GAAP net interest income including the amortization of premiums and discounts associated with the company’s participation certificates (PCs) and the loans underlying those PCs, and the accretion of other-than-temporary impairments on available-for-sale securities.
(6)The expense related to the Temporary Payroll Tax Cut Continuation Act of 2011 is reclassified from GAAP other non-interest expense to adjusted guarantee fee income. As a result of the reclassification, the revenue and expense related to the legislated 10 basis point increase are netted within adjusted guarantee fee income.
(7) The impact from the reclassification of seriously delinquent single-family mortgage loans from held-for-investment to held-for-sale is not included in adjusted benefit (provision) for credit losses.
(8) Other reclassifications primarily reflect interest rate concession adjustments related to the company’s modified loan population, which are reclassified from GAAP benefit (provision) for credit losses to adjusted net interest income.
Page 17