UNITED STATES
SECURITIES AND EXCHANGE COMMISSION
Washington, D.C. 20549
FORM N-CSR
CERTIFIED SHAREHOLDER REPORT OF REGISTERED
MANAGEMENT INVESTMENT COMPANIES
Investment Company Act file number: 811-08049
______________________________________________
RENAISSANCE CAPITAL GREENWICH FUNDS
______________________________________________________________________________
(Exact name of registrant as specified in charter)
100 FIRST STAMFORD PLACE, SUITE 403
STAMFORD, CONNECTICUT 06902
______________________________________________________________________________
(Address of principal executive offices)(Zip code)
(Name and Address of Agent for Service) |
State Street Bank and Trust Company Rebecca Gilding, Esq. One Lincoln Street, SUM0703 Boston, Massachusetts 02111 |
Registrant’s telephone number, including area code: (203) 622-2978
Date of fiscal year end: September 30th
Date of reporting period: September 30, 2021
Item 1: Shareholder Report
| (a) | The Report to Shareholders is attached herewith. |

Renaissance IPO ETF
Renaissance International IPO ETF
2021 Annual Report
September 30, 2021
Renaissance Capital LLC
Investors should consider the investment objectives, risks, charges and expenses carefully before investing. For a prospectus or summary prospectus with this and other information about the Funds, please visit our website at www.renaissancecapital.com/Docs/Renaissance-IPO-ETFs-Prospectus.pdf or call (866) 486-6645. Read the prospectus or summary prospectus carefully before investing.

Dear Shareholders,
Renaissance IPO ETF
For the period from October 1, 2020 to September 30, 2021, the Renaissance IPO ETF’s total return based on net asset value was 23.59% compared with 30.00% for the S&P® Index.*
During the period, the Fund underperformed the broad indexes of the equity market due to poor performance of the Consumer Discretionary and Financials sectors. Key detractors included video conferencing platform Zoom Video and connected fitness equipment maker Peloton.
Renaissance International IPO ETF
For the period from October 1, 2020 to September 30, 2021, the Renaissance International IPO ETF’s total return based on net asset value was -6.09% compared with 24.45% for the MSCI ACWI ex-US Index.*
During the period, the Fund underperformed the broad indexes of the equity market due to poor performance of the Information Technology and Consumer Staples sectors. Key detractors included Tencent-backed video-based social media platform Kuaishou and remote access software provider TeamViewer.
Thank you for being a shareholder of the Renaissance IPO ETFs.
Sincerely,
Tiffany Ng
Portfolio Manager
Renaissance Capital LLC
October 20, 2021
| * | Past performance is no guarantee of future results. Investment return and principal value will fluctuate. Investor shares, when redeemed, may be worth more or less than their original cost. Current performance may be lower or higher than the performance data quoted. Returns do not reflect the deduction of taxes a shareholder would pay on distributions or redemption of fund shares. Performance reflects fee waivers and/or expense limitations in effect. In their absence, performance would be reduced. The Funds’ prospectuses contain more complete information, including fees, expenses and risks involved in investing in initial public offerings and newly public companies and should be read carefully before investing. The S&P 500® Index (registered trademark of The McGraw-Hill Companies, Inc.) is an unmanaged index of 500 common stocks primarily traded on the New York Stock Exchange, weighted by market capitalization. Index performance includes the reinvestment of dividends and capital gains. The MSCI All Country World ex-U.S. Index is a passive index that captures large and mid-cap representation across 45 developed and emerging market countries, excluding the US. Developed and emerging market countries are defined based on company sizes, security sizes, security liquidity and certain market accessibility criteria. Developed countries are additionally subject to sustainability of economic development criteria. The index covers approximately 85% of the global equity market outside the US. |
| R e n a i s s a n c e C a p i t a l — T h e I P O E x p e r t P a g e 1 |
| Growth of a $10,000 Investment |
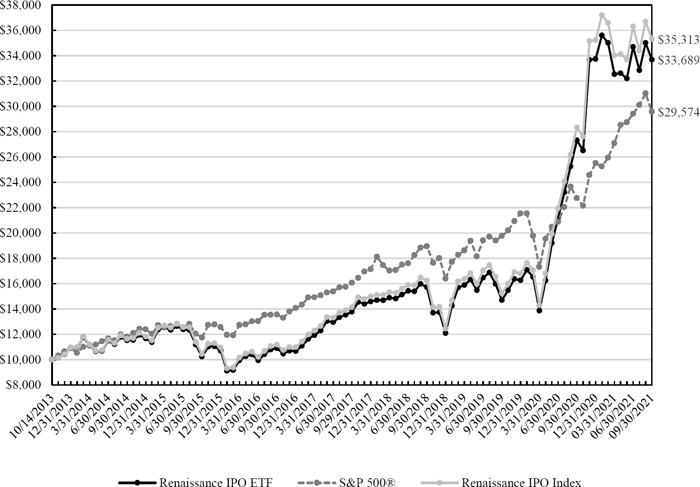
The line chart above represents the changes in value of a hypothetical $10,000 investment made in the Renaissance IPO ETF on 10/14/2013. Returns include the reinvestment of all Fund distributions. The returns do not reflect the deduction of taxes that a shareholder would pay on fund distributions or the redemption of fund shares. Investment return and principal value will fluctuate, so that shares, when redeemed, may be worth more or less than original cost. Past performance is not predictive of future performance. The current performance may be lower or higher than the performance data quoted. This chart is for illustrative purposes only and may not represent your returns. The Renaissance IPO Index is a passive index provided by an affiliate of the Advisor and is calculated independently by FTSE Russell. It represents the largest, most liquid, newly-listed U.S. IPOs. The Fund’s Total Operating Expense Ratio is 0.60%.
| | Average Annual Total Returns |
| | | | Since Inception |
| | 1 Year | 5 Year | (10/14/2013) |
| Renaissance IPO ETF | 23.59% | 25.32% | 16.47% |
| Renaissance IPO Index | 24.65% | 25.85% | 17.17% |
| S&P 500® | 30.00% | 16.90% | 14.58% |
| R e n a i s s a n c e C a p i t a l — T h e I P O E x p e r t P a g e 2 |
| Growth of a $10,000 Investment |
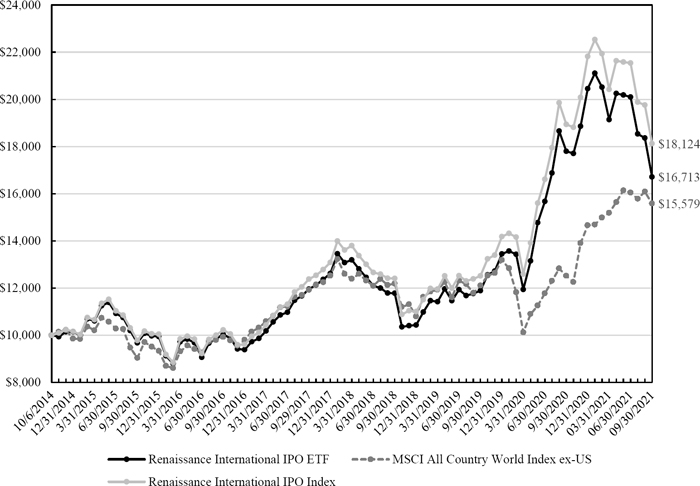
The line chart above represents the changes in value of a hypothetical $10,000 investment made in the Renaissance International IPO ETF on 10/06/2014. Returns include the reinvestment of all Fund distributions. The returns do not reflect the deduction of taxes that a shareholder would pay on fund distributions or the redemption of fund shares. Investment return and principal value will fluctuate, so that shares, when redeemed, may be worth more or less than original cost. Past performance is not predictive of future performance. The current performance may be lower or higher than the performance data quoted. This chart is for illustrative purposes only and may not represent your returns. The Renaissance International IPO Index is a passive index provided by an affiliate of the Advisor and independently calculated by FTSE Russell. It represents the largest, most liquid, newly-listed non-U.S. IPOs. The Fund’s Total Operating Expense Ratio is 0.80%.
| | Average Annual Total Returns |
| | | | Since Inception |
| | 1 Year | 5 Year | (10/06/2014) |
| Renaissance International IPO ETF | -6.09% | 10.74% | 7.63% |
| Renaissance International IPO Index | -4.30% | 12.13% | 8.88% |
| MSCI All Country World ex US | 24.45% | 9.44% | 6.55% |
| R e n a i s s a n c e C a p i t a l — T h e I P O E x p e r t P a g e 3 |
| Report of Independent Registered Public Accounting Firm |
To the Shareholders and Board of Trustees
of Renaissance Capital Greenwich Funds
Opinion on the Financial Statements
We have audited the accompanying statements of assets and liabilities of the Renaissance IPO ETF and the Renaissance International IPO ETF, each a series of shares of Renaissance Capital Greenwich Funds (the “Trust”), including the schedules of investments, as of September 30, 2021, the related statements of operations for the year then ended, the statements of changes in net assets for each of the two years in the period then ended, the financial highlights for each of the five years in the period then ended, and the related notes (collectively referred to as the “financial statements”). In our opinion, the financial statements present fairly, in all material respects, the financial position of the Funds as of September 30, 2021, the results of their operations for the year then ended, the changes in their net assets for each of the two years in the period then ended, and the financial highlights for each of the five years in the period then ended, in conformity with accounting principles generally accepted in the United States of America.
Basis for Opinion
These financial statements are the responsibility of the Funds’ management. Our responsibility is to express an opinion on the Funds’ financial statements based on our audits. We are a public accounting firm registered with the Public Company Accounting Oversight Board (United States) (“PCAOB”) and are required to be independent with respect to the Funds in accordance with the U.S. federal securities laws and the applicable rules and regulations of the Securities and Exchange Commission and the PCAOB. We have served as the auditor of one or more of the funds in the Trust since 1997.
We conducted our audits in accordance with the standards of the PCAOB. Those standards require that we plan and perform the audits to obtain reasonable assurance about whether the financial statements are free of material misstatement, whether due to error or fraud. The Funds are not required to have, nor were we engaged to perform, an audit of the Funds’ internal control over financial reporting. As part of our audits we are required to obtain an understanding of internal control over financial reporting, but not for the purpose of expressing an opinion on the effectiveness of the Funds’ internal control over financial reporting. Accordingly, we express no such opinion.
Our audits included performing procedures to assess the risks of material misstatement of the financial statements, whether due to error or fraud, and performing procedures that respond to those risks. Such procedures included examining, on a test basis, evidence regarding the amounts and disclosures in the financial statements. Our audits also included evaluating the accounting principles used and significant estimates made by management, as well as evaluating the overall presentation of the financial statements. Our procedures included confirmation of securities owned as of September 30, 2021 by correspondence with the custodian and other appropriate auditing procedures. We believe that our audits provide a reasonable basis for our opinion.
TAIT, WELLER & BAKER LLP
Philadelphia, Pennsylvania
November 19, 2021
| R e n a i s s a n c e C a p i t a l — T h e I P O E x p e r t P a g e 4 |
| Renaissance IPO ETF |
| Portfolio Summary (Unaudited) |
Top Ten Holdings
As of September 30, 2021
| | % of Net Assets |
| Moderna, Inc. | 9.2% |
| Uber Technologies, Inc. | 7.0% |
| Snowflake, Inc. | 5.7% |
| Zoom Video Communications, Inc. | 5.4% |
| Crowdstrike Holdings, Inc. | 4.7% |
| Palantir Technologies, Inc. | 3.8% |
| Datadog, Inc. | 3.2% |
| DoorDash, Inc. | 2.9% |
| Cloudflare, Inc. | 2.8% |
| Pinterest, Inc. | 2.7% |
(The ten largest holdings are subject to change, and there are no guarantees the Fund will continue to remain invested in any particular company.)
Holding By Industry
As of September 30, 2021
| | % of | | | % of |
| | Net Assets | | | Net Assets |
| Software | 27.3% | | Health Care Equipment & Supplies | 0.7% |
| Biotechnology | 12.5% | | Insurance | 0.5% |
| IT Services | 10.5% | | Food & Staples Retailing | 0.5% |
| Road & Rail | 8.9% | | Real Estate Management & Development | 0.4% |
| Internet & Direct Marketing Retail | 6.0% | | Commercial Services & Supplies | 0.4% |
| Life Sciences Tools & Services | 5.3% | | Building Products | 0.4% |
| Capital Markets | 4.3% | | Tobacco | 0.3% |
| Interactive Media & Services | 3.8% | | Professional Services | 0.3% |
| Leisure Equipment & Products | 3.0% | | Thrifts & Mortgage Finance | 0.2% |
| Automobiles | 2.7% | | Textiles, Apparel & Luxury Goods | 0.2% |
| Hotels, Restaurants & Leisure | 2.6% | | Household Products | 0.1% |
| Entertainment | 2.2% | | Specialty Retail | 0.1% |
| Health Care Providers & Services | 2.0% | | Trading Companies & Distributors | 0.1% |
| Consumer Finance | 1.8% | | Household Durables | 0.0% |
| Pharmaceuticals | 1.1% | | Short-Term Investments | 0.6% |
| Health Care Technology | 0.8% | | Liabilities less Other Assets | (0.3%) |
| Food Products | 0.7% | | Total | 100.0% |
| R e n a i s s a n c e C a p i t a l — T h e I P O E x p e r t P a g e 5 |
| Renaissance International IPO ETF |
| Portfolio Summary (Unaudited) |
Top Ten Holdings
As of September 30, 2021
| | % of Net Assets |
| Meituan | 10.3% |
| SoftBank Corp. | 10.1% |
| Haidilao International Holding Ltd. | 4.2% |
| Nexi SpA | 3.9% |
| Adevinta ASA | 3.6% |
| Knorr-Bremse AG | 3.5% |
| Kuaishou Technology | 3.4% |
| Hansoh Pharmaceutical Group Co. Ltd. | 3.1% |
| Innovent Biologics, Inc. | 2.9% |
| Lightspeed Commerce, Inc. | 2.8% |
| | |
(The ten largest holdings are subject to change, and there are no guarantees the Fund will continue to remain invested in any particular company.)
Holding By Industry
As of September 30, 2021
| | % of | | | % of |
| | Net Assets | | | Net Assets |
| Internet & Direct Marketing Retail | 15.7% | | Multiline Retail | 1.8% |
| Wireless Telecommunication Services | 11.1% | | Tobacco | 1.7% |
| Interactive Media & Services | 7.0% | | Metals & Mining | 1.3% |
| IT Services | 6.7% | | Beverages | 0.9% |
| Machinery | 6.1% | | Real Estate Investment Trusts (REITs) | 0.8% |
| Hotels, Restaurants & Leisure | 5.7% | | Diversified Telecommunication Services | 0.8% |
| Real Estate Management & Development | 5.6% | | Air Freight & Logistics | 0.7% |
| Software | 5.4% | | Health Care Providers & Services | 0.7% |
| Capital Markets | 4.4% | | Textiles, Apparel & Luxury Goods | 0.5% |
| Biotechnology | 4.2% | | Electronic Equipment, Instruments & Components | 0.5% |
| Pharmaceuticals | 4.0% | | Household Durables | 0.3% |
| Specialty Retail | 3.7% | | Health Care Equipment & Supplies | 0.2% |
| Life Sciences Tools & Services | 3.1% | | Household Products | 0.2% |
| Containers & Packaging | 2.6% | | Short-Term Investments | 0.6% |
| Food Products | 1.8% | | Other Assets less Liabilities | 0.1% |
| Electric Utilities | 1.8% | | Total | 100.0% |
| R e n a i s s a n c e C a p i t a l — T h e I P O E x p e r t P a g e 6 |
| Renaissance IPO ETF |
| Portfolio Of Investments |
| September 30, 2021 |
| Shares | | | | | Value (US$) | |
| | | | | COMMON STOCKS - 99.7% | | | | |
| | | | | COMMUNICATION SERVICES - 6.0% | | | | |
| | | | | Entertainment - 2.2% | | | | |
| | 10,231 | | | Endeavor Group Holdings, Inc. - Class A * (a) | | $ | 293,323 | |
| | 49,770 | | | Playtika Holding Corp. * | | | 1,375,145 | |
| | 95,555 | | | ROBLOX Corp. - Class A * | | | 7,219,180 | |
| | 279,210 | | | Tencent Music Entertainment Group - ADR * | | | 2,024,273 | |
| | | | | | | | 10,911,921 | |
| | | | | Interactive Media & Services - 3.8% | | | | |
| | 36,267 | | | Bumble, Inc. - Class A * | | | 1,812,625 | |
| | 23,057 | | | Kanzhun Ltd. - ADR * | | | 829,821 | |
| | 265,811 | | | Pinterest, Inc. - Class A * | | | 13,543,070 | |
| | 46,735 | | | ZoomInfo Technologies, Inc. - Class A * | | | 2,859,715 | |
| | | | | | | | 19,045,231 | |
| | | | | | | | 29,957,152 | |
| | | | | CONSUMER DISCRETIONARY - 14.6% | | | | |
| | | | | Automobiles - 2.7% | | | | |
| | 197,434 | | | Li Auto, Inc. - ADR * | | | 5,190,540 | |
| | 233,833 | | | XPeng, Inc. - ADR * | | | 8,310,425 | |
| | | | | | | | 13,500,965 | |
| | | | | Hotels, Restaurants & Leisure - 2.6% | | | | |
| | 76,230 | | | Airbnb, Inc. - Class A * | | | 12,787,583 | |
| | | | | | | | | |
| | | | | Household Durables - 0.0% | | | | |
| | 7,356 | | | Cricut, Inc. - Class A * (a) | | | 202,878 | |
| | | | | | | | | |
| | | | | Internet & Direct Marketing Retail - 6.0% | | | | |
| | 34,263 | | | Chewy, Inc. - Class A * | | | 2,333,653 | |
| | 183,143 | | | ContextLogic, Inc. - Class A * | | | 999,961 | |
| | 57,959 | | | Coupang, Inc. * | | | 1,614,158 | |
| | 30,718 | | | Dada Nexus Ltd. - ADR * | | | 615,589 | |
| | 69,094 | | | DoorDash, Inc. - Class A * | | | 14,231,982 | |
| | 149,493 | | | Farfetch Ltd. - Class A * | | | 5,602,998 | |
| | 14,520 | | | Fiverr International Ltd. * | | | 2,652,513 | |
| | 13,083 | | | Global-e Online Ltd. * | | | 939,359 | |
| | 17,928 | | | Ozon Holdings PLC - ADR * | | | 904,468 | |
| | | | | | | | 29,894,681 | |
| | | | | Leisure Equipment & Products - 3.0% | | | | |
| | 126,547 | | | Peloton Interactive, Inc. - Class A * | | | 11,015,916 | |
| | 18,380 | | | Hayward Holdings, Inc. * | | | 408,771 | |
| | 40,991 | | | YETI Holdings, Inc. * | | | 3,512,519 | |
| | | | | | | | 14,937,206 | |
| | | | | Specialty Retail - 0.1% | | | | |
| | 26,506 | | | Petco Health & Wellness Co., Inc. * | | | 559,277 | |
| | | | | | | | | |
| | | | | Textiles, Apparel & Luxury Goods - 0.2% | | | | |
| | 38,377 | | | Levi Strauss & Co. - Class A | | | 940,620 | |
| | | | | | | | 72,823,210 | |
| | | | | CONSUMER STAPLES - 1.6% | | | | |
| | | | | Food & Staples Retailing - 0.5% | | | | |
| | 74,389 | | | Albertsons Cos., Inc. - Class A (a) | | | 2,315,729 | |
| | | | | | | | | |
| | | | | Food Products - 0.7% | | | | |
| | 27,462 | | | Beyond Meat, Inc. * | | | 2,890,650 | |
| | 40,530 | | | Oatly Group AB - ADR * | | | 612,814 | |
| | | | | | | | 3,503,464 | |
| | | | | Household Products - 0.1% | | | | |
| | 26,036 | | | Reynolds Consumer Products, Inc. | | | 711,824 | |
| | | | | | | | | |
| | | | | Tobacco - 0.3% | | | | |
| | 349,550 | | | RLX Technology, Inc. - ADR * | | | 1,579,966 | |
| | | | | | | | 8,110,983 | |
See accompanying Notes to Financial Statements.
| R e n a i s s a n c e C a p i t a l — T h e I P O E x p e r t P a g e 7 |
| Renaissance IPO ETF |
| Portfolio Of Investments |
| September 30, 2021 (Continued) |
| Shares | | | | | Value (US$) | |
| | | | FINANCIALS - 6.8% | | | |
| | | | | Capital Markets - 4.3% | | | | |
| | 50,291 | | | Tradeweb Markets, Inc. - Class A | | $ | 4,062,507 | |
| | 93,193 | | | XP, Inc. - Class A * | | | 3,743,563 | |
| | 26,419 | | | Robinhood Markets, Inc. - Class A * (a) | | | 1,111,711 | |
| | 55,168 | | | Coinbase Global, Inc. - Class A * | | | 12,549,617 | |
| | | | | | | | 21,467,398 | |
| | | | | Consumer Finance - 1.8% | | | | |
| | 265,301 | | | Lufax Holding Ltd. - ADR * | | | 1,851,801 | |
| | 21,607 | | | Upstart Holdings, Inc. * | | | 6,837,319 | |
| | | | | | | | 8,689,120 | |
| | | | | Insurance - 0.5% | | | | |
| | 18,313 | | | Lemonade, Inc. * | | | 1,227,154 | |
| | 29,107 | | | Bright Health Group, Inc. * | | | 237,513 | |
| | 27,341 | | | Ryan Specialty Group Holdings, Inc. - Class A * | | | 926,040 | |
| | | | | | | | 2,390,707 | |
| | | | | Thrifts & Mortgage Finance - 0.2% | | | | |
| | 66,183 | | | Rocket Cos., Inc. - Class A | | | 1,061,575 | |
| | | | | | | | 33,608,800 | |
| | | | | HEALTH CARE - 22.4% | | | | |
| | | | | Biotechnology - 12.5% | | | | |
| | 23,726 | | | Beam Therapeutics, Inc. * | | | 2,064,399 | |
| | 38,584 | | | BioNTech SE - ADR * | | | 10,533,046 | |
| | 51,223 | | | Bridgebio Pharma, Inc. * | | | 2,400,822 | |
| | 25,454 | | | CureVac NV * | | | 1,390,298 | |
| | 119,207 | | | Moderna, Inc. * | | | 45,878,006 | |
| | | | | | | | 62,266,571 | |
| | | | | Health Care Equipment & Supplies - 0.7% | | | | |
| | 77,080 | | | Envista Holdings Corp. * | | | 3,222,715 | |
| | | | | | | | | |
| | | | | Health Care Providers & Services - 2.0% | | | | |
| | 32,613 | | | agilon health, Inc. * | | | 854,787 | |
| | 43,032 | | | Guardant Health, Inc. * | | | 5,379,430 | |
| | 49,677 | | | Oak Street Health, Inc. * | | | 2,112,763 | |
| | 30,028 | | | Progyny, Inc. * | | | 1,681,568 | |
| | | | | | | | 10,028,548 | |
| | | | | Health Care Technology - 0.8% | | | | |
| | 119,869 | | | Change Healthcare, Inc. * | | | 2,510,057 | |
| | 31,492 | | | GoodRx Holdings, Inc. - Class A * | | | 1,291,801 | |
| | | | | | | | 3,801,858 | |
| | | | | Life Sciences Tools & Services - 5.3% | | | | |
| | 40,072 | | | 10X Genomics, Inc. - Class A * | | | 5,833,682 | |
| | 12,142 | | | AbCellera Biologics, Inc. * | | | 243,326 | |
| | 52,146 | | | Adaptive Biotechnologies Corp. * | | | 1,772,442 | |
| | 277,867 | | | Avantor, Inc. * | | | 11,364,760 | |
| | 48,668 | | | Maravai LifeSciences Holdings, Inc. - Class A * | | | 2,388,625 | |
| | 76,756 | | | PPD, Inc. * | | | 3,591,413 | |
| | 47,617 | | | Sotera Health Co. * | | | 1,245,185 | |
| | | | | | | | 26,439,433 | |
| | | | | Pharmaceuticals - 1.1% | | | | |
| | 155,848 | | | Royalty Pharma PLC - Class A | | | 5,632,347 | |
| | | | | | | | 111,391,472 | |
| | | | | INDUSTRIALS - 10.1% | | | | |
| | | | | Building Products - 0.4% | | | | |
| | 52,511 | | | AZEK Co., Inc. * | | | 1,918,227 | |
| | | | | | | | | |
| | | | | Commercial Services & Supplies - 0.4% | | | | |
| | 56,327 | | | GFL Environmental, Inc. | | | 2,092,548 | |
| | | | | | | | | |
| | | | | Professional Services - 0.3% | | | | |
| | 76,721 | | | Dun & Bradstreet Holdings, Inc. * | | | 1,289,680 | |
| | 9,317 | | | Legalzoom.com, Inc. * | | | 245,969 | |
| | | | | | | | 1,535,649 | |
See accompanying Notes to Financial Statements.
| R e n a i s s a n c e C a p i t a l — T h e I P O E x p e r t P a g e 8 |
| Renaissance IPO ETF |
| Portfolio Of Investments |
| September 30, 2021 (Continued) |
| Shares | | | | | Value (US$) | |
| | | | | Road & Rail - 8.9% | | | | |
| | 152,176 | | | DiDi Global, Inc. - ADR * (a) | | $ | 1,185,451 | |
| | 39,632 | | | Full Truck Alliance Co. Ltd. - ADR * | | | 607,559 | |
| | 136,867 | | | Lyft, Inc. - Class A * | | | 7,334,702 | |
| | 15,956 | | | TuSimple Holdings, Inc. - Class A * | | | 592,446 | |
| | 774,066 | | | Uber Technologies, Inc. * | | | 34,678,157 | |
| | | | | | | | 44,398,315 | |
| | | | | Trading Companies & Distributors - 0.1% | | | | |
| | 16,756 | | | Core & Main, Inc. - Class A * | | | 439,175 | |
| | | | | | | | 50,383,914 | |
| | | | | INFORMATION TECHNOLOGY - 37.8% | | | | |
| | | | | IT Services - 10.5% | | | | |
| | 11,817 | | | Affirm Holdings, Inc. * | | | 1,407,759 | |
| | 123,834 | | | Cloudflare, Inc. - Class A * | | | 13,949,900 | |
| | 14,128 | | | Dlocal Ltd. * | | | 770,824 | |
| | 44,396 | | | Kingsoft Cloud Holdings Ltd. - ADR * | | | 1,257,295 | |
| | 21,834 | | | Marqeta, Inc. - Class A * | | | 482,968 | |
| | 20,572 | | | Shift4 Payments, Inc. - Class A * | | | 1,594,741 | |
| | 93,823 | | | Snowflake, Inc. - Class A * | | | 28,374,890 | |
| | 19,409 | | | Squarespace, Inc. - Class A * | | | 749,964 | |
| | 105,975 | | | StoneCo Ltd. - Class A * | | | 3,679,452 | |
| | | | | | | | 52,267,793 | |
| | | | | Software - 27.3% | | | | |
| | 67,288 | | | Anaplan, Inc. * | | | 4,097,166 | |
| | 12,009 | | | AppLovin Corp. - Class A * | | | 869,091 | |
| | 35,201 | | | Asana, Inc. - Class A * | | | 3,655,272 | |
| | 35,924 | | | Bill.com Holdings, Inc. * | | | 9,589,912 | |
| | 16,396 | | | C3.ai, Inc. - Class A * | | | 759,791 | |
| | 11,050 | | | Confluent, Inc. - Class A * | | | 659,132 | |
| | 94,479 | | | Crowdstrike Holdings, Inc. - Class A * | | | 23,221,049 | |
| | 111,315 | | | Datadog, Inc. - Class A * | | | 15,734,375 | |
| | 4,687 | | | DoubleVerify Holdings, Inc. * | | | 160,108 | |
| | 94,283 | | | Dynatrace, Inc. * | | | 6,691,265 | |
| | 33,358 | | | Elastic NV * | | | 4,970,008 | |
| | 45,451 | | | Lightspeed Commerce, Inc. * | | | 4,382,840 | |
| | 32,652 | | | McAfee Corp. - Class A | | | 721,936 | |
| | 1,779 | | | Monday.com Ltd. * | | | 580,310 | |
| | 26,885 | | | nCino, Inc. * | | | 1,909,642 | |
| | 778,682 | | | Palantir Technologies, Inc. - Class A * | | | 18,719,515 | |
| | 8,888 | | | Paycor HCM, Inc. * | | | 312,502 | |
| | 4,655 | | | Procore Technologies, Inc. * | | | 415,878 | |
| | 29,379 | | | Qualtrics International, Inc. - Class A * | | | 1,255,658 | |
| | 15,376 | | | SentinelOne, Inc. - Class A * | | | 823,692 | |
| | 21,652 | | | Tuya, Inc. - ADR * | | | 196,384 | |
| | 13,197 | | | UiPath, Inc. - Class A * | | | 694,294 | |
| | 71,327 | | | Unity Software, Inc. * | | | 9,005,034 | |
| | 102,387 | | | Zoom Video Communications, Inc. - Class A * | | | 26,774,200 | |
| | | | | | | | 136,199,054 | |
| | | | | | | | 188,466,847 | |
| | | | | REAL ESTATE - 0.4% | | | | |
| | | | | Real Estate Management & Development - 0.4% | | | | |
| | 12,009 | | | Compass, Inc. - Class A * (a) | | | 159,240 | |
| | 111,097 | | | KE Holdings, Inc. - ADR * | | | 2,028,631 | |
| | | | | | | | 2,187,871 | |
| | | | | | | | 2,187,871 | |
| | | | | | | | | |
| | | | | TOTAL COMMON STOCKS (Cost - $532,822,388) | | | 496,930,249 | |
See accompanying Notes to Financial Statements.
| R e n a i s s a n c e C a p i t a l — T h e I P O E x p e r t P a g e 9 |
| Renaissance IPO ETF |
| Portfolio Of Investments |
| September 30, 2021 (Continued) |
| Shares | | | | | Value (US$) | |
| | | | | SHORT-TERM INVESTMENTS - 0.6% | | | | |
| | 2,950,479 | | | State Street Navigator Securities Lending Government Money Market Portfolio (b) | | $ | 2,950,479 | |
| | | | | | | | | |
| | | | | TOTAL SHORT-TERM INVESTMENTS (Cost - $2,950,479) | | | 2,950,479 | |
| | | | | | | | | |
| | | | | TOTAL INVESTMENTS - 100.3% (Cost - $535,772,867) (c) | | $ | 499,880,728 | |
| | | | | LIABILITIES LESS OTHER ASSETS - (0.3) % | | | (1,347,642 | ) |
| | | | | | | | | |
| | | | | NET ASSETS - 100.0% | | $ | 498,533,086 | |
| * | Non-income producing security. |
| (a) | Securities (or a portion of the security) on loan. As of September 30, 2021, the market value of securities loaned was $2,827,174. The loaned securities were secured with cash collateral of $2,950,479. Collateral is calculated based on prior day’s prices. |
| (b) | Represents investments of cash collateral received in connection with securities lending. |
| (c) | Represents cost for financial reporting purposes. The cost for Federal income tax purposes is $535,891,930. At September 30, 2021, net depreciation for all securities was $36,011,202. This consists of aggregate gross unrealized appreciation of $5,672,056 and aggregate gross unrealized depreciation of $41,683,258. |
ADR - American Depositary Receipt
PLC - Public Limited Company
See accompanying Notes to Financial Statements.
| R e n a i s s a n c e C a p i t a l — T h e I P O E x p e r t P a g e 1 0 |
| Renaissance International IPO ETF |
| Portfolio Of Investments |
| September 30, 2021 |
| Shares | | | | | Value (US$) | |
| | | | | COMMON STOCKS - 99.3% | | | | |
| | | | | BRITAIN - 6.7% | | | | |
| | 183,176 | | | Airtel Africa PLC | | $ | 246,071 | |
| | 10,657 | | | Allfunds Group PLC * | | | 207,141 | |
| | 12,615 | | | Bridgepoint Group Ltd.* | | | 85,667 | |
| | 8,990 | | | Darktrace PLC * | | | 99,328 | |
| | 29,990 | | | Deliveroo PLC * | | | 116,861 | |
| | 24,186 | | | Dr. Martens PLC * | | | 128,398 | |
| | 5,320 | | | Pepco Group NV * | | | 68,218 | |
| | 50,503 | | | THG PLC * | | | 345,002 | |
| | 22,010 | | | Wise PLC - Class A * | | | 322,364 | |
| | | | | | | | 1,619,050 | |
| | | | | CANADA - 4.3% | | | | |
| | 6,950 | | | Lightspeed Commerce, Inc. * | | | 670,637 | |
| | 3,080 | | | Nuvei Corp.* | | | 352,841 | |
| | | | | | | | 1,023,478 | |
| | | | | CHINA - 41.1% | | | | |
| | 23,211 | | | Akeso, Inc. * | | | 127,614 | |
| | 41,818 | | | Blue Moon Group Holdings Ltd. (a) | | | 36,582 | |
| | 6,467 | | | CanSino Biologics, Inc. - Class H * | | | 228,453 | |
| | 126,906 | | | China Feihe Ltd. | | | 214,209 | |
| | 28,254 | | | China Resources Mixc Lifestyle Services Ltd. | | | 156,974 | |
| | 526,930 | | | Evergrande Property Services Group Ltd.*,(a) | | | 346,564 | |
| | 14,050 | | | Ganfeng Lithium Co. Ltd. - Class H | | | 249,789 | |
| | 266,077 | | | Haidilao International Holding Ltd. (a) | | | 1,016,846 | |
| | 6,001 | | | Hangzhou Tigermed Consulting Co. Ltd. - Class H | | | 127,734 | |
| | 288,662 | | | Hansoh Pharmaceutical Group Co. Ltd. | | | 734,202 | |
| | 11,867 | | | Hygeia Healthcare Holdings Co. Ltd. | | | 88,568 | |
| | 29,462 | | | InnoCare Pharma Ltd. * | | | 79,666 | |
| | 70,973 | | | Innovent Biologics, Inc. * | | | 688,337 | |
| | 35,650 | | | JD Health International, Inc. * | | | 343,922 | |
| | 7,450 | | | Jinke Smart Services Group Co. Ltd. - Class H | | | 41,821 | |
| | 30,595 | | | Jiumaojiu International Holdings Ltd. | | | 92,556 | |
| | 2,020 | | | Joinn Laboratories China Co. Ltd. - Class H | | | 27,350 | |
| | 75,920 | | | Kuaishou Technology *,(a) | | | 806,534 | |
| | 18,742 | | | Linklogis, Inc. - Class B *,(a) | | | 19,309 | |
| | 78,160 | | | Meituan - Class B * | | | 2,475,931 | |
| | 27,407 | | | Ming Yuan Cloud Group Holdings Ltd.* | | | 95,057 | |
| | 6,532 | | | Pharmaron Beijing Co. Ltd. - Class H | | | 156,322 | |
| | 6,743 | | | Poly Property Services Co. Ltd. - Class H (a) | | | 40,191 | |
| | 21,947 | | | Pop Mart International Group Ltd. *,(a) | | | 150,126 | |
| | 4,174 | | | Remegen Co. Ltd. - Class H * | | | 52,868 | |
| | 41,868 | | | Shandong Gold Mining Co. Ltd. - Class H | | | 74,113 | |
| | 10,689 | | | Shanghai Junshi Biosciences Co. Ltd. - Class H * | | | 54,374 | |
| | 122,048 | | | Shenwan Hongyuan Group Co. Ltd. - Class H | | | 32,297 | |
| | 9,086 | | | Shenzhen Hepalink Pharmaceutical Group Co. Ltd. - Class H | | | 9,863 | |
| | 37,228 | | | Shimao Services Holdings Ltd. | | | 76,994 | |
| | 85,449 | | | Smoore International Holdings Ltd. | | | 398,451 | |
| | 151,268 | | | Sunac Services Holdings Ltd.* | | | 312,848 | |
| | 86,720 | | | Topsports International Holdings Ltd. | | | 99,145 | |
| | 18,955 | | | WuXi AppTec Co. Ltd. - Class H | | | 443,399 | |
| | | | | | | | 9,899,009 | |
| | | | | FRANCE - 1.3% | | | | |
| | 4,241 | | | La Francaise des Jeux SAEM | | | 218,560 | |
| | 2,629 | | | Verallia SA | | | 90,750 | |
| | | | | | | | 309,310 | |
See accompanying Notes to Financial Statements.
| R e n a i s s a n c e C a p i t a l — T h e I P O E x p e r t P a g e 1 1 |
| Renaissance International IPO ETF |
| Portfolio Of Investments |
| September 30, 2021 (Continued) |
| Shares | | | | | Value (US$) | |
| | | | GERMANY - 9.8% | | | |
| | 8,305 | | | About You Holding SE * | | $ | 234,731 | |
| | 4,481 | | | Auto1 Group SE * | | | 163,866 | |
| | 7,857 | | | Knorr-Bremse AG | | | 843,131 | |
| | 1,746 | | | SUSE SA * | | | 71,555 | |
| | 2,697 | | | Synlab AG * | | | 64,200 | |
| | 7,703 | | | TeamViewer AG * | | | 226,549 | |
| | 24,371 | | | Traton SE | | | 626,709 | |
| | 3,358 | | | Vantage Towers AG | | | 114,047 | |
| | | | | | | | 2,344,788 | |
| | | | | HONG KONG - 2.3% | | | | |
| | 82,492 | | | Budweiser Brewing Co. APAC Ltd. | | | 209,180 | |
| | 89,349 | | | ESR Cayman Ltd. * | | | 271,445 | |
| | 31,370 | | | JS Global Lifestyle Co. Ltd. | | | 72,938 | |
| | | | | | | | 553,563 | |
| | | | | ITALY - 3.9% | | | | |
| | 50,682 | | | Nexi SpA * | | | 948,713 | |
| | | | | | | | | |
| | | | | JAPAN - 10.6% | | | | |
| | 1,734 | | | Freee KK * | | | 126,979 | |
| | 178,734 | | | SoftBank Corp. | | | 2,432,208 | |
| | | | | | | | 2,559,187 | |
| | | | | LUXEMBOURG - 1.0% | | | | |
| | 4,328 | | | Shurgard Self Storage SA | | | 237,382 | |
| | | | | | | | | |
| | | | | NETHERLANDS - 0.8% | | | | |
| | 2,974 | | | CTP NV | | | 64,765 | |
| | 4,066 | | | JDE Peet’s NV | | | 121,514 | |
| | | | | | | | 186,279 | |
| | | | | NORWAY - 3.6% | | | | |
| | 49,992 | | | Adevinta ASA * | | | 857,814 | |
| | | | | | | | | |
| | | | | PHILIPPINES - 0.7% | | | | |
| | 74,933 | | | Converge Information and Communications Technology Solutions, Inc. * | | | 58,760 | |
| | 286,321 | | | Monde Nissin Corp.* | | | 105,525 | |
| | | | | | | | 164,285 | |
| | | | | POLAND - 1.8% | | | | |
| | 18,813 | | | Allegro.eu SA * | | | 273,640 | |
| | 9,821 | | | InPost SA * | | | 162,565 | |
| | | | | | | | 436,205 | |
| | | | | RUSSIA - 0.3% | | | | |
| | 8,834 | | | Fix Price Group Ltd. - GDR | | | 79,373 | |
| | | | | | | | | |
| | | | | SPAIN - 1.8% | | | | |
| | 2,659 | | | Acciona SA | | | 441,063 | |
| | | | | | | | | |
| | | | | SWEDEN - 3.0% | | | | |
| | 13,744 | | | EQT AB | | | 574,603 | |
| | 8,330 | | | Nordnet AB publ | | | 149,769 | |
| | | | | | | | 724,372 | |
| | | | | SWITZERLAND - 2.3% | | | | |
| | 16,451 | | | SIG Combibloc Group AG * | | | 439,894 | |
| | 4,926 | | | Softwareone Holding AG* | | | 108,621 | |
| | | | | | | | 548,515 | |
| | | | | THAILAND - 4.0% | | | | |
| | 348,237 | | | Asset World Corp. PCL * | | | 47,962 | |
| | 293,957 | | | Central Retail Corp. PCL | | | 291,046 | |
| | 584,893 | | | PTT Oil & Retail Business PCL | | | 475,382 | |
| | 58,345 | | | SCG Packaging PCL (a) | | | 104,326 | |
| | 46,930 | | | Sri Trang Gloves Thailand PCL | | | 43,345 | |
| | | | | | | | 962,061 | |
| | | | | | | | | |
| | | | | TOTAL COMMON STOCKS (Cost - $25,699,015) | | | 23,894,447 | |
See accompanying Notes to Financial Statements.
| R e n a i s s a n c e C a p i t a l — T h e I P O E x p e r t P a g e 1 2 |
| Renaissance International IPO ETF |
| Portfolio Of Investments |
| September 30, 2021 (Continued) |
| Shares | | | | | Value (US$) | |
| | | | | SHORT-TERM INVESTMENTS - 0.6% | | | | |
| | 147,545 | | | State Street Navigator Securities Lending Government Money Market Portfolio (b) | | $ | 147,545 | |
| | | | | TOTAL SHORT-TERM INVESTMENTS (Cost - $147,545) | | | 147,545 | |
| | | | | | | | | |
| | | | | TOTAL INVESTMENTS - 99.9% (Cost - $25,846,560) (c) | | $ | 24,041,992 | |
| | | | | OTHER ASSETS LESS LIABILITIES - 0.1 % | | | 24,442 | |
| | | | | NET ASSETS - 100.0% | | $ | 24,066,434 | |
| * | Non-income producing security. |
| (a) | Securities (or a portion of the security) on loan. As of September 30, 2021, the market value of securities loaned was $1,619,717. The loaned securities were secured with cash collateral of $147,545 and non-cash collateral with a value of $1,566,364. The non-cash collateral received consists primarily of U.S. treasuries, and is held for the benefit of the Fund at the Fund’s custodian. The Fund cannot repledge or resell this collateral. Collateral is calculated based on prior day’s prices. |
| (b) | Represents investments of cash collateral received in connection with securities lending. |
| (c) | Represents cost for financial reporting purposes. The cost for Federal income tax purposes is $25,846,560. At September 30, 2021, net depreciation for all securities was $1,804,568. This consists of aggregate gross unrealized appreciation of $331,291 and aggregate gross unrealized depreciation of $2,135,859. |
GDR - Global Depositary Receipt
PLC - Public Limited Company
See accompanying Notes to Financial Statements.
| R e n a i s s a n c e C a p i t a l — T h e I P O E x p e r t P a g e 1 3 |
| Renaissance IPO ETFs |
| Statements Of Assets And Liabilities |
| September 30, 2021 |
| | | | | | Renaissance | |
| | | Renaissance IPO | | | International IPO | |
| | | ETF | | | ETF | |
| Assets | | | | | | | | |
| Investment Securities | | | | | | | | |
| At Cost | | $ | 535,772,867 | | | $ | 25,846,560 | |
| At Value* | | | 499,880,728 | | | | 24,041,992 | |
| Cash | | | 1,884,040 | | | | 4,688 | |
| Foreign Cash, at Value (Cost $0 and $113,437, respectively) | | | — | | | | 112,030 | |
| Receivable for Investments Sold | | | 3,193,906 | | | | — | |
| Dividends Receivable | | | 3,804 | | | | 74,934 | |
| Total Assets | | | 504,962,478 | | | | 24,233,644 | |
| | | | | | | | | |
| Liabilities | | | | | | | | |
| Payable Upon Receipt of Securities Loaned | | | 2,950,479 | | | | 147,545 | |
| Payable for Fund Shares Redeemed | | | 3,193,738 | | | | — | |
| Accrued Management Fees | | | 285,175 | | | | 19,665 | |
| Total Liabilities | | | 6,429,392 | | | | 167,210 | |
| Net Assets | | $ | 498,533,086 | | | $ | 24,066,434 | |
| | | | | | | | | |
| Net Assets Consist of: | | | | | | | | |
| Paid-in-Capital | | $ | 590,302,987 | | | $ | 29,312,202 | |
| Distributable earnings (accumulated loss) | | | (91,769,901 | ) | | | (5,245,768 | ) |
| Total Net Assets | | $ | 498,533,086 | | | $ | 24,066,434 | |
| | | | | | | | | |
| Net Asset Value Per Share | | $ | 64.33 | | | $ | 30.08 | |
| Shares Outstanding (unlimited amount authorized) | | | 7,750,000 | | | | 800,001 | |
| * Includes investments in securities on loan, at value | | $ | 2,827,174 | | | $ | 1,619,717 | |
See accompanying Notes to Financial Statements.
| R e n a i s s a n c e C a p i t a l — T h e I P O E x p e r t P a g e 1 4 |
| Renaissance IPO ETFs |
| Statement Of Operations |
| For the Year Ended September 30, 2021 |
| | | | | | Renaissance | |
| | | Renaissance IPO | | | International IPO | |
| | | ETF | | | ETF | |
| Investment Income | | | | | | | | |
| Dividends (net of foreign tax withheld of $941 and $57,844, respectively) | | $ | 575,448 | | | $ | 264,281 | |
| Securities Lending Income | | | 1,241,948 | | | | 34,113 | |
| Total Investment Income | | | 1,817,396 | | | | 298,394 | |
| | | | | | | | | |
| Expenses | | | | | | | | |
| Management Fees | | | 3,668,846 | | | | 277,836 | |
| Net Investment Income (Loss) | | | (1,851,450 | ) | | | 20,558 | |
| Net Realized and Unrealized Gain (Loss) on Investments and Foreign Currency | | | | | | | | |
| Net Realized Loss on Investments | | | (51,461,845 | ) | | | (3,378,426 | ) |
| Net Realized Gain (Loss) on In-Kind Transactions | | | 150,153,861 | | | | 3,486,741 | |
| Net Realized Gain (Loss) on Foreign Currency Transactions | | | — | | | | (77,349 | ) |
| Net Change in Unrealized Appreciation (Depreciation) on Investments | | | (48,385,844 | ) | | | (1,087,876 | ) |
| Net Change in Unrealized Appreciation (Depreciation) on Foreign Currency Translations | | | — | | | | 48 | |
| Net Realized and Unrealized Gain (Loss) on Investments and Foreign Currency | | | 50,306,172 | | | | (1,056,862 | ) |
| Net Increase (Decrease) in Net Assets Resulting from Operations | | $ | 48,454,722 | | | $ | (1,036,304 | ) |
See accompanying Notes to Financial Statements.
| R e n a i s s a n c e C a p i t a l — T h e I P O E x p e r t P a g e 1 5 |
| Renaissance IPO ETF |
| Statement Of Changes In Net Assets |
| | | Year Ended | | | Year Ended | |
| | | September 30, 2021 | | | September 30, 2020 | |
| Increase (Decrease) in Net Assets from Operations | | | | | | | | |
| Net Investment Loss | | $ | (1,851,450 | ) | | $ | (127,112 | ) |
| Net Realized Loss on Investments and Foreign Currency | | | (51,461,845 | ) | | | (1,130,296 | ) |
| Net Realized Gain on In-Kind Transactions | | | 150,153,861 | | | | 26,665,778 | |
| Net Change in Unrealized Appreciation (Depreciation) of Investments | | | (48,385,844 | ) | | | 17,634,206 | |
| Net Increase in Net Assets Resulting from Operations | | | 48,454,722 | | | | 43,042,576 | |
| | | | | | | | | |
| Distributions to Shareholders From | | | | | | | | |
| Retained Earnings | | | — | | | | (164,816 | ) |
| | | | | | | | | |
| Fund Share Transactions | | | | | | | | |
| Proceeds from Shares Sold | | | 1,258,868,139 | | | | 240,640,705 | |
| Cost of Shares Redeemed | | | (1,035,242,178 | ) | | | (99,482,559 | ) |
| Other Capital (Note 4) | | | 49,250 | | | | — | |
| Net Increase in Net Assets from Fund Share Transactions | | | 223,675,211 | | | | 141,158,146 | |
| Total Increase in Net Assets | | | 272,129,933 | | | | 184,035,906 | |
| | | | | | | | | |
| Net Assets | | | | | | | | |
| Beginning of Period | | | 226,403,153 | | | | 42,367,247 | |
| End of Period | | $ | 498,533,086 | | | $ | 226,403,153 | |
| | | | | | | | | |
| Increase (Decrease) in Fund Shares Issued | | | | | | | | |
| Number of Shares Sold | | | 19,350,000 | | | | 5,050,000 | |
| Number of Shares Redeemed | | | (15,950,000 | ) | | | (2,200,000 | ) |
| Net Increase in Fund Shares | | | 3,400,000 | | | | 2,850,000 | |
See accompanying Notes to Financial Statements.
| R e n a i s s a n c e C a p i t a l — T h e I P O E x p e r t P a g e 1 6 |
| Renaissance International IPO ETF |
| Statement Of Changes In Net Assets |
| | | Year Ended | | | Year Ended | |
| | | September 30, 2021 | | | September 30, 2020 | |
| Increase (Decrease) in Net Assets from Operations | | | | | | | | |
| Net Investment Income | | $ | 20,558 | | | $ | 129,702 | |
| Net Realized Gain (Loss) on Investments and Foreign Currency | | | (3,455,775 | ) | | | 214,114 | |
| Net Realized Gain on In-Kind Transactions | | | 3,486,741 | | | | 3,235,618 | |
| Net Change in Unrealized Depreciation of Investments and Foreign Currency | | | (1,087,828 | ) | | | (799,686 | ) |
| Net Increase (Decrease) in Net Assets Resulting from Operations | | | (1,036,304 | ) | | | 2,779,748 | |
| | | | | | | | | |
| Distributions to Shareholders From | | | | | | | | |
| Retained Earnings | | | (192,968 | ) | | | (13,599 | ) |
| | | | | | | | | |
| Fund Share Transactions | | | | | | | | |
| Proceeds from Shares Sold | | | 9,905,253 | | | | 43,426,867 | |
| Cost of Shares Redeemed | | | (23,262,765 | ) | | | (9,696,810 | ) |
| Net Increase (Decrease) in Net Assets from Fund Share Transactions | | | (13,357,512 | ) | | | 33,730,057 | |
| Total Increase (Decrease) in Net Assets | | | (14,586,784 | ) | | | 36,496,206 | |
| | | | | | | | | |
| Net Assets | | | | | | | | |
| Beginning of Period | | | 38,653,218 | | | | 2,157,012 | |
| End of Period | | $ | 24,066,434 | | | $ | 38,653,218 | |
| | | | | | | | | |
| Increase (Decrease) in Fund Shares Issued | | | | | | | | |
| Number of Shares Sold | | | 300,000 | | | | 1,400,000 | |
| Number of Shares Redeemed | | | (700,000 | ) | | | (300,000 | ) |
| Net Increase (Decrease) in Fund Shares | | | (400,000 | ) | | | 1,100,000 | |
See accompanying Notes to Financial Statements.
| R e n a i s s a n c e C a p i t a l — T h e I P O E x p e r t P a g e 1 7 |
| Renaissance IPO ETF |
| Financial Highlights |
| |
| For a Share Outstanding Throughout Each Year |
| | | Year Ended September 30, | |
| | | 2021 | | | 2020 | | | 2019 | | | 2018 | | | 2017 | |
| Net Assets Value, Beginning of Year | | $ | 52.05 | | | $ | 28.24 | | | $ | 30.26 | | | $ | 26.61 | | | $ | 21.15 | |
| Income (Loss) From Investment Operations | | | | | | | | | | | | | | | | | | | | |
| Net Investment Income (Loss)(1) | | | (0.19 | ) | | | (0.08 | ) | | | 0.16 | | | | 0.13 | | | | 0.13 | |
| Net Realized and Unrealized Gain (Loss) | | | 12.46 | | | | 24.02 | | | | (2.10 | ) | | | 3.63 | | | | 5.45 | |
| Total from Investment Operations | | | 12.27 | | | | 23.94 | | | | (1.94 | ) | | | 3.76 | | | | 5.58 | |
| Other Capital(1) | | | 0.01 | | | | 0.00 | | | | 0.00 | | | | 0.00 | | | | 0.00 | |
| Distribution to Shareholders From Net Investment Income | | | — | | | | (0.13 | ) | | | (0.08 | ) | | | (0.11 | ) | | | (0.12 | ) |
| Net Asset Value, End of Year | | $ | 64.33 | | | $ | 52.05 | | | $ | 28.24 | | | $ | 30.26 | | | $ | 26.61 | |
| Total Return(2) | | | 23.59 | % | | | 85.18 | % | | | (6.43 | )% | | | 14.13 | % | | | 26.45 | % |
| Ratios and Supplemental Data | | | | | | | | | | | | | | | | | | | | |
| Net Assets, End of Year (000s) | | $ | 498,533 | | | $ | 226,403 | | | $ | 42,367 | | | $ | 19,668 | | | $ | 14,638 | |
| Ratio of Net Expenses to Average Net Assets | | | 0.60 | % | | | 0.60 | % | | | 0.60 | % | | | 0.60 | % | | | 0.60 | % |
| Ratio of Net Investment Income (Loss) to Average Net Assets | | | (0.30 | )% | | | (0.21 | )% | | | 0.53 | % | | | 0.45 | % | | | 0.57 | % |
| Portfolio Turnover Rate(3) | | | 156 | % | | | 152 | % | | | 92 | % | | | 192 | % | | | 159 | % |
| (1) | Calculated using average shares method. |
| (2) | Total return is calculated assuming a purchase of shares at net asset value on the first day and a sale at net asset value on the last day of each year reported. Distributions are assumed, for the purpose of this calculation, to be reinvested at net asset value per share on the payment date. Broker commission charges are not included in this calculation. |
| (3) | Portfolio turnover rate excludes securities received or delivered from in-kind processing of creations or redemptions. |
See accompanying Notes to Financial Statements.
| R e n a i s s a n c e C a p i t a l — T h e I P O E x p e r t P a g e 1 8 |
| Renaissance International IPO ETF |
| Financial Highlights |
| |
| For a Share Outstanding Throughout Each Year |
| | | Year Ended September 30, | |
| | | 2021 | | | 2020 | | | 2019 | | | 2018 | | | 2017 | |
| Net Assets Value, Beginning of Year | | $ | 32.21 | | | $ | 21.57 | | | $ | 22.47 | | | $ | 23.00 | | | $ | 19.50 | |
| Income (Loss) From Investment Operations | | | | | | | | | | | | | | | | | | | | |
| Net Investment Income(1) | | | 0.02 | | | | 0.42 | | | | 0.29 | | | | 0.22 | | | | 0.26 | |
| Net Realized and Unrealized Gain (Loss) | | | (1.95 | ) | | | 10.27 | | | | (0.20 | ) | | | (0.54 | ) | | | 3.45 | |
| Total from Investment Operations | | | (1.93 | ) | | | 10.69 | | | | 0.09 | | | | (0.32 | ) | | | 3.71 | |
| Distribution to Shareholders | | | | | | | | | | | | | | | | | | | | |
| From Net Investment Income | | | (0.13 | ) | | | (0.05 | ) | | | (0.19 | ) | | | (0.21 | ) | | | (0.21 | ) |
| From Realized Gain on Investments | | | (0.07 | ) | | | — | | | | (0.80 | ) | | | — | | | | — | |
| Net Asset Value, End of Year | | $ | 30.08 | | | $ | 32.21 | | | $ | 21.57 | | | $ | 22.47 | | | $ | 23.00 | |
| Total Return(2) | | | (6.09 | )% | | | 49.65 | % | | | 0.95 | % | | | (1.43 | )% | | | 19.08 | % |
| Ratios and Supplemental Data | | | | | | | | | | | | | | | | | | | | |
| Net Assets, End of Year (000s) | | $ | 24,066 | | | $ | 38,653 | | | $ | 2,157 | | | $ | 2,247 | | | $ | 2,300 | |
| Ratio of Net Expenses to Average Net Assets | | | 0.80 | % | | | 0.80 | % | | | 0.80 | % | | | 0.80 | % | | | 0.80 | % |
| Ratio of Net Investment Income to Average Net Assets | | | 0.06 | % | | | 1.46 | % | | | 1.41 | % | | | 0.92 | % | | | 1.31 | % |
| Portfolio Turnover Rate(3) | | | 137 | % | | | 127 | % | | | 80 | % | | | 107 | % | | | 88 | % |
| (1) | Calculated using average shares method. |
| (2) | Total return is calculated assuming a purchase of shares at net asset value on the first day and a sale at net asset value on the last day of each year reported. Distributions are assumed, for the purpose of this calculation, to be reinvested at net asset value per share on the payment date. Total return for periods of less than one year is not annualized. Broker commission charges are not included in this calculation. |
| (3) | Portfolio turnover rate excludes securities received or delivered from in-kind processing of creations or redemptions. |
See accompanying Notes to Financial Statements.
| R e n a i s s a n c e C a p i t a l — T h e I P O E x p e r t P a g e 1 9 |
| Renaissance IPO ETFs |
| Notes to Financial Statements |
| For the Year Ended September 30, 2021 |
The Renaissance IPO ETF and the Renaissance International IPO ETF (each a “Fund” and collectively, the “Funds”) are a series of Renaissance Capital Greenwich Funds (“the Trust”), a Delaware Trust, operating as a registered, non-diversified, open-end investment company under the Investment Company Act of 1940, as amended (“1940 Act”). The Trust, organized on February 3, 1997, may issue an unlimited number of shares of the Funds. The shares of the Funds are referred to herein as “Shares.” The Renaissance IPO ETF commenced operations on October 14, 2013 and the Renaissance International IPO ETF commenced operations on October 6, 2014. The financial statements herein relate solely to those of the Funds.
The Funds are exchange-traded funds (“ETFs”). As ETFs, the Funds trade like other publicly-traded securities and are designed to track an index. Unlike shares of a mutual fund, which can be bought from and redeemed by the issuing fund by all shareholders at a price based on net asset value (“NAV”), Shares of the Funds may be directly purchased from and redeemed by a Fund at NAV solely by certain large institutional investors. The Shares of the Funds are listed on the NYSE Arca (the “Exchange”), and trade in the secondary market at market prices that may differ from the Shares’ NAV.
1. SIGNIFICANT ACCOUNTING POLICIES: The following is a summary of significant accounting policies followed by the Funds in preparation of their financial statements. These policies are in conformity with accounting principles generally accepted in the United States of America (“GAAP”). The preparation of financial statements in conformity with GAAP requires management to make estimates and assumptions that affect the reported amounts of assets and liabilities and disclosure of contingent assets and liabilities at the date of the financial statements and the reported amounts of increases and decreases in net assets from operations during the reporting period. Actual results could differ from those estimates. These financial statements are presented in United States dollars.
Each Fund is an investment company and accordingly follows the investment company accounting and reporting guidance of the Financial Accounting Standards Board (FASB) Accounting Standard Codification Topic 946 “Financial Services - Investment Companies”.
A. FOREIGN CURRENCY TRANSLATIONS: Values of investments denominated in foreign currencies are converted into U.S. dollars using the current exchange rates each business day. Purchases and sales of investments and dividend income are translated into U.S. dollars using the current prevailing exchange rate on the transaction date. The effect of changes in foreign exchange rates on realized and unrealized gains or losses on securities is reflected as a component of such gains or losses. Transactions in foreign denominated assets may involve greater risks than domestic transactions.
B. SECURITY VALUATION: The values of the Funds’ securities are based on the securities’ closing prices on their principal markets, where available. In the absence of a last reported sales price, values may be based on the mean between the last bid and ask prices, if available. For restricted securities, as well as securities or other assets for which market quotations are not readily available or are unreliable, those securities are to be valued at fair value using good faith estimates as determined in accordance with the Trust’s Fund Securities Valuation Procedures, which is approved annually by the Board of Trustees (the “Board”). There is no single standard for determining the fair value of such securities. Rather, in determining the fair value of a security, the Fair Value Committee, after consulting with representatives of the Fund’s Adviser, Renaissance Capital LLC (the “Advisor”), and/or the Fund’s Administrator, State Street Bank and Trust, shall take into account the relevant factors and surrounding circumstances, a few of which may include: (i) market prices for a security or securities deemed comparable, including the frequency of trades or quotes for the security and comparable securities; (ii) dealer valuations of a security or securities deemed comparable; (iii) short-term instruments with maturities of 60 days or less at the date of the purchase are valued at amortized cost, which approximates fair value; short-term instruments with maturities greater than 60 days at the date of purchase are valued at the midpoint between the latest available and representative asked and bid prices, and commencing 60 days prior to maturity such securities are valued at amortized cost; and (iv) determinations of value by one or more pricing services for a security or securities deemed comparable. The Funds may also use fair value pricing in a variety of circumstances, including, but not limited to, situations where the value of a security in a Fund’s portfolio has been materially affected by events occurring after the close of the market on which the security is principally traded, or where trading in a security has been suspended or halted. Fair value pricing involves subjective judgments and it is possible that a fair value determination for a security is materially different than the value that could be realized upon the sale of the security. In addition, fair value pricing could result in a difference between the prices used to calculate the NAV of the Funds and the prices used by each of the Funds’ benchmark indices, the Renaissance IPO Index and the Renaissance International IPO Index, respectively (the “Indices”). This may adversely affect the Funds’ ability to track the Indices.
The Funds utilize various methods to measure the fair value of most of their investments on a recurring basis. GAAP establishes a hierarchy that prioritizes inputs to valuation methods. The three levels of input are:
| R e n a i s s a n c e C a p i t a l — T h e I P O E x p e r t P a g e 2 0 |
| Renaissance IPO ETFs |
| Notes to Financial Statements |
| For the Year Ended September 30, 2021 (Continued) |
Level 1 – Unadjusted quoted prices in active markets for identical assets and liabilities that the Funds have the ability to access.
Level 2 – Observable inputs other than quoted prices included in Level 1 that are observable for the asset or liability, either directly or indirectly. These inputs may include quoted prices for the identical instrument on an inactive market, prices for the identical instrument on an inactive market, prices for similar instruments, interest rates, prepayment speeds, credit risk, yield curves, default rates and similar data.
Level 3 – Unobservable inputs for the asset or liability, to the extent relevant observable inputs are not available, representing the Funds’ own assumptions about the assumptions a market participant would use in valuing the asset or liability and would be based on the best information available.
The inputs or methodology used for valuing securities are not necessarily an indication of the risk associated with investing in those securities. At September 30, 2021, all of the Funds’ investments were valued based on Level 1 inputs, except as noted and detailed on the Portfolio of Investments.
Transfers between investment levels may occur as the markets fluctuate and/or the availability of data used in an investment’s valuation changes.
C. INVESTMENT INCOME: Dividend income is recorded on the ex-dividend date. Interest income, if any, is recorded on an accrual basis.
D. INVESTMENT TRANSACTIONS: Security transactions are accounted for on a trade date basis for financial reporting purposes. In determining the gain or loss from the sale of securities, the cost of securities sold is determined on the basis of identified cost.
2. FEDERAL INCOME TAXES: It is the Funds’ intention to qualify as a regulated investment company under Subchapter M of the Internal Revenue Code and to distribute all of their taxable income to relieve them from all, or substantially all, Federal income and excise taxes. Accordingly, no provision for Federal income taxes is required in the financial statements.
The Funds may be subject to foreign taxes on income, gains on investments, or currency repatriation, a portion of which may be recoverable. The Funds will accrue such taxes and recoveries as applicable, based upon their current interpretation of tax rules and regulations that exist in the markets in which the Funds invest.
The Funds recognize the tax benefits of uncertain tax positions only when the position is “more likely than not” to be sustained assuming examination by tax authorities. Management has reviewed the tax positions in the open tax years (current and prior years, as applicable) or expected to be taken in the Funds’ 2021 tax returns and concluded that no liability for unrecognized tax benefits should be recorded related to uncertain tax positions taken in the above open tax years. The Funds identify their major tax jurisdictions as U.S. Federal and foreign jurisdictions where the Funds make significant investments.
The components of accumulated earnings on a tax basis were as follows:
| Renaissance IPO ETF | | 2021 | |
| Undistributed Ordinary Income | | $ | — | |
| Undistributed Long-Term Gains | | | — | |
| Capital Loss Carry Forwards | | | (54,467,887 | ) |
| Post October and Late Year Losses | | | (1,290,812 | ) |
| Unrealized Depreciation | | | (36,011,202 | ) |
| Total Accumulated Earnings | | $ | (91,769,901 | ) |
| | | | | |
| Renaissance International IPO ETF | | 2021 | |
| Undistributed Ordinary Income | | $ | — | |
| Undistributed Long-Term Gains | | | — | |
| Capital Loss Carry Forwards | | | (3,383,232 | ) |
| Post October and Late Year Losses | | | (56,791 | ) |
| Unrealized Depreciation | | | (1,805,745 | ) |
| Total Accumulated Earnings | | $ | (5,245,768 | ) |
| R e n a i s s a n c e C a p i t a l — T h e I P O E x p e r t P a g e 2 1 |
| Renaissance IPO ETFs |
| Notes to Financial Statements |
| For the Year Ended September 30, 2021 (Continued) |
The difference between book basis and tax basis unrealized appreciation, accumulated net realized loss on investments and accumulated net investment loss is primarily attributable to the tax deferral of losses on wash sales and adjustments for real estate investment trusts and partnerships.
Capital loss carry forwards are available through the date specified below to offset future realized net capital gains for federal income tax purposes. Future capital loss carryover utilization in any given year may be subject to Internal Revenue Code limitations. To the extent future gains are offset by capital loss carry forwards, such gains will not be distributed. As of September 30, 2021, the Renaissance IPO ETF and Renaissance International IPO ETF had non- expiring short term capital loss carry forwards of $53,570,673 and $3,070,909, respectively and long term capital loss carry forwards of $897,214 and $312,323, respectively.
The Renaissance IPO ETF has elected to defer losses incurred from November 1, 2020 through September 30, 2021 in accordance with federal income tax rules. These losses are treated as having arisen on the first day of the following fiscal year. As of September 30, 2021, Renaissance IPO ETF did not post any October loss deferrals.
As of September 30, 2021, Renaissance IPO ETF and Renaissance International IPO ETF has late year ordinary loss deferrals of $1,290,812 and $56,791, respectively.
The tax character of distributions paid during the year ended September 30, 2021 was ordinary income of $0 and $ 192,968 for the Renaissance IPO ETF and Renaissance International IPO ETF, respectively. The tax character of distributions paid during the year ended September 30, 2020 was ordinary income of $164,816 and $13,599 for the Renaissance IPO ETF and Renaissance International IPO ETF, respectively.
A. DISTRIBUTIONS TO SHAREHOLDERS: The Funds will normally distribute substantially all of their net investment income at least annually. Any realized net capital gains will be distributed annually. The Funds may also pay a special distribution at any time to comply with U.S. federal tax requirements. All distributions are recorded on the ex-dividend date. The amount and character of income and capital gain distributions to be paid are determined in accordance with Federal income tax regulations, which may differ from GAAP. These “book/tax” differences are considered either temporary (e.g., deferred losses, capital loss carryforwards) or permanent in nature. To the extent these differences are permanent in nature, such amounts are reclassified within the composition of net assets based on their federal tax-basis treatment; temporary differences do not require reclassification. Any such reclassifications will have no effect on net assets, results of operations, or net asset values per share of the Funds.
Permanent book and tax differences resulted in reclassifications for the fiscal year ended September 30, 2021 as follows:
| | | Increase (Decrease) | | Distributable earnings |
| | | to Paid-In Capital | | (accumulated loss) |
| Renaissance IPO ETF | | $147,999,904 | | $(147,999,904) |
| Renaissance International IPO ETF | | 3,486,742 | | (3,486,742) |
For the year ended September 30, 2021, the Renaissance IPO ETF and the Renaissance International IPO ETF reclassified non-taxable security gain/ loss realized on the in-kind redemption of Creation Units (Note 4) as an increase to paid-in-capital in the Statement of Assets and Liabilities in the amounts of $150,153,861 and $3,486,741, respectively.
| R e n a i s s a n c e C a p i t a l — T h e I P O E x p e r t P a g e 2 2 |
| Renaissance IPO ETFs |
| Notes to Financial Statements |
| For the Year Ended September 30, 2021 (Continued) |
3. FEES AND EXPENSES
A. MANAGEMENT FEE: The Advisor serves as investment advisor to the Funds pursuant to an investment management agreement between the Trust and the Advisor (the “Investment Management Agreement”). Under the Investment Management Agreement, the Advisor, subject to the supervision of the Board and in conformity with the stated investment policies of the Funds, manages the investment of the Funds’ assets. The Advisor is responsible for placing purchase and sale orders and providing continuous supervision of the investment portfolio of the Funds.
Pursuant to a Supervision and Administration Agreement between the Trust, on behalf of the Funds, and the Advisor, the Advisor oversees the operation of the Funds, provides or causes to be furnished the advisory, supervisory, administrative, distribution, transfer agency, custody and all other services necessary for the Funds to operate, and exercises day-to-day oversight over the Funds’ service providers. Under the Supervision and Administration Agreement, the Advisor also bears all the fees and expenses incurred in connection with its obligations under the Supervision and Administration Agreement, including, but not limited to, the costs of various third-party services required by the Funds, including audit, certain custody, portfolio accounting, legal, transfer agency and printing costs, except those fees and expenses specifically assumed by the Trust on behalf of the Funds.
Pursuant to the terms of each of the Investment Management Agreement and the Supervision and Administration Agreement, the Trust has agreed to indemnify the Advisor for certain liabilities, including certain liabilities arising under the federal securities laws, unless such loss or liability results from willful misfeasance, bad faith or gross negligence in the performance of its duties or the reckless disregard of its obligations and duties. The Investment Management Agreement also provides that the Advisor may engage in other businesses, devote time and attention to any other business, whether of a similar or dissimilar nature, and render investment advisory services to others.
As compensation for its services, the Advisor is paid a monthly management fee for providing investment advisory, supervisory, administrative and other services the Funds require under an all-in fee structure based on a percentage of the Funds’ average daily net assets at the annual rate of 0.60% for Renaissance IPO ETF and 0.80% for Renaissance International IPO ETF.
The Funds also bear certain other expenses, which are specifically excluded from being covered under the management fee and the Supervision and Administration Agreement (“Excluded Expenses”) and may vary and will affect the total level of expenses paid by the Funds. Such Excluded Expenses include taxes, brokerage fees, commissions and other transaction expenses, interest and extraordinary expenses (such as litigation and indemnification expenses). The Funds also bear asset-based custodial fees not covered by the Supervision and Administration Agreement.
B. DISTRIBUTION AND SERVICING FEES: Foreside Fund Services, LLC (the “Distributor”) serves as the distributor of the Shares of the Funds. The Board of Trustees of the Trust has adopted a distribution and services plan (the “Plan”) pursuant to Rule 12b-1 under the 1940 Act. Under the Plan, the Funds are authorized to pay distribution fees in connection with the sale and distribution of their Shares and pay service fees in connection with the provision of ongoing services to shareholders and the maintenance of shareholder accounts in an amount up to 0.25% of the Funds’ average daily net assets each year. No Rule 12b-1 fees are currently paid by the Funds, and there are no current plans to impose these fees. However, in the event Rule 12b-1 fees are charged in the future, because these fees are paid out of the Funds’ assets on an ongoing basis, these fees will increase the cost of your investment in the Funds.
4. SHAREHOLDER TRANSACTIONS: The Funds issue and redeem Shares at NAV only in a large specified number of Shares each called a “Creation Unit,” or multiples thereof. Creation Units are sold to and from institutional brokers through participation agreements. Except when aggregated in Creation Units, Shares of the Funds are not redeemable. Such transactions generally consist of the in-kind deposit of a designated portfolio of equity securities (the “Deposit Securities”) that comprise the Index and an amount of cash computed as described below (the “Cash Component”) or, as permitted or required by the Funds, of cash. The Cash Component together with the Deposit Securities, as applicable, are referred to as the “Fund Deposit,” which represents the minimum initial and subsequent investment amount for Shares. The Cash Component represents the difference between the NAV of a Creation Unit and the market value of Deposit Securities and may include a Dividend Equivalent Payment. The “Dividend Equivalent Payment” enables the Funds to make a complete distribution of dividends on the next dividend payment date, and is an amount equal, on a per Creation Unit basis, to the dividends on all the securities held by the Funds (“Fund Securities”) with ex-dividend dates within the accumulation period for such distribution (the “Accumulation Period”), net of expenses and liabilities for such period, as if all of the Fund Securities had been held by the Trust for the entire Accumulation Period. The Accumulation Period begins on the ex-dividend date for the Funds and ends on the next ex-dividend date. Transactions in capital shares for the Funds are disclosed in detail in the Statements of Changes in Net Assets.
| R e n a i s s a n c e C a p i t a l — T h e I P O E x p e r t P a g e 2 3 |
| Renaissance IPO ETFs |
| Notes to Financial Statements |
| For the Year Ended September 30, 2021 (Continued) |
A fixed transaction fee of $300 per Creation Unit for the Renaissance IPO ETF and $1,000 per Creation Unit for the Renaissance International IPO ETF, regardless of the number of Creation Units that are created or redeemed on the same day, is charged to the institutional broker creating or redeeming Creation Units. An additional variable fee may be charged for certain transactions. Transaction fees are received by the Trust and/or Custodian and are used to defray related expenses. The amounts are included in Other Capital on the Statements of Changes in Net Assets.
5. INDEMNIFICATION: Under the Funds’ organizational documents, their officers and trustees are indemnified against certain liabilities arising out of the performance of their duties for the Funds. In addition, in the normal course of business, the Funds may enter into contracts with vendors that contain a variety of representations and warranties that provide general indemnification. The Funds’ maximum exposure under these arrangements is unknown, as this would involve future claims that may be made against the Funds. However, based on experience, the risk of loss due to these warranties appears to be remote.
6. INVESTMENT TRANSACTIONS: For the year ended September 30, 2021, the Renaissance IPO ETF had in-kind contributions of $1,258,868,139 in-kind redemptions of $1,035,242,177 and an in-kind net realized gain of $150,153,861. For the year ended September 30, 2021, the Renaissance International IPO ETF had in-kind contributions of $9,905,253 in-kind redemptions of $23,262,766 and an in-kind net realized gain of $3,486,741.
The in-kind contributions and in-kind redemptions shown above may not agree with the Fund Share Transactions on the Statements of Changes in Net Assets. The amounts shown above represent the accumulation of each Fund’s daily net shareholder transactions while the Statements of Changes in Net Assets reflect gross shareholder transactions including any cash component of the transaction.
The length of time the Funds have held a particular security is not generally a consideration in investment decisions. A change in the securities held by each Fund is known as “portfolio turnover.” The Funds may engage in frequent and active trading of portfolio securities to achieve their investment objective, including, without limitation, to reflect changes in the component securities of the Index, such as reconstitutions or additions or deletions of component securities. To the extent that Creation Unit purchases from and redemptions by the Funds are effected in cash, frequent purchases and redemptions may increase the rate of portfolio turnover. High portfolio turnover involves correspondingly greater expenses to the Funds, including brokerage commissions or dealer mark-ups and other transaction costs on the sale of securities and reinvestments in other securities. Such sales may also result in realization of taxable capital gains, including short-term capital gains (which are generally taxed at ordinary income tax rates). The trading costs and tax effects associated with portfolio turnover may adversely affect the Funds’ performance. The portfolio turnover rates are reported in the Financial Highlights.
For the year ended September 30, 2021, the Renaissance IPO ETF made purchases with a cost of $2,141,826,319 and sales with proceeds of $1,914,909,925 of investment securities (excluding short-term securities, including in-kind transactions of $1,232,380,175 in purchases and $1,006,329,797 in sales) and the Renaissance International IPO ETF made purchases with a cost of $55,354,973 and sales with proceeds of $ 70,105,507 of investment securities (excluding short-term securities, including in-kind transactions of $8,760,312 in purchases and $22,059,416 in sales).
7. SECURITIES LENDING: The Funds may lend their portfolio securities to brokers, dealers and other financial institutions desiring to borrow securities to complete transactions and for other purposes. In connection with such loans, the Funds receive liquid collateral equal to at least 102% for U.S. securities and 105% for international securities of the value of the portfolio securities being loaned. This collateral is marked-to-market on a daily basis. Although the Funds will receive collateral in connection with all loans of its securities holdings, the Funds would be exposed to a risk of loss should a borrower fail to return the borrowed securities (e.g., the loaned securities may have appreciated beyond the value of the collateral held by the Funds) or become insolvent. The Funds may pay fees to the party arranging the loan of securities. In addition, the Funds will bear the risk of loss of any cash collateral that it invests. The Funds will then invest the cash collateral received in the State Street Navigator Securities Lending Government Money Market Portfolio, and record a liability for the return of the collateral, during the period the securities are on loan. Non-cash collateral is not disclosed in the Fund’s Statement of Assets and Liabilities as it is held by the lending agent on behalf of the Fund and the Fund does not have the ability to re-hypothecate those securities. The Funds are subject to a lending limit of 33⅓% of total assets (including the value of collateral).
The loans are subject to termination at the option of the borrower or the Funds. Upon termination of the loan, the borrower will return to the lender securities identical to the loaned securities. Should the borrower of the securities fail to return loaned securities, the Funds have the right to repurchase the securities using the collateral in the open market.
| R e n a i s s a n c e C a p i t a l — T h e I P O E x p e r t P a g e 2 4 |
| Renaissance IPO ETFs |
| Notes to Financial Statements |
| For the Year Ended September 30, 2021 (Continued) |
The borrower pays fees at the Funds’ direction to the lending agent. The lending agent may retain a portion of the fees and interest earned on the cash collateral invested as compensation for its services. Investments made with the cash collateral are disclosed on the Schedules of Investments. The lending fees and the Funds’ portion of the interest income earned on the cash collateral are included on the Statements of Operations as securities lending income.
See the Portfolio of Investments for information about the value of the securities on loan and their related collateral. The loaned securities are subject to enforceable netting arrangements and as of September 30, 2021, the value of the related collateral exceeded the value of the securities loaned.
| | | | | | Gross Amounts not offset in the | |
| | | | | | Statement of Financial Position | |
| | | | | | Gross Amounts | | | Net Amounts | | | | | | | | | | |
| | | Gross Amounts | | | Offset in the | | | Presented in the | | | | | | Collateral | | | | |
| | | of Recognized | | | Statement of | | | Statement of | | | Financial | | | Pledged | | | Net | |
| Securities Lending | | Liabilities | | | Financial Position | | | Financial Position | | | Instruments | | | (Received) | | | Amount | |
| Renaissance IPO ETF | | $ | 2,950,479 | | | $ | — | | | $ | 2,950,479 | | | $ | 2,950,479 | (a) | | $ | — | | | $ | — | |
| Renaissance International IPO ETF | | $ | 147,545 | | | $ | — | | | $ | 147,545 | | | $ | 147,545 | (a) | | $ | — | | | $ | — | |
(a) Collateral for securities on loan is included in the Schedule of Investments
The following tables represent the amount of payables for cash collateral received on securities on loan as shown on the Statements of Assets and Liabilities for the year ended September 30, 2021:
| | | Remaining Contractual Maturity of the Agreements | |
| Renaissance IPO ETF | | As of September 30, 2021 | |
| | | Overnight and | | | | | | Between | | | | | | | |
| Securities Lending Transactions | | Continuous | | | <30 days | | | 30 & 90 days | | | >90 days | | | Total | |
| Common Stocks | | $ | 2,950,479 | | | $ | — | | | $ | — | | | $ | — | | | $ | 2,950,479 | |
| Total Borrowings | | $ | 2,950,479 | | | $ | — | | | $ | — | | | $ | — | | | $ | 2,950,479 | |
| Gross amount of recognized liabilities for securities lending transactions | | | | | | | | | | | | | | | | | | $ | 2,950,479 | |
| | | | | | | | | | | | | | | | | | | | | |
| | | Remaining Contractual Maturity of the Agreements | |
| Renaissance International IPO ETF | | As of September 30, 2021 | |
| | | Overnight and | | | | | | Between | | | | | | | |
| Securities Lending Transactions | | Continuous | | | <30 days | | | 30 & 90 days | | | >90 days | | | Total | |
| Common Stocks | | $ | 147,545 | | | $ | — | | | $ | — | | | $ | — | | | $ | 147,545 | |
| Total Borrowings | | $ | 147,545 | | | $ | — | | | $ | — | | | $ | — | | | $ | 147,545 | |
| Gross amount of recognized liabilities for securities lending transactions | | | | | | | | | | | | | | | | | | $ | 147,545 | |
8. PRINCIPAL RISKS: Investors in the Funds should be willing to accept a high degree of volatility in the price of the Funds’ Shares and the possibility of significant losses. An investment in the Funds involves a substantial degree of risk. The Funds are subject to the principal investment risks noted below, any of which may adversely affect the Funds’ NAV, trading price, yield, total return and ability to meet its investment objective. Therefore, you should consider carefully the following risks before investing in the Funds. In the normal course of business the Funds trade financial instruments and enter into financial transactions where risk of potential loss exists due to such things as changes in the market (market risk) or failure or inability of the other party to a transaction to perform (credit and counterparty risk). See below for a detailed description of selected principal risks. For a more comprehensive list of potential risks the Funds may be subject to, please see the Funds’ Prospectus.
A. RISK OF INVESTING IN IPOs. The Funds invest in companies that have recently completed an initial public offering. The stocks of such companies are unseasoned equities lacking a trading history, a track record of reporting to investors, widely available research coverage and may have a limited operating history. IPOs are thus often subject to extreme price volatility and speculative trading. These stocks may have above-average price appreciation in connection with the initial public offering prior to inclusion in the Indices. The price of stocks included in the Indices may not continue to appreciate and the performance of these stocks may not replicate the performance exhibited in the past. In addition, IPOs share similar illiquidity risks of private equity and venture capital. The free float shares held by the public in an IPO are typically a small percentage of the market
| R e n a i s s a n c e C a p i t a l — T h e I P O E x p e r t P a g e 2 5 |
| Renaissance IPO ETFs |
| Notes to Financial Statements |
| For the Year Ended September 30, 2021 (Continued) |
capitalization. The ownership of many IPOs often include large holdings by venture capital and private equity investors who seek to sell their shares in the public market in the months following an IPO when shares restricted by lock -up are released, causing greater volatility and possible downward pressure during the time that locked-up shares are released.
B. FINANCIAL SECTOR RISK. Financial companies frequently represent the largest sector in the Renaissance International IPO Index. Financial companies are especially subject to the adverse effects of economic recession, currency exchange rates, government regulation, decreases in the availability of capital, volatile interest rates, portfolio concentrations in geographic markets and in commercial and residential real estate loans, and competition from new entrants in their fields of business.
C. INFORMATION TECHNOLOGY RISK. Information technology companies frequently represent the largest sector in the Renaissance IPO Index. Information technology companies are generally subject to the risks of rapidly changing technologies; short product life cycles; fierce competition; aggressive pricing and reduced profit margins; the loss of patent, copyright and trademark protections; cyclical market patterns; evolving industry standards; and frequent new product introductions. Information technology companies may be smaller and less experienced companies, with limited product lines, markets or financial resources and fewer experienced management or marketing personnel. Information technology company stocks, especially those which are internet-related, have experienced extreme price and volume fluctuations that are often unrelated to their operating performance.
D. SMALL AND MID-CAPITALIZATION COMPANY RISK. The Funds invest in small and mid-capitalization companies. Such companies may be more vulnerable to adverse general market or economic developments, and their securities may be less liquid and may experience greater price volatility than larger, more established companies as a result of several factors, including limited trading volumes, products or financial resources, management inexperience and less publicly available information. Accordingly, such companies are generally subject to greater market risk than larger, more established companies.
E. DEPOSITARY RECEIPT RISK. The Funds may hold the securities of non-U.S. companies in the form of ADRs and GDRs. ADRs are negotiable certificates issued by a U.S. financial institution that represent a specified number of shares in a foreign stock and trade on a U.S. national securities exchange, such as the New York Stock Exchange. GDRs are certificates issued in more than one country for shares in a foreign company. The shares are held by a foreign branch of an international bank. The shares trade as domestic shares, but are offered for sale globally through the various bank branches. Sponsored ADRs or GDRs are issued with the support of the issuer of the foreign stock underlying the ADRs or GDRs and carry all of the rights of common shares, including voting rights. The underlying securities of the ADRs and GDRs in the Funds’ portfolios are usually denominated or quoted in currencies other than the U.S. Dollar. As a result, changes in foreign currency exchange rates may affect the value of the Funds’ portfolios. In addition, because the underlying securities of ADRs or GDRs trade on foreign exchanges at times when the U.S. markets are not open for trading, the value of the securities underlying the ADRs or GDRs may change materially at times when the U.S. markets are not open for trading, regardless of whether there is an active U.S. market for shares of the Funds.
F. REIT RISK. Investments in securities of real estate companies involve risks. These risks include, among others, adverse changes in foreign, national, state or local real estate conditions; obsolescence of properties; changes in the availability, cost and terms of mortgage funds; and the impact of changes in environmental laws. In addition, a Real Estate Investment Trust (a “REIT”) that fails to comply with foreign or domestic tax requirements affecting REITs may be subject to income taxation, including the U.S. federal tax requirement that a REIT distribute substantially all of its net income to its shareholders may result in a REIT having insufficient capital for future expenditures. The value of a REIT can depend on the structure of and cash flow generated by the REIT. In addition, like mutual funds, REITs have expenses, including advisory and administration fees that are paid by their shareholders. As a result, you will absorb duplicate levels of fees when the Funds invest in REITs. In addition, REITs are subject to certain provisions under federal tax law. The failure of a company to qualify as a REIT could have adverse consequences for a Fund, including significantly reducing return to the Fund on its investment in such company.
G. PARTNERSHIP UNIT RISK. Investments in partnership units, such as master limited partnerships and trusts, involve risks that differ from an investment in common stock. Holders of partnership units have more limited control and limited rights to vote on matters affecting the partnership. There are also certain tax risks associated with an investment in partnership units. In addition, conflicts of interest may exist between common unit holders, subordinated unit holders and the general partner of a partnership, including a conflict arising as a result of incentive distribution payments.
H. NON -U.S. ISSUER RISK. Certain companies in which the Funds may invest may be non-U.S. issuers whose securities are listed on U.S. exchanges. These securities involve risks beyond those associated with investments in U.S. securities, including greater market volatility, higher transactional costs, the possibility that the liquidity of such securities could be impaired because of future political and/or economic developments, such as the imposition of trading restrictions with or economic sanctions on
| R e n a i s s a n c e C a p i t a l — T h e I P O E x p e r t P a g e 2 6 |
| Renaissance IPO ETFs |
| Notes to Financial Statements |
| For the Year Ended September 30, 2021 (Continued) |
foreign countries, taxation by foreign governments, political instability, and the possibility that foreign governmental restrictions may be adopted which might adversely affect such securities. The selection of securities of non-U.S. issuers may be more difficult because there may be less publicly available information concerning such non-U.S. issuers or the accounting, auditing and financial reporting standards, practices and requirements applicable to non-U.S. issuers may differ from those applicable to U.S. issuers. Current political uncertainty surrounding the European Union (the “EU”) and its membership, including uncertainty around the effects of the United Kingdom’s exit from the EU in January 2020, may increase market volatility and illiquidity, and may potentially lower economic growth in markets in the United Kingdom, the EU and globally.
I. EMERGING MARKETS RISK. The funds may invest a portion of their portfolios in securities of issuers located in emerging markets. Emerging market companies involve certain risks not associated with investing in developed market countries because emerging market countries are often in the initial stages of their industrialization cycles and have low per capita income. These increased risks include the possibility of investment and trading limitations, unexpected market closures, greater liquidity concerns, higher price volatility, greater delays and possibility of disruptions in settlement transactions, greater political uncertainties and greater dependence on international trade or development assistance. In addition, emerging market countries may be subject to overburdened infrastructures and environmental problems. Companies in emerging market countries generally may be subject to less stringent regulatory, financial reporting, recordkeeping, accounting and auditing standards than companies in more developed countries, and information about such companies may be less available and reliable. Securities law and the enforcement of systems of taxation in many emerging market countries may change quickly and unpredictably, and the ability to bring and enforce actions may be limited. The Funds are not actively managed and do not select investments based on investor protection considerations.
J. EQUITY SECURITIES RISK. The value of the equity securities held by the Funds may fall due to general market and economic conditions, perceptions regarding the markets in which the issuers of securities held by the Funds participate, or factors relating to specific issuers in which the Funds invest. Equity securities are subordinated to preferred securities and debt in a company’s capital structure with respect to priority in right to a share of corporate income, and therefore will be subject to greater dividend risk than preferred securities or debt instruments. In addition, while broad market measures of equity securities have historically generated higher average returns than fixed income securities, equity securities have also experienced significantly more volatility in those returns.
K. MARKET RISK. The prices of the securities in the Funds are subject to the risk associated with investing in the securities market, including general economic conditions and sudden and unpredictable drops in value. An investment in the Funds may lose money.
L. INDEX TRACKING RISK. The Funds’ returns may not match the returns of the Indices for a number of reasons. For example, a Fund incurs a number of operating expenses not applicable to its Index and incurs costs associated with buying and selling securities, especially when rebalancing a Fund’s securities holdings to reflect changes in the composition of its Index. Because the Funds bear the costs and risks associated with buying and selling securities while such costs and risks are not factored into the returns of the Indices, the Funds’ returns may deviate significantly from the returns of the Indices. In addition, the Funds may not be able to invest in certain securities included in the Indices or invest in them in the exact proportions in which they are represented in the Indices, due to legal restrictions or other limitations. To the extent that a Fund calculates its NAV based on fair value prices and the value of the Index is based on securities’ closing prices, a Fund’s ability to track its Index may be adversely affected.
M. REPLICATION MANAGEMENT RISK. An investment in the Funds involves risks similar to those of investing in any fund of equity securities traded on an exchange, such as market fluctuations caused by such factors as economic and political developments, changes in interest rates and perceived trends in security prices. However, because the Funds are not “actively” managed, unless a specific security is removed from one of the Indices, the Funds generally would not sell a security because the security’s issuer was in financial trouble. Therefore, the Funds’ performance could be lower than funds that may actively shift their portfolio assets to take advantage of market opportunities or to lessen the impact of a market decline or a decline in the value of one or more issuers.
N. PREMIUM/DISCOUNT RISK. Disruptions to creations and redemptions, the existence of extreme market volatility or potential lack of an active trading market for Shares may result in Shares trading at a significant premium or discount to NAV. This occurs because shares are offered and purchased at market price and not the NAV. If a shareholder purchases Shares at a time when the market price is at a premium to the NAV or sells Shares at a time when the market price is at a discount to the NAV, the shareholder may sustain losses.
O. NON-DIVERSIFIED RISK. The Funds are classified as a “non-diversified” investment company under the 1940 Act. Therefore, the Funds may invest a relatively high percentage of their assets in a smaller number of issuers or may invest a larger proportion of their assets in a single company. As a result, the gains and losses on a single investment may have a greater impact on the Funds’ NAV and may make the Funds more volatile than more diversified funds. The Funds may be particularly vulnerable to this risk because they seek to replicate indices that are comprised of a limited number of securities.
| R e n a i s s a n c e C a p i t a l — T h e I P O E x p e r t P a g e 2 7 |
| Renaissance IPO ETFs |
| Notes to Financial Statements |
| For the Year Ended September 30, 2021 (Continued) |
P. CONCENTRATION RISK . A Fund’s assets may be concentrated in a particular sector or sectors or industry or group of industries to the extent its Index concentrates in a particular sector or sectors or industry or group of industries. The Funds may be subject to the risk that economic, political or other conditions that have a negative effect on that sector or industry will negatively impact the Funds to a greater extent than if the Funds’ assets were invested in a wider variety of sectors or industries.
Q. PORTFOLIO TURNOVER RISK. The Funds may engage in frequent trading of its portfolio securities in connection with the rebalancing or adjustment of the Indices. A portfolio turnover rate of 200%, for example, is equivalent to the Fund buying and selling of its securities two times during the course of a year. A high portfolio turnover rate (such as 100% or more) could result in high brokerage costs for a Fund. While a high portfolio turnover rate can result in an increase in taxable capital gain distributions to a Fund’s shareholders, the Funds will seek to utilize the in-kind creation and redemption mechanism to minimize realization of capital gains to the extent possible.
R. SECURITIES LENDING RISK. The Funds may engage in securities lending. Securities lending involves the risk that the fund may lose money because the borrower of the Funds’ loaned securities fails to return the securities in a timely manner or at all. The Funds could also lose money in the event of a decline in the value of the collateral provided for the loaned securities or a decline in the value of any investments made with cash collateral. These events could also trigger adverse tax consequences for the Funds.
S. CUSTODY RISK. The Renaissance International IPO ETF invests in securities on non-U.S. exchanges. Custody risk refers to risks in the process of clearing and settling trades and to the holding of securities by local banks, agents and depositories. Low trading volumes and volatile prices in less developed markets make trades harder to complete and settle. Local agents are held only to the standard of care of the local markets. Governments or trade groups may compel local agents to hold securities in designated depositories that are subject to independent evaluation. The less developed a country’s securities market is, the greater the likelihood of custody problems occurring.
T. CURRENCY RISK. The Funds hold investments that are denominated in non-U.S. currencies, or in securities that provide exposure to such currencies, currency exchange rates or interest rates denominated in such currencies. Changes in currency exchange rates and the relative value of non-U.S. currencies will affect the value of the Funds’ investment and the value of the Funds’ Shares. Currency exchange rates can be very volatile and can change quickly and unpredictably. As a result, the value of an investment in the Funds may change quickly and without warning and you may lose money.
U. VALUATION RISK. The sales price the Renaissance International IPO ETF could receive for a security may differ from the Fund’s valuation of the security and may differ from the value used by the Renaissance International IPO Index, particularly for securities that trade in low value or volatile markets or that are valued using a fair value methodology. Because non-U.S. exchanges may be open on days when the Fund does not price its Shares, the value of the securities in the Renaissance International IPO ETF portfolio may change on days when shareholders will not be able to purchase or sell the Fund’s Shares.
V. AUTHORIZED PARTICIPANT CONCENTRATION RISK. Only an authorized participant may engage in creation or redemption transactions directly with the Funds. The Funds have a limited number of institutions that act as authorized participants. To the extent that these institutions exit the business or are unable to proceed with creation and/or redemption orders with respect to the Funds and no other authorized participant is able to step forward to create or redeem Creation Units (as defined above), Fund shares may trade at a discount to NAV and possibly face trading halts and/or delisting. This risk may be more pronounced in volatile markets, potentially where there are significant redemptions in ETFs generally.
W. OTHER RISKS. The current outbreak of the novel strain of coronavirus, COVID-19, has resulted in instances of market closures and dislocations, extreme volatility, liquidity constraints and increased trading costs. Efforts to contain the spread of COVID-19 have resulted in travel restrictions, closed international borders, disruptions of healthcare systems, business operations and supply chains, layoffs, lower consumer demand, defaults and other significant economic impacts, all of which have disrupted global economic activity across many industries and may exacerbate other pre-existing political, social and economic risks, locally or globally. The ongoing effects of COVID-19 are unpredictable and may result in significant and prolonged effects on the Funds’ performance.
9. SUBSEQUENT EVENTS: The Funds are required to recognize in the financial statements the effects of all subsequent events that provide additional evidence about conditions that existed at the date of the Statement of Assets and Liabilities. For non-recognized subsequent events that must be disclosed to keep the financial statements from being misleading, the Funds are required to disclose the nature of the event as well as an estimate of their financial effect, or a statement that such an estimate cannot be made. Management has determined that there were no subsequent events to report through the issuance of these financial statements.
| R e n a i s s a n c e C a p i t a l — T h e I P O E x p e r t P a g e 2 8 |
| Renaissance IPO ETFs |
| Other Information |
| For the Year Ended September 30, 2021 (Unaudited) |
Proxy Voting Policies and Procedures and Records
Information regarding how the Funds voted proxies related to portfolio securities during the year ended June 30 as well as a description of the policies and procedures that the Funds use to determine how to vote proxies is available without charge, upon request, by calling 1-866-486-6645 or by referring to the SEC’s website at http://www.sec.gov.
Quarterly Portfolio Schedule
The Funds file their complete schedule of portfolio holdings with the SEC for the first and third quarters of each fiscal year on Form N -PORT. Previously, the Trust filed a complete schedule of portfolio holdings with the SEC for the first and third quarters of each fiscal year on Form N-Q. The Trust’s Forms N-PORT and N-Q are available on the SEC’s website at www.sec.gov.
Discount/Premium Information
Information regarding how often shares of each Fund traded on NYSE Arca at a price above (i.e., at a premium) or below (i.e., at a discount) the Net Asset Value of the Fund during the past calendar year, when available can be found at www.renaissancecapital.com.
Cost of Investing
Shareholders of the Funds will incur two types of costs: (1) transaction costs, which may include creation and redemption fees or brokerage charges and (2) ongoing costs, including management fees and other Fund expenses. The following example is intended to help the shareholder understand the ongoing cost (in dollars) of investing in the Funds and to compare these costs with the ongoing costs of investing in other funds.
This example is based on an investment of $1,000 invested at the beginning of the period and held for the entire six month period ended September 30, 2021.
Actual Expenses: The first line of the table below provides information about actual account values and actual expenses. You may use the information in this line, together with the amount you invested, to estimate the expenses that you paid over the period. Simply divide your account value by $1,000 (for example, an $8,600 account value divided by $1,000 = 8.6), then multiply the result by the number in the first line under the heading entitled “Expenses Paid During Period” to estimate the expenses you paid on your account during the period.
Hypothetical Examples for Comparison Purposes
The second line of the table below provides information about hypothetical account values and hypothetical expenses based on the Funds’ actual expense ratio and an assumed rate of return of 5% per year before expenses, which is not the Funds’ actual return. Thus, you should not use the hypothetical account values and expenses to estimate the actual ending account balance or your expenses for the period. Rather, these figures are provided to enable you to compare the ongoing costs of investing in the Funds and other funds. To do so, compare this 5% hypothetical example with the 5% hypothetical examples that appear in the shareholder reports of the other funds. The Renaissance IPO ETF charges a transaction fee of $300 per Creation Unit and the Renaissance International IPO ETF charges a transaction fee of $1,000 per Creation Unit to those persons creating or redeeming Creation Units. If you buy or sell the Funds’ shares in the secondary market, you will incur customary brokerage commissions and charges.
Please note that the expenses shown in the table are meant to highlight your ongoing costs only and do not reflect any transaction costs, such as creation and redemption fees, or brokerage charges. Therefore, the second line of the table is useful in comparing ongoing costs only, and will not help you determine the relative total costs of owning different funds. In addition, if these transaction costs were included, your costs would have been higher.
| | | Beginning | | Ending | | Expenses Paid | | |
| | | Account Value | | Account Value | | During Period* | | Annualized |
| | | (4/1/21) | | (9/30/21) | | (4/1/21-9/30/21) | | Expense Ratio |
| Renaissance IPO ETF | | | | | | | | |
| Actual | | $1,000 | | $1,036 | | 3.06% | | 0.60% |
| Hypothetical | | $1,000 | | $1,022 | | 3.04% | | 0.60% |
| (5% return before expenses) | | | | | | | | |
| | | | | | | | | |
| Renaissance International IPO ETF | | | | | | | | |
| Actual | | $1,000 | | $873 | | 3.76% | | 0.80% |
| Hypothetical | | $1,000 | | $1,021 | | 4.05% | | 0.80% |
| (5% return before expenses) | | | | | | | | |
| * | Expenses are equal to the Funds’ annualized net expense ratio multiplied by the average account value of the period, multiplied by the number of days in the most recent six month period, then divided by 365. |
| R e n a i s s a n c e C a p i t a l — T h e I P O E x p e r t P a g e 2 9 |
| Renaissance IPO ETFs |
| Other Information |
| For the Year Ended September 30, 2021 (Unaudited) (Continued) |
Additional Tax Information
For federal income tax purposes, the following information is furnished with respect to the distributions of the Trust for its fiscal year ended September 30, 2021.
Dividend Received Deduction
The percentage of distributions which qualify for the corporate dividends received is 0% for both the Renaissance IPO ETF and Renaissance International IPO ETF Fund.
Foreign Taxes Credit
Renaissance International IPO ETF Fund designates $55,919 as foreign taxes paid and $313,985 as foreign source income earned for regular Federal income tax purposes.
Qualified Dividend Income
A portion of dividends distributed by the Fund during the fiscal year ended September 30, 2021 is considered qualified dividend income and is eligible for reduced tax rates. These lower rates range from 5% to 20% depending on the individual’s tax bracket. The Renaissance IPO ETF Fund and Renaissance International IPO ETF Fund had qualified dividend income of $318,616 and $176,894, respectively, for the year ended September 30, 2021.
Long Term Capital Gains
Renaissance IPO ETF and Renaissance International IPO ETF had no long term capital gain dividends during the year ended September 30, 2021.
| R e n a i s s a n c e C a p i t a l — T h e I P O E x p e r t P a g e 3 0 |
| Trustees and Officers (Unaudited) |
Name
Address
Date of Birth | Position(s)
Held with Trust | Length of
Service1 | Principal Occupation(s)
During Past 5 Years | Number of
Portfolios in
Fund
Complex
Overseen2 | Other
Directorships
Held |
| Independent Trustees |
Warren K. Greene*
100 First Stamford Place,
Suite 403
Stamford, CT 06902
02/36 | Independent Trustee | Since December 1997 | President –American Investors Fund,LLC (July 2006 – Present) | 2 | None |
Walter E. Auch Jr.*
100 First Stamford Place,
Suite 403
Stamford, CT 06902
03/45 | Independent Trustee | Since August 2013 | Managing Director –Sophis Investments LLC (2018 – Present); Senior VicePresident – HJ Sims & Co., Inc. (2013– 2016) | 2 | None |
Deborah Fuhr*
100 First Stamford Place,
Suite 403
Stamford, CT 06902
03/59 | Independent Trustee | Since July 2021 | Co-Founder and Managing Partner – ETFGI LLP (February 2012 - Present); Co-Founder and Board Member – Women in ETFs (2014 to present); Co-Founder and Board Member – Women in ETFs Europe Limited (2015 to present) | 2 | Syntax ETF Trust (3 funds)(2018 - present) |
| Interested Trustee and Officers |
Kathleen Shelton Smith3
100 First Stamford Place,
Suite 403
Stamford, CT 06902
05/54 | Interested Trustee, Chairman, Secretary, Treasurer and Chief Compliance Officer | Since December 1997 | Chairman and Chief Compliance Officer, Vice President, Treasurer and Secretary of Renaissance Capital LLC and Renaissance Capital International, LLC | 2 | None |
William K. Smith4
100 First Stamford Place,
Suite 403
Stamford, CT 06902
05/51 | President | Since December 1997 | President, Chief Executive Officer and Director of Renaissance Capital LLCand Renaissance Capital International, LLC | 2 | None |
| 1 | Each Trustee serves until resignation, death, retirement or removal. Officers are elected yearly by the Trustees. |
| 2 | The Fund Complex consists of the Renaissance IPO ETF and the Renaissance International IPO ETF, both a series of the Trust. |
| 3 | “Interested person” of the Trust within the meaning of the 1940 Act. Ms. Smith is an officer of the Adviser and the spouse of William K. Smith. |
| 4 | Mr. Smith is the spouse of Kathleen Shelton Smith. |
| * | Member of the Audit Committee. |
| R e n a i s s a n c e C a p i t a l — T h e I P O E x p e r t P a g e 3 1 |
Page Intentionally Left Blank
Page Intentionally Left Blank
Page Intentionally Left Blank
Item 2. Code of Ethics
(a) As of the end of the period covered by this report, the registrant has adopted a code of ethics that applies to the registrant's principal executive officer, principal financial officer, principal accounting officer or controller, or persons performing similar functions, regardless of whether these individuals are employed by the registrant or a third party.
(b) For purposes of this item, “code of ethics” means written standards that are reasonably designed to deter wrongdoing and to promote:
| (1) | Honest and ethical conduct, including the ethical handling of actual or apparent conflicts of interest between personal and professional relationships; |
| (2) | Full, fair, accurate, timely, and understandable disclosure in reports and documents that a registrant files with, or submits to, the Commission and in other public communications made by the registrant; |
(3) Compliance with applicable governmental laws, rules, and regulations;
| (4) | The prompt internal reporting of violations of the code to an appropriate person or persons identified in the code; and |
(5) Accountability for adherence to the code.
(c) Amendments: During the period covered by the report, the combined code of ethics for the registrant and its adviser was amended to remove references to the affiliated broker-dealer, Renaissance Capital Investments, Inc., which has ceased operation.
(d) Waivers: During the period covered by the report, the registrant has not granted any express or implicit waivers from the provisions of the code of ethics.
(e) Not applicable.
(f) The Code of Ethics is included with this Form N-CSR as Exhibit 13(a)(1).
Item 3. Audit Committee Financial Expert
The registrant’s board of trustees has determined that Warren Greene is the independent audit committee financial expert.
Item 4. Principal Accountant Fees and Services
Registrant Adviser
FY 09/30/21 $26,450 N/A
FY 09/30/20 $26,000 N/A
Registrant Adviser
FYE 09/30/21 $0 N/A
FYE 09/30/20 $0 N/A
Registrant Adviser
FYE 09/30/21 $5,000 N/A
FYE 09/30/20 $5,000 N/A
Preparation of Federal & State income tax returns, assistance with calculation of required income, capital gain and excise distributions and preparation of Federal excise tax returns.
Registrant Adviser
FYE 09/30/21 $0 N/A
FYE 09/30/20 $0 N/A
| (e) | (1) Audit Committee’s Pre-Approval Policies |
The registrant’s Audit Committee is required to pre-approve all audit services and, when appropriate, any non-audit services (including audit-related, tax and all other services) to the registrant. The registrant’s Audit Committee also is required to pre-approve, when appropriate, any non-audit services (including audit-related, tax and all other services) to its adviser, or any entity controlling, controlled by or under common control with the adviser that provides ongoing services to the registrant, to the extent that the services may be determined to have an impact on the operations or financial reporting of the registrant. Services are reviewed on an engagement by engagement basis by the Audit Committee.
| (2) | Percentages of Services Approved by the Audit Committee |
Registrant Adviser
Audit-Related Fees: N/A N/A
Tax Fees: N/A N/A
All Other Fees: N/A N/A
| (f) | During the audit of registrant's financial statements for the most recent fiscal year, less than 50 percent of the hours expended on the principal accountant's engagement were attributed to work performed by persons other than the principal accountant's full-time, permanent employees. |
| (g) | The aggregate non-audit fees billed by the registrant's accountant for services rendered to the registrant, and rendered to the registrant's investment adviser (not including any sub-adviser whose role is primarily portfolio management and is subcontracted with or |
overseen by another investment adviser), and any entity controlling, controlled by, or under common control with the adviser that provides ongoing services to the registrant:
Registrant Adviser
FYE 09/30/2021 $5,000 N/A
FYE 09/30/2020 $5,000 N/A
Item 5. Audit Committee of Listed Registrants
The registrant has an audit committee which was established by the Board of Trustees of the registrant in accordance with Section 3(a)(58)(A) of the Securities Exchange Act of 1934, as amended. The members of the registrant’s Audit Committee are Warren K. Greene, Walter E. Auch, Jr., and Deborah Fuhr.
Item 6. Schedule of Investments
Schedule of Investments is included as part of Item 1 of the Form N-CSR.
Item 7. Disclosure of Proxy Voting Policies and Procedures for Closed-End Management Investment Companies.
Not applicable to the Registrant.
Item 8. Portfolio Managers of Closed-End Management Investment Companies.
Not applicable to the Registrant.
Item 9. Purchases of Equity Securities by Closed-End Management Investment Company and Affiliated Purchasers.
Not applicable to the Registrant.
Item 10. Submission of Matters to a Vote of Security Holders.
None.
Item 11. Controls and Procedures.
(a) Based on an evaluation of the Registrant’s disclosure controls and procedures as of a date within 90 days of the filing date of this Form N-CSR, the principal executive officer and principal financial officer of the Registrant have concluded that the disclosure controls and procedures of the Registrant are reasonably designed to ensure the information required in filings on Form N-CSR is recorded, processed, summarized, and reported by the filing date, including that information required to be disclosed is accumulated and communicated to the Registrant’s management, including the Registrant’s principal executive officer and principal financial officer, as appropriate to allow timely decisions regarding required disclosure.
(b) There were no significant changes in the Registrant’s internal control over financial reporting that occurred during the second fiscal quarter of the period covered by this report (in the registrant’s second fiscal half-year in the case of an annual report) that have materially affected, or are reasonably likely to materially affect, the Registrant’s internal control over financial reporting.
Item 12. Disclosure of Securities Lending Activities for Closed-End Management Investment Companies.
Not applicable.
Item 13. Exhibits.
(a)(1) Code of Ethics filed herewith.
(a)(2) Certification(s) required by Rule 30a-2 of the Investment Company Act of 1940, as amended (the “1940 Act”) are attached hereto.
(a)(3) Not applicable to the filing.
(a)(4) Not applicable.
(b) The certifications required by Rule 30a-2(b) of the 1940 Act and Sections 906 of the Sarbanes-Oxley Act of 2002 are attached hereto.
SIGNATURES
Pursuant to the requirements of the Securities Exchange Act of 1934, as amended, and the Investment Company Act of 1940, as amended, the registrant has duly caused this report to be signed on its behalf by the undersigned, thereunto duly authorized.
RENAISSANCE CAPITAL GREENWICH FUNDS
By: /s/ William K. Smith
William K. Smith,
President
Date: December 1, 2021
Pursuant to the requirements of the Securities Exchange Act of 1934, as amended, and the Investment Company Act of 1940, as amended, this report has been signed below by the following persons on behalf of the registrant and in the capacities and on the dates indicated.
By: /s/ William K. Smith
William K. Smith,
President
Date: December 1, 2021
By: /s/ Kathleen S. Smith
Kathleen S. Smith,
Chairman of the Board, Treasurer
Date: December 1, 2021