Table of Contents
SECURITIES AND EXCHANGE COMMISSION
Washington, D.C. 20549

FORM 6-K
REPORT OF FOREIGN PRIVATE ISSUER
Pursuant to Rule 13a-16 or 15d-16 of
the Securities Exchange Act of 1934
For the month of February, 2003
IMSA GROUP
(Translation of Registrant’s name into English)
GRUPO IMSA, S.A. DE C.V.
Ave. Batallón de San Patricio No. 111, Piso 26
Fracc. Valle Oriente
San Pedro Garza García, N.L. 66269, México
(Address of principal executive offices)
(Indicate by check mark whether the registrant files or will file annual reports under cover of Form 20-F or Form 40-F.)
Form 20-F x Form 40-F ¨
(Indicate by check mark whether the registrant by furnishing the information contained in this Form is also thereby furnishing the information to the Commission pursuant to Rule 12g3-2(b) under the Securities Exchange Act of 1934.)
Yes ¨ No x
Table of Contents
GRUPO IMSA, S.A. DE C.V.
Item | ||
1. | Press Release issued on February 13, 2003, announcing results for the fourth quarter of 2002. |
Table of Contents

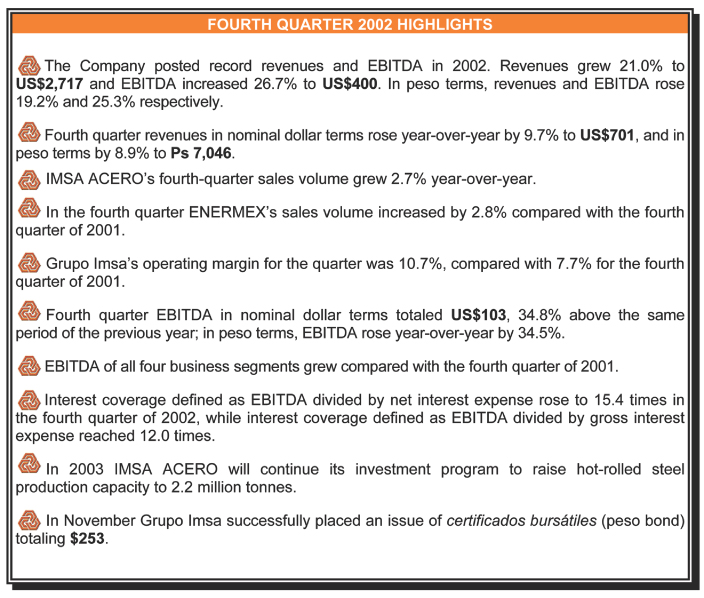
GRUPO IMSA ANNOUNCES FOURTH QUARTER 2002 RESULTS
EBITDA GROWS 35% TO US$103 MILLION
Monterrey, Mexico, February 13, 2003 - Grupo Imsa, S.A. de C.V. (NYSE: IMY) today announced results for the fourth quarter of 2002.1
| 1 | Unless otherwise stated, all figures are presented in millions of December 31, 2002 pesos (Ps), or in millions of nominal U. S. dollars (US$). Nominal dollars result from the translation of nominal pesos using the average exchange rate of each month. |
Page 1 of 14
Table of Contents

Mr. Eugenio Clariond, Chief Executive Officer of Grupo Imsa, explained: “2002 was an acceptable year for Grupo Imsa. Despite the uncertain economic environment, we posted record sales and primary cash flow (EBITDA). In fact, our four business segments reported a rise in EBITDA. During 2003 we will continue the programs to increase the profitability of our operations; being the most efficient company in the sector, and offering competitive and innovative solutions for our customers, our profits should grow substantially when the NAFTA economies recover. 2003 will not be easy, but I am confident that we will continue to capitalize on the opportunities to increase our profitability.”
See note for presentation criteria.1

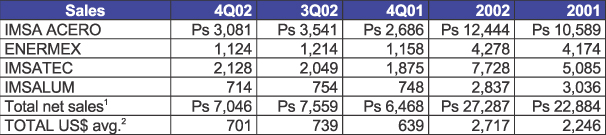
Net sales for the quarter were US$701, an increase of 9.7% over the fourth quarter of 2001 (4Q01) and a decrease of 5.3% from the third quarter of 2002 (3Q02). In peso terms, net sales for 4Q02 totaled Ps 7,046, an upswing of 8.9% over 4Q01 and a decline of 6.8% from 3Q02. The year-over-year revenue growth was a consequence of increased sales volumes for some of Grupo Imsa’s main business segments and higher prices of certain products, principally those related to steel. The quarter-over-quarter decline reflects reduced sales volumes for the Company’s main businesses, largely because the third quarter is seasonally stronger than the fourth.
For 4Q02, domestic sales amounted to Ps 3,067, an increase of 7.1% over 4Q01 and a decrease of 10.9% from 3Q02. Foreign sales for 4Q02 totaled Ps 3,979, an increase of 25.6% over 4Q01 and a decrease of 3.3% from 3Q02. Foreign sales for the quarter represented 56.5% of total net sales.
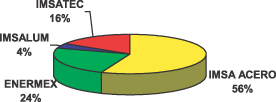
The following is a breakdown by business segment for the quarter:
1 Fourth quarter 2002 (4Q02) inflation was 1.7%, resulting in an inflation rate of 5.7% for the last twelve months. The Mexican peso depreciated against the U.S. dollar by 1.9% during 4Q02, and by 13.0% over the last twelve months. The exchange rate used as of yearend 2002 was 10.3613 pesos per dollar. Since the price and cost structure of Grupo Imsa is mainly denominated in dollars, the performance of the Company is affected when financial information is expressed in real pesos.
In compliance with Bulletin B-15, “Foreign Currency Translation of Foreign Currency Financial Statements,” the restatement factors applied to financial statements of prior periods are calculated on the basis of a weighted average index that takes into consideration the inflation rates of the countries in which Grupo Imsa’s subsidiaries operate and changes in the exchange rates of each country vis-à-vis the Mexican peso. The restatement factor for the twelve-month period of December 2001 – December 2002 was 1.0861; for the three-month period of September 2002 – December 2002 it was 1.0229.
Page 2 of 14
Table of Contents

Operating income in nominal dollar terms for 4Q02 totaled US$73, an increase of 52.4% over 4Q01 and a decrease of 21.7% from 3Q02. Operating income for 4Q02 in peso terms was Ps755, an upswing of 51.3% over 4Q01 and a decline of 21.6% from 3Q02. Grupo Imsa’s operating margin for the quarter was 10.7%, compared with 7.7% for 4Q01 and 12.7% for 3Q02.

EBITDA for 4Q02 totaled US$103, representing an increase of 34.8% compared with 4Q01 and a decrease of 16.2% versus 3Q02. EBITDA for the quarter in peso terms was Ps 1,065, 34.5% above 4Q01 and 15.9% below 3Q02.
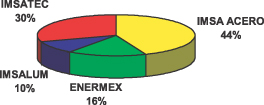
EBITDA contribution per business segment in 4Q02 was as follows:
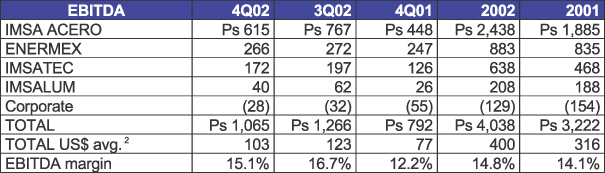
| 1 | The sum of these amounts does not equal the consolidated net sales for the periods presented because Corporate and Other has been excluded. |
| 2 | Current pesos translated at the average dollar exchange rate of each month. |
Page 3 of 14
Table of Contents

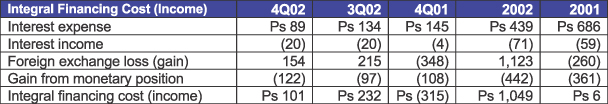
Integral financing cost for 4Q02 was Ps 101, compared with an income of Ps 315 in 4Q01 and a cost of Ps 232 in 3Q02. The main reason for the rise in integral financing cost versus 4Q01 was a higher foreign exchange loss, reflecting the depreciation of the Mexican peso by 1.9% versus the U.S. dollar in 4Q02, compared with an appreciation of the peso versus the dollar of 3.7% in 4Q01. The quarter-over-quarter decline in integral financing cost was a result of a lower interest expense, a reduction in foreign exchange loss and a greater gain from monetary position.
Interest expense decreased year-over-year and quarter-over-quarter, reflecting the decline in Libor interest rate and the Company having contracted debt with lower spreads over Libor. It is important to note that at the end of 3Q02 Grupo Imsa prepaid its Yankee Bond; this bond had the highest interest rate of all the Company’s debt.

For 4Q02, the Majority Net Income was Ps 332, compared with incomes of Ps 692 for 4Q01 and Ps 476 for 3Q02. The year-over-year decline in Net Income mainly reflects an increase in foreign exchange loss resulting from the devaluation of the Mexican peso versus the U.S. dollar in 4Q02.
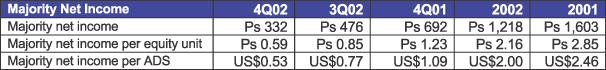
As of December 31, 2002, Grupo Imsa had 2,814.2 million shares outstanding, equivalent to 562,845,158 equity units and 62,538,351 ADSs.

Interest bearing debt, net of cash, as of December 31, 2002 was US$851, US$3 less than the figure reported as of September 30, 2002. It should be noted that Enertec México, the entity created from the joint venture with Johnson Controls in Mexico, consolidates 100% of its debt in the Grupo Imsa balance sheet. As of December 31, 2002, Enertec México had debt of US$155, 49% of which corresponds to Johnson Controls’ stake in the company.
Interest coverage defined as EBITDA divided by net interest expense improved substantially from 5.6 times in 4Q01 to 15.4 times in 4Q02, while interest coverage defined as EBITDA divided by gross interest expense reached 12.0 times. In addition, the total debt to EBITDA ratio improved from 2.8 times in 2001 to 2.3 times in 2002.
Page 4 of 14
Table of Contents
As of December 31, 2002, the Company had a current ratio of 1.62 times. Total debt-to-equity ratio on December 31, 2002 was 0.68.


Mr. Santiago Clariond, CEO of IMSA ACERO, explained: “2002 was an excellent year for us. IMSA ACERO consolidated its position as one of the steel companies with the highest profit per tonne in the world, posting an EBITDA of 120 dollars per tonne sold in 2002.” Mr. Clariond added: “In accordance with our strategy for increasing the profitability of our operations through high value-added products, in 2002 we acquired the assets of Pinole Point Steel. This allowed us to substitute the sale of galvanized steel with higher-margin painted steel.”
Sales
4Q02 sales volume was 473 thousand tonnes, an increase of 2.7% over 4Q01 and a decrease of 13.8% from 3Q02. Domestic shipments for the quarter totaled 314 thousand tonnes, a decline of 7.9% from 4Q01 and of 16.9% versus 3Q02. Foreign volume amounted to 159 thousand tonnes for 4Q02, a growth of 33.1% over 4Q01 and a decrease of 7.1% versus 3Q02. The domestic sales volume fell in 4Q02, reflecting: the fact that a large number of IMSA ACERO’s customers had been accumulating inventory in the prior quarters; an increase in imports of non-coated flat steel; and a reduction in demand. Foreign sales volume grew compared with 4Q01 because the U.S. market was more orderly and prices were higher, but fell compared with 3Q02 as a consequence of the seasonality of the U.S. construction market.
Net sales for 4Q02 reached Ps 3,081, an increase of 14.7% over 4Q01 and a decrease of 13.0% from 3Q02. The year-over-year growth reflects higher volumes and average prices in 4Q02, and an increase in the peso-dollar exchange rate, while the quarter-over-quarter decline was a result of a reduction in sales volume. Foreign sales represented 40.6% of total revenues in 4Q02.
Operating Income and EBITDA
Operating income was Ps 413, an increase of 60.7% over 4Q01 and a decrease of 26.8% versus 3Q02. 4Q02 operating margin was 13.4%, compared with operating margins of 9.6% for 4Q01 and of 15.9% for 3Q02. EBITDA for 4Q02 was Ps 615, a growth of 37.3% with respect to 4Q01 and a decline of 19.8% versus 3Q02. In dollar terms, EBITDA rose 38.2% year-over-year and decreased 19.3% quarter-over-quarter to US$60.
The year-over-year upswing in operating margin reflects increased prices and a 2.9 percentage point reduction in operating expenses as a percent of sales. IMSA ACERO reduced operating expenses significantly in 2002 as a result of its concerted efforts to become more efficient. The quarter-over-quarter decline in margin was mainly a result of a reduction in sales volume and a rise in the cost of the company’s main raw materials, particularly steel.
Page 5 of 14
Table of Contents

Sales
ENERMEX’S 4Q02 sales volume reached 5.6 million batteries, an upswing of 2.8% from 4Q01 and a decrease 5.9% over 3Q02. The year-over-year growth was largely a result of increased sales volumes in the United States and Brazil. The quarter-over-quarter decline was mainly due to the third quarter of the year being seasonally stronger than the fourth. Year-over-year, foreign shipments increased by 7.0% in 4Q02, while domestic shipments were down 6.3%. The main reason for the decline in domestic sales volume was a reduction in the original equipment market because fewer vehicles were assembled in Mexico during 2002.
ENERMEX posted revenues of Ps 1,124 for 4Q02, a decrease of 2.9% from 4Q01 and of 7.4% versus 3Q02. The year-over-year decline reflects a change in sales mix to include a higher proportion of foreign sales. The quarter-over-quarter decrease in revenues reflects a seasonal reduction in sales volume. In 4Q02, foreign sales represented 56.4% of total revenues.
Operating Income and EBITDA
Operating income for 4Q02 was Ps 232, an increase of 11.5% over 4Q01 and a decrease of 2.1% versus 3Q02. The operating margin for the quarter was 20.6%, compared with 18.0% for 4Q01 and 19.5% for 3Q02. EBITDA for the quarter totaled Ps 266, an increase of 7.7% over 4Q01 and a decrease of 2.2% versus 3Q02. In dollar terms, EBITDA grew 10.2% year-over-year and 0.4% quarter-over-quarter, to US$26.
The main reason for the year-over-year upswing in operating margin was a 2.2 percentage point fall in operating expenses as a percent of sales, as a result of the company’s efforts to make its operations more efficient. The commercial and logistics areas have been restructured, making the sale and distribution of batteries more efficient; in addition, tools such as 6-Sigma have contributed to increasing efficiency and reducing expenses. The quarter-over-quarter decline in operating income reflects a decrease in sales volume as a result of the seasonality of demand in the United States.

Sales
IMSATEC’s 4Q02 revenues totaled Ps 2,128, representing increases of 13.5% over 4Q01 and of 3.9% versus 3Q02. The year-over-year growth in sales was a result of most of IMSATEC’s businesses gaining market share. The quarter-over-quarter growth was largely due to Stablit and Grupo Imsa Chile posting increased revenues, at the same time that Formet started working on new infrastructure projects. Foreign sales amounted to 81.2% of total sales for 4Q02.
Operating Income and EBITDA
Operating income totaled Ps 125 in 4Q02, an increase of 52.4% over 4Q01 and a decrease of 18.3% from 3Q02. Operating margin for the quarter was 5.9%, compared with 4.4% for 4Q01 and 7.5% in 3Q02. EBITDA for the quarter was Ps 172, an increase of 36.5% over 4Q01 and a decrease of 12.7% with respect to 3Q02. In dollar terms, EBITDA grew 18.7% year-over-year and decreased 22.0% quarter-over-quarter to US$16.
IMSATEC’s operating income rose year-over-year mainly as a consequence of Stabilit, Formet and Metl-Span posting better results in 4Q02. Quarter-over-quarter operating income fell as a
Page 6 of 14
Table of Contents
consequence of the third quarter being seasonally stronger than the fourth, which resulted in several IMSATEC companies serving the construction industry in North America reporting a decline in activity.
In 2002 non-residential construction in the United States fell 16% compared with 2001. Despite this downturn, IMSATEC’s main companies gained market share and posted improved results; however, growth was limited since this business has significant exposure to the U.S. non-residential construction industry.

Sales
IMSALUM’s revenues totaled Ps 714 for 4Q02, a decline of 4.5% from 4Q01 and of 5.3% from 3Q02. The year-over-year decline in sales was largely due to a contraction in the demand of ladders. The quarter-over-quarter decrease mainly reflected the third quarter being seasonally stronger than the fourth, particularly in the U.S. ladder market. Foreign sales represented 51.3% of total sales for 4Q02.
Operating Income and EBITDA
Operating income for 4Q02 was Ps 29, an increase of 93.3% over 4Q01 and a decrease of 40.8% versus 3Q02. Operating margin for the quarter was 4.1%, compared with operating margins of 2.0% for 4Q01 and of 6.5% for 3Q02. IMSALUM’s 4Q02 EBITDA was Ps 40, a growth of 53.8% over 4Q01 and a decrease of 35.5% from 3Q02. In dollar terms, EBITDA rose 41.2% year-over-year and decreased 33.8% quarter-over-quarter to US$4.
The year-over-year increase in IMSALUM’s operating income reflects the company’s efforts to reduce costs, which resulted in a 2.8 percentage point rise in gross margin compared with 2001. The quarter-over-quarter decrease in operating income is a consequence of lower margins in the ladder business because of the seasonality of this market in the United States, as well as a contraction in the demand.
During 2002 IMSALUM made significant progress with its 6-Sigma projects to reduce waste and eliminate rework in the production processes. The gross margin improved from 19.1% in 2001 to 20.6% in 2002 despite revenues falling during the year. In addition, operating expenses decreased 3.8%. As part of the company’s ongoing efforts to increase profitability, during 2003 IMSALUM will continue working with 6-Sigma, since there is still great potential to continue increasing efficiency.

Capacity Expansion for IMSA ACERO
In 2003 IMSA ACERO will continue its program to expand hot-rolled steel production capacity to 2.2 million tonnes. From a capacity of 1.5 million tonnes at yearend 2002, the company expects to reach a capacity of 1.9 million tonnes by the end of 2003 and then grow to 2.0 – 2.2 million tonnes in 2004. These capacity increases will be achieved by eliminating bottlenecks in production lines and adjusting internal logistics, so that the investment required will be relatively small.
Page 7 of 14
Table of Contents
In order to increase Grupo Imsa’s presence in Central America and satisfy the growing demand there, Ingasa is currently installing a new galvanized steel line with an annual production capacity of 50 thousand tonnes. The new line will be located next to the existing one in Guatemala and should be operating by mid-2003.
Financing
In November Grupo Imsa successfully placed an issue ofcertificados bursátiles (peso bond) for Ps 253. This placement was part of a bond program that was set up in May 2002 with theComisión Nacional Bancaria y de Valores (Mexican National Banking and Securities Commission).
The peso bond bears a fixed interest rate of 11.2% and is payable in one installment when it matures in three years. Standard & Poor’s and Fitch Mexico gave this bond issue an AA credit rating.
Since Grupo Imsa’s revenues are closely tied to the US dollar, the Company used a swap to convert the Ps 253 issue to US$25 bearing interest at a rate of 87 basis points over six-month Libor. The resources obtained from this issue were mainly used to pay liabilities, so the Company’s total debt did not increase.
Mr. Marcelo Canales, Chief Financial Officer for Grupo Imsa, stated, “During 2002 we were very active in the peso bond market, which allowed us to access new financing alternatives at competitive costs.” Mr. Canales added: “In 2002 we extended the maturity profile of the Company’s debt and at the same time lowered its average cost which, combined with lower Libor rates, resulted in important savings in interest expense.”
* * *
Grupo Imsa, a holding company, dates back to 1936 and is today one of Mexico’s leading diversified industrial companies. The Group operates in four core businesses: steel processed products; automotive batteries and related products; aluminum and other related products; and steel and plastic construction products. With manufacturing and distribution facilities in Mexico, the United States, and throughout Central and South America, Grupo Imsa currently exports to all five continents. In 2002 Grupo Imsa’s sales reached US$2.7 billion, of which close to 55% was generated outside Mexico. Grupo Imsa’s shares trade on the Mexican Stock Exchange (IMSA) and, in the United States, on the NYSE (IMY).
Contacts:
Marcelo Canales, Chief Financial Officer, (52-81) 8153-8349
Adrian Fernandez, Corporate Finance Manager, (52-81) 8153-8433
Jose Luis Fornelli, Investor Relations, (52-81) 8153-8416
jfornell@grupoimsa.com
This document contains forward-looking statements within the meaning of Section 27A of the Securities Acts of 1933, as amended, and Section 21E of the Securities Exchange of 1934, as amended. These include statements regarding the intent, belief or current expectations of the Company and its management. Investors are cautioned that any such forward-looking statements are not guarantees of future performance and involve a number of risks and uncertainties pertaining to the industries in which the Company participates.
TABLES TO FOLLOW
Page 8 of 14
Table of Contents
GRUPO IMSA, S.A. DE C.V. AND SUBSIDIARIES
CONSOLIDATED BALANCE SHEETS
(Millions of Mexican pesos of
purchasing power as of December 31, 2002)
December 2002 | December 2001 | |||||
ASSETS | ||||||
Current: | ||||||
Cash and cash equivalents | 586 |
| 526 |
| ||
Accounts receivable-trade, net | 3,905 |
| 3,618 |
| ||
Inventories | 5,494 |
| 5,458 |
| ||
Other current assets | 719 |
| 949 |
| ||
10,704 |
| 10,551 |
| |||
Investment in associated companies | 102 |
| 94 |
| ||
Property, plant and equipment, net | 18,380 |
| 17,372 |
| ||
Other assets, net | 1,113 |
| 1,148 |
| ||
Excess of cost over fair value of net assets acquired of subsidiaries | 959 |
| 1,029 |
| ||
TOTAL ASSETS | 31,258 |
| 30,194 |
| ||
LIABILITIES AND STOCKHOLDERS’ EQUITY | ||||||
Current: | ||||||
Current portion of long-term debt | 1,632 |
| 1,195 |
| ||
Bank loans | 241 |
| 272 |
| ||
Accounts payable-trade | 2,927 |
| 3,149 |
| ||
Advances from clients | 175 |
| 287 |
| ||
Other accounts payable and accrued liabilities | 1,623 |
| 1,213 |
| ||
6,598 |
| 6,116 |
| |||
Long-term debt | 7,528 |
| 7,479 |
| ||
Deferred taxes | 2,983 |
| 2,932 |
| ||
Other long-term liabilities | 277 |
| 297 |
| ||
10,788 |
| 10,708 |
| |||
TOTAL LIABILITIES | 17,386 |
| 16,824 |
| ||
Excess of fair value of net assets acquired over cost of subsidiaries | 135 |
| 592 |
| ||
Stockholder’s equity: | ||||||
Common stock | 4,782 |
| 4,782 |
| ||
Additional paid-in capital | 2,803 |
| 2,803 |
| ||
Reserve for repurchase of own shares | 140 |
| 140 |
| ||
Retained earnings | 14,950 |
| 13,930 |
| ||
Insufficiency in capital restatement | (6,514 | ) | (6,397 | ) | ||
Initial effect of deferred taxes | (3,497 | ) | (3,497 | ) | ||
Majority interest | 12,664 |
| 11,761 |
| ||
Minority interest | 1,073 |
| 1,017 |
| ||
TOTAL STOCKHOLDERS’ EQUITY | 13,737 |
| 12,778 |
| ||
TOTAL LIABILITIES AND STOCKHOLDERS’ EQUITY | 31,258 |
| 30,194 |
| ||
Page 9 of 14
Table of Contents
GRUPO IMSA, S.A. DE C.V. AND SUBSIDIARIES
CONSOLIDATED STATEMENTS OF OPERATIONS
(Millions of Mexican pesos of purchasing power
as of December 31, 2002)
% Change | |||||||||||||||||||
4Q02 | 3Q02 | 4Q01 | 2002 | 2001 | 4Q02/4Q01 | 4Q02/3Q02 | 2002 /2001 | ||||||||||||
NET SALES | 7,046 | 7,559 | 6,468 | 27,287 | 22,884 | 8.9 | % | -6.8 | % | 19.2 | % | ||||||||
Domestic Sales | 3,067 | 3,444 | 3,301 | 12,585 | 12,270 | -7.1 | % | -10.9 | % | 2.6 | % | ||||||||
Foreign Sales | 3,979 | 4,115 | 3,167 | 14,702 | 10,614 | 25.6 | % | -3.3 | % | 38.5 | % | ||||||||
COST OF SALES | 5,465 | 5,786 | 5,117 | 21,225 | 17,764 | 6.8 | % | -5.5 | % | 19.5 | % | ||||||||
OPERATING EXPENSES | 826 | 810 | 852 | 3,222 | 2,957 | -3.1 | % | 2.0 | % | 9.0 | % | ||||||||
OPERATING INCOME | 755 | 963 | 499 | 2,840 | 2,163 | 51.3 | % | -21.6 | % | 31.3 | % | ||||||||
Financial expenses | 89 | 134 | 145 | 439 | 686 | -38.6 | % | -33.6 | % | -36.0 | % | ||||||||
Interest income | -20 | -20 | -4 | -71 | -59 | 400.0 | % | 0.0 | % | 20.3 | % | ||||||||
Foreign exchange loss (gain) | 154 | 215 | -348 | 1,123 | -260 | -28.4 | % | ||||||||||||
Gain from monetary position | -122 | -97 | -108 | -442 | -361 | 13.0 | % | 25.8 | % | 22.4 | % | ||||||||
INTEGRAL FIN. COST, NET | 101 | 232 | -315 | 1,049 | 6 | -56.5 | % | 17383.3 | % | ||||||||||
Other income, net | 33 | -44 | -73 | -106 | -265 | -60.0 | % | ||||||||||||
INCOME BEFORE TAXES AND EMPLOYEE’S PROFIT SHARING | 621 | 775 | 887 | 1,897 | 2,422 | -30.0 | % | -19.9 | % | -21.7 | % | ||||||||
PROVISIONS FOR: | |||||||||||||||||||
Income taxes | 215 | 222 | 139 | 458 | 600 | 54.7 | % | -3.2 | % | -23.7 | % | ||||||||
Employees’ profit sharing | 29 | 13 | -4 | 86 | 62 | 123.1 | % | 38.7 | % | ||||||||||
CONSOLIDATED NET INCOME | 377 | 540 | 752 | 1,353 | 1,760 | -49.9 | % | -30.2 | % | -23.1 | % | ||||||||
Net income of minority interest | 45 | 64 | 60 | 135 | 157 | -25.0 | % | -29.7 | % | -14.0 | % | ||||||||
Net income of majority interest | 332 | 476 | 692 | 1,218 | 1,603 | -52.0 | % | -30.3 | % | -24.0 | % | ||||||||
Page 10 of 14
Table of Contents
GRUPO IMSA, S.A. DE C.V. AND SUBSIDIARIES
CONSOLIDATED STATEMENTS OF CHANGES IN FINANCIAL POSITION
(Millions of Mexican pesos of
purchasing power as of December 31, 2002)
December 2002 | December 2001 | |||||
OPERATING ACTIVITIES: | ||||||
CONSOLIDATED NET INCOME | 1,353 |
| 1,761 |
| ||
ITEMS NOT (GENERATING) REQUIRING RESOURCES: | ||||||
Depreciation and amortization | 1,198 |
| 1,059 |
| ||
Amortization of excess of fair value of net assets acquired over cost of subsidiaries | (370 | ) | (379 | ) | ||
Other | 95 |
| 148 |
| ||
2,276 |
| 2,589 |
| |||
CHANGES IN CURRENT ASSETS AND LIABILITIES NET OF EFFECTS FROM PURCHASES OF BUSINESSES: | ||||||
Accounts receivable-trade | (241 | ) | 350 |
| ||
Inventories | (430 | ) | 310 |
| ||
Other current assets | 229 |
| (248 | ) | ||
Accounts payable-trade | (258 | ) | 193 |
| ||
Advances from clients | (112 | ) | 16 |
| ||
Other accounts payable and accrued liabilities | 390 |
| (202 | ) | ||
(422 | ) | 419 |
| |||
RESOURCES GENERATED FROM OPERATING ACTIVITIES | 1,854 |
| 3,008 |
| ||
FINANCING ACTIVITIES: | ||||||
Payments of short-term bank loans | 406 |
| 116 |
| ||
Proceeds from borrowings from banks and issuance of long-term debt | 49 |
| (497 | ) | ||
Dividends paid | (198 | ) | (169 | ) | ||
Others | (100 | ) | (99 | ) | ||
RESOURCES (USED IN) GENERATED FROM FINANCING ACTIVITIES | 157 |
| (649 | ) | ||
INVESTING ACTIVITIES: | ||||||
Acquisition of property, plant and equipment | (1,820 | ) | (1,240 | ) | ||
Acquisition of companies and minority interest | (104 | ) | (1,212 | ) | ||
Other assets | (27 | ) | — |
| ||
RESOURCES USED IN INVESTING ACTIVITIES | (1,951 | ) | (2,452 | ) | ||
(DECREASE) INCREASE IN CASH AND CASH EQUIVALENTS | 60 |
| (93 | ) | ||
CASH AND CASH EQUIVALENTS AT BEGINNING OF PERIOD | 526 |
| 619 |
| ||
CASH AND CASH EQUIVALENTS AT END OF PERIOD | 586 |
| 526 |
| ||
Page 11 of 14
Table of Contents
GRUPO IMSA S.A. DE C.V. AND SUBSIDIARIES
(Millions of Mexican pesos of purchasing power as of December 31, 2002)
4Q02 | 3Q02 | 4Q01 | 2002 | 2001 | 4Q02/4Q01 | 4Q02/3Q02 | 2002/2001 | |||||||||||||||||
IMSA ACERO | ||||||||||||||||||||||||
DOMESTIC SALES | 1,831 |
| 2,209 |
| 1,928 |
| 7,845 |
| 7,271 |
| -5.0 | % | -17.1 | % | 7.9 | % | ||||||||
FOREIGN SALES | 1,250 |
| 1,332 |
| 758 |
| 4,599 |
| 3,318 |
| 64.9 | % | -6.2 | % | 38.6 | % | ||||||||
% Export/Sales | 40.6 | % | 37.6 | % | 28.2 | % | 37.0 | % | 31.3 | % | ||||||||||||||
NET SALES | 3,081 |
| 3,541 |
| 2,686 |
| 12,444 |
| 10,589 |
| 14.7 | % | -13.0 | % | 17.5 | % | ||||||||
COST OF SALES | 2,429 |
| 2,724 |
| 2,140 |
| 9,822 |
| 8,438 |
| 13.5 | % | -10.8 | % | 16.4 | % | ||||||||
OPERATING EXPENSES | 239 |
| 253 |
| 289 |
| 972 |
| 992 |
| -17.3 | % | -5.5 | % | -2.0 | % | ||||||||
OPERATING INCOME | 413 |
| 564 |
| 257 |
| 1,650 |
| 1,159 |
| 60.7 | % | -26.8 | % | 42.4 | % | ||||||||
OPERATING MARGIN | 13.4 | % | 15.9 | % | 9.6 | % | 13.3 | % | 10.9 | % | ||||||||||||||
EBITDA | 615 |
| 767 |
| 448 |
| 2,438 |
| 1,885 |
| 37.3 | % | -19.8 | % | 29.3 | % | ||||||||
EBITDA MARGIN | 20.0 | % | 21.7 | % | 16.7 | % | 19.6 | % | 17.8 | % | ||||||||||||||
ENERMEX | ||||||||||||||||||||||||
DOMESTIC SALES | 490 |
| 469 |
| 584 |
| 1,832 |
| 1,982 |
| -16.1 | % | 4.5 | % | -7.6 | % | ||||||||
FOREIGN SALES | 634 |
| 745 |
| 574 |
| 2,446 |
| 2,192 |
| 10.5 | % | -14.9 | % | 11.6 | % | ||||||||
% Export/Sales | 56.4 | % | 61.4 | % | 49.6 | % | 57.2 | % | 52.5 | % | ||||||||||||||
NET SALES | 1,124 |
| 1,214 |
| 1,158 |
| 4,278 |
| 4,174 |
| -2.9 | % | -7.4 | % | 2.5 | % | ||||||||
COST OF SALES | 761 |
| 843 |
| 789 |
| 2,978 |
| 2,856 |
| -3.5 | % | -9.7 | % | 4.3 | % | ||||||||
OPERATING EXPENSES | 131 |
| 134 |
| 161 |
| 555 |
| 623 |
| -18.6 | % | -2.2 | % | -10.9 | % | ||||||||
OPERATING INCOME | 232 |
| 237 |
| 208 |
| 745 |
| 695 |
| 11.5 | % | -2.1 | % | 7.2 | % | ||||||||
OPERATING MARGIN | 20.6 | % | 19.5 | % | 18.0 | % | 17.4 | % | 16.7 | % | ||||||||||||||
EBITDA | 266 |
| 272 |
| 247 |
| 883 |
| 835 |
| 7.7 | % | -2.2 | % | 5.7 | % | ||||||||
EBITDA MARGIN | 23.7 | % | 22.4 | % | 21.3 | % | 20.6 | % | 20.0 | % | ||||||||||||||
IMSATEC | ||||||||||||||||||||||||
DOMESTIC SALES | 400 |
| 413 |
| 405 |
| 1,566 |
| 1,582 |
| -1.2 | % | -3.1 | % | -1.0 | % | ||||||||
FOREIGN SALES | 1,728 |
| 1,636 |
| 1,470 |
| 6,162 |
| 3,503 |
| 17.6 | % | 5.6 | % | 75.9 | % | ||||||||
% Export/Sales | 81.2 | % | 79.8 | % | 78.4 | % | 79.7 | % | 68.9 | % | ||||||||||||||
NET SALES | 2,128 |
| 2,049 |
| 1,875 |
| 7,728 |
| 5,085 |
| 13.5 | % | 3.9 | % | 52.0 | % | ||||||||
COST OF SALES | 1,703 |
| 1,624 |
| 1,523 |
| 6,174 |
| 3,973 |
| 11.8 | % | 4.9 | % | 55.4 | % | ||||||||
OPERATING EXPENSES | 300 |
| 272 |
| 270 |
| 1097 |
| 755 |
| 11.1 | % | 10.3 | % | 45.3 | % | ||||||||
OPERATING INCOME | 125 |
| 153 |
| 82 |
| 457 |
| 357 |
| 52.4 | % | -18.3 | % | 28.0 | % | ||||||||
OPERATING MARGIN | 5.9 | % | 7.5 | % | 4.4 | % | 5.9 | % | 7.0 | % | ||||||||||||||
EBITDA | 172 |
| 197 |
| 126 |
| 638 |
| 468 |
| 36.5 | % | -12.7 | % | 36.3 | % | ||||||||
EBITDA MARGIN | 8.1 | % | 9.6 | % | 6.7 | % | 8.3 | % | 9.2 | % | ||||||||||||||
IMSALUM | ||||||||||||||||||||||||
DOMESTIC SALES | 348 |
| 351 |
| 384 |
| 1,341 |
| 1,435 |
| -9.4 | % | -0.9 | % | -6.6 | % | ||||||||
FOREIGN SALES | 366 |
| 403 |
| 364 |
| 1,496 |
| 1,601 |
| 0.5 | % | -9.2 | % | -6.6 | % | ||||||||
% Export/Sales | 51.3 | % | 53.4 | % | 48.7 | % | 52.7 | % | 52.7 | % | ||||||||||||||
NET SALES | 714 |
| 754 |
| 748 |
| 2,837 |
| 3,036 |
| -4.5 | % | -5.3 | % | -6.6 | % | ||||||||
COST OF SALES | 572 |
| 595 |
| 621 |
| 2,252 |
| 2,455 |
| -7.9 | % | -3.9 | % | -8.3 | % | ||||||||
OPERATING EXPENSES | 113 |
| 110 |
| 112 |
| 429 |
| 446 |
| 0.9 | % | 2.7 | % | -3.8 | % | ||||||||
OPERATING INCOME | 29 |
| 49 |
| 15 |
| 156 |
| 135 |
| 93.3 | % | -40.8 | % | 15.6 | % | ||||||||
OPERATING MARGIN | 4.1 | % | 6.5 | % | 2.0 | % | 5.5 | % | 4.4 | % | ||||||||||||||
EBITDA | 40 |
| 62 |
| 26 |
| 208 |
| 188 |
| 53.8 | % | -35.5 | % | 10.6 | % | ||||||||
EBITDA MARGIN | 5.6 | % | 8.2 | % | 3.5 | % | 7.3 | % | 6.2 | % |
Page 12 of 14
Table of Contents
SALES VOLUME
4Q02 | 3Q02 | 4Q01 | 2002 | 2001 | ||||||
STEEL PROCESSING | ||||||||||
IMSA ACERO (Tonnes) | ||||||||||
Domestic Sales Volume | 313,716 | 377,477 | 340,748 | 1,419,329 | 1,291,992 | |||||
Export and Foreign Subsidiaries Sales Volume | 159,083 | 171,195 | 119,518 | 627,451 | 506,104 | |||||
TOTAL IMSA ACERO | 472,799 | 548,672 | 460,266 | 2,046,780 | 1,798,096 |
4Q02 | 3Q02 | 4Q01 | 2002 | 2001 | ||||||
AUTOMOTIVE BATTERIES (1) | ||||||||||
ENERMEX (000 Units) | ||||||||||
Mexico | ||||||||||
Domestic Market | 1,605 | 1,510 | 1,715 | 5,944 | 5,949 | |||||
Exports | 2,817 | 3,215 | 1,601 | 10,250 | 6,238 | |||||
Total(2) | 4,422 | 4,725 | 3,316 | 16,194 | 12,187 | |||||
Foreign Subsidiaries(3) | 1,212 | 1,261 | 2,165 | 5,625 | 8,553 | |||||
TOTAL ENERMEX | 5,634 | 5,986 | 5,481 | 21,819 | 20,740 |
4Q02 | 3Q02 | 4Q01 | 2002 | 2001 | ||||||
IMSALUM | ||||||||||
Aluminum (Tonnes) | ||||||||||
TOTAL ALUMINUM | 12,489 | 11,735 | 11,002 | 47,680 | 47,323 |
| (1) | Includes 100% of the sales volume of the joint venture with Johnson Controls and Varta. |
| (2) | 100% of this volume is consolidated in Enermex financial statements. |
| (3) | 50% of this volume is consolidated in Enermex financial statements. |
Page 13 of 14
Table of Contents
Selected Financial Information
Income Statement
US$ Millions(1)
4Q02 | 3Q02 | 4Q01 | 2002 | 2001 | ||||||
Net Sales | ||||||||||
IMSA ACERO | 307 | 346 | 272 | 1,241 | 1,080 | |||||
ENERMEX | 112 | 121 | 110 | 432 | 406 | |||||
IMSATEC | 212 | 200 | 189 | 764 | 508 | |||||
IMSALUM | 70 | 73 | 75 | 281 | 298 | |||||
Grupo IMSA(2) | 701 | 739 | 639 | 2,717 | 2,246 | |||||
Operating Income | ||||||||||
IMSA ACERO | 40 | 55 | 25 | 164 | 112 | |||||
ENERMEX | 23 | 23 | 21 | 74 | 69 | |||||
IMSATEC | 11 | 16 | 9 | 45 | 36 | |||||
IMSALUM | 3 | 5 | 2 | 16 | 14 | |||||
Grupo IMSA(2) | 73 | 93 | 48 | 280 | 212 | |||||
EBITDA | ||||||||||
IMSA ACERO | 60 | 75 | 44 | 243 | 183 | |||||
ENERMEX | 26 | 26 | 24 | 88 | 82 | |||||
IMSATEC | 16 | 20 | 13 | 63 | 47 | |||||
IMSALUM | 4 | 6 | 3 | 21 | 19 | |||||
Grupo IMSA(2) | 103 | 123 | 77 | 400 | 316 | |||||
Majority Net Income | ||||||||||
Grupo IMSA | 33 | 48 | 68 | 125 | 154 |
| (1) | Peso figures converted into dollars by dividing the monthly nominal pesos by the average monthly exchange rate. |
| (2) | The sum of these amounts does not equal the consolidated figures presented because Corporate and Other have been excluded. |
Page 14 of 14
Table of Contents
SIGNATURE
Pursuant to the requirements of the Securities Exchange Act of 1934, the registrant has duly caused this report to be signed on its behalf by the undersigned, thereunto duly authorized.
GRUPO IMSA, S.A. DE C.V. (Registrant) | ||||||
Dated: February 19, 2003 | By: | /s/ MARCELO CANALES CLARIOND | ||||
Name: Marcelo Canales Clariond | ||||||
Title: Chief Financial Officer | ||||||