SECURITIES AND EXCHANGE COMMISSION
Washington, D.C. 20549

FORM 6-K
REPORT OF FOREIGN PRIVATE ISSUER
Pursuant to Rule 13a-16 or 15d-16 of
the Securities Exchange Act of 1934
For the month of July, 2004
IMSA GROUP
(Translation of Registrant’s name into English)
GRUPO IMSA, S.A. DE C.V.
Ave. Batallón de San Patricio No. 111, Piso 26
Fracc. Valle Oriente
San Pedro Garza García, N.L. 66269, México
(Address of principal executive offices)
(Indicate by check mark whether the registrant files or will file annual reports under cover of Form 20-F or Form 40-F.)
Form 20-F X Form 40-F
(Indicate by check mark whether the registrant by furnishing the information contained in this Form is also thereby furnishing the information to the Commission pursuant to Rule 12g3-2(b) under the Securities Exchange Act of 1934.)
Yes No X
TABLE OF CONTENTS
| 1. | Press Release issued on July 19, 2004, announcing results for the second quarter of 2004. |
| 2. | Press Release issued on July 19, 2004, announcing Grupo Imsa´s exit from the battery business. |
| Second Quarter 2004
| |||
| NYSE | BMV | |||
GRUPO IMSA ANNOUNCES SECOND QUARTER 2004 RESULTS
Sales Grow 34% and Operating Margin 101%
Monterrey, Mexico, July 19, 2004 - Grupo Imsa, S.A. de C.V. (NYSE: IMY) today announced results for the second quarter of 2004.1
SECOND QUARTER 2004 HIGHLIGHTS
| • | Second quarter revenues of all four business segments rose. Total sales reached a historic quarterly maximum ofPs 10,589, an increase of 34.3% year-over-year and of 20.4% quarter-over-quarter. In dollar terms, revenues grew 32.3% compared to the second quarter of 2003 to a total ofUS$930. |
| • | IMSA ACERO’s second quarter 2004 sales volume was 10.2% higher than that of the same quarter of 2003. |
| • | Operating expenses as a percent of sales were8.1% in second quarter 2004, down from11.0% in second quarter 2003. |
| • | Operating income for second quarter 2004 reached a historic quarterly maximum ofPs 1,345, an increase of 101.3% compared to the same period of 2003 and of 115.9% quarter-over-quarter. In dollar terms, operating income grew 101.7% compared to second quarter 2003 to US$119. |
| • | Second quarter EBITDA also reached a historic maximum, totalingPs 1,738, 69.7% above that of the same period of 2003 and 72.4% more than first quarter 2004. In dollar terms, EBITDA grew 69.6% compared to the second quarter of 2003 toUS$153. |
| • | Grupo Imsa’s net debt was reduced byUS$16 in the second quarter of 2004, and byUS$130during the past twelve months. |
| • | Net interest coverage – defined as EBITDA divided by net interest expense – was16.2 times for the past twelve months, while leverage – defined as total debt divided by EBITDA – was2.1 times. |
| • | Grupo Imsa and Johnson Controls formalized an agreement whereby Grupo Imsa will exit the automotive battery business and Johnson Controls, its JV partner since 1998, will assume 100% ownership. |
| 1 | Unless otherwise stated, all figures are presented in millions of June 30, 2004 pesos (Ps), or in millions of nominal U.S. dollars (US$). |
Please refer to the last page of this document for definitions of terms, U.S. dollar conversion methodology and other disclosures.
Page 1 of 16
Consolidated Financial Results
Mr. Eugenio Clariond Reyes, Grupo Imsa’s Chief Executive Officer, explained: “Today, we are presenting our results for the second quarter of 2004. I am pleased to inform you that Grupo Imsa is reporting historic maximum sales and operating income. The markets in which we participate have recovered as a result of the improved economic conditions in the United States and Mexico. With this support and our continued efforts, we increased our sales volume, were able to reflect part of the rise in cost of our main inputs in our prices, and improved our efficiency thereby reducing operating expenses. I firmly believe that we are on the right track, so we will continue seeking market opportunities and growing our efficiency to make 2004 an excellent year for Grupo Imsa.” Mr. Clariond added, “Today we also announced an agreement whereby Grupo Imsa will exit the automotive battery business. This business will create more value as a wholly owned subsidiary of Johnson Controls, our JV partner for the last six years and the world’s automotive battery leader. For Grupo Imsa this transaction represents an opportunity to exit the battery business at the right time and to look for opportunities to create value for its shareholders and further strengthen its balance sheet.”
SALES
Grupo Imsa’s revenues reached a historic quarterly maximum in the second quarter of 2004 (2Q04). In dollar terms, net sales for the quarter were US$930, an increase of 32.3% over second quarter 2003 (2Q03) and of 18.3% compared to first quarter 2004 (1Q04). In peso terms, net sales for 2Q04 totaled Ps 10,589, an upswing of 34.3% over 2Q03 and of 20.4% vs. 1Q04. The year-over-year and quarter-over-quarter revenue growths were a result of a more favorable economic environment for Grupo Imsa’s businesses, with the Company reporting increased sales volumes, as well as higher product prices to reflect part of the rise in cost of its main inputs.
For 2Q04, domestic sales amounted to Ps 5,114, 37.9% above 2Q03 and 15.2% more than 1Q04. Foreign sales for 2Q04 totaled Ps 5,475, an increase of 31.1% over 2Q03 and of 25.7% compared to 1Q04. Foreign sales for the quarter represented 52% of total net sales.
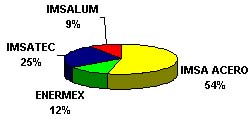
The following is a breakdown by business segment for the quarter:
Please refer to the last page of this document for definitions of terms, U.S. dollar conversion methodology and other disclosures.
Page 2 of 16
Sales | 2Q04 | 1Q04 | 2Q03 | Ac.04 | Ac.03 | ||||||||||
IMSA ACERO | Ps | 5,693 | Ps | 4,753 | Ps | 3,752 | Ps | 10,446 | Ps | 7,235 | |||||
ENERMEX | 1,275 | 1,159 | 1,256 | 2,434 | 2,364 | ||||||||||
IMSATEC | 2,649 | 2,075 | 2,109 | 4,723 | 3,934 | ||||||||||
IMSALUM | 971 | 809 | 767 | 1,780 | 1,501 | ||||||||||
Total net sales1 | Ps | 10,589 | Ps | 8,796 | Ps | 7,884 | Ps | 19,385 | Ps | 15,035 | |||||
TOTAL US$ avg. | 930 | 786 | 703 | 1,716 | 1,325 | ||||||||||
OPERATING INCOME
Operating income in nominal dollar terms for 2Q04 totaled US$119, an increase of 101.7% over 2Q03 and of 112.1% vs. 1Q04. Operating income for 2Q04 in peso terms was Ps 1,345, a growth of 101.3% vs. 2Q03 and of 115.9% over 1Q04. Grupo Imsa’s operating margin for the quarter was 12.7%, compared to 8.5% for 2Q03 and 7.1% for 1Q04.
EBITDA
EBITDA for 2Q04 totaled US$153, representing increases of 69.6% year-over-year and of 69.5% quarter-over-quarter. EBITDA for the quarter in peso terms was Ps 1,738, 69.7% above 2Q03 and 72.4% more than 1Q04.
EBITDA contribution per business segment in 2Q04 was as follows:
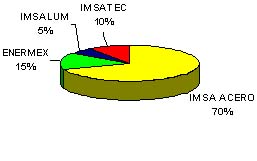
EBITDA | 2Q04 | 1Q04 | 2Q03 | Ac.04 | Ac.03 | |||||||||||||||
IMSA ACERO | Ps | 1,236 | Ps | 638 | Ps | 571 | Ps | 1,875 | Ps | 1,120 | ||||||||||
ENERMEX | 260 | 242 | 297 | 502 | 569 | |||||||||||||||
IMSATEC | 187 | 75 | 141 | 262 | 173 | |||||||||||||||
IMSALUM | 81 | 74 | 55 | 155 | 112 | |||||||||||||||
Corporate | (26 | ) | (21 | ) | (40 | ) | (48 | ) | (79 | ) | ||||||||||
TOTAL | Ps | 1,738 | Ps | 1,008 | Ps | 1,024 | Ps | 2,746 | Ps | 1,895 | ||||||||||
TOTAL US$ avg. | 153 | 90 | 90 | 243 | 166 | |||||||||||||||
EBITDA margin | 16.4 | % | 11.5 | % | 13.0 | % | 14.2 | % | 12.6 | % | ||||||||||
| 1 | The sum of these amounts does not equal the consolidated net sales for the periods presented because Corporate and Other has been excluded. |
Please refer to the last page of this document for definitions of terms, U.S. dollar conversion methodology and other disclosures.
Page 3 of 16
INTEGRAL FINANCING COST (INCOME)
The integral financing cost for 2Q04 was Ps 261, compared to revenues of Ps 174 in 2Q03 and Ps 138 in 1Q04. The main reason for the change in integral financing result compared to 2Q03 and 1Q04 was the foreign exchange loss resulting from a 2.3% depreciation of the Mexican peso vis-à-vis the U.S. dollar in 2Q04, while appreciations of the peso of 2.7% in 2Q03 and 0.7% in 1Q04 resulted in foreign exchange gains.
Interest expense fell 21.8% in 2Q04 compared to 2Q03 as a result of a decline in Libor interest rate, the Company having contracted debt with lower spreads over Libor and a reduction in debt.
Integral Financing Cost (Income) | 2Q04 | 1Q04 | 2Q03 | Ac. 04 | Ac. 03 | |||||||||||||||
Interest expense | Ps | 93 | Ps | 83 | Ps | 119 | Ps | 176 | Ps | 217 | ||||||||||
Interest income | (7 | ) | (26 | ) | (5 | ) | (33 | ) | (14 | ) | ||||||||||
Foreign exchange loss (gain) | 185 | (73 | ) | (271 | ) | 112 | 85 | |||||||||||||
Gain from monetary position | (10 | ) | (122 | ) | (17 | ) | (132 | ) | (132 | ) | ||||||||||
Integral financing cost (income) | Ps | 261 | Ps | (138 | ) | Ps | (174 | ) | Ps | 123 | Ps | 156 | ||||||||
MAJORITY NET INCOME
For 2Q04, the Majority Net Income was Ps 615, compared to incomes of Ps 484 for 2Q03 and Ps 435 for 1Q04. The increase in Net Income compared to 2Q03 and 1Q04 reflects operating income growth.
Majority Net Income | 2Q04 | 1Q03 | 2Q03 | Ac. 04 | Ac. 03 | ||||||||||
Majority net income | Ps | 615 | Ps | 435 | Ps | 484 | Ps | 1,050 | Ps | 496 | |||||
Majority net income per equity unit | Ps | 1.09 | Ps | 0.77 | Ps | 0.86 | Ps | 1.87 | Ps | 0.88 | |||||
Majority net income per ADS | US$ | 0.87 | US$ | 0.65 | US$ | 0.68 | US$ | 1.52 | US$ | 0.69 | |||||
As of June 30, 2004, Grupo Imsa had 2,811.8 million shares outstanding, equivalent to 562,362,758 equity units and 62,484,751 ADSs.
FINANCIAL POSITION
Net debt as of June 30, 2004 was US$781, a decrease of US$16 compared to the net debt presented in the balance sheet as of March 31, 2004 and of US$130 compared to net debt as of June 30, 2003. Total debt as of June 30, 2004 was US$865, US$103 below total debt as of June 30, 2003.
Net interest coverage defined as EBITDA divided by net interest expense was 16.2 times for the twelve months ended June 30, 2004, while interest coverage defined as EBITDA divided by gross interest expense was 13.5 times for the same period. The total debt to EBITDA ratio for the past twelve months was 2.1 times as of June 30, 2004.
Please refer to the last page of this document for definitions of terms, U.S. dollar conversion methodology and other disclosures.
Page 4 of 16
Financial Results by Segment
IMSA ACERO
Sales
2Q04 sales volume was 576 thousand tonnes, an increase of 10.2% over 2Q03 but a decline of 9.6% compared to 1Q04. Domestic shipments for the quarter totaled 413 thousand tonnes, 11.8% above 2Q03 but 5.0% below 1Q04. Foreign volume amounted to 163 thousand tonnes for 2Q04, a growth of 6.5% over 2Q03 but a decline of 19.4% versus 1Q04. The quarter-over-quarter decline in volume reflects a decrease in exports from Mexico, partially offset by an increase in the sales volume reported by Steelscape, IMSA ACERO’s subsidiary in the United States. The year-over-year growth in sales volume reflects increased steel demand in Mexico and the United States, which combined with a world shortage of steel that reduced imports to North America. In addition, the company was able to take advantage of part of the increase in annual hot-rolled steel production capacity to 2.2 million tonnes, which had become available in September 2003. The quarter-over-quarter decline in sales volume reflects the global steel shortage which made it difficult to totally satisfy raw material needs this quarter.
Net sales for 2Q04 reached Ps 5,693, an increase of 51.7% over 2Q03 and of 19.8% compared to 1Q04. The year-over-year growth reflects an upswing in sales volume and increased prices of the company’s products. The quarter-over-quarter rise in net sales was a result of higher average prices, which rose in line with international prices.
Operating Income and EBITDA
Operating income was Ps 973, an increase of 189.6% over 2Q03 and of 156.1% versus 1Q04. 2Q04 operating margin was 17.1%, compared to margins of 9.0% for 2Q03 and 8.0% for 1Q04. EBITDA for 2Q04 was Ps 1,236, a growth of 116.5% with respect to 2Q03 and of 93.7% versus 1Q04. In dollar terms, EBITDA rose 118.9% year-over-year and 90.7% quarter-over-quarter to US$109.
The year-over-year and quarter-over-quarter increases in operating income were largely due to a temporary rise in the margin between the cost of raw materials and the price of the company’s products. Product price increases outpaced the rise in costs because of existing inventories and because, during this period in which steel prices were continuously increasing in the international marketplace, the company received raw materials at prices that had been contracted in advance. An important part of the growth in operating income was a consequence of improved results in the United States and Central America. In the second half of the year, raw material costs will increase with respect to current market prices, thereby reducing IMSA ACERO’s margin compared to the first half of the year. The company will continue its efforts to expand its market presence and increase efficiency in order to reduce the effects of the rise in raw material costs.
Additionally, operating income rose year-over-year because the increase in sales volume improved the coverage of fixed costs. The quarter-over-quarter growth also reflects a sales mix with increased domestic volume and painted steel volume in the United States, segments that produce better margins.
Please refer to the last page of this document for definitions of terms, U.S. dollar conversion methodology and other disclosures.
Page 5 of 16
There was a generalized rise in global steel prices during the first half of 2004. The recovery of a large number of the world’s principal economies resulted in an increase in the consumption of steel. As far as the offer side is concerned, there is currently a shortage of the raw materials required to produce steel, and the cost of many industry-related inputs has increased. As a result, the market has been under pressure and prices have been rising. However, during the last few months, China has reduced its level of purchasing, largely reflecting credit restrictions imposed by the Chinese government, which has resulted in the stabilization of steel prices in that country. In the North American markets, steel prices continued to rise during the second quarter of the year and remain strong.
ENERMEX
Sales
ENERMEX’S 2Q04 sales volume totaled 5.7 million batteries, representing a decrease of 4.2% compared to 2Q03 but an increase of 4.5% over 1Q04. The year-over-year decline largely reflects reduced sales volumes in the United States and Mexico. The quarter-over-quarter growth was a result of the second quarter being seasonally more active than the first in South America and the United States.
ENERMEX posted revenues of Ps 1,275 for 2Q04, an increase of 1.5% over 2Q03 and of 10.0% versus 1Q04. The year-over-year revenue growth reflects a price rise resulting from the increase in price of lead, while the quarter-over-quarter growth was a result of an upswing in sales volume combined with a higher average price because of the increase in foreign exchange rate and adjustments to reflect the price of lead.
Operating Income and EBITDA
Operating income for 2Q04 was Ps 208, a decrease of 16.8% compared to 2Q03 but a growth of 8.9% versus 1Q04. Operating margin for the quarter was 16.3%, compared to 19.9% for 2Q03 and 16.5% for 1Q04. EBITDA for the quarter totaled Ps 260, a decline of 12.5% compared to 2Q03 but an increase of 7.4% versus 1Q04. In dollar terms, EBITDA fell 12.1% year-over-year but rose 6.7% quarter-over-quarter, to US$23.
The main reason for the year-over-year decrease in operating margin was a significant rise in the price of lead, ENERMEX’s main raw material, as well as in the price of other secondary metallic raw materials. The approximately 78% year-over-year increase in lead prices affected margins in all markets, except the Mexican replacement segment which consumes recycled lead. The quarter-over-quarter decrease in margin reflects a reduction in domestic volume in the sales mix because the second quarter is seasonally less active than the first in the Mexican market.
IMSATEC
Sales
IMSATEC’s 2Q04 revenues totaled Ps 2,649, representing an upswing of 25.6% over 2Q03 and of 27.7% versus 1Q04. The year-over-year and quarter-over-quarter revenue growths reflect increased sales volumes for IMSATEC’s main businesses and higher prices of most of their products. Both in Mexico and the United States, the company’s businesses benefited from greater activity in the non-residential construction segment. In addition, these businesses, particularly those related to the sale of components for the construction industry, were able to reflect an important part of the increase in raw material costs in their product prices. The pre-
Please refer to the last page of this document for definitions of terms, U.S. dollar conversion methodology and other disclosures.
Page 6 of 16
engineered metal buildings business operates with a larger lead-time between sales and product delivery, resulting in a longer lag between a rise in raw material costs and product price increases. Steel is the most important raw material in the buildings business, so the significant and rapid rise in steel prices limited the margin increase. The quarter-over-quarter revenue growth also reflects the second quarter of the year being seasonally stronger than the first.
Operating Income and EBITDA
Operating income totaled Ps135 in 2Q04, an increase of 55.2% compared to 2Q03 and of 513.6% vs. 1Q04. Operating margin for the quarter was 5.1%, compared to 4.1% for 2Q03 and 1.1% in 1Q04. EBITDA for the quarter was Ps 187, an increase of 32.6% vs. 2Q03 and of 149.3% with respect to 1Q04. In dollar terms, EBITDA grew year-over-year by 31.5% and quarter-over-quarter by 140.6% to US$16.
IMSATEC’s operating income rose year-over-year because of improved prorating of fixed costs as a result of higher sales volumes and most businesses being able to reflect raw material cost increases in their prices. In addition, the adjustments that were made to VP Holdings and other IMSATEC companies in 2003 to make their administrative processes more efficient resulted in a reduction in operating expenses as a percent of sales, which fell from 14.1% in 2Q03 to 11.2% in 2Q04. The quarter-over-quarter growth in operating income largely reflects the second quarter of the year being seasonally more active than the first.
During the first months of 2004, the market environment in the economies and industries in which the company participates improved, resulting in an increase in sales and in greater flexibility for the company to reflect rising input costs in its product prices. This growth trend is expected to continue in the second half of the year, since the backlog for the main IMSATEC businesses continues to outstrip that of 2003.
IMSALUM
Sales
IMSALUM’s 2Q04 revenues totaled Ps 971, a growth of 26.6% over 2Q03 and of 20.0% compared to 1Q04. The year-over-year upswing in revenues was due to the construction market remaining strong and the recovery of the industrial profiles market. Additionally, the price of final products has risen to reflect part of the increase in the cost of aluminum, and the economic recovery in the United States resulted in ladder volume growth in the U.S. market in 2Q04. The quarter-over-quarter increase was due to the fact that during the first quarter of the year the company concluded projects to raise ladder production capacity in order to satisfy increased demand from foreign customers, resulting in growing sales to these customers starting in the second quarter. Ladder sales volume in the United States is expected to remain strong for the rest of 2004, reflecting increased sales to existing clients.
Operating Income and EBITDA
Operating income for 2Q04 was Ps 68, representing increases of 58.1% over 2Q03 and of 11.5% vs. 1Q04. Operating margin for the quarter was 7.0%, compared to operating margins of 5.6% for 2Q03 and of 7.5% for 1Q04. IMSALUM’s 2Q04 EBITDA was Ps 81, 47.3% above that of 2Q03 and 9.5% more than for 1Q04. In dollar terms, EBITDA grew 48.3% year-over-year and 8.5% quarter-over-quarter to US$7.
Please refer to the last page of this document for definitions of terms, U.S. dollar conversion methodology and other disclosures.
Page 7 of 16
Despite increased costs resulting from the rise in aluminum prices and a product mix with a higher proportion of foreign sales with lower margins, IMSALUM’s operating income grew in 2Q04. The year-over-year and quarter-over-quarter growths in operating income were due to the efforts the company has made to increase the efficiency of its operations. For example, the ladder business reorganized its organizational structure and logistics, becoming more competitive and efficient. Additionally, all IMSALUM businesses continue to implement improvement projects. Despite 2Q04 sales growing almost 27% compared to 2Q03, operating expenses only rose 2.1% year-over-year. Operating expenses as a percent of sales fell from 14.5% in 2Q03 and 13.7% in 1Q04 to 11.7% in 2Q04.
Corporate Developments
Grupo Imsa and Johnson Controls formalized an agreement whereby Grupo Imsa will exit the automotive battery business and Johnson Controls, its JV partner since 1998, will assume 100% ownership.
Grupo Imsa will obtain US$525 million, which includes absorption of debt by JCI, for its ownership of the automotive battery business. The primary use of the proceeds obtained from this transaction will be used to pay debt. This transaction is expected to close once the approval of the regulatory authorities is granted.
Mr. Eugenio Clariond, CEO of Grupo Imsa said, “Over the last six years, we have worked in a very close and friendly relationship with Johnson Controls in order to build a strong automotive battery business, achieve lower costs, a more efficient operation and increase our market share in both the North and South American markets while at the same time protecting the environment according to our commitment with the principles of Sustainable Development. These accomplishments have lead to better results year after year since the joint venture started. We at Grupo Imsa are applying the best of these experiences throughout our organization. We have carefully analyzed this opportunity and we have concluded that this business will create more value as a wholly owned subsidiary of Johnson Controls who is the world’s automotive battery leader.”
* * *
Please refer to the last page of this document for definitions of terms, U.S. dollar conversion methodology and other disclosures.
Page 8 of 16
Grupo Imsa, a holding company, dates back to 1936 and is today one of Mexico’s leading diversified industrial companies, operating in four core businesses: steel processed products; automotive batteries and related products; steel and plastic construction products; and aluminum and other related products. With manufacturing and distribution facilities in Mexico, the United States, Europe and throughout Central and South America, Grupo Imsa currently exports to all five continents. In 2003 the Company’s sales reached US$2.8 billion, of which close to 55% was generated outside Mexico. Grupo Imsa’s shares trade on the Mexican Stock Exchange (IMSA) and, in the United States, on the NYSE (IMY).
Contacts:
Adrian Fernandez, Corporate Finance Manager, (52-81) 8153-8433
Jose Luis Fornelli, Investor Relations, (52-81) 8153-8416
jfornell@grupoimsa.com
TABLES TO FOLLOW
Please refer to the last page of this document for definitions of terms, U.S. dollar conversion methodology and other disclosures.
Page 9 of 16
GRUPO IMSA, S.A. DE C.V. AND SUBSIDIARIES
CONSOLIDATED BALANCE SHEETS
(Millions of Mexican pesos of
purchasing power as of June 30, 2004)
June 2004 | December 2003 | |||||
ASSETS | ||||||
Current: | ||||||
Cash and cash equivalents | 962 | 892 | ||||
Accounts receivable-trade, net | 5,765 | 4,572 | ||||
Inventories | 5,782 | 6,594 | ||||
Other current assets | 1,155 | 1,063 | ||||
| 13,664 | 13,121 | |||||
Investment in associated companies | 109 | 118 | ||||
Property, plant and equipment, net | 20,719 | 20,771 | ||||
Other assets, net | 699 | 802 | ||||
Excess of cost over fair value of net assets acquired of subsidiaries | 947 | 988 | ||||
TOTAL ASSETS | 36,138 | 35,800 | ||||
LIABILITIES AND STOCKHOLDERS’ EQUITY | ||||||
Current: | ||||||
Current portion of long-term debt | 892 | 1,506 | ||||
Bank loans | 230 | 701 | ||||
Accounts payable-trade | 2,927 | 4,220 | ||||
Advances from clients | 138 | 254 | ||||
Other accounts payable and accrued liabilities | 1,638 | 1,345 | ||||
| 5,825 | 8,026 | |||||
Lont-term debt | 8,747 | 7,838 | ||||
Deferred taxes | 3,706 | 3,430 | ||||
Other long-term liabilities | 519 | 346 | ||||
| 12,972 | 11,614 | |||||
TOTAL LIABILITIES | 18,797 | 19,640 | ||||
Excess of fair value of net assets acquired over cost of subsidiaries | 79 | 96 | ||||
Stockholder’s equity: | ||||||
Common stock | 5,048 | 5,045 | ||||
Additional paid-in capital | 2,958 | 2,959 | ||||
Reserve for repurchase of own shares | 158 | 139 | ||||
Retained earnings | 17,475 | 16,961 | ||||
Insufficiency in capital restatement | (5,533 | ) | (6,276 | ) | ||
Initial effect of deferred taxes | (3,691 | ) | (3,691 | ) | ||
Majority interest | 16,415 | 15,137 | ||||
Minority interest | 847 | 927 | ||||
TOTAL STOCKHOLDERS’ EQUITY | 17,262 | 16,064 | ||||
TOTAL LIABILITIES AND STOCKHOLDERS’ EQUITY | 36,138 | 35,800 | ||||
Please refer to the last page of this document for definitions of terms, U.S. dollar conversion methodology and other disclosures.
Page 10 of 16
GRUPO IMSA, S.A. DE C.V. AND SUBSIDIARIES
CONSOLIDATED STATEMENTS OF OPERATIONS
(Millions of Mexican pesos of purchasing power
as of June 30, 2004)
| % Change | ||||||||||||||||||||||||
| 2Q04 | 1Q04 | 2Q03 | Ac. 04 | Ac. 03 | 2Q04/2Q03 | 2Q04/1Q04 | Ac.03/Ac.02 | |||||||||||||||||
NET SALES | 10,589 | 8,796 | 7,884 | 19,385 | 15,035 | 34.3 | % | 20.4 | % | 28.9 | % | |||||||||||||
Domestic Sales | 5,114 | 4,441 | 3,709 | 9,555 | 7,250 | 37.9 | % | 15.2 | % | 31.8 | % | |||||||||||||
Foreign Sales | 5,475 | 4,355 | 4,175 | 9,830 | 7,785 | 31.1 | % | 25.7 | % | 26.3 | % | |||||||||||||
COST OF SALES | 8,384 | 7,317 | 6,348 | 15,701 | 12,101 | 32.1 | % | 14.6 | % | 29.7 | % | |||||||||||||
OPERATING EXPENSES | 860 | 856 | 868 | 1,716 | 1,748 | -0.9 | % | 0.5 | % | -1.8 | % | |||||||||||||
OPERATING INCOME | 1,345 | 623 | 668 | 1,968 | 1,186 | 101.3 | % | 115.9 | % | 65.9 | % | |||||||||||||
Financial expenses | 93 | 83 | 119 | 176 | 217 | -21.8 | % | 12.0 | % | -18.9 | % | |||||||||||||
Interest income | (7 | ) | (26 | ) | (5 | ) | (33 | ) | (14 | ) | 40.0 | % | -73.1 | % | 135.7 | % | ||||||||
Foreign exchange loss (gain) | 185 | (73 | ) | (271 | ) | 112 | 85 | 31.8 | % | |||||||||||||||
Gain from monetary position | (10 | ) | (122 | ) | (17 | ) | (132 | ) | (132 | ) | -41.2 | % | -91.8 | % | 0.0 | % | ||||||||
INTEGRAL FIN. COST, NET | 261 | (138 | ) | (174 | ) | 123 | 156 | -21.2 | % | |||||||||||||||
Other income, net | 36 | 7 | 5 | 43 | 69 | 620.0 | % | 414.3 | % | -37.7 | % | |||||||||||||
INCOME BEFORE TAXES AND EMPLOYEE’S PROFIT SHARING | 1,048 | 754 | 837 | 1,802 | 961 | 25.2 | % | 39.0 | % | 87.5 | % | |||||||||||||
PROVISIONS FOR: | ||||||||||||||||||||||||
Income taxes | 364 | 249 | 251 | 613 | 289 | 45.0 | % | 46.2 | % | 112.1 | % | |||||||||||||
Employees’ profit sharing | 18 | 13 | 28 | 31 | 49 | -35.7 | % | 38.5 | % | -36.7 | % | |||||||||||||
CONSOLIDATED NET INCOME | 666 | 492 | 558 | 1,158 | 623 | 19.4 | % | 35.4 | % | 85.9 | % | |||||||||||||
Net income of minority interest | 51 | 57 | 74 | 108 | 127 | -31.1 | % | -10.5 | % | -15.0 | % | |||||||||||||
Net income of majority interest | 615 | 435 | 484 | 1,050 | 496 | 27.1 | % | 41.4 | % | 111.7 | % | |||||||||||||
Please refer to the last page of this document for definitions of terms, U.S. dollar conversion methodology and other disclosures.
Page 11 of 16
GRUPO IMSA, S.A. DE C.V. AND SUBSIDIARIES
CONSOLIDATED STATEMENTS OF CHANGES IN FINANCIAL POSITION
(Millions of Mexican pesos of
purchasing power as of June 30, 2004)
| June 2004 | December 2003 | |||||
OPERATING ACTIVITIES: | ||||||
CONSOLIDATED NET INCOME | 1,158 | 1,034 | ||||
ITEMS NOT (GENERATING) REQUIRING RESOURCES: | ||||||
Depreciation and amortization | 778 | 1,431 | ||||
Amoritzation of excess of fair value of net assets acquired over cost of subsidiaries | 17 | 17 | ||||
Other | 54 | 257 | ||||
| 2,007 | 2,739 | |||||
CHANGES IN CURRENT ASSETS AND LIABILITIES NET OF EFFECTS FROM PURCHASES OF BUSINESSES: | ||||||
Accounts receivable-trade | (1,193 | ) | (297 | ) | ||
Inventories | 1,647 | (38 | ) | |||
Other current assets | (92 | ) | (222 | ) | ||
Accounts payable-trade | (1,293 | ) | 1,017 | |||
Advances from clients | (116 | ) | 63 | |||
Other accounts payable and accrued liabilities | 293 | (313 | ) | |||
| (754 | ) | 210 | ||||
RESOURCES GENERATED FROM OPERATING ACTIVITIES | 1,253 | 2,949 | ||||
FINANCING ACTIVITIES: | ||||||
Proceeds (Payments) of short-term bank loans | (1,085 | ) | 438 | |||
Proceeds (Payments) from borrowings from banks and issuance of long-term debt | 909 | (683 | ) | |||
Dividends paid | (331 | ) | (354 | ) | ||
Others | — | (346 | ) | |||
RESOURCES (USED IN) GENERATED FROM FINANCING ACTIVITIES | (507 | ) | (945 | ) | ||
INVESTING ACTIVITIES: | ||||||
Acquisition of property, plant and equipment | (510 | ) | (1,732 | ) | ||
Acquisition of companies and minority interest | (166 | ) | — | |||
Other assets | — | (21 | ) | |||
RESOURCES USED IN INVESTING ACTIVITIES | (676 | ) | (1,753 | ) | ||
(DECREASE) INCREASE IN CASH AND CASH EQUIVALENTS | 70 | 251 | ||||
CASH AND CASH EQUIVALENTS AT BEGINNING OF PERIOD | 892 | 641 | ||||
CASH AND CASH EQUIVALENTS AT END OF PERIOD | 962 | 892 | ||||
Please refer to the last page of this document for definitions of terms, U.S. dollar conversion methodology and other disclosures.
Page 12 of 16
GRUPO IMSA S.A. DE C.V. AND SUBSIDIARIES
(Millions of Mexican pesos of purchasing power as of June 30, 2004)
| 2Q04 | 1Q04 | 2Q03 | Ac. 04 | Ac. 03 | 2Q04/2Q03 | 2Q04/1Q04 | Ac.04/Ac.03 | |||||||||||||||||
IMSA ACERO | ||||||||||||||||||||||||
DOMESTIC SALES | 3,784 | 3,101 | 2,464 | 6,885 | 4,774 | 53.6 | % | 22.0 | % | 44.2 | % | |||||||||||||
FOREIGN SALES | 1,909 | 1,652 | 1,288 | 3,561 | 2,461 | 48.2 | % | 15.6 | % | 44.7 | % | |||||||||||||
% Export/Sales | 33.5 | % | 34.8 | % | 34.3 | % | 34.1 | % | 34.0 | % | ||||||||||||||
NET SALES | 5,693 | 4,753 | 3,752 | 10,446 | 7,235 | 51.7 | % | 19.8 | % | 44.4 | % | |||||||||||||
COST OF SALES | 4,440 | 4,080 | 3,152 | 8,519 | 6,041 | 40.9 | % | 8.8 | % | 41.0 | % | |||||||||||||
OPERATING EXPENSES | 280 | 293 | 264 | 574 | 545 | 6.1 | % | -4.4 | % | 5.3 | % | |||||||||||||
OPERATING INCOME | 973 | 380 | 336 | 1,353 | 649 | 189.6 | % | 156.1 | % | 108.5 | % | |||||||||||||
OPERATING MARGIN | 17.1 | % | 8.0 | % | 9.0 | % | 13.0 | % | 9.0 | % | ||||||||||||||
EBITDA | 1,236 | 638 | 571 | 1,875 | 1,120 | 116.5 | % | 93.7 | % | 67.4 | % | |||||||||||||
EBITDA MARGIN | 21.7 | % | 13.4 | % | 15.2 | % | 17.9 | % | 15.5 | % | ||||||||||||||
ENERMEX | ||||||||||||||||||||||||
DOMESTIC SALES | 447 | 483 | 466 | 930 | 936 | -4.1 | % | -7.5 | % | -0.6 | % | |||||||||||||
FOREIGN SALES | 828 | 676 | 790 | 1,504 | 1,428 | 4.8 | % | 22.5 | % | 5.3 | % | |||||||||||||
% Export/Sales | 64.9 | % | 58.3 | % | 62.9 | % | 61.8 | % | 60.4 | % | ||||||||||||||
NET SALES | 1,275 | 1,159 | 1,256 | 2,434 | 2,364 | 1.5 | % | 10.0 | % | 3.0 | % | |||||||||||||
COST OF SALES | 937 | 838 | 861 | 1,775 | 1,603 | 8.8 | % | 11.8 | % | 10.7 | % | |||||||||||||
OPERATING EXPENSES | 130 | 130 | 145 | 260 | 284 | -10.3 | % | 0.0 | % | -8.5 | % | |||||||||||||
OPERATING INCOME | 208 | 191 | 250 | 399 | 477 | -16.8 | % | 8.9 | % | -16.4 | % | |||||||||||||
OPERATING MARGIN | 16.3 | % | 16.5 | % | 19.9 | % | 16.4 | % | 20.2 | % | ||||||||||||||
EBITDA | 260 | 242 | 297 | 502 | 569 | -12.5 | % | 7.4 | % | -11.8 | % | |||||||||||||
EBITDA MARGIN | 20.4 | % | 20.9 | % | 23.6 | % | 20.6 | % | 24.1 | % | ||||||||||||||
IMSATEC | ||||||||||||||||||||||||
DOMESTIC SALES | 484 | 432 | 417 | 915 | 801 | 16.1 | % | 12.0 | % | 14.2 | % | |||||||||||||
FOREIGN SALES | 2,165 | 1,643 | 1,692 | 3,808 | 3,133 | 28.0 | % | 31.8 | % | 21.5 | % | |||||||||||||
% Export/Sales | 81.7 | % | 79.2 | % | 80.2 | % | 80.6 | % | 79.6 | % | ||||||||||||||
NET SALES | 2,649 | 2,075 | 2,109 | 4,723 | 3,934 | 25.6 | % | 27.7 | % | 20.1 | % | |||||||||||||
COST OF SALES | 2,218 | 1,764 | 1,724 | 3,980 | 3,267 | 28.7 | % | 25.7 | % | 21.8 | % | |||||||||||||
OPERATING EXPENSES | 296 | 289 | 298 | 585 | 602 | -0.7 | % | 2.4 | % | -2.8 | % | |||||||||||||
OPERATING INCOME | 135 | 22 | 87 | 158 | 65 | 55.2 | % | 513.6 | % | 143.1 | % | |||||||||||||
OPERATING MARGIN | 5.1 | % | 1.1 | % | 4.1 | % | 3.3 | % | 1.7 | % | ||||||||||||||
EBITDA | 187 | 75 | 141 | 262 | 173 | 32.6 | % | 149.3 | % | 51.4 | % | |||||||||||||
EBITDA MARGIN | 7.1 | % | 3.6 | % | 6.7 | % | 5.5 | % | 4.4 | % | ||||||||||||||
IMSALUM | ||||||||||||||||||||||||
DOMESTIC SALES | 397 | 426 | 362 | 823 | 737 | 9.7 | % | -6.8 | % | 11.7 | % | |||||||||||||
FOREIGN SALES | 574 | 383 | 405 | 957 | 764 | 41.7 | % | 49.9 | % | 25.3 | % | |||||||||||||
% Export/Sales | 59.1 | % | 47.3 | % | 52.8 | % | 53.8 | % | 50.9 | % | ||||||||||||||
NET SALES | 971 | 809 | 767 | 1,780 | 1,501 | 26.6 | % | 20.0 | % | 18.6 | % | |||||||||||||
COST OF SALES | 790 | 637 | 613 | 1,426 | 1,189 | 28.9 | % | 24.0 | % | 19.9 | % | |||||||||||||
OPERATING EXPENSES | 113 | 111 | 111 | 224 | 224 | 1.8 | % | 1.8 | % | 0.0 | % | |||||||||||||
OPERATING INCOME | 68 | 61 | 43 | 130 | 88 | 58.1 | % | 11.5 | % | 47.7 | % | |||||||||||||
OPERATING MARGIN | 7.0 | % | 7.5 | % | 5.6 | % | 7.3 | % | 5.9 | % | ||||||||||||||
EBITDA | 81 | 74 | 55 | 155 | 112 | 47.3 | % | 9.5 | % | 38.4 | % | |||||||||||||
EBITDA MARGIN | 8.3 | % | 9.1 | % | 7.2 | % | 8.7 | % | 7.5 | % | ||||||||||||||
Please refer to the last page of this document for definitions of terms, U.S. dollar conversion methodology and other disclosures.
Page 13 of 16
SALES VOLUME
| 2Q04 | 1Q04 | 2Q03 | Ac.04 | Ac.03 | ||||||
STEEL PROCESSING IMSA ACERO (Tonnes) | ||||||||||
Domestic Sales Volume | 412,753 | 434,451 | 369,317 | 847,204 | 728,007 | |||||
Export and Foreign Subsidiaries Sales Volume | 162,856 | 202,104 | 152,845 | 364,960 | 288,233 | |||||
TOTAL IMSA ACERO | 575,609 | 636,555 | 522,162 | 1,212,164 | 1,016,240 | |||||
| 2Q04 | 1Q04 | 2Q03 | Ac.04 | Ac.03 | ||||||
AUTOMOTIVE BATTERIES(1) ENERMEX (000 Units) | ||||||||||
Mexico | ||||||||||
Domestic Market | 1,308 | 1,457 | 1,377 | 2,764 | 2,806 | |||||
Exports | 2,734 | 2,596 | 3,212 | 5,330 | 5,633 | |||||
Total(2) | 4,042 | 4,053 | 4,589 | 8,094 | 8,439 | |||||
Foreign Subsidiaries(3) | 1,651 | 1,396 | 1,354 | 3,047 | 2,647 | |||||
TOTAL ENERMEX | 5,693 | 5,449 | 5,943 | 11,141 | 11,086 | |||||
| 2Q04 | 1Q04 | 2Q03 | Ac.04 | Ac.03 | ||||||
IMSALUM Aluminum (Tonnes) | ||||||||||
TOTAL ALUMINUM | 15,335 | 14,832 | 11,733 | 30,167 | 23,314 | |||||
| (1) | Includes 100% of the sales volume of the joint venture with Johnson Controls. |
| (2) | 100% of this volume is consolidated in Enermex financial statements. |
| (3) | 50% of this volume is consolidated in Enermex financial statements. |
Please refer to the last page of this document for definitions of terms, U.S. dollar conversion methodology and other disclosures.
Page 14 of 16
Selected Financial Information
Income Statement
US$Millions(1)
| 2Q04 | 1Q04 | 2Q03 | Ac.04 | Ac.03 | ||||||
Net Sales | ||||||||||
IMSA ACERO | 501 | 425 | 334 | 926 | 637 | |||||
ENERMEX | 112 | 104 | 112 | 216 | 208 | |||||
IMSATEC | 232 | 185 | 189 | 417 | 350 | |||||
IMSALUM | 85 | 72 | 68 | 157 | 132 | |||||
Grupo Imsa(2) | 930 | 786 | 703 | 1,716 | 1,325 | |||||
Operating Income | ||||||||||
IMSA ACERO | 86 | 34 | 29 | 120 | 56 | |||||
ENERMEX | 18 | 17 | 22 | 36 | 42 | |||||
IMSATEC | 12 | 2 | 8 | 14 | 6 | |||||
IMSALUM | 6 | 5 | 4 | 12 | 8 | |||||
Grupo Imsa(2) | 119 | 56 | 59 | 174 | 104 | |||||
EBITDA | ||||||||||
IMSA ACERO | 109 | 57 | 50 | 166 | 97 | |||||
ENERMEX | 23 | 22 | 26 | 45 | 50 | |||||
IMSATEC | 16 | 7 | 12 | 23 | 15 | |||||
IMSALUM | 7 | 7 | 5 | 14 | 10 | |||||
Grupo Imsa(2) | 153 | 90 | 90 | 243 | 166 | |||||
Majority Net Income | ||||||||||
Grupo Imsa | 54 | 40 | 43 | 95 | 43 | |||||
| (1) | Peso figures converted into dollars by dividing the monthly nominal pesos by the average monthly exchange rate. |
| (2) | The sum of these amounts does not equal the consolidated figures presented because Corporate and Other have been excluded. |
Please refer to the last page of this document for definitions of terms, U.S. dollar conversion methodology and other disclosures.
Page 15 of 16
Disclosures and Definitions
Methodology used for consolidation and presentation of results and other important disclosures
Grupo Imsa consolidates its results in Mexican pesos using Mexican generally accepted accounting principles (Mexican GAAP). Figures in this document are presented in millions of Mexican pesos as of June 30, 2004 (Ps), unless otherwise specified.
In compliance with Bulletin B-15, “Foreign Currency Translation of Foreign Currency Financial Statements,” the restatement factors applied to financial statements of prior periods are calculated on the basis of a weighted average index that takes into consideration the inflation rates of the countries in which Grupo Imsa’s subsidiaries operate and changes in the exchange rates of each country vis-à-vis the Mexican peso. The restatement factor for the twelve-month period of June 2003 – June 2004 was 1.07125; for the three-month period of March 2004 – June 2004, it was 1.01261.
For the convenience of the reader, this document contains U.S. dollar amounts for Grupo Imsa and its four business segments. The conversion from Mexican pesos to U.S. dollars is carried out by dividing nominal monthly peso amounts of the financial statements by the average Mexican peso – U.S. dollar exchange rate for that month, and then adding the results of the divisions into quarterly or accumulated figures. U.S. dollar (US$) figures in this document are presented in millions, unless otherwise specified.
Second quarter 2004 (2Q04) inflation was 0.1%, resulting in an inflation rate of 4.4% for the last twelve months. The Mexican peso depreciated 2.3% against the U.S. dollar during 2Q04 and 8.9% over the last twelve months. The exchange rate used as of June 30, 2004 was 11.4116 pesos per dollar. Since the price and cost structure of Grupo Imsa is mainly denominated in dollars, the performance of the Company is affected when financial information is expressed in real pesos.
The term EBITDA is used throughout this document because Grupo Imsa believes it is a widely accepted financial indicator of its ability to generate cash flow to operate, fund capital expenditures, pay taxes, service or incur debt, and pay dividends. EBITDA should not be considered as an indicator of Grupo Imsa’s financial performance, as a measure of liquidity or as a substitute for the statement of changes in financial position. EBITDA can be reconciled by adding operating income to depreciation and operating amortization, all of which are concepts accepted under Mexican GAAP.
This document contains forward-looking statements relating to Grupo Imsa’s future performance or its current expectations or beliefs. These include statements regarding the intent, belief or current expectations of the Company and its management. Investors are cautioned that any such forward-looking statements are not guarantees of future performance and involve a number of risks and uncertainties pertaining to the industries in which the Company participates. Grupo Imsa does not intend, and does not assume any obligation, to update these forward-looking statements.
Definition of terms
EBITDA: Operating income plus depreciation and operating amortization
Net Debt: Total debt, minus cash and cash equivalents
Net Interest Coverage: EBITDA divided by (interest expense minus interest income)
Interest Coverage: EBITDA divided by interest expense
Page 16 of 16
| Press Release
| |||
| NYSE | BMV | |||
GRUPO IMSA TO EXIT AUTOMOTIVE BATTERY BUSINESS
Monterrey, N.L., Mexico – July 19, 2004 – Grupo Imsa, S.A. de C.V. (BMV: IMSA; NYSE: IMY) andJohnson Controls, Inc. (NYSE: JCI) today announced an agreement whereby Grupo Imsa will exit the automotive battery business and Johnson Controls, its JV partner since 1998, will assume 100% ownership.
Grupo Imsa will obtain US$525 million, which includes absorption of debt by JCI, for its ownership of the automotive battery business. The primary use of the proceeds obtained from this transaction will be used to pay debt. This transaction is expected to close once the approval of the regulatory authorities is granted.
Mr. Eugenio Clariond, CEO of Grupo Imsa said, “Over the last six years, we have worked in a very close and friendly relationship with Johnson Controls in order to build a strong automotive battery business, achieve lower costs, a more efficient operation and increase our market share in both the North and South American markets while at the same time protecting the environment according to our commitment with the principles of Sustainable Development. These accomplishments have lead to better results year after year since the joint venture started. We at Grupo Imsa are applying the best of these experiences throughout our organization. This business will create more value as a wholly owned subsidiary of Johnson Controls who is the world’s automotive battery leader. For Grupo Imsa this transaction represents an opportunity to exit the battery business at the right time and to look for opportunities to create value for its shareholders and further strengthen its balance sheet.”
Grupo Imsa, a holding company, dates back to 1936 and is today one of Mexico’s leading diversified industrial companies, operating in four businesses: steel processed products; automotive batteries and related products; steel and plastic construction products; and aluminum and other related products. Grupo Imsa operates manufacturing and distribution facilities in Mexico, the United States, Europe and throughout Central and South America. In 2003 the Company’s sales reached US$2.8 billion, of which close to 55% was generated outside Mexico. Grupo Imsa shares trade on the Mexican Stock Exchange (IMSA) and, in the United States, on the NYSE (IMY).
Johnson Controls is a global market leader in automotive systems and facility management and control. In the automotive market, it is a major supplier of integrated seating and interior systems, and batteries. For nonresidential facilities, Johnson Controls provides control systems and services including comfort, energy and security management. Johnson Controls (NYSE: JCI), founded in 1885, has headquarters in Milwaukee, Wisconsin.
Contacts:
Adrian Fernandez, Corporate Finance Manager, (52-81) 8153-8433
Jose Luis Fornelli, Investor Relations, (52-81) 8153-8416
jfornell@grupoimsa.com
This document may contain forward-looking statements relating to Grupo Imsa’s future performance or its current expectations or beliefs. These include statements regarding the intent, belief or current expectations of the Company and its management. Investors are cautioned that any such forward-looking statements are not guarantees of future performance and involve a number of risks and uncertainties pertaining to the industries in which the Company participates. Grupo Imsa does not intend, and does not assume any obligation, to update these forward-looking statements.
1
SIGNATURE
Pursuant to the requirements of the Securities Exchange Act of 1934, the registrant has duly caused this report to be signed on its behalf by the undersigned, thereunto duly authorized.
GRUPO IMSA, S.A. DE C.V. (Registrant) | ||||
Dated: July 21st, 2004 | By: | /s/ MARCELO CANALES CLARIOND | ||
Name: Title: | Marcelo Canales Clariond Chief Financial Officer | |||